AS FILED WITH THE SECURITIES AND EXCHANGE COMMISSION ON April 30, 2013
APRIL 22, 2016
UNITED STATES
SECURITIES AND EXCHANGE COMMISSION
WASHINGTON, DC 20549
FORM 20-F
FORM 20-F
(Mark One)
| ¨ | REGISTRATION STATEMENT PURSUANT TO SECTION 12(b) OR (g) OF THE SECURITIES EXCHANGE ACT OF 1934 |
| | |
OR
| | |
| x | ANNUAL REPORT PURSUANT TO SECTION 13 OR 15(d) OF THE SECURITIES EXCHANGE ACT OF 1934 |
| | |
For the fiscal year ended December 31, 2012
2015
OR
| | |
| ¨ | TRANSITION REPORT PURSUANT TO SECTION 13 OR 15(d) OF THE SECURITIES EXCHANGE ACT OF 1934 |
| | |
For the transition period from ..................... to……………..
OR
| | |
| ¨ | SHELL COMPANY REPORT PURSUANT TO SECTION 13 OR 15(d) OF THE SECURITIES EXCHANGE ACT OF 1934 |
| | |
Date of event requiring this shell company report……………….
Commission file number: 001-32535001 - 32535
BANCOLOMBIA S.A.
(Exact name of Registrant as specified in its charter)
N/A
(Translation of Registrant’s name into English)
Republic of Colombia
(Jurisdiction of incorporation or organization)
Carrera 48 # 26-85, Avenida Los Industriales
Medellín, Colombia
(Address of principal executive offices)
Alejandro Mejia Jaramillo, Investor Relations Manager
Tel. +574 4041837, Fax + 574 4045146, e-mail: almejia@bancolombia.com
Carrera 48 # 26-85, Medellín, Colombia
Tel. +574 4041837, Fax. + 574 4045146, e-mail: almejia@bancolombia.com
(Name, Telephone, E-Mail and/or Facsimile number and Address of Company Contact Person)
Securities registered or to be registered pursuant to Section 12(b) of the Act.
| Title of each Class | Name of each exchange on which registered | |
| American Depositary Shares | New York Stock Exchange |
| Preferred Shares | New York Stock Exchange* |
__________________
| * | Bancolombia’s preferred shares are not listed for trading directly, but only in connection with its American Depositary Shares, which are evidenced by American Depositary Receipts, each representing four preferred shares. |
Securities registered or to be registered pursuant to Section 12(g) of the Act.
Not applicable
(Title of Class)
Securities for which there is a reporting obligation pursuant to Section 15(d) of the Act.
Not applicable
(Title of Class)
Indicate the number of outstanding shares of each of the issuer’s classes of capital or common stock as of the close of the
period covered by the annual report.
| Common Shares | 509,704,584 |
| Preferred Shares | 342,122,416452,122,416 |
Indicate by check mark if the registrant is a well-known seasoned issuer, as defined in Rule 405 of the Securities Act.
Yesx No¨
If this report is an annual or transition report, indicate by check mark if the registrant is not required to file reports pursuant to
Section 13 of 15(d) of the Securities Exchange Act of 1934.
Yes¨ Nox
Indicate by check mark whether the registrant (1) has filed all reports required to be filed by Section 13 or 15(d) of the Securities Exchange Act of 1934 during the preceding 12 months (or for such shorter period that the registrant was required to file such reports),
and (2) has been subject to such filing requirements for the past 90 days.
Yesx No¨
Indicate by check mark whether the registrant has submitted electronically and posted on its corporate Web site, if any, every Interactive Data File required to be submitted and posted pursuant to Rule 405 of Regulation S-T during the preceding 12 months (or for such shorter period that the registrant was required to submit and post such files).
Yes¨No¨x
Indicate by check mark whether the registrant is a large accelerated filer, an accelerated filer, or a non-accelerated filer. See the definitions of “accelerated filer and large, accelerated filer” in Rule 12b-2 of the Exchange Act. (Check one):
Large accelerated filerxAccelerated filer¨Non-accelerated filer¨
(Do not check if a smaller reporting company)
Indicate by check mark which basis of accounting the registrant has used to prepare the financial statements included in this filing:
U.S. GAAP¨ | International Financial Reporting Standards as issued by the International Accounting Standards Board | Other x | Other ¨ |
If “Other” has been checked in response to the previous question indicate by check mark which financial statement item the registrant has elected to follow.
Item 17¨ Item 18x¨
If this is an annual report, indicate by check mark whether the registrant is a shell company (as defined in Rule 12b-2 of the Exchange Act).
Yes¨ Nox
(APPLICABLE ONLY TO ISSUERS INVOLVED IN BANKRUPTCY PROCEEDINGS DURING THE PAST FIVE YEARS.)
Indicate by check mark whether the registrant has filed all documents and reports required to be filed by Section 12, 13 or 15(d) of the Securities Exchange Act of 1934 subsequent to the distribution of securities under a plan confirmed by a court.
Yes¨No¨x
TABLE OF CONTENTS
CERTAIN DEFINED TERMS
Unless otherwise specified or if the context so requires, in this annual report:
References to “ADSs” refer to our American Depositary Shares (one ADS represents four preferred shares).
References to the “Annual Report” refer to this annual report on Form 20-F.
References to “Banagrícola” refer to Banagrícola S.A., a company incorporated in Panama, including its subsidiaries on a consolidated basis, unless otherwise indicated or the context otherwise requires.
References to “Banca de Inversión” refer to Banca de Inversión Bancolombia S.A. Corporación Financiera, a Subsidiary of Bancolombia S.A. organized under the laws of the Republic of Colombia that specializes in providing investment banking services.
References to “Banco Agrícola” refer to Banco Agrícola S.A., a banking institution organized under the laws of the Republic of El Salvador, including its subsidiaries on a consolidated basis, unless otherwise indicated or the context otherwise requires.
References to “Bancolombia”, the “Bank”, “us” , “we” or “our” refer to Bancolombia S.A., a banking institution organized under the laws of the Republic of Colombia, which may also act under the name of Banco de Colombia S.A., including its subsidiaries on a consolidated basis, unless otherwise indicated or the context otherwise requires.
References to “Bancolombia Panama” refer to Bancolombia (Panama)Panamá S.A., a Subsidiarysubsidiary of Bancolombia S.A. organized under the laws of the Republic of Panama that provides banking services to non-Panamanian customers.
References to “Banistmo” refer to Banistmo S.A., a banking institution organized under the laws of the Republic of Panama, including its subsidiaries on a consolidated basis, unless otherwise indicated or the context otherwise requires.
References to “Central Bank” refer to the Central Bank of Colombia.Colombia (Banco de la República).
References to “Colombia” refer to the Republic of Colombia.
References to “Colombian banking GAAP” refer to generally accepted accounting principles in Colombia as supplemented by the applicable regulations of the SFC.
References to “Conavi” refer to Conavi Banco Comercial y de Ahorros S.A. as it existed immediately before the Conavi/Corfinsuraits merger (as defined below).
References to the “Conavi/Corfinsura merger” refer to the merger of Conavi and Corfinsura with and into Bancolombia, with Bancolombia as the surviving entity, which took effect on July 30, 2005 pursuant to a Merger Agreement dated February 28, 2005.Bancolombia.
References to “Congress” refer to the national congress of Colombia.
References to “Corfinsura” refer to Corporación Financiera Nacional y Suramericana S.A., as it existed immediately before the Conavi/Corfinsuraits merger takingwith and into account the effect of its spin-off of a portion of its investment portfolio effective July 29, 2005.Bancolombia.
References to “DTF” refer to theDepósitos a Término Fijo rate, the weighted average interest rate paid by finance corporations, commercial banks and financing companies in Colombia for termtime deposits with maturities of 90 days.
References to “Factoring Bancolombia” refer to Factoring Bancolombia S.A. Compañía de Financamiento, a Subsidiary of Bancolombia organized under the laws of Colombia that specializes in accounts receivable financing.
References to “Fiduciaria Bancolombia” refer to Fiduciaria Bancolombia S.A. Sociedad Fiduciaria, a Subsidiary of Bancolombia organized under the laws of Colombia which provides trust and fund management services.
References to “Grupo Agromercantil” refer to Grupo Agromercantil Holding S.A., a company organized under the laws of the Republic of Panama, of which Bancolombia S.A. owns 60% of its voting shares, and is the parent company of Banco Agromercantil of Guatemala, and its subsidiaries.
References to “IRS” refer to U.S. Internal Revenue Service.
References to “Leasing Bancolombia” refer to Leasing Bancolombia S.A. Compañía de Financiamiento, a Subsidiary of Bancolombia S.A. organized under the laws of Colombia that specializes in leasing activities, offering a wide range of financial leases, operating leases, loans, time deposits and bonds.
References to “NYSE” refer to the New York Stock Exchange.
References to “peso”, “pesos” or “COP” refer to the lawful currency of Colombia.
References to “preferred shares” and “common shares” refer to our issued, outstanding and paid infully paid-in preferred and common shares, designated asacciones con dividendo preferencial sin derecho a votoandacciones ordinarias, respectively.
References to “Renting Colombia” refer to Renting Colombia S.A., a Subsidiary of Bancolombia S.A. organized under the laws of Colombia which provides operating lease and fleet management services for individuals and companies.
References to “Representative Market Rate” refer toTasa Representativa del Mercado, the U.S. dollar representative market rate, certified by the SFC. The Representative Market Rate is an economic indicator of the daily exchange rate on the Colombian market spot of currencies. It corresponds to the arithmetical weighted average of the rates for the purchase and sale of currencies by certain financial institutions (including Bancolombia) authorized to engage in foreign exchange transactions in Colombia.
References to “SEC” refer to the U.S. Securities and Exchange Commission.
References to “SMEs” refer to Small and Medium Enterprises
References to “SMMLV” refer toSalario Mínimo Mensual Legal Vigente,the effective legal minimum monthly salary in Colombia. In 2015, the effective legal minimum monthly salary in Colombia was COP 644,350.
References to “Subsidiaries” refer to entities in which Bancolombia S.A. holds, directly or indirectly, more than 50% of the outstanding voting shares.
References to “Superintendency of Finance” or “SFC” refer to the Colombian Superintendency of Finance (Superintendencia Financiera de Colombia), a technical entity under the Ministry of Finance and Public Credit (Ministerio de Hacienda y Crédito Público) with functions of inspection, supervision and control functions over the entities involved in financial activities, capital markets, insurance and any other services related to the management, use or investment of resources collected from the public.
References to “Representative Market Rate” refer toTasa Representativa del Mercado, the U.S. dollar representative market rate, certified by the SFC. The Representative Market Rate is an economic indicator of the daily exchange rate on the Colombian market spot of currencies. It corresponds to the arithmetical weighted average of the rates of purchase and sale of currencies of interbank transactions of the authorized intermediaries.
References to “Colombian banking GAAP” refer to the generally accepted accounting principles in Colombia and the special accounting regulations of the SFC.
References to “SEC” refer to the U.S. Securities and Exchange Commission.
References to “SMEs” refer to Small and Medium Enterprises.
References to “SMMLV” refer toSalario Mínimo Mensual Legal Vigente the effective legal minimum monthly salary in Colombia. In 2012, the effective legal minimum monthly salary in Colombia was COP 566,700.
References to “peso”, “pesos” or “COP” refer to the lawful currency of Colombia.
References to “Subsidiaries” refer to subsidiaries of Bancolombia in which Bancolombia holds, directly or indirectly, more than 50% of the outstanding voting shares.
References to “U.S.” or “United States” refer to the United States of America.
References to “U.S. dollar”, “USD”, and “US$” refer to the lawful currency of the United States.
References to “UVR” refer toUnidades de Valor Real, a Colombian inflation-adjusted monetary index calculated by the board of directors of the Central Bank and generally used for pricing home-mortgage loans.
References to “Valores Bancolombia” refer to Valores Bancolombia S.A. Comisionista de Bolsa, a Subsidiary of Bancolombia S.A. organized under the laws of the Republic of Colombia that provides brokerage and asset management services.
The term “billion” means one thousand million (1,000,000,000).
The term “trillion” means one million million (1,000,000,000,000).
Our fiscal year ends on December 31, and references in this Annual Reportannual report to
any specific fiscal year are to the twelve-month12-month period ended December 31 of
such year.
CAUTIONARY NOTE REGARDING FORWARD-LOOKING STATEMENTS
This Annual Report contains statements which may constitute forward-looking statements within the meaning of the safe harbor provisions of the U.S. Private Securities Litigation Reform Act of 1995. These forward-looking statements are not based on historical facts but instead represent only the Bank’s belief regarding future events, many of which, by their nature, are inherently uncertain and outside the Bank’s control. The words “anticipate”, “believe”, “estimate”, “expect”, “intend”, “plan”, “predict”, “target”, “forecast”, “guideline”, “should”, “project” and similar words and expressions are intended to identify forward-looking statements. It is possible that the Bank’s actual results may differ, possibly materially, from the anticipated results indicated in or implied by these forward-looking statements.
Information regarding important factors that could cause actual results to differ, perhaps materially, from those in the Bank’s forward-looking statements appear in a number of places in this Annual Report, principally in “Item 3. Key Information – D. Risk Factors” and “Item 5. Operating and Financial Review and Prospects”, and. These factors include, but are not limited to: (i) changes in general economic, business, political, social, fiscal or other conditions in Colombia, or in any of the other countries where the Bank operates; (ii) changes in capital markets or in markets in general that may affect policies or attitudes towards lending; (iii) unanticipated increases in financing and other costs or the inability to obtain additional debt or equity financing on attractive terms; (iv) inflation, changes in foreign exchange rates and/or interest rates; (v) sovereign risks; (vi) liquidity risks; (vii) increases in defaultsdelinquencies by the Bank’s borrowers and other loan delinquencies;borrowers; (viii) lack of acceptance of new products or services by the Bank’s targeted customers; (ix) competition in the banking, financial services, credit card services, insurance, asset management, remittances, business and other industries in which the Bank operates; (x) adverse determination of legal or regulatory disputes or proceedings; (xi) changes in official regulations and the Colombian Government’sgovernment’s banking policy as well as changes in laws, regulations or policies in theother jurisdictions in which the Bank does business; (xii) regulatory issues relating to acquisitions; and (xiii) changes in business strategy.
Forward-looking statements speak only as of the date they are made and are subject to change, and the Bank does not intend, and does not assume any obligation, to update these forward-looking statements in light of new information or future events arising after the date of this Annual Report.
PRESENTATION OF CERTAIN FINANCIAL AND OTHER INFORMATION
Accounting Principles
The accounting practices usedaudited Consolidated Financial Statements (the “Consolidated Financial Statements”) are prepared in accordance with IFRS as issued by the preparation ofIASB and the Bank’s consolidated financial statements followrelated interpretations issued by the International Financial Reporting Interpretations Committee (“IFRS-IC”) and by the Standing Interpretations Committee (SIC) related interpretations. Until December 31, 2014, we prepared our Consolidated Financial Statements following Colombian banking GAAP. Together, these requirements differ in certain significant respects from generally accepted accounting principles in the United States (“U.S. GAAP”). Note 31 to the Bank’s audited consolidated financial statementsAll 2015 and 2014 data included in this Annual Report provides a description of the principal differences between Colombian banking GAAP and U.S. GAAPreport has been prepared in accordance with IFRS as they relate to the Bank’s audited consolidated financial statements and provides a reconciliation of consolidated net income and consolidated stockholders’ equity for the years and dates indicated herein. References to Colombian banking GAAP in this Annual Report are to Colombian GAAP as supplementedissued by the applicable regulations of the SFC.IASB.
For consolidation purposes under Colombian banking GAAP, financial statements of2015, the Bank and its Subsidiaries must be prepared under uniform accounting policies. In order to comply with this requirement, financial statements of foreign Subsidiaries were adjusted as required by Colombian regulations.
In July 2009 Congress approved Law 1314 of 2009, which introduced changes in the accounting, audit and information disclosures with the aim of converging with “InternationalConsolidated Financial Reporting Standards – IFRS”, although current regulations could differ in certain subjects from those in other countries. In accordance with Decree 2784 of 2012, those regulations are effective for annual and interim fiscal years beginning after December 31, 2014.
For 2012, the Bank’s consolidated financial statementsStatements include entities in which itthe Bank holds control, directly or indirectly, 50% or more of the outstanding voting rights. The Bank consolidates directly Leasing Bancolombia, Fiduciaria Bancolombia. Banca de Inversión, Tuya S.A. Compañía de Financiamiento, Bancolombia Puerto Rico Internacional Inc., Bancolombia Panamá, Valores Bancolombia, Factoring Bancolombia and Patrimonio Autónomo Cartera LBC. Some of the Bank’s Subsidiaries also consolidate their own subsidiaries. Bancolombia Panamá consolidates Bancolombia Cayman S.A., Sistema de Inversiones y Negocios S.A. Sinesa, Suleasing International USA, Inc. and Banagrícola (which, in turn, consolidates Inversiones Financieras Banco Agrícola S.A. IFBA, Banco Agrícola, Arrendadora Financiera S.A. Arfinsa, Credibac S.A. de C.V., Valores Banagrícola S.A. de C.V., Banagrícola Guatemala S.A., Bagrícola Costa Rica and UFF Móvil S.A.S.). Banca de Inversión consolidates BIBA Inmobiliaria S.A.S., Valores Simesa S.A., Inversiones CFNS S.A.S., CFNS Infraestructura S.A.S. and Vivayco S.A.S. Leasing Bancolombia consolidates Leasing Perú S.A., Renting Colombia (which, in turn, consolidates Arrendamiento Operativo CIB S.A.C., Capital Investments SAFI S.A., Fondo de Inversión en Arrendamiento Operativo Renting Perú, and Transportempo S.A.S.). Valores Bancolombia consolidates Valores Bancolombia Panamá S.A. and Suvalor Panamá Fondo de Inversión S.A. and Fiduciaria Bancolombia consolidates FiduPerú S.A. Sociedad Fiduciaria.indirectly. See “Item 4. Information on the Company – C. Selected Organizational Structure” for an organizational chart depicting Bancolombia and its subsidiaries.
Currencies
The Bank maintains accounting records in pesos.pesos, which is the functional and presentation currency of the Bank. The audited consolidated financial statements of BancolombiaConsolidated Financial Statements as of December 31, 2012,2015 and 20112014, and January 1, 2014, for threethe years ended December 31, 2012 (collectively, including the notes thereto, the “Financial Statements”)2015 and 2014 contained in this Annual Report are expressed in millions of pesos.
This Annual Report translates certain pesopesos amounts into U.S. dollars at specified rates solely for the convenience of the reader. Unless otherwise indicated, such peso amounts have been translated at the rate of COP 1,768.233,149.47 per USD 1.00, which corresponds to the Representative Market Rate calculated on December 31, 20122015 the last business day of the year. The Representative Market Rate is computed and certified by the SFC, the Colombian banking regulator, on a daily basis and represents the weighted average of the buy/sell foreign exchange rates negotiated on the previous day by certain financial institutions authorized to engage in foreign exchange transactions (including Bancolombia). The SFC also calculates and certifies the average Representative Market Rate for each month for purposes of preparing financial statements and converting amounts in foreign currency to pesos. Such conversion should not be construed as a representation that the peso amounts correspond to, or have been or could be converted into, U.S. dollars at that rate or any other rate. On April 29, 2013,21, 2016, the Representative Market Rate was COP 1,833.702,899.92 per USD 1.00.
Rounding Comparability of Data
Certain monetary amounts, percentages and other figures included in this Annual Report have been subject to rounding adjustments. Accordingly, figures shown as totals in certain tables may not be the arithmetic aggregation of the figures that precede them, and figures expressed as percentages in the text may not total 100% or, as applicable, when aggregated may not be the arithmetic aggregation of the percentages that precede them.
ThisThe Bank maintains an internet site at http://www.grupobancolombia.com/. In addition, certain of the Bank’s Subsidiaries referred to in this Annual Report refers to certain websites as sources for certain information contained herein. Information contained inmaintain separate internet sites. For example, Banco Agrícola and Banistmo maintain internet sites at http://www.bancoagricola.com/ and http://www.banistmo.com/, respectively.Information included on or otherwise accessible through these websitesBancolombia’s internet site or the internet site of any of the Subsidiaries of the Bank is not a part of this Annual Report. All references in this Annual Report to these and other internet sites are inactive textual references to these URLs, or “uniform resource locators”, and are for your informational reference only.
The Bank maintains an internet site atwww.grupobancolombia.com. In addition, certain of the Bank’s Subsidiaries referred to in this Annual Report maintain separate internet sites. For example, Banco Agrícola maintains an internet site atwww.bancoagricola.com. Information included on or accessible through Bancolombia’s internet site or the internet site of any of the Subsidiaries of the Bank is not part of this Annual Report.iv
PART I
| ITEM 1. | IDENTITY OF DIRECTORS, SENIOR MANAGEMENT AND ADVISERS |
Not applicable.
| ITEM 2. | OFFER STATISTICS AND EXPECTED TIMETABLE |
Not applicable.
| A. | SELECTED FINANCIAL DATA |
The selected consolidated financial data as of December 31, 20122015 and 2011, and for each of the three fiscal years in the period ended December 31, 2012 set forth below has been derived from the Bank’s audited consolidated financial statements included in this Annual Report. The selected consolidated financial data as of December 31, 2010, 2009 and 2008,2014, and for each of the two fiscal years in the period ended December 31, 20092015 set forth below havehas been derived from the Bank’s audited consolidated financial statements for the respective periods, which are notConsolidated Financial Statements under IFRS included herein.in this Annual Report.
The selected consolidated financial data should be read in conjunction with the Bank’s consolidated financial statements,Consolidated Financial Statements, related notes thereto, and the reports of the Bank’s independent registered public accounting firms.
Differences Between Colombian banking GAAP and U.S. GAAP Results
| | | As of and for the year ended December 31, | |
| | | 2015 | | | 2015 | | | 2014 | |
| | | (in millions of COP and thousands of USD, except per share
and per ADS amounts) | |
| CONSOLIDATED STATEMENT OF INCOME: | | | | | | | | | | | | |
| Total interest and valuation income | | USD | 3,578,267 | | | COP | 11,269,644 | | | COP | 9,172,163 | |
| Interest expenses | | | (1,282,102 | ) | | | (4,037,941 | ) | | | (3,164,611 | ) |
| Net margin and valuation on financial instruments | | | 2,296,165 | | | | 7,231,703 | | | | 6,007,552 | |
| Credit impairment charges on loans and financial leases, net. | | | (529,511 | ) | | | (1,667,680 | ) | | | (843,597 | ) |
| Allowances for credit losses on off balance sheet credit instruments | | | (2,356 | ) | | | (7,421 | ) | | | (25,608 | ) |
| Net interest and valuation income after provisions for loans, financial leases and off-balance sheet credit instruments | | | 1,764,298 | | | | 5,556,602 | | | | 5,138,347 | |
| Total other operating income | | | 1,135,848 | | | | 3,577,320 | | | | 3,084,942 | |
| Total operating expenses | | | (1,872,787 | ) | | | (5,898,287 | ) | | | (5,118,695 | ) |
| Profit before tax | | | 1,027,359 | | | | 3,235,635 | | | | 3,104,594 | |
| Income tax | | | (206,146 | ) | | | (649,250 | ) | | | (737,676 | ) |
| Profit for the year from continuing operations | | | 821,213 | | | | 2,586,385 | | | | 2,366,918 | |
| Net income from discontinued operations | | | 7,148 | | | | 22,513 | | | | 62,867 | |
| Net income | | | 828,361 | | | | 2,608,898 | | | | 2,429,785 | |
| Net income attributable to equity holders of the parent company | | USD | 799,782 | | | COP | 2,518,890 | | | COP | 2,387,086 | |
| Non-controlling interest | | | 28,579 | | | | 90,008 | | | | 42,699 | |
| | | | | | | | | | | | | |
| Weighted average of Preferred and Common Shares outstanding(1) | | | | | | | 961,827,000 | | | | 941,936,589 | |
| Basic and Diluted net income per share(1) | | | 851 | | | | 2,680 | | | | 2,591 | |
| From continued operations | | | 843 | | | | 2,656 | | | | 2,524 | |
| From discontinued operations | | | 8 | | | | 24 | | | | 67 | |
| Basic and Diluted net income per ADS | | | 3,404 | | | | 10,720 | | | | 10,364 | |
| From continuing operations | | | 3,373 | | | | 10,624 | | | | 10,096 | |
| From discontinued operations | | | 30 | | | | 96 | | | | 268 | |
| Cash dividends declared per share | | | | | | | 888 | | | | 830 | |
| Cash dividends declared per share (stated in US Dollars) | | | | | | | 0.28 | | | | 0.26 | |
| Cash dividends declared per ADS | | | | | | | 3,552 | | | | 3,320 | |
| Cash dividends declared per ADS (stated in US Dollars) | | | | | | | 1.13 | | | | 1.05 | |
The Bank’s consolidated financial statements have been prepared in accordance with Colombian banking GAAP, which are the accounting principles and policies that are summarized in “Note 2. Summary of Significant Accounting Policies” to the Bank’s Financial Statements included in this Annual Report. These accounting principles and policies differ in some significant respects from U.S. GAAP.
Consolidated net income attributable to the controlling interest under U.S. GAAP for the year ended December 31, 2012 was COP 1,633,563 million (compared with COP 1,043,636 million for fiscal year 2011 and COP 1,544,761 million for fiscal year 2010). A reconciliation of consolidated net income and consolidated stockholders’ equity under U.S. GAAP is included in “Note 31. Differences between Colombian Accounting Principles for Banks and U.S. GAAP” to the Financial Statements included in this Annual Report.
| | | As of and for the year ended December 31, | |
| | | 2012(1) | | | 2012 | | | 2011 | | | 2010 | | | 2009 | | | 2008 | |
| | | (in millions of COP and thousands of USD(1), except per share and per American Depositary Share (“ADS”) amounts) | |
| CONSOLIDATED STATEMENT OF OPERATIONS: | | | | | | | | | | | | | | | | | | | | | | | | |
| Colombian banking GAAP: | | | | | | | | | | | | | | | | | | | | | | | | |
| Interest income | | USD | 4,333,081 | | | COP | 7,661,883 | | | COP | 5,945,594 | | | COP | 4,960,640 | | | COP | 6,427,698 | | | COP | 6,313,743 | |
| Interest expense | | | (1,637,151 | ) | | | (2,894,860 | ) | | | (2,042,006 | ) | | | (1,571,581 | ) | | | (2,625,416 | ) | | | (2,753,341 | ) |
| Net interest income | | | 2,695,930 | | | | 4,767,023 | | | | 3,903,588 | | | | 3,389,059 | | | | 3,802,282 | | | | 3,560,402 | |
| | | | | | | | | | | | | | | | | | | | | | | | | |
| Provisions for loans, finance leases and accrued interest losses, net of recoveries (2) | | | (606,550 | ) | | | (1,072,520 | ) | | | (596,417 | ) | | | (512,585 | ) | | | (1,103,595 | ) | | | (1,155,262 | ) |
| Provision for foreclosed assets and other assets, net of recoveries(3) | | | (21,690 | ) | | | (38,353 | ) | | | (2,288 | ) | | | (35,130 | ) | | | (49,779 | ) | | | 22,095 | |
| Net interest income after provisions | | | 2,067,690 | | | | 3,656,150 | | | | 3,304,883 | | | | 2,841,344 | | | | 2,648,908 | | | | 2,427,235 | |
| | | | | | | | | | | | | | | | | | | | | | | | | |
| Fees and income from services and other operating income, net(4) | | | 1,493,095 | | | | 2,640,137 | | | | 2,359,821 | | | | 2,115,970 | | | | 1,886,949 | | | | 1,964,084 | |
| Operating expenses | | | (2,353,981 | ) | | | (4,162,382 | ) | | | (3,606,348 | ) | | | (3,098,479 | ) | | | (2,895,145 | ) | | | (2,639,997 | ) |
| Net operating income | | | 1,206,804 | | | | 2,133,905 | | | | 2,058,356 | | | | 1,858,835 | | | | 1,640,712 | | | | 1,751,322 | |
| | | | | | | | | | | | | | | | | | | | | | | | | |
| Net non-operating income excluding minority interest | | | 23,153 | | | | 40,938 | | | | 87,406 | | | | 99,293 | | | | 93,232 | | | | 31,888 | |
| Minority interest (loss) | | | (3,237 | ) | | | (5,723 | ) | | | (11,351 | ) | | | (13,217 | ) | | | (15,081 | ) | | | (18,511 | ) |
| Income before income taxes | | | 1,226,720 | | | | 2,169,120 | | | | 2,134,411 | | | | 1,944,911 | | | | 1,718,863 | | | | 1,764,699 | |
| | | | | | | | | | | | | | | | | | | | | | | | | |
| Income taxes | | | (264,150 | ) | | | (467,074 | ) | | | (470,517 | ) | | | (508,417 | ) | | | (462,013 | ) | | | (474,056 | ) |
| Net income | | USD | 962,570 | | | COP | 1,702,046 | | | COP | 1,663,894 | | | COP | 1,436,494 | | | COP | 1,256,850 | | | COP | 1,290,643 | |
| | | | | | | | | | | | | | | | | | | | | | | | | |
| Weighted average of Preferred and Common Shares outstanding(5) | | | | | | | 845,531,918 | | | | 787,827,003 | | | | 787,827,003 | | | | 787,827,003 | | | | 787,827,003 | |
| Basic and Diluted net income per share(5) | | | 1.14 | | | | 2,013 | | | | 2,112 | | | | 1,823 | | | | 1,595 | | | | 1,638 | |
| Basic and Diluted net income per ADS | | | 4.55 | | | | 8,052 | | | | 8,448 | | | | 7,292 | | | | 6,380 | | | | 6,552 | |
| Cash dividends declared per share | | | | | | | 754 | | | | 708 | | | | 669 | | | | 637 | | | | 624 | |
| Cash dividends declared per share(stated in U.S. Dollars) | | | | | | | 0.43 | | | | 0.36 | | | | 0.35 | | | | 0.31 | | | | 0.28 | |
| Cash dividends declared per ADS | | | | | | | 3,016 | | | | 2,832 | | | | 2,675 | | | | 2,547 | | | | 2,496 | |
| Cash dividends declared per ADS (stated in U.S. Dollars) | | | | | | | 1.71 | | | | 1.46 | | | | 1.40 | | | | 1.25 | | | | 1.11 | |
| | | | | | | | | | | | | | | | | | | | | | | | | |
| U.S. GAAP:(6) | | | | | | | | | | | | | | | | | | | | | | | | |
| Net income attributable to the controlling interest | | USD | 923,841 | | | COP | 1,633,563 | (6) | | COP | 1,043,636 | (6) | | COP | 1,544,761 | (6) | | COP | 1,172,524 | (6) | | COP | 849,920 | |
| Basic and Diluted net income per common share (7) | | | 1.09 | | | | 1,932 | | | | 1,325 | | | | 1,961 | | | | 1,488 | | | | 1,079 | |
| Basic and Diluted net income per ADS (7) (8) | | | 4.37 | | | | 7,728 | | | | 5,300 | | | | 7,844 | | | | 5,952 | | | | 4,316 | |
| (1) | Amounts stated in U.S. dollars have been converted at the rate of COP 1,768.23 per USD 1.00, which is the Representative Market Rate calculated on December 31, 2012 (the last business day of 2012), as reported by the SFC. Such translation should not be construed as representations that the Colombian pesos amount represent, or have been or could be converted into, United States at that or any other rate. |
| (2) | Represents the provision for loans, accrued interest losses and other receivables, net and recovery of charged-off loans. Includes a provision for accrued interest losses amounting to COP 48,085 million, COP 31,852 million, COP 33,540 million, COP 46,840 million and COP 58,721 million for the years ended December 31, 2012, 2011, 2010, 2009 and 2008, respectively. |
| (3) | Represents the provision for foreclosed assets and other assets and the recovery of provisions for foreclosed assets and other assets. |
| (4) | Represents the total fees and income from services, net and total other operating income. |
| (5) | The weighted average of preferred and common shares outstanding for the fiscal year 2012 includes 335,827,334ended December 31, 2015 reflects 452,122,416 preferred shares and 509,704,584 common shares, and for the fiscal years 2011, 2010, 2009 and 2008, includes 278,122,419year ended December 31, 2014 reflects 432,232,005 preferred shares and 509,704,584 common shares. |
| (6) | Refer to “Note 31. Differences Between Colombian Accounting Principles for Banks and U.S. GAAP” of our Financial Statements included in this Annual Report. |
| (7) | Net income per share under U.S. GAAP is presented on the basis of net income available to common stockholders divided by the weighted average number of common shares outstanding (509,704,584 for 2012, 2011, 2010, 2009 and 2008). See “Note 31. Differences Between Colombian Accounting Principles for Banks and U.S. GAAP”. |
| (8) | Basic and diluted net income per ADS for any period is defined as basic and diluted net income per share multiplied by four as each ADS is equivalent to four preferred shares of Bancolombia. Basic and diluted net income per ADS should not be considered in isolation, or as a substitute for net income, as a measure of operating performance or as a substitute for cash flows from operations or as a measure of liquidity. |
CONSOLIDATED BALANCE SHEETSTATEMENT OF FINANCIAL POSITION
| | | As of the year ended December 31, | |
| | | 2012(1) | | | 2012 | | | 2011 | | | 2010 | | | 2009 | | | 2008 | |
| | | (in millions of COP and thousands of USD(1), except per share and per American Depositary Share (“ADS”) amounts) | |
| CONSOLIDATED BALANCE SHEET | | | | | | | | | | | | | | | | | | | | | | | | |
| Colombian banking GAAP: | | | | | | | | | | | | | | | | | | | | | | | | |
| Assets: | | | | | | | | | | | | | | | | | | | | | | | | |
| Cash and due from banks | | USD | 4,040,207 | | | COP | 7,144,015 | | | COP | 6,818,307 | | | COP | 5,312,398 | | | COP | 4,983,569 | | | COP | 3,870,927 | |
| Funds sold and securities purchased under agreements to resell | | | 579,722 | | | | 1,025,082 | | | | 910,690 | | | | 842,636 | | | | 2,388,790 | | | | 1,748,648 | |
| Investment securities, net | | | 7,099,931 | | | | 12,554,311 | | | | 9,958,191 | | | | 8,675,762 | | | | 8,914,913 | | | | 7,278,276 | |
| Loans and financial leases, net | | | 37,743,416 | | | | 66,739,040 | | | | 58,575,846 | | | | 46,091,877 | | | | 39,610,307 | | | | 42,508,210 | |
| Accrued interest receivable on loans and financial leases, net | | | 296,364 | | | | 524,041 | | | | 439,189 | | | | 317,532 | | | | 338,605 | | | | 505,658 | |
| Customers’ acceptances and derivatives | | | 442,824 | | | | 783,014 | | | | 741,296 | | | | 784,888 | | | | 205,367 | | | | 272,458 | |
| Accounts receivable, net | | | 703,112 | | | | 1,243,263 | | | | 1,016,985 | | | | 797,715 | | | | 806,885 | | | | 828,817 | |
| Premises and equipment, net | | | 758,780 | | | | 1,341,698 | | | | 1,622,311 | | | | 1,174,625 | | | | 992,041 | | | | 1,171,117 | |
| Premises and equipment under operating leases, net | | | 1,239,617 | | | | 2,191,928 | | | | 1,380,057 | | | | 1,006,108 | | | | 843,054 | | | | 726,262 | |
| Foreclosed assets, net | | | 47,968 | | | | 84,818 | | | | 53,194 | | | | 70,277 | | | | 80,668 | | | | 24,653 | |
| Prepaid expenses and deferred charges, net | | | 437,121 | | | | 772,930 | | | | 785,456 | | | | 319,864 | | | | 185,811 | | | | 132,881 | |
| Goodwill | | | 323,133 | | | | 571,373 | | | | 679,861 | | | | 750,968 | | | | 855,724 | | | | 1,008,639 | |
| Other assets | | | 1,181,377 | | | | 2,088,947 | | | | 1,697,648 | | | | 1,185,977 | | | | 922,265 | | | | 1,093,850 | |
| Reappraisal of assets | | | 481,793 | | | | 851,920 | | | | 783,989 | | | | 764,529 | | | | 736,366 | | | | 612,683 | |
| Total assets | | USD | 55,375,365 | | | COP | 97,916,380 | | | COP | 85,463,020 | | | COP | 68,095,156 | | | COP | 61,864,365 | | | COP | 61,783,079 | |
| | | | | | | | | | | | | | | | | | | | | | | | | |
| Liabilities and stockholders’ equity: | | | | | | | | | | | | | | | | | | | | | | | | |
| Deposits | | USD | 36,284,150 | | | COP | 64,158,720 | | | COP | 52,434,492 | | | COP | 43,538,967 | | | COP | 42,149,330 | | | COP | 40,384,400 | |
| Borrowings(3) | | | 2,981,235 | | | | 5,271,508 | | | | 7,458,926 | | | | 5,250,587 | | | | 4,039,150 | | | | 5,947,925 | |
| Other liabilities | | | 9,545,815 | | | | 16,879,197 | | | | 16,576,242 | | | | 11,358,462 | | | | 8,643,056 | | | | 9,333,909 | |
| Stockholder’ equity | | | 6,564,165 | | | | 11,606,955 | | | | 8,993,360 | | | | 7,947,140 | | | | 7,032,829 | | | | 6,116,845 | |
| Total liabilities and stockholders’ equity | | USD | 55,375,365 | | | COP | 97,916,380 | | | COP | 85,463,020 | | | COP | 68,095,156 | | | COP | 61,864,365 | | | COP | 61,783,079 | |
| | | | | | | | | | | | | | | | | | | | | | | | | |
| U.S. GAAP: | | | | | | | | | | | | | | | | | | | | | | | | |
| Stockholders’ equity attributable to the controlling interest | | USD | 6,303,190 | | | COP | 11,145,490 | (2) | | COP | 8,589,202 | (2) | | COP | 8,069,346 | | | COP | 7,095,266 | | | COP | 6,422,815 | |
| Stockholders’ equity per share(4) (5) | | | 7,455 | | | | 13,182 | | | | 10,902 | | | | 10,243 | | | | 9,006 | | | | 8,153 | |
| Stockholders’ equity per ADS(4) (5) | | | 29,820 | | | | 52,728 | | | | 43,608 | | | | 40,972 | | | | 36,024 | | | | 32,612 | |
| | | As of December 31, | |
| | | USD
2015 | | | 2015 | | | 2014 | |
| | | | | | | | | | |
| | | (in millions of COP and thousands of USD, except per share and per
ADS amounts) | |
| CONSOLIDATED STATEMENT OF FINANCIAL POSITION | | | | | | | | | | | | |
| Assets: | | | | | | | | | | | | |
| Cash and cash equivalents | | USD | 5,904,998 | | | COP | 18,597,614 | | | COP | 13,466,783 | |
| Financial assets investments | | | 4,533,405 | | | | 14,277,824 | | | | 12,784,223 | |
| Derivative financial instruments | | | 756,371 | | | | 2,382,168 | | | | 1,448,845 | |
| Loans and advances to customers | | | 46,236,554 | | | | 145,620,639 | | | | 115,173,653 | |
| Allowance for loan and lease losses | | | (1,666,551 | ) | | | (5,248,755 | ) | | | (4,789,257 | ) |
| Assets held for sale and inventories | | | 619,408 | | | | 1,950,808 | | | | 97,744 | |
| Investment in associates and joint ventures | | | 173,537 | | | | 546,549 | | | | 1,349,697 | |
| Investment property | | | 477,873 | | | | 1,505,046 | | | | 1,114,180 | |
| Premises and equipment, net | | | 1,029,240 | | | | 3,241,562 | | | | 2,646,321 | |
| Goodwill and Intangible assets, net | | | 2,251,888 | | | | 7,092,255 | | | | 4,585,849 | |
| Deferred tax | | | 54,130 | | | | 170,482 | | | | 187,737 | |
| Other assets | | | 900,683 | | | | 2,836,675 | | | | 1,564,106 | |
| Total assets | | USD | 61,271,536 | | | COP | 192,972,867 | | | COP | 149,629,881 | |
| | | | | | | | | | | | | |
| Liabilities and stockholders' equity: | | | | | | | | | | | | |
| Deposit from customers | | | 38,673,817 | | | | 121,802,028 | | | | 94,769,319 | |
| Borrowings from other financial institutions | | | 6,261,747 | | | | 19,721,184 | | | | 13,852,284 | |
| Debt securities in issue | | | 6,171,154 | | | | 19,435,865 | | | | 14,527,403 | |
| Other liabilities | | | 3,685,024 | | | | 11,605,871 | | | | 9,114,395 | |
| Stockholder' equity | | | 6,479,794 | | | | 20,407,919 | | | | 17,366,480 | |
| | | | | | | | | | | | | |
| Total liabilities and stockholders' equity | | USD | 61,271,536 | | | COP | 192,972,867 | | | COP | 149,629,881 | |
| | | | | | | | | | | | | |
| Stockholders' equity per share(1) | | | 6,736 | | | | 21,214 | | | | 18,436 | |
| Stockholders' equity per ADS(1) | | | 26,943 | | | | 84,856 | | | | 73,743 | |
| (1) | Amounts stated in U.S. dollars have been converted at the rate of COP 1,768.23 per USD 1.00, which is the Representative Market Rate calculated on December 31, 2012, the last business day of the year, as reported by the SFC. Such conversions should not be construed as representations that the peso amounts represent, or have been or could be converted into, United States dollars at the Representative Market Rate or any other rate. |
| (2) | Refer to “Note 31, Differences between Colombian Accounting Principles for Banks and U.S. GAAP” to the Financial Statements included in this Annual Report. |
| (3) | Includes interbank borrowing, development and other domestic banks. |
| (4) | On February 6, 2012, Bancolombia issued 63,999,997 preferred shares in a public offering, 43,543,793 preferred shares were issued in a local preemptive rights offering, at a price of COP 26,000 per share and in the offering outside of Colombia, 5,114,051 ADSs, representing 20,456,204 preferred shares were issued at a price of USD 60 per ADS. |
| (5) | The weighted average (rounded to the nearest million) of preferred and common shares outstanding was 845962 million for the fiscal year ended December 31, 20122015, and 788942 million for the fiscal year ended December 31, 2011, 2010, 2009 and 2008.2014. Stockholders’ equity per share is equal to stockholders’ equity under U.S. GAAPIFRS divided by the weighted average of preferred and common shares outstanding, stockholders’outstanding. Stockholders’ equity per ADS is equal to stockholders’ equity per share multiplied by four preferred shares of Bancolombia (each ADS is equivalent torepresents four preferred shares of Bancolombia). |
| | Stockholders’ equity per share and stockholders’ equity per ADS should not be considered in isolation, or as a substitute for net income, as a measure of operating performance or as a substitute for cash flows from operations or as a measure of liquidity. The non-GAAP financial measures described in this footnote are not a substitute for the GAAP measures of financial performance. Shouldperformance and should not be considered as an alternate measure of stockholders’ equity as determined on a consolidated basis using amounts derived from the consolidated balance sheetstatement of financial position prepared in accordance with Colombian banking GAAP.IFRS. |
See ―“Item 8. Financial Information – A. Consolidated Statements and Other Financial Information – A.3. Dividend Policy”, for information about the dividends declared per share in both pesos and U.S. dollars during the fiscal years ended December 31, 2012, 2011, 2010, 20092015 and 2008.
2014.
SELECTED RATIOS
| | | As of and for the year ended December 31, | |
| | | 2012 | | | 2011 | | | 2010 | | | 2009 | | | 2008 | |
| | | (Percentages, except for operating data) | |
| SELECTED RATIOS:(1) | | | | | | | | | | | | | | | | | | | | |
| Colombian banking GAAP: | | | | | | | | | | | | | | | | | | | | |
| Profitability ratios: | | | | | | | | | | | | | | | | | | | | |
| Net interest margin(2) | | | 6.49 | | | | 6.17 | | | | 6.38 | | | | 7.22 | | | | 7.64 | |
| Return on average total assets(3) | | | 1.92 | | | | 2.20 | | | | 2.27 | | | | 2.01 | | | | 2.34 | |
| Return on average stockholders’ equity(4) | | | 15.97 | | | | 20.22 | | | | 19.71 | | | | 19.59 | | | | 23.68 | |
| Efficiency Ratio: | | | | | | | | | | | | | | | | | | | | |
| Operating expenses as a percentage of interest, fees, services and other operating income | | | 56.19 | | | | 57.58 | | | | 56.28 | | | | 50.89 | | | | 47.79 | |
| Capital ratios: | | | | | | | | | | | | | | | | | | | | |
| Period-end stockholders’ equity as a percentage of period-end total assets | | | 11.85 | | | | 10.52 | | | | 11.67 | | | | 11.37 | | | | 9.90 | |
| Period-end regulatory capital as a percentage of period-end risk- weighted assets(5) | | | 15.77 | | | | 12.46 | | | | 14.67 | | | | 13.23 | | | | 11.24 | |
| Credit quality data: | | | | | | | | | | | | | | | | | | | | |
| Non-performing loans as a percentage of total loans(6) | | | 1.76 | | | | 1.52 | | | | 1.91 | | | | 2.44 | | | | 2.35 | |
| “C”, “D” and “E” loans as a percentage of total loans(9) | | | 3.96 | | | | 3.82 | | | | 4.32 | | | | 5.11 | | | | 4.40 | |
| Allowance for loan and accrued interest losses as a percentage of non-performing loans | | | 268.96 | | | | 306.94 | | | | 274.36 | | | | 241.08 | | | | 224.53 | |
| Allowance for loan and accrued interest losses as a percentage of “C”, “D” and “E” loans(7) | | | 119.30 | | | | 121.69 | | | | 121.45 | | | | 115.25 | | | | 120.21 | |
| Allowance for loan and accrued interest losses as a percentage of total loans | | | 4.72 | | | | 4.65 | | | | 5.24 | | | | 5.89 | | | | 5.29 | |
| | | | | | | | | | | | | | | | | | | | | |
| OPERATING DATA: | | | | | | | | | | | | | | | | | | | | |
| Number of branches(8) | | | 993 | | | | 952 | | | | 921 | | | | 889 | | | | 890 | |
| Number of employees(9) | | | 24,820 | | | | 24,126 | | | | 22,992 | | | | 21,201 | | | | 19,728 | |
| | | As of and for the year ended December 31, | |
| | | 2015 | | | 2014 | |
| | | (Percentages, except for operating data) | |
| SELECTED RATIOS:(1) | | | | | | | | |
| Profitability ratios: | | | | | | | | |
| Net interest margin and valuation from continuing operations(2) | | | 5.25 | | | | 5.30 | |
| Return on average total assets from continuing operations(3) | | | 1.53 | | | | 1.72 | |
| Return on average stockholders‘ equity(4) | | | 13.62 | | | | 14.81 | |
| Efficiency ratio: | | | | | | | | |
| Operating expenses to net operating income from continuing operations | | | 54.57 | | | | 56.30 | |
| Operating expenses to average total assets from continuing operations | | | 3.62 | | | | 3.80 | |
| Operating expenses to productive assets from continuing operations | | | 4.28 | | | | 4.51 | |
| Capital ratios: | | | | | | | | |
| Technical capital to risk weighted assets(5) | | | 12.46 | | | | N/A | (6) |
| Credit quality data: | | | | | | | | |
| Past due loans to total loans | | | 2.98 | | | | 2.62 | |
| “C”, “D” and “E” loans as a percentage of total loans | | | 3.95 | | | | 3.81 | |
| Allowances to past due loans(7) | | | 115.16 | | | | 145.55 | |
| Allowance for loan and lease losses as a percentage of “C”, “D” and “E” loans | | | 87.00 | | | | 100.09 | |
| Allowance for loan and lease losses as a percentage of total loans | | | 3.43 | | | | 3.81 | |
| OPERATING DATA: | | | | | | | | |
| Number of branches(8) | | | 1,274 | | | | 1,070 | |
| Number of employees (9) | | | 34,390 | | | | 30,158 | |
| (1) | RatiosAverage balances used to calculate the ratios shown above have been calculated as follows: for the year ended December 31, 2015, for each month, the actual month-end balances were established. The average consolidated balance for such period is the average of such month-end balances. The Bank has calculated on the basisaverage balances using quarterly book balances for the year ended December 31, 2014 as we believe such balances are representative of our operations and it would be too costly to produce average balances using monthly averages.balances under IFRS. |
| (2) | Net interest income divided by average interest-earning assets. |
| (3) | Net income and valuation on financial instruments divided by average total assets. |
| (4) | Net income and valuation on financial instruments divided by average stockholders’ equity. |
| (5) | For an explanation of risk-weighted assets and Technical Capital, see “ItemItem 4. Information“Information on the Company – B. Business Overview – B.8. SupervisionB.8 –Supervision and RegulationRegulation” and Item 5“Operation and Financial Review and Prospects - B. Liquidity and Capital Resources –B.1. Liquidity and Funding - Capital Adequacy Requirements”Adequacy". |
| (6) | Non-performing loans are small business loans that are past due 30 days or more, mortgage and consumer loans that are past due 60 days or more and commercial loans that are past due 90 days or more. (Each category includes financial leases.)N/A: not applicable. The Bank’s consolidated capital adequacy was computed considering balance accounts under IFRS as of December 31, 2015. |
| (7) | The decrease in this coverage ratiovariation is explainedmainly generated by the formationinclusion of PDLs during the year, which was faster than the pace of increase in allowances in the balance sheet.See “Item 4. Information on the Company – E. Selected Statistical Information – E.3. Loan Portfolio – Classification of theGrupo Agromercantil’s loan portfolio and Credit Categories for a description of ‘C’, ‘D’ and ‘E’ Loans”.at fair value during 2015. |
| (8) | Number of branches includes branches of the Bank’s Subsidiaries. For some subsidiaries, the central office is considered a branch. Representative offices are included. |
| (9) | The number of employees includes employees of the Bank’s consolidated Subsidiaries. |
Exchange Rates
On March 27, 2013,31, 2016, the Representative Market Rate was COP 1,832.203,000.63 per USDU.S. dollar 1.00. The Federal Reserve Bank of New York does not report a rate for pesos; the SFC calculates the Representative Market Rate based on the weighted average of the buy/sell foreign exchange rates quoted daily by certain financial institutions, including Bancolombia, for the purchase and sale of U.S. dollars.
The following table sets forth the low and high peso per U.S. dollar exchange rates and the peso/U.S. dollar representative market rate on the last day of the month, for each of the last six months:
| Recent exchange rates of pesos per U.S. dollars |
| Month | | Low | | | High | | | Period-End | |
| | | | | | | | | | |
| March 2013 | | | 1,797.28 | | | | 1,832.20 | | | | 1,832.20 | |
| February 2013 | | | 1,776.20 | | | | 1,818.54 | | | | 1,814.28 | |
| January 2013 | | | 1,758.45 | | | | 1,779.84 | | | | 1,775.65 | |
| December 2012 | | | 1,768.23 | | | | 1,813.73 | | | | 1,768.23 | |
| November 2012 | | | 1,813.72 | | | | 1,828.80 | | | | 1,813.72 | |
| October 2012 | | | 1,795.40 | | | | 1,831.25 | | | | 1,831.25 | |
| Recent exchange rates of pesos per U.S. dollars |
| Month | | Low | | | High | | | Period-End | |
| | | | | | | | | | |
| March 2016 | | | 3,000.63 | | | | 3,268.86 | | | | 3,000.63 | |
| February 2016 | | | 3,306.00 | | | | 3,434.89 | | | | 3,319.80 | |
| January 2016 | | | 3,203.86 | | | | 3,375.80 | | | | 3,287.31 | |
| December 2015 | | | 3,131.95 | | | | 3,356.00 | | | | 3,149.47 | |
| November 2015 | | | 2,819.63 | | | | 3,142.11 | | | | 3,142.11 | |
| October 2015 | | | 2,855.74 | | | | 3,061.85 | | | | 2,897.83 | |
Source: SFC.
The following table sets forth the peso/U.S. dollar representative market rateRepresentative Market Rate on the last day of the year and the average peso/U.S. dollar representative market rate (calculated by using the average of the Representative Market Rates on the last day of each month during the year) for each of the five most recent financial years.
| Peso/USD 1.00 | Representative Market Rate | | Period | | | Period-End | | | | Average | | | Period-End | | | Average | |
| | | | | | | | | | | | | | |
| 2015 | | | | 3,149.47 | | | | 2,773.43 | |
| 2014 | | | | 2,392.46 | | | | 2,019.38 | |
| 2013 | | | | 1,926.83 | | | | 1,881.04 | |
| 2012 | | | 1,768.23 | | | | 1,798.08 | | | | 1,768.23 | | | | 1,798.08 | |
| 2011 | | | 1,942.70 | | | | 1,852.83 | | | | 1,942.70 | | | | 1,852.83 | |
| 2010 | | | 1,913.98 | | | | 1,901.67 | | |
| 2009 | | | 2,044.23 | | | | 2,179.64 | | |
| 2008 | | | 2,243.59 | | | | 1,993.80 | | |
Source: SFC.
| B. | CAPITALIZATION AND INDEBTEDNESS |
Not applicable.
| C. | REASONS FOR THE OFFER AND USE OF PROCEEDS |
Not applicable.
Investors should consider the following risks and uncertainties, and the other informationfactors presented in this Annual Report. In addition, the factorsinformation referred to below, as well as all other information presented in this Annual Report, should be considered by investors when reviewing any forward-looking statements contained in this Annual Report, in any document incorporated by reference in this Annual Report, in any of the Bank’s future public filings or press releases, or in any future oral statements made by the Bank or any of its officers or other persons acting on its behalf. If any of the following risks occur, the Bank’s business, results of operations and financial condition, its ability to raise capital and its ability to access funding could be materially and adversely affected. These risk factors should not be considered a complete list of potential risks that may affect Bancolombia.
Risk Factors Relating to Colombia and Other Countries Where the Bank Operates.
Changes in economic and political conditions in Colombia, and El Salvador, Panama, Guatemala or in the other countries where the Bank operates may adversely affect the Bank’s financial condition and results of operations.
The Bank’s financial condition, results of operations and asset quality are significantly dependent on the macroeconomic and political conditions prevailing in Colombia, El Salvador, Panama, Guatemala and the other jurisdictions in which the Bank operates. Accordingly, decreases in the growth rate, periods of negative growth, increases in inflation, changes in policy, or future judicial interpretations of policies involving exchange controls and other matters such as (but not limited to) currency depreciation, inflation, interest rates, taxation, banking laws and regulations and other political or economic developments in or affecting Colombia, El Salvador or the othersuch jurisdictions where the Bank operates may affect the overall business environment and may in turn impact the Bank’s financial condition and results of operations.
In particular, the Governmentsgovernments of Colombia, Panama, Guatemala and El Salvador have historically exercised substantial influence on their economies, and their policiesthey are likely to continue to implement policies that will have an important effectimpact on Colombianthe business and Salvadorianresults of operations of the entities in such countries (including the Bank), market conditions and prices and rates of return on securities of local issuers (including the Bank’s securities). Potential changes in laws, public policies and regulations may cause instability and volatility in Colombia, Panama, Guatemala and itsEl Salvador, and their respective markets.
Future developments in Governmentgovernment policies could impair the Bank’s business or financial condition or the market value of its securities.
The economies of the countries wherein which the Bank operates are vulnerable to external effects that could be caused by significant economic difficulties experienced by their major regional trading partners or by more general “contagion”contagion effects, which could have a material adverse effect on such countries economic growth in these countries and their ability to service their public debt.
A significant decline in the economic growth or a sustained economic downturn of any of Colombia’s, or El Salvador’s, Panama’s or Guatemala’s major trading partners (i.e., the European Union, the United States, China Venezuela and Ecuadorother Latin American countries for Colombia and the United States and European Union for El Salvador)Salvador and Panama) could have a material adverse impact on Colombia’s, and El Salvador’s, Guatemala’s and Panama’s balance of trade and remittances inflows, resulting in lower economic growth.
Deterioration in the economic and political situation of neighboring countries could affect the national stability or the Colombian economy of Colombia, Panama, El Salvador and Guatemala by disrupting Colombia’stheir diplomatic or commercial relationships with theseneighboring countries. PoliticalAny future tensions between Colombia and Venezuela in recent years have produced lower trade levels that have adversely impacted economic activity. Although relations with Venezuela have improved significantly with the current Government, the possibility of any further resurgence in tensions between the two countries may cause political and economic uncertainty, instability, market volatility, lowerlow confidence levels and higher risk aversion by investors and market participants that may negatively affect economic activity in Colombia and El Salvador.any of those jurisdictions.
A contagion effect, in which an entire region or class of investment is disfavored by international investors, could negatively affect Colombia and El Salvador or other economies where the bankBank operates, (i.e., Panama, Cayman Islands, Peru and Puerto Rico), as well as the market prices and liquidity of securities issued or owned by the Bank.
Any additional taxes resulting from changes to tax regulations or the interpretation thereof in Colombia, El Salvador, Panama, Guatemala or other countries wherein which the Bank operates, could adversely affect the Bank’s consolidated results.
Uncertainty relating to tax legislation poses a constant risk to the Bank. Changes in legislation, regulation and jurisprudence can affect tax burdens by increasing tax rates and fees, creating new taxes, limiting stated expenses and deductions, and eliminating incentives and non-taxed income. Notably, the Colombian and Salvadorian Governmentsgovernments have significant fiscal deficits that may result in future tax increases. Additional tax regulations could be implemented that could requirerequiring the Bank to make additional tax payments and negatively affecting its results of operations and cash flow. In addition, national or local taxing authorities may not interpret tax regulations in the same way that the Bank does. Differing interpretations could result in future tax litigation and associated costs.
Exchange rate volatilityfluctuations may adversely affect the Colombian economy, the market price of ourthe Bank’s ADSs, and the dividends payable to holders of the Bank’s ADSs.
Colombia has adopted a floating exchange rate system. The Colombian Central Bank maintains the power to intervene in the exchange market in order to consolidate or dispose of international reserves, and to control any volatility in the exchange rate. From time to time, including during 2015, there have been significant fluctuations in the exchange rate between the Colombian peso and the U.S. dollar. Unforeseen events in the international markets, fluctuations in interest rates, volatility of the oil price in the international markets, or changes in capital flows, may cause exchange rate instability that could generate sharp movements in the value of the peso. Given that a portion of ourthe Bank’s assets and liabilities are denominated in, or indexed to, foreign currencies, especially the U.S. dollar, sharp movements in exchange rates may negatively impact the Bank’s results. In addition, exchange rate fluctuations may adversely impact the value of dividends paid to holders of the Bank’s ADSs as well as the market price and liquidity of ADSs.
Colombia has experienced several periods of violence and instability and such instabilitythat could affect the economy and the Bank.
Colombia has experienced several periods of criminal violence over the past four decades, primarily due to the activities of guerilla groups and drug cartels. In response, the Colombian Government has implemented various security measures and has strengthened its military and police forces by creating specialized units, and currentlygovernment is in the process of negotiating a peace treaty with the Revolutionary Armed Forces of Colombia (Fuerzas Armadas Revolucionarias de Colombia or “FARC”) (FARC). Despite these efforts, drug-related crime and guerilla activity continue to exist in Colombia. These activities, their possible escalation and the violence associated with them may have a negative impact on the Colombian economy or on the Bank in the future. The Bank’s business or financial condition and the market value of the Bank’s securities and any dividends distributed by it, could be adversely affected by rapidly changing economic and social conditions in Colombia and by the Colombian Government’sgovernment’s response to such conditions.
Risk Factors Relating to the Bank’s Business and the Banking Industry
Our financial results may be negatively affected by changes to accounting standards.
We report our results and financial position in accordance with IFRS as issued by the International Accounting Standards Board (IASB). Changes to IFRS or interpretations thereof may cause our future reported results and financial position to differ from current expectations, or historical results to differ from those previously reported due to the adoption of accounting standards on a retrospective basis. Such changes may also affect our regulatory capital and ratios. We monitor potential accounting changes and when these are finalized by the IASB, we determine the potential impact and disclose significant future changes in our financial statements. Currently, there are a number of issued but not yet effective IFRS changes, as well as potential IFRS changes, some of which could be expected to impact our reported results, financial position and regulatory capital in the future. For example, IFRS 9, when fully adopted, will require us to record loans at inception net of expected losses instead of recording credit losses on an incurred loss basis.
Our financial results may be negatively affected by changes to assumptions supporting the value of our goodwill.
The goodwill that we have recognized on the respective balance sheets of our operating segments is tested for impairment at least annually. Our impairment test in respect of the assets recognized as of December 31, 2015 indicated that our respective goodwill balances are not impaired. The impairment test is based on assumptions regarding estimated earnings, discount rates and long-term growth rates impacting the recoverable amount of each segment and on estimates of the carrying amounts of the segments to which the goodwill relates. If the estimated earnings and other assumptions in future periods deviate from the current outlook, the value of the goodwill in any one or more of our businesses may become impaired in the future, giving rise to losses in the income statement.
Changes in banking laws and regulations in Colombia and in other jurisdictions wherein which the Bank operates could adversely affect the Bank’s consolidated results.
Changes in banking laws and regulations, or in their official interpretation, in Colombia and in other jurisdictions wherein which the Bank operates, may have a material effect on the Bank’s business and operations. Since banking laws and regulations change frequently, they could be adopted, enforced or interpreted in a manner that may have an adverse effect on the Bank’s business.
Although Bancolombia currently complies with applicable capital requirements, there can be no assurance that future regulation will not change or require Bancolombia or its subsidiaries to seek additional capital. Moreover, regulators in other jurisdictions have not reached consensus as to the appropriate level of capitalization for financial services institutions. Regulators in the jurisdictions wherein which Bancolombia operates may alter the current regulatory capital requirements to which Bancolombia is subject and thereby require equity increases that could dilute existing stockholders, lead to required asset sales or adversely impact the return on stockholders’ equity and/or the market price of the Bank’s common and preferred shares.
In 2012, a new regulation relating to capital adecquacy requirements (Decree 1771 of 2012) was issued. For further details on the changes set forth in the new regulations, see“Item 4. Information on the Company – B. Business Overview - B.8 Supervision and Regulation - capital adecquacy requirements”.
BankingFurthermore, banking laws and regulations accounting standards and corporate disclosure applicable tomay create new types of financial entities whose services could compete with the segments or services offered by the Bank, and, therefore, its subsidiaries differ from those in the United States and other countries.
While many of the policies underlying Colombian banking regulations are similar to those underlying regulations applicable to banks in other countries, including those in the United States, Colombian regulations can differ in a number of material respects. For example, capital adequacy requirements for banks under Colombian regulations differ from those under U.S. regulations and may differ from those in effect in other countries. The Bank prepares its annual audited financial statements in accordance with Colombian banking GAAP, which differs from U.S. GAAP and International Financial Reporting Standards (“IFRS”). Thus, Colombian financial statements and reported earnings may differ from those of companies in other countriesresults in these and other respects. Some of the differences affecting earnings and stockholders’ equity include, but are not limited to the accounting treatment for restructuring, loan origination fees and costs, equity tax, securitization, fair value adjustment in debt securities, deferred income taxes and the accounting treatment for business combinations. Moreover, under Colombian banking GAAP, allowances for non-performing loans are computed by establishing each non-performing loan’s individual inherent risk using criteria established by the SFC that differ from those used under U.S. GAAP. See “Item 4. Information on the Company – E. Selected Statistical Information – E.4. Summary of Loan Loss Experience – Allowance for Loan Losses”.
The Colombian Government is currently undertaking a review of present regulations relating to accounting, audit, and information disclosure, with the intention of seeking convergence with international standards. Nevertheless, current regulations continue to differ in certain respects from those in other countries. In addition, theresegments or services may be less publicly available information about the Bank than is regularly published by or about U.S. issuers or issuers in other countries and any changes in those regulations would become effective in 2015.adversely affected.
The Bank is subject to regulatory inspections, examinations, inquiries or audits in Colombia and in other countries wherein which it operates, and any sanctions, fines and other penalties resulting from such inspections and audits could materially and adversely affect the Bank’s business, financial condition, results of operations and reputation.
The Bank is subject to comprehensive regulation and supervision by the banking authorities of Colombia, El Salvador, Guatemala, Panama and the other jurisdictions in which the Bank operates. These regulatory authorities have broad powers to adopt regulations and impose other requirements affecting or restricting virtually all aspects of the Bank’s capitalization, organization and operations, including the imposition of anti-money laundering measures and the authority to regulate the terms and conditions of credit that can be appliedextended by banks. In the event of non-compliance with applicable regulations, the Bank could be subject to fines, sanctions or the revocation of licenses or permits to operate its business. In Colombia, for instance, in the eventif the Bank encounters significant financial problems or becomes insolvent or in danger of becoming insolvent, banking authorities would have the power to take over the Bank’s management and operations. In addition, the supervisory authorities of Colombia and El Salvador have reached an agreement for consolidated supervision which allows them to perform transnational inspection processes. Any sanctions, fines and other penalties resulting from non-compliance with regulations in Colombia, El Salvador, Guatemala, Panama and in the other jurisdictions wherein which the Bank operates could materially and adversely affect the Bank’s business, financial condition, results of operations and reputation.
An increase in constitutional public interest actions (acciones populares), class actions (acciones de grupo) and other legal actions involving claims for significant monetary awards against financial institutions may affect the Bank’s businesses and results of operations.
Under the Colombian Constitution, individuals may initiate constitutional public interest or class actions to protect their collective or class rights, respectively. Colombian financial institutions, including the Bank, have experienced a substantial increase in the aggregatehigh number of these actions. The great majority of such actions have been related to fees, financial services and interest rates, and their outcome is uncertain. Pursuant to lawLaw 1425 of 2010, monetary awards for plaintiffs in constitutional actions or class actions were eliminated as of January 1, 2011. Nevertheless, individuals continue to have the right to initiate these actions against the Bank.
Future restrictions on interest rates or banking fees could negatively affect the Bank’s profitability.
In the future, regulations in the jurisdictions where the Bank operates could impose limitations regarding interest rates or fees charged by the Bank. Any such limitations could materially and adversely affect the Bank’s results of operations and financial situation.
In the past, there have been disputes in Colombia among commercial businesses, payment service providers and banks regarding credit card interbank exchange fees (tarifa interbancaria de intercambio). Although such disputes have been resolved, the Superintendency of Industry and Commerce and mayhas the authority to initiate new investigations relating to such fees. This possibilityAny new investigations may lead to requirements that the Bank applies additional decreases, which in turn could impact the Bank’s financial results.
Furthermore, pursuant to article 62 of lawLaw 1430 of 2010 Congress granted the GovernmentColombian government has power and authority to establish and define criteria and formulas applicable to the calculation of banking fees and charges and define maximum limits. In 2011, the government used such authority to define maximum limits to banking fees and charges. On December 20, 2011 the Government used the authority granted by law 1430 of 2010 and enacted Decree 4809 of 2011 in which it set forth caps to the bank fees that may be charged on ATM withdrawals through ATMs outside their ownof each bank’s respective networks. Currently, there is a regulatory initiative that eliminates fees that banks may charge on ATM withdrawals.
Currently, an initiativeAdditionally, in past years, there have been regulatory initiatives regarding banking fees. Although such initiatives were not approved by Congress in the past, there are new initiatives pursuing similar restrictions on banking fees. If a law regarding banking fees is being discussed in Congress,enacted, the Bank might be prohibited from charging for certain services or types of transactions to its clients, which could have a negative effect on our results of operations and has been approved in its first debate out of four needed for it to become a law. If the law were enacted banks would need to cease charging transactional and service fees from those individuals whose income is equal or under two SMMLV, provided that this benefit would only apply to one savings account per individual. However, the likelihood of this initiative becoming a law is uncertain given that there have been two similar unsuccessful initiatives discussed in Congress in recent years.financial condition.
In addition, recent Law 1555 of 2012 prohibits prepayment penalties for loans worth less than 880 SMMLV, (mortgageand prepayment of mortgage loans are excluded).is allowed with no penalties without regard to the amount of the loan.
Further limitsAlso, In December 2015, Congress enacted a law that orders banks to transfer funds in inactive bank accounts to an education financing public entity. In case the accountholder withdraws its funds, banks must pay them with its own funds, and then request reimbursement from the education financing public entity.
Colombian tax haven regulation could adversely affect the Bank’s business and financial results.
Decree 1966 of 2014 modified by Decree 2095 of 2014, designates 37 jurisdictions as tax havens for Colombian tax purposes (although neither Panama nor other countries in which the Bank operates, were included on this list). As a result of the tax haven regulation the Bank’s clients who are residents in such jurisdictions would be subject to (i) higher withholding tax rates including a higher withholding rate on interest and dividends derived from investments in the Colombian securities market, (ii) the transfer pricing regime and its reporting duties, (iii) enhanced ability on the part of Colombian authorities to qualify a conduct as abusive under tax regulations, (iv) non-deductibility of payments made to such residents or regulations regarding banking feesentities located in tax havens, unless the required tax amount has been withheld and uncertainties with respect thereto,(v) additional information disclosure requirements, any of which could have a negative effectimpact on ourBancolombia’s business and financial results.
In order to avoid Panama’s designation as a tax haven, Colombia and Panama signed a memorandum of understanding which establishes that both countries will negotiate a treaty for the avoidance of double taxation. This treaty is expected to include provisions regarding the exchange of information between Colombian and Panamanian tax authorities. The deadline for execution of the treaty was September 30, 2015, which was extended to November 30, 2015, but as of date there is no known consequence for not executing such treaty within the deadline. Failure to execute a treaty, or the designation of Panama as a tax haven, could result in a negative impact on the Bank’s customer base and, therefore, a potential negative impact on the Bank’s results of operations and financial condition.
The Bank and most of its subsidiariesSubsidiaries are subject to the U.S. Foreign Account Tax Compliance Act of 2010.
Bancolombia and most of its subsidiaries are considered foreign financial institutions (“FFIs”) under the Foreign Account Tax Compliance Act of 2010 (“FATCA”) (see “Item 4. Information on the Company – B. Business Overview – B.8. Supervision and Regulation – International regulations applicable to Bancolombia and its subsidiaries”). Given the size and the scope of our group’sthe Bank’s international operations, we intend to take all necessary steps to comply with FATCA (including entering into agreements with the U.S. tax authority)authorities and transmitting the reports).
However, if the GroupBank cannot enter into such agreements or satisfy the requirements thereunder, certain payments to Bancolombia or its subsidiariesSubsidiaries may be subject to withholding under FATCA. The possibility of such withholding and the need for accountholders and investors to provide certain information may adversely affect our results of operations and financial condition. In addition, entering into agreements with the IRS, and compliance with the terms of such agreements and with FATCA and any regulations or other guidance promulgated thereunder or any legislation promulgated under an intergovernmental agreement (“IGA”) may increase our compliance costs. We are currently in the process of estimating the costs and commercial impact of implementing FATCA compliance on a group widegroup-wide level. Because legislationLegislation and regulations implementing FATCA and the related IGAs in the countries where we operatein which the Bank operates remain under development, and the IGAs remain under development,reporting dates vary depending on the jurisdiction. As a result, the future impact of this law onand the Bancolombia Groupaccuracy of the first reports of the Bank and its Subsidiaries is still uncertain.
The Bank is subject to credit risk, and estimating exposure to credit risk involves subjective and complex judgments.
A number of our products expose the Bank to credit risk, includingrisk. These products include loans, financial leases, lending commitments and derivatives.
The Bank estimates and establishes reserves for credit risk and potential credit losses. This process involves subjective and complex judgments, including projections of economic conditions and assumptions on the ability of our borrowers to repay their loans. This process is also subject to human error as the Bank’s employees may not always be able to assign an accurate credit rating to a client, which may result in the Bank’s exposure to higher credit risk than indicated by the Bank’s risk rating system. The Bank may not be able to timely detect these risks before they occur, or due to limited resources or available infrastructure, the Bank’s employees may not be able to effectively implement its credit risk management system, which may increase its exposure to credit risk. Moreover, the Bank’s failure to continuously refine its credit risk management system may result in a higher risk exposure for the Bank, which could materially and adversely affect its results of operations and financial position.
Overall, if the Bank is unable to effectively control the level of non-performing or poor credit quality loans in the future, or if its loan loss reserves are insufficient to cover future loan losses, the Bank’s financial condition and results of operations may be materially and adversely affected.
In addition, the amount of the Bank’s non-performing loans may increase in the future as a result of factors beyond the Bank’s control, such as changes in the income levels of the Bank’s borrowers, increases in the inflation rate or an increase in interest rates, the impact of macroeconomic trends and political events affecting Colombia and other jurisdictions wherein which the Bank operates or has exposure (especially Panama, El Salvador and Guatemala) or events affecting specific industries. Any of these developments could have a negative effect on the quality of the Bank’s loan portfolio, causingrequiring the Bank to increase provisions for loan losses and resulting in reduced profits or in losses.
The Bank is subject to credit risk with respect to its non-traditional banking businesses including investing in securities and entering into derivatives transactions.
Non-traditional sources of credit risk can arise from, among other things: investing in securities, of third parties, entering into derivative contracts under which counterparties have obligations to make payments to the Bank, and executing securities, futures, currency or commodity trades from the Bank’s proprietary trading desk that fail to settle at the required time due to non-delivery by the counterparty or systems failure by clearing agents, exchanges, clearing houses or other financial intermediaries. Any significant increases in exposure to any of these non-traditional risks, or a significant decline in the credit quality or the insolvency of any of the counterparties, could materially and adversely affect the Bank’s results of operations and financial position.
The Bank is exposed to risks associated with the mortgage loan market.
BancolombiaThe Bank is a leader in the Colombian mortgage loan market.markets in which it operates. Colombia’s mortgage loan market is highly regulated and has historically been affected by various macroeconomic factors.factors, as have the mortgage loan markets of Panama, Guatemala and El Salvador. Although during the past years interest rates have decreased during recent years, periods of sustained high interest rates have historically discouraged customers from borrowing and have resulted in increased defaults in outstanding loans and deterioration in the quality of assets.
The Bank is subject to concentration of default risks in its loan portfolio. Problems with one or more of its largest borrowers may adversely affect its financial condition and results of operations.
As of December 31, 2012,2015, the aggregate outstanding principal amount of the Bank’s 25 largest credit exposures, on a consolidated basis, represented approximately 11.92%14.04% of the Bank’s loan portfolio, and noportfolio. No single exposure represented more than 1%3% of the loan book. Also, 100%book, all of those loans were corporate loans and 100%all of these relationships were classified as “A”. However, problems with one or more of the Bank’s largest borrowers could materially and adversely affect its results of operations and financial position, see “Item 4. Information on the Company – E. Selected Statistical Information – E.3. Loan Portfolio – Borrowing Relationships”.
The value of the collateral or guarantees securing the outstanding principal and interest balance of the Bank’s loans may not be sufficient to cover such outstanding principal and interest. In addition, the Bank may be unable to realize the full value of the collateral or guarantees securing the outstanding principal and interest balance of its loans.
The Bank’s loan collateral primarily includes real estate, assets pledged in financial leasing transactions and other assets that are located primarily in Colombia, and El Salvador, Panama and Guatemala, the value of which may significantly fluctuate or decline due to factors beyond the Bank’s control. Such factors include market factors, environmental risks, natural disasters, macroeconomic factors and political events affecting the local economy. Any decline in the value of the collateral securing the Bank’s loans may result in a reduction in the recovery from collateral realization and may have an adverse impact on the Bank’s results of operations and financial condition. In addition, the Bank may face difficulties in enforcing its rights as a secured creditor. In particular, timing delays and procedural problems in enforcing against collateral and local protectionism may make foreclosures on collateral and enforcement of judgments difficult, and may result in losses that could materially and adversely affect the Bank’s results of operations and financial position.
The Bank is subject to market risk.
The Bank is directly and indirectly affected by changes in market conditions. Market risk, or the risk of losses in positions arising from movements in market prices, is inherent in the products and instruments associated with our operations, including loans, deposits, securities, bonds, long-term debt, short-term borrowings, proprietary trading in assets and liabilities and derivatives. Changes in market conditions that may affect our financial condition and results of operations include fluctuations in interest and currency exchange rates, securities prices, changes in the implied volatility of interest rates and foreign exchange rates, among others.
The Bank is subjectBank’s results of operations are sensitive to fluctuations in interest rates, which may materially and adversely affect its results of operations and financial condition.rates.
The Bank holds a substantial portfolio of loans and debt securities that have both fixed and floating interest rates. Therefore, changes in interest rates could adversely affect our net interest margins as well as the pricesvalue of these securities. Increases in interest rates may reduce the market value of the Bank’s debt securities, leading to smaller gains or larger losses on these investments. Sustained high interest rates have historically discouraged customers from borrowing and have resulted in increased delinquencies in outstanding loans and deterioration in the quality of assets. On the other hand, decreases in interest rates may cause margin compression and lower net interest income as the Bank usually maintains more assets than liabilities at variable rates. Decreasing interest rates also may trigger loan prepayments which could negatively affect the Bank’s net interest income. Generally, in a declining interest rate environment, prepayment activity increases, reducing the weighted average maturity of the Bank’s interest earning assets and adversely affecting its operating results. Prepayment risk also has a significant adverse impact on our earnings from our credit card and collateralized mortgage obligations, since prepayments could shorten the weighted average life of these portfolios, which may result in a mismatch in funding or in reinvestment of the prepayment proceeds at lower yields.
The Bank’s income from its proprietary trading activities is highly volatile.
The Bank’s trading income is highly volatile. The Bank derives a portion of its profits from its proprietary trading activities and any significant reduction in its trading income could adversely affect the Bank’s results of operations and financial position.activities. The Bank’s trading income is dependent on numerous factors beyond its control, such as the general market environment, overall market trading activity, interest rate levels, fluctuations in exchange rates and general market volatility. A significant decline in the Bank’s trading income, or the incurrence of a trading loss, could adversely affect the Bank’s results of operations and financial position.
The Bank has significant exposure to sovereign risk, and especially Colombian risk, and the Bank’s results could be adversely affected by decreases in the value of its sovereign debt securities.
The Bank’s debt securities portfolio is primarily composed of sovereign debt securities, including securities issued or guaranteed by the Colombian Government. Therefore, the Bank’s results are exposed to credit, market, and liquidity risk associated with sovereign debt. As of, December 31, 2012,2015 the Bank’s total debt securities represented 11.66%5.0% of its total assets, and 54.27% of these securities were issued or backed by the Colombian Government.assets. A significant decline in the value of the securities issued or guaranteed by the Colombian Government could adversely affect the Bank’s debt securities portfolio and consequently the Bank’s results of operations and financial position.
The Bank is subject to market, operational and structural risks associated with its derivative transactions.
The Bank enters into derivative transactions for hedging purposes and on behalf of its customers. The Bank is subject to market and operational risks associated with these transactions, including basis risk (the risk of loss associated with variations in the spread between the asset yield and the funding and/or hedge cost) and credit or default risk (the risk of insolvency or other inability of the counterparty to a particular transaction to perform its obligations thereunder). In addition, the market practice and documentation for derivative transactions is less developed in the jurisdictions wherein which the Bank operates as compared to other more economically developed countries, and the court systems in such jurisdictions have limited experience in dealing with issues related to derivative transactions. As a result, there are increased operating and structural risks associated with derivatives transactions in these jurisdictions.
In addition, the execution and performance of derivatives transactions depend on the Bank’s ability to develop adequate control and administrative systems, and to hire and retain qualified personnel. Moreover, the Bank’s ability to adequately monitor, analyze and report these derivative transactions depends, to a great extent, on its information technology systems. These factors may further increase the risks associated with these transactions and could materially and adversely affect the Bank’s results of operations and financial position.
The Bank is subject to operational risks.risks and losses.
The Bank’s businesses are dependent on the ability to process a large number of transactions efficiently and accurately. Operational risks and losses can result from fraud, employee errors, technological failures and failure to properly document transactions or to obtain proper internal authorization, failure to comply with regulatory requirements, breaches of conduct of business rules, equipment failures, natural disasters or the failure of external systems. The Bank’s currentlyBank has adopted procedures may not be effective in controllingto prevent and manage each of the operational risks, faced bybut there can be no assurance that our procedures will be sufficient to prevent losses resulting from these risks.
In addition, the Bank.Bank’s businesses are exposed to risk from potential non-compliance with policies, employee misconduct or negligence and fraud, which could result in regulatory sanctions and serious reputational or financial harm. In recent years, a number of financial institutions have suffered material losses due to the actions of employees and third parties. The precautions the Bank takes to prevent and detect employee and third-party misconduct may not always be effective.
The Bank’s businesses rely heavily on data collection, processing and storage systems, the failure of which could materially and adversely affect the effectiveness of its risk management, reputation and internal control system as well as its financial condition and results of operations.
All of the Bank’s principal businesses are highly dependent on the ability to timely collect and process a large amount of financial and other information at its various branches across numerous markets, at a time when transaction processes have become increasingly complex with increasing volume. The proper functioning of financial control, accounting or other data collection and processing systems is critical to the Bank’s businesses and to its ability to compete effectively. A partial or complete failure of any of these primary systems could materially and adversely affect the Bank’s decision-making process, its risk management and internal control systems, the quality of its service, and the Bank’s ability to respond on a timely basis to changing market conditions. If the Bank cannot maintain an effective data collection and management system, its business operations, financial condition, reputation and results of operations could be materially and adversely affected. The Bank is also dependent on information systems to operate its website, process transactions, respond to customer inquiries on a timely basis and maintain cost-efficient operations. The Bank may experience operational problems with its information systems as a result of system failures, viruses, computer hackers or other causes. Any material disruption or slowdown of its systems could cause information, including data related to customer requests and other client information, to be lost, compromised, or to be delivered to the Bank’s clients with delays or errors, which could reduce demand for the Bank’s services and products, resultresulting in additional costs for the Bank and potentially fines and penalties by regulators which could materially and adversely affect the Bank’s results of operations and financial position.
The Bank is subject to cyber securitycyber-security risk.
The bank is subject to cyber securitycyber-security risk, which includes the unauthorized access to privileged information, technological assaults on the infrastructure of the Bank with the aim of stealing information, committing fraud or interfering with regular service, and the interruption of the Bank’s services to some of its clients or users due to the exploitation and materialization of these vulnerabilities. Cyber-security risks for financial institutions have significantly increased because of the proliferation of new technologies, the use of the Internet and telecommunications technologies to conduct financial transactions, and the increased sophistication and activities of organized crime, hackers, terrorists and other external parties.
The risk methodology used byBank’s business is highly dependent on the Bank allows for the evaluationsecurity and efficacy of residual risk,our infrastructure, computer and has resulted in a low leveldata management systems, as well as those of risk of potential cyber-attacks. service providers, and others with whom we interact.
The controls that the Bank has implemented in order to anticipate, identify, and offset these threats, have been effective thus far in maintaining cyber securitycyber-security risk at a low level. These controls include the existence of perimeter defenses, security backups, special 24/7 teams and continuous security tests (including ethical hacking among others), However, we can give no assurance that the low level of risk experienced thus far will continue in the future. Any failure by the Bank to detect cyber securityor present cyber-security risk in a timely manner could result in a negative impact on the Bank’s results of operations and financial condition.position, or in problems with information, including data related to customers to be lost, compromised, or to be delivered to the Bank’s clients with delays or errors.
Any failure to effectively improve or upgrade the Bank’s information technology infrastructure and management information systems in a timely manner could adversely affect itsthe Bank’s competitiveness, financial condition and results of operations.
The Bank’s ability to remain competitive will depend in part on its ability to upgrade the Bank’s information technology infrastructure on a timely and cost-effective basis. The information available to and received by the Bank’s management through its existing information systems may not be timely and sufficient to manage risks or to plan for and respond to changes in market conditions and other developments in its operations. The Bank is currently undertaking a project to update its information technology platform (“IT platform”) that will result in significant changes in the following areas:its treasury and credit cards, customer management, products and distribution channels, financial management and accounting and human resources.card operations. Any failure to effectively improve or upgrade the Bank’s information technology infrastructure and information management systems in a timely and cost-effective manner could materially and adversely affect the Bank’s competitiveness, financial condition and results of operations.
The occurrence of natural disasters in the regions wherein which the Bank operates could impair its ability to conduct business effectively and could impact the Bank’sits results of operations.
The Bank is exposed to the risk of natural disasters such as earthquakes, volcanic eruptions, tornadoes, tropical storms, floods, wind and hurricanes in the regions where it operates. In the event of a natural disaster, unanticipated problems with the Bank’s disaster recovery systems could have a material adverse effect on the Bank’s ability to conduct business in the affected region, particularly if those problems affect its computer-based data processing, transmission, storage and retrieval systems and destroy valuable data. In addition, if a significant number of the Bank’s local employees and managers werebecame unavailable indue to a natural disaster, the event of a disaster, itsBank’s ability to effectively conduct business could be severely compromised. In addition, the Bank’sBank may face added credit risk if its clients located in the affected region may be severely impacted and mayare not be able to continue paying themake timely payment on outstanding loans or other obligations they have withto the Bank. A natural disaster or multiple catastrophic events could have a material adverse effect on the Bank’s business and results of operations in the affected region.
Acquisitions and strategic partnerships may not perform in accordance with expectations or may disrupt the Bank’s operations and adversely affect its profitability.
An element of the Bank’s business strategy is to identify and pursue growth-enhancing strategic opportunities. The Bank may base assessments of potential acquisitions and partnerships on assumptions with respect to operations, profitability and other matters that may subsequently prove to be incorrect. Futureincorrect, and any future acquisitions, investments and alliances including the pending acquisition of a minority interest in Banco Agromercantil and the pending acquisition of HSBC Bank Panama (see “Item 4. Information on the Company. – A. History and development of the company – Recent Developments”), may not produce the anticipated synergies or perform in accordance with the Bank’s expectations andwhich could adversely affect its operations and profitability.
The Bank’s concentration in and reliance on short-term deposits may increase its funding costs.
The Bank’s principal source of funds areis short-term deposits, which on a consolidated basis represented a share of 74.3%70.58% of total liabilities at the end of 20122015 compared to 68.6% and 72.4%71.65% at the end of 2011 and 2010, respectively.2014. Because the Bank relies primarily on short-term deposits for its funding, in the event of a sudden or unexpected shortage of funds in the banking systemsystems and money markets wherein which the Bank operates, the Bank may not be able to maintain its current level of funding without incurring higher costs or selling assets at prices below their prevailing market value.value.
The Bank’s policies and procedures may not be able to detect money laundering and other illegal or improper activities fully or on a timely basis, which could damage the Bank’s reputation and expose the Bank to fines and other liabilities.
The Bank is required to comply with applicable anti-money laundering, anti-terrorism laws and other regulations. These laws and regulations require the Bank, among other things, to adopt and enforce “know your customer” policies and procedures and to report suspicious and large transactions to the applicable regulatory authorities. While the Bank has adopted policies and procedures aimed at detecting and preventing the use of its banking network for money laundering activities and by terrorists and terrorist-related organizations and individuals generally, such policies and procedures have in some cases only been adopted only recently and may not completely eliminate instances where itthe risk that the Bank may be used by other parties to engage in money laundering and other illegal or improper activities. To the extentIf the Bank may failfails to fully comply with applicable laws and regulations, the relevant Government agencies to which it reports have the power and authority to imposemay face fines and other penalties, including restrictions on the Bank.its ability to conducts business. In addition, the Bank’s business and reputation could suffer if customers use the Bank for money laundering or illegal or improper purposes.
The Bank is subject to increasing competition which may adversely affect its results of operations.
The Bank operates in a highly competitive environment and increased competitive conditions aremanagement expects competition to be expectedincrease in the jurisdictions where the Bank operates. Intensified merger activity in the financial services industry produces larger, better capitalized and more geographically diverse firms that are capable of offering a wider array of financial products and services at more competitive prices. The Bank’s ability to maintain its competitive position depends mainly on its ability to fulfill new customers’ needs through the development of new products and services and the Bank’s ability to offer adequate services and strengthen its customer base through cross-selling. The Bank’s business will be adversely affected if the Bank is not able to maintain efficient service strategies. In addition, the Bank’s efforts to offer new services and products may not succeed if product or market opportunities develop more slowly than expected or if the profitability of opportunities is undermined by competitive pressures.
Downgrades in our credit ratings would increase our cost of borrowing funds and make our ability to raise new funds, attract deposits or renew maturing debt more difficult.
Our credit ratings are an important component of our liquidity profile.profile, and our ability to successfully compete depends on various factors, including our financial stability as reflected by our credit ratings. A downgrade in our credit ratings would increase our cost of raising funds from other banks or in the capital markets or of borrowing funds. Due to regulatory or internal policies, certain Colombian institutional investors are only permitted to purchase debt securities that are rated “AAA” by Colombian credit rating agencies. Purchasemarkets. Purchases of our securities by theseinstitutional investors could be prohibitedreduced if we suffer a decline in our local credit rating.ratings. Our ability to renew maturing debt could bebecome restricted and the terms for such renewal more expensive if our credit rating were to decline. Our lenders and counterparties in derivative transactions are sensitive to the risk of a credit rating downgrade. A downgrade in our credit rating may adversely affect perception of our financial stability and our ability to raise deposits, which could make us less successful when competing for deposits and loans in the market place. Our ability to successfully compete depends on various factors, including our financial stability as reflected by our credit ratings.
A new insolvency law in Colombia may limit our ability to collect and enforce claims against non-merchants.
On June 12, 2012, Congress enacted Law 1564 of 2012 which provides insolvency protection for non-merchant individuals. In addition, on December 21, 2012, the Ministry of Justice and Law issued Decree 2677 of 2012 to regulate certain aspects set forth in Law 1564. Under the new insolvency regulations, once a non-merchant individual has ceased paying its debts, such individual can initiate a voluntary insolvency proceeding before a notary public or mediator to reach an agreement with its creditors. The terms of any agreement reached with a group of creditors (two or more) that represents more than 50% of the total amount of the claims will be mandatorily applicable to all relevant creditors.
As a result of these agreements, the Bank may not be able to recover the total amount of its claims. The increased debtor protections contemplated by this law, including an automatic stay for a maximum of 90 days, could also make it more difficult for us to enforce debt and other monetary obligations, which could have an adverse impact on our results of operations and financial condition.
The Central Bank may impose requirements on our (and other Colombian residents’) ability to obtain loans in foreign currency.
The Central Bank may impose certain mandatory deposit requirements in connection with foreign currency-denominatedcurrency denominated loans obtained by Colombian residents, including the Bank. AlthoughBank, although no such mandatory deposit requirement is currently in effect, a mandatory deposit requirement was set at 40% in 2008 after the Colombian peso appreciated against foreign currencies. Although weeffect. We cannot predict or control future actions by the Central Bank in respect of such deposit requirements, which may involve the establishment of a different mandatory deposit percentage, and the use of such measures by the Central Bank may be a disincentive for the Bankraise our cost of raising funds and reduce our clients to obtain loans denominated in a foreign currency.financial flexibility.
Risks Relating to the Preferred Shares and the American Depositary Shares (“ADSs”).ADSs.
Preemptive rights may not be available to holders of ADRs.American Depositary Receipts (“ADRs”) evidencing ADSs.
The Bank’s by-laws and Colombian law require that, whenever the Bank issues new shares of any outstanding class, it must offer the holders of each class of shares (including holders of ADRs) the right to purchase a number of shares of such class sufficient to maintain their existing percentage ownership of the aggregate capital stock of the Bank. These rights are called preemptive rights. United States holders of ADRs may not be able to exercise their preemptive rights through The Bank of New York Mellon, which acts as depositary (the “Depositary”) for the Bank’s ADR facility, unless a registration statement under the Securities Act is effective with respect to such rights and class of shares or an exemption from the registration requirement thereunder is available. The Bank is obligated to file a registration statement or find a corresponding exemption only if it determines to extend the rights to holders of the ADRs. Although the Bank is not obligated to, it intends to consider at the time of any rights offering the costs and potential liabilities associated with any such registration statement, the benefits to the Bank from enabling the holders of the ADRs to exercise those rights and any other factors deemed appropriate at the time, and will then maketimebefore it makes a decision as to whether to file a registration statement. Accordingly, the Bank mightmay in some cases decide not to file a registration statementstatement. For example, in some cases. In connection with its recent rights offering in January 2012, the Bank did not file such a registration statement.
ToUnder the extent holders of ADRs are unable to exercise these rights because a registration statement has not been fileddeposit agreement between the Bank and no exemption from the registration requirement under the Securities Act is available, the Depositary, may attemptonly the Depositary is entitled to sell the holders’exercise preemptive rights, and distribute the net proceeds from that sale, if any,Depositary has no obligation to such holders. The Depositary, after consulting withmake available preemptive rights to holders of ADRs. If the Bank will haveoffers or causes to be offered to the holders of any deposited securities, including preferred shares of the Bank, any rights to subscribe for additional preferred shares of the Bank or any rights of any other nature, the Depositary has discretion as to the procedure forto be followed in making preemptivesuch rights available to theany holders of ADRs or in disposing of such rights on behalf of any holders of ADRs and making anythe net proceeds available to such holders.holders of ADRs. If by the terms of anysuch rights offering or for any other reason, the Depositary is unable or choosesmay not toeither make thosesuch rights available to any holderholders of ADRs or dispose of such rights and if it is unable or for any reason chooses notmake the net proceeds available to sell those rights,such holders of ADRs, then the Depositary maywill allow the rights to lapse. Whenever the rights are sold or lapse, the equity interests of the holders of ADRs will be proportionately diluted.
The Bank’s preferred shares have limited voting rights.
The Bank’s corporate affairs are governed by its by-laws and Colombian law. Under the Bank’s by-laws and Colombian law, the Bank’s preferred stockholders may have fewer rights than stockholders of a corporation incorporated in a U.S. jurisdiction. Holders of the Bank’s ADRs and preferred shares are not entitled to vote for the election of directors or to influence the Bank’s management policies. Under the Bank’s by-laws and Colombian corporate law, holders of preferred shares (and, consequently, holders of ADRs) have no voting rights in respect of preferred shares, other than in limited circumstances as described in “Item 10. Additional Information – B. Memorandum and Articles of Association – Description of Share Rights, Preferences and Restrictions – Voting Rights – Preferred Shares”.
Holders of the Bank’s ADRs may encounter difficulties in the exercise of dividend and voting rights.
Holders of the Bank’s ADRs may encounter difficulties in the exercise of some of their rights with respect to the shares underlying ADRs. If the Bank makes a distribution to holders of underlying shares in the form of securities, the Depositary is allowed, in its discretion, to sell those securities on behalf of ADR holders and instead distribute the net proceeds to the ADR holders. Also, under some circumstances, ADR holders may not be able to vote by giving instructions to the depositaryeven in those limited instances in which the preferred shares represented by the ADRs have the power to vote.vote, under some circumstances, ADR holders may not be able to vote by giving instructions to the depositary. This may occur if ADR holders do not receive from the Depositary a notice of meeting sufficiently prior to the instruction date to ensure that the Depositary will vote the preferred shares represented by the ADRs in accordance with instructions received from such holders. There are no circumstances in which holders of ADRs may vote in a way other than by providing instructions to the Depositary.
Relative illiquidity of the Colombian securities markets may impair the ability of an ADR holder to sell preferred shares.
The Bank’s common and preferred shares are listed on the Colombian Stock Exchange, which is relatively small and illiquid compared to stock exchanges in major financial centers. In addition, a small number of issuers represent a disproportionately large percentage of market capitalization and trading volume on the Colombian Stock Exchange. A liquid trading market for the Bank’s securities might not develop on the Colombian Stock Exchange. A limited trading market could impair the ability of an ADR holder to sell preferred shares (obtained upon withdrawal of such shares from the ADR facility) on the Colombian Stock Exchange in the amount and at the price and time such holder desires, and could increase the volatility of the price of the ADRs.
American Depositary Receipts (“ADRs”)ADRs do not have the same tax benefits as other equity investments in Colombia.
Although ADRs represent Bancolombia’s preferred shares, they are held through a fund of foreign capital in Colombia which is subject to a specific tax regulatory regime. Accordingly, the tax benefits applicable in Colombia to equity investments, in particular those relating to dividends and profits from sale, are not applicable to ADRs, including the Bank’s ADRs. For more information see “Item 10. Additional Information. –E. Taxation –Colombian Taxation”.
| ITEM 4. | | INFORMATION ON THE COMPANY |
| A. | HISTORY AND DEVELOPMENT OF THE COMPANY |
Due to the fact that Bancolombia and its subsidiaries have adopted IFRS for the first time, the selected financial data have been prepared in accordance with IFRS and presented for the two most recent financial years.
Bancolombia is Colombia’s leading financial institution, with a presence in other jurisdictions such as Panama, El Salvador, Puerto Rico, Guatemala, the Cayman Islands, Peru and the United States,Peru, providing a wide range of financial products and services to a diversified individual, corporate, and Governmentgovernment customer base throughout Colombia, Latin America and the Caribbean region.
Bancolombia is a stock company (sociedad comercial por acciones, de la especie anónima)domiciled in Medellín, Colombia and operates under Colombian laws and regulations, mainly the Colombian Commercial Code, of Commerce and the Financial Statute - Decree 663 of 1993 and Decree 2555 of 2010.
Bancolombia was incorporated in Colombia in 1945, under the name Banco Industrial Colombiano S.A. or “BIC”, and is incorporated until 2044. In 1998, the Bank merged with Banco de Colombia S.A., and changed its legal name to Bancolombia S.A. On July 30, 2005, Conavi and Corfinsura merged with and into Bancolombia, with Bancolombia as the surviving entity. Through this merger, Bancolombia gained important competitive advantages as Conavi and Corfinsura were two of the top financial institutions in the Colombian market at the time. Conavi, a mortgage bank in Colombia and one of the strongest in retail operations, significantly increased the Bank’s participation and know-how in these specific markets. On the other hand, Corfinsura, then the largest financial corporation in Colombia and highly regarded for its expertise in handling large and mid-sized corporate credit and financial services, its investment bank and its modern and diversified treasury department,banking which materially strengthened Bancolombia’s multi-banking franchise.
In May 2007, Bancolombia PanamáPanama acquired Banagrícola, which controls several subsidiaries, including Banco Agrícola in El Salvador, and is dedicated to banking, commercial and consumer activities and brokerage. Through its first international acquisition, Bancolombia gained a leadership position in the Salvadorian market.
In October 2013, Bancolombia Panama acquired a 40% interest in Grupo Agromercantil, the parent company of Banco Agromercantil de Guatemala, and certain other companies dedicated to securities brokerage, insurance, and other financial businesses. Bancolombia Panama acquired an additional 20% interest on December 30, 2015.
Also in October 2013, Bancolombia acquired a 100% percent interest in the ordinary voting shares, and 1,325,780 preferred shares of Banistmo, a Panamanian banking entity and its subsidiaries involved in the securities brokerage, trust, consumer finance, and leasing businesses.
Since 1995, Bancolombia has maintained a listing on the NYSE, where its ADSs are traded under the symbol “CIB”, and on the Colombian Stock Exchange, where its preferred shares are traded under the symbol “PFBCOLOM”. Since 1981 Bancolombia’s common shares have been traded on the Colombian Stock Exchange under the symbol “BCOLOMBIA”. See “Item 9. The Offer and Listing”.
Bancolombia has grown substantially over the years, both through organic growth and acquisitions.
As of December 31, 2012,2015, Bancolombia had, on a consolidated basis:
COP 97,916192,973 billion in total asset;assets;
COP 66,739140,372 billion in total net loans and financial leases;advances to customers;
COP 64,159121,802 billion in total deposits;deposits from customers; and
COP 11,60719,279 billion in stockholders’ equity.equity attributable to the owners of Bancolombia S.A.
Bancolombia’s consolidated net income attributable to equity holders of Bancolombia S.A. for the year ended December 31, 20122015 was COP 1,7022,519 billion, representing an averagea return on average equity of 15.97%13.62% and an averagea return on average assets of 1.92%1.53%.
The address and telephone numbers of the Bank’s headquarters are as follows: Carrera 48 # 26-85, Medellín, Colombia; telephone + (574) 404-1837. Our agent for service of process in the United States is Puglisi & Associates, presently located at 850 Library Avenue, Suite 204, Newark, Delaware 19711.
RECENT DEVELOPMENTS
Notes public offeringImplementation of IFRS
According to the adoption schedule of IFRS in Colombia, the Bank began preparing its year-end comparative financial statements and its interim financial information under IFRS from the years ending at December 31, 2015 and 2014 onwards, considering the opening statement of financial position as of January 1, 2014.
Disposal of Seguros Banistmo
On February 23, 2015, Banistmo entered into an agreement with Suramericana S.A., whereby Banistmo agreed to sell, and Suramericana S.A. agreed to buy 100% of the outstanding capital of Seguros Banistmo S.A., an insurance company incorporated under the laws of Panama. The transaction closed on August 31, 2015, after obtaining all the authorizations required by the authorities and the satisfaction of the relevant condition precedents. In consideration for the shares, Suramericana S.A. paid Banistmo a total purchase price of USD 96 million.
Strengthening of the organizational structure
On April 24, 2015 Bancolombia announced the following changes in its organizational structure:
The Corporate Innovation and Digital Transformation Vice-Presidency was created. Its objective is to project innovation and digital banking at its clients’ service. Juan Carlos Mora Uribe, who previously acted as Vice President of Corporate Services, assumed this Vice-Presidency and will act in that capacity until he assumes as CEO of Bancolombia.
The Corporate Services Vice-Presidency now consolidates under the same management team the corporate procedures, technology services and human resources. Augusto Restrepo Gómez, who acted as Vice President of Human Resources, assumed this Vice-Presidency. The Human Resources Vice-Presidency has been integrated into the Corporate Service Vice-Presidency.
Disposal of 50% stake in Compañía de Financiamiento Tuya S.A.
On June 30, 2015 Bancolombia, Fondo de Empleados of Grupo Bancolombia - FEBANC and Fundacion Bancolombia acting as sellers; and Almacenes Éxito S.A. and Almacenes Éxito Inversiones S.A.S acting as buyers, entered into a purchase and sale agreement whereby the sellers will transfer to the buyers their 50% interest in Compañía de Financiamiento Tuya S.A., a financial institution located in Colombia through which sellers and buyers have developed a commercial alliance for financing business growth and the strengthening of consumer credit.
The purchase price will be determined at the closing and will equal the sum of: (i) fifty percent (50%) of the sum of the following accounts of Tuya S.A. Compañía de Financiamiento according to the most recent financial statements before the closing (a) equity, (b) capital stock, and (c) additional paid-in capital; and (ii) one thousand five hundred million Colombian pesos (COP 1,500 million).
The sale is subject to certain conditions, including, among others, receipt of the required regulatory approvals by the SFC. Closing is expected to ocurr in the second half of 2016.
Renewal of the term of the program of senior and subordinated notes
On August 10, 2015, Bancolombia renewed the term of the program of senior and subordinated notes of up to an aggregate principal amount of COP 3 billion that may be offered in the Colombian market, which was initially established in 2012. Consequently, the new term of the program will be valid until August 10, 2018.
Acquisition of control of Grupo Agromercantil
On September 11, 2015, Bancolombia Panama entered into an agreement with BAM Financial Corporation for the acquisition of an additional 20% interest of the common stock in Grupo Agromercantil. With this acquisition, Bancolombia Panama owns a controlling stake of 60% in Grupo Agromercantil. The transaction was completed on December 30, 2015, when Bancolombia Panama paid a purchase price of USD 151.5 million to the sellers. Such amount may be adjusted pursuant to the agreement.
Changes to the corporate governance code
On September 11, 2012, Bancolombia issued USD 1.2 billion22, 2015, the board of its 5.125% Subordinated Notes due 2022 in a U.S. registered public offering. Of the aggregate principal amount, USD 50 million were placed in the Asian market hours, and USD 1.15 billion were placed in the international markets. The 10-year maturity and 5.125% Subordinated Notes priced at 99.421%.
Disposition of Asesuisa
On September 27, 2012, Bancolombia completed the sale of Asesuisa, an insurance company in the Republic of El Salvador. After obtaining all the required authorizations from the regulators in Colombia and El Salvador, Banagrícola S.A. and Inversiones Financieras Banco Agrícola S.A., subsidiariesdirectors of Bancolombia sold to Seguros Suramericana S.A., a Panamanian company linked to Grupo de Inversiones Suramericana, 97.03% of its shares of capital stock of Asesuisa. The total amount received by Banagrícola S.A. and Inversiones Financieras Banco Agrícola S.A. was USD 98 million. This transaction was completed pursuantapproved an update to the Purchasecorporate governance code. The main adjustments relate to: (i) procedures for the exercise of shareholders’ rights at the shareholders’ meeting; (ii) principles and Sale agreement entered into in 2011.policies related to the organizational structure of Bancolombia; (iii) adoption of policies and guidelines for transactions between Bancolombia and affiliates; (iv) new responsibilities for the committees that assist board of directors; (v) heightened eligibility requirements for the members of the board of directors; and (vi) new guidelines related to Bancolombia’s control structure.
Exchange Offer
On October 10, 2012, Bancolombia announced the resultsDisposal of the private offer to exchange any and all of its outstanding Subordinated Notes due 2017 for Subordinated Notes due 2022, pursuant to an offering memorandum dated September 10, 2012. An aggregate principal amount of USD 200 million of subordinated notes due 2017, representing 50.12% of the USD 400 million aggregate outstanding principal amount of such notes, was tendered and accepted pursuant to the offer.
Acquisition of Interbolsa S.A. SCB Contract Positions on Public BondsUFF Móvil S.A.S.
On November 6, 2012 Interbolsa S.A. Sociedad Comisionista de Bolsa,30, 2015 Bancolombia announced that, in accordance with the evolution of its mobility strategy, it entered into an agreement for the sale of its equity participation in UFF Móvil S.A.S, a brokerage firm, assignedvirtual mobile operating company located in Colombia. The transaction closed on the same date. Bancolombia sold its 80.59% stake, which was held through Inversiones CFNS S.A.S. and BIBA Inmobiliaria S.A.S., to Bancolombia S.A. its outstanding contractual positions linked toMVNO Holdings LLC, a company established under the performance of public bonds. The face valuelaws of the assigned outstanding contractual positions totaled approximately COP 1.6 trillion. The net market valueState of the underlying public bonds was COP 113,400 million. Bancolombia is responsible for the settlementFlorida, United States.
Sale of the outstanding buy/sell contracts entered into by Interbolsa’s proprietary trading desk. The assignment does not include client positions. This transaction was executed with the prior approval of the SFC which exercises administrative control over the stock brokerage firm as its Colombian regulator, as well as with the consideration of Bancolombia Group’sminority interest in contributing to the stability of the Colombian stock market.
Opening of Branch in Panama
On November 22, 2012, Bancolombia announced the opening of its new branch in Panama. Through this branch Bancolombia will provide Panamanian corporate clients with specialized credit and investment services. The branch in Panama will coexist with Bancolombia’s subsidiary, Bancolombia Panamá S.A., which has been operating with an international banking license in Panama for more than 40 years providing certain financial services to non-Panamanian clients.
Acquisition of Grupo Agromercantil Holding
On December 18, 2012, Bancolombia, through its subsidiary Bancolombia Panamá and BAM Financial Corporation (BFC) entered into a stock purchase agreement, pursuant to which Bancolombia Panamá will purchase from BFC a 40% of the capital stock of the Panamanian company Grupo Agromercantil Holding. Grupo Agromercantil Holding owns the financial conglomerate Grupo Financiero Agromercantil of Guatemala, which includes Banco Agromercantil BAM of Guatemala, Mercom Bank Ltd, an offshore bank based in Barbados, and Seguros Agromercantil of Guatemala, among others. Agromercantil has total assets of approximately USD 2,233 million. Bancolombia Panamá will pay a total of USD 216 million to BFC for the 40% interest. Following the transaction, BFC will continue to hold 60% of the capital stock of Grupo Agromercantil Holding. Completion of the transaction is subject to regulatory approvals in Colombia, Guatemala, Barbados and Panama and the satisfaction of other conditions. Bancolombia Panamá and BFC entered into a shareholders agreement the enforceability of which is subject to the completion of the transaction and that provides, among other things, for the acquisition by Bancolombia Panamá of a controlling interest in Grupo Agromercantil Holding in the medium term.
Legal proceeding against Banco Agrícola in El Salvador
On December 19, 2012 a decision was issued by the courts of El Salvador in a lawsuit against Banco Agrícola granting damages to the plaintiff in an amount of USD 366 million for the alleged failure of Banco Agrícola to return certain assets that were attached in a debt collection lawsuit. The judicial decision was appealed by Banco Agrícola on December 21, 2012 and the request for appeal has been accepted. In the event that the appeal is not favorable to Banco Agrícola it could further appeal the matter through an extraordinary recourse (recurso de casacion) to the civil chamber of the Supreme Court of Justice of El Salvador. Management, considering the advice of Banco Agricola's external legal counsel, believes that the appeal will be favorable to Banco Agrícola and any contingency derived from this lawsuit is deemed remote.
Purchase of HSBC Bank (Panama)CIFIN S.A.
On February 19, 20139, 2016, Bancolombia S.A. entered into an agreement with HSBC Holdings plc’s Latin American holding company, HSBC Latin America Holdings (UK) LimitedTransUnion Netherlands II B.V., for the sale by Bancolombia of its minority stake in Cifin S.A (“HSBC”Cifin”), which amounted to acquire HSBC Bank (Panama) S.A. (“HSBC Panama”). The agreement provides for14.2% of the outstanding shares. Cifin is a provider of financial, credit, commercial information and services. Bancolombia to pay total cash consideration of USD 2.1 billion, subject to certain customary adjustments based upon estimated net asset value at completion of USD 700 million, in exchange for 100% ofsold 106,504 common shares and 90.1% of preferredCifin for a total amount of COP 629,563.37 per share. The shares of HSBC Panama. The transaction is alignedin CIFIN sold by Bancolombia, together with Bancolombia’s strategythe stakes sold by the other shareholders party to expand its international operations by investingthe sale agreement, represented in the growing, solid and profitable market of Panama, where it has been present for over 40 years. The agreement provides for the acquisition of HSBC Panama’s subsidiaries, including its securities, trust, consumer finance businesses and an insurance company. The transaction will not include the subsidiaries of HSBC Panamaaggregate a 71% stake in Colombia (HSBC Colombia S.A. and HSBC Fiduciaria S.A.), which are being sold to a third party by HSBC as part of a previously announced transaction. The transaction is expected to close during the third quarter of 2013, subject to receipt of required regulatory approvals and other customary closing conditions.Cifin.
Pursuant to the terms of the agreement, HSBC has agreed to enter into a transitional services agreement to provide certain customary transitional services to Bancolombia for a period of time after closing.
Wind-down of Bancolombia’s Miami AgencyChange in Chief Executive Officer
On March 5, 2013,7, 2016, Carlos Raul Yepes Jimenez resigned as Chief Executive Officer of Bancolombia announced its decision to wind-downand the business and operationsboard of its agency in Miami, Florida. This decision was mainly based on the strategy to focus our international operations on other markets. The wind-down process is expected to be completed by the third quarter of 2013.directors appointed Juan Carlos Mora Uribe as his replacement.
PUBLIC TAKEOVER OFFERS
During 2012,In 2015, and as of the date of this Annual Report, there have been no public takeover offers by third parties with respect to the Bank’s shares or by the Bank in respect to another company’s shares.
CAPITAL EXPENDITURES AND DIVESTITURES
During the past three years, Bancolombia has made significant capital expenditures aimed at increasing the Bank’s productivity, footprint and cost efficiency. These expenditures include the improvements made to the Bank’s information technology platform and those related to new ATMs and branches.
During 2012,2015, total capital expenditures amounted to COP 154294 billion. Such investments were mainly focused on an IT Platform renewal projectIT-related projects (COP 9744 billion), the expansion of the Bank’s branch and ATM network (COP 1233 billion), the purchase of hardware for the expansion, updating and replacing current IT equipmentfixed assets (COP 2514 billion), and other investments, such as an anti-fraud systemmiscellaneous projects, including new software modules, upgrade of web contents, automation of reports and fixed assetsconstruction of data centers (COP 20203 billion).
In September 2010, the Board of Directors authorized Bancolombia to proceed with negotiations with Grupo de Inversiones Suramericana S.A. and Protección S.A. Sociedad Administradora de Fondos de Pensiones y Cesantías regarding the sale of Bancolombia’s ownership interests, held through foreign subsidiaries, in AFP Crecer, Asesuisa and Asesuisa Vida in El Salvador. The stock purchase agreements were executed in January 2011. The AFP Crecer transaction was authorized by regulators in El Salvador and Colombia and was closed in the second half of 2011. The Bank recognized a pre-tax gain on sale of investments of equity securities of COP 138 billion in connection with the AFP Crecer transaction. The Asesuisa and Asesuisa Vida transaction was authorized by regulators in El Salvador and Colombia and closed in the second half of 2012. The Bank recognized a pre-tax gain on sale of investments of equity securities of COP 81 billion in connection with the Asesuisa and Asesuisa Vida transaction.
Bancolombia received USD 104 million for the sale of AFP Crecer and USD 98 million for the sale of Asesuisa and Asesuisa Vida.
In 2012, Bancolombia invested USD 150 million in Sura Asset Management España S.L., a holding company that owns pension plan management institutions in Latin America. Investments in other companies during 2012 amounted COP 85 billion.
In 2012,2015, Bancolombia funded its capital expenditures with its own resources and plans to continue to fund those currently in progress in the same manner.
During 2011, total capital expenditures amounted to COP 197 billion. Such investments were mainly focused on an IT Platform renewal project (COP 107 billion), the expansion of the Bank’s branch and ATM network (COP 41 billion), the purchase of hardware for the expansion, updating and replacing current IT equipment (COP 36 billion), and other investments, such as an anti-fraud system and fixed assets (COP 13 billion).
During 2010, total capital expenditures amounted to COP 297 billion. Such investments were mainly focused on the IT Platform renewal project (COP 124 billion), the expansion of the Bank’s branch and ATM network (COP 69 billion), the purchase of hardware for the expansion, updating and replacing of current IT equipment (COP 32 billion), and other investments, such as an anti-fraud system and fixed assets (COP 77 billion).
During 2013,2016, the Bank expects to invest approximately COP 160385 billion as follows: COP 99 billion in connection with the IT Platform renewal project, COP 1542 billion in connection with the expansion of the Bank’s branch and ATM network, COP 750 billion in connection with the purchase of hardware for the expansion, updating and replacement of the current IT equipment, and COP 3982 billion in connection with other investments, such as an anti-fraud systemfixed assets and fixed assets.COP 211 billion in connection with strategic projects, including a new datacenter for the Bank’s operation in El Salvador. These figures represent only an estimate and may change according to the continuing assessment of the Bank’s project portfolio. No assurance can be given, however, that all such capital expenditures will be made and, if made, that such expenditures will be in the amounts currently expected.
The following table summarizes the Bank’s capital expendituresacquisitions and divestitures in interests in other companies for the years ending December 31, 2012, 20112015 and 2010:2014:
| | | As of December 31, | |
| Capital Expenditures (COP million) | | 2012 | | | 2011 | | | 2010 | | | Total | |
| Sura Asset Management España S.L. | | COP | 266,772 | | | COP | - | | | COP | - | | | COP | 266,772 | |
| Inversiones Inmobiliaria Arauco Alameda S.A. | | | 27,645 | | | | 3,479 | | | | - | | | | 31,124 | |
| UFF Móvil S.A.S. | | | 21,000 | | | | - | | | | - | | | | 21,000 | |
| Avefarma S.A.S. | | | 20,423 | | | | - | | | | - | | | | 20,423 | |
| Panamerican Farmaceutical Holding Inc. | | | 6,846 | | | | - | | | | - | | | | 6,846 | |
| Glassfarma Tech S.A.S. | | | 4,360 | | | | - | | | | - | | | | 4,360 | |
| Construcciones El Cóndor | | | 3,469 | | | | - | | | | - | | | | 3,469 | |
| Grupo Odinsa S.A. | | | 562 | | | | 190,516 | | | | - | | | | 191,078 | |
| Fondos de Pensiones y de Cesantías Protección S.A. | | | - | | | | 64,891 | | | | - | | | | 64,891 | |
| Enka de Colombia S.A. | | | - | | | | 9,523 | | | | - | | | | 9,523 | |
| Renting Colombia S.A. | | | - | | | | - | | | | 39,104 | | | | 39,104 | |
| Leasing Perú S.A. | | | - | | | | - | | | | 25,741 | | | | 25,741 | |
| Inversiones CFNS S.A.S. | | | - | | | | - | | | | 11,441 | | | | 11,441 | |
| Vivayco S.A.S. | | | - | | | | - | | | | 1,593 | | | | 1,593 | |
FiduPerú S.A. Sociedad Fiduciaria | | | - | | | | - | | | | 1,561 | | | | 1,561 | |
| Fondo de Inversión en arrendamiento operativo | | | - | | | | - | | | | 1,076 | | | | 1,076 | |
| Banagrícola S.A. | | | - | | | | - | | | | 93 | | | | 93 | |
| Fiduciaria Bancolombia S.A. | | | - | | | | - | | | | 69 | | | | 69 | |
| Inversiones Financieras Banco Agrícola S.A. | | | - | | | | - | | | | 68 | | | | 68 | |
| Others | | | 861 | | | | 2,034 | | | | 3,349 | | | | 6,244 | |
| Total Expenditures | | COP | 351,938 | | | COP | 270,443 | | | COP | 84,095 | | | COP | 706,476 | |
| | | For the year ended December 31, | |
| Capital Acquisitions | | 2015 | | | 2014 | | | Total | |
| | | (in millions of COP) | |
| Grupo Agromercantil Holding S.A DE C.V. | | | 477,145 | (1) | | | 79,339 | (2) | | | 556,484 | |
| Internacional Ejecutiva de Aviación S.A.S. | | | 8,121 | | | | - | | | | 8,121 | |
| Compañía de Procesamiento de Medios de Pago Guatemala (Bahamas), S.A. | | | 5,562 | | | | - | | | | 5,562 | |
| Grupo Nutresa | | | 2,644 | | | | - | | | | 2,644 | |
| Grupo AVAL | | | 2,618 | | | | - | | | | 2,618 | |
| Banco DAVIVIENDA S.A. | | | 2,180 | | | | - | | | | 2,180 | |
| ECOPETROL S.A. | | | 1,785 | | | | - | | | | 1,785 | |
| Equifax centroamerica S.A. De C.V. | | | 1,695 | | | | - | | | | 1,695 | |
| Transacciones y Transferencias, S.A. | | | 1,315 | | | | - | | | | 1,315 | |
| Interconexión Eléctrica S.A. | | | 1,107 | | | | - | | | | 1,107 | |
| Inversiones ARGOS S.A. | | | 1,076 | | | | - | | | | 1,076 | |
| Reintegra S.A.S. | | | 950 | | | | - | | | | 950 | |
| Cementos ARGOS S.A. | | | 667 | | | | - | | | | 667 | |
| Garantias y Servicios S.G.R.SA.DE C.V. | | | 531 | | | | - | | | | 531 | |
| Imágenes Computarizadas de Guatemala, S.A. | | | 476 | | | | - | | | | 476 | |
| Citigroup Inc. | | | 461 | | | | - | | | | 461 | |
| Inversiones Inmobiliaria Arauco Alameda S.A. | | | - | | | | 15,082 | | | | 15,082 | |
| Titularizadora Colombia S.A. | | | - | | | | 11,902 | | | | 11,902 | |
| Others | | | 1,709 | | | | - | | | | 1,709 | |
| Total Expenditures | | | 510,042 | | | | 106,323 | | | | 616,365 | |
| Capital Divestitures (COP million) | | 2012 | | | 2011 | | | 2010 | | | Total | |
| Asesuisa(1) | | COP | 173,285 | | | COP | - | | | COP | - | | | COP | 173,285 | |
| Todo Uno Services Inc.(1) | | | 3,161 | | | | - | | | | - | | | | 3,161 | |
| Todo Uno Colombia(1) | | | 228 | | | | - | | | | - | | | | 228 | |
| AFP Crecer(1) | | | - | | | | 203,072 | | | | - | | | | 203,072 | |
| Promotora La Alborada(1) | | | - | | | | 1,124 | | | | - | | | | 1,124 | |
| Promotora de Hoteles Medellín S.A.(1) | | | - | | | | 145 | | | | - | | | | 145 | |
| Banco Agrícola Panamá(2) | | | - | | | | - | | | | 51,677 | | | | 51,677 | |
| Inversiones IVL S.A.(1) | | | - | | | | - | | | | 33,895 | | | | 33,895 | |
| Metrotel Redes S.A.(1) | | | - | | | | - | | | | 30,000 | | | | 30,000 | |
| Bolsa de Valores de Colombia(1) | | | - | | | | - | | | | 5,886 | | | | 5,886 | |
| Valores Simesa S.A.(1) | | | - | | | | - | | | | 5,184 | | | | 5,184 | |
| Others(1) | | | - | | | | 57 | | | | 4,042 | | | | 4,099 | |
| Total Divestitures | | COP | 176,674 | | | COP | 204,398 | | | COP | 130,684 | | | COP | 511,756 | |
_____________________
| (1) | Investments soldThe amount of USD 151.5 million has been converted at the rate of COP 3,149.47 per USD 1.00, which is the Representative Market Rate calculated on December 31, 2015, as reported by the SFC. |
| (2) | Capital decreaseThe amount of USD 40 million has been converted at the rate of COP 1,983.48 per USD 1.00, which is the Representative Market Rate calculated on January 23, 2014, as reported by the SFC. |
| | | As of December 31, | |
| Capital Divestitures | | 2015 | | | 2014 | | | Total | |
| | | (in millions of COP) | |
| Inversiones Inmobiliarias Arauco Alameda S.A.S. | | | 216,598 | | | | - | | | | 216,598 | |
| Grupo Odinsa S.A. | | | 1,442 | | | | - | | | | 1,442 | |
| Prosicol S.A.S. (in liquidation)(1) | | | - | | | | 992 | | | | 992 | |
| Others | | | 2,426 | | | | - | | | | 2,426 | |
| | | | | | | | | | | | | |
| Total Divestitures | | | 220,466 | | | | 992 | | | | 221,458 | |
| (1) | Refund of the investment. |
COMPANY DESCRIPTION, PRODUCTS AND SERVICES
Bancolombia is a full service financial institution that offers a wide range of banking products and services to a diversified individual and corporate customer base of more than 7nearly 11 million customers. Bancolombia delivers its products and services through its regional network comprising Colombia’s largest non-Government owned banking network, El Salvador’s leading financial conglomerate by gross loans, Guatemala’s fourth-largest bank by gross loans, Panama’s second-largest bank by gross loans and off-shore banking subsidiaries in Panama, Cayman and Puerto Rico, as well as an agency in Miami and subsidiaries in Peru.
Bancolombia and its subsidiaries offer the following products and services:
Savings and Investment:InvestmentBancolombia: The Bank offers its customers checking accounts, savings accounts, fixed term deposits and a diverse variety of investment products that fit the specific transactional needs of each client and their income bracket. The Bank also offers its clients and users the service of tax collection in all its branches, and through electronic channels.
| · | Debit cards: A product designed for people to manage their cash, deposited in a savings account. ATM’s and electronic payment channels are widely available in Colombia. Different savings accounts are designed for several profiles of customers: “Young” segment, payroll savings, programmed savings, and preferential segment. |
| · | Checking accounts:Deposits can be made in cash or checks. This account grants overdraft protection for eventual cash flow needs.All Bancolombia’s ATMs and electronic payment systems are available to checking account customers. |
| · | Fixed term certificates of deposit: (CDT) Certificados de Depósito a Término.An investment option for individual clients seeking to deposit their capital at a fixed or variable interest rate; the variable interest rate depends on the term of the deposit. Interest can be reinvested in the CDT or disbursed to the owner of the capital at agreed intervals. |
Ahorro a la Mano: This is a mobile phone based savings account specially designed to serve low-income clients and those with no prior experience with banking products.
Financing:FinancingBancolombia:The Bank offers its customers a wide range of credit alternatives which include: trade financing, loans funded by domestic development banks, working capital loans, credit cards, personal loans, vehicle loans, payroll loans and overdrafts, among others. It also offers the following financial specialized products:
| · | Personal Loan: Is a credit line of free investment destination that allows an individual earning an income greater than two times the minimum wage to obtain credit from the bank without use limitations |
| · | Prestanómina:Is a credit line attached to an authorized individual payrollamount. |
| · | Prestanómina FOPEP:Is a credit line attached to an authorized individual payroll figure for retired employees in the FOPEP (Public Pension Fund). |
| · | Auto Loans (new cars):Loan designed for clients interested in purchasing a new car for private or public use. The vehicle financed is used as collateral for the loan. |
| · | Auto Loans (used cars):Loan designed for clients interested in purchasing a used car for private or public use. The vehicle financed is used as collateral for the loan. |
| · | Credit Cards: Bancolombia offers several credit cards with three different franchises as well as private brands: MasterCard, Visa, and American Express (American Express is an exclusive franchise in Colombia for Bancolombia). These products are divided in different segments of the market, personal and corporate, designed to satisfy the needs of different customers with different purchase habits and income levels. All the traditional classifications are commercialized: Black, Platinum, Gold, Traditional, among others. |
Mortgage Banking: BancolombiaThe Bank is a leader in the mortgage market in Colombia, providing full financial support to construction firms and mortgages for individuals and companies.
| · | Housing Loan: Is a loan designed for individuals interested in purchasing homes. The loan uses a mortgage on the purchased property as collateral. |
| · | Commercial Property Loan: This loan is specialized in providing funds for purchase of properties, the use of which is not related to habitation; such as, commercial properties, offices, lands for construction (restrictions may apply), warehouses, and others. |
| · | Private General Construction Loan: This is a general construction loan for individuals and businesses for new construction of properties, the use of which is not related to habitation. Periodic disbursements are given to the client as the project advances. These loans are granted depending on the solicitor’s periodic income or cash flow. |
Factoring:Factoring: Bancolombia offers its clients solutions for handling their working capital and maximizing their assetassets turnover through comprehensive solutions to manage their accounts receivable financing.
| · | Factoring for Suppliers:For corporate clients, this product provides the funds to pay debt with suppliers at a fixed interest rate andwith frequent periodic payments. |
| · | Export and Import Factoring:Acquire cash flow based on invoices related to international trade at a specific asking price. |
Financial and Operating Leases:Leases Bancolombia,: The Bank, primarily through Leasing Bancolombia and its subsidiaries, offers financial and operating leases specifically designed for acquiring fixed assets.
| · | Home Leases:Bancolombia provides an alternative to its clients to acquire their own real estate property. With a low initial payment, clients of the lease pay periodic fees, leaving a portion of the total capital to the end of the term as a possible purchase option. |
| · | Vehicle Leases:Bancolombia provides an alternative to its clients to purchase an automobile. With a low initial payment, clients of the lease pay periodic fees, leaving a portion of the total capital to the end of the term as a possible purchase option. It can also help companies, whose activity is connected to the transportation of goods and people, to acquire new vehicles for their operations. |
| · | Infrastructure Leases:Bancolombia provides an alternative to its clients to invest in infrastructure projects needed for the corporate and industrial segment. With a low initial payment, clients of the lease pay periodic fees, leaving a portion of the total capital to the end of the term as a possible purchase option. |
Capital Markets:MarketsBancolombia: The Bank assists its clients in mitigating market risk through hedging instruments such as:as, futures, forwards, options and swaps.
| · | Foreign exchange forwards |
eTrading:The bank offers an internet-based trading platform, available for retail and institutional clients, which allows them to buy/sell securities in the Colombian Stock Exchange.
The Bank also performs inter-bank lending, repurchase agreements (repos), foreign exchange transactions, as well as sovereign and corporate securities sales and trading. Bancolombia is an active player in the “Market-makers”“market-makers” scheme for trading Colombian sovereign debt (TES bonds).
Valores Bancolombia and Valores Bancolombia Panamá offerThe Bank offers its clients direct access to local and international capital markets through a full range of Brokeragebrokerage and Investment Advisory Servicesinvestment advisory services that cover:
| · | Third party asset management vehicles |
Fiduciaria Bancolombiacover equities and Valores Bancolombia also offer a wide range offixed income securities, proprietary and third-party asset management products, such asMutual Funds, Private Equity Funds,asmutual funds, private equity funds, and Privately Managed Investment Accountsprivately managed investment accounts for institutional, corporate and private bank clients.
Comprehensive Cash Management:Management Bancolombia: The Bank provides support to its clients through efficient cash management, offering a portfolio of standard products that allows clients to make payments and collections through different channels. Our payables and receivables services provide solutions to process and reconcile transactions accurately, efficiently, and in a timely manner. We also offer a comprehensive Reporting Solution,reporting solution, providing the data that is required by customers’ internal processes. In addition, ourthe Bank designs and creates custom-made products in order to address our clients’ specific payment and collection needs, includingneeds. These include a variety of real timereal-time web services, straight through processing (STP) and messaging through Swift Net solutions.
Foreign Currency:CurrencyBancolombia: The Bank offers its clients specialized solutions to satisfy their investment, financing and payment needs with regard to foreign currency transactions. The Bank also provides trade finance solutions with products such as Lettersletters of Credit, Standby Letterscredit, standby letters of Creditcredit and Bills Collection.bills collection.
Bancassurance and Insurance:Bancolombia: The Bank distributes diverse insurance products (life, auto, commercial, and homeowner’s insurance) offeredwritten by Compañía Suramericana de Seguros, one of the main insurance companies in Colombia. In addition, Bancolombia offers unemployment insurance issuedwritten by Sure General Cardif Colombia S.A. In El Salvador, Banco Agricola offers a comprehensive portfolio of insurance products from Asesuisa (auto insurance, personal accident and health insurance, fire and associated perils insurance, cargo insurance, among others) and Asesuisa Vida (life insurance).
Investment Banking:BankingBancolombia offers: The Bank, through its subsidiary Banca de Inversión, offers a wide variety of value-added services, that allows it to adviseincluding project and assist companies from all economic sectors, including in areas relating to projectacquisition finance, capital markets capital(DCM & ECM), principal investments (in real estate, industrials, construction), M&A, restructurings and structured corporate lending etc.across all economic sectors.
Trust and Fiduciary Services:ServicesBancolombia offers:The Bank, through its subsidiary Fiduciaria Bancolombia offers a broad and diversified portfolio of services for companies and individuals, meeting their needs with tailored services. These services include managing escrow accounts, multiple investment funds, and real estate funds.
NEW PRODUCTS OR SERVICES
Bancolombia continues its efforts to diversify and improve its product portfolio. Below is a brief description of the new products and services introduced in 2012:
Savings Account in Puerto Rico:Savings account in USD offered by Bancolombia Puerto Rico to individuals with a minimum deposit requirement of USD 7,000 and a monthly interest payment.
Automated payments funded by coin and currency collections: Allows customers who use Coin and Currency Collection to use these resources to fund automated and tax payments, uploading payment instructions through their e-banking platform.
Paypass Debit card:Is a new “contactless” payment system attached to both savings and checking accounts. It is unique in the Colombian market, allowing users to pass their cards in special establishments without having to type their passwords for purchases worth less than COP 39,300 per use, and at a maximum of COP 600,000 daily.
Domestic Remittances:improved service designed to offer our customers the possibility to transfer money from branch to branch within the Bancolombia network.
Sector Fund: open-end collective investment fund with compartments, where each compartment invests in a specific sector of the economy such as energy, mining, financial, etc.
IBR and IPC BVC Futures: money market and inflation futures contracts traded on Colombian Stock Exchange (Bolsa de Valores de Colombia, “the BVC”).
Forward Novado:possibility to settle and clear over-the-counter USD/COP forward contracts through Colombian Central Credit Risk Clearing-House.
Plan Cuenta Pensión:Savings account designed to receive the pension payments made to the customer by a Pension Fund.
Swift Fileact: Allows secure and reliable transfer of files between corporate clients and Bancolombia, exchanging batches of Swift Structured Financial Messages and Bancolombia Proprietary Standard Formats, required for collection and payments processes. Multipayments PSE: Payment Transactional Portal, available on Bancolombia’s web site, allows access to several payment agreements and is linked to ACH, Colombia’s online payment service. PSE is a standard payment service used to make secure online payments between bank accounts. When billers offer PSE as a payment method in their online stores, a direct link is established with the systems of the payer’s bank.
Discount of Account Receivables: Financing line for corporate customers known as “massive holders of account receivables”. The line of credit is based on a contract where Bancolombia groups several receivables in just one obligation, and acts as factor between the seller and the buyer, doing all the operational process.
Credit line for Environmental Sustainability: Designed for customers who support new processes to optimize energy efficiency, use renewable energy and implement clean production in their businesses. This line of credit offers technical assistance, where experts evaluate and identify projects for the customer, and give advice regarding applicable tax benefits.
Arithmetic Asian Options: This product is a cash-settled option that pays the difference between the average rates of the underlying asset on a specific set of dates over a period at a predetermined strike rate.
Student Loan:is a credit designed for clients willing to finance graduate and undergraduate education programs in certified universities. The minimum withdrawal amount under the facility is COP 1,000,000, and a maximum of 250 SMMLV. Credit possibilities vary depending on the client’s debt capacity.
MAIN LINES OF BUSINESS
The Bank manages its business through eightten main operating segments: Banking Colombia, Banking Panama, Banking El Salvador, Leasing, Trust, Investment Banking, Brokerage, Off Shore, and All other.
Until 2011 Bancolombia also included “Pension and Insurance” as one of its segments. In 2012, Bancolombia closed the sale of those units and does not report numbers under the “Pension and Insurance” segment anymore.
For a description and discussion of these segments, please see “Item 5. Operating and Financial Review and Prospects – A. Operating Results – A.2. Results by Segment”.
See Note 31 – section (y)3 to the Bank’s consolidated financial statementsConsolidated Financial Statements as of December 31, 20122015 included in this Annual Report for a description of the principal markets in which the company competes, including a breakdown of total revenues by category of activity and geographic market for each of the last three financialtwo fiscal years.
| B.3. | SEASONALITY OF DEPOSITS |
Historically, the Bank has experienced some seasonality in its demand deposits, with higher average balances at the end of the year and lower average balances in the first quarter of the year. This behavior is explained primarily by the increased liquidity provided by the Central Bank and the Colombian National Treasury at year end,year-end, as economic activity tends to be higher during this period resulting in a greater number of transactions. However, we do not consider the seasonality of demand deposits to have a significant impact on our business.
The Bank on a consolidated basis is not dependent on sources or availability of raw materials.
Bancolombia provides its products and services through a traditional branch network, sales and customer representatives as well as through mobile branches (or “Puntos de Atención Móviles”), banking correspondents, an ATM network, online and computer banking, telephone banking, mobile phone banking services, and PACs, among others. In addition, as of December 31, 2012,2015, Bancolombia had a sales force of approximately 10,52013,147 employees and transactions performed through electronic channels represented more than 88%83.6% of all transactions in 2012.2015.
The following are the distribution channels offered by Bancolombia as of December 31, 2012.2015.
Branch Network
As of December 31, 2012,2015, Bancolombia’s consolidated branch network consisted of 9921,274 offices which included 822827 from Bancolombia 101S.A., 97 from Banco AgrícolaAgricola, 47 from Banistmo, 220 from BAM and 6983 from other subsidiaries.
| Company* | | Number of
branches
2012 | | Number of
branches
2011 | | Number of
branches
2010 | | | Number of
branches
2015 | | | Number of
branches
2014 | | | Number of
branches
2013 | | | Number of
branches
2012 | | | Number of
branches
2011 | |
| Bancolombia S.A.(unconsolidated) | | | 822 | | | | 779 | | | | 736 | | | | 827 | | | | 826 | | | | 844 | | | | 815 | | | | 779 | |
| Bancolombia Panamá | | | 1 | | | | 1 | | | | 1 | | |
| Bancolombia Panama | | | | 1 | | | | 1 | | | | 1 | | | | 1 | | | | 1 | |
Bancolombia Miami (Agency) | | | 1 | | | | 1 | | | | 1 | | | | - | | | | - | | | | - | | | | 1 | | | | 1 | |
| Bancolombia Panamá (Branch) | | | 1 | | | | - | | | | - | | |
| Bancolombia S.A. Panama Branch | | | | 1 | | | | 1 | | | | 1 | | | | 1 | | | | - | |
| Leasing Bancolombia | | | 20 | | | | 16 | | | | 17 | | | | 21 | | | | 21 | | | | 21 | | | | 20 | | | | 16 | |
| Renting Colombia | | | 17 | | | | 16 | | | | 16 | | | | 23 | | | | 19 | | | | 17 | | | | 17 | | | | 16 | |
| Valores Bancolombia | | | 5 | | | | 8 | | | | 9 | | | | 7 | | | | 11 | | | | 11 | | | | 5 | | | | 8 | |
| Valores Bancolombia Panamá S.A. | | | 1 | | | | 1 | | | | 1 | | |
| Valores Bancolombia Panama S.A. | | | | 1 | | | | 1 | | | | 1 | | | | 1 | | | | 1 | |
| Banca de Inversión | | | 2 | | | | 2 | | | | 2 | | | | 2 | | | | 2 | | | | 2 | | | | 2 | | | | 2 | |
| Fiduciaria Bancolombia | | | 4 | | | | 6 | | | | 6 | | | | 5 | | | | 7 | | | | 7 | | | | 4 | | | | 6 | |
| Tuya S.A, Compañía de Financiamiento (previously Sufinanciamiento S.A.) | | | 5 | | | | 5 | | | | 6 | | |
| Tuya S.A. Compañía de Financiamiento(6) | | | | - | | | | 4 | | | | 6 | | | | 5 | | | | 5 | |
| Bancolombia Puerto Rico International Inc. | | | 1 | | | | 1 | | | | 1 | | | | 1 | | | | 1 | | | | 1 | | | | 1 | | | | 1 | |
| Factoring Bancolombia | | | 1 | | | | 1 | | | | 1 | | |
| Arrendamiento Operativo CIB S.A.C.(1) | | | 1 | | | | 2 | | | | 5 | | |
| Factoring Bancolombia S.A. | | | | - | | | | - | | | | 1 | | | | 1 | | | | 1 | |
| SUFI | | | | 3 | | | | 3 | | | | 6 | | | | 7 | | | | | |
| Arrendamiento Operativo CIB S.A.C.(2) | | | | 1 | | | | 1 | | | | 1 | | | | 1 | | | | 2 | |
| Fondo Inversión Arrend.Operativo Renting Perú I | | | 1 | | | | 1 | | | | 1 | | | | 1 | | | | 1 | | | | 1 | | | | 1 | | | | 1 | |
| Inversiones CFNS S.A.S. | | | 2 | | | | 2 | | | | 1 | | | | 2 | | | | 2 | | | | 2 | | | | 2 | | | | 2 | |
| Banco Agrícola | | | 101 | | | | 101 | | | | 102 | | | | 97 | | | | 98 | | | | 98 | | | | 101 | | | | 101 | |
| Arrendadora Financiera S.A. | | | 1 | | | | 1 | | | | 1 | | | | 1 | | | | 1 | | | | 1 | | | | 1 | | | | 1 | |
| Credibac S.A. de C.V | | | - | | | | 1 | | | | 1 | | | | - | | | | - | | | | - | | | | - | | | | 1 | |
| Valores Banagricola, S.A. de C.V.(2) | | | 1 | | | | 1 | | | | 1 | | |
| AFP Crecer S.A.(3) | | | - | | | | - | | | | 6 | | |
| Aseguradora Suiza Salvadoreña S.A.(4) | | | - | | | | 1 | | | | 1 | | |
| Asesuisa Vida S.A.(4) | | | - | | | | 1 | | | | 1 | | |
| Uff Móvil S.A.S. | | | 1 | | | | - | | | | - | | |
| Valores Banagricola, S.A. de C.V.(3) | | | | 1 | | | | 1 | | | | 1 | | | | 1 | | | | 1 | |
| AFP Crecer S.A.(4) | | | | - | | | | - | | | | - | | | | - | | | | - | |
| Aseguradora Suiza Salvadoreña S.A.(5) | | | | - | | | | - | | | | - | | | | - | | | | 1 | |
| Asesuisa Vida S.A.(5) | | | | - | | | | - | | | | - | | | | - | | | | 1 | |
| Uff Móvil S.A.S. (7) | | | | - | | | | 1 | | | | 1 | | | | 1 | | | | - | |
| Capital Investments SAFI S.A. | | | 1 | | | | 1 | | | | 1 | | | | 1 | | | | 1 | | | | 1 | | | | 1 | | | | 1 | |
| Transportempo S.A.S | | | 1 | | | | 1 | | | | 1 | | | | 1 | | | | 1 | | | | 1 | | | | 1 | | | | 1 | |
| Leasing Perú S.A. | | | 1 | | | | 1 | | | | 1 | | | | 1 | | | | 1 | | | | 1 | | | | 1 | | | | 1 | |
| FiduPerú S.A. Sociedad Fiduciaria (previously Fiduciaria GBC S.A.) | | | 1 | | | | 1 | | | | 1 | | | | 1 | | | | 1 | | | | 1 | | | | 1 | | | | 1 | |
| Banitsmo | | | | 47 | | | | 50 | | | | 50 | | | | - | | | | - | |
| Financomer | | | | 8 | | | | 7 | | | | 8 | | | | - | | | | - | |
| BAM (Guatemala) | | | | 220 | | | | - | | | | - | | | | - | | | | - | |
| Seguros Banitsmo | | | | - | | | | 4 | | | | 4 | | | | - | | | | - | |
| Total | | | 993 | | | | 952 | | | | 921 | | | | 1,274 | | | | 1,070 | | | | 1,090 | | | | 993 | | | | 952 | |
*For some subsidiaries, their central office is considered a branch.
__________________
| (1) | Bancolombia Miami closed its operations on August 30, 2013 |
| (2) | Renting Perú S.A.C. changed its legal name to Arrendamiento Operativo CIB S.A.C. The offices operated for the Localiza franchise in Peru are included in the total number of branches reported for Arrendamiento Operativo CIB S.A.C. |
| (2)(3) | Bursabac S.A. de C.V changed its legal name to Valores Banagricola, S.A. de C.V. |
| (3)(4) | AFP Crecer S.A. was sold on November 21, 2011, and it is no longer part of the organization.2011. |
| (4)(5) | Aseguradora Suiza Salvadoreña S.A. and Asesuisa Vida S.A. were sold on September 27, 2012, and are2012. |
| (6) | Bancolombia S.A. entered into an agreement to sell 50% of its stake in Compañía de Financiamiento Tuya S.A. in 2015. Bancolombia S.A. will no longer partconsolidate such company, although it will still own 50% of the organization.company’s common equity. |
| (7) | Bancolombia S.A. sold its 80.59% stake in Uff Movil S.A.S. in 2015. |
Banking Correspondents
A banking correspondent is a platform which allows non-financial institutions, such as stores open to the public, to provide financial services and transactions in towns where banks and financial institutions have limited or no presence. As of December 31, 2012, there were2015, Bancolombia has a total of 1,1436,768 banking correspondents.correspondents, including 6,595 in Colombia, 73 in Panama and 100 in El Salvador.
Puntos de Atención Móviles (“PAM”)
PAMs consist of commercial advisors who visit small towns periodically to offer Bancolombia’s products and services. As of December 31, 2012,2015, there were a total of 732564 PAMs.
Kiosks
Kiosks, used in El Salvador, are located inside the Bank’s agencies, malls, and other public places and are used to provide the Bank’s clients the possibility of conducting a variety of self-service transactions. As of December 31, 2012,2015, there were a total of 204215 kiosks.
Automatic Teller Machines (“ATM”ATMs”)
Bancolombia has a total of 3,8275,080 ATMs, including 3,3334,024 in Colombia, and 494561 in El Salvador.Salvador, 323 in Panama, and 172 in Guatemala.
Online/Computer Banking
We offer multiple online and computer-based banking alternatives designed to fit the specific needs of our different client segments. Through a variety of platforms (computer and Internet-based solutions) our clients can review their account balances and monitor transactions in their deposit accounts, loans, and credit cards, make virtual term investments, access funds from pre-approved loans, make payroll and supplier payments, make purchases and bill payments, negotiate stocks, learn about products and services and complete other transactions in real time.
Telephone Banking
We provide customized and convenient advisory services to customers of all segments through automatic interactive voice response (IVR) operations and a 24/7 contact center.
Punto de Atención Cercano (“PAC”) or Electronic Funds Transfer at Point of Sale or Punto de Atención Cercano (“EFTPOS”PAC”)
Through our own network of 8,2256,188 PACs our customers may carry out a variety of transactions including transfer of funds, bill payments, and changes to credit and credit card PINs.
Mobile Phone Banking Service
Our clients can conduct a variety of transactions using their cell phones, including fund transfers between Bancolombia accounts, account balance inquiries, purchase of prepaid cell phone air time and payment of bills and invoices.
| B.6. | PATENTS, LICENSES AND CONTRACTS |
The Bank is not dependent on patents or licenses, nor is it substantially dependent on any industrial, commercial or financial contracts (including contracts with customers or suppliers).
However, there are two materialthe contracts with service providers thatdescribed below have significant relevance to the Bank’s business:
As a result of the disposal of Todo1 Services, Inc. in August, 2012, theThe online banking platform of the Bank is no longer provided by an affiliate, and is currently provided by Todo1 Services Inc., a third party with whom the Bank has entered into a service-level agreement. As of December 31, 2012, Todo 1 Services, Inc. is the sole service providercompany specialized in providing services to financial institutions for the Bank’s onlinetheir mobile and internet banking platform and in the event it ceased to provide such service, the Bank would need to engage a new service provider with whom it would have to negotiate a new service-level agreement.platforms.
The Bank’s call center and telephone banking services are renderedprovided by Allus Global BPO (“Business Process Outsourcing”) Center, a company specialized in providing business process outsourcing, or BPO solutions. If Allus Global BPO Center ceased to provide such services, the Bank would need to engage a new service provider with whom it would have to negotiate a new service-level agreement.
The Bank’s check processing and settlement service is provided by IQ Outsourcing S.A., a Colombian company specialized in processing checks issued by customers of the Colombian financial institutions, through the Central Bank.
If IQ Outsourcing S.A. ceasedwe were required to provide such service, the Central Bank could impose fines to the Bank, and the Bank would need to engage a new service provider for such services.
The replacementreplace any of Todo1 Services Inc., Allus Global BPO Center or IQ Outsourcing S.A. as service providers of the Bank, or if any of those service providers were not to fulfill their respective contractual obligations, our business could suffer, and we might be delayed or result in a variation of therequired to incur additional costs associated with such services due to negotiations with potential newfind replacement providers.
Description of the Colombian Financial System
Overview
In recent years,During the last decade, the Colombian banking system has been undergoing a period of consolidationexpansion, given the series of mergers and acquisitions that have taken place within the sector. More specifically, several mergers and acquisitions took place in 2005, including2007, mainly due to the Conavi/Corfinsura merger,global economic situation. Colombian banks made several investments allowing some entities to become big players in the acquisition of Banco Aliadas by Banco de Occidente, the merger of Banco Tequendama and Banco Sudameris, as well as the merger of the Colmena and the Caja Social banks. The trend towards mergers and acquisitions continued throughout 2006, with the completion of certain transactions first announced during 2005. These include the acquisition of Banco Superior by Davivienda, of Banco Granahorrar by BBVA Colombia and of Banco Unión by Banco de Occidente. Also during 2006, Banco de Bogota acquired Megabanco and Davivienda announced its acquisition of Bancafé. In 2007, HSBC acquired Banitsmo andLatin American market; Bancolombia, also completed the acquisition of Banagrícola in El Salvador. For more information on the acquisition of Banagrícola, see “Item 4. Information on the Company – 4.A. History and Development of the Company”. In 2008 the Royal Bank of Scotland (RBS) purchased the Colombian arm of ABN Amro Bank and General Electric (GE) Money acquired a 49.7% stake in Colpatria, with an option of increasing this stake by another 25% by 2012. However, in May of 2010, Group Colpatria repurchased this 49.7% stake and in October of 2011, Canadian Scotiabank purchased Colpatria’s 51% for US$ 1,000 million. Also, in 2010, Banco de Bogotá acquired BAC-Credomatic, which has operationsoperates in several countries in Central America, forAmerica; and, in October 2011, Canadian Scotiabank purchased a reported purchase price of COP 3.53 billion.
stake in Colpatria. In 2012, the Colombian banking system continued its process of internationalization; the most relevant events related toevent regarding the presence of foreign bankingbanks in Colombia werewas the acquisition by Corpbanca (Chile) of Banco Santander Colombia S.A. in July 2012 for USD 1,225 million andby Corpbanca (Chile). Also, Davivienda acquired the announcement in October 2012 to purchase Helm Bank for USD 1,300 million. The stock market also showed some changes with the acquisition of 100% of Bolsa y Renta by BTG Pactual, a Brazilian broker-dealer, for USD 52 million. It’s also highlighted the arrival of financial company Opportunity from Canada in July 2012, as well as Banco Itaú, the largest of Latin America by assets in November 2012. Grupo Bancolombia was also active in the international markets; it continued its growth in Central America with the purchase of 40% of Grupo Financiero Agromercantil in Guatemala, for USD 216 million and it opened a branch office in Panama (Bancolombia Panamá) in order to offer services to the local Panamanian market. Colombian banks were also active in intenational markets; Davivienda purchased the affiliatessubsidiaries of HSBC in Costa Rica, Honduras and El Salvador for USD 801 million and GNB Sudameris completedSalvador.
In 2013, Bancolombia continued its internationalization process with the purchaseacquisition of the subsidiariesbanking and insurance operations of HSBC in Colombia, Perú, Paraguay and UruguayPanama for USD 4002,234 million. In addition, Bancolombia Panama, acquired 40% of the common shares of Grupo Agromercant for USD 217 million. In 2013, Grupo Aval acquired 100% of the Guatemalan Reformador Financial Group (the transaction was valued at USD 411 million) and acquired BBVA Panama for USD 490 million. In 2013, some competitors started operations in Colombia: Itau BBA entered the market with an investment bank, just as did BNP Paribas, Credicorp with the acquisition of Correval (a local brokerage firm), Brazilian broker-dealer BTG Pactual acquired Bolsa y Renta, Banco Santander returned to the Colombian market with a bank and the Chilean Larrain Vial started operations with a brokerage firm. During 2014, the entry of new entities continued as the financing company Hipotecaria specialized in mortgage loans that began operations in March 2014; also, in June 2014, Corpbanca completed the acquisition of Helm Bank, keeping the brand of Corpbanca; additionally, in 2014 the bank GNB Sudameris acquired 99.9% of the capital of HSBC Colombia and now operates under the brand GNB Colombia. In October 2014, GNB Sudameris acquired GNB Colombia. In 2015, the Chilean group CorpBanca made a merger agreement with the Brazilian Itau. Bancolombia sold 50% of its shares in Tuya SA to Grupo Exito. Furthermore, in December of 2015, Bancolombia bought an additional 20% interest in Grupo Agromercantil, controlling in total 60% of the company.
As of December 31, 2012, and2015, according to the SFC, the principalmain participants in the Colombian financial system were the Central Bank, 2325 commercial banks (12(14 domestic private banks, 10 foreign banks, and 1 domestic state-owned bank), 5 financefinancial corporations and 2116 financing companies (6(4 leasing companies and 1512 traditional financing companies). Bancolombia has the commercial finance company Leasing Bancolombia, which as of December 31, 2015 had a market share in assets and net income of 64.79% and 64.99% respectively, also has Finance Corporation, Banca de Inversión, with a market share in assets and net income of 4.64% and 12.67% respectively. In addition, trust companies, cooperatives, insurance companies, insurance brokerage firms, bonded warehouse, special state-owned institutions, pension and severance pay funds also participate in the Colombian financial system.
The Financial Reform Act of 2009 (Law 1328 passed on July 15, 2009) also made important advances towardsCredit Institutions’ Evolution in 2015
During 2015, Colombia showed a multi-banking framework. This new legislation authorized banks to provide merger and acquisition loans and allowed them to conduct financial leasing operations. As a result, some competitors have absorbed their financial leasing subsidiaries into their banking franchises and some leasing companies aredeceleration in the processgrowth of becoming banks.
Financial System Evolutionthe Gross Domestic Product (GDP) in 2012
During 2012relation to 2014. The GDP increased 3.1% in 2015 whereas the growth in 2014 was 4.6%. Inflation in 2015 was out of the target range of the Central Bank, due to the lack of staple foodstuffs and devaluation of the Colombian peso. In 2015, inflation increased 6.77% in comparison to 2014. One of the critical points for the Colombian economy experienced moderate growth comparedduring 2015 was the evolution of raw material and commodities international prices, which decreased in relation to 20112014, affecting especially crude oil. The devaluation of the Colombian peso has had a negative impact in the trade balance, which is primarily explained by low growth in domestic demandnow more negative. In 2014, the deficit was of 6,293 million of dollars and the deep contractiondeficit of 2015 was 15,907 million. Exports to the United States decreased 31% and to China 61%. As a measure to control inflation and the negative growth of the trade balance, the Central Bank has increased the interest rate up to 125 basis points in civil infrastructure investments. These indicators suggest a 20122015, ending the year in 5.75%.
Loans growth rate of about 4%, which is lower than market expectations. Theat Colombian credit expansion throughout 2012institutions was lower than that of 2011. The financial system’s loans increased by 14.8714.42 % in 2015 according to SFC, while the rate was 23.39%compared to 14.80% and 17.52% in 201113.55% for 2014 and 2010,2013, respectively. Monetary policy during the first half of the year was restrictive, and the rate of intervention increased over 50bp. In July 2012, the rate was 5.25%. From the second quarter on, the rate of intervention diminished 100bp to close in December 2012 at 4.25%, due to low economic Colombian growth in the third quarter 2012, low inflation during the year and a moderateThe growth of credit, which led to higher reference interest rates with a gradual increase of about 125bp. The demand for businesscommercial loans increased by 12.07% for 2012,was 14.79% in 2015, compared to 18.26% for15.54% in the previous year. The rising confidence drove up consumer loans which grew by 17.54%increased 11.70% in 2012, lower2015, less than the 28.30%13.30% in 2011.2014. Mortgage and small business loans continued to perform well, with increases of 23.94%16.59% and 19.92% for 2012.15.50%, respectively, in 2015.
The financial system’scredit institutions’ level of past-due loans as a percentage of the total loan portfolio increased throughout the year,decreased from 2.47%2.94% in December 20112014 to 2.86% for the same month in 2012.December 2015. In addition, the coverage, measured asby the ratio of allowances for loans losses (principal) to past-due loans,PDLs (overdue 30 days), ended 20122015 at 166.79%156.85%, compared to 191.53%151.52% at the end of 2011.2014.
During 2012, lending increased its percentage2015, loans raised their participation in the total amount of financial system’s structure.assets. Loans increased from 62.9%64.4% of total assets at the end of 20112014 to 63.4%65.5% at the end of 2012.2015. The investment portfolio,investments and derivatives transactions, as a percentage of total assets, decreasedincreased from 19.7%19.2% at the end of 20112014 to 19.6%19.8% at the end of 2012.2015. Deposits reduced their participation in the total balance of loans from 97.28% in 2014 to 93.6% in 2015.
As of December 31, 2012,2015, the Colombian financial sectorcredit institutions recorded COP 370549.8 trillion in total assets, representing a 14.42%14.88% increase as compared to the same period in 2011.2014. The Colombian financial system’scredit institutions total composition of assets shows banks with a market share of 90.84%91.79%, followed by financing companies with 5.67% and5.18%, financial corporations with 3.05%2.57% and financial cooperatives with 0.47%.
As of December 31, 2012, theThe capital adequacy ratio (tier(Tier 1 + tierTier 2) for credit institutions was 16%15.42% in December 2015 (including banks, financefinancial corporations, financing companies and financing companies)financial cooperatives), which is well above the minimum legal requirement of 9%. With the effectiveness of Decree 1771 of 2012 and the external circular 20 of 2013 of the Financial Superintendence, a new capital regime for credit institutions was established in order to strengthen the quality of equity of financial institutions to ensure they have the capacity to absorb losses in the development of their activities.
During 2015, the Colombian financial institutions began reporting their financial results under IFRS. In the case of credit institutions, the SFC since 2015 has allowed the presentation of non-consolidated financial statements under Colombian banking GAAP, following the Decree 1851 of August 2013, which regulates the Law 1314 of 2009 concerning the technical regulatory framework for the institutions that report their financial results.
Bancolombia and itsIts Competitors
The following table shows the key profitability, capital adequacy ratios and loan portfolio quality indicators for Bancolombia unconsolidated and its main competitors unconsolidated, as published by the SFC. It is important to note that, in the case of mortgages, loans used in the calculation shown below incorporate the past-due installments, instead of the complete mortgage balance, whenever a mortgage is due in less than 120 days.
| | | ROE(1) | | ROA(2) | | Past-due loans/
Total loans | | Allowances/
Past-due loans | | Capital Adequacy | | | ROE(1) | | ROA(2) | | | Past-due loans/ Total loans | | | Allowances/
Past-due loans | | Capital Adequacy | |
| | | Dec-12 | | Dec-11 | | Dec-12 | | Dec-11 | | Dec-12 | | Dec-11 | | Dec-12 | | Dec-11 | | Dec-12 | | Dec-11 | | | Dic-15 | | Dic-14 | | Dic-15 | | Dic-14 | | Dic-15 | | Dic-14 | | Dic-15 | | Dic-14 | | Dic-15 | | Dic-14 | |
| Bancolombia (unconsolidated) | | | 11.17 | % | | | 13.56 | % | | | 1.71 | % | | | 1.9 | % | | | 2.16 | % | | | 1.85 | % | | | 208.21 | % | | | 236.23 | % | | | 17.85 | % | | | 15.5 | % | |
| Banco de Bogota | | | 14.37 | % | | | 13.58 | % | | | 2.72 | % | | | 2.5 | % | | | 2.11 | % | | | 1.64 | % | | | 155.97 | % | | | 198.00 | % | | | 15.86 | % | | | 15.7 | % | |
| Bancolombia | | | | 13.06 | % | | | 8.14 | % | | | 2.13 | % | | | 1.33 | % | | | 2.78 | % | | | 2.51 | % | | | 177.11 | % | | | 185.46 | % | | | 15.76 | % | | | 17.89 | % |
| Banco de Bogotá | | | | 15.74 | % | | | 10.77 | % | | | 2.99 | % | | | 2.25 | % | | | 2.31 | % | | | 2.36 | % | | | 140.48 | % | | | 132.71 | % | | | 20.69 | % | | | 19.13 | % |
| Davivienda | | | 13.13 | % | | | 12.32 | % | | | 1.79 | % | | | 1.7 | % | | | 3.27 | % | | | 3.07 | % | | | 158.03 | % | | | 165.29 | % | | | 17.52 | % | | | 12.9 | % | | | 15.73 | % | | | 14.43 | % | | | 1.92 | % | | | 1.83 | % | | | 2.39 | % | | | 2.74 | % | | | 176.02 | % | | | 160.39 | % | | | 14.20 | % | | | 12.96 | % |
| BBVA | | | 15.55 | % | | | 18.87 | % | | | 1.45 | % | | | 1.9 | % | | | 1.88 | % | | | 1.78 | % | | | 208.03 | % | | | 226.67 | % | | | 11.27 | % | | | 12.3 | % | | | 15.81 | % | | | 13.90 | % | | | 1.20 | % | | | 1.17 | % | | | 2.20 | % | | | 2.06 | % | | | 153.57 | % | | | 168.57 | % | | | 13.51 | % | | | 10.57 | % |
| Banco de Occidente | | | 14.69 | % | | | 14.56 | % | | | 2.16 | % | | | 2.1 | % | | | 2.33 | % | | | 2.23 | % | | | 172.08 | % | | | 193.81 | % | | | 11.15 | % | | | 10.6 | % | | | 12.49 | % | | | 29.56 | % | | | 1.50 | % | | | 3.94 | % | | | 2.72 | % | | | 2.79 | % | | | 135.43 | % | | | 143.51 | % | | | 11.30 | % | | | 12.32 | % |
| Banco Popular | | | 17.21 | % | | | 19.65 | % | | | 2.46 | % | | | 2.6 | % | | | 2.11 | % | | | 2.01 | % | | | 175.18 | % | | | 190.68 | % | | | 11.22 | % | | | 11.4 | % | | | 12.76 | % | | | 14.56 | % | | | 1.59 | % | | | 2.24 | % | | | 1.99 | % | | | 2.07 | % | | | 178.75 | % | | | 165.39 | % | | | 10.97 | % | | | 12.21 | % |
| Citibank | | | 12.35 | % | | | 10.08 | % | | | 2.33 | % | | | 1.8 | % | | | 4.34 | % | | | 3.01 | % | | | 127.30 | % | | | 153.77 | % | | | 16.94 | % | | | 16.3 | % | | | 15.25 | % | | | 14.76 | % | | | 2.24 | % | | | 2.26 | % | | | 2.71 | % | | | 2.98 | % | | | 166.91 | % | | | 160.80 | % | | | 11.82 | % | | | 13.50 | % |
Source: SFC.
| (1) | ROE is return on average stockholders’ equity. |
| (2) | ROA is return on average assets. |
In 2012, Bancolombia ranked first in Colombia and El Salvador in terms of amount of assets, deposits, stockholders’ equity and net income.
The following tables illustrate theBancolombia and its main competitor’s market share of Bancolombia on an unconsolidated basis and its main competitors with respect to various key products, based on figures published by the SFC for the years ended December 31, 2012, 20112015, 2014 and 2010:2013:
Total Net Loans
Market Share
| Total Net Loans – Market Share % | | 2012 | | | 2011 | | | 2010 | | |
| Total Net Loans – Market Share (%) | | | 2015 | | 2014 | | 2013 |
| | | | | | | | | | | | | | |
| Bancolombia | | | 23.05 | | | | 21.93 | | | | 21.66 | | | 22.69% | | 23.04% | | 22.65% |
| Banco de Bogotá | | | 13.71 | | | | 13.63 | | | | 14.10 | | | 13.78% | | 13.86% | | 13.76% |
| Davivienda | | | 12.39 | | | | 12.75 | | | | 13.09 | | | 13.82% | | 13.50% | | 12.98% |
| BBVA | | | 9.23 | | | | 9.44 | | | | 9.57 | | | 10.61% | | 10.29% | | 9.95% |
| Banco de Occidente | | | 7.33 | | | | 7.31 | | | | 7.40 | | | 7.31% | | 6.91% | | 7.45% |
| Banco Popular | | | 5.10 | | | | 5.11 | | | | 5.50 | | | 4.20% | | 4.32% | | 4.61% |
| Citibank | | | 2.45 | | | | 2.53 | | | | 2.78 | | | 1.96% | | 2.12% | | 2.20% |
Source:Source: Ratios are calculated by Bancolombia based on figures published by the SFC.
Checking Accounts
Market Share
Checking Accounts – Market Share
% | | 2012 | | | 2011 | | | 2010 | | |
| Checking Accounts – Market Share (%) | | | 2015 | | 2014 | | 2013 |
| | | | | | | | | | | | | | |
| Bancolombia | | | 24.00 | | | | 22.51 | | | | 22.87 | | | 25.28% | | 23.72% | | 25.16% |
| Banco de Bogotá | | | 19.50 | | | | 19.66 | | | | 18.06 | | | 19.23% | | 19.82% | | 18.79% |
| Banco de Occidente | | | 11.39 | | | | 12.77 | | | | 15.09 | | | 11.39% | | 11.51% | | 11.49% |
| BBVA | | | 9.14 | | | | 9.12 | | | | 9.68 | | | 9.73% | | 9.89% | | 10.03% |
| Davivienda | | | 8.96 | | | | 9.54 | | | | 9.42 | | | 9.94% | | 10.23% | | 9.76% |
| Banco Popular | | | 3.84 | | | | 4.13 | | | | 3.86 | | | 2.46% | | 2.68% | | 3.31% |
| Citibank | | | 3.15 | | | | 3.67 | | | | 2.74 | | | 4.23% | | 3.91% | | 3.13% |
Source: Ratios are calculated by Bancolombia based on figures published by the SFC.
Time Deposits
Market Share
| Time Deposits – Market Share % | | 2012 | | | 2011 | | | 2010 | | |
| Time Deposits – Market Share (%) | | | 2015 | | 2014 | | 2013 |
| | | | | | | | | | | | | | |
| Bancolombia | | | 18.22 | | | | 13.32 | | | | 13.92 | | | 15.23% | | 14.59% | | 17.93% |
| Banco de Bogotá | | | 14.36 | | | | 15.86 | | | | 14.57 | | | 14.67% | | 17.01% | | 14.61% |
| Davivienda | | | 10.00 | | | | 11.19 | | | | 14.71 | | | 13.53% | | 12.58% | | 12.35% |
| BBVA | | | 9.66 | | | | 7.66 | | | | 7.30 | | | 11.17% | | 12.11% | | 10.27% |
| Citibank | | | 2.67 | | | | 3.60 | | | | 4.34 | | | 1.05% | | 1.88% | | 2.00% |
| Banco Popular | | | 2.87 | | | | 3.77 | | | | 3.59 | | | 4.12% | | 2.16% | | 1.56% |
| Banco de Occidente | | | 5.18 | | | | 3.66 | | | | 3.65 | | | 4.51% | | 5.94% | | 5.09% |
Source: Ratios are calculated by Bancolombia based on figures from the SFC.
Saving Accounts
Market Share
| Saving Accounts – Market Share % | | 2012 | | | 2011 | | | 2010 | | |
| Saving Accounts – Market Share (%) | | | 2015 | | 2014 | | 2013 |
| | | | | | | | | | | | | | |
| Bancolombia | | | 22.92 | | | | 22.33 | | | | 20.78 | | | 22.70% | | 23.09% | | 22.95% |
| Banco de Bogotá | | | 14.39 | | | | 13.00 | | | | 14.95 | | | 13.14% | | 11.67% | | 14.09% |
| Davivienda | | | 12.23 | | | | 12.89 | | | | 11.26 | | | 12.37% | | 12.54% | | 11.35% |
| BBVA | | | 12.61 | | | | 11.69 | | | | 11.56 | | | 12.44% | | 11.86% | | 11.96% |
| Banco Popular | | | 5.37 | | | | 6.05 | | | | 7.12 | | | 4.64% | | 5.29% | | 6.48% |
| Banco de Occidente | | | 5.75 | | | | 5.94 | | | | 5.67 | | | 6.29% | | 6.67% | | 6.41% |
| Citibank | | | 2.18 | | | | 2.20 | | | | 3.65 | | | 3.12% | | 2.87% | | 2.49% |
Source: Ratios are calculated by Bancolombia based on figures from the SFC.
Description of the Salvadorian Financial System
As of December 31, 2012, the Salvadorian financial system was comprised of 13 institutions (10 commercial banks, 2 state-owned banks and 1 foreign bank).
The total assets of the Salvadorian financial system amounted to USD 13.3 billion in 2012, increasing 3.8% as compared to the previous year. As of December 31, 2012, loans represented 64.9% of total assets in the Salvadorian financial system, while investments represented 14.3% and cash and due from banks represented 13.9%. As of December 31, 2011, loans represented 63.7% of total assets in the Salvadorian financial system, while investments represented 15.0% and cash and due from banks represented 13.7%.
Banco Agrícola and its Competitors
In 2012,2015, Banco Agrícola continued to lead the Salvadorian financial system and ranked first in terms of assets, loans, deposits, stockholders equity and profits. The following table illustrates the market share for the main institutions of the Salvadorian financial system for the year endedend December 31, 2012:2015:
| | | | | | MARKET SHARE | | | | | | | | | | |
| | | Assets | | | Stockholders’ Equity | | | Loans | | | Deposits | | | Profits | |
| Banco Agrícola | | | 29.3 | % | | | 32.3 | % | | | 30.1 | % | | | 28.8 | % | | | 43.9 | % |
| Citibank | | | 15.0 | % | | | 19.2 | % | | | 13.1 | % | | | 15.0 | % | | | 12.3 | % |
| Davivienda | | | 14.9 | % | | | 15.7 | % | | | 14.4 | % | | | 14.1 | % | | | 8.0 | % |
| Scotiabank | | | 15.1 | % | | | 13.2 | % | | | 16.6 | % | | | 14.3 | % | | | 15.8 | % |
| BAC | | | 10.6 | % | | | 9.1 | % | | | 10.4 | % | | | 11.2 | % | | | 11.0 | % |
| Others | | | 15.1 | % | | | 10.5 | % | | | 15.4 | % | | | 16.6 | % | | | 9.1 | % |
MARKET SHARE
| | | Assets | | Stockholders` Equity | | Loans | | Deposits | | Profits |
| Banco Agrícola | | 27.9% | | 28.0% | | 28.4% | | 27.5% | | 46.6% |
| Citibank | | 10.8% | | 15.6% | | 9.4% | | 11.7% | | 3.1% |
| Davivienda | | 15.4% | | 14.2% | | 15.3% | | 13.9% | | 15.3% |
| Scotiabank | | 13.6% | | 14.3% | | 15.0% | | 13.1% | | 9.5% |
| BAC | | 12.4% | | 10.6% | | 12.2% | | 13.1% | | 12.9% |
| Others | | 19.9% | | 17.3% | | 19.7% | | 20.7% | | 12.6% |
Source: ABANSA (Asociación Bancaria Salvadoreña).
The following tables illustrate the market share of Banco Agrícola and its main competitors, with respect to various key products, based on figures published by the Salvadorian Banking Association (ABANSA) for the years ended in December 31, 2012, 20112015 and 2010:2014:
Total Loans
Market Share
| Total Loans – Market Share % | | 2012 | | | 2011 | | | 2010 | | |
| Total Loans - Market Share (%) | | | 2015 | | 2014 |
| Banco Agrícola | | | 30.1 | % | | | 29.7 | % | | | 30.4 | % | | 28.4% | | 28.7% |
| Citibank | | | 13.1 | % | | | 14.4 | % | | | 15.8 | % | | 9.4% | | 10.5% |
| Davivienda | | | 14.4 | % | | | 14.6 | % | | | 14.8 | % | | 15.3% | | 15.4% |
| Scotiabank | | | 16.6 | % | | | 17.1 | % | | | 17.2 | % | | 15.0% | | 15.1% |
| BAC | | | 10.4 | % | | | 9.9 | % | | | 9.5 | % | | 12.2% | | 11.9% |
| Others | | | 15.4 | % | | | 14.2 | % | | | 12.3 | % | | 19.7% | | 18.3% |
Source: Ratios are calculated by Banco Agrícola based on figures published by the Salvadorian Banking Association.
Checking Accounts
Market Share
| Checking Accounts – Market Share % | | 2012 | | | 2011 | | | 2010 | | |
| Checking Accounts - Market Share (%) | | | 2015 | | 2014 |
| Banco Agrícola | | | 23.9 | % | | | 24.2 | % | | | 27.6 | % | | 23.2% | | 23.1% |
| Citibank | | | 23.5 | % | | | 23.6 | % | | | 24.7 | % | | 19.3% | | 21.7% |
| Davivienda | | | 11.5 | % | | | 11.4 | % | | | 12.0 | % | | 11.5% | | 11.0% |
| Scotiabank | | | 9.1 | % | | | 10.5 | % | | | 10.5 | % | | 7.8% | | 7.4% |
| BAC | | | 16.2 | % | | | 15.6 | % | | | 14.3 | % | | 19.7% | | 18.0% |
| Others | | | 15.8 | % | | | 14.7 | % | | | 10.8 | % | | 18.5% | | 18.8% |
Source: Ratios are calculated by Banco Agrícola based on figures published by the Salvadorian Banking Association.
Time Deposits
Market Share
| Time Deposits – Market Share % | | 2012 | | | 2011 | | | 2010 | | |
| Time Deposits - Market Share (%) | | | 2015 | | 2014 |
| Banco Agrícola | | | 24.2 | % | | | 25.4 | % | | | 26.6 | % | | 22.3% | | 24.0% |
| Citibank | | | 8.2 | % | | | 11.2 | % | | | 12.6 | % | | 5.5% | | 5.8% |
| Davivienda | | | 15.1 | % | | | 16.8 | % | | | 16.5 | % | | 15.3% | | 14.6% |
| Scotiabank | | | 17.6 | % | | | 16.2 | % | | | 16.4 | % | | 16.7% | | 17.1% |
| BAC | | | 12.0 | % | | | 10.4 | % | | | 10.8 | % | | 10.8% | | 11.1% |
| Others | | | 23.0 | % | | | 20.0 | % | | | 17.1 | % | | 29.4% | | 27.4% |
Source: Ratios are calculated by Banco Agrícola based on figures published by the Salvadorian Banking Association.
Saving Accounts
Market Share
| Saving Accounts – Market Share % | | 2012 | | | 2011 | | | 2010 | | |
| Saving Account - Market Share (%) | | | 2015 | | 2014 |
| Banco Agrícola | | | 38.7 | % | | | 34.7 | % | | | 34.6 | % | | 39.1% | | 38.5% |
| Citibank | | | 15.7 | % | | | 19.9 | % | | | 20.8 | % | | 11.8% | | 12.8% |
| Davivienda | | | 15.1 | % | | | 15.2 | % | | | 15.7 | % | | 14.7% | | 14.4% |
| Scotiabank | | | 15.1 | % | | | 15.0 | % | | | 15.0 | % | | 13.9% | | 14.1% |
| BAC | | | 5.9 | % | | | 5.8 | % | | | 5.7 | % | | 8.9% | | 9.0% |
| Others | | | 9.5 | % | | | 9.4 | % | | | 8.2 | % | | 11.6% | | 11.1% |
Source: Ratios are calculated by Banco Agrícola based on figures published by the Salvadorian Banking Association.
Banistmo and its Competitors
Banistmo, a leading company in Panama; is the second largest bank in the country with 10.7% market share by loans. The following table illustrates the market share for the main institutions of the Panamanian financial system for the year ended in December 31, 2015:
MARKET SHARE
| | | Assets | | Equity | | Loans | | Deposits | | Profits |
| Banistmo | | 9.1% | | 9.3% | | 10.7% | | 12.2% | | 11.1% |
| Banco General | | 13.9% | | 10.2% | | 14.3% | | 19.7% | | 14.7% |
| Global Bank | | 5.9% | | 4.4% | | 7.8% | | 5.7% | | 5.0% |
| Banesco | | 4.1% | | 3.0% | | 4.3% | | 6.9% | | 4.0% |
| BAC | | 6.7% | | 22.7% | | 5.2% | | 5.9% | | 12.8% |
| Others | | 60.4% | | 50.4% | | 57.6% | | 49.5% | | 52.4% |
Source: Banistmo based on data by the Superintendency of Banks of Panama.
The following tables illustrate the market share of Banistmo and its main competitors, based on figures published by the Superintendency of Banks of Panama for the years ended in December 31, 2015 and 2014:
Total Loans
Market Share
| Total Loans - Market Share (%) | | 2015 | | 2014 |
| Banistmo | | 10.7% | | 11.1% |
| Banco General | | 14.3% | | 14.2% |
| Global Bank | | 7.8% | | 7.6% |
| Banesco | | 4.3% | | 4.0% |
| BAC | | 5.2% | | 5.6% |
| Others | | 57.6% | | 57.7% |
Source: Banistmo based on data by the Superintendency of Banks of Panama.
Saving Accounts
Market Share
| Saving Account - Market Share (%) | | 2015 | | 2014 |
| Banistmo | | 13.8% | | 13.5% |
| Banco General | | 24.4% | | 23.4% |
| Global Bank | | 5.4% | | 5.4% |
| Banesco | | 14.5% | | 15.3% |
| BAC | | 3.1% | | 3.2% |
| Others | | 38.7% | | 39.1% |
Source: Banistmo based on data by the Superintendency of Banks of Panama.
Checking Accounts
Market Share
| Checking Accounts - Market Share (%) | | 2015 | | 2014 |
| Banistmo | | 13.0% | | 13.4% |
| Banco General | | 22.8% | | 22.2% |
| Global Bank | | 3.9% | | 4.1% |
| Banesco | | 4.6% | | 3.9% |
| BAC | | 8.9% | | 8.1% |
| Others | | 46.9% | | 48.3% |
Source: Banistmo based on data by the Superintendency of Banks of Panama.
Time Deposits
Market Share
| Time Deposits - Market Share (%) | | 2015 | | 2014 |
| Banistmo | | 11.1% | | 10.7% |
| Banco General | | 16.5% | | 16.4% |
| Global Bank | | 6.6% | | 7.0% |
| Banesco | | 4.4% | | 4.0% |
| BAC | | 6.1% | | 6.5% |
| Others | | 55.4% | | 55.3% |
Source: Banistmo based on data by the Superintendency of Banks of Panama.
Banco Agromercantil de Guatemala, S.A. and its Competitors
In 2015, Banco Agromercantil maintained its position as the fourth-largest bank in Guatemala in terms of assets, loans, deposits and stockholders’ equity. The Guatemalan financial system has a total of 17 banks. The following table illustrates the market share for the main institutions of the financial system for the year ended in December 31, 2015:
MARKET SHARE
| | | Assets | | Stockholders’ Equity | | Loans | | Deposits | | Profits |
| Banco Industrial | | 28.1% | | 20.9% | | 27.1% | | 25.0% | | 29.0% |
| Banrural | | 20.1% | | 23.5% | | 21.4% | | 22.2% | | 26.4% |
| Banco G&T Continental | | 18.4% | | 15.4% | | 16.5% | | 18.3% | | 15.0% |
| Banco Agromercantil | | 8.6% | | 9.1% | | 10.6% | | 7.9% | | 7.4% |
| BAC-Reformador | | 6.8% | | 8.4% | | 8.1% | | 7.3% | | 1.4% |
| Bantrab | | 6.4% | | 6.6% | | 5.4% | | 6.9% | | 10.5% |
| Citibank | | 2.2% | | 4.5% | | 2.7% | | 2.3% | | 1.7% |
| Others* | | 9.4% | | 11.6% | | 8.2% | | 10.1% | | 8.6% |
Source: SIB(Superintendencia de Bancos de Guatemala).
The following tables illustrate the market share of Banco Agromercantil and its main competitors, based on figures published by the Superintendency of Banks of Guatemala for the years ended in December 31, 2015 and 2014:
Total Loans
Market Share
| Total Loans - Market Share (%) | | 2015 | | 2014 |
| Banco Industrial | | 27.1% | | 26.7% |
| Banrural | | 21.4% | | 21.1% |
| Banco G&T Continental | | 16.5% | | 16.4% |
| Banco Agromercantil | | 10.6% | | 10.7% |
| BAC-Reformador | | 8.1% | | 7.9% |
| Bantrab | | 5.4% | | 5.8% |
| Citibank | | 2.7% | | 3.0% |
| Others* | | 8.2% | | 8.4% |
Source: SIB(Superintendencia de Bancos de Guatemala).
Checking Accounts
Market Share
| Checking Accounts - Market Share (%) | | 2015 | | 2014 |
| Banco Industrial | | 31.2% | | 30.3% |
| Banrural | | 20.2% | | 22.0% |
| Banco G&T Continental | | 17.9% | | 17.7% |
| Banco Agromercantil | | 7.9% | | 7.9% |
| BAC-Reformador | | 10.0% | | 9.3% |
| Bantrab | | 1.3% | | 1.2% |
| Citibank | | 2.8% | | 3.8% |
| Others* | | 8.7% | | 7.8% |
Source: SIB(Superintendencia de Bancos de Guatemala).
Time Deposits
Market Share
| Time Deposits - Market Share (%) | | 2015 | | 2014 |
| Banco Industrial | | 19.9% | | 20.3% |
| Banrural | | 20.7% | | 18.1% |
| Banco G&T Continental | | 17.0% | | 19.3% |
| Banco Agromercantil | | 7.4% | | 8.3% |
| BAC-Reformador | | 6.0% | | 6.7% |
| Bantrab | | 13.2% | | 12.1% |
| Citibank | | 2.1% | | 1.2% |
| Others* | | 13.7% | | 14.0% |
Source: SIB(Superintendencia de Bancos de Guatemala).
Saving Accounts
Market Share
| Saving Account - Market Share (%) | | 2015 | | 2014 |
| Banco Industrial | | 24.6% | | 23.7% |
| Banrural | | 29.2% | | 29.8% |
| Banco G&T Continental | | 21.5% | | 20.9% |
| Banco Agromercantil | | 8.7% | | 9.2% |
| BAC-Reformador | | 5.3% | | 5.6% |
| Bantrab | | 3.8% | | 3.5% |
| Citibank | | 1.7% | | 2.0% |
| Others* | | 5.2% | | 5.3% |
* Others. Includes the followings banks: Internacional, Promerica, Crédito Hipotecario Nacional, Ficohsa, Azteca, Inmobiliario, De Antigua, Vivibanco, Citibank, N.A. de Guatemala, De Crédito.
| B.8. | SUPERVISION AND REGULATION |
Colombian Banking Regulators
Pursuant to Colombia’s Constitution, the Congress has the power to prescribe the general legal framework within which the Government may regulate the financial system. The agencies vested with the authority to regulate the financial system are the Boardboard of Directorsdirectors of the Central Bank, the Ministry of Finance and Public Credit (the “Ministry of Finance”), the SFC, the Superintendency of Industry and Commerce (the “SIC”) and the Self-Regulatory Organization ((Autoregulador del Mercado de Valores - AMV) (the “SRO”or “AMV”).
Central Bank
The Central Bank exercises the customary functions of a central bank, including price stabilization, monetary policy, regulation of currency circulation, regulation of credit, exchange rate monitoring and management of international reserves. Its board of directors is the regulatory authority for monetary, currency exchange and credit policies, and is responsible for the direction of the Central Bank’s duties. The Central Bank also acts as lender of last resort to financial institutions.
Ministry of Finance and Public Credit
One of the functions of the Ministry of Finance is to regulate all aspects of finance and insurance activities.
As part of its duties, the Ministry of Finance issues decrees relating to financial matters that may affect banking operations in Colombia. In particular, the Ministry of Finance is responsible for regulations relating to capital adequacy, risk limitations, authorized operations, disclosure of information and accounting of financial institutions.institutions on a high level, which matters are then regulated in detail by the SFC.
Superintendency of Finance
The SFC is the authority responsible for supervising and regulating financial institutions, including commercial banks such as the Bank, finance corporations, financing companies, financial services companies and insurance companies.companies, which require prior authorization of the SFC before commencing operations. Regulations issued by the SFC must comply with decrees issued by the Ministry of Finance. The SFC has broad discretionary powers to supervise financial institutions, including the authority to impose fines on financial institutions and their directors and officers for violations of applicable regulations. The SFC can also conduct on-site inspections of Colombian financial institutions.
The SFC is also responsible for monitoring and regulating the market for publicly traded securities in Colombia and for monitoring and supervising securities market participants, including the Colombian Stock Exchange, brokers, dealers, mutual funds and issuers.
Financial institutions must obtain the prior authorization of the SFC before commencing operations.
Violations of the financial system rules and regulations are subject to administrative and, in some cases, criminal sanctions.
Other Colombian regulators
Self-RegulatorySelf- Regulatory Organization
The Self-Regulatory OrganizationAMV is a private entity responsible for the regulation of entities participating in the Colombian capital markets. The Self-Regulatory OrganizationAMV may issue mandatory instructions to its members and supervise its members’ compliance and impose sanctions for violations.
All capital market intermediaries, including the Bank, must become members of the Self-Regulatory OrganizationAMV and are subject to its regulations.
Superintendency of Industry and Commerce
The SIC is the authority responsible for supervising and regulating competition in several industrial sectors, including financial institutions. The SIC is authorized to initiate administrative proceedings and impose sanctions on banks, including the Bank, whenever the financial entity behaves in a manner considered to be anti-competitive.
Regulatory Framework for Colombian Banking Institutions
The basic regulatory framework of the Colombian financial sector is set forth in Decree 663 of 1993, modified among others, by Law 510 of 1999, Law 546 of 1999, Law 795 of 2003 Law 964 of 2005 and Law 1328 of 2009, as well as in External Resolution 8 of 2000 (foreign exchange regulations) and Resolution 4 (as hereinafter defined) issued by the board of directors of the Central Bank. 2009.
Decree 663 of 1993 definesdefined the structure of the Colombian financial system and defines several forms of business entities, including: (i) credit institutions (establecimientos de crédito) (which are further categorized into banks, such as the Bank, finance corporations (corporaciones financieras), financing companies (compañias de financiamiento) and finance cooperatives (cooperativas financieras)); (ii) financial services entities (sociedades de servicios financieros); (iii) capitalization corporations (sociedades de capitalización); (iv) insurance companies (entidades aseguradoras); and (v) insurance intermediaries (intermediarios de seguros). Furthermore, Decree 663 of 1993 provides that no financial, banking or credit institution may operate in Colombia without the prior approval of the SFC. Additionally, Decree 2555 of 2010 compiled regulations that were dispersed in separate decrees, including regulations regarding capital adequacy and lending activities.
The main role of banks, finance corporations and financing companies is to receive deposits. Banks place funds back into circulation by means of loans or any active credit operation; finance corporations place funds into circulation by means of active credit operations or investments, with the purpose of promoting the creation or expansion of enterprises; and financing companies place funds back into circulation by means of active credit operations, with the purpose of fostering the sale of goods and services, including the development of leasing operations.
Law 510 of 1999 and Law 795 of 2003 substantially amended the powers of the SFC to control, regulate and supervise financial institutions. Law 510 of 1999 also streamlined the procedures for theFondo de Garantías de Instituciones Financieras (“Fogafin”), the agency that insures deposits in financial institutions and provides credit and support to troubled financial institutions. The main purpose of Law 510 of 1999 was to improveimproved the solvency standards and stability of Colombia’s financial institutions by providing rules for their incorporation and regulating permitted investments of credit institutions, insurance companies and investment companies.
Law 546 of 1999 was enacted to regulate the system of long-term home loans.
Law 795 of 2003 was enacted to broadenbroadened the scope of permitted activities thatfor financial institutions, can engage in, to update regulations with some of the then-latest principles of the Basel Committee and to increase the minimum capital requirements in order to incorporate a financial institution (for more information, see “Minimum Capital Requirements” below). Law 795 of 2003 also provided authority to the SFC to take preventive measures, consisting mainly of preventive interventions with respect to financial institutions whose capital falls below certain thresholds. For example, in order to avoid a temporary take-over by the SFC, such financial institutions must submit to the SFC a restructuring program to restore their financial condition.
Law 1328 of 2009 providesprovided a set of rights and responsibilities for customers of the financial system and a set of obligations for financial institutions in order to minimize disputes. This law also gives foreign banks more flexibility to operate in Colombia. Prior to Law 1328 of 2009, foreign banks were able to operate in Colombia by establishing a Colombian subsidiary authorized by the SFC. Following the enactment of Law 1328 of 2009, as of June 15, 2013, foreign banks will be permitted to operate through their “branches” and will not be required to incorporate a Colombian subsidiary. Law 1328 of 2009 also broadened the scope of permitted business activities by regulated entities.. Following its adoption, credit institutions were allowed to operate leasing businesses and banks were allowed to extend loans to third parties so that borrowers could acquire control of other companies. On September 6, 2011, the SFC issued External Regulation 039 of 2011 pursuant to which the SFC is empowered to regulate certain banking practices considered as abusive. The SFC issued the External Circular 038 of 2011 on September 6, 2011, with the purpose to set the necessary instructions that should be followed by the entities that are supervised by the SFC in regards to supplying financial consumers all the information they require in order to allow them to choose the best options in the market, according to their own needs.
On December 20, 2011 the Colombian Government issued Decree 4809 by means of which they: (i) defined the laws and principles that must be observed in the determination, diffusion and publicity of rates and prices of products and financial services, (ii) defined the maximum rate charged for the withdrawal of funds from ATM’s of other financial institutions, (iii) provided that should there be an increase in applicable rates within a standard form contract, the banks must inform the clients of that change within a minimum of 45 days, in which time the client will have the ability to reject the aforementioned increase and terminate the contractual relationship with the bank, (iv) imposed a prohibition on charging for unsuccessful transactions carried out through ATMs when there is no fault attributable to the client, and (v) established that transactions made via the Internet cannot be more expensive than those made via other available channels.
The SFC has authority to implement applicable regulations and, accordingly, issues from time to time administrative resolutions and circulars. By means of External Circular 007029 of 1996 (as amended),2014, the SFC compiled the rules and regulations applicable to financial institutions.institutions and other entities under its supervision. Likewise, by means of External Circular 100 of 1995 (the “Basic Accounting Circular”), it compiled all regulations applicable to the accounting rules and regulations.
TheFinancial institutions are subject to further rules if they engage in additional activities. Law 964 of 2005 (securities market law) regulates securities intermediation activities, which may be performed by banks, and securities offerings. External Resolution 8 of 2000 (foreign exchange control statute definesregulations), and Resolution 4 (as hereinafter defined) issued by the board of directors of the Central Bank, defined the different activities that banks, including the Bank, may perform as currency exchange intermediaries, including lending in foreign currencycurrencies and investment in foreign securities.
Additionally, Decree 2555 of 2010 compiled regulations that were dispersed in separate decrees, including regulations regarding securities market activities, capital adequacy requirements, principles in the determination, diffusion and publicity of rates and prices of products and financial services, and lending activities.
Violations of any of the above statutes and their relevant regulations are subject to administrative sanctions and, in some cases, criminal sanctions.
Key interest rates
Colombian commercial banks, finance corporations and consumer financing companies are required to provide the Central Bank, on a weekly basis, with data regarding the total volume (in pesos) of certificates of deposit issued during the prior week and the average interest rates paid for certificates of deposit with maturities of 90 days. Based on such reports, the Central Bank computes theTasa de Captaciones de Corporaciones Financieras (“TCC”) and theDepósitos a Término Fijo (“DTF”) rates,rate, which areis published at the beginning of the following week, for use in calculating interest rates payable by financial institutions. The TCC is the weighted average interest rate paid by finance corporations for deposits with maturities of 90 days. The DTF is the weighted average interest rate paid by finance corporations, commercial banks and consumer financing companies for certificates of deposit with maturities of 90 days. For the week of April 29, 2013,18, 2016, the DTF was 4.11% and the TCC was 4.24%6.49%.
Article 884 of the Colombian Commercial Code of Commerce provides for a limit on the amount of interest that may be charged in commercial transactions. The limit is 1.5 times the current banking interest rate, orInterés Bancario Corriente, calculated as the average of the interest ordinarily charged by banks within a set period of time. The current banking interest rate for small business loans and for all other loans is certified by the SFC. As of December 31, 2012,2015, the banking interest rate for small business loans was 35.63%35.42% and for all other loans was 20.89%19.33%.
Capital adequacy requirements
Capital adequacy requirements for Colombian financial institutions (as set forth in Decree 2555 of 2010, as amended) are based on applicable Basel Committee standards. Decree 2555 of 2010 establishes four categories of assets, which are each assigned different risk weights, and requires that a credit institution’s Technical Capital (as defined below) be at least 9% of that institution’s total risk-weighted assets. As of the date of this Annual Report, the Technical Capital for the purposes of the regulations consists of the sum of Tier One Capital (basic capital) and Tier Two Capital (additional capital) (Tier One Capital and Tier Two Capital, collectively, “Technical Capital”). Tier Two Capital may not exceed the total amount of Tier One Capital.
However, on August 23, 2012 the Ministry of Finance issued a new regulation (Decree 1771 of 2012) amending the capital adequacy requirements set forth in Decree 2555. Under this new regulation, financial institutions (such as the Bank) will remain subject to the capital adequacy requirements previously in place until August 1, 2013. Some of the highlights of this new regulation are:are as follows:
| · | As of August 1, 2013, theThe technical capital will beis calculated as the sum of Ordinary Basic Capital (common equity tier one)Tier I), Additional Basic Capital (additional tier one)Tier I), and Additional Capital (tier two(Tier II capital). |
| · | New criteriaCriteria for debt and equity instruments to be considered ordinary basic capital, additional basic capital, and additional capital waswere established. Additionally, the SFC must review whether a given instrument adequately complies with these criteria in order for an instrument to be considered tier oneTier I or tier twoTier II capital, upon request of the issuer. Debt and equity instruments that have not been classified by the SFC as basic or additional capital willare not be considered tier oneTier I or tier twoTier II capital for purposes of capital adequacy requirements. |
| · | The total solvency ratio remainsis set at a minimum of 9% of the financial institution’s total risk-weighted assets; however, as of August 1, 2013, each entity must also comply with a minimum basic solvency ratio of 4.5%, which is defined as the Ordinary Basic Capitalordinary basic capital after deductions divided by the financial institution’s total risk-weighted assets. |
The following chart includes a summaryIn 2014, the Ministry of the items that areFinance issued Decree 1648 of 2014 which establishes criteria for hybrid instruments to be considered in the definition of the Technical Capital as set forth in Decree 2555 of 2010, as amended:
Current Definition of Technical Capital
Basic Capital
|
• | Outstanding and paid-in capital stock. |
• | Legal and other reserves. |
• | Profits retained from previous fiscal years. |
• | Net positive result of the cumulative translation adjustment account. |
• | The total value of the revaluation of equity account (revalorización del patrimonio) (if positive) and of the foreign currency translation adjustment account (ajuste por conversion de estados financieros). |
• | Current fiscal year profits in a proportion equal to the percentage of prior fiscal year profits that were capitalized, or allocated to increase the legal reserve, or all profits that must be used to cover accrued losses. |
• | Shares held as a guarantee by Fogafin when the entity is in compliance with the recovery program aimed at bringing the bank back into compliance with capital adequacy requirements. |
• | Subordinated bonds held by Fogafin when they comply with certain requirements stated in the regulations. |
• | Non-controlling interests registered in the consolidated financial statements. |
• | The total value of paid-in stock dividends. |
• | The part of the surplus capital account from donations that complies with the requirements set forth in the applicable regulation. |
New Definition of Technical Capital (Effective August 1, 2013) |
Ordinary Basic Capital |
• | Ordinary Basic Capital |
• | Outstanding and paid-in capital stock classified as Ordinary Basic Capital by the SFC subject to the conditions set forth in the regulation. |
• | Legal reserves. |
• | Shares held as a guarantee by Fogafin when the entity is in compliance with a recovery program aimed at bringing the financial entity back into compliance with capital adequacy requirements. |
• | Non-controlling interests registered in the consolidated financial statements, subject to the conditions set forth in the regulations. |
• | The value of paid-in stock dividends when the relevant class of stock has been classified as part of the Ordinary Basic Capital by the SFC. |
• | Capital surplus. |
• | Irrevocable donations. |
• | Net positive result of the cumulative translation adjustment account. |
• | Capital stock paid in prior to its issuance by the entity, provided, however, that the stock remains unissued for a maximum term of four (4) months. After such time frame, it will no longer be considered ordinaryadditional basic capital. |
• | Subordinated bonds held by Fogafin when they comply with certain requirements stated in the regulations. |
• | Any other financial instrument issued by the entity and held by Fogafin, when the subscription is intended to strengthen the financial condition of the financial entity. |
Deductions from Basic Capital |
• | Any prior or current period losses. |
• | The total value of the capital revaluation account (revalorización del patrimonio) (if negative). |
• | Accumulated inflation adjustments on non-monetary assets (provided that the respective assets have not been transferred). |
• | Investments in shares, mandatory convertible bonds, subordinated bonds that may be convertible into shares or subordinated debt instruments issued by other entities (excluding subsidiaries) subject to the supervision of the SFC, excluding appraisals and investments in Finagro credit establishments and investments undertaken pursuant to Article 63 of Decree 663 of 1993, subject to the conditions set forth in the regulation. |
• | Investments in shares, mandatory convertible bonds, subordinated bonds that may be convertible into shares or subordinated debt instruments issued by foreign financial institutions where the investor directly or indirectly holds at least 20% of the capital of said institution (excluding subsidiaries). This amount includes cumulative translation adjustments and excludes appraisals. |
Deductions from Ordinary Basic Capital |
• | Any prior or current period losses. |
• | Investments in shares, mandatory convertible bonds, subordinated bonds that may be convertible into shares or subordinated debt instruments issued by other Colombian or foreign financial institutions (excluding subsidiaries), including cumulative translation adjustments and excluding appraisals, subject to the conditions set forth in the regulation. |
• | Deferred income taxes, if positive. |
• | Intangible assets registered after August 23, 2012. |
• | Reacquired stock, subject to the conditions set forth in the regulations. |
• | Unamortized amount of the actuarial calculation of the pension obligations of the entity. |
| |
Additional Basic Capital |
• | Outstanding and paid-in capital stock classified as Additional Basic Capital by the SFC subject to the conditions set forth in the regulation. |
• | The value of paid-in stock dividends when the relevant class of stock has been classified as part of the Additional Basic Capital by the SFC. |
• | Non-controlling interests registered in the consolidated financial statements, subject to the conditions set forth in the regulation. |
Additional Capital |
• | Fifty percent (50%) of the accumulated inflation adjustment of non-monetary assets (provided that such assets have not been disposed of). |
• | Fifty percent (50%) of asset reappraisal (excluding revaluations of foreclosed assets or assets received as payment of credits). |
• | Mandatory convertible bonds effectively subscribed and paid, with maturities of up to 5 years, provided that the terms and conditions of their issuance were approved by the SFC and subject to the conditions set forth by the SFC. |
• | Subordinated payment obligations as long as said obligations do not exceed 50% of Tier One Capital and comply with additional requirements stated in the regulations. |
• | The part of the surplus capital account from donations that complies with the requirements set forth in the applicable regulation. |
• | General allowances made in accordance with the instructions issued by the SFC. |
Additional Capital |
• | Fifty percent (50%) of the reappraisal or unrealized profits derived from investments in equity and debt instruments with high or medium trading volumes, subject to conditions set forth in the regulation. |
• | Mandatory convertible bonds effectively subscribed and paid, subject to the conditions set forth in the regulation. |
• | Subordinated payment obligations that the SFC classifies as part of the Additional Capital. |
• | Current period profits, in the amount that the shareholders irrevocably resolve to capitalize or assign to increase the legal reserves once the fiscal year is ended, subject to approval by the SFC. |
• | Voluntary reserves (reservas ocasionales) with more than five years in the balance sheet and up to an amount no greater than ten percent (10%) of the Technical Capital of the entity. |
• | Non-controlling interests registered in the consolidated financial statements, subject to the conditions set forth in the regulation. |
• | Fifty percent (50%) of the tax reserve, as defined by law. |
• | Thirty percent (30%) of the reappraisal or unrealized profits derived from investments in equity instruments with low or non-existing trading volumes, or not listed in trading platforms, subject to an appraisal by an independent expert, according to the regulations expected to be issued by the SFC, and to conditions set forth in the regulation. |
• | The value of the general provisions made by the financial entity, in an amount no greater than 1.25% of the risk-weighted assets. |
Deductions from Additional Capital |
• | 50% of the direct or indirect capital investments (in entities subject to the supervision of the SFC, excluding subsidiaries) and mandatory convertible bonds reappraisal that complies with the requirements set forth in the applicable regulation. |
• | 50% of the direct or indirect capital investments (excluding subsidiaries) and mandatory convertible bonds reappraisal of foreign financial entities with respect to which the bank’s share is or exceeds 20% of the entity’s subscribed capital. |
• | The value of the devaluation of equity investments with low exchange volume or which are unquoted. |
The following table sets forth certain information regarding the Bank’s consolidated capital adequacy as of December 31, 2012 and 2011:(Additional Tier I).
| | | As of December 31, 2012 | | | As of December 31, 2011 | |
| | | (In millions of COP, except percentages) | |
| Long-term senior indebtedness | | COP | 7,674,213 | | | COP | 7,866,678 | |
| | | | | | | | | |
| Subscribed capital | | | 425,914 | | | | 393,914 | |
| Legal reserve and other reserves | | | 7,413,379 | | | | 5,145,404 | |
| Unappropriated retained earnings | | | 1,348,530 | | | | 1,143,158 | |
| Minority interest | | | 81,394 | | | | 73,455 | |
| Net Income | | | - | | | | 421,964 | |
| Less: | | | | | | | | |
| Long-term investments | | | (147,267 | ) | | | (145,238 | ) |
| Non-monetary inflation adjustment | | | (51,463 | ) | | | (53,631 | ) |
| Primary capital (Tier I) | | COP | 9,070,487 | | | COP | 6,979,026 | |
| Provisions for loans | | | 62,129 | | | | 50,910 | |
| Subordinated bonds | | | 4,385,006 | | | | 2,442,305 | |
| Reappraisal of assets | | | 216,642 | | | | 171,388 | |
| Non-monetary inflation adjustment | | | 30,426 | | | | 31,509 | |
| Computed secondary capital (Tier II) | | | 4,694,203 | | | | 2,696,112 | |
| Technical Capital | | COP | 13,764,690 | | | COP | 9,675,138 | |
| | | | | | | | | |
| Capital Ratios | | | | | | | | |
| Primary capital to risk-weighted assets (Tier I) | | | 10.39 | % | | | 8.99 | % |
| Secondary capital to risk-weighted assets (Tier II) | | | 5.38 | % | | | 3.47 | % |
| | | | | | | | | |
| Risk-weighted assets including market risk | | | 87,262,916 | | | | 77,651,096 | |
| Technical capital to risk-weighted assets | | | 15.77 | % | | | 12.46 | % |
As of December 31, 2012,2015, the Bank’s technical capital ratio was 15.77%12.46%, exceeding the requirements of the Colombian Governmentgovernment and the SFC by 677346 basis points. As of December 31, 2011,2014, the Bank’s technical capital ratio was 12.46%13.29%. Despite the rapid growth in the Bank’s loan portfolio during 2012, the increase in the capital adequacy ratio is explained by the issuance of subordinated bonds and shares in 2012 by Bancolombia S.A.
If the new requirements had been applied to the consolidated balance sheet of the BankFor more information, see “Item 5. Operating and its subsidiaries as of December 31, 2012,Financial Review and excluding the impact of the agreements for the acquisition of an interest in Banco AgromercatilProspects - “BAM”B1 Liquidity and HSBC Bank (Panama),the measures adopted by Bancolombia’s subsidiaries during 2013, and any additional changes the Bank may make in the future to its businesses or structure as a result of implementing the new rules, the Bank’s preliminary estimate is that its consolidated capital adequacy ratio (Tier I plus Tier II) would have been 12.22%, compared with a minimum requirement of 9%, and that its consolidated BasicFunding. Capital ratio (basic ordinary capital net of deductions divided by risk weighted assets) would have been 7.00%, compared with a minimum requirement of 4.5%. The preliminary estimates given above are based on the Bank’s current understanding of the new regulations, and the Bank continues to analyze the impact of these new regulations on its business.
The following table sets forth a reconciliation of the differences between the current consolidated capital adequacy and the consolidated capital adequacy measure under the new definition provided by Decree 1771 as of December 31, 2012:
| | | As of December 31, 2012 | | | | | | As of December 31, 2012 | |
| | | (In millions of COP, except percentages) | |
| | | Current Definition of Technical
Capital | | | Adjustments | | | New Definition of Technical
Capital (Effective August 1, 2013) | |
| Long-term senior indebtedness | | COP | 7,674,213 | | | COP | - | | | COP | 7,674,213 | |
| | | | | | | | | | | | | |
| Subscribed capital | | | 425,914 | | | | | | | | 425,914 | |
| Legal reserve and other reserves | | | 7,413,379 | | | | (1,604,916) (1) | | | | 5,808,463 | |
| Unappropriated retained earnings | | | 1,348,530 | | | | (1,346,346)(2) | | | | 2,184 | |
| Minority interest | | | 81,394 | | | | - | | | | 81,394 | |
| | | | | | | | | | | | | |
| Net Income | | | - | | | | - | | | | - | |
| Less: | | | | | | | - | | | | | |
| Long-term investments | | | (147,267 | ) | | | - | | | | (147,267 | ) |
| Intangibles assets acquired after August 23, 2012 | | | - | | | | (20,944)(3) | | | | (20,944 | ) |
| Treasury stock | | | - | | | | (36,570)(4) | | | | (36,570 | ) |
| Non-monetary inflation adjustment | | | (51,463 | ) | | | 51,463(5) | | | | - | |
| Primary capital (Tier I) | | COP | 9,070,487 | | | | (2,957,313 | ) | | COP | 6,113,174 | |
| Provisions for loans | | | 62,129 | | | | - | | | | 62,129 | |
| Subordinated bonds | | | 4,385,006 | | | | - | | | | 4,385,006 | |
| Reappraisal of assets | | | 216,642 | | | | (211,805)(6) | | | | 4,837 | |
| Non-monetary inflation adjustment | | | 30,426 | | | | (30,426)(6) | | | | - | |
| Tax reserve | | | | | | | 105,440(5) | | | | 105,440 | |
| Computed secondary capital (Tier II) | | | 4,694,203 | | | | (136,791 | ) | | | 4,557,412 | |
| Technical Capital | | COP | 13,764,690 | | | COP | (3,094,104) | | | COP | 10,670,586 | |
| | | | | | | | | | | | | |
| Capital Ratios | | | | | | | | | | | | |
| Primary capital to risk-weighted assets (Tier I) | | | 10.39% | | | | (3.39)% | | | | 7.00% | |
| Secondary capital to risk-weighted assets (Tier II) | | | 5.38% | | | | (0.16)% | | | | 5.22% | |
| | | | | | | | | | | | | |
| Risk weighted assets including market risk | | | 87,262,916 | | | | (20,944)(3) | | | | 87,241,972 | |
| Technical capital to risk-weighted assets | | | 15.77% | | | | (3.55)% | | | | 12.22% | |
_______________________
| (1) | The decrease is due to the treatment of voluntary reserves and the total value of the revaluation of equity account (revalorización del patrimonio), which are no longer part of the computation of Ordinary Basic Capital (“OBC”) under the new Definition of Technical Capital. |
| (2) | The decrease is due to the treatment of retained earnings from previous fiscal years, which are no longer part of the computation of OBC under the new Definition of Technical Capital. |
| (3) | Corresponds to the goodwill recognized under Colombian GAAP for the acquisition of Uff Móvil, which is not computed as Risk weighted assets under new definition provided by Decree 1771. |
| (4) | Under new regulation the Treasury stock that is subject to the conditions set forth in the regulations is deducted from OBC. |
| (5) | Under new regulation the Accumulated inflation adjustments on non-monetary assets is not deducted from the OBC. |
| (6) | Decreased in Computed secondary capital (Tier II) of COP 136,791; mostly due to net effect of the withdrawal of the 50% of the accumulated inflation adjustment of non-monetary assets and of the 50% reappraisal of asset and the addition of the 50% of the tax reserve (as defined by law). |
Our calculation of our Tier 1 and Tier 2 capital ratios under the new capital regulations as of December 31, 2012 are considered to be non-GAAP financial measures, and other entities may calculate these ratios differently. Since analysts and banking regulators may assess Bancolombia’s capital adequacy using the framework of the new rules, Bancolombia believes that it is useful to provide investors information enabling them to assess Bancolombia’s capital adequacy on the same basis.
In order to improve the consolidated capital adequacy ratio of Bancolombia, some of its subsidiaries implemented a series of measures, including:
| · | On February 27, 2013 Valores Bancolombia approved a capitalization of certain reserves and profits for an amount of COP 35,981 million. |
| · | On February 27, 2013, Leasing Bancolombia approved a capitalization of profits for an amount of COP 126,273 million and made an irrevocable commitment to increase the legal reserve with an amount equal to 10% of the net profits of fiscal year 2013. |
| · | On February 28, 2013, Banca de Inversion approved a capitalization of certain reserves and profits for an amount of COP 39,216 million. |
| · | On March 1, 2013, Tuya S.A. Compañía de Financiamiento made an irrevocable commitment to increase the legal reserve in an amount equal to 10% of the net profits of fiscal year 2013. |
| · | On April 2, 2013, Bancolombia Puerto Rico Internacional Inc. allocated a portion of 2012 profits and other retained earnings for the creation of a voluntary reserve account, intended to cover for potential future losses or to make future capitalizations in the amount of USD 71.5 million. |
| · | On March 21, 2013, Banagrícola allocated certain reserves for an amount of USD 376.8 million to create a new voluntary reserve account, intended to cover for potential future losses or to make future capitalizations for an amount of appropriated from other reserve accounts. The restricted reserve will remain in place for a minimum of five years. |
| · | On April 2, 2013, Bancolombia Panama, allocated USD 633 million from 2012 profits and retained earnings to increase its capital reserve. |
The implemented measures were adopted considering the impact on the consolidated capital adequacy ratio of Bancolombia; however, these measures did not affect the individual capital or solvency ratios applicable to each subsidiary. Each subsidiary is in compliance with the current regulatory ratios applicable in each jurisdiction.
Minimum Capital RequirementsAdequacy”
The minimum capital requirement for banks on an unconsolidated basis is established in Article 80 of Decree 633 of 1993, as amended.1993. The minimum capital requirement for 2012banks, including Bancolombia S.A., for 2015 is COP 73,75079,835 million. Failure to meet such requirement can result in the Takingtaking of Possessionpossession (toma de posesión) of the Bank by the SFC (see “Colombian Banking Regulations — Bankruptcy“Bankruptcy Considerations”).
Capital Investment Limit
For entities incorporated in Colombia, all investments in subsidiaries and other authorized capital investments, other thanexcluding those made in order to abide by legal requirements may not exceed 100% of the total aggregate of capital, equity reserves and the equity re-adjustment account of the respective bank, financial corporation or commercial finance company excluding unadjusted fixed assets and including deductions for accumulated losses.
Mandatory Investments
Central Bank regulations require financial institutions, including the Bank, to hold minimum mandatory investments in the debt securities issued by Fondo para el Financiamiento del Sector Agropecuario (“Finagro”), a Colombian public financial institution that finances production and rural activities to support the agricultural sector. The amount of these mandatory investments is calculated by applying a fixed percentage (ranging from 4% to 7%, depending on the type of liability) to the quarterly average of the end of day balances of certain liabilities, primarily, deposits and short-term debt. The investment balance is computed at the end of each quarter. Any required adjustment (due to a change in the quarterly average between periods) results in the purchase of additional securities or may result in the optional redemption at par of securities in excess of the requirement. The purchase of additional securities takes place during the month following the date as of which the computation was performed.
Foreign Currency Position Requirements
According to External Resolution 49 of 20072013 issued by the board of directors of the Central Bank as amended or suppplemented (“Resolution 4”9”), a financial institution’s foreign currency position (posición propia en moneda extranjera) is the difference between such institution’s foreign currency-denominated assets and liabilities (including any off-balance sheet items), madeactual or contingent, including those that may be sold inconverted into Colombian legal currency.
Resolution 49 provides that the average of a bank’s foreign currency position for three business days cannot exceed the equivalent in pesos of 20% of the bank’s Technical Capital.technical capital. Currency exchange intermediaries such as the Bank are permitted to hold a three business days’ average negative foreign currency position not exceeding the equivalent in foreign currency of 5% of its Technical Capitaltechnical capital (with penalties being payable after the first business day).
Resolution 49 also defines the foreign currency position in cash (posición propia decontado en moneda extranjera) as the difference between all foreign currency-denominated assets and liabilities. A bank’s three business days average foreign currency position in cash cannot exceed 50% of the bank’s Technical Capital.technical capital. In accordance with Resolution 4,9, the three-daythree business days’ average must be calculated on a daily basis and the foreign currency position in cash cannotcan be negative.negative as long as it does not exceed 20% of the bank’s technical capital.
Finally, Resolution 49 requires banks to comply with a gross position of leverage (posición bruta de apalancamiento). as it relates to its foreign currency position. Gross position of leverage is defined as (i) the value of term contracts denominated in foreign currency, plus (ii) the value of transactions denominated in foreign currency to be settled within two days in cash, plus (iii) the value of the exchange rate risk exposure associated with exchange rate options and derivatives. According to Resolution 4 sets a limit on9 the three business days’ average of the gross position of leverage which cannot exceed 550% of the Technical Capital.technical capital.
Reserve Requirements
Reserve Requirements
Commercial banksCredit institutions are required by the board of directors of the Central Bank to satisfy reserve requirements with respect to deposits and other cash demands. Such reservesdemands which are held by the Central Bank in the form of cash deposits. According to Resolution 11 of 2008 issued by the board of directors of the Central Bank, as amended, the reserve requirements for Colombian banks are measured bi-weekly and the amounts dependamount depends on the class of deposits.
Credit institutions must maintain reserves of 11% over the followingprivate demand deposits, government demand deposits, other deposits and cash demands:
| · | Private demandliabilities and savings deposits; |
| · | Government demand deposits; |
| · | Other deposits and liabilities; and |
In addition, credit institutions must maintain reserves of 4.5% forover term deposits with maturities fewer than 540 days and 0% forover term deposits with maturities ofequal to or more than 540 days.
Credit institutions may maintain these reserves in their accounts at the Central Bank.
Marginal reserve requirements were eliminated by the Central Bank in 2008.
Foreign Currency Loans
ResidentsAccording to External Resolution 8 of 2000, residents of Colombia may obtain foreign currency loans from foreign residents, and from Colombian currency exchange intermediaries (such as the Bank) or by placing debt securities abroad. Foreign currency loans must be either disbursed through a foreign exchange intermediary or deposited in special purpose offshore compensation accounts.
According to regulations issued by the Central Bank, every Colombian resident and institution borrowingresidents who borrow funds in foreign currency isare generally required to post with the Central Bank non-interest bearing deposits for a specified term, although the size of the required deposit is currently zero.
Notwithstanding the foregoing, such Such deposits would not be required in certain cases, established in article 26 of External Resolution 8 of 2000, including in the case of foreign currency loans aimed at financing Colombian investments abroad, or for short-term exportation loans, provided that such loan isthese loans are disbursed against the funds of Banco de Comercio Exterior -– Bancoldex. Moreover, Article 59-1(c) of
External Resolution 8 of 2000 sets forth a number of restrictions and limitations as to the use of proceeds in the case of foreign currency loans obtained by Colombian currency exchange intermediaries (including the Bank) and also provides that deposits would not be required in the event such restrictions and limitations are observed.order to avoid deposits. Such foreign currency loans may be used, among others, for lending activities in a foreign currency with a tenor equal to, or shorter than, the tenor of the foreign financing.
Finally, pursuant to Law 9 of 1991, the board of directors of the Central Bank is entitled to impose conditions and limitations on the incurrence of foreign currency indebtedness, as an exchange control policy, in order to avoid pressure in the currency exchange market.
Non-Performing Loan Allowance
The SFC maintains guidelinesrules on non-performing loan allowances for financial institutions. These rules apply for Bancolombia’s financial statements on a stand-alone basis for Colombian regulatory purposes. Non-performing loan allowances in the Consolidated Financial Statements are calculated according to IFRS.
Lending Activities
Decree 2555 of 2010, as amended, sets forth the maximum amounts that a financial institution may lend to a single borrower (including for this purpose all related fees, expenses and charges). These maximum amounts may not exceed 10% of a bank’s Technical Capital. However, there are several circumstances under which the limit may be raised. In general, the limit is raised to 25% when amounts lent above 5% of Technical Capital are secured by guarantees that comply with the financial guidelines provided in Decree 2555 of 2010, as amended. Also, according to Decree 2555 of 2010, a bank may not make loans to any shareholder that holds directly more than 10% of its capital stock for one year after such shareholder reaches the 10% threshold. In no event may a loan to a shareholder holding directly or indirectly 20% or more of the Bank’s capital stock exceed 20% of the Bank’s Technical Capital. In addition, no loan to a single financial institution may exceed 30% of the Bank’s Technical Capital, with the exception of loans funded by Colombian development banks which are not subject to such limit.
Also, Decree 2555 of 2010 also sets a maximum limit for risk concentrated in one single party, equivalent toof 30% of the Bank’s Technical Capital,technical capital for single-party risk, the calculation of which includes loans, leasing operations and equity and debt investments.
The Central Bank also has the authority to establish maximum limits on the interest rates that commercial banks and other financial institutions may charge on loans. However, interest rates must also be consistent with market terms with a maximum limit certified by the SFC.
Ownership and Management Restrictions
The Bank is organized as a stock company (sociedad anónima). Its corporate existence is subject to the rules applicable to commercial companies, principally the Colombian Commerce Code. The Colombian CommerceCommercial Code which requires stock companies (such as the Bank) to have at leasta minimum of five shareholders at all times and provides that no single shareholder may own 95% or more of the Bank’s subscribed capital stock. Article 262 of the Colombian Commerce Code prohibits the Bank’s subsidiaries from acquiring the stock of the Bank.
Pursuant to Decree 663 of 1993, as amended, any transaction resulting in an individual or entity holding 10% or more of any class of capital stockthe outstanding shares of any Colombian financial institution, including, in the case of the Bank, transactions resulting in holding ADRs representing 10% or more of the outstanding stockshares of the Bank, is subject to the prior authorization of the SFC. For that purpose, the SFC must evaluate the proposed transaction based on the criteria and guidelines specified in Decree 663 of 1993. Transactions entered into without the prior approval of the SFC are null and void and cannot be recorded in the institution’s stock ledger. These restrictions apply equally to national as well asColombian and foreign investors.
Bankruptcy Considerations
Pursuant to Colombian banking law, the SFC has the power to intervene in the operations of a bank in order to prevent it from, or to control and reduce the effects of, a bank failure. Accordingly,Additionally, the SFC also conducts periodic visits to financial institutions and may impose capital or solvency obligations on financial institutions without taking control.
The SFC may intervene in a bank’s business,business: (i) prior to the liquidation of the bank, by taking one of the following preventive measures (institutos de salvamento) in order to prevent the bank from entering into a state where the SFC would need to take possession:possession by taking one of the following recovery measures (institutos de salvamento): (a) submitsubmitting the bank to a special supervision regime; (b) issueissuing a mandatory order to recapitalize the bank; (c) placeplacing the bank under the management of another authorized financial institution, acting as trustee; (d) orderordering the transfer of all or part of the assets, liabilities and contracts as well as certain on-going concerns (establecimientos de comercio) of the bank to another financial institution; (e) orderordering the bank to merge with one or more financial institutions that consent to the merger, whether by creating a new institution or by having another institution absorb the bank;merger; (f) orderordering the adoption of a recovery plan by the bank including adequate measures to reestablish its financial situation, pursuant to guidelines approved by the Government;government; (g) orderordering the exclusion of certain assets and liabilities by requiring the transfer of such assets and liabilities to another institution designated by the SFC; andor (h) orderordering the progressive unwinding (desmonte progresivo) of the operations of the bank; or (ii) at any time, by taking possession of the bank (toma de posesión) (“Taking of Possession”) to either administer the bank or order its liquidation, depending on how critical the situation is found to be by the SFC.
The following grounds for a Takingtaking of Possessionpossession are considered to be “automatic” in the sense that, if the SFC discovers their existence, the SFC must step in and take over the respective financial institution: (i) if the financial institution’s Technical Capital (patrimonio adecuado) falls below 40% of the legal minimum,minimum; or (ii) upon the expiration of the term of any then-current recovery plans or the non-fulfillment of the goals set forth in such plans. Additionally, the SFC also conducts periodic visits to financial institutions and, as a consequence of these visits, the SFC can impose capital or solvency obligations on financial institutions without taking control of the financial institution.
Additionally, and subject to the approval of the Ministry of Finance the SFC may, at its discretion, initiate intervention procedures under the following circumstances: (i) suspension of payments; (ii) failure to pay deposits; (iii) refusal to submit its files, accounts and supporting documentation for inspection by the SFC; (iv) refusal to be interrogated under oath regarding its business; (v) repeated failure to comply with orders and instructions from the SFC; (vi) repeated violations of applicable laws and regulations or of the bank’s by-laws; (vii) unauthorized or fraudulent management of the bank’s business; (viii) reduction of the bank’s net worth below 50% of its subscribed capital; (ix) existence of serious inconsistencies in the information provided to the SFC that, at its discretion, impedes to accurately understand of the situation of the bank; (x) failure to comply with the minimum capital requirements set forth in Decree 663 of 1993; (xi) failure to comply with the recovery plans that were adopted by the bank; (xii) failure to comply with the order of exclusion of certain assets and liabilities to another institution designated by the SFC; and (xiii) failure to comply with the order of progressive unwinding (desmonte progresivo) of the operations of the bank.
The SFC may decide to order the Taking of Possession subject to the prior opinion of its advisory council (Consejo Asesor del Superintendente), the SFC may, at its discretion, initiate intervention procedures against a bank under the following circumstances: (i) suspension of payments; (ii) failure to pay deposits; (iii) refusal to submit its files, accounts and supporting documentation for inspection by the SFC; (iv) refusal to be interrogated under oath regarding its business; (v) repeated failure to comply with orders and instructions from the SFC; (vi) repeated violations of applicable laws and regulations or of the bank’s by-laws; (vii) unauthorized or fraudulent management of the bank’s business; (viii) reduction of the bank’s net worth below 50% of its subscribed capital; (ix) existence of serious inconsistencies in the information provided to the SFC that, at its discretion, impedes the SFC to accurately understand the situation of the bank; (x) failure to comply with the prior approvalminimum capital requirements set forth in Decree 663 of 1993; (xi) failure to comply with the recovery plans that were adopted by the bank; (xii) failure to comply with the order of exclusion of certain assets and liabilities to another institution designated by the SFC; and (xiii) failure to comply with the order of progressive unwinding (desmonte progresivo) of the Ministryoperations of Finance.the bank.
The purpose of Taking of Possession of a bank is to decide whether the entity should be liquidated, whether it is possible to place it in a position to continue doing business in the ordinary course, or whether other measures may be adopted to secure better conditions so that depositors, creditors and investors may obtain the full or partial payment of their credits.
Within two months (extendible for two additional months) from the date whenin which the SFC takes possession of a bank, the SFC must decide which of the aforementioned measures to adopt. The decision is to be pursued. The decision is subject to the prior opinion of Fogafin, which is the Government agency that insures deposits made in Colombian financial institutions. The two-month term may be extended with the prior consentpurpose of Fogafin.permitting depositors, creditors and investors to obtain the full or partial payment of their credits and must be submitted toFondo de Garantías de Instituciones Financieras’ (Fogafin) previous opinion.
Upon the Takingtaking of Possessionpossession of a bank, depending on the bank’s financial situation of the bank and the reasons that gave rise to such measure, the SFC may (but is not required to) order the bank to suspend payments to its creditors. The SFC has the power to determine that such suspension will affect all of the obligations of the bank, or only certain types of obligations or even obligations up to or in excess of a specified amount.
As a result of the Takingtaking of Possession,possession, the SFC must appoint as special agent the person or entity designated by Fogafin to administer the affairs of the bank while such process lasts and until it is decided whether to liquidate the bank.
As part of its duties duringfollowing the Takingtaking of Possession,possession by the SFC, Fogafin must provide the SFC with the plan to be followed by the special agent in order to meet the goals set for the fulfillment of the measures that may have been adopted. If the underlying problems that gave rise to the Takingtaking of Possessionpossession of the bank are not resolved within a term not to exceed two years, the SFC must order the liquidation of the bank.
During the Takingtaking of Possessionpossession (which period ends when the liquidation process begins), Colombian banking laws prevent any creditor of the bank from: (i) initiating any procedure for the collection of any amount owed by the bank; (ii) enforcing any judicial decision rendered against the bank to secure payment of any of its obligations; (iii) constituting a lien or attachment over any of the assets of the bank to secure payment of any of its obligations; or (iv) making any payment, advance or compensation or assumeassuming any obligation on behalf of the bank, with the funds or assets that may belong to it and are held by third parties, except for payments that are made by way of set-off between regulated entities of the Colombian financial and insurance systems.
In the event that the bank is liquidated, the SFC must, among other measures, provide that all term obligations owed by the bank are due and payable as of the date when the order to liquidate becomes effective.
During the liquidation process bank deposits and certain other types of saving instruments will be excluded from the liquidation process and paid prior to any other liabilities. The remainder of resources will be distributed among creditors whose claims of creditors rank as follows:are recognized in accordance with the following rank: (i) the first class of creditsclaims includes the court expenses incurred in the interest of all creditors, wages and other obligations related with employment contracts and tax authorities’ credits regarding national and local taxes; (ii) the second class of creditsclaims comprises the creditsclaims secured by a security interest on movable assets; (iii) the third class of creditsclaims includes the creditsclaims secured by real estate collateral, such as mortgages; (iv) the fourth class of creditsclaims contains some other creditsclaims of the tax authorities against the debtor that are not included in the first class of creditsclaims and creditsclaims of suppliers of raw materials and input to the debtor and (v) finally, the fifth class of creditsclaims includes all other credits without any priority or privilege, provided, however, that among credits of the fifth class, subordinated debt shallwill be ranked junior to the external liabilities (pasivos externos) and senior only to capital stock. Each category of creditors will collect in the order indicated above, whereby distributions in one category will be subject to completingthe full distributionsatisfaction of claims in the prior category.
Colombian banks and other financial institutions are not subject to the laws and regulations that generally govern the insolvency, restructuring and liquidation of industrial and commercial companies.
Deposit insurance—Troubled Financial Institutions
In response to the crisis faced by the Colombian financial system during the early 1980s, in 1985 the Government created Fogafin. Subject to specific limitations, Fogafin is authorized to provide equity (whether or not reducing the par value of the recipient’s shares) and/or secured credits to troubled financial institutions, and to insure deposits of commercial banks and certain other financial institutions.
To protect the customers of commercial banks and certain financial institutions, Resolution No. 1 of 2012 of the board of directors of Fogafin, as amended, requires mandatory deposit insurance. Under this Resolution No. 1, banksBanks must pay an annual premium of 0.3% of total funds received on saving accounts, checking accounts, certificates of deposit and other deposits, which is paid in four quarterly installments. If a bank is liquidated, the deposit insurance will cover the funds deposited by an individual or corporation with such bank up to a maximum of COP 20 million regardless of the number of accounts held.
Risk Management Systems
Commercial banks must have risk administration systems to meet the SFC minimum standards for compliance and to avoid and mitigate the following risks: (i) credit; (ii) liquidity; (iii) market; (iv) operational; and (v) money laundering and terrorism.
Commercial banks generally have several risk measurement methods, including the risk weighted assets measurement which is calculated according to weight percentages assigned to different types of assets, which may be 0%, 20%, 50% and 100%. There are some exceptions in which the weight percentage is higher and is calculated based on the associated risk perception of the evaluated asset. Provisions, which are calculated on a monthly basis, are another risk measurement method. For commercial and consumer loans, the SFC issues a provision reference model, according to which the probability of default depends on an assigned rating (AA, A, BB, B, CC and default). For mortgage loans and small business loans, provisions are calculated based on ratings (A, B, C, D and E) assigned depending on the time elapsed since the client’s default.
With respect to market risks, commercial banks must follow the provisions of the Basic Accounting Circular, which defines criteria and procedures for measuring a bank’s exposure to interest rate, foreign exchange, and market risks. Under such regulations, banks must submit to the SFC information on the net present value, duration, and interest rate of its assets, liabilities, and derivative positions. Colombian banks are required to calculate, for each position on the statement of financial position, a volatility rate and a parametric value at risk (“VaR”), which is calculated based on net present value, modified duration and a risk factor computed in terms of a basis points change. Each risk factor is calculated and provided by the SFC.
With respect to liquidity risk, each financial entity is required to have liquid assets greater than the contractual liquidity accumulative one-month-gap. This contractual gap includes the maturity of assets and liabilities of the current positions and does not include projections of future transactions. The loan portfolio is affected by the historical default indicator and the maturity of deposits is modeled according to the regulation.
With respect to operational risk, commercial banks must assess, according to principles provided by the Basic Accounting Circular, each of their business lines (such as corporate finance, purchases and sales of securities, commercial banking, asset management, etc.) in order to record the risk events that may occur and result in fraud, technology problems, legal and reputational problems and problems associated with labor relations at the bank.
Anti-Money Laundering Provisions
The regulatory framework to prevent and control money laundering is contained in, among others, Decree 663 of 1993 and Circulars 26External Circular 029 of 2008 and 019 of 20102014 issued by the SFC, as well as Law 599 of 2000, and the Colombian Criminal Code, as amended.
Colombian laws adopt the latest guidelines related to anti-money laundering and other terrorist activities established by the Financial Action Task Force on Money Laundering (“FATF”). Colombia, as a member of the GAFI-SUD (a FATF-style regional body), follows all of FATF’s 40 recommendations and eight special recommendations. External Circular 26029 of 2008 issued by the SFC2014 requires the implementation by financial institutions of a system of controls for money laundering and terrorism financing. These rules emphasize “know your customer” policies and knowledge of customers and markets. They also establish processesmarkets, and parameters to identifyother customer identification and monitor a financial institution’s customers. According to these regulations, financialmonitoring processes.
Financial institutions must cooperate with the appropriate authorities to prevent and control money laundering and terrorism.terrorism financing. Finally, the Colombian criminal codeCriminal Code introduced criminal rules and regulations to prevent, control, detect, eliminate and adjudicate all matters related to financing terrorism and money laundering. The criminal rules and regulations coverlaundering, including the omission of reports on cash transactions, mobilization or storage of cash, and the lack of controls.
Risk management systemsRegulatory Framework for Subsidiaries that are Non-Participants in the Financial Sector
Commercial banks, including the Bank, must have risk administration systems to meet the SFC minimum standards for compliance and to avoid and mitigate the following risks: (i) credit; (ii) liquidity; (iii) market; (iv) operational; and (v) money laundering and terrorism.
In general, commercial banks, such as the Bank, have several risk measurement methods, including the risk weighted assets measurement which is calculated according to weight percentages assigned to different types of assets, which may be 0%, 20%, 50% and 100%. There are some exceptions in which the weight percentage is higher and is calculated based on the associated risk perception of the evaluated asset. Additionally, provisions, which are calculated on a monthly basis, are another risk measurement method. For commercial and consumer loans, there is a provision’s reference model issued by the SFC, according to which a probability of default depends of an assigned rating (AA, A, BB, B, CC and default); and, for mortgage loans and small business loans, provisions are calculated based on ratings (A, B, C, D and E) assigned depending on the time elapsed since the client’s default.
With respect to market risks, commercial banks must follow the provisions of the Basic Accounting Circular, which defines criteria and procedures for measuring a bank’s exposure to interest rate risk, foreign exchange risk, and market risk. Under such regulations, banks must send the SFC information on the net present value, duration, and interest rate of its assets, liabilities, and derivative positions. Since January 2002, Colombian banks have been required to calculate, for each position on the balance sheet, a volatility rate and a parametric VaR (value at risk), which is calculated based on net present value, modified duration and a risk factor computed in terms of a basis points change. Each risk factor is calculated and provided by the SFC.
With respect to liquidity risks, each financial entity is required to have liquid assets greater than the contractual liquidity accumulative one-month-gap. This contractual gap includes the maturity of assets and liabilities of the current positions and does not include projections of future transactions. The loan portfolio is affected by the historical default indicator and the maturity of deposits is modeled according to the regulation. All of Bancolombia’s Colombian banking subsidiaries met this regulatory limit throughoutthat are not part of the year.finance sector are governed by the laws and regulations embodied in the Colombian Civil Code and the Colombian Commercial Code as well as any regulations issued by the Colombian Superintendency of Industry and Commerce and the Superintendency of Corporations or any other type of special regulations that may be applicable to the commercial and industrial activities carried out by said subsidiaries.
With respect to operational risk, commercial banks must qualify, according to principles provided by the Basic Accounting Circular, each of their operative lines (such as corporate finance, issue and negotiation of securities, commercial banking, assets management, etc.) in order to record the risk events that may occur and cause fraud, technology problems, legal and reputational problems and problems associated with labor relations at the bank.
International regulations applicable to Bancolombia and its subsidiaries
FATCA
Under the Foreign Account Tax Compliance Act (“FATCA”),FATCA, which is U.S. federal tax legislation enacted in 2010, imposes a 30% withholding tax on ‘withholdable payments’ made to non-U.S. financial institutions that do not participate in the FATCA program or that fail (or, in some case,cases, that have affiliates in which they hold an interest of more than 50% and which are also non-U.S. financial institutions that fail) to provide certain information regarding their U.S. accountholders and/or certain U.S. investors (such U.S. accountholders and U.S. investors, “U.S. accountholders”) to the U.S. Internal Revenue Service (“IRS”).IRS. FATCA also requires participating foreign financial institutions (“FFIs”)FFIs to withhold on “passthru payments” (which include both “withholdable payments” and certain non-U.S.-source payments) made to account holders who don’tdo not provide information to the FFIs to determine their U.S. accountholder’s status – “recalcitrant accountholders” -– and to FFIs that do not sign an FFI Agreement with the IRS (such FFIs, “nonparticipating FFIs”). “Withholdable payments” generally include, among other items, payments of U.S.-source interest and dividends and the gross proceeds from the sale or other disposition of property that may produce U.S.-source interest and dividends. This withholding will take effect on a “phased” schedule, startingwhich started in JanuaryJuly 2014 with respect to certain payments; however, withholding on non-U.S. source payments by non-U.S. financial institutions towill start no earlier than January 2017.2019.
Some countries have entered into, and other countries are expected to enter into, agreements (‘intergovernmental agreements’ or ‘IGAs’)IGAs with the United States to facilitate the type of information reporting required under FATCA. These agreements are expected to reduce thatsuch risk for financial institutions and investors in countries that have entered into IGAs. None ofAmong the countries where Bancolombia operates, Colombia, the Cayman Islands and Panama have signed IGAsan IGA Model 1. Peru has reached an agreement in substance with the IRS, and we doconsented to be treated as having an IGA in effect. In addition, certain subsidiaries of Bancolombia located in other countries have transmitted directly to the IRS the information required pursuant to FATCA, since they have not expect that these countries will sign IGAs before January 2014. entered into an IGA.
We are currently incontinue with the process of estimating the costs and commercial impact of implementing FATCA compliance on a group wide level.
Regulatory Frameworkgroup-wide level and adjusting our systems for Subsidiaries Not Participants in the Financial Sector
All of Bancolombia’s Colombian subsidiaries that are not part of the finance sector are governed by the laws and regulations embodied in the Colombian Civil Code and the Colombian Code of Commerce as well as any regulations issued by the Colombian Superintendency of Industry and Commerce and the Superintendency of Corporations or any other type of special regulations that may be applicable to the commercial and industrial activities carried out by said subsidiaries.FATCA reporting.
Financial Regulation of El Salvadorin Panama
OnThe banking business in Panama is regulated by the Law Decree 9 of 1998, subsequently amended by Law Decree 2 of 2008. In accordance with the Law Decree, as amended, the Superintendency of Banks of the Republic of Panama, as the banking supervisor, has the power to issue agreements and resolutions to regulate the banking system. These regulations are mainly focused on matters such as licensing of banks, corporate governance, banking supervision (consolidated and individual or sub-consolidated), capital requirements, capital adequacy, liquidity requirements, risk management (credit, market, liquidity, country, asset and liability, operational, information technology, electronic banking), external audit, on-site inspections, reporting, compliance, change of control, mergers and acquisitions, confidentiality, money laundering, voluntary wind up, administrative and operational control, reorganization, bankruptcy, penalties, customers protection and dispute resolution.
In order to implement Basel III capital standards, the Superintendency of Banks of the Republic of Panama issued in January 26,2015 an agreement on Capital Adequacy. This agreement sets forth the new composition of a banking institution’s capital base, as well as the new capital adequacy ratio, including tier 1 core capital ratio and tier 1 capital ratio, all consistent with Basel III standards. This agreement shall become effective in June 2016, and the new standards will be implemented, progressively, from that date until they are fully applicable in January 2019.
The Superintendency of Banks of the Republic of Panama is also in charge of the supervision and oversight of the trust business, regulated by Law 1 of 1984 and the Executive Decree 16 of 1984, which set forth aspects such as minimum requirements of trust agreements, characteristics of trusts, rights and responsibilities of grantors, trustees and beneficiaries, licensing of trustees, inspection and reporting of trustees, confidentiality and penalties.
In addition, securities market activities in Panama are subject to the supervision, control and oversight of the Superintendency of the Securities Market. These activities are primarily regulated by Law Decree 1 of 1999, as amended by several laws, which established important changes in order to strengthen the regulatory framework of the Panamanian securities market and increase investors’ confidence. Among the most important changes introduced by these recent amendments are the following:
| 1. | The establishment of a coordination and cooperation system between the financial supervisors. This system also enables a more comprehensive supervision of financial conglomerates operating in multiple areas of the financial industry. |
| 2. | The establishment of the Superintendency of the Securities Market, as the supervising entity replacing the previous National Securities Commission. |
| 3. | The authority given to the Superintendency of the Securities Market to carry the consolidated supervision, as home supervisor, of intermediaries having agencies abroad, and to enter into cooperation agreements with foreign supervisors to facilitate the consolidated supervision. |
| 4. | The regulation of foreign currency exchange as a securities activity and the regulation of certain actors of the securities market, such as securities price suppliers, risk rating agencies and Administrative Service Suppliers of the securities market. |
The principal aspects of the securities business covered by the Law-Decree as amended, and the agreements and resolutions issued by the Superintendency of the Securities Market of the Republic of Panama are (i) licensing requirements of securities brokers, investment advisors, fund administrators and self-regulated organizations, (ii) registration requirements of risk rating agencies, securities price suppliers, securities, public offerings, funds and administrative service suppliers of the securities market, (iii) authorization for requesting voting powers regarding registered securities, (iv) notification requirements of public offerings for the acquisition of registered shares, (v) options, futures contracts and derivatives, (vi) custody, clearing and settlement of securities, (vii) penalization procedures and penalties, (viii) voluntary wind up, reorganization and bankruptcy of securities brokers, self-regulated organizations, funds, and fund administrators, (ix) reporting of issuers of registered securities, securities brokers, investment advisors, funds, fund administrators, self-regulated organization and other registered entities, (x) on-site inspection of securities brokers, investment advisors, self-regulated organizations, funds, fund administrators, administrative service suppliers of the securities market, securities price suppliers and rating agencies, (xi) capital requirements, liquidity requirements, risk assessment, confidentiality, conflict of interest, suitability, compliance and money laundering of securities brokers and (xii) communication of events of importance by issuers of registered securities.
Financial Regulation in El Salvador
In 2011, the Legislature of El Salvador approved Decree 592, entitled “Supervision and Regulation of the financialFinancial System” (hereinafter the “Law”) (Ley de Supervisión y Regulación del Sistema Financiero) was enacted in order to fortify the State’s organization, adapting all supervision and regulatory institutions to the economic reality of the financial system. Consequently, the Legislature, merged the Superintendency of Pensions and the Superintendency of Securities into the Superintendency of the Financial System, consolidating the technical experience and management that the regulatory institutions have accumulated during the years in every segment of the financial system, in coordination with the macroeconomic and financial experience of the Central Reserve Bank of El Salvador (Banco Central de Reserva de El Salvador), to bring stability, efficiency and development to the financial system.
The LawDecree 592 states that the Superintendency of the Financial System and the Central Reserve Bank of El Salvador are obligedobligated to supervise all members of the financial system and to approve the necessary regulation for the Law’s adequate application.application of Decree 592.
The Law’sDecree 592’s main objective isobjectives are to maintain stability in the Salvadorian financial system, to guarantee efficiency, transparency, security and solidity within the system, and to bring all its members in compliance with this law, and other applicable laws and regulations, all in accordance with best international practices.
The Superintendency of the Financial System is responsible for the surpervisionsupervision of the individual and consolidated activities of all the members in the system, as well as the people, operations and entities thatdescribed in the law obliges it to regulate. Article 3 of the Lawlaw. Decree 592 establishes all the competencespowers and duties of the Superintendency, some of which are detailed below:are: (i) to fulfill and enforce the laws, regulations and other legal provisions applicable to the entities subject to its supervision and issue all the necessary instructions for compliance of the laws applicable to the system; (ii) to authorize the establishment, function, operation, intervention, suspension, modification, revocation of authorizations and closure of all members of the system, in accordance with laws and regulations. In the event of closure, the Superintendency will coordinate with the entities involved the actions established by the law; (iii) risk prevention through the monitoring and management of the members within the system with an eyea view toward the prudential management of liquidity and solvency;capital adequacy; (iv) to propitiatefacilitation of an efficient, transparent and organized financial system; (v) to require that all supervised entities and institutions be managed in accordance with the best international practices of risk management and corporate governance; and (vi) all other legal requirements.
Banking Law of El Salvador
The Legislature of the Republic of El Salvador established the banking law through Decree 697 of 1999, which regulates the financial intermediation and other operations performed by banks in El Salvador.banks.
The banksBanks are required to establish a reserve requirement, set by the Salvadorian Superintendency of the Financial System in accordance towith the deposits and obligations of such bank.
According to the Salvadorian Superintendency of Financial System’s regulations, the reserve requirements for Salvadorian banks as of December 31, 20122015 are:
| | | Ordinary Reserve
Requirements % | |
Checking Accountsaccounts | | | 25.0 | % |
Saving Accountsaccounts | | | 20.0 | % |
Time Depositsdeposits | | | 20.0 | % |
| Borrowings from foreign banks | | | 5.0 | % |
| Long-term debt(1) | | | 15.0%-20.0 - 20.0 | % |
__________________________
| (1) | 15% for long-term debt with maturity above one year and 20% for long-term debt with maturity less than one year. |
An extraordinary reserve requirement of 3.0% over the total amount of deposits applicable to banks is in place as of December 31, 2012.
Monetary Integration Law of El Salvador
Since November 2000, El Salvador has usedThe Monetary Integration Law adopted the U.S. dollar as itsthe legal currency. The transition from the Colon (former currency) was enacted by the Monetary Integration Law. This law establishedcurrency, establishing a fixed exchange rate of 8.75Colones per USD 1.1.00. The Coloncolón continues to have unrestricted legal circulation, but the central bankCentral Reserve Bank has been replacing it with the U.S. dollar anyat each time Coloncolón bills and coins are presented forused in transactions.
Since the implementation of the Monetary Integration Law, all financial operations, such as bank deposits, loans, pensions, issuance of securities and any others made through the financial system, as well as the accounting records, must be expressed in U.S. dollars. The operations or transactions of the financial system made or agreed inColones before the effective date of the Monetary Integration Law are expressed in U.S. dollars at the exchange rate established in such law.
Financial Transactions Tax
In 2014, the Legislature of El Salvador enacted the financial transactions tax law.
Pursuant to the financial transactions tax law, financial entities act as withholding agents for the tax on financial transactions and the liquidity control tax, each of which are calculated at the time the customer conducts financial transactions. The financial transactions tax is 0.25% on taxable transactions exceeding USD 1,000. The tax for the liquidity control is 0.25% on cash transactions of deposit, withdrawals and payments in excess of a monthly aggregate amount of USD 5,000.
The transactions subject to the financial transactions tax are: (i) payments for goods and services by check or debit card, (ii) payments by wire transfers, (iii) transfers to third parties by any means, and (iv) transactions between financial entities, based on any statement of its customers.
Investment Funds Law
The investment funds law aims to encourage economic activity by providing small investors with access to capital markets, diversification of their investments and channeling savings into productive sectors, in order to generate higher economic growth.
This Law sets forth the regulatory framework for the supervision of investment funds, their share of participation and companies that administer such funds and their operations; as well as other participants to which it refers. Additionally, it regulates the marketing of participation shares in foreign investment funds.
This Law also provides for the creation of investment fund managers who are responsible for performing all acts, contracts and operations necessary for the administration and operation of investment funds.
| C. | ORGANIZATIONAL STRUCTURE |
The following are the main subsidiaries of Bancolombia:
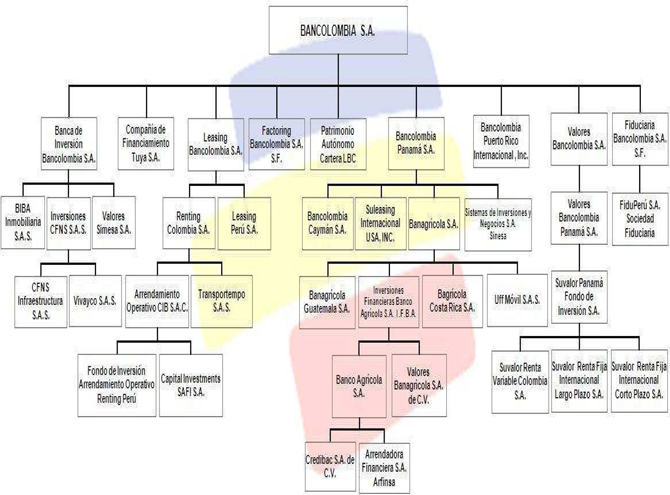
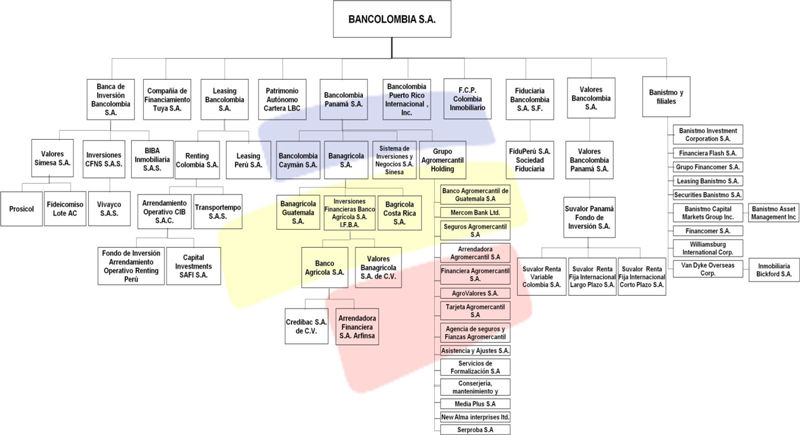
The following is a list of subsidiaries of Bancolombia as of December 31, 2012:2015:
SUBSIDIARIES
SUBSIDIARIES
| Entity | | Jurisdiction of
Incorporation | | Business | | Shareholding
directlyDirectly and
indirectlyIndirectly | |
| | | | | | | |
| Leasing Bancolombia S.A. Compañía de Financiamiento | | Colombia | | Leasing businesses | | | 100.00 | % |
| Fiduciaria Bancolombia S.A. Sociedad Fiduciaria | | Colombia | | Trust businesses | | | 98.81 | % |
| Banca de Inversión Bancolombia S.A. Corporación Financiera | | Colombia | | Investment BankingFinancial services | | | 100.00 | % |
| Valores Bancolombia S.A. Comisionista de Bolsa | | Colombia | | Securities brokerage | | | 100.00 | % |
Tuya S.A. Compañía de Financiamiento Tuya S.A. (Discontinued operations) | | Colombia | | Financial services | | | 99.99 | % |
Factoring Bancolombia | | Colombia | | Financial services | | | 100.00 | % |
Patrimonio Autónomo Cartera LBC(1) | | Colombia | | Loan management | | | 100.00 | % |
| Renting Colombia S.A. | | Colombia | | Operating leasing | | | 100.00 | % |
| Transportempo S.A.S. | | Colombia | | TransportationTransport services | | | 100.00 | % |
| Valores Simesa S.A. | | Colombia | | Investments | | | 67.5468.57 | % |
| Inversiones CFNS S.A.S. | | Colombia | | Investments | | | 100.00 | % |
CFNS Infraestructura S.A.S. | | Colombia | | Investments | | | 100.0099.94 | % |
BIBA Inmobiliaria S.A.S. (formely Inmobiliaria Bancol S.A.) | | Colombia | | Real estate broker | | | 98.96100.00 | % |
| Vivayco S.A.S. (in liquidation) | | Colombia | | Portfolio Purchasepurchase | | | 75.0074.95 | % |
Uff Móvil S.A.S.FCP Fondo Colombia Inmobiliario S.A. | | Colombia | | Mobile network operatorReal estate broker | | | 69.4250.21 | % |
| PA Cartera LBC | | Colombia | | Loan management | | | 100.00 | % |
| Prosicol S.A.S. (in liquidation) | | Colombia | | Pre-operating stage | | | 68.57 | % |
| Fideicomiso "Lote Abelardo Castro". | | Colombia | | Mercantil trust | | | 68.23 | % |
Bancolombia PanamáPanama | | Panama | | BankingCommercial bank | | | 100.00 | % |
| Valores Bancolombia Panamá S.A. | | Panama | | Securities brokerage | | | 100.00 | % |
| Suvalor Panamá Fondo de Inversión S.A. | | Panama | | Holding | | | 100.00 | % |
SistemaSuvalor Renta Variable Colombia S.A. | | Panama | | Collective investment fund | | | 100.00 | % |
| Suvalor Renta Fija Internacional Corto Plazo S.A. | | Panama | | Collective investment fund | | | 100.00 | % |
| Suvalor Renta Fija Internacional Largo Plazo S.A. | | Panama | | Collective investment fund | | | 100.00 | % |
| Sistemas de Inversiones y Negocios S.A. Sinesa | | Panama | | Investments | | | 100.00 | % |
| Banagrícola S.A. | | Panama | | Investments | | | 99.16 | % |
| Banistmo S.A. | | Panama | | Banking | | | 100.00 | % |
| Banistmo Investment Corporation S.A. | | Panama | | Trust | | | 100.00 | % |
| Financomer S.A. | | Panama | | Financial services | | | 100.00 | % |
| Financiera Flash S.A. | | Panama | | Financial services | | | 100.00 | % |
| Grupo Financomer S.A. | | Panama | | Financial services | | | 100.00 | % |
| Seguros Banistmo S.A. (disposed in 2015) | | Panama | | Insurance company | | | 100.00 | % |
| Securities Banistmo S.A. | | Panama | | Purchase and sale of securities | | | 100.00 | % |
| Banistmo Asset Management Inc. | | Panama | | Purchase and sale of securities | | | 100.00 | % |
| Banistmo Capital Markets Group Inc. | | Panama | | Purchase and sale of securities | | | 100.00 | % |
| Van Dyke Overseas Corp. | | Panama | | Real estate broker | | | 100.00 | % |
| Inmobiliaria Bickford S.A. | | Panama | | Real estate broker | | | 100.00 | % |
| Williamsburg International Corp. | | Panama | | Real estate broker | | | 100.00 | % |
| Leasing Banistmo S.A. | | Panama | | Leasing | | | 100.00 | % |
| Banco Agrícola S.A. | | El Salvador | | Banking | | | 97.3597.36 | % |
| Arrendadora Financiera S.A. Arfinsa | | El Salvador | | Leasing | | | 97.3597.36 | % |
| Credibac S.A. de C.V. | | El Salvador | | Credit card services | | | 97.3597.36 | % |
| Valores Banagrícola S.A. de C.V. | | El Salvador | | Securities brokerage | | | 98.89 | % |
| Inversiones Financieras Banco Agrícola S.A. IFBA | | El Salvador | | Investments | | | 98.89 | % |
| Arrendamiento Operativo CIB S.A.C. | | Peru | | Operating leasing | | | 100.00 | % |
| Fondo de Inversión en Arrendamiento Operativo - Renting Perú | | Peru | | Operating leasing | | | 100.00 | % |
| Capital Investments SAFI S.A. | | Peru | | Trust | | | 100.00 | % |
Fondo de Inversión en Arrendamiento Operativo Renting Perú | | Peru | | Car Rental | | | 100.00 | % |
Leasing Perú S.A. | | Peru | | Leasing businesses | | | 100.00 | % |
| FiduPerú S.A. Sociedad Fiduciaria | | Peru | | Trust businesses | | | 98.81 | % |
Bancolombia Puerto Rico Internacional, Inc.Leasing Perú S.A. | | Puerto Rico | | Banking | | | 100.00 | % |
Suleasing Internacional USA, Inc. | | USAPeru | | Leasing | | | 100.00 | % |
Bancolombia Cayman S.A. | | Cayman Islands | | Banking | | | 100.00 | % |
| Banagrícola Guatemala S.A. | | Guatemala | | Outsourcing | | | 99.16 | % |
BanagríGrupo Financiero Agromercantil Holding S.A. | | Guatemala | | Holding | | | 60.00 | % |
| Banco Agromercantil de Guatemala S.A. | | Guatemala | | Banking | | | 60.00 | % |
| Mercomer Bank Ltd. | | Guatemala | | Banking | | | 60.00 | % |
| Seguros Agromercantil S.A. | | Guatemala | | Insurance company | | | 59.17 | % |
| Entity | | Jurisdiction of
Incorporation | | Business | | Shareholding
Directly and
Indirectly | |
| Financiera Agromercantil S.A. | | Guatemala | | Financial services | | | 60.00 | % |
| Agrovalores S.A. | | Guatemala | | Securities brokerage | | | 60.00 | % |
| Tarjeta Agromercantil S.A. | | Guatemala | | Credit card | | | 60.00 | % |
| Arrendadora Agromercantil S.A. | | Guatemala | | Operating leasing | | | 60.00 | % |
| Agencia de Seguros y Fianzas Agromercantil S.A. | | Guatemala | | Insurance company | | | 60.00 | % |
| Asistencia y Ajustes S. A. | | Guatemala | | Services | | | 60.00 | % |
| Serproba S.A. | | Guatemala | | Refurbishment and remodelling services | | | 60.00 | % |
| Servicios de Formalización S.A. | | Guatemala | | Loans formalization | | | 60.00 | % |
| Conserjeria, Mantenimiento y Mensajeria S.A. | | Guatemala | | Maintenance services | | | 60.00 | % |
| Media Plus S.A. | | Guatemala | | Advertising and marketing | | | 60.00 | % |
| New Alma Enterprises Ltd. | | Bahamas | | Investments | | | 60.00 | % |
| Bancolombia Puerto Rico Internacional Inc. | | Puerto Rico | | Banking | | | 100.00 | % |
| Bancolombia Caymán S.A. | | Cayman Islands | | Commercial bank | | | 100.00 | % |
| Bagrícola Costa Rica S.A. | | Costa Rica | | Outsourcing | | | 99.16 | % |
___________________________
| (1) | See Item 18. Financial Statements, note 1 “Organization of Background”. |
As of December 31, 2012,2015, the Bank owned COP 3,5333,242 billion in premises and equipment (including assets that are part of our operating leasing business). COP 1,0581,534 billion correspondscorrespond to land and buildings, of which approximately 95%96% are used for administrative offices and branches in 6059 municipalities in Colombia, and 25 municipalities in El Salvador.Salvador, 9 municipalities in Guatemala and 4 municipalities in Panama. Likewise, COP 309770 billion correspond to computer equipment, of which 21.16%approximately 10% relate to the central computer and servers of Bancolombiathe Bank and the rest relate to personal computers, ATMs, telecommunications equipment and other equipment.
In addition to its own branches, the Bank occupies 699944 rented offices.
The Bank does not have any liens on its property.
| E. | SELECTED STATISTICAL INFORMATION |
The following information is included for analytical purposes and should be read in conjunction with the Bank’s consolidated financial statementsConsolidated Financial Statements as well as Item 5. Operating5, “Operating and Financial Review and Prospects.Prospects”. This information has been prepared based on the Bank’s financial records, which are prepared in accordance with Colombian banking GAAPIFRS technical framework as issued by the IASB and do not reflect adjustments necessary to state the informationrelated interpretations issued by the International Financial Reporting Interpretations Committee (“IFRS-IC”) and by the Standing Interpretations Committee (SIC) related interpretations. The Bank has applied IFRS in its financial reporting with effect from January 1, 2014, the date of transition, in accordance with U.S. GAAP. See Note 31 to the Bank’s consolidated financial statements as of December 31, 2012 includedtransitional provisions set out in this Annual Report for a summary of the significant differences between Colombian banking GAAP and U.S. GAAP.IFRS 1.
The consolidated selected statistical information for the year ended December 31, 20082014 includes the selected statistical information of Bancolombia and its subsidiaries,Subsidiaries, without reflecting any pro-forma calculation of the effect of Banagrícola’sthe acquisition of the majority ownership of Grupo Agromercantil, while consolidated selected statistical information for the yearsyear ended December 31, 2009, December 31, 2010, December 31, 2011 and December 31, 20122015 corresponds to the Bank and its Subsidiaries, including all additional subsidiariesSubsidiaries acquired as a result of the Banagrícola acquisition.2015 acquisition of the additional shares of Grupo Agromercantil.
| E.1. | DISTRIBUTION OF ASSETS, LIABILITIES AND STOCKHOLDERS’ EQUITY; INTEREST RATES AND INTEREST DIFFERENTIAL |
Average balances have been calculated as follows: for the year ended December 31, 2015, for each month, the actual month-end balances were established. The average balance for each period is the arithmetic average of the monthly balances. The Bank has calculated the average balances using quarterly book balances for the year ended December 31, 2014, as we believe such month-end balances. For purposesbalances are representative of the presentation in the following tables, non-performing loans have been treated as non-interest-earning assets.our operations and it would be too costly to produce average balances using monthly balances under IFRS.
In addition, the interest rate subtotals are based on the weighted average of the average peso-denominateddomestic and U.S. dollar-denominated balances.foreign assets and liabilities.
Average balance sheetstatement of financial position
The following tables show for the years ended December 31, 2012, 20112015 and 2010,2014, respectively: (i) average balances for all of the Bank’s assets and liabilities; (ii) interest earned and interest paid amounts; and (iii) average nominal interest rates/yield for the Bank’s interest-earning assets and interest-bearing liabilities.
| | | Average Balance Sheet and Income from Interest-Earning Assets for the Fiscal Years
Ended December 31, | |
| | | 2012 | | | 2011 | | | 2010 | |
| | | Average
Balance | | | Interest
Earned | | | Average
Yield /
Rate | | | Average
Balance | | | Interest
Earned | | | Average
Yield /
Rate | | | Average
Balance | | | Interest
Earned | | | Average
Yield /
Rate | |
| | | (COP million, except percentages) | |
| | | | | | | | | | | | | | | | | | | | | | | | | | | | |
| ASSETS | | | | | | | | | | | | | | | | | | | | | | | | | | | | | | | | | | | | |
| Interest-earning assets | | | | | | | | | | | | | | | | | | | | | | | | | | | | | | | | | | | | |
| Funds sold and securities purchased under agreements to resell | | | | | | | | | | | | | | | | | | | | | | | | | | | | | | | | | | | | |
| Peso-denominated | | | 314,406 | | | | 20,341 | | | | 6.5 | % | | | 197,731 | | | | 9,253 | | | | 4.7 | % | | | 907,453 | | | | 32,472 | | | | 3.6 | % |
| U.S. Dollar-denominated | | | 837,221 | | | | 3,837 | | | | 0.5 | % | | | 555,502 | | | | 9,567 | | | | 1.7 | % | | | 478,224 | | | | 9,526 | | | | 2.0 | % |
| Total | | | 1,151,627 | | | | 24,178 | | | | 2.1 | % | | | 753,233 | | | | 18,820 | | | | 2.5 | % | | | 1,385,677 | | | | 41,998 | | | | 3.0 | % |
| Investment securities | | | | | | | | | | | | | | | | | | | | | | | | | | | | | | | | | | | | |
| Peso-denominated | | | 7,393,673 | | | | 752,081 | | | | 10.2 | % | | | 7,292,601 | | | | 638,401 | | | | 8.8 | % | | | 6,381,602 | | | | 422,866 | | | | 6.9 | % |
| U.S. Dollar-denominated | | | 2,480,742 | | | | 7,432 | | | | 0.3 | % | | | 2,170,386 | | | | (12,842 | ) | | | (0.6 | %) | | | 2,159,867 | | | | 11,502 | | | | 0.5 | % |
| Total | | | 9,874,415 | | | | 759,513 | | | | 7.7 | % | | | 9,462,987 | | | | 625,559 | | | | 6.6 | % | | | 8,541,469 | | | | 454,368 | | | | 5.3 | % |
| Loans and Financial Leases (1) | | | | | | | | | | | | | | | | | | | | | | | | | | | | | | | | | | | | |
| Peso-denominated | | | 47,397,959 | | | | 6,029,349 | | | | 12.7 | % | | | 39,020,268 | | | | 4,495,779 | | | | 11.5 | % | | | 32,808,038 | | | | 3,763,049 | | | | 11.5 | % |
| U.S. Dollar-denominated | | | 14,982,937 | | | | 848,843 | | | | 5.7 | % | | | 14,053,540 | | | | 805,436 | | | | 5.7 | % | | | 10,361,466 | | | | 701,225 | | | | 6.8 | % |
| Total | | | 62,380,896 | | | | 6,878,192 | | | | 11.0 | % | | | 53,073,808 | | | | 5,301,215 | | | | 10.0 | % | | | 43,169,504 | | | | 4,464,274 | | | | 10.3 | % |
| Total interest-earning assets | | | | | | | | | | | | | | | | | | | | | | | | | | | | | | | | | | | | |
| Peso-denominated | | | 55,106,038 | | | | 6,801,771 | | | | 12.3 | % | | | 46,510,600 | | | | 5,143,433 | | | | 11.1 | % | | | 40,097,093 | | | | 4,238,387 | | | | 10.6 | % |
| U.S. Dollar-denominated | | | 18,300,900 | | | | 860,112 | | | | 4.7 | % | | | 16,779,428 | | | | 802,161 | | | | 4.8 | % | | | 12,999,557 | | | | 722,253 | | | | 5.6 | % |
| Total | | | 73,406,938 | | | | 7,661,883 | | | | 10.4 | % | | | 63,290,028 | | | | 5,945,594 | | | | 9.4 | % | | | 53,096,650 | | | | 4,960,640 | | | | 9.3 | % |
| | | | | | | | | | | | | | | | | | | | | | | | | | | | | | | | | | | | | |
| Total non-interest-earning assets | | | | | | | | | | | | | | | | | | | | | | | | | | | | | | | | | | | | |
| Peso-denominated | | | 14,789,995 | | | | | | | | | | | | 10,794,960 | | | | | | | | | | | | 6,957,834 | | | | | | | | | |
| U.S. Dollar-denominated | | | 459,680 | | | | | | | | | | | | 1,674,836 | | | | | | | | | | | | 3,300,597 | | | | | | | | | |
| Total | | | 15,249,675 | | | | | | | | | | | | 12,469,796 | | | | | | | | | | | | 10,258,431 | | | | | | | | | |
| | | | | | | | | | | | | | | | | | | | | | | | | | | | | | | | | | | | | |
| Total interest and non-interest-earning assets | | | | | | | | | | | | | | | | | | | | | | | | | | | | | | | | | | | | |
| Peso-denominated | | | 69,896,033 | | | | 6,801,771 | | | | | | | | 57,305,560 | | | | 5,143,433 | | | | | | | | 47,054,927 | | | | 4,238,387 | | | | | |
| U.S. Dollar-denominated | | | 18,760,580 | | | | 860,112 | | | | | | | | 18,454,264 | | | | 802,161 | | | | | | | | 16,300,154 | | | | 722,253 | | | | | |
| Total Assets (COP) | | | 88,656,613 | | | | 7,661,883 | | | | | | | | 75,759,824 | | | | 5,945,594 | | | | | | | | 63,355,081 | | | | 4,960,640 | | | | | |
| | | Average statement of financial position and Income from Interest-Earning Assets for the Fiscal Year Ended December 31, | |
| | | 2015 | | | 2014 | |
| | | Average
Balance | | | Interest
Earned | | | Average
Yield / Rate | | | Average
Balance | | | Interest
Earned | | | Average
Yield / Rate | |
| | | (in millions of COP, except percentages) | |
| | | | | | | | | | | | | | | | | | | |
| ASSETS | | | | | | | | | | | | | | | | | | | | | | | | |
| Interest-earning assets | | | | | | | | | | | | | | | | | | | | | | | | |
| Funds sold and securities purchased under agreements to resell | | | | | | | | | | | | | | | | | | | | | | | | |
| Domestic activities | | | 1,180,507 | | | | 74,237 | | | | 6.3 | % | | | 909,396 | | | | 105,614 | | | | 11.6 | % |
| Foreign activities | | | 1,594,096 | | | | 20,752 | | | | 1.3 | % | | | 1,937,558 | | | | 17,473 | | | | 0.9 | % |
| Total | | | 2,774,603 | | | | 94,989 | | | | 3.4 | % | | | 2,846,954 | | | | 123,087 | | | | 4.3 | % |
| Investment securities(1) | | | | | | | | | | | | | | | | | | | | | | | | |
| Domestic activities | | | 7,929,171 | | | | 253,161 | | | | 3.2 | % | | | 8,627,917 | | | | 322,438 | | | | 3.7 | % |
| Foreign activities | | | 3,684,896 | | | | 113,608 | | | | 3.1 | % | | | 2,665,992 | | | | 141,154 | | | | 5.3 | % |
| Total | | | 11,614,067 | | | | 366,769 | | | | 3.2 | % | | | 11,293,909 | | | | 463,592 | | | | 4.1 | % |
| Loans and Financial Leases(2) | | | | | | | | | | | | | | | | | | | | | | | | |
| Domestic activities | | | 79,835,468 | | | | 8,739,998 | | | | 10.9 | % | | | 68,434,591 | | | | 7,388,145 | | | | 10.8 | % |
| Foreign activities | | | 45,190,581 | | | | 2,521,782 | | | | 5.6 | % | | | 31,028,592 | | | | 1,704,084 | | | | 5.5 | % |
| Total | | | 125,026,049 | | | | 11,261,780 | | | | 9.0 | % | | | 99,463,183 | | | | 9,092,229 | | | | 9.1 | % |
| Total interest-earning assets | | | | | | | | | | | | | | | | | | | | | | | | |
| Domestic activities | | | 88,945,146 | | | | 9,067,396 | | | | 10.2 | % | | | 77,971,904 | | | | 7,816,197 | | | | 10.0 | % |
| Foreign activities | | | 50,469,573 | | | | 2,656,142 | | | | 5.3 | % | | | 35,632,142 | | | | 1,862,711 | | | | 5.2 | % |
| Total | | | 139,414,719 | | | | 11,723,538 | | | | 8.4 | % | | | 113,604,046 | | | | 9,678,908 | | | | 8.5 | % |
| | | | | | | | | | | | | | | | | | | | | | | | | |
| Total non-interest-earning assets | | | | | | | | | | | | | | | | | | | | | | | | |
| Domestic activities | | | 10,050,646 | | | | | | | | | | | | 10,149,131 | | | | | | | | | |
| Foreign activities(3) | | | 15,383,212 | | | | | | | | | | | | 11,674,133 | | | | | | | | | |
| Total Assets | | | 25,433,858 | | | | | | | | | | | | 21,823,264 | | | | | | | | | |
| | | | | | | | | | | | | | | | | | | | | | | | | |
| Total interest and non-interest-earnings assets | | | | | | | | | | | | | | | | | | | | | | | | |
| Domestic activities | | | 98,995,792 | | | | 9,067,396 | | | | | | | | 88,121,035 | | | | 7,816,196 | | | | | |
| Foreign activities (3) | | | 65,852,785 | | | | 2,656,142 | | | | | | | | 47,306,275 | | | | 1,862,711 | | | | | |
| Total Assets | | | 164,848,577 | | | | 11,723,538 | | | | | | | | 135,427,310 | | | | 9,678,907 | | | | | |
___________________________
(1) Tax-exempt income derived fromtax-exempt investment securities has not been calculated on a tax equivalent basis because the effect of such calculation would not be material.
(2) Includes performing loans only.
(3) The percentage of total average assets attributable to foreign activities was 39.9% and 34.9%, respectively, for the fiscal years ended December 31, 2015 and 2014.
| | | Average statement of financial position and Interest Paid on Interest-Bearing
Liabilities for the Fiscal Year
Ended December 31, | |
| | | 2015 | | | 2014 | |
| | | Average Balance | | | Interest Paid | | | Average Yield / Rate(1) | | | Average Balance | | | Interest Paid | | | Average Yield / Rate(1) | |
| | | (in millions of COP, except percentages) | |
| LIABILITIES AND STOCKHOLDERS’ EQUITY | | | | | | | | | | | | | | | | | | | | | | | | |
| Interest-bearing liabilities: | | | | | | | | | | | | | | | | | | | | | | | | |
| Checking deposits | | | | | | | | | | | | | | | | | | | | | | | | |
| Domestic activities | | | 11,034,571 | | | | 17,778 | | | | 0.2 | % | | | 10,877,728 | | | | 19,929 | | | | 0.2 | % |
| Foreign activities | | | 7,538,081 | | | | 16,060 | | | | 0.2 | % | | | 5,587,845 | | | | 2,800 | | | | 0.1 | % |
| Total | | | 18,572,652 | | | | 33,838 | | | | 0.2 | % | | | 16,465,573 | | | | 22,729 | | | | 0.1 | % |
| Savings deposits | | | | | | | | | | | | | | | | | | | | | | | | |
| Domestic activities | | | 30,937,835 | | | | 528,806 | | | | 1.7 | % | | | 28,097,124 | | | | 442,206 | | | | 1.6 | % |
| Foreign activities | | | 9,837,665 | | | | 142,111 | | | | 1.4 | % | | | 6,904,204 | | | | 103,498 | | | | 1.5 | % |
| Total | | | 40,775,500 | | | | 670,917 | | | | 1.6 | % | | | 35,001,328 | | | | 545,704 | | | | 1.6 | % |
| Time deposits | | | | | | | | | | | | | | | | | | | | | | | | |
| Domestic activities | | | 23,284,367 | | | | 1,322,738 | | | | 5.7 | % | | | 21,273,104 | | | | 1,061,542 | | | | 5.0 | % |
| Foreign activities | | | 18,944,955 | | | | 443,488 | | | | 2.3 | % | | | 13,131,180 | | | | 305,107 | | | | 2.3 | % |
| Total | | | 42,229,322 | | | | 1,766,226 | | | | 4.2 | % | | | 34,404,284 | | | | 1,366,649 | | | | 4.0 | % |
| Funds purchased and securities sold under agreements to repurchase | | | | | | | | | | | | | | | | | | | | | | | | |
| Domestic activities | | | 2,795,234 | | | | 128,858 | | | | 4.6 | % | | | 1,332,438 | | | | 96,847 | | | | 7.3 | % |
| Foreign activities | | | 450,720 | | | | 3,327 | | | | 0.7 | % | | | 419,069 | | | | 5,087 | | | | 1.2 | % |
| Total | | | 3,245,954 | | | | 132,185 | | | | 4.1 | % | | | 1,751,507 | | | | 101,934 | | | | 5.8 | % |
| Borrowings from development and other domestic banks(2) | | | | | | | | | | | | | | | | | | | | | | | | |
| Domestic activities | | | 4,603,982 | | | | 130,156 | | | | 2.8 | % | | | 4,402,506 | | | | 241,206 | | | | 5.5 | % |
| Foreign activities | | | 270,205 | | | | 7,475 | | | | 2.8 | % | | | 71,804 | | | | 7,472 | | | | 10.4 | % |
| Total | | | 4,874,187 | | | | 137,631 | | | | 2.8 | % | | | 4,474,310 | | | | 248,678 | | | | 5.6 | % |
| Interbank borrowings(2) (3) | | | | | | | | | | | | | | | | | | | | | | | | |
| Domestic activities | | | - | | | | - | | | | 0.0 | % | | | - | | | | - | | | | 0.0 | % |
| Foreign activities | | | 10,502,220 | | | | 183,555 | | | | 1.7 | % | | | 7,679,133 | | | | 135,635 | | | | 1.8 | % |
| Total | | | 10,502,220 | | | | 183,555 | | | | 1.7 | % | | | 7,679,133 | | | | 135,635 | | | | 1.8 | % |
| Long-term debt | | | | | | | | | | | | | | | | | | | | | | | | |
| Domestic activities | | | 5,907,501 | | | | 495,168 | | | | 8.4 | % | | | 4,884,212 | | | | 353,695 | | | | 7.2 | % |
| Foreign activities | | | 10,735,079 | | | | 580,314 | | | | 5.4 | % | | | 7,947,893 | | | | 442,133 | | | | 5.6 | % |
| Total | | | 16,642,580 | | | | 1,075,482 | | | | 6.5 | % | | | 12,832,105 | | | | 795,828 | | | | 6.2 | % |
| Total interest-bearing liabilities | | | | | | | | | | | | | | | | | | | | | | | | |
| Domestic activities | | | 78,563,490 | | | | 2,623,504 | | | | 3.3 | % | | | 70,867,112 | | | | 2,215,425 | | | | 3.1 | % |
| Foreign activities | | | 58,278,925 | | | | 1,376,330 | | | | 2.4 | % | | | 41,741,128 | | | | 1,001,732 | | | | 2.4 | % |
| Total | | | 136,842,415 | | | | 3,999,834 | | | | 2.9 | % | | | 112,608,240 | | | | 3,217,157 | | | | 2.9 | % |
| Total non-interest bearing liabilities | | | | | | | | | | | | | | | | | | | | | | | | |
| Domestic activities | | | 5,744,793 | | | | | | | | | | | | 3,760,403 | | | | | | | | | |
| Foreign activities(4) | | | 3,366,523 | | | | | | | | | | | | 3,573,771 | | | | | | | | | |
| Total | | | 9,111,316 | | | | | | | | | | | | 7,334,174 | | | | | | | | | |
| Stockholders' equity | | | | | | | | | | | | | | | | | | | | | | | | |
| Domestic activities | | | 15,512,136 | | | | | | | | | | | | 14,756,128 | | | | | | | | | |
| Foreign activities(4) | | | 3,344,666 | | | | | | | | | | | | 252,887 | | | | | | | | | |
| Total | | | 18,856,802 | | | | | | | | | | | | 15,009,015 | | | | | | | | | |
| | | | | | | | | | | | | | | | | | | | | | | | | |
| Total interest and non-interest bearing liabilities and stockholders’ equity | | | | | | | | | | | | | | | | | | | | | | | | |
| Domestic activities | | | 99,820,419 | | | | 2,623,504 | | | | | | | | 89,383,643 | | | | 2,215,425 | | | | | |
| Foreign activities(4) | | | 64,990,114 | | | | 1,376,330 | | | | | | | | 45,567,786 | | | | 1,001,732 | | | | | |
| Total Liabilities and Stockholders’ Equity | | | 164,810,533 | | | | 3,999,834 | | | | | | | | 134,951,429 | | | | 3,217,157 | | | | | |
| (1) | See “Item 4. Information on the Company – E. Selected Statistical Information – E.1 Distribution of Assets, Liablilities and Stockholders’ Equity; Interest Rates and Interest Differential”. |
| (2) | Includes performing loans only.both short-term and long-term borrowings. |
| (3) | Includes borrowings from banks located outside Colombia. |
| (4) | The percentage of total average liabilities attributable to foreign activities was 42.2% and 37.8%, respectively, for the fiscal years ended December 31, 2015 and 2014. |
| | | Average Balance Sheet and Interest Paid on Interest-Bearing Liabilities for the Fiscal Years
Ended December 31, | |
| | | 2012 | | | 2011 | | | 2010 | |
| | | Average
Balance | | | Interest
Paid | | | Average
Yield /
Rate(1) | | | Average
Balance | | | Interest
Paid | | | Average
Yield /
Rate(1) | | | Average
Balance | | | Interest
Paid | | | Average
Yield /
Rate(1) | |
| | | (COP million, except percentages) | |
| LIABILITIES AND STOCKHOLDERS’ EQUITY | | | | | | | | | | | | | | | | | | | | | | | | | | | |
| Interest-bearing liabilities: | | | | | | | | | | | | | | | | | | | | | | | | | | | | | | | | | | | | |
| Checking deposits | | | | | | | | | | | | | | | | | | | | | | | | | | | | | | | | | | | | |
| Peso-denominated | | | 815,018 | | | | 14,854 | | | | 1.8 | % | | | 1,133,887 | | | | 27,648 | | | | 2.4 | % | | | 852,041 | | | | 24,357 | | | | 2.9 | % |
| U.S. Dollar-denominated | | | 1,552,101 | | | | 10,077 | | | | 0.6 | % | | | 1,761,949 | | | | 12,278 | | | | 0.7 | % | | | 1,679,362 | | | | 14,501 | | | | 0.9 | % |
| Total | | | 2,367,119 | | | | 24,931 | | | | 1.1 | % | | | 2,895,836 | | | | 39,926 | | | | 1.4 | % | | | 2,531,403 | | | | 38,858 | | | | 1.5 | % |
| Savings deposits | | | | | | | | | | | | | | | | | | | | | | | | | | | | | | | | | | | | |
| Peso-denominated | | | 20,523,024 | | | | 645,429 | | | | 3.1 | % | | | 17,804,695 | | | | 465,477 | | | | 2.6 | % | | | 14,046,068 | | | | 307,106 | | | | 2.2 | % |
| U.S. Dollar-denominated | | | 2,516,804 | | | | 13,926 | | | | 0.6 | % | | | 2,423,260 | | | | 13,965 | | | | 0.6 | % | | | 2,122,407 | | | | 14,556 | | | | 0.7 | % |
| Total | | | 23,039,828 | | | | 659,355 | | | | 2.9 | % | | | 20,227,955 | | | | 479,442 | | | | 2.4 | % | | | 16,168,475 | | | | 321,662 | | | | 2.0 | % |
| Time deposits | | | | | | | | | | | | | | | | | | | | | | | | | | | | | | | | | | | | |
| Peso-denominated | | | 15,434,855 | | | | 948,569 | | | | 6.1 | % | | | 11,069,415 | | | | 547,775 | | | | 4.9 | % | | | 11,117,836 | | | | 537,145 | | | | 4.8 | % |
| U.S. Dollar-denominated | | | 6,254,808 | | | | 168,866 | | | | 2.7 | % | | | 5,720,138 | | | | 142,682 | | | | 2.5 | % | | | 5,835,906 | | | | 156,601 | | | | 2.7 | % |
| Total | | | 21,689,663 | | | | 1,117,435 | | | | 5.2 | % | | | 16,789,553 | | | | 690,457 | | | | 4.1 | % | | | 16,953,742 | | | | 693,746 | | | | 4.1 | % |
| Funds purchased and securities sold under agreements to repurchase | | | | | | | | | | | | | | | | | | | | | | | | | | | | | | | | | | | | |
| Peso-denominated | | | 1,783,698 | | | | 95,984 | | | | 5.4 | % | | | 2,055,858 | | | | 82,757 | | | | 4.0 | % | | | 1,457,443 | | | | 38,867 | | | | 2.7 | % |
| U.S. Dollar-denominated | | | 85,580 | | | | 1,636 | | | | 1.9 | % | | | 171,464 | | | | 2,503 | | | | 1.5 | % | | | 119,075 | | | | 1,584 | | | | 1.3 | % |
| Total | | | 1,869,278 | | | | 97,620 | | | | 5.2 | % | | | 2,227,322 | | | | 85,260 | | | | 3.8 | % | | | 1,576,518 | | | | 40,451 | | | | 2.6 | % |
| Borrowings from development and other domestic banks(2) | | | | | | | | | | | | | | | | | | | | | | | | | | | | | | | | | | | | |
| Peso-denominated | | | 3,114,989 | | | | 216,746 | | | | 7.0 | % | | | 2,746,976 | | | | 157,471 | | | | 5.7 | % | | | 2,521,533 | | | | 133,673 | | | | 5.3 | % |
| U.S. Dollar-denominated | | | 62,503 | | | | 3,350 | | | | 5.4 | % | | | 61,949 | | | | 2,438 | | | | 3.9 | % | | | 127,093 | | | | 5,359 | | | | 4.2 | % |
| Total | | | 3,177,492 | | | | 220,096 | | | | 6.9 | % | | | 2,808,925 | | | | 159,909 | | | | 5.7 | % | | | 2,648,626 | | | | 139,032 | | | | 5.2 | % |
| Interbank borrowings(2) (3) | | | | | | | | | | | | | | | | | | | | | | | | | | | | | | | | | | | | |
| Peso-denominated | | | - | | | | - | | | | | | | | - | | | | - | | | | - | | | | - | | | | - | | | | | |
| U.S. Dollar-denominated | | | 2,488,285 | | | | 50,209 | | | | 2.0 | % | | | 2,949,935 | | | | 45,840 | | | | 1.6 | % | | | 1,449,197 | | | | 19,537 | | | | 1.3 | % |
| Total | | | 2,488,285 | | | | 50,209 | | | | 2.0 | % | | | 2,949,935 | | | | 45,840 | | | | 1.6 | % | | | 1,449,197 | | | | 19,537 | | | | 1.3 | % |
| Long-term debt | | | | | | | | | | | | | | | | | | | | | | | | | | | | | | | | | | | | |
| Peso-denominated | | | 5,113,227 | | | | 405,946 | | | | 7.9 | % | | | 3,849,149 | | | | 298,847 | | | | 7.8 | % | | | 2,759,345 | | | | 209,542 | | | | 7.6 | % |
| U.S. Dollar-denominated | | | 5,674,347 | | | | 319,268 | | | | 5.6 | % | | | 4,175,142 | | | | 242,325 | | | | 5.8 | % | | | 1,952,604 | | | | 108,753 | | | | 5.6 | % |
| Total | | | 10,787,574 | | | | 725,214 | | | | 6.7 | % | | | 8,024,291 | | | | 541,172 | | | | 6.7 | % | | | 4,711,949 | | | | 318,295 | | | | 6.8 | % |
| Total interest-bearing liabilities | | | | | | | | | | | | | | | | | | | | | | | | | | | | | | | | | | | | |
| Peso-denominated | | | 46,784,811 | | | | 2,327,528 | | | | 5.0 | % | | | 38,659,980 | | | | 1,579,975 | | | | 4.1 | % | | | 32,754,266 | | | | 1,250,690 | | | | 3.8 | % |
| U.S. Dollar-denominated | | | 18,634,428 | | | | 567,332 | | | | 3.0 | % | | | 17,263,837 | | | | 462,031 | | | | 2.7 | % | | | 13,285,644 | | | | 320,891 | | | | 2.4 | % |
| Total | | | 65,419,239 | | | | 2,894,860 | | | | 4.4 | % | | | 55,923,817 | | | | 2,042,006 | | | | 3.7 | % | | | 46,039,910 | | | | 1,571,581 | | | | 3.4 | % |
| Total interest and non-interest bearing liabilities and stockholders’ equity | | | | | | | | | | | | | | | | | | | | | | | | | | | | | | | | | | | | |
| Peso-denominated | | | 69,753,379 | | | | 2,327,528 | | | | | | | | 57,205,647 | | | | 1,579,975 | | | | | | | | 47,981,394 | | | | 1,250,690 | | | | | |
| U.S. Dollar-denominated | | | 18,903,234 | | | | 567,332 | | | | | | | | 18,554,177 | | | | 462,031 | | | | | | | | 15,373,687 | | | | 320,891 | | | | | |
| Total Liabilities and Stockholders’ Equity (COP) | | | 88,656,613 | | | | 2,894,860 | | | | | | | | 75,759,824 | | | | 2,042,006 | | | | | | | | 63,355,081 | | | | 1,571,581 | | | | | |
_____________________________
(1) See “Item 4. Information on the Company – E. Selected Statistical Information – E.1 Distribution of Assets, Liablilities and Stockholders’ Equity; Interest Rates and Interest Differential”.
(2) Includes both short-term and long-term borrowings.
(3) Includes borrowings from banks located outside Colombia.
CHANGES IN NET INTEREST INCOME AND EXPENSES—VOLUME AND RATE ANALYSIS
The following table allocates, by currency of denomination,for domestic and foreign activities, changes in the Bank’s net interest income to changes in average volume, changes in nominal rates and the net variance caused by changes in both average volume and nominal rate for the fiscal year ended December 31, 20122015 compared to the fiscal year ended December 31, 2011; and the fiscal year ended December 31, 2011 compared to the fiscal year ended December 31, 2010.2014. Volume and rate variances have been calculated based on movements in average balances over the period and changes in nominal interest rates on average interest-earning assets and average interest-bearing liabilities. Net changes attributable to changes in both volume and interest rate have been allocated to the change due to changes in volume.
| | | 2011-2012
Increase (Decrease)
Due To Changes in: | | | 2010-2011
Increase (Decrease)
Due To Changes in: | |
| | | Volume | | | Rate | | | Net
Change | | | Volume | | | Rate | | | Net
Change | |
| | | (COP million) | |
| Interest-earning assets: | | | | | | | | | | | | | | | | | | | | | | | | |
| Funds sold and securities purchased under agreements to resell | | | | | | | | | | | | | | | | | | | | | | | | |
| Peso-denominated | | | 7,548 | | | | 3,540 | | | | 11,088 | | | | (33,212 | ) | | | 9,993 | | | | (23,219 | ) |
| U.S. Dollar-denominated | | | 1,291 | | | | (7,021 | ) | | | (5,730 | ) | | | 1,331 | | | | (1,290 | ) | | | 41 | |
| Total | | | 8,839 | | | | (3,481 | ) | | | 5,358 | | | | (31,881 | ) | | | 8,703 | | | | (23,178 | ) |
| Investment securities | | | | | | | | | | | | | | | | | | | | | | | | |
| Peso-denominated | | | 10,281 | | | | 103,399 | | | | 113,680 | | | | 79,750 | | | | 115,785 | | | | 195,535 | |
| U.S. Dollar-denominated | | | 930 | | | | 19,344 | | | | 20,274 | | | | (62 | ) | | | (24,282 | ) | | | (24,344 | ) |
| Total | | | 11,211 | | | | 122,743 | | | | 133,954 | | | | 79,688 | | | | 91,503 | | | | 171,191 | |
| Loans and financial leases | | | | | | | | | | | | | | | | | | | | | | | | |
| Peso-denominated | | | 1,065,700 | | | | 467,870 | | | | 1,533,570 | | | | 715,751 | | | | 16,979 | | | | 732,730 | |
| U.S. Dollar-denominated | | | 52,654 | | | | (9,247 | ) | | | 43,407 | | | | 211,600 | | | | (107,389 | ) | | | 104,211 | |
| Total | | | 1,118,354 | | | | 458,623 | | | | 1,576,977 | | | | 927,351 | | | | (90,410 | ) | | | 836,941 | |
| Total interest-earning assets | | | | | | | | | | | | | | | | | | | | | | | | |
| Peso-denominated | | | 1,083,529 | | | | 574,809 | | | | 1,658,338 | | | | 762,289 | | | | 142,757 | | | | 905,046 | |
| U.S. Dollar-denominated | | | 54,875 | | | | 3,076 | | | | 57,951 | | | | 212,869 | | | | (132,961 | ) | | | 79,908 | |
| Total | | | 1,138,404 | | | | 577,885 | | | | 1,716,289 | | | | 975,158 | | | | 9,796 | | | | 984,954 | |
| | | | | | | | | | | | | | | | | | | | | | | | | |
| Interest-bearing liabilities: | | | | | | | | | | | | | | | | | | | | | | | | |
| Checking deposits | | | | | | | | | | | | | | | | | | | | | | | | |
| Peso-denominated | | | (5,812 | ) | | | (6,982 | ) | | | (12,794 | ) | | | 12,406 | | | | (4,487 | ) | | | 7,919 | |
| U.S. Dollar-denominated | | | (1,362 | ) | | | (839 | ) | | | (2,201 | ) | | | 228 | | | | (11,432 | ) | | | (11,204 | ) |
| Total | | | (7,174 | ) | | | (7,821 | ) | | | (14,995 | ) | | | 12,634 | | | | (15,919 | ) | | | (3,285 | ) |
| Savings deposits | | | | | | | | | | | | | | | | | | | | | | | | |
| Peso-denominated | | | 85,489 | | | | 94,463 | | | | 179,952 | | | | 153,872 | | | | (119,521 | ) | | | 34,351 | |
| U.S. Dollar-denominated | | | 518 | | | | (557 | ) | | | (39 | ) | | | 1,550 | | | | (7,324 | ) | | | (5,774 | ) |
| Total | | | 86,007 | | | | 93,906 | | | | 179,913 | | | | 155,422 | | | | (126,845 | ) | | | 28,577 | |
| Time deposits | | | | | | | | | | | | | | | | | | | | | | | | |
| Peso-denominated | | | 268,284 | | | | 132,510 | | | | 400,794 | | | | (99,515 | ) | | | (452,388 | ) | | | (551,903 | ) |
| U.S. Dollar-denominated | | | 14,435 | | | | 11,749 | | | | 26,184 | | | | (41,955 | ) | | | (92,252 | ) | | | (134,207 | ) |
| Total | | | 282,719 | | | | 144,259 | | | | 426,978 | | | | (141,470 | ) | | | (544,640 | ) | | | (686,110 | ) |
| Funds purchased and securities sold under agreements to repurchase | | | | | | | | | | | | | | | | | | | | | | | | |
| Peso-denominated | | | (14,645 | ) | | | 27,872 | | | | 13,227 | | | | 33,910 | | | | (25,645 | ) | | | 8,265 | |
| U.S. Dollar-denominated | | | (1,642 | ) | | | 775 | | | | (867 | ) | | | (4,704 | ) | | | (12,400 | ) | | | (17,104 | ) |
| Total | | | (16,287 | ) | | | 28,647 | | | | 12,360 | | | | 29,206 | | | | (38,045 | ) | | | (8,839 | ) |
| Borrowings from development and other domestic banks | | | | | | | | | | | | | | | | | | | | | | | | |
| Peso-denominated | | | 25,607 | | | | 33,668 | | | | 59,275 | | | | (8,157 | ) | | | (79,016 | ) | | | (87,173 | ) |
| U.S. Dollar-denominated | | | 30 | | | | 882 | | | | 912 | | | | (14,777 | ) | | | 9,017 | | | | (5,760 | ) |
| Total | | | 25,637 | | | | 34,550 | | | | 60,187 | | | | (22,934 | ) | | | (69,999 | ) | | | (92,933 | ) |
| Interbank borrowings | | | | | | | | | | | | | | | | | | | | | | | | |
| Peso-denominated | | | - | | | | - | | | | - | | | | - | | | | - | | | | - | |
| U.S. Dollar-denominated | | | (9,315 | ) | | | 13,684 | | | | 4,369 | | | | 26,099 | | | | (27,909 | ) | | | (1,810 | ) |
| Total | | | (9,315 | ) | | | 13,684 | | | | 4,369 | | | | 26,099 | | | | (27,909 | ) | | | (1,810 | ) |
| Long-term debt | | | | | | | | | | | | | | | | | | | | | | | | |
| Peso-denominated | | | 100,357 | | | | 6,742 | | | | 107,099 | | | | 111,494 | | | | (69,368 | ) | | | 42,126 | |
| U.S. Dollar-denominated | | | 84,353 | | | | (7,410 | ) | | | 76,943 | | | | 147,343 | | | | (8,479 | ) | | | 138,864 | |
| Total | | | 184,710 | | | | (668 | ) | | | 184,042 | | | | 258,837 | | | | (77,847 | ) | | | 180,990 | |
| Total interest-bearing liabilities | | | | | | | | | | | | | | | | | | | | | | | | |
| Peso-denominated | | | 459,280 | | | | 288,273 | | | | 747,553 | | | | 204,010 | | | | (750,425 | ) | | | (546,415 | ) |
| U.S. Dollar-denominated | | | 87,017 | | | | 18,284 | | | | 105,301 | | | | 113,784 | | | | (150,779 | ) | | | (36,995 | ) |
| Total (COP) | | | 546,297 | | | | 306,557 | | | | 852,854 | | | | 317,794 | | | | (901,204 | ) | | | (583,410 | ) |
| | | 2014-2015
Increase (Decrease)
Due To Changes in: | |
| | Volume | | | Rate | | | Net
Change | |
| | | (in millions of COP) | |
| Interest-earning assets | | | | | | | | | |
| Funds sold and securities purchased under agreements to resell | | | | | | | | | | | | |
| Domestic activities | | | 17,049 | | | | (48,426 | ) | | | (31,377 | ) |
| Foreign activities | | | (4,471 | ) | | | 7,750 | | | | 3,279 | |
| Total | | | 12,578 | | | | (40,676 | ) | | | (28,098 | ) |
| Investment securities(1) | | | | | | | | | | | | |
| Domestic activities | | | (22,309 | ) | | | (46,968 | ) | | | (69,277 | ) |
| Foreign activities | | | 31,414 | | | | (58,960 | ) | | | (27,546 | ) |
| Total | | | 9,105 | | | | (105,928 | ) | | | (96,823 | ) |
| Loans and financial leases | | | | | | | | | | | | |
| Domestic activities | | | 1,248,112 | | | | 103,741 | | | | 1,351,853 | |
| Foreign activities | | | 790,285 | | | | 27,413 | | | | 817,698 | |
| Total | | | 2,038,397 | | | | 131,154 | | | | 2,169,551 | |
| Total interest-earning assets | | | | | | | | | | | | |
| Domestic activities | | | 1,242,852 | | | | 8,347 | | | | 1,251,199 | |
| Foreign activities | | | 817,228 | | | | (23,797 | ) | | | 793,431 | |
| Total | | | 2,060,080 | | | | (15,450 | ) | | | 2,044,630 | |
| | | | | | | | | | | | | |
| Interest-bearing liabilities: | | | | | | | | | | | | |
| Checking deposits | | | | | | | | | | | | |
| Domestic activities | | | 253 | | | | (2,404 | ) | | | (2,151 | ) |
| Foreign activities | | | 4,155 | | | | 9,105 | | | | 13,260 | |
| Total | | | 4,408 | | | | 6,701 | | | | 11,109 | |
| Savings deposits | | | | | | | | | | | | |
| Domestic activities | | | 48,555 | | | | 38,045 | | | | 86,600 | |
| Foreign activities | | | 42,376 | | | | (3,763 | ) | | | 38,613 | |
| Total | | | 90,931 | | | | 34,282 | | | | 125,213 | |
| Time deposits | | | | | | | | | | | | |
| Domestic activities | | | 114,256 | | | | 146,940 | | | | 261,196 | |
| Foreign activities | | | 136,096 | | | | 2,285 | | | | 138,381 | |
| Total | | | 250,352 | | | | 149,225 | | | | 399,577 | |
| Funds purchased and securities sold under agreements to repurchase | | | | | | | | | | | | |
| Domestic activities | | | 67,434 | | | | (35,423 | ) | | | 32,011 | |
| Foreign activities | | | 234 | | | | (1,994 | ) | | | (1,760 | ) |
| Total | | | 67,668 | | | | (37,417 | ) | | | 30,251 | |
| Borrowings from development and other domestic banks | | | | | | | | | | | | |
| Domestic activities | | | 5,696 | | | | (116,746 | ) | | | (111,050 | ) |
| Foreign activities | | | 5,489 | | | | (5,486 | ) | | | 3 | |
| Total | | | 11,185 | | | | (122,232 | ) | | | (111,047 | ) |
| Interbank borrowings | | | | | | | | | | | | |
| Domestic activities | | | - | | | | - | | | | - | |
| Foreign activities | | | 49,341 | | | | (1,421 | ) | | | 47,920 | |
| Total | | | 49,341 | | | | (1,421 | ) | | | 47,920 | |
| Long-term debt | | | | | | | | | | | | |
| Domestic-activities | | | 85,772 | | | | 55,701 | | | | 141,473 | |
| Foreign-activities | | | 150,669 | | | | (12,488 | ) | | | 138,181 | |
| Total | | | 236,441 | | | | 43,213 | | | | 279,654 | |
| Total interest-bearing liabilities | | | | | | | | | | | | |
| Domestic-activities | | | 321,966 | | | | 86,113 | | | | 408,079 | |
| Foreign-activities | | | 388,360 | | | | (13,762 | ) | | | 374,598 | |
| Total | | | 710,326 | | | | 72,351 | | | | 782,677 | |
(1)Tax-exempt income of tax-exempt investment securities has not been calculated on a tax equivalent basis because the effect of such calculation would not be material.
INTEREST-EARNING ASSETS — NET INTEREST MARGIN AND SPREAD
The following table presents the levels of average interest-earning assets and net interest income of the Bank and illustrates the comparative net interest margin and interest spread obtained for the fiscal years ended December 31, 2012, 20112015 and 2010,2014, respectively.
| | | Interest-Earning Assets Yield For the Fiscal
Year Ended December 31, | | | Interest-Earning Assets-Yield For the Fiscal
Year Ended December 31, | |
| | | 2012 | | | 2011 | | | 2010 | | | 2015 | | 2014 | |
| | | (COP million, except percentages) | | | (COP million, except percentages) | |
| Total average interest-earning assets | | | | | | | | | | | | | | | | | | | | |
| Peso-denominated | | | 55,106,038 | | | | 46,510,600 | | | | 40,097,093 | | |
| U.S. Dollar-denominated | | | 18,300,900 | | | | 16,779,428 | | | | 12,999,557 | | |
| Domestic activities | | | | 88,945,146 | | | | 77,971,904 | |
| Foreign activities | | | | 50,469,573 | | | | 35,632,142 | |
| Total | | | 73,406,938 | | | | 63,290,028 | | | | 53,096,650 | | | | 139,414,719 | | | | 113,604,046 | |
| Net interest income(1) | | | | | | | | | | | | | | | | | | | | |
| Peso-denominated | | | 4,474,243 | | | | 3,563,458 | | | | 2,987,697 | | |
| U.S. Dollar-denominated | | | 292,780 | | | | 340,130 | | | | 401,362 | | |
| Domestic activities | | | | 6,443,892 | | | | 5,600,771 | |
| Foreign activities | | | | 1,279,812 | | | | 860,979 | |
| Total | | | 4,767,023 | | | | 3,903,588 | | | | 3,389,059 | | | | 7,723,704 | | | | 6,461,750 | |
| Average yield on interest-earning assets | | | | | | | | | | | | | | | | | | | | |
| Peso-denominated | | | 12.3 | % | | | 11.1 | % | | | 10.6 | % | |
| U.S. Dollar-denominated | | | 4.7 | % | | | 4.8 | % | | | 5.6 | % | |
| Domestic activities | | | | 10.2 | % | | | 10.0 | % |
| Foreign activities | | | | 5.3 | % | | | 5.2 | % |
| Total | | | 10.4 | % | | | 9.4 | % | | | 9.3 | % | | | 8.4 | % | | | 8.5 | % |
| Net interest margin(2) | | | | | | | | | | | | | | | | | | | | |
| Peso-denominated | | | 8.1 | % | | | 7.7 | % | | | 7.5 | % | |
| U.S. Dollar-denominated | | | 1.6 | % | | | 2.0 | % | | | 3.1 | % | |
| Domestic activities | | | | 7.2 | % | | | 7.2 | % |
| Foreign activities | | | | 2.5 | % | | | 2.4 | % |
| Total | | | 6.5 | % | | | 6.2 | % | | | 6.4 | % | | | 5.5 | % | | | 5.7 | % |
| Interest spread(3) | | | | | | | | | | | | | | | | | | | | |
| Peso-denominated | | | 7.4 | % | | | 7.0 | % | | | 6.8 | % | |
| U.S. Dollar-denominated | | | 1.7 | % | | | 2.1 | % | | | 3.1 | % | |
| Domestic activities | | | | 6.9 | % | | | 6.9 | % |
| Foreign activities | | | | 2.9 | % | | | 2.8 | % |
| Total | | | 6.0 | % | | | 5.7 | % | | | 5.9 | % | | | 5.5 | % | | | 5.7 | % |
| (1) | Net interest income is loan interest income less interest accrued and includes interest earned on investments. |
| (2) | Net interest margin is net interest income divided by total average interest-earning assets. |
| (3) | Interest spread is the difference between the average yield on interest-earning assets and the average rate accrued on interest-bearing liabilities. |
The Bank acquires and holds investment securities, including fixed income debt and equity securities, for liquidity and other strategic purposes, or when it is required by law.
The SFCInternational Financial Reporting Standard 9 (IFRS 9) requires investments to be classified as “trading”, “available for sale”either amortized cost or “held to maturity”. Trading investments are those acquired primarily to obtain profits from fluctuations in short-term prices and are recorded at marketfair value. The difference between currentclassification is based on: (a) the entity’s business model for managing the financial assets, and previous market value(b) the contractual cash flow characteristics of the financial asset. Accordingly, an investment is addedclassified and measured as amortized cost if: (i) the asset is held within a business model whose objective is to or subtracted fromhold assets in order to collect contractual cash flows and (ii) the contractual terms of the financial asset give rise on specified dates to cash flows that are solely payments of principal and interest on the principal amount outstanding.
Indicators that the financial asset is impaired include historical performance data, particular characteristics of the borrower, fair value of collateral, the investmentborrower’s debt to other entities, macroeconomic factors and creditedfinancial information, a significant financial difficulty of the customers, or chargedif they are likely to earnings. “Available for sale”declare bankruptcy or financial restructuring, or if there is a breach of contract, such as a default or delinquency in interest or principal payments.
For purposes of measurement and recognition of the investments are those held for at least one yearimpairment in subsidiaries, affiliates, associates and are recorded at market value with changes to the values of these securities recorded in a separate accountjoint ventures in the equity section. “Held to maturity” investments are those acquired to be held until maturity and are valued at amortized cost.
As of December 31, 2012, Bancolombia’s investment portfolio had a value of COP 11,418 billion.
In accordance with Chapter 1 of Circular 100 of 1995 (Basic Accounting Circular) issued byIndividual Financial Statements, the SFC, investments in debt securities are fully tested for impairment in June and December and partially tested for impairment on a quarterly basis; in each case taking into accountcontrolled companies must meet the related solvency risk, market exposure, currency exchange and country risk. Investments in securities rated by external agencies recognized by the SFC cannot be recorded on the balance sheetdispositions of the Bank for an amount higher than a certain percentage of the face value (as shown in the table below), net of the amortizations recorded as of the valuation date.IAS 39.
Long-Term Classification
| | Maximum Face Value (%)
|
BB+, BB, BB- | | Ninety (90) |
B+, B, B- | | Seventy (70) |
CCC | | Fifty (50) |
DD, EE | | Zero (0) |
Short-Term Classification
| | Maximum Face Value (%)
|
3 | | Ninety (90) |
4 | | Fifty (50) |
5 and 6 | | Zero (0) |
Internal or external debt securities issued or guaranteed by the Republic of Colombia, as well as those issued by the Central Bank and those issued or guaranteed by Fogafin, are not subject to this adjustment.
The following table sets forth the book value of the Bank’s investments in Colombian Government andgovernment foreign Governmentsgovernments and corporate securities and certain other financial investments as of the dates indicated:
| | | As of December 31, | |
| | | 2012(1)(2) | | | 2011(1)(2) | | | 2010(1)(2) | |
| | | (COP million ) | |
| Foreign currency-denominated | | | | | | | | | | | | |
| Securities issued or secured by the Colombian Government | | COP | 236,890 | | | COP | 200,600 | | | COP | 111,482 | |
| Securities issued or secured by the El Salvador Central Bank | | | 582,418 | | | | 685,853 | | | | 751,689 | |
| Securities issued or secured by Government entities(3) | | | 58,513 | | | | 72,275 | | | | 91,798 | |
| Securities issued or secured by other financial entities | | | 341,302 | | | | 321,765 | | | | 262,361 | |
| Securities issued by foreign Governments | | | 693,751 | | | | 484,272 | | | | 522,599 | |
| Others(4) | | | 205,749 | | | | 212,259 | | | | 184,800 | |
| Subtotal | | | 2,118,623 | | | | 1,977,024 | | | | 1,924,729 | |
| | | | | | | | | | | | | |
| Peso-denominated | | | | | | | | | | | | |
| Securities issued or secured by the Colombian Government | | | 5,959,277 | | | | 3,405,746 | | | | 2,157,162 | |
| Securities issued or secured by Government entities | | | 1,278,576 | | | | 1,191,753 | | | | 1,011,385 | |
| Securities issued or secured by financial entities | | | 1,997,260 | | | | 2,534,782 | | | | 2,969,900 | |
| Others(4) | | | 64,319 | | | | 75,051 | | | | 117,909 | |
| Subtotal | | | 9,299,432 | | | | 7,207,332 | | | | 6,256,356 | |
| Total, net | | COP | 11,418,055 | | | COP | 9,184,356 | | | COP | 8,181,085 | |
__________________indicated(1):
| | | As of December 31, | |
| | | 2015(2) | | | 2014(2) | |
| | | (in millions of COP) | |
| Foreing currency-denominated | | | | | | | | |
| Securities issued by foreign Governments(3) | | | 4,443,307 | | | | 1,789,280 | |
| Securities issued or secured by other financial entities | | | 905,171 | | | | 663,209 | |
| Securities issued or secured by Colombian Government | | | 188,618 | | | | 205,572 | |
| Securities issued or secured by the El Salvador Central Bank | | | 43,913 | | | | 23,638 | |
| Securities issued or secured by Government entities | | | 9,997 | | | | 7,830 | |
| Others(4) | | | 531,044 | | | | 148,017 | |
| Subtotal | | | 6,122,050 | | | | 2,837,546 | |
| Peso-denominated | | | | | | | | |
| Securities issued or secured by financial entities | | | 838,769 | | | | 876,180 | |
| Securities issued or secured by the Colombian Government | | | 4,644,051 | | | | 6,333,255 | |
| Securities issued or secured by Government entities | | | 1,475,055 | | | | 1,423,619 | |
| Others | | | 33,218 | | | | 32,337 | |
| Subtotal (5) | | | 6,991,093 | | | | 8,665,391 | |
| Total | | | 13,113,143 | | | | 11,502,937 | |
(1)
| (1) | For further information, see Note 5 “Financial assets investments and derivatives”. |
| (2) | Includes debt securities only. Net investments in equity securities were COP 1,164,681 million and COP 1,281,286 million for 2015 and 2014, respectively. |
| (3) | Due to the acquisition of Grupo Agromercantil in 2015, the Bank has increased significantly its position in securities issued by the Republic of Guatemala, Costa Rica and Panama, which reached COP 1,694,426 million as of December 31, 2015. |
| (4) | Includes debt securities in corporate bonds. |
| (5) | Tuya S.A. Compañía de Financiamiento as a discontinued operation, had as of December 31, 2015 debt securities amounting to COP 30,271, which were classified in “Securities issued or secured by Government entities” item. For further information see Note 31 “Discontinued Operations”. |
As of December 31, 2015 and 2014 Bancolombia held securities only. Net investments in equity securities were COP 1,136,256 million, COP 773,835 million and COP 494,678 million for 2012, 2011 and 2010.
(2) These amounts are net of allowances for decline in value which were COP 14,159 million for 2012, COP 16,854 million for 2011 and COP 45,726 million for 2010.
(3) This amount includes investments in fiduciary certificates of participation. These certificates were issued for the Environmental Trust for the conservation of the Coffee Forest (Fideicomiso Ambiental para la Conservación del Bosque Cafeteroor “FICAFE”). This trust was formed with the transfer of the coffee sector’s loan portfolio by a number of banks in El Salvador, including Banco Agrícola. The purpose of this transaction was to carry out the restructuring of those loans, promoted by the Government of El Salvador. The Bank has recognized an allowance related to probable losses inherentforeign governments in the FICAFE investment in an amount of COP 32,297 million and COP 41,926 million at December 31, 2012 and 2011, respectively.following amounts:
(4) Includes debt securities in corporate bonds.
As of December 31, | | Issuer | | Investment Amount–Book Value - (in millions of COP) | | | Investment Amount–Book Value (thousands of U.S. dollars) | |
| | | | | | | | | |
| 2015 | | Republic of Guatemala | | | 1,670,390 | | | | 530,372 | |
| | | Republic of Panama | | | 923,470 | | | | 293,214 | |
| | | U.S. Treasury | | | 523,707 | | | | 166,284 | |
| | | United Mexican States | | | 479,304 | | | | 152,186 | |
| | | Republic of Costa Rica | | | 123,196 | | | | 39,117 | |
| | | Republic of El Salvador | | | 688,522 | | | | 218,615 | |
| | | Republic of Brazil | | | 34,718 | | | | 11,023 | |
| 2014 | | Republic of Panama | | | 811,489 | | | | 339,186 | |
| | | U.S. Treasury | | | 203,223 | | | | 84,943 | |
| | | United Mexican States | | | 449,018 | | | | 187,680 | |
| | | Republic of Costa Rica | | | 74,968 | | | | 31,335 | |
| | | Republic of El Salvador | | | 184,053 | | | | 76,930 | |
| | | Republic of Brazil | | | 57,292 | | | | 23,947 | |
| | | Republic of Chile | | | 9,237 | | | | 3,861 | |
As of December 31, 2012, 2011 and 2010 Bancolombia held securities issued by foreign Governments in2015, the following amounts:
| As of December 31, | | Issuer | | | Investment Amount–Book
Value (in millions of pesos)(1) | | | | Investment Amount–Book
Value (thousands of U.S.
dollars)(1) (2) | |
| | | | | | | | | | | |
| 2012 | | Republic of El Salvador | | | COP | 403,541 | | | | USD | 228,218 | |
| | | Republic of Chile | | | COP | 76,235 | | | | USD | 43,114 | |
| | | Republic of Brazil | | | COP | 74,601 | | | | USD | 42,189 | |
| | | U.S. Treasury | | | COP | 52,985 | | | | USD | 29,965 | |
| | | Republic of Mexico | | | COP | 48,629 | | | | USD | 27,501 | |
| | | Republic of Costa Rica | | | COP | 31,133 | | | | USD | 17,607 | |
| | | Republic of Panama | | | COP | 10,761 | | | | USD | 6,086 | |
| | | Republic of Peru | | | COP | 6,496 | | | | USD | 3,674 | |
| 2011 | | Republic of El Salvador | | | COP | 310,088 | | | | USD | 159,617 | |
| | | U.S. Treasury | | | COP | 113,335 | | | | USD | 58,339 | |
| | | Republic of Brazil | | | COP | 46,063 | | | | USD | 23,711 | |
| | | Republic of Panama | | | COP | 11,193 | | | | USD | 5,761 | |
| | | Republic of Peru | | | COP | 10,406 | | | | USD | 5,357 | |
| | | Republic of Chile | | | COP | 171 | | | | USD | 88 | |
| 2010 | | Republic of El Salvador | | | COP | 335,402 | | | | USD | 175,238 | |
| | | U.S. Treasury | | | COP | 99,567 | | | | USD | 52,021 | |
| | | Republic of Brazil | | | COP | 68,294 | | | | USD | 35,682 | |
| | | Republic of Panama | | | COP | 43,446 | | | | USD | 22,699 | |
| | | Republic of Peru | | | COP | 10,720 | | | | USD | 5,601 | |
| | | Republic of Chile | | | COP | 153 | | | | USD | 80 | |
_________________________
| (1) | These amounts are not net of allowances for decline in value which were COP 10,630 million (USD 6 million) for 2012, COP 6,983 million (USD 3.6 million) for 2011 and COP 34,983 million (USD 18 million) for 2010. |
| (2) | These amounts have been translated at the rate of COP 1,768.23 per USD 1.00 at December 2012, COP 1,942.70 per USD 1.00 at December 2011 and COP 1,913.98 per USD 1.00 at December 2010, which corresponds to the Representative Market Rate, calculated on December 31, the last business day of the year. |
As of December 31, 2012, the Bank’s peso-denominated debt securities portfolio amounted to COP 9,2996,991 billion, reflecting a 29% increase19% decrease compared to the level at December 31, 2011.2014. The increasedecrease resulted mainly from an increasea reduction in holdings of securitiesSecurities issued or secured by the Colombian Government.Government and financial entities. Peso-denominated debt securities issued by the Colombian Government represented 64%66% of the Bank’s peso-denominated debt securities portfolio in 2012.as of December 31, 2015.
On the other hand, as of December 31, 2012,2015, Bancolombia’s held securities issued by foreign Governmentsgovernments amounted to COP 6934,443 billion, (net of allowances for decline in value), increasing in 43%148% compared to the end of 2011.December 31, 2014. This variation is primarily explained by an increase in the Bank’s position in Chilean and Mexican sovereign bonds.acquisition of Grupo Agromercantil.
INVESTMENT SECURITIES PORTFOLIO MATURITY
The following table summarizes the maturities and weighted average nominal yields of the Bank’s investment securities as of December 31, 2012:2015:
| | | As of December 31, 2012 | |
| | | Maturing in less than 1
year | | | Maturing between 1 and 5
years | | | Maturing between 5 and
10 years | | | Maturing in more
than 10 years | | | Total | |
| | | Balance(1) | | | Yield %(2) | | | Balance(1) | | | Yield %(2) | | | Balance(1) | | | Yield %(2) | | | Balance(1) | | | Yield %(2) | | | Balance(1) | | | Yield %(2) | |
| (COP million, except yields) |
| Securities issued or secured by: | | | | | | | | | | | | | | | | | | | | | | | | | | | | | | | | | | | | | | | | |
| Foreign currency-denominated: | | | | | | | | | | | | | | | | | | | | | | | | | | | | | | | | | | | | | | | | |
| Colombian Government | | | 7,599 | | | | 5.53 | % | | | 67,512 | | | | 2.12 | % | | | 161,755 | | | | 2.18 | % | | | 24 | | | | 6.93 | % | | | 236,890 | | | | 2.27 | % |
| El Salvador Central Bank | | | 582,418 | | | | 0.40 | % | | | - | | | | - | | | | - | | | | - | | | | - | | | | - | | | | 582,418 | | | | 0.40 | % |
| Other Government entities | | | - | | | | - | | | | 7,544 | | | | 4.21 | % | | | 12,530 | | | | 4.61 | % | | | 38,439 | | | | 3.27 | % | | | 58,513 | | | | 3.68 | % |
| Other financial entities | | | 14,118 | | | | 3.70 | % | | | 157,222 | | | | 3.97 | % | | | 169,962 | | | | 4.87 | % | | | - | | | | - | | | | 341,302 | | | | 4.41 | % |
| Foreign Governments | | | 378,848 | | | | 4.11 | % | | | 47,574 | | | | 1.15 | % | | | 181,367 | | | | 2.96 | % | | | 85,962 | | | | 4.63 | % | | | 693,751 | | | | 3.67 | % |
| Others | | | - | | | | - | | | | 98,517 | | | | 6.88 | % | | | 99,964 | | | | 4.04 | % | | | 7,268 | | | | 5.01 | % | | | 205,749 | | | | 5.44 | % |
| Subtotal | | | 982,983 | | | | 1.91 | % | | | 378,369 | | | | 4.05 | % | | | 625,578 | | | | 3.48 | % | | | 131,693 | | | | 4.25 | % | | | 2,118,623 | | | | 2.90 | % |
| | | | | | | | | | | | | | | | | | | | | | | | | | | | | | | | | | | | | | | | | |
| Securities issued or secured by: | | | | | | | | | | | | | | | | | | | | | | | | | | | | | | | | | | | | | | | | |
| Peso-denominated | | | | | | | | | | | | | | | | | | | | | | | | | | | | | | | | | | | | | | | | |
| Colombian Government | | | 534,420 | | | | 5.03 | % | | | 3,766,334 | | | | 5.10 | % | | | 206,486 | | | | 5.59 | % | | | 57,192 | | | | 6.03 | % | | | 4,564,432 | | | | 5.12 | % |
| Government entities | | | 1,261,441 | | | | 2.41 | % | | | 9,583 | | | | 7.55 | % | | | 7,552 | | | | 0.87 | % | | | - | | | | - | | | | 1,278,576 | | | | 2.43 | % |
| Other financial entities | | | 121,895 | | | | 6.17 | % | | | 228,600 | | | | 6.99 | % | | | 692,450 | | | | 6.93 | % | | | 652,639 | | | | 11.75 | % | | | 1,695,584 | | | | 8.74 | % |
| Others | | | 20,138 | | | | 6.63 | % | | | 37,390 | | | | 3.38 | % | | | 6,791 | | | | 7.69 | % | | | - | | | | - | | | | 64,319 | | | | 4.85 | % |
| Subtotal | | | 1,937,894 | | | | 3.41 | % | | | 4,041,907 | | | | 5.19 | % | | | 913,279 | | | | 6.58 | % | | | 709,831 | | | | 11.29 | % | | | 7,602,911 | | | | 5.47 | % |
| | | | | | | | | | | | | | | | | | | | | | | | | | | | | | | | | | | | | | | | | |
| Securities issued or secured by: | | | | | | | | | | | | | | | | | | | | | | | | | | | | | | | | | | | | | | | | |
| UVR-denominated | | | | | | | | | | | | | | | | | | | | | | | | | | | | | | | | | | | | | | | | |
| Colombian Government | | | 1,034,410 | | | | 1.38 | % | | | 349,340 | | | | 0.54 | % | | | 8,857 | | | | 2.51 | % | | | 2,238 | | | | 2.84 | % | | | 1,394,845 | | | | 1.18 | % |
| Other financial entities | | | - | | | | - | | | | 26,142 | | | | 5.75 | % | | | 211,936 | | | | 4.13 | % | | | 63,598 | | | | 9.12 | % | | | 301,676 | | | | 5.32 | % |
| Subtotal | | | 1,034,410 | | | | 1.38 | % | | | 375,482 | | | | 0.90 | % | | | 220,793 | | | | 4.06 | % | | | 65,836 | | | | 8.90 | % | | | 1,696,521 | | | | 1.91 | % |
| Total (COP) | | | 3,955,287 | | | | | | | | 4,795,758 | | | | | | | | 1,759,650 | | | | | | | | 907,360 | | | | | | | | 11,418,055 | | | | | |
| | | As of December 31, 2015 | |
| | | Maturity less than 1 year | | | Maturity between 1 and 5 years | | | Maturity between 5 and 10 Years | | | Maturity more than 10 years | | | Total | |
| | | Balance | | | Yield %(1) | | | Balance | | | Yield %(1) | | | Balance | | | Yield %(1) | | | Balance | | | Yield %(1) | | | Balance | | | Yield %(1) | |
| | | (in millions of COP, except yields) | |
Securities issued or secured by: Foreign currency.-denominated (2): | | | | | | | | | | | | | | | | | | | | | | | | | | | | | | | | | | | | | | | | |
| Foreign Governments | | | 1,312,280 | | | | 3.15 | % | | | 1,589,018 | | | | 2.33 | % | | | 1,214,720 | | | | 2.20 | % | | | 327,289 | | | | 0.17 | % | | | 4,443,307 | | | | 2.38 | % |
| Other financial entities | | | 260,004 | | | | 1.70 | % | | | 344,814 | | | | 2.60 | % | | | 37,861 | | | | 4.68 | % | | | 262,492 | | | | - | | | | 905,171 | | | | 1.67 | % |
| Colombian Government | | | 5,647 | | | | 6.69 | % | | | 148,215 | | | | 1.76 | % | | | 24,772 | | | | 4.52 | % | | | 9,984 | | | | 5.91 | % | | | 188,618 | | | | 2.49 | % |
| El Salvador Central Bank | | | 43,913 | | | | 2.65 | % | | | - | | | | - | | | | - | | | | - | | | | - | | | | - | | | | 43,913 | | | | 2.65 | % |
| Other Government entities | | | - | | | | - | | | | 9,997 | | | | 3.37 | % | | | - | | | | - | | | | - | | | | - | | | | 9,997 | | | | 3.37 | % |
| Others | | | 16,365 | | | | 2.56 | % | | | 96,688 | | | | 3.94 | % | | | 376,707 | | | | 6.35 | % | | | 41,284 | | | | 6.36 | % | | | 531,044 | | | | 5.80 | % |
| Subtotal | | | 1,638,209 | | | | 2.91 | % | | | 2,188,732 | | | | 2.41 | % | | | 1,654,060 | | | | 3.24 | % | | | 641,049 | | | | 0.59 | % | | | 6,122,050 | | | | 2.58 | % |
| | | | | | | | | | | | | | | | | | | | | | | | | | | | | | | | | | | | | | | | | |
| Securities issued or secured by Peso-denominated (2) | | | | | | | | | | | | | | | | | | | | | | | | | | | | | | | | | | | | | | | | |
| Other financial entities | | | 124,787 | | | | 3.33 | % | | | 154,029 | | | | 6.25 | % | | | 340,977 | | | | 9.55 | % | | | 132,852 | | | | 11.26 | % | | | 752,645 | | | | 8.14 | % |
| Colombian Government. | | | 1,411,213 | | | | 5.50 | % | | | 1,540,904 | | | | 6.69 | % | | | 99,532 | | | | 7.37 | % | | | 384,116 | | | | 7.55 | % | | | 3,435,765 | | | | 6.31 | % |
| Other Government entities | | | 1,392,894 | | | | 1.40 | % | | | 4,744 | | | | 7.15 | % | | | 77,417 | | | | 7.70 | % | | | - | | | | - | | | | 1,475,055 | | | | 1.75 | % |
| Others | | | 1,988 | | | | 5.59 | % | | | 22,251 | | | | 6.56 | % | | | 8,979 | | | | 6.84 | % | | | - | | | | - | | | | 33,218 | | | | 6.58 | % |
| Subtotal | | | 2,930,882 | | | | 3.46 | % | | | 1,721,928 | | | | 6.65 | % | | | 526,905 | | | | 8.82 | % | | | 516,968 | | | | 8.50 | % | | | 5,696,683 | | | | 5.37 | % |
| Securities issued or secured by UVR-denominated (2) | | | | | | | | | | | | | | | | | | | | | | | | | | | | | | | | | | | | | | | | |
| Other financial entities | | | - | | | | - | | | | 20,046 | | | | 2.01 | % | | | 66,078 | | | | 8.92 | % | | | - | | | | - | | | | 86,124 | | | | 7.31 | % |
| Colombian Government | | | 15,065 | | | | 0.01 | % | | | 1,075,627 | | | | 1.66 | % | | | 117,400 | | | | 2.79 | % | | | 194 | | | | 4.21 | % | | | 1,208,286 | | | | 1.75 | % |
| Subtotal | | | 15,065 | | | | 0.01 | % | | | 1,095,673 | | | | 1.67 | % | | | 183,478 | | | | 5.00 | % | | | 194 | | | | 4.21 | % | | | 1,294,410 | | | | 2.12 | % |
| | | | | | | | | | | | | | | | | | | | | | | | | | | | | | | | | | | | | | | | | |
| Total (COP) | | | 4,584,156 | | | | | | | | 5,006,333 | | | | | | | | 2,364,443 | | | | | | | | 1,158,211 | | | | | | | | 13,113,143 | | | | | |
| (1) | Amounts are netYield was calculated using the internal rate of allowances for decline in value which amounted to COP 14,159 million in 2012.return (IRR) as of December 31, 2015. |
| (2) | Yield wasYields on tax-exempt obligations have not been calculated usingon a tax equivalent basis because the internal return rate (IRR) aseffect of December 31, 2012.such calculation would not be material. |
As of December 31, 2012,2015 and 2014, the Bank had the following investments in securities of issuers that exceeded 10% of the Bank’s stockholders’Bank‘s stockholder‘ equity:
| | | Issuer | | Book value | | | Fair value | |
| | | (COP million) |
| Securities issued or secured by: | | | | | | | | | | |
| Colombian Government | | Ministry of Finance | | COP | 6,196,167 | | | COP | 6,165,857 | |
| Other financial entities | | Titularizadora Colombiana | | | 1,563,673 | | | | 1,535,937 | |
| Government entities | | FINAGRO | | | 1,259,362 | | | | 1,244,041 | |
| Total | | | | COP | 9,019,202 | | | COP | 8,945,835 | |
| | | | | As of December 31, | |
| | | | | 2015 | | | 2014 | |
| | Issuer | | Book Value | | | Fair value | | | Book Value | | | Fair value | |
| | | (in millions of COP) |
| Securities issued or secured by: | | | | | | | | | | | | | | | | | | |
| Colombian Government | | Ministry of Finance | | | 4,691,618 | | | | 4,691,602 | | | | 6,437,069 | | | | 6,433,455 | |
| Total | | | | | 4,691,618 | | | | 4,691,602 | | | | 6,437,069 | | | | 6,433,455 | |
Types of loans
The following table shows the Bank’s loan portfolio classified into corporate, retail (including small and medium enterprise loans), financial leases and mortgage loans:
| | | As of December 31, | | | As of December 31, | |
| | | 2012 | | | 2011 | | | 2010 | | | 2009 | | | 2008 | | | 2015 | | 2014 | |
| | | (COP million) | | | (in millions of COP) | |
| Domestic | | | | | | | | | | | | | | | | | | | | | | | | | | | | |
| Corporate | | | | | | | | | | | | | | | | | | | | | | | | | | | | |
| Trade financing | | | 1,994,779 | | | | 2,338,728 | | | | 1,704,673 | | | | 623,084 | | | | 640,033 | | | | 3,380,106 | | | | 2,896,799 | |
| Loans funded by development banks | | | 245,241 | | | | 252,891 | | | | 300,459 | | | | 485,754 | | | | 970,456 | | | | 1,306,888 | | | | 703,152 | |
| Working capital loans | | | 26,274,367 | | | | 22,234,866 | | | | 18,360,582 | | | | 15,003,979 | | | | 15,524,940 | | | | 42,632,934 | | | | 36,157,009 | |
| Credit cards | | | 30,008 | | | | 30,552 | | | | 31,297 | | | | 26,947 | | | | 33,039 | | | | 54,694 | | | | 47,197 | |
| Overdrafts | | | 82,981 | | | | 66,454 | | | | 38,563 | | | | 45,072 | | | | 55,796 | | | | 126,888 | | | | 67,060 | |
| Total corporate | | | 28,627,376 | | | | 24,923,491 | | | | 20,435,574 | | | | 16,184,836 | | | | 17,224,264 | | | | 47,501,510 | | | | 39,871,217 | |
| | | | | | | | | | | | | | | | | | | | | | | | | | | | | |
| Retail(1) | | | | | | | | | | | | | | | | | | | | | | | | | | | | |
| Credit cards | | | 3,488,787 | | | | 3,161,273 | | | | 2,477,808 | | | | 2,198,127 | | | | 2,317,178 | | | | 3,629,539 | | | | 4,831,945 | |
| Personal loans | | | 5,209,423 | | | | 4,222,015 | | | | 2,890,095 | | | | 2,060,776 | | | | 2,369,852 | | | | 7,104,076 | | | | 6,568,264 | |
| Vehicle loans | | | 2,154,121 | | | | 1,991,909 | | | | 1,332,175 | | | | 1,218,299 | | | | 1,314,685 | | | | 2,517,925 | | | | 2,477,992 | |
| Overdrafts | | | 210,653 | | | | 168,865 | | | | 156,244 | | | | 168,760 | | | | 208,123 | | | | 203,439 | | | | 210,283 | |
| Loans funded by development banks | | | 843,146 | | | | 676,985 | | | | 667,299 | | | | 792,437 | | | | 887,978 | | | | 884,490 | | | | 783,610 | |
| Trade financing | | | 99,596 | | | | 69,210 | | | | 27,547 | | | | 48,955 | | | | 98,344 | | | | 372,339 | | | | 424,596 | |
| Working capital loans | | | 8,380,095 | | | | 6,330,371 | | | | 4,702,240 | | | | 4,346,213 | | | | 4,125,358 | | | | 13,078,764 | | | | 11,909,314 | |
| Total retail | | | 20,385,821 | | | | 16,620,628 | | | | 12,253,408 | | | | 10,833,567 | | | | 11,321,518 | | | | 27,790,572 | | | | 27,206,004 | |
| Financial Leases | | | 8,405,497 | | | | 6,977,454 | | | | 5,737,473 | | | | 5,390,937 | | | | 5,406,712 | | | | 19,898,665 | | | | 17,197,752 | |
| Mortgage | | | 5,164,514 | | | | 4,017,855 | | | | 2,516,376 | | | | 2,556,810 | | | | 2,313,864 | | | | 8,712,892 | | | | 7,353,372 | |
| Total loans and leases | | | 62,583,208 | | | | 52,539,428 | | | | 40,942,831 | | | | 34,966,150 | | | | 36,266,358 | | | | 103,903,639 | | | | 91,628,345 | |
| Allowance for loan losses | | | (2,975,616 | ) | | | (2,455,141 | ) | | | (2,160,119 | ) | | | (2,115,161 | ) | | | (1,810,577 | ) | | | (4,312,564 | ) | | | (4,028,866 | ) |
| Total domestic loans, net (COP) | | | 59,607,592 | | | | 50,084,287 | | | | 38,782,712 | | | | 32,850,989 | | | | 34,455,781 | | |
| Total domestic loans, net | | | | 99,591,075 | | | | 87,599,479 | |
| | | | | | | | | | | | | | | | | | | | | | | | | | | | | |
| Foreign | | | | | | | | | | | | | | | | | | | | | | | | | | | | |
| Corporate | | | | | | | | | | | | | | | | | | | | | | | | | | | | |
| Trade financing | | | 220,834 | | | | 1,889,668 | | | | 1,192,349 | | | | 551,211 | | | | 1,128,931 | | | | 15,192,611 | | | | 6,248,364 | |
| Loans funded by development banks | | | 16,460 | | | | 11,104 | | | | 18,874 | | | | 41,969 | | | | 52,308 | | | | 12,576 | | | | 6,162 | |
| Working capital loans | | | 4,219,310 | | | | 4,001,695 | | | | 3,644,287 | | | | 3,509,893 | | | | 3,807,352 | | | | 8,793,603 | | | | 6,188,503 | |
| Credit cards | | | 5,611 | | | | 16,817 | | | | 6,712 | | | | 8,462 | | | | 9,327 | | | | 25,748 | | | | 9,978 | |
| Overdrafts | | | 20,453 | | | | 29,380 | | | | 5,190 | | | | 5,530 | | | | 7,712 | | | | 6,661 | | | | 7,140 | |
| Total corporate | | | 4,482,668 | | | | 5,948,664 | | | | 4,867,412 | | | | 4,117,065 | | | | 5,005,630 | | | | 24,031,199 | | | | 12,460,147 | |
| | | | | | | | | | | | | | | | | | | | | | | | | | | | | |
| Retail(1) | | | | | | | | | | | | | | | | | | | | | | | | | | | | |
| Credit cards | | | 183,979 | | | | 168,061 | | | | 156,895 | | | | 190,932 | | | | 201,813 | | | | 1,429,351 | | | | 746,691 | |
| Personal loans | | | 1,611,499 | | | | 1,597,624 | | | | 1,649,853 | | | | 1,713,992 | | | | 1,917,663 | | | | 6,106,241 | | | | 4,134,873 | |
| Vehicle loans | | | 1,426 | | | | 1,905 | | | | 2,705 | | | | 3,718 | | | | 5,724 | | | | 637,047 | | | | 373,478 | |
| Overdrafts | | | 12,897 | | | | 18,248 | | | | 18,449 | | | | 19,853 | | | | 21,089 | | | | 74,492 | | | | 53,213 | |
| Loans funded by development banks | | | 19,879 | | | | 16,718 | | | | 12,143 | | | | 9,410 | | | | 8,304 | | | | 66,149 | | | | 41,242 | |
| Trade financing | | | 8,767 | | | | 17,585 | | | | 7,516 | | | | 4,343 | | | | 25,482 | | | | 242,403 | | | | 128,668 | |
| Working capital loans | | | 46,600 | | | | 63,025 | | | | 20,705 | | | | 24,833 | | | | 13,015 | | | | 71,316 | | | | 45,246 | |
| Total retail | | | 1,885,047 | | | | 1,883,166 | | | | 1,868,266 | | | | 1,967,081 | | | | 2,193,090 | | | | 8,626,999 | | | | 5,523,411 | |
| Financial Leases | | | 244,446 | | | | 194,357 | | | | 96,076 | | | | 79,064 | | | | 100,030 | | | | 652,911 | | | | 367,477 | |
| Mortgage | | | 793,310 | | | | 822,813 | | | | 826,505 | | | | 912,614 | | | | 1,077,462 | | | | 8,405,891 | | | | 5,194,273 | |
| Total loans and leases | | | 7,405,471 | | | | 8,849,000 | | | | 7,658,259 | | | | 7,075,824 | | | | 8,376,212 | | | | 41,717,000 | | | | 23,545,308 | |
| Allowance for loan losses | | | (274,023 | ) | | | (357,441 | ) | | | (349,094 | ) | | | (316,506 | ) | | | (323,783 | ) | | | (936,191 | ) | | | (760,391 | ) |
| Total foreign loans, net (COP) | | | 7,131,448 | | | | 8,491,559 | | | | 7,309,165 | | | | 6,759,318 | | | | 8,052,429 | | |
| Total Foreign and Domestic Loans (COP) | | | 66,739,040 | | | | 58,575,846 | | | | 46,091,877 | | | | 39,610,307 | | | | 42,508,210 | | |
| Total foreign loans, net | | | | 40,780,809 | | | | 22,784,917 | |
| | | | | | | | | | |
| Total Foreign and Domestic Loans | | | | 140,371,884 | | | | 110,384,396 | |
(1) Includes loans to high-income individuals and small companies.
| (1) | Includes loans to high-income individuals and small companies. |
The Bank classifies its loan portfolio into the following categories: (i) corporate loans; (ii) retail and small and medium enterprises loans; (iii) financial leases; and (iv) mortgage loans.
As of December 31, 2012,2015, the Bank’s total loan portfolio amounted to COP 69,989145,621 billion, up 14%26.44% as compared to COP 61,388115,174 billion in 2011, and 44% higher than the COP 48,601 billion at the end of 2010.2014. Loan volume performance during 20122015 is primarily explained by the significantly increased economic activity in Colombia, which leddemand from individuals and corporations, to demand more credit.the depreciation of the Colombian Peso and by the acquisition of Grupo Agromercantil Holding S.A. on December 30, 2015. For further discussion of some of these trends please see “ItemItem 5. Operating"Operating and Financial Review and Prospects – D. Trend information”information".
As of December 31, 2012,2015, corporate loans amounted to COP 33,11071,533 billion, or 47%49.12% of loans, and increased 7%36.69% from COP 30,87252,331 billion at December 31, 2014. In 2015, corporations demanded loans for expanding production facilities and for working capital purposes. This demand caused the endstock of 2011.loans to increase in the Bank’s books.
Retail loans totaled COP 22,27136,418 billion, or 32%25.01% of total loans, of which COP 10,49413,210 billion were consumer loans (15%(9.07% of total loans). Retail loans increased 20% over the year.11.27% from COP 32,729 at December 31, 2014. In 2015, individuals demanded credit card loans and leases, to finance vehicles and for personal purposes.
Financial leases totaled COP 8,65020,552 billion as of the end of 2012,December 31, 2015, up 21%17.01% from COP 7,17217,565 billion at the endas of 2011.December 31, 2014.
Mortgage lending activity was dynamic during 2012,2015, driven mainly by the Colombian Government’sGovernment‘s housing subsidy program that was implemented in April 2009 as well as by lower long-term interest rates in Colombia. Taking into account securitizedMortgage loans mortgage loans decreased 11%totaled 17,119 and increased 36.43% over the year. At
On December 30, 2015, Bancolombia acquired an additional 20% interest in Grupo Agromercantil, for a total stake of 60%. The loan portfolio acquired in the endbusiness combination of 2012, Bancolombia had COP 2,426 billion in securitized mortgages, comparedGrupo Agromercantil amounted to COP 2,7418,162 billion, atcorresponding to 5.60% of the endBank’s total loans and advances to customers. Additionally, as of 2011.December 31, 2015, Tuya S.A. Compañía de Financiamiento is considered a discontinued operation. Therefore, its loan portfolio is classified as assets held for sale in the Consolidated Statement of Financial Position. The net balance of loans of this company amounted to COP 1,480 billion as of December 31, 2015 and corresponds to retail loans.
Borrowing Relationships
As of December 31, 2012,2015, the aggregate outstanding principal amount of the Bank’s 25 largest borrowing relationships,credit exposures, on a consolidated basis, represented approximately 11.92%14.04% of the loan portfolio of the Bank and no single borrowing relationshipexposure represented more than 0.86%3% of the loan book. Also,In addition, 100% of those loans were corporate loans and 100% of these relationships were classified as “A”.
Maturity and Interest Rate Sensitivity of Loans
The following table shows the maturities of the Bank’s loan portfolio as of December 31, 2012:2015:
| | | Due in one year
or less | | | Due from one to
five years | | | Due after five
years | | | Total | | | Maturity of one
year or less | | | Maturity of one
to five years | | | Maturity of more
than five years | | | Total | |
| | | (COP million) | | | (in millions of COP) | |
| Domestic loans and financial leases: | | | | | | | | | | | | | | | | | |
| Domestic loans and financial leases | | | | | | | | | | | | | | | | | |
| Corporate | | | | | | | | | | | | | | | | | | | | | | | | | | | | | | | | |
| Trade financing | | | 1,891,687 | | | | 63,300 | | | | 39,792 | | | | 1,994,779 | | | | 3,376,837 | | | | 3,269 | | | | - | | | | 3,380,106 | |
| Loans funded by development banks | | | 13,363 | | | | 105,775 | | | | 126,103 | | | | 245,241 | | | | 17,883 | | | | 258,545 | | | | 1,030,460 | | | | 1,306,888 | |
| Working capital loans | | | 8,583,759 | | | | 8,985,565 | | | | 8,705,043 | | | | 26,274,367 | | | | 16,042,082 | | | | 7,473,832 | | | | 19,117,020 | | | | 42,632,934 | |
| Credit cards | | | 3,229 | | | | 24,741 | | | | 2,038 | | | | 30,008 | | | | 2,961 | | | | 21,406 | | | | 30,327 | | | | 54,694 | |
| Overdrafts | | | 82,981 | | | | - | | | | - | | | | 82,981 | | | | 126,888 | | | | - | | | | - | | | | 126,888 | |
| Total corporate | | | 10,575,019 | | | | 9,179,381 | | | | 8,872,976 | | | | 28,627,376 | | | | 19,566,651 | | | | 7,757,052 | | | | 20,177,807 | | | | 47,501,510 | |
| | | | | | | | | | | | | | | | | | | | | | | | | | | | | | | | | |
| Retail | | | | | | | | | | | | | | | | | | | | | | | | | | | | | | | | |
| Credit cards | | | 669,569 | | | | 2,712,859 | | | | 106,359 | | | | 3,488,787 | | | | 192,016 | | | | 2,337,329 | | | | 1,100,194 | | | | 3,629,539 | |
| Personal loans | | | 366,113 | | | | 4,628,049 | | | | 215,261 | | | | 5,209,423 | | | | 337,896 | | | | 5,592,727 | | | | 1,173,453 | | | | 7,104,076 | |
| Vehicle loans | | | 51,341 | | | | 1,360,277 | | | | 742,503 | | | | 2,154,121 | | | | 68,485 | | | | 1,818,670 | | | | 630,770 | | | | 2,517,925 | |
| Overdrafts | | | 210,653 | | | | - | | | | - | | | | 210,653 | | | | 203,439 | | | | - | | | | - | | | | 203,439 | |
| Loans funded by development banks | | | 52,035 | | | | 564,983 | | | | 226,128 | | | | 843,146 | | | | 54,236 | | | | 443,116 | | | | 387,138 | | | | 884,490 | |
| Trade financing | | | 99,596 | | | | - | | | | - | | | | 99,596 | | | | 372,339 | | | | - | | | | - | | | | 372,339 | |
| Working capital loans | | | 2,136,453 | | | | 5,392,818 | | | | 850,824 | | | | 8,380,095 | | | | 3,196,224 | | | | 7,558,497 | | | | 2,324,043 | | | | 13,078,764 | |
| Total retail | | | 3,585,760 | | | | 14,658,986 | | | | 2,141,075 | | | | 20,385,821 | | | | 4,424,635 | | | | 17,750,339 | | | | 5,615,598 | | | | 27,790,572 | |
| Financial leases | | | 295,174 | | | | 4,220,756 | | | | 3,889,567 | | | | 8,405,497 | | | | 2.287,297 | | | | 5,518,087 | | | | 12,093,281 | | | | 19,898,665 | |
| Mortgage | | | 46,446 | | | | 225,166 | | | | 4,892,902 | | | | 5,164,514 | | | | 25,689 | | | | 305,785 | | | | 8,381,418 | | | | 8,712,892 | |
| Total domestic loans and financial leases | | | 14,502,399 | | | | 28,284,289 | | | | 19,796,520 | | | | 62,583,208 | | | | 26,304,272 | | | | 31,331,263 | | | | 46,268,104 | | | | 103,903,639 | |
| | | | | | | | | | | | | | | | | | | | | | | | | | | | | | | | | |
| Foreign loans and financial leases: | | | | | | | | | | | | | | | | | | | | | | | | | | | | | | | | |
| Corporate | | | | | | | | | | | | | | | | | | | | | | | | | | | | | | | | |
| Trade financing | | | 10,064 | | | | 44,997 | | | | 165,773 | | | | 220,834 | | | | 3,878,159 | | | | 6,683,832 | | | | 4,630,620 | | | | 15,192,611 | |
| Loans funded by development banks | | | 8,076 | | | | 1,587 | | | | 6,797 | | | | 16,460 | | | | 21 | | | | 2,198 | | | | 10,357 | | | | 12,576 | |
| Working capital loans | | | 1,211,393 | | | | 1,726,551 | | | | 1,281,366 | | | | 4,219,310 | | | | 4,867,617 | | | | 2,991,747 | | | | 934,239 | | | | 8,793,603 | |
| Credit cards | | | 3 | | | | 5,608 | | | | - | | | | 5,611 | | | | 8 | | | | 24,720 | | | | 1,020 | | | | 25,748 | |
| Overdrafts | | | 20,453 | | | | - | | | | - | | | | 20,453 | | | | 6,661 | | | | - | | | | - | | | | 6,661 | |
| Total corporate | | | 1,249,989 | | | | 1,778,743 | | | | 1,453,936 | | | | 4,482,668 | | | | 8,752,466 | | | | 9,702,497 | | | | 5,576,236 | | | | 24,031,199 | |
| | | | | | | | | | | | | | | | | | | | | | | | | | | | | | | | | |
| Retail | | | | | | | | | | | | | | | | | | | | | | | | | | | | | | | | |
| Credit cards | | | 383 | | | | 183,516 | | | | 80 | | | | 183,979 | | | | 10,613 | | | | 1,391,794 | | | | 26,944 | | | | 1,429,351 | |
| Personal loans | | | 52,242 | | | | 451,921 | | | | 1,107,336 | | | | 1,611,499 | | | | 284,324 | | | | 3,614,203 | | | | 2,207,714 | | | | 6,106,241 | |
| Vehicle loans | | | 109 | | | | 1,282 | | | | 35 | | | | 1,426 | | | | 7,425 | | | | 301,546 | | | | 328,076 | | | | 637,047 | |
| Overdrafts | | | 12,815 | | | | 82 | | | | - | | | | 12,897 | | | | 73,100 | | | | 1,392 | | | | - | | | | 74,492 | |
| Loans funded by development banks | | | 51 | | | | 3,039 | | | | 16,789 | | | | 19,879 | | | | 120 | | | | 7,888 | | | | 58,141 | | | | 66,149 | |
| Trade financing | | | 126 | | | | 1,917 | | | | 6,724 | | | | 8,767 | | | | 56,168 | | | | 70,121 | | | | 116,114 | | | | 242,403 | |
| Working capital loans | | | 8,494 | | | | 17,489 | | | | 20,617 | | | | 46,600 | | | | 42,812 | | | | 20,771 | | | | 7,733 | | | | 71,316 | |
| Total retail | | | 74,220 | | | | 659,246 | | | | 1,151,581 | | | | 1,885,047 | | | | 474,562 | | | | 5,407,715 | | | | 2,744,722 | | | | 8,626,999 | |
| Financial leases | | | 33,058 | | | | 199,548 | | | | 11,840 | | | | 244,446 | | | | 38,274 | | | | 493,467 | | | | 121,170 | | | | 652,911 | |
| Mortgage | | | 3,318 | | | | 36,776 | | | | 753,216 | | | | 793,310 | | | | 18,410 | | | | 145,915 | | | | 8,241,566 | | | | 8,405,891 | |
| Total foreign loans and financial leases | | | 1,360,585 | | | | 2,674,313 | | | | 3,370,573 | | | | 7,405,471 | | | | 9,283,712 | | | | 15,749,594 | | | | 16,683,694 | | | | 41,717,000 | |
| Total loans (COP million) | | | 15,862,984 | | | | 30,958,602 | | | | 23,167,093 | | | | 69,988,679 | | |
| Total loans | | | | 35,587,984 | | | | 47,080,857 | | | | 62,951,798 | | | | 145,620,639 | |
In general, the term of a loan will depend on the type of guarantee, the credit history of the borrower and the purpose of the loan. Currently 56.77% of the Bank’s loan portfolio has a maturity of five years or less as of December 31, 2015.
The following table shows the interest rate sensitivity of the Bank’s loan portfolio due afterone year and within one year or lessas of December 31, 2012:less:
| | | As of December 31, 20122015 | |
| | | (COP million) | |
| | in millions of COP) | |
| Loans with term of 1 year or more: | | | | |
| Variable Rate | | | | |
| Domestic-denominated | | COP | 34,364,76256,646,538 | |
| Foreign-denominated | | | 5,765,47520,014,590 | |
| Total | | | 40,130,23776,661,128 | |
| Fixed Rate | | | | |
| Domestic-denominated | | | 13,716,04720,952,829 | |
| Foreign-denominated | | | 279,41112,418,698 | |
| Total | | | 13,995,45833,371,527 | |
Loans with termsterm of less than 1 year: | | | | |
| Domestic-denominated | | | 14,502,39926,304,272 | |
| Foreign-denominated | | | 1,360,5859,283,712 | |
| Total | | | 15,862,98435,587,984 | |
| | | | |
| Total loans | | COP | 69,988,679145,620,639 | |
Loans by Economic Activity
The following table summarizes the Bank’s loan portfolio, for the periods indicated, by the principal activity of the borrower using the primary Standard Industrial Classification (SIC) codes. Where the Bank has not assigned a code to a borrower, classification of the loan has been made based on the purpose of the loan as described by the borrower:
| | | As of December 31, | |
| | | 2015 | | | % | | | 2014 | | | % | |
| | | (in millions of COP, except percentages) | |
| Domestic | | | | | | | | | | | | | | | | |
| Agricultural | | | 4,330,757 | | | | 4.2 | % | | | 4,030,994 | | | | 4.4 | % |
| Mining products and oil | | | 1,791,910 | | | | 1.7 | % | | | 2,559,701 | | | | 2.8 | % |
| Food, beverage and tobacco | | | 5,141,738 | | | | 5.0 | % | | | 4,148,724 | | | | 4.5 | % |
| Chemical production | | | 2,871,547 | | | | 2.8 | % | | | 3,028,095 | | | | 3.3 | % |
| Other industrial and manufacturing products | | | 5,657,242 | | | | 5.4 | % | | | 5,492,444 | | | | 6.0 | % |
| Government | | | 3,131,339 | | | | 3.0 | % | | | 2,030,749 | | | | 2.2 | % |
| Construction | | | 14,577,061 | | | | 14.0 | % | | | 11,515,240 | | | | 12.6 | % |
| Trade and tourism | | | 14,934,712 | | | | 14.4 | % | | | 13,380,359 | | | | 14.6 | % |
| Transportation and communications | | | 8,189,789 | | | | 7.9 | % | | | 5,200,661 | | | | 5.7 | % |
| Public services | | | 4,881,297 | | | | 4.7 | % | | | 4,832,527 | | | | 5.3 | % |
| Consumer services | | | 22,439,817 | | | | 21.6 | % | | | 21,109,019 | | | | 23.0 | % |
| Commercial services | | | 15,956,430 | | | | 15.3 | % | | | 14,299,832 | | | | 15.6 | % |
| | | | | | | | | | | | | | | | | |
| Total domestic loans | | | 103,903,639 | | | | 100.0 | % | | | 91,628,345 | | | | 100.0 | % |
| | | | | | | | | | | | | | | | | |
| Foreign | | | | | | | | | | | | | | | | |
| Agricultural | | | 1,942,147 | | | | 4.7 | % | | | 752,267 | | | | 3.2 | % |
| Mining products and oil | | | 355,825 | | | | 0.9 | % | | | 501,236 | | | | 2.1 | % |
| Food, beverage and tobacco | | | 330,038 | | | | 0.8 | % | | | 323,446 | | | | 1.4 | % |
| Chemical production | | | 331,651 | | | | 0.8 | % | | | 109,137 | | | | 0.5 | % |
| Other industrial and manufacturing products | | | 4,751,983 | | | | 11.4 | % | | | 2,466,135 | | | | 10.5 | % |
| Government | | | 668,463 | | | | 1.6 | % | | | 309,947 | | | | 1.3 | % |
| Construction | | | 5,424,291 | | | | 13.0 | % | | | 3,609,264 | | | | 15.3 | % |
| Trade and tourism. | | | 5,833,248 | | | | 14.0 | % | | | 3,362,533 | | | | 14.3 | % |
| Transportation and communications | | | 1,588,048 | | | | 3.8 | % | | | 716,974 | | | | 3.1 | % |
| | | As of December 31, | |
| | | 2015 | | | % | | | 2014 | | | % | |
| | | (in millions of COP, except percentages) | |
| Public services | | | 4,807,362 | | | | 11.5 | % | | | 2,757,506 | | | | 11.7 | % |
| Consumer services | | | 12,634,026 | | | | 30.2 | % | | | 8,580,530 | | | | 36.4 | % |
| Commercial services | | | 3,049,918 | | | | 7.3 | % | | | 56,333 | | | | 0.2 | % |
| Total foreign loans | | | 41,717,000 | | | | 100.0 | % | | | 23,545,308 | | | | 100.0 | % |
| | | | | | | | | | | | | | | | | |
| Total Foreign and Domestic Loans | | | 145,620,639 | | | | 100.0 | % | | | 115,173,653 | | | | 100.0 | % |
| | | As of December 31, | |
| | | 2012 | | | % | | | 2011 | | | % | | | 2010 | | | % | | | 2009 | | | % | | | 2008 | | | % | |
| | | | | | (COP million, except percentages) | | | | | | | |
| Domestic | | | | | | | | | | | | | | | | | | | | | | | | | | | | | | | | | | | | | | | | |
| Agricultural | | | 2,648,064 | | | | 4.2 | % | | | 2,102,923 | | | | 4.0 | % | | | 1,810,415 | | | | 4.4 | % | | | 1,625,790 | | | | 4.6 | % | | | 1,691,697 | | | | 4.7 | % |
| Mining products and oil | | | 2,324,822 | | | | 3.7 | % | | | 1,583,513 | | | | 3.0 | % | | | 1,863,052 | | | | 4.6 | % | | | 1,193,712 | | | | 3.4 | % | | | 521,249 | | | | 1.4 | % |
| Food, beverage and Tobacco | | | 1,885,953 | | | | 3.0 | % | | | 1,710,015 | | | | 3.3 | % | | | 2,922,405 | | | | 7.1 | % | | | 2,243,064 | | | | 6.4 | % | | | 2,264,246 | | | | 6.2 | % |
| Chemical production | | | 2,526,802 | | | | 4.0 | % | | | 2,464,222 | | | | 4.7 | % | | | 2,727,045 | | | | 6.7 | % | | | 1,310,495 | | | | 3.7 | % | | | 1,790,731 | | | | 4.9 | % |
| Other industrial and Manufacturing products | | | 3,857,788 | | | | 6.2 | % | | | 3,993,961 | | | | 7.6 | % | | | 3,124,519 | | | | 7.6 | % | | | 3,396,188 | | | | 9.7 | % | | | 4,132,049 | | | | 11.4 | % |
| Government | | | 1,554,722 | | | | 2.5 | % | | | 1,223,563 | | | | 2.3 | % | | | 1,310,226 | | | | 3.2 | % | | | 1,234,824 | | | | 3.5 | % | | | 659,800 | | | | 1.8 | % |
| Construction | | | 8,461,594 | | | | 13.5 | % | | | 6,199,270 | | | | 11.8 | % | | | 4,092,951 | | | | 10.0 | % | | | 3,520,673 | | | | 10.2 | % | | | 3,422,564 | | | | 9.4 | % |
| Trade and tourism | | | 9,904,717 | | | | 15.8 | % | | | 8,439,099 | | | | 16.1 | % | | | 5,614,774 | | | | 13.7 | % | | | 5,471,749 | | | | 15.7 | % | | | 6,216,359 | | | | 17.2 | % |
| Transportation and Communications | | | 4,415,162 | | | | 7.1 | % | | | 3,432,027 | | | | 6.5 | % | | | 2,803,387 | | | | 6.9 | % | | | 2,544,050 | | | | 7.3 | % | | | 2,426,608 | | | | 6.7 | % |
| Public services | | | 2,387,679 | | | | 3.8 | % | | | 2,028,122 | | | | 3.9 | % | | | 2,220,108 | | | | 5.4 | % | | | 1,659,742 | | | | 4.7 | % | | | 836,298 | | | | 2.3 | % |
| Consumer services | | | 17,136,487 | | | | 27.4 | % | | | 13,613,317 | | | | 25.9 | % | | | 9,353,171 | | | | 22.8 | % | | | 7,916,772 | | | | 22.7 | % | | | 8,709,958 | | | | 24.1 | % |
| Commercial services | | | 5,479,418 | | | | 8.8 | % | | | 5,749,396 | | | | 10.9 | % | | | 3,100,778 | | | | 7.6 | % | | | 2,849,091 | | | | 8.1 | % | | | 3,594,799 | | | | 9.9 | % |
| Total domestic loans (COP) | | | 62,583,208 | | | | 100 | % | | | 52,539,428 | | | | 100 | % | | | 40,942,831 | | | | 100 | % | | | 34,966,150 | | | | 100 | % | | | 36,266,358 | | | | 100 | % |
| Foreign | | | | | | | | | | | | | | | | | | | | | | | | | | | | | | | | | | | | | | | | |
| Agricultural | | | 166,159 | | | | 2.2 | % | | | 272,334 | | | | 3.0 | % | | | 327,430 | | | | 4.3 | % | | | 301,866 | | | | 4.3 | % | | | 248,631 | | | | 3.0 | % |
| Mining products and oil | | | 192,566 | | | | 2.6 | % | | | 265,689 | | | | 3.0 | % | | | 133,052 | | | | 1.7 | % | | | 176,042 | | | | 2.5 | % | | | 189,743 | | | | 2.3 | % |
| Food, beverage and Tobacco | | | 387,775 | | | | 5.3 | % | | | 150,692 | | | | 1.7 | % | | | 138,252 | | | | 1.8 | % | | | 118,092 | | | | 1.7 | % | | | 232,410 | | | | 2.8 | % |
| Chemical production | | | 9,915 | | | | 0.1 | % | | | 24,197 | | | | 0.3 | % | | | 12,850 | | | | 0.2 | % | | | 51,173 | | | | 0.7 | % | | | 95,552 | | | | 1.1 | % |
| Other industrial and Manufacturing products | | | 895,532 | | | | 12.1 | % | | | 2,147,936 | | | | 24.3 | % | | | 1,836,483 | | | | 24.0 | % | | | 1,586,708 | | | | 22.4 | % | | | 2,426,601 | | | | 29.0 | % |
| Government | | | 4,362 | | | | 0.1 | % | | | 92 | | | | 0.0 | % | | | 4 | | | | 0.0 | % | | | - | | | | - | | | | - | | | | - | |
| Construction | | | 1,037,806 | | | | 14.0 | % | | | 1,281,568 | | | | 14.5 | % | | | 1,231,658 | | | | 16.1 | % | | | 1,375,521 | | | | 19.4 | % | | | 442,021 | | | | 5.2 | % |
| Trade and tourism | | | 803,196 | | | | 10.9 | % | | | 595,938 | | | | 6.7 | % | | | 594,213 | | | | 7.8 | % | | | 613,928 | | | | 8.7 | % | | | 751,364 | | | | 9.0 | % |
| Transportation and | | | | | | | | | | | | | | | | | | | | | | | | | | | | | | | | | | | | | | | | |
| Communications | | | 198,131 | | | | 2.7 | % | | | 136,281 | | | | 1.5 | % | | | 149,698 | | | | 2.0 | % | | | 291,613 | | | | 4.1 | % | | | 117,356 | | | | 1.4 | % |
| Public services | | | 306,685 | | | | 4.1 | % | | | 402,896 | | | | 4.6 | % | | | 514,250 | | | | 6.7 | % | | | 256,307 | | | | 3.6 | % | | | 275,812 | | | | 3.3 | % |
| Consumer services | | | 1,905,249 | | | | 25.7 | % | | | 1,839,468 | | | | 20.8 | % | | | 1,946,188 | | | | 25.4 | % | | | 1,971,723 | | | | 27.9 | % | | | 3,202,212 | | | | 38.2 | % |
| Commercial services | | | 1,498,095 | | | | 20.2 | % | | | 1,731,909 | | | | 19.6 | % | | | 774,181 | | | | 10.0 | % | | | 332,851 | | | | 4.7 | % | | | 394,510 | | | | 4.7 | % |
| Total foreign loans (COP) | | | 7,405,471 | | | | 100 | % | | | 8,849,000 | | | | 100 | % | | | 7,658,259 | | | | 100 | % | | | 7,075,824 | | | | 100 | % | | | 8,376,212 | | | | 100 | % |
| Total Foreign and Domestic Loans (COP) | | | 69,988,679 | | | | 100 | % | | | 61,388,428 | | | | 100 | % | | | 48,601,090 | | | | 100 | % | | | 42,041,974 | | | | 100 | % | | | 44,642,570 | | | | 100 | % |
Credit Categories
For the purpose of credit risk evaluation, loans and financial lease contracts are classified in accordance with the regulations of the SFC as follows:
Mortgage Loans:Commercial Loans and Financial Leases: These are loans, regardless of value, granted to individuals for the purchase of new or used housing orcompanies in order to build a home, all in accordance with Law 546 of 1999. These loans include loans denominated in UVR or local currency thatcarry out organized economic activities and are guaranteed by a senior mortgage on the property and that are financed with a total repayment term of 5 to 30 years.not classified as small business loans.
Consumer Loans: These are loans and financial leases, regardless of value, granted to individuals for the purchase of consumer goods or to pay for non-commercial or business services.
Small Business Loans: These are issued for the purpose of encouraging the activities of small business and are subject to the following requirements: (i) the maximum amount to be lent is equal to twenty-five (25)25 SMMLV and at any time the balance of any single borrower may not exceed such amount (as stipulated in Articlearticle 39 of Law 590 of 2000) and (ii) the main source of payment for the corresponding obligation shall be the revenues obtained from activities of the borrower’s microsmall business. The balance of indebtedness on the part of the borrower may not exceed 120 SMMLV, as applicable, at the momenttime the creditloan is approved.
Commercial Loans and Financial Leases:Mortgage Loans: These are loans, regardless of value, granted to individuals for the purchase of new or companiesused housing or to build a home, all in orderaccordance with Law 546 of 1999. These loans include loans denominated in UVR or local currency that are guaranteed by a senior mortgage on the property and that are financed with a total repayment term of five to carry out organized economic activities and are not classified as small business loans.30 years.
The following table shows the Bank’s loan portfolio categorized in accordance with the regulationsby type of the SFC in effectloan for the relevant periods:
| | | Loan Portfolio by Type of Loan
As of December 31, | | | Loan Portfolio by Type of Loan
As of December 31, | |
| | | 2012 | | | 2011 | | | 2010 | | | 2009 | | | 2008 | | | 2015 | | | 2014 | |
| | | (COP million) | | | (in millions of COP) | |
| Commercial Loans | | | 42,465,660 | | | | 38,212,997 | | | | 30,992,403 | | | | 26,011,915 | | | | 28,068,731 | | | | 85,892,752 | | | | 65,473,755 | |
| Consumer Loans | | | 12,580,661 | | | | 10,846,046 | | | | 8,177,175 | | | | 6,888,615 | | | | 7,532,649 | | | | 21,170,615 | | | | 18,927,154 | |
| Small Business Loans | | | 334,591 | | | | 316,906 | | | | 255,082 | | | | 202,019 | | | | 143,122 | | | | 886,913 | | | | 659,870 | |
| Financial Leases | | | 8,649,943 | | | | 7,171,811 | | | | 5,833,549 | | | | 5,470,001 | | | | 5,506,742 | | | | 20,551,576 | | | | 17,565,229 | |
| Mortgage | | | 5,957,824 | | | | 4,840,668 | | | | 3,342,881 | | | | 3,469,424 | | | | 3,391,326 | | |
| Mortgage Loans | | | | 17,118,783 | | | | 12,547,645 | |
| Total Loans and Financial Leases | | | 69,988,679 | | | | 61,388,428 | | | | 48,601,090 | | | | 42,041,974 | | | | 44,642,570 | | | | 145,620,639 | | | | 115,173,653 | |
| Allowance for Loans and Financial Lease Losses | | | 3,249,639 | | | | 2,812,582 | | | | 2,509,213 | | | | 2,431,667 | | | | 2,134,360 | | | | (5,248,755 | ) | | | (4,789,257 | ) |
| Total Loans and Financial Leases, Net (COP) | | | 66,739,040 | | | | 58,575,846 | | | | 46,091,877 | | | | 39,610,307 | | | | 42,508,210 | | |
| Total Loans and Financial Leases, Net | | | | 140,371,884 | | | | 110,384,396 | |
Risk categories
The SFC provides the following minimum risk classifications, according to the financial situation of the debtor or the past-due days of the obligation:
Category A or “Normal Risk”: Loans and financial leases in this category are appropriately serviced. The debtor’s financial statements or its projected cash flows, as well as all other credit information available to the Bank, reflect adequate paying capacity.
Category B or “Acceptable Risk, Above Normal”: Loans and financial leases in this category are acceptably serviced and guaranty protected, but there are weaknesses which may potentially affect, on a transitory or permanent basis, the debtor’s paying capacity or its projected cash flows, to the extent that, if not timely corrected, would affect the normal collection of credit or contracts.
Category C or “Appreciable Risk”: Loans and financial leases in this category represent insufficiencies in the debtor’s paying capacity or in the project’s cash flow, which may compromise the normal collection of the obligations.
Category D or “Significant Risk”: Loans and financial leases in this category have the same deficiencies as loans in category C, but to a larger extent; consequently, the probability of collection is highly doubtful.
Category E or “Risk of Non-Recoverability”“unrecoverable”: Loans and financial leases in this category are deemed uncollectible.
For further details about these risk categories see “Note 2. Summary of significant accounting policies – (i) Loans and Financial Leases – Evaluation by credit risk categories”management appendix to the Consolidated Financial Statements.
| | | As of December 31, | |
| | | 2012 | | | % | | | 2011 | | | % | | | 2010 | | | % | | | 2009 | | | % | | | 2008 | | | % | |
| | | (COP million, except percentages) | |
| “A” Normal | | | 65,453,223 | | | | 93.5 | % | | | 57,095,160 | | | | 93.0 | % | | | 44,914,187 | | | | 92.4 | % | | | 38,180,628 | | | | 90.8 | % | | | 40,650,096 | | | | 91.0 | % |
| “B” Subnormal | | | 1,766,262 | | | | 2.5 | % | | | 1,946,067 | | | | 3.2 | % | | | 1,588,798 | | | | 3.3 | % | | | 1,711,661 | | | | 4.1 | % | | | 2,216,832 | | | | 5.0 | % |
| “C” Deficient | | | 1,179,600 | | | | 1.7 | % | | | 913,893 | | | | 1.4 | % | | | 606,901 | | | | 1.2 | % | | | 703,053 | | | | 1.7 | % | | | 576,557 | | | | 1.3 | % |
| “D” Doubtful Recover | | | 948,051 | | | | 1.4 | % | | | 848,682 | | | | 1.4 | % | | | 1,014,289 | | | | 2.1 | % | | | 1,105,442 | | | | 2.6 | % | | | 871,892 | | | | 2.0 | % |
| “E” Unrecoverable | | | 641,543 | | | | 0.9 | % | | | 584,626 | | | | 1.0 | % | | | 476,915 | | | | 1.0 | % | | | 341,190 | | | | 0.8 | % | | | 327,193 | | | | 0.7 | % |
| Total loans and financial leases | | | 69,988,679 | | | | 100.0 | % | | | 61,388,428 | | | | 100 | % | | | 48,601,090 | | | | 100 | % | | | 42,041,974 | | | | 100 | % | | | 44,642,570 | | | | 100 | % |
| Loans classified as “C”, “D” and “E” as a percentage of total loans | | | 4.0 | % | | | | | | | 3.8 | % | | | | | | | 4.3 | % | | | | | | | 5.1 | % | | | | | | | 4.0 | % | | | | |
Suspension of Accruals
The SFC established that interest, UVR, lease payments and other items of income cease to be accrued in the statement of operations and begin to be recorded in memorandum accounts until effective payment is collected, after a loan is in arrears for more than a certain time:
Type of loan and financial lease | | Arrears in excess of: |
Mortgage | | 2 months |
Consumer | | 2 months |
Small Business loans | | 1 month |
Commercial | | 3 months |
However, the Bank adopts a stricter policy for every credit category, except for mortgages. According to this policy loans are placed in non-accrual status once those loans are 30 days or more overdue. Under this policy, once the accumulation of interest is suspended, the Bank records an allowance equal to the interest that had accrued up to that point. Mortgage loans, on the other hand, are placed in non-accrual status once they are 60 days past-due, at which time an allowance is made for 100% of the interest accrued up to that point.
Amounts due on loans that become past-due and that at some point have stopped accruing interest, UVR, lease payments or other items of income will be recorded in memorandum accounts until such amounts are actually collected.
| | | As of December 31, | |
| | | 2015 | | | % | | | 2014 | | | % | |
| | | (in millions of COP, except percentages) | |
| “A” Normal Risk | | | 131,999,143 | | | | 90.6 | % | | | 105,475,511 | | | | 91.6 | % |
| “B” Acceptable Risk | | | 7,682,616 | | | | 5.3 | % | | | 4,978,602 | | | | 4.3 | % |
| “C” Appreciable Risk | | | 2,438,541 | | | | 1.7 | % | | | 1,865,897 | | | | 1.6 | % |
| “D” Significant Risk | | | 1,821,582 | | | | 1.3 | % | | | 1,504,125 | | | | 1.3 | % |
| “E” Unrecoverable Risk | | | 1,678,757 | | | | 1.1 | % | | | 1,349,518 | | | | 1.2 | % |
| Total loans and financial leases | | | 145,620,639 | | | | 100 | % | | | 115,173,653 | | | | 100 | % |
| Loans classified as “C”, “D” and “E” as a percentage of total loans | | | 4.08 | % | | | | | | | 4.10 | % | | | | |
The following table sets forth the breakdown of the non-performing past-due loans by type of loan in accordance with the criteria of the SFC for domestic and for foreign loans at the end of each period:
| | | As of December 31, | |
| | | 2012 | | | % | | | 2011 | | | % | | | 2010 | | | % | | | 2009 | | | % | | | 2008 | | | % | |
| | | (COP million, except percentages) | |
| Performing past-due loans:(1) | | | | | | | | | | | | | | | | | | | | | | | | | | | | | | | | | | | | | | | | |
| Consumer loans(2) | | | 194,062 | | | | 32.1 | % | | | 107,790 | | | | 26.3 | % | | | 117,787 | | | | 25.2 | % | | | 141,813 | | | | 23.7 | % | | | 150,762 | | | | 22.4 | % |
| Commercial loans(3) | | | 194,001 | | | | 32.1 | % | | | 152,297 | | | | 37.1 | % | | | 197,895 | | | | 42.4 | % | | | 254,923 | | | | 42.5 | % | | | 323,185 | | | | 48.0 | % |
| Mortgage loans(4) | | | 146,648 | | | | 24.3 | % | | | 110,474 | | | | 26.9 | % | | | 107,639 | | | | 23.0 | % | | | 115,611 | | | | 19.3 | % | | | 100,785 | | | | 15.0 | % |
| Financial leases(5) | | | 69,664 | | | | 11.5 | % | | | 39,591 | | | | 9.7 | % | | | 43,819 | | | | 9.4 | % | | | 87,202 | | | | 14.5 | % | | | 98,644 | | | | 14.6 | % |
| Total perf. PDLs COP | | | 604,375 | | | | 100.0 | % | | | 410,152 | | | | 100 | % | | | 467,140 | | | | 100 | % | | | 599,549 | | | | 100 | % | | | 673,376 | | | | 100 | % |
| | | | | | | | | | | | | | | | | | | | | | | | | | | | | | | | | | | | | | | | | |
| Non-performing PDLs: | | | | | | | | | | | | | | | | | | | | | | | | | | | | | | | | | | | | | | | | |
| Consumer loans(6) | | | 410,112 | | | | 33.4 | % | | | 245,077 | | | | 26.4 | % | | | 180,668 | | | | 19.5 | % | | | 231,790 | | | | 22.6 | % | | | 296,153 | | | | 31.2 | % |
| Small business loans(7) | | | 31,188 | | | | 2.5 | % | | | 27,319 | | | | 2.9 | % | | | 22,193 | | | | 2.4 | % | | | 17,250 | | | | 1.7 | % | | | 17,600 | | | | 1.9 | % |
| Commercial loans(8) | | | 435,582 | | | | 35.5 | % | | | 365,910 | | | | 39.3 | % | | | 450,161 | | | | 48.5 | % | | | 488,248 | | | | 47.5 | % | | | 387,571 | | | | 40.7 | % |
| Mortgage loans(9) | | | 262,250 | | | | 21.4 | % | | | 206,730 | | | | 22.3 | % | | | 195,631 | | | | 21.1 | % | | | 197,323 | | | | 19.2 | % | | | 184,597 | | | | 19.4 | % |
| Financial leases(10) | | | 89,195 | | | | 7.2 | % | | | 85,504 | | | | 9.1 | % | | | 80,106 | | | | 8.5 | % | | | 93,101 | | | | 9.0 | % | | | 64,708 | | | | 6.8 | % |
| Total non-perf. PDLs COP.. | | | 1,228,327 | | | | 100.0 | % | | | 930,540 | | | | 100 | % | | | 928,759 | | | | 100 | % | | | 1,027,712 | | | | 100 | % | | | 950,629 | | | | 100 | % |
| | | | | | | | | | | | | | | | | | | | | | | | | | | | | | | | | | | | | | | | | |
| Total PDLs (COP) | | | 1,832,702 | | | | | | | | 1,340,692 | | | | | | | | 1,395,899 | | | | | | | | 1,627,261 | | | | | | | | 1,624,005 | | | | | |
| | | | | | | | | | | | | | | | | | | | | | | | | | | | | | | | | | | | | | | | | |
| Total non-perf. PDLs | | | 1,228,327 | | | | | | | | 930,540 | | | | | | | | 928,759 | | | | | | | | 1,027,712 | | | | | | | | 950,629 | | | | | |
| Foreclosed assets | | | 270,935 | | | | | | | | 231,066 | | | | | | | | 257,603 | | | | | | | | 250,976 | | | | | | | | 204,480 | | | | | |
| Other accounts receivable (overdue > 180 days) | | | 40,517 | | | | | | | | 20,645 | | | | | | | | 19,190 | | | | | | | | 33,800 | | | | | | | | 34,486 | | | | | |
| Total non performing assets (COP) | | | 1,539,779 | | | | | | | | 1,182,251 | | | | | | | | 1,205,552 | | | | | | | | 1,312,488 | | | | | | | | 1,189,595 | | | | | |
| | | | | | | | | | | | | | | | | | | | | | | | | | | | | | | | | | | | | | | | | |
| Allowance for loan and finance leases losses | | | (3,249,639 | ) | | | | | | | (2,812,582 | ) | | | | | | | (2,509,213 | ) | | | | | | | (2,431,667 | ) | | | | | | | (2,134,360 | ) | | | | |
| Allowance for estimated losses on foreclosed assets | | | (186,117 | ) | | | | | | | (177,872 | ) | | | | | | | (187,326 | ) | | | | | | | (170,308 | ) | | | | | | | (179,827 | ) | | | | |
| | | | | | | | | | | | | | | | | | | | | | | | | | | | | | | | | | | | | | | | | |
| Allowance for accounts receivable and accrued interest losses | | | (139,994 | ) | | | | | | | (105,521 | ) | | | | | | | (111,848 | ) | | | | | | | (124,916 | ) | | | | | | | (114,009 | ) | | | | |
| | | | | | | | | | | | | | | | | | | | | | | | | | | | | | | | | | | | | | | | | |
| PDLs/ Total loans | | | | | | | 2.6 | % | | | | | | | 2.2 | % | | | | | | | 2.9 | % | | | | | | | 3.9 | % | | | | | | | 3.6 | % |
| Allowance for loan losses/ PDLs | | | | | | | 177.3 | % | | | | | | | 209.8 | % | | | | | | | 179.8 | % | | | | | | | 149.4 | % | | | | | | | 131.4 | % |
| Allowance for loan losses/ Loans classified as “C”, “D” and “E” | | | | | | | 117.3 | % | | | | | | | 119.8 | % | | | | | | | 119.6 | % | | | | | | | 113.1 | % | | | | | | | 120.2 | % |
| Perf. Loans/Total loans | | | | | | | 98.2 | % | | | | | | | 98.5 | % | | | | | | | 98.1 | % | | | | | | | 97.6 | % | | | | | | | 97.9 | % |
| (1) | Performing past-due loans are loans upon which the Bank continues to recognize income although interest has not been received for the periods indicated. |
| (2) | Past-due from 31 to 60 days. |
| (3) | Past-due from 31 to 90 days. |
| (4) | Past-due from 31 to 60 days. |
| (5) | The Consumer financial leases are due from 31 to 60 days and the commercial financial leases are due from 31 to 90 days. |
| (6) | Past-due more than 60 days. |
| (7) | Past-due more than 30 days. |
| (8) | Past-due more than 90 days. |
| (9) | Past-due more than 60 days. |
| (10) | The Consumer financial leases are more than 60 days and the commercial financial leases are more than 90 days. |
The following table sets forth the breakdown of the non-performing past-due loans by type of loan in accordance with the criteria of the SFC for domestic and for foreign loans at the end of each period:
| | | As of December 31, | |
| | | 2012 | | | 2011 | | | 2010 | | | 2009 | | | 2008 | |
| Non-performing past-due loans: | | | | | | | | | | | | | | | | | | | | |
| Consumer loans(1) | | | | | | | | | | | | | | | | | | | | |
| Domestic | | COP | 367,392 | | | COP | 199,276 | | | COP | 124,149 | | | COP | 169,357 | | | COP | 243,487 | |
| Foreign | | | 42,720 | | | | 45,801 | | | | 56,519 | | | | 62,433 | | | | 52,666 | |
| Total Consumer Loans | | | 410,112 | | | | 245,077 | | | | 180,668 | | | | 231,790 | | | | 296,153 | |
| Small Business loans(2) | | | | | | | | | | | | | | | | | | | | |
| Domestic. | | | 27,306 | | | | 22,866 | | | | 20,602 | | | | 15,025 | | | | 15,583 | |
| Foreign | | | 3,882 | | | | 4,453 | | | | 1,591 | | | | 2,225 | | | | 2,017 | |
| Total Small Business Loans | | | 31,188 | | | | 27,319 | | | | 22,193 | | | | 17,250 | | | | 17,600 | |
| Commercial loans(3) | | | | | | | | | | | | | | | | | | | | |
| Domestic | | | 412,231 | | | | 312,950 | | | | 378,380 | | | | 430,695 | | | | 336,958 | |
| Foreign | | | 23,351 | | | | 52,960 | | | | 71,781 | | | | 57,553 | | | | 50,613 | |
| Total Commercial Loans | | | 435,582 | | | | 365,910 | | | | 450,161 | | | | 488,248 | | | | 387,571 | |
| | | | | | | | | | | | | | | | | | | | | |
| | | | | | | | | | | | | | | | | | | | | |
| Mortgage loans(4) | | | | | | | | | | | | | | | | | | | | |
| Domestic | | | 226,350 | | | | 164,808 | | | | 151,975 | | | | 159,697 | | | | 161,284 | |
| Foreign | | | 35,900 | | | | 41,922 | | | | 43,656 | | | | 37,626 | | | | 23,313 | |
| Total Mortgage Loans | | | 262,250 | | | | 206,730 | | | | 195,631 | | | | 197,323 | | | | 184,597 | |
| Financial leases(5) | | | | | | | | | | | | | | | | | | | | |
| Domestic | | | 87,396 | | | | 85,504 | | | | 80,106 | | | | 93,100 | | | | 63,160 | |
| Foreign | | | 1,799 | | | | - | | | | - | | | | 1 | | | | 1,548 | |
| Total Financial leases | | | 89,195 | | | | 85,504 | | | | 80,106 | | | | 93,101 | | | | 64,708 | |
| Total non-perf. PDLs (domestic) | | | 1,120,675 | | | | 785,404 | | | | 755,212 | | | | 867,874 | | | | 820,472 | |
| Total non-perf. PDLs (foreign) | | | 107,652 | | | | 145,136 | | | | 173,547 | | | | 159,838 | | | | 130,157 | |
| Total non-perf. PDLs | | COP | 1,228,327 | | | COP | 930,540 | | | COP | 928,759 | | | COP | 1,027,712 | | | COP | 950,629 | |
(1)Past-due more than 60 days.
(2)Past-due more than 30 days.
(3)Past-due more than 90 days.
(4)Past-due more than 60 days.
(5)Past-due financial leases includes consumer financial leases that are more than 60 days past-due and commercial financial leases that are more than 90 days past-due.
The following table illustrates Bancolombia’s past-due loan portfolio by type of loan:
| | | As of December 31, | | | As of December 31, | |
| | | 2012 | | | % | | | 2011 | | | % | | | 2010 | | | % | | | 2009 | | | % | | | 2008 | | | % | | | 2015 | | | % | | | 2014 | | | % | |
| | | (COP million, except percentages) | | | (in millions of COP, except percentages) | |
| Domestic | | | | | | | | | | | | | | | | | | | | | | | | | | | | | | | | | | | | | | | | | | | | | | | | | | | | | | | | |
| Corporate | | | | | | | | | | | | | | | | | | | | | | | | | | | | | | | | | | | | | | | | | | | | | | | | | | | | | | | | |
| Trade financing | | | 943 | | | | 0.1 | % | | | 1,140 | | | | 0.1 | % | | | 1,685 | | | | 0.2 | % | | | 3,945 | | | | 0.3 | % | | | 2,472 | | | | 0.2 | % | | | 24,733 | | | | 0.7 | % | | | 464 | | | | 0.0 | % |
| Loans funded by development banks | | | 2,657 | | | | 0.2 | % | | | 20,270 | | | | 1.8 | % | | | 22,497 | | | | 1.9 | % | | | 13,933 | | | | 1.0 | % | | | 22,125 | | | | 1.6 | % | | | 3,567 | | | | 0.1 | % | | | 4,264 | | | | 0.2 | % |
| Working capital loans | | | 204,864 | | | | 12.2 | % | | | 110,121 | | | | 9.6 | % | | | 189,833 | | | | 16.4 | % | | | 154,071 | | | | 11.2 | % | | | 150,795 | | | | 11.1 | % | | | 613,922 | | | | 17.0 | % | | | 461,505 | | | | 16.9 | % |
| Credit cards | | | 624 | | | | 0.0 | % | | | 417 | | | | 0.0 | % | | | 351 | | | | 0.0 | % | | | 376 | | | | 0.0 | % | | | 456 | | | | 0.0 | % | | | 1,167 | | | | 0.0 | % | | | 1,795 | | | | 0.1 | % |
| Overdrafts | | | 1,222 | | | | 0.1 | % | | | 1,125 | | | | 0.1 | % | | | 1,975 | | | | 0.2 | % | | | 2,781 | | | | 0.2 | % | | | 3,032 | | | | 0.2 | % | | | 1,339 | | | | 0.0 | % | | | 3,509 | | | | 0.1 | % |
| Total corporate | | | 210,310 | | | | 12.6 | % | | | 133,073 | | | | 11.6 | % | | | 216,341 | | | | 18.7 | % | | | 175,106 | | | | 12.7 | % | | | 178,880 | | | | 13.1 | % | | | 644,728 | | | | 17.8 | % | | | 471,537 | | | | 17.3 | % |
| | | | | | | | | | | | | | | | | | | | | | | | | | | | | | | | | | | | | | | | | | | | | | | | | | | | | | | | | |
| Retail | | | | | | | | | | | | | | | | | | | | | | | | | | | | | | | | | | | | | | | | | | | | | | | | | | | | | | | | |
| Credit cards | | | 272,057 | | | | 16.1 | % | | | 151,078 | | | | 13.2 | % | | | 137,649 | | | | 11.9 | % | | | 163,924 | | | | 11.9 | % | | | 172,409 | | | | 12.7 | % | | | 231,865 | | | | 6.4 | % | | | 343,521 | | | | 12.6 | % |
| Personal loans | | | 179,170 | | | | 10.7 | % | | | 95,678 | | | | 8.3 | % | | | 62,392 | | | | 5.4 | % | | | 86,358 | | | | 6.3 | % | | | 144,336 | | | | 10.6 | % | | | 265,802 | | | | 7.4 | % | | | 239,261 | | | | 8.7 | % |
| Vehicle loans | | | 97,767 | | | | 5.8 | % | | | 72,954 | | | | 6.4 | % | | | 68,194 | | | | 5.9 | % | | | 117,601 | | | | 8.6 | % | | | 142,336 | | | | 10.5 | % | | | 133,846 | | | | 3.7 | % | | | 144,213 | | | | 5.3 | % |
| Overdrafts | | | 21,654 | | | | 1.3 | % | | | 15,285 | | | | 1.3 | % | | | 15,368 | | | | 1.3 | % | | | 20,106 | | | | 1.5 | % | | | 33,277 | | | | 2.5 | % | | | 24,994 | | | | 0.7 | % | | | 29,418 | | | | 1.1 | % |
| Loans funded by development banks | | | 26,154 | | | | 1.6 | % | | | 33,666 | | | | 2.9 | % | | | 31,752 | | | | 2.7 | % | | | 30,733 | | | | 2.2 | % | | | 33,530 | | | | 2.5 | % | | | 30,119 | | | | 0.8 | % | | | 40,132 | | | | 1.5 | % |
| Trade financing | | | 3,791 | | | | 0.2 | % | | | 732 | | | | 0.1 | % | | | 947 | | | | 0.1 | % | | | 961 | | | | 0.1 | % | | | 8,169 | | | | 0.6 | % | | | 1,759 | | | | 0.1 | % | | | 1,198 | | | | 0.0 | % |
| Working capital loans | | | 358,950 | | | | 21.3 | % | | | 263,968 | | | | 23.0 | % | | | 272,522 | | | | 23.5 | % | | | 353,744 | | | | 25.7 | % | | | 287,587 | | | | 21.2 | % | | | 755,713 | | | | 21.0 | % | | | 702,065 | | | | 25.6 | % |
| Total retail | | | 959,543 | | | | 57.0 | % | | | 633,361 | | | | 55.2 | % | | | 588,824 | | | | 50.8 | % | | | 773,427 | | | | 56.3 | % | | | 821,644 | | | | 60.6 | % | | | 1,444,098 | | | | 40.1 | % | | | 1,499,808 | | | | 54.8 | % |
| Financial Leases | | | 156,705 | | | | 9.3 | % | | | 125,094 | | | | 10.8 | % | | | 123,925 | | | | 10.7 | % | | | 179,632 | | | | 13.1 | % | | | 155,678 | | | | 11.5 | % | | | 936,382 | | | | 26.0 | % | | | 259,048 | | | | 9.4 | % |
| Mortgage | | | 356,466 | | | | 21.1 | % | | | 256,624 | | | | 22.4 | % | | | 230,018 | | | | 19.8 | % | | | 246,277 | | | | 17.9 | % | | | 201,186 | | | | 14.8 | % | | | 582,010 | | | | 16.1 | % | | | 507,588 | | | | 18.5 | % |
| Total domestic past-due loans (COP) | | | 1,683,024 | | | | 100.0 | % | | | 1,148,152 | | | | 100 | % | | | 1,159,108 | | | | 100 | % | | | 1,374,442 | | | | 100 | % | | | 1,357,388 | | | | 100 | % | |
| Total domestic past due loans | | | | 3,607,218 | | | | 100.0 | % | | | 2,737,981 | | | | 100.0 | % |
| | | | | | | | | | | | | | | | | | | | | | | | | | | | | | | | | | | | | | | | | | | | | | | | | | | | | | | | | |
| Foreign | | | | | | | | | | | | | | | | | | | | | | | | | | | | | | | | | | | | | | | | | | | | | | | | | | | | | | | | |
| Corporate | | | | | | | | | | | | | | | | | | | | | | | | | | | | | | | | | | | | | | | | | | | | | | | | | | | | | | | | |
| Trade financing | | | 4,201 | | | | 2.8 | % | | | 9,004 | | | | 4.7 | % | | | 9,535 | | | | 4.0 | % | | | 14,978 | | | | 5.9 | % | | | 19,157 | | | | 7.2 | % | | | 301,674 | | | | 22.7 | % | | | 97,646 | | | | 12.6 | % |
| Loans funded by development banks | | | - | | | | 0.0 | % | | | 147 | | | | 0.1 | % | | | 376 | | | | 0.2 | % | | | 2,306 | | | | 0.9 | % | | | 1,552 | | | | 0.6 | % | | | 291 | | | | 0.0 | % | | | - | | | | 0.0 | % |
| Working capital loans | | | 29,388 | | | | 19.7 | % | | | 56,627 | | | | 29.3 | % | | | 76,559 | | | | 32.3 | % | | | 80,031 | | | | 31.7 | % | | | 106,532 | | | | 40.0 | % | | | 99,330 | | | | 7.5 | % | | | 75,205 | | | | 9.7 | % |
| Credit cards | | | 124 | | | | 0.1 | % | | | 264 | | | | 0.1 | % | | | 434 | | | | 0.2 | % | | | 499 | | | | 0.1 | % | | | 222 | | | | 0.0 | % | | | 1,316 | | | | 0.1 | % | | | 170 | | | | 0.0 | % |
| Overdrafts | | | 172 | | | | 0.1 | % | | | 349 | | | | 0.2 | % | | | 775 | | | | 0.3 | % | | | 287 | | | | 0.0 | % | | | 341 | | | | 0.1 | % | | | 149 | | | | 0.0 | % | | | 36 | | | | 0.0 | % |
| Total corporate | | | 33,885 | | | | 22.7 | % | | | 66,391 | | | | 34.4 | % | | | 87,679 | | | | 37.0 | % | | | 98,101 | | | | 38.6 | % | | | 127,804 | | | | 47.9 | % | |
| Total Corporate | | | | 402,760 | | | | 30.3 | % | | | 173,057 | | | | 22.3 | % |
| | | | | | | | | | | | | | | | | | | | | | | | | | | | | | | | | | | | | | | | | | | | | | | | | | | | | | | | | |
| Retail | | | | | | | | | | | | | | | | | | | | | | | | | | | | | | | | | | | | | | | | | | | | | | | | | | | | | | | | |
| Credit cards | | | 6,628 | | | | 4.4 | % | | | 5,925 | | | | 3.1 | % | | | 7,615 | | | | 3.2 | % | | | 12,450 | | | | 4.9 | % | | | 10,692 | | | | 4.0 | % | | | 79,573 | | | | 6.0 | % | | | 37,427 | | | | 4.9 | % |
| Personal loans | | | 49,692 | | | | 33.3 | % | | | 54,410 | | | | 28.2 | % | | | 65,749 | | | | 27.8 | % | | | 72,157 | | | | 28.5 | % | | | 63,172 | | | | 23.7 | % | | | 277,596 | | | | 20.9 | % | | | 203,487 | | | | 26.4 | % |
| Vehicle loans | | | 29 | | | | 0.0 | % | | | 138 | | | | 0.1 | % | | | 203 | | | | 0.1 | % | | | 239 | | | | 0.1 | % | | | 110 | | | | 0.0 | % | | | 41,015 | | | | 3.1 | % | | | 22,638 | | | | 2.9 | % |
| Overdrafts | | | 354 | | | | 0.2 | % | | | 96 | | | | 0.1 | % | | | 134 | | | | 0.1 | % | | | 99 | | | | 0.0 | % | | | 103 | | | | 0.0 | % | | | 2,755 | | | | 0.2 | % | | | 1,773 | | | | 0.2 | % |
| Loans funded by development banks | | | 621 | | | | 0.4 | % | | | 440 | | | | 0.2 | % | | | 569 | | | | 0.2 | % | | | 260 | | | | 0.1 | % | | | 568 | | | | 0.2 | % | | | 2,792 | | | | 0.2 | % | | | 1,249 | | | | 0.2 | % |
| Trade financing | | | 216 | | | | 0.1 | % | | | 387 | | | | 0.2 | % | | | 199 | | | | 0.1 | % | | | 213 | | | | 0.1 | % | | | 243 | | | | 0.1 | % | | | 11,639 | | | | 0.9 | % | | | 7,184 | | | | 0.9 | % |
| Working capital loans | | | 3,667 | | | | 2.5 | % | | | 4,173 | | | | 2.2 | % | | | 1,391 | | | | 0.6 | % | | | 1,972 | | | | 0.8 | % | | | 1,764 | | | | 0.7 | % | | | 4,912 | | | | 0.4 | % | | | 4,132 | | | | 0.5 | % |
| Total retail | | | 61,207 | | | | 40.9 | % | | | 65,569 | | | | 34.1 | % | | | 75,860 | | | | 32.1 | % | | | 87,390 | | | | 34.5 | % | | | 76,652 | | | | 28.7 | % | | | 420,282 | | | | 31.7 | % | | | 277,890 | | | | 36.0 | % |
| Financial Leases | | | 2,154 | | | | 1.4 | % | | | - | | | | - | | | | - | | | | - | | | | 671 | | | | 0.3 | % | | | 7,674 | | | | 2.9 | % | | | 23,381 | | | | 1.8 | % | | | 9,892 | | | | 1.4 | % |
| Mortgage | | | 52,432 | | | | 35.0 | % | | | 60,580 | | | | 31.5 | % | | | 73,252 | | | | 30.9 | % | | | 66,657 | | | | 26.6 | % | | | 54,487 | | | | 20.5 | % | | | 480,469 | | | | 36.2 | % | | | 311,389 | | | | 40.3 | % |
| Total foreign past-due loans (COP) | | | 149,678 | | | | 100 | % | | | 192,540 | | | | 100 | % | | | 236,791 | | | | 100 | % | | | 252,819 | | | | 100 | % | | | 266,617 | | | | 100 | % | |
| Total Foreign and Domestic past-due loans (COP) | | | 1,832,702 | | | | 100 | % | | | 1,340,692 | | | | 100 | % | | | 1,395,899 | | | | 100 | % | | | 1,627,261 | | | | 100 | % | | | 1,624,005 | | | | 100 | % | |
| Total foreign past due loans | | | | 1,326,892 | | | | 100.0 | % | | | 772,228 | | | | 100.0 | % |
| | | | | | | | | | | | | | | | | | |
| Total Foreign and Domestic past due loans | | | | 4,934,110 | | | | 100.0 | % | | | 3,510,209 | | | | 100.0 | % |
The following table presents information with respect to the Bank’s loan portfolio at least 31 days past-due based on the nature of the collateral for the loan:
| | | As of December 31, | |
| | | 2012 | | | % | | | 2011 | | | % | | | 2010 | | | % | | | 2009 | | | % | | | 2008 | | | % | |
| | | (COP million, except percentages) | |
| Secured | | | | | | | | | | | | | | | | | | | | | | | | | | | | | | | | | | | | | | | | |
| Current | | | 28,630,768 | | | | 40.8 | % | | | 25,932,056 | | | | 42.2 | % | | | 20,970,409 | | | | 43.2 | % | | | 19,061,249 | | | | 45.3 | % | | | 17,779,101 | | | | 39.8 | % |
| Past-due Commercial loans | | | 363,054 | | | | 0.5 | % | | | 277,746 | | | | 0.5 | % | | | 327,323 | | | | 0.7 | % | | | 411,359 | | | | 1.0 | % | | | 324,541 | | | | 0.7 | % |
| Past-due Consumer loans | | | 124,323 | | | | 0.2 | % | | | 78,924 | | | | 0.1 | % | | | 73,476 | | | | 0.2 | % | | | 88,740 | | | | 0.2 | % | | | 70,934 | | | | 0.2 | % |
| Past-due Small business loans | | | 23,116 | | | | 0.1 | % | | | 17,423 | | | | 0.0 | % | | | 11,415 | | | | 0.1 | % | | | 7,824 | | | | 0.1 | % | | | 8,175 | | | | 0.1 | % |
| Past-due Mortgage loans | | | 408,898 | | | | 0.6 | % | | | 317,204 | | | | 0.5 | % | | | 303,270 | | | | 0.6 | % | | | 312,934 | | | | 0.7 | % | | | 285,382 | | | | 0.6 | % |
| Past-due Financial leases | | | 158,859 | | | | 0.2 | % | | | 125,095 | | | | 0.2 | % | | | 123,925 | | | | 0.3 | % | | | 180,303 | | | | 0.4 | % | | | 163,352 | | | | 0.4 | % |
| Total (COP) | | | 29,709,018 | | | | 42.4 | % | | | 26,748,448 | | | | 43.5 | % | | | 21,809,818 | | | | 45.1 | % | | | 20,062,409 | | | | 47.7 | % | | | 18,631,485 | | | | 41.8 | % |
| | | | | | | | | | | | | | | | | | | | | | | | | | | | | | | | | | | | | | | | | |
| Unsecured(1) | | | | | | | | | | | | | | | | | | | | | | | | | | | | | | | | | | | | | | | | |
| Current | | | 39,525,209 | | | | 56.5 | % | | | 34,115,680 | | | | 55.6 | % | | | 26,234,778 | | | | 54.0 | % | | | 21,353,464 | | | | 50.8 | % | | | 25,239,464 | | | | 56.5 | % |
| Past-due Commercial loans | | | 266,529 | | | | 0.4 | % | | | 240,461 | | | | 0.4 | % | | | 320,738 | | | | 0.7 | % | | | 331,812 | | | | 0.8 | % | | | 386,215 | | | | 0.9 | % |
| Past-due Consumer loans | | | 479,851 | | | | 0.7 | % | | | 273,943 | | | | 0.5 | % | | | 224,978 | | | | 0.5 | % | | | 284,863 | | | | 0.7 | % | | | 375,981 | | | | 0.8 | % |
| Past-due Small business loans | | | 8,072 | | | | 0.0 | % | | | 9,896 | | | | 0.0 | % | | | 10,778 | | | | 0.0 | % | | | 9,426 | | | | 0.0 | % | | | 9,425 | | | | 0.0 | % |
| Total (COP) | | | 40,279,661 | | | | 57.6 | % | | | 34,639,980 | | | | 56.5 | % | | | 26,791,272 | | | | 55.2 | % | | | 21,979,565 | | | | 52.3 | % | | | 26,011,085 | | | | 58.2 | % |
| | | | | | | | | | | | | | | | | | | | | | | | | | | | | | | | | | | | | | | | | |
| Total current loans and financial leases COP | | | 68,155,977 | | | | 97.3 | % | | | 60,047,736 | | | | 97.8 | % | | | 47,205,191 | | | | 97.1 | % | | | 40,414,713 | | | | 96.1 | % | | | 43,018,565 | | | | 96.4 | % |
| Past-due Commercial loans | | | 629,583 | | | | 0.9 | % | | | 518,207 | | | | 0.9 | % | | | 648,061 | | | | 1.4 | % | | | 743,171 | | | | 1.9 | % | | | 710,756 | | | | 1.6 | % |
| Past-due Consumer loans | | | 604,174 | | | | 0.9 | % | | | 352,867 | | | | 0.6 | % | | | 298,454 | | | | 0.6 | % | | | 373,603 | | | | 0.9 | % | | | 446,915 | | | | 1.0 | % |
| Past-due Small business loans | | | 31,188 | | | | 0.1 | % | | | 27,319 | | | | 0.0 | % | | | 22,189 | | | | 0.1 | % | | | 17,250 | | | | 0.0 | % | | | 17,600 | | | | 0.0 | % |
| Past-due Mortgage loans | | | 408,898 | | | | 0.6 | % | | | 317,204 | | | | 0.5 | % | | | 303,270 | | | | 0.6 | % | | | 312,934 | | | | 0.7 | % | | | 285,382 | | | | 0.6 | % |
| Past-due Financial leases | | | 158,859 | | | | 0.2 | % | | | 125,095 | | | | 0.2 | % | | | 123,925 | | | | 0.3 | % | | | 180,303 | | | | 0.4 | % | | | 163,352 | | | | 0.4 | % |
| Total past-due loans and financial leases (COP) | | | 1,832,702 | | | | 2.7 | % | | | 1,340,692 | | | | 2.2 | % | | | 1,395,899 | | | | 2.9 | % | | | 1,627,261 | | | | 3.9 | % | | | 1,624,005 | | | | 3.6 | % |
| Total gross loans and financial leases | | | 69,988,679 | | | | 100 | % | | | 61,388,428 | | | | 100 | % | | | 48,601,090 | | | | 100 | % | | | 42,041,974 | | | | 100 | % | | | 44,642,570 | | | | 100 | % |
| Allowance for loan and financial lease losses | | | (3,249,639 | ) | | | (4.6 | )% | | | (2,812,582 | ) | | | (4.6 | )% | | | (2,509,213 | ) | | | (5.2 | )% | | | (2,431,667 | ) | | | (5.8 | )% | | | (2,134,360 | ) | | | (4.8 | )% |
| Total loans and financial leases, net (COP) | | | 66,739,040 | | | | 95.4 | % | | | 58,575,846 | | | | 95.4 | % | | | 46,091,877 | | | | 94.8 | % | | | 39,610,307 | | | | 94.2 | % | | | 42,508,210 | | | | 95.2 | % |
| (1) | Includes loans with personal guarantees. |
Non-performing loans, accruing loans which are contractually past-due 90 days and performing troubled debt restructuring loans
Non-performing loans and accruing loans which are contractually past-due 90 days
As of December 31, 2012, 2011, 2010, 2009 and 2008, Bancolombia did not have any performing loans which were past-due for 90 days or more.
The following table shows the non-performing loans portfolio classified into foreign and domestic loans, the gross interest income that would have been recorded in the period that ended if the loans had been current in accordance with their original terms and had been outstanding throughout the period or since origination and the amount of interest income on those loans that were included in net income for the period.
| | | As of December 31, | |
| | | 2012 | |
| | | Amount of Loans | | | Gross Interest Income | | | Interest income included in net
income for the period | |
| | | | | | (COP million) | | | | |
| Foreign loans | | COP | 107,652 | | | COP | 10,382 | | | COP | 1,832 | |
| Domestic loans | | | 1,120,675 | | | | 472,261 | | | | 345,533 | |
| Non –perfoming loans | | COP | 1,228,327 | | | COP | 482,643 | | | COP | 347,365 | |
| | | As of December 31, | |
| | | 2011 | |
| | | Amount of Loans | | | Gross Interest Income | | | Interest income included in net
income for the period | |
| | | | | | (COP million) | | | | |
| Foreign loans | | COP | 145,136 | | | COP | 14,423 | | | COP | 2,583 | |
| Domestic loans | | | 785,404 | | | | 332,051 | | | | 244,619 | |
| Non-perfoming loans | | COP | 930,540 | | | COP | 346,474 | | | COP | 247,202 | |
Performing Troubled Debt Restructuring Loans
The following table presents a summary of the Bank’s Troubled Debt Restructuring loans accounted for on a performing basis in accordance with the criteria of the SFC in effect at the end of each period, classified into foreign and domestic loans:
| | | As of December 31, | |
| | | 2012 | | | 2011 | | | 2010 | | | 2009 | | | 2008 | |
| | | (COP million) | |
| Foreign loans | | | 224,385 | | | | 270,803 | | | | 266,173 | | | | 169,459 | | | | 176,246 | |
| Domestic loans | | | 208,405 | | | | 441,055 | | | | 1,088,117 | | | | 994,506 | | | | 623,722 | |
| Total Performing Troubled Debt Restructuring loans (COP) | | | 432,790 | | | | 711,858 | | | | 1,354,290 | | | | 1,163,965 | | | | 799,968 | |
The following table shows the Bank’s Performing Troubled Debt Restructuring loan portfolio classified into foreign and domestic loans, the gross interest income that would have been recorded in the period that ended if the loans had been current in accordance with their original terms and had been outstanding throughout the period or since origination and the amount of interest income on those loans that was included in net income for the period.
| | | As of December 31, | |
| | | 2012 | |
| | | Amount of Loans | | | Gross Interest Income | | | Interest income included in
net income for the period | |
| | | | | | (COP million) | | | | |
| Foreign loans | | | 224,385 | | | | 15,399 | | | | 15,399 | |
| Domestic loans | | | 208,405 | | | | 23,622 | | | | 23,622 | |
| Total Performing Troubled Debt Restructuring loans | | COP | 432,790 | | | COP | 39,021 | | | COP | 39,021 | |
| | | As of December 31, | |
| | | 2011 | |
| | | Amount of Loans | | | Gross Interest Income | | | Interest income included in
net income for the period | |
| | | | | | (COP million) | | | | |
| Foreign loans | | | 270,803 | | | | 19,617 | | | | 19,617 | |
| Domestic loans | | | 441,055 | | | | 51,969 | | | | 51,969 | |
| Total Performing Troubled Debt Restructuring loans | | COP | 711,858 | | | COP | 71,586 | | | COP | 71,586 | |
Policies for the granting and review of credit
The Bank’s credit standards and policies aim to achieve a high level of credit quality in the Bank’s loan portfolio, efficiency in the processing of loans and the specific assignment of responsibilities for credit risk.
To maintain credit quality and manage the risk arising from its lending activities, the Bank has established general loan policies for the evaluation of credit, the determination of lending limits to customers and the level of management authority required to approve a loan. In addition, the Bank has established a centralized area for credit analysis, the disbursement process and the management and custody of promissory notes and guarantees.
Bancolombia’s policies require every credit to be analyzed using the following factors: the character, reputation and credit history of the borrower, the type of business the borrower engages in, the borrower’s ability to repay the loan and/or its projected cashflowscash flows, the coverage and suitability of the proposed collateral for the loan and information received from the two credit risk bureaus currently operating in Colombia.
In addition to the analysis of the borrower, the Bank engages in the analysis of the different economic sectors toin which the Bank makes loans and has established guidelines for financial analysis of the borrower and for participation in investment projects in and outside Colombia.
The Bank applies the lending limits to borrowers established under Colombian law, which require that: (i) uncollateralized loans to a single customer or economic group may not exceed 10% of the Bank’s (unconsolidated) Technical Capital; (ii) collateralized loans to a single customer or economic group may not exceed 25% of the Bank’s (unconsolidated) Technical Capital; (iii) a collateralized loan to a stockholder of the Bank, who owns a position exceeding 20% of the Bank’s Capital,capital, may not exceed 20% of the Bank’s (unconsolidated) Technical Capital; (iv) aan uncollateralized loan to a stockholder of the Bank who owns a position exceeding 20% of the Bank’s Capital,capital, may not exceed 10% of the Bank’s (unconsolidated) Technical Capital; and (v) a loan to a financial institution may not exceed 30% of the Bank’s (unconsolidated) Technical Capital.
In general, the term of a loan will depend on the type of guarantee, the credit history of the borrower and the purpose of the loan. Almost 66% of the Bank’s loan portfolio has a maturity of five years or less.
Loan applications, depending on their amount, are presented for approval to branch managers, the zone or regional managers, the Vice Presidents,vice presidents, the President,president, the Credit Committeecredit committee and the board of directors of Bancolombia.Bancolombia (the “Board of Directors”). In general, loan application decisions are made by the Bank’s management in the corresponding committee. Approval at each level also requires the agreement of each lower level of the approval hierarchy.
Loans to managers, directors and affiliates of the Bank must be approved by the boardBoard of directors of the Bank,Directors, which has the authority to grant loans in any principal amount subject to the Bank’s legal lending limit.
The Bank has established policies for the valuation of collateral received as well as for the determination of the maximum loan amount that can be granted against the value of the collateral. Periodically, the Bank undertakes a valuation of collateral held as security for loans, and the valuation frequency varies depending on the type of collateral. In any event, the collateral cannot be used to mitigate risk if its valuation is not updated on a periodic basis. In addition, forFor retail and mortgage loans that are between 5five and 60 days past-due, responsibility for collecting payments is outsourced to an external collection company controls each obligation payment,company; for commercial lendingloans this procedure is always madecarried out by internal employees. When a loan becomes 60 days past-due, management of the loan will be giventransferred to an independent and specialized division within the Bank where various steps will be taken to recover the loan.
In October 2011, the SFC issued the External Circular 043 of 2011 with the purpose of setting forth the necessary instructions to be followed by financial institutions in order to determine the fair value of collateral securing loans, as well as the frequency of valuations of collateral. In accordance with these new regulations, all collateral must be valued at least every three years, except those which support mortgage and automobile loans, which must be valued annually. When the current valuation is overdue, the fair value is not considered in the measurement of certain allowances for loan losses as a mitigating factor.
With respect to monitoring outstanding loans, the Bank in accordance with the requirements of the SFC, has implemented regional committees and a central qualification process to undertake a biannualbi-annual evaluation of the loan portfolio, during the months of May and November.portfolio. When monitoring outstanding loans, the Bank examines current financial statements including cash flow and financial indicators, industry analysis and historical payment behavior.
Additionally, all of the Bank’s loans are evaluated monthly based on the days they are past-due. When reviewing loans, Bancolombia evaluates and updates their risk classification and makes corresponding adjustments in theto their provisions, if needed.
In addition, the Bank carries out a credit audit process that reviews clients with financial weaknesses, early past-due loans, clients in underperforming sectors, that are underperforming, and branches with high records of write-offs, among others.
| E.4. | SUMMARY OF LOAN LOSS EXPERIENCE |
ALLOWANCE FOR LOANLOANS AND FINANCIAL LEASES LOSSES
The Bank records an allowance for loans and financial leaseslease losses in accordance with the regulations establishedIFRS as issued by the SFC.IASB. For further details regarding the regulation and methodologies for the calculation of such allowances please see Item 5. Operating andNote 2 to the Consolidated Financial Review and Prospects - “Allowance for credit losses” and Note 2.i. of Notes to Financial Statements included in this Annual Report.Statements.
The following table sets forth the changes in the allowance for loan and financial lease losses:
| | | Year Ended December 31, | |
| | | 2012 | | | 2011 | | | 2010 | | | 2009 | | | 2008 | |
| | | (COP million) | |
| Balance at beginning of period | | | 2,812,582 | | | | 2,509,213 | | | | 2,431,667 | | | | 2,134,360 | | | | 1,457,151 | |
| Sale of Asesuisa S.A. and Asesuisa Vida S.A.(1) | | | (688 | ) | | | - | | | | - | | | | - | | | | - | |
| Provisions for loan losses(2) | | | 2,344,265 | | | | 1,796,873 | | | | 1,842,406 | | | | 2,448,581 | | | | 1,986,710 | |
| Recoveries of provisions | | | (1,192,067 | ) | | | (972,251 | ) | | | (1,085,211 | ) | | | (1,186,674 | ) | | | (807,245 | ) |
| Charge-offs | | | (678,506 | ) | | | (531,682 | ) | | | (658,151 | ) | | | (925,592 | ) | | | (547,860 | ) |
| Effect of difference in exchange rate | | | (35,947 | ) | | | 10,429 | | | | (21,498 | ) | | | (39,008 | ) | | | 45,604 | |
| Balance at end of year(3) | | | 3,249,639 | | | | 2,812,582 | | | | 2,509,213 | | | | 2,431,667 | | | | 2,134,360 | |
| | | Year Ended December 31, | |
| | | 2015 | | | 2014 | |
| | | (in millions of COP) | |
| | | | | | | |
| Balance at beginning of period | | | 4,789,257 | | | | 4,473,562 | |
| Domestic | | | 4,028,866 | | | | 3,766,387 | |
| Foreign | | | 760,391 | | | | 707,175 | |
| Domestic Discontinued Operations(1) | | | (282,098 | ) | | | - | |
| Provisions for loan losses, net | | | 1,884,859 | | | | 1,308,825 | |
| Domestic | | | 1,642,914 | | | | 1,236,594 | |
| Foreign | | | 241,945 | | | | 72,231 | |
| Charge-offs | | | (1,422,055 | ) | | | (1,178,748 | ) |
| Domestic | | | (1,134,928 | ) | | | (974,115 | ) |
| Foreign | | | (287,127 | ) | | | (204,633 | ) |
| Effect of difference in exchange rate | | | 278,792 | | | | 185,618 | |
| Foreign | | | 278,792 | | | | 185,618 | |
| Balance at end of year | | | 5,248,755 | | | | 4,789,257 | |
| Domestic | | | 4,254,754 | | | | 4,028,866 | |
| Foreign | | | 994,001 | | | | 760,391 | |
As of December 31, 2015, Tuya S.A. Compañía de Financiamiento is considered as a discontinued operation (See Note 31).
| (1) | On February 5, 2011, Banagrícola S.A. and Inversiones Financieras Banco Agrícola S.A., subsidiaries of Bancolombia S.A., and Suramericana S.A. signed an agreement pursuant to which Banagrícola S.A. and Inversiones Financieras Banco Agrícola S.A. agreed to sell to Suramericana 97.03% of its shares of capital stock of Asesuisa, an insurance company in the Republic of El Salvador. |
On September 27, 2012, after obtaining all of the authorizations required by the authorities of Colombia and El Salvador, Banagrícola S.A. and Inversiones Financieras Banco Agrícola S.A., subsidiaries of Bancolombia S.A., sold to Seguros Suramericana S.A., a Panamanian company linked to Grupo de Inversiones Suramericana, 97.03% of its shares of capital stock of Asesuisa, an insurance company in the Republic of El Salvador. The total amount received by Banagrícola S.A. and Inversiones Financieras Banco Agrícola S.A. was USD 97,999.
| (2) | The provision for past-due accrued interest receivable, which is not included in this item, amounted to COP 48,085 million, COP 31,852 million, COP 33,540 million, COP 46,840 million and COP 58,721 million for the years ended December 31, 2012, 2011, 2010, 2009 and 2008, respectively. |
| (3) | The allowance for past due accrued interest receivable, which is not included in this item, amounted to COP 54,026 million, COP 43,644 million, COP 38,952 million, COP 45,937 million, and COP 54,323 million for the years ended December 31, 2012, 2011, 2010, 2009, and 2008, respectively. The allowance at the beginning the period for past-due accrued interest receivable , which is not included in this item, amounted to COP 43,644 million, COP 38,952 million, COP 45,937 million, COP 54,323 million, and COP 33,303 million for the years ended December 31, 2012, 2011, 2010, 2009, and 2008, respectively. |
The recoveriesRecoveries of charged-off loans are recorded in the consolidated statement of operationsincome and are not included in provisions for loan losses. See(See “Recovery of charged-off loans” in the Consolidated Statement of Operations on the line: Recovery of Charged-off loans.Income).
The following table sets forth the allocation of the Bank’s allowance for loan and financial lease losses by type of loan using the classification of the SFC:
| | | As of December 31, | |
| | | 2012 | | | 2011 | | | 2010 | | | 2009 | | | 2008 | |
| | | (COP million) | |
| Commercial loans | | | 1,661,705 | | | | 1,472,657 | | | | 1,465,318 | | | | 1,443,943 | | | | 1,202,047 | |
| Consumer loans | | | 988,391 | | | | 804,321 | | | | 559,789 | | | | 523,353 | | | | 502,496 | |
| Small business loans | | | 28,191 | | | | 24,528 | | | | 21,719 | | | | 17,263 | | | | 12,424 | |
| Financial leases | | | 310,443 | | | | 283,665 | | | | 269,634 | | | | 253,764 | | | | 197,952 | |
| Mortgage | | | 198,780 | | | | 176,501 | | | | 157,459 | | | | 157,445 | | | | 122,407 | |
| General allowance | | | 62,129 | | | | 50,910 | | | | 35,294 | | | | 35,899 | | | | 97,034 | |
| Total allowance for loan losses (COP)(1) | | | 3,249,639 | | | | 2,812,582 | | | | 2,509,213 | | | | 2,431,667 | | | | 2,134,360 | |
| | | As of December 31, | |
| | | 2015 | | | 2014 | |
| | | (in millions of COP) | |
| Commercial loans | | | 2,694,965 | | | | 2,360,488 | |
| Consumer loans | | | 1,321,281 | | | | 1,479,460 | |
| Small business loans | | | 80,586 | | | | 76,560 | |
| Financial leases | | | 579,151 | | | | 415,766 | |
| Mortgage | | | 572,772 | | | | 456,983 | |
| Total allowance for loan losses | | | 5,248,755 | | | | 4,789,257 | |
| (1) | For mortgage and microcredit loans, the Bank sets up a general allowance, which corresponds to one percent (1%) of the outstanding principal. By virtue of applying the standardized models supplied by the SFC for commercial and consumer loans, general allowances are no longer assigned to commercial and consumer loans. |
The following table sets forth the allocation of the Bank’s allowance for domestic and foreign loans and financial leaseslease losses by type of loan:
| | | As of December 31, | | | As of December 31, | |
| | | 2012 | | | % | | | 2011 | | | % | | | 2010 | | | % | | | 2009 | | | % | | | 2008 | | | % | | | 2015 | | | % | | | 2014 | | | % | |
| | | (COP million, except percentages) | | | (in millions of COP, except percentages) | |
| Domestic | | | | | | | | | | | | | | | | | | | | | | | | | | | | | | | | | | | | | | | | | | | | | | | | | | | | | | | | |
| Corporate | | | | | | | | | | | | | | | | | | | | | | | | | | | | | | | | | | | | | | | | | | | | | | | | | | | | | | | | |
| Trade financing | | | 31,939 | | | | 1.1 | % | | | 42,797 | | | | 1.7 | % | | | 36,857 | | | | 1.7 | % | | | 22,834 | | | | 1.1 | % | | | 13,081 | | | | 0.7 | % | | | 35,387 | | | | 0.8 | % | | | 14,759 | | | | 0.4 | % |
| Loans funded by development banks | | | 17,659 | | | | 0.6 | % | | | 36,944 | | | | 1.5 | % | | | 39,189 | | | | 1.8 | % | | | 47,540 | | | | 2.2 | % | | | 61,430 | | | | 3.4 | % | | | 23,552 | | | | 0.5 | % | | | 5,772 | | | | 0.1 | % |
| Working capital loans | | | 893,522 | | | | 30.0 | % | | | 728,313 | | | | 29.7 | % | | | 687,038 | | | | 31.8 | % | | | 614,342 | | | | 29.0 | % | | | 522,065 | | | | 28.8 | % | | | 1,183,378 | | | | 27.4 | % | | | 1,006,493 | | | | 25.0 | % |
| Credit cards | | | 1,166 | | | | 0.0 | % | | | 1,122 | | | | 0.1 | % | | | 898 | | | | 0.0 | % | | | 826 | | | | 0.0 | % | | | 1,134 | | | | 0.1 | % | | | 2,218 | | | | 0.1 | % | | | 1,995 | | | | 0.1 | % |
| Overdrafts | | | 4,525 | | | | 0.2 | % | | | 2,091 | | | | 0.1 | % | | | 2,892 | | | | 0.1 | % | | | 3,783 | | | | 0.2 | % | | | 3,983 | | | | 0.2 | % | | | 3,318 | | | | 0.1 | % | | | 5,759 | | | | 0.1 | % |
| Total corporate | | | 948,811 | | | | 31.9 | % | | | 811,267 | | | | 33.1 | % | | | 766,874 | | | | 35.4 | % | | | 689,325 | | | | 32.5 | % | | | 601,693 | | | | 33.2 | % | | | 1,247,853 | | | | 28.9 | % | | | 1,034,778 | | | | 25.7 | % |
| Retail | | | | | | | | | | | | | | | | | | | | | | | | | | | | | | | | | | | | | | | | | | | | | | | | | | | | | | | | |
| Credit cards | | | 426,535 | | | | 14.3 | % | | | 385,481 | | | | 15.7 | % | | | 285,248 | | | | 13.2 | % | | | 266,094 | | | | 12.6 | % | | | 208,323 | | | | 11.5 | % | | | 343,057 | | | | 8.0 | % | | | 589,702 | | | | 14.6 | % |
| Personal loans | | | 327,009 | | | | 11.0 | % | | | 199,464 | | | | 8.1 | % | | | 124,912 | | | | 5.8 | % | | | 122,265 | | | | 5.8 | % | | | 166,880 | | | | 9.2 | % | | | 441,225 | | | | 10.2 | % | | | 422,649 | | | | 10.5 | % |
| Vehicle loans | | | 122,604 | | | | 4.1 | % | | | 106,379 | | | | 4.3 | % | | | 95,308 | | | | 4.4 | % | | | 112,626 | | | | 5.3 | % | | | 115,593 | | | | 6.4 | % | | | 180,408 | | | | 4.2 | % | | | 224,481 | | | | 5.6 | % |
| Overdrafts | | | 18,304 | | | | 0.6 | % | | | 13,824 | | | | 0.6 | % | | | 13,341 | | | | 0.6 | % | | | 16,650 | | | | 0.8 | % | | | 24,002 | | | | 1.3 | % | | | 27,668 | | | | 0.6 | % | | | 36,345 | | | | 0.9 | % |
Loans funded by
development banks | | | 38,843 | | | | 1.3 | % | | | 46,021 | | | | 1.9 | % | | | 45,927 | | | | 2.1 | % | | | 48,354 | | | | 2.3 | % | | | 41,323 | | | | 2.3 | % | | | 38,274 | | | | 0.9 | % | | | 39,235 | | | | 1.0 | % |
| Trade financing | | | 5,230 | | | | 0.2 | % | | | 2,026 | | | | 0.1 | % | | | 1,333 | | | | 0.1 | % | | | 2,450 | | | | 0.1 | % | | | 7,616 | | �� | | 0.4 | % | | | 13,531 | | | | 0.3 | % | | | 12,972 | | | | 0.3 | % |
| Working capital loans | | | 535,946 | | | | 18.0 | % | | | 413,364 | | | | 16.8 | % | | | 393,285 | | | | 18.2 | % | | | 442,116 | | | | 20.9 | % | | | 330,437 | | | | 18.3 | % | | | 1,084,698 | | | | 25.2 | % | | | 969,557 | | | | 24.1 | % |
| Total retail | | | 1,474,471 | | | | 49.5 | % | | | 1,166,559 | | | | 47.5 | % | | | 959,354 | | | | 44.4 | % | | | 1,010,555 | | | | 47.8 | % | | | 894,174 | | | | 49.4 | % | | | 2,128,861 | | | | 49.4 | % | | | 2,294,941 | | | | 57.0 | % |
| Financial Leases | | | 320,855 | | | | 10.8 | % | | | 287,615 | | | | 11.7 | % | | | 273,556 | | | | 12.7 | % | | | 251,618 | | | | 11.9 | % | | | 187,514 | | | | 10.4 | % | |
| Financial leases | | | | 553,317 | | | | 12.8 | % | | | 388,115 | | | | 9.6 | % |
| Mortgage | | | 177,308 | | | | 6.0 | % | | | 147,087 | | | | 6.0 | % | | | 133,101 | | | | 6.2 | % | | | 136,674 | | | | 6.5 | % | | | 103,133 | | | | 5.7 | % | | | 382,533 | | | | 8.9 | % | | | 311,032 | | | | 7.7 | % |
| General allowance | | | 54,171 | | | | 1.8 | % | | | 42,613 | | | | 1.7 | % | | | 27,234 | | | | 1.3 | % | | | 26,989 | | | | 1.3 | % | | | 24,062 | | | | 1.3 | % | |
Total domestic allowance for loan
losses (COP) | | | 2,975,616 | | | | 100 | % | | | 2,455,141 | | | | 100 | % | | | 2,160,119 | | | | 100 | % | | | 2,115,161 | | | | 100 | % | | | 1,810,576 | | | | 100 | % | |
| | | | | | | | | | | | | | | | | | | | | | | | | | | | | | | | | | | | | | | | | | |
| Total domestic allowance for loan losses | | | | 4,312,564 | | | | 100.0 | % | | | 4,028,866 | | | | 100.0 | % |
| Foreign | | | | | | | | | | | | | | | | | | | | | | | | | | | | | | | | | | | | | | | | | | | | | | | | | | | | | | | | |
| Corporate | | | | | | | | | | | | | | | | | | | | | | | | | | | | | | | | | | | | | | | | | | | | | | | | | | | | | | | | |
| Trade financing | | | 5,664 | | | | 2.1 | % | | | 14,078 | | | | 3.9 | % | | | 26,344 | | | | 7.6 | % | | | 13,502 | | | | 4.3 | % | | | 13,633 | | | | 4.2 | % | | | 82,777 | | | | 8.8 | % | | | 83,306 | | | | 10.9 | % |
| Loans funded by development banks | | | 340 | | | | 0.1 | % | | | 222 | | | | 0.1 | % | | | 554 | | | | 0.2 | % | | | 1,107 | | | | 0.3 | % | | | 545 | | | | 0.2 | % | | | 568 | | | | 0.1 | % | | | 175 | | | | 0.0 | % |
| Working capital loans | | | 114,041 | | | | 41.6 | % | | | 142,416 | | | | 39.8 | % | | | 174,348 | | | | 49.9 | % | | | 172,704 | | | | 54.6 | % | | | 132,294 | | | | 40.9 | % | | | 256,244 | | | | 27.4 | % | | | 227,915 | | | | 30.0 | % |
| Credit cards | | | 245 | | | | 0.1 | % | | | 406 | | | | 0.1 | % | | | 344 | | | | 0.1 | % | | | 387 | | | | 0.0 | % | | | 177 | | | | 0.0 | % | | | 838 | | | | 0.1 | % | | | 361 | | | | 0.1 | % |
| Overdrafts | | | 302 | | | | 0.1 | % | | | 457 | | | | 0.1 | % | | | 513 | | | | 0.2 | % | | | 656 | | | | 0.2 | % | | | 222 | | | | 0.1 | % | | | 656 | | | | 0.1 | % | | | 548 | | | | 0.1 | % |
| Total Corporate | | | 120,592 | | | | 44.0 | % | | | 157,579 | | | | 44.0 | % | | | 202,103 | | | | 58.0 | % | | | 188,356 | | | | 59.4 | % | | | 146,871 | | | | 45.4 | % | |
| Total corporate | | | | 341,083 | | | | 36.5 | % | | | 312,305 | | | | 41.1 | % |
| Retail | | | | | | | | | | | | | | | | | | | | | | | | | | | | | | | | | | | | | | | | | | | | | | | | | | | | | | | | |
| Credit cards | | | 12,484 | | | | 4.6 | % | | | 13,550 | | | | 3.8 | % | | | 10,991 | | | | 3.2 | % | | | 12,961 | | | | 4.1 | % | | | 9,469 | | | | 2.9 | % | | | 66,582 | | | | 7.1 | % | | | 42,433 | | | | 5.6 | % |
| Personal loans | | | 101,010 | | | | 36.8 | % | | | 137,574 | | | | 38.5 | % | | | 97,239 | | | | 27.9 | % | | | 78,999 | | | | 25.0 | % | | | 62,409 | | | | 19.3 | % | | | 277,094 | | | | 29.6 | % | | | 221,627 | | | | 29.2 | % |
| Vehicle loans | | | 76 | | | | 0.0 | % | | | 167 | | | | 0.1 | % | | | 220 | | | | 0.1 | % | | | 242 | | | | 0.1 | % | | | 152 | | | | 0.0 | % | | | 14,076 | | | | 1.5 | % | | | 12,533 | | | | 1.7 | % |
| Overdrafts | | | 1,066 | | | | 0.4 | % | | | 2,795 | | | | 0.8 | % | | | 2,403 | | | | 0.7 | % | | | 2,032 | | | | 0.6 | % | | | 564 | | | | 0.2 | % | | | 10,780 | | | | 1.1 | % | | | 8,237 | | | | 1.1 | % |
Loans funded by
development banks | | | 1,098 | | | | 0.4 | % | | | 1,681 | | | | 0.5 | % | | | 708 | | | | 0.2 | % | | | 332 | | | | 0.1 | % | | | 274 | | | | 0.1 | % | | | 2,731 | | | | 0.3 | % | | | 1,514 | | | | 0.2 | % |
| Trade financing | | | 152 | | | | 0.1 | % | | | 414 | | | | 0.1 | % | | | 303 | | | | 0.1 | % | | | 214 | | | | 0.1 | % | | | 525 | | | | 0.2 | % | | | 3,450 | | | | 0.4 | % | | | 2,728 | | | | 0.4 | % |
| Working capital loans | | | 2,170 | | | | 0.8 | % | | | 2,427 | | | | 0.7 | % | | | 1,025 | | | | 0.3 | % | | | 1,542 | | | | 0.5 | % | | | 838 | | | | 0.3 | % | | | 5,305 | | | | 0.6 | % | | | 4,867 | | | | 0.6 | % |
| Total retail | | | 118,056 | | | | 43.1 | % | | | 158,608 | | | | 44.5 | % | | | 112,889 | | | | 32.5 | % | | | 96,322 | | | | 30.5 | % | | | 74,231 | | | | 23.0 | % | | | 380,018 | | | | 40.6 | % | | | 293,939 | | | | 38.8 | % |
| Financial Leases | | | 5,947 | | | | 2.2 | % | | | 3,576 | | | | 1.0 | % | | | 1,685 | | | | 0.5 | % | | | 2,147 | | | | 0.7 | % | | | 10,436 | | | | 3.1 | % | |
| Financial leases | | | | 24,848 | | | | 2.6 | % | | | 8,217 | | | | 1.0 | % |
| Mortgage | | | 21,470 | | | | 7.8 | % | | | 29,381 | | | | 8.2 | % | | | 24,357 | | | | 7.0 | % | | | 20,771 | | | | 6.6 | % | | | 19,274 | | | | 6.0 | % | | | 190,242 | | | | 20.3 | % | | | 145,930 | | | | 19.1 | % |
| General allowance | | | 7,958 | | | | 2.9 | % | | | 8,297 | | | | 2.3 | % | | | 8,060 | | | | 2.0 | % | | | 8,910 | | | | 2.8 | % | | | 72,972 | | | | 22.5 | % | |
| Total foreign allowances for loan losses (COP) | | | 274,023 | | | | 100 | % | | | 357,441 | | | | 100 | % | | | 349,094 | | | | 100 | % | | | 316,506 | | | | 100 | % | | | 323,784 | | | | 100 | % | |
Total Foreign and Domestic allowance for loan
losses (COP) | | | 3,249,639 | | | | 100 | % | | | 2,812,582 | | | | 100 | % | | | 2,509,213 | | | | 100 | % | | | 2,431,667 | | | | 100 | % | | | 2,134,360 | | | | 100 | % | |
| Total foreign allowance for loan losses | | | | 936,191 | | | | 100.0 | % | | | 760,391 | | | | 100.0 | % |
| | | | | | | | | | | | | | | | | | |
| Total Foreign and Domestic allowance for loan losses | | | | 5,248,755 | | | | 100.0 | % | | | 4,789,257 | | | | 100.0 | % |
As of December 31, 2012,2015, allowances for loans and financial lease losses amounted to COP 3,2505,249 billion (4.6%(3.60% of total loans), up 15.5%9.61% as compared to COP 2,8134,789 billion (4.6%(4.16% of total loans) at the end of 2011, and up 29.5% as compared to COP 2,509 billion (5.2% of loans) at the end of 2010.2014.
Coverage, measured by the ratio of allowances for loan losses to past-due loans (overdue 30 or more days), was 177%115% at the end of 2012, decreasing2015 and down from 210%127% at the end of 2011 and 180% at the end of 2010.2014. The decrease in thisthe coverage ratio is explained by the rate of formation of PDLs during the year, which was faster than the pace of increase in allowances in the balance sheet. For further information regarding asset quality and provision charges see “Item 5. Operating and Financial Review and Prospects”.statement of financial position.
CHARGE-OFFS
CHARGE-OFFS
The following table shows the allocation of the Bank’s charge-offs of domestic and foreign loans by type of loan as of December 31, 2012, 2011, 2010, 20092015 and 2008:2014:
| | | Year ended December 31, | | | Year ended December 31, | |
| | | 2012 | | | 2011 | | | 2010 | | | 2009 | | | 2008 | | | 2015 | | | 2014 | |
| | | (COP million) | | | (in millions of COP) | |
| Domestic | | | | | | | | | | | | | | | | | | | | | | | | | | | | |
| Trade financing | | | 452 | | | | 706 | | | | 2,165 | | | | 263 | | | | 2,558 | | | | 1,220 | | | | 12,452 | |
| Loans funded by development banks | | | 15,133 | | | | 11,000 | | | | 22,368 | | | | 37,112 | | | | 8,820 | | | | 23,852 | | | | 10,078 | |
| Working capital loans | | | 131,165 | | | | 172,572 | | | | 202,241 | | | | 329,603 | | | | 45,941 | | | | 457,097 | | | | 279,701 | |
| Credit cards | | | 293,507 | | | | 131,553 | | | | 172,804 | | | | 195,676 | | | | 166,067 | | | | 145,350 | | | | 325,475 | |
| Personal loans | | | 98,253 | | | | 44,561 | | | | 69,808 | | | | 96,597 | | | | 138,007 | | | | 209,211 | | | | 197,973 | |
| Automobile loans | | | 35,846 | | | | 25,227 | | | | 55,711 | | | | 57,966 | | | | 29,088 | | |
| Vehicle loans | | | | 81,140 | | | | 79,527 | |
| Overdrafts | | | 7,224 | | | | 8,345 | | | | 15,052 | | | | 27,685 | | | | 52,822 | | | | 13,947 | | | | 10,276 | |
| Mortgage & other | | | 11,693 | | | | 30,833 | | | | 679 | | | | 29,027 | | | | 509 | | |
| Mortgage and other | | | | 167,718 | | | | 13,818 | |
| Financial leases | | | 30,414 | | | | 21,664 | | | | 23,799 | | | | 30,284 | | | | 27,650 | | | | 35,393 | | | | 44,815 | |
| Total domestic charge-offs (COP) | | | 623,687 | | | | 446,461 | | | | 564,627 | | | | 804,213 | | | | 471,462 | | |
| | | | | | | | | | | | | | | | | | | | | | |
| Total domestic charge-offs | | | | 1,134,928 | | | | 974,115 | |
| Foreign | | | | | | | | | | | | | | | | | | | | | | | | | | | | |
| Trade financing | | | 249 | | | | 44 | | | | 3,999 | | | | 74 | | | | 1,819 | | | | - | | | | 72 | |
| Loans funded by development banks | | | 46 | | | | 28 | | | | 6 | | | | 62 | | | | - | | | | - | | | | - | |
| Working capital loans | | | 11,554 | | | | 37,312 | | | | 31,207 | | | | 31,850 | | | | 21,581 | | | | 28,317 | | | | 33,170 | |
| Credit cards | | | 6,268 | | | | 6,672 | | | | 10,969 | | | | 13,460 | | | | 10,734 | | | | 37,938 | | | | 40,640 | |
| Personal loans | | | 31,445 | | | | 38,305 | | | | 45,898 | | | | 62,854 | | | | 39,073 | | | | 198,283 | | | | 113,685 | |
| Automobile loans | | | 10 | | | | 75 | | | | 167 | | | | 55 | | | | 88 | | |
| Vehicle loans | | | | 9,968 | | | | 5,211 | |
| Overdrafts | | | 3,720 | | | | 1,110 | | | | 947 | | | | 1,167 | | | | 620 | | | | 726 | | | | 3,743 | |
| Mortgage & other | | | 1,527 | | | | 1,675 | | | | 331 | | | | 3,472 | | | | 2,434 | | |
| Mortgage and other | | | | 11,761 | | | | 8,112 | |
| Financial leases | | | - | | | | - | | | | - | | | | 8,385 | | | | 49 | | | | 134 | | | | - | |
| Total foreign charge-offs (COP) | | | 54,819 | | | | 85,221 | | | | 93,524 | | | | 121,379 | | | | 76,398 | | |
| Total Foreign and Domestic charge-offs (COP) | | | 678,506 | | | | 531,682 | | | | 658,151 | | | | 925,592 | | | | 547,860 | | |
| Total foreign charge-offs | | | | 287,127 | | | | 204,633 | |
| Total Foreign and Domestic charge-offs | | | | 1,422,055 | | | | 1,178,748 | |
The ratio of charge-offs to average outstanding loans for the years ended December 31, 2012, 2011, 2010, 20092015 and 20082014, was as follows:
| | | Year ended December 31, | |
| | | 2012 | | | 2011 | | | 2010 | | | 2009 | | | 2008 | |
| Ratio of charge-offs to average outstanding loans | | | 1.07 | % | | | 0.99 | % | | | 1.49 | % | | | 2.10 | % | | | 1.36 | % |
| | | Year ended December 31, | |
| | | 2015 | | | 2014 | |
| Ratio of charge-offs to average outstanding loans | | | 1.14 | % | | | 1.19 | % |
The Bank charges off loans that are classified as “unrecoverable” once they become overdue:overdue as follows: (i) after 180 days for consumer and small business loans; (ii) after 360 days for commercial loans; and (iii) 54 monthsafter 1,620 days for mortgage loans.
All charge-offs must be approved by the boardBoard of directors.Directors. Even if a loan is charged off, management remains responsible for decisions in respect of the loan, and neither the Bank nor its Subsidiaries in Colombia are released from their obligations to pursue recovery as appropriate.
The recovery of charged-off loans is accounted for as income in the Consolidated Statementconsolidated statement of Operations.income on a cash receipts basis.
POTENTIAL PROBLEM LOANS
In order to carefully monitor the credit risk associated with clients, the Bank has established a committee that meets monthly to identify current situations or anticipate future situations that might generate a possible deterioration in the client’s ability of paying.to pay. In general, the clients who are analyzedplaced on this watch list when they could face difficulties in the future in the repayment of their obligations with the Bank but who have had a good record of payment behavior. This situationThe reasons for placing a client on the watch list could be related to internal factors such as economic activity, financial weakness or any other external or internal events that could affect the client’s business.
As of December 31, 2012, 1,3572015, performing loans amounting to COP 1.5 billion were performing and were on the watch list. The amount of loans and clientsincluded on the watch list has decreasedamounted to COP 5.9 billion. The increase from COP 3.7 billion at December 31, 2014, was driven by some loans to customers in responsethe hydrocarbons sector and importers impacted by the devaluation of the peso with respect to the actions taken bydollar, that were catalogued in all levels risk at December 31, 2015.
| Watch List 2015 | | Watch List 2014 |
| Level | | Amount (COP million) | | | % | | | Allowance (COP million) | | | Level | | Amount (COP million) | | | % | | | Allowance (COP million) | |
| Level 1 - Low Risk | | | 2,680,111 | | | | 3 | % | | | 69,044 | | | Level 1 - Low Risk | | | 2,106,438 | | | | 4 | % | | | 74,166 | |
| Level 2 - Medium Risk | | | 1,320,431 | | | | 7 | % | | | 90,270 | | | Level 2 - Medium Risk | | | 664,811 | | | | 13 | % | | | 83,581 | |
| Level 3 - High Risk | | | 1,951,644 | | | | 36 | % | | | 695,291 | | | Level 3 - High Risk | | | 1,016,480 | | | | 29 | % | | | 293,903 | |
| Total | | | 5,952,186 | | | | 14 | % | | | 854,605 | | | Total | | | 3,787,729 | | | | 12 | % | | | 451,650 | |
IMPAIRED LOANS
A credit is considered an impaired loan when there is an objective evidence of impairment that has an effect on the cash flow of the loan; additionally, this category includes loans that had been restructured because of the financial difficulties of the debtor, and for that reason, the Bank must grant a concession to improve itsthe debtor, that it would not otherwise consider ("trouble debt service.restructuring loans" or TDRs). Under IFRS, all credits are accounted for on an accrual basis, although they are classified as “impaired loans”.
Level 3The following table presents the recorded investment for impaired loans:
| | | As of December 31, | |
| | | 2015 | | | 2014 | |
| | | (In millions of COP) | |
| | | Domestic | | | Foreign | | | Total | | | Domestic | | | Foreign | | | Total | |
| Commercial | | | | | | | | | | | | | | | | | | | | | | | | |
| Corporate | | | 1,468,122 | | | | 401,920 | | | | 1,870,042 | | | | 1,245,373 | | | | 185,292 | | | | 1,430,665 | |
| SME | | | 1,114,816 | | | | 128,125 | | | | 1,242,941 | | | | 997,605 | | | | 75,695 | | | | 1,073,300 | |
| Others | | | 661,481 | | | | 187,413 | | | | 848,894 | | | | 677,435 | | | | 100,199 | | | | 777,634 | |
| Total Commercial | | | 3,244,419 | | | | 717,458 | | | | 3,961,877 | | | | 2,920,413 | | | | 361,186 | | | | 3,281,599 | |
| | | | | | | | | | | | | | | | | | | | | | | | | |
| Consumer | | | | | | | | | | | | | | | | | | | | | | | | |
| Credit card | | | 554,725 | | | | 392,490 | | | | 947,215 | | | | 168,562 | | | | 206,879 | | | | 375,441 | |
| Vehicle loans | | | 201,456 | | | | 9,886 | | | | 211,342 | | | | 160,021 | | | | 67,019 | | | | 227,040 | |
| Payroll loan | | | 118,015 | | | | 24,002 | | | | 142,017 | | | | 100,626 | | | | 130,885 | | | | 231,511 | |
| Others | | | 223,080 | | | | 138,428 | | | | 361,508 | | | | 196,045 | | | | 111,766 | | | | 307,811 | |
| Total Consumer | | | 1,097,276 | | | | 564,806 | | | | 1,662,082 | | | | 625,254 | | | | 516,549 | | | | 1,141,803 | |
| | | | | | | | | | | | | | | | | | | | | | | | | |
| Residential Mortgage | | | | | | | | | | | | | | | | | | | | | | | | |
| Vis(1) | | | 136,628 | | | | 305 | | | | 136,933 | | | | 130,188 | | | | 342 | | | | 130,530 | |
| No Vis | | | 291,128 | | | | 571,248 | | | | 862,376 | | | | 239,177 | | | | 357,879 | | | | 597,056 | |
| Total residential mortgage | | | 427,756 | | | | 571,553 | | | | 999,309 | | | | 369,365 | | | | 358,221 | | | | 727,586 | |
| | | | | | | | | | | | | | | | | | | | | | | | | |
| Small Business Loans | | | 58,875 | | | | 1,365 | | | | 60,240 | | | | 52,660 | | | | 57,581 | | | | 110,241 | |
| | | | | | | | | | | | | | | | | | | | | | | | | |
| Financial leases | | | 865,412 | | | | 12,547 | | | | 877,959 | | | | 289,926 | | | | 2,629 | | | | 292,555 | |
| | | | | | | | | | | | | | | | | | | | | | | | | |
| TOTAL | | | 5,693,738 | | | | 1,867,729 | | | | 7,561,467 | | | | 4,257,618 | | | | 1,296,166 | | | | 5,553,784 | |
| (1) | VIS refers in Spanish to “Vivienda de Interés Social”, a term used to describe residential mortgages granted by financial institutions in amounts that are less than 135 legal minimum monthly salaries in Colombia ( as of December 31, 2015 COP 87). |
The following table shows the TDRs classified into foreign and domestic loans, increased as compared to 2011, mainly because in 2012 the Bank issued an internal policy - Circular 1899 - regarding to special administration of clients, which had the objective to extend the special administration to customers classifiedgross interest income that would have been recorded in the category of Construction. As a result,period ended if the number of clients increased by 16loans had been current in accordance with their original terms and by anhad been outstanding throughout the period or since origination and the amount of COP 103 million. The increase was also explained by corporate clientsinterest income on those loans that increase their level of risk, as shown below:were included in net income for the period:
| Watch List 2012 | | Watch List 2011 |
| Level | | Amount (COP million) | | | % | | | Allowance
(COP million) | | | Level | | Amount (COP million) | | | % | | | Allowance
(COP million) | |
| Level 1 - Low Risk | | | 855,940 | | | | 57 | % | | | 27,351 | | | Level 1 - Low Risk | | | 1,161,775 | | | | 68 | % | | | 45,481 | |
| Level 2 - Medium Risk | | | 166,965 | | | | 11 | % | | | 32,107 | | | Level 2 - Medium Risk | | | 225,041 | | | | 13 | % | | | 38,843 | |
| Level 3 - High Risk | | | 487,115 | | | | 32 | % | | | 264,821 | | | Level 3 - High Risk | | | 327,315 | | | | 19 | % | | | 187,855 | |
| Total | | | 1,510,020 | | | | | | | | 324,279 | | | Total | | | 1,714,131 | | | | | | | | 272,179 | |
| | | 2015 | | | 2014 | |
| | | (in millions of COP) | |
| | | Domestic | | | Foreign | | | Total | | | Domestic | | | Foreign | | | Total | |
| | | | | | | | | | | | | | | | | | | |
| Interest income recognized in net income for the period. | | | 471,226 | | | | 116,355 | | | | 587,581 | | | | 413,194 | | | | 88,851 | | | | 502,045 | |
| | | | | | | | | | | | | | | | | | | | | | | | | |
| The gross interest income that would have been recorded in the period that ended if the loans had been current in accordance with their original terms and had been outstanding throughout the period or since origination, if held for part of the period. | | | 472,862 | | | | 117,148 | | | | 590,010 | | | | 413,128 | | | | 90,106 | | | | 503,235 | |
CROSS-BORDER OUTSTANDING LOANS AND INVESTMENTS
As of December 31, 2012, 20112015 and 2010,2014, total cross-border outstanding loans and investments amounted to approximately USD 5,298 million, USD 5,44816,082 million, and USD 4,90211,878 million, respectively. As of December 31, 2012,2015, total outstanding loans to borrowers in foreign countries amounted to USD 4,20414,268 million, and total investments were USD 1,0941,814 million. As of December 31, 2012,2015, total cross-border outstanding loans and investments represented 9.57%26.25% of total assets.
The Bank had no cross-border outstanding acceptances, interest-earning deposits with other banks or any other monetary assets denominated in pesos or other non-local currencies, in which the total exceeded 1% of consolidated total assets at December 31, 2012, 20112015 and 2010.2014.
The following table presents information with respect to the Bank’s cross-border outstanding loans and investments for the years endedat December 31, 2012, 20112015 and 2010:2014
| | | As of December 31, | |
| | | 2012 | | | 2011 | | | 2010 | |
| | | (thousands of U.S. dollars) | |
| El Salvador | | USD | 3,258,295 | | | USD | 2,924,567 | | | USD | 3,006,200 | |
| Costa Rica | | | 536,082 | | | | 266,921 | | | | 225,344 | |
| Panama | | | 361,121 | | | | 361,765 | | | | 407,418 | |
| Spain | | | 296,277 | | | | 18,552 | | | | 885 | |
| Peru | | | 231,971 | | | | 257,255 | | | | 130,774 | |
| Brazil | | | 164,372 | | | | 128,009 | | | | 128,228 | |
| Chile | | | 97,852 | | | | 85,469 | | | | 107,215 | |
| Guatemala | | | 78,272 | | | | 822,868 | | | | 581,671 | |
| United States | | | 75,757 | | | | 140,511 | | | | 90,828 | |
| Mexico | | | 43,853 | | | | 100,613 | | | | 69,957 | |
| British Virgin Island | | | 37,000 | | | | - | | | | 4,700 | |
| Venezuela | | | 34,260 | | | | 32,731 | | | | 30,453 | |
| Canada | | | 30,611 | | | | 57,429 | | | | 23 | |
| Honduras | | | 15,565 | | | | 51,406 | | | | 76,635 | |
| Nicaragua | | | 5,801 | | | | 6,652 | | | | 6,916 | |
| United Kingdom | | | 6,416 | | | | 163,777 | | | | 435 | |
| Dominican Republic | | | 5,242 | | | | 7,755 | | | | 5,080 | |
| Bahamas | | | 4,448 | | | | 7,490 | | | | 9,316 | |
| Guyana | | | 3,700 | | | | 4,900 | | | | 5,000 | |
| Ecuador | | | 2,991 | | | | 1,837 | | | | 6,017 | |
| Saint Vincent and the Grenadines | | | 2,760 | | | | 13 | | | | - | |
| Russia | | | 2,432 | | | | - | | | | - | |
| Fiji Islands | | | 383 | | | | 163 | | | | - | |
| Puerto Rico | | | 365 | | | | 306 | | | | 318 | |
| Finland | | | 352 | | | | - | | | | - | |
| Romania | | | 254 | | | | - | | | | - | |
| Cayman Islands | | | 218 | | | | 6,511 | | | | 7,800 | |
| Others | | | 1,126 | | | | 651 | | | | 1,217 | |
| Total Cross-Border Outstanding Loans and Investment | | USD | 5,297,776 | | | USD | 5,448,151 | | | USD | 4,902,430 | |
| | | As of December 31, | |
| | | 2015 | | | 2014 | |
| | | (thousands of U.S. dollars) | |
| Governments and official institutions | | | | | | | | |
| Guatemala | | USD | 529,834 | | | USD | 40,000 | |
| Panama | | | 373,540 | | | | 447,939 | |
| El Salvador | | | 233,096 | | | | 86,811 | |
| United States | | | 166,284 | | | | 84,943 | |
| Mexico | | | 152,186 | | | | 187,680 | |
| Costa Rica | | | 39,117 | | | | 32,598 | |
| Brazil | | | 11,023 | | | | 23,947 | |
| Chile | | | - | | | | 3,861 | |
| | | | | | | | | |
| Banks and other financial institutions | | | | | | | | |
| Panama | | USD | 216,788 | | | USD | 172,248 | |
| El Salvador | | | 43,766 | | | | 41,555 | |
| Venezuela | | | 30,164 | | | | 27,179 | |
| Costa Rica | | | 30,119 | | | | 26,653 | |
| Guatemala | | | 26,786 | | | | 2,620 | |
| Chile | | | 14,951 | | | | 15,478 | |
| Peru | | | 13,281 | | | | 17,227 | |
| United States | | | 10,002 | | | | - | |
| Brazil | | | 7,705 | | | | 27,537 | |
| Mexico | | | 3,041 | | | | 6,043 | |
| Honduras | | | 751 | | | | - | |
| | | As of December 31, | |
| | | 2015 | | | 2014 | |
| | | (thousands of U.S. dollars) | |
| | | | |
| Commercial and industrial loans | | | | | | | | |
| Panama | | USD | 6,208,185 | | | USD | 5,518,750 | |
| Guatemala | | | 2,941,396 | | | | 353,280 | |
| El Salvador | | | 563,534 | | | | 1,154,395 | |
| Peru | | | 420,341 | | | | 490,910 | |
| United States | | | 260,041 | | | | 266,004 | |
| Costa Rica | | | 249,819 | | | | 223,115 | |
| Puerto Rico | | | 100,474 | | | | 101,012 | |
| Dominican Republic | | | 100,035 | | | | 5,008 | |
| Honduras | | | 87,036 | | | | 11,283 | |
| Ecuador | | | 56,545 | | | | 4,039 | |
| Chile | | | 41,192 | | | | 30,314 | |
| American Virgin Islands | | | 27,835 | | | | 46,186 | |
| British Virgin Islands | | | 15,234 | | | | 32,523 | |
| Brazil | | | 13,002 | | | | 13,063 | |
| Uruguay | | | 10,768 | | | | 69,512 | |
| Nicaragua | | | 8,917 | | | | 12,869 | |
| Guyana | | | 4,906 | | | | 22,342 | |
| Barbados | | | 4,021 | | | | 4,867 | |
| Mexico | | | 3,636 | | | | 10,403 | |
| Marshall Islands | | | - | | | | 45,109 | |
| Belgium and Luxembourg | | | - | | | | 40,297 | |
| New Zealand | | | - | | | | 12,000 | |
| Republic of China | | | - | | | | 9,952 | |
| Bahamas | | | - | | | | 7,759 | |
| Others | | | 1,243 | | | | 6,765 | |
| | | | | | | | | |
| Other loans | | | | | | | | |
| El Salvador | | USD | 2,471,002 | | | USD | 1,648,990 | |
| Panama | | | 249,688 | | | | 142,411 | |
| Guatemala | | | 115,215 | | | | 70,746 | |
| Costa Rica | | | 79,351 | | | | 95,251 | |
| Peru | | | 44,947 | | | | 35,298 | |
| United States | | | 32,617 | | | | 61,784 | |
| Nicaragua | | | 18,523 | | | | 18,713 | |
| Spain | | | 14,249 | | | | 19,219 | |
| Brazil | | | 8,333 | | | | 8,443 | |
| England | | | 5,501 | | | | 7,181 | |
| Chile | | | 5,468 | | | | 5,496 | |
| Belgium and Luxembourg | | | 3,203 | | | | 3,896 | |
| Canada | | | 2,989 | | | | 3,678 | |
| Venezuela | | | 2,429 | | | | 2,602 | |
| Mexico | | | 1,770 | | | | 10,851 | |
| Ecuador | | | 1,218 | | | | - | |
| Australia | | | 1,010 | | | | 1,634 | |
| France | | | - | | | | 1,256 | |
| Others | | | 3,811 | | | | 4,446 | |
| | | | | | | | | |
| Total Cross-Border Outstanding Loans and Investments | | USD | 16,081,918 | | | USD | 11,877,971 | |
E.5. DEPOSITS
The following table shows the composition of the Bank’s deposits for 2012, 20112015 and 2010:2014:
| | | As of December 31, | | | As of December 31, | |
| | | 2012 | | | 2011 | | | 2010 | | | 2015 | | | 2014 | |
| | | (COP million) | | | (in millions of COP) | |
| Non-interest bearing deposits: | | | | | | | | | | | | | |
| Checking accounts | | COP | 8,820,458 | | | COP | 7,909,743 | | | COP | 6,980,322 | | |
| Non-interest bearing deposits | | | | | | | | | |
| Checking deposits | | | | 16,823,024 | | | | 14,598,804 | |
| Other deposits | | | 978,416 | | | | 904,430 | | | | 651,894 | | | | 1,627,981 | | | | 1,387,199 | |
| Total | | | 9,798,874 | | | | 8,814,173 | | | | 7,632,216 | | | | 18,451,005 | | | | 15,986,003 | |
| | | | | | | | | | | | | | | | | | | | | |
| Interest bearing deposits: | | | | | | | | | | | | | |
| Checking accounts | | | 2,478,443 | | | | 2,384,151 | | | | 2,575,611 | | |
| Interest bearing deposits | | | | | | | | | |
| Checking deposits | | | | 6,823,554 | | | | 3,548,221 | |
| Time deposits | | | 24,767,489 | | | | 17,973,117 | | | | 15,270,271 | | | | 48,713,789 | | | | 36,105,096 | |
| Savings deposits | | | 27,113,914 | | | | 23,263,051 | | | | 18,060,869 | | | | 47,813,680 | | | | 39,129,999 | |
| Total | | | 54,359,846 | | | | 43,620,319 | | | | 35,906,751 | | | | 103,351,023 | | | | 78,783,316 | |
| | | | | | | | | | |
| Total deposits | | COP | 64,158,720 | | | COP | 52,434,492 | | | COP | 43,538,967 | | | | 121,802,028 | | | | 94,769,319 | |
The following table shows the time deposits held by the Bank as of December 31, 2012,2015 and 2011,2014, respectively, classified by amount and maturity for deposits:maturity:
| | | At December 31, 2012 | | | At December 31, 2015 | |
| | | Peso-Denominated | | | Foreign Exchange
Denominated | | | Total | | | Peso - Denominated | | | Foreign Exchange-
Denominated | | | Total | |
| | | (COP million) | | | (in millions of COP) | |
| Time deposits higher than USD 100,000(1) | | | | | | | | | | | | | | | | | | | | | | | | |
| Up to 3 months | | COP | 3,262,557 | | | COP | 2,475,895 | | | COP | 5,738,452 | | | | 4,125,232 | | | | 7,868,823 | | | | 11,994,055 | |
| From 3 to 6 months | | | 2,162,634 | | | | 1,253,157 | | | | 3,415,791 | | | | 2,325,895 | | | | 3,407,023 | | | | 5,732,918 | |
| From 6 to 12 months | | | 2,136,468 | | | | 936,813 | | | | 3,073,281 | | | | 2,877,583 | | | | 4,960,526 | | | | 7,838,109 | |
| More than 12 months | | | 7,245,194 | | | | 403,328 | | | | 7,648,522 | | | | 8,791,734 | | | | 5,031,722 | | | | 13,823,456 | |
| Time deposits less than USD 100,000(1) | | | 3,714,192 | | | | 1,177,251 | | | | 4,891,443 | | | | 6,031,680 | | | | 3,293,571 | | | | 9,325,251 | |
| Total | | COP | 18,521,045 | | | COP | 6,246,444 | | | COP | 24,767,489 | | | | 24,152,124 | | | | 24,561,665 | | | | 48,713,789 | |
| | | At December 31, 2011 | |
| | | Peso-Denominated | | | Foreign Exchange
Denominated | | | Total | |
| | | (COP million) | |
| Time deposits higher than USD 100,000(2) | | | | | | | | | | | | |
| Up to 3 months | | COP | 2,851,607 | | | COP | 1,887,448 | | | COP | 4,739,055 | |
| From 3 to 6 months | | | 1,581,059 | | | | 939,896 | | | | 2,520,955 | |
| From 6 to 12 months | | | 1,542,396 | | | | 854,068 | | | | 2,396,464 | |
| More than 12 months | | | 3,176,867 | | | | 689,282 | | | | 3,866,149 | |
| Time deposits less than USD 100,000(2) | | | 3,155,083 | | | | 1,295,411 | | | | 4,450,494 | |
| Total | | COP | 12,307,012 | | | COP | 5,666,105 | | | COP | 17,973,117 | |
(1)Approximately COP 315 million at the Representative Market Rate as of December 31, 2015
| (1) | Approximately COP 177 million at the Representative Market Rate as of December 31, 2012. |
| (2) | Approximately COP 194 million at the Representative Market Rate as of December 31, 2011. |
As of December 31, 2012,2015, Tuya S.A. Compañía de Financiamiento was considered as assets held for sale, and the related deposits amounted to COP 1,266,305. For further information see Note 31 to the Consolidated Financial Statements.
| | | At December 31, 2014 | |
| | | Peso -
Denominated | | | Foreign Exchange-
Denominated | | | Total | |
| | | (in millions of COP) | |
| Time deposits higher than USD 100,000(1) | | | | | | | | | | | | |
| Up to 3 months | | | 5,203,412 | | | | 5,688,643 | | | | 10,892,055 | |
| From 3 to 6 months | | | 2,058,180 | | | | 1,716,627 | | | | 3,774,807 | |
| From 6 to 12 months | | | 2,424,899 | | | | 3,210,680 | | | | 5,635,579 | |
| More than 12 months | | | 5,834,129 | | | | 3,144,653 | | | | 8,978,782 | |
| Time deposits less than USD 100,000(1) | | | 4,805,488 | | | | 2,018,385 | | | | 6,823,873 | |
| Total | | | 20,326,108 | | | | 15,778,988 | | | | 36,105,096 | |
(1)Approximately COP 239 million at the Representative Market Rate as of December 31, 2014.
As of December 31, 2015, the time deposits greater than USD 100,000 collected by foreign subsidiaries amounted to COP 5,303,14321,009,232 million.
For a description of the average amount and the average rate paid for deposits, see “Item 4. Information on the Company – E. Selected Statistical Information – E.1. Distribution of Assets, Liabilities and Stockholders’ Equity; Interest Rates and Interest Differential”.
E.6. RETURN ON EQUITY AND ASSETS
| E.6. | RETURN ON EQUITY AND ASSETS |
The following table presents certain selected financial ratios of the Bank for the periods indicated:
| | | Year
ended December 31, | | | Year
Ended December 31, | |
| | | 2012 | | | 2011 | | | 2010 | | | 2015 | | | 2014 | |
| | | (in percentages) | | | (in percentages) | |
| Net income as a percentage of: | | | | | | | | | | | | | | | | | | | | |
| Average total assets | | | 1.92 | | | | 2.20 | | | | 2.27 | | | | 1.58 | | | | 1.79 | |
| Average stockholders’ equity | | | 15.97 | | | | 20.22 | | | | 19.71 | | | | 13.84 | | | | 16.19 | |
| Dividends declared per share as a percentage of consolidated net income per share(1) | | | 37.46 | | | | 33.52 | | | | 36.68 | | | | 32.46 | | | | 32.03 | |
| Average stockholders’ equity as a percentage of average total assets | | | 12.02 | | | | 10.86 | | | | 11.50 | | | | 11.44 | | | | 11.08 | |
| Return on interest-earning assets(2) | | | 10.44 | | | | 9.39 | | | | 9.34 | | | | 8.41 | | | | 8.52 | |
| (1) | Dividends are paid based on unconsolidated earnings.earnings prepared under Colombia Banking GAAP. Net income per share is calculated using the average number of common and preferred shares outstanding during the year. |
| (2) | Defined as total interest earned divided by average interest-earning assets. |
E.7. INTERBANK BORROWINGS
| E.7. | SHORT-TERM BORROWINGS |
The following table sets forth certain information regarding the foreign interbankshort-term borrowings by the Bank for the periods indicated:
| | | | As of December 31, | |
| | | As of December 31, | | | 2015 | | | 2014 | |
| | | 2012 | | | 2011 | | | 2010 | | | Amount | | | Rate(3) | | | Amount | | | Rate(3) | |
| | | Amount | | | Rate(3) | | | Amount | | | Rate(3) | | | Amount | | | Rate(3) | | | (COP million, except percentages) | |
| | | (COP million, except percentages) | | | | | | | | | | | | | | | | | |
| End of period | | | 1,803,665 | | | | 2.78 | % | | | 4,130,915 | | | | 1.11 | % | | | 2,698,941 | | | | 0.72 | % | | | 11,129,652 | (1) | | | 1.68 | %(3) | | | 7,466,814 | | | | 2.39 | % |
| Weighted average during period | | | 2,488,285 | | | | 2.02 | % | | | 2,949,935 | | | | 1.55 | % | | | 1,449,197 | | | | 1.30 | % | | | 8,527,033 | | | | 2.20 | % | | | 6,495,626 | | | | 2.75 | % |
| Maximum amount of borrowing at any month-end | | | 3,693,395 | (1) | | | | | | | 4,130,915 | (2) | | | | | | | 2,698,941 | (2) | | | | | | | 11,129,652 | (2) | | | | | | | 7,466,814 | (2) | | | | |
| Interest paid during the year | | | 50,209 | | | | | | | | 45,840 | | | | | | | | 19,537 | | | | | | | | 187,185 | | | | | | | | 178,675 | | | | | |
(1) January
(2) December
(3) Corresponds to the ratio of interest paid to foreign interbank borrowings.
| (1) | As of December 31, 2015, Grupo Agromercantil has short-term borrowing amounting to COP 755,384 |
| (3) | Corresponds to the ratio of interest paid during the period to short-term borrowings |
ITEM 4 A. UNRESOLVED STAFF COMMENTS
| ITEM 4 A. | UNRESOLVED STAFF COMMENTS |
As of the date of the filing of this Annual Report, the Bank hasthere are no unresolved written comments from the Securities and Exchange Commission (the “SEC”)SEC staff regarding the Bank’s periodic reports required to be filed under the Exchange Act of 1934.
| ITEM 5. | OPERATING AND FINANCIAL REVIEW AND PROSPECTS |
The following discussion should be read in conjunction with Bancolombia’s audited consolidated financial statementsConsolidated Financial Statements for the years ended December 31, 2012, 20112015 and 2010.
Bancolombia’s audited consolidated financial statements are prepared following2014. For further information regarding the accounting practices and the special regulationsadoption of the SFC, or, in the absence of such regulations, Colombian banking GAAP. Together, these requirements differ in certain significant respects from U.S. GAAP.IFRS, please refer to Note 31 to the Bank’s audited consolidated financial statements included in this Annual Report provides a description of the significant differences between Colombian banking GAAP and U.S. GAAP as they relate to the Bank’s audited consolidated financial statements and provides a reconciliation of net income and stockholders’ equity for the years and dates indicated herein.30.
IMPACT OF ECONOMIC AND MONETARY POLICIES ON BANCOLOMBIA’S RESULTS
Bancolombia’s operations are affected by external factors such as economic activity in Colombia, interest rates, inflation and exchange rates. The following discussion summarizes the trends of such variables.
Economic activity
Although Colombia’s GDP growth was 4.0%3.1% in 2012, significantly2015, lower than the 6.6% growth4.6% reached in 2011 (the 2011 GDP reported in 2011 was 5.9%, and it was revised to 6.6% in 2012). This2014, this figure nonetheless indicates a moderation in therelatively strong pace of growth in the Colombian economy, considering the negative output for most of the economy, although household consumption and investment remain solid and are drivingcountries in the economic expansion.region.
Key GDP components performed as follows in 20122015 compared to 2011:2014: investment grew 2.6%, consumption increased 4.4% investment grew 5.7%3.9%, imports increased 3.9% and exports increased 5.3%decreased 0.7%.
In 2012,2015, gross capital formation represented 27.7%29.6% of GDP, household consumption represented 65.4%65.0%, government consumption 16.3%17.2%, exports 17.3%15.7% and imports 27%28.8%.
The activities that led growth during the year were mining (5.9% increase), financial services (5.5% increase), non-financial services (4.9%(4.3% increase) and trade and tourism (4.1%construction (3.9% increase).
Interest Rates
In the first two meetingsAs of the year, in January and February 2012, the Central Bank increased its benchmarkDecember 31, 2015, following continuous rate 25 basis points in each meeting to 5.25% motivated by inflation and increased consumer lending activity. Then, in July, the Central Bank began a process of rate cuts that caused the rate to end the year at 4.25%. The reasons for the rate cuts inhikes during the second half of 2012 were the moderation of economic growthyear, the Central Bank left rates at 5.75% in an attempt to subdue inflation in a challenging macroeconomic context. The Central Bank increased rates by 125 basis points in 2015, starting in September with a 25p raise, and credit expansion, as well as a declinesubsequent hikes in the inflation.October (50 basis points), November and December.
The Central Bank expects to maintain inflation rates over time within the long-term targeted range (between 2% and 4%) while permittingallowing the economy to grow close to GDP estimates. In order to do so, the Central Bank may change the interest raterates to promote economic activity, credit expansion and consumption.consumption or curb inflation expectations.
Inflation
Year-endThe year-end inflation rate for 20122015 was 2.44%6.77%, lowerhigher than the 3.73%3.66% recorded for 2011.2014.
The components that led inflation in 20122015 were education (4.6%food (10.9% increase), housing (5.4% increase) and health care (4.3% increase) and housing (3%(5.3% increase).
The 12-month core inflation rate for 20122015 came to 2.4%at 5.43%, thereby remaining withinwhich exceeded the Central Bank’s targeted inflation range of 2% to 4%. The price increase in regulated goods and services, suchincreases are mainly due to El Niño Phenomenon as utilities, urban transportation and gasoline was 1.91%.well as a pass-through effect of nominal depreciation of the currency.
Exchange rate
The Colombian Peso appreciated 9%depreciated 32% versus the U.S. dollar during 2012, and it has appreciated 21% since 2000.
2015, compared to a depreciation of 24% during 2014.
Foreign Direct Investment flows into Colombia have been one of the main drivers of the appreciation of the Colombian peso against the U.S. dollar during the last eleven years. In 2012, FDI totaled USD 16,684 million, of which 80% was related to oil, gas and mining. Abundance of U.S. dollars in the U.S. economy was also a factor that contributed to the appreciation as international investors were seeking investments in currencies that were not likely to lose value versus the U.S. dollar and that could offer better returns than dollar denominated securities.
The strengtheningweakening of the Colombian Peso mainly affected Colombian companies that focusis explained by the drop in oil prices, which initially has a negative impact on exportingthe economy, until the necessary adjustments are made, including export diversification, import substitution, and that lost competitiveness given that a large portion of their expenses was denominated in Colombian Pesos.other structural economic changes.
Outlook
Future prospects for the Colombian financial sector in general, and for Bancolombia in particular, are expected to depend on the factors listed below:
| Favorable factors for the Colombian economy – mid-term | | Unfavorable factors for the Colombian economy – mid-term |
| | | |
Benefits derived from past monetary policies aimed at achieving sustainable growth. | | Underdeveloped infrastructure that translates into a constraint for growth. |
| | |
PositiveDeclining inflationary outlook. | | Commodity dependent export activity. |
| | |
| pressures with the end of El Niño. Investment grade rating given to Colombia by Standard and Poor’s, Moody’s and Fitch. Large investments in 2011, should continue4G projects and infrastructure in general. Stronger local capital markets, with little exposure to strengthen investor confidence.“toxic assets” and with low currency mismatches. A well-capitalized banking system. Well-developed supervision and regulation of the financial system. Adequate international reserves to short-term debt. | | Underdeveloped infrastructure that translates into a constraint for growth. Oil and gas dependent export activity. Despite successful efforts to diversify export markets, there is still concentration in specific export destinations, particularly the United States. |
| | |
The approval by Congress of the Fiscal Rule, which will further contribute to the country’s fiscal sustainability. | | Exchange rate uncertaintiesvolatility and depreciation that could expose the economy to highly volatile markets or builddirectly impacts inflation pressures. |
| | |
Stronger local capital markets, with little exposure to “toxic assets” and with low currency mismatches. | | Riskeconomic growth.Large current account deficit and fiscal pressures. Introduction of new tax reform due to fiscal measures. |
| | |
A well-capitalized banking system. | | Possible escalationburden.High tax environment for Colombian corporate compared to other countries in activities of guerillathe region. Uncertainties regarding the peace process and drug cartels that may hurt investor confidence. |
| | |
Well-developed supervisionColombia’s future post-conflict.Higher unemployment and regulation of the financial system. | | |
| | |
Adequate international reserves to short term debt. | | |
| | |
Limited exposure of corporations to speculation through derivatives. | | household indebtedness. |
| A.1. | GENERAL DISCUSSION OF THE CHANGES IN RESULTS FOR 2015 VERSUS 2014 |
GENERAL DISCUSSION OF THE CHANGES IN RESULTS FOR 2012 VERSUS 2011
Summary
During 2012,2015, Bancolombia strengthened its competitive position and full-service financial model, and benefited from the diversity of its leading franchises. For the year 2012,2015, net income attributable to equity holders of the Parent Company totaled COP 1,7022,519 billion (COP 2,0132,736 per share, – USD 4.553.48 per ADR), which represents an increase of 2%6% as compared to COP 1,6642,387 billion of net income for the fiscal year 2011, and an increase of 18% as compared to COP 1,436 billion of net income for the fiscal year 2010.2014.
Bancolombia’s return on average stockholders’ equity for 20122015 was 15.97%13.62%, down from 20.22%14.81% in 2011 and 19.71% in 2010.2014.
The net interest margin increaseddecreased slightly in 20122015 and reached 6.49%was 5.25% for the year, updown from 6.17%5.30% in 2011 and 6.38% in 2010.2014.
Provision charges, net of recoveries, totaled COP 1,1111,675 billion for 2012,2015, up 86%92.72% from COP 599 billion in 2011 and up 103% from COP 548 billion in 2010.869 billion. The higher amount of provisions was the result of generalized loan deterioration,impairment, especially induring the first monthssecond half of the year. The majority of the new past due loans are related to the commercial and consumer clientsloans and are responsible for most of the provision charges for the year.
LoansGross loans and financial leases grew 14%26% during the year. This performance was driven primarily by credit and mortgage demandsdemand from individuals and financial leases from corporations.corporate loans as well as by the consolidation of GAH, which contributed 7.8% of this growth.
Reserves for loan losses and accrued interest represented 4.7%3.4% of total loans and 177%115% of past-due loans at the end of 20122015 compared with 4.6%3.8% of total loans and 210%146% of past-due loans at December 31, 2011.2014. Capital adequacy was 15.8% (Tier 1 ratio of 10.4%), a significant increase from the 12.5% (Tier 1 ratio of 9.0%7.51%), lower than the 13.3% (Tier 1 ratio of 7.71%) reported at the end of 2011.2014.
Deposits by customers increased 22%29% during 2012,2015, while the ratio of net loans to deposits (including borrowings from development banks) was 99%110% at the end of the year, down from 105% at111% in December 31, 2011.
REVENUE PERFORMANCE2014.
Net Interest IncomeMargin and Valuation on Financial Instruments
For the year 2012,2015, net interest income totaled COP 4,7677,232 billion, up 22%20.4% as compared to COP 3,9046,008 billion in 2011 and up 41% as compared to COP 3,389 billion in 2010.2014. This performance is explained by the combined effect of a slight increase in interest margins and thesteady growth in the loan portfolio during the year.year as well as stable interest margins. During 2012,2015, the Central Bank decreasedincreased its reference rate from 4.75%4.50% to 4.25% which increased5.75% in response to higher inflation, decreasing money supply and expanded the availability of credita substantial reduction in liquidity in the economy. The reasons for these cuts inAlthough interest rates on the reference rate were the slower pace of growth in the economy and the reduction of inflation. Although rates declinedBank’s borrowings increased during 2012,2015, the Bank was able to manage thecontrol its funding costs, and interest charged on loans, in a manner that expanded spreads. Netprotected spreads, in spite of the tougher macroeconomic conditions as well as the continuation of the integration and deployment of strategies in Banistmo (acquired in 2013). The net interest margin was 6.49%5.25% for the year, updown from 6.17%5.30% in 2011.2014. Net interest income represented 64%67% of nettotal revenues in 2012,2015, compared to 62%66% for 2011 and 62% for 2010.
Interest income, which is the sum of interest on loans, financial leases, overnight funds and income from investment securities, totaled COP 7,662 billion in 2012, up 29% as compared to COP 5,946 billion in 2011 and up 54% as compared to COP 4,960 billion in 2010.2014.
Interest on loans and financial leases reflected an increase in the loan portfolio in 2012.2015. The weighted average nominal interest rate on loans and financial leases increased to 11%ended at 9.0% in 20122015 down from 10%9.1% in 2011 and 10.3% in 2010.2014. As a result, interest income, which is the sum of interest on loans, and financial leases, overnight funds and interest and valuation income from investment securities, totaled COP 6,87811,270 billion (90% of interest income) and increased 30%in 2015, up 23% as compared to COP 5,3019,172 billion (89% of interest income) in 2011 and increased 54% as compared to COP 4,464 billion (90% of interest income) in 2010.2014.
Interest on investment securities, which includes, among other items, the interest paid or accrued on debt securities and mark-to-market valuation adjustments, totaled COP 760302 billion in 2012, up 21%2015, down 47% as compared to 20112014.
The net interest margin contracted 5 basis points from 5.30% to 5.25% during the year due to increased funding costs and 67% as comparedliquidity pressures during the second half of the year. Bancolombia was very active in the deposits markets to 2010.secure the necessary funding. Interest rates began to rise in the second half of the year, which at first constrains financial margins, however, in the near term management expects margins to expand due to the asset re-pricing that is already taking place. Management’s outlook going forward is positive and the higher rate environment provides an upside for the net interest margin.
Regarding interest expenses, interest incurred on liabilities totaled COP 2,8954,038 billion in 2012,2015, up 42%28% as compared to COP 2,0423,165 billion in 2011, and up 84% as compared to COP 1,572 billion in 2010.2014. The increase in interest expenses is explained by higher interest rates incurred on deposits and the increase in volumes of deposits and bonds.bonds, as well as a higher cost on each type of funding source. Overall, the average interest rate paid on interest-bearing liabilities increased to 4.4%2.92% in 20122015 from 3.7%2.85% in 2011 and from 3.4% in 2010.2014.
Net Fees and Income from Financial Services
For the year 2012,2015, net fees and income from services totaled COP 1,8071,993 billion, up 8%9% as compared to COP 1,6691,826 billion in 2011 and up 14% as compared to COP 1,581 billion in 2010.2014. This increase was driven primarily by increases in the performance of commission from banking services, credit and debit card annualcards fees, banking services and collectioncollections and payments fees.
Bancolombia distribution channels performed an increasing number of transactions in 2012. In particular, our banking operation in Colombia performed about 1.38 billion transactions during 2012, which represents an increase of 18% as compared to the 1.17 billion transactions of 2011. The Bank achieved these higher transaction levels, despite fee increasesfees, bancassurance, and the elimination of fee exemptions for certain payment instruments for some segments (such as debit cards and credit cards).trust activities.
The following table lists the main revenue-producing fees for the years 2012, 20112015 and 20102014 along with their growth figures between 2012 and 2011 and 2011 and 2010:the corresponding year-to-year variations:
| | | Year | | | Growth | | | Growth | |
| | | 2012 | | | 2011 | | | 2010 | | | 2012/2011 | | | 2011/2010 | |
| | | (COP million) | | | | | | | |
| Main fees and commissions | | | | | | | | | | | | | | | | | | | | |
| Commissions from banking services | | | 449,452 | | | | 383,984 | | | | 307,890 | | | | 17.05 | % | | | 24.71 | % |
| Electronic services and ATM fees | | | 73,887 | | | | 67,267 | | | | 57,019 | | | | 9.84 | % | | | 17.97 | % |
| Branch network services | | | 126,356 | | | | 125,835 | | | | 118,647 | | | | 0.41 | % | | | 6.06 | % |
| Collections and payments fees | | | 256,503 | | | | 224,878 | | | | 226,537 | | | | 14.06 | % | | | (0.73 | %) |
| Credit card merchant fees | | | 9,684 | | | | 16,725 | | | | 18,355 | | | | (42.10 | %) | | | (8.88 | %) |
| Credit and debit card annual fees | | | 654,900 | | | | 617,526 | | | | 564,457 | | | | 6.05 | % | | | 9.40 | % |
| Checking fees | | | 72,636 | | | | 74,514 | | | | 69,425 | | | | (2.52 | %) | | | 7.33 | % |
| Trust activities | | | 208,583 | | | | 188,340 | | | | 165,075 | | | | 10.75 | % | | | 14.09 | % |
| Pension plan management | | | - | | | | - | | | | 90,131 | | | | 0.00 | % | | | (100.00 | %) |
| Brokerage fees | | | 63,631 | | | | 65,943 | | | | 36,779 | | | | (3.51 | %) | | | 79.30 | % |
| Check remittance | | | 22,120 | | | | 19,626 | | | | 17,693 | | | | 12.71 | % | | | 10.93 | % |
| International operations | | | 71,932 | | | | 71,293 | | | | 58,559 | | | | 0.90 | % | | | 21.75 | % |
| Fees and other service expenses | | | (202,644 | ) | | | (187,347 | ) | | | (149,653 | ) | | | 8.17 | % | | | 25.19 | % |
| Total fees and income from services, net | | | 1,807,040 | | | | 1,668,584 | | | | 1,580,914 | | | | 8.30 | % | | | 5.61 | % |
| | | Year | | | Growth | |
| | | 2015 | | | 2014 | | | 2015-2014 | |
| | | (in millions of COP) | |
| Main Fees and Commissions Income and Expense | | | | | | | | | | | | |
| Banking services | | | 630,616 | | | | 653,513 | | | | -3.50 | % |
| Credit and debit card fees | | | 524,646 | | | | 420,707 | | | | 24.71 | % |
| Electronic services and ATM fees | | | 490,607 | | | | 380,696 | | | | 28.87 | % |
| Trust | | | 265,215 | | | | 203,608 | | | | 30.26 | % |
| Bancassurance | | | 260,224 | | | | 212,223 | | | | 22.62 | % |
| Payments and Collections | | | 203,772 | | | | 182,669 | | | | 11.55 | % |
| Checks | | | 55,861 | | | | 60,998 | | | | -8.42 | % |
| Acceptances, Guarantees and Standby letters of credits | | | 44,539 | | | | 51,923 | | | | -14.22 | % |
| Brokerage | | | 23,453 | | | | 23,784 | | | | -1.39 | % |
| Others | | | 291,624 | | | | 305,296 | | | | -4.48 | % |
| Fees and other service income | | | 2,790,557 | | | | 2,495,417 | | | | 11.83 | % |
| | | | | | | | | | | | | |
| Discontinued operations Compañía de Financiamiento Tuya S.A. (Note 31) | | | 388,306 | | | | 341,601 | | | | 13.67 | % |
| | | Year | | | Growth | |
| | | 2015 | | | 2014 | | | 2015-2014 | |
| | | (COP million) | | | | |
| | | | | | | | | | | | | |
| Banking services | | | (298,415 | ) | | | (245,581 | ) | | | 21.51 | % |
| Call Center and Website | | | (254,769 | ) | | | (230,501 | ) | | | 10.53 | % |
| Credit and debit card fees | | | (85,798 | ) | | | (95,172 | ) | | | -9.85 | % |
| Others | | | (158,531 | ) | | | (98,453 | ) | | | 61.02 | % |
| Fees and other service expenses | | | (797,513 | ) | | | (669,707 | ) | | | 19.08 | % |
| Total fees and income from services, net | | | 1,993,044 | | | | 1,825,710 | | | | 9.17 | % |
| | | | | | | | | | | | | |
| Discontinued operations Compañía de Financiamiento Tuya S.A. (Note 31) | | | (152,500 | ) | | | (69,397 | ) | | | 119.75 | % |
Other Operating Income
For 2012,2015, total other operating income was COP 8331,373 billion, 21% higher than the COP 6911,137 billion reported in 2011, and 56% higher than the COP 535 billion obtained in 2010.2014.
Revenue from communication, postage, rent and othersNet foreign exchange had a significant impact in the other operating income line of COP 350-158 billion in 2012, 56% higher2015, 148% lower than the COP 225332 billion reported in 2011, and 98% higher than the COP 177 billion obtained in 2010.
In addition, the sale of Bancolombia’s stake in Asesuisa and Asesuisa Vida positively affected other operating income in the year. As part of this transaction, the Bank recorded gains on sales of equities of COP 81 billion for 2012.
2014. The Bank recorded no insurance income in 2012 because32% depreciation of the sale ofColombian Peso against the insurance units (AsesuisaU.S. Dollar during 2015 caused the foreign exchange gains and Asesuisa Vida) in El Salvador during 2011, when these activities contributed COP 18,039 million in income.
Foreign exchange net gains decreased 7% to COP 104 billion in 2012, from COP 112 billion in 2011 and increased 67% from COP 62 billion in 2010. Gains on forward contracts in foreign currency increased 436% to COP 59 billion in 2012, from COP 11 billion in 2011 and 48% from COP 40 billion in 2010.have significant variations.
Operating expenses
For 2012,2015, operating expenses totaled COP 4,1625,898 billion, up 15% as compared to COP 3,6065,119 billion in 2011 and 34% up as compared to COP 3,098 billion in 2010.2014.
Personnel expenses (the sum of salaries and employee benefits, bonus plan payments and indemnitiesindemnities) totaled COP 1,6382,255 billion in 2012,2015, up 14% as compared to 2011.2014. This performance was primarily driven by the combined effect of increaseda slight increase in headcount, and wage increments during 2012. Salaries in 2012 were raised in line with the 2011 inflation rate of 3.73%.2015, and bonus payments.
Administrative and other expenses totaled COP 2,0402,238 billion in 2012,2015, up 15% as compared to 2011 and up 40% as compared to 2010,2014 driven by increased taxes differentother than income taxtax. Depreciation and expenses incurred in connection with software development and IT upgrades.
Depreciationamortization expenses totaled COP 320477 billion in 2012,2015, increasing 43%by 4% as compared to COP 223460 billion in 2011 and 63% as compared to COP 196 billion in 2010.2014. This increase was driven by the growth in the operating lease business of Bancolombia.
As of December 31, 2015, outstanding goodwill totaled COP 7,092 billion, which represents a 55% increase from COP 4,586 billion at the end of 2014. Goodwill relates primarily to the acquisition of GAH in 2015 Banistmo in 2013 and Banagrícola in May 2007. These transactions originated goodwill denominated in U.S. dollars. The depreciation of the peso against the U.S. dollar results in higher recorded goodwill in pesos.
The following table summarizes the principal components of Bancolombia’s operating expenses for the last threetwo fiscal years:
| | | Year ended December 31, | |
| | | 2012 | | | 2011 | | | 2010 | |
| | | (COP million) | |
| Operating expenses | | | | | | | | | | | | |
| Salaries and employee benefits | | | 1,394,027 | | | | 1,275,351 | | | | 1,139,947 | |
| Bonus plan payments | | | 204,201 | | | | 137,160 | | | | 126,839 | |
| Indemnities benefits | | | 39,452 | | | | 29,347 | | | | 27,551 | |
| Administrative and other expenses | | | 2,040,223 | | | | 1,780,459 | | | | 1,455,025 | |
| Insurance on deposits, net | | | 105,675 | | | | 90,769 | | | | 84,399 | |
| Donation expenses | | | 13,512 | | | | 19,020 | | | | 13,008 | |
| Depreciation | | | 319,602 | | | | 223,003 | | | | 195,744 | |
| Goodwill amortization | | | 45,690 | | | | 51,239 | | | | 55,966 | |
| Total operating expenses | | | 4,162,382 | | | | 3,606,348 | | | | 3,098,479 | |
| | | Year ended December 31, | | | Growth | |
| | | 2015 | | | 2014 | | | 2015-2014 | |
| | | (in millions of COP) | | | | |
| Operating expenses | | | | | | | | | | | | |
| Salaries and employee benefits | | | 2,255,391 | | | | 1,973,467 | | | | 14.29 | % |
| Other administrative and general expenses | | | 2,237,598 | | | | 1,947,375 | | | | 14.90 | % |
| Wealth tax, contributions and other tax burden | | | 675,387 | | | | 438,711 | | | | 53.95 | % |
| Provision, depreciation and amortization | | | 477,285 | | | | 459,703 | | | | 3.82 | % |
| Other expenses | | | 252,626 | | | | 299,439 | | | | -15.63 | % |
| Total operating expenses | | | 5,898,287 | | | | 5,118,695 | | | | 15.23 | % |
| | | | | | | | | | | | | |
| Discontinued operations Compañía de Financiamiento Tuya S.A. (Note 31) | | | 219,532 | | | | | | | | | |
Provision Charges and Credit Quality
For the year 2012,2015, provision charges (net of recoveries) totaled COP 1,1111,675 billion (or 1.7%1.3% of average loans), which represents an increase of 86%93% as compared to COP 599869 billion in 2011 (or 1% of average loans) and an increase of 103% as compared to COP 548 billion in 2010 (or 1.2% of average loans).2014. The higher level of provisions was driven by fasterthe formation of past due loans in ourand the growth of the loan portfolio.
Net loan charge-offs totaled COP 6791,422 billion in 2012,2015, up 28%21% from COP 532the 1,179 billion in 2011 and up 3% from COP 658 billion in 2010.2014. Past-due loans amounted to COP 1,8324,188 billion in 2012,2015, up 37%41.58% as compared to COP 1,3412,958 billion in 2011, and 31% higher than COP 1,396 billion in 2010.2014.
The delinquencies ratio (loans overdue more than 30 days divided by total loans) reached 2.62%2.98% as of the end of 2012,2015, up from 2.18%2.62% at the end of 2011 and down from 2.87% at the end of 2010.
Allowance for credit losses
Under Colombian banking GAAP and according to the rules established by the SFC, banking institutions in Colombia must follow minimum standards for establishing allowances for loan losses. Such minimum standards require banks to analyze, on an ongoing basis, the credit risk to which their loan portfolio is exposed, taking into account the terms of the corresponding obligations as well as the level of risk associated with the borrowers. The risk evaluation is based on information relating to historical performance data, particular characteristics of the borrower, collateral, the borrower’s debt to other entities, macroeconomic factors and financial information, among other data. The standards for provisioning vary for each credit category.
Commercial and consumer loans are provisioned following standard models developed by the SFC. According to the models the allowance for loan losses is calculated as follows:
Expected Loss = [Probability of default] x [Exposure at default] x [Loss given default]
2014.
The probability of default is calculated and provided by the SFC based on historical data. Exposure at default is defined as the current balance of the principal, interest, interest receivable accounts and other receivables regarding consumer and commercial loan obligations at the moment of default. The Loss Given Default (“LGD”) is defined as the expected loss occurred after default and is calculated and provided by the SFC. The LGD varies according to the type of collateral and would increase gradually depending on the number of days the loan has been in default. It is important to note that Bancolombia applies stricter parameters than those required by the Colombian regulator in the estimation of the LGD of its loan portfolio by reducing the number of the past-due days that are used in such calculation and adjusting some percentages. Therefore, allowances produce higher provision charges that reflected a higher coverage ratio for loan losses. In addition to the allowances calculated by the reference models, the Bank also sets up incremental allowances for certain clients who are considered to bear an increased inherent risk due to determined risk factors such as macroeconomic or industry deterioration trends or any other factors that could indicate early impairment. In June 2012, the SFC issued the External Circular 026 of 2012, with the purpose of setting the necessary instructions to be followed by financial institutions, in order to establish a new additional allowance for covering the consumer loan’s individual inherent risk, due to the significant increase in the consumer loan portfolio of the Colombian financial institutions. For futher details see the Consolidated Financial Statements, Note 2 “Summary of significant accounting policies”.
In addition, there are no standard models required or provided by the regulator for mortgage and small business loans. In order to calculate provisions for these segments, the Bank must maintain at all times individual allowances equal to or greater than the minimum percentages provided by the SFC. The minimum percentages vary depending on the risk category assigned to every loan within the mortgage and small business loans categories (the higher the risk, the higher the allowance percentage). In addition, the minimum percentages might differ if the loan has any collateral. In October 2011, the SFC issued the External Circular 043 of 2011 with the purpose of setting forth the necessary instructions to be followed by financial institutions in order to determine the fair value of collateral securing loans, as well as the frequency of valuations of collateral. For futher details see the Consolidated Financial Statements, Note 2 “Summary of significant accounting policies”.
The Bank also has adopted, for its Colombian business, more rigorous policies in the calculation of allowances for mortgage and small business loans as compared to that required by the SFC. Such policy has established higher allowance percentages for loans classified in the C, D and E risk categories.
For mortgage and small business loans, the Bank sets up a general allowance which corresponds to one percent (1%) of the outstanding principal. Because the Bank applies standardized models supplied by the SFC to compute the allowance for commercial and consumer loans, the Bank no longer establishes general allowances for commercial and consumer loans.
Allowances for loans, financial lease and accrued interest losses amounted to COP 3,249 billion or 4.64% of total loans at the end of 2012, an increase from COP 2,813 billion, or 4.58% of total loans, as of December 31, 2011. Notwithstanding, coverage for loan losses, measured by the ratio of allowances to past-due loans (“PDLs”) (overdue 30 days), reached 177% at the end of 2012, down from 210% at the end of 2011. The decrease in this coverage ratio is explained by the formation of PDLs during the year, which was faster than the pace of increase in allowances in the balance sheet. This coverage reflects the Bank’s prudent approach toward risk management and incorporates, as mentioned above, stricter parameters than those required by the SFC. As of December 31, 2012, allowances in the amount of COP 587 billion were recorded in excess of the minimum allowances required by the SFC as compared with COP 438 billion as of December 31, 2011.
The Bank’s management considers that the Bank’s allowances for loans and financial leases losses adequately reflect the credit risk associated with its loan portfolio given the current economic environment and the available information upon which the credit assessments are made. Nonetheless, the methodology used in the allowance and provision charges determination is based on the existence and magnitude of determined factors that are not necessarily an indication of future losses and, accordingly, no assurance can be given that current allowances and provision charges will exactly reflect actual losses.
For further details regarding the regulation and methodologies for the calculation of allowances following the accounting practices and the special regulations of the SFC, please see “Note 2.i. Loans and Financial Lease” of Notes to Consolidated Financial Statements included in this Annual Report.
For a description of the loan portfolio, the summary of loan experience, potential problem loans and charge-offs see “Item 4. Information on the Company – E. Selected Statistical Information – E.3. Loan Portfolio” and “Item 4. Information on the Company – E. Selected Statistical Information – E.4. Summary of loan loss experience”.
Loan loss allowances calculated following practices and special regulations of the SFC differ in certain significant respects from those determined in accordance with U.S. GAAP. Note 31- e) “Allowance for loan losses, financial leases, foreclosed assets and other receivables” to the Bank’s audited consolidated financial statements included in this Annual Report provides a description of the significant differences between Colombian banking GAAP and U.S. GAAP in this respect and a reconciliation of allowances following U.S. GAAP.
Merger Expenses and Goodwill Amortization
For the year ended December 31, 2012, goodwill amortization amounted to COP 46 billion, down 10% from COP 51 billion in 2011 and down 18% from COP 56 billion in 2010.
As of December 31, 2012, outstanding goodwill totaled COP 571 billion, which represents a 16% decrease from COP 680 billion at the end of 2011. Outstanding goodwill represented 0.6% of the Bank’s total assets and primarily comprises the goodwill related to the acquisition of Banagrícola, which is denominated U.S. dollars and is being amortized over 20 years beginning in May 2007.
Non-Operating Income (Expenses)
Net non-operating income, which includes gains/losses from the sale of foreclosed assets, premises and equipment and other assets and income from minority interests, totaled COP 35 billion in 2012, 54% lower than COP 76 billion in 2011. This performance is explained by lower gains on the sale of properties.
The following table summarizes the components of the Bank’s non-operating income and expenses for the last three fiscal years:
| | | Year ended December 31, | |
| | | 2012 | | | 2011 | | | 2010 | |
| | | (COP million) | |
| Non-operating income (expenses), net: | | | | | | | | | | | | |
| Other income(1) | | COP | 148,751 | | | COP | 200,098 | | | COP | 267,472 | |
| Minority interest | | | (5,723 | ) | | | (11,351 | ) | | | (13,217 | ) |
| Other expenses(2) | | | (107,813 | ) | | | (112,692 | ) | | | (168,179 | ) |
| Total non-operating income (expenses), net | | COP | 35,215 | | | COP | 76,055 | | | COP | 86,076 | |
| (1) | Includes gains on sale of foreclosed assets, premises and equipment, reimbursement of the provisions, deferred tax recovery. |
| (2) | Include fraud-related losses, losses from the sale of foreclosed assets, premises and equipment and payments for fines, sanctions, lawsuits and indemnities. |
Income Tax Expenses
Income tax expense for the fiscal year 20122015 totaled COP 467649 billion, down 1% as compared to12% from COP 471738 billion in 20112014. The income tax decreased despite the higher statutory income tax rate, because of certain differences between fiscal accounting and down 8% as comparedfinancial accounting.
Furthermore, in 2015 the bank faced a higher total tax burden, in general, due in part to the COP 508 billionwealth tax, which it paid in 2010.
Tax expense is determinedJanuary 2015 for every subsidiary followinga total amount of 160 billion. Also, the tax laweffect of the country where it is domiciled. On December 31, 2010, Bancolombia, Banca de Inversión Bancolombiadifference in foreign exchange derivatives implies the recognition of future taxes and Leasing Bancolombia concludedfinally, the difference between the book value and market value of debt securities implies a tax stability agreement signed with the Government of Colombia in 2001. Fiduciaria Bancolombia concluded that agreement on December 31, 2009. Therefore, since January 1, 2010 for Fiduciaria Bancolombia and since January 1, 2011 for Bancolombia, Banca de Inversión Bancolombia and Leasing Bancolombia, any new tax that is implemented in Colombia will apply to those entities and they will pay the statutory tax rate applicable in Colombia, as well as the financial transactionsfuture tax.
Since January 1, 2012, subsidiaries in the fiscal jurisdiction of El Salvador will pay a 30% income tax, with the exception of entities with taxable income of less that USD 150 thousand per year, which will pay 25%. Dividends received by those entities will beare subject to a 5% tax rate.
In the case of Bancolombia Panama and its subsidiary, Banagrícola, which are domiciled in Panama and permitted to operate through an international banking license, income tax is governed by the Panamanian tax law. Pursuant to Panamanian tax law the profits of these companies are not subject to income tax in Panama. Subsidiaries incorporated in El Salvador pay income tax of 25% on profits obtained within the country. For further details about the income tax expense calculation, see “Note 21. Accrued Expenses –11.A Income Taxes–CREE Tax Expense” ofand Deferred Tax” in the Notes to the Consolidated Financial Statements.
GENERAL DISCUSSION OF THE CHANGES IN RESULTS FOR 2011 VERSUS 2010
Banistmo and its subsidiaries incorporated in Panama pay an income tax on the profits obtained in the country equivalent to 25% from 2014 onwards. According to existing fiscal regulation, profits from foreign operations, interest paid on term deposits by local banks, debt securities issued by the Panamanian Government and from securities listed in the Securities Exchange Superintendency (Superintendencia del Mercado de Valores
Summary) are exempt from income taxes.
During 2011, Bancolombia strengthened its competitive position and full-service financial model, and benefited from the diversity of its leading franchises. For the year 2011, netGAM in Guatemala operates under a tax jurisdiction that requires it to pay an income totaled COP 1,664 billion (COP 2,112 per share – USD 4.35 per ADR), which represents an increase of 16% as compared to COP 1,436 billion of net incometax for the fiscal year 2010, and an increase of 32% as compared to COP 1,257 billion of net income for the fiscal year 2009.
Bancolombia’s return on average stockholders’ equity in 2011 was 20.2%, up from 19.7% in 2010 and 19.6% in 2009.
Margin compression during 2011: net interest margin decreased throughout 2011 and reached 6.17% for the whole year, down from 6.38% in 2010 and 7.22% in 2009.
Provision charges, net of recoveries, totaled COP 599 billion for 2011, up 9% from COP 548 billion in 2010 and down 48% from COP 1,153 billion in 2009.
Loans and financial leases grew 27% during the year. This performance was driven primarily by significant increase in economic activity in Colombia, which led to an increase in credit demand from individuals and corporations.
Reserves for loan losses represented 4.6% of total loans and 210% of past-due loans at the end of 2011, while capital adequacy at December 31, 2011 was 12.5% (Tier 1 ratio of 9.0%), lower than the 14.7% (Tier 1 ratio of 10.3%) reported at the end of 2010.
Deposits increased 20% during 2011, while the ratio of net loans to deposits (including borrowings from development banks) was 105% at the end of the year, up from 100% at December 31, 2010.
REVENUE PERFORMANCE
Net Interest Income
For the year 2011, net interest income totaled COP 3,904 billion, up 15% as compared to COP 3,389 billion in 2010 and up 3% as compared to COP 3,802 billion in 2009. This performance is explained by the combined effect of a slight decline in interest margins, which was offset by steady growthprofits obtained in the loan portfolio duringcountry equivalent to 25%. This corporate tax rate has been in effect since 2013 and will continue indefinitely into the year. During 2011, the Central Bank increased its reference rate from 3% to 4.75%, which reduced money supply in the economy. Net interest margin was 6.17% for the year, down from 6.38% in 2010. Net interest income represented 62% of revenues in 2011, compared to 62% in 2010 and 67% in 2009.
Interest income, which is the sum of interest on loans, financial leases, overnight funds and income from investment securities, totaled COP 5,946 billion in 2011, up 20% as compared to COP 4,961 billion in 2010 and down 7.5% as compared to COP 6,428 billion in 2009.
Interest on loans and financial leases reflected an increase in interest rates during 2011. The weighted average nominal interest rate on loans and financial leases decreased to 10% in 2011 from 10.3% in 2010 and 13.1% in 2009. As a result, interest on loans and financial leases totaled COP 5,301 billion (89% of interest income) and increased 19% as compared to COP 4,464 billion (90% of interest income) in 2010, and decreased 6% as compared to COP 5,623 billion (87% of interest income) in 2009.
Interest on investment securities, which includes, among other items, the interest paid or accrued on debt securities and mark-to-market valuation adjustments, totaled COP 626 billion in 2011, up 38% as compared to 2010 and down 14% as compared to 2009.
Regarding interest expenses, interest incurred on liabilities totaled COP 2,042 billion in 2011, up 30% as compared to COP 1,572 billion in 2010, and down 22% as compared to COP 2,625 billion in 2009. Such an increase in interest expenses is explained by higher interest rates incurred on deposits. Overall, the average interest rate paid on interest-bearing liabilities increased to 3.7% in 2011 from 3.4% in 2010, but was lower than the 5.6% in 2009.
Net Fees and Income from Financial Services
For the year 2011, net fees and income from services totaled COP 1,669 billion, up 6% as compared to COP 1,581 billion in 2010 and up 11% as compared to COP 1,506 billion in 2009. This increase was driven primarily by the performance of credit and debit card annual fees, banking services and collection and payments fees.
Bancolombia distribution channels performed an increasing number of transactions in 2011. In particular, our banking operation in Colombia performed about 1.17 billion transactions during 2011, which represents an increase of 6% as compared to the levels experienced in 2010. The higher transactional levels, together with fee increases and the elimination of fee exemptions in certain payment instruments (such as debit cards and credit cards) for some segments explained the performance of fees.
Other Operating Income
For 2011, total other operating income was COP 691 billion, 29% higher than the COP 535 billion reported in 2010, and 81% higher than the COP 381 billion obtained in 2009.
Revenue from communication, postage, rent and others had a significant impact in the other operating income line of COP 225 billion, 27% in 2011 higher than the COP 177 billion reported in 2010, and 44% higher than the COP 156 billion obtained in 2009.
forseeable future. In addition, the sale of Bancolombia’s stake in AFP Crecer positively affected other operating income in the year. As part of this transaction, the Bank recorded non-recurringcapital gains on sales of equities of COP 138 billion for 2011.
Insurance income totaled COP 46 billion in 2011, 1,543% higher than COP 2.8 billion reported in 2010. With the completion of the sale of AFP Crecer in El Salvador, the revenues from the insurance business began reflecting revenue that was offset in the consolidation process prior to the sale. As a result, insurance income presented a significant increase in 2011.
Foreign exchange net gains increased significantly by 80% from COP 62 billion in 2010 to COP 112 billion in 2011. Gains on forward contracts in foreign currency fell by 73% from COP 40 billion in 2010 to COP 11 billion in 2011.
Operating expenses
For 2011, operating expenses totaled COP 3,606 billion, up 16% as compared to COP 3,098 billion in 2010 and 25% up as compared to COP 2,895 billion in 2009.
Personnel expenses (the sum of salaries and employee benefits, bonus plan payments and indemnities) totaled COP 1,442 billion in 2011, up 11% as compared to 2010. This performance was primarily driven by the combined effect of increased headcount and wage increments during 2011. Salaries in 2011 were raised in line with the 2010 inflation rate of 3.17%.
Administrative and other expenses totaled COP 1,780 billion in 2011, up 22% as compared to 2010 and up 26% as compared to 2009, driven by increased taxes other than income taxes and expenses paid in connection with software development and IT upgrades.
Depreciation expenses totaled COP 223 billion in 2011, increasing 14% as compared to COP 196 billion in 2010. This increase was driven by the growth in the operating lease business of Bancolombia.
Provision Charges and Credit Quality
For the year 2011, provision charges (net of recoveries) totaled COP 599 billion (or 1% of average loans), which represents an increase of 9% as compared to COP 548 billion in 2010 (or 1.2% of average loans) and a decrease of 48% as compared to COP 1,153 billion in 2009 (or 2.6% of average loans). The lower level of provisions was driven by lower net charge-offs in our loan portfolio and lower reserve additions across all credit segments, reflecting the better economic activity and stronger labor markets and consequently improved credit profile of our loan portfolio.
Net loan charge-offs totaled COP 532 billion in 2011, down 19% from COP 658 billion in 2010 and down 43% from COP 926 billion in 2009. Past-due loans amounted to COP 1,341 billion in 2011, down 4% as compared to COP 1,396 billion in 2010, and 18% lower than COP 1,627 billion in 2009.
The delinquencies ratio (loans overdue more than 30 days divided by total loans) reached 2.18% as of the end of 2011, down from 2.87% at the end of 2010 and down from 3.87% at the end of 2009.
Merger Expenses and Goodwill Amortization
For the year ended December 31, 2011, goodwill amortization amounted to COP 51 billion, down 9% from COP 56 billion in 2010 and down 26% from COP 69 billion in 2009.
As of December 31, 2011, outstanding goodwill totaled COP 680 billion, which represents a 9% decrease from COP 751 billion at the end of 2010. Outstanding goodwill represented 0.8% of the Bank’s total assets and primarily comprises the goodwill related to the acquisition of Banagrícola, which is being amortized over 20 years beginning in May 2007.
Non-Operating Income (Expenses)
Net non-operating income, which includes gains/losses from the sale of foreclosed assets, premises and other assets and income from minority interests, totaled COP 76 billion in 2011, 12% lower than COP 86 billion in 2010. This performance is explained by higher non-operating income in 2010, which increased 10% compared to 2009, driven by gains on the sale of premises.
Income Tax Expenses
Income tax expense for the fiscal year 2011 totaled COP 471 billion, down 7% as compared to COP 508 billion in 2010 and 2% above the COP 462 billion in 2009.
Tax expense is determined for every subsidiary following the tax law of the country where it is domiciled. It is important to note that Bancolombia (unconsolidated), Leasing Bancolombia, Banca de Inversion Bancolombia and Fiduciaria Bancolombia signed an agreement with the Government of Colombia in order to be subject to the tax stability regime for ten years beginning on January 2001. Pursuant to the tax stability regime, those firms agreed to be taxed two percentage points above the applicable income tax rate in Colombia in exchange for an exemption with regard to any new national taxes or rates required after the date of the agreement. For this reason, in 2010, 2009 and 2008, Bancolombia (unconsolidated), Leasing Bancolombia, Banca de Inversion Bancolombia and Fiduciaria Bancolombia did not pay the financial transaction tax, equity tax or income surtax. Consequently, Bancolombia (unconsolidated), Leasing Bancolombia, Banca de Inversion Bancolombia and Fiduciaria Bancolombia wereare taxed at a total income tax rate of 35%10%, and dividends, other gains, and net income are taxed at a rate of 5%. Also, some corporates are allowed to adopt a simplified tax regime for calculating income tax. This alternative defines a tax of 5% on monthly income up to an amount of Q. 30,000, plus an additional 7% on any income surpassing the fiscal years 2010, 2009 and 2008, two percentage points above the required tax rate for the companies that were not subject to the tax stability regime in Colombia. This agreement terminated in December 31, 2010 (in the case of Fiduciaria Bancolombia, the agreement was terminated in December 31, 2009). As a result of the expiration of the tax stability regime agreement, Bancolombia is subject to any new taxes or increases in tax rates that are implemented on or after January 1, 2011.monthly taxable income base.
RESULTS BY SEGMENT
The Bank manages its business through eight10 main operating segments: Banking Colombia, Banking El Salvador, Leasing, Trust, Investment Banking, Brokerage, Banking Panama, Insurance, Off Shore and All Other.
Until 2011,In 2013, Bancolombia also included “Pension“Insurance” and Insurance”“Banking Panama” as onenew segments because of the acquisition of Banistmo and its segments. In 2012, Bancolombia concluded the sale of those units and no longer reports results for the “Pension and Insurance” segment. Nevertheless, for completeness purposes, the results of this segment have been included for the years 2011 and 2010.subsidiaries, which includes an insurance operation.
Banking Colombia:This segment provides retail and corporate banking products and services to individuals, companies and national and local Governmentsgovernments in Colombia. The Bank’s strategy in Colombia is to grow with thesethose clients based on value-added and long-term relationships. In order to offer specialized services to individuals and small and medium size enterprises (SMEs), the Bank´sBank retail sales force targets the clients classified as:as Personal, Private, Entrepreneurs, Foreign Residents and SMEs. The Bank´sAdditionally, the Bank’s corporate and Governmentgovernment sales force targets large companies and specializes in companies with more than COP 16,000 million in revenue of nine economic sectors: Agribusiness, Commerce, Manufacturing of Supplies and Materials, Media, Financial Services, Non-Financial Services, Construction, Government and Natural Resources.government owned enterprises.
This segment is also responsible for the management of the Bank’s proprietary trading activities, liquidity and distribution of treasury products and services to its client base in Colombia.
Year ended December 31,
| | | 2012 | | | 2011 | | | 2010 | | | Change 2012-2011 | | | Change 2011-2010 | |
| | | (COP in million) | |
| | | | | | | | | | | | | | | | |
| Net Interest income | | | 4,010,434 | | | | 3,000,900 | | | | 2,617,840 | | | | 33.64 | % | | | 14.63 | % |
| Net provisions | | | (1,057,745) | | | | (481,251) | | | | (378,778) | | | | 119.79 | % | | | 27.05 | % |
| Net commissions | | | 1,445,429 | | | | 1,335,101 | | | | 1,197,419 | | | | 8.26 | % | | | 11.50 | % |
| Other net revenues | | | 490,755 | | | | 452,331 | | | | 444,676 | | | | 8.49 | % | | | 1.72 | % |
| Total Operating Income | | | 4,888,873 | | | | 4,307,081 | | | | 3,881,157 | | | | 13.51 | % | | | 10.97 | % |
| Operating expenses | | | 3,296,266 | | | | 2,837,985 | | | | 2,442,504 | | | | 16.15 | % | | | 16.19 | % |
| Non-operating income (expense) | | | 18,153 | | | | 53,989 | | | | 71,628 | | | | (66.38 | %) | | | (24.63 | %) |
| Income before income taxes | | | 1,610,760 | | | | 1,523,085 | | | | 1,510,281 | | | | 5.76 | % | | | 0.85 | % |
| Income tax expense | | | (318,158) | | | | (319,572) | | | | (334,712) | | | | (0.44 | %) | | | (4.52 | %) |
| Segment profit | | | 1,292,602 | | | | 1,203,513 | | | | 1,175,569 | | | | 7.40 | % | | | 2.38 | % |
| Segment assets | | | 71,566,337 | | | | 63,626,713 | | | | 49,499,711 | | | | 12.48 | % | | | 28.54 | % |
| | | Year ended December 31, | |
| | | 2015 | | | 2014 | | | Change 2015-2014 | |
| | | (in millions of COP) | |
| Total interest and valuation | | | 7,594,955 | | | | 6,339,144 | | | | 19.81 | % |
| Interest expenses | | | (2,415,234 | ) | | | (1,941,525 | ) | | | 24.40 | % |
| Net margin and valuation on financial instruments | | | 5,179,721 | | | | 4,397,619 | | | | 17.78 | % |
| Total net provisions | | | (1,389,647 | ) | | | (816,099 | ) | | | 70.28 | % |
| Net interest and valuation income after provision for loans and financial leases | | | 3,790,074 | | | | 3,581,520 | | | | 5.82 | % |
| Revenues (Expenses) from transactions with other operating segments of the Bank | | | (67,981 | ) | | | (26,305 | ) | | | 158.43 | % |
| Total fees and income from services, net | | | 1,330,328 | | | | 1,222,518 | | | | 8.82 | % |
| Other operating income | | | 374,039 | | | | 219,211 | | | | 70.63 | % |
| Total income net | | | 5,426,460 | | | | 4,996,944 | | | | 8.60 | % |
| Total operating expenses | | | (3,866,006 | ) | | | (3,401,183 | ) | | | 13.67 | % |
| Profit before tax | | | 1,560,454 | | | | 1,595,761 | | | | -2.21 | % |
| Segment assets | | | 100,855,044 | | | | 88,052,668 | | | | 14.54 | % |
Analysis of 20122015 versus 2011.2014.
In 2012,2015, profit before taxes for Banking Colombia increased 7%declined by 2.2% to COP 1,2931,560 billion.
NetTotal interest incomeand valuation increased 34%19.8% to COP 4,0107,595 billion, explained by the growthgreater volumes in the loan portfolio.net loans and by a stable net interest margin. Consumer loans grew 10.5%, mortgages 15.5% and mortgages led the growth,corporate loans grew 25.5%. Demand in consumer loans was mainly driven by credit cards and personal loans while commercial loans followed aswere mainly driven by large corporationscorporate loans and small and medium enterprises demanded more credit.factoring operations.
NetTotal net provision charges increased 120%by 70.3% to COP 1,0581,390 billion. This increase resulted from growth of the loan portfolio, in particular loan growth in the consumer segment which increased 16%,specific defaults related to a few corporate clients, as well as some deterioration in credit quality. Operating expenses increased 16% to COP 3,296 billion, due to increased administrative expenses and labor costs.
Assets attributable to Banking Colombia grew 12% during the year, mainly driven by the growth in loans.
Analysis of 2011 versus 2010.
In 2011, profit for Banking Colombia increased 2% to COP 1,204 billion.consumer segment.
Net interestfees and income from services increased by 8.8% to COP 1,330 billion mainly due to credit card and banking services fees, which include branch network services and check remittances.
Other operating income increased 15%70.6% during 2015 because of the income received in operations with derivatives FX and gains from the sale of some assets held for sale.
Operating expenses increased by 13.7% to COP 3,0013,866 billion, due to stable net interest marginsincreases in labor costs as well as in contributions and growth in the loan portfolio. Consumer loans and mortgages led the growth, commercial loans followed as large corporations and small and medium enterprises demanded more credit.
Net provision charges increased 27% to COP 481 billion. This increase was in line with the growth of the loan portfolio, especially the consumer segment. Operating expenses increased 16% to COP 2,838 billion, due to increased administrative expenses and labor costs. A big driver for these expenses was the IT renovation project that Grupo Bancolombia is currently undertaking, which demands labor and operational expenses. Financial transaction taxes and equity taxes are also included in this line.taxes.
Assets attributable to Banking Colombia grew 29%by 14.5% during the year, mainly driven by the growth in loans.
Banking El Salvador through Banco Agrícola S.A.::This segment provides retail and commercial banking products and services to individuals, companies and national and local Governmentsgovernments in El Salvador through Banco Agrícola S.A.Salvador. Banking El Salvador also includes operations of the following subsidiariessubsidiaries: Arrendadora Financiera S.A., Credibac S.A. de CV, Valores and Banagricola S.A. de C.V.
This segment is also responsible for the management of the Bank’s proprietary trading activities, liquidity and distribution of treasury products and services to its client base in El Salvador.
Year ended December 31,
| | | 2012 | | | 2011 | | | 2010 | | | Change 2012-2011 | | | Change 2011-2010 | |
| | | (COP in million) | | | | | | | |
| Net Interest income | | | 333,789 | | | | 355,778 | | | | 362,155 | | | | (6.18%) | | | | (1.76%) | |
| Net provisions | | | 16,775 | | | | (38,787) | | | | (102,681) | | | | (143.25%) | | | | (62.23%) | |
| Net commissions | | | 129,226 | | | | 107,442 | | | | 115,206 | | | | 20.28% | | | | (6.74%) | |
| Other net revenues | | | (2,788) | | | | 34,076 | | | | 18,476 | | | | (108.18%) | | | | 84.43% | |
| Total Operating Income | | | 477,002 | | | | 458,509 | | | | 393,156 | | | | 4.03% | | | | 16.62% | |
| Operating expenses | | | 217,291 | | | | 205,304 | | | | 189,922 | | | | 5.84% | | | | 8.10% | |
| Non-operating income (expense) | | | 4,290 | | | | 6,731 | | | | 600 | | | | (36.27%) | | | | 1021.83% | |
| Income before income taxes | | | 264,001 | | | | 259,936 | | | | 203,834 | | | | 1.56% | | | | 27.52% | |
| Income tax expense | | | (66,473) | | | | (60,575) | | | | (54,547) | | | | 9.74% | | | | 11.05% | |
| Segment profit | | | 197,528 | | | | 199,361 | | | | 149,287 | | | | (0.92%) | | | | 33.54% | |
| Segment assets | | | 6,699,690 | | | | 6,931,582 | | | | 7,093,621 | | | | (3.35%) | | | | (2.28%) | |
| | | Year ended December 31, | |
| | | 2015 | | | 2014 | | | Change 2015-2014 | |
| | | (in millions of COP) | |
| Total interest and valuation | | | 728,582 | | | | 506,575 | | | | 43.83 | % |
| Interest expenses | | | (187,743 | ) | | | (109,353 | ) | | | 71.69 | % |
| Net margin and valuation on financial instruments | | | 540,839 | | | | 397,222 | | | | 36.16 | % |
| Total net provisions | | | (26,933 | ) | | | (44,808 | ) | | | -39.89 | % |
| Net interest and valuation income after provision for loans and financial leases | | | 513,906 | | | | 352,414 | | | | 45.82 | % |
| Revenues (Expenses) from transactions with other operating segments of the Bank | | | (8,475 | ) | | | (3,529 | ) | | | 140.15 | % |
| Total fees and income from services, net | | | 140,398 | | | | 103,585 | | | | 35.54 | % |
| Other operating income | | | 1,740 | | | | 6,303 | | | | -72.39 | % |
| Total income net | | | 647,569 | | | | 458,773 | | | | 41.15 | % |
| Total operating expenses | | | (358,123 | ) | | | (239,049 | ) | | | 49.81 | % |
| Profit before tax | | | 289,446 | | | | 219,724 | | | | 31.73 | % |
| Segment assets | | | 13,094,026 | | | | 9,567,903 | | | | 36.85 | % |
Analysis of 20122015 versus 2011.2014.
In 2012,2015, profit before taxes for Banking El Salvador decreased 1%increased by 31.7% to COP 198289 billion.
NetTotal interest income decreased 6%and valuation increased by 43.8% to COP 334729 billion, due to a reductiongrowth in the loan portfolio caused by a little demandmainly in commercial loans, as well as greater revenues in debt investments.
Total net provisions were COP 27 billion, compared with COP 44 billion for 2014, due to higher recoveries of non-performing loans. This variation is also explained by lower charges for credit impairment and a weak economy in El Salvador. The costreversal of deposits remained stable in 2012, net interest margin ended at 5.8%.the impairment of foreclosed assets.
Total operating expenses grew by 49.8% to COP 358 billion, mainly due to increased personnel, administrative and general expenses. Also, the appreciation of the U.S. dollar versus the Colombian Peso during 2015 contributed to the increase.
Net recoveries werefees and income from services increased by 35.5% to COP 17140 billion compared with net provisions of COP 38 billion for 2011, in line with an improvement in the credit quality of the loan portfolio. In banking operations in El Salvador, we maintained strict discipline in credit standards in order to prevent any significant deterioration of the loan bookmainly due to weak economic performance. Allowances for bad loan losses as a percentage of past-due loans at the end of 2012 were 133%fees from banking services, which include Electronic services and past-due loans as a percentage of gross loans was 2.99% for Banking El Salvador.
Operating expenses grew 6% to COP 217 billion, due to increases in administrativeATM and personnel expenses.
check remittances. Assets attributable to Banking El Salvador decreased 3%increased by 36.8% during the year, mainly driven by the contractionappreciation of the U.S. dollar versus the Colombian Peso and the growth of the loan portfolio of Banco Agrícola.
Analysis The loan portfolio denominated in U.S. dollar grew 2.7% during 2015. Consumer and Mortgage loans led the growth in 2015 and at the end of 2011 versus 2010.
In 2011, profitthe period accounted for Banking El Salvador increased 34% to COP 199 billion.
Net interest income decreased 2% to COP 356 billion, due to the contraction56.3% of the loan portfolio. This small growth inCorporate loans are 43.5% of the loan portfolio was caused by low demand due to weak economy in El Salvador. Deposits contracted and their cost remained stable. In 2011, net interest margin ended at 5.7% compared with 5.4% for 2010.total loans.
Net provision charges decreased 62% to COP 39 billion, in line with an improvement in the credit quality of the loan portfolio. In banking operations in El Salvador, we maintained strict discipline in credit standards in order to prevent any significant deterioration of the loan book due to weak economic performance. Allowances for bad loan losses as a percentage of past-due loans at the end of 2011 was 115% and past-due loans as a percentage of gross loans was 3.69% for Banking El Salvador. 76
Operating expenses grew 8% to COP 205 billion, due to increases in administrative and personnel expenses.
Non-operating income also presented a positive change, as it generated a profit of COP 6.7 billion compared with only of COP 0.6 billion in 2010. This variation is explained mainly by the impact of the depreciation of the Colombian peso against the U.S. dollar in 2011 and the resulting beneficial impact in Banking El Salvador. Assets attributable to Banking El Salvador decreased 2% during the year, mainly driven by the contraction of 9% in the investment portfolio of Banco Agrícola.
Leasing:This segment provides financial and operational leases, including cross-border and international leasing services to clients in Colombia, Central America, Mexico and Brazil. Bancolombia offers these services mainly through the following Subsidiaries: Leasing Bancolombia, S.A., Renting Colombia S.A., Arrendamiento Operativo CIB S.A.C., Leasing PeruPerú S.A., Transportempo S.A.S., Capital Investment Safi S.A., Fondo de Inversión en Arrendamiento Operativo Renting Perú and Patrimonio Autónomo Cartera LBC.
Year ended December 31,
| | | 2012 | | | 2011 | | | 2010 | | | Change 2012-2011 | | | Change 2011-2010 | |
| | | (COP in million) | | | | | | | |
| Net Interest income | | | 533,725 | | | | 473,867 | | | | 443,574 | | | | 12.63% | | | | 6.83% | |
| Net provisions | | | (91,389) | | | | (49,211) | | | | (48,262) | | | | 85.71% | | | | 1.97% | |
| Net commissions | | | 36,528 | | | | 11,703 | | | | 4,895 | | | | 212.13% | | | | 139.08% | |
| Other net revenues | | | 111,121 | | | | 68,930 | | | | 53,799 | | | | 61.21% | | | | 28.13% | |
| Total Operating Income | | | 589,985 | | | | 505,289 | | | | 454,006 | | | | 16.76% | | | | 11.30% | |
| Operating expenses | | | 314,999 | | | | 280,478 | | | | 213,433 | | | | 12.31% | | | | 31.41% | |
| Non-operating income (expense) | | | (52,761) | | | | (488) | | | | (7,032) | | | | 10711.68% | | | | (93.06%) | |
| Income before income taxes | | | 222,225 | | | | 224,323 | | | | 233,541 | | | | (0.94%) | | | | (3.95%) | |
| Income tax expense | | | (3,106) | | | | (2,720) | | | | (47,208) | | | | 14.19% | | | | (94.24%) | |
| Segment profit | | | 219,119 | | | | 221,603 | | | | 186,333 | | | | (1.12%) | | | | 18.93% | |
| Segment assets | | | 13,179,545 | | | | 11,488,298 | | | | 8,345,821 | | | | 14.72% | | | | 37.65%) | |
| | | Year ended December 31, | |
| | | 2015 | | | 2014 | | | Change 2015-2014 | |
| | | (in millions of COP) | |
| Total interest and valuation | | | 1,507,045 | | | | 1,279,129 | | | | 17.82 | % |
| Interest expenses | | | (814,044 | ) | | | (670,195 | ) | | | 21.46 | % |
| Net margin and valuation on financial instruments | | | 693,001 | | | | 608,934 | | | | 13.81 | % |
| Total net provisions | | | (123,067 | ) | | | (53,659 | ) | | | 129.35 | % |
| Net interest and valuation income after provision for loans and financial leases | | | 569,934 | | | | 555,275 | | | | 2.64 | % |
| Revenues (Expenses) from transactions with other operating segments of the Bank | | | (24,222 | ) | | | (16,797 | ) | | | 44.20 | % |
| Total fees and income from services, net | | | 17,011 | | | | 47,735 | | | | -64.36 | % |
| Other operating income | | | 585,634 | | | | 527,990 | | | | 10.92 | % |
| Total income net | | | 1,148,357 | | | | 1,114,203 | | | | 3.07 | % |
| Total operating expenses | | | (643,443 | ) | | | (645,307 | ) | | | -0.29 | % |
| Profit before tax | | | 504,914 | | | | 468,896 | | | | 7.68 | % |
| Segment assets | | | 18,737,433 | | | | 16,739,678 | | | | 11.93 | % |
Analysis of 20122015 versus 2011.2014.
In 2012,2015, profit before taxes for Leasing decreased 1%increased by 7.7% to COP 219505 billion.
NetTotal interest incomeand valuation increased 13%by 17.8% to COP 5341,507 billion, explained mainly by the growth in the balance of financial leases.
Net provision chargesTotal net provisions increased 86%by 129.3% to COP 91123 billion, due to higherthe formation of new past due loans and the growing of the total loan portfolio. This increment is also explained by the methodological change in the recognition of the deterioration of prepayments, the basis for the estimation changed from the amount of the prepayment to the whole amount of the leasing portfolio. Allowances for bad loan losses, as acontract besides the percentage of gross loans, were 153%; and past-due loans as a percentage of gross loans were 1.84% at end of 2012.provision increased under IFRS.
Operating expenses increased 12%Net fees and income from services decreased by 64.4% to COP 31517 billion due to increased labor costsless fees from arrangements of operational leasing structures and administrative expenses.imports.
Total operating expenses decreased by 0.2% to COP 643 billion.
Assets attributable to Leasing grew 15%by 11.9% to COP 13,18018,737 billion, mainly driven by the increase in financial and operating leases demanded by large corporations and small and medium enterprises, although the rate increased slowly from 2011.
Analysismainly of 2011 versus 2010.massive transportation.
In 2011, profit for Leasing increased 19% to COP 222 billion. 77
Net interest income increased 7% to COP 474 billion, explained mainly by the growth in the balance of financial leases.
Net provision charges increased 2% to COP 49 billion, due to better credit quality and high provision charges that the company made in previous years. Allowances for bad loan losses as a percentage of gross loans was 210%; and past-due loans as a percentage of gross loans was 1.82% at end of 2011, compared with 220% and 2.04%, respectively, at the end of 2010.
Operating expenses increased 31% to COP 280 billion, due to increased labor costs and administrative expenses, derived from the integration of Leasing Bancolombia S.A. and Renting Colombia S.A.
Assets attributable to Leasing grew 38% to COP 11,488 billion, mainly driven by the increase in financial leases demanded by corporations and small and medium enterprises.
Trust:This segment provides trust services and asset management to clients in Colombia and Peru through Fiduciaria Bancolombia and FiduPerú S.A. Sociedad Fiduciaria. The main products offered by this segment include money market accounts, mutual and pension funds, private equity funds, payment trust, custody services and corporate trust.
Year ended December 31,
| | | 2012 | | | 2011 | | | 2010 | | | Change 2012-2011 | | | Change 2011-2010 | |
| | | (COP in million) | | | | | | | |
| Net Interest income | | | 12,635 | | | | 14,906 | | | | 16,933 | | | | (15.24)% | | | | (11.97)% | |
| Net provisions | | | (831) | | | | 158 | | | | (394) | | | | (625.95)% | | | | (140.10)% | |
| Net commissions | | | 198,987 | | | | 166,736 | | | | 144,786 | | | | 19.34% | | | | 15.16% | |
| Other net revenues | | | (28,287) | | | | (557) | | | | 874 | | | | 4978.46% | | | | (163.73)% | |
| Total Operating Income | | | 182,504 | | | | 181,243 | | | | 162,199 | | | | 0.70% | | | | 11.74% | |
| Operating expenses | | | 63,165 | | | | 69,510 | | | | 53,805 | | | | (9.13)% | | | | 29.19% | |
| Non-operating income (expense) | | | 1,106 | | | | 4,540 | | | | (742) | | | | (75.64)% | | | | (711.86)% | |
| Income before income taxes | | | 120,445 | | | | 116,273 | | | | 107,652 | | | | 3.59% | | | | 8.01% | |
| Income tax expense | | | (38,827) | | | | (37,637) | | | | (34,660) | | | | 3.16% | | | | 8.59% | |
| Segment profit | | | 81,618 | | | | 78,636 | | | | 72,992 | | | | 3.79% | | | | 7.73% | |
| Segment assets | | | 79,579 | | | | 303,579 | | | | 272,797 | | | | (73.79)% | | | | 11.28% | |
Analysis of 2012 versus 2011.
In 2012, profit for the Trust segment increased 4% to COP 82 billion.
Net interest income decreased 15% to COP 13 billion, due to the contraction of the net interest margin and a reduction in volumes. Commissions grew 19% due to an increase in the value of assets under management. Operating expenses decreased 9% to COP 63 billion due to a reduction in administrative expenses related to consulting fees associated with the implementation of new products and services. Assets attributable to the Trust segment decreased 74% during the year to COP 79 billion, mainly driven by the reduction of the investment securities portfolio of Fiduciaria Bancolombia S.A. This reduction was a result of the consolidation of the proprietary securities portfolio in the Banking Colombia segment, aimed at gaining efficiency in the management of the portfolio.
| | | Year ended December 31, | |
| | | 2015 | | | 2014 | | | Change 2015-2014 | |
| | | (in millions of COP) | |
| Total interest and valuation | | | 626 | | | | 12,852 | | | | -95.13 | % |
| Interest expenses | | | (367 | ) | | | (321 | ) | | | 14.33 | % |
| Net margin and valuation on financial instruments | | | 259 | | | | 12,531 | | | | -97.93 | % |
| Total net provisions | | | (3,204 | ) | | | 319 | | | | -1104.39 | % |
| Net interest and valuation income after provision for loans and financial leases | | | (2,945 | ) | | | 12,850 | | | | -122.92 | % |
| Revenues (Expenses) from transactions with other operating segments of the Bank | | | (21,833 | ) | | | (34,036 | ) | | | -35.85 | % |
| Total fees and income from services, net | | | 218,190 | | | | 199,806 | | | | 9.20 | % |
| Other operating income | | | 30,080 | | | | 6,525 | | | | 361.00 | % |
| Total income net | | | 223,492 | | | | 185,145 | | | | 20.71 | % |
| Total operating expenses | | | (86,384 | ) | | | (84,489 | ) | | | 2.24 | % |
| Profit before tax | | | 137,108 | | | | 100,656 | | | | 36.21 | % |
| Segment assets | | | 154,485 | | | | 164,571 | | | | -6.13 | % |
Analysis of 20112015 versus 2010.2014.
In 2011,2015, profit before taxes for the Trust segment increased 8%by 36.2% to COP 79137 billion.
Net interestTotal fees and income decreased 12%from services increased by 9.2% to COP 15218 billion due to the contraction of the net interest margin. Commissions grew 15% due to an increase in thedriven by higher value of assets under management. Operating expenses grew 29% to COP 69 billion due to increases in labormanagement and administrative expenses related to consulting fees associated with the implementation of new products and services. Assets under management of thecorporate trust segment totaled COP 44.5 trillion at the end of 2011.fees.
Assets attributable to the Trust segment grew 11%decreased by 6.1% during the year to COP 304154 billion, mainly driven by the growthdecrease in the investment securities portfoliodebt investments of Fiduciaria Bancolombia S.A.
Investment Banking:This segment provides corporate and project finance advisory, underwriting, capital markets services and private equity management through Banca de Inversion Bancolombia S.A.Bancolombia. Its customers include private and publicly-heldpublicly held corporations as well as Government institutions.
Year ended December 31,
| | | 2012 | | | 2011 | | | 2010 | | | Change 2012-2011 | | | Change 2011-2010 | |
| | | (COP in million) | | | | | | | |
| Net Interest income | | | 2,391 | | | | 7,043 | | | | 10,303 | | | | (66.05)% | | | | (31.64)% | |
| Net provisions | | | (137) | | | | (242) | | | | 1,168 | | | | (43.39)% | | | | (120.72)% | |
| Net commissions | | | 38,415 | | | | 33,972 | | | | 31,913 | | | | 13.08% | | | | 6.45% | |
| Other net revenues | | | 25,894 | | | | 41,947 | | | | 94,743 | | | | (38.27)% | | | | (55.73)% | |
| Total Operating Income | | | 66,563 | | | | 82,720 | | | | 138,127 | | | | (19.53)% | | | | (40.11)% | |
| Operating expenses | | | 19,381 | | | | 21,573 | | | | 16,673 | | | | (10.16)% | | | | 29.39% | |
| Non-operating income (expense) | | | 491 | | | | 1,062 | | | | 133 | | | | (53.77)% | | | | 698.50% | |
| Income before income taxes | | | 47,673 | | | | 62,209 | | | | 121,587 | | | | (23.37)% | | | | (48.84)% | |
| Income tax expense | | | (8,653) | | | | (9,186) | | | | (18,632) | | | | (5.80)% | | | | (50.70)% | |
| Segment profit | | | 39,020 | | | | 53,023 | �� | | | 102,955 | | | | (26.41)% | | | | (48.50)% | |
| Segment assets | | | 165,326 | | | | 462,155 | | | | 427,967 | | | | (64.23)% | | | | 7.99% | |
| | | Year ended December 31, | |
| | | 2015 | | | 2014 | | | Change 2015-2014 | |
| | | (in millions of COP) | |
| Total interest and valuation | | | 287 | | | | 249 | | | | 15.26 | % |
| Interest expenses | | | (236 | ) | | | (200 | ) | | | 18.00 | % |
| Net margin and valuation on financial instruments | | | 51 | | | | 49 | | | | 4.08 | % |
| Total net provisions | | | 127 | | | | (157 | ) | | | -180.89 | % |
| Net interest and valuation income after provision for loans and financial leases | | | 178 | | | | (108 | ) | | | -264.81 | % |
| Revenues (Expenses) from transactions with other operating segments of the Bank | | | 2,355 | | | | 961 | | | | 145.06 | % |
| Total fees and income from services, net | | | 29,327 | | | | 22,985 | | | | 27.59 | % |
| Other operating income | | | 42,098 | | | | (2,124 | ) | | | -2082.02 | % |
| Total income net | | | 73,958 | | | | 21,714 | | | | 240.60 | % |
| Total operating expenses | | | (22,728 | ) | | | (23,038 | ) | | | -1.35 | % |
| Profit before tax | | | 51,230 | | | | (1,324 | ) | | | -3,969.34 | % |
| Segment assets | | | 128,301 | | | | 122,716 | | | | 4.55 | % |
Analysis of 20122015 versus 2011.2014.
In 2012,2015, profit before taxes for the Investment Banking segment decreased 26%increased to COP 3951 billion.
NetTotal interest income decreased 66%and valuation increased by 15.2% to COP 2 billion,287 million, due to the contraction of the investment securities portfolio. Net commissions,higher investments valuation.
Total fees and income from services, which areis the main revenue line, grew 13%increased by 27.6% to COP 3829 billion, led by higher fees generated by corporate finance advisory services and capital markets related fees. Corporate bond issuance was robust in Colombia in 2012 and Banca de Inversion Bancolombia participated in bond and commercial papers issuances worth COP 2.4 trillion.
Other revenues declined 38%operating income increased to COP 2642 billion as gains from divestitures in companies that occurred in 2011 did not occur in 2012.mainly due to sales of real estate assets.
OperatingTotal operating expenses declined 10%decreased by 1.3% to COP 1923 billion, due to a reduction in personnelless administration and general expenses.
Assets attributable to Investment Banking decreased 64%increased by 4.5% during the year to COP 165 billion, mainly driven by the reduction of the investment securities portfolio.
Analysis of 2011 versus 2010.
In 2011, profit for the Investment Banking segment decreased 48% to COP 53 billion.
Net interest income decreased 32% to COP 7128 billion, due to the contraction of the loan portfolio and margins. Net commissions, which are the main revenue line, grew 6% to COP 34 billion, led by fees generated by corporate finance advisory services and capital markets related fees. Corporate bond issuance was robust in Colombia in 2011 and Banca de Inversion Bancolombia participated in deals worth COP 5 trillion, an increase of 100% as compared with deals worth COP 2.5 trillion in 2010.
Other revenues declined 56% to COP 42 billion as gains in stakes in companies that occurred in 2010 did not occur in 2011.
Operating expenses grew 29% to COP 22 billion, due to increased labor costs.
Assets attributable to Investment Banking grew 8% during the year to COP 462 billion, mainly drivena capitalization approved by the growth in the investment portfolio.shareholders.
Brokerage:This segment provides brokerage, investment advisory and private banking services to individuals and institutions through Valores Bancolombia, S.A. Comisionista de Bolsa, Valores Bancolombia Panama S.A. and Suvalor PanamáPanama Fondo de Inversión S.A. It sells and distributes equities, futures, foreign currencies, fixed income securities, mutual funds and structured products.
| | | Year ended December 31, | |
| | | 2015 | | | 2014 | | | Change 2015-2014 | |
| | | (in millions of COP) | |
| Total interest and valuation | | | 21,157 | | | | 19,833 | | | | 6.68 | % |
| Interest expenses | | | (652 | ) | | | (784 | ) | | | -16.84 | % |
| Net margin and valuation on financial instruments | | | 20,505 | | | | 19,049 | | | | 7.64 | % |
| Total net provisions | | | (177 | ) | | | (1,829 | ) | | | -90.32 | % |
| Net interest and valuation income after provision for loans and financial leases | | | 20,328 | | | | 17,220 | | | | 18.05 | % |
| Revenues (Expenses) from transactions with other operating segments of the Bank | | | 31,734 | | | | 46,068 | | | | -31.11 | % |
| Total fees and income from services, net | | | 78,124 | | | | 81,733 | | | | -4.42 | % |
| Other operating income | | | (7,798 | ) | | | 4,258 | | | | -283.14 | % |
| Total income net | | | 122,388 | | | | 149,279 | | | | -18.01 | % |
| Total operating expenses | | | (112,529 | ) | | | (106,779 | ) | | | 5.38 | % |
| Profit before tax | | | 9,859 | | | | 42,500 | | | | -76.80 | % |
| Segment assets | | | 224,020 | | | | 248,150 | | | | -9.72 | % |
Year ended December 31,
| | | 2012 | | | 2011 | | | 2010 | | | Change 2012-2011 | | | Change 2011-2010 | |
| | | (COP in million) | | | | | | | |
| Net Interest income | | | 20,284 | | | | 22,149 | | | | 28,102 | | | | (8.42)% | | | | (21.18)% | |
| Net provisions | | | (68) | | | | (86) | | | | (208) | | | | (20.93)% | | | | (58.65)% | |
| Net commissions | | | 70,511 | | | | 81,094 | | | | 52,711 | | | | (13.05)% | | | | 53.85% | |
| Other net revenues | | | 38,421 | | | | 27,225 | | | | 4,581 | | | | 41.12% | | | | 494.30% | |
| Total Operating Income | | | 129,148 | | | | 130,382 | | | | 85,186 | | | | (0.95)% | | | | 53.06% | |
| Operating expenses | | | 102,199 | | | | 98,947 | | | | 86,699 | | | | 3.29% | | | | 14.13% | |
| Non-operating income (expense) | | | 4,333 | | | | 6,226 | | | | 15,206 | | | | (30.40)% | | | | (59.06)% | |
| Income before income taxes | | | 31,282 | | | | 37,661 | | | | 13,693 | | | | (16.94)% | | | | 175.04% | |
| Income tax expense | | | (5,962) | | | | (3,942) | | | | (1,245) | | | | 51.24% | | | | 216.63% | |
| Segment profit | | | 25,320 | | | | 33,719 | | | | 12,448 | | | | (24.91)% | | | | 170.88% | |
| Segment assets | | | 224,811 | | | | 364,962 | | | | 851,844 | | | | (38.40)% | | | | (57.16)% | |
Analysis of 20122015 versus 2011.2014.
In 2012,2015, profit before taxes for the Brokerage segment decreased 25%by 76.8% to COP 25 billion.
Net interest income decreased 8% to COP 2010 billion, due to a reduction in gains on securities.higher expenses and less operating income.
Net commissions,Total interest and valuation increased by 6.7% to COP 21 million, due to higher investments valuation.
Total fees and income from services, which are the most important component of revenues, decreased 13%presented a decrease of 4.4% to COP 7178 billion, due to lowerhigher fees expenses related to distribution and intermediation of securities and asset management.
Other operating income decreased by 283% to COP -8 billion, due mainly to higher costs of securities exchange services and deposit and custody of securities.
Other net revenuesTotal operating expenses increased 41%by 5.4% to COP 38 billion, due mainly to the reduction of other expenses associated with the administration of investment portfolios to the trust segment.
Operating expenses increased 3% to COP 102112 billion, due to labor cost increases and higher IT expenditures.taxes other than income taxes, as well as higher depreciation due to the shortening of the useful life of fixed assets.
Assets attributable to the Brokerage segment decreased 38%by 9.7% during the year, mainly driven by a decrease in active positions in market activities, which also led to athe reduction in associated liabilities in the liability side of the balance sheet.
Analysis of 2011 versus 2010.
In 2011, profit for the Brokerage segment increased 171% to COP 34 billion.
Net interest income decreased 21% to COP 22 billion, due to a reduction in gains on securities.
Net commissions, which are the most important component of revenues, increased 54% to COP 81 billion, as increased trading activity in 2011 generated more fees and revenues from third-party portfolios. Assets under management of the private banking arm of Valores Bancolombia totaled COP 10 trillion at the end of 2011.
Other net revenues increased 494% to COP 27 billion due mainly to mark-to-market gain stemming from the reclassification of BVC (Bolsa de Valores de Colombia) equity securities from “available for sale” investments to “trading” investments.
Operating expenses increased 14% to COP 99 billion, due to labor cost increases and higher IT expenditures.
Assets attributable to the Brokerage segment decreased 57% during the year, mainly driven by a decrease in active positions in market activities, which also led to a reduction in associated liabilities in the liability side of the balance sheet.repurchase agreement operations.
Off Shore:This segment provides a complete line of offshore banking services to Colombian and Salvadorian customers through Bancolombia Panamá S.A.,Panama, Bancolombia Cayman S.A., and Bancolombia Puerto Rico International, Inc. It offers loans to private sector companies, trade financing, lease financing and financing for industrial projects, as well as a complete portfolio of cash management products, such as checking accounts, international collections and payments. Through these Subsidiaries,subsidiaries, the Bank also offers investment opportunities in U.S. dollars, savings and checking accounts, time deposits, and investment funds to its high net worthwide network of clients and private banking customers.
The performance of Bancolombia Panamá,Panama, which has a significant weight in this segment, refers only to the results reported by Bancolombia Panamá’sPanama’s offshore commercial banking activities and does not consolidate the results of Banco Agrícola, which are reflected in the results for the segment Banking El Salvador.
Year ended December 31,
| | | 2012 | | | 2011 | | | 2010 | | | Change 2012-2011 | | | Change 2011-2010 | |
| | | (COP in million) | | | | | | | |
| Net Interest income | | | 95,963 | | | | 107,043 | | | | 108,114 | | | | (10.35)% | | | | (0.99)% | |
| Net provisions | | | 5,268 | | | | 2,557 | | | | (19,754) | | | | 106.02% | | | | (112.94)% | |
| Net commissions | | | 15,461 | | | | 19,686 | | | | 12,432 | | | | (21.46)% | | | | 58.35% | |
| Other net revenues | | | 109,111 | | | | 183,272 | | | | 87,081 | | | | (40.46)% | | | | 110.46% | |
| Total Operating Income | | | 225,803 | | | | 312,558 | | | | 187,873 | | | | (27.76)% | | | | 66.37% | |
| Operating expenses | | | 57,500 | | | | 60,802 | | | | 66,811 | | | | (5.43)% | | | | (8.99)% | |
| Non-operating income (expense) | | | (195) | | | | (392) | | | | (3,279) | | | | (50.26)% | | | | (88.05)% | |
| Income before income taxes | | | 168,108 | | | | 251,364 | | | | 117,783 | | | | (33.12)% | | | | 113.41% | |
| Income tax expense | | | - | | | | - | | | | - | | | | - | | | | - | |
| Segment profit/(loss) | | | 168,108 | | | | 251,364 | | | | 117,783 | | | | (33.12)% | | | | 113.41% | |
| Segment assets | | | 5,215,286 | | | | 8,751,997 | | | | 6,068,344 | | | | (40.41)% | | | | 44.22% | |
| | | Year ended December 31, | |
| | | 2015 | | | 2014 | | | Change 2015-2014 | |
| | | (in millions of COP) | |
| Total interest and valuation | | | 291,249 | | | | 188,934 | | | | 54.15 | % |
| Interest expenses | | | (215,592 | ) | | | (152,601 | ) | | | 41.28 | % |
| Net margin and valuation on financial instruments | | | 75,657 | | | | 36,333 | | | | 108.23 | % |
| Total net provisions | | | (49,830 | ) | | | (21,160 | ) | | | 135.49 | % |
| Net interest and valuation income after provision for loans and financial leases | | | 25,827 | | | | 15,173 | | | | 70.22 | % |
| Revenues (Expenses) from transactions with other operating segments of the Bank | | | 95,495 | | | | 53,519 | | | | 78.43 | % |
| Total fees and income from services, net | | | 32,325 | | | | 28,776 | | | | 12.33 | % |
| Other operating income | | | (124,980 | ) | | | (152,765 | ) | | | -18.19 | % |
| Total income net | | | 28,667 | | | | (55,297 | ) | | | -151.84 | % |
| Total operating expenses | | | (90,679 | ) | | | (39,288 | ) | | | 130.81 | % |
| Profit before tax | | | (62,012 | ) | | | (94,585 | ) | | | -34.44 | % |
| Segment assets | | | 11,667,606 | | | | 8,488,021 | | | | 37.46 | % |
Analysis of 20122015 versus 2011.2014.
In 2012,2015, profit before taxes for the Off Shore segment decreased 33%by 34.4% to COP 16862 billion.
NetTotal interest income decreased 10%and valuation increased by 54.1% to COP 96291 billion, driven by a reduction of the loan portfolio. Other nethigher revenues decreased 40%from commercial loans, consumer loans and debt investments.
Net fees and income from services increased by 12.3% to COP 10932 billion mostlymainly due to a reduction in dividends receivedhigher fees and less expenses from Banagrícola (part of the Banking El Salvador segment). These dividends are eliminated in the consolidation process that generates the consolidated financial statements.banking services.
Operating expensesOther operating income decreased 5%by 18.1% to COP 58125 billion.
Total operating expenses increased by 130.8% to COP 91 billion, due to lower amortization chargesthe growth of the goodwill created with the purchase of Banagrícola, which was reflected in Bancolombia Panamá.
labor and administration and general expenses.
Assets attributable to the Off Shore segment decreased 40%increased by 37.5% during the year, mainly driven by the transferstrengthening of some loans tothe U.S. dollar versus the Colombian banking book as partPeso and the organic growth of the strategy to mitigate expected pre-paymets of loans to clients in Guatemala following regulatory changes in 2012.loans.
The jurisdictions where operations of the Off Shore segment are conducted have no corporate income taxes.
Analysis of 2011 versus 2010.
In 2011, profit for the Off Shore segment increased 113% to COP 251 billion.
Net interest income decreased 1% to COP 107 billion. Other net revenues grew 110% to COP 183 billion, mostly due to an increase in dividends received from Banagrícola (part of the Banking El Salvador segment). These dividends were increased because the capital in Banagrícola was higher than required due to slow demand in credit for El Salvador. These dividends are eliminated in the consolidation process that generates the consolidated financial statements.
Operating expenses decreased 9% to COP 61 billion, due to lower amortization charges of the goodwill created with the purchase of Banagrícola, which was reflected in Bancolombia Panamá.
Assets attributable to the Off Shore segment increased 44% during the year, mainly driven by the depreciation of the Colombian peso versus the US dollar in 2011.
The jurisdictions where operations of the Off Shore segment are conducted have no corporate income taxes.
Pension and Insurance:Panama:This segment provided pension plan administrationprovides retail and insurancecommercial banking products and services to individuals and companies in El SalvadorPanama through Crecer S.A., Aseguradora Suiza Salvadoreñthe Banistmo operation. This segment includes all the operations of Banistmo and its subsidiaries (except Insurance operations) as they are managed and monitored by the chief operating decision maker on a S.A. and Asesuisa Vida S.A.consolidated basis.
Year ended December 31,
| | | 2012 | | | 2011 | | | 2010 | | | Change 2012-2011 | | | Change 2011-2010 | |
| | | (COP in million) | | | | | | | |
| Net Interest income | | | - | | | | 2,454 | | | | 4,046 | | | | - | | | | (39.35)% | |
| Net provisions | | | - | | | | 1,033 | | | | 593 | | | | - | | | | 74.20% | |
| Net commissions | | | - | | | | (65) | | | | 89,969 | | | | - | | | | (100.07)% | |
| Other net revenues | | | - | | | | 28,898 | | | | (14,887) | | | | - | | | | (294.12)% | |
| Total Operating Income | | | - | | | | 32,320 | | | | 79,721 | | | | - | | | | (59.46)% | |
| Operating expenses | | | - | | | | 9,552 | | | | 31,115 | | | | - | | | | (69.30)% | |
| Non-operating income (expense) | | | - | | | | 524 | | | | 1,752 | | | | - | | | | (70.09)% | |
| Income before income taxes | | | - | | | | 23,292 | | | | 50,358 | | | | - | | | | (53.75)% | |
| Income tax expense | | | - | | | | (5,253) | | | | (11,557) | | | | - | | | | (54.55)% | |
| Segment profit | | | - | | | | 18,039 | | | | 38,801 | | | | - | | | | (53.51)% | |
| Segment assets | | | - | | | | 173,006 | | | | 229,156 | | | | - | | | | (24.51)% | |
| | | Year ended December 31, | |
| | | 2015 | | | 2014 | | | Change 2015-2014 | |
| | | (in millions of COP) | |
| Total interest and valuation | | | 1,119,540 | | | | 807,547 | | | | 38.63 | % |
| Interest expenses | | | (363,373 | ) | | | (256,795 | ) | | | 41.50 | % |
| Net margin and valuation on financial instruments | | | 756,167 | | | | 550,752 | | | | 37.30 | % |
| Total net provisions | | | (82,344 | ) | | | 69,703 | | | | -218.14 | % |
| Net interest and valuation income after provision for loans and financial leases | | | 673,823 | | | | 620,455 | | | | 8.60 | % |
| Revenues (Expenses) from transactions with other operating segments of the Bank | | | (6,098 | ) | | | (1,831 | ) | | | 233.04 | % |
| Total fees and income from services, net | | | 136,372 | | | | 140,189 | | | | -2.72 | % |
| Other operating income | | | 173,575 | | | | 86,325 | | | | 101.07 | % |
| Total income net | | | 977,672 | | | | 845,138 | | | | 15.68 | % |
| Total operating expenses | | | (656,172 | ) | | | (528,764 | ) | | | 24.10 | % |
| Profit before tax | | | 321,500 | | | | 316,374 | | | | 1.62 | % |
| Segment assets | | | 27,895,156 | | | | 20,099,028 | | | | 38.79 | % |
Analysis of 20112015 versus 2010.2014.
In 2011,2015, profit before taxes for the Pension and Insurance segmentBanking Panama increased 54%by 1.62% to COP 18321 billion.
Net commissions, which are the main revenue generators, decreased 100% to zero, due to the sale of AFP Crecer. The sale of AFP Crecer was authorizedTotal interest and valuation increased by regulators in Colombia and El Salvador in 2011 and the transaction generated a gain of COP 138 billion. As a result of this transaction, neither revenues nor expenses related to pension plan administration were recognized in 2011.
Operating expenses decreased 69%38.6% to COP 311,119 billion, due to lowera growth in the loan portfolio mainly in commercial and consumer loans, as well as a greater increase in leasing and debt investments.
Total net provisions were COP 82 billion, compared with COP -69 billion for 2014. In 2014, the loans recoveries were higher than the provision charges in COP 60 billion. In 2015, the loan recoveries decreased by 8.6% while the provision charges grew by 47%.
Total operating expenses grew by 24.1% to COP 656 billion, mainly due to increased personnel, administrative and laborgeneral expenses. Also, the appreciation of the U.S. dollar versus the Colombian Peso during 2015 contributed to the increase.
Net fees and income from services decreased by 2.7% to COP 136 billion due to higher commission expenses.
Assets attributable to Pension and Insurance decreased 25%Banking Panama increased by 38.8% during the year, mainly drivenyear. This increase is explained by the saleorganic growth of AFP Crecer.
the loan portfolio and the strengthening of the U.S. dollar versus the Colombian Peso which caused dollar denominated assets represent more pesos when converted.
All Other:This segment includes results from the operationsoperation of particular investment vehicles of Bancolombia: Valores Simesa S.A., BIBA Inmobiliaria S.A.S., Inversiones CFNS S.A.S., CFNS Infraestructura S.A.S., Sistema de Inversiones y Negocios S.A. Sinesa, Vivayco S.A.S., Banagrícola, S.A., Inversiones Financieras Banco Agrícola S.A., Fondo Inmobiliario Colombia and others.
Year ended December 31,
| | | 2012 | | | 2011 | | | 2010 | | | Change 2012-2011 | | | Change 2011-2010 | |
| | | (COP in million) | | | | | | | |
| Net Interest income | | | 1,353 | | | | 1,806 | | | | 680 | | | | (25.08) | % | | | 165.59 | % |
| Net provisions | | | 15,434 | | | | (37,211) | | | | (181) | | | | (141.48) | % | | | 204.59 | % |
| Net commissions | | | (979) | | | | (40) | | | | 840 | | | | 23.48 | % | | | (104.76) | % |
| Other net revenues | | | 380,476 | | | | 373,091) | | | | 100,036 | | | | 1.98 | % | | | 272.96 | % |
| Total Operating Income | | | 396,284 | | | | 337,646 | | | | 101,375 | | | | 17.37 | % | | | 233.07 | % |
| Operating expenses | | | 40,994 | | | | 20,641 | | | | 25,343 | | | | 98.60 | % | | | (18.55) | % |
| Non-operating income (expense) | | | (2,882) | | | | (7,404) | | | | 19,814 | | | | (61.08) | % | | | (137.37) | % |
| Income before income taxes | | | 352,408 | | | | 309,601 | | | | 95,846 | | | | 13.83 | % | | | 223.02 | % |
| Income tax expense | | | (25,895) | | | | (31,631) | | | | (5,856) | | | | (18.13) | % | | | 440.15 | % |
| Segment profit | | | 326,513 | | | | 277,970 | | | | 89,990 | | | | 17.46 | % | | | 208.89 | % |
| Segment assets | | | 785,806 | | | | 1,852,144 | | | | 1,529,612 | | | | (57.57) | % | | | 21.09 | % |
| | | Year ended December 31, | |
| | | 2015 | | | 2014 | | | Change 2015-2014 | |
| | | (in millions of COP) | |
| Total interest and valuation | | | 2,425 | | | | 13,730 | | | | -82.34 | % |
| Interest expenses | | | (40,700 | ) | | | (32,783 | ) | | | 24.15 | % |
| Net margin and valuation on financial instruments | | | (38,275 | ) | | | (19,053 | ) | | | 100.89 | % |
| Total net provisions | | | (24 | ) | | | (1,515 | ) | | | -98.42 | % |
| Net interest and valuation income after provision for loans and financial leases | | | (38,299 | ) | | | (20,568 | ) | | | 86.21 | % |
| Revenues (Expenses) from transactions with other operating segments of the Bank | | | (975 | ) | | | (18,050 | ) | | | -94.60 | % |
| Total fees and income from services, net | | | 10,994 | | | | (5,155 | ) | | | -313.27 | % |
| Other operating income | | | 81,286 | | | | 20,789 | | | | 291.00 | % |
| Total income net | | | 53,006 | | | | (22,984 | ) | | | -330.62 | % |
| Total operating expenses | | | (62,228 | ) | | | (50,865 | ) | | | 22.34 | % |
| Profit before tax | | | (9,222 | ) | | | (73,849 | ) | | | -87.51 | % |
| Segment assets | | | 2,438,368 | | | | 2,160,855 | | | | 12.84 | % |
Analysis of 20122015 versus 2011.2014.
In 2012,2015, profit before taxes for All Other increased 17%decreased by 87.5% to COP 3279 billion.
Other net revenue,operating income, which is the most significant revenue line, increased 2%by 291% to COP 380 billion. The increase is explained by higher dividends received81 billion, driven by the companies that composegrowth in revenues of real estate investment and the segment.
Net recoveries totaled COP 15 billion, due mainly to reversalsstrengthening of provisions related to investments by Inversiones CFNS in BVC (Bolsa de Valores de Colombia), Grupo Odinsa and Enka.
Operating expenses increased 99% to COP 41 billion, due to mark to market losses on investments in equity securities.the U.S. dollar versus the Colombian Peso.
Assets attributable to All Other declined 58%increased by 12.8% during the year. This reduction is explainedyear, driven by the transferincrease in the value of assets and investments in equities to the Investment Banking segment and transactions between.
Analysis of 2011 versus 2010.
In 2011, profit for All Other increased 209% to COP 278 billion.
Other net revenue, which is the most significant revenue line, increased 273% to COP 373 billion. The increase is explained by higher dividends received by the companies that compose the segment.
Net provision charges increased 204.59% to COP 37 billion, due mainly to provisions related to investments by Inversiones CFNS in BVC (Bolsa de Valores de Colombia), Grupo Odinsa and Enka.
Operating expenses decreased 19% to COP 21 billion, due to lower amortization charges. The decrease was mainly explained by the absence of goodwill amortizations attributable of AFP Crecer, due to the sale of this entity in 2011.
Assets attributable to All Other grew 21% during the year.
investments.
| B. | LIQUIDITY AND CAPITAL RESOURCES |
| B.1. | LIQUIDITY AND FUNDING |
Market Scenario
Macroeconomic policies established by Colombia’sThe Colombian Central Bank impact directlygradually increased the liquidity levelsreference rate 25 basis points per month from September to December 31, 2015 after more than a year of stability, for a total increase of 125 basis points during 2015. The reference rate stood at 5.75%. The change in the macroeconomic policy was due to increasing inflation throughout the second half of the financial system. Duringyear, reaching 6.77% (annual variation) for the first semesterfull year 2015, a level which was 277 basis points above the upper limit of 2012,the target range of the Central Bank raised its reference rate by 50 basis points(2% - 4%).
This upward trend in inflation was mainly due to the high economic growth observed during 2011. However, lower global economic growth started to impact Colombia’s economic performance“El Niño” weather phenomenon and the Colombian peso devaluation pass-through that impacted tradable goods and services. Higher inflation is addressed by the Central Bank by increasing its monetary policy rate, decreased 129 basis points as comparedwhich tends to reduce the variationmoney supply in the aggregated price leveleconomy, therefore, exacerbating competition for deposits.
Additionally, during 2015 the Colombian economy started a process of 2011 (3.73%)deceleration which hadwas characterized by a stagnation of the internal demand, especially in concern to aggregate demand and government spending, and a considerable decreasing in net exports. Also, the labor market weakened, which led to a changedeceleration in monetary policy; consequently,private consumption.
For all of the Central Bank decided to reduceabove reasons, the reference rate by 100 basis points duringcost of funding the second semester of 2012. At year end 2012 the Central Bank reference rate was 50 basis points lower than at year end 2011. Even though monetary policy’s objective aimed to improve credit conditions by means of lower interest rates, the Government’s budget execution was slow, liquidity levels were relatively low, and, as a consequence, the mentioned reductionBank’s liabilities increased in the reference interest rate did not have an immediate impact inlast quarter of 2015; nevertheless, the financial system’s cost of funding. The Bank continued to have a strong liquidity position and thecomplied with internal and regulatory limits were assured.limits.
Liquidity Management
The “ALCO”, Asset and Liability Management Committee, or ALCO, defines the main policies of liquidity and funding of the Bank in accordance with the Bank’s desired balance sheetstatement of financial position structure.
The Bank uses a variety of funding sources to generate liquidity, taking into consideration market conditions, interest rates, liquidity needs and the desired maturity profile of funding instruments. Consequently, policies are designed to achieve an optimal match between assets and liabilities profile regarding maturities, interest rates and currency exposure.
One of the Bank’s main strategies is to maintain a solid liquidity position, thus, the ALCO has established a minimum amount of liquid assets, calculated in relative terms to the total assets,based on calculations of maximum expected withdrawals of deposits, disbursements and other obligations in order to guarantee the proper operation of banking activities such as lending and withdrawals of deposits, protect capital and take advantage of market opportunities.capital. The ALCO has delegated the short termshort-term liquidity assessment task to the Liquidity Committee, which revises strategies and policies regarding liquidity.
Stress tests scenarios are simulated periodically to guarantee the Bank has sufficient time to raise funds under adverse market conditions. In addition, the Bank has defined a contingency liquidity plan that allows the organization to raise funds under stressstressed market scenarios.
Liquid Assets
During 2012,2015, the Bank maintained a solid liquidity position. As mentioned above, the Bank seeks the optimum level of liquid assets to assure not only the proper daily operation of banking activities but also to operate under stress market scenarios.
The following table shows the composition of the liquid assets in the last threetwo years:
| | | As of December 31; | |
| | | COP million | |
| | | 2012 | | | 2011 | | | 2010 | |
| | | | | | | | | | |
| Cash | | | 3,103,537 | | | | 2,934,313 | | | | 2,356,851 | |
| | | | | | | | | | | | | |
| Central Bank | | | 2,005,573 | | | | 2,572,056 | | | | 2,003,580 | |
| | | | | | | | | | | | | |
| Cash financial institutions | | | 1,930,000 | | | | 1,255,640 | | | | 873,558 | |
| | | | | | | | | | | | | |
| Debt securities | | | | | | | | | | | | |
| Government debt | | | | | | | | | | | | |
| Trading | | | 5,915,567 | | | | 3,059,151 | | | | 1,663,559 | |
| Available for sale | | | 677,238 | | | | 713,120 | | | | 806,220 | |
| Held to maturity | | | 2,158,107 | | | | 2,195,953 | | | | 2,089,337 | |
| | | | | | | | | | | | | |
| Financial Institutions | | | | | | | | | | | | |
| Trading | | | 429,244 | | | | 571,488 | | | | 446,923 | |
| | | | | | | | | | | | | |
| Total Liquid Assets | | | 16,219,266 | | | | 13,301,721 | | | | 10,240,028 | |
| | | As of December 31, | |
| | | 2015 | | | 2014 | |
| | | (in millions of COP) | |
| | | | | | | |
| Cash | | | 5,806,159 | | | | 3,908,866 | |
| Cash at central Bank | | | 3,714,428 | | | | 3,191,069 | |
| Cash financial institutions | | | 4,709,861 | | | | 3,965,968 | |
| Debt securities | | | | | | | | |
| Government debt | | | | | | | | |
| Fair value through profit and losses | | | 8,133,401 | | | | 8,169,564 | |
| Amortized cost | | | 2,671,540 | | | | 1,613,630 | |
| Financial institutions | | | | | | | | |
| Fair value through profit and losses | | | 1,358,117 | | | | 1,301,888 | |
| Amortized cost | | | 385,823 | | | | 237,501 | |
| | | | | | | | | |
| Total Liquid Assets | | | 26,779,329 | | | | 22,388,486 | |
The Bank measures liquid assets on a daily basis and compares this result withto an objective target of minimum requirements defined by the ALCO. Under this rule, daily liquid assets must be equal to or higher than this target. In the event the limit is not reached, there is a 5-dayfive-day period to increase liquidity levels.
Cash is important to guarantee the operation in branchesbranch and ATM´s.ATM operations. The Bank´sBank’s expansion across the Colombian territory requires considerable levels of cash; however, cash levels are daily monitored in order to minimize opportunity costs. Additionally, cash is taken into account in the mandatory bank reserve established by the Central Bank.
The levels of cash at major Central Bank’sBanks have a relationship with mandatory bank reserves associated with the growth of demand and time deposits.
Debt securities in the table shown are not affected by haircuts. Securities that comprise liquid assets are reviewed by the ALCO in light of the Bank’s liquidity objective. Even though available for sale and held to maturity debt securities cannot be sold, they can be pledged as collateral in repurchase agreements someagreements. Some of them are mandatory investments that are received by the Central BanksBank as collateral. A portion of them, mainly CEDEL (Liquidity Certificates issued by El Salvador Central Bank) constitute legal reserve. These investments are taken into account as liquid assets since they are used for what the Bank has defined as its liquidity needs which includes mandatory legal reserve.
During 2012, theThe SFC enhanced liquidity regulation and required eachrequires financial entityentities to have liquid assets greater than the contractual liquidity accumulative one-month-gap.one-month gap. This contractual gap includesreflects the maturity of assets and liabilities of the current positions and does not includereflect projections of future operations. The loan portfolio is affected by the historical default indicator and the maturity of deposits is modeled according to the regulation. All of Bancolombia’s Colombian banking subsidiaries met this regulatory limit throughout the year.
The Bank’s management believes that the current level of liquidity is adequate and will seek to maintain its solid deposit base and the access to alternative sources of funding such as borrowings from domestic development banks, securitizations, repurchase agreements, bond issuances, overnight funds and Central Bank funds, in light of market conditions, interest rates and the desired maturity profile of liabilities.
Funding Structure
As of December 31, 2012,2015, the Bank’s liabilities reached COP 86,309172.6 billion, increasing 12.9% asa 30.6% increase compared to the end of 2011. Liabilities denominated2014. The funding composition changed, with increases in pesos, which represent 82.3% of total liabilities, increased 34.9% as compared to the end of 2011, while liabilities denominated in U.S. dollars totaledand Colombian Pesos by almost 39.4 and 23.4 percentage points, respectively. This change was mainly explained by the COP 15,310 billion, decreasingdevaluation, which was 31.6% during 2015, and also by 35.8% as compared to the endincrease in checking accounts, savings accounts, time deposits, COP derivative financial instruments (liabilities), USD borrowings from financial institutions and the issue of 2011. Bank acceptances outstanding and derivatives had a significant change year to year. This position changed the funding structure, decreasing dollar and increasing peso funding liabilities. See Item 18. Financial Statements, see note (8) Customers’ Acceptances and Derivatives. If bank acceptances and derivatives are not considered, liabilities denominated in pesos increased 17.9% while liabilities denominated in U.S. dollars decreased 0.4%.USD debt securities.
| | | 2012 | | | 2011 | | | 2010 | |
| Total funding | | | | | | | | | | | | |
| Peso-denominated | | | 70,999,782 | | | | 52,639,400 | | | | 43,939,802 | |
| Dollar-denominated | | | 15,309,643 | | | | 23,830,260 | | | | 16,208,214 | |
| Total Liabilities | | COP | 86,309,425 | | | COP | 76,469,660 | | | COP | 60,148,016 | |
| | | As of December 31, | |
| | | 2015 | | | 2014 | |
| | | (in millions of COP, except percentages) | |
| Total funding | | | | | | | | |
| Peso-denominated | | | 91,418,612 | | | | 74,061,263 | |
| Dollar-denominated. | | | 81,146,336 | | | | 58,202,138 | |
| Total Liabilities | | | 172,564,948 | | | | 132,263,401 | |
In 2012,2015, the Bank experienced significanta growth in deposits which reached COP 64,159121.80 billion at year end,year-end, an increase of COP 11,72427.03 billion, 22% asand 28.5% compared to 2011.2014. COP denominated deposits had a 13.25% increase while USD denominated deposits increased 59.9% where, as explained above, the COP devaluation during 2015 and the increase in checking accounts, savings accounts and time deposits contributed to this growth. The ratio of deposits to total assets was 65%63.12%, representing an increase from 61% in 2011.decreasing by 0.22% compared to 2014.
| | | 2012 | | | 2011 | | | 2010 | |
| Total Deposits | | COP | 64,158,720 | | | COP | 52,434,492 | | | COP | 43,538,967 | |
| | | As of December 31, | |
| | | 2015 | | | 2014 | |
| | | (in millions of COP) | |
| Total Deposits | | | 121,802,028 | | | | 94,769,319 | |
The following table sets forth checking accounts, savings accounts and time deposits as a percentage of the Bank’s total liabilities for the years 2012, 20112015 and 2010:2014:
| | | 2012 | | | 2011 | | | 2010 | | | 2015 | | | 2014 | |
| Checking deposits | | | 13.0 | % | | | 13.4 | % | | | 15.9 | % | | | 13.7% | | | | 13.7% | |
| Time deposits | | | 28.5 | % | | | 23.5 | % | | | 25.4 | % | | | 28.2% | | | | 27.3% | |
| Saving deposits | | | 31.4 | % | | | 30.4 | % | | | 30.1 | % | |
| Savings deposits | | | | 27.7% | | | | 29.6% | |
| Other deposits | | | 1.4 | % | | | 1.2 | % | | | 1.0 | % | | | 1.0% | | | | 1.0% | |
| Percentage of Total Liabilities | | | 74.3 | % | | | 68.5 | % | | | 72.4 | % | | | 70.6% | | | | 71.6% | |
The Bank’s principal sources of funding are deposits, which are mainly composed of checking accounts, time deposits and savings accounts. Time deposits had an important growth as percentage of total liabilities which improved the funding position.
Deposits as a percentage of the Bank’s total liabilities in 20122015 were 74.3%70.4%, increasingdecreasing from 68.5%71.4% of total liabilities at year end 2011. year-end 2014.
The ratio of net loans to deposits (including borrowingsborrowing from development banks)commercial banks and other non-financial entities) was 99%99.19% at the end of 2012,2015, decreasing from 105% at year end 2011.101.62% as compared to 2014. This change is primarily explained by decreasesthe increase in interbank credits denominateddollar-denominated borrowings from other financial institutions, which rose from USD 3,069 million in U.S. dollars and2014 to USD 4,625 million in repurchase agreements and interbank funds in pesos, due to a higher deposit growth than that observed in the loan portfolio.2015.
| | | 2012 | | | 2011 | | | 2010 | |
| Net Loans to Deposits | | | 99 | % | | | 105 | % | | | 100 | % |
| | | As of December 31, | |
| | | 2015 | | | 2014 | |
| Net Loans to Deposits | | | 99.19% | | | | 101.62% | |
The Bank also used borrowings from domestic development banks which amounted to COP 3,4685.15 billion at the end of 20122015 and represented a good quality source of funding provided mainly by Governmentalgovernmental entities in order to promote lending activities within specific sectors of the Colombian economy. This funding source is fully matched with related loans in terms of maturity and interest rate indexation.
In addition to the main sources of funding described above, the Bank uses: (i) itsuses borrowings from other financial institutions and issued debt securities portfolio as a source of short-term liquidity by engaging in repurchase agreements transactions, overnight-loan funds and the Central Bank’s funds and (ii) the issuance of bonds on a regular basis to reduce the maturity mismatch between assets and liabilities, reducing the liquidity risk.securities.
Long TermLong-Term Debt
During 2012, the Bank obtained new funds from the issuance of notes with an aggregate principal amount of COP 2,822 billion.
On September 4, 2012, Bancolombia issued an aggregate principal amount of USD 1,200 million in subordinated notes due 2022 with a coupon rate of 5.125% in the international markets. On September 10, 2012, Bancolombia offered to exchange USD 400 million of its subordinated notes due in 2017 that were issued in May 2007 with a coupon rate of 6.87%, into new subordinated notes due 2022. USD 200 million were exchanged into subordinated notes due 2022 with a coupon rate of 5.125% and a market value of USD 227 million. Taken together, these transactions extended the average maturity of the Bank’s subordinated debt, thereby strengthening its Tier II capital in the coming years, and reduced the Bank’s annual interest expense.
Likewise,In 2015, Leasing Bancolombia Tuya and Banco Agrícola also issued notes;notes in amounts of COP 600 billion, COP 45 billion,450,000 million and USD 31300 million, respectively.
Additionally, Grupo Agromercantil issued notes in an amount of COP 7,118 million during 2015.
As of December 31, 2012,2015, the total outstanding aggregate principal amount of bonds issued by the Bank was COP 12,05919.43 billion.
The following table shows Bancolombia’s long termlong-term debt maturity profile:profile (in millions COP):
| | | 2013 | | | 2014 | | | 2015 | | | 2016 | | | 2017 | | | 2018 and
thereafter | | | Total | |
| Long Term Debt | | | 1,094,261 | | | | 800,714 | | | | 315,782 | | | | 1,155,622 | | | | 447,142 | | | | 8,245,698 | | | | 12,059,219 | |
| | | 2016 | | | 2017 | | | 2018 | | | 2019 | | | 2020 | | | 2021 and
thereafter | | | Total | |
| | | (in millions of COP) | |
| Long-Term Debt | | | 1,624,493 | | | | 960,268 | | | | 936,581 | | | | 1,606,473 | | | | 3,365,909 | | | | 10,942,141 | | | | 19,435,865 | |
The following table sets forth the components of the Bank’s liabilities for the years 2012, 20112015 and 2010:2014:
| As of December 31, |
| | | 2012 | | | % of total
funding | | | 2011 | | | % of total
funding | | | 2010 | | | % of total
funding | |
| (COP million, except percentages) |
| Checking deposits | | | | | | | | | | | | | | | | | | | | | | | | |
| Peso-denominated | | COP | 9,185,435 | | | | 10.6 | % | | COP | 7,910,046 | | | | 10.3 | % | | COP | 7,275,904 | | | | 12.1 | % |
| U.S. dollar-denominated | | | 2,113,466 | | | | 2.4 | % | | | 2,383,848 | | | | 3.1 | % | | | 2,280,029 | | | | 3.8 | % |
| Total | | | 11,298,901 | | | | 13.0 | % | | | 10,293,894 | | | | 13.4 | % | | | 9,555,933 | | | | 15.9 | % |
Time deposits | | | | | | | | | | | | | | | | | | | | | | | | |
| Peso-denominated | | | 18,550,309 | | | | 21.3 | % | | | 12,307,011 | | | | 16.1 | % | | | 9,215,754 | | | | 15.3 | % |
| U.S. dollar-denominated | | | 6,217,180 | | | | 7.2 | % | | | 5,666,106 | | | | 7.4 | % | | | 6,054,517 | | | | 10.1 | % |
| Total | | | 24,767,489 | | | | 28.5 | % | | | 17,973,117 | | | | 23.5 | % | | | 15,270,271 | | | | 25.4 | % |
| Savings deposits | | | | | | | | | | | | | | | | | | | | | | | | |
| Peso-denominated | | | 24,251,374 | | | | 28.1 | % | | | 20,722,989 | | | | 27.2 | % | | | 15,794,026 | | | | 26.3 | % |
| U.S. dollar-denominated | | | 2,862,540 | | | | 3.3 | % | | | 2,540,062 | | | | 3.3 | % | | | 2,266,843 | | | | 3.8 | % |
| Total | | | 27,113,914 | | | | 31.4 | % | | | 23,263,051 | | | | 30.5 | % | | | 18,060,869 | | | | 30.1 | % |
| Other deposits | | | | | | | | | | | | | | | | | | | | | | | | |
| Peso-denominated | | | 577,613 | | | | 0.7 | % | | | 620,206 | | | | 0.8 | % | | | 507,002 | | | | 0.8 | % |
| U.S. dollar-denominated | | | 400,803 | | | | 0.5 | % | | | 284,224 | | | | 0.4 | % | | | 144,892 | | | | 0.2 | % |
| Total | | | 978,416 | | | | 1.2 | % | | | 904,430 | | | | 1.2 | % | | | 651,894 | | | | 1.0 | % |
| Interbank Borrowings | | | | | | | | | | | | | | | | | | | | | | | | |
| Peso-denominated | | | - | | | | - | | | | - | | | | - | | | | - | | | | - | |
| U.S. dollar-denominated | | | 1,803,665 | | | | 2.1 | % | | | 4,130,915 | | | | 5.4 | % | | | 2,698,941 | | | | 4.5 | % |
| Total | | | 1,803,665 | | | | 2.1 | % | | | 4,130,915 | | | | 5.4 | % | | | 2,698,941 | | | | 4.5 | % |
| Funds purchased and securities sold under agreements to repurchase | | | | | | | | | | | | | | | | | | | | | | | | |
| Peso-denominated | | | 44,935 | | | | 0.1 | % | | | 1,769,352 | | | | 2.3 | % | | | 1,784,060 | | | | 3.0 | % |
| U.S. dollar-denominated | | | - | | | | - | | | | 185,200 | | | | 0.2 | % | | | 174,786 | | | | 0.3 | % |
| Total | | | 44,935 | | | | 0.1 | % | | | 1,954,552 | | | | 2.5 | % | | | 1,958,846 | | | | 3.3 | % |
| Domestic development banks Borrowings and other(1) | | | | | | | | | | | | | | | | | | | | | | | | |
| Peso-denominated | | | 3,410,476 | | | | 4.0 | % | | | 3,255,485 | | | | 4.3 | % | | | 2,479,778 | | | | 4.1 | % |
| U.S. dollar-denominated | | | 57,367 | | | | 0.1 | % | | | 72,526 | | | | 0.1 | % | | | 71,868 | | | | 0.1 | % |
| Total | | | 3,467,843 | | | | 4.1 | % | | | 3,328,011 | | | | 4.4 | % | | | 2,551,646 | | | | 4.2 | % |
| Bank acceptances outstanding and derivatives | | | | | | | | | | | | | | | | | | | | | | | | |
| Peso-denominated | | | 6,350,706 | | | | 7.4 | % | | | (2,193,632 | ) | | | (2.9 | )% | | | 911,353 | | | | 1.5 | % |
| U.S. dollar-denominated | | | (5,725,074 | ) | | | (6.6 | )% | | | 2,707,607 | | | | 3.5 | % | | | (265,979 | ) | | | (0.4 | )% |
| Total | | | 625,632 | | | | 0.8 | % | | | 513,975 | | | | 0.6 | % | | | 645,374 | | | | 1.1 | % |
| Long term debt | | | | | | | | | | | | | | | | | | | | | | | | |
| Peso-denominated | | | 4,981,776 | | | | 5.8 | % | | | 4,977,962 | | | | 6.5 | % | | | 3,332,068 | | | | 5.5 | % |
| U.S. dollar-denominated | | | 7,077,443 | | | | 8.2 | % | | | 5,331,021 | | | | 7.0 | % | | | 2,386,308 | | | | 4.0 | % |
| Total | | | 12,059,219 | | | | 14.0 | % | | | 10,308,983 | | | | 13.5 | % | | | 5,718,376 | | | | 9.5 | % |
| Other liabilities | | | | | | | | | | | | | | | | | | | | | | | | |
| Peso-denominated | | | 3,647,157 | | | | 4.2 | % | | | 3,269,981 | | | | 4.3 | % | | | 2,639,857 | | | | 4.4 | % |
| U.S. dollar-denominated | | | 502,254 | | | | 0.6 | % | | | 528,751 | | | | 0.7 | % | | | 396,009 | | | | 0.6 | % |
| Total | | | 4,149,411 | | | | 4.8 | % | | | 3,798,732 | | | | 5.0 | % | | | 3,035,866 | | | | 5.0 | % |
| Total funding | | | | | | | | | | | | | | | | | | | | | | | | |
| Peso-denominated | | | 70,999,782 | | | | 82.2 | % | | | 52,639,400 | | | | 68.9 | % | | | 43,939,802 | | | | 73.0 | % |
| Dollar-denominated | | | 15,309,643 | | | | 17.8 | % | | | 23,830,260 | | | | 31.1 | % | | | 16,208,214 | | | | 27.0 | % |
| Total Liabilities | | COP | 86,309,425 | | | | 100 | % | | COP | 76,469,660 | | | | 100 | % | | COP | 60,148,016 | | | | 100 | % |
| | | As of December | |
| | | 2015 | | | % of total
funding | | | 2014 | | | % of total
funding | |
| | | (in millions of COP, except percentages) | |
| Checking accounts | | | | | | | | | | | | | | | | |
| Peso-denominated | | | 12,822,977 | | | | 7.4 | % | | | 11,790,442 | | | | 8.9 | % |
| Dollar-denominated | | | 10,823,601 | | | | 6.3 | % | | | 6,356,583 | | | | 4.8 | % |
| Total | | | 23,646,578 | | | | 13.7 | % | | | 18,147,025 | | | | 13.7 | % |
| Time deposits | | | | | | | | | | | | | | | | |
| Peso-denominated | | | 24,152,124 | | | | 14.0 | % | | | 20,326,579 | | | | 15.4 | % |
| Dollar-denominated | | | 24,561,665 | | | | 14.2 | % | | | 15,778,517 | | | | 11.9 | % |
| Total | | | 48,713,789 | | | | 28.2 | % | | | 36,105,096 | | | | 27.3 | % |
| Savings accounts | | | | | | | | | | | | | | | | |
| Peso-denominated | | | 34,451,787 | | | | 20.0 | % | | | 30,800,217 | | | | 23.3 | % |
| Dollar-denominated | | | 13,361,893 | | | | 7.7 | % | | | 8,329,782 | | | | 6.3 | % |
| Total | | | 47,813,680 | | | | 27.7 | % | | | 39,129,999 | | | | 29.6 | % |
| Other deposits | | | | | | | | | | | | | | | | |
| Peso-denominated | | | 826,557 | | | | 0.5 | % | | | 881,689 | | | | 0.7 | % |
| Dollar-denominated | | | 801,424 | | | | 0.5 | % | | | 505,510 | | | | 0.4 | % |
| Total | | | 1,627,981 | | | | 1.0 | % | | | 1,387,199 | | | | 1.0 | % |
| Interbank Deposits | | | | | | | | | | | | | | | | |
| Peso-denominated | | | 5,516 | | | | 0.0 | % | | | (2,577 | ) | | | 0.0 | % |
| Dollar-denominated | | | 394,546 | | | | 0.2 | % | | | 378,535 | | | | 0.3 | % |
| Total | | | 400,062 | | | | 0.2 | % | | | 375,958 | | | | 0.3 | % |
| Derivate financial insntrument-Liabilities | | | | | | | | | | | | | | | | |
| Peso-denominated | | | 1,882,322 | | | | 1.1 | % | | | (5,626,021 | ) | | | -4.3 | % |
| Dollar-denominated | | | 48,287 | | | | 0.0 | % | | | 7,097,800 | | | | 5.4 | % |
| Total | | | 1,930,609 | | | | 1.1 | % | | | 1,471,779 | | | | 1.1 | % |
| Borrowings from other financial institutions(1) | | | | | | | | | | | | | | | | |
| Peso-denominated | | | 5,153,378 | | | | 3.0 | % | | | 4,184,213 | | | | 3.2 | % |
| Dollar-denominated | | | 14,567,806 | | | | 8.4 | % | | | 9,668,071 | | | | 7.3 | % |
| Total | | | 19,721,184 | | | | 11.4 | % | | | 13,852,284 | | | | 10.5 | % |
| Debt securities in issue | | | | | | | | | | | | | | | | |
| Peso-denominated | | | 5,222,568 | | | | 3.0 | % | | | 5,383,386 | | | | 4.1 | % |
| Dollar-denominated | | | 14,213,297 | | | | 8.3 | % | | | 9,144,017 | | | | 6.9 | % |
| Total | | | 19,435,865 | | | | 11.3 | % | | | 14,527,403 | | | | 11.0 | % |
| Repurchase agreements and other similar secured borrowing | | | | | | | | | | | | | | | | |
| Peso-denominated | | | 919,394 | | | | 0.5 | % | | | 1,777,276 | | | | 1.3 | % |
| Dollar-denominated | | | 313,062 | | | | 0.2 | % | | | 114,683 | | | | 0.1 | % |
| Total | | | 1,232,456 | | | | 0.7 | % | | | 1,891,959 | | | | 1.4 | % |
| Other liabilities | | | | | | | | | | | | | | | | |
| Peso-denominated | | | 5,981,989 | | | | 3.5 | % | | | 4,546,059 | | | | 3.2 | % |
| Dollar-denominated | | | 2,060,755 | | | | 1.2 | % | | | 828,640 | | | | 0.8 | % |
| Total | | | 8,042,744 | | | | 4.7 | % | | | 5,374,699 | | | | 4.1 | % |
| Total funding | | | | | | | | | | | | | | | | |
| Peso-denominated | | | 91,418,612 | | | | 53.0 | % | | | 74,061,263 | | | | 55.8 | % |
| Dollar-denominated | | | 81,146,336 | | | | 47.0 | % | | | 58,202,138 | | | | 44.2 | % |
| Total Liabilities | | | 172,564,948 | | | | 100 | % | | | 132,263,401 | | | | 100 | % |
| (1) | Includes borrowings from commercial banks and other non-financial entities. |
Consolidated Statement of Cash Flows
Cash flows for the Bank include net cash used inprovided by (used in) operating activities, net cash used inprovided by (used in) investing activities and net cash provided by (used in) financing activities. The following table shows those flows for the years ended December 31, 2012, 20112015 and 2010:2014:
| | | 2012 | | | 2011 | | | 2010 | | | 2015 | | | 2014 | |
| | | (COP million) | | | (in millions of COP) | |
| | | | | | | |
| Operating activities | | COP | 1,806,456 | | | COP | (3,939,094 | ) | | COP | (3,066,491 | ) | | | 1,856,726 | | | | (6,667,416 | ) |
| Investing activities | | | (594,310 | ) | | | (519,572 | ) | | | (1,093,268 | ) | | | 141,985 | | | | 934,112 | |
| Financing activities | | | (502,754 | ) | | | 5,898,518 | | | | 3,047,868 | | | | (231,474 | ) | | | 1,630,077 | |
| Net increase in cash and cash equivalents | | COP | 709,392 | | | COP | 1,439,852 | | | COP | (1,111,891 | ) | | | 1,767,237 | | | | (4,103,227 | ) |
During 2012,2015, the Bank reported a positive net cash flow that increased the stock of cash and cash equivalents available by COP 7091,767 billion. This result is explained by COP 1,8061,856 billion provided by operating activities, COP 503142 billion provided by investing activities and COP 594231 billion were used in financing activities and investing activities, respectively. The variations of operating, investing and financing activities are explained below:activities.
Operating Activities
During 2012,In 2015, operating activities provided cash;liquidity; deposits and other liabilities increased byto COP 12,6959.80 billion, the loan portfolio used liquidity byinterest received provided COP 10,91912.21 billion and an increasethe change in trading investmentsinvestment securities recognized at fair value through profit and losses was COP 1.72 billion. Loans increased to COP 15.04 billion and the interest paid used cashCOP 3.78 billion of COP 2,338 billion.cash.
Net income has been positive; COP 1,702 billion, COP 1,6642.61 billion and COP 1,4362.43 billion for 2012, 2011,2015 and 2010,2014, respectively.
Investing Activities
Investing Activities
During 2012,In 2015, investing activities usedprovided cash; purchasepurchases of property, plant and equipment increased by COP 951 billion, held to maturity debt securities and available for sale securities decreased by COP 338 billion and COP 328 billion, respectively, and the technological renewal programat amortized cost used COP 94 billion.
The bank classifies part of its investments as available for sale and held to maturity in order to manage interest rate risk; a portion of these investments are mandatory, others are securitizations. Held to maturity and available for sale debt securities decreased during 2012 and 2011 by COP 6661.77 billion and COP 802 billion respectively. This diminution is associated with the maturity of securitizations.
Net purchases of property, plant and equipment for 2012, 2011 and 2010, including operating leases which are partused COP 961,827 million; while proceeds from maturities of debt securities provided COP 1.71 billion.
In December 2015 Grupo Bancolombia moved to a 60% ownership of Grupo Agromercantil Holding because of the leasing business, increased by COP 951 billion, COP 1,098 billiondecision to purchase an additional 20% stake. This transaction provided Grupo Bancolombia with the control of this Guatemalan holding and COP 546 billion, respectively. Of these amounts, 100%, 45% and 49%, respectively, correspondedalso the obligation to operating leases.consolidate the financial information of both banks when reporting to any regulator or other entity.
The Bank has made investmentspurchase of the mentioned 20% of Grupo Agromercantil Holding provided COP 783,803 million as a result of the high level of cash it had at the time of this acquisition. The amount paid for this proportion was COP 477,145 million, while the amount of cash and equivalents this holding had in December 2015 was COP 1.26 billion.
The investing activities related to equity securities at fair value through other comprehensive income and the technological renewal program. During 2012, 2011 and 2010,ones related to joint ventures provided a net cash value of COP 94 billion, COP 130 billion,12,359 million and COP 101 billion, respectively, have been invested in this program.207,527 million during 2015, respectively. The actions related to property, plant and equipment used a net value of COP 672,106 million, while during 2014 the net value used was COP 296,619 million.
During 2012 and 2011 the bank received cash from the sale of Aseguradora Suiza Salvadoreña Subsidiary and AFP Crecer S.A. for COP 136 billion and COP 173 billion, respectively.
Financing Activities
Financing activities usedrequired cash during 2012;2015; the decrease in overnight funding was COP 898,652 million while borrowings and interbank borrowing decreased bylong-term debts provided COP 3,76713.53 billion whereas issuance placement of long term debt increased byand COP 2,195 billion. Preferred shares were issued providing cash of COP 1,652 billion.2.45 billion respectively. Cash was used in paying dividends to stockholders in the amount of COP 583 billion.785,332 million. Additionally, the repayment of borrowings and payments of long-term debt used COP 13.13 billion and COP 1.37 billion respectively.
Overnight and interbank borrowingsfunds are used to complement the Bank’s funding strategy. During 2012,The Bank decreased significantly this source of cash compared to 2014, where the high deposit growth and the issuance of long term debt changed the Bank´s funding composition; interbank borrowing and interbank lending decreased significantly. In 2011 and 2010, these sources of funding increased bywas COP 2,083 billion and COP 1,896 billion, respectively, due to the high demand for credit.17,488 million.
Structural fundingLong-term debt is also an important to manage liquidity and interest rate risk. Long term debt is part of the Bank’s funding structure. During 2012, 2011 and 2010,2015, the bank raised funds in amountlong-term debt financial activities provided a net cash value of COP 2,195 billion,1.079 billion. This value increased significantly as compared to 2014, where the net cash value used by long-term debt was COP 4,342 billion and COP 1,654 billion, respectively.299,317 million explained by the increase in placement of long term-debt.
Payments of dividends to stockholders has remained relatively constant,have increased at least in 2012, 2011line with inflation; in 2015 COP 785,332 million were distributed, while in 2014 this value was COP 713,679 million, representing 30% and 2010, COP 583 billion, COP 527 billion and COP 502 billion,29% of the Bank’s net income, respectively.
Capital Adequacy
The Bank and its subsidiaries comply with the capital adequacy requirements in their respective countries of operation.
Stockholders’ equity amounted to COP 11,60719,279 billion at the end of 2012,2015, up 29% as compared tofrom COP 8,99316,872 billion in stockholders’ equity at the end of 2011.2014. This increase is the net effect of paying out dividends, generating earnings during the year 2012, the capital increase of COP 1,652 billion that took place in February 20122014 and all the other transactions that directly affect the stockholders’ equity.
In addition,The Bank’s capital adequacy ratio on a consolidated basis the Bank’s capital adequacy ratio was 15.77%12.46% as of December 31, 2012, higher than the 12.46% at the end of 2011 and the 14.67% as of December 31, 2010.2015, down from 13.66% in 2014. The Bank’s capital adequacy ratio exceeded the requirements of the Colombian Governmentgovernment and the SFC by 677346 basis points. The basic capital ratio (Tier 1) was 10.39%7.51% and the tangible capital ratio, which is equal to the ratio of the difference between stockholders’ equity minusand goodwill and intangible assets divided byto tangible assets, was 10.63%6.41% at the end of 2012.2015. For a full description of our capital adequacy requirements, please see “ItemItem 4. Information“Information on the Company – B. Business Overview – B.7 – SupervisionB.8 –Supervision and Regulation”.
| TECHNICAL CAPITAL RISK WEIGHTED ASSETS | | As of December 31, | |
| Consolidated (COP million) | | 2012 | | | % | | | 2011 | | | % | | | 2010 | | | % | |
| Basic capital (Tier I) | | | 9,070,487 | | | | 10.39 | | | | 6,979,026 | | | | 8.99 | | | | 6,343,769 | | | | 10.32 | |
| Additional capital (Tier II) | | | 4,694,203 | | | | 5.38 | | | | 2,696,112 | | | | 3.47 | | | | 2,673,679 | | | | 4.35 | |
| Technical capital(1) | | | 13,764,690 | | | | | | | | 9,675,138 | | | | | | | | 9,017,448 | | | | | |
| Risk weighted assets included market risk | | | 87,262,916 | | | | | | | | 77,651,096 | | | | | | | | 61,449,661 | | | | | |
| CAPITAL ADEQUACY(2) | | | 15.77 | % | | | | | | | 12.46 | % | | | | | | | 14.67 | % | | | | |
The following table sets forth certain information regarding the Bank’s consolidated capital adequacy as of December 31, 2015 (computed considering balance accounts under IFRS) and 2014 (computed considering balance accounts under Colombian Banking GAAP):
| | (in millions of COP, except percentages) | |
| (1) | As of December 31, 2015 | |
| Long-term senior indebtedness | | COP | 11,831,968 | |
| Subscribed capital | | | 480,914 | |
| Legal reserve | | | 15,576,989 | |
| Unappropriated retained earnings | | | - | |
| Non-controlling interest | | | 627,654 | |
| Net Income | | | - | |
| Less: | | | | |
| Long-term investments | | | (191,435 | ) |
| Intangibles assets acquired after August 23, 2012 | | | (3,940,516 | ) |
| Treasury stock | | | (983 | ) |
| Primary capital (Tier I) | | COP | 12,552,623 | |
| Provisions for loans | | | - | |
| Subordinated bonds | | | 7,603,897 | |
| Other comprenhensive income related to investments at fair value | | | (32,325 | ) |
| Non-controlling interest | | | 493,591 | |
| Non-monetary inflation adjustment | | | | |
| Legal reserve | | | 203,725 | |
| Computed secondary capital (Tier II) | | | 8,268,888 | |
| Technical Capital(1) | | COP | 20,821,511 | |
| Capital Ratios | | | - | |
| Primary capital to risk-weighted asets (Tier I) | | | 7.51 | % |
| Secondary capital to risk-weighted asets (Tier II) | | | 4.95 | % |
| Risk-weighted assets included market risk | | | 167,168,400 | |
Technical capital is the sum of basic and additional capital. |
| to risk-weighted assets(2) | (2) | Capital adequacy is technical capital divided by risk weighted assets. | 12.46 | % |
(1)Technical capital is the sum of basic and additional capital.
(2)Capital adequacy is technical capital divided by risk weighted assets.
| | | (in millions of COP, except percentages) | |
| | As of December 31, 2014 | |
| Long-term senior indebtedness | | COP | 7,129,312 | |
| Subscribed capital | | | 480,914 | |
| Legal reserve | | | 13,674,305 | |
| Unappropriated retained earnings | | | (527,007 | ) |
| Minority interest | | | 240,681 | |
| Net Income | | | - | |
| Less: | | | | |
| Long-term investments | | | (806,501 | ) |
| Intangibles assets acquired after August 23, 2012 | | | (3,324,174 | ) |
| Treasury stock | | | (17,770 | ) |
| Deferred Income Taxes | | | - | |
| Non-monetary inflation adjustmet | | | - | |
| Translation of financial statements of foreign operations | | | (23 | ) |
| Primary capital (Tier I) | | | 9,720,425 | |
| Provisions for loans | | | 90,289 | |
| Subordinated bonds | | | 6,553,543 | |
| Reappraisal of assets | | | (28,846 | ) |
| Minority interest | | | 253,671 | |
| Non-monetary inflation adjustment | | | | |
| Legal reserve | | | 154,601 | |
| Computed secondary capital (Tier II) | | | 7,023,258 | |
| Technical Capital(1) | | COP | 16,743,683 | |
| Capital Ratios | | | | |
| Primary capital to risk-weighted asets (Tier I) | | | 7.71 | % |
| Secondary capital to risk-weighted asets (Tier II) | | | 5.58 | % |
| Risk-weighted assets included market risk | | | 126,020,585 | |
| Technical capital to risk-weighted assets(2) | | | 13.29 | % |
(1)Technical capital is the sum of basic and additional capital.
(2)Capital adequacy is technical capital divided by risk weighted assets.
| B.2. | FINANCIAL INSTRUMENTS AND TREASURY ACTIVITIES |
The Bank’s treasury division is able to carry out all transactions in local or foreign currencies that are legally authorized in Colombia. These include derivative transactions, purchase and sale of fixed income securities and indexed securities, repurchase or resale transactions, short sales, temporary securities transfers, simultaneous transactions and transactions on the foreign currency exchange market.
The Bank monitors treasury division activities through policies regarding management of liquidity, market, legal, credit and operational risks. Such policies are monitored by the Vice President of Risk Management. In order to be able to control market and liquidity risks, the Bank sets limits intended to keep its exposure levels and losses within certain ranges determined by the Bank’s boardBoard of directors.Directors. The Bank’s investment policies do not include restrictions regarding the maturity of the securities held in the portfolio, except those related to the liquidity portfolio.portfolio and over the counter (“OTC”) derivatives transactions.
Before taking any additional positions, the Bank’s treasury division also verifies, with respect to investments in local and in foreign currencies, the availability of funds for investment and each investment’s compatibility with the Bank’s liquidity structure.
As further described in “ItemItem 11. Quantitative“Quantitative and Qualitative Disclosure About Market Risk”, the market risk stated in the treasury book is measured using methodologies of value at risk (VaR),VaR, and the position limits are based on the results of these methodologies. The Bank has defined VaR limits that follow a hierarchical structure, which avoidavoids the concentration of market risk in certain groups of assets and also taketakes advantage of portfolio diversification. In addition to VaR limits, the Bank also uses stop loss advisories to inform senior management when losses are close to certain established thresholds in the trading book. Moreover, for the options portfolio, the Bank has set limits based on the sensitivity of the portfolio to the underlying volatility, foreign currency and interest rates.
As part of its operation,operations, the Bank holds cash and cash equivalents primarily in Colombian pesos and U.S. dollars. Nevertheless, thoseThose positions, as well as any other currency position, are determined by the treasury division in connection with the Bank’s currency risk assessment and management. Specifically, the Bank’s exposure to currency risk primarily arises from changes in the U.S. dollar/COP exchange rate. The exposure to currency risk is managed by the Bank’s treasury division. The Bank uses a VaR calculation to limit the exposure to currency risk of its balance sheet.statement of financial position. These limits are supervised on a daily basis by the Bank’s Market Risk Management Office.market risk management office. The Bank’s treasury division manages a derivative portfolio which includes forward agreements in foreign currency with the purpose, among others, of hedging its currency exposure.
| B.3. | COMMITMENT FOR CAPITAL EXPENDITURES |
On December 18, 2012, Bancolombia Panama S.A. and BAM Financial Corporation (BFC) entered into a stock purchase agreement, pursuant to which Bancolombia Panama will purchase from BFC a 40% stake in the capital stock of the Panamanian company Grupo Agromercantil Holding. Bancolombia Panama will pay a total of USD 216 million in cash to BFC for the 40% interest at closing. This transaction, which is subject to customary conditions including regulatory approvals, is expected to close in the second quarter of 2013. Bancolombia Panama will pay the purchase price from its own resources.
On February 19, 2013, Bancolombia and HSBC Latin America Holdings (UK) Limited entered into an agreement with HSBC Holdings plc’s Latin American holding company, HSBC Latin America Holdings (UK) Limited (“HSBC”), to acquire HSBC Bank (Panama) S.A. (“HSBC Panama”). The agreement provides for Bancolombia to pay total cash consideration of USD 2.1 billion, subject to certain customary adjustments based upon estimated net asset value at completion of USD 700 million, in exchange for 100% of common shares, and 90.1% of preferred shares of HSBC Panama. This transaction, which is subject to customary conditions including regulatory approvals, is expected to close in the third quarter of 2013. Bancolombia will pay the purchase price from its own resources.
For further information regarding expected capital expenditures, seeSee “Item 4. Information on the Company - A. History and Development of the Company – Capital Expenditures and Divestitures”.
| C. | RESEARCH AND DEVELOPMENT, PATENTS AND LICENSES, ETC. |
Not Applicable
During 2012,2015, net interest income grew 22%20% as net interest margins increased slightly and credit volumes increased. Credit cost in 2012 was higher than in 2011.grew compared to 2014. Net provision charges increased significantly over the past year (93% compared to 2014). Future levels of loan volumes, interest margins and cost of credit will be key drivers of the Bank’s performance. The following is a brief discussion of recent trends with regard to those three elements.
Loan Volume Performance
Gross loans and financial leases (i.e., before allowance for loans and financial lease losses) increased 14%26% during 2012.2015.
Economic activity in Colombia and consumer confidence remained strong.weakened during the second half of the year. As a result, demandthe pace of loan growth slowed and even the dynamic mortgage market decelerated late in mortgages and consumer loans picked up vigorously and commercial loans kept growing. During 2012,the year. Nevertheless, during 2015, commercial loans grew 11%31%, consumer loans grew 16%12%, small business loans grew 6%mortgages increased 22%, financial leases grew 21% and mortgages (including securitized mortgages) increased 23%microcredit expanded 35%.
Economic growth in El Salvador was slow in 20122015 and Banco Agrícola’s loan book expanded only 6.8%3% as there was weak demand from corporatecorporates and individuals. This slow growth generated a lagging effect in the Bank’s overall book.
USD-denominatedCredit demand in Banistmo was moderate, due to the slow down in economic growth over the last year. The total loan book grew 9%, which was expected in last year’s more challenging environment. This growth level is more in line with growth in Guatemala than with growth in El Salvador, which despite solid financial performance does not provide high growth rates.
Loan growth in Guatemala was the highest in Central America, thereby growing 13% for 2015. GAH in Guatemala operates in Central America’s largest country, which provides a favorable growth environment.
Foreign-denominated loans decreased 16%increased 79% during 2012.2015. Corporations in Colombia and off shore financing, particularly in Central America did not demanddemanded this type of loan as they didthe Banistmo’s loans, all of them denominated in USD, contributed to the previous year.
Debt issuances by Colombian companies were COP 10,174 billiongrowth in 2012 (a 15% increase from COP 8,841 billion in 2011), and non-financial firms issued about COP 3,517 billion (a 164% increase from COP 1,347 billion in 2011). During 2012, the Bank did not suffer a significant impact from corporations funding their capital needs in the debt markets. Mid-size companies and SMEs demanded more credit and that allowed the Bank to grow its loan portfolio.this line.
Credit demand is expected to be strongmoderate even further in 20132016 as the economy in Colombia continuesis expected to growslow down considerably, as individuals and corporations demand consumer and commercial loans,less credit, and as the economy in El Salvador recoverscontinues to recover from the crisis of 2008 - 2010.
Net Interest Margins
The majority of the Bank’s loan book has a variable rate (57%(53% of loans have a maturity of more than one year and earn interest at variable rates) and the re-pricing pace of our assets tends to be faster than that of our liabilities. The interest rate increasesincrease in Colombiathe bank’s cost of funding during the firstsecond half of 2012 had a positive effect onthe year contributed to the Bank’s slightly lower net interest margins as there was less pressure on them.margins. As a result, the net interest margin increaseddecreased from 5.6%5.30% 2014 to 5.25% in the fourth quarter of 2011 to 5.9% in the fourth quarter of 2012.2015.
The bank’sBank’s strategy during the year was to support the net interest margin by changing the mix of deposits and increasing the proportion of average demand deposits (savings and checking accounts) which are less expensive than time deposits and also maintaining funding costs as low as possible on each type of deposits.deposit.
AmpleMore liquidity, a more favorable deposit mix (one with a greater proportion of average demand deposits) and potentialconsistent increases in the interest rates in the economy point toward stability intowards improving net interest margins in 2013.2016.
Cost of credit
For the year 2012,2015, the cost of credit was 1.7%1.3% of average loans, higher thanwhich is not comparable to last year’s numbers because of the 1.1% experienced in 2011 and the 1.2% in 2010.adoption of full IFRS reporting standards. This higher credit cost was drivenexplained by reserve additions across all credit segments and highera minimal deterioration in our loan portfolio that resulted from the increase of indebtedness of households in Colombia.portfolio.
| E. | OFF-BALANCE SHEET ARRANGEMENTS |
The following are the off-balance sheet arrangements in which Bancolombiathe Bank is involved: standby letters of credit, letters of credit and bank guarantees.
Standby letters of credit and bank guarantees are conditional commitments issued by us to guarantee the performance of a customer to a third party. BancolombiaThe Bank typically has recourse to recover from the customer any amounts paid under these guarantees. In addition, Bancolombiathe Bank may hold cash or other highly liquid collateral to support these guarantees.
At December 31, 2012, 20112015 and 2010,2014, outstanding letters of creditcredits and bank guarantees issued by Bancolombiathe Bank totaled COP 4,440,515 million, COP 4,054,4947,164,613 million and COP 3,198,1436,727,055 million, respectively.
The table below summarizes at December 31, 2012 and 2011 all of the Bank’s guarantees whereissued by the Bank is the guarantor.as of December 31, 2015 and 2014. The total amount outstanding represents the maximum potential amount (notional amounts) that could be lost under the guarantees if there werewas a total default in full by all the guaranteed parties, without consideration of possible recoveries under recourse provisions or from collateral held or pledged. Such amounts greatly exceed anticipated losses.
Commissions received from these arrangements amounted to COP 27,751 million, COP 27,644 million and COP 23,250 million for 2012, 2011 and 2010, respectively. Unused credit lines amounted to COP 2,844,74510,516,134 million and COP 2,468,5879,438,002 million at December 31, 20122015 and 2011.2014.
| | | Expire within one year
At December 31, | | | Expire after one year
At December 31, | | | Total amount outstanding
At December 31, | | | Maximum potential
amount of future losses
At December 31, | |
| | | 2012 | | | 2011 | | | 2012 | | | 2011 | | | 2012 | | | 2011 | | | 2012 | | | 2011 | |
| | | COP million | |
| Letters of credit | | | 1,681,099 | | | | 1,756,346 | | | | 1,027,423 | | | | 782,291 | | | | 2,708,522 | | | | 2,538,637 | | | | 2,708,522 | | | | 2,538,637 | |
| Bank guarantees | | | 1,072,320 | | | | 1,010,425 | | | | 659,673 | | | | 505,432 | | | | 1,731,993 | | | | 1,515,857 | | | | 1,731,993 | | | | 1,515,857 | |
| Total (COP) | | | 2,753,419 | | | | 2,766,771 | | | | 1,687,096 | | | | 1,287,723 | | | | 4,440,515 | | | | 4,054,494 | | | | 4,440,515 | | | | 4,054,494 | |
| | | Expire within one year
at December 31, | | | Expire after one year
at December 31, | | | Total amount outstanding
at December 31, | | | Maximum potential
amount of future losses
at December 31, | |
| | | 2015 | | | 2014 | | | 2015 | | | 2014 | | | 2015 | | | 2014 | | | 2015 | | | 2014 | |
| | | (in millions of COP) | |
| Bank guarantees and letters of credit | | | 4,845,119 | | | | 4,430,853 | | | | 2,319,494 | | | | 2,296,202 | | | | 7,164,613 | | | | 6,727,055 | | | | 7,164,613 | | | | 6,727,055 | |
| Total (COP) | | | 4,845,119 | | | | 4,430,853 | | | | 2,319,494 | | | | 2,296,202 | | | | 7,164,613 | | | | 6,727,055 | | | | 7,164,613 | | | | 6,727,055 | |
| F. | TABULAR DISCLOSURE OF CONTRACTUAL OBLIGATIONS |
The following table shows the Bank’s contractual obligations as of December 31, 2012:2015:
| Contractual Obligations | | Total | | | Less than
1 year | | | 1-3
years | | | 3-5
years | | | After
5 years | |
| | | | | | (COP millions) | |
| Long-term debt obligations | | | 12,243,755 | | | | 1,280,797 | | | | 1,116,496 | | | | 1,600,763 | | | | 8,245,699 | |
| Time deposits | | | 25,054,240 | | | | 17,241,602 | | | | 4,745,203 | | | | 1,557,713 | | | | 1,509,722 | |
| Commitments to originate loans | | | 2,844,745 | | | | 2,844,745 | | | | - | | | | - | | | | - | |
| Employee benefit plans | | | 259,838 | | | | 25,795 | | | | 45,040 | | | | 53,953 | | | | 135,050 | |
| Finance Leases Obligations | | | 30,973 | | | | 8,710 | | | | 18,813 | | | | 3,450 | | | | - | |
| Operating Lease Obligations | | | 995 | | | | 315 | | | | 680 | | | | - | | | | - | |
| Interbank Borrowings | | | 1,803,665 | | | | 1,346,286 | | | | 415,674 | | | | 6,325 | | | | 35,380 | |
| Borrowings from domestic development banks | | | 3,467,843 | | | | 840,309 | | | | 831,060 | | | | 743,935 | | | | 1,052,539 | |
| Total | | | 45,706,054 | | | | 23,588,559 | | | | 7,172,966 | | | | 3,966,139 | | | | 10,978,390 | |
The amounts shown in the table include interest costs on debt. The Bank does not have any uncertain tax positions to report.
| Contractual Obligations | | Total | | | Less than
1 year | | | 1-3
years | | | 3-5
years | | | More than
5 years | |
| | | (in millions of COP) | |
| Debt securities in issue | | | 19,435,865 | | | | 1,624,493 | | | | 1,896,849 | | | | 4,972,382 | | | | 10,942,141 | |
| Time deposits | | | 48,713,789 | | | | 34,353,150 | | | | 9,287,774 | | | | 2,918,072 | | | | 2,154,793 | |
| Commitments to originate loans | | | 10,516,134 | | | | 10,516,134 | | | | - | | | | - | | | | - | |
| Post-employment benefit plans | | | 676,591 | | | | 55,353 | | | | 103,862 | | | | 125,260 | | | | 392,116 | |
| Finance Lease Obligations | | | 62,619 | | | | 17,448 | | | | 41,853 | | | | 3,318 | | | | - | |
| Operating Lease Obligations | | | 6,138 | | | | 1,978 | | | | 4,160 | | | | - | | | | - | |
| Borrowings from other financial institutions | | | 19,721,184 | | | | 11,131,373 | | | | 4,098,244 | | | | 1,240,253 | | | | 3,251,314 | |
| Total | | | 99,132,320 | | | | 57,699,929 | | | | 15,432,742 | | | | 9,259,285 | | | | 16,740,364 | |
| G. | CRITICAL ACCOUNTING POLICIES AND ESTIMATES |
The following are consideredBank has defined some critical accounting policies, given their significant impact on the financial condition and operating performance of the Bank. ThisFor further information should be read together with Note 2. Summary of significant accounting policies of2 to the Consolidated Financial Statements.
CRITICAL ACCOUNTING POLICIES AND ESTIMATES UNDER COLOMBIAN BANKING GAAP
Evaluation of loan portfolio risk and determination of allowances for loan losses:Under Colombian banking GAAP, the Bank currently evaluates loan portfolio risk according to the rules issued by the SFC, which establishes qualitative and quantitative standards for assigning a risk category to individual assets. The qualitative analysis includes the evaluation of “potential weaknesses”, “deficiencies” or “serious deficiencies” based on the existence and magnitude of specific factors, according to the judgment of management. For the quantitative evaluation, the Bank first determines whether the loan has become due and then classifies the loan according to the number of days past-due.
Commercial and consumer loans are provisioned following standard models developed by the SFC. According to the models, the allowance for loan losses is stated through the calculation of the Expected Loss.
Small business loans and mortgage loans are provisioned considering a minimum allowance level for each credit category. In addition, a general allowance equal to 1% of the outstanding loan balance is required.
The Bank considers the accounting estimates used in the methodology to determine the allowance for loan losses to be “critical accounting estimates” because: (a) by its nature, the allowance requires the Bank to make judgments and assumptions regarding the Bank’s loan portfolio, (b) the methodology used in its determination is based on the existence and magnitude of determined factors that are not necessarily an indication of future losses and (c) the amount of the provision that is based on reference models for commercial and consumer portfolios and a percentage based on the risk category for small business loans and mortgage portfolios, although it is impossible to ensure that this percentage will exactly reflect the probability of loss.
Contingent Liabilities: The Bank is subject to contingent liabilities, including judicial, regulatory and arbitration proceedings and tax and other claims arising from the conduct of the Bank’s business activities. Under Colombian banking GAAP, reserves are established for legal and other claims by assessing the likelihood of the loss actually occurring as probable, reasonably possible or remote. Contingencies are partially provisioned and are recorded when all the information available indicates that it is probable that the Bank will be required to make disbursements in the future for events that happened before the balance sheet date and the amounts may be reasonably estimated. The Bank engages internal and external experts (lawyers and actuaries) in assessing probability and in estimating any amounts involved.
Throughout the life of a contingency, the Bank may learn of additional information that can affect assessments regarding probability or the estimates of amounts involved. Changes in these assessments can lead to changes in recorded reserves.
The Bank considers the estimates used to determine the reserves for contingent liabilities to be “critical accounting estimates” because the probability of their occurrence and the amounts that the Bank may be required to pay are based on the Bank’s judgment and its advisers, which will not necessarily coincide with the future outcome of the proceedings.
Pension Plan:Under Colombian banking GAAP, the Bank applies the provisions of Decree 4565 of 2010, which requires a distribution of charges to amortize the actuarial calculation by 2029. The distribution is calculated by taking the percentage amortized up to December 2009 and annually adding the minimum percentages needed to complete amortization by 2029. As of December 31, 2012, the Bank has completed the amortization of the total amount resulting from the calculation performed in accordance with Decree 4565. Under the Bank’s non-contributory unfunded defined benefit pension plan, benefits are based on length of service and level of compensation.
The Bank considers that the accounting estimates related to its pension plan are “critical accounting estimates” because the determination of the contributions to the plan involves judgments and assumptions made by the actuaries related to the future macroeconomic and employee demographic factors, among others, which will not necessarily coincide with the future outcome of such factors.
Recognition of Business Combinations:Upon a business combination, the Colombian purchase method of accounting requires that (i) the purchase price be allocated to the acquired assets and liabilities on the basis of their book value, (ii) the statement of income of the acquiring company for the period in which a business combination occurs includes the income of the acquired company as if the acquisition had occurred on the first day of the reporting period and (iii) the costs directly related to the purchase business combination not be considered as a cost of the acquisition, but deferred and amortized over a reasonable period as determined by management.
The pooling of interests method of accounting requires the aggregate of the stockholders’ equity of the entities included in the business.
The Conavi/Corfinsura Merger was accounted for using the pooling of interests method in accordance with the methodology suggested by the SFC. The Sufinanciamiento (now Tuya S.A. Compañía de Financiamiento), Comercia (now Factoring Bancolombia) and Banagrícola acquisitions were accounted for using the purchase method under Colombian banking GAAP.
Goodwill Recognized Upon Business Combinations:The Bank tests goodwill recognized upon business combinations for impairment at least annually using a two-step process that begins with an estimation of the fair value of a reporting unit. The first step is a screen for potential impairment, and the second step measures the amount of impairment, if any. However, if certain criteria are met, the requirement to test goodwill for impairment annually can be satisfied without a re-measurement of the fair value of a reporting unit. Fair value is determined by management by reference to market value, if available, or by pricing models or with the assistance of a qualified evaluator. Determination of a fair value by a qualified evaluator or pricing model requires management to make assumptions and use estimates.
The most significant amounts of goodwill and intangibles relate to the acquisition of Conavi and Corfinsura in 2005 and Banagrícola in 2007. The valuation models used to determine the fair value of these companies and the intangibles are sensitive to changes in the assumptions. Adverse changes in any of these factors could lead the bank to record a goodwill or intangible impairment charge. Management believes that the assumptions and estimates used are reasonable and supportable in the existing market environment and commensurate with the risk profile of the assets valued. However, different assumptions and estimates could be used which would lead to different results.
Under Colombian banking GAAP, financial entities have to register amortization of goodwill. According to the guidelines issued by the SFC, the goodwill should be amortized using the exponential method, however, other methods which provide a better association between revenues and expenses are permitted. Since January, 2008, the straight-line method has been used to amortize goodwill, since the Bank considers this method to provide a better association between revenues and expenses corresponding to this investment. Under Colombian banking GAAP the Bank performs impairment test using a discounted cash flow technique.
The Bank considers amortization and impairment tests to be “critical accounting estimates” because of the importance of assumptions used in the testing and the sensitivity of the results to the assumptions used.
Recognition and Measurement of Financial Instruments at Fair Value: A portion of the Bank’s assets is carried at fair value for Colombian banking GAAP purposes, including equity and debt securities with quotations available or where quoted prices are available for similar assets, derivatives, customers’ acceptances and short-term borrowings.
Under Colombian banking GAAP, the fair value of a financial instrument is defined as the estimated amount at which the instrument could be exchanged in a current transaction between willing and independent parties. A large proportion of the Bank’s assets reported at fair value are based on quoted market prices, which provide the best indication of fair value. If quoted market prices are not available, the Bank discounts the expected cash flows using market interest rates which take into account the credit quality and maturity of the investment. The degree of management’s judgment involved in determining the fair value of a financial instrument is dependent upon the availability of quoted market prices. When observable market prices and parameters do not exist, management’s judgment is necessary to estimate fair value, in terms of estimating the future cash flows, based on variables of the instruments, the inherent credit risk and the applicable interest rate to discount those cash flows.
As of December 31, 2012, the Bank’s assets that were fair-valued using discounted cash flow techniques amounted to COP 372 billion and mainly included bonds and notes issued by the Colombian Government or its entities and corporate debt securities.
As of December 31, 2012, derivative financial instruments were not recognized based on quoted prices and as a consequence, valuation techniques such as discounted cash flows, Black-Scholes and similar methodologies were performed to measure the estimated fair value, using where possible current market-based or independently sourced market parameters, such as interest rates, currency rates and forward curves based on transactions.
The estimated fair value of instruments based upon internally developed valuation techniques could vary if other valuation methods or assumptions were used.
As of December 31, 2012, our financial derivatives that were fair-valued using discounted cash flows and Black-Scholes techniques amounted to COP 156 billion net and mainly included market rate and interest rate swaps, forwards and options.
For a further discussion on the effect of a change in interest rates and foreign exchange rates on the Bank’s portfolio see “Item 11. Quantitative and Qualitative Disclosures About Market Risk”.
Securitizations:The Bank has securitized both performing and non-performing mortgage loans which, according to Colombian banking GAAP, have been accounted for as sales, and as such, said loans have been removed from the Bank’s balance sheet.
As of 2009 (effective date), when External Circular 047 of 2008 was issued, assets subject to portfolio securitizations could be derecognized as firm transfers or disposals providing the following conditions were fulfilled:
| · | Assets assigned to securitizations and transferred exclusively to securitization firms in order to set up Special-Purpose Vehicles (SPVs). |
| · | In the case of securitizations carried out by securitization firms or directly by credit establishments, the disposal of the corresponding assets must be carried out by separating the equity value of the securitized assets and creating the corresponding SPV. |
| · | The disposal or transfer of securitized assets shall not be subject to any type of express or implicit cancellation clause or provision. |
| · | In transferring or disposing of these securitized assets, the total benefits and risks inherent or accruing from such assets must also have been totally transferred. |
| · | Under no circumstance shall the originator conserve discretionary rights to dispose of, control, limit, encumber, substitute, reacquire or use the assets thus transferred or disposed of. |
Also, this new regulation provided that in cases where the transferor retains a positive residual interest, it may record as an investment the fair value of the residual interest subject to the conditions defined for this purpose in the applicable rules and regulations of the issue in question, with a balancing entry in the investment valuation income account. This value must be updated at least every year, on the anniversary of the date on which the SPV was set up and in any case on the closing date of the fiscal period in question. As a result of the above, the Bank has recognized retained interest as held to maturity debt securities in the amount of COP 138,983 million and COP 95,749 million as of December 31, 2012 and 2011, respectively.
Equity tax:Since 2007 Colombian tax regulations require companies to pay an annual special tax defined as “Equity tax” calculated based on their net assets established on their tax basis as of January 1 of each year at the statutory tax rate of 1.2%. The equity tax is in addition to corporate income tax. During 2010 and 2011 a new regulation required companies to calculate this tax only once for the subsequent four years as of January 1, 2011 at the tax rate of 6% and payable in 8 semi-annual installments over four years without interest. The equity tax calculated by companies in accordance with Colombian banking GAAP is recorded as a deferred asset to be amortized on a straight-line basis over the four years proportionately against stockholders’ equity and income.
CRITICAL ACCOUNTING POLICIES AND ESTIMATES UNDER U.S. GAAP
Allowance of Deferred Tax Assets
A valuation allowance for deferred tax assets is recognized if, based on the weight of available evidence, it is more likely than not that some portion or all of the deferred tax assets will not be realized. All available evidence, both positive and negative, is considered to determine whether, based on the weight of that evidence, a valuation allowance is needed. Future realization of the tax benefit of existing deductible temporary differences or carry forwards ultimately depends on the existence of sufficient taxable income in future periods.
In determining a valuation allowance, the Bank performs a review of future taxable income (required for reversing temporary differences and carry forwards) and future reversals of existing taxable temporary differences. Due to the continuing weak economic conditions, the determination of the valuation allowance involves difficult judgments to estimate future taxable income.
With regard to state taxes, Bancolombia is subject to Colombian tax legislation. In the case of its companies based in El Salvador and Peru, it must also calculate the corresponding taxes according to Salvadorian and Peruvian tax legislations.
With regard to municipal and departmental taxes, these must be calculated according to tax legislation applicable in each of the municipal jurisdictions in which the Bank’s branch offices are located.
The application of tax legislation is subject to diverse interpretations on the part of both taxpayers and the Colombian tax authorities (Dirección de Impuestos y Aduanas Nacionales).
When calculating deferred tax, the Bank considers future estimates, the figures recorded on its consolidated financial statements.
However, the deferred tax asset is considered as a critical accounting policy, due to tax determinations involving estimates of profits and future taxable incomes that will be settled in future years; such estimates can be affected by changes on the economic conditions. The valuation allowance has been determined based on estimations of taxable income and the applications of the current fiscal laws.
Evaluation of Loan Portfolio Risk and Determination of Allowances for Loan Losses:Under U.S. GAAP, the Bank considers loans to be impaired when it is probable that all amounts of principal and interest will not be collected according to the contractual terms of the loan agreement. The allowance for significant impaired loans are assessed based on the present value of estimated future cash flows discounted at the effective loan rate or the fair value of the collateral in the case where the loan is considered collateral-dependent. An allowance for impaired loans is provided when discounted future cash flows or the fair value of collateral is lower than book value.
In addition, if necessary, a specific allowance for loan losses is established for non-impaired individual loans, based on statistic modeling, recent back testing results, expectations about the economy’s behavior, recent and future loss experience, credit scores, the risk characteristics of the various classifications of loans and other factors directly influencing potential collectability and affecting the quality of the loan portfolio.
Determining the allowance for loan losses requires a significant amount of management judgment and estimates including, among others, identifying impaired loans, determining customers’ ability to pay and estimating the fair value of underlying collateral or the expected future cash flows to be received.
To calculate the allowance required for smaller-balance impaired loans and unimpaired loans, historical loss ratios are determined by analyzing historical losses. Loss estimates are analyzed by loan type (commercial and consumer, microcredit and mortgage) and thus for homogeneous groups of clients depending on their scoring and portfolio segment. Such historical ratios are updated to incorporate the most recent data reflecting current economic conditions, industry performance trends, geographic or obligor concentrations within each portfolio segment and any other pertinent information that may affect the estimation of the allowance for loan losses.
Allowances on homogeneous loan portfolios are established based on probability of default, which is defined as the probability that the debtor within a specific loan portfolio or segment and rating, will default on their obligations within the next twelve (12) months. Under U.S. GAAP, this probability of default is determined by analyzing estimated defaults or foreclosures based on portfolio trends, historical losses, client’s payment behavior with past-due loans greater than 90 days, delinquencies, bankruptcies, economic conditions and credit scores.
Another parameter associated to the client’s allowance under homogeneus groups is the Loss Given Default (“LGD”), which is a function of the guarantee and the number of days that each loan is past due. The Bank applies the parameters designated by the SFC, but in 2012, it calculated some parameters under a proprietary model based on historical information of recoveries from defaulted clients.
A one-percent decrease in the expected cash flows could result in an impairment of the portfolio of approximately COP 6,236 million. These sensitivity analyses do not represent management’s expectations of the decline in risk ratings or the increases in loss rates, but are provided as hypothetical scenarios to assess the sensitivity of the allowance for loan and lease losses to changes in key inputs. The Bank believes the risk ratings and loss severities currently in use are appropriate and represent management’s expectations about the credit risk inherent in its loan portfolio.
The Bank considers accounting estimates related to provisions for loans and advances “critical accounting estimates” because: (i) they are highly susceptible to change from period to period as the assumptions about future default rates and valuation of potential losses relating to impaired loans and advances are based on recent performance experience, and (ii) any significant difference between the Bank’s estimated losses (as reflected in the provisions) and actual losses would require the Bank to take provisions which, if significantly different, could have a material impact on its future financial condition and results of operations. The Bank’s assumptions about estimated losses are based on past performance, past customer behavior, the credit quality of recent underwritten business and general economic conditions, which are not necessarily an indication of future losses.
Pension Plan:Under U.S. GAAP, actuarial valuation of its pension plan is performed annually using the projected unit credit method in accordance with ASC 715 Compensation-Retirement Benefits and prepared using actuarial, economic and demographic assumptions about future events.
The Bank considers the accounting estimates related to its pension plan to be “critical accounting estimates” because the determination of the contributions to the plan involves judgments and assumptions made by the actuaries related to the future macroeconomic and employee demographic factors, among others, which will not necessarily coincide with the future outcome of such factors.
Recognition and Measurement of Intangibles Recognized Upon Business Combinations:Under U.S. GAAP, the Bank accounts for acquired businesses using the acquisition purchase method of accounting which requires that the assets acquired and liabilities assumed be recorded at the date of acquisition at their respective fair values. The application of the acquisition method requires certain estimates and assumptions, especially concerning the determination of fair values of the acquired intangible assets and property, plant and equipment, as well as the liabilities assumed at the date of the acquisition.
In addition, the useful lives of acquired intangible assets, property, plant and equipment have to be determined. The judgments made in the context of the purchase price allocation can materially impact the Bank’s future results of operations. Accordingly, for significant acquisitions, the Bank obtains assistance from third-party valuation specialists. The valuations are based on information available at the acquisition date and different methodologies are used for each intangible identified.
Goodwill and Intangibles Recognized Upon Business Combinations:Under U.S. GAAP, for business acquisitions that occurred before January 1, 2009, goodwill was measured as the excess of the cost of an acquired entity over the net of the amounts assigned to assets acquired and liabilities assumed. Since January 1, 2009, goodwill has beenmeasured as the excess of the sum of the consideration transferred, the fair value of any non-controlling interests in the acquiree, and the fair value of the acquirer’s previously held equity interest in the acquiree (if any) over the net of the acquisition date amounts of the identifiable assets acquired and the liabilities assumed. The Bank tests goodwill recognized upon business combinations for impairment at least annually using a two-step process that begins with an estimation of the fair value of a reporting unit. A reporting unit is defined as an operating segment or one level below an operating segment; which is a business component that earns revenues and incurs expenses, whose operating results are regularly reviewed by management to assess performance and allocate resources. The first step is a screen for potential impairment, and the second step measures the amount of impairment, if any. However, if certain criteria are met, the requirement to test goodwill for impairment annually can be satisfied without a re-measurement of the fair value of a reporting unit. Fair value is determined by management by reference to market value, if available, by pricing models, or with the assistance of a qualified evaluator. Determination of fair value by a qualified evaluator or pricing model requires management to make assumptions and use estimates to forecast cash flow for periods that are beyond the normal requirements of management reporting; the assessment of the discount rate appropriate to the reporting unit; estimation of the fair value of reporting units; and the valuation of the separable assets of each business whose goodwill is being reviewed.
The amount of goodwill allocated to the reporting unit and the key assumptions used by management in determining the fair value are:
| Reporting segments | | Reporting Unit | | Goodwill
2012 | | | Valuation
Methodology | | Key
Assumptions | | Discount Rate
(real) | | | Growth rate
(real) | |
| | | | | | | | | | | | | | | | |
| Banking El Salvador | | Banco Agrícola | | COP | 524,854 | | | Cash flow | | 10 years plan | | | 9.5 | % | | | - | |
| Banking Colombia | | Bancolombia Tuya and Factoring(1) | | | 428,040 | | | Cash flow | | 10 years plan | | | 10.63 | % | | | 4.70 | % |
| Leasing | | Leasing Bancolombia | | | 54,238 | | | Cash flow | | 10 years plan | | | 10.63 | % | | | 4.70 | % |
| Pension and Insurance(2) | | - | | | - | | | - | | - | | | - | | | | - | |
| Trust | | Fiduciaria Bancolombia | | | 2,493 | | | Cash flow | | 10 years plan | | | 10.63 | % | | | 4.70 | % |
| Investment Banking | | Banca de Inversión | | | 132,273 | | | Cash flow | | 10 years plan | | | 10.63 | % | | | 4.70 | % |
| Brokerage | | Valores Bancolombia | | | 43,722 | | | Cash flow | | 10 years plan | | | 10.63 | % | | | 4.70 | % |
| Off Shore | | Bancolombia Puerto Rico | | | 31,534 | | | Cash flow | | 10 years plan | | | 10.63 | % | | | 4.70 | % |
| All Other Segments | | Inversiones CFNS | | COP | 1,330 | | | Cash flow | | 10 years plan | | | 10.63 | % | | | 4.70 | % |
| (1) | In 2009, the Bank performed the impairment test of Factoring Bancolombia’s goodwill and concluded there was impairment. The impairment loss has been recorded to the extent of the carrying amount of the goodwill. There are no reporting units close to failing the first step of the impairment test performed during 2012. |
| (2) | During 2012 and 2011, the Bank sold 97.03% of its shares of capital stock of Asesuisa and 99.99% of its shares of capital stock in AFP Crecer, respectively. See Note 31 - q) Discontinued operations. |
There are no reporting units close to failing the first step of the impairment test performed during 2012.
The long-term growth rates have been based on respective country GDP rates adjusted for inflation. The risk discount rates are based on observable market long-term Government bond yields and average industry betas adjusted for an appropriate risk premium.
The most significant amounts of goodwill and intangibles relate to the Conavi/Corfinsura Merger in 2005 (allocated to Bancolombia, Tuya and Factoring Reporting Unit) and the acquisition of Banagrícola in 2007. The valuation models used to determine the fair value of these companies and the intangibles are sensitive to changes in the assumptions. Significant adverse changes in discount rate or growth rate could lead the Bank to record a goodwill or intangible impairment charge. Management believes that the assumptions and estimates used are reasonable and supportable in the existing market environment and commensurate with the risk profile of the assets valued. However, different assumptions and estimates could be used which would lead to different results.
Recognition and Measurement of Financial Instruments at Fair Value:Effective January 1, 2008, for U.S. GAAP purposes, the Bank adopted ASC 820 – Fair Value Measurements and Disclosures (revised on January 1, 2012). As a result, the Bank has made amendments to the techniques used in measuring the fair value in order to include considerations about credit risk, as described below.
The Bank holds debt and equity securities, derivatives, assets-backed securities, loans, short-term borrowings and long-term debt, to meet clients’ needs and to manage liquidity needs and market risk.
| a. | Overall Valuation Methodology |
When available, the Bank generally uses quoted market prices to determine fair value, and classifies such items within Level 1 of the fair value hierarchy established under ASC 820. Where available, the Bank may also make use of quoted prices for recent trading activity in positions with the same or similar characteristics to that being valued.
If quoted market prices are not available, fair value is based upon internally developed valuation techniques that use, where possible, current market-based or independently sourced market parameters, such as interest rates, currency rates and option volatilities. Financial instruments valued in this manner are classified within level 2 of the fair-value hierarchy under ASC 820.
When an internally developed model is used to price a significant product, it is subject to validation and testing by independent personnel and the item would be classified as Level 3 of the fair-value hierarchy established under ASC 820.
| b. | Credit Valuation Adjustments |
For U.S. GAAP purposes, beginning January 1, 2008 with the adoption of fair-value measurement guidance, the Bank has measured the effects of the credit risk of its counterparties and its own creditworthiness in determining fair value of certain financial instruments that are measured on a recurring basis.
Counterparty credit-risk adjustments are applied to derivatives, such as over-the-counter derivatives, where the base valuation uses market parameters based on the LIBOR, the COP interest rate curve implicit in the Cross Currency Swap Curve and foreign exchange curves.
The Bank generally calculates the asset’s credit risk adjustment for derivatives transacted with international financial institutions by incorporating indicative credit related pricing that is generally observable in the Credit Default Swap (“CDS”) market. The credit risk adjustment for derivatives transacted with all other counterparties is calculated by incorporating unobservable credit data derived from internal credit qualifications to the financial institutions and corporations located in Colombia.
The Bank also considers its own creditworthiness when determining the fair value of an instrument, including OTC derivative instruments if the Bank believes market participants would take that into account when trading the respective instrument. The approach to measuring the impact of the Bank’s credit risk on an instrument is in the same as for third-party credit risk.
A hundred basis point and two hundred basis point increase in our own credit spreads when determining the credit valuation adjustment of our derivative portfolio, could result in a decrease of the associated adjustment of approximately COP 1,262 and COP 2,541, respectively, as of December 31, 2012. These sensitivity analyses do not represent management’s expectations of the changes in our own credit risk, but are provided as hypothetical scenarios to assess the sensitivity of the fair value of our derivative portfolio to changes in credit spreads.
A hundred basis point and two hundred basis point increase in the counterparty credit spreads when determining the credit valuation adjustment of our derivative portfolio, could result in an increase of the associated adjustment of approximately COP 6,875 and COP 13,440, respectively, as of December 31, 2012. These sensitivity analyses do not represent management’s expectations of the changes in the counterparties credit risk, but are provided as hypothetical scenarios to assess the sensitivity of the fair value of our derivative portfolio to changes in credit spreads.
The Bank is required, on a nonrecurring basis, to adjust the carrying value of certain assets or provide valuation allowances related to certain assets using fair-value measurements in accordance with U.S. GAAP. Loans are generally not recorded at fair value on a recurring basis. Periodically, the Bank records nonrecurring adjustments for including certain impairment amounts for collateral-dependent loans calculated in accordance with ASC 450 Contingencies when establishing the allowance for loan losses. Such amounts are generally based on the fair value of the underlying collateral supporting the loan. Estimates of fair value used for collateral supporting loans generally are based on assumptions not observable in the marketplace and therefore such valuations have been classified as Level 3. Loans subject to nonrecurring fair value measurement were COP 166,864 million and COP 238,228 million at December 31, 2012 and 2011, respectively, classified as Level 3. Changes in fair value recognized for loan impairment reserves on loans held by the Bank on December 31, 2012 and 2011, represented impairment losses of COP 41,036 million and COP 83,968 million, for the period ended December 31, 2012 and 2011, respectively.
| d. | Other than Temporary Impairment |
The Bank conducts regular reviews to assess whether other than temporary impairment exists, in accordance with ASC 320. If the Bank determines that unrealized losses are temporary in nature, they are recorded in Accumulated Other Comprehensive Income.
U.S. GAAP requires, when an entity intends to sell an impaired debt security or it is more likely than not that it will be required to sell prior to recovery of its amortized cost basis, the recognition in earnings of the impairment loss on investment securities for decline in fair value. Determinations of whether a decline is other than a temporary decline often involve estimating the outcome of future events. Management judgment is required in determining whether factors exist that indicate that an impairment loss has been incurred at the balance sheet date. These judgments are based on subjective as well as objective factors. The Bank conducts a review semi-annually to identify and evaluate investment securities that have indications of possible impairment.
The Bank has determined that unrealized losses on investments as of December 31, 2012 are temporary in nature because it does not intend to sell an impaired debt security and it is not more likely than not it will be required to sell the debt security before the recovery of its amortized cost.
The substantial majority of the investments in an unrealized loss position for 12 months or more are primarily securities issued by Titularizadora Colombiana, denominated in Unidad de Valor Real (the “Real Value Unit” or “UVR”). Unrealized losses may decline as interest rates fall below the purchased yield and as the securities approach maturity. Since the Bank does not intend to sell an impaired debt security and it is not more likely than not it will be required to sell the debt security before the recovery of its amortized cost, which could be maturity, the unrealized loss is considered temporary.
The Bank considers that the accounting estimate related to the valuation of financial assets and financial liabilities, including derivatives where quoted market prices are not available to be a ���critical accounting estimate’ because: (i) it is highly susceptible to change from period to period because it requires management to make assumptions about interest rates, volatility, exchange rates, the credit rating of the counterparty, valuation adjustments and specific features of the transactions and (ii) the impact that recognizing a change in the valuations would have on the assets reported on its balance sheet as well as its net profit/(loss) could be material.
Securitizations: Before 2010, if SPE activities were sufficiently restricted to meet certain accounting requirements in order to be considered a qualifying special-purpose entity (QSPE), the trust was not consolidated by the seller of the transferred assets. Additionally, under ASC 810 Consolidation, if trusts other than QSPEs met the definition of a variable interest entity (VIE), the Bank evaluated whether the bank was the primary beneficiary of the trust and, if so, consolidated the trust. For U.S. GAAP purposes, since the activities of some vehicles were not sufficiently restricted to meet certain accounting requirements in order to be considered a QSPE, these vehicles were deemed variable interest entities in accordance with ASC 810 and therefore, in those cases where the Bank holds the majority of the residual interests in these vehicles, the Bank concluded it was the primary beneficiary as the party that expects to absorb the majority of the expected losses of such vehicles.
Under U.S. GAAP, beginning in 2010, the Bank adopted the new standard established in ASC 810 “Accounting for transfers of financial assets”. Under the new standard, there are two key accounting determinations that must be made relating to securitizations. A decision must be made as to whether a transfer would be considered a sale under U.S. GAAP, resulting in the transferred assets being removed from the Bank’s consolidated balance sheet with a gain or loss recognized. Alternatively, the transfer would be considered a secured borrowing, resulting in recognition of a liability in the Bank’s consolidated balance sheet. The second key determination to be made is whether the securitization vehicle must be consolidated and included in our consolidated balance sheet or whether such securitization vehicle is sufficiently independent that it does not need to be consolidated. This change in accounting principle did not have a material effect to the Bank’s U.S. GAAP disclosures.
Under ASC 810 Consolidation, in order to determine if trusts other than SPEs meet the definition of a variable interest entity (VIE), the Bank must evaluate whether the Bank is the primary beneficiary of the trust and, if so, must consolidate the trust. In those cases where the Bank holds the majority of the residual interests in these vehicles, the Bank concludes it is the primary beneficiary as the party that receives benefits or absorbs losses that could potentially be significant to the VIE and the Bank consolidates the trust.
Additionally and in order to consolidate these vehicles used to securitize the Bank’s performing loans, the Bank records loans net of allowance for loan losses. For this process, the Bank considers the evaluation of loan portfolio risk and determination of allowances for loan losses under U.S. GAAP to be “critical accounting estimates” because it is based on estimations. (See more details above in Evaluation of Loan Portfolio Risk and Determination of Allowances for Loan Losses in this item).
The table below presents a summary of the assets and liabilities of VIEs of the securitizations of performing loans which have been consolidated on the Bank’s balance sheet at December 31, 2012 and 2011:
| | | 2012 | | | 2011 | |
| Assets | | COP | 1,736,521 | | | COP | 3,022,500 | |
| Liabilities | | | 787,819 | | | | 1,636,952 | |
| Allowance for loan losses | | COP | 122,971 | | | COP | 144,036 | |
The allowance for loan losses represents the management’s estimate of probable losses inherent in the portfolio.
| H. | RECENT U.S. GAAP PRONOUNCEMENTS |
In March 2013, FASB issued ASU 2013-05, “Foreign Currency Matters (Topic 830)”: to resolve the diversity in practice related to the cumulative translation adjustment derecognition guidance in Subtopic 830-30 for the derecognition of certain subsidiaries or groups of assets within a foreign entity and for changes in an investment in a foreign entity. Furthermore, the ASU 2013-05 resolves the diversity in practice for the treatment of business combinations achieved in stages (sometimes also referred to as step acquisitions) involving a foreign entity. The requirements will be effective prospectively for fiscal years beginning after December 15, 2012. Management is currently evaluating the impact the ASU 2013-05 would have on the Bank’s financial statements and U.S. GAAP disclosures.
In February 2013, FASB issued ASU 2013-02, “Reporting of Amounts Reclassified out of Accumulated Other Comprehensive Income (Topic 220)”. The amendments require additional disclosures of items reclassified from accumulated Other Comprehensive Income (OCI) to net income. The requirements will be effective prospectively for reporting periods beginning after December 15, 2012. Management has concluded that the adoption has no significant impact on the Bank’s U.S. GAAP disclosures and financial information.
In January 2013, the FASB issued ASU 2013-01, “Balance Sheet (Topic 210): Clarifying the Scope of Disclosures about Offsetting Assets and Liabilities.” The amendments clarify that the scope of Update 2011-11 applies to derivatives accounted for in accordance with Topic 815, Derivatives and Hedging, including bifurcated embedded derivatives, repurchase agreements and reverse repurchase agreements, and securities borrowing and securities lending transactions that are either offset in accordance with Section 210-20-45 or Section 815-10-45 or subject to an enforceable master netting arrangement or similar agreement. An entity is required to apply the amendments for fiscal years beginning on or after January 1, 2013, and interim periods within those annual periods. An entity should provide the required disclosures retrospectively for all comparative periods presented. The effective date is the same as the effective date of Update 2011-11. Management is currently evaluating the impact the amendments would have on the Bank’s financial statement and U.S. GAAP disclosures
In October 2012, FASB issued ASU 2012-04, “Technical Corrections and Improvements” to provide: 1) clarification through updating wording, correcting references, or a combination of both, which affects a wide variety of Topics in the Codification; and 2) clarify certain guidance in various Topics of the Codification to fully reflect the fair value measurement and disclosure requirements of Topic 820. The amendments are not introducing any new fair value measurements and are not intended to result in a change in the application of the requirements in Topic 820 or fundamentally change other principles of U.S. GAAP. For public entities, the amendments that are subject to the transition guidance will be effective for fiscal periods beginning after December 15, 2012. Management is currently evaluating the impact on the U.S. GAAP disclosures and financial information released by the Bank.
In August 2012, FASB issued ASU 2012-03, “Technical Amendments and Corrections to SEC Sections” to amends various SEC paragraphs pursuant to SAB 114 related to computation of restricted net assets of subsidiaries, Presentation of Financial Statements, Notes to Financial Statements and other topics; SEC Release No. 33-9250, and ASU 2010-22, which amend or rescind portions of certain SAB Topics related to: Form of condensed financial statements, Debt Issue Costs in Conjunction with a Business Combination, Business Combinations Prior to an Initial Public Offering,“Significant Accounting for Divestiture of a Subsidiary and other topics. The amendments do not include an effective date, applications must be considered after publication. The adoption had no impact on the U.S. GAAP disclosures and financial information released by the Bank.
In July 2012, FASB issued ASU 2012-02, “Testing Indefinite-Lived Intangible Assets for Impairment” to reduce the cost and complexity of performing an impairment test for indefinite-lived intangible assets by simplifying how an entity tests those assets for impairment and to improve consistency in impairment testing guidance among long-lived asset categories. The amendments permit an entity first to assess qualitative factors to determine whether it is more likely than not that an indefinite-lived intangible asset is impaired as a basis for determining whether it is necessary to perform the quantitative impairment test in accordance with Section 350-30. The amendments include a number of events and circumstances for an entity to consider in conducting the qualitative assessment. The amendments are effective for annual and interim impairment tests performed for fiscal years beginning after September 15, 2012. Management has concluded that the ASU 2012-02 has no impact on the Bank’s annual impairment test due to the fact that the Bank has not recognized Indefinite-lived intangible assets in prior business combinations.
In December 2011, FASB issued ASU 2011-11, “Disclosures about offsetting assets and liabilities (Topic 210)”, to provide enhanced disclosures that will enable users of its financial statements to evaluate the effect or potential effect of netting arrangements on an entity’s financial position. This includes the effect or potential effect of rights of setoff associated with an entity’s recognized assets and recognized liabilities within the scope of this Update. The amendments require enhanced disclosures by requiring improved information about financial instruments and derivative instruments that are either (1) offset in accordance with either Section 210-20-45 or Section 815-10-45 or (2) subject to an enforceable master netting arrangement or similar agreement, irrespective of whether they are offset in accordance with either Section 210-20-45 or Section 815-10-45. Also, in January 2013, FASB issued ASU 2013-01, to clarify implementation issues about the scope of ASU 2011-11, specifically, amendments related to accounting for derivatives and hedging. An entity is required to apply the amendments for annual reporting periods beginning on or after January 1, 2013. An entity should provide the disclosures required by those amendments retrospectively for all comparative periods presented. Management is currently evaluating the impact the amendments would have on the Bank’s financial statement and U.S. GAAP disclosures.
In December 2011, FASB issued ASU 2011-10, “Derecognition of in substance Real Estate (Topic 360)”, to resolve the diversity in practice about whether the guidance in sub- topic 360-20 applies to a parent that ceases to have a controlling interest in a subsidiary that is in substance real estate. The amendments are effective for fiscal years, and interim periods within those years beginning on or after December 15, 2013. Early adoption is permitted. The adoption had no impact on the U.S. GAAP disclosures and financial information released by the Bank for the reporting period ending on December 31, 2012 and 2011.
In September 2011, FASB issued ASU 2011-08, “Intangibles – Goodwill and Other (Topic 350)”, to simplify the way entities, both public and nonpublic, test goodwill for impairment. The amendments in this update will allow an entity to first assess qualitative factors to determine whether it is necessary to perform the two-step quantitative goodwill impairment test. Under these amendments, an entity would not be required to calculate the fair value of a reporting unit unless the entity determines, based on a qualitative assessment, that it is more likely than not that its fair value is less than its carrying amount. The amendments are effective for annual and interim goodwill impairment tests performed for fiscal years beginning after December 15, 2011. Early adoption is permitted, including for annual and interim goodwill impairment tests performed as of a date before September 15, 2011, if an entity’s financial statements for the most recent annual or interim period have not yet been issued or, for nonpublic entities, have not yet been made available for issuance. The adoption had no impact on the U.S. GAAP disclosures and financial information released by the Bank for the reporting period ending on December 31, 2012 and 2011.
In May 2011, FASB issued ASU 2011-04, “Amendments to Achieve Common Fair Value Measurement and Disclosure Requirements in U.S. GAAP and IFRSs”, as a result of the work developed by the FASB and the IASB to expand common requirements for measuring fair value and for disclosing information about fair value measurements in accordance with U.S. generally accepted accounting principles (GAAP) and International Financial Reporting Standards (IFRSs)Policies”. The amendments in this update require additional disclosures including the following: (1) information about transfers between Level 1 and Level 2 of the fair value hierarchy, (2) information about the sensitivity of a fair value measurement categorized within Level 3 of the fair value hierarchy to changes in unobservable inputs and any interrelationships between those unobservable inputs, and (3) the categorization by level of the fair value hierarchy for items that are not measured at fair value in the statement of financial position, but for which the fair value of such items is required to be disclosed. For public entities, the amendments are effective during interim and annual periods beginning after December 15, 2011. As a result of the Bank’s adoption of ASU 2011-04 further information related to fair value measurements has been included on the Bank’s financial statement and U.S. GAAP disclosures as of December 31, 2012. See note 31 - t) “Estimated Fair Value”.
In April 2011, FASB issued ASU 2011-03, “Reconsideration of Effective Control for Repurchase Agreements”, to improve the accounting for repurchase agreements (repos) and other agreements that both entitle and obligate a transferor to repurchase or redeem financial assets before their maturity. The amendments in this update remove from the assessment of effective control (1) the criterion requiring the transferor to have the ability to repurchase or redeem the financial assets on substantially the agreed terms, even in the event of default by the transferee, and (2) the collateral maintenance implementation guidance related to that criterion. Other criteria applicable to the assessment of effective control are not changed by the amendments in this update. The guidance in this update is effective for the first interim or annual period beginning on or after December 15, 2011. Management has not identified a significant impact on the Bank’s financial statements and U.S. GAAP disclosures.
In April 2011, FASB issued ASU 2011-02, “A Creditor’s Determination of Whether a Restructuring Is a Troubled Debt Restructuring”, to help creditors in determining whether a creditor has granted a concession and whether a debtor is experiencing financial difficulties for purposes of determining whether a restructuring constitutes a troubled debt restructuring. The new guidance requires creditors to evaluate modifications and restructurings of receivables using a more principles-based approach, which may result in more modifications and restructurings being considered troubled debt restructurings. In addition, the amendments to Topic 310 clarify that a creditor is precluded from using the effective interest rate test in the debtor’s guidance on restructuring of payables when evaluating whether a restructuring constitutes a troubled debt restructuring. As a result of applying these amendments, management believes that new considerations applied in its U.S. GAAP disclosures and financial information have not impacted significantly the Bank’s disclosures.
In January 2011, FASB issued ASU 2011-01, “Deferral of the Effective Date of Disclosures about Troubled Debt Restructurings in ASU 2010-20”, to temporarily delay the effective date of the disclosures about troubled debt restructurings in ASU 2010-20 for public entities. The delay is intended to allow the Board time to complete its deliberations on what constitutes a troubled debt restructuring. Under the existing effective date in ASU 2010-20, the Bank would have provided disclosures about troubled debt restructurings for periods beginning on or after December 15, 2010. According to ASU 2011-02, the amendments in this ASU are effective for the first interim or annual period beginning on or after June 15, 2011, and should be applied retrospectively to the beginning of the annual period of adoption. As a result of applying these amendments, management believes that new considerations applied in its U.S. GAAP disclosures and financial information have not impacted significantly the Bank’s disclosures.
| ITEM 6. | DIRECTORS, SENIOR MANAGEMENT AND EMPLOYEES |
| A. | DIRECTORS AND SENIOR MANAGEMENT |
As of March 31, 2013, theThe following persons acted as directors and senior management of the Bank:
Directors
David Emilio Bojanini Garcíawas born in 1956. Mr. Bojanini holds a degree in industrial engineering from Universidad de los Andes and an MBA with emphasis on actuary from University of Michigan. He has beenheld several positions in the Chief Executive Officer of Grupo de Inversiones Suramericana S.A. since September 2006 and was theprivate sector such as CEO of Administradora de Fondos de Pensiones y Cesantías “ProteccióProtección S.A.” from 1991 to September 2006. Before that time, he was Actuarial Manager2006, and Gerente Actuaría in Suramericana de Seguros S.A. Currentlywhere he worked for 11 years. He has been CEO of Grupo de Inversiones Suramericana S.A. since 2006. Mr. Bojanini is a member of the boardfollowing boards of directors ofdirectors: Grupo Nutresa S.A., Bancolombia Grupo Inversiones Nacional de Chocolates,S.A., Grupo Argos S.A. and, Suramericana S.A. Heand SURA Asset Management. In Colombia he is also partthe CEO of Consejo Privado de la Competitividad, and he is member the Boardboards of Directors ofsocial purpose entities as Fundación para el Desarrollo de Antioquia Proantioquia, and the Privy Council for Competitiveness. He is a member of the Consejo EmpresarialFundación de América Latina – CEAL (Business Council for Latin America) as well as a member of the board of directors the Empresarios por la Educación Foundation, El Cinco Foundation and Mi Sangre Foundation, among others.Corporación Colombiana Internacional.
José Alberto Vélez Cadavid was born in 1950. Mr. Vélez holds a degree in administrative engineering from Universidad Nacional de Colombia and a Masters degree in Science in Engineering from the University of California in Los Angeles (UCLA). He has also taken several specialized courses at Harvard University, Northwestern University and Massachusetts Institute of Technology (MIT). He is also an Honoris Causa Engineer from The National School of Engineers of Metz, France (ENIM). He has been the PresidentCEO of Grupo Argos S.A. since August, 2003. He has held several management positions at Suramericana de Seguros S.A. since 1984, including Vice President of Marketing and Sales, Vice President of Investments, Vice President of Enterprise Development and PresidentCEO of InversuraSuramericana S.A. and Suramericana de Seguros S.A. Currently Mr. Vélez Cadavid is also a member of the board of directors of Suramericana de Inversiones S.A., Grupo Nacional de Chocolates S.A. and Calcetines Crystal S.A.
Carlos Enrique Piedrahita Arocha was born in 1954. He has been President of Grupo Nutresa S.A. since 2000. He was President of Corfinsura from 1993 to 2000, Vice President of Finance of Compañía Suramericana de Seguros S.A. from 1989 to 1993, Vice President of Personal Banking of Banco Industrial Colombiano from 1986 to 1989, National Manager of Credit Cards of Banco Industrial Colombiano from 1984 to 1986 and General Manager of Suleasing S.A. from 1981 to 1984. Mr. Piedrahita Arocha is a member of the board of directors of SuramericanaGrupo de Inversiones Suramericana S.A., Consejo Empresario de America Latina - CEALCelsia S.A. E.S.P., Cementos Argos S.A., Situm S.A.S. and Grupo Argos S.A.Arcos Dorados (McDonald´s franchise for Latin America). He is also part of the management team of Proantioquia, Codesarrollo, Consejo Empresarial Colombiano para el Desarrollo and Fundación Fraternidad de Medellín. He is a member of the America’s Society/Council of the Americas, located in New York as well as a member of the Administrative Counsil of Universidad EAFIT.
Roberto Ricardo Steiner Sampedro was born in 1959. Mr. Steiner holds a Masters degree in economics from the Universidad de los Andes and with a PhD from Columbia University. Within his professional trajectory Mr. Steiner has held several positions in the Central Bank, such as Director of the Investigation Department and Associate Investigator; he also served as Subdirector and Executive Director of Fedesarrollo, Director of the Economic Development Studies Center of the Universidad de los Andes and as an Alternate Executive Director of the IMF. He is currently an Associate Investigator for Fedesarrollo, a position he has held since March 2013. Mr. Steiner has been a Professor at Universidad de los Andes, Columbia University, Universidad Javeriana and Universidad Nacional; he has also been a guest Visting Researcher for the IMF and a Visting Professor for the NASDAQ’s program in then Lehigh University. He was also a government representative for the Audit Committee for the Coffee Sector Policies. He has been member of the board of directors of the following not-for-profit organizations: Hospital San VicenteBogotá Stock Exchange, Credibanco and Ecopetrol. He has been a consultant for IDB, the World Bank, the IMF and the ECLAC. He was a member of the editing committee for the Latin American Economic Policy Review and for Cuadernos de Paúl, ProantioquiaEconomía of Universidad Católica de Chile. He has published several books and Consejo Privado de Competitividad.articles at a national and international level.
Gonzalo Alberto Pérez Rojas was born in 1958. Mr. Pérez holds a law degree from Universidad de Medellín and a post-graduate degree in insurance from Swiss Re, Zurich and a CEO management program certificate from the Kellogg School of Management. He is the PresidentCEO of InversuraSuramericana S.A. Heand has held different management positions at Compañía Suramericana de Seguros S.A. since 1981, such as Vice President of Corporate Businesses and Vice President of Insurance and Capitalization. Mr. Pérez Rojasis currently a member of the boards of directors of Grupo Nutresa S.A., Celsia S.A., Federación Nacional de Aseguradores Colombianos- FASECOLDA, Fundación Suramericana and Fundación Nutresa. He also is a member of the board of directors of Suramericana Panama.
Ricardo Sierra Morenowas born in 1951. Mr. Sierra holds a degree in business administration from Universidad EAFIT. He has been the CEO of Productora Distrihogar S.A. since 1989. He was CFO of Suramericana de Seguros S.A. and Regional Manager of Corporación Financiera Suramericana S.A. Corfinsura. Mr. Sierra is also a member of the board of directors of Suramericana Panamá, Fasecolda (Federación de Aseguradores Colombianos), Colombiana de InversionesCrystal Vestimundo S.A., Fundación Suramericana, Grupo Nacional de ChocolatesCusezar S.A., Cadena S.A. and Fundación Grupo Nacional de Chocolates.
Ricardo Sierra Morenowas born in 1951.Proantioquia. He has been the President of Productora Distrihogar S.A. since 1989. He had previously held positions as Chief Financial Officer of Suramericana de Seguros S.A. from 1982 to 1989 and Regional Manager of Corporación Financiera Suramericana S.A. Corfinsura from 1979 to 1982. Mr. Sierra Moreno is also aan independent member of the boardBank’s Board of directors of Conconcreto S.A., Carulla Vivero S.A., UNE EPM Telecomunicaciones S.A. and Calcetines Crystal S.A. He has also been a member of the ANDI’s sectional boardDirectors since 1992.2004.
Rafael Martinez Villegaswas born in 1942. He holdsMr. Martinez has a degree in Business Administrationbusiness administration from Universidad EAFIT University in Medellin, and a Master’sMasters degree of science in Science in Accountingaccounting from Texas Tech University. He had previously held positions as an auditor atOver the firmcourse of his carreer, he has been Auditor of Peat Marwick, Mitchell & Co.,Co, General Manager of Prebel, PresidentCEO of Inversiones Aliadas S.A. and Corporación Financiera Aliadas S.A. He alsois member of the board of directors of the Philharmonic Orchestra of Medellin. Today he is dedicated to his personal businesses.
Hernando José Gómez Restrepo was born in 1957. Mr. Gómez holds a cum laude degree in economics from Universidad de los Andes. He has a PhD in economics, holds Master’s in philosophy and arts, and a post-graduate degree in currency, banking and international economics from Yale University. Mr. Gómez has been a Professor at Universidad de los Andes, and an Assistant Professor at Yale University. He has held the position of Assesment Director the Central Bank, CEO of Consejo Privado de Competitividad, and Chief of the Colombian Government Negotiation Team for the Free Trade Agreement with the United States of America, the National Planning Director of Colombia, among other positions. He is also a part of the board of directors of Editorial la Patria. Mr. Gómez is an independent member of the Bank’s Board of Directors since his appointment in 2013.
José Alberto Vélez Cadavid, Ricardo Sierra Moreno and Rafael Martínez Villegas resigned as members of the Board of Directors on March 16, 2016. The shareholders, in their general meeting on that date, announced the appointment of the following directors as their replacements, who are deemed as independent members:
Arturo Condo Tamayowas born in 1967.Mr. Condo has a PhD in business strategy and competitiveness from Harvard Business School, and holds degree in Electric Engineering from Escuela Superior Politecnica del Litoral Ecuador. He also obtained a Master’s degree in business administration from INCAE. Mr. Condo is a professor and held the position of principal of INCAE Business School between 2007 and 2015. Previously, he was the dean of masters, the Dean of Research and Development and Director of the Centro Latinoamericano para la Competitividad y el Desarrollo Sostenible (CLACDS). He is currently a consultant in companies located in Latin America and Asia in strategic planning and competitiveness strategy. He has also been consultant of multilateral organizations as Inter-American Development Bank (IDB) and the World Bank. He is the CEO of Keyword Centroamérica, an strategic information company he created in 2014.
Andrés Felipe Mejía Cardona was born in 1962. Mr. Mejía is an economist from Michigan University. He holds certificates in strategic planning from Barcelona University, senior management from Universidad de los Andes and Expro program in business administration from Centrum Bevordering Import Ontw.Landn, in Rotterdam. He has been the CEO of MU Mecanicos Unidos S.A.S since 1983 and a member of the board of directors of Prebel S.A., Productos Familia S.A., Enka de Colombia S.A, Corporación Financiera Suramericana S.A.Fedemetal, Edatel, ISA, Isagen, Fabricato, Internexa and Orquesta Filarmónica de Medellín, among others. He is now dedicated to his own business.Proteccion.
Hernando José GómezLuis Fernando Restrepo Echavarría was born in 1957. He1958. Mr. Restrepo holds a bachelor's degree in Economics,industrial management from the Georgia Institute of Technology and is a Ph.D. candidateMaster’s degree in business administration from Universidad de los Andes.the University of Chicago. He had previouslyhas held several positions as director advisorin the Marmon Group of Chicago, and was also a part of the Central Bank, presidentLeadership Rotational Program in Chicago at the Rego Company (Production planning and industrial engineering), Hammond Organ Company (accountability) and Marmom Keystone (sales). He began in Crystal S.A.S as International Vice President, then he became an Executive Vice President until 2003, and since 2004 he has acted as CEO. He is part of the private counsil for competitiveness (Consejo Privado de la Competitividad), lead negotiator for the Colombian Governmentboard of directors of Andi-Antioquia, Conconcreto, Etiflex and MAS S.A.S.
The cease of functions of the free trade agreement with the United States, and directordeparting members of the National Planning Department (Departamento Nacional de Planeación),board of directors and has been a faculty member at Universidad de los Andes, and a visiting professor at Yale University.the exercise of functions of the recently appointed members are subject to confirmation by the SFC.
For additional information regarding the Bank’s boardBoard of directorsDirectors and its functions, see “Item 10.Item “10 Additional Information – B. Memorandum and Articles of Association – Board of Directors.”Directors”.
Senior Management
Carlos Raúl Yepes Jimenezwas born in 1964. He has been the President of Bancolombia since February 2011, and washad been previously a member of its boardBoard of directorsDirectors for five years. Mr. Yepes was Corporate Vice President of Cementos Argos S.A. from 2003 to 2011, Legal Director of Bancolombia from 1994 to 2003 and also Legal Director of CI Unión de Bananeros de Urabá (“Uniban”) from 1991 to 1994.
Mr. Yepes holds a degree in law from Universidad Pontificia Bolivariana and a degree in Business Lawbusiness law from Universidad Externado de Colombia.
Sergio Restrepo Isazawas born in 1961. He has been the Vice Carlos Raul resigned as President of Capital MarketsBancolombia effective as of Bancolombia since December, 2011. Previously he was Vice PresidentApril 30, 2016, and the Board of Corporate Development since the Conavi/Corfinsura merger was completed on July 30, 2005. Mr. Restrepo was President (CEO) of Corfinsura since 2004 and held various managerial positions at Corfinsura suchDirectors has appointed Juan Carlos Mora Uribe as Vice President of Investment Banking from 1996 to 2004, Vice President of Investment and International Affairs from 1993 to 1996, and prior to that, Assistant to the CEO, Regional Manager, International Sub-manager and Project Director. Mr. Restrepo Isaza holds a B.A. degree from Universidad EAFIT and a Master of Science in Management degree from Stanford University.his replacement.
Juan Carlos Mora Uribewas born in 1965. He ishas been the Corporate Innovation and Digital Transformation Vice President since 2015. He holds a B.A degree from Universidad Eafit and an M.B.A degree from Babson College. Mr. Mora has experience in diverse areas of Corporate Services. Previously hecorporate finance and investment banking and was the Risk Management Vice President of Bancolombia between July 2005 and March 2011 when he was designated as Technology and Innova Vice President. He served as the Vice President of Operations of Corfinsura since 2003 and held various positions within the corporation such as Corporate Finance Manager from 1995 to 2003, account executive from 1992 to 1995 and credit analyst from 1991 to 1992.in 2004. Most recently, Mr. Mora Uribe holds a B.A. degree from Universidad EAFITperformed the role of Vice President of Risk in 2005, and an M.B.A. degree from Babson College.then he was appointed as Chief Corporate Services Officer until 2015. He will step into the role of CEO of Bancolombia on May 1, 2016.
Santiago Pérez MorenoMaria Cristina Arrastia Uribe was born in 1955. He1965. She has been the Vice President ofChief Personal and SMEs Banking Officer since 1989, andOctober 2015. Mrs. Arrastia is a Business Administrator graduated from Eafit University in Medellin. She has held different managerial positions atperformed various roles in Bancolombia, since 1981, such as PersonalSub-Manager of the trading desk, and Regional Manager of the Corporate Banking of Antioquia. Between 1998 and 2009 she was appointed as Regional Manager for the Bogota Region, International CommercePersonal and SME Banking in Antioquia. In 2009 she was appointed as General Manager for the Bogota Region and assistant for the Vice Presidency of International Commerce. Mr. Pérez Moreno holds an Industrial Economics degree from Universidad de los Andes and an M.B.A. from IESE in Barcelona.
Jaime Alberto Velásquez BoteroSufi until 2011 when she was born in 1960. He has been the Vice President of Strategy and Finance since April 2012. Previously, he heldappointed to the position of Vice President of Finance of Bancolombia since 1997. From 1989 through 1997, he held several managerial positions in the Economic DepartmentConsumer and Investor Relations Department of the Bank. Previously, he worked at C.I. Banacol from 1987 to 1989. Mr. Velásquez Botero holds an Economics Degree from Universidad de Antioquia.
Mauricio Rosillo Rojas was born in 1969. He has been the Legal Vice President of Bancolombia since December 2008. Mr. Rosillo Rojas holds a law degree from Pontificia Universidad Javeriana, obtained a post-graduate degree in financial law from Universidad de Los Andes, and a Master’s degree in commercial and economic law from the University of Georgia. Mr. Rosillo Rojas has held several positions in the public and private sectors, including secretary general of Fedeleasing, Interim Colombian Superintendent of Cooperatives (“Superintendente de Economia Solidaria (encargado)”), director of financial regulation of the Colombian Ministry of Finance, supervisor of the securities market of the Colombian Stock Exchange and president of Autoregulador del Mercado de Valores, a Colombian self-regulatory organization.
Gonzalo Toro Bridge was born in 1960. He has been Vice President of Corporate Banking of Bancolombia since 2003. From 1988 to 1994, he was the Assistant of the Vice Presidency of Corporate and International Banking and from 1994 to 2003 he was the Vice President of Corporate and International Banking. Mr. Toro Bridge holds a B.A. degree from Universidad EAFIT and a certificate of attendance from the Advanced Management Program for overseas bankers of the University of Pennsylvania.
Augusto Restrepo Gómez was born in 1962. He was appointed as Vice President in charge of the acquisition and integration of HSBC Bank (Panama) on April 22, 2013. He was previously the Vice President of Human Resources since April 2011. Previously he held the position of Administrative Vice President of Bancolombia between August 2007 and 2011. Mr. Restrepo Gómez has worked in Bancolombia for 27 years holding several positions at different departments of Bancolombia such as analyst, sub-manager, chief of department and regional manager. Most recently he was the Administrative Vice President of Bancolombia. He is also a member of the board of directors of ACH Colombia S.A., Multienlace S.A., and Redeban Multicolor S.A. Mr. Restrepo Gómez holds a B.A. degree from the Universidad Cooperativa de Colombia, and obtained a post-graduate degree in Marketing from Universidad EAFIT. His post-graduate education also includes, among others, courses in Advanced Management from Universidad de los Andes and Universidad de la Sabana.Housing Credit.
Luis Fernando Muñoz Serna was born in 1956. He has been the Vice President of Construction Mortgage Banking since the Conavi/Corfinsura merger that was completed on July 30, 2005. He joined Conavi in 1989 as Regional Manager for Bogota, holding various positions at Conavi such as Vice President of Business Development and Vice President of Corporate Banking since 1994. Previously, Mr. Muñoz Serna worked as Branch Manager for the main office of BIC in Bogota from 1983 to 1989 and Branch Manager for the main office of Banco Real de Colombia in Bogota from April to October 1989. Mr. Muñoz Serna holds an industrial engineering degree from Pontificia Universidad Javeriana.
Luis Arturo Penagos Londoño was born in 1950. He was appointed as Vice President of Human Resources on April 22, 2013. He was previously the Vice President in charge of overseeing the implementation of the new organizational structure of the Bank since October 2011, Internal Auditor of Conavi since 1993 and the Compliance Officer since 1996. He was the CEO of El Mundo newspaper from 1990 to 1991 and the external auditor of Uniban S.A. from 1980 to 1983. He also worked as audit assistant to Coltejer S.A. from 1977 to 1990 and was the Dean of the B.A. Department of Universidad EAFIT from 1983 to 1993. Mr. Penagos Londoño is a CPA from Universidad de Antioquia. He holds an MBA degree, a specialization diploma in Systems Audit from Universidad EAFIT and a specialization diploma in Money Laundering prevention from Salamanca University.
Carmenza Henao Tisneswas born in 1960. She was appointed Vice President of Internal Audit in April 2011. Mrs. Henao has worked at Bancolombia for 28 years holding several positions at different departments of Bancolombia such as analyst and manager of audit technology. Most recently she was the Audit National Manager of Bancolombia Banches.branches. She has also been a professor at various universities including Universidad EAFIT, Universidad Pontificia Bolivariana, Universidad de Medellin and Universidad San Buenaventura. Mrs. Henao is a system engineer and has a post-graduate degree in Finance from Universidad EAFIT.
Rodrigo Prieto Uribewas born in 1973. He was appointed as Risk Management Vice President of BancolombiaRisk Management in March 2011. Mr. Prieto has worked at Bancolombia for 12 years holding several positions at different departments of Bancolombia such as analyst, manager of risk administration, planning manager and manager of Capital allocation and risk quantification. Most recently he was the director of planning and projects. He has also been a professor at several universities including Universidad EAFIT, Escuela de Ingenieria de Antioquia and Universidad de los Andes. Mr. Prieto Uribe is a civil engineer and has a Master’s degree in Economicseconomics from Universidad de los Andes and a Master’s degree in Financefinance from Instituto Tecnológico y de Estudios Superiores de Monterrey.
María Cristina Calderón BetancurAugusto Restrepo Gómezwas born in 1958. She was appointed as Vice President of Technology in October 2011. Mrs. Calderón holds a Systems Engineering degree and a post-graduate degree in Finance from EAFIT. She was Director of the Client Applications Development during the merger of BIC and Banco de Colombia. She directed the Portfolio Unit and was subsequently in charge of the Integration Project of Conavi, Corfinsura and Bancolombia and was Products Unit Director of Bancolombia until 2008. Mrs. Calderon has been leading the technological renovation program of Bancolombia since 2008.
Jose Humberto Acosta Martin was born in 1962. He was appointed as Vice President of Finance in December 2011. Mr. Acosta has been serving as Director of International Banking since 2005 and previously served as International Division Manager at Corfinsura, Methods and Organization Division Manager and General Manager of Mergers, among others. Mr. Acosta holds a degree in Business Administration from the Universidad Externado de Colombia and an MBA from the Universidad de la Sabana.
Hernan Alonso Alzate Arias was born in 1971. He was appointed as Vice President of Treasury in October 2011. He had previously held positions as Chief of Sales of Scotiabank Colombia S.A. from 2007 to 2008 and Director of Financial Resources of ISA from 1996 to 2007. Mr. Alzate Arias holds a degree in Business Administration from EAFIT University in Medellin, a MBM in Finance from State University of New York, and he is a specialist in Economy from Los Andes University in Bogota. He also studied at the London Financial Studies: “Advanced Interest Rate Derivatives and Advanced Option Trading & RM with Simple Exotics”.
Jorge Ivan Otalvaro Tobon was born in 1973. He was appointed as Administrative Vice President of Bancolombia in October 2011. Mr. Otalvaro Tobon worked in Bancolombia for 14 years holding several positions at different departments of Bancolombia such as Director of Strategy, Director of Solutions. Previously, he held some positions in Corfinsura before the merger such as Credit Analyst, Marketing Analyst, Project Chief and Technology Manager. Mr. Otalvaro holds a degree in Business Administration from EAFIT University in Medellin, an MBA from the IE in Madrid, Spain and a Master’s degree in Senior Management from Los Andes University.
María Cristina Arrastía Uribe was born in 1965. She1962.He has been the Vice President of ConsumerCorporate Services since April, 2015.Mr. Restrepo has worked for more than 30 years at the Bank, initiating his career as an assistant, and Household Credit since October 2011. Previously, shethen working in different areas of the Bank as Analyst, Sub-Manager, Chief of Department, Regional Manager and Distribution Channels Unit Director. He acted as Management Vice President between 2007 and 2011, year in which he was appointed as Human Resources Management Vice President. Mr. Restrepo holds a degree in business management from Universidad Cooperativa de Colombia, a graduate degree in Marketing from Universidad EAFIT and advanced management studies at Universidad de Los Andes and Universidad de La Sabana.
Mauricio Rosillo Rojaswas born in 1969. He has been the Legal Vice President of Bancolombia since December 2008. Mr. Rosillo holds a law degree from Pontificia Universidad Javeriana, obtained a post-graduate degree in financial law from Universidad de Los Andes, and a Master’s degree in commercial and economic law from the University of Georgia. Mr. Rosillo has held several positions in the public and private sectors, including secretary general of Fedeleasing, Interim Colombian Superintendent of Cooperatives (“Superintendente de Economia Solidaria (encargado)”), director of financial regulation of the Colombian Ministry of Finance, supervisor of the securities market of the Colombian Stock Exchange and president of AMV.
Gonzalo Toro Bridgewas born in 1960. He has been Vice President of Corporate Banking of Bancolombia since 1992 such as Deputy Manager in2003. From 1988 to 1994, he was the Money TableAssistant to the Vice Presidency of Bancolombia, Regional Manager of PersonalCorporate and SME’s Banking, Regional Manager of CorporativeInternational Banking and from 1994 to 2003 he was the Vice President of SUFI. She also held the position of Credit Executive in Bancafe. Mrs Arrastía UribeCorporate and International Banking. Mr. Toro holds a B.A. degree in Business Administration from Universidad EAFIT and a certificate of attendance from the advanced management program for overseas bankers of the University in Medellin.of Pennsylvania.
Jaime Alberto Villegas GutiérrezVelásquez Boterowas born in 1965.1960. He was appointedhas been the Vice President of Service DeliveryStrategy and Customer ExperienceFinance since April 2012. Previously, he held the position of Vice President of Finance of Bancolombia from 1997 to 2012. From 1989 through 1997, he held several managerial positions in July, 2012. Mr. Villegas holds a degree in Industrial Engineeringthe Economic Department and a post-graduate degree in Finance, both from Los Andes University in Colombia. Mr. Villegas started his financial career at Citibank and forInvestor Relations Department of the twelve years prior to his appointmentBank. Previously, he worked in finance, operations and technology for Standard Chartered Bank in Colombia, Peru, United Arab Emirates and Singapore.at C.I. Banacol from 1987 to 1989. Mr. Velásquez holds an economics degree from Universidad de Antioquia.
There are no family relationships between the directors and senior management of Bancolombia listed above.
No arrangements or understandings have been made by major shareholders, customers, suppliers or others pursuant to which any of the above directors or members of senior management were selected.
| B. | COMPENSATION OF DIRECTORS AND OFFICERS |
During 2012In 2015 the Bank paid each director a fee of COP 3.25.5 million approximately per month for sitting on the Board, and another fee of COP 3.25.0 million approximately for attending each session of the committees. The members of the Board of Directors who belong to other advisory committees were paid additional monthly fees ranging from COP 3.2 million to COP 5.8 million.
The directors received no other compensation or benefits. There is no stock option plan for directors. Consistent with Colombian law, the Bank does not make publicpublish information regarding the compensation of the Bank’s individual officers. The Bank’s stockholders may request that information during the period preceding the annual general stockholders’ meeting. The aggregate amount of remuneration paid by the Bank and consolidated subsidiaries to all directors, alternate directors and senior management during the fiscal year ended December 31, 20122015 was COP 40.6356.18 billion. A totalAdditionally, the bank has established a retirement bonus for senior management, and at the end of 2015 the provision to this effect was COP 3.0 billion29.43 billion. In 2015, no bonus was paid by the Bank in 2012 to any retiring senior managers who retired from the company during the year.managers.
The Board of Directors approves the salary increases for vice presidents and authorizes the CEOChief Executive Officer to readjust the salary of the remaining employees.
The Bank has established an incentive compensation plan that awards bonuses annually or semi-annually to its management employees. In determining the amount of any bonuses, the Bank takes into consideration the overall return on equity of the Bank and its executives’ achievement of their individualestablished goals. The Bank’s variable compensation has deferred elements and, depending on the amount awarded, the bonuses are payable in cash and as a combination of cash, a right to receive in three years an amount in cash determined with reference to the value of the Bank’s stocks and an entitlement to a share in a pool of unvested bonuses. The pool of unvested bonuses is an account of preliminary bonuses, payable once it is established that the results that are the basis of such bonuses have been sustained over time and were not the result of a particular, extraordinary transaction that does not reflect better performance, according to guidelines designed by the Bank. Such elements are solely paid when certain future profits are obtained. This incentive compensation plan is not in the form of stock options.
The Bank paid a total of COP 1,2321,524 billion for salaries of personnel employed directly by the Bank and senior management of its affiliates. TheSuch amount includes the sum of approximately COP 77.85130.14 billion that was paid forspent in connection with the incentive compensation plan was included in the total amount.plan.
As of December 31, 2012,2015, the Bank had provisioned 100% of its actuarial obligation corresponding to retirement pension’spensions payable by the Bank, which amounted to COP 118.43120.54 billion. Decree 4565 of 2010 established the year 2029 as the deadline for amortization.
Composition of the Board of
Directors for the period April
2011-March 2013:
Name | | First Elected to the Board | | | Term Expires | |
| David Bojanini García | | | 2006 | | | | 2013 | |
| José Alberto Vélez Cadavid | | | 1996 | | | | 2013 | |
| Carlos Enrique Piedrahita Arocha | | | 1994 | (1) | | | 2013 | |
| Gonzalo Alberto Pérez Rojas | | | 2004 | (2) | | | 2013 | |
| Ricardo Sierra Moreno | | | 1996 | (3) | | | 2013 | |
| Alejandro Gaviria Uribe | | | 2005 | (4) | | | 2013 | |
| Rafael Martinez Villegas | | | 2010 | | | | 2013 | |
The following table reflects the composition of the Board of Directors as of March 31, 2015.
| Name | | | Elected to the Board | | | | Term Expires | |
| David Bojanini García | | | 2006 | | | | 2018 | |
| Roberto Ricardo Steiner Sampedro | | | 2014 | | | | 2018 | |
| Gonzalo Alberto Pérez Rojas(1) | | | 2004 | | | | 2018 | |
| Hernando José Gómez Restrepo | | | 2013 | | | | 2018 | |
| Luis Fernando Restrepo Echavarría(2) | | | 2016 | | | | 2018 | |
| Arturo Condo Tamayo(2) | | | 2016 | | | | 2018 | |
| Andrés Felipe Mejía Cardona(2) | | | 2016 | | | | 2018 | |
| José Alberto Vélez Cadavid(3) | | | 1996 | | | | 2016 | |
| Ricardo Sierra Moreno(3)(4) | | | 1996 | | | | 2016 | |
| Rafael Martínez Villegas(3) | | | 2010 | | | | 2016 | |
(1) Carlos Enrique Piedrahita Arocha had previously served as Bank’s Director during the period 1990-1993.
| (1) | Gonzalo Alberto Pérez Rojas had previously served as the Bank’s Director during the period 1990-1994. |
| (2) | Members appointed by the general shareholders’ metting on March 16, 2016, pending confirmation by the SFC. |
| (3) | Cease of functions of these members is subject to the confirmation of the appointment of the newly elected members by the SFC. |
| (4) | Ricardo Sierra Moreno had previously served as the Bank’s Director during the period 1982-1988. |
(2) Gonzalo Alberto Pérez Rojas had previously served as Bank’s Director during the period 1990-1994.
(3)Messrs. Hernando José Gómez Restrepo, Roberto Ricardo Steiner Sampedro, Ricardo Sierra Moreno had previously servedand Rafael Martínez Villegas act as independent directors in accordance with the Bank’s Director during the period 1982-1988.
(4) Alejandro Gaviria Uribe resignedby-laws and other applicable laws. Upon confirmation of their appointment as a membermembers of the Board of Directors on August 2012, due to his appointmentby the SFC, Luis Fernando Restrepo Echavarría, Arturo Condo Tamayo and Andres Felipe Mejía Cardona will act as Health Ministerindependent members. Consequently, the majority of Colombia.
At the annual shareholders’ meeting held on March 4, 2013, the shareholders appointed the following individuals to serve on the boardBoard of directors for the 2013 – 2015 period:
| · | David Emilio Bojanini García |
| · | José Alberto Vélez Cadavid |
| · | Carlos Piedrahita Arocha |
| · | Gonzalo Alberto Pérez Rojas |
| · | Rafael Martínez Villegas |
| · | Hernando José Gómez Restrepo |
Mr. Ricardo Sierra Moreno, Rafael Martínez Villegas and Hernando José Gómez Restrepo were appointed asDirectors is composed of independent directors.
Neither the Bank nor its Subsidiaries have any type of agreement with the Bank’s directors providing for benefits upon termination of their term.
The following are the current terms of office and the period during which the members of senior management have servedacted as such in Bancolombia. There are no defined expiration terms. The members of senior management can be removed by a decision of the boardBoard of directors.Directors.
| Name | | Period Served |
| President | | |
| Carlos Raúl Yepes Jimenez | | Since 2011 |
| | | |
| Vice Presidents | | |
Sergio Restrepo Isaza | | Since 2005 |
| Jaime Alberto Velásquez Botero | | Since 1997 |
| Juan Carlos Mora Uribe | | Since 2005 |
| Mauricio Rosillo Rojas | | Since 2008 |
Santiago Pérez MorenoMaria Cristina Arrastia | | Since 19891998 |
| Gonzalo Toro Bridge | | Since 1998 |
Luis Fernando Muñoz Serna | | Since 2005 |
Jose Humberto Acosta Mantín | | Since 2011 |
Hernán Alonso Alzate Arias | | Since 2011 |
| Augusto Restrepo Gómez | | Since 2007 |
Carlos Alberto Rodriguez López(1) | | Since 2008 |
| Rodrigo Prieto Uribe | | Since 2011 |
María Cristina Calderon Betancur | | Since 2011 |
Jorge Iván Otálvaro Tobón | | Since 2011 |
| Carmenza Henao Tisnes | | Since 2011 |
María Cristina Arrastía Uribe | | Since 2011 |
Jaime Alberto Villegas Gutiérrez | | Since 2012 |
Luis Arturo Penagos Londoño | | Since 2006 |
| (1) | Resigned on March 04, 2013. |
Neither the Bank nor its Subsidiaries have any service contracts with the Bank’s directors providing for benefits upon termination of employment.
For further information about the Bank’s corporate governance practices please see “ItemItem 16. Reserved“Reserved – 16.B.B. Corporate Governance and Code of Ethics”.
Audit Committee
In accordance with the Colombian regulation,regulations, the Bank has an audit committee whose main purpose is to support the Bank’s boardBoard of directors inDirectors by supervising the effectiveness of the Bank’s internal controls. The committee consists of three independent directors, one of whom must be a financial expert, who are elected by the board of directors for a period of two years.
The audit committee is composed of Mr. Hernando José Gómez Restrepo, Mr. Rafael MartinezMartínez Villegas and Mr. Ricardo Sierra Moreno. Subject to confirmation by the SFC, Mr. Alejandro Gaviria Uribe resigned as a memberMartínez and Mr. Sierra will cease to be part of the Board of Directors, and the Audit Committee on August 2012, due to his appointment as Health Minister of Colombia. On March 4, 2013 the shareholders appointed Hernando José Gómez Restrepo as an independent membertwo of the Board of Directors and he was authorizednewly appointed independent members will be designated by the SFCsuch board to assume his duties as director and memberbe a part of the Audit Committee on April 12, 2013.
audit committee.
Pursuant to applicable U.S. laws for foreign private issuers, Mr. Rafael MartinezMartínez Villegas serves as the interim financial expert of the Audit Committee.audit committee.
As established by the SFC, the audit committee has a charter approved by the Bank’s boardBoard of directorsDirectors which establishes its composition, organization, objectives, duties, responsibilities and extension of its activities. The Bank’s boardBoard of directorsDirectors also establishes the remuneration of the members of the audit committee. The audit committee must meet at least quarterly and must present a report of its activities at the general stockholders’ meeting.
The Bank currently complies with the requirements of the Sarbanes-Oxley Act of 2002 and the rules promulgated thereunder, as applicable to foreign private issuers with respect to the composition and functions of its audit committee.
Designation, Compensation and Development Committee
This Committeecommittee is composed of two members of the Board of Directors elected by it. The Vice President of Human Relations of the Bank acts as Secretarysecretary of this Committee.committee.
The Designation, Compensationdesignation, compensation and Development Committeedevelopment committee determines the policies and provisions for the hiring, remuneration, compensation, and development of management and key personnel of the Bank. Likewise, it continuously surveys the goals of the different compensation programs with regard to the performance of the officers, and it assesses the efficacy of such programs.
The duties of the Designation, Compensationdesignation, compensation and Development Committeedevelopment committee are: (i) defining the administration policies of human resources, establishing the selection, evaluation, compensation, and development processes for top management, determining their goals; (ii) determining the objective criteria under which the Bank hires its principal officers; (iii) proposing objective criteria under which the Bank hires senior management and designs succession plans; (iv) evaluating the performance of senior management; and (v) issuing recommendations for the boardBoard of directors of the BankDirectors concerning appointments and compensation of the Presidentpresident and senior management.
The members of the Designation, Compensationdesignation, compensation and Developmentdevelopment committee are Ricardo Sierra Moreno, Carlos Enrique Piedrahita Arocha, David Bojanini Garcia and JoseJosé Alberto VelezVélez Cadavid. Subject to confirmation by the SFC, Mr. Sierra and Mr. Vélez will cease to be part of the Board of Directors, and two of the newly appointed members will be designated by such board to be a part of this committee.
Good Governance Committee
The Good Governance Committee consists of at least three (3) members of the Board of Directors, one of them being an independent member. Bancolombia’s President attends this committee on a permanent basis.
The Good Governance Committee has internal regulation to govern aspects such as composition and guests to the meetings, competences, and responsibilities of the Committee and its internal regulations.
The main purpose of this Committee is to assist Bancolombia’s Board of Directors in overseeing compliance with the Corporate Governance measures and review any potential change to such measures.
This Committee shall also support the Board of Directors in cases related to the implementation of succession policies of the Board of Directors and its remuneration.
This Committee furnishes reports on the activities performed by the Bank’s Board of Directors, and approves a yearly report on Corporate Governance, to be submitted before the Shareholders General Meeting.
The members of the Good Governance Committee are David Bojanini García, José Alberto Vélez Cadavid and Rafael Martinez Villegas. Subject to confirmation by the SFC, Mr. Vélez and Mr. Martínez will cease to be part of the Board of Directors, and two of the newly appointed members will be designated by such board to be a part of this committee.
The following table sets forth the number of employees of the Bank for the last three fiscal years:
| As of December 31 | | Total number of employees employed by
Bancolombia and its consolidated Subsidiaries | | | Number of employees employed by Bancolombia
and Bancolombia Miami Agency | |
| 2012 | | | 24,820 | | | | 17,532 | |
| 2011 | | | 23,765 | | | | 16,982 | |
| 2010 | | | 22,992 | | | | 16,209 | |
| As of December 31 | | Total number of employees employed by
Bancolombia and its consolidated Subsidiaries | | | Number of employees employed by Bancolombia | |
| 2015 | | | 34,392 | | | | 19,544 | |
| 2014 | | | 30,158 | | | | 18,867 | |
| 2013 | | | 28,763 | | | | 18,463 | |
As of December 31, 2012,2015, Bancolombia and its consolidated subsidiaries had 24,82034,392 employees, of which 17,53219,544 were employed directly by the Bank. Of the 17,53219,544 employees directly contracted by the Bank, 11,96912,940 are operations personnel and 5,5636,604 are management employees. Of the 17,53219,544 employees, approximately 24.84%23.45% are located in the Bogota Region, 12.77%11.36% in the South Region, 16.05%14.94% in the Antioquia Region, 24.14%28.09% in the Medellin headquarters, 12.27%12.18% in the Central Region 9.93%and 9.98% in the Caribbean Region and 0.12% in the Miami Agency.Region. During 2012,2015, the Bank employed an average of 240237 employees per month through temporary personnel service companies.
Of the employees directly employed by Bancolombia, approximately 15.64%23% are part of a labor union called Sintrabancol, 10.26%13.65% are members of an industry union called Uneb, 0.71%1.13% belong to an industry labor union called Sintraenfi, 0.10% belong to an industry labor union called Uprofin, 0.13% belong to an industry labor union called USF and 0.02%0.04% belong to an industry labor union called Aceb. A collective bargaining agreement was reached with Uneb and Sintrabancol in October, 2011.2014. The agreement has been in effect since November 1, 20112014 and is set to expire on October 31, 2014.2017. This agreement applies to approximately 11,95113,424 employees regardless of whether they are members of a union. Sintranefi, which isan union or not and it extends to operating personnel employed by the subsidiaries Banca de Inversión Bancolombia, Valores Bancolombia, Leasing Bancolombia and Fiduciaria Bancolombia. Sintraenfi, the labor union composed of approximately 125220 employees, did not take part in the collective bargaining agreement. The latter labor union has made a request for an arbitration court to settle this dispute, a request which is currently in process by the respective administrativejudicial authorities, and if it is successful it would cover only the members of the said union; nevertheless, the terms of the agreement reached with UNEB and Sintrabancol apply as well to the members of the Sintraenfi union.
With the execution of this agreement, the Bank, Uneb and Sintrabancol continue to work on the consolidation of long-term labor relationships based on mutual trust and respect.
The most important economic aspects of the Agreement are:
1. A pay increase of 7% for the first year. For the second year, the increase will be(8.77%) was equal to the variation in the Colombian consumer price index (“IPC”), as certified by the Colombian statistical bureau (“DANE”) for the period between November 2011January 2015 and October 2012,December 2015, plus 150200 basis points. For the third year, the increase will be equal to the IPC variation, for the period between November 20122015 and October 2013,2016, plus 180250 basis points.
For the salary increases corresponding to the second and the third year in which the current collective bargaining agreement is in place, the Bank will apply whichever is greatest between the variation of the national Consumer Price Index (IPC)IPC for the last twelve12 months, and the variation of the national IPC for the period between October 31 and December 31 of the year in question. The same criteria will be applied for the subsidies and benefits associated to salary increases.
2. Improved benefits, forsuch as, immediate right to access first home loan after 4 years of tenure, increased amounts to the Bank’s covered employees, including increases in the amounts of individual housingfirst home loans, tuition aid fund,improved health insurance coverage, transportation and food assistance. Increase in tuition assistance and a new tuition loan.
The following directors and managersmembers of the senior management owned common shares in Bancolombia as of December 31, 2012:2015: David Bojanini García, Rafael Martinez Villegas, Ricardo Sierra Moreno, Gonzalo Alberto Pérez Rojas, Sergio Restrepo Isaza, Carlos Alberto Rodríguez López, Gonzalo Toro Bridge Luz María Velásquez Zapata, Mario Sebastián Alcalá Castro and José Manuel Pérez Montoya.Sergio Pelaez Jaramillo.
The following managersdirectors and members of senior management owned preferred shares in Bancolombia as of December 31, 2012: Sergio Restrepo Isaza,2015: Roberto Ricardo Steiner Sampedro, Gonzalo Toro Bridge, Luis Santiago Pérez Moreno, Luz María Velásquez Zapata, Mario Sebastián Alcalá CastroSergio Pelaez Jaramillo and José Manuel Pérez Montoya.Julian Botero Larrañaga.
None of the directors and managers’members of senior management’s shareholdings, individually or in the aggregate, exceed 1% of Bancolombia’s outstanding common shares, preferred shares or a combination of both classes of shares.
As of December 31, 2012,2015, there are no stock options to acquire any of Bancolombia’s outstanding common shares or preferred shares or share basedshare-based payment to any employee.
| ITEM 7. | MAJOR STOCKHOLDERSSTOCKHOLDERs AND RELATED PARTY TRANSACTIONS |
In accordance with the Bank’s by-laws, there are two classes of stock authorized and outstanding: common shares and preferred shares. Each common share entitles its holder to one vote at meetings of the Bank’s stockholders, and there are no differences in the voting rights conferred by any of the common shares. Under the Bank’s by-laws and Colombian corporate law, holders of preferred shares (and consequently, holders of ADRs) have no voting rights in respect of preferred shares, other than in limited circumstances as described in “Item 10. Additional Information – B. Memorandum and Articles of Association – Description of Share Rights, Preferences and Restrictions – Voting Rights – Preferred Shares”.
The following table sets forth, solely for purposes of United States securities laws, certain information regarding the beneficial ownership of Bancolombia’s capital stock by each person known to Bancolombia to own beneficially more than 5% of each class of Bancolombia’s outstanding capital stock as of February 28, 2013.March 31, 2016. A beneficial owner includes anyone who has the power to receive the economic benefit of ownership of the securities.
| Name | | Common
Shares | | | Preferred
Shares | | | % Ownership
of Common
Shares(1) | | | % Ownership
of Preferred
Shares(1) | | | % Ownership
of Total
Shares(1) | | | Common Shares | | | Preferred Shares | | | % Ownership
of Common
Shares(1) | | | % Ownership
of Preferred
Shares(1) | | | % Ownership
of Total
Shares(1) | |
| | | | | | | | | | | | | | | | | | | | | | |
| Grupo de Inversiones Suramericana S.A(2) | | | 228,209,967 | | | | 171,762 | | | | 44.77 | % | | | 0.05 | % | | | 26.81 | % | | | 237,363,392 | | | | 16,147,114 | | | | 46.57 | % | | | 3.57 | % | | | 26.36 | % |
| Grupo Argos S.A.(3) | | | 33,139,106 | | | | - | | | | 6.50 | % | | | 0.00 | % | | | 3.89 | % | | | 28,139,106 | | | | - | | | | 5.52 | % | | | 0.00 | % | | | 2.93 | % |
| ADR Program | | | - | | | | 171,239,196 | | | | 0.00 | % | | | 50.05 | % | | | 20.10 | % | | | - | | | | 209,986,616 | | | | 0.00 | % | | | 46.44 | % | | | 21.83 | % |
| Fondo de Pensiones Obligatorias Protección S.A. | | | 19,147,146 | | | | 40,360,702 | | | | 3.76 | % | | | 11.80 | % | | | 6.99 | % | |
| Fondo de Pensiones Obligatorias Protección | | | | 21,601,534 | | | | 51,541,660 | | | | 4.24 | % | | | 11.40 | % | | | 7.60 | % |
| Fondo de Pensiones Obligatorias Porvenir Moderado | | | 38,497,961 | | | | 17,250,304 | | | | 7.55 | % | | | 5.04 | % | | | 6.54 | % | | | 56,148,347 | | | | 33,221,398 | | | | 11.02 | % | | | 7.35 | % | | | 9.29 | % |
| (1)(1) | Common shares have one vote per share; preferred shares have limited voting rights under certain circumstances specified in the by-laws of Bancolombia filed as Exhibit 1 to this Annual Report. |
| (2) | Represents ownership of Grupo de Inversiones Suramericana S.A. directly and through its subsidiaries: PortafolioGrupo de Inversiones Suramericana Panamá S.A. (en liquidacion), Fideicomiso Cititrust - Suramericana II, Inversiones y Construcciones Estrategicas S.A., Cia. Suramericana de Seguros de Vida S.A., Cia. Suramericana de Seguros S.A., Suratep. |
| (3) | Represents ownership of Grupo Argos S.A. directly and through its subsidiary Cementos Argos S.A. |
As of February 28, 2013,March 31, 2016, a total of 509,704,584 common shares and 342,122,416452,122,416 preferred shares were registered in the Bank’s stockholder registry in the name of 15,11551,278 stockholders. A total of 171,239,196209,986,616 representing 50.05%46.44% of preferred shares were part of the ADR Program and were held by 38 record holders registered in The Bank of New York Mellon’s registered stockholder list. Given that some of the preferred shares and ADSs are held by nominees, the number of record holders may not be representative of the number of beneficial owners.
During the past year, the Bank’s ADR program changed its percentage ownership of the Bank, decreasingincreasing from 22.28%21.77% as of February 29, 2012March 31, 2015 to 20.10%21.83% by the end of February 2013March 2016 as depositary receipts were created throughout the period, and in particular as a product of the preferred stock issuance that took place in February 2012.period. In addition, Fondo de Pensiones Obligatorias Protección, a Colombian private pension fund manager, increased its percentage ownership to 6.99%7.60% as of February 28, 2013March 31, 2016 compared to 4.24%7.22% as of February 29, 2012;March 31, 2015; and Fondo de Pensiones Obligatorias Porvenir Moderado a Colombian private pension fund manager increased its percentage of ownership to 6.54%9.29% as of February 28, 2013March 31, 2016 compared to 6.15%8.57%, as of February 29, 2012.March 31, 2015.
There are no arrangements known to the Bank which may at a subsequent date result in a change in control of the company.
To the extent known to the Bank, and in accordance with Colombian law, Bancolombia is not directly or indirectly owned or controlled by any other entity or person.
| B. | RELATED PARTY TRANSACTIONS |
Colombian law sets forth certain restrictions and limitations on transactions carried out with related parties, these being understood as principal shareholders, subsidiaries and management officials.
Limitations on related party transactions are set forth, mainly, in articlesArticles 119 and 122 of Decree 663 of 1993, in the Colombian Commercial Code of Commerce and, regarding credit and risk concentration limits (legal lending limits), in Decree 2.5552555 of 2010, all as amended.
The above-mentioned regulations set forth, among others, the following guidelines: (i) subsidiaries must carry out their activities independently and with administrative autonomy; (ii) transactions between the parent company and its subsidiaries must have economic substance and cannot differ considerably from standard market conditions, nor in detrimental to the Colombian Government,government, stockholders or third parties; and (iii) subsidiaries may not acquire any shares issued by their parent company.
According to the provisions of the Colombian Commercial Code, of Commerce, neither the Bank’s directors nor its management may, directly or indirectly, purchase or sell shares issued by the Bank while they remain in their offices, except when said transactions are carried out for reasons other than purely speculative and upon prior authorization of (i) the boardBoard of directors,Directors, which shall be granted by the affirmative vote of two-thirds of its members, or (ii) at a shareholders meeting;the shareholders; in either case, excluding the vote of the person requesting such authorization, if applicable.
The Bank’s Corporate Governance Code provides that, in any event, any transaction regarding Bancolombia’s shares that is carried out by any officer, director or manager may not be executed for speculative purposes, which would be presumed if the following three conditions were met: (a) if suspiciously short lapses of time exist between the purchase and the sale of shares; (b) if situations arise proving to be exceptionally favorable for the Bank; and (c) if significant profits are obtained from this transaction.
Pursuant to Article 122 of Decree 663 of 1993, transactions entered into by credit institutions with (i) their shareholders holding 5% or more of the outstanding capital, (ii) their managers, or (iii) spouses and certain relatives of shareholders and managers, shall require the unanimous affirmative vote of the members of the boardBoard of directorsDirectors attending the corresponding meeting. The Board of Directors may not authorize transactions subject to terms and conditions other than those usually agreed by the entityBank with non-related parties.
All transactions that the Bank enters into with its directors, officers and senior executives shall beare subject to the limitations and conditions set forth by the applicable law governing the prevention, handling and resolution of conflicts of interest.
Over time, Bancolombia has granted loans and engaged in other transactions with related parties. Such loans were made in the ordinary course of business, on substantially the same terms, including interest rates and required collateral, as those prevailing at the time for comparable transactions with other persons, and did not involve more than the normal risk of collectability, and do not present any additional unfavorable terms for the Company.
Between the parent company and its related parties, during the period ended as of December 31, 2015 there were no:
- Loans implying for the borrower an obligation that does not correspond to the essence or nature of the loan agreement.
- Loans with interest rates different to those that are ordinarily paid or charged to third parties in similar conditions of term, risk, etc.
- Operations whose characteristics differ from those carried out with third parties.
Bancolombia, on a non-consolidated basis, had a total amount of COP 1,315,2452.158.007 million in loans outstanding to related parties as of February 28, 2013.29, 2016. The principal amounts outstandingoutstandings as of February 28, 2013 included29, 2016 includes in this amount are:
| Entity | | Amount outstanding | | | Accrued Interest | | | Average Interest rate | |
| Grupo Argos S.A. | | | 429,522 | | | | 3,936 | | | | 5.52 | % |
| FCP Fondo Inmobiliario Colombia | | | 304,519 | | | | 604 | | | | 6.28 | % |
| Cementos Argos S.A. | | | 236,401 | | | | 1,954 | | | | 4.56 | % |
| Grupo Odinsa S.A. | | | 190,143 | | | | 125 | | | | 8.46 | % |
| Entitiy | | Amount
outstanding | | | Accrued
Interest | | | Average Interest
rate | |
| Leasing Bancolombia S.A. | | | 1,354,012 | | | | 13,909 | | | | 7.32 | % |
| Renting Colombia S.A. | | | 220,028 | | | | 2,571 | | | | 7.34 | % |
| Grupo Odinsa S.A. | | | 161,504 | | | | 3,541 | | | | 11.30 | % |
| FCP Fondo Inmobiliario Colombia | | | 142,080 | | | | 515 | | | | 11.77 | % |
| Inversiones CFNS S.A.S. | | | 46,543 | | | | 698 | | | | 7.98 | % |
| | | 2012 | | | 2015 | |
| | | Enterprises that directly or indirectly
through one or more intermediaries,
control or are controlled by, or are
under common control with, the
company and associates | | | Key management personnel | | | Entities that directly or indirectly
through one or more intermediaries,
control or are controlled by, or are
under common control with, the
Bank and associates | | | Key management personnel | |
| | | (COP million) | | | | | | (in millions of COP) | |
| Balance Sheet | | | | | | | | | |
| Statement of financial position: | | | | | | |
| Investment securities | | COP | 123,970 | | | COP | - | | | | 974,366 | | | | - | |
| Loans | | | 1,158,246 | | | | 74,010 | | | | 16,660 | | | | 20,194 | |
| Customers’ acceptances and derivatives | | | 18,759 | | | | - | | | | - | | | | - | |
| Accounts receivable | | | 12,329 | | | | 3,732 | | | | - | | | | - | |
| Other assets | | | 245,946 | | | | - | | |
| Other Assets | | | | 5,063 | | | | - | |
| Total | | COP | 1,559,250 | | | COP | 77,742 | | | COP | 996,089 | | | COP | 20,194 | |
| | | | | | | | | | | | | | | | | |
| Deposits | | | 3,997,513 | | | | 7,088 | | | | 149,916 | | | | 1,496 | |
| Derivatives | | | 5,984 | | | | - | | | | - | | | | - | |
| Accounts payable | | | 18 | | | | 137 | | |
| Bonds | | | 729,400 | | | | - | | | | 2,031 | | | | 16 | |
| Total | | COP | 4,732,915 | | | COP | 7,225 | | | COP | 151,947 | | | COP | 1,512 | |
| | | | | | | | | | | | | | | | | |
| Transactions Income | | | | | | | | | |
| Transactions Income: | | | | | | | | | |
| Interest and fees | | | 53,010 | | | | 6,988 | | | | 22,588 | | | | 1,389 | |
| Dividends received | | | | 45,736 | | | | - | |
| Other income | | | | 14 | | | | - | |
| Total | | COP | 53,010 | | | COP | 6,988 | | | COP | 68,338 | | | COP | 1,389 | |
| | | | | | | | | | | | | | | | | |
| Expenses | | | | | | | | | | | | | | | | |
| Interest | | | 15,510 | | | | 774 | | | | 4,895 | | | | 23 | |
| Fees | | | 1 | | | | 331 | | | | - | | | | 792 | |
| Other expenses | | | | 1,006 | | | | - | |
| Total | | COP | 15,511 | | | COP | 1,105 | | | COP | 5,901 | | | COP | 815 | |
For additional information regarding the Bank’s related party transactions, please see “Note 29Note 27 to the Consolidated Financial Statements”.Statements.
| C. | INTEREST OF EXPERTS AND COUNSEL |
Not applicable.
| ITEM 8. | FINANCIAL INFORMATION |
| A. | CONSOLIDATED STATEMENTS AND OTHER FINANCIAL INFORMATION |
| A.1. | CONSOLIDATED FINANCIAL STATEMENTS |
Reference is made to pages F- 1F-1 through F - 143.F-171.
The Bank is involved in normal collection proceedings and restructuring proceedings with respect to certain borrowers as well as other legal proceedings. For further information regarding legal proceedings, see “ITEM 8. FINANCIAL INFORMATION – A.1. CONSOLIDATED FINANCIAL STATEMENTS - “Note 26 –Contingencies”.20 to the Consolidated Financial Statements.
The declaration, amount and payment of dividends are based on Bancolombia’s unconsolidated earnings. Dividends must be approved at the ordinary annual shareholders’ meeting upon the recommendation of the board of directors. Under the Colombian CommerceCommercial Code, after payment of income taxes and appropriation of legal and other reserves, and after setting off losses from prior fiscal years, Bancolombia must distribute to its stockholders at least 50% of its annual net income or 70% of its annual net income if the total amount of reserves exceeds its outstanding capital. Unless such minimum percentages are waived by an affirmative vote of the holders of 78% of the shares present at the shareholders’ meeting. Such dividend distribution must be made to all stockholders, in cash or in issued stock of Bancolombia, as may be determined by the stockholders, and within a year from the date of the ordinary annual stockholders’ meeting in which the dividend was declared. According to Colombia’s law, the minimum dividend per share may be waived by an affirmative vote of the holders of 78% of the shares present at the stockholders’ meeting.
The annual net profits of Bancolombia must be applied as follows: (i)first, an amount equal to 10% of Bancolombia’s net profits to a legal reserve until such reserve is equal to at least 50% of the Bank’s paid-in capital; (ii)second, to the payment of the minimum dividend on the preferred shares (for more information, see “Item 10. Additional Information – B. Memorandum and Articles of Association”); and (iii)third, as may be determined in the ordinary annual stockholders’ meeting by the vote of the holders of a majority of the shares entitled to vote.
The following table sets forth the annual cash dividends paid on each common share and each preferred share during the periods indicated:
Dividends declared with respect to net
income earned in: | | Cash Dividends
per share(1)(2) | | | Cash Dividends
per share(1)(3) | | | Cashdividends
per share(1)(2) | | | Cash dividends
per share(1)(3) | |
| | | (COP) | | (U.S. dollars) | | | (COP) | | (U.S. dollars) | |
| 2015 | | | | 888 | | | | 0.267 | |
| 2014 | | | | 830 | | | | 0.319 | |
| 2013 | | | | 776 | | | | 0.394 | |
| 2012 | | | 754 | | | | 0.412 | | | | 754 | | | | 0.412 | |
| 2011 | | | 708 | | | | 0.395 | | | | 708 | | | | 0.395 | |
| 2010 | | | 669 | | | | 0.357 | | |
| 2009 | | | 637 | | | | 0.331 | | |
| 2008 | | | 624 | | | | 0.245 | | |
| (1) | Includes common shares and preferred shares. |
| (2) | Cash dividends for 2015, 2014, 2013, 2012 and 2011 2010, 2009 and 2008 were paid in quarterly installments and cash dividends for 2012 will be paid in quarterly installments. |
| (3) | Amounts have been translated from pesos at the Representative Market Rate in effect at the end of the month in which the dividends were declared (March). |
There have not been any significant changes since the date of the annual consolidated financial statementsConsolidated Financial Statements included in this document.
| ITEM 9. | THE OFFER AND LISTING |
| A. | OFFER AND LISTING DETAILS |
Bancolombia’s ADRs, each representing four preferred shares, have been listed on the New York Stock Exchange (“NYSE”) since 1995, where they are traded under the symbol “CIB”. Bancolombia’s preferred shares are also listed on the Colombian Stock Exchange.
The table below sets forth, for the periods indicated, the reported high and low market prices and share trading volume for the preferred shares on the Colombian Stock Exchange. The table also sets forth the reported high and low market prices and the trading volume of the ADRs on the NYSE for the periods indicated:
| | | Colombian Stock Exchange | | | New York Stock Exchange | | | Colombian Stock Exchange | | New York Stock Exchange | |
| | | COP Per Preferred Share | | | USD per ADS | | | Trading Volume | | | COP Per Preferred Share | | USD per ADS | | Trading Volume | |
| | | High | | | Low | | | High | | | Low | | | (Number of ADSs) | | | High | | Low | | High | | Low | | (Number of ADSs) | |
| | | | | | | | | | | | | | | | | | | | | | | |
| Year Ending | | | | | | | | | | | | | | | | | | | | | | | | | | | | | | | | | | | | | | | | |
| December 31, 2015 | | | | 28,880 | | | | 20,080 | | | | 48.56 | | | | 23.69 | | | | 111,797,200 | |
| December 31, 2014 | | | | 31,300 | | | | 22,000 | | | | 66.78 | | | | 42.50 | | | | 104,278,406 | |
| December 31, 2013 | | | | 31,460 | | | | 23,380 | | | | 70.62 | | | | 47.59 | | | | 63,665,433 | |
| December 31, 2012 | | | 30,600 | | | | 24,220 | | | | 69.50 | | | | 53.78 | | | | 100,220,776 | | | | 30,600 | | | | 24,220 | | | | 69.50 | | | | 53.78 | | | | 100,220,776 | |
| December 31, 2011 | | | 31,100 | | | | 25,160 | | | | 69.87 | | | | 53.56 | | | | 83,520,522 | | | | 31,100 | | | | 25,160 | | | | 69.87 | | | | 53.56 | | | | 83,520,522 | |
| December 31, 2010 | | | 31,820 | | | | 20,400 | | | | 69.44 | | | | 40.10 | | | | 92,823,574 | | | | 31,820 | | | | 20,400 | | | | 69.44 | | | | 40.10 | | | | 92,823,574 | |
| December 31, 2009 | | | 24,200 | | | | 10,440 | | | | 48.00 | | | | 15.90 | | | | 110,933,010 | | |
| December 31, 2008 | | | 18,960 | | | | 9,300 | | | | 44.00 | | | | 15.00 | | | | 135,165,148 | | |
Source: NYSENet (Composite Index) and Colombian Stock Exchange.
| | | Colombian Stock Exchange | | | New York Stock Exchange | |
| | | COP Per Preferred
Shares | | | Trading
Volume | | | USD per ADS | | | | |
| | | High | | | Low | | | (Number of
Shares) | | | High | | | Low | | | Trading Volume
(Number of ADSs) | |
| | | (in nominal pesos) | | | | | | | | | | |
| 2013 | | | | | | | | | | | | | | | | | | | | | | | | |
| First quarter | | | 31,460 | | | | 28,300 | | | | 18,455,997 | | | | 70.62 | | | | 61.37 | | | | 18,330,475 | |
| | | | | | | | | | | | | | | | | | | | | | | | | |
| 2012 | | | | | | | | | | | | | | | | | | | | | | | | |
| First quarter | | | 29,040 | | | | 26,100 | | | | 55,123,698 | | | | 66.11 | | | | 56.87 | | | | 33,073,377 | |
| Second quarter | | | 30,600 | | | | 26,520 | | | | 34,020,628 | | | | 69.50 | | | | 58.46 | | | | 23,442,409 | |
| Third quarter | | | 28,660 | | | | 24,220 | | | | 48,088,203 | | | | 64.86 | | | | 53.78 | | | | 25,842,301 | |
| Fourth quarter | | | 29,980 | | | | 26,640 | | | | 32,050,564 | | | | 67.00 | | | | 59.19 | | | | 17,862,689 | |
| | | | | | | | | | | | | | | | | | | | | | | | | |
| 2011 | | | | | | | | | | | | | | | | | | | | | | | | |
| First quarter | | | 29,700 | | | | 25,160 | | | | 40,901,113 | | | | 63.53 | | | | 53.56 | | | | 26,407,950 | |
| Second quarter | | | 29,980 | | | | 27,780 | | | | 25,006,440 | | | | 67.01 | | | | 61.83 | | | | 17,070,939 | |
| Third quarter | | | 29,880 | | | | 26,000 | | | | 30,674,067 | | | | 67.35 | | | | 55.70 | | | | 21,196,499 | |
| Fourth quarter | | | 29,800 | | | | 26,520 | | | | 27,263,359 | | | | 64.35 | | | | 54.66 | | | | 18,824,920 | |
| | | Colombian Stock Exchange | | | New York Stock Exchange | |
| | | COP Per Preferred
Share | | | Trading Volume | | | USD per ADS | | | | |
| | | High | | | Low | | | (Number of Shares) | | | High | | | Low | | | Trading Volume
(Number of ADSs) | |
| | | (in nominal pesos) | | | | | | | | | | |
| | | | | | | | | | | | | |
| 2016 | | | | | | | | | | | | | | | | | | | | | | | | |
| First quarter | | | 26,980 | | | | 20,460 | | | | 48,443,358 | | | | 34.56 | | | | 24.69 | | | | 20,403,900 | |
| 2015 | | | | | | | | | | | | | | | | | | | | | | | | |
| First quarter | | | 28,880 | | | | 23,740 | | | | 44,059,256 | | | | 48.56 | | | | 36.23 | | | | 32,659,705 | |
| Second quarter | | | 28,140 | | | | 25,400 | | | | 31,944,253 | | | | 46.61 | | | | 39.00 | | | | 21,519,900 | |
| Third quarter | | | 28,400 | | | | 23,340 | | | | 35,368,754 | | | | 43.51 | | | | 28.68 | | | | 22,562,300 | |
| Fourth quarter | | | 28,100 | | | | 20,080 | | | | 48,224,705 | | | | 39.40 | | | | 23.69 | | | | 35,057,000 | |
| | | | | | | | | | | | | | | | | | | | | | | | | |
| 2014 | | | | | | | | | | | | | | | | | | | | | | | | |
| First quarter | | | 27,440 | | | | 22,000 | | | | 58,591,558 | | | | 56.48 | | | | 42.77 | | | | 31,239,335 | |
| Second quarter | | | 28,100 | | | | 25,540 | | | | 52,735,647 | | | | 59.60 | | | | 53.20 | | | | 23,039,202 | |
| Third quarter | | | 31,300 | | | | 27,100 | | | | 37,993,293 | | | | 66.78 | | | | 56.06 | | | | 18,297,717 | |
| Fourth quarter | | | 30,400 | | | | 26,020 | | | | 37,548,935 | | | | 58.15 | | | | 42.50 | | | | 31,702,152 | |
Source: NYSENet (Composite Index) and Colombian Stock Exchange.
| | | Colombian Stock Exchange | | | New York Stock Exchange | |
| | | COP Per Preferred Share | | | USD per ADS | | | Trading Volume | |
| | | High | | | Low | | | High | | | Low | | | (Number of ADSs) | |
| | | | | | | | | | | | | | | | |
| Month | | | | | | | | | | | | | | | | | | | | |
| March 2013 | | | 29,560 | | | | 28,300 | | | | 65.57 | | | | 61.37 | | | | 5,598,000 | |
| February 2013 | | | 31,460 | | | | 29,400 | | | | 70.62 | | | | 64.65 | | | | 6,060,900 | |
| January 2013 | | | 31,200 | | | | 29,580 | | | | 70.59 | | | | 66.54 | | | | 6,671,575 | |
| December 2012 | | | 29,980 | | | | 28,760 | | | | 67.00 | | | | 63.49 | | | | 6,199,200 | |
| November 2012 | | | 29,300 | | | | 27,620 | | | | 64.38 | | | | 61.42 | | | | 5,418,001 | |
| October 2012 | | | 29,240 | | | | 26,640 | | | | 64.08 | | | | 59.19 | | | | 6,245,488 | |
| | | Colombian Stock Exchange | | | New York Stock Exchange | |
| | | COP Per Preferred Share | | | USD per ADS | | | Trading Volume | |
| | | High | | | Low | | | High | | | Low | | | (Number of ADSs) | |
| | | | | | | | | | | | | | | | |
| Month | | | | | | | | | | | | | | | | | | | | |
| March 2016 | | | 26,980 | | | | 24,500 | | | | 34.56 | | | | 29.85 | | | | 8,765,600 | |
| February 2016 | | | 25,200 | | | | 23,600 | | | | 30.42 | | | | 27.51 | | | | 6,232,600 | |
| January 2016 | | | 24,000 | | | | 20,460 | | | | 29.54 | | | | 24.69 | | | | 5,405,700 | |
| March 2015 | | | 26,220 | | | | 23,740 | | | | 41.30 | | | | 36.23 | | | | 10,999,516 | |
| February 2015 | | | 28,880 | | | | 25,760 | | | | 48.39 | | | | 40.93 | | | | 8,209,348 | |
| January 2015 | | | 28,880 | | | | 26,680 | | | | 48.56 | | | | 43.81 | | | | 13,450,841 | |
Source: NYSENet (Composite Index) and Colombian Stock Exchange.
ADRs evidencing ADSs are issuable by The Bank of New York Mellon (the “Depositary”), as Depositary, pursuant to the Deposit Agreement, dated as of July 25, 1995, entered into by Bancolombia, the Depositary, the owners of ADRs from time to time and the owners and beneficial owners from time to time of ADRs, pursuant to which the ADSs are issued (as amended, the “Deposit Agreement”). The Deposit Agreement was amended and restated on January 14, 2008. Copies of the Deposit Agreement are available for inspection at the Corporate Trust Office of the Depositary, currently located at 101 Barclay Street, New York, New York 10286, and at the office of Fiduciaria Bancolombia, as agent of the Depositary, currently located at Carrera 48, No. 26 - 85, Medellín,Medellin, Colombia or Calle 30A No. 6-38, Bogotá, Colombia. The Depositary’s principal executive office is located at One Wall Street, New York, New York 10286.
On September 30, 1998, Bancolombia filed a registration statement on Form F-3 with the SEC to register ADSs evidenced by ADRs, each representing four preferred shares, issued in connection with the merger between BIC and Banco de Colombia for resale by the holders into the U.S. public market from time to time. On January 24, 2005, the Board determined to deregister the unsold ADSs registered under the registration statement on Form F-3. On March 14, 2005, Bancolombia filed an amendment to the registration statement deregistering the remaining unsold ADSs. On August 8, 2005, Bancolombia filed, through the Depositary, a registration statement on Form F-6 registering 50,000,000 ADSs evidenced by ADRs in connection with the Conavi/Corfinsura merger. On May 14, 2007, Bancolombia filed an automatic shelf registration statement on Form F-3 with the SEC to register an indeterminate amount of debt securities, preferred shares and rights to subscribe for preferred shares in connection with the subsequent offerings which took place in the second and third quarter of 2007. On January 14, 2008, by filing the Form F-6 with the SEC, Bancolombia increased the amount of its ADR program up to 400,000,000 American Depositary Shares, and registered some amendments to the Depositary Agreement of ADSs between Bancolombia and The Bank of New York Mellon. On July 13, 2010, Bancolombia filed an automatic shelf registration statement on Form F-3 with the SEC to register an indeterminate amount of debt securities, preferred shares, American Depositary Shares representing preferred shares and rights to subscribe for preferred shares in connection with the subsequent offering of subordinated debt securities which took place on July 19, 2010. On February 6, 2012, Bancolombia priced a public offer of 63,999,997 preferred shares without voting rights, which represented an aggregate amount of approximately COP 1,680 billion. On March 3, 2014, Bancolombia priced a public offer of 110,000,000 preferred shares without voting rights, which represented an aggregate amount of approximately COP 2,656 billion.
Not applicable.
The Colombian Stock Exchange is the principal non-U.S. trading market for the preferred shares and the sole market for the common shares. As of DecemberMarch 31, 2012,2016, the market capitalization for Bancolombia’s preferred shares based on the closing price in the Colombian Stock Exchange was COP 10,20211,701 billion (Bancolombia’s total market capitalization, which includes the common and preferred shares, was COP 25,49324,291 billion or USD 14.428.04 billion as of the same date).
There are no official market makers or independent specialists on the Colombian Stock Exchange to ensure market liquidity and, therefore, orders to buy or sell in excess of corresponding orders to sell or buy will not be executed. The aggregate equity market capitalization of the Colombian Stock Exchange, as of DecemberMarch 31, 2012,2016, was COP 483,296313,080 billion (USD 273.3104.3 billion), with 11489 companies listed as of that date.
Not applicable.
Not applicable.
Not applicable.
| ITEM 10. | ADDITIONAL INFORMATION |
Not applicable.
| B. | MEMORANDUM AND ARTICLES OF ASSOCIATION |
Set forth below is certain information concerning the Bank’s capital stock and a brief summary of certain significant provisions of the Bank’s bylaws and Colombian corporate law. This description does not purport to be complete and is qualified by reference to the Bank’s bylaws (an English translation of which is attached as Exhibit 1.1 to this Annual Report) and to Colombian corporate law.
Bancolombia’s Corporate Purpose
Pursuant to Article 4 of its bylaws, Bancolombia’s corporate purpose consists of all kinds of banking operations, business, acts and services. Subject to applicable law, Bancolombia may carry out all the activities and investments authorized to banks. Bancolombia is also authorized to participate in the capital stock of other companies, subject to any restrictions imposed by applicable law.
Board of Directors
As of the date of filing of this Annual Report, Bancolombia’s board of directors is composed of seven directors, elected for a two-year term, with no alternate directors. For additional information regarding Bancolombia’s current directors please see Item 6.A, “Directors and Senior Management Directors”.
After being designated, all of the members of the Board of Directors need an authorization from the Superintendency of Finance. The SFC assesses whether the director has an adequate profile for the position according to the requirements under Colombian Law.
According to Decree 3923 of 2006, the election of independent directors must be in a separate ballot from the ballot to elect the rest of directors, unless the reaching of the minimum number of independent directors required by law or by the by-laws is assured, or when there is only one list that includes the minimum number of required independent directors.
According to Law 964 of 2005, 25% of the members of the board of directors shall be independent. An “independent director” is a director who is NOT: (i) an employee or director of the issuer or any of its parent or subsidiary companies, including all those persons acting in said capacity during the year immediately preceding that in which they were appointed, except in the case of an independent member of the board of directors being re-elected; (ii) shareholders, who either directly or by virtue of an agreement direct, guide or control the majority of the entity’s voting rights or who determine the majority composition of the administration, the board of directors or other corporate bodies of this same entity; (iii) a partner or employee of any association or firm that provides advisory or consultancy services to the issuer or to companies who belong to the same economic group to which the issuer in question belongs, in the event that income obtained from such services represent for said association or firm twenty percent (20%) or more of its total operating income; (iv) an employee or director of a foundation, association or institution that receives significant donations from the issuer. The term “significant donations” is quantified as being twenty percent (20%) or more of the total amount of donations received by the respective institution; (v) an administrator of any entity on whose board of directors a legal representative of the issuer participates; and (vi) any person who receives from the issuer any kind of remuneration different from fees as a member of the board of directors, of the audit committee or any other committee set up by the board of directors.
Elections are made under a proportional representation voting system. Under that system: (i) each holder of common shares is entitled at the annual general shareholders’ meeting to nominate for election one or more directors; (ii) each nomination of one or more directors constitutes a group for the purposes of the election; (iii) each group of nominees must be listed in the order of preference for nominees in that group to be elected; (iv) once all groups have been nominated, holders of common shares may cast one vote for each common share held in favor of a particular group of nominees. Votes may not be cast for particular nominees in a group; they may be cast only for the entire group; (v) the total number of votes casted in the election is divided by the number of directors to be elected. The resulting quotient is the quota of votes necessary to elect particular directors. For each time that the number of votes cast for a group of nominees is divisible by the quota of votes, one nominee from that group is elected, in the order of the list of that group; and (vi) when no group has enough remaining votes to satisfy the quota of votes necessary to elect a director, any remaining board seat or seats are filled by electing the highest remaining nominee from the group with the highest number of remaining votes cast until all available seats have been filled.
The directors of Bancolombia must abstain from participating, directly or through an intermediary, on their own behalf or on behalf of a third party, in activities that may compete against the Bank or in conflict-of-interest transactions that may generate a conflict of interest situation, unless the general shareholders meeting expressly authorizes such transactions. For such purposes, the directors shall provide the shareholders meeting with all the relevant information necessary for the shareholders to reach a decision. If the director is a shareholder, his or her vote shall be excluded from the respective decision process. In any case, the general shareholders meeting could only grant its authorization if the act does not adversely affect Bancolombia’s interests.
In the general annual shareholders meeting the shareholders are responsible for determining, the compensation of the members of the board of directors.
Pursuant to the by-laws of Bancolombia, the board of directors has the power to authorize the execution of any agreement, within the corporate purpose of Bancolombia, and to adopt the necessary measures in order for the Bank to accomplish its purpose.
The Corporate Governance Code of Bancolombia provides an age limit requirement of 65 years regarding retirement for senior management.
Description of Share Rights, Preferences and Restrictions
Bancolombia’s bylaws provide for an authorized capital stock of COP 700 billion divided into 1,400,000,000 shares of a par value of COP 500 each, which must belong to one of the following classes: (i) common shares, (ii) privileged shares; and (iii) shares with preferred dividend and no voting rights (“preferred shares”). Pursuant to Article 8 of the bylaws, all shares issued shall have the same nominal value.
As of December 31, 2015, Bancolombia had 509,704,584 common shares and 452,122,416 preferred shares outstanding and a shareholders’ equity of COP 19,279 billion divided into 961,827,000 shares.
Voting Rights
Common Shares
The holders of common shares are entitled to vote on the basis of one vote per share on any matter subject to approval at a general shareholders’ meeting. These general meetings may be ordinary meetings or extraordinary meetings.
Ordinary general shareholder’s meetings occur at least once a year but no later than three months after the end of the prior fiscal year, for the following purposes: (i) to consider the approval of Bancolombia’s annual report, including the financial statements for the preceding fiscal year; (ii) to review the annual report prepared by the external auditor; (iii) to determine the compensation for the members of the board of directors, the external auditor and the client representative (defensor del consumidor financiero). The client representative’s primary duty is to solve the individual complaints submitted by clients and users and serve as their spokesman; (iv) to elect directors, the client representative and the external auditor (each for a two-year term); and (v) to determine the dividend policy and the allocation of profits, if any, of the preceding fiscal year, as well as any retained earnings from previous fiscal years.
Extraordinary general shareholders’ meetings may take place when duly called for a specified purpose or purposes, or, without prior notice, when holders representing all outstanding shares entitled to vote on the issues presented are present at the meeting.
Quorum for both ordinary and extraordinary general shareholders’ meetings to be convened at first call requires the presence of two or more shareholders representing at least half plus one of the outstanding shares entitled to vote at the relevant meeting. If a quorum is not present, a subsequent meeting is called at which the presence of one or more holders of shares entitled to vote at the relevant meeting constitutes a quorum, regardless of the number of shares represented. General shareholders’ meetings may be called by the board of directors, the President or the external auditor of Bancolombia. In addition, two or more shareholders representing at least 20% of the outstanding shares have the right to request that a general meeting be convened. Notice of ordinary meetings and extraordinary meetings convened to approve fiscal year-end financial statements, the reduction of the outstanding capital, the merger, spin-off or sale of more than 25% of the assets, liabilities and contracts, must be published in one newspaper of wide circulation at Bancolombia’s principal place of business at least 30 calendar days prior to such meeting. Notice of other extraordinary meetings, must be published in one newspaper of wide circulation at Bancolombia’s principal place of business at least 15 calendar days prior to such meeting listing the matters to be addressed at such meeting.
Except when Colombian law or Bancolombia’s bylaws require a special majority, action may be taken at a general shareholder’s meeting by the vote of two or more shareholders representing a majority of common shares present. Pursuant to Colombian law and/or Bancolombia’s bylaws, special majorities are required to adopt the following corporate actions: (i) a favorable vote of at least 70% of the shares represented at a general shareholders’ meeting is required to approve the issuance of shares without preemptive rights available for shareholders; (ii) a favorable vote of at least 78% of the holders of represented common shares to decide not to distribute as dividend at least 50% of the annual net profits of any given fiscal year; (iii) a favorable vote of at least 80% of the holders of represented common shares and 80% of the holders of outstanding preferred shares to approve the payment of the dividend in shares; and (iv) a favorable vote of at least 70% of the holders of common shares and of outstanding preferred shares to effect a decision to impair the conditions or rights established for such preferred shares, or a decision to convert those preferred shares into common shares.
If the Superintendency of Finance determines that any amendment to the bylaws fails to comply with Colombian law, it may demand that the relevant provisions be modified accordingly. Under these circumstances, Bancolombia will be obligated to comply in a timely manner.
Preferred Shares
The holders of preferred shares are not entitled to receive notice of, attend to or vote at any general shareholders’ meeting except as described below.
The holders of preferred shares will be entitled to vote on the basis of one vote per share at any shareholders’ meeting, whenever a shareholders vote is required on the following matters, in addition to those indicated above: (i) when voting the anticipated dissolution, merger or transformation of the corporation or change of its corporate purpose. (ii) when the preferred dividend has not been fully paid during two consecutive annual terms. In this event, holders of such shares shall retain their voting rights until the corresponding accrued dividends have been fully paid to them. (iii) if at the end of a fiscal period, the Bank’s profits are not enough to pay the minimum dividend and the Superintendency of Finance, by its own decision or upon petition of holders of at least ten percent (10%) of preferred shares, determines that benefits were concealed or shareholders were misled with regard to benefits received from the Bank by the Bank’s directors or officers decreasing the profits to be distributed, the Superintendency of Finance may resolve that holders of preferred shares should participate with speaking and voting rights at the general shareholders’ meeting, in the terms established by law. (iv) when the registration of shares at the Colombian Stock Exchange or at the Superintendency of Finance, is suspended or canceled. In this event, voting rights shall be maintained until the irregularities that resulted in such cancellation or suspension are resolved.
Bancolombia must cause a notice of any meeting at which holders of preferred shares are entitled to vote to be mailed to each record holder of preferred shares. Each notice must include a statement stating: (i) the date of the meeting; (ii) a description of any resolution to be proposed for adoption at the meeting on which the holders of preferred shares are entitled to vote; and (iii) instructions for the delivery of proxies.
Dividends
Common Shares
Once the Consolidated Financial Statements are approved by the general shareholders meeting, the appropriation for the payment of taxes of the corresponding taxable year has been made, and the transfers to the reserves have been performed, then they can determine the allocation of distributable profits, if any, of the preceding year.
Under the Colombian Commercial Code, a company must distribute at least 50% of its annual net profits to all shareholders, payable in cash, or as determined by the shareholders, within a period of one year following the date on which the shareholders determine the dividends. If the total amount segregated in all reserves of a company exceeds its outstanding capital, this percentage is increased to 70%. The minimum common stock dividend requirement of 50% or 70%, as the case may be, may be waived by a favorable vote of the holders of 78% of a company’s common stock present at the meeting.
Under Colombian law and Bancolombia’s bylaws annual net profits are to be applied as follows: (i)first, an amount equivalent to 10% of net profits is segregated to build a legal reserve until that reserve is equal to at least 50% of Bancolombia’s paid-in capital; (ii)second, payment of the minimum dividend on the preferred shares; and (iii)third, allocation of the net profits is determined by the holders of a majority of the common shares entitled to vote on the recommendation of the board of directors and the President and may, subject to further reserves required by the by-laws, be distributed as dividends. Under the Bank’s bylaws, the dividends payable to the holders of common shares cannot exceed the dividends payable to holders of the preferred shares. Bancolombia’s bylaws requires to maintain a reserve fund equal to 50% of paid-in capital. All common shares that are fully paid in and outstanding at the time a dividend or other distribution is declared are entitled to share equally in that dividend or other distribution. Common shares that are only partially-paid participate in a dividend or distribution in the same proportion than the shares that have been fully paid in at the time of the dividend or distribution.
The general shareholders’ meeting may allocate a portion of the profits to welfare, education or civic services, or to support economic organizations of the Bank’s employees.
Preferred Shares
Holders of preferred shares are entitled to receive dividends based on the profits of the preceding fiscal year, after deducting losses affecting the capital and once the amount that shall be legally set apart for the legal reserve has been deducted, but before creating or accruing for any other reserve, of a minimum preferred dividend equal to one percent (1%) yearly of the subscription price of the preferred share, provided this dividend is higher than the dividend assigned to common shares, if this is not the case, the dividend shall be increased to an amount that is equal to the per share dividend on the common shares. The dividend received by holders of common shares may not be higher than the dividend assigned to preferred shares.
Payment of the preferred dividend shall be made at the time and in the manner established in the general shareholders’ meeting and with the priority indicated by Colombian law.
In the event that the holders of preferred shares have not received the minimum dividend for a period in excess of two consecutive fiscal years, they will acquire certain voting rights. See Item 10.B. “Memorandum and Articles of Association” pleaseAssociation¾Description of Share Rights, Preferences and Restrictions —Voting Rights —Preferred Shares”.
General Considerations Relating to Dividends
The dividend periods may be different from the periods covered by the statement of financial position. In the general shareholders’ meeting, shareholders will determine such dividend periods, the effective date, the system and the place for payment of dividends.
Dividends declared on the common shares and the preferred shares will be payable to the record holders of those shares, as they are recorded on Bancolombia’s stock registry, on the appropriate record dates as determined in the general shareholders’ meeting.
Any dividend in shares payable by Bancolombia will be paid in common shares to the holders of common shares and in preferred shares to the holders of preferred shares. Nonetheless, Shareholders at the general shareholders’ meeting may authorize the payment in common shares to all shareholders.
Any dividend in shares requires the approval of 80% or more of the shares present at a shareholders’ meeting, which will include 80% or more of the outstanding preferred shares. In the event that such voting majority is not obtained, shareholders may individually elect to receive a stock dividend or a cash dividend.
Liquidation Rights
Bancolombia will be dissolved if certain events take place, including the following: (i) its term of existence, as stated in the by-laws, expires without being extended by the shareholders prior to its expiration date; (ii) losses cause the decrease of its shareholders’ equity below 50% of its outstanding capital stock, unless one or more of the corrective measures described in the Colombian Commercial Code are adopted by the shareholders within six months; (iii) by decision at the general shareholders’ meeting; and (iv) in certain other events expressly provided by law and in the by-laws.
Upon dissolution, a liquidator must be appointed by the general shareholders’ meeting to wind up its affairs. In addition, the Superintendency of Finance has the power to take over the operations and assets of a bank and proceed to its liquidation under certain circumstances and in the manner prescribed in theEstatuto Orgánico del Sistema Financiero, Decree 663 of 1993. For more information see “Item 10. AdditionalItem 4. “Information on The Company - B. Business Overview - B.8. Supervision and Regulation - Bankruptcy Considerations”.
Preemptive Rights and Other Anti-Dilution Provisions
Under the Bank’s bylaws, the holders of common shares determine in their meeting the amount of authorized capital stock, and the board of directors has the power to (a) order the issuance and regulate the terms of subscription of common shares up to the total amount of authorized capital stock and (b) regulate the issuance of shares with rights to a preferential dividend but without the right to vote, when expressly delegated at the general shareholders’ meeting. The issuance of preferred shares must always be first approved at the general shareholders’ meeting, which shall determine the nature and extent of any privileges, according to the bylaws and Colombian law.
The Bank’s bylaws and Colombian law require that, whenever the Bank issues new shares of any outstanding class, it must offer the holders of each class of shares the right to purchase a number of shares of such class sufficient to maintain their existing percentage ownership of the aggregate capital stock of the Bank. These rights are called preemptive rights. See Item 3. “Key Information – B. MemorandumD. Risk Factors Preemptive rights may not be available to holders of ADRs”.
Shareholders at a general meeting of shareholders may suspend preemptive rights with respect to a particular capital increase by a favorable vote of at least 70% of the shares represented at the meeting. Preemptive rights must be exercised within the period stated in the share placement terms of the increase, which cannot be shorter than 15 business days following the publication of the notice of the public offer of that capital increase. From the date of the notice of the share placement terms, preemptive rights may be transferred separately from the corresponding shares.
The Superintendency of Finance will authorize decreases in the outstanding capital stock decided by the holders of common shares only if: (i) Bancolombia has no liabilities; (ii) Bancolombia’s creditors consent in writing; or (iii) the outstanding capital stock remaining after the reduction represents at least twice the amount of Bancolombia’s liabilities.
Limits on Purchases and ArticlesSales of Association”Capital Stock by Related Parties
Pursuant to the Colombian Commerce Code, the members of Form 20-F – 2010 filedthe Bank’s board of directors and certain of our principal executive officers may not, directly or undirectly, buy or sell shares of our capital stock while they hold their positions, except when dealing with nonspeculative operations and in that case they need to obtain the prior authorization of the board of directors passed with the SECvote of two-thirds of its members (excluding, in the case of transactions by a director, such director’s vote) or when deemed relevant by the Board of Directors of the Bank with the authorization of the Shareholders Meeting the affirmative vote of the ordinary majority foreseen in the bylaws, excluding the vote of the petitioner.
No Redemption
Colombian law prohibits Bancolombia from repurchasing shares of its capital stock, including the preferred shares.
Limitations on April 28, 2011.the Rights to Hold Securities
There are no limitations in our by-laws or Colombian law on the rights of Colombian residents or foreign investors to own the shares of the Bank, or on the right to hold or exercise voting rights with respect to those shares.
Restrictions on Change of Control Mergers, Acquisitions or Corporate Restructuring of the Company
Under Colombian law and our bylaws, the general shareholders’ meeting has full and exclusive authority to approve any corporate restructuring including, mergers, acquisitions or spin-offs upon authorization by the Colombian Superintendency of Finance.
Ownership Threshold Requiring Public Disclosure
We must disclose to the Superintendency of Finance at the end of each fiscal year the names of the shareholders of our company, indicating at least, the twenty shareholders with the highest number of shares.
Colombian securities regulations set forth the obligation to disclose any material event or relevant fact. Any transfer of shares equal or greater than 5% of our capital stock or any person acquiring a percentage of shares that would make him the beneficial owner of 5% or more of our capital stock, is a material event, and therefore, must be disclosed to the Superintendency of Finance.
Changes in the Capital of the Company
There are no conditions in our by-laws governing changes in our capital stock that are more stringent than those required under Colombian law.
Bancolombia has not entered into any contract, other than those entered in the ordinary course of business (including agreements relating to our pending acquisitions of Grupo Agromercantil Holding and HSBC Bank (Panama) S.A.) or that are not considered to be material, to which it or any of its subsidiaries is a party, for the two years immediately preceding publication of this Annual Report.
The Central Bank has consistently made foreign currency available to Colombian private sector entities to meet their foreign currency obligations. Nevertheless, in the event of shortages, of foreign currency, foreign currency may not be available to private sector companies and foreign currencythe amounts needed by the Bank to service foreign currency obligations may not be purchased in the open market without substantial additional cost.costs.
The Foreign Exchange Statute, Law 9 of 1991, sets forth the outline ofoutlines the Colombian foreign exchange regime which relates to matters such as imports and exports of goods, foreign indebtedness, and guarantees in foreign currencies, amongstamong others. Additionally, Decree 20801068 of 2000,2015, as amended, sets forth an International Investments Regime which provides for rules applicable to foreign residents who invest in the Colombian securities markets and undertake other types of investments, prescribes registration with the Central Bank of certain foreign exchange transactions, and specifies procedures pursuant to which certain types of foreign investments are to be authorized and administered. Both, the Foreign Exchange Statute and the International Investments Regime are regulated by External Resolution No. 8 of 2000 and External Regulating Circular DCIN 83 of 2006, both as amended, of the boardBoard of directorsDirectors of the Central Bank.
Under Colombian law and the Bank’s by-laws, foreign investors receive the same treatment as Colombian citizens with respect to ownership and the voting rights of ADSs and preferred shares. For a detailed discussion of ownership restrictions see “ItemItem 4. Information“Information on the Company –- B. Business Overview – B.7.- B.8. Supervision and Regulation – Ownership and Management Restrictions”.
Colombian Taxation
For purposes of Colombian taxation, an individual is a resident of Colombia if he or she has a consecutive or non-consecutive physical presence in Colombia for more than 183 days, including days of arrival and departure from the country, during a 365 continuous days’ period, provided that, if the physical presence is exercised in two different fiscal years, the individual is deemed to be a resident on the second fiscal year. An individual is also considered as resident if he or she meets any of the following conditions:
| · | The individual is exempt from income and occasional gains’ taxes in the country, in which he or she resides, as a consequence of his or her service as a member of the foreign or diplomatic service of Colombia. |
| · | The individual is a Colombian citizen and during the applicable fiscal year: |
| (a) | his or her spouse or life partner, or underage children, are residents in Colombia; |
| (b) | 50% or more of his or her gross income has a Colombian source; |
| (c) | 50% or more of his or her assets are managed or held or deemed to be held in Colombia; |
| (d) | 50% or more of his or her assets are owned in Colombia; |
| (d)(e) | The Colombian taxation authority has requested evidence of the non-resident status, and it is not provided by the individual; or |
| (e)(f) | He or she has a fiscal residence in a tax haven jurisdiction. |
| · | An individual is not considered a tax resident if meets any of the above conditions but fulfills at least one of the following: |
| (a) | 50% or more of the individual’s annual income has its source in the jurisdiction as determined byin which they are domiciled; or |
| (b) | 50% or more of its assets are located in the Government of Colombia.jurisdiction where they are domiciled. |
For purposes of Colombian taxation, a legal entity is a resident of Colombia if it has its headquarterprincipal office is located in Colombia. For this purpose, the headquarterprincipal office shall meanmeans the place where material commercial and management decisions are made.
Foreign companies, foreign investment funds, and individuals that are not Colombian residents are not required by law to file an income tax return in Colombia when their income has been previously subject to withholding tax, provided that such income results from payments of dividends, capital gains or labor related income.
Pursuant to the International Investment Regime (see “Item 10. Additional Information – D. Exchange Controls”), the preferred shares deposited under the Deposit Agreement constitute a Foreign Institutional Capital Investment Fund (the “Fund”)”. Under Article 18-1 of theEstatuto Tributario, Decree 624 Fiscal Statute, modified by the Law 1607 of 1989, as amended (the “Fiscal Statute”),2012, profits of the Fund, excluding dividends, are subject to withholding tax. The applicable taxation rate is 14%, provided that the Depositary is not located in a tax haven, in which case, the applicable taxation rate is 25%.
If the Depositary sells, or otherwise negotiates, the preemptive rights it would be entitled to in the event of a new issue of shares (see “ItemItem 3. “Key Information - D. Risk Factors - Risks Relating to the Preferred Shares and the American Depositary Shares (“ADSs”)), the profits obtained from such disposal will be subject to withholding tax.
Dividends paid by the Bank are not subject to withholding tax, provided that they are previously taxed earnings of Bancolombia, pursuant to Article 49 of the Fiscal Statute. If the dividends are paid out of non-taxed earnings of the Bank, they will be subject to a withholdable tax at a rate of 25%.
Likewise, dividends paid to a holder of preferred shares (as distinguished from the ADSs representing such preferred shares) who is not a resident of Colombia, and who holds the preferred shares in his own name, rather than through another institutional or individual fund, in compliance with the International Investment Regime, will be subject to income tax if such dividends do not correspond to the Bank’s profits that have been previously taxed. For these purposes, the applicable rate is 25%33%.
Pursuant to article 36-1 of the Fiscal Statute, profits received by a Colombian or foreign investor derived from the disposal or negotiation of stock listed in the Colombian Stock Exchange, are not subject to withholding or any other tax in Colombia, provided that the transaction does not involve the disposal of 10% or more of the company’s outstanding shares by the same beneficial owner in one taxable year.
Other Tax Considerations
As of the date of this report, there is no income tax treaty and no inheritance or gift tax treaty in effect between Colombia and the United States. Transfers of ADSs from non-residents or residents to non-residents of Colombia by gift or inheritance are not subject to Colombian income tax. Transfers of ADSs or preferred shares by gift or inheritance from residents to residents or from non-residents to residents will be subject to Colombian income tax at the income tax rate applicable for occasional gains obtained by residents of Colombia. Transfers of preferred shares by gift or inheritance from non-residents to non-residents or from residents to non-residents are also subject to income tax in Colombia at the applicable rate. There are no Colombian stamps, issue, registration, transfer or similar taxes or duties payable by holders of preferred shares or ADSs.
United States Federal Income Taxation Considerations
In General
This section describes the material United States federal income tax consequences generally applicable to ownership by a U.S. holder (as defined below) of owning preferred shares or ADSs. It applies to you only if you hold your preferred shares or ADSs as capital assets for tax purposes. This section does not apply to you if you are a member of a special class of holders subject to special rules, including:
| ·§ | a dealer in securities, |
| ·§ | a trader in securities that elects to use a mark-to-market method of accounting for securities holdings, |
| ·§ | a tax-exempt organization, |
| ·§ | a life insurance company, |
| ·§ | a person liable for alternative minimum tax, |
| ·§ | a person that actually or constructively owns 10% or more of our voting stock, |
| ·§ | a person that holds preferred shares or ADSs as part of a straddle or a hedging or conversion transaction, |
| ·§ | a person that purchases or sells preferred shares or ADSs as part of a wash sale for tax purposes, or |
| ·§ | a person whose functional currency is not the U.S. dollar. |
This section is based on the Internal Revenue Code of 1986, as amended, its legislative history, existing and proposed regulations, published rulings and court decisions. These laws are subject to change, possibly on a retroactive basis. There is currently no comprehensive income tax treaty between the United States and Colombia. In addition, this section is based in part upon the representations of the Depositary and the assumption that each obligation in the Deposit Agreement and any related agreement will be performed in accordance with its terms.
If a partnership holds the preferred shares or ADSs, the United States federal income tax treatment of a partner will generally depend on the status of the partner and the tax treatment of the partnership. A partner in a partnership holding the preferred shares or ADSs should consult its tax advisor with regard to the United States federal income tax treatment of an investment in the preferred shares or ADSs.
You are a U.S. holder if you are a beneficial owner of preferred shares or ADSs and you are:
| ·§ | a citizen or resident of the United States, |
| ·§ | a domestic corporation, |
| ·§ | an estate whose income is subject to United States federal income tax regardless of its source, or |
| ·§ | a trust if a United States court can exercise primary supervision over the trust’s administration and one or more United States persons are authorized to control all substantial decisions of the trust. |
In general, and taking into account the earlier assumptions, for United States federal income tax purposes, if you hold ADRs evidencing ADSs, you will be treated as the owner of the preferred shares represented by those ADRs. Exchanges of preferred shares for ADRs, and ADRs for preferred shares generally will not be subject to United States federal income tax.
Taxation of Dividends and Distributions
Under the United States federal income tax laws, and subject to the passive foreign investment company, or PFIC, rules discussed below, the gross amount of any dividend we pay out of our current or accumulated earnings and profits (as determined for United States federal income tax purposes) is subject to United States federal income taxation. If you are a non-corporate U.S. holder, dividends paid to you that constitute qualified dividend income will be taxable to you at preferential rates applicable to long-term capital gains provided that you hold the preferred shares or ADSs for more than 60 days during the 121-day period beginning 60 days before the ex-dividend date (or, if the dividend is attributable to a period or periods aggregating over 366 days, provided that you hold the preferred shares or ADSs for more than 90 days during the 181-day period beginning 90 days before the ex-dividend date) and meet other holding period requirements. Dividends we pay with respect to the shares or ADSs generally will be qualified dividend income provided that, in the year that you receive the dividend, the shares or ADSs are readily tradable on an established securities market in the United States. The Bank believes that its ADSs, which are listed on the NYSE, are readily tradable on an established securities market in the United States; however, there can be no assurance that the Bank’s ADSs will continue to be readily tradable on an established securities market. Because the preferred shares are not listed on any United States securities market, it is unclear whether dividends we pay with respect to the preferred shares will also be qualified dividend income. If dividends we pay with respect to our preferred shares are not qualified dividend income, then the U.S. dollar amount of such dividends received by a U.S. holder (including dividends received by a non-corporate U.S. holder) will be subject to taxation at ordinary income tax rates.
You must include any Colombian tax withheld from the dividend payment in this gross amount even though you do not in fact receive it. The dividend is taxable to you when you, in the case of preferred shares, or the Depositary, in the case of ADSs, receive the dividend, actually or constructively. The dividend will not be eligible for the dividends-received deduction generally allowed to United States corporations in respect of dividends received from other United States corporations. The amount of the dividend distribution that you must include in your income as a U.S. holder will be the U.S. dollar value of the Colombian Peso payments made, determined at the spot Colombian Peso / U.S. dollar rate on the date the dividend distribution is includible in your income, regardless of whether the payment is in fact converted into U.S. dollars. Generally, any gain or loss resulting from currency exchange fluctuations during the period from the date you include the dividend payment in income to the date you convert the payment into U.S. dollars will be treated as ordinary income or loss and will not be eligible for the special tax rate applicable to qualified dividend income. The gain or loss generally will be income or loss from sources within the United States for foreign tax credit limitation purposes. Distributions in excess of current and accumulated earnings and profits, as determined for United States federal income tax purposes, will be treated as a non-taxable return of capital to the extent of your basis in the preferred shares or ADSs and thereafter as capital gain. However, we do not expect to calculate earnings and profits in accordance with U.S. federal income tax principles. Accordingly, you should expect to generally treat distributions with respect to preferred shares or ADSs as dividends.
Subject to certain limitations, the Colombian tax withheld and paid over to Colombia will be creditable or deductible against your United States federal income tax liability. Special rules apply in determining the foreign tax credit limitation with respect to dividends that are subject to preferential rates. To the extent a refund of the tax withheld is available to you under Colombian law;law, the amount of tax withheld that is refundable will not be eligible for credit against your United States federal income tax liability. The rules governing foreign tax credits are complex, and U.S. holders should consult their tax advisors regarding the creditability of foreign taxes in their particular circumstances.
For foreign tax credit purposes, dividends will be income from sources outside the United States and will, depending on your circumstances, be either “passive” or “general” income for purposes of computing the foreign tax credit allowable to you.
Taxation of Capital Gains
Subject to the PFIC rules discussed below, if you sell or otherwise dispose of your preferred shares or ADSs, you will recognize capital gain or loss for United States federal income tax purposes equal to the difference between the U.S. dollar value of the amount that you realize and your tax basis, determined in U.S. dollars, in your preferred shares or ADSs. Capital gain of a non-corporate U.S. holder is generally taxed at preferential rates where the property is held for more than one year. The deductibility of capital losses is subject to limitations. The gain or loss will generally be income or loss from sources within the United States for foreign tax credit limitation purposes.
PFIC Rules
We believe that preferred shares and ADSs should not be treated as stock of a PFIC for United States federal income tax purposes, but this conclusion is a factual determination that is made annually and thus may be subject to change. If we were to be treated as a PFIC, unless you elect to be taxed annually on a mark-to-market basis with respect to your preferred shares or ADSs, the following rules would apply. With certain exceptions, your preferred shares or ADSs would be treated as stock in a PFIC if we were a PFIC at any time during your holding period in your preferred shares or ADSs.
Any “excess distributions,” which would include any distributions during a taxable year that are greater than 125% of the average annual distributions received by you in respect of the preferred shares or ADSs during the three preceding taxable years or, if shorter, your holding period for the preferred shares or ADSs, and any gain realized on the sale or other disposition of your preferred shares or ADSs would be allocated ratably over your holding period for the preferred shares or ADSs and would generally be taxed at the highest tax rate in effect for each such year to which the gain was allocated, together with an interest charge in respect of the tax attributable to each such year. Any gain recognized would not be treated as capital gain.
If you own preferred shares or ADSs in a PFIC that are treated as marketable stock, you may make a mark-to-market election. If you make this election, you will not be subject to the PFIC rules described above. Instead, in general, you will include as ordinary income each year the excess, if any, of the fair market value of your preferred shares or ADSs at the end of the taxable year over your adjusted basis in your preferred shares or ADSs. These amounts of ordinary income will not be eligible for the favorable tax rates applicable to qualified dividend income or long-term capital gains. You will also be allowed to take an ordinary loss in respect of the excess, if any, of the adjusted basis of your preferred shares or ADSs over their fair market value at the end of the taxable year (but only to the extent of the net amount of previously included income as a result of the mark-to-market election). Your basis in the preferred shares or ADSs will be adjusted to reflect any such income or loss amounts.
In addition, notwithstanding any election you make with regard to the preferred shares or ADSs, dividends that you receive from us would not be eligible for the special tax rates applicable to qualified dividend income if we are treated as a PFIC with respect to you either in the taxable year of the distribution or the preceding taxable year, but instead would be taxable at rates applicable to ordinary income.
Medicare Tax
For taxable years beginning after December 31, 2012, aA U.S. holder that is an individual or estate, or a trust that does not fall into a special class of trusts that is exempt from such tax, will beis subject to a 3.8% tax on the lesser of (1) the U.S. holder’s “net investment income” (or “undistributed net investment income” in the case of an estate or trust) for the relevant taxable year and (2) the excess of the U.S. holder’s modified adjusted gross income for the taxable year over a certain threshold (which in the case of individuals will beis between USD 125,000 and USD 250,000, depending on the individual’s circumstances). A holder’s net investment income will generally includeincludes its dividend income and its net gains from the disposition of preferred shares or ADSs, unless such dividend income or net gains are derived in the ordinary course of the conduct of a trade or business (other than a trade or business that consists of certain passive or trading activities). If you are an individual, estate or trust, you are urged to consult your tax advisors regarding the applicability of the Medicare tax to your income and gains in respect of your investment in the preferred shares or ADSs.
Information with Respect to Foreign Financial Assets
Owners of “specified foreign financial assets” with an aggregate value in excess of USD 50,000 (and in some circumstances, a higher threshold) may be required to file an information report with respect to such assets with their tax returns. “Specified foreign financial assets” include any financial accounts maintained by foreign financial institutions, as well as any of the following, but only if they are held for investment and not held in accounts maintained by financial institutions: (i) stocks and securities issued by non-United States persons (including the preferred shares and ADSs), (ii) financial instruments and contracts held for investment that have non-United States issuers or counterparties, and (iii) interests in foreign entities. U.S. holders are urged to consult their tax advisors regarding the application of this reporting requirement to their ownership of the preferred shares or ADSs.
| F. | DIVIDENDS AND PAYING AGENTS |
Not applicable.
Not applicable.
Bancolombia files reports and other information with the SEC pursuant to the rules and regulations of the SEC that apply to foreign private issuers. You may read and copy any document that Bancolombia files at the SEC’s public reference room at 100 F Street NE, Washington, D.C. 20549. Some of the Bank’s SEC filings are also available to the public from the SEC’s website at http://www.sec.gov.
Not applicable.
| ITEM 11. | QUANTITATIVE AND QUALITATIVE DISCLOSURES ABOUT MARKET RISK |
Introduction
The following section describes the market risks to which Bancolombia is exposed and the tools and methodology used to measure these risks as ofDecember 31, 2012.2015. Bancolombia faces market risk as a consequence of its lending, trading funding and investmentinvestments businesses. Market risk represents the potential loss due to adverse changes in market prices of financial instruments as a result of movements in interest rates, foreign exchange rates, equity prices and other risk factors, such as sovereign risk.
Bancolombia’s risk management strategy, called the Integrated Risk Management Strategy, is based on principles set by international bodies and by Colombian regulations, and is guided by Bancolombia’s corporate strategy. The main objective of the Integrated Risk Management Strategy is to identify, measure, coordinate, monitor, report and propose policies for market and liquidity risks of the Bank, which in turn serve to facilitate the efficient administration of Bancolombia’s assets and liabilities. Bancolombia’s board of directors and senior management have formalized the policies, procedures, strategies and rules of action for market risk administration in its “Market Risk Manual”. This manual defines the roles and responsibilities within each subdivision of the Bank and their interaction to ensure adequate market risk administration.
The Bank’s Market RiskRisks Management Office is responsible for: (a) identifying, measuring, monitoring, analyzing and controlling the market risk inherent in the Bank’s businesses, (b) analyzing the Bank’s exposure under stress scenarios and confirming compliance with Bancolombia’s risk management policies, (c) designinganalyzing the methodologies for valuation of the market value of certain securities and financial instruments design by the official price vendor, (d) reporting to senior management and the board of directors any violation of Bancolombia’s risk management policies, (e) reporting to the senior management on a daily basis the levels of market risk associated with the trading instruments recorded in its treasury book (the “Treasury Book”), and (f) proposing policies to the board of directors and to senior management that ensure the maintenance of predetermined risk levels. The Bank has also implemented an approval process for new products across each of its subdivisions. This process is designed to ensure that every subdivision is prepared to incorporate the new product into their procedures, that every risk is considered before the product is incorporated and that approval is obtained from the board of directors before the new product can be sold.
The Bank’s assets include both trading and non-trading instruments. Trading instruments are recorded in the Treasury Book and include fixed income securities and derivatives, foreign exchange (FX) and bond futures, and over-the-counter plain vanilla and exotic derivatives. Trading in derivatives includes forward contracts in foreign currency operations, plain vanilla options and Asian options on USD/U.S. dollar/COP currency, foreign exchange swaps and interest rate swaps. Non-trading instruments are recorded in the Bank’s banking book (the “Banking Book”), which includes primarily loans, time deposits, checking accounts and savings accounts.
The Bank uses a value at risk (“VaR”) calculation to limit its exposure to the market risk of its Treasury Book. The board of directors is responsible for establishing the maximum VaR based on its assessment of the appropriate level of risk for Bancolombia. The Capital Market Risks Committee is responsible for establishing the maximum VaR by type of investment (e.g., fixed income in public debt) and by type of risk (e.g., currency risk). These limits are supervised on a daily basis by the Market Risk Management Office.
For managing the interest rate risk from banking activities, the Bank analyzes the interest rate mismatches between its interest earning assets and its interest bearing liabilities. In addition, the foreign currency exchange rate exposures arising from the Banking Book are provided to the Treasury Division where these positions are aggregated and managed.
Trading Instruments Market Risk Measurement
The Bank currently measures the Treasury Book exposure to market risk (including over-the-counter derivatives positions) as well as the currency risk exposure of the Banking Book, which is provided to the Treasury Division, using a VaR methodology established in accordance with “Chapter XXI of the Basic Accounting Circular”, issued by the SFC.Superintendency of Finance.
The VaR methodology established by “Chapter XXI of the Basic Accounting Circular” is based on the model recommended by the Amendment to the Capital Accord to Incorporate Market Risks of Basel Committee of 2005, which focuses on the Treasury Book and excludes investments classified as “held to maturity”measured under amortized cost which are not being given as collateral and any other investment that comprises the Banking Book, such as non-trading positions. In addition, the methodology aggregates all risks by the use of correlations, through a newan allocation system based on defined zones and bands, affected by given sensitivity factors.
The total market risk for the Bank is calculated by the arithmetical aggregation of the VaR calculated for each subsidiary. The aggregated VaR is reflected in the Bank’s Capital Adequacy (Solvency) ratio, in accordance with Decree 17201771 of 2001.2012.
For purposes of VaR calculations, a risk exposure category is any market variable that is able to influence potential changes in the portfolio value. Taking into account a given risk exposure, the VaR model assesses the maximum loss not exceeded at a specified confidence level over a given period of time. The fluctuations in the portfolio’s VaR depend on volatility, modified duration and positions changes relating to the different instruments that are subject to market risk.
The relevant risk exposure categories for which VaR is computed by Bancolombia according to the “Chapter XXI, appendix 1 of the Basic Accounting Circular” are: (i) interest rate risks relating to local currency, foreign currency and UVR; (ii) currency risk; (iii) stock price risk; and (iv) fund risk.
Interest Rate Risk (Treasury Book)::
The interest rate risk is the probability of decrease in the market value of the position due to fluctuations in market interest rates. Bancolombia calculates the interest rate risk for positions in local currency, foreign currency and UVR separately;separately, in accordance with Chapter XXI of the Basic Accounting Circular issued by the SFC.Superintendency of Finance. The calculation of the interest rate risk begins by determining the net position in each instrument and estimating its sensitivity by multiplying its net present value (“NPV”) by its “modified duration” and by the interest rate’s estimated fluctuation (as defined by the SFC)Superintendency of Finance). The interest rate’s fluctuations are established by the SFCSuperintendency of Finance according to historical market performance, as shown in the following table:
Figure 1. Interest Risk – Sensitivity by Bands and Zones
| | | Modified Duration | | | Interest Rate Fluctuations (basis points) | |
| Zone | | Band | | | Low | | | High | | | Pesos | | | UVR | | | USD | |
| | | | | | | | | | | | | | | | | | | |
| | | | 1 | | | | 0 | | | | 0.08 | | | | 274 | | | | 274 | | | | 100 | |
| Zone 1 | | | 2 | | | | 0.08 | | | | 0.25 | | | | 268 | | | | 274 | | | | 100 | |
| | | | 3 | | | | 0.25 | | | | 0.5 | | | | 259 | | | | 274 | | | | 100 | |
| | | | 4 | | | | 0.5 | | | | 1 | | | | 233 | | | | 274 | | | | 100 | |
| | | | | | | Modified Duration | | Interest rate fluctuations (basis points) | |
| Zone | | | Band | | Low | | High | | Pesos | | URV | | USD | |
| | | | | 1 | | | | 0 | | | | 0.08 | | | | 274 | | | | 274 | | | | 100 | |
| | | | | 2 | | | | 0.08 | | | | 0.25 | | | | 268 | | | | 274 | | | | 100 | |
| Zone 1 | | | | 3 | | | | 0.25 | | | | 0.5 | | | | 259 | | | | 274 | | | | 100 | |
| | | Modified Duration | | | Interest Rate Fluctuations (basis points) | | | | 4 | | | | 0.5 | | | | 1 | | | | 233 | | | | 274 | | | | 100 | |
| | | | 5 | | | | 1 | | | | 1.9 | | | | 222 | | | | 250 | | | | 90 | | | | 5 | | | | 1 | | | | 1.9 | | | | 222 | | | | 250 | | | | 90 | |
| Zone 2 | | | 6 | | | | 1.9 | | | | 2.8 | | | | 222 | | | | 250 | | | | 80 | | | | 6 | | | | 1.9 | | | | 2.8 | | | | 222 | | | | 250 | | | | 80 | |
| | | | | 7 | | | | 2.8 | | | | 3.6 | | | | 211 | | | | 220 | | | | 75 | |
| | | | 7 | | | | 2.8 | | | | 3.6 | | | | 211 | | | | 220 | | | | 75 | | | | 8 | | | | 3.6 | | | | 4.3 | | | | 211 | | | | 220 | | | | 75 | |
| | | | 8 | | | | 3.6 | | | | 4.3 | | | | 211 | | | | 220 | | | | 75 | | | | 9 | | | | 4.3 | | | | 5.7 | | | | 172 | | | | 200 | | | | 70 | |
| | | | 9 | | | | 4.3 | | | | 5.7 | | | | 172 | | | | 200 | | | | 70 | | | | 10 | | | | 5.7 | | | | 7.3 | | | | 162 | | | | 170 | | | | 65 | |
| | | | 10 | | | | 5.7 | | | | 7.3 | | | | 162 | | | | 170 | | | | 65 | | | | 11 | | | | 7.3 | | | | 9.3 | | | | 162 | | | | 170 | | | | 60 | |
| Zone 3 | | | 11 | | | | 7.3 | | | | 9.3 | | | | 162 | | | | 170 | | | | 60 | | | | 12 | | | | 9.3 | | | | 10.6 | | | | 162 | | | | 170 | | | | 60 | |
| | | | 12 | | | | 9.3 | | | | 10.6 | | | | 162 | | | | 170 | | | | 60 | | | | 13 | | | | 10.6 | | | | 12 | | | | 162 | | | | 170 | | | | 60 | |
| | | | 13 | | | | 10.6 | | | | 12 | | | | 162 | | | | 170 | | | | 60 | | | | 14 | | | | 12 | | | | 20 | | | | 162 | | | | 170 | | | | 60 | |
| | | | 14 | | | | 12 | | | | 20 | | | | 162 | | | | 170 | | | | 60 | | | | 15 | | | | 20 | | | | - | | | | 162 | | | | 170 | | | | 60 | |
| | | | 15 | | | | 20 | | | | - | | | | 162 | | | | 170 | | | | 60 | | |
Once the sensitivity factor is calculated for each position, the modified duration is then used to classify each position within its corresponding band. A net sensitivity is then calculated for each band, by determining the difference between the sum of all long-positions and the sum of all short-positions. Then a net position is calculated for each zone (which consists of a series of bands) determined by the SFC.Superintendency of Finance. The final step is to make adjustments within each band, across bands and within each zone, which results in a final number that is the interest rate risk VaR by currency. Each adjustment is performed following the guidelines established by the SFC.Superintendency of Finance.
The Bank’s exposure to interest rate risk primarily arises from investments in Colombian Government’sgovernment’s treasury bonds (TES) and securities issued by the Colombian Government.government.
The interest rate risk VaR wentincreased from COP 255172 billion on December 31, 20112014 to COP 343276 billion on December 31, 2012,2015, due to an increaseraise in the position in Colombian Government´s securities.government’s treasury bonds (TES) in the liquidity portfolio. During the period from December 31, 2011 to December 31, 2012,year 2015, the average interest rate risk VaR was COP 296212 billion, the maximum value COP 497276 billion, and the minimum value COP 146134 billion.
Currency (Treasury and Banking Book), Equity (Treasury Book) and Fund Risk (Treasury Book)::
The VaR model uses a sensitivity factor to calculate the probability of loss due to fluctuations in the price of stocks, funds and currencies in which the Bank maintains a position. As previously indicated, the methodology used in this Annual Report to measure such risk consists of computing VaR, which is derived by multiplying the position by the maximum probable variation in the price of such positions (“Dp”). TheDp is determined by the SFC,Superintendency of Finance, as shown in the following table:
Figure 2. Sensitivity Factor for Currency Risks, Equity Risks and Fund Risks
| USD | | | 5.50 | % |
| Euro | | | 6.00 | % |
| Other currencies | | | 8.00 | % |
| Funds | | | 14.70 | % |
| Stock Price | | | 14.70 | % |
The currency risk VaR increasedrose from COP 1356 billion as of December 31, 20112014 to COP 17.3349 billion as of December 31, 2012.This increase was2015 due to the raiseincrease in the net long position in US Dollar exposed to currency risk in the Bank.U.S. dollars, euros and Guatemalan quetzales. Between December 31, 20112014 and December 31, 2012,2015, the average currency risk VaR was COP 19.8144 billion, the maximum value COP 27.6349 billion, and the minimum value COP 13.858 billion.
The equity risk VaR increased from COP 10.951 billion as of December 31, 20112014 to COP 1355 billion as of December 31, 2012.2015 due to the surge in the brokerage firm’s trading position and the increase in the market value of the Bank’s equity positions. Between December 31, 20112014 and December 31, 2012,2015, the average equity VaR was COP 1357 billion, the maximum value COP 16.181 billion, and the minimum value COP 10.949 billion.
The fund risk, VaR which arises from investment in mutual funds, increaseddropped from COP 42.544 billion as of December 31, 20112014 to COP 45.241 billion as of December 31, 2012.2015. Between December 31, 20112014 and December 31, 2012,2015, the average fund risk VaR was COP 44.241 billion, the maximum value COP 45.747 billion, and the minimum value COP 42.636 billion.
As mentioned above the Bank uses the regulatory VaR model to measure its exposure to market risk, in accordance with “Chapter XXI of the Basic Accounting Circular”, issued by the SFC.Superintendency of Finance. The interest rate’s fluctuations and the sensitivity factors for currency, equity and fund risk used in the model are established by the SFCSuperintendency of Finance according to historical market performance, and have not changed since March 2011.
Total Market Risk VaR
The total market risk VaR is calculated as the algebraic sum of the interest rate risk, the currency risk, the stock price risk and the fund risk.
The total market risk VaR had a 30% increase123% surge, going from COP 321323 billion in December 31, 20112014 to COP 418721 billion as of December 31, 2012,2015, due mainly to the rise in the currency risk VaR and interest rate risk VaR, mentioned above.
Assumptions VaR and Limitations of VaR Models:
Although VaR models represent a recognized tool for risk management, they have inherent limitations, including reliance on historical data that may not be indicative of future market conditions or trading patterns. Accordingly, VaR models should not be viewed as predictive of future results. The Bank may incur losses that could be materially in excess of the amounts indicated by the models on a particular trading day or over a period of time, and there have been instances when results have fallen outside the values generated by the Bank’s VaR models. A VaR model does not calculate the greatest possible loss. The results of these models and analysis thereof are subject to the reasonable judgment of the Bank’s risk management personnel.
The chart below provides information about Bancolombia’s consolidated VaR for trading instruments at the end of December 20122014 and December 2011.2015.
| (COP million) | | 2012 | | | 2011 | | |
| | | | As of December 31, | |
| | | | 2015 | | 2014 | |
| | | | | | | | (in millions of COP) | |
| Interest Rate Risk VaR | | | 343,026 | | | | 255,342 | | | | 276,405 | | | | 171,602 | |
| Currency Risk VaR | | | 17,319 | | | | 13,035 | | | | 348,815 | | | | 56,310 | |
| Equity Risk VaR | | | 13,021 | | | | 10,939 | | | | 54,947 | | | | 50,949 | |
| Fund Risk VaR | | | 45,249 | | | | 42,579 | | | | 40,675 | | | | 44,235 | |
| | | | | | | | | | |
| Total VaR | | | 418,615 | | | | 321,895 | | | | 720,842 | | | | 323,096 | |
Includes Grupo Agromercantil's market risk exposure at a 100%
Between December 31, 20112014 and December 31, 2012,2015, the average Total VaR was COP 369.9455 billion, the maximum value COP 582721 billion, and the minimum value COP 217301 billion.
Non-Trading Instruments Market Risk Measurement
The Banking Book’s relevant risk exposure is interest rate risk, which is the probability of unexpected changes in net interest income as a result of a change in market interest rates. Changes in interest rates affect Bancolombia’s earnings as a result of timing differences on the re-pricingrepricing of the assets and liabilities. The Bank manages the interest rate risk arising from banking activities in non-trading instruments by analyzing the interest rate mismatches between its interest-earninginterest earning assets and its interest-bearinginterest bearing liabilities. The foreign currency exchange rate exposures arising from the Banking Book are provided to the Treasury Division where these positions are aggregated and managed.
Interest Risk Exposure (Banking Book)
The Bank has performed a sensitivity analysis of market risk sensitive instruments based on hypothetical changes inestimating the interest rates. The Bank has estimated the impact that a change in interest rates would have on the net present valueinterest income of each position in the Banking Book, using within a modified durationperiod of twelve months based on hypothetical changes in the interest rates, using a repricing model and assuming positive parallel shifts of 50 and 100 basis points.points (pbs).
The following tables provideTable 1 provides information about Bancolombia’s interest rate sensitivity for the balance sheetstatement of financial position items comprising the Banking Book. These tables showBook:
Table 1. Sensitivity to Interest Rate Risk of the followingBanking Book
The chart below provides information for each groupabout Bancolombia’s interest rate risk sensitivity in local currency (pesos) at the end of December 2014 and December 2015:
| Interest Rate Risk |
| | | | |
| | | As of December 31, | |
| | | 2015 | | | 2014 | |
| | | (in millions of COP) | |
| Assets sensitivity 100 bps | | | 579,393 | | | | 492,890 | |
| Liabilities sensitivity 100 bps | | | 332,079 | | | | 306,541 | |
| Net interest income sensitivity 100 bps | | | 247,314 | | | | 186,349 | |
The chart below provides information about Bancolombia’s interest rate risk sensitivity in foreign currency (US dollars) at the end of December 2014 and December 2015:
| Interest Rate Risk |
| | | | |
| | | As of December 31, | |
| | | 2015 | | | 2014 | |
| | | (In thousands of US dollars) | |
| Assets sensitivity 100 bps | | | 74,228 | | | | 70,345 | |
| Liabilities sensitivity 100 bps | | | 69,869 | | | | 65,746 | |
| Net interest income sensitivity 100 bps | | | 4,359 | | | | 4,599 | |
Includes Grupo Agromercantil's market risk exposure at a 100%
A positive net sensitivity denotes a higher sensitivity of assets side and liabilities:
FAIR VALUE: Sumtherefore a rise in interest rates affects positively the Bank’s net interest income. A negative sensitivity denotes a higher sensitivity of liabilities side and therefore a rise in the originalinterest rates affects negatively the Bank’s net present value.
+ 50 bps: Net present value change with an increaseinterest income. In the event of 50 bps.
+ 100 bps: Net present value change with an increase of 100 bps.a decrease in interest rates, the impact in the net interest income would be opposite to the mentioned.
Interest Rate Risk (COP million)Total Exposure:
2012
| | | FAIR VALUE | | | +50bps | | | +100bps | |
| | | | | | | | | | |
| Assets | | | | | | | | | | | | |
| Held To Maturity Securities | | | 3,865,571 | | | | (38,334 | ) | | | (76,493 | ) |
| Loans | | | 69,414,492 | | | | (315,339 | ) | | | (629,243 | ) |
| Total interest rate sensitive assets | | | 73,280,063 | | | | (353,673 | ) | | | (705,736 | ) |
| | | | | | | | | | | | | |
| | FAIR VALUE | | | +50bps | | | +100bps | |
| | | | | | | | | | |
| Liabilities | | | | | | | | | |
| Demand deposits | | | 39,828,522 | | | | (166,897 | ) | | | (333,034 | ) |
| Time Deposits | | | 25,599,781 | | | | (84,946 | ) | | | (169,506 | ) |
| Interbank borrowings | | | 4,935,049 | | | | (7,376 | ) | | | (14,718 | ) |
| Long-term debt | | | 13,281,224 | | | | (261,635 | ) | | | (522,080 | ) |
| Convertible Bonds | | | 361,276 | | | | (2,146 | ) | | | (4,282 | ) |
| Total interest rate sensitive liabilities | | | 84,005,852 | | | | (523,000 | ) | | | (1,043,620 | ) |
| Total net change | | | | | | | 169,328 | | | | 337,884 | |
Interest Rate Risk (COP million)
2011
| | | FAIR VALUE | | | +50bps | | | +100bps | |
| | | | | | | | | | |
| Assets | | | | | | | | | | | | |
| Held To Maturity Securities | | | 4,051,077 | | | | (51,892 | ) | | | (103,548 | ) |
| Loans | | | 60,681,372 | | | | (277,786 | ) | | | (554,308 | ) |
| Total interest rate sensitive assets | | | 64,732,449 | | | | (329,678 | ) | | | (657,856 | ) |
| | | | | | | | | | | | | |
| | FAIR VALUE | | | +50bps | | | +100bps | |
| | | | | | | | | | |
| Liabilities | | | | | | | | | |
| Checking Accounts - Saving Deposits | | | 34,502,625 | | | | (134,458 | ) | | | (268,304 | ) |
| Time Deposits | | | 18,223,815 | | | | (49,095 | ) | | | (97,966 | ) |
| Interbank borrowings | | | 7,380,261 | | | | (12,356 | ) | | | (24,655 | ) |
| Long-term debt | | | 10,966,848 | | | | (188,019 | ) | | | (375,182 | ) |
| Convertible Bonds | | | 395,837 | | | | (367 | ) | | | (732 | ) |
| Total interest rate sensitive liabilities | | | 71,469,386 | | | | (384,295 | ) | | | (766,839 | ) |
| Total net change | | | | | | | 54,617 | | | | 109,253 | |
A rise in interest rates decreases the fair value of the assets and liabilities of the Bank; therefore, it affects negatively the Bank’s market value on the active side and positively on the liabilities side.
Bancolombia’s largest assets are loans, which represent 94.7% of the total NPV of the total interest rate sensitive assets in the banking book. The market value’s change in assets with a 50 basis points parallel shift of the yield curve has increased from COP 330 billion in December 2011 to COP 354 billion in December 2012 due to an increase in Commercial and Mortgage Loans.
On the liabilities side, Bancolombia’s largest interest rate sensitive liabilities are demand deposits and time deposits which represent 47.4% and 30.4%, respectively, of the total NPV of the total interest rate sensitive liabilities in the banking book. The market value’s change in liabilities with a 50 basis points parallel shift of the yield curve increased from COP 384 billion in December 2011 to COP 523 billion in December 2012, reflecting the increase in demand and time deposits, and in the long-term debt during 2012.
As of December 2012,2015, the net changeinterest income sensitivity in the NPVlocal currency for the market risk sensitivebanking book instruments, entered into for other than trading purposes with positive parallel shifts of 50 and 100 basis points werewas COP 169 billion and COP 338 billion, respectively.247 million. The increase of thesensitivity variation due to interest rate sensitivity for the balance sheet items comprising the Banking Book in December 2011 versus December 2012, isrisk between 2014 and 2015 occurred due to the increase in the sensitivity of the long-term debt in 2012 and its longer duration.loan portfolio.
On the other hand, the net interest income sensitivity in foreign currency in the face of 100 basis points was USD 4.4 million, which is not a significant difference between 2014 and 2015.
Assumptions and Limitations of Sensitivity Analysis: SensitivityLimitations:
Net interest income sensitivity analysis is based on the following assumptions,repricing model and should not be relied on as indicative of future results. When computingconsiders the NPV of the market risk sensitive instruments and its modified duration we have relied on twofollowing key assumptions: (a) a uniform change ofdoes not consider prepaid, new operations, defaults, etc., (b) the fixed rate instruments sensitivity includes the amounts with maturity lower than one year and assuming these will be disbursed at market, interest rates ofand (c) changes in interest rate occur immediately and parallel in the yield curves from assets and liabilities and of rates for different maturities;maturities.
Structural Equity Risk Exposure (Banking Book)
Bancolombia’s investment banking affiliate, in its role of financial corporation, has, directly and (b)through its affiliated companies, structural equity investments. These positions are maintained mostly in energy and construction sectors. Smaller positions are held on the modified durationfinancial sector. Those investments had a 22% decrease in market value, going from COP 337 billion as of variable rate assets and liabilities is takenDecember 31, 2014 to beCOP 262 billion as of December 31, 2015.
The structural equity positions are exposed to market risk. Sensitivity calculations are made for those positions:
| | | As of December 31, | |
| | | 2015 | | | 2014 | |
| | | (in millions of COP) | |
| Market Value | | | 261,648 | | | | 337,097 | |
| Delta | | | 14.7 | % | | | 14.7 | % |
| Sensitivity | | | 38,462 | | | | 49,553 | |
A negative impact of 14.7%, applied to the time remaining untilmarket value, produces a decrease of COP 38 billion on the next interest reset date.structural equity investments market value, going from COP 262 billion to 223 billion.
| ITEM 12. | DESCRIPTION OF SECURITIES OTHER THAN EQUITY SECURITIES |
| D. | American Depositary Shares |
| D.3. | Fees and charges applicable to holders of American Depositary Receipts |
The depositary collects its fees for delivery and surrender of ADSs directly from investors depositing shares or surrendering ADSs for the purpose of withdrawal or from intermediaries acting for them. The depositary may generally refuse to provide fee-attracting services until its fees for those services are paid.
The following are the fees charged by the depositary:
| Persons depositing or withdrawing shares must pay: | | For: |
USD 5.00 per 100 ADSs (or portion of 100 ADSs) | | • Issuance of ADSs, including issuances resulting from a distribution of shares or rights or other propertyproperty. • Cancellation of ADSs for the purpose of withdrawal, including if the deposit agreement terminates terminates. |
Registration or transfer fees | | • Transfer and registration of shares on our share register to or from the name of the depositary or its agent when you deposit or withdraw sharesshares. |
| | |
Expenses of the depositary | | • Cable, telex and facsimile transmissions (when expressly provided in the deposit agreement). • Converting foreign currency to U.S. dollarsdollars. |
| | |
| Taxes and other Governmental charges the depositary or the custodian has to pay on any ADSs or share underlying an ADSs, for example, stock transfer taxes, stamp duty or withholding taxes. | | • As necessary |
| | necessary. |
| Any charges incurred by the depositary or its agents for servicing the deposited securities. | | • As necessarynecessary. |
| D.4.i. | FEES INCURRED IN PAST ANNUAL PERIOD |
From January 1, 20122015 to December 31, 2012,2015, the depositary reimbursed Bancolombia USD 626,711550,000 for expenses related to the administration and maintenance of the ADR facility, investor relations activities, annual listing fees and any other ADR program-related expenses incurred by Bancolombia directly associated with the Bank’s preferred share ADR program. In addition, Fiduciaria Bancolombia, a subsidiary of the Bank, received USD 210,238COP 339 million from The Bank of New York Mellon during the same period in connection with its role as local custodian of the depositary bank.
| D.4.ii. | Fees to be Paid in the Future |
The Bank of New York Mellon, as depositary, has agreed to reimburse the Bank for expenses incurred that are related to establishment and maintenance expenses of the ADS program. The depositary has agreed to reimburse the Company for its continuing annual stock exchange listing fees. The depositary has also agreed to pay the standard out-of-pocket maintenance costs for the ADRs, which consist of the expenses of postage and envelopes for mailing annual and interim financial reports, printing and distributing dividend checks, electronic filing of U.S. federal tax information, mailing required tax forms, stationery, postage, facsimile, and telephone calls. It has also agreed to reimburse the Company annually for certain investor relationship programs or special investor relations promotional activities. In certain instances, the depositary has agreed to provide additional payments to the Company based on any applicable performance indicators relating to the ADR facility. There are limits on the amount of expenses for which the depositary will reimburse the Company, but the amount of reimbursement available to the Company is not necessarily tied to the amount of fees the depositary collects from investors.
The depositary collects its fees for delivery and surrender of ADSs directly from investors depositing shares or surrendering ADSs for the purpose of withdrawal or from intermediaries acting for them. The depositary collects fees for making distributions to investors by deducting those fees from the amounts distributed or by selling a portion of distributable property to pay the fees. The depositary may collect its annual fee for depositary services by deduction from cash distributions or by directly billing investors or by charging the book-entry system accounts of participants acting for them. The depositary may generally refuse to provide fee-attracting services until its fees for those services are paid.
PART II
| ITEM 13. | DEFAULTS, DIVIDEND ARREARAGES AND DELINQUENCIES |
There has not been any default, arrearage or delinquency neither in the payment of principal, interest, a sinking or purchase fund installment, nor in any payment relating to indebtedness or dividends by the Bank or any of its subsidiaries.
| ITEM 14. | MATERIAL MODIFICATIONS TO THE RIGHTS OF SECURITY HOLDERS AND USE OF PROCEEDS |
There has not been any modification to the rights of security holders and use of proceeds.
| ITEM 15. | CONTROLS AND PROCEDURES |
The Bank carried out an evaluation under the supervision and with the participation of our management, including the Chief Executive Officer and Chief Financial Officer, of the effectiveness of our disclosure controls and procedures. As a result, the Chief Executive Officer and Chief Financial Officer have concluded that, as of the end of the period covered by this report, the disclosure controls and procedures were effective to provide reasonable assurance that information required to be disclosed in the reports the Bank files and submits under the Exchange Act is recorded, processed, summarized and reported within the time periods specified in the rules and regulations of the SEC and to provide reasonable assurance that such information is accumulated and communicated to management, including the Chief Executive Officer and Chief Financial Officer, to allow timely decisions regarding disclosure.
There are inherent limitations to the effectiveness of any system of disclosure controls and procedures, including the possibility of human error and the circumvention or overriding of the controls and procedures.
Accordingly, even effective disclosure controls and procedures can only provide reasonable assurance of achieving their control objectives.
Management’sManagement's Report on Internal Control Over Financial Reporting
Management is responsible for establishing and maintaining adequate internal control over financial reporting.reporting as defined in Rule 13a – 15(f) under the Securities Exchange Act of 1934. The Bank's internal control over financial reporting is a process designed to provide reasonable assurance regarding the reliability of financial reporting and the preparation of consolidated financial statements for external purposes in accordance with generally accepted accounting principles.
The Bank's internal control over financial reporting includes those policies and procedures that:
| · | Pertain to the maintenance of records that in reasonable detail accurately and fairly reflect the transactions and dispositions of the assets of the Bank; |
| · | Provide reasonable assurance that transactions are recorded as necessary to permit preparation of consolidated financial statements in accordance with generally accepted accounting principles, and that receipts and expenditures of the Bank are being made only in accordance with authorizations of the Bank's management and directors; and |
| · | Provide reasonable assurance regarding prevention or timely detection of unauthorized acquisition, use or disposition of the Bank’sBank's assets that could have a material effect on the financial statements. |
Because of its inherent limitations, internal control over financial reporting may not prevent or detect misstatements. Projections of any evaluation of effectiveness to future periods are subject to the risk that controls may become inadequate because of changes in conditions, or that the degree of compliance with the policies or procedures may deteriorate.
Management assessed the effectiveness of internal control over financial reporting as of December 31, 20122015 based on criteria established in the Internal Control-Integrated Framework issued by the Committee of Sponsoring Organizations of the Treadway Commission.Commission (2013 Framework version). On this assessment, management concluded that the Bank's internal control over financial reporting was effective as of December 31, 2012.2015. In addition, there were no changes in the Bank’sBank´s internal control over financial reporting occurred during the period covered by this annual report that has materially affected, or is reasonable likely to materially affect the bank´s internal control over financial reporting.
Management excluded from its assessment the internal controls over financial reporting of Banco Agromercantil of Guatemala (BAM) and its subsidiaries, except for controls at the acquiring entity related to the accounting and reporting for business combinations which are part of the internal control over financial reporting of Bancolombia Panama. BAM was acquired by Bancolombia Panama through the acquisition of a 40% interest in 2013 and an additional 20% in Grupo Agromercantil on December 30, 2015.
As of the year ended December 31, 2015, Grupo Agromercantil and its subsidiaries represented 6.22% of the Bank’s total assets.
The effectiveness of the Bank's internal control over financial reporting as of December 31, 20122015 has been audited by PricewaterhouseCoopers, Ltda, an independent registered public accounting firm, which report is included on page F-2F-4 of this annual report.
| A. | AUDIT COMMITTEE FINANCIAL EXPERT |
The board of directors of Bancolombia appointed Mr. Rafael Martinez Villegas as the “audit committee financial expert” in accordance with SEC rules and regulations.
Our audit committee financial expert, along with the other members of our audit committee, is considered to be independent according to applicable NYSE criteria.
Mr. Martinez Villegas has served as the Bank’s audit committee financial expert since he was appointed in October 22, 2012; he does not own anyowns 11 ordinary shares of Bancolombia and there is no business relationship between him and the Bank, except for standard personal banking services. Further, there is no fee arrangement between Mr. Martinez Villegas and the Bank, except in connection with his capacity as a member of the Bank’s board of directors and now as a member of the audit committee. Mr. Martinez Villegas is considered an independent director under Colombian law and the Bank’s Corporate Governance Code, as well as under NYSE’s director independence standards. For more information regarding our audit committee, see “Item 6. Directors, Senior Management and Employees—C. Board Practices—Audit Committee.”Committee”.
| B. | CORPORATE GOVERNANCE AND CODE OF ETHICS |
Bancolombia has adopted a Code of Ethics and a Corporate Governance Code, both of which apply to all employees, including our Chief Executive Officer, (principal executive officer), Chief Financial Officer (principal financial officer) and Controller (principal accounting officer),Chief Accounting Officer, as well as to the directors of the Bank.
English translations of the Ethics Code and the Corporate Governance Code are posted at Bancolombia’s website at www.grupobancolombia.com.co. The Spanish versions of these codes will prevail for all legal purposes.
The Bank also has a phone line called “lí“ethics line” (línea ética”ética) which is available for anonymous reporting of any evidence of improper conduct.
Under the NYSE’s Corporate Governance Standards, Bancolombia, as a listed foreign private issuer, must disclose any significant ways in which its corporate governance practices differ from those followed by U.S. companies under NYSE listing standards. See “Item 16. G Reserved – 16.G Corporate Governance”.
| C. | PRINCIPAL ACCOUNTANT FEES AND SERVICES |
Audit Fees
The aggregate fees billed under the caption audit fees for professional services rendered to Bancolombia for the audit of its financial statements and for services that are normally provided to Bancolombia, in connection with statutory or regulatory filings or engagements totaled COP 9,07914,082 million and COP 9,33111,926 million audited by PricewaterhouseCoopers for the years 20122015 and 2011,2014, respectively.
Audit-Related Fees
In 20122015 and 2011,2014,Bancolombia paid no other audit-related fees.
Tax Fees
At December 31, 2015 and 2014, Bancolombia and its subsidiaries paid COP 1228 million and COP 13 million, respectively for concept of tax fees for professional services related to transfer pricing advice provided by PricewaterhouseCoopers for the year 2012. During this year,PricewaterhouseCoopers.
All other Fees
In 2015 and 2014, Bancolombia paid no other fees to PricewaterhouseCoopers.
For the year 2011, Bancolombia paid no tax fees or other fees to PricewaterhouseCoopers.
Pre-Approval Policies and Procedures
The Bank’s audit committee charter includes the following pre-approval policies and procedures, which are included in the audit committee’s charters:
In those events in which additional services are required to be provided by the external auditors, such services must be previously approved by the audit committee. Whenever this approval is not obtained at a meeting held by the audit committee, the approval will be obtained through the Legal Vice Presidency, who will be responsible for soliciting the consent from each of the audit committee members. The approval will be obtained with the favorable vote of the majority of its members.
Every request of approval of additional services must be adequately sustained, including complete and effective information regarding the characteristics of the service that will be provided by the external auditors. In all cases, the budget of the external auditors must be approved by the General Stockholders Meeting.
During 2012,2015, there were no services approved by the audit committee pursuant to paragraph (c)(7)(i)(C) of Rule 2-01 of Regulation S-X.
| D. | EXEMPTIONS FROM THE LISTING STANDARDS FOR AUDIT COMMITTEES |
There are no exceptions from the listing standards for audit committees.
| E. | PURCHASES OF EQUITY SECURITIES BY THE ISSUER AND AFFILIATED PURCHASERS |
There have not been any purchases by Bancolombia or any affiliated purchaser (as defined in 17CFR240.10b-18(a) (3)) of shares or any other units of any class of equity securities issued by Bancolombia.
Colombian law prohibits the repurchase of shares issued by entities supervised by the SFC. Therefore, neither Bancolombia nor any of its Subsidiaries that are under supervision of such Superintendency may repurchase securities issued by them.
| F. | CHANGE IN REGISTRANT’S CERTIFYING ACCOUNTANT |
Not applicable.On March 16, 2016, the Bank’s shareholders, in their general meeting, dismissed Pricewaterhouse Coopers (PWC) as the registered public accounting firm for the Bank and its subsidiaries, pursuant to the corporate governance code which provides a policy to change such firm at least once every ten years.
On the same date, the Bank’s shareholders appointed Deloitte as the new registered public accounting firm beginning on the fiscal year ended in December 31, 2016. This change was approved by the Bank’s audit committee in January 2016. This appointment is subject to confirmation by the SFC.
PWC’s report on the Consolidated Financial Statements, as of, and for the years ended in December 31, 2015 and 2014, did not contain an adverse opinion or disclaimer of opinion, or was qualified or modified as to uncertainty, audit scope, or accounting principles.
In connection with the audit of the Bank’s Consolidated Financial Statements for the fiscal periods ended December 31, 2015 and 2014, there have been no disagreements with PWC on any matter of accounting principles or practices, financial statement disclosure, or auditing scope or procedure or reportable events (as defined in Item 16F(a)(1)(v) of Form 20-F).
Further in the two years prior to December 31, 2015 or in any subsequent interim period, Bancolombia has not consulted with Deloitte regarding either (i) the application of accounting principles to a specified transaction, either completed or proposed, or the type of audit opinion that might be rendered with respect to the consolidated financial statements of Bancolombia, and either a report was provided to Bancolombia or oral advice was provided that Deloitte concluded was an important factor considered by Bancolombia in reaching a decision as to the accounting, auditing or financial reporting issue; or (ii) any matter that was either the subject of a disagreement as that term is used in Item 16F(a)(1)(iv) of Form 20-F or a reportable event as described in Item 16F(a)(1)(v) of Form 20-F.
Bancolombia, as a listed company that qualifies as a foreign private issuer under the NYSE listing standards in accordance with the NYSE corporate governance rules, is permitted to follow home-country practice in some circumstances in lieu of the provisions of the corporate governance rules contained in Section 303A of the NYSE Listed Company Manual that are applicable to U.S. companies. The Bank follows corporate governance practices applicable to Colombian companies and those described in the Bank’s Corporate Governance Code, which in turn follows Colombian corporate governance rules. An English translation of the Corporate Governance Code is available at Bancolombia’s website at www.grupobancolombia.com.co. The Spanish prevails for all legal purposes.
In Colombia, a series of laws and regulations set forth corporate governance requirements. External Circular 056029 of 2007,2014, issued by the SFC, contains the corporate governance standards to be followed by companies issuing securities that may be purchased by Colombian pension funds, and determines that entities under supervision of the SFC, when making investment decisions, must take into account the recommendations established by the “Country Code” (Código País) and the corporate governance standards followed by the entities who are beneficiaries of the investment. Additionally, External Circular 055 of 2007 establishes that entities under the supervision of the SFC must adopt mechanisms for the periodic disclosure of their corporate governance standards.
Additionally, Law 964 of 2005 established mandatory corporate governance requirements for all issuers whose securities are publicly traded in the Colombian market, and Decree 2555 of 2010 regulates the information disclosure requirements for the Colombian securities market SIMEV (Sistema(Sistema Integral de Información del Mercado de Valores)Valores). Bancolombia’s corporate governance standards comply with these legal requirements and followBancolombia has implemented additional corporate governance measures pursuant to regional recommendations including the Organization for Economic Cooperation and Development’s (OECD) White Paper on Corporate Governance for Latin America and the Andean Development Corporation’s (CAF) Corporate Governance Code.
The following is a summary of the significant differences between the corporate governance practices followed by Bancolombia and those applicable to domestic issuers under the NYSE listing standards:
| · | Independence of Directors. Under NYSE corporate governance rules, a majority of a U.S. company’s board of directors must be composed of independent directors. Regarding Colombian legislation, Law 964 of 2005 requires that at least 25% of the members of the Bank’s board of directors are independent directors, and Decree 3923 of 2006 regulates their election. To be considered independent, the board members must not be (i) employees or directors of the Bank; (ii) shareholders of the Bank that directly or indirectly address or control the majority of the voting rights or that may determine the majority composition of the management boards; (iii) shareholders or employees of entities that render certain services to the Bank in cases in which the service provider receives 20% or more of its income from the Bank; (iv) employees or directors of a non-profit organization that receives donations from the Bank in certain amounts; (v) directors of other entities in whose board of directors one of the legal representatives of the Bank participates; and (vi) any other person that receives from the Bank any kind of economic consideration (except for the considerations received by the board members, the auditing committee or any other committee of the board of directors). Additionally, Colombian law requires that all directors exercise independent judgment under all circumstances. Bancolombia’s Corporate Governance Code includes a provision stating that directors shall exercise independent judgment and requires that Bancolombia’s management recommend to its shareholders lists of director nominees of which at least 25% are independent directors. As of December 31, 2015, the Bank’s board of directors included a majority of independent members. For the independence test applicable to directors of Bancolombia, see “Item 10. Additional Information. – B. Memorandum and Articles of Association – Board of Directors”. |
| · | Non-Executive Director Meetings. Pursuant to the NYSE listing standards, non-executive directors of U.S. listed companies must meet on a regular basis without management present. There is no prohibition under Colombian regulations for officers to be members of the board of directors; however, it is customary for Colombian companies to maintain separation between the directors and management. Bancolombia’s board of directors does not include any management members; however, the CEO attends the monthly meetings of the Bank’s board of directors, (but is not allowed to vote)and members of senior management may attend the meetings of the board of directors and committees may have officers or employees as permanent members to guarantee an adequate flow of information between employees, management and directors.directors; in both cases, the CEO and members of senior management are not allowed to vote. In accordance with Law 964 of 2005 and the Bank’s by-laws, no executive officer can be elected as chairman of the Bank’s board of directors. |
| · | Committees of the Board of Directors. Under NYSE listing standards, all U.S. companies listed on the NYSE must have an audit committee, a compensation committee, and a nominating/corporate governance committee and all members of such committees must be independent. In each case, the independence of directors must be established pursuant to highly detailed rules enacted by the NYSE and, in the case of the audit committee, the NYSE and the SEC. The Bank’s board of directors has a“Board Issues Committee”, a “Designation, Compensation and Development Committee,”, a “Corporate Governance Committee,”, a Risk Committee and an “Audit Committee,”, each of which is composed exclusively of both directors and officers, except the audit committee, which is composed of three independent directors but no officers.directors. For a description of the Designation, Compensation and Development Committee, Corporate Governance Committee and Audit Committee, see “Item 6. Directors, Senior Management and Employees – C. Board Practices”. |
| · | Stockholders’ Approval of Dividends. While NYSE corporate governance standards do not require listed companies to have stockholders approve or declare dividends, in accordance with the Colombian Code of Commerce, all dividends must be approved by Bancolombia’s stockholders. |
| H. | MINE SAFETY DISCLOSURES |
Not applicable
PART III
FINANCIAL STATEMENTS
ITEM 17. FINANCIAL STATEMENTS
| ITEM 17. | FINANCIAL STATEMENTS |
Not applicable.
ITEM 18.
| ITEM 18. | FINANCIAL STATEMENTS |
Not applicable.
Reference is made to pages F - 1 through F – 143.
ITEM 19. EXHIBITS
The following exhibits are filed as part of this Annual Report.
| 1.1 | English translation of the corporate by-laws (estatutos sociales)(estatutos sociales) of the registrant, as amended on March 7, 2011(1).October 30, 2015. |
| 2.1 | The Deposit Agreement entered into between Bancolombia and The Bank of New York, as amended and restated on January 14, 2008(2)(1). |
2.2 | Instruments defining the rights of the holders of long-term debt issued by Bancolombia S.A. and its subsidiaries. We agree
|
| The Bank agrees to furnish to the SEC upon request, copies of the instruments, including indentures, defining the rights of the holders of our long-term debt and of our subsidiaries’ long-term debt. |
| 7.1 | Selected Ratios’ Calculation. |
8.18.1. | List of Subsidiaries. |
| 12.1 | CEO Certification pursuant to Section 302 of the Sarbanes-Oxley Act of 2002, dated April 30, 2013.22, 2016. |
| 12.2 | CFO Certification pursuant to Section 302 of the Sarbanes-Oxley Act of 2002, dated April 30, 2013.22, 2016. |
| 13.1 | CEO Certification pursuant to Section 906 of the Sarbanes-Oxley Act of 2002, dated April 30, 2013.22, 2016. |
| 13.2 | CFO Certification pursuant to Section 906 of the Sarbanes-Oxley Act of 2002, dated April 30, 2013.22, 2016. |
15.1 | Consent of Pricewaterhouse Coopers Ltda. |
(1) Incorporated by reference to the Bank’s Annual Report on Form 20-F for the year ended December 31, 2010 filed on April 28, 2011.
(2)Incorporated by reference to the Registration Statement in Form F-6, filed by Bancolombia on January 14, 2008.
| (1) | Incorporated by reference to the Registration Statement in Form F-6, filed by Bancolombia on January 14, 2008. |
SIGNATURE
The registrant hereby certifies that it meets all of the requirements for filing on Form 20-F and that it has duly caused and authorized the undersigned to sign this annual report on its behalf.
BANCOLOMBIA S.A.
/s/ JAIME ALBERTO VELASQUEZ BOTERO
Name: Jaime Alberto Velasquez Botero.
Title: Vice President, Strategy and Finance.
Date: April 30, 2013
INDEX TO CONSOLIDATED FINANCIAL STATEMENTS
| | PageBANCOLOMBIA S.A | |
| | |
Reports of Independent Registered Public Accounting Firms | F-2 |
| | |
Consolidated Balance Sheets/s/ JAIME ALBERTO VELASQUEZ BOTERO | |
As of December 31, 2012 and 2011 | F-4Name: Jaime Alberto Velasquez Botero. | |
| | |
Consolidated Statements of OperationsTitle: Vice President, Strategy and Finance | |
As of December 31, 2012, 2011 and 2010 | F-6 |
| |
Consolidated Statements of Stockholders’ Equity | |
As of December 31, 2012, 2011 and 2010 | F-8 |
| |
Consolidated Statements of Cash Flows | |
As of December 31, 2012, 2011 and 2010 | F-9 |
| |
Notes to Consolidated Financial Statements | F-10 |
Date: April 22, 2016


Report of Independent Registered Public Accounting Firm
To The Board of Directors and Stockholders of Bancolombia S. A.
In our opinion, the accompanying consolidated balance sheetsstatement of financial position and the related consolidated statements of operations, ofincome, and other comprehensive income, changes in stockholders’ equity and of cash flows present fairly, in all material respects, the financial position of Bancolombia S. A. and its subsidiaries (the "Bank"“Bank”) atas of December 31, 20122015 and 2011,2014 and January 1, 2014, and the results of their operations, and their cash flows for each of the threetwo years in the period ended December 31, 2012, 2011 and 20102015, in conformity with accounting principles generally accepted in Colombia andInternational Financial Reporting Standards as issued by the special regulations of the Colombian Superintendency of Finance, collectively “Colombian GAAP” .International Accounting Standards Board. Also in our opinion, the Bank maintained, in all material respects, effective internal control over financial reporting as of December 31, 2012,2015, based on criteria established inInternal Control - Integrated Framework (2013) issued by the Committee of Sponsoring Organizations of the Treadway Commission (COSO)(“COSO”). The Bank's management is responsible for these financial statements, for maintaining effective internal control over financial reporting and for its assessment of the effectiveness of internal control over financial reporting, included in “Management's Report on Internal Control Over Financial Reporting” appearing under Item 15. 15 of the Bancolombia S. A. Form 20-F dated April 22, 2016.
Our responsibility is to express opinions on these financial statements and on the Bank’s internal control over financial reporting based on our integrated audits. We conducted our audits in accordance with the standards of the Public Company Accounting Oversight Board (United States) and auditing standards generally accepted in Colombia.. Those standards require that we plan and perform the audits to obtain reasonable assurance about whether the financial statements are free of material misstatement and whether effective internal control over financial reporting was maintained in all material respects. Our audits of the financial statements included examining, on a test basis, evidence supporting the amounts and disclosures in the financial statements, assessing the accounting principles used and significant estimates made by management, and evaluating the overall financial statement presentation. Our audit of internal control over financial reporting included obtaining an understanding of internal control over financial reporting, assessing the risk that a material weakness exists, and testing and evaluating the design and operating effectiveness of internal control based on the assessed risk. Our audits also included performing such other procedures as we considered necessary in the circumstances. We believe that our audits provide a reasonable basis for our opinions.
Colombian GAAP varies in certain significant respects from accounting principles generally accepted in the United States of America. Information relating to the nature and effect of such differences is presented in Note 31 to the consolidated financial statements.
A company’s internal control over financial reporting is a process designed to provide reasonable assurance regarding the reliability of financial reporting and the preparation of the financial statements for external purposes in accordance with generally accepted accounting principles.
PricewaterhouseCoopers Ltda., Edificio Foruum, Calle 7 Sur No. 42-70, Torre 2, Piso 11, Medellín, Colombia, Tel: (57-4) 325 4320, Fax: (57-4) 325 4322, wwww.pwc.com/co
Report of Independent Registered Public Accounting Firm
A company’s internal control over financial reporting includes those policies and procedures that (i) pertain to the maintenance of records that, in reasonable detail, accurately and fairly reflect the transactions and dispositions of the assets of the company; (ii) provide reasonable assurance that transactions are recorded as necessary to permit preparation of the consolidated financial statements in accordance with generally accepted accounting principles, and that receipts and expenditures of the company are being made only in accordance with authorizations of management and directors of the company; and (iii) provide reasonable assurance regarding prevention or timely detection of unauthorized acquisition, use, or disposition of the company’s assets that could have a material effect on the financial statements.
PricewaterhouseCoopers Ltda., Edificio Forum, Calle 7 sur No. 42-70, Torre 2, Piso 11, Medellín, Colombia,
Tel: (57-4) 325 4320, Fax: (57-4) 325 4322, www.pwc.com/co
Report of Independent Registered Public Accounting Firm
To The Board of Directors and Stockholders of Bancolombia S. A.
April 22, 2016
Because of its inherent limitations, internal control over financial reporting may not prevent or detect misstatements. Also, projections of any evaluation of effectiveness to future periods are subject to the risk that controls may become inadequate because of changes in conditions, or that the degree of compliance with the policies or procedures may deteriorate.
As described in “Management's Report on Internal Control Over Financial Reporting”, management has excluded Grupo Agromercantil Holding S. A. and subsidiaries from its assessment of internal control over financial reporting as of 2015 because it was acquired by the Bank in a purchase business combination during 2015. We have also excluded Grupo Agromercantil Holding S. A. and subsidiaries from our audit of internal control over financial reporting. Grupo Agromercantil Holding S. A. and subsidiaries is a 60%-owned subsidiary whose total assets and total revenues represent 6.22% and 0%, respectively of the related consolidated financial statement amounts as of and for the year ended December 31, 2015.
PricewaterhouseCoopers Ltda.
Medellin,Medellín, Colombia
April 30, 2013
22, 2016
CONSOLIDATED STATEMENT OF FINANCIAL POSITION
BANCOLOMBIA S.A. AND ITS SUBSIDIARIES
Consolidated Balance Sheets
As of December 31, 20122015, 2014 and 2011
January 1, 2014
(Stated in millions of Colombian pesos and thousands of U.S. Dollars)pesos)
| | | Notes | | | 2012(1) (Unaudited) | | | 2012 | | | 2011 | |
| | | | | | U.S. Dollar | | | | | | | |
| Assets | | | | | | | | | | | | | | | | |
| | | | | | | | | | | | | | | | | |
| Cash and cash equivalents: | | | | | | | | | | | | | | | | |
| Cash and due from banks | | | 4 | | | USD | 4,040,207 | | | COP | 7,144,015 | | | COP | 6,818,307 | |
| Funds sold and securities purchased under agreements to resell | | | | | | | 579,722 | | | | 1,025,082 | | | | 910,690 | |
| Total cash and cash equivalents | | | | | | | 4,619,929 | | | | 8,169,097 | | | | 7,728,997 | |
| | | | | | | | | | | | | | | | | |
| Investment securities: | | | 5 | | | | | | | | | | | | | |
| Debt securities: | | | | | | | 6,465,343 | | | | 11,432,214 | | | | 9,201,210 | |
| Trading | | | | | | | 3,671,927 | | | | 6,492,812 | | | | 3,706,039 | |
| Available for sale | | | | | | | 823,446 | | | | 1,456,042 | | | | 1,759,483 | |
| Held to maturity | | | | | | | 1,969,970 | | | | 3,483,360 | | | | 3,735,688 | |
| Equity securities: | | | | | | | 642,595 | | | | 1,136,256 | | | | 838,973 | |
| Trading | | | | | | | 184,982 | | | | 327,091 | | | | 305,764 | |
| Available for sale | | | | | | | 457,613 | | | | 809,165 | | | | 533,209 | |
| Allowance for impairment | | | | | | | (8,007 | ) | | | (14,159 | ) | | | (81,992 | ) |
| Total investment securities | | | | | | | 7,099,931 | | | | 12,554,311 | | | | 9,958,191 | |
| | | | | | | | | | | | | | | | | |
| Loans and financial leases: | | | 6 | | | | | | | | | | | | | |
| Commercial loans | | | | | | | 24,015,914 | | | | 42,465,660 | | | | 38,212,997 | |
| Consumer loans | | | | | | | 7,114,833 | | | | 12,580,661 | | | | 10,846,046 | |
| Small business loans | | | | | | | 189,224 | | | | 334,591 | | | | 316,906 | |
| Mortgage loans | | | | | | | 3,369,372 | | | | 5,957,824 | | | | 4,840,668 | |
| Financial leases | | | | | | | 4,891,865 | | | | 8,649,943 | | | | 7,171,811 | |
| | | | | | | | 39,581,208 | | | | 69,988,679 | | | | 61,388,428 | |
| Allowance for loan and financial lease losses | | | 7 | | | | (1,837,792 | ) | | | (3,249,639 | ) | | | (2,812,582 | ) |
| Total loans and financial leases, net | | | | | | | 37,743,416 | | | | 66,739,040 | | | | 58,575,846 | |
| | | | | | | | | | | | | | | | | |
| Accrued interest receivable on loans and financial leases: | | | | | | | | | | | | | | | | |
| Accrued interest receivable on loans and financial leases | | | | | | | 326,918 | | | | 578,067 | | | | 482,833 | |
| Allowance for accrued interest losses | | | 7 | | | | (30,554 | ) | | | (54,026 | ) | | | (43,644 | ) |
| Total interest accrued,net | | | | | | | 296,364 | | | | 524,041 | | | | 439,189 | |
| | | | | | | | | | | | | | | | | |
| Customers’ acceptances and derivatives | | | 8 | | | | 442,824 | | | | 783,014 | | | | 741,296 | |
| Accounts receivable, net | | | 9 | | | | 703,112 | | | | 1,243,263 | | | | 1,016,985 | |
| Premises and equipment, net | | | 10 | | | | 758,780 | | | | 1,341,698 | | | | 1,622,311 | |
| Premises and equipment under operating leases, net | | | 11 | | | | 1,239,617 | | | | 2,191,928 | | | | 1,380,057 | |
| Foreclosed assets, net | | | 15 | | | | 47,968 | | | | 84,818 | | | | 53,194 | |
| Prepaid expenses and deferred charges, net | | | 12 | | | | 437,121 | | | | 772,930 | | | | 785,456 | |
| Goodwill | | | 14 | | | | 323,133 | | | | 571,373 | | | | 679,861 | |
| Other assets | | | 13 | | | | 1,181,377 | | | | 2,088,947 | | | | 1,697,648 | |
| Reappraisal of assets | | | 16 | | | | 481,793 | | | | 851,920 | | | | 783,989 | |
| Total assets | | | | | | USD | 55,375,365 | | | COP | 97,916,380 | | | COP | 85,463,020 | |
| | | | | | | | | | | | | | | | | |
| Memorandum accounts | | | 25 | | | USD | 268,982,082 | | | COP | 475,622,182 | | | COP | 454,772,061 | |
| | | Note | | December 31, 2015 | | | December 31, 2014 | | | January 1, 2014 | |
| Assets | | | | | | | | | | | | | | |
| Cash and cash equivalents | | 4 | | | 18,597,614 | | | | 13,466,783 | | | | 15,445,977 | |
| Financial assets Investments | | 5.1 | | | 14,277,824 | | | | 12,784,223 | | | | 13,082,856 | |
| Derivative financial instruments | | 5.2 | | | 2,382,168 | | | | 1,448,845 | | | | 529,619 | |
| Loans and advances to customers | | | | | 145,620,639 | | | | 115,173,653 | | | | 96,403,318 | |
| Allowance for loan and lease losses | | | | | (5,248,755 | ) | | | (4,789,257 | ) | | | (4,473,562 | ) |
| Loans and advances to customers, net | | 6 | | | 140,371,884 | | | | 110,384,396 | | | | 91,929,756 | |
| Assets held for sale and inventories | | 12,31 | | | 1,950,808 | | | | 97,744 | | | | 53,651 | |
| Investment in associates and joint ventures | | 7 | | | 546,549 | | | | 1,349,697 | | | | 1,029,482 | |
| Investment property | | 10 | | | 1,505,046 | | | | 1,114,180 | | | | 984,701 | |
| Premises and equipment, net | | 9 | | | 3,241,562 | | | | 2,646,321 | | | | 2,426,470 | |
| Goodwill and intangible assets, net | | 8 | | | 7,092,255 | | | | 4,585,849 | | | | 3,893,518 | |
| Deferred tax, net | | 11 | | | 170,482 | | | | 187,737 | | | | 239,359 | |
| Other assets | | 13 | | | 2,836,675 | | | | 1,564,106 | | | | 1,360,974 | |
| Total assets | | | | | 192,972,867 | | | | 149,629,881 | | | | 130,976,363 | |
| Liabilities and Stockholders' Equity | | | | | | | | | | | | | | |
| Liabilities | | | | | | | | | | | | | | |
| Deposit from customers | | 14 | | | 121,802,028 | | | | 94,769,319 | | | | 86,512,104 | |
| Interbank deposits | | 15 | | | 400,062 | | | | 375,958 | | | | 229,201 | |
| Repurchase agreements and other similar secured borrowing | | 15 | | | 1,232,456 | | | | 1,891,959 | | | | 1,016,442 | |
| Liabilities relating to assets held for sale | | 31 | | | 1,605,133 | | | | - | | | | - | |
| Derivative financial instruments | | 5.2 | | | 1,930,609 | | | | 1,471,779 | | | | 621,988 | |
| Borrowings from other financial institutions | | 16 | | | 19,721,184 | | | | 13,852,284 | | | | 12,478,711 | |
| Debt securities in issue | | 17 | | | 19,435,865 | | | | 14,527,403 | | | | 12,673,741 | |
| Preferred shares | | | | | 580,959 | | | | 579,946 | | | | 299,963 | |
| Current tax | | | | | 193,949 | | | | 119,654 | | | | 156,676 | |
| Deferred tax, net | | 11 | | | 834,392 | | | | 543,101 | | | | 409,842 | |
| Post-employment benefit plans | | 18 | | | 546,422 | | | | 424,558 | | | | 323,094 | |
| Other liabilities | | 19, 20 | | | 4,281,889 | | | | 3,707,440 | | | | 3,610,794 | |
| Total liabilities | | | | | 172,564,948 | | | | 132,263,401 | | | | 118,332,556 | |
| Stockholders' Equity | | | | | | | | | | | | | | |
| Share capital | | 21 | | | 480,914 | | | | 480,914 | | | | 425,914 | |
| Additional paid-in-capital | | | | | 4,857,454 | | | | 4,857,454 | | | | 2,571,399 | |
| Appropriated reserves | | 22 | | | 5,877,379 | | | | 5,130,861 | | | | 4,372,669 | |
| Retained earnings | | | | | 5,850,588 | | | | 5,667,037 | | | | 4,726,819 | |
| Accumulated other comprehensive income (loss), net of tax | | | | | 2,213,114 | | | | 735,641 | | | | 84,821 | |
| Stockholders’ equity attributable to the owners of the Parent Company | | | | | 19,279,449 | | | | 16,871,907 | | | | 12,181,622 | |
| Non-controlling interest | | | | | 1,128,470 | | | | 494,573 | | | | 462,185 | |
| Total stockholders equity | | | | | 20,407,919 | | | | 17,366,480 | | | | 12,643,807 | |
| Total liabilities and stockholders' equity | | | | | 192,972,867 | | | | 149,629,881 | | | | 130,976,363 | |
BANCOLOMBIA S.A. AND ITS SUBSIDIARIES
Consolidated Balance Sheets
December 31, 2012 and 2011
(Stated in millions of Colombian pesos and thousands of U.S. Dollars)
| | | Notes | | | 2012(1) (Unaudited) | | | 2012 | | | 2011 | |
| | | | | | U.S. Dollar | | | | | | | |
| Liabilities and Stockholders’ Equity | | | | | | | | | | | | | | | | |
| Deposits | | | | | | | | | | | | | | | | |
| Non- interest bearing : | | | | | | | | | | | | | | | | |
| Checking accounts | | | | | | USD | 4,988,298 | | | COP | 8,820,458 | | | COP | 7,909,743 | |
| Other | | | | | | | 553,331 | | | | 978,416 | | | | 904,430 | |
| Interest bearing: | | | | | | | | | | | | | | | | |
| Checking accounts | | | | | | | 1,401,652 | | | | 2,478,443 | | | | 2,384,151 | |
| Time deposits | | | | | | | 14,006,939 | | | | 24,767,489 | | | | 17,973,117 | |
| Savings deposits | | | | | | | 15,333,930 | | | | 27,113,914 | | | | 23,263,051 | |
| Total deposits | | | | | | | 36,284,150 | | | | 64,158,720 | | | | 52,434,492 | |
| | | | | | | | | | | | | | | | | |
| Funds purchased and securities sold under agreements to repurchase | | | | | | | 25,412 | | | | 44,935 | | | | 1,954,552 | |
| Bank acceptances outstanding and derivatives | | | 8 | | | | 353,818 | | | | 625,632 | | | | 513,975 | |
| Interbank borrowings | | | 17 | | | | 1,020,040 | | | | 1,803,665 | | | | 4,130,915 | |
| Borrowings from development and other domestic banks | | | 18 | | | | 1,961,195 | | | | 3,467,843 | | | | 3,328,011 | |
| Accounts payable | | | | | | | 1,307,082 | | | | 2,311,221 | | | | 2,173,253 | |
| Accrued interest payable | | | | | | | 296,146 | | | | 523,655 | | | | 397,412 | |
| Other liabilities | | | 19 | | | | 502,305 | | | | 888,190 | | | | 874,330 | |
| Long-term debt | | | 20 | | | | 6,819,938 | | | | 12,059,219 | | | | 10,308,983 | |
| Accrued expenses | | | 21 | | | | 195,083 | | | | 344,951 | | | | 280,282 | |
| Minority interest | | | | | | | 46,031 | | | | 81,394 | | | | 73,455 | |
| Total liabilities | | | | | | | 48,811,200 | | | | 86,309,425 | | | | 76,469,660 | |
| | | | | | | | | | | | | | | | | |
| Stockholders’ equity | | | 22,24 | | | | | | | | | | | | | |
| Subscribed and paid in capital: | | | | | | | 278,631 | | | | 492,684 | | | | 460,684 | |
| Non-voting preference shares | | | | | | | 103,732 | | | | 183,422 | | | | 151,422 | |
| Common shares | | | | | | | 174,899 | | | | 309,262 | | | | 309,262 | |
| Retained earnings: | | | | | | | | | | | | | | | | |
| Appropriated | | | 23 | | | | 4,917,425 | | | | 8,695,139 | | | | 6,221,793 | |
| Unappropriated | | | | | | | 962,570 | | | | 1,702,046 | | | | 1,663,894 | |
| Reappraisal of assets | | | 16 | | | | 391,824 | | | | 692,835 | | | | 637,040 | |
| Gross unrealized gain or (loss) on available for sale investments | | | | | | | 13,715 | | | | 24,251 | | | | 9,949 | |
| Total stockholders’ equity(2) | | | | | | | 6,564,165 | | | | 11,606,955 | | | | 8,993,360 | |
| | | | | | | | | | | | | | | | | |
| Total liabilities and stockholders’ equity | | | | | | USD | 55,375,365 | | | COP | 97,916,380 | | | COP | 85,463,020 | |
| | | | | | | | | | | | | | | | | |
| Memorandum accounts against | | | 25 | | | USD | 268,982,082 | | | COP | 475,622,182 | | | COP | 454,772,061 | |
The accompanying notes numbered 1 to 31, form an integral part of these Consolidated Financial Statements.
| (2) | A summary of significant adjustments to stockholders’ equity that would be required if U.S. GAAP had been applied is disclosed in Note 31. |
CONSOLIDATED STATEMENT OF INCOME
BANCOLOMBIA S.A. AND ITS SUBSIDIARIES
Consolidated Statements of Operations
YearsFor the years ended December 31, 2012, 20112015 and 20102014
(Stated in millions of Colombian pesos, and thousands of U.S. Dollars, except per share data)EPS)
| | | Note | | | 2012(1) (Unaudited) | | | 2012 | | | 2011 | | | 2010 | |
| | | | | | U.S. Dollar | | | | | | | | | | |
| | | | | | | | | | | | | | | | |
| Interest income: | | | | | | | | | | | | | | | | | | | | |
| Loans | | | | | | USD | 3,420,316 | | | COP | 6,047,906 | | | COP | 4,660,580 | | | COP | 3,892,114 | |
| Investment securities | | | | | | | 429,533 | | | | 759,513 | | | | 625,559 | | | | 454,368 | |
| Funds sold and securities purchased under agreements to resell | | | | | | | 13,674 | | | | 24,178 | | | | 18,820 | | | | 41,998 | |
| Financial leases | | | | | | | 469,558 | | | | 830,286 | | | | 640,635 | | | | 572,160 | |
| Total interest income | | | | | | | 4,333,081 | | | | 7,661,883 | | | | 5,945,594 | | | | 4,960,640 | |
| | | | | | | | | | | | | | | | | | | | | |
| Interest expense: | | | | | | | | | | | | | | | | | | | | |
| Checking accounts | | | | | | | 14,099 | | | | 24,931 | | | | 39,926 | | | | 38,858 | |
| Time deposits | | | | | | | 631,951 | | | | 1,117,435 | | | | 690,457 | | | | 693,746 | |
| Saving deposits | | | | | | | 372,890 | | | | 659,355 | | | | 479,442 | | | | 321,662 | |
| Total interest expense on deposits | | | | | | | 1,018,940 | | | | 1,801,721 | | | | 1,209,825 | | | | 1,054,266 | |
| | | | | | | | | | | | | | | | | | | | | |
| Interbank borrowings | | | | | | | 28,395 | | | | 50,209 | | | | 45,840 | | | | 19,537 | |
| Borrowings from development and other domestic banks | | | | | | | 124,472 | | | | 220,096 | | | | 159,909 | | | | 139,032 | |
| Funds purchased and securities sold under agreements to repurchase | | | | | | | 55,208 | | | | 97,620 | | | | 85,260 | | | | 40,451 | |
| Long-term debt | | | | | | | 410,136 | | | | 725,214 | | | | 541,172 | | | | 318,295 | |
| Total interest expense | | | | | | | 1,637,151 | | | | 2,894,860 | | | | 2,042,006 | | | | 1,571,581 | |
| | | | | | | | | | | | | | | | | | | | | |
| Net interest income | | | | | | | 2,695,930 | | | | 4,767,023 | | | | 3,903,588 | | | | 3,389,059 | |
| | | | | | | | | | | | | | | | | | | | | |
| Provisions for loans and finance leases, accrued interest losses and other receivables, net | | | | | | | (701,458 | ) | | | (1,240,339 | ) | | | (840,558 | ) | | | (788,794 | ) |
| Recovery of charged-off loans and finance leases | | | | | | | 94,908 | | | | 167,819 | | | | 244,141 | | | | 276,209 | |
| Provision for foreclosed assets and other assets | | | | | | | (67,277 | ) | | | (118,961 | ) | | | (123,994 | ) | | | (67,187 | ) |
| Recovery of provisions for foreclosed assets and other assets | | | | | | | 45,587 | | | | 80,608 | | | | 121,706 | | | | 32,057 | |
| Total net provisions | | | | | | | (628,240 | ) | | | (1,110,873 | ) | | | (598,705 | ) | | | (547,715 | ) |
| Net interest income after provisions for loans and accrued interest losses | | | | | | | 2,067,690 | | | | 3,656,150 | | | | 3,304,883 | | | | 2,841,344 | |
| | | | | | | | | | | | | | | | | | | | | |
| Fees and other service income: | | | | | | | | | | | | | | | | | | | | |
| Commissions from banking services | | | | | | | 254,182 | | | | 449,452 | | | | 383,984 | | | | 307,890 | |
| Electronic services and ATM fees | | | | | | | 41,786 | | | | 73,887 | | | | 67,267 | | | | 57,019 | |
| Branch network services | | | | | | | 71,459 | | | | 126,356 | | | | 125,835 | | | | 118,647 | |
| Collections and payments fees | | | | | | | 145,062 | | | | 256,503 | | | | 224,878 | | | | 226,537 | |
| Credit card merchant fees | | | | | | | 5,477 | | | | 9,684 | | | | 16,725 | | | | 18,355 | |
| Credit and debit card fees | | | | | | | 370,370 | | | | 654,900 | | | | 617,526 | | | | 564,457 | |
| Checking fees | | | | | | | 41,078 | | | | 72,636 | | | | 74,514 | | | | 69,425 | |
| Trust activities | | | | | | | 117,961 | | | | 208,583 | | | | 188,340 | | | | 165,075 | |
| Pension plan management(2) | | | | | | | - | | | | - | | | | - | | | | 90,131 | |
| Brokerage fees | | | | | | | 35,986 | | | | 63,631 | | | | 65,943 | | | | 36,779 | |
| Check remittances | | | | | | | 12,510 | | | | 22,120 | | | | 19,626 | | | | 17,693 | |
| International wire transfers | | | | | | | 40,680 | | | | 71,932 | | | | 71,293 | | | | 58,559 | |
| Total fees and other service income | | | | | | | 1,136,551 | | | | 2,009,684 | | | | 1,855,931 | | | | 1,730,567 | |
| | | | | | | | | | | | | | | | | | | | | |
| Fees and other service expenses | | | | | | | (114,603 | ) | | | (202,644 | ) | | | (187,347 | ) | | | (149,653 | ) |
| Total fees and income from services, net | | | | | | | 1,021,948 | | | | 1,807,040 | | | | 1,668,584 | | | | 1,580,914 | |
| | | Note | | 2015 | | | 2014 | |
| Interest on loans | | | | | | | | | | |
| Commercial | | | | | 5,487,993 | | | | 3,889,542 | |
| Consumer | | | | | 2,333,173 | | | | 1,997,319 | |
| Small business loans | | | | | 188,438 | | | | 158,344 | |
| Mortgage | | | | | 1,396,002 | | | | 1,372,337 | |
| Leasing | | | | | 1,547,634 | | | | 1,172,218 | |
| Interest income on loans | | | | | 10,953,240 | | | | 8,589,760 | |
| Interest income on overnight and market funds | | | | | 14,564 | | | | 11,122 | |
| Interest and valuation on investment | | 24.1 | | | 301,840 | | | | 571,281 | |
| Total interest and valuation | | | | | 11,269,644 | | | | 9,172,163 | |
| Interest expenses | | 24.1 | | | (4,037,941 | ) | | | (3,164,611 | ) |
| Net margin and valuation on financial instruments | | | | | 7,231,703 | | | | 6,007,552 | |
| Credit impairment charges on loans and financial leases, net | | | | | (1,667,680 | ) | | | (843,597 | ) |
| Allowances for credit losses on off balance sheet credit instruments | | | | | (7,421 | ) | | | (25,608 | ) |
| Total net provisions | | | | | (1,675,101 | ) | | | (869,205 | ) |
| Net interest and valuation income after provisions for loans and financial leases and off balance sheet credit instruments | | | | | 5,556,602 | | | | 5,138,347 | |
| Fees and other service income | | 24.3 | | | 2,790,557 | | | | 2,495,417 | |
| Fees and other service expenses | | 24.3 | | | (797,513 | ) | | | (669,707 | ) |
| Total fees and income from services, net | | | | | 1,993,044 | | | | 1,825,710 | |
| Other operating income | | 24.4 | | | 1,372,702 | | | | 1,136,543 | |
| Dividends received and equity method | | | | | 211,574 | | | | 122,689 | |
| Total operating income, net | | | | | 9,133,922 | | | | 8,223,289 | |
| Operating expenses | | | | | | | | | | |
| Salaries and employee benefits | | | | | (2,255,391 | ) | | | (1,973,467 | ) |
| Other administrative and general expenses | | 25 | | | (2,237,598 | ) | | | (1,947,375 | ) |
| Wealth tax, contributions and other tax burden | | | | | (675,387 | ) | | | (438,711 | ) |
| Provision of goodwill, depreciation and amortization | | 25 | | | (477,285 | ) | | | (459,703 | ) |
| Other expenses | | | | | (252,626 | ) | | | (299,439 | ) |
| Total operating expenses | | | | | (5,898,287 | ) | | | (5,118,695 | ) |
| Profit before tax | | | | | 3,235,635 | | | | 3,104,594 | |
| Income tax | | | | | (649,250 | ) | | | (737,676 | ) |
| Profit for the year from continuing operations | | | | | 2,586,385 | | | | 2,366,918 | |
| Net income from discontinuing operations | | 31 | | | 22,513 | | | | 62,867 | |
| Net income | | | | | 2,608,898 | | | | 2,429,785 | |
| Net income attributable to equity holders of the Parent Company | | | | | 2,518,890 | | | | 2,387,086 | |
| Non-controlling interest | | | | | 90,008 | | | | 42,699 | |
| Basic and Diluted earnings per share to common shareholders | | 26 | | | 2,680 | | | | 2,591 | |
| From continuing operations | | | | | 2,656 | | | | 2,524 | |
| From discontinuing operations | | | | | 24 | | | | 67 | |
BANCOLOMBIA S.A. AND ITS SUBSIDIARIES
Consolidated Statements of Operations
Years ended December 31, 2012, 2011 and 2010
(Stated in millions of Colombian pesos and thousands of U.S. Dollars, except per share data)
| | | Note | | | 2012(1) (Unaudited) | | | 2012 | | | 2011 | | | 2010 | |
| | | | | | U.S. Dollar | | | | | | | | | | |
| Other operating income: | | | | | | | | | | | | | | | | | | | | |
| Foreign exchange gain (loss), net | | | | | | | 58,789 | | | | 103,953 | | | | 111,774 | | | | 62,110 | |
| Gains on forward contracts in foreign currency | | | | | | | 33,311 | | | | 58,902 | | | | 11,034 | | | | 39,536 | |
| Gains on sales of investments in equity securities | | | | | | | 46,480 | | | | 82,187 | | | | 121,166 | | | | 45,716 | |
| Gains on sales of mortgage loans | | | | | | | 24,401 | | | | 43,146 | | | | 48,714 | | | | 85,862 | |
| Dividend income | | | | | | | 26,925 | | | | 47,610 | | | | 27,700 | | | | 34,699 | |
| Income from non-financial subsidiaries | | | | | | | 83,306 | | | | 147,304 | | | | 100,647 | | | | 87,625 | |
| Insurance income(2) | | | | | | | - | | | | - | | | | 45,690 | | | | 2,808 | |
| Communication, postage, rent and others | | | | | | | 197,935 | | | | 349,995 | | | | 224,512 | | | | 176,700 | |
| Total other operating income | | | | | | | 471,147 | | | | 833,097 | | | | 691,237 | | | | 535,056 | |
| Total operating income | | | | | | | 3,560,785 | | | | 6,296,287 | | | | 5,664,704 | | | | 4,957,314 | |
| | | | | | | | | | | | | | | | | | | | | |
| Operating expenses: | | | | | | | | | | | | | | | | | | | | |
| Salaries and employee benefits | | | | | | | 788,374 | | | | 1,394,027 | | | | 1,275,351 | | | | 1,139,947 | |
| Bonus plan payments | | | | | | | 115,483 | | | | 204,201 | | | | 137,160 | | | | 126,839 | |
| Indemnities benefits | | | | | | | 22,312 | | | | 39,452 | | | | 29,347 | | | | 27,551 | |
| Administrative and other expenses | | | 27 | | | | 1,153,822 | | | | 2,040,223 | | | | 1,780,459 | | | | 1,455,025 | |
| Insurance on deposits, net | | | | | | | 59,763 | | | | 105,675 | | | | 90,769 | | | | 84,399 | |
| Donation expenses | | | | | | | 7,642 | | | | 13,512 | | | | 19,020 | | | | 13,008 | |
| Depreciation | | | | | | | 180,747 | | | | 319,602 | | | | 223,003 | | | | 195,744 | |
| Goodwill amortization | | | 14 | | | | 25,838 | | | | 45,690 | | | | 51,239 | | | | 55,966 | |
| Total operating expenses | | | | | | | 2,353,981 | | | | 4,162,382 | | | | 3,606,348 | | | | 3,098,479 | |
| Net operating income | | | | | | | 1,206,804 | | | | 2,133,905 | | | | 2,058,356 | | | | 1,858,835 | |
| | | | | | | | | | | | | | | | | | | | | |
| Non-operating income: | | | | | | | | | | | | | | | | | | | | |
| Other income | | | | | | | 84,125 | | | | 148,751 | | | | 200,098 | | | | 267,472 | |
| Minority interest | | | | | | | (3,237 | ) | | | (5,723 | ) | | | (11,351 | ) | | | (13,217 | ) |
| Other expense | | | | | | | (60,972 | ) | | | (107,813 | ) | | | (112,692 | ) | | | (168,179 | ) |
| Total non-operating income, net | | | 28 | | | | 19,916 | | | | 35,215 | | | | 76,055 | | | | 86,076 | |
| | | | | | | | | | | | | | | | | | | | | |
| Income before income taxes | | | | | | | 1,226,720 | | | | 2,169,120 | | | | 2,134,411 | | | | 1,944,911 | |
| Income tax expense | | | 21 | | | | (264,150 | ) | | | (467,074 | ) | | | (470,517 | ) | | | (508,417 | ) |
| Net income | | | | | | USD | 962,570 | | | COP | 1,702,046 | | | COP | 1,663,894 | | | COP | 1,436,494 | |
| | | | | | | | | | | | | | | | | | | | | |
| Earnings per share | | | | | | USD | 1.14 | | | COP | 2,013 | | | COP | 2,112 | | | COP | 1,823 | |
The accompanying notes numbered 1 to 31, form an integral part of these Consolidated Financial Statements.
| (2) | Aseguradora Suiza Salvadoreña and AFP Crecer were sold in 2012 and 2011, respectively. See Note 1. |
CONSOLIDATED STATEMENT OF OTHER COMPREHENSIVE INCOME
BANCOLOMBIA S.A. AND ITS SUBSIDIARIES
Consolidated Statements of Stockholders’ Equity
YearsFor the years ended December 31, 2012, 2011,2015 and 2010
2014
(Stated in millions of Colombian pesos, and thousands of U.S. Dollars, except share data)EPS)
| | | Non Voting Preferred Shares | | | Voting Common Shares | | | Retained Earnings | | | Surplus | | | Total | |
| | | Number | | | Par Value | | | Number | | | Par Value | | | Appro-
priated | | | Unappro-
priated | | | Reappraisal
of assets | | | Gross unrealized
gain or( loss) on
available for sale
investments | | | Stockholders’
equity | |
| | | | | | | | | | | | | | | | | | | | | | | | | | | | |
| Balance at December 31, 2009 | | | 278,122,419 | | | COP | 151,422 | | | | 509,704,584 | | | COP | 309,262 | | | COP | 4,697,355 | | | COP | 1,256,850 | | | COP | 582,377 | | | COP | 35,563 | | | COP | 7,032,829 | |
| Net income | | | - | | | | - | | | | - | | | | - | | | | - | | | | 1,436,494 | | | | - | | | | - | | | | 1,436,494 | |
| Transfer to appropriated retained earnings | | | - | | | | - | | | | - | | | | - | | | | 1,256,850 | | | | (1,256,850 | ) | | | - | | | | - | | | | - | |
| Reappraisal of assets and valuation of investments | | | - | | | | - | | | | - | | | | - | | | | - | | | | - | | | | 39,850 | | | | (5,801 | ) | | | 34,049 | |
| Dividends declared | | | - | | | | - | | | | - | | | | - | | | | (501,688 | ) | | | - | | | | - | | | | - | | | | (501,688 | ) |
| Cumulative translation adjustments | | | - | | | | - | | | | - | | | | - | | | | (54,544 | ) | | | - | | | | - | | | | - | | | | (54,544 | ) |
| Balance at December 31, 2010 | | | 278,122,419 | | | | 151,422 | | | | 509,704,584 | | | | 309,262 | | | | 5,397,973 | | | | 1,436,494 | | | | 622,227 | | | | 29,762 | | | | 7,947,140 | |
| Net Income | | | - | | | | - | | | | - | | | | - | | | | - | | | | 1,663,894 | | | | - | | | | - | | | | 1,663,894 | |
| Transfer to appropriated retained earnings | | | - | | | | - | | | | - | | | | - | | | | 1,436,494 | | | | (1,436,494 | ) | | | - | | | | - | | | | - | |
| Reappraisal of assets and valuation of investment | | | - | | | | - | | | | - | | | | - | | | | - | | | | - | | | | 14,813 | | | | (19,813 | ) | | | (5,000 | ) |
| Dividends declared | | | - | | | | - | | | | - | | | | - | | | | (526,773 | ) | | | - | | | | - | | | | - | | | | (526,773 | ) |
| Equity tax | | | - | | | | - | | | | - | | | | - | | | | (105,324 | ) | | | - | | | | - | | | | - | | | | (105,324 | ) |
| Cumulative translation adjustments | | | - | | | | - | | | | - | | | | - | | | | 19,423 | | | | - | | | | - | | | | - | | | | 19,423 | |
| Balance at December 31, 2011 | | | 278,122,419 | | | | 151,422 | | | | 509,704,584 | | | | 309,262 | | | | 6,221,793 | | | | 1,663,894 | | | | 637,040 | | | | 9,949 | | | | 8,993,360 | |
| Net Income | | | - | | | | - | | | | - | | | | - | | | | - | | | | 1,702,046 | | | | - | | | | - | | | | 1,702,046 | |
| Transfer to appropriated retained earnings | | | - | | | | - | | | | - | | | | - | | | | 1,663,894 | | | | (1,663,894 | ) | | | | | | | - | | | | - | |
| Issuance of preferred shares(1) | | | 63,999,997 | | | | 32,000 | | | | - | | | | - | | | | 1,619,917 | | | | - | | | | - | | | | - | | | | 1,651,917 | |
| Reappraisal of assets and valuation of investments | | | - | | | | - | | | | - | | | | - | | | | - | | | | - | | | | 55,795 | | | | 14,302 | | | | 70,097 | |
| Dividends Declared | | | - | | | | - | | | | - | | | | - | | | | (603,094 | ) | | | - | | | | - | | | | - | | | | (603,094 | ) |
| Equity Tax | | | - | | | | - | | | | - | | | | - | | | | (99,051 | ) | | | - | | | | - | | | | - | | | | (99,051 | ) |
| Cumulative translation adjustments | | | - | | | | - | | | | - | | | | - | | | | (108,320 | ) | | | - | | | | - | | | | - | | | | (108,320 | ) |
| Balance at December 31, 2012 | | | 342,122,416 | | | COP | 183,422 | | | | 509,704,584 | | | COP | 309,262 | | | COP | 8,695,139 | | | COP | 1,702,046 | | | COP | 692,835 | | | COP | 24,251 | | | COP | 11,606,955 | |
| Balance at December 31, 2012(2)(Unaudited) | | | | | | USD | 103,732 | | | | | | | USD | 174,899 | | | USD | 4,917,425 | | | USD | 962,570 | | | USD | 391,824 | | | USD | 13,715 | | | USD | 6,564,165 | |
| | | Note | | 2015 | | | 2014 | |
| | | | | | | | | |
| Net income | | | | | 2,608,898 | | | | 2,429,785 | |
| Other comprehensive (loss) ⁄ income that will not be reclassified to profit or loss | | | | | | | | | | |
| Remeasurement loss related to post-employment benefit plans | | | | | (59,434 | ) | | | (27,297 | ) |
| Related tax | | | | | 9,312 | | | | 6,407 | |
| Net of tax amount | | 11 | | | (50,122 | ) | | | (20,890 | ) |
| Unrealized gains or (loss) on investments at fair value through Other Comprehensive Income (OCI) | | | | | 128,271 | | | | (120,627 | ) |
| Related tax | | | | | 9,052 | | | | (3,110 | ) |
| Net of tax amount | | 11 | | | 137,323 | | | | (123,737 | ) |
| | | | | | | | | | | |
| Total other comprehensive income (loss) that will not be reclassified to profit or loss net of tax | | | | | 87,201 | | | | (144,627 | ) |
| Other comprehensive profit that may be reclassified to profit or loss | | | | | | | | | | |
| Foreign currency translation adjustments | | | | | 1,407,675 | | | | 745,381 | |
| Net of tax amount | | | | | 1,407,675 | | | | 745,381 | |
| Net gain on cash flow hedges | | | | | 6,378 | | | | 5,734 | |
| Net of tax amount | | | | | 6,378 | | | | 5,734 | |
| Unrealized (loss) or gains on investments in associates and joint ventures using equity method. | | | | | (23,781 | ) | | | 34,021 | |
| Net of tax amount | | | | | (23,781 | ) | | | 34,021 | |
| | | | | | | | | | | |
| Total other comprehensive gains that may be reclassified to profit or loss net of tax | | | | | 1,390,272 | | | | 785,136 | |
| Other comprehensive income, net of tax: | | | | | 1,477,473 | | | | 640,509 | |
| Total comprehensive income attributable to: | | | | | 4,086,371 | | | | 3,070,294 | |
| Equity holders of the Parent Company | | | | | 3,996,363 | | | | 3,037,906 | |
| Non-controlling interests | | | | | 90,008 | | | | 32,388 | |
The accompanying notes numbered 1 to 31, form an integral part of these Consolidated Financial Statements.
CONSOLIDATED STATEMENT OF CHANGES IN EQUITY
BANCOLOMBIA S.A. AND ITS SUBSIDIARIES
Consolidated Statements of Cash Flows
YearsFor the year ended December 31, 2012, 2011 and 20102014
(Stated in millions of Colombian pesos and thousands of U.S. Dollars)pesos)
| | | 2012(1) | | | | | | | | | | |
| | | (Unaudited) | | | 2012 | | | 2011 | | | 2010 | |
| Cash flows from operating activities: | | | | | | | | | | | | | | | | |
| Net income | | USD | 962,570 | | | COP | 1,702,046 | | | COP | 1,663,894 | | | COP | 1,436,494 | |
| Minority interest | | | 3,237 | | | | 5,723 | | | | 11,351 | | | | 13,217 | |
| Adjustments to reconcile net income to net cash used in operating activities: | | | | | | | | | | | | | | | | |
| Provisions for loan, accrued interest and accounts receivable losses | | | 700,045 | | | | 1,237,841 | | | | 839,554 | | | | 792,708 | |
| Provisions for foreclosed assets and other assets | | | 61,763 | | | | 109,212 | | | | 107,468 | | | | 44,428 | |
| Depreciation and amortization | | | 305,776 | | | | 540,682 | | | | 394,689 | | | | 343,095 | |
| Recovery of provisions for foreclosed assets and other assets | | | (44,174 | ) | | | (78,110 | ) | | | (120,702 | ) | | | (41,823 | ) |
| Gains on sales of mortgage loans and other assets | | | (10,241 | ) | | | (18,108 | ) | | | (9,387 | ) | | | (118,309 | ) |
| Valuation gains on investment securities | | | (475,489 | ) | | | (840,774 | ) | | | (697,194 | ) | | | (531,531 | ) |
| Valuation gains on derivative contracts | | | (30,753 | ) | | | (54,379 | ) | | | (65,227 | ) | | | (10,759 | ) |
| Foreclosed assets donation | | | 3,750 | | | | 6,630 | | | | 6,271 | | | | 6,676 | |
| Increase in loans and financial leases | | | (6,175,004 | ) | | | (10,918,827 | ) | | | (12,926,408 | ) | | | (7,843,304 | ) |
| Decrease (Increase) in customers’ acceptances and derivatives | | | 119,078 | | | | 210,558 | | | | (18,830 | ) | | | 48,948 | |
| Increase in accounts receivable | | | (275,897 | ) | | | (487,850 | ) | | | (361,071 | ) | | | (3,435 | ) |
| (Increase) Decrease in other assets | | | (7,397 | ) | | | (13,079 | ) | | | 94,385 | | | | (219,973 | ) |
| Increase in deposits and other liabilities | | | 7,179,643 | | | | 12,695,260 | | | | 8,789,020 | | | | 2,021,535 | |
| Increase in accounts payable | | | 221,741 | | | | 392,089 | | | | 230,690 | | | | (83,457 | ) |
| Equity tax paid(2) | | | (56,049 | ) | | | (99,107 | ) | | | (105,324 | ) | | | (1,898 | ) |
| Increase in estimated liabilities and allowances | | | 40,319 | | | | 71,293 | | | | 10,753 | | | | 52,837 | |
| Change in trading investment securities | | | (1,322,412 | ) | | | (2,338,328 | ) | | | (1,244,998 | ) | | | 1,080,569 | |
| Net losses on sales of foreclosed assets | | | 48,537 | | | | 85,825 | | | | 86,807 | | | | 123,370 | |
| Increase in assets to place in lease contracts | | | (227,426 | ) | | | (402,141 | ) | | | (624,835 | ) | | | (175,879 | ) |
| Net cash provided by (used in) operating activities | | | 1,021,617 | | | | 1,806,456 | | | | (3,939,094 | ) | | | (3,066,491 | ) |
| Cash flows from investing activities: | | | | | | | | | | | | | | | | |
| Purchases of available for sale debt securities | | | (814,319 | ) | | | (1,439,904 | ) | | | (852,635 | ) | | | (2,225,803 | ) |
| Proceeds from sales of available for sale debt securities | | | 999,998 | | | | 1,768,227 | | | | 1,450,358 | | | | 2,198,192 | |
| Purchases of held to maturity debt securities | | | (771,363 | ) | | | (1,363,948 | ) | | | (1,299,624 | ) | | | (1,528,232 | ) |
| Proceeds from maturities of debt securities | | | 962,408 | | | | 1,701,759 | | | | 1,503,790 | | | | 1,093,250 | |
| Purchases of available for sale equity securities | | | (205,081 | ) | | | (362,631 | ) | | | (268,247 | ) | | | (41,608 | ) |
| Proceeds from sales of equity securities | | | 6,960 | | | | 12,306 | | | | 844 | | | | 58,467 | |
| Proceeds from sales of Aseguradora Suiza Salvadoreña subsidiary | | | 76,793 | | | | 135,788 | | | | - | | | | - | |
| Proceeds from sales of AFP Crecer S.A. subsidiary | | | - | | | | - | | | | 173,336 | | | | - | |
| Purchases of premises and equipment | | | (640,435 | ) | | | (1,132,436 | ) | | | (1,274,035 | ) | | | (1,047,237 | ) |
| Proceeds from sales of premises and equipment | | | 102,355 | | | | 180,988 | | | | 176,340 | | | | 500,919 | |
| Software purchases under INNOVA project | | | (53,420 | ) | | | (94,459 | ) | | | (129,699 | ) | | | (101,216 | ) |
| Net cash (used in) provided by investing activities | | | (336,104 | ) | | | (594,310 | ) | | | (519,572 | ) | | | (1,093,268 | ) |
| Cash flows from financing activities: | | | | | | | | | | | | | | | | |
| (Decrease) Increase in overnight funds | | | (1,079,704 | ) | | | (1,909,165 | ) | | | (47,902 | ) | | | 624,316 | |
| (Decrease) Increase in interbank borrowings | | | (1,050,452 | ) | | | (1,857,441 | ) | | | 2,131,319 | | | | 1,271,526 | |
| Placement of long-term debt | | | 1,622,788 | | | | 2,869,462 | | | | 5,087,562 | | | | 2,369,179 | |
| Payment of long-term debt | | | (381,232 | ) | | | (674,106 | ) | | | (745,688 | ) | | | (715,465 | ) |
| Issuance of preferred shares | | | 934,221 | | | | 1,651,917 | | | | - | | | | - | |
| Dividends paid | | | (329,946 | ) | | | (583,421 | ) | | | (526,773 | ) | | | (501,688 | ) |
| Net cash (used in) provided by financing activities | | | (284,325 | ) | | | (502,754 | ) | | | 5,898,518 | | | | 3,047,868 | |
| | | | | | | | | | | | | | | | | |
| Increase (Decrease) in cash and cash equivalents | | | 401,188 | | | | 709,392 | | | | 1,439,852 | | | | (1,111,891 | ) |
| Effects of exchange rate changes on cash and cash equivalents | | | (152,295 | ) | | | (269,292 | ) | | | 134,111 | | | | (105,434 | ) |
| | | | | | | | | | | | | | | | | |
| Cash and cash equivalents at beginning of year | | | 4,371,036 | | | | 7,728,997 | | | | 6,155,034 | | | | 7,372,359 | |
| Cash and cash equivalents at end of year | | USD | 4,619,929 | | | COP | 8,169,097 | | | COP | 7,728,997 | | | COP | 6,155,034 | |
| Supplemental disclosure of cash flows information: | | | | | | | | | | | | | | | | |
| Cash paid during the year for: | | | | | | | | | | | | | | | | |
| Interest | | | 1,565,757 | | | | 2,768,618 | | | | 1,941,177 | | | | 1,686,798 | |
| Income taxes | | | 121,605 | | | | 215,025 | | | | 352,065 | | | | 318,279 | |
| Supplemental schedule of noncash financing activities: | | | | | | | | | | | | | | | | |
| Exchange offering of subordinated notes(3): | | | | | | | | | | | | | | | | |
| Aggregate principal amount tendered and accepted | | | (200,488 | ) | | | (360,736 | ) | | | - | | | | - | |
| Aggregate principal amount issued | | | 227,458 | | | | 409,263 | | | | - | | | | - | |
| | | Attributable to owners of Parent Company | | | | | | | |
| | | | | | | | | | | | Other comprehensive income | | | | | | | | | | | | | |
| | | | | | | | | | | | | | | | | | | | | | | | | | | | | | Attributable | | | | | | | |
| | | Share | | | | | | | | | | | | Investment | | | Fair value | | | | | | | | | | | | to owners | | | Non- | | | | |
| | | Capital | | | Additional | | | Appropriated | | | Translation | | | at fair value | | | hedging | | | | | | Employee | | | Retained | | | of Parent | | | controlling | | | Total | |
| | | (Note 21) | | | paid-in capital | | | Reserves | | | adjustment | | | through OCI | | | instruments | | | Associates | | | benefits | | | earnings | | | Company | | | interest | | | equity | |
| Balance as of January 1, 2014 | | | 425,914 | | | | 2,571,399 | | | | 4,372,669 | | | | - | | | | 84,115 | | | | - | | | | - | | | | 706 | | | | 4,726,819 | | | | 12,181,622 | | | | 462,185 | | | | 12,643,807 | |
| Issuance of preferred shares, see Note 21 | | | 55,000 | | | | 2,286,055 | | | | | | | | | | | | | | | | | | | | | | | | | | | | | | | | 2,341,055 | | | | | | | | 2,341,055 | |
| For paying a dividend corresponding to 509,704,584 common shares and 342,122,416 prefer shares without voting rights, subscribed and paid as of December 31, 2013 and a dividend corresponding to a number up to 110 million prefer shares without voting rights that might be subscribed in the share issuance | | | | | | | | | | | (212,955 | ) | | | | | | | | | | | | | | | | | | | | | | | (475,721 | ) | | | (688,676 | ) | | | | | | | (688,676 | ) |
| Legal reserve movements | | | | | | | | | | | 913,838 | | | | | | | | | | | | | | | | | | | | | | | | (913,838 | ) | | | - | | | | | | | | - | |
| Release of reserves by law | | | | | | | | | | | (267,739 | ) | | | | | | | | | | | | | | | | | | | | | | | 267,739 | | | | - | | | | | | | | - | |
| Increase of reserves by law | | | | | | | | | | | 288,386 | | | | | | | | | | | | | | | | | | | | | | | | (288,386 | ) | | | - | | | | | | | | - | |
| Other movements(1) | | | | | | | - | | | | 36,662 | | | | | | | | | | | | | | | | | | | | | | | | (36,662 | ) | | | - | | | | | | | | - | |
| Net income | | | | | | | | | | | | | | | | | | | | | | | | | | | | | | | | | | | 2,387,086 | | | | 2,387,086 | | | | 42,699 | | | | 2,429,785 | |
| Other comprehensive income | | | | | | | | | | | | | | | 745,381 | | | | (113,426 | ) | | | 5,734 | | | | 34,021 | | | | (20,890 | ) | | | | | | | 650,820 | | | | (10,311 | ) | | | 640,509 | |
| Balance as of December 31, 2014 | | | 480,914 | | | | 4,857,454 | | | | 5,130,861 | | | | 745,381 | | | | (29,311 | ) | | | 5,734 | | | | 34,021 | | | | (20,184 | ) | | | 5,667,037 | | | | 16,871,907 | | | | 494,573 | | | | 17,366,480 | |
(1)This item includes appropriation of profits at the end of the first semester of the Bank’s subsidiaries
The accompanying notes numbered 1 to 31, form an integral part of these Consolidated Financial Statements.
| (1) | See note 2(c ) and 2 (d) |
CONSOLIDATED STATEMENT OF CHANGES IN EQUITY
BANCOLOMBIA S.A. AND ITS SUBSIDIARIES
Notes to Consolidated Financial StatementsFor the years ended December 31, 2015 and 2014
(Stated in millions of Colombian pesos and thousands of U.S. dollars.
Except for the Representative Market Rate)pesos)
| | | | | | Attributable to owners of Parent Company | | | | | | | |
| | | | | | | | | | | | Other comprehensive income | | | | | | | | | | | | | |
| | | | | | | | | | | | | | | | | | | | | | | | | | | | | | Attributable | | | | | | | |
| | | Share | | | | | | | | | | | | Investment | | | Fair value | | | | | | | | | | | | to owners | | | | | | | |
| | | Capital | | | Additional | | | Appropriated | | | Translation | | | at fair value | | | hedging | | | | | | Employee | | | Retained | | | of Parent | | | Non-controlling | | | Total | |
| | | (Note 21) | | | paid-in capital | | | Reserves | | | adjustment | | | through OCI | | | instruments | | | Associates | | | benefits | | | earnings | | | Company | | | interest | | | Equity | |
| Balance as of December 31, 2014 | | | 480,914 | | | | 4,857,454 | | | | 5,130,861 | | | | 745,381 | | | | (29,311 | ) | | | 5,734 | | | | 34,021 | | | | (20,184 | ) | | | 5,667,037 | | | | 16,871,907 | | | | 494,573 | | | | 17,366,480 | |
| For paying a dividend corresponding to 509,704,584 common shares and 342,122,416 prefer shares without voting rights, subscribed and paid as of December 31, 2014, at a rate of COP 830 per share. | | | | | | | | | | | | | | | | | | | | | | | | | | | | | | | | | | | (798,316 | ) | | | (798,316 | ) | | | | | | | (798,316 | ) |
| Legal reserve movements | | | | | | | | | | | 308,442 | | | | | | | | | | | | | | | | | | | | | | | | (308,442 | ) | | | - | | | | | | | | - | |
| Release of reserves by law | | | | | | | | | | | (288,386 | ) | | | | | | | | | | | | | | | | | | | | | | | 288,386 | | | | - | | | | | | | | - | |
| Increase of reserves by law | | | | | | | | | | | 377,470 | | | | | | | | | | | | | | | | | | | | | | | | (377,470 | ) | | | - | | | | | | | | - | |
| Non-controlling interest(1) | | | | | | | | | | | - | | | | | | | | | | | | | | | | | | | | | | | | | | | | | | | | 543,889 | | | | 543,889 | |
| Other movements(2) | | | - | | | | - | | | | 348,992 | | | | | | | | | | | | | | | | | | | | | | | | (348,992 | ) | | | - | | | | | | | | - | |
| Recognition of GAH´s gross put obligation(3) | | | | | | | | | | | | | | | | | | | | | | | | | | | | | | | | | | | (368,776 | ) | | | (368,776 | ) | | | | | | | (368,776 | ) |
| Net income | | | | | | | | | | | | | | | | | | | | | | | | | | | | | | | | | | | 2,097,161 | | | | 2,097,161 | | | | 90,008 | | | | 2,187,169 | |
| Other comprehensive income | | | - | | | | - | | | | - | | | | 1,407,675 | | | | 137,323 | | | | 6,378 | | | | (23,781 | ) | | | (50,122 | ) | | | - | | | | 1,477,473 | | | | | | | | 1,477,473 | |
| Balance as of December 31, 2015 | | | 480,914 | | | | 4,857,454 | | | | 5,877,379 | | | | 2,153,056 | | | | 108,012 | | | | 12,112 | | | | 10,240 | | | | (70,306 | ) | | | 5,850,588 | | | | 19,279,449 | | | | 1,128,470 | | | | 20,407,919 | |
Organization
(1) The increase in the category of non-controlling interest is due to the inclusion of GAH in the consolidated financial statements, see Note 8.3 Acquisition of Grupo Agromercantil Holding S.A. and Backgroundthe translation adjustment of non-controlling interest.
(2) This item includes appropriation of profits at the end of the first semester of the Bank’s subsidiaries that have prepared semi-annual financial statements.
(3)Due to contractual terms, the non-controlling interest of GAH is entitled to sell its interest to the Bank. See Note 8.3. Acquisition of Grupo Agromercantil Holding.
The accompanying notes form an integral part of these Consolidated Financial Statements.
CONSOLIDATED STATEMENT OF CASH FLOW
BANCOLOMBIA S.A. AND ITS SUBSIDIARIES
For the years ended 31, 2015 and 2014
(Stated in millions of Colombian pesos)
| | | 2015 | | | 2014 | |
| | | | | | | |
| Net income (loss) | | | 2,608,898 | | | | 2,429,785 | |
| Adjustments to reconcile net income to net cash provided (used) by operating activities: | | | | | | | | |
| Depreciation and amortization | | | 481,558 | | | | 435,214 | |
| Equity Method | | | (122,477 | ) | | | (60,547 | ) |
| Deferred income tax | | | 296,535 | | | | 270,277 | |
| Allowance for loan and lease losses | | | 2,190,333 | | | | 1,308,825 | |
| Allowances for credit losses on off balance sheet credit instruments | | | 26,254 | | | | (1,229 | ) |
| (Gain) Loss on sales on assets held for sale | | | (8,453 | ) | | | 229,371 | |
| Gains on sale of mortgage loans and other assets | | | (2,247 | ) | | | (35,776 | ) |
| Valuation gain on investment securities | | | (478,387 | ) | | | (502,047 | ) |
| Loss on sale on investment in subsidiary | | | 18,643 | | | | - | |
| Valuation gain on derivative contracts | | | (558,972 | ) | | | 134,488 | |
| Goodwill impairment | | | - | | | | 3,179 | |
| Wealth/Equity tax (expenses) | | | 162,302 | | | | 94,615 | |
| Income tax (expenses) | | | 351,648 | | | | 467,399 | |
| Other non-cash items | | | (45,408 | ) | | | 4,539 | |
| Net interest | | | (7,140,043 | ) | | | (5,715,922 | ) |
| Change in assets and liabilities: | | | | | | | | |
| Decrease (Increase) in derivatives | | | 64,456 | | | | (483,881 | ) |
| Increase in accounts receivable | | | (680,752 | ) | | | (478,288 | ) |
| Increase in loans | | | (15,036,979 | ) | | | (13,008,841 | ) |
| Increase in other assets | | | (465,403 | ) | | | (215,422 | ) |
| Decreasein accounts payable | | | (359,628 | ) | | | (554,738 | ) |
| Increase (decrease) in other liabilities | | | 535,817 | | | | 21,561 | |
| Increase in deposits | | | 9,797,802 | | | | 2,869,712 | |
| (Decrease)Increase in estimated liabilities and provisions | | | (7,842 | ) | | | 101,402 | |
| Change in investment securities recognized at fair value through profit or loss | | | 1,729,280 | | | | 381,104 | |
| Proceeds from sales of assets held for sale | | | 185,777 | | | | - | |
| Others | | | - | | | | 26,094 | |
| Wealth/Equity tax paid | | | (162,302 | ) | | | (94,615 | ) |
| Income tax paid | | | (159,795 | ) | | | (79,036 | ) |
| Dividend received | | | 192,911 | | | | 31,582 | |
| Interest received | | | 12,214,438 | | | | 8,957,399 | |
| Interest paid | | | (3,771,238 | ) | | | (3,203,620 | ) |
| Net cash provided by (used in) operating activities | | | 1,856,726 | | | | (6,667,416 | ) |
| Cash flow from investment activities: | | | | | | | | |
| Purchases of debt securities at amortized cost | | | (1,768,079 | ) | | | (3,018,016 | ) |
| Proceeds from maturities of debt securities at amortized cost | | | 1,713,200 | | | | 4,297,720 | |
| Purchase of Grupo Agromercantil Holding, net of cash acquired | | | 783,803 | | | | - | |
| Purchases of equity instruments and interests in joint ventures | | | (9,602 | ) | | | - | |
| Proceeds from equity instruments and interests in joint ventures | | | 229,488 | | | | - | |
| Purchases of premises and equipment and investment property | | | (961,827 | ) | | | (774,976 | ) |
| Proceeds from sales of premises and equipment and investment property | | | 289,721 | | | | 478,356 | |
| Proceeds from sales of investments in subsidiaries, net of cash sold | | | (248 | ) | | | - | |
| Purchase of other long-term assets | | | (134,471 | ) | | | (48,972 | ) |
| Net cash provided by investing activities | | | 141,985 | | | | 934,112 | |
| Cash flows from financing activities: | | | | | | | | |
| (Decrease) Increase in overnight funds | | | (898,652 | ) | | | 1,015,052 | |
| Proceeds of borrowings | | | 13,533,749 | | | | 7,549,533 | |
| Repayment of borrowings | | | (13,132,534 | ) | | | (8,547,097 | ) |
| Placement of long-term debts | | | 2,452,213 | | | | 1,560,804 | |
| Payment of long-term debts | | | (1,372,837 | ) | | | (1,860,121 | ) |
| Issuance of preferred shares | | | - | | | | 2,625,585 | |
| Redemption of preferred shares by Banistmo | | | (28,081 | ) | | | - | |
| Dividends paid | | | (785,332 | ) | | | (713,679 | ) |
| Net cash (used in) provided by financing activities | | | (231,474 | ) | | | 1,630,077 | |
| Effect of exchange rate changes on cash and cash equivalents | | | 3,571,557 | | | | 2,124,033 | |
| Increase (Decrease) in cash and cash equivalents | | | 1,767,237 | | | | (4,103,227 | ) |
| Cash and cash equivalents at beginning of year | | | 13,466,783 | | | | 15,445,977 | |
| Cash and cash equivalents at end of year(1) | | | 18,805,577 | | | | 13,466,783 | |
| (1) | COP 18,805,577 includes cash and cash equivalents related to assets held for sale amounted to COP 207,963. See Note 31 Discontinued Operations. |
These consolidated statements of cash flows include the following non-cash transactions for the years 2015 and 2014:
| | a. Restructured loans that were transferred to foreclosed assets amounting to COP 185,042 and COP 169,798, respectively. |
| | b. Foreclosed assets donation amounting to COP 4,539 in 2014; during 2015 there were no foreclosed assets donations. |
The accompanying notes form an integral part of these Consolidated Financial Statements
BANCOLOMBIA S.A. AND ITS SUBSIDIARIES
NOTES TO CONSOLIDATED FINANCIAL STATEMENTS
AS OF DECEMBER 31, 2015 and 2014 and January 1, 2014
NOTE 1. REPORTING ENTITY
Bancolombia S.A. (“, hereinafter the Bank”)Parent Company is a private commercial bank incorporatedcredit establishment, listed in the Colombia Stock Exchange “BVC,” as well as in New York Stock Exchange (NYSE), since 1981 and 1995, respectively. The Parent Company's main location is in Medellin (Colombia), main address Carrera 48 # 26-85, Avenida Los Industriales and was constituted under the name of Colombian law onIndustrial Bank (BIC) according to public deed number 388, dating January 24, 1945, and is incorporated until 2044.from the First Notary's Office of Medellin, authorized by the Superintendence of Finance of Colombia. On April 3, 1998, Banco Industrial Colombiano S.A. (“BIC”) merged with Banco de Colombia S.A. and the surviving entity was renamed Bancolombia S.A. The registered office and business address of Bancolombia S.A. is in Medellin, Colombia. Bancolombia S.A. and its subsidiaries are defined herein as the Bank unless the context otherwise requires.
The most recent amendments to the Bank’s by-laws are as follows: (i) by means of Public Deed No. 633 drawn up on April 3, 1998 before the Notary Public No. 14 of the Circuit of Medellin, BIC took over Banco de Colombia S.A. which was dissolved without being liquidated, and changed its corporate name to Bancolombia S.A.; (ii) by means of Public Deed No. 3974 drawn up on July 30, 2005 before the Notary Public No. 29 of the Circuit of Medellín the merger between Bancolombia, Conavi and Corfinsura (spin-off) was duly made official. By virtue of this merger, Bancolombia took over the total amount of assets, rights and obligations of Conavi and Corfinsura, which were dissolved but not liquidated; (iii) by means of Public Deed No. 1614 drawn up on March 15, 2007 before the Notary Public No. 29 of the Circuit of Medellin, the main purpose of which was to simplify the workings of its Board of Directors, eliminating alternate members and reducing the number of principal members to nine and (iv) the most recent amendment was made by means of public Deeddeed No. 1638 drawn up on March 25, 2011 before the Notary Public No. 29633, Colombian Industrial Bank S.A. (BIC) merged with Bank of Medellin, accordingly, by which the members of the Board of Directors of the Bank was reduced from nine to seven; the procedures of the General Meeting of Stockholders were amended to include the designation for periods of two (2) years, of the Financial Consumer Defender and his alternate,Colombia S.A., and the ability to dismiss both freely, the conflictresulting organization of interest procedures of the Board of Directors were modified; and the duties of the President were amended to include the possibility to create and abolish, subject to compliance with legal requirements, branches and agencies of the Bank in Colombia, as necessary for the development of the corporate objective.that merger was named Bancolombia S.A.
Bancolombia S.A.’s business purpose is to carry out all operations, transactions, acts and services inherent into the bankingBanking business through banking establishments that carry its name and according to all applicable legislation. The Parent Company will be able to keep holdings in other corporations, wherever authorized by law, according to all terms and requirements, limits or conditions established therein.
Bancolombia S.A.The consolidated structure of the Parent Company includes the following operating segments: Banking Colombia, Banking Panama, Banking El Salvador, Banking Guatemala, Leasing, Trust, Investment banking, Brokerage, Off Shore and others. These activities of the Bank (“The Bank”) are described in Note 4, Operating segments.
The duration contemplated in the statutes is until December 8, 2044, but it can be dissolved or renewed before the conclusion of that period. The operating license was authorized definitively by the Superintendency of Finance (“SFC”) according to Resolution number 3140 on September 24, 1993. Concerning statutory reforms, in 2015 and by means of public deed number 6,290 dating November 27, 2015 from Notary's Office 25 of Medellin, a statutes reform was formalized, whose main changes were the increase of the authorized capital to COP 700,000, represented in 1,400 millions of shares with nominal value of COP 500 each share and adjustments regarding Corporate Governance.
The Parent Company has agencies19,544 employees, and operates through 827 offices, 6,595 banking Correspondents and 564 Mobile service spots in Miami, Florida, United States of America andColombian territory.
The Parent Company also has an agency in Panama City, Panama.Panama, and representative offices in Peru and Guatemala.
NOTE 2. SIGNIFICANT ACCOUNTING POLICIES
The consolidated financial statements of the Bank are prepared in accordance with the International Financial Reporting Standards (hereinafter, IFRS) issued by the International Accounting Standards Board (hereinafter, IASB), as well as the interpretations issued by the International Financial Reporting Interpretations Committee (hereinafter, IFRS IC).
The preparation of financial statements in conformity with IFRS requires the use of accounting estimates which, by definition, will seldom equal the actual results. Therefore, the estimates and assumptions are constantly reviewed, recognizing the revision in the same period if it affects the reviewed period; or in the reviewed period and future periods if it affects all the current and future periods.
Non-financial assets and liabilities are measured at cost or amortized cost, and financial assets and liabilities and investment properties are measured at fair value. Financial assets and liabilities measured at fair value comprise those classified as assets and liabilities at fair value through profit or loss, and those equity investments measured at fair value through Other comprehensive income (“OCI”); likewise all the financial derivatives and assets and liabilities recognized that are designated as hedged items in a fair value hedge, whose carrying value is adjusted with changes in fair value attributable to the hedged risk.
The consolidated financial statements are stated in Colombian pesos and its figures are stated in millions, except earnings per share and the market exchange rate, which are stated in Colombian pesos, while other currencies (dollars, euro, pounds, etc.) are stated in thousands.
According to Colombian law, the Bank must prepare separate and consolidated financial statements, which have been prepared in accordance with Decree 2784 of 2012 and 3024 of 2013 issued by the Ministry of Finance and Public Credit. This technical framework has been set up based on the IFRS issued by the IASB standards effective until December 31, 2013 and their corresponding amendments.
The Parent Company’s separate financial statements are those that serve as the basis for the distribution of dividends and other appropriations by the stockholders. The consolidated financial statements are presented before the General Meeting of Stockholders for information purposes only.
| B. | Presentation of financial statements |
The Bank presents the statement of financial position ordered by liquidity level. Financial assets and liabilities are offset in the consolidated statement of financial position only when there is a legally enforceable right to offset the amounts recognized and there is an intention to settle on the net amount, or to realize the asset and settle the liability simultaneously.
The consolidated statement of income is prepared based on the nature of expenses. Revenues and expenses are not offset, unless such compensation is permitted or required by any accounting standard or interpretation, and is described in the Bank's policies.
The consolidated statement of cash flows was prepared using the indirect method, which adjusts accrual basis net profit or loss for the effects of non-cash transactions, and valuation gains or losses related to investment or financing activities.
The consolidated financial statements include the assets, liabilities, earnings, contingentfinancial statements of Bancolombia S.A. and memorandum accountsits subsidiaries for the periods ended on December 31, 2015 and 2014 and January 1, 2014. (Opening balance sheet). The Parent Company consolidates the statement of income and statement of financial position of the Bank and other entities inon which the Bank holds, directly or indirectly, 50% or moreit exerts control.
In accordance with IFRS 10, a subsidiary is an organization controlled by any of the outstanding voting shares (the “Subsidiaries”).companies that conform The consolidated financial statements are submitted to the Bank’s Stockholders meeting, but dividends are declared and paid to stockholders based on net income from the previous year based on the unconsolidated financial statements. Pursuant to requirements established by the Superintendency of Finance (the “SFC”) the Bank, must prepare the consolidated financial statements without consolidating non-financial subsidiaries.as long as they have:
F-10 | - | Power over the investee that give it the ability to direct their relevant activities that significantly affect its performance. |
| - | Exposure or rights to variable returns for its involvement with the investee. |
| - | Ability to use its power over the investee to affect the investor return amounts. |
Bancolombia S.A.The Parent Company has the following subsidiaries making up the Bancolombia Group,Bank´s organizational structure, which is currently registered as a corporate group:
| Entity | | Location | | Business | | Participation
Percentage
December-
2012 | | Participation
Percentage
December-
2011 |
| Leasing Bancolombia S.A. Compañía de Financiamiento | | Colombia | | Leasing | | 100.00 | | 100.00 |
| Fiduciaria Bancolombia S.A. Sociedad Fiduciaria | | Colombia | | Trust | | 98.81 | | 98.81 |
| Banca de Inversión Bancolombia S.A. Corporación Financiera | | Colombia | | Investment banking | | 100.00 | | 100.00 |
| Valores Bancolombia S.A. Comisionista de Bolsa | | Colombia | | Securities brokerage | | 100.00 | | 100.00 |
| Compañía de Financiamiento Tuya S.A. | | Colombia | | Financial services | | 99.99 | | 99.99 |
| Factoring Bancolombia S.A. Compañía de Financiamiento | | Colombia | | Financial services | | 100.00 | | 100.00 |
| Patrimonio Autónomo Cartera LBC(1) | | Colombia | | Loan management | | 100.00 | | - |
| Renting Colombia S.A. | | Colombia | | Operating leasing | | 100.00 | | 100.00 |
| Transportempo S.A.S. | | Colombia | | Transportation | | 100.00 | | 100.00 |
| Valores Simesa S.A. | | Colombia | | Investments | | 67.54 | | 67.54 |
| Inversiones CFNS S.A.S. | | Colombia | | Investments | | 100.00 | | 100.00 |
| CFNS Infraestructura S.A.S. | | Colombia | | Investments | | 100.00 | | 100.00 |
| BIBA Inmobiliaria S.A.S. (Formerly Inmobiliaria Bancol S.A.) | | Colombia | | Real estate broker | | 98.96 | | 98.96 |
| Todo 1 Colombia S.A.(2) | | Colombia | | E-commerce | | - | | 90.08 |
| Vivayco S.A.S. | | Colombia | | Portfolio Purchase | | 75.00 | | 75.00 |
| Uff Móvil S.A.S.(3) | | Colombia | | Mobile network operator | | 69.42 | | - |
| Bancolombia Panamá S.A. | | Panama | | Banking | | 100.00 | | 100.00 |
| Valores Bancolombia Panamá S.A. | | Panama | | Securities brokerage | | 100.00 | | 100.00 |
| Suvalor Panamá Fondo de Inversión S.A. | | Panama | | Holding | | 100.00 | | 100.00 |
| Sistema de Inversiones y Negocios S.A. Sinesa | | Panama | | Investments | | 100.00 | | 100.00 |
| Banagrícola S.A. | | Panama | | Investments | | 99.16 | | 99.16 |
| Banco Agrícola S.A. | | El Salvador | | Banking | | 97.35 | | 97.34 |
| Aseguradora Suiza Salvadoreña S.A. Asesuisa(5) | | El Salvador | | Insurance company | | - | | 96.08 |
| Asesuisa Vida S.A.(5) | | El Salvador | | Insurance company | | - | | 96.08 |
| Arrendadora Financiera S.A. Arfinsa | | El Salvador | | Leasing | | 97.35 | | 97.35 |
| Credibac S.A. de C.V. | | El Salvador | | Credit card services | | 97.35 | | 97.34 |
| Valores Banagricola S.A. de C.V. (Formerly Bursabac S.A. de C.V.) | | El Salvador | | Securities brokerage | | 98.89 | | 98.89 |
| Inversiones Financieras Banco Agrícola S.A. IFBA | | El Salvador | | Investments | | 98.89 | | 98.89 |
| Arrendamiento Operativo CIB S.A.C. | | Peru | | Operating leasing | | 100.00 | | 100.00 |
| Capital Investments SAFI S.A. | | Peru | | Trust | | 100.00 | | 100.00 |
| Fondo de Inversión en Arrendamiento Operativo Renting Perú | | Peru | | Car Rental | | 100.00 | | 100.00 |
| Leasing Perú | | Peru | | Leasing | | 100.00 | | 100.00 |
| FiduPerú S.A. Sociedad Fiduciaria | | Peru | | Trust | | 98.81 | | 98.81 |
| Bancolombia Puerto Rico Internacional, Inc. | | Puerto Rico | | Banking | | 100.00 | | 100.00 |
| Suleasing International USA, Inc. | | USA | | Leasing | | 100.00 | | 100.00 |
| Bancolombia Caymán S.A. | | Cayman Islands | | Banking | | 100.00 | | 100.00 |
| Banagrícola Guatemala S.A. | | Guatemala | | Outsourcing | | 99.16 | | 98.97 |
| Bagrícola Costa Rica S.A.(4) | | Costa Rica | | Outsourcing | | 99.16 | | - |
| Name | | Country of
business | | Corporate purpose | | % of ownership interest
December 2015 | | | % of ownership
interest
December 2014 | |
| Leasing Bancolombia S.A. Compañía de Financiamiento | | Colombia | | Leasing businesses | | | 100 | % | | | 100 | % |
| Fiduciaria Bancolombia S.A. Sociedad Fiduciaria | | Colombia | | Trust businesses | | | 98.81 | % | | | 98.81 | % |
| Banca de Inversión Bancolombia S.A. Corporación Financiera | | Colombia | | Financial services | | | 100 | % | | | 100 | % |
| Valores Bancolombia S.A. Comisionista de bolsa | | Colombia | | Stock market Commission agent | | | 100 | % | | | 100 | % |
| Compañía de Financiamiento Tuya S.A.(1) | | Colombia | | Financial services | | | 99.99 | % | | | 99.99 | % |
| Renting Colombia S.A. | | Colombia | | Operative leasing | | | 100 | % | | | 100 | % |
| Transportempo S.A.S. | | Colombia | | Transport services | | | 100 | % | | | 100 | % |
| Valores Simesa S.A. | | Colombia | | Several | | | 68.57 | % | | | 68.57 | % |
| Inversiones CFNS S.A.S. | | Colombia | | Investors | | | 99.94 | % | | | 99.94 | % |
| CFNS Infraestructura S.A.S.(2) | | Colombia | | Investors | | | - | | | | 99.94 | % |
| BIBA Inmobiliaria S.A.S. | | Colombia | | Real estate | | | 100 | % | | | 100 | % |
| Vivayco S.A.S. (in settlement) | | Colombia | | Portfolio purchase | | | 74.95 | % | | | 74.95 | % |
| Uff Móvil S.A.S.(3) | | Colombia | | Mobile network operator | | | - | | | | 75.05 | % |
| FCP Fondo Colombia Inmobiliario S.A. | | Colombia | | Real estate | | | 50.21 | % | | | 50.21 | % |
| PA Cartera LCB | | Colombia | | Portfolio management | | | 100 | % | | | 100 | % |
| Prosicol S.A.S. (in settlement) | | Colombia | | Pre-operating stage | | | 68.57 | % | | | 68.57 | % |
| Fideicomiso “Lote Abelardo Castro”. | | Colombia | | Mercantil trust | | | 68.23 | % | | | 68.23 | % |
| Bancolombia Panamá S.A. | | Panama | | Commercial bank | | | 100 | % | | | 100 | % |
| Valores Bancolombia Panamá S.A. | | Panama | | Stock market Commission agent | | | 100 | % | | | 100 | % |
| Suvalor Panamá Fondo de Inversión S.A. | | Panama | | Holding | | | 100 | % | | | 100 | % |
| Sistema de Inversiones y Negocios, S.A. Sinesa | | Panama | | Investments | | | 100 | % | | | 100 | % |
| Banagrícola S.A. | | Panama | | Holding | | | 99.16 | % | | | 99.16 | % |
| Banistmo S.A. | | Panama | | Banking | | | 100 | % | | | 98.12 | % |
| Banistmo Investment Corporation S.A. | | Panama | | Trust businesses | | | 100 | % | | | 98.12 | % |
| Financiera Flash S.A. | | Panama | | Financial services | | | 100 | % | | | 98.12 | % |
| Grupo Financomer S.A. | | Panama | | Financial services | | | 100 | % | | | 98.12 | % |
| Seguros Banistmo S.A.(4) | | Panamá | | Insurance company | | | - | | | | 98.12 | % |
| Leasing Banistmo S.A. | | Panama | | Leasing businesses | | | 100 | % | | | 98.12 | % |
| Securities Banistmo S.A. | | Panama | | Purchase and sale of securities | | | 100 | % | | | 98.12 | % |
| Banistmo Capital Markets Group Inc. | | Panama | | Purchase and sale of securities | | | 100 | % | | | 98.12 | % |
| Anavi Investment Corporation S.A.(5) | | Panama | | Real estate broker | | | 98.12 | % | | | 98.12 | % |
| Williamsburg International Corp. | | Panama | | Real estate broker | | | 100 | % | | | 98.12 | % |
| Van Dyke Overseas Corp. | | Panama | | Real estate broker | | | 100 | % | | | 98.12 | % |
| Desarrollo de Oriente S.A. (5) | | Panama | | Real estate broker | | | 98.12 | % | | | 98.12 | % |
| Bien Raices Armuelles S.A. (6) | | Panama | | Real estate broker | | | - | | | | 98.12 | % |
| Steens Enterprises S.A. (5) | | Panama | | Portfolio holder | | | 98.12 | % | | | 98.12 | % |
| Ordway Holdings S.A.(5) | | Panama | | Real estate broker | | | 98.12 | % | | | 98.12 | % |
| Name | | Country of
business | | Corporate purpose | | % of ownership interest
December 2015 | | | % of ownership
interest
December 2014 | |
| Financomer S.A. | | Panama | | Financial services | | | 100 | % | | | 98.12 | % |
| Banistmo Asset Management Inc. | | Panama | | Purchase and sale of securities | | | 100 | % | | | 98.12 | % |
| M.R. C Investment Corp.(7) | | Panama | | Real estate broker | | | - | | | | 98.12 | % |
| Inmobiliaria Bickford S.A. | | Panama | | Real estate broker | | | 100 | % | | | 98.12 | % |
| Banco Agrícola S.A. | | El Salvador | | Banking | | | 97.36 | % | | | 97.36 | % |
| Arrendadora Financiera S.A. Arfinsa | | El Salvador | | Leasing | | | 97.36 | % | | | 97.36 | % |
| Credibac S.A. de C.V. | | El Salvador | | Trust businesses | | | 97.36 | % | | | 97.36 | % |
| Valores Banagrícola S.A. de C.V. | | El Salvador | | Stock market Commission agent | | | 98.89 | % | | | 98.89 | % |
| Inversiones Financieras Banco Agrícola S.A. IFBA | | El Salvador | | Holding | | | 98.89 | % | | | 98.89 | % |
| Arrendamiento Operativo CIB S.A.C. | | Peru | | Operative leasing | | | 100 | % | | | 100 | % |
| Fondo de Inversión en Arrendamiento Operativo - Renting Perú | | Peru | | Operative leasing | | | 100 | % | | | 100 | % |
| Capital Investments SAFI S.A. | | Peru | | Trust businesses | | | 100 | % | | | 100 | % |
| FiduPerú S.A. Sociedad Fiduciaria | | Peru | | Trust businesses | | | 98.81 | % | | | 98.81 | % |
| Leasing Perú S.A. | | Peru | | Leasing | | | 100 | % | | | 100 | % |
| Banagrícola Guatemala S.A. | | Guatemala | | Outsourcing | | | 99.16 | % | | | 99.16 | % |
| Grupo Financiero Agromercantil Holding S.A.(8) | | Guatemala | | Holding | | | 60.00 | % | | | - | |
| Banco Agromercantil de Guatemala S.A.(8) | | Guatemala | | Banking | | | 60.00 | % | | | - | |
| Mercomer Bank Ltd.(8) | | Guatemala | | Banking | | | 60.00 | % | | | - | |
| Seguros Agromercantil S.A.(8) | | Guatemala | | Insurance company | | | 59.17 | % | | | - | |
| Financiera Agromercantil S.A.(8) | | Guatemala | | Financial services | | | 60.00 | % | | | - | |
| Agrovalores S.A.(8) | | Guatemala | | Securities brokerage | | | 60.00 | % | | | - | |
| Tarjeta Agromercantil S.A.(8) | | Guatemala | | Credit Card | | | 60.00 | % | | | - | |
| Arrendadora Agromercantil S.A.(8) | | Guatemala | | Operating Leasing | | | 60.00 | % | | | - | |
| Agencia de Seguros y Fianzas Agromercantil S.A. (8) | | Guatemala | | Insurance company | | | 60.00 | % | | | - | |
| Asistencia y Ajustes S.A. (8) | | Guatemala | | Services | | | 60.00 | % | | | - | |
| Serproba S.A.(8) | | Guatemala | | Refurbishment and remodelling services | | | 60.00 | % | | | - | |
| Servicios de Formalización S.A.(8) | | Guatemala | | Loans formalization | | | 60.00 | % | | | - | |
| Conserjeria, Mantenimiento y Mensajería S.A.(8) | | Guatemala | | Maintenance services | | | 60.00 | % | | | - | |
| Media Plus S.A.(8) | | Guatemala | | Advertising and marketing | | | 60.00 | % | | | - | |
| New Alma Enterprises Ltd.(8) | | Bahamas | | Investments | | | 60.00 | % | | | - | |
| Bancolombia Puerto Rico Internacional Inc. | | Puerto Rico | | Banking | | | 100 | % | | | 100 | % |
| Suleasing Internacional USA Inc.(9) | | United States | | Leasing | | | - | | | | 100 | % |
| Bancolombia Caymán S.A. | | Cayman Islands | | Commercial bank | | | 100 | % | | | 100 | % |
| Bagrícola Costa Rica S.A. | | Costa Rica | | Outsourcing | | | 99.16 | % | | | 99.16 | % |
| (1) | In July 2012, Leasing Bancolombia transferred its economic rights in certain housing leases to a Patrimonio Autónomo Cartera LBC trust fund managed by Fiduciaria Bancolombia and subsequently sold 99.00% of the rights in the trust assets to Bancolombia S.A, the parent entity. The total amount received by Leasing Bancolombia was COP 730,989. |
| (2) | On August 10, 2012, Banca de Inversión Bancolombia S.A. (directly and through its subsidiaries) sold its 90% interest in Todo 1 Colombia S.A. to Todo 1 Services Inc and certain members of management. The total sale price received in cash amounted to COP 228. |
Todo 1 Colombia(1)See Note 31 'Discontinued operations'
(2)Investment liquidated by Inversiones CFNS S.A.S. during 2015.
(3)Investment sold by Inversiones CFNS S.A.S. during 2015.
(4)Investment sold for Banistmo S.A. will continue to provide services to the Bank at arm´s length terms.during 2015.
| (3) | On August 30, 2012, Banagrícola, a Bancolombia Panamá subsidiary, acquired 70% of Uff Móvil S.A.S. (“Uff”), a Colombian telecommunications services operator. |
(5) Investments in non-operational stage
The total sale price received in cash was COP 21,000, sum paid in full at the date of the transaction.(6) Investment absorbed by Van Dyke Overseas Corp during 2015.
| (4) | Company created in 2012. |
| (5) | On February 5, 2011, Banagrícola S.A. and Inversiones Financieras Banco Agrícola S.A., subsidiaries of Bancolombia S.A., and Suramericana S.A., signed an agreement pursuant to which Banagrícola S.A. and Inversiones Financieras Banco Agrícola S.A. agreed to sell to Suramericana 97.03% of its shares of capital stock of Asesuisa, an insurance company in the Republic of El Salvador. |
(7)Investment liquidated for Banistmo S.A. during 2015.
On September 27, 2012, after obtaining all of the authorizations required(8)See Note8.3 “Agromercantil Group Holding (GAH) acquisition”
(9)Investment liquidated by the authorities of Colombia and El Salvador, BanagrícolaBancolombia Panamá S.A. and Inversiones Financieras Banco Agrícola S.A., subsidiaries of Bancolombia S.A., sold to Seguros Suramericana S.A., a Panamanian company linked to Grupo de Inversiones Suramericana, 97.03% of its shares of capital stock of Asesuisa, an insurance company in the Republic of El Salvador. The total amount received by Banagrícola S.A. and Inversiones Financieras Banco Agrícola S.A. was USD 97,999 and the Bank recorded COP 81,490 (USD 45,317) as gain on sale of investment securities on its Consolidated Statements of Operations.during 2015.
The summarizedconsolidation process combines the assets, liabilities and resultsincome of operations, of Asesuisathe Parent Company and its subsidiary Asesuisa Vida at December 31, 2011 and for the year then ended were as follows:
| | December 31, 2011 | |
Assets | | | | |
Cash and cash equivalents | | COP | 6,719 | |
Funds sold and securities purchased under agreements to resell | | | 50,270 | |
Investments | | | 51,885 | |
Account receivable | | | 56,303 | |
Other Assets | | | 7,829 | |
Total Assets | | COP | 173,006 | |
| | | | |
Liabilities | | | | |
Interbank borrowings | | COP | 15 | |
Accounts Payable | | | 19,442 | |
Other Liabilities | | | 74,325 | |
Accrued expenses | | | 54 | |
Total Liabilities | | COP | 93,836 | |
| | | | |
Statement of operations | | | | |
Interest income | | COP | 3,381 | |
Provision for loan, accrued interest losses and other receivables, net | | | 1,445 | |
Commissions and other service income | | | 263,849 | |
Other income | | | 71 | |
Total operating income | | | 268,746 | |
Operating expenses | | | (247,523 | ) |
Other non-operating income | | | 2,179 | |
Other non-operating expenses | | | (110 | ) |
Income tax | | | (5,253 | ) |
Net Income | | COP | 18,039 | |
The aforementioned entities accounted for less than 1% of the Bank’s consolidated stockholders’ equity accounts. Consequently, any effect arising from this transaction has not been considered a change in accounting policies.
The Bank holds the majority voting rights in Prosicol E.U, which was not included in the Consolidated Financial Statements due to the fact that this company is in a non-productive stage.
(2) Summary of Significant Accounting Policies
(a) Basis of Presentation
For the preparation of the financial statements and related disclosures, the Bank follows generally accepted accounting principles in Colombia and the special regulations of the SFC, collectively “Colombian Banking GAAP”.
The financial statements of foreign subsidiaries, were adjustedafter adjusting in order to adopt uniform accounting practices as required in connection with the accounts of investments, derivatives, allowances for loan and financial leases losses, goodwill, foreclosed assets and financial leases.
Intercompany operations and balances between Bancolombia Group companies are eliminated upon consolidation.
(b) Translation of Foreign Currency Transactions and Balances
Translation of financial statements in foreign currency
The balance sheet accounts are converted to Colombian pesos using the exchange rate applicable at the end of the year (except equity accounts which are translated at the historical exchange rate). The exchange rate at December 31, 2012 and December 31, 2011 was COP 1,768.23 and COP 1,942.70 per USD 1, respectively. For income accounts the average exchange rate was used. The average exchange rate for the periods ended December 31, 2012 and 2011 were COP 1,798.23 and COP 1,848.17 per USD 1, respectively. Exchange differences originated in balance sheet accounts are recorded as “Cumulative Translation Adjustments” in the consolidated statements of Stockholders’ Equity and the exchange differences originated in the consolidated statements of operations accounts are recorded as “Foreign exchange gain (loss)” in the Consolidated Statements of Operations.
Transactions in foreign currencyaccounting policies.
Transactions and balances in foreign currencies are converted by the Bank and its Subsidiariessubsidiaries to Colombian pesos using the exchange rates applicable on the corresponding dates when the transactions were originated, as established by the SFC. Superintendency of Finance.
Intercompany operations and balances between Bancolombia Group companies are eliminated upon consolidation.
Non-controlling interests in controlled entities are presented in equity separately from the Parent Company stockholders equity. When the Bank loses control over a subsidiary, any residual interest to withhold is measured at fair value; gains or losses arising from this measurement are recognized in profit or loss.
| 2. | Investments in associates and joint ventures |
An associate is an entity over which the Bank has significant influence, without total or joint control.
A joint venture is an entity that the Bank controls jointly with other participants, where both maintain a contractual agreement that establishes joint control over the relevant activities of the entity.
At the acquisition date, the excess of the acquisition cost of the associate or joint venture shares exceeding the Bank´s share of the net fair value of identifiable assets and liabilities assumed, is recognized as goodwill. Goodwill is included in the carrying amount of the investment.
The income of the associate or joint venture is incorporated in the consolidated financial statements using the equity method. Under this method the investment is initially recorded at cost and adjusted to changes in the shares of the Bank in the joint venture or associate's net assets after the date of acquisition, less any loss due to impairment of the investment value. The losses of the associate or joint venture that exceed the amount of the Bank's investment are not recognized.
When the equity method is applicable, adjustments are considered in order to adopt uniform accounting practices and policies of the associate or joint venture with the Bank. The portion that corresponds to the Bank in other comprehensive income items obtained by measuring the assets and liabilities at fair value through OCI is recognized, as well as gains and losses recognized by the associate or joint venture, in accordance with the Bank's participation in the associate or joint venture. The equity method is applied from the acquisition date until the significant influence or joint control over the entity is lost.
The unrealized gain or loss of an associate or joint venture is presented in the comprehensive statement of income net of tax. Changes in the investment´s participation recognized directly in equity and other comprehensive income of the associate or joint venture are considered in the consolidated statement of equity and consolidated statement of other consolidated comprehensive income.
The dividends received in cash from the associate or joint venture reduce the investment carrying value.
The Bank periodically analyzes the existence of impairment indicators and the possibility of recognizing losses by impairment of the associate or joint venture. Impairment losses are recognized in profit or loss and are calculated as the difference between the recoverable amount of the associate or joint venture, using the higher value between its value in use and its fair value less costs of disposal, and their carrying value.
When the significant influence on the associate or the joint venture is lost, the Bank measures and recognizes any residual investment that remained at its fairvalue. The difference between the associate or joint venture carrying value (taking into account the relevant items of other comprehensive income) and the fair value of the retained residual investment; is recognized in profit or loss.
The Bank manages assets held in private common funds and other means of investment. Assets managed by the Bank’s subsidiaries and owned by third parties are not included in the consolidated financial statements unless control exists under IFRS 10.
To determine whether the Bank controls the funds, all of the following conditions are taken into account:
| · | Power over the investee. |
| · | Exposure, or rights, to variables returns from the Bank’s involvement with the investee, and |
| · | The ability to use its power over the investee to affect the amount of the investor’s returns. |
The Bank consolidates the following funds:
| Funds | | Country | | % Of ownership
interest | | | December
31, 2015 | | | December
31, 2014 | | | January
1, 2014 | |
| FCP Fondo Colombia Inmobiliario S.A. | | Colombia | | | 50.28 | % | | | 1,550,219 | | | | 1,348,833 | | | | 1,048,096 | |
| PA Cartera LCB | | Colombia | | | 100.00 | % | | | 1,214,044 | | | | 1,095,732 | | | | 966,431 | |
| Suvalor Panamá Fondo de Inversión | | Panama | | | 100.00 | % | | | 53,939 | | | | 64,522 | | | | 61,021 | |
| Fideicomiso “lote Abelardo Castro” | | Colombia | | | 68.23 | % | | | 8,994 | | | | 7,962 | | | | 7,481 | |
| Fondo de Inversión en Arrendamiento Operativo Renting Perú | | Perú | | | 100.00 | % | | | 236 | | | | 179 | | | | 145 | |
For all of the aforementioned funds, the Bank has participated in the design of the structured entity, establishes operating and financial decisions of the funds and it is exposed to variable returns such as dividends or returns paid in quarterly installments.
The commissions earned by asset management funds are included in the statement of income as “Fees and other service income”.
| 4. | Non-controlling interest |
Non-controlling interests in the net assets of consolidated subsidiaries are presented separately within the Bank’s equity. Similarly profit or loss and other comprehensive income are also attributed to non-controlling interest and equity holders of the Parent Company.
Any purchase or sale of shares in subsidiaries that does not imply a loss or gain of control is directly recognized in equity.
As of December 31, 2015 and 2014 and January 1, 2014, the portion of ownership in the FCP Colombia Inmobiliario S.A. was 49.72%, 49.72% and 49.79%, respectively, reason for which is considered as a significant non-controlling interest for the Bank and its subsidiaries. The principal place of business of FCP Colombia Inmobiliario is Bogotá (Colombia).
On December 30, 2015 Bancolombia Group Acquired 60% of Grupo Agromercantil Holding S.A. (GAH), the Group conserves 40% of non-controlling interest. For further information about the acquisition of GAH and the net assets acquired see note 8.3.
As of December 31, 2014, there were not dividends declared by the subsidiary aforementioned. In contrast, there were returns paid in quarterly installments due to the nature of its business, which mainly comprises: long- term investment in real estate considering low risk options.
The following table summarizes the assets, liabilities and profits as of December 31, 2015 and 2014, and as of January 1, 2014 related to the FCP Colombia Inmobiliario:
| | | December 31, 2015 | | | December 31, 2014 | | | January 1, 2014 | |
| | | In millions of COP | |
| Assets | | | 1,550,219 | | | | 1,348,833 | | | | 1,048,096 | |
| Liabilities | | | 661,973 | | | | 590,191 | | | | 359,875 | |
| Equity | | | 888,246 | | | | 758,642 | | | | 688,221 | |
| | | | | | | | | | | | | |
| Income | | | | | | | | | | | | |
| Valuation gains | | | 48,805 | | | | 18,974 | | | | - | |
| Rents | | | 104,379 | | | | 84,270 | | | | - | |
| Other income | | | 99,983 | | | | 50,195 | | | | - | |
| Total | | | 253,167 | | | | 153,439 | | | | - | |
| Expenses | | | | | | | | | | | | |
| Interest on loans | | | 52,451 | | | | 57,475 | | | | - | |
| Trust fees | | | 8,819 | | | | 7,225 | | | | - | |
| Other expenses | | | 36,936 | | | | 16,955 | | | | - | |
| Total | | | 98,206 | | | | 81,655 | | | | - | |
The information above is the amount before inter-company eliminations.
As of December 31, 2015 and 2014, the profit allocated to non-controlling interest amounted to COP 69,074 and COP 31,238, respectively.
As of December 31, 2015 and 2014, and January 1, 2014 the accumulated non-controlling interest of the FCP Colombia Inmobiliario S.A. amounted to COP 442,314, COP 372,812, and COP 342,200, respectively.
As of December 30, 2015, the portion of ownership in Grupo Agromercantil Holding was 40.00%, reason for which is considered as a significant non-controlling interest for the Bank and its subsidiaries. The principal place of business of Grupo Agromercantil and its subsidiaries is detailed in section 2 of this Note.
The following table summarizes the assets and liabilities as of December 31, 2015 of Grupo Agromercantil Holding.
| | December 31, 2015 | |
| | In millions of COP | |
| Assets | | | 12,137,258 | |
| Liabilities | | | 10,792,953 | |
| Equity | | | 1,344,305 | |
For the year 2015, the dividends received from Grupo Agromercantil amounted to COP 33,403. The acquisition by stages of this subsidiary took place in December 2015, and the transaction is detailed in 8.3. ‘Acquisition of Grupo Agromercantil Holding’.
D. Use of estimates and judgments
The preparation of consolidated financial statements requires the Bank's management to make judgments, estimates and assumptions that affect the application of accounting policies and the recognized amounts of assets, liabilities, income and expenses. The actual outcome can differ from these estimates. These estimates refer to:
The Bank tests goodwill recognized upon business combinations for impairment at least annually. The impairment test for goodwill involves estimates and significant judgments, including the identification of cash generating units and the allocation of goodwill based on the expectations of which the Bank will benefit from the acquisition. The valuation models used to determine the fair value of the acquired companies are sensitive to changes in the assumptions. Adverse changes in any of the factors underlying these assumptions could lead the Bank to record a goodwill impairment charge. Management believes that the assumptions and estimates used are reasonable and supportable in the existing market environment and commensurate with the risk profile of the assets valued. See Note 8, for further information related to carrying amount, valuation methodologies, key assumptions and the allocation of goodwill.
Deferred tax assets (‘DTA’) are recorded for all deductible temporary differences or carry forwards when it is probable that the Bank can utilize the deductible temporary difference against sufficient taxable income in future periods. In determining the DTA, the Bank performs a review of future taxable income (required for reversing temporary differences and carry forwards) and future reversals of existing taxable temporary differences. Due to the continuing weak economic conditions, the determination of the DTA, involves difficult judgments to estimate future taxable income.
With regard to state taxes, Bancolombia is subject to Colombian tax legislation. In the case of its companies based in Guatemala, Puerto Rico, El Salvador, Panama (only applicable to Banistmo and its subsidiaries) and Peru, it must also calculate the corresponding taxes according to Guatemalan, Puerto Rican, Salvadorian, Panamanian and Peruvian tax legislations.
The application of tax legislation is subject to diverse interpretations on the part of both taxpayers and the relevant tax authorities
The deferred tax asset is considered as a critical accounting policy, due to tax determinations involving estimates of profits and future taxable incomes that will be settled in future years; such estimates can be affected by changes in economic conditions. See Note 11 for further information related to the nature of the deferred tax assets recognized by the Bank and their carrying amount.
| – | Provisions and contingent liabilities: |
The Bank is subject to contingent liabilities, including judicial, regulatory and arbitration proceedings and tax and other claims arising from the conduct of the Bank’s business activities. These contingencies are evaluated based on management’s best estimates and reserves are established for legal and other claims by assessing the likelihood of the loss actually occurring as probable or remote. Provisions are recorded when all the information available indicates that it is probable that an outflow of resources embodying economic benefits will be required to settle the obligation before the statement of financial position date and the amounts may be reasonably estimated. The Bank engages internal and external experts in assessing probability and in estimating any amounts involved.
Throughout the life of a contingency, the Bank may learn of additional information that can affect assessments regarding probability or the estimates of amounts involved. Changes in these assessments can lead to changes in recorded reserves.
The Bank considers the estimates used to determine the reserves for contingent liabilities are critical estimates because the probability of their occurrence and the amounts that the Bank may be required to pay are based on the Bank’s judgment and its advisers, which will not necessarily coincide with the future outcome of the proceedings. For further information regarding legal proceedings and contingencies and its carrying amounts. See Note 20.
| – | Impairment for credit risk: |
Determining the allowance for loan losses requires a significant amount of management judgment and estimates in, among others, identifying impaired loans, determining customers’ ability to pay and estimating the fair value of underlying collateral or the expected future cash flows to be received. The Bank assess if an asset or a group of financial assets is impaired and if impairment losses are incurred if, and only if, there is objective evidence of impairment as a result of one or more events that occurred after the initial recognition of the asset (a 'loss event') and that loss event (or events) has an impact on the estimated future cash flows of the financial asset or group of financial assets that can be reliably estimated. The estimates are considered as critical accounting judgement because: (i) they are highly susceptible to change from period to period as the assumptions about future default rates and valuation of potential losses relating to impaired loans and advances are based on recent performance experience, and (ii) any significant difference between the Bank’s estimated losses (as reflected in the provisions) and actual losses would require the Bank to record provisions which, if significantly different, could have a material impact on its future financial condition and results of operations. The Bank’s assumptions about estimated losses are based on past performance, past customer behavior, the credit quality of recent underwritten business and general economic conditions, which are not necessarily an indication of future losses. For further information regarding risk management (see section Risk Management).
| – | Fair value of financial assets and liabilities: |
Financial assets and liabilities recorded at fair value on the Bank’s statement of financial position include mainly debt and equity securities classified at fair value through profit or loss or at fair value through other comprehensive income, respectively and derivatives contracts.
IFRS 13 specifies different levels of inputs that may be used to measure the fair value of financial instruments classified as levels 1, 2 and 3. In accordance with IFRS 13 the financial instruments are classified as follows:
Level 1: Observable inputs that reflect quoted prices (unadjusted) for identical assets or liabilities in active markets.
Level 2: Inputs other than quoted prices included in Level 1 that are observable for the asset or liability either directly or indirectly.
Level 3: Unobservable inputs that are supported by little or no market activity and that are significant to the fair value of the assets or liabilities.
For further details, as carrying amount and sensitivity disclosures, please see Note 29 ‘Fair value of assets and liabilities’.
E. Recently Issued Accounting Pronouncements Applicable in Future Periods
IFRS 9, Financial Instruments:This Standard was developed in three phases and is mandatorily effective for the periods beginning on or after January 1, 2017, with early adoption permitted.
The first stage of this standard presents the requirements for the recognition, classification and measurement of financial assets. In November 2009, the IASB issued the amendments related to classification and measurement of financial assets, in October 2010 some requirements regarding to classification and measurement of financial liabilities were issued, in July 2014, some additional guidance was provided by the IASB related to classification and measurement of financial assets establishing 3 categories for the measurement of financial assets: Amortized cost, fair value through comprehensive income and fair value through profit or loss.
The second and third stages present: a) the impairment model based on “expected loss” and -issued in July 2014-; and b) hedge accounting –issued in November 2013-, which requires an economic relationship between the hedged item and the hedging instrument and that the hedging ratio be the same ratio that the entity uses for risk management.
The Bank opted for the early adoption of the version of the first phase of this standard (issued in October 2013), which is related to the recognition, classification and measurement of financial instruments.
The Bank has not adopted the hedging accounting nor the expected losses impairment model included in IFRS 9 – November 2013, as a consequence, the measurement of impairment losses and hedge effectiveness are recorded in accordance with IAS 391.
IFRS 15, Revenue from contracts with customers: On May 28, 2014, the IASB issued IFRS 15, which clarifies how an entity should recognize revenue to depict the transfer of promised goods or services to customers in an amount that reflects the consideration to which the entity expects to be entitled in exchange for those goods or services. Likewise entities are required to provide more useful information related to significant judgments, nature and costs to obtain or fulfil a contract with a customer.
The standard must be applied in an entity’s IFRS financial statements for annual reporting periods beginning on or after 1 January 2018. Earlier application is permitted. Management is currently evaluating the impact the changes adoption of IFRS 15 would have on the Bank’s financial statement and disclosures. Management is currently evaluating the impact the changes from adopting IFRS 9 would have on the Bank’s financial statement and disclosures.
IFRS 16, Leases: In January, 2016, the IASB issued IFRS 16 to replace IAS 17. Accounting for finance leases will remain substantially the same. Operating leases will be brought on balance sheet through the recognition of assets representing the contractual rights of use and liabilities will be recognised for the contractual payments. Applying that model, a lessee is required to recognize:
| (a) | Assets and liabilities for all leases with a term of more than 12 months, unless the underlying asset is of low value; and |
| (b) | Depreciation of lease assets separately from interest on lease liabilities in the income statement. The effective date is January 1, 2019. |
Management is currently evaluating the impact the changes from adopting IFRS 16 would have on the Bank’s financial statement and disclosures.
Amendment to IFRS 11 Joint Arrangements: The amendments clarify the accounting for the acquisition of an interest in a joint operation where the activities of the operation constitute a business. The amendment is effective for annual periods beginning on or after January 1, 2016, with early adoption permitted. The amendment will have an impact on the Bank’s financial statements only in case of an acquisition of a joint arrangement.
Amendment to IAS 16 Property, Plant and Equipment and IAS 38 Intangible Assets: The amendments clarify that the use of a revenue based depreciation and amortization method is not appropriate, and provide a rebuttable presumption for intangible assets. The amendment is effective for annual periods beginning on or after January 1, 2016, with early adoption permitted. Management is currently evaluating the impact the amendments would have on the Bank’s financial statements.
Amendment to IAS 27 Separate Financial Statement - Equity method:The amendment restore the option to use the equity method to account for investments in subsidiaries, joint ventures and associates in the separate financial statements. The amendment is effective for annual periods beginning on or after January 1, 2016, with early adoption permitted.
Amendment to IFRS 10 Consolidated Financial Statements and IAS 28 Investments in Associates and Joint Ventures: The amendments relate to an inconsistency between IFRS 10 and IAS 28 and clarify the accounting treatment for sales or contribution of assets between an investor and its associates or joint ventures. The amendment is effective for annual periods beginning on or after January 1, 2016, with early adoption permitted. Any possible impacts arising from adopting these changes are being evaluated and will be completed up to the date this standard comes into force.
1 In accordance with IFRS 9, an entity that applies early adoption for stage 1 ‘classification and measurement model’ is able to decide whether or not to apply the hedge accounting based on IAS39, instead of model required by IFRS 9 until the effective date comes into force (for annual periods beginning on January 1, 2018).
Amendment to IAS 1 – Presentation of Financial Statements: The amendments clarify guidance on materiality and aggregation, the presentation of subtotals, the structure of financial statements and the disclosure of accounting policies The amendment is effective for annual periods beginning on or after January 1, 2016, with early adoption permitted. Management is assessing the impact that the amendments would have on the Bank’s financial statements.
Amendment to IAS 7 Cash Flow Statement:In January 2016, the IASB issued guidance requiring accompanying disclosures to the statement of cash flow that include a reconciliation of changes in liabilities arising from financial activities, considering both cash and non-cash transactions. The amendment is effective for annual periods beginning on or after January 1, 2017, with early adoption permitted. Any possible impacts arising from adopting these changes are being evaluated and will be completed up to the date this standard comes into force.
F. Significant Accounting Policies
The significant accounting policies that the Bank uses in preparing its consolidated financial statements are detailed below:
| 1. | Functional and presentation currency |
Items included in the financial statements of each of the Bank’s entities are measured using the currency of the primary economic environment in which the entity operates (‘the functional currency’). The consolidated financial statements are presented in Colombian pesos, which is the functional currency for the Parent Company (the main subsidiary), and the presentation currency for the consolidated financial statements.
| 2. | Transactions and balances |
Foreign currency transactions are translated into the functional currency using the exchange rates at December 31, 2012the dates of the transactions. Foreign exchange gains and December 31, 2011 are those stated above.
Exchange rate differences arisinglosses resulting from adjustmentsthe settlement of such transactions and remeasurementsfrom the translation of monetary assets and liabilities denominated in foreign currencies at year end exchange rates are recordedgenerally recognised in profit or loss. They are deferred in equity if they relate to qualifying cash flow hedges and qualifying net investment hedges or are attributable to part of the Consolidated Statements of Operations.net investment in a foreign operation.
(c) ConvenienceNon-monetary items that are measured at fair value in a foreign currency are translated using the exchange rates at the date when the fair value was determined. Translation to U.S. Dollarsdifferences on assets and liabilities carried at fair value are reported as part of the fair value gain or loss.
Foreign subsidiaries
The Bank maintains its accounting recordsresults and prepares its financial statements in Colombian pesos. The U.S. Dollar amounts presented inposition of foreign operations (none of which has the financial statements and accompanying notescurrency of a hyperinflationary economy) that have been converteda functional currency different from peso figures solely for the convenienceBank´s presentation currency are translated into the presentation currency as follows:
| · | assets and liabilities for each statement of financial position presented are translated at the closing rate at the date of that statement of financial position |
| · | income and expenses for each statement of income and statement of other comprehensive income are translated at average exchange rates, and |
| · | all resulting exchange differences are recognized in other comprehensive income |
As part of the readerconsolidation process, exchange differences arising from debt securities in issue and other financial instruments designated as hedges of foreign operations, are recognized in other comprehensive income. When a foreign operation is sold or any debt securities in issue forming part of the net investment are repaid, the associated exchange differences are reclassified to profit or loss, as part of the gain or loss on sale.
Goodwill and fair value adjustments arising on the acquisition of a foreign operation are treated as assets and liabilities of the foreign operation and translated at the closing exchange rate.
The table below sets forth the exchange rate used by the Bank and its subsidiaries to convert U.S. dollar into Colombian pesos statement of COP 1,768.23 per USD 1,financial position accounts and transactions in foreign currency:
| | | December 31, 2015 | | | December 31, 2014 | | | January 1, 2014 | |
| Closing exchange rate | | | 3,149.47 | | | | 2,392.46 | | | | 1,926.83 | |
| Average rate for the period ended at | | | 2,746.55 | | | | 2,000.68 | | | | - | |
| 3. | Cash and cash equivalents |
The Bank considers cash and cash equivalents to include cash and balances at central bank, interbank deposits and reverse repurchase agreements and other similar secured lending that have original maturities of up to 90 days or less, as shown in Note 5.
Security deposits are assets pledged as collateral that correspond to cash guarantees made by the Bank to other financial institutions. The carrying amount is increased when a margin call is issued or when it is necessary to increase the trading quota; conversely, it is decreased when the aim is to lower that quota. The carrying amount is recognized for the amount paid by the counterpart and is not subject to interest.
| 5. | Business combinations and goodwill |
Business combinations are those operations when an acquirer obtains control of a business (e.g. an acquisition or merger).
Business combinations are accounted for using the acquisition method as follows: a) Identifiable acquired assets, liabilities and contingent liabilities assumed in the acquisition are recognized at fair value at the date of acquisition; b) Acquisition costs are recognized in the consolidated statement of income as expenses in the periods in which correspondsthe costs are incurred and the services are received; c) and goodwill is recognized as an asset in the consolidated financial statement.
The consideration transferred for the acquisition of a subsidiary is the fair value of the assets transferred, the liabilities incurred to the representative market rate calculated on December 31, 2012 the last business dayformer owners of the year (the “Representative Market Rate”). The Representative Market Rate is computedacquiree and certifiedthe equity interests issued by the SFC,Bank.
Goodwill is measured as the Colombian banking regulator,excess of the sum of the consideration transferred, the value of any non-controlled interest and, when applicable, the fair value of any previous equity interest in the acquiree, over the net value of the acquired assets, liabilities or contingent liabilities assumed at the date of acquisition. The profits or losses resulting from the measurement of the previously held interest are recognized in the statement of income for the period.
For each business combination, at the date of acquisition, the Bank measures the non-controlled interest by the proportional share of the identifiable assets acquired, as well as liabilities and contingent liabilities assumed by the acquired company, or by their fair value.
Any contingent consideration in a business combination is classified as a liability or as equity and is recognized at fair value at the date of acquisition and remeasured quarterly.
The goodwill acquired in a business combination is allocated, at the date of acquisition, to the Bank's cash-generating units which are expected to benefit from the combination, regardless of whether other assets or liabilities assumed by the acquired company are assigned to these units.
For business combinations in stages, any previous equity of the acquiring party is adjusted at its fair value at the date of acquisition and any resulting gain (or loss) is reported in the consolidated statement of income. Amounts previously recognized in the consolidated statement of other comprehensive income that must be recycle through profit or loss in relation with such investments are reclassified to the consolidated income account, as if such investment had been sold. When the associate has other comprehensive income, which is not reclassified to profit or loss, the amounts are not reclassified when the investment is sold.
When the Bank enters into a contract to acquire shares in a subsidiary held by non-controlling interest, that entitles the non-controlling interest to sell its interest in the subsidiary to the Bank, the Bank analyzes whether the ownership risks and rewards remain with the non-controlling interest or have transferred to the Bank. The non-controlling interest is recognized to the extent the risks and rewards of ownership of those shares remain with them. Irrespective of whether the non-controlling interest is recognized, a financial liability is recorded for the present value of the redemption amount. Subsequent changes to the liability are recognized in profit or loss. The Bank will reclassify the liability to equity if a put expires unexercised.
A financial instrument is a contract that gives rise to a financial asset of one entity and a financial liability or equity instrument of another entity.
6.1 Recognition of financial assets and liabilities
Financial assets and liabilities are recognized in the statement of financial position when the Bank becomes a party of the contractual provisions of the instrument. This includes conventional purchases and sales, which are those purchases and sales of financial assets that require the delivery of assets within the established general period. The Bank uses trade date accounting for regular way contracts when recording financial asset transactions.
6.2 Offsetting of financial instruments
The Bank reports financial assets and financial liabilities on a dailynet basis on the statement of financial position if and representsonly if (i) there is a legally enforceable right to set off the weighted averagerecognized amounts and there is intention to settle on a net basis, or (ii) to realize the asset and settle the liability simultaneously.
The Bank enters into International Swaps and Derivatives Association (ISDA) master netting agreements or similar agreements with substantially all of the buy/sell foreign exchange rates negotiatedBank’s derivative counterparties. Where legally enforceable, and depending on the previous dayBank’s intention, these master netting agreements give the Bank, in the event of default by certainthe counterparty, the right to liquidate securities and cash equivalents held as collateral and to offset receivables and payables with the same counterparty.
6.3 Derecognition of financial institutions authorizedassets and liabilities
Financial assets are derecognised when the rights to deal in foreign exchange transactions (including Bancolombia S.A.). This translation may not be construed to represent thatreceive cash flows from the Colombian peso amounts representsfinancial assets have expired or have been transferred and the group has transferred substantially all the risks and rewards of ownership. A financial liability is removed from the statement of financial position when it is extinguished, that is when the obligation is discharged, cancelled or expired.
6.4 Fair value
The fair value of all financial assets and liabilities is determined at the statement of financial position date, for recognition or disclosure in the notes to the financial statements.
The fair value is determined:
| − | Based on quoted prices (unadjusted) in active markets for identical assets or liabilities to which the Bank can access at the measurement date (level 1). |
| − | Based on valuation models commonly used by the market participants whose inputs are other than quoted prices included with in level 1 that are observable for the assets or liabilities, either directly or indirectly (level 2). |
| − | Based on internal valuation techniques of cash flow discounts and other valuation models, using unobservable inputs estimated by the Bank for the assets or liabilities, in the absence of observable inputs (level 3). |
The accounting judgments used in determining fair value related to matters such as liquidity risk, credit risk and volatility. The changes in estimates related to these factors could be converted into, U.S. Dollars at that or any other rate. Foraffect the recognized fair value of the financial instruments.
In Note 29 Fair Value Measurement an analysis is provided of the fair values of financial instruments and non-financial assets and liabilities, including further details about the consolidated foreign currency assets and liabilities converted into U.S. Dollars, see Note 3 “Transactions in Foreign Currency”.measurement of fair value.
(d) Cash6.5 Financial assets
On initial recognition, the Bank measures financial assets at fair value plus, in the case of a financial assets not at fair value through profit or loss, transaction costs that are directly attributable to the acquisition of the financial assets. The financial assets are then classified for subsequent measurement at fair value or amortized cost, respectively, depending on the business model used by the Bank to manage them and Cash Equivalentsthe characteristics of contractual cash flows of the instrument. Additionally, for certain equity instruments, according to IFRS 9, the Bank made the irrevocable election to present their subsequent changes in fair value in other comprehensive income.
At subsequent measurement, the Bank measures and classifies its financial assets at amortized cost, using the effective interest rate, if the asset is maintained within a business model whose objective is to hold the asset in order to collect the contractual cash flows and if the contractual terms give rise on specified dates to cash flows that are solely payments of principal and interest on the principal amount outstanding”. Otherwise, the financial assets are subsequently measured at fair value.
The consolidated statement of cash flows was prepared usingBank classified the indirect method. Undercompulsory investment securities portfolio (Títulos de Reducción de Deuda – TRDs and TDAs securities issued by the Colombian Banking GAAP theregovernment), money market operations, loan portfolio and financial leasing portfolio as financial instruments at amortized cost. Other financial assets, such as debt securities other than TRDs and TDAs, derivatives, and investments in equity instruments are no special requirements or forms governing of the Bank’s statement of cash flows. Accordingly,measured at fair value through profit and loss, except for investments in equity instruments for which the Bank has preparedmade the consolidated statement of cash flows in accordance with the presentation in the International Financial Reporting Standard No. 7, “Statement of Cash Flows”.irrevocable election since initial recognition to measure them subsequently at fair value through other comprehensive income.
Cash and cash equivalents consist of cash and due from banks, funds sold and securities purchased under agreements to resell , which are highly liquid investments with a maturity that contractually do not exceed one month.6.5.1 Money market operations
(e) Use of Estimates in the Preparation of Financial Statements
The preparation of financial statements requires management to make estimates and assumptions that affect the reported amounts of assets and liabilities at the date of financial statements and the reported amounts of revenues and expenses during the reporting period. Some of the main estimations affecting the financial statements include, but are not limited to the accounting treatment for pension plan provisions, evaluation of loan portfolio risk and determination of allowances for loan and finance lease, income taxes and determination of valuation allowances for debt and equity securities. Actual losses could differ from those estimated.
(f) Real Value Unit Rate (UVR)Overnight funds
The operationsThese are funds that the Bank carries out with regard to mortgage loans linked to the “Unidad de Valor Real” (the “Real Value Unit” or “UVR”) are adjusted on a daily basis according to the daily value of the UVR, as published by the Central Bank. The values assigned by the Central Bank to the UVR, in Colombian pesos, on December 31, 2012 and 2011, were COP 204.2017 and COP 198.4467, respectively. The UVR rate corresponds to the monthly variance of theIndice de Precios al Consumidor (the “IPC” or “Colombian Consumer Index Price”) during the calendar month immediately prior to the month for which the UVR rate is being calculated. In light of the above, the annualized UVR rate increased at December 31, 2012 and 2011 by 0.09% and 1.99%, respectively.
(g) Money Market Operations.
Include funds sold and securities purchased under agreements to resell and funds purchased and securities sold under agreements to repurchase (“Repos).
Interbank Funds
Interbank funds include loans madelends to other financial institutions and borrowingsor borrows from the Central Bank orand other financial institutionsinstitutions. The transactions in an asset position with maturities between 1maturity of up to 30 days.ninety days are measured at fair value and classified as cash equivalents. The operations in an asset position with maturity greater than ninety days and all the operations in a liability position are measured at amortized cost and presented as interbank assets or interbank liabilities.
Reverse repurchase agreements and other similar secured transactions
Repos
Asset position refers to transactions accounted for as collateralized lending in which the Bank or its subsidiaries purchasepurchases securities with an agreement to resell them to the seller at a stated price plus interest at a specified date. The amount recorded in this account relates to the money lent and the investment securities purchased under those agreements are recordednot recognized in memorandum accounts.the statement of financial position when the counterparty substantially retains all of the risks and rewards of the ownership. Accrued interest is recorded in accounts receivable, and recognized as operating income.income during the life of the agreement using the effective interest rate method.
Liability position refers to transactions accounted for as collateralized borrowing in which the Bank or its subsidiaries sell securities with an agreement to repurchase them from the buyer at a stated price plus interest at a specified date, not exceeding one year.
The amount is recordedsecurities sold under those agreements are not derecognized from the statement of financial position when the Bank substantially retains all of the risks and rewards of the securities. The values received are initially recognized, at their fair value, as a liability related to the money borrowed and the investment security sold is reclassified inside the investment securities account into “Investment Securities under Repurchase Agreement”.financial liability. Accrued interest is recorded in accounts payable, and recognized as operating expense.an interest expense during the useful life of the agreement using the effective interest rate method.
Repo transactions do not qualify as true purchase/sales6.6 Loans and therefore these investments are included on the Bank’s balance sheet.
(h) Investment Securities
1. Classification
Investment securities are classified as “trading”, “heldadvances to maturity”,customers and “available for sale”.
Trading Securities
Trading investments are those acquired mainly for the purpose of obtaining gains on short-term price fluctuations.
Held to Maturity Securities
Investments “held to maturity” are debt securities acquired for the purpose of holding until maturity. Reclassification to a different category is permitted only under specific situations. These investments are only sold for liquidity operations, in exceptional cases, as determined by the SFC.
Available for Sale Securitiesother receivables
These are investments which do not fall into eitherfinancial assets that consist primarily of the above classifications, for which the investor has the stated intentioncorporate loans, personal loans (including mainly consumer finance and legal, contractual, financialoverdrafts) and operational capacityresidential mortgage loans. The Bank established that loans, advances to customers and other receivables are held within a business model whose objective is to hold them in order to collect contractual cash flows and the investments for at least one year fromcontractual terms give rise on specified dates to cash flows that are solely payments of principal and interest on the date of classification.
Investments intended to be held for less than one year are classified as trading securities. This classification also covers equity investments with low market liquidity or those with no quoted share price.
2. Investment Valuation
Initial recognition of investment
All investment securitiesprincipal amount outstanding. They are initially recorded at their purchase cost.
Subsequent measurement
Subsequent measurement is recorded as follows:
2.1. Debt Securities Denominated in Local Currency
Trading securities are valued dailymeasured at fair value, plus transaction costs and the result is recorded daily. The Bank determines the fair value of trading and available for sale debt securities by using the prices, reference rates and margins provided by the Colombia Stock Exchange. These prices are calculated and published daily.
Held to maturity investments are valued at amortized cost based on their internal rate of return calculated on the purchase date.
2.2 Securities Denominated in Foreign Currency or in UVR
The fair value of securities denominated in a foreign currency or UVR is initially determined in such currency or in UVR by using reference rates and margins provided by Bloomberg and other price providers in accordance with international market ordinary transactions.
Securities denominated in a foreign currency other than U.S. dollars are first converted by the Bank and its Subsidiaries to U.S. Dollars using the Exchange Rate authorized by the SFC. The U.S. Dollar amount computed is then converted into Colombian pesos using the exchange rates applicable on the same dates, as established by the SFC.
Valuation adjustments are recorded in the consolidated statement of operations as net interest income, and foreign exchange gains or losses resulting from investment in foreign currency securities are recorded as net foreign exchange gain or loss.
2.3 Equity Securities
External Circular 100 of 1995 issued by the SFC provides that investments should be valued on a daily basis; however, in the case of investments in equity shares with little or low market liquidity, ororigination fees that are not listed ondirectly attributable to the stock exchange, the valuation is based on the financial statements of the issuer. The Bank records the valuation of these investments on a monthly basis:
| a) | Listed equity securities on the Colombia Stock Exchange are valued at prices published by authorized entities. In the absence of a price calculated for the day on which these investments are valued, the last known valuation price is used. For low volume trading securities the Bank uses the method described below in section b. |
| b) | Non-listed equity securities are valued at their purchase cost which is increased or decreased based on the investor’s share in all subsequent changes in the issuer’s equity. For this purpose, the issuer’s equity is calculated based on the latest certified financial statements released by the issuer that have been issued no longer than six (6) months prior to the date of determination. |
In connection with investments held by the Bank’s foreign subsidiaries, the issuer’s stockholders equity is adjusted to follow the accounting practices required, before applying the valuation method described in b. above.
Shares held in investment funds and structured securitizations through fundsacquisition or self-standing trustsissue. They are valued using the unit value calculated by the fund manager on the day immediately preceding the date on which such investments are valued. In the case of the Private Capital Fund (Fondo Inmobiliario Colombia) the unit value is calculated based on the fund financial statements in which real estate assets are adjusted by inflation and then recorded at their fair value, and the valuation adjustment is recognized in the consolidated statements of operations as interest income.
As of December 31, 2012, the Bank has taken the appropriate measures to adopt in 2013 the new requirements introduced by the External Circulars 039 and 050 of 2012 issued by the Colombian SFC, related to investment valuation techniques using a price providers approach. Consequently, the methodologies used by the authorized price providers have been tested in order to select the appropriate price provider.
3. Accounting recognition
3.1. Trading Investments
Changes in the fair value of the investments are recorded in the consolidated statements of operations.
3.2. Investments Held to Maturity
Investments held to maturity are accounted forsubsequently measured at amortized cost using the effective interest rate method and interest accruals are recorded as interest income on investment securities.
3.3. Investments Available for Sale
3.3.1. Debt Securities
Interest accruals are recorded as interest income on investment securities in the consolidated statements of operations.
Changes in the fair value of the investment are recorded in stockholders’ equity in the account denominated “surplus from gross unrealized gain or (loss) on available for sale investments”.
3.3.2 Equity Investments
Changes in the fair value of the investments are recorded in accordance with the trading characteristics of the investment as follows:
| · | Investments in high or medium volume trading securities, quoted on a stock exchange, are recorded in the investment account, with a charge or credit in stockholders’ equity in the account “surplus from unrealized gain or (loss) on available for sale investments". |
| · | Changes in the carrying value of investments in securities with little or low liquidity on the exchange or not listed on a stock exchanges are recorded as other assets in a special account “Reappraisal of assets” with a corresponding charge or credit in the stockholders’ equity in the account “surplus from reappraisal of assets”. A decrease in the fair value of the investment below the purchase cost is recorded as a provision with a charge in the consolidated statements of operations. This provision could be reversed in the future if the fair value increases above the purchase cost. |
| · | Dividends received in cash or shares on investment equity securities are recorded as income on an accrual basis when the dividend is declared. |
4. Impairment Test on Investment Securities
Debt securities, with the exception of debt securities issued or guaranteed by the Republic of Colombia or the Colombian Guarantee Fund for Financial Institutions (Fondo de Garantias de Instituciones Financieras “Fogafin”), or issued by the Central Bank, and equity securities with low liquidity or not listed on stock exchanges, must be tested for impairment on a quarterly basis as follows:
4.1. Securities with External Ratings
Securities that are rated by a rating firm approved by the SFC may not be recorded for an amount that exceeds the following percentages of their nominal value, net of amortization for debt securities, or acquisition cost for equity securities, as of the valuation date:
Long-Term | | Max. Amount | | Short-Term | | Max. Amount |
Rating | | % | | Ranking | | % |
BB+, BB, BB- | | Ninety (90) | | 3 | | Ninety (90) |
B+, B, B- | | Seventy (70) | | 4 | | Fifty (50) |
CCC | | Fifty (50) | | 5 and 6
| | Zero (0)
|
DD, EE | | Zero (0) | |
However, for debt securities classified as held to maturity, with known fair value, impairment is recorded for the difference between its carrying value and such fair value.
4.2. Securities withoutless any External Credit Rating
These securities are rated according to the methodology defined by the Bank. The securities are rated “A” except when there is a risk associated with them, in which case they are rated from rating B to E. The maximum value, as defined by the SFC, at which these investments are recorded, according to their rating is:
Rating | | Max. Registered Amount % (1) | | Investment Characteristics |
B Acceptable risk, greater than normal | | Eighty (80) | | Current factors of uncertainty that could affect the capacity to continue adequately fulfilling debt service and weaknesses that could affect financial situation. |
C Appreciable risk | | Sixty (60) | | Current medium-high probabilities of non-fulfillment of timely payments of capital and interest that may compromise the recovery of the investment. |
D Significant risk | | Forty (40) | | Current non-fulfillment of agreed terms of the security and material deficiencies in their financial situation, the probability of recovering the investment is highly doubtful. |
E Unrecoverable | | Zero (0) | | Recovery highly improbable. |
| (1) | Based on the net nominal amount as of the valuation date for debt securities or the acquisition cost, net of allowances for equity securities. |
In assessing investment securities for impairment, the Bank reviews the ratings issued by ratings agencies, where applicable, verifies its internal rating model and calculates the maximum registered amount in accordance with those credit ratings or model. If the resulting amount is less than its carrying amount, the carrying amount of the investment is reduced to the face value, net of any amortization of principal, multiplied by the applicable percentage as described above. An impairment loss is recognized immediately in the consolidated statements of operations.
5. Reclassification of Investment Securitiesimpairment.
The Bank reclassifies investments from available for saleeffective interest method is a method used to trading when its main purpose iscalculate the amortized cost of an asset and to obtain gains on short-term price fluctuations.
An investment reclassified from available for sale to trading is subject to accounting, valuation rules and regulations applicable toassign the trading category. As a result, unrealized gain or (loss) must be accounted for as either income or expense oncost in interest during the date onrelevant period. The effective interest rate is the discount rate at which the investment is reclassified.
(i) Loans and Financial Leases
The Bank grants loans to customers inpresent value of future estimated cash payments or those received through the following segments: residential mortgage, consumer, commercial, financial leases and small business loans. A substantial portionexpected life of the Bank’s loan portfolio is represented by commercial loans throughout Colombia.
Loansfinancial instrument, or, when appropriate, in a shorter time frame, are recorded at the principal outstanding less allowance for impairment, except in cases of purchases of portfolios, which are recorded at the acquisition cost on day one, and then the principal outstanding is affected by the allowance for impairment and loans granted in foreign currency which are recorded at the exchange rate applicable on the corresponding date of origination. Accrued interest is recorded in account receivables and unearned income is recorded as a liability.
Financial leasing operations are initially recorded as loans for an amount equal to the booknet carrying value ofat the asset to be leased tobeginning. To calculate the customer and subsequently, the loan is amortized when the rental payments are due in the amount of the payment corresponding to principal.
Suspension of Interest Accruals
The SFC requires thateffective interest income, lease payments and other items of income cease to be accrued in the consolidated statements of operations after a loan is in arrears for more than two months for mortgage and consumer loans, three months for commercial loans and one month for small business loans. However,rate, the Bank adopted a policy, in which commercial, consumer and small business loans that are past-due more than 30 days and mortgages that are past-due more than 60 days will stop accruing interest inestimates cash flows considering all the consolidated statements of operations. Instead, interest and principal payments are reflected in memorandum accounts until such time that the customer proceeds to pay amounts due or overdue. After that, the interest collected is recorded as income in the consolidated statements of operations on a cash basis.
Credit Risk Evaluation
The Bank analyzes on an ongoing basis the credit risk to which its loan portfolio is exposed, considering thecontractual terms of the corresponding obligationsfinancial instrument ,including transaction costs and premiums granted minus commissions and discounts, but without taking into account future credit losses.
6.7 Impairment of financial assets at amortized cost
At the end of every period, the Bank assesses whether there is objective evidence that a financial asset or group of assets measured at amortized cost are impaired; impairment is recognized as well asa result of one or more events that occurred, after the levelinitial recognition of risk associated with the borrower. This risk evaluationfinancial asset, where the loss event has an impact on the estimated future cash flows of the financial asset or group of financial assets that can be reliably estimated.
Indicators that the financial asset is based on information relating toimpaired include historical performance data, particular characteristics of the borrower, fair value of collateral, the borrower’s debt service withto other entities, macroeconomic factors and financial information, etc. For consumer, mortgage and small business loans the analysis is performed only on the basisa significant financial difficulty of the past-due daysborrower, whether the borrower will likely to declare bankruptcy or financial restructuring, or any breach of the loans.
For loan portfolios, the following minimum credit risk ratings are assigned according to the financial situation of the debtor and/contract, such as a default or the past-due days of the obligation. Additionally, all significant counterparty relationships as well as loans under special supervision are revieweddelinquency in detail every six months:interest or principal payments.
Rating | | Qualitative Factors |
A –Normal Risk | | Loans and financial leases in this category are appropriately serviced. The debtor’s financial statements or itsprojected cash flows, as well as all other credit information available to the Bank, reflect adequate paying capacity. |
B –Acceptable Risk, Sub Normal | | Loans and financial leases in this category are acceptably serviced and guaranty protected, but there are weaknesses which may potentially affect, on a transitory or permanent basis, the debtor’s paying capacity or its projected cash flows, to the extent that, if not timely corrected, would affect the normal collection of credit or contracts. |
C –Appreciable Risk | | Loans and financial leases in this category represent insufficiencies in the debtors’ paying capacity or in the project’s cash flow, which may compromise the normal collection of the obligations. |
D –Significant Risk | | Loans and financial leases in this category have deficiencies and the probability of collection is highly doubtful are deemed uncollectible. |
E – Unrecoverable | | Loans and financial leases in this category are considered default loans. |
Allowance for Loan Losses
Commercial and consumer loans
Allowances for loan losses are established based on the parameters issued by the SFC.
The Bank has adopted the Reference Modelsindividually evaluates for Commercial and Consumer Loans, issued by the SFC. Based onimpairment financial assets which exceed COP 2,000 million (USD 1 million for foreign subisidiaries). When these models, the individual provision for loan portfolios is calculatedsignificant financial assets are identified as a sum of the following individual components:
(a) The individual current credit risk (pro-cyclic) corresponding to the portion of the individual provision on the loan portfolio that reflects the current credit risk for each debtor.
(b) The individual future credit risk (counter-cyclic) corresponding to the portion of the individual provision on the loan portfolio, reflecting future possible changes in the debtor’s credit risk. This portion is included to reduce the impact on the consolidated statements of operations when such a situation occurs. The internal reference models must take into account and calculate this component based on all available information reflecting such changes.
Under no circumstance may the individual future credit risk component for each obligation be less than zero and neither may it exceed the expected loss calculated using matrix B included below. Also, the sum of both components may not exceed the total value of the exposure of the loan.
According to the reference models, the allowance for loan losses is calculated as follows:
Expected Loss = [Probability of default] x [Exposure at default] x [Loss-given default]
Probability of Default (PD)
Probability of Default is defined as the probability of the debtor within a specific loan portfolio or segment and rating, defaulting on its obligations within the next twelve (12) months. For the Bank and its subsidiaries this probability of default is established by the SFC.
Banco Agricola S.A. uses an internal model to calculate the Probability of Default duly authorized by the SFC.
Probability of Default is calculated based on the following matrices authorized by the SFC according to the type of portfolio:
Commercial loans
| MATRIX A |
| Rating | | Large Corporations(1) | | | Medium Corporations(1) | | | Small entities(1) | | | Individuals(1) | |
| AA | | | 1.53 | % | | | 1.51 | % | | | 4.18 | % | | | 5.27 | % |
| A | | | 2.24 | % | | | 2.40 | % | | | 5.30 | % | | | 6.39 | % |
| BB | | | 9.55 | % | | | 11.65 | % | | | 18.56 | % | | | 18.72 | % |
| B | | | 12.24 | % | | | 14.64 | % | | | 22.73 | % | | | 22.00 | % |
| CC | | | 19.77 | % | | | 23.09 | % | | | 32.50 | % | | | 32.21 | % |
| Default | | | 100.00 | % | | | 100.00 | % | | | 100.00 | % | | | 100.00 | % |
| MATRIX B |
| Rating | | Large Corporations(1) | | | Medium Corporations(1) | | | Small entities(1) | | | Individuals(1) | |
| AA | | | 2.19 | % | | | 4.19 | % | | | 7.52 | % | | | 8.22 | % |
| A | | | 3.54 | % | | | 6.32 | % | | | 8.64 | % | | | 9.41 | % |
| BB | | | 14.13 | % | | | 18.49 | % | | | 20.26 | % | | | 22.36 | % |
| B | | | 15.22 | % | | | 21.45 | % | | | 24.15 | % | | | 25.81 | % |
| CC | | | 23.35 | % | | | 26.70 | % | | | 33.57 | % | | | 37.01 | % |
| Default | | | 100.00 | % | | | 100.00 | % | | | 100.00 | % | | | 100.00 | % |
.
| (1) | The following table presents the classification of corporations by its level of assets, to determine the range in which their loans should be evaluated: |
Size of the Corporation
| | Level of assets in SMMLV
| | COP
|
Large Corporations | | More than 15,000 | | More than 8,500 |
Medium Corporations | | Between 5,000 and 15,000 | | Between 2,834 and 8,500 |
Small Corporations and/or Entities
| | Less than 5,000
| | Less than 2,834
|
SMMLV means the effective legal minimum monthly salary (Salario Mínimo Mensual Legal Vigente). In 2012, the effective SMMLV in Colombia was COP 566,700 (in pesos).
Consumer loans
| MATRIX A |
| Rating | | Vehicles | | | Others | | | Credit Cards | |
| AA | | | 0.97 | % | | | 2.10 | % | | | 1.58 | % |
| A | | | 3.12 | % | | | 3.88 | % | | | 5.35 | % |
| BB | | | 7.48 | % | | | 12.68 | % | | | 9.53 | % |
| B | | | 15.76 | % | | | 14.16 | % | | | 14.17 | % |
| CC | | | 31.01 | % | | | 22.57 | % | | | 17.06 | % |
| Default | | | 100.00 | % | | | 100.00 | % | | | 100.00 | % |
| MATRIX B |
| Rating | | Vehicles | | | Others | | | Credit Cards | |
| AA | | | 2.75 | % | | | 3.88 | % | | | 3.36 | % |
| A | | | 4.91 | % | | | 5.67 | % | | | 7.13 | % |
| BB | | | 16.53 | % | | | 21.72 | % | | | 18.57 | % |
| B | | | 24.80 | % | | | 23.20 | % | | | 23.21 | % |
| CC | | | 44.84 | % | | | 36.40 | % | | | 30.89 | % |
| Default | | | 100.00 | % | | | 100.00 | % | | | 100.00 | % |
In accordance with the instructions issued by the SFC and due to the cumulative phase that took place during the years 2012 and 2011, the Bank used matrix B in order to calculate its individual current credit risk (pro-cyclic).
Exposure at Default
Exposure at default is defined as the current loan balance of the principal plus interest receivable accounts and other receivables of the customer.
Loss Given Default (LGD)
Loss Given Default is the economic loss incurred by the Bank when events of default occur. The LGD for debtors classified in the default rating depends on the type of collateral and gradually increases the allowance according toimpaired, the amount of days lapsing after being classified in such rating. For this purpose 100%the loss is measured as the difference between the asset’s carrying amount and the present value of estimated future cash flows, including the fair value of any collateral, discounted at the financial asset’s original effective interest rate. When it is determined that the significant financial asset will be substantially recovered solely from the value of collaterals or guarantees, the Group estimates the impairment loss as the difference between the carrying amount of the collateral value is considered to coverloan and the principal amount. Loss Given Default is calculated based on the following matrices authorized by the SFC according to the type of loan portfolio and adjusted by the Bank in order to recognize in an earliest term the effects of the loans’ overdue:
Commercial loans
| Collateral | | LGD
Initial | | Days After
Default | | LGD | | Days After
Default | | LGD | | Days After
Default | | LGD | | Days After
Default |
| Guarantees not accepted as collateral | | 55 | % | 0 | | 100 | % | 1 onwards | | | | | | | | |
| Financial collateral: FNG and FAG(1) | | 12 | % | 0-359 | | 70 | % | 360-539 | | 100 | % | 540 onwards | | | | |
| Real estate – commercial and residential | | 40 | % | 0 | | 60 | % | 1-89 | | 80 | % | 90-209 | | 100 | % | 210 onwards |
| Assets leased in leasing agreements | | 45 | % | 0 | | 90 | % | 1-89 | | 100 | % | 90 onwards | | | | |
| Other collaterals | | 50 | % | 0 | | 90 | % | 1-89 | | 100 | % | 90 onwards | | | | |
| Rights in trust guarantees and others | | 45 | % | 0 | | 60 | % | 1-89 | | 80 | % | 90-209 | | 100 | % | 210 onwards |
| Without collateral or not accepted for local purposes | | 55 | % | 0 | | 100 | % | 1 onwards | | | | | | | | |
Consumer loans
| Collateral | | LGD
Initial | | | Days After
Default | | | LGD | | | Days After
Default | | LGD | | | Days After
Default | | LGD | | | Days After
Default |
| Guarantees not accepted as collateral | | | 75 | %(2) | | | 0 | | | | 90 | % | | 1-29 | | | 90 | % | | 30-89 | | | 100 | % | | 90 onwards |
| Financial collateral: FNG and FAG(1) | | | 12 | % | | | 0- 359 | | | | 70 | % | | 360-539 | | | 100 | % | | 540 onwards | | | | | | |
| Real estate – commercial and residential | | | 40 | % | | | 0 | | | | 80 | % | | 1-29 | | | 90 | % | | 30-89 | | | 100 | % | | 90 onwards |
| Assets leased in leasing agreements- real estate | | | 35 | % | | | 0 | | | | 80 | % | | 1-29 | | | 90 | % | | 30-89 | | | 100 | % | | 90 onwards |
| Assets leased in leasing agreements – other than real estate | | | 45 | % | | | 0 | | | | 85 | % | | 1-29 | | | 90 | % | | 30-89 | | | 100 | % | | 90 onwards |
| Other collaterals | | | 50 | % | | | 0 | | | | 85 | % | | 1-29 | | | 90 | % | | 30-89 | | | 100 | % | | 90 onwards |
| Rightsin trust guarantees and others | | | 45 | % | | | 0 | | | | 80 | % | | 1-29 | | | 90 | % | | 30-89 | | | 100 | % | | 90 onwards |
| Without collateral or not accepted for local purposes | | | 75 | %(2) | | | 0 | | | | 90 | % | | 1-29 | | | 90 | % | | 30-89 | | | 100 | % | | 90 onwards |
| (1) | Collateral provided to the clients by local government entities named: |
FNG =Fondo Nacional de Garantías. TheFondo Nacional de Garantías, guarantees credit operations up to 70% to financial intermediaries, supporting activities of all economic sectors (except agriculture). The fund guarantees credits destined for working capital, acquisition of fixed assets and in general, financial resources needed by medium and small corporations, only if these resources are invested in productive activities.
FAG =Fondo Agropecuario de Garantías. TheFondo Agropecuario de Garantías guarantees credit operations discounted before FINAGRO, which have been granted in order to finance projects in the agriculture sector.
| (2) | In accordance with External Circular 043 of 2011 issued by SFC, the LGD was increased by 10% for loans without collateral. The Bank decided to apply the same increase for loans with guarantees not accepted as collateral. |
For sovereign collateral, letters of credits and deposits the LGD is zero (0).
In June 2012, the SFC issued the External Circular 026 of 2012, with the purpose of setting the necessary instructions to be followed by financial institutions, in order to establish a new additional allowance for covering the consumer loan’s individual inherent risk, due to the significant increase in the consumer loan portfolio of the Colombian financial institutions. These new requirements came into place in June 2012. This additional allowance is calculated and recorded prospectively only when the rate of growth of past-due loans in the consumer loan portfolio reflects an increased trend according to certain credit risk measures provided by the External Circular. The new additional allowance is equivalent to 0.5% of the individual amount of each loan multiplied by the respective LGD. In July 2012, the Bank has adopted requirements introduced by the External Circular 026 of 2012. As of December 31, 2012, the Bank has accounted for this new allowance the amount of COP 36,894 in the consolidated statement of operations.
Mortgage Residential Loans and Small Business Loans
In compliance with instructions issued by the SFC for mortgage residential loans and small business loans, the Bank must maintain at all times individual allowances corresponding to minimum percentages, which might differ if the loan has any collateral. Up to 70% of the collateral value is considered to repay the principal. There is no reference model issued for this type of loan.
The tables set forth below show the percentages applied on collateral for maintaining individual allowances according to the instructions issued by the SFC:
For Small Business Loans
Past-due | | Percentage | |
0 – less than 12 months | | | 70 | % |
More than 12 months – less than 24 months | | | 50 | % |
More than 24 months | | | 0 | % |
For Mortgage Residential Loans
Past-due | | Percentage | |
0 – less than 18 months | | | 70 | % |
More than 18 months – less than 24 months | | | 50 | % |
More than 24 months – less than 30 months | | | 30 | % |
More than 30 months – less than 36 months | | | 15 | % |
More than 36 months | | | 0 | % |
Allowances are calculated based on the following matrix authorized by the SFC:
| | | Mortgage Residential Loans | |
| | | Principal outstanding | | | Accounts receivables | |
| Risk Rating | | With Collateral | | | Without Collateral | | | |
| A – Normal | | | 1 | % | | | 1 | % | | | 1 | % |
| B – Acceptable | | | 2.20 | % | | | 3.20 | % | | | 100 | % |
| C – Appreciable | | | 60 | % | | | 60 | % | | | 100 | % |
| D – Significant | | | 100 | % | | | 100 | % | | | 100 | % |
| E – Unrecoverable | | | 100 | % | | | 100 | % | | | 100 | % |
Valuation of Mortgage Collateral for Allowance Purposes
Thecurrent fair value of the collateral recorded byor guarantee less the Bankestimated selling costs when applicable.
For loans that are not considered individually significant and for the portfolio of individually significant loans that are not considered impaired, a collective assessment is establishedcarried out. Portfolios of financial assets with similar risk characteristics are grouped together, using statistical techniques based on parameters issued by the SFC:
·In the caseanalysis of mortgage collateral consisting of residential real estate, the fair value shall be the appraisal established when the loan was disbursed and subsequently adjusted on a quarterly basis according to the residential price index published by the National Planning Department.
·In the case of mortgage collateral consisting of premises other than residential real estate, the fair value is updated on a periodic basis when the loan is renewed or impaired.
In October 2011, the SFC issued the External Circular 043 of 2011 with the purpose of setting forth the necessary instructions to be followed by financial institutions in order to determine the fair value of collateral securing loans, as well as the frequency of valuations of collateral. In accordance with these new regulations, all collateral must be valued at least every three years, except those which support mortgage and automobile loans, which must be valued annually. When the current valuation is overdue, the fair value is not consideredhistorical loss experience. The historical losses information losses used in the measurementprocess is adjusted to include the most recent data regarding current economic conditions, the performance trends by industry or region, or the concentration of certain allowances for loan losses as a mitigating factor. These new requirements took effect on June 30, 2012. As a consequenceobligations in each portfolio of the latest valuation the Bank has recognized as expense for allowance for loan losses an additional amount of COP 13,461 for the year ended December 31, 2012.
General Allowance
According to SFC rules, the Bank records a general provision corresponding to 1% of the total value of mortgage and small business loans. The general provision is updated on a monthly basis according to the increases or decreases in the loan portfolio. The general provision may also be increased if approvedfinancial assets by the general stockholders’ at the annual meeting.
Other provisions
The Bank and its subsidiaries Factoring Bancolombia S.A., Leasing Bancolombia S.A. and Tuya S.A. also record other allowances for specific clients in addition to minimum allowances required by the SFC, bearing in mind specific risk factors affecting clients, including macroeconomic, industrysegment, and any other factorsrelevant information that could indicate early impairment.may affect the impaired loss allowance.
At December 31, 2012, and 2011 additional allowances were as follows:
| Type of Loan | | 2012 | | | 2011 | |
| Commercial | | COP | 338,391 | | | COP | 263,535 | |
| Consumer | | | 88,013 | | | | 90,655 | |
| Mortagage | | | 6 | | | | - | |
| Small Business Loans | | | 2,155 | | | | 7 | |
| Total | | COP | 428,565 | | | COP | 354,197 | |
Charge-Offs
In June and DecemberQuantification of each year, the Bank writes off in full, debtors classified as “unrecoverable”,losses based on historical loss experience takes into account three fundamental factors: exposure at default, the following criteria: (i) allowanceprobability of 100% of all amounts past-due (principal, interestdefault and other items); (ii) One hundred and eighty (180) days past-due for consumer and small business loans; (iii) Three hundred and sixty (360) days past-due for commercial loans and (iv) one thousand six hundred and twenty (1,620) days past-due for mortgage loans.
The recovery of charged-off loans is accounted for as income in the consolidated statements of operations.
Troubled Restructured Loans
Loans are troubled restructured loans when the Bank, because of economic or legal reasons related to the debtor’s financial difficulties, grants a concession to the debtor that it would not otherwise consider. Such restructurings can employ different mechanisms in accordance with the regulatory framework to grant that concession to the debtor by modifying the original agreed terms in order to help the debtor to improve its financial conditions before any current or potential impairment of its debt service occurs. Among those mechanisms the Bank can provide an extension of the maturity date.
Troubled restructured loans are accounted for according to the terms of the restructuring agreement, including income accruals. When the agreement includes the capitalization of non-accrued interest previously recorded in memorandum accounts, the interest is recorded by increasing the loan balance with a credit to deferred income in other liabilities and this deferred income is amortized with a credit to income on a cash receipts basis.
In order to calculate the corresponding provisions, the ratings for these loans may be upgraded only when the Bank collects the principal of the loan on a regular basis.
For this purpose, the Bank has defined the following policy:
• Restructured loans rated either B or C, remain in this rating for two months following the date of the restructuring agreement; thereafter, the rating may be improved by one grade when the Bank collects four timely payments.
• Restructured loans rated D or E remain in this rating for four months following the date of the restructuring agreement; thereafter, the rating may be improved to a C rating when the Bank collects two timely payments, to B when the Bank collects four additional consecutive timely payments, and then to A when the Bank collects an additional four timely payments.
Sale of loan portfolios under securitizations process
Loans that are securitized are derecognized as non-recourse credit providing the following conditions are satisfied:loss given default:
| · | LoansExposure at default: This is defined as the current balance of the principal, interest receivable accounts and other receivables regarding consumer and commercial loans at the statement of financial position date. In the case of loans which include a revolving line of credit that is susceptible to be used in its entirety in the form of loan contracts, this parameter includes the Bank’s expectations of future drawdowns even though the corresponding provisions for committed credit lines are transferred exclusively to a special purpose entity (“SPE”).included as liabilities on the statement of financial position. |
| · | Probability of default (PD): This is the probability that the debtor fails to fulfill their obligations of capital and/or interest payment based on information available at each statement of financial position date. The disposal or transferPD estimated for a period of securitized assets shall not be subject to any type of restriction12 months is adjusted by the transferor.loss identification period (LIP) in order to estimate the point in time probability of default at the statement of financial position date as follows: |
| - | The parameter “point-in-time,” which converts the probability of cycle-adjusted default required for regulatory purposes (defined as the average probability of default in a complete economic cycle) to the probability of default on a given date required by IFRS; known as “point-in-time” probability. |
| - | The parameter “loss identification period” (LIP) is the time elapsed between the occurrences of a loss event and the moment in which that loss becomes evident at an individual level. The analysis of LIPs is made based on homogeneous risk portfolios. |
Financial assets are classified as impaired when the loans are typically three months or more past due as well as in cases where there is other objective evidence of impairment.
| · | Loss given default (LGD): This is defined as the loss the Bank would incur in the event of any instance of default. This depends mainly upon the characteristics of the debtor and upon the valuation of guarantees or collateral. |
Once a loan or group of loans is classified as impaired, interest income continues to be recognized using the original contractual interest rate of the loan calculated over the carrying amount less the allowance for loan losses.
The financial assets are derecognized from the balance from the allowance for loan losses when they are considered non-recoverable. The recoveries of financial assets previously discounted are registered as an increase in the allowance for loan losses.
6.8 Debt modification or restructuring process
The debt restructuring is an alternative to achieve a proper collection management. It must be understood as an exceptional resource to standardize the behavior of a portfolio, applied through a legal commitment accomplished previously agreed. Such agreement aims to modify the originally established conditions in order to allow the accurate attention to the debt in the light of the real or potential impairment in the debtor’s payment ability. The debt restructuring is implemented through amendments to the contractual terms, rates and payment terms. In any case, at the restructuring time, all the guarantees must be preserved and if possible, the Bank’s position should be improved by obtaining new guarantees or guarantors that support the obligations.
In the restructuring, real property or personal property can be received as foreclosed assets to cancel partially or totally the obligations. Likewise, the Bank can grant discounts on interest or other as commissions. If necessary, the discount can be applied to debt principal, either because the guarantees or payment sources do not have coverage on total debt or because the agreement does not permit full recovery of the total balance. The terms are reviewed In each negotiation to determine if the client should continue in the portfolio and if so, the terms to restore the business relationship after a certain time.
When the financial asset is modified and withdraws the full original obligation, costs and fees are recognized as part of profit or loss, as well the difference between the value in the balance sheet and the consideration received. In the case in which the modification is not recognized as a cancellation, the costs and fees are adjusted and will be amortized by the remaining life of the modified asset.
Before the restructuring process, the Bank should perform an analysis of the debtor’s projected cash flow in order to evaluate the capacity to pay the proposed plan. Restructuring debts are classified as follows:
Private Agreement
Are those agreed with the client, after negotiations between the two parties, without any legal special scheme adopted by the debtor.
Regulated by the law agreements
These are the result of legal bankruptcy and insolvency procedures or corporate restructuring agreements acquired by the client.
6.9 Written-Off loan portfolio
Written-off loan portfolio will be imposed on the basis of the determination of non-recovery of the principal and receivables from a client or third party. In general, this characteristic will be fulfilled when the following default conditions are presented in the credit portfolio:
Type | | Length of delinquency |
| Consumer | | 180 days. For Tuya Credit Card from 135 days |
| Commercial | | 360 days |
| Small Business Loan | | 180 days |
| Mortgage | | 1.620 days. For Banistmo and Banco Agrícola from 720 days |
Among the reasons for portfolio default, the estimated obligation recovery time must be considered as well as the probable recovery percentage with or without guarantees.
6.10 Leasing
The lease agreements entered into by the Bank are classified at the initial recognition as financial or operating leases.
The Bank classifies a lease as a financial lease when according to the agreement substantially, all the inherent risks and benefits are transferred to the lesee. Otherwise, the lease is classified as an operating lease, which is subject to depreciation charges and classified in the statement of financial position as premises and equipment.
Among the risks transferred are the possibilities of losses through underutilization, technological obsolescence, decrease in profitability or changes in the economic environment. Among the benefits derived from the use are the expectation of profit overthe economic life of the asset and eventually, the appreciation of its residual value or realization of the asset.
The following are indications of transfer of risk and rewards of ownership to the lessee:
| · | The risks and returnslease transfers ownership of the loans must also have been totally transferredasset to the SPE.lessee by the end of the leasing term. |
| · | Under no circumstance shallThe lessee has the transferor conserve discretionary rightsoption to disposepurchase the asset at a price that is expected to be sufficiently lower than the fair value at the date the option becomes exercisable for it to be reasonably certain, at the inception of control, limit, encumber, substitute, reacquire, or use the assets thus transferred or disposed of.lease, that the option will be exercised. |
| · | Portfolio loans sold in securitizations that meetThe lease term is the foregoing criteria are derecognized at their net book value. Any difference arising between the proceedsmajor part of the sale andeconomic life of the bookasset even if title is not transferred. |
| · | At the inception of the lease the present value of the loans is recorded as an income or expense, as applicable, inminimum lease payments amounts to at least substantially all of the consolidated statementsfair value of operations.the leased asset. |
| · | The leased assets are of such a specialized nature that only the lessee has the possibility of using them without making significant modifications. |
If during the lease term, the lessor and the lessee decide to modify the initial conditions, and the agreed changes result in a different classification, then the modified agreement will be considered a new lease with new clauses that will lead to the classification of a financial or operating lease, as appropriate.
6.10.1 The Bank may also retain beneficial interestsas lessee
The assets taken for lease under financial leases are recognized at the lower of the fair value of the leased assets and the present value of the minimum lease payments. Such assets are recognized as properties and equipment in the formstatement of financial position.
The assets leased under financial leases are depreciated throughout their life using the straight line method. However, if there is no reasonable certainty that the Bank will obtain the property at the end of the securitieslease term, the asset is depreciated throughout its life or the lease term, whichever is shorter. The lease payments are divided between interest and debt reduction. The finance charges are recorded in the consolidated statement of income.
The payments for operating leases, including incentives granted, are recognized as expenses in the consolidated statement of income during the lease term.
6.10.2 The Bank as lessor
The assets transferred under financial leases are not recognized as property and equipment since the risks associated with the property have been transferred to the lessee rather,the sum of the minimum payments to be received and any unguaranteed residual value discounted at the lease interest rate is recorded as part of the loan portfolio.
The assets leased under operating leases are recorded as property and equipment. The initial direct costs incurred in the negotiation of an operating lease are added to the carrying value of the leased assets and recorded as a cost during the lease term on the same basis as the lease income. The contingent rents of the leases are recorded as income in the period in which they are obtained.
6.11 Financial liabilities
At initial recognition, the Bank measures its financial liabilities at fair value minus, in the case of a financial liability not at fair value through profit or loss, transaction costs that are directly attributable to the acquisition or issuance of the financial liabilities. Financial liabilities are subsequently measured at fair value through profit and loss or at amortized cost respectively.
Derivative liabilities are measured at fair value through profit and loss. The gains or losses of those liabilities are recognized in the statement of income at the initial recognition and for subsequent measurements. Non-derivative financial liabilities are measured at amortized cost using the effective interest rate. Gains and losses are recognized in the comprehensive statement of income when the liabilities are derecognized, as well as through the process of amortization under the effective interest rate method, which is included as a financial cost.
The compound financial instruments that comprise both a liability and equity component must be separated and accounted for separately. Therefore, for initial measurement, the liability component is determined by discounting future cash flows using the market rate at the date of the issuance (excluding the equity component) and the residual value is assigned to the equity component. Subsequent to initial recognition, the liability component of a compound financial instrument is measured at amortized cost using the effective interest method. The equity component of a compound financial instrument is not re-measured subsequent to initial recognition except on conversion or expiry. The liability component corresponds to the preferred dividend related to 1% of the subscription price, which is the payment of the minimum dividend on the preferred shares for each period in accordance with the Bank’s bylaws.
6.12 Financial guarantee contracts
In order to meet the needs of its customers, the Bank issues financial standby letters of credit and bank guarantees. These are commitments issued by the SPE,Bank to guarantee the performance of a customer to a third party and through servicing fees onare mainly issued to guarantee agreements established between parties from the securitized receivable. The securitized loans may be serviced byenergy sector, private sector and public procurement contracts.
Financial guarantee contracts are initially measured at fair value, which is normally the Bank or by third parties. Currently, when acting asconsideration received, adjusted for the service manager,directly attributable transaction costs incurred. Such contracts are measured at the Bank is responsible for granting concessionshigher of the expected credit loss estimate according to the debtorsmodel described above in point 6.5. “Depreciation of financial assets at amortized cost,” and the amount initially recognized less the accumulated amortization.
Income derived from guarantees is recognized as fees and other service income in the statement of income over the term of the securitized loans and to perform the best effort to sell the foreclosed assets in favor of the structuring.contract.
According to Superitendency of Finance regulations any residual beneficial interest retained by the Bank in a securitization process must be recorded as a held to maturity investment in an amount equal to the value established for the beneficial interest in the balance sheet of the SPE created for such purpose. Before 2008 residual beneficial interests were not recognized. As a result, the Bank recognized residual beneficial interests in 2012, 20116.13. Derivatives and 2010 in investment securities increasing income amounting to COP 43,233; COP 18,692 and COP 19,699, respectively.hedging
(j) Derivatives
Derivatives are defined as agreements between two parties to purchase or sell financial instruments at a future date or agreements where the underlying is an index listed on a stock exchange. The Bank enters into derivative transactions only to facilitate customer business or for hedging purposes but not for speculation, inpurposes. Derivative instruments include forwards, options or swaps where the underlying are exchange rates, interest rates and securities. Derivatives not designated as hedging instruments are measured at fair value through profit or loss, and all changes in the fair value are recognized in the consolidated statements of income.
The Bank recognizes all of its derivativesderivative instruments at initial recognition on its balance sheetstatement of financial position as either assetshedging derivative or liabilities depending onas for trading purposes.
Certain transactions with derivatives that do not qualify to be accounted for as hedging are recorded as trading derivatives, even when they provide an economic hedge for the rights or obligations underrisk management positions.
Hedge accounting
– Fair value hedges are used by the derivatives contracts. All derivatives are measured at fair value; changes in the fair value are recognized currently in the consolidated statements of operations, except theBank, through its Panamanian subsidiary, Banistmo, to protect against changes in the fair value of swap contracts on day oneinvestment securities that are deferredattributable to interest rate variability. Cash flow hedges are used mainly to reduce the variability in cash flows of deposits issued by Banistmo caused by interest rate changes.When the hedging relationship is considered to be highly effective, the changes in value of the hedging derivative are accounted for according to their classification as fair value hedges, cash flow hedges and recognizedhedges of net investment in foreign operations, as set in the consolidated statementsparagraph below.
The Bank assesses at the inception of operationsthe hedge and on a straight linemonthly basis during the life of the contract.instrument, whether the hedge used in the transaction is expected to be highly effective (prospective effectiveness), and considers the actual effectiveness of the hedge on an ongoing basis (retrospective effectiveness). The SFC rules permitBank discontinues the hedge accounting butwhen the Bank does not usehedging instrument expires or is sold, terminated or exercised, the hedge accounting.
Derivativeno longer meets the criteria for hedge accounting or if hedge designation is revoked. When hedge accounting for a fair value measurements are established as follows:
Forward Contracts
Thehedge is terminated the previous adjustments related to the changes in fair value of forward contracts is determined using the standardized methodology issued by the SFC, using the quoted forward price points published by authorized pricing providers and/or authorized brokerage firms that represent a major portion of market liquidity.
Swap Contracts
The fair value of swap contracts is determined using the discounted cash flow method at the interest rates applicable for each flow. Interest rate curveshedged item are calculated based on information provided by Bloomberg and Infoval. Counterparty credit risk on the swap is not includedsubsequently recorded in the valuation process.
Option Contracts
The fair valueconsolidated statement of option contracts is determined usingincome in the Black-Scholes/Merton method.
Spot Transactions
These are transactionssame manner as other components of the carrying amount of that are recorded with a term for their respective clearance equal to the date on which the transaction is recorded or up to three business days beginning on the day after the transaction was completed.
As of December 31, 2012, the Bank has taken the appropriate measures to adopt in 2013 the new requirements introduced by the External Circulars 039 and 050 of 2012 issued by the Colombian SFC, related to investments valuation techniques using a price providers approach. Consequently, the methodologies used by the authorized price providers have been tested in order to select the appropriate price provider.
k) Foreclosed Assetsasset.
The Bank records foreclosed assets usingdocuments at inception the relationship between hedged items and hedging instruments, as well as its risk management objectives and hedging strategies, which are previously approved by the Risk Management Committee as the body designated by the Board of Directors.
Hedge relationships, are classified and accounted for in the following criteria:
| · | Foreclosed real estate is recognized at the amount specified in the foreclosure appraisal or at the price that both parties have agreed on the basis of a valuation by reference to market evidence of transaction prices for similar properties. |
| · | If the amount recognized in the contract for the foreclosed asset is more than the balance of the loan outstanding, that difference is recorded as accounts payable to the debtor. If such amount is insufficient to cover the outstanding loan, the difference must be immediately recorded on the consolidated statements of operations as a non-operating expense. |
| · | Other assets received in payment corresponding to investment securities are valued by applying the criteria indicated in the investment securities accounting policy. |
| · | Profits on credit sales of foreclosed assets are deferred over the life of the credit and are recognized on a cash basis; losses are recognized in the consolidated statements of operations. |
| · | When subsequent to the initial measurement the fair value of the asset is lower than its book value, a provision for the difference is recorded in the consolidated statements of operations. |
| · | Reappraisals of foreclosed assets are recorded as memorandum accounts. |
Legal Term for the Sale of Foreclosed Assetsway:
Financial institutions must sellFair value hedges are designated to protect against the foreclosedexposure to changes in the fair value of recognized assets by a date no later than two years afteror liabilities or unrecognized firm commitments.
Changes in the foreclosure date.
Impairmentfair value of Foreclosed Assets
derivatives that are designated and qualify as fair value hedges are recorded in the statement of income as financial expense or financial income. The SFC requires that a bank record a provision equalchange in fair value of the hedged item attributable to a percentagethe hedged risk is registered as part of the carrying value of the assethedged item, and it is also recognized in the statement of income as expense or income.
For fair value hedges that are related to items accounted for at amortized cost, the adjustments to the carrying value are amortized through the statement of income during the remaining term until their expiry. The amortization of the effective interest rate will be able to begin as long as there is an adjustment to the carrying value of the hedged item, but it will have to begin at the latest when the hedged item is no longer adjusted by changes to its fair value attributable to the risk that is being hedged. The amortization of the adjustments to the carrying value is based on the effective interest rate recalculated on the starting date of the amortization. If the hedged item is derecognized, the non-amortized fair value is recognized immediately in the comprehensive statement of income. If the hedge instrument expires or it is sold, terminated or exercised, or when the hedge no longer meets the criteria for hedge accounting, the Bank discontinues prospectively the hedge accounting. For the items hedged at amortized cost, the difference between the carrying value of the item hedged at the completion of the hedge and the nominal value are amortized using the effective rate method during the time surplus of receipt equalthe original terms of the hedge. If the hedged item is derecognized, the pending value to 60%amortize is recognized immediately in the statement of income.
When an unrecognized firm commitment is designated as a hedged item, the subsequent cumulative change in the fair value of the firm commitment attributable to the hedged risk is recognized as an asset or liability with corresponding gain or loss recognized in the comprehensive statement of income.
– Cash flow hedges are used mainly to reduce the variability related to the cash flows in fair value of the hedged assets or liabilities recognized on statement of financial position or to a highly probable forecast transaction.
The portion of the gain or loss on the hedging instrument that is determined to be an effective hedge is recognized in other comprehensive income. The ineffective portion of the gain or loss on the hedging instrument is recognized in the statement of income.
When the hedging instrument expires or is sold, or when a hedge no longer meets the criteria for real estate and 70% for other foreclosed assets. This provision must behedge accounting, any cumulative gain or loss recorded in straight-line monthly installments within the two years followingstatement of other comprehensive income is recognized in the bank’s receiptstatement of income when the hedged item is recognized in the statement of income.
–Hedges of a net investment in a foreign operation:
In accordance with IFRS 9 ‘Financial instruments’ and IFRIC 16 ‘Hedges of a net investment in a foreign operation’, the Parent Company has decided to apply the hedge accounting of the asset. Once this legal term for sale has expired, the provision must be increased to 80% and 100%, respectively. If an extension of the permitted term to sell the asset is grantedforeign currency risk arising from its net investment in Banistmo, designating as a hedging instrument certain debt securities in issued by the Superintendency,Parent Company. Considering the increase in the provision may be recorded on a monthly basis within the new term.
Also, it is the Bank’s policy,hedge accounting relationship, in the case of real estate foreclosed assetsthe net investment, the gain or loss derived from the foreign exchange differences related to the debt securities that remain for more than five yearsis determined to be an effective hedge is recognized in the Bank’s possession to increase the provision up to 100% of its book value. Foreclosed assets under commitment agreements to sell are excluded from this practice.
(l) Loan Fees
Loan origination and commitment fees,other comprehensive income, as well as direct loan originationthe currency translation adjustment of the Banistmo operation into the presentation currency as required by IAS 21 as detailed in F.2. ‘Functional and commitment costs, are recorded in the consolidated statements of operations as earned and as incurred.presentation currency’.
(m)7. Premises and Equipmentequipment
Premises and equipment include tangible items that are held for use for rental to others, or for administrative purposes and are expected to be used during more than one period.
Items of premises and equipment are recorded at the cost of acquisition, including directless accumulated depreciation and indirect costs and expenses incurred in their construction plus the inflation adjustment recorded until 2001 for premises and equipment purchased before that year.
impairment losses. Depreciation is calculated on ausing the straight-line basismethod over the estimated useful lifelives of the asset.assets. The annual depreciation ratesdepreciable amount is the cost of an asset less its residual value. The estimated useful lives for each asset itemgroup are:
Asset group | | Useful life range |
| Buildings | | 10 to 75 years |
| | |
| Furniture and fixtures | | 5 | % to 20 years |
Equipment, furniture and fittings | | | 10 | % |
| Computer equipment | | 3 to 20 years |
| | 20 | % |
| Equipment and machinery | | 3 to 40 years |
| | |
| Vehicles | | | 20 | % |
Monitors, laptops and CPUs | | | 33 | %3 to 6 years |
The net bookassets’ residual values and useful lives are reviewed, and adjusted if appropriate, at the end of each reporting period. When there is a significant change, the depreciation and the charge to the statement of income are adjusted based on the new estimation.
Assets classified as premises and equipment are subject to impairment tests when events or circumstances occur indicating that the carrying amount of the assets may not be recoverable
An impairment loss is recognized for the amount by which the asset’s carrying amount exceeds its recoverable amount and is recognized in the statement of income as ‘Other assets impairment’.
When the carrying value exceeds the recoverable value, the carrying value is adjusted to its recoverable value, modifying the future charges for depreciation, according to its new remaining useful life.
In a similar way, when indications exist that the value of land and buildings (cost less accumulated depreciation) is compared against fair values taken from independent professional appraisals. Ifan asset has been recovered, the fair value is higher, the difference is recorded as a “Reappraisal of Assets” with a credit to the “Surplus for Reappraisal of Assets” in Stockholders’ Equity; otherwise, the difference is charged to expenses as provision for other assets of the period. This provision may be reversed in future periods if the fairrecoverable value of the asset increases. Appraisals mustis estimated and recognized in the statement of income, registering the reversion of the impairment loss in previous periods, and consequently the future charges for the asset’s depreciation are adjusted. In any case, the reversion of the impairment loss of assets cannot increase its carrying value above the amount that it would have if impairment losses in previous periods had not been recognized.
For the purposes of assessing impairment, assets are grouped at the smallest identifiable group that generates cash inflows that are largely independent of the cash inflows from other assets or groups of assets (cash-generating units). The evaluation can be updatedcarried out at least every three years.individual asset level when the fair value less the cost of sale can be reliably determined and the value in use is estimated to be close to its fair value less costs to sell and fair value less costs to sell can be determined
(n) Prepaid Expenses, Deferred Charges
Amortization of prepaidMaintenance expenses and deferred charges is calculated from the date on which they first contribute to the generation of income, based on the following factors:
Prepaid Expenses
Prepaid expenses mainly include monetary items: prepaid interest is amortized monthly during the period prepaid; insurance, over the life of the policy; rent, over the period prepaid;premises and equipment maintenance, over the life of the contract; and other prepaid expenses, overare recognized as a cost in the period in which servicesthey are received or costsincurred and expenses are incurred.registered in the consolidated statement of income as other administrative and general expenses.
Gains and losses in the sale of premises and equipment are registered in the consolidated statement of income asDeferred Chargesother incomeorother expenses.
| ·8. | Stationery is expensed when consumed.Investment properties |
Land and buildings that the Bank holds to earn rentals or for capital appreciation or both rather than for their use in the supply of services or sale in the ordinary course of business are recognized as investment properties.
The investment properties are measured initially at cost, including the transaction costs. The carrying value includes the cost of replacement or substitution of a part of an investment property at the time in which the cost is incurred, if the cost meets the recognition criteria; and it excludes the daily maintenance costs of the investment property.
After the initial recognition, the investment properties are measured at fair value which reflects the market conditions at the statement of financial position date. The gains and losses that arise from changes in the fair values of investment properties are included in the statement of income as ‘Other income’.
The investment properties are derecognized, either at the moment of their disposal, or when they are permanently withdrawn from use and no future economic benefits are expected. The difference between the net disposal proceeds of the asset and the carrying value is recognized in profit or loss in the period the disposal occurs.
Transfers to or from the investment properties are only made when there is a change in its use. For a transfer from an investment property to fixed assets, the cost taken into account for its subsequent accounting is the fair value at the time of the change in use. If a fixed asset becomes an investment property, it will be accounted for by its fair value.
| ·9. | The discount on the issuance of long-term debt is amortized over the term of the debt on a straight-line basis.Intangible assets |
An intangible asset is an identifiable non-monetary asset with no physical appearance. Separately acquired intangible assets are measured initially at their cost. The cost of intangible assets acquired in business combinations is their fair value at the date of acquisition. After the initial recognition, the intangible assets are accounted for at cost less any accumulated amortization and any accumulated impairment loss. The costs of internally generated intangible assets, excluding the costs from development that meet the recognition criteria, are not capitalized and the expense is reflected in the statement of income as it is incurred.
The useful lives of intangible assets are determined as finite or indefinite. The intangible assets with finite useful lives are amortized using the straight-line method over their estimated useful lives. The Bank assesses its intangible assets in order to identify whether any indications of impairment exist, as well as possible reversal of previous impairment losses. The amortization period and the amortization method for intangible assets with a finite useful life are reviewed at least at the close of each period. The expected changes in the useful life or in the pattern of consumption of the future economic benefits of the asset are accounted for when changing the period or amortization method, as appropriate, and they are treated as changes in the accounting estimates. The amortization expense of intangible assets with finite useful lives is recognized in the statement of income. The useful lives of the intangible assets with finite life ranges between 1 and 10 years.
Intangible assets with indefinite useful lives are not subject to amortization, but are periodically tested in order to identify any impairment, either individually or at the cash-generating unit level. The assessment of the indefinite life is reviewed annually to determine if it continues being valid.
The gain or loss that arises when an intangible asset is derecognized are measured as the difference between the disposal value and the carrying value of the asset, and is recognized in the statement of income.
| ·10. | ContributionsResearch and memberships are amortized over the period prepaid.development costs |
The research costs are recorded as expenses as they are incurred. Costs directly related to the development of a stand-alone project are recognized as intangible assets when the following criteria are met:
| ·– | The Bank has been implementing a major projectIt is technical feasible of to renew its technological infrastructure, named Innova. Accounting guidelines incomplete the case of the Innova project are as follows:intangible asset so that it will be available for use or sale; |
| (a)– | Software licensesManagement intends to complete the intangible asset and feesuse or sell it; |
| – | There is an ability to use or sell the intangible asset; |
| – | It can be demonstrated how the asset will generate probable future economic benefits; |
| – | Adequate technical, financial and other payments that directly relateresources to softwarecomplete the development and to use or sell the intangible asset are deferredavailable; and then amortized over a period of 36 months, from the date when the software begins to be used in the Bank’s operations. The invoices that amounted to less than COP 50 have been recognized as an expense on an accrual basis amounting to COP 6,532 at December 31, 2012. |
| (b) | Payroll for employees directly associated with the project is recorded as an expense on an accrual basis. |
| (c)– | The fees not directly relatedexpenditure attributable to softwarethe intangible asset during its development and other indirect costs (gap analysis, training, replacing internal resources, etc) are recorded as an expense on an accrual basis.can be reliably measured. |
| · | Software licenses and fees and other payments greater than COP 120 that directly relate to software development, other than the Innova project, are deferred and then amortized over a period of 12 months, from the date when the software begins to be used in the Bank’s operations. Payments less than COP 120 are recorded as an expense in operations as expensed as incurred. |
| · | During 2010, new regulations required Colombian companies to calculate Equity tax only once for the next four years as of January 1, 2011 and payable in 8 semi-annual installments over four years without interest. The amount computed, was recorded as a deferred asset to be amortized against the balance of local special account named “Revaluation of equity” in the stockholders’ equity (which was originated when in the past companies recorded inflation adjustments) on a straight line basis over the four year period beginning with 2011, if the balance in this account is insuficient to cover the amount of the equity tax, the difference is recorded as expense in the consolidated statements of operations. The equity tax calculated by the Bank and its subsidiaries amounts to approximately COP 469,002. As of December 31, 2012 and 2011, the Bank has amortized COP 99,051 and COP 105,324, respectively, against equity and COP 18,160 and COP 12,097, respectively, has been included in the line “Administrative and other expenses” in the consolidated statements of operations. |
(o) Premises and Equipment Held under Operating Leases
The subsidiaries Leasing Bancolombia S.A., Renting Colombia S.A., Arrendamiento Operativo CIB S.A.C. (formerly Renting Perú), Fondo de Inversión en Arrendamiento Operativo Renting Perú and Arfinsa lease assets under operating leasing arrangements. Assets under operating leases are recorded at cost. Equipment other than vehicles is fully depreciated over the shorter of the lease term or its useful life.
Depreciation on vehicles under operating leasing arrangements is as follows:
1. Residual values of vehicles are established on a technical basis.
2. For vehicles purchased before December 31, 2009, their cost less their residual value is depreciated over a useful life of five years.
3. For vehicles purchased since January 1, 2010, their cost less their residual value is depreciated over the lease term.
4. When the lease agreement is renewed or the vehicle is received and placed under a new lease agreement, the new residual value is established and this book value less the new residual value is depreciated over the new lease term.
(p) Goodwill
The value of the goodwill acquired is determined once the Bank effectively obtains control over the acquired entity in an amount equal to the difference between the price paid and the net book value of the assets and liabilities acquired. Goodwill must be allocated to each of the business segments acquired and must be fully identified in the accounting records.
Since January 2008, goodwill recorded in the Group Banagrícola acquisition has been amortized on a straight-line basis over 20 years since the Bank considers this method properly reflects the pattern in which the future economic benefits are expected to be received.
In the casestatement of goodwill acquired byfinancial position, the Bankrelated capitalized costs are recorded at cost less accumulated depreciation and its subsidiaries before 2008accumulated impairment losses.
Costs are capitalized during the amortization term was ten yearsapplication development stage and three yearsamortized on a straight line basis since the beginning of the production stage over the period of expected future economic benefits. During the development period, the asset is subjected to annual impairment tests to determine if impairment indications exists. The research and development costs that do not qualify for goodwillcapitalization are recorded as expenses in the subsidiaries Banagrícola S.A. and Inversiones Financieras Banagrícola S.A., respectively. Goodwill fromincome of the acquisition of Renting Colombia is being amortized by Leasing Bancolombia S.A. over a period of five years on a straight-line basis.period.
Goodwill allocated to a business segment is tested for impairment annually, comparingThe Bank’s intangible assets comprise mainly intangibles of finite useful life: computer programs and applications, the fair valuelegal stability agreement signed with the bookMinistry of Finance and Public Credit, customer relationships and patents.Intangibles of indefinite useful life comprise Goodwill
10.1 Expenses paid in advance
The Bank registers the value of the business segments.
(q) Reappraisals of assets
This account records the excess over net book value of real estate properties and available for sale investments with a low trading volumeprepaid expenses which it incurs in the market or for non-listed investments,development of its business with a credit to the “Reappraisalpurpose of Assest” accountreceiving services in the Stockholders’ Equity.
Valuations are subject to the accounting policy for each type of asset.
(r) Trusteeships
Net assets put in trust under trust agreements are recorded in other assets at their book value. This account is adjusted periodically by the equity share of the Bank in the trust.
(s) Deferred Income
This account records deferred income and income received in advance in the course of business. Amounts recorded in this accountfuture.Prepaid expenses are amortized overduring the period to which they relate or in which the services are renderedreceived or the costs or expenses are recorded.
The inventories of returned goods are those assets that come from an early termination of a lease (returned goods) or those upon which the lease has already concluded (premises and equipment), which are expected to be sold in the normal course of business. These are controlled by the Bank and are expected to generate future economic benefits.
The inventory of returned goods is recognized as an asset from the date in which the Bank assumes the risks and benefits of the inventories. The cost of it can be reliably measured and it is probable that it will generate future economic benefits.
The inventories of returned goods are valued using the specific identification method and their costs include the carrying value at the time the asset is returned.
The carrying values of returned goods is measured at the lower of the leasing agreement and the net realizable value (NRV). The net realizable value is the estimated selling price in the ordinary course of business less its estimated costs to make the sale. The adjusted amount in the carrying value to reach the net realizable value, is recognized in the statement of income of the period in which the goods are returned. The value of any reversion that comes from an increase in the net realizable value in which the increase occurs is recognized as a lower expense in the period.
When the inventories of returned goods are sold, their carrying value is recognized as a cost in the period in which the goods are sold.
Other inventories than returned goods are measured initially at acquisition cost which comprises the sum of the purchase price, the import costs (if applicable), the non-recoverable taxes paid, the storage, the transport costs, and other attributable or necessary costs for their acquisition, less discounts, reductions or similar items. Those inventories do not include selling costs.
The Bank must review the NRV2 of its inventories, at least annually or whenever necessary by market conditions. Any write-down adjustment must be recognized directly in the statement of income.
| 12. | Non-current assets held for sale and discontinued operations |
Non-current assets and disposal groups are classified as held for sale if their carrying value will be recovered through a sale transaction, rather than through continuing use. These assets or groups of assets are shown separately in the statement of financial position at the lower of their carrying value and their fair value less costs to sell and they are not depreciated nor amortized from the date of their classification.
The held for sale condition is met if the assets or group of assets are available, in their current condition, for immediate sale and the sale transaction is highly probable and is expected to be completed within the year following the date of classification.
The Bank and its subsidiaries perform the measurement of the assets held for sale at the statement of financial position date. However these assets are evaluated quarterly if exist impairment indicators that imply review of the carrying value recorded in the accounts. If those indications are identified, impairment losses are recognized for the difference between the carrying and recoverable amount of an asset as ‘Other assets impairment’ in the statement of income.
A discontinued operation is a component of an entity that has been disposed of, or is classified as held for sale and, represents a separate major line of business or a geographical area of operations, is part of a single coordinated and individual plan to dispose a separate major line of business or geographical area of operations or is a subsidiary acquired exclusively with a view to resale.
Income and expenses coming from a discontinued operation must be disclosed separately from those coming from continued operations, in a single item after the income tax, in the consolidated statement of income even though the Bank retains a non-controlling interest in the subsidiary after the sale.
| 13. | Impairment of non financial assets, cash-generating units and goodwill |
The Bank evaluates whether there is any indication that on a stand-alone basis, cash-generating units are impaired at the end of each period. If some indication of impairment does exist, the Bank estimates the recoverable amount of the assets and the loss by impairment. Regardless of whether impairment indicators exist, goodwill must be tested annually for impairment.
2 Net realizable value= Fair value less selling costs
If an asset does not generate cash flows that are independent from the rest of the assets or group of assets, the recoverable amount is determined by the cash-generating unit to which the asset belongs.
A cash-generating unit is the smallest identifiable group of assets that generates cash inflows, that are largely independent of the cash inflows from other assets or groups of assets.
14.1 Short term benefits
The Bank grants to its employees short term benefits such as bonuses, salaries, accrued performance costs and social security that are expected to settled wholly within 12 months. Expenses related to these benefits are recognized over the period in which the money is collected inemployees provide the case of profits obtained fromservices to which the sale of foreclosed assets on credit agreements.payments relate.
The capitalization of yields on restructured loans that have been recorded in memorandum accounts or as charged off loan balances are included in this category as indicated in this note under loans and financial leases.
(t) Deferred Tax
Deferred tax assets or liabilities must be recorded for all temporary differences raised in the current period based on consolidated statement of operations when comparing the amount of recognized income and expenses for accounting and tax purposes. Until 2011 the Bank did not recognize deferred tax assets. However, starting in 2012, taking into consideration the accounting rules applicable to financial institutions in Colombia in order to associate more accurately, in the current period, the tax effect that certain accounting items would have in future periods according to practices that have been observed in financial institutions in Colombia duly accepted by the SFC, the Bank recorded a deferred tax asset for a total amount of COP40,243, impacting the consolidated statements of operations in such amount only for the temporary differences between financial and tax bases arising since 2012.
(u) Legal Retirement Pensions
Under Colombian law,14.2 Other long term employee pension obligations are managed as a defined contribution plan since 1990. The Bank’s legal retirement benefit obligation as of December 31, 2012 and 2011 relates to retired employees who rendered services to the Bank before the current regulations took effect. Retirement pension liabilities are calculated on an actuarial basis. The actuarial liability is amortized on a straight line basis over periods defined by local rules in accordance with Decree 4565 of 2010, which requires a distribution of charges to amortize the actuarial calculation by 2029. The Bank’s pension liability as of December 31, 2012 was fully amortized.
(v) Estimated Labor Liabilities
Other legal estimated labor liabilities are recorded based on applicable legislation and current labor agreements.benefits
In addition to legal benefits, the Bank grants to its employees other benefits such as retirement and seniority bonuses. Both liabilitiesThey are calculated on an actuarial basis, accruedpayments (different from post-employment benefits and recognizedtermination benefits) whose payment is not expected within the 12 months following the end of the annual period in which the consolidated statementsemployees have rendered their services. These benefits are projected up to the date of operations.payment and are discounted through the Projected Unit Credit method.The cost of long term benefits is allocated across the period from the time the employee entered into employement with the Bank and the expected date of obtaining the benefit.
(w) Long-Term Debt14.3 Pensions and other post-employment benefits
Long-term debt consists of bonds issued by the Bank, which are recognized at amortized cost.
The discount on issuance of bonds is recognized as deferred charge and amortized using the straight-line method over the maturity period.
(x) Other Accrued Expenses
| - | Defined contribution plans |
The Bank records provisions to cover estimated liabilities, suchrecognizes contributions due in respect of the accounting period in the statement of income. Any contributions unpaid at the statement of financial position date are included as fines, sanctions, litigation and lawsuits, provided that the Bank has acquired a right, and therefore has an obligation; and the liability is probable, justifiable, quantifiable and verifiable.liability.
This account also records estimates for taxes and labor expenses calculated as indicated above.
(y) Additional paid-in capital
Additional paid-in capital consists of the excess paid by an investor over the par-value price of a stock issued. For the public offerings of preferred shares offered by the Bank exclusively outside of Colombia in the form of American Depositary Shares (“ADSs”), the discount contained in an underwriting agreement is recognized as a deduction from the additional paid-in capital.
(z) Other Income, Costs and Expenses
Other income, cost and expensesThey are recognized on an accrual basis.
Loan origination costs are recorded in the consolidated statements of operations when incurred. The Bank has not implemented a policy of collecting commissions on the origination of the loans, and the commissions that it collects from credit cards are recorded in the income accounts using the accrual method.
Profits in leaseback transactions of real estate with a real estate investment fund, after duly evaluating the legal and economic aspects of the transaction are recorded in the consolidated statement of operations.
(aa) Memorandum Accounts
Contingent accounts record operationspost-employment benefit plans in which the Bank acquires rightshas the legal or assumes obligations conditioned by possible or remote future events. They also include financial income accrued on nonaccrual assetsimplicit obligation to take responsibility for the payments of benefits that have remained in the loan portfolio and financial leasing operations.its charge.
| 15. | Provisions and contingent liabilities |
Contingencies including fines, sanctions, litigation and lawsuits
Provisions are evaluated by the Bank’s Legal Department and its legal advisors. Estimating loss contingencies necessarily implies exercising judgment. In estimating loss contingencies regarding pending legal proceedings againstrecorded when the Bank legal counsel evaluates, among other aspects,has a present obligation (legal or constructive) as a result of past events, it is probable that an outflow of resources embodying economic benefits will be required to settle the meritsobligation, and a reliable estimate can be made of the case, the case law of the courts in question and the current status of the individual proceedings.
If this evaluation reveals the probability that a loss has occurred and the amount of the liability can be estimated, then this is duly recorded inobligation.
Provisions are determined by the financial statements. If the evaluation reveals that a potential loss is not probable, or the outcome either is uncertain or probable but the amountmanagement’s best estimate of the loss cannot be estimated, thenexpenditure required to settle the nature ofpresent obligation at the corresponding contingency is disclosed in a note to the financial statements along with the probable estimated range of the loss. Loss contingencies that are estimated as being remote are not disclosed, except when a remote contingency is required by a regulator.
Memorandum accounts also record third party operations whose nature does not affect the financial situation of the Bank. Contingent and memorandum accounts are included in the caption “memorandum accounts” of the balance sheet. This also includes tax memorandum accounts that are used in preparing income tax returns, as well as all those internal control or management information accounts and reciprocal transactions carried out between the Bank and its Subsidiaries.
(ab) Net Income per Share
To determine net income per share, the Bank uses the weighted average of Preferred and Common Shares outstanding during the accounting period. During the years ended on December 31, 2012 and 2011, the Bank’s weighted average of Preferred and Common Shares outstanding were 845,531,918 and 787,827,003, respectively.
(ac) Insurance Liabilities
Actuarial liabilities
Actuarial liability for long term individual life insurance is calculated based on mortality tables, interest rates and actuarial formulas for each type of insurance.
The interest rate used in calculating the liability is the rate used to calculate the premium of the life insurance contract according to each type of insurance.
Premiums
Premiums on short-duration insurance contracts are deferred and amortized against income on a straight-line basis during the insurance contract life.
Liability for incurred but not reported claims
The liability for incurred but not reported claims (“IBNR”) is calculated as the average value of payments made by claims over the last three years but not reported in the year they occurred.
Salvage and Recovery
This item records all those revenues received from salvaging goods subject to claims for which the insurance company has paid to its clients the corresponding indemnities.
(ad) Business Combinations
Business combinations are recorded as follows: (i) the assets acquired and the liabilities assumed are recorded at book value, (ii) the consolidated statements of operations of the acquiring company for the period in which a business combination occurs includes the income of the acquired company as if the acquisition had occurred on the first dayend of the reporting period and (iii)it is discounted using discount rates based on a review of Colombian sovereign bond yields (TES rate3). The corresponding expense of any provision is recorded in the costs directly related to the purchase business combination are not considered as a costcomprehensive statement of income, net of all expected reimbursement. The increase of the acquisition, but deferred and amortized over a reasonable period as determined by Bank management.
However, the Conavi and Corfinsura acquisition which occurred in 2004 was accounted for using the pooling of interests methodprovision due to the fact that the combination was between entities under common control.
(3) Transactions in Foreign Currency
Colombian regulations define the limit on the amounttime value of foreign-currency assets and liabilitiesmoney is recognized as 20% of the Bank’s Technical Capital. As of December 31, 2012 and 2011, the Bank was in compliance with these regulations.
Substantially all foreign currency holdings are in U.S. Dollars. The consolidated foreign currency assets and liabilities of the Bank at December 31, 2012 and 2011, converted to USD based on exchange rates in effect at the respective balance sheet dates, were as follows:
| | | 2012 | | | 2011 | |
| | | | | | | |
| Assets: | | | | | | | | |
| Cash and due from banks | | USD | 1,535,023 | | | USD | 961,307 | |
| Funds sold and securities purchased under agreements to resell | | | 323,515 | | | | 465,687 | |
| Investment securities | | | 1,381,185 | | | | 1,027,664 | |
| Loans, net | | | 8,980,925 | | | | 8,493,153 | |
| Customers’ acceptances and derivatives | | | (3,669,142 | ) | | | 701,136 | |
| Accounts receivable | | | 130,295 | | | | 126,208 | |
| Premises and equipment, net | | | 103,391 | | | | 122,571 | |
| Other assets | | | 612,149 | | | | 628,748 | |
| Total foreign currency assets | | USD | 9,397,341 | | | USD | 12,526,474 | |
| Liabilities: | | | | | | | | |
| Deposits | | | 6,556,833 | | | | 5,597,488 | |
| Bank acceptances outstanding and derivatives | | | (3,237,743 | ) | | | 1,393,734 | |
| Borrowings from development and other domestic banks | | | 32,443 | | | | 37,333 | |
| Interbank borrowings | | | 1,020,040 | | | | 2,126,378 | |
| Long term-debt | | | 4,002,558 | | | | 2,744,130 | |
| Other liabilities | | | 284,043 | | | | 367,505 | |
| Total foreign currency liabilities | | | 8,658,174 | | | | 12,266,568 | |
| Net foreign currency asset position | | USD | 739,167 | | | USD | 259,906 | |
At December 31, 2012 and 2011, the net foreign exchange proprietary trading assets amounted to USD 159,067 and USD 146,013 respectively, which met the legal requirements.
At December 31, 2012 and 2011, foreign currency of foreign subsidiaries represents 75.64% and 82.86% respectively, of the consolidated assets in foreign currency and 74.82% and 83.98% respectively, of the consolidated liabilities in foreign currency.
(4) Cash and Due from Banksa financial expense.
The balancesamounts recognized in the statement of cash and due from banks consistedincome, correspond mainly to:
| - | Provisions for loan commitments and financial guarantee contracts; and |
| - | Provisions for legal proceedings, classified as probable to bedecided against the Bank. |
3It refers to the yield interest rate of the following:
| | | 2012 | | | 2011 | |
| | | | | | | |
| Colombian peso denominated: | | | | | | | | |
| Cash | | COP | 2,924,600 | | | COP | 2,798,716 | |
| Due from the Colombian Central Bank | | | 1,424,925 | | | | 2,019,340 | |
| Due from domestic banks | | | 73,768 | | | | 126,735 | |
| Remittances of domestic negotiated checks in transit | | | 7,178 | | | | 6,496 | |
| Allowance for cash and due from banks | | | (729 | ) | | | (511 | ) |
| Total local currency denominated | | | 4,429,742 | | | | 4,950,776 | |
| | | | | | | | | |
| Foreign currency denominated: | | | | | | | | |
| Cash | | | 178,935 | | | | 135,597 | |
| Due from the Colombian and El Salvador Central Bank | | | 583,959 | | | | 556,212 | |
| Due from foreign banks | | | 1,856,232 | | | | 1,128,905 | |
| Remittances of foreign negotiated checks in transit | | | 95,174 | | | | 46,845 | |
| Allowance for cash and due from banks | | | (27 | ) | | | (28 | ) |
| Total foreign currency denominated | | | 2,714,273 | | | | 1,867,531 | |
| Total cash and due from banks | | COP | 7,144,015 | | | COP | 6,818,307 | |
(5) Investment Securities
Investments in trading securities consisted of the following:
| | | 2012 | | | 2011 | |
| | | | | | | |
| Trading Securities | | | | | | | | |
| | | | | | | | | |
| Colombian peso denominated: | | | | | | | | |
| Colombian government | | COP | 5,582,574 | | | COP | 2,890,170 | |
| Government entities | | | 29,559 | | | | 32,244 | |
| Financial institutions | | | 365,234 | | | | 570,825 | |
| Corporate bonds | | | 59,899 | | | | 69,452 | |
| Equity securities | | | 315,325 | | | | 293,687 | |
| Total local currency denominated | | | 6,352,591 | | | | 3,856,378 | |
| | | | | | | | | |
Foreign currency denominated: | | | | | | | | |
| Colombian government | | | 179,074 | | | | 135,350 | |
| Foreign governments | | | 124,361 | | | | 1,386 | |
| Financial institutions | | | 65,280 | | | | 5,861 | |
| Corporate bonds | | | 86,831 | | | | 751 | |
| Equity securities | | | 11,766 | | | | 12,077 | |
| Total foreign currency denominated | | | 467,312 | | | | 155,425 | |
| Total trading securities | | | 6,819,903 | | | | 4,011,803 | |
| Allowance for trading securities | | | (1,271 | ) | | | (5,245 | ) |
| Total trading securities, net | | COP | 6,818,632 | | | COP | 4,006,558 | |
The foreign currency denominated securitiessecured bonds issued or secured by the Colombian government (TES).
Possible obligations that arise from past events and whose existence will be confirmed only by the occurrence or non-occurrence of one or more uncertain future events, not wholly within the control of the Bank, or a present obligation that arise from past events but are bonds denominatednot recognized because it is not probable, that an outflow of resources embodying economic benefits will be required to settle the obligations. or the amount of the obligations cannot be measured with sufficient reliability are not recognized in the financial statement but instead are disclosed as contingent liabilities, unless the possibility of an outflow of resources embodying economic benefits is remote, in which case no disclosure is required.
Possible assets that arise from past events whose existence will be confirmed only by the occurrence or non-occurrence of one or more uncertain future events, not wholly within the control of the Bank, are not recognized in the financial statement; instead are disclosed as contingent assets where an inflow of economic benefits is probable. When the realization of income is virtually certain, then the related asset is not a contingent asset and its recognition is appropriate.
| 16. | Customer loyalty program |
The Bank maintains a credit card loyalty program to provide incentives to its customers. The program allows customers to purchase goods and services, based on the exchange of awards point called “miles”, which are awarded based on purchases with the Bank's credit cards and the fulfillment of certain conditions established in such program. Miles redemption for prizes is carried out by a third party. According to IFRIC 13, the expenses of the Bank's commitments with its clients arising from this program are recognized as a lower value of the fee and other serviceincome, considering the total number of points that can be redeemed over the accumulated prizes and taking into account the probability of redemptions.
Revenue is recognized to the extent that it is probable that the economic benefits flow to the Bank and that the revenue can be measured reliably.
| 17.1 | Interest and revenues and expenses |
For all financial instruments measured at amortized cost, interest revenues are recognized using the effective interest rate. The effective interest rate is the rate that exactly discounts future estimated cash flows payments through the expected life of the financial instrument or, when appropriate, a shorter period to the net carrying value of the financial liability or asset The computation takes into account all the contractual conditions of the financial instrument (for example, prepayment options) and includes incremental fees or expenses that are directly attributed to the instrument and are an integral part of the Internal Rate of Return (IRR), but not future credit losses.
For debt securities at fair value, gains and losses arising from changes in fair value are included in the statement of income as ‘Interest and valuation on investments’
| 17.2 | Commissions and others |
The Bank charges commissions received from the services it offers to its clients. Revenue from commissions can be split into the following two categories:
| - | Revenue from commissions obtained from the services that are provided for a certain period of time. |
These are commissions earned from the provision of services for a certain period of time. These payments include revenue from commissions and assets management, custody and other administration and consulting commissions.
Commissions from loan commitments that are likely to be used and other payments related with the credit are deferred (along with any incremental expense) and recognized as an adjustment to the statement of income. When it is not possible to demonstrate the likelihood that a loan will be used, the commissions from the origination of the loan are recognized during the commitment period on a straight line basis.
| - | Transaction services revenue |
Fees arising from the negotiation or participation in the negotiation of a transaction for a third party, such as the acquisition of shares or other securities or the purchase or sale of businesses, are recognized at the end of the underlying transaction. Commissions or fee components that are linked to a specified performance are recognized after the corresponding criteria are met.
For the portfolio investments that are not associates and where the Bank has no significant influence, dividends are recognized when the right to payment of the Bank is established, which is generally when the stockholders meeting declares the dividend.
The income derived from commercial operations (trading) includes all profits and losses from variations in the fair value and revenue or expenses for related interests from financial liabilities or assets. This includes any inefficiency registered in the hedging transactions.
| 18. | Income tax – CREE and deferred tax |
The provision for income tax consists of two components: current tax and deferred tax.
Current tax corresponds to income taxes and CREE payables during the taxable period, pursuant to the tax regulations and rates in force in Colombia and in each of the countries where the subordinate companies are domiciled.
Deferred tax assets and liabilities are based upon the temporary differences arising from the future estimate of tax and accounting effects attributable to differences between assets and liabilities shown in the statement of financial position and its tax base; as well as on temporary differences in the income statement for the realization for tax and accounting purposes in different periods.
Measuring assets and liabilities for deferred taxes is performed according to the tax rates of each country's tax laws that is expected to apply at the time of recovery (settlement) of the amount on the asset (liability) ledgers that have been recorded in the entity's statement of financial position.
The future effects of changes in tax laws or tax rates are recognized in the deferred taxes as from the date of publication of the law providing for such changes.
Deferred tax assets are recorded due to deductible temporary differences or offsets, provided that Grupo Bancolombia is likely to have net income in later periods with which such deductible temporary differences may be reverted.
Tax credit from fiscal losses and excess amounts from the presumptive income on the net income is recognized as a deferred asset, provided that it is likely that the entity will generate future net income to allow their offset.
Deferred tax is recognized in the income statement, except when it refers to values recognized directly in Other Comprehensive Income account in the equity.
Grupo Bancolombia performs periodical assessments of positions taken on tax statements with respect to situations in which the applicable tax regulation is subject to interpretation and adjusts the recorded amounts, as applicable, based on the amounts expected to be paid to tax authorities.
Regulatory changes in tax laws and in tax rates are recognized in the income statement in the deferred or in the income tax heading in the period when such regulatory change becomes enforceable. Sanctions imposed for discussions and their interest are recognized in the income statement in the heading referred as general and administrative expenses.
In connection with national taxes, Bancolombia and its subordinate companies are under Colombian tax regulations. In the case of companies based in El Salvador, Peru and Panama (only applicable to Banistmo and its subordinate companies), the applicable taxes are calculated considering the tax laws of each respective country where the company is located.
The asset and liability for the deferred tax is deemed as a critical accounting policy, as its determination includes estimates of profit, future income and expenses that may be impacted by changes in the country economic conditions, ongoing regulatory changes, different interpretations of regulations on the part of taxpayers and tax authorities and, in addition, the rates that are applied, which are variable along the time.
Operating segments are defined as components of the Bank for which separate financial information is available that is regularly used by the chief operating decision maker in deciding how to allocate resources and assessing performance.
The Bank manages and measures the performance of its operations through the operating segments using the same accounting policies described in the summary of significant accounting policies described in Note 2.
The basic earnings per share are calculated by dividing the result for the period attributable to the controlling interest by the weighted average number of ordinary shares in circulation during the period.
To calculate diluted earnings per share, the result for the period attributable to ordinary equity holders, and the weighted average number of shares in circulation is adjusted by the dilutive effects inherent to potential ordinary shares.
NOTE 3. OPERATING SEGMENTS
Operating segments are defined as components of an entity about which separate financial information is available that is evaluated regularly by the Board of Directors, who is the chief operating decision maker (CODM) in deciding how to allocate resources and assessing performance. The segment information has been prepared following the Bank’s accounting policies and presented consistently with the internal reports provided to the CODM as described in the summary of significant accounting policies, see Note 2.
The CODM uses a variety of information and key financial data on a consolidated basis to assess the performance and make decision regarding the investment and allocation of funds, such as:
| · | Net interest margin (Net margin on financial instruments divided by average interest-earning assets) |
| · | Return on average total assets (Net income divided by average total assets). |
| · | Return on average stockholders’ equity |
| · | Efficiency ratio (Operating expenses as a percentage of interest, fees, services and other operating income) |
| · | Asset Quality and loans coverage ratios |
The Bank’s consolidated group structure includes the following segments: Banking Colombia, Banking Panamá, Banking El Salvador, Leasing, Trust, Investment Banking, Brokerage, Off Shore and All Other segments.
The Bank’s operating segments are comprised as follows:
This segment provides retail and corporate banking products and services to individuals, companies and national and local governments in Colombia. The Bank’s strategy in Colombia is to grow with these clients based on value added and long-term relationships. In order to offer specialized services to individuals and small and medium size enterprises (SMEs), the Bank´s retail sales force targets the clients classified as: Personal, Private, Entrepreneurs, Foreign Residents and SMEs. The Bank´s corporate and government sales force targets and specializes in companies with more than COP 16,000 million in revenue in nine economic sectors: Agribusiness, Commerce, Manufacturing of Supplies and Materials, Media, Financial Services, Non-Financial Services, Construction, Government and Natural Resources.
This segment is also responsible for the management of the Bank’s proprietary trading activities, liquidity and distribution of treasury products and services to its client base in Colombia.
This segment provides retail and commercial banking products and services to individuals and companies in Panama through the Banistmo operation. This segment includes all the operations of Banistmo and its subsidiaries (except Insurance operations), which are managed and monitored by the CODM on a consolidated basis.
This segment is also responsible for the management of the Bank’s proprietary trading activities, liquidity and distribution of treasury products and services to its client base in Panama.
This segment provides retail and commercial banking products and services to individuals, companies and national and local governments in El Salvador. Banking El Salvador also includes operations of the following subsidiaries: Arrendadora Financiera S.A., Credibac S.A. de CV, Valores Banagricola S.A. de C.V.
This segment is also responsible for the management of the Bank’s proprietary trading activities, liquidity and distribution of treasury products and services to its client base in El Salvador.
This segment provides retail and commercial banking and insurance products and services to individuals, companies and national and local governments in Guatemala. Banking Guatemala also includes operations of the following subsidiaries: Banco Agromercantil de Guatemala S.A., Mercomer Bank Ltd., Seguros Agromercantil S.A., Financiera Agromercantil S.A., Agrovalores S.A., Tarjeta Agromercantil S.A.
This segment is also responsible for the management of the Bank’s proprietary trading activities, liquidity and distribution of treasury products and services to its client base in Guatemala.
This segment provides financial and operating leases, including cross-border and international leasing services to clients in Colombia, Central America, Mexico and Brazil. Bancolombia offers these services mainly through the following Subsidiaries: Leasing Bancolombia, Renting Colombia S.A., Arrendamiento Operativo CIB S.A.C., Leasing Perú S.A., Transportempo S.A.S., Capital Investment Safi S.A., Fondo de Inversión en Arrendamiento Operativo Renting Perú and Patrimonio Autónomo Cartera LBC.
This segment provides trust services and asset management to clients in Colombia and Peru through Fiduciaria Bancolombia and FiduPerú S.A. Sociedad Fiduciaria. The main products offered by this segment include money market accounts, mutual and pension funds, private equity funds, payment trust, custody services, and corporate trust.
This segment provides corporate and project finance advisory, underwriting, capital markets services and private equity management through Banca de Inversión Bancolombia S.A. Its customers include private and publicly-held corporations as well as government institutions.
This segment provides brokerage, investment advisory and private banking services to individuals and institutions through Valores Bancolombia S.A. Comisionista de Bolsa, Valores Bancolombia Panama S.A. and Suvalor Panamá Fondo de Inversión S.A. It sells and distributes equities, futures, foreign currencies, fixed income securities, mutual funds and structured products.
This segment provides a complete line of offshore banking services to Colombian and Salvadorian customers through Bancolombia Panamá S.A., Bancolombia Caymán S.A., and Bancolombia Puerto Rico International, Inc. It offers loans to private sector companies, trade financing, leases financing and financing for industrial projects, as well as a complete portfolio of cash management products, such as checking accounts, international collections and payments. Through these Subsidiaries, the Bank also offers investment opportunities in U.S. Dollars, purchased at par value, with annual average interest ratesdollars, savings and checking accounts, time deposits, and investment funds to its high net worth clients and private banking customers.
This segment includes results from small operation of 2.27%particular investment vehicles of Bancolombia: Valores Simesa S.A., BIBA Inmobiliaria S.A.S., Inversiones CFNS S.A.S., CFNS Infraestructura S.A.S., Sistema de Inversiones y Negocios S.A. Sinesa, Vivayco S.A.S., Banagrícola S.A., Inversiones Financieras Banco Agrícola and 2.10% for 2012 and 2011, respectively.others.
Financial performance by operating segment:
The following table presents financial information of the results by operating segment:
| | | For the year ended December 31, 2015(1) | |
| | | Banking
Colombia | | | Banking
Panama | | | Banking
El Salvador | | | Leasing | | | Trust | | | Investment
banking | | | Brokerage | | | Off shore | | | Other | | | Total before
eliminations | | | Adjustments
for
consolidation
Purposes (1) | | | Total after
eliminations | |
| | | In millons of COP | |
| Total interest and valuation | | | 7,594,955 | | | | 1,119,540 | | | | 728,582 | | | | 1,507,045 | | | | 626 | | | | 287 | | | | 21,157 | | | | 291,249 | | | | 2,425 | | | | 11,265,866 | | | | 3,778 | | | | 11,269,644 | |
| Interest expenses | | | (2,415,234 | ) | | | (363,373 | ) | | | (187,743 | ) | | | (814,044 | ) | | | (367 | ) | | | (236 | ) | | | (652 | ) | | | (215,592 | ) | | | (40,700 | ) | | | (4,037,941 | ) | | | - | | | | (4,037,941 | ) |
| Net margin on financial instruments | | | 5,179,721 | | | | 756,167 | | | | 540,839 | | | | 693,001 | | | | 259 | | | | 51 | | | | 20,505 | | | | 75,657 | | | | (38,275 | ) | | | 7,227,925 | | | | 3,778 | | | | 7,231,703 | |
| Total net provisions | | | (1,389,647 | ) | | | (82,344 | ) | | | (26,933 | ) | | | (123,067 | ) | | | (3,204 | ) | | | 127 | | | | (177 | ) | | | (49,830 | ) | | | (24 | ) | | | (1,675,099 | ) | | | (2 | ) | | | (1,675,101 | ) |
| Net interest income after provisions for loans and financial leases | | | 3,790,074 | | | | 673,823 | | | | 513,906 | | | | 569,934 | | | | (2,945 | ) | | | 178 | | | | 20,328 | | | | 25,827 | | | | (38,299 | ) | | | 5,552,826 | | | | 3,776 | | | | 5,556,602 | |
| Revenues (Expenses) from transactions with other operating segments of the Bank | | | (67,981 | ) | | | (6,098 | ) | | | (8,475 | ) | | | (24,222 | ) | | | (21,833 | ) | | | 2,355 | | | | 31,734 | | | | 95,495 | | | | (975 | ) | | | - | | | | - | | | | - | |
| Total fees and income from services, net | | | 1,330,328 | | | | 136,372 | | | | 140,398 | | | | 17,011 | | | | 218,190 | | | | 29,327 | | | | 78,124 | | | | 32,325 | | | | 10,994 | | | | 1,993,069 | | | | (25 | ) | | | 1,993,044 | |
| Other operating income | | | 374,039 | | | | 173,575 | | | | 1,740 | | | | 585,634 | | | | 30,080 | | | | 42,098 | | | | (7,798 | ) | | | (124,980 | ) | | | 81,286 | | | | 1,155,674 | | | | 428,602 | | | | 1,584,276 | |
| Total operating income, net | | | 5,426,460 | | | | 977,672 | | | | 647,569 | | | | 1,148,357 | | | | 223,492 | | | | 73,958 | | | | 122,388 | | | | 28,667 | | | | 53,006 | | | | 8,701,569 | | | | 432,353 | | | | 9,133,922 | |
| Depreciation and amortization | | | (3,634,025 | ) | | | (606,582 | ) | | | (330,362 | ) | | | (496,765 | ) | | | (85,918 | ) | | | (22,635 | ) | | | (111,255 | ) | | | (73,425 | ) | | | (60,040 | ) | | | (5,421,007 | ) | | | 5 | | | | (5,421,002 | ) |
| Operating expenses | | | (231,981 | ) | | | (49,590 | ) | | | (27,761 | ) | | | (146,678 | ) | | | (466 | ) | | | (93 | ) | | | (1,274 | ) | | | (17,254 | ) | | | (2,188 | ) | | | (477,285 | ) | | | - | | | | (477,285 | ) |
| Total operating expenses | | | (3,866,006 | ) | | | (656,172 | ) | | | (358,123 | ) | | | (643,443 | ) | | | (86,384 | ) | | | (22,728 | ) | | | (112,529 | ) | | | (90,679 | ) | | | (62,228 | ) | | | (5,898,292 | ) | | | 5 | | | | (5,898,287 | ) |
| Profit before tax | | | 1,560,454 | | | | 321,500 | | | | 289,446 | | | | 504,914 | | | | 137,108 | | | | 51,230 | | | | 9,859 | | | | (62,012 | ) | | | (9,222 | ) | | | 2,803,277 | | | | 432,358 | | | | 3,235,635 | |
F-33 | (1) | Includes provisions, dividends, gains on sales and non-controlling interest and reclassification according to the analysis process used by the CODM. |
| | | For the year ended December 31, 2014(1) | |
| | | Banking
Colombia | | | Banking
Panama | | | Banking
El Salvador | | | Leasing | | | Trust | | | Investment
banking | | | Brokerage | | | Off shore | | | All other
segments | | | Total before
eliminations | | | Adjustments for
consolidation
purposes(1) | | | Total After
eliminations | |
| | | In millons of COP | |
| Total interest and valuation | | | 6,339,144 | | | | 807,547 | | | | 506,575 | | | | 1,279,129 | | | | 12,852 | | | | 249 | | | | 19,833 | | | | 188,934 | | | | 13,730 | | | | 9,167,993 | | | | 4,170 | | | | 9,172,163 | |
| Interest expenses | | | (1,941,525 | ) | | | (256,795 | ) | | | (109,353 | ) | | | (670,195 | ) | | | (321 | ) | | | (200 | ) | | | (784 | ) | | | (152,601 | ) | | | (32,783 | ) | | | (3,164,557 | ) | | | (54 | ) | | | (3,164,611 | ) |
| Net margin and valuation on financial instruments | | | 4,397,619 | | | | 550,752 | | | | 397,222 | | | | 608,934 | | | | 12,531 | | | | 49 | | | | 19,049 | | | | 36,333 | | | | (19,053 | ) | | | 6,003,436 | | | | 4,116 | | | | 6,007,552 | |
| Total net provisions | | | (816,099 | ) | | | 69,703 | | | | (44,808 | ) | | | (53,659 | ) | | | 319 | | | | (157 | ) | | | (1,829 | ) | | | (21,160 | ) | | | (1,514 | ) | | | (869,204 | ) | | | (1 | ) | | | (869,205 | ) |
| Net interest and valuation income after provision for loans and financial leases | | | 3,581,520 | | | | 620,455 | | | | 352,414 | | | | 555,275 | | | | 12,850 | | | | (108 | ) | | | 17,220 | | | | 15,173 | | | | (20,567 | ) | | | 5,134,232 | | | | 4,115 | | | | 5,138,347 | |
| Revenues (Expenses) from transactions with other operating segments of the Bank | | | (26,305 | ) | | | (1,831 | ) | | | (3,529 | ) | | | (16,797 | ) | | | (34,036 | ) | | | 961 | | | | 46,068 | | | | 53,519 | | | | (18,050 | ) | | | - | | | | - | | | | - | |
| Total fees and income from services, net | | | 1,222,518 | | | | 140,189 | | | | 103,585 | | | | 47,735 | | | | 199,806 | | | | 22,985 | | | | 81,733 | | | | 28,776 | | | | (5,155 | ) | | | 1,842,172 | | | | (16,462 | ) | | | 1,825,710 | |
| Other operating income | | | 219,211 | | | | 86,325 | | | | 6,303 | | | | 527,990 | | | | 6,525 | | | | (2,124 | ) | | | 4,258 | | | | (152,765 | ) | | | 20,789 | | | | 716,512 | | | | 542,720 | | | | 1,259,232 | |
| Total operating income, net | | | 4,996,944 | | | | 845,138 | | | | 458,773 | | | | 1,114,203 | | | | 185,145 | | | | 21,714 | | | | 149,279 | | | | (55,297 | ) | | | (22,983 | ) | | | 7,692,916 | | | | 530,373 | | | | 8,223,289 | |
| Depreciation and amortization | | | (3,145,505 | ) | | | (470,862 | ) | | | (220,715 | ) | | | (520,808 | ) | | | (84,102 | ) | | | (22,946 | ) | | | (105,880 | ) | | | (38,652 | ) | | | (49,590 | ) | | | (4,659,060 | ) | | | 68 | | | | (4,658,992 | ) |
| Operating expenses | | | (255,678 | ) | | | (57,902 | ) | | | (18,334 | ) | | | (124,499 | ) | | | (387 | ) | | | (92 | ) | | | (899 | ) | | | (636 | ) | | | (1,276 | ) | | | (459,703 | ) | | | - | | | | (459,703 | ) |
| Total operating expenses | | | (3,401,183 | ) | | | (528,764 | ) | | | (239,049 | ) | | | (645,307 | ) | | | (84,489 | ) | | | (23,038 | ) | | | (106,779 | ) | | | (39,288 | ) | | | (50,866 | ) | | | (5,118,763 | ) | | | 68 | | | | (5,118,695 | ) |
| Profit before tax | | | 1,595,761 | | | | 316,374 | | | | 219,724 | | | | 468,896 | | | | 100,656 | | | | (1,324 | ) | | | 42,500 | | | | (94,585 | ) | | | (73,849 | ) | | | 2,574,153 | | | | 530,441 | | | | 3,104,594 | |
Investments in available for sale securities consisted
(1)Includes provisions, dividends, gains on sales and non-controlling interest and reclassification according to the analysis process used by the CODM.
The following table presents financial information of the following: investments in associates by operating segment:
| Available for sale - Debt securities | | 2012 | | | 2011 | |
| | | | | | | |
| Colombian peso denominated: | | | | | | | | |
| Colombian government | | COP | - | | | COP | 72,394 | |
| Financial institutions | | | 461,677 | | | | 673,314 | |
| Other | | | - | | | | 1,129 | |
| Total local currency denominated | | | 461,677 | | | | 746,837 | |
| | | | | | | | | |
| Foreign currency denominated: | | | | | | | | |
| Colombian government | | | 57,816 | | | | 65,250 | |
| El Salvador Central Bank | | | 69,035 | | | | 132,392 | |
| Government entities(1) | | | 58,400 | | | | 72,100 | |
| Foreign governments | | | 561,018 | | | | 450,067 | |
| Financial institutions | | | 202,845 | | | | 168,171 | |
| Corporate bonds | | | 19,033 | | | | 51,248 | |
| Other | | | 26,218 | | | | 73,418 | |
| Total foreign currency denominated | | | 994,365 | | | | 1,012,646 | |
| Total Available for sale - Debt securities | | | 1,456,042 | | | | 1,759,483 | |
| Valuation allowance for available for sale securities | | | (11,148 | ) | | | (9,715 | ) |
| Total available for sale securities, net | | COP | 1,444,894 | | | COP | 1,749,768 | |
| | | For the year ended December 31, 2015 | |
| | | Banking
Colombia | | | Banking El
Salvador | | | Trust | | | Investment
banking | | | Off shore | | | Other | | | Total | |
| | | In millions of COP | |
| Investments in associates | | | 286,009 | | | | 9,936 | | | | 201,909 | | | | 2,489 | | | | - | | | | 46,206 | | | | 546,549 | |
| Equity method | | | 17,529 | | | | 1,707 | | | | 13,904 | | | | (462 | ) | | | 84,141 | | | | 6,468 | | | | 123,287 | |
| | | For the year ended December 31, 2014 | |
| | | Banking
Colombia | | | Banking El
Salvador | | | Trust | | | Investment
banking | | | Off shore | | | Other | | | Total | |
| | | In millions of COP | |
| Investments in associates | | | 273,874 | | | | 7,074 | | | | 196,690 | | | | 81,672 | | | | 663,118 | | | | 127,269 | | | | 1,349,697 | |
| Equity method | | | 32,157 | | | | (804 | ) | | | 25,566 | | | | (5,069 | ) | | | (2,704 | ) | | | 11,401 | | | | 60,547 | |
For additional information related to investment in associates in joint ventures, see Note 7.
The following table presents material non-cash items other than depreciation and amortization by segment:
| | | For the year ended December 31, 2015 | |
| | | Banking
Colombia | | | Banking El
Salvador | | | Trust | | | Leasing | | | Off shore | | | Banking
Panama | | | Total | |
| | | In millions of COP | |
| Restructured loans that were transferred to foreclosed assets | | | 14,750 | | | | 18,819 | | | | - | | | | 143,371 | | | | - | | | | 8,102 | | | | 185,042 | |
| Provisions | | | 1,816,556 | | | | 65,037 | | | | 3,241 | | | | 113,853 | | | | 67,347 | | | | 114,425 | | | | 2,180,459 | |
| | | For the year ended December 31, 2014 | |
| | | Banking
Colombia | | | Banking El
Salvador | | | Trust | | | Leasing | | | Off shore | | | Banking
Panama | | | Other | | | Total | |
| | | In millions of COP | |
| Restructured loans that were transferred to foreclosed assets | | | 89,949 | | | | 31,065 | | | | - | | | | 40,327 | | | | - | | | | 8,457 | | | | - | | | | 169,798 | |
| Provisions | | | 1,222,481 | | | | 79,568 | | | | (2,140 | ) | | | 34,179 | | | | 21,967 | | | | (32,895 | ) | | | - | | | | 1,323,160 | |
| Impairment goodwill | | | - | | | | - | | | | - | | | | - | | | | - | | | | - | | | | 3,179 | | | | 3,179 | |
| Donations | | | 4,539 | | | | - | | | | - | | | | - | | | | - | | | | - | | | | - | | | | 4,539 | |
Geographic information
The following summarizes the Bank’s revenues and long-lived assets attributable to Colombia and other foreign countries based on the country where the revenue was originated:
| | | As of December 31, | |
| | | 2015 | | | 2014 | |
| Geographic information | | Revenues | | | Long-lived assets (1) | | | Revenues | | | Long-lived assets (1) | |
| | | In millions of COP | |
| Colombia | | | 9,335,345 | | | | 3,829,742 | | | | 7,760,424 | | | | 3,233,259 | |
| Panama | | | 1,470,692 | | | | 442,732 | | | | 1,017,171 | | | | 265,484 | |
| Puerto Rico | | | 43,672 | | | | 355 | | | | 37,100 | | | | 130 | |
| Peru | | | 19,810 | | | | 119,575 | | | | 59,971 | | | | 109,238 | |
| El Salvador | | | 729,258 | | | | 359,887 | | | | 507,947 | | | | 245,223 | |
| Costa Rica | | | - | | | | 124 | | | | - | | | | 105 | |
| Guatemala | | | - | | | | 205,315 | | | | - | | | | - | |
| Total | | | 11,598,777 | | | | 4,957,730 | | | | 9,382,613 | | | | 3,853,439 | |
| Eliminations and translation adjustment | | | (329,133 | ) | | | 6,394,792 | | | | (210,450 | ) | | | 4,407,437 | |
| Total, net | | | 11,269,644 | | | | 11,352,522 | | | | 9,172,163 | | | | 8,260,876 | |
(1) This amount includes investments in fiduciary certificates of participation. These certificates were issued for the Environmental Trust for the conservationIncluded foreclosed assets, net, property, plant and equipment, net and Goodwill
NOTE 4. CASH AND CASH EQUIVALENTS
For purposes of the Coffee Forest (Fideicomiso Ambiental para la Conservación del Bosque Cafetero “FICAFE”). This trust was formedconsolidated statement of cash flow and the consolidated statement of financial position, the following assets are considered as cash and cash equivalents:
| | | December 31, 2015 | | | December 31, 2014 | | | January 1, 2014 | |
| | | In millions of COP | |
| Cash and balances at central bank | | | | | | | | | | | | |
| Cash | | | 5,806,157 | | | | 3,908,267 | | | | 3,292,326 | |
| Due from other private financial entities | | | 4,561,668 | | | | 3,888,960 | | | | 3,295,223 | |
| Due from the Colombian Central Bank(1) | | | 3,654,660 | | | | 3,268,677 | | | | 4,689,374 | |
| Checks on hold | | | 79,959 | | | | 18,526 | | | | 16,744 | |
| Remittances of domestic negotiated checks in transit | | | 192,719 | | | | 110,429 | | | | 146,590 | |
| Total cash and due from banks | | | 14,295,163 | | | | 11,194,859 | | | | 11,440,257 | |
| Money market transactions: | | | | | | | | | | | | |
| Interbank borrowings | | | 1,385,587 | | | | 969,657 | | | | 1,880,999 | |
| Reverse repurchase agreements and other similar secured loans(2) | | | 2,916,864 | | | | 1,302,267 | | | | 2,124,721 | |
| Total money market transactions: | | | 4,302,451 | | | | 2,271,924 | | | | 4,005,720 | |
| Total cash and cash equivalents(3) | | | 18,597,614 | | | | 13,466,783 | | | | 15,445,977 | |
(1) According to External Resolution Number 005 of 2008 issued by the Colombian Central Bank, the Parent Company must maintain the equivalent of 4.5% of its customer’s deposits with a maturity term less than 18 months as a legal banking reserve, represented by deposits at the transferCentral Bank or as cash in hand.
(2)See Note 15
(3)As of December 31, 2015, includes cash and cash equivalents of Grupo Agromercantil Holding amounting to COP 1,260,947.
As of December 31, 2015 and 2014 and January 1, 2014, there are no restrictions on cash and cash equivalents.
As of December 31, 2015 Tuya S.A. (a subsidiary classified a discontinued operation), had cash and cash equivalents to COP 207,963. See Note 31 Discontinued Operations.
NOTE 5. FINANCIAL ASSETS INVESTMENTS AND DERIVATIVES
5.1 Financial assets investments
The Bank’s securities portfolios at fair value and at amortized cost are listed below, as of December 31, 2015 and 2014, and as of January 1, 2014:
The detail of the coffee sector’s loancarrying value of the debt securities is as follows:
| | | December 31, 2015 | |
| | | Measurement methodology | | | | |
| Debt securities | | Fair value through
profit or loss | | | Amortized cost | | | Total carrying value | |
| | | In millions of COP | |
| Securities issued by the Colombian Government | | | 4,817,604 | | | | 15,065 | | | | 4,832,669 | |
| Securities issued by Foreign Government | | | 3,189,722 | | | | 1,253,585 | | | | 4,443,307 | |
| Securities issued by other financial institutions | | | 1,358,117 | | | | 385,823 | | | | 1,743,940 | |
| Securities issued by Government entities | | | 82,162 | | | | 1,402,890 | | | | 1,485,052 | |
| Securities issued by the Salvador Central Bank | | | 43,913 | | | | - | | | | 43,913 | |
| Corporate bonds | | | 159,750 | | | | 404,512 | | | | 564,262 | |
| Total debt securities | | | 9,651,268 | | | | 3,461,875 | | | | 13,113,143 | |
| Total equity securities | | | | | | | | | | | 1,164,681 | |
| Total investment securities | | | | | | | | | | | 14,277,824 | |
| | | December 31, 2014 | |
| | | Measurement methodology | | | | |
| Debt securities | | Fair value through
profit or loss | | | Amortized cost | | | Total carrying value | |
| | | In millions of COP | |
| Securities issued by the Colombian Government | | | 6,373,706 | | | | 165,121 | | | | 6,538,827 | |
| Securities issued by Foreign Governments | | | 1,762,357 | | | | 26,923 | | | | 1,789,280 | |
| Securities issued by other financial institutions | | | 1,301,888 | | | | 237,501 | | | | 1,539,389 | |
| Securities issued by Government entities | | | 9,862 | | | | 1,421,587 | | | | 1,431,449 | |
| Securities issued by the El Salvador Central Bank | | | 23,638 | | | | - | | | | 23,638 | |
| Corporate bonds | | | 100,623 | | | | 79,731 | | | | 180,354 | |
| Total debt securities | | | 9,572,074 | | | | 1,930,863 | | | | 11,502,937 | |
| Total equity securities | | | | | | | | | | | 1,281,286 | |
| Total investment securities | | | | | | | | | | | 12,784,223 | |
| | | January 1, 2014 | |
| | | Measurement methodology | | | | |
| Debt securities | | Fair value through
profit or loss | | | Amortized cost | | | Total carrying value | |
| | | In millions of COP | |
| Securities issued by the Colombian Government | | | 5,768,136 | | | | 276,456 | | | | 6,044,592 | |
| Securities issued by Foreign Governments | | | 1,615,681 | | | | 22,116 | | | | 1,637,797 | |
| Securities issued by other financial institutions | | | 1,388,758 | | | | 120,742 | | | | 1,509,500 | |
| Securities issued by Government entities | | | 18,669 | | | | 1,774,894 | | | | 1,793,563 | |
| Securities issued by the El Salvador Central Bank | | | 24,585 | | | | 580,451 | | | | 605,036 | |
| Corporate bonds | | | 375,828 | | | | 27,202 | | | | 403,030 | |
| Total debt securities | | | 9,191,657 | | | | 2,801,861 | | | | 11,993,518 | |
| Total equity securities | | | | | | | | | | | 1,089,338 | |
| Total investment securities | | | | | | | | | | | 13,082,856 | |
The following tables set forth the debt securities portfolio by a numbermaturity:
| | | December 31, 2015 | |
| | | Less than 1
year | | | Between 1
and 3 years | | | Between 3
and 5 years | | | Greater than
5 years | | | Total | |
| | | In millions of COP | |
| Securities at fair value through profit or loss |
| Securities issued by the Colombian Government | | | 1,416,860 | | | | 635,998 | | | | 420,155 | | | | 2,344,591 | | | | 4,817,604 | |
| Securities issued by Foreign Governments | | | 1,044,499 | | | | 894,027 | | | | 118,778 | | | | 1,132,418 | | | | 3,189,722 | |
| Securities issued by other financial institutions | | | 228,333 | | | | 808,362 | | | | 102,069 | | | | 219,353 | | | | 1,358,117 | |
| Securities issued by Government entities | | | - | | | | 77,417 | | | | 4,196 | | | | 549 | | | | 82,162 | |
| Securities issued by the Salvador Central Bank | | | 43,913 | | | | - | | | | - | | | | - | | | | 43,913 | |
| Corporate bonds | | | 5,534 | | | | 110,452 | | | | 13,958 | | | | 29,806 | | | | 159,750 | |
| | | | 2,739,139 | | | | 2,526,256 | | | | 659,156 | | | | 3,726,717 | | | | 9,651,268 | |
| Securities at amortized cost | | | | | | | | | | | | | | | | | | | | |
| Securities issued by the Colombian Government | | | 15,065 | | | | - | | | | - | | | | - | | | | 15,065 | |
| Securities issued by Foreign Governments | | | 267,781 | | | | 647,982 | | | | 229,390 | | | | 108,432 | | | | 1,253,585 | |
| Securities issued by other financial institutions | | | 156,458 | | | | 31,898 | | | | 19,222 | | | | 178,245 | | | | 385,823 | |
| Securities issued by Government entities | | | 1,392,894 | | | | - | | | | 9,996 | | | | - | | | | 1,402,890 | |
| Corporate bonds | | | 12,819 | | | | 316,519 | | | | 2,968 | | | | 72,206 | | | | 404,512 | |
| | | | 1,845,017 | | | | 996,399 | | | | 261,576 | | | | 358,883 | | | | 3,461,875 | |
| Total | | | 4,584,156 | | | | 3,522,655 | | | | 920,732 | | | | 4,085,600 | | | | 13,113,143 | |
The investment securities held by Tuya S.A. considered as assets held for sale, amounting to COP 30,271, are classified at amortized cost, issued by other financial institutions and their maturity is in less than one year. For further information, see Note 31 Discontinued Operations.
| | | December 31, 2014 | |
| | | Less than 1
year | | | Between 1
and 3 years | | | Between 3
and 5 years | | | Greater than
5 years | | | Total | |
| | | In millions of COP | |
| Securities at fair value through profit or loss | | | | | | | | | | | | | | | | | | | | |
| Securities issued by the Colombian Government | | | - | | | | 4,236,863 | | | | 848,274 | | | | 1,288,569 | | | | 6,373,706 | |
| Securities issued by Foreign Governments | | | 119,127 | | | | 661,126 | | | | 549,600 | | | | 432,504 | | | | 1,762,357 | |
| Securities issued by other financial institutions | | | 4,927 | | | | 185,213 | | | | 88,267 | | | | 1,023,481 | | | | 1,301,888 | |
| Securities issued by Government entities | | | - | | | | 1,650 | | | | 557 | | | | 7,655 | | | | 9,862 | |
| Securities issued by the El Salvador Central Bank | | | 7,161 | | | | 16,477 | | | | - | | | | - | | | | 23,638 | |
| Corporate bonds | | | 1,101 | | | | 10,512 | | | | 46,849 | | | | 42,161 | | | | 100,623 | |
| | | | 132,316 | | | | 5,111,841 | | | | 1,533,547 | | | | 2,794,370 | | | | 9,572,074 | |
| Securities at amortized cost | | | | | | | | | | | | | | | | | | | | |
| Securities issued by the Colombian Government | | | 11,980 | | | | 153,141 | | | | - | | | | - | | | | 165,121 | |
| Securities issued by Foreign Governments | | | - | | | | - | | | | 26,923 | | | | - | | | | 26,923 | |
| Securities issued by other financial institutions | | | 21,987 | | | | 64,659 | | | | 123,243 | | | | 27,612 | | | | 237,501 | |
| Securities issued by Government entities | | | 464,092 | | | | 949,665 | | | | - | | | | 7,830 | | | | 1,421,587 | |
| Corporate bonds | | | - | | | | 9,872 | | | | 55,670 | | | | 14,189 | | | | 79,731 | |
| | | | 498,059 | | | | 1,177,337 | | | | 205,836 | | | | 49,631 | | | | 1,930,863 | |
| Total | | | 630,375 | | | | 6,289,178 | | | | 1,739,383 | | | | 2,844,001 | | | | 11,502,937 | |
| | | January 1, 2014 | |
| | | Less than 1
year | | | Between 1
and 3 years | | | Between 3
and 5 years | | | Greater than
5 years | | | Total | |
| | | In millions of COP | |
| Securities at fair value through profit or loss |
| Securities issued by the Colombian Government | | | 1,521,267 | | | | 3,655,988 | | | | 185,466 | | | | 405,415 | | | | 5,768,136 | |
| Securities issued by Foreign Governments | | | 842,655 | | | | 31,095 | | | | 423,310 | | | | 318,621 | | | | 1,615,681 | |
| Securities issued by other financial institutions | | | 63,785 | | | | 204,372 | | | | 87,523 | | | | 1,033,078 | | | | 1,388,758 | |
| Securities issued by Government entities | | | - | | | | 4,736 | | | | 1,092 | | | | 12,841 | | | | 18,669 | |
| Securities issued by the El Salvador Central Bank | | | 24,585 | | | | - | | | | - | | | | - | | | | 24,585 | |
| Corporate bonds | | | 13,597 | | | | 2,052 | | | | 82,267 | | | | 277,912 | | | | 375,828 | |
| | | | 2,465,889 | | | | 3,898,243 | | | | 779,658 | | | | 2,047,867 | | | | 9,191,657 | |
| Securities at amortized cost |
| Securities issued by the Colombian Government | | | 116,879 | | | | 159,577 | | | | - | | | | - | | | | 276,456 | |
| Securities issued by Foreign Governments | | | - | | | | - | | | | - | | | | 22,116 | | | | 22,116 | |
| Securities issued by other financial institutions | | | 8,698 | | | | 60,104 | | | | 41,523 | | | | 10,417 | | | | 120,742 | |
| Securities issued by Government entities | | | 1,774,869 | | | | - | | | | 25 | | | | - | | | | 1,774,894 | |
| Securities issued by the El Salvador Central Bank | | | 580,451 | | | | - | | | | - | | | | - | | | | 580,451 | |
| Corporate bonds | | | - | | | | 8,057 | | | | 9,632 | | | | 9,513 | | | | 27,202 | |
| | | | 2,480,897 | | | | 227,738 | | | | 51,180 | | | | 42,046 | | | | 2,801,861 | |
| Total | | | 4,946,786 | | | | 4,125,981 | | | | 830,838 | | | | 2,089,913 | | | | 11,993,518 | |
For further information related to disclosures of banks in El Salvador, including Banco Agrícola. the fair value of securities measured at amortized cost, please see Note 29 Fair value of assets and liabilities.
The purposefollowing table shows the fair value of this transaction wasequity securities:
| | | Carrying amount | |
| Equity securities | | December
31, 2015 | | | December
31, 2014 | | | January
1, 2014 | |
| | | In millions of COP | |
| Equity securities at fair value through profit or loss | | | 763,556 | | | | 865,730 | | | | 697,270 | |
| Equity securities at fair value through OCI | | | 401,125 | | | | 415,556 | | | | 392,068 | |
| Total | | | 1,164,681 | | | | 1,281,286 | | | | 1,089,338 | |
The equity securities held by Tuya S.A., considered as assets held for sale, amounting to carry out the restructuring of those loans, promoted by the government of El Salvador.COP 994, are classified as security measured at fair value through OCI. For further information, see Note 31 Discontinued Operations.
The Bank received proceeds from sales ofhas recognized COP 1,768,227(9,838) in 2015 and COP 1,450,358 of available for sale debt26,577 in 2014 related to equity securities during the years ended December 31, 2012 and 2011, respectively.trust funds at fair value through OCI.
Equity securities that have been designated to be measured at fair value through OCI are considered strategic for the Bank and, thus, there is no intention to sell them in the foreseeable future and that is the main reason for using this presentation alternative.
| | | Participation
percentage at
December 31,
2012 | | | 2012 | | | Participation
percentage at
December 31,
2011 | | | 2011 | |
| Available for sale - equity securities | | | | | | | | | | | | | | | | |
| | | | | | | | | | | | | | | | | |
| Sura Asset Management España S.L.(1) | | | 4.13 | % | | COP | 262,173 | | | | - | | | COP | - | |
| Grupo Odinsa S.A.(2) | | | 13.50 | % | | | 197,946 | | | | 13.46 | % | | | 190,516 | |
| Sociedad Administradora de Fondos de Pensiones y de Cesantías Protección S.A. | | | 20.58 | % | | | 86,993 | | | | 24.64 | % | | | 86,993 | |
| EPSA S.A. ESP | | | 1.96 | % | | | 62,343 | | | | 1.96 | % | | | 62,343 | |
| Inversiones Inmobiliaria Arauco Alameda(3) | | | 22.50 | % | | | 51,781 | | | | 45.00 | % | | | 24,136 | |
| Bolsa de Valores de Colombia | | | 8.63 | % | | | 45,269 | | | | 8.63 | % | | | 52,501 | |
| Todo Uno Services(4) | | | - | | | | - | | | | 47.72 | % | | | 46,281 | |
| Avefarma S.A.S.(5) | | | 21.00 | % | | | 20,423 | | | | - | | | | - | |
| Titularizadora Colombia S.A. | | | 21.25 | % | | | 14,743 | | | | 21.25 | % | | | 14,743 | |
| Concesiones CCFC S.A. | | | 25.50 | % | | | 7,223 | | | | 25.50 | % | | | 7,223 | |
| Panamerican Farmaceutical Holding INC(6) | | | 21.00 | % | | | 6,846 | | | | - | | | | - | |
| Enka de Colombia S.A. | | | 6.60 | % | | | 5,615 | | | | 6.60 | % | | | 9,523 | |
| Concesiones Urbanas S.A. | | | 33.33 | % | | | 5,590 | | | | 33.33 | % | | | 5,590 | |
| Cadenalco S.A. Securitization | | | 3.33 | % | | | 5,250 | | | | 3.33 | % | | | 5,150 | |
| Depósito Centralizado de Valores de Colombia Deceval S.A. | | | 13.59 | % | | | 4,738 | | | | 13.59 | % | | | 4,738 | |
| Redeban Red Multicolor | | | 20.36 | % | | | 4,396 | | | | 20.36 | % | | | 4,396 | |
| Banco Latinoamericano de exportaciones BLADEX S.A. | | | 0.20 | % | | | 1,718 | | | | 0.20 | % | | | 1,799 | |
| Other | | | | | | | 26,118 | | | | | | | | 17,277 | |
| Total equity securities | | | | | | COP | 809,165 | | | | | | | COP | 533,209 | |
| | | | | | | | | | | | | | | | | |
| Valuation allowance for equity securities | | | | | | | - | | | | | | | | (65,138 | ) |
| Total equity securities, net | | | | | | COP | 809,165 | | | | | | | COP | 468,071 | |
| (1) | The Bank’s subsidiary, Banagricola S.A., a Panamanian company subscribed for 4,129 shares representing 4.13% of the capital stock of Grupo de Inversiones Suramericana España S.L., a company organized and existing under the laws of Spain and the indirect owner of the ING Latinamerica pension and insurance assets purchased by Grupo de Inversiones Suramericana in late 2011. The subscription price for the shares is USD 36,539 per share, for a total purchase price of approximately USD 150,870. |
| (2) | During February 2012, the Bank’s subsidiary, Inversiones CFNS increased its stock participation in Grupo Odinsa through a purchase of 64,421 common shares for COP 562 and received stock dividends amounted to COP 6,867. |
| (3) | During March and September 2012, the Bank’s subsidiary, Banca de Inversion Bancolombia increased its investment in Inversiones Inmobiliaria Arauco Alameda through capitalization for COP 27,645, corresponding to 2,764,479 common shares. |
| (4) | In August 2012, the Bank’s subsidiary, Sistema de Inversiones y Negocios S.A. (“SINESA”) sold its 47.72% participation in Todo1 Services Inc. |
| (5) | In December 2012, the Bank’s subsidiary, Inversiones CFNS acquired shares representing approximately 21.0% of the outstanding shares (corresponding to 3,697,698 shares) of Avefarma S.A.S. for COP 20,423. |
| (6) | In December 2012, the Bank’s subsidiary, Inversiones CFNS acquired shares representing approximately 21.0% of the outstanding shares of Panamerican Farmaceutical Holding INC for COP 6,846. |
In December 2012, Bancolombia Panamá S.A. (a Panamanian subsidiary ofThe following table details the Bank) and BAM Financial Corporation (“BFC”), entered into a stock purchase agreement, pursuant to which Bancolombia Panamá will purchase from BFC a 40% stake in the capital stock of the Panamanian company Agromercantil Holding Group. Bancolombia Panamá will pay a total of USD 216,000 to BFC for the 40% interest and subject to the completion of the transaction, Bancolombia Panamá and BFC entered into a stockholders agreement, which will provide, amongequity instruments designated at fair value through other things, for the acquisitioncomprehensive income analyzed by Bancolombia Panamá of control of Agromercantil Holding Group in the med term. Completion of the transaction is subject to the receipt of regulatory approvals in Colombia, Guatemala, and Panamá and the satisfaction of other conditions.listing status:
| | | Carrying amount | |
| Equity securities | | December
31, 2015 | | | December
31, 2014 | | | January
1, 2014 | |
| | | In millions of COP | |
| Securities at fair value through OCI: | | | | | | | | | | | | |
| Equity securities listed in Colombia | | | 12,146 | | | | 15,003 | | | | 16,004 | |
| Equity securities listed elsewhere | | | 9,889 | | | | 7,446 | | | | 6,496 | |
| Equity securities unlisted | | | 379,090 | | | | 393,107 | | | | 369,568 | |
| Total of securities at fair value through OCI | | | 401,125 | | | | 415,556 | | | | 392,068 | |
Dividends received from equity investments at fair value through OCI and through profit or loss held at the end of the year 2015 amounted to COP 47,610, COP 27,7009,605 and COP 34,699 for13,975, respectively; and held at the years ended December 31, 2012, 2011end of the year 2014 amounted to COP 5,821 and 2010,COP 25,760, respectively.
Equity investments do not have a specific maturity date; therefore, they are not included in the maturity detail.
The following equity securities are impaired and the Bank has recognized the impairment amounts:
| | | 2012 | | | 2011 | |
| | | Valuation | | | | | | Valuation | |
| | | Allowance | | | Risk Category | | | Allowance | |
| | | | | | | | | | |
| Todo 1 Services | | COP | - | | | | C | | | COP | 46,281 | |
| Industria Colombo Andina Inca S.A. | | | - | | | | E | | | | 367 | |
| Enka de Colombia S.A | | | - | | | | B | | | | 3,280 | |
| Grupo Odinsa S.A. | | | - | | | | A | | | | 3,567 | |
| Bolsa de Valores de Colombia | | | - | | | | A | | | | 11,643 | |
| | | COP | - | | | | | | | COP | 65,138 | |
Investments in held to maturity securities consisteddetail of the following:
| | | 2012 | | | 2011 | |
| Held to Maturity Securities | | | | | | | | |
| | | | | | | | | |
| Colombian peso denominated: | | | | | | | | |
| Colombian government | | COP | 376,703 | | | COP | 443,181 | |
| Government entities | | | 1,249,017 | | | | 1,159,509 | |
| Financial institutions | | | 1,173,360 | | | | 1,297,556 | |
| Corporate bonds | | | 4,420 | | | | 4,517 | |
| Total Colombian-Peso denominated | | | 2,803,500 | | | | 2,904,763 | |
| | | | | | | | | |
| Foreign currency denominated: | | | | | | | | |
| El Salvador Central Bank | | | 513,383 | | | | 553,461 | |
| Government entities | | | 113 | | | | 175 | |
| Foreign governments | | | 19,002 | | | | 39,802 | |
| Financial institutions | | | 73,177 | | | | 147,733 | |
| Other | | | 74,185 | | | | 89,754 | |
| Total foreign currency denominated | | | 679,860 | | | | 830,925 | |
| | | | 3,483,360 | | | | 3,735,688 | |
| Valuation allowance for Held to Maturity securities | | | (1,740 | ) | | | (1,894 | ) |
| Total Held to Maturity securities, net | | COP | 3,481,620 | | | COP | 3,733,794 | |
As of December 31, 2012 and 2011, the Banksecurities pledged investment securities amounting to COP 119,132 and COP 1,984,210, respectively, as collateral to secure lines of credit at international banks, domestic development banks and other financial institutions.
The following table summarizes the maturities and weighted average yields of the Bank’s investment debt securities as of December 31, 2012:2015 and 2014 and as of January 1, 2014 is as follows:
| | | As of December 31, 2012 | |
| | | Maturing in less than 1
year | | | Maturing between 1 and 5
years | | | Maturing between 5 and
10 years | | | Maturing in more
than 10 years | | | Total | |
| | | Balance(1) | | | Yield %(2) | | | Balance(1) | | | Yield %(2) | | | Balance(1) | | | Yield %(2) | | | Balance(1) | | | Yield %(2) | | | Balance(1) | | | Yield %(2) | |
| | | (COP million, except yields) | |
Securities issued or secured by:
Foreign currency-denominated: | | | | | | | | | | | | | | | | | | | | | | | | | | | | | | | | | | | | | | | | |
| Colombian government | | | 7,599 | | | | 5.53 | % | | | 67,512 | | | | 2.12 | % | | | 161,755 | | | | 2.18 | % | | | 24 | | | | 6.93 | % | | | 236,890 | | | | 2.27 | % |
| El Salvador Central Bank | | | 582,418 | | | | 0.40 | % | | | - | | | | - | | | | - | | | | - | | | | - | | | | - | | | | 582,418 | | | | 0.40 | % |
| Other government entities | | | - | | | | - | | | | 7,544 | | | | 4.21 | % | | | 12,530 | | | | 4.61 | % | | | 38,439 | | | | 3.27 | % | | | 58,513 | | | | 3.68 | % |
| Other financial entities | | | 14,118 | | | | 3.70 | % | | | 157,222 | | | | 3.97 | % | | | 169,962 | | | | 4.87 | % | | | - | | | | - | | | | 341,302 | | | | 4.41 | % |
| Foreign governments | | | 378,848 | | | | 4.11 | % | | | 47,574 | | | | 1.15 | % | | | 181,367 | | | | 2.96 | % | | | 85,962 | | | | 4.63 | % | | | 693,751 | | | | 3.67 | % |
| Others | | | - | | | | - | | | | 98,517 | | | | 6.88 | % | | | 99,964 | | | | 4.04 | % | | | 7,268 | | | | 5.01 | % | | | 205,749 | | | | 5.44 | % |
| Subtotal | | | 982,983 | | | | 1.91 | % | | | 378,369 | | | | 4.05 | % | | | 625,578 | | | | 3.48 | % | | | 131,693 | | | | 4.25 | % | | | 2,118,623 | | | | 2.90 | % |
| | | | | | | | | | | | | | | | | | | | | | | | | | | | | | | | | | | | | | | | | |
Securities issued or secured by:
Peso-denominated | | | | | | | | | | | | | | | | | | | | | | | | | | | | | | | | | | | | | | | | |
| Colombian government | | | 534,420 | | | | 5.03 | % | | | 3,766,334 | | | | 5.10 | % | | | 206,486 | | | | 5.59 | % | | | 57,192 | | | | 6.03 | % | | | 4,564,432 | | | | 5.12 | % |
| Other Government entities.. | | | 1,261,441 | | | | 2.41 | % | | | 9,583 | | | | 7.55 | % | | | 7,552 | | | | 0.87 | % | | | - | | | | - | | | | 1,278,576 | | | | 2.43 | % |
| Other financial entities | | | 121,895 | | | | 6.17 | % | | | 228,600 | | | | 6.99 | % | | | 692,450 | | | | 6.93 | % | | | 652,639 | | | | 11.75 | % | | | 1,695,584 | | | | 8.74 | % |
| Others | | | 20,138 | | | | 6.63 | % | | | 37,390 | | | | 3.38 | % | | | 6,791 | | | | 7.69 | % | | | - | | | | - | | | | 64,319 | | | | 4.85 | % |
| Subtotal | | | 1,937,894 | | | | 3.41 | % | | | 4,041,907 | | | | 5.19 | % | | | 913,279 | | | | 6.58 | % | | | 709,831 | | | | 11.29 | % | | | 7,602,911 | | | | 5.47 | % |
| Securities issued or secured by: | | | | | | | | | | | | | | | | | | | | | | | | | | | | | | | | | | | | | | | | |
| UVR-denominated | | | | | | | | | | | | | | | | | | | | | | | | | | | | | | | | | | | | | | | | |
| Colombian Government. | | | 1,034,410 | | | | 1.38 | % | | | 349,340 | | | | 0.54 | % | | | 8,857 | | | | 2.51 | % | | | 2,238 | | | | 2.84 | % | | | 1,394,845 | | | | 1.18 | % |
| Other financial entities | | | - | | | | - | | | | 26,142 | | | | 5.75 | % | | | 211,936 | | | | 4.13 | % | | | 63,598 | | | | 9.12 | % | | | 301,676 | | | | 5.32 | % |
| Subtotal | | | 1,034,410 | | | | 1.38 | % | | | 375,482 | | | | 0.90 | % | | | 220,793 | | | | 4.06 | % | | | 65,836 | | | | 8.90 | % | | | 1,696,521 | | | | 1.91 | % |
| Total (COP) | | | 3,955,287 | | | | | | | | 4,795,758 | | | | | | | | 1,759,650 | | | | | | | | 907,360 | | | | | | | | 11,418,055 | | | | | |
| | December 31, 2015 |
| Pledged financial assets | | Term | | Security pledged | | Carrying
amount | |
| | In millions of COP |
| Investments pledged as collateral in repo operations |
| Securities issued by the Colombian Government | | Greater than 12 months | | TES-Fixed rate | | | 268,921 | |
| Securities issued by the Colombian Government | | Between 3 and 6 months | | TES-Fixed rate | | | 36,547 | |
| Securities issued by Foreign Government | | Greater than 12 months | | BOND-Fixed rate | | | 231,970 | |
| Securities issued by Foreign Government | | Less than 3 months | | BOND-Fixed rate | | | 20,881 | |
| Securities issued by Foreign Government | | Greater than 12 months | | TREASURY-Fixed rate | | | 12,342 | |
| Corporate bonds | | Greater than 12 months | | BOND-Fixed rate | | | 21,670 | |
| Subtotal investments pledged as collateral in repo operations | | | | | | | 592,331 | |
| Investments pledged as collateral in derivative operations |
| Securities issued by the Colombian Government | | Greater than 12 months | | TES-Fixed rate | | | 186,346 | |
| Subtotal investments pledged as collateral in derived operations | | | | | | | 186,346 | |
| Total securities pledged as collateral | | | | | | | 778,677 | |
| (1) | Amounts are net of allowances for decline in value which amounted to COP 14,159 at December 31, 2012.2014 |
| Pledged financial assets | | Term | | Security pledged | | Carrying
amount | |
| | In millions of COP |
| Investments pledged as collateral in repo operations |
| Securities issued by the Colombian Government | | Grater than 12 months | | TES-Fixed rate | | | 1,104,591 | |
| Securities issued by the Colombian Government | | Between 6 and 12 months | | TES-Fixed rate | | | 18,457 | |
| Securities issued by the Colombian Government | | Between 6 and 12 months | | TES-Variable rate | | | 6,147 | |
| Securities issued by other financial institutions | | Grater than 12 months | | CDT-Variable rate | | | 6,049 | |
| Securities issued by other financial institutions | | Between 6 and 12 months | | CDT-Variable rate | | | 1,930 | |
| Securities issued by other financial institutions | | Between 3 and 6 months | | CDT-Variable rate | | | 408 | |
| Subtotal investments pledged as collateral in repo operations | | | | | | | 1,137,582 | |
| Investments pledged as collateral in derivative operations |
| Securities issued by the Colombian Government | | Between 6 and 12 months | | TES-Fixed rate | | | 83,593 | |
| Securities issued by the Colombian Government | | Between 6 and 12 months | | TES-Variable rate | | | 6,152 | |
| Subtotal investments pledged as collateral in derived operations | | | | | | | 89,745 | |
| Total securities pledged as collateral | | | | | | | 1,227,327 | |
| (2) | Yield was calculated usingJanuary 1, 2014 |
| Pledged financial assets | | Term | | Security pledged | | Carrying
amount | |
| | In millions of COP |
| Investments pledged as collateral in repo operations |
Securities issued by the internal returnColombian Government | | Between 6 and 12 months | | TES-Fixed rate (IRR) | | | 28,626 | |
| Securities issued by the Colombian Government | | Greater than 12 months | | TES-Fixed rate | | | 10,044 | |
| Securities issued by the Colombian Government | | Between 3 and 6 months | | TES-Fixed rate | | | 4,312 | |
| Securities issued by other financial institutions | | Greater than 12 months | | CDT-Variable rate | | | 24,040 | |
| Securities issued by other financial institutions | | Between 6 and 12 months | | CDT-Fixed rate | | | 10,810 | |
| Securities issued by other financial institutions | | Less than 3 months | | CDT-Fixed rate | | | 2,784 | |
| Securities issued by other financial institutions | | Between 3 and 6 months | | CDT-Fixed rate | | | 2,510 | |
| Securities issued by other financial institutions | | Greater than 12 months | | BONDS-Variable rate | | | 694 | |
Subtotal investments pledged as of December 31, 2012.collateral in repo operations | | | | | | | 83,820 | |
| Investments pledged as collateral in derivative operations |
| Securities issued by the Colombian Government | | Between 6 and 12 months | | TES-Fixed rate | | | 44,145 | |
| Subtotal investments pledged as collateral in derived operations | | | | | | | 44,145 | |
| Total securities pledged as collateral | | | | | | | 127,965 | |
(6) Loans and Financial Leases
Loan portfolio and financial lease contracts were classified, in accordance with the provisions of the SFC, as follows:
5.2Derivatives
December 31, 2012
| Rating | | Commercial | | | Consumer | | | Mortgage | | | Small business
loans | | | Financial leases | | | Total | |
| “A” Normal | | COP | 40,161,323 | | | COP | 11,173,081 | | | COP | 5,624,738 | | | COP | 294,399 | | | COP | 8,199,682 | | | COP | 65,453,223 | |
| “B” Acceptable | | | 789,623 | | | | 629,856 | | | | 152,237 | | | | 10,118 | | | | 184,428 | | | | 1,766,262 | |
| “C” Appreciable | | | 737,201 | | | | 244,513 | | | | 74,472 | | | | 5,700 | | | | 117,714 | | | | 1,179,600 | |
| “D” Significant | | | 467,418 | | | | 356,079 | | | | 28,789 | | | | 5,523 | | | | 90,242 | | | | 948,051 | |
| “E” Unrecoverable | | | 310,095 | | | | 177,132 | | | | 77,588 | | | | 18,851 | | | | 57,877 | | | | 641,543 | |
| Total loans and financial leases | | COP | 42,465,660 | | | COP | 12,580,661 | | | COP | 5,957,824 | | | COP | 334,591 | | | COP | 8,649,943 | | | COP | 69,988,679 | |
December 31, 2011
| Rating | | Commercial | | | Consumer | | | Mortgage | | | Small business
loans | | | Financial leases | | | Total | |
| “A” Normal | | COP | 36,178,917 | | | COP | 9,378,629 | | | COP | 4,568,655 | | | COP | 279,477 | | | COP | 6,689,482 | | | COP | 57,095,160 | |
| “B” Acceptable | | | 819,831 | | | | 824,253 | | | | 103,462 | | | | 10,046 | | | | 188,475 | | | | 1,946,067 | |
| “C” Appreciable | | | 457,906 | | | | 247,367 | | | | 55,265 | | | | 6,557 | | | | 146,798 | | | | 913,893 | |
| “D” Significant | | | 491,898 | | | | 230,958 | | | | 32,001 | | | | 6,013 | | | | 87,812 | | | | 848,682 | |
| “E” Unrecoverable | | | 264,445 | | | | 164,839 | | | | 81,285 | | | | 14,813 | | | | 59,244 | | | | 584,626 | |
| Total loans and financial leases | | COP | 38,212,997 | | | COP | 10,846,046 | | | COP | 4,840,668 | | | COP | 316,906 | | | COP | 7,171,811 | | | COP | 61,388,428 | |
Promissory notes documenting loans amounting to COP 1,124,726 and COP 957,698 at December 31, 2012 and 2011, respectively, have been duly endorsed to development banks, as required by applicable laws.
The following table represents a summary of troubled restructured loans:
| | | 2012 | | | 2011 | |
| | | | | | | |
| Performed by the Bank | | COP | 1,261,050 | | | COP | 1,263,924 | |
| Performed under local regulations | | | 293,637 | | | | 266,397 | |
| Interest and other receivables items | | | 13,689 | | | | 12,080 | |
| Trouble loans restructured | | | 1,568,376 | | | | 1,542,401 | |
| Allowances for loan losses | | | (509,423 | ) | | | (489,988 | ) |
| Troubled loans restructured, net | | COP | 1,058,953 | | | COP | 1,052,413 | |
(7) Allowance for Loans, Financial Leases and Accrued Interest Losses
The following table sets forth an analysisfor the Bank’ derivatives by type of risk as of December 31, 2015 and 2014, and as of January 1, 2014:
Derivatives | | December 31, 2015 | | | December 31, 2014 | | | January 1, 2014 | |
| | | In millions of COP | |
| Forwards |
| Assets | | | | | | | | | | | | |
| Foreign exchange contracts | | | 692,324 | | | | 496,748 | | | | 74,324 | |
| Equity contracts | | | 2,717 | | | | 17,141 | | | | 82 | |
| Interest rate contracts | | | - | | | | 14 | | | | 323 | |
| Subtotal | | | 695,041 | | | | 513,903 | | | | 74,729 | |
| Liabilities | | | | | | | | | | | | |
| Foreign exchange contracts | | | (634,297 | ) | | | (558,740 | ) | | | (60,375 | ) |
| Equity contracts | | | (5,395 | ) | | | (11,467 | ) | | | (4,248 | ) |
| Subtotal | | | (639,692 | ) | | | (570,207 | ) | | | (64,623 | ) |
| Total | | | 55,349 | | | | (56,304 | ) | | | 10,106 | |
| Swaps | | | | | | | | | | | | |
| Assets | | | | | | | | | | | | |
| Foreign exchange contracts | | | 1,293,947 | | | | 748,364 | | | | 283,529 | |
| Interest rate contracts | | | 257,238 | | | | 3,898 | | | | 139,042 | |
| Subtotal | | | 1,551,185 | | | | 752,262 | | | | 422,571 | |
| Liabilities | | | | | | | | | | | | |
| Foreign exchange contracts | | | (949,668 | ) | | | (535,758 | ) | | | (220,514 | ) |
| Interest rate contracts | | | (267,113 | ) | | | (22,924 | ) | | | (96,681 | ) |
| Subtotal | | | (1,216,781 | ) | | | (558,682 | ) | | | (317,195 | ) |
| Total | | | 334,404 | | | | 193,580 | | | | 105,376 | |
| Options | | | | | | | | | | | | |
| Assets | | | | | | | | | | | | |
| Foreign exchange contracts | | | 135,942 | | | | 182,680 | | | | 32,319 | |
| Subtotal | | | 135,942 | | | | 182,680 | | | | 32,319 | |
| Liabilities | | | | | | | | | | | | |
| Foreign exchange contracts | | | (74,136 | ) | | | (87,348 | ) | | | (47,723 | ) |
| Equity contracts | | | - | | | | (255,542 | ) | | | (192,447 | ) |
| Subtotal | | | (74,136 | ) | | | (342,890 | ) | | | (240,170 | ) |
| Total | | | 61,806 | | | | (160,210 | ) | | | (207,851 | ) |
| Derivatives Assets | | | 2,382,168 | | | | 1,448,845 | | | | 529,619 | |
| Deririvatives Liabilities | | | (1,930,609 | ) | | | (1,471,779 | ) | | | (621,988 | ) |
| Total, net | | | 451,559 | | | | (22,934 | ) | | | (92,369 | ) |
The following table sets forth the remaining contractual life of the activityderivative portfolio:
| | | December 31, 2015 | |
| | | Forwards | | | Swaps | | | Options | | | Total | |
| | | In millions of COP | |
| Assets | | | 695,041 | | | | 1,551,185 | | | | 135,942 | | | | 2,382,168 | |
| Up to 1 year | | | 24,225 | | | | 722,894 | | | | 16,821 | | | | 763,940 | |
| From 1 to 3 years | | | 670,748 | | | | 172,834 | | | | 119,121 | | | | 962,703 | |
| Over 3 years | | | 68 | | | | 655,457 | | | | - | | | | 655,525 | |
| | | | | | | | | | | | | | | | | |
| Liabilities | | | (639,692 | ) | | | (1,216,781 | ) | | | (74,136 | ) | | | (1,930,609 | ) |
| Up to 1 year | | | (67,821 | ) | | | (376,173 | ) | | | (14,429 | ) | | | (458,423 | ) |
| From 1 to 3 years | | | (571,871 | ) | | | (256,064 | ) | | | (59,707 | ) | | | (887,642 | ) |
| Over 3 years | | | - | | | | (584,544 | ) | | | - | | | | (584,544 | ) |
| | | | | | | | | | | | | | | | | |
| Total | | | 55,349 | | | | 334,404 | | | | 61,806 | | | | 451,559 | |
| | | December 31, 2014 | |
| | | Forwards | | | Swaps | | | Options | | | Total | |
| | | In millions of COP | |
| Assets | | | 513,903 | | | | 752,262 | | | | 182,680 | | | | 1,448,845 | |
| Up to 1 year | | | 484,279 | | | | 176,241 | | | | 165,314 | | | | 825,834 | |
| From 1 to 3 years | | | 15,353 | | | | 335,274 | | | | 17,366 | | | | 367,993 | |
| Over 3 years | | | 14,271 | | | | 240,747 | | | | - | | | | 255,018 | |
| | | | | | | | | | | | | | | | | |
| Liabilities | | | (570,207 | ) | | | (558,682 | ) | | | (342,890 | ) | | | (1,471,779 | ) |
| Up to 1 year | | | (537,019 | ) | | | (129,433 | ) | | | (82,666 | ) | | | (749,118 | ) |
| From 1 to 3 years | | | (21,851 | ) | | | (144,280 | ) | | | (4,682 | ) | | | (170,813 | ) |
| Over 3 years | | | (11,337 | ) | | | (284,969 | ) | | | (255,542 | ) | | | (551,848 | ) |
| | | | | | | | | | | | | | | | | |
| Total | | | (56,304 | ) | | | 193,580 | | | | (160,210 | ) | | | (22,934 | ) |
| | | January 1, 2014 | |
| | | Forwards | | | Swaps | | | Options | | | Total | |
| | | In millions of COP | |
| Assets | | | 74,729 | | | | 422,571 | | | | 32,319 | | | | 529,619 | |
| Up to 1 year | | | 722 | | | | 93,783 | | | | 1,688 | | | | 96,193 | |
| From 1 to 3 years | | | 73,508 | | | | 55,286 | | | | 30,631 | | | | 159,425 | |
| Over 3 years | | | 499 | | | | 273,502 | | | | - | | | | 274,001 | |
| | | | | | | | | | | | | | | | | |
| Liabilities | | | (64,623 | ) | | | (317,195 | ) | | | (240,170 | ) | | | (621,988 | ) |
| Up to 1 year | | | (1,635 | ) | | | (49,359 | ) | | | (2,282 | ) | | | (53,276 | ) |
| From 1 to 3 years | | | (59,868 | ) | | | (96,172 | ) | | | (45,441 | ) | | | (201,481 | ) |
| Over 3 years | | | (3,120 | ) | | | (171,664 | ) | | | (192,447 | ) | | | (367,231 | ) |
| | | | | | | | | | | | | | | | | |
| Total | | | 10,106 | | | | 105,376 | | | | (207,851 | ) | | | (92,369 | ) |
Collateral for derivatives
The table below presents the collateral amounts posted under derivatives contracts as of December 31, 2015 and 2014, and January 1, 2014:
| | | December 31, 2015 | | | December
31, 2014 | | | January
1, 2014 | |
| | | In millions of COP | |
| Collateral | | | 442,915 | | | | 360,432 | | | | 201,671 | |
Hedge accounting
The Bank, through its subsidiary Banistmo, has entered into credit derivatives to manage its credit risk. Those derivatives are designated as hedging instruments to protect the Bank against changes in the allowance for loansfair value fluctuations of its subsidiary’s position in debt securities issued by the Panamanian Government (fair value hedge) and financial leases losses:to protect against interest risk due to changes in cash flows related to its subsidiary’s portfolio of floating-rate deposits (cash flow hedge). The hedge effectiveness assessment is performed on a monthly basis consistently throughout the hedging relationship. For fair value hedges, the changes in value of the hedging derivative, as well as the changes in value of the related hedged item concerning to the risk hedged, are reflected in the statement of income.
| | | 2012 | | | 2011 | | | 2010 | |
| Balance at beginning of period | | COP | 2,812,582 | | | COP | 2,509,213 | | | COP | 2,431,667 | |
| Sale of Asesuisa S.A. and Asesuisa Vida S.A.(1) | | | (688 | ) | | | - | | | | - | |
| Provisions for loan losses | | | 2,344,265 | | | | 1,796,873 | | | | 1,842,406 | |
| Reversals of provisions | | | (1,192,067 | ) | | | (972,251 | ) | | | (1,085,211 | ) |
| Charge-offs | | | (678,506 | ) | | | (531,682 | ) | | | (658,151 | ) |
| Effect of changes in foreign exchange rates | | | (35,947 | ) | | | 10,429 | | | | (21,498 | ) |
| Balance at end of year | | COP | 3,249,639 | | | COP | 2,812,582 | | | COP | 2,509,213 | |
| Ratio of charge-offs to average outstanding loans | | | 1.07 | % | | | 0.99 | % | | | 1.49 | % |
| Recovery of charged-off loans | | COP | 167,819 | | | COP | 244,141 | | | COP | 276,209 | |
Fair value hedging
| (1) | On September 27, 2012, Banagricola S.A. and Inversiones Financieras Banco Agrícola S.A., subsidiaries of Bancolombia S.A., sold to Suramericana 97.03% of its shares of capital stock of Aseguradora Suiza Salvadoreña. See note 1 “Organization and background”. |
RecoveriesAs of charged-off loansDecember 31, 2015 and 2014 and January 1, 2014, Banistmo has designated 7, 8 and 15 asset derivative contracts (Interest rate swaps), respectively, as fair value hedging instruments with maturity dates ranging from January 2015 to February 2023.
As of December 31, 2015 and 2014 and January 1, 2014, Banistmo has designated 9, 8 and 13 liability derivative contracts (Interest rate swaps), respectively, as fair value hedging instruments with maturity dates ranging from January 2018 to February 2022. The notional amount and the fair value of those instruments are recorded separatelyas follows:
| | | In millions of COP | |
| | | December 31, 2015 | | | December 31, 2014 | | | January 1, 2014 | |
| Notional amount | | | 321,025 | | | | 243,863 | | | | 309,656 | |
| Fair value | | | (6,284 | ) | | | (2,373 | ) | | | 13,832 | |
| | | In thousands of USD | |
| | | December 31, 2015 | | | December
31, 2014 | | | January 1, 2014 | |
| Notional amount | | | 101,930 | | | | 101,930 | | | | 129,430 | |
| Fair value | | | (1,995 | ) | | | (992 | ) | | | 5,782 | |
All the aforementioned fair value hedging instruments are classified in the consolidated statementsline of operations.the statement of financial position as ‘Derivative financial instruments’.
The following table sets forth the activitynotional amount and fair value of the hedged item recognized in the statement of financial position as ‘Financial assets investments’, as of December 31, 2015 and 2014 and January 1, 2014:
| | | In millions of COP | |
| | | December 31, 2015 | | | December 31, 2014 | | | January 1, 2014 | |
| Notional amount | | | 321,025 | | | | 243,863 | | | | 249,390 | |
| Fair value | | | - | | | | 274,132 | | | | 276,113 | |
| | | In thousands of USD | |
| | | December 31, 2015 | | | December 31, 2014 | | | January 1, 2014 | |
| Notional amount | | | 101,930 | | | | 101,930 | | | | 129,430 | |
| Fair value | | | - | | | | 114,581 | | | | 143,299 | |
The change in value of the hedged item used as the basis for recognizing hedge ineffectiveness amounted to COP (3,110) and COP (1,982) for the periods ended December 31, 2015 and 2014, respectively.
Cash flow hedging
The following table sets forth the derivative instruments designated by Banistmo as cash flow hedging instruments, as of December 31, 2015, 2014 and January 1, 2014:
| | | In millions of COP | |
| | | December 31, 2015 | | | December 31, 2014 | | | January 1, 2014 | |
| Notional amount | | | 629,894 | | | | 478,492 | | | | 385,366 | |
| Fair value | | | (2,499 | ) | | | (10,106 | ) | | | (13,873 | ) |
| | | In thousands of USD | |
| | | December 31, 2015 | | | December 31, 2014 | | | January 1, 2014 | |
| Notional amount | | | 200,000 | | | | 200,000 | | | | 200,000 | |
| Fair value | | | (794 | ) | | | (4,224 | ) | | | (7,200 | ) |
All the cash flow hedging instruments are recognized in the line of the statement of financial position as ‘Derivative financial instruments’.
For the year ended December 31, 2014, the Bank has reclassified from OCI to the statement of income financial gains amounting to COP 2,361, related to the effectiveness of the cash flow hedge relationship.For the year ended December 31, 2015, the reclassification from OCI to the statement of income is nil.
The following tables set forth the expected cash flows related to the hedging relationships aforementioned, as well as the remaining periods:
| | | As of December 31, 2015 | |
| | | In millions of COP | |
| | | From 1 to 3 months | | | From 3 months to 1
year | | | From 1 year to 5 years | | | Total | |
| Cash inflows | | | 968 | | | | - | | | | - | | | | 968 | |
| Cash outflows | | | (3,467 | ) | | | - | | | | - | | | | (3,467 | ) |
| Total: | | | (2,499 | ) | | | - | | | | - | | | | (2,499 | ) |
| | | In thousands of USD | |
| | | From 1 to 3 months | | | From 3 months to 1
year | | | From 1 year to 5 years | | | Total | |
| Cash inflows | | | 307 | | | | - | | | | - | | | | 307 | |
| Cash outflows | | | (1,101 | ) | | | - | | | | - | | | | (1,101 | ) |
| Total: | | | (794 | ) | | | - | | | | - | | | | (794 | ) |
| | | As of December 31, 2014 | |
| | | In millions of COP | |
| | | From 1 to 3 months | | | From 3 months to 1
year | | | From 1 year to 5 years | | | Total | |
| Cash inflows | | | 602 | | | | - | | | | 3,794 | | | | 4,396 | |
| Cash outflows | | | (2,642 | ) | | | - | | | | (11,858 | ) | | | (14,500 | ) |
| Total: | | | (2,040 | ) | | | - | | | | (8,064 | ) | | | (10,104 | ) |
| | | In thousands of USD | |
| | | From 1 to 3 months | | | From 3 months to 1
year | | | From 1 year to 5 years | | | Total | |
| Cash inflows | | | 251 | | | | - | | | | 1,586 | | | | 1,837 | |
| Cash outflows | | | (1,105 | ) | | | - | | | | (4,956 | ) | | | (6,061 | ) |
| Total: | | | (854 | ) | | | - | | | | (3,370 | ) | | | (4,224 | ) |
As of December 31, 2015 and 2014 and January 1, 2014, the Bank has recognized unrealized gains in other comprehensive income amounting to COP 10,499, COP 7,120 and COP 5,197, respectively, in connection with the effective portion of the cash flow hedges.
The following table sets forth the carrying amount and fair value of the hedged item recognized in the statement of financial position as ‘Deposits from customers’, as of December 31, 2015 and 2014 and January 1, 2014:
| | | In millions of COP | |
| | | December
31, 2015 | | | December 31, 2014 | | | January 1, 2014 | |
| Carrying amount (Liability) | | | 629,894 | | | | 478,492 | | | | 385,366 | |
| Fair value | | | 649,362 | | | | 484,389 | | | | 391,570 | |
| | In thousands of USD | |
| | | December 31, 2015 | | | December 31, 2014 | | | January 1, 2014 | |
| Carrying amount (Liability) | | | 200,000 | | | | 200,000 | | | | 200,000 | |
| Fair value | | | 206,181 | | | | 202,465 | | | | 203,220 | |
Offsetting of derivatives
The table below presents derivative instruments subject to enforceable master netting agreements and other similar agreements but not offset in the statement of financial position as of December 31, 2015 and 2014 and January 1, 2014 by derivative and by risk:
| | | December 31, 2015 | |
| | | Derivatives Assets | | | Derivatives Liabilities | |
| | | In millions of COP | |
| Over-the-counter |
| Foreign exchange contracts |
| Swaps | | | 1,293,947 | | | | (949,668 | ) |
| Forwards | | | 692,324 | | | | (634,297 | ) |
| Option | | | 135,942 | | | | (74,136 | ) |
| Interest rate contracts |
| Swaps | | | 257,238 | | | | (267,113 | ) |
| Forwards | | | - | | | | - | |
| Equity contracts |
| Forwards | | | 2,717 | | | | (5,395 | ) |
| Gross derivative assets/liabilities | | | 2,382,168 | | | | (1,930,609 | ) |
| Offsetting of derivatives | | | - | | | | - | |
| Net derivatives in statement of financial position | | | 2,382,168 | | | | (1,930,609 | ) |
| Master netting agreements | | | (1,681,887 | ) | | | 1,930,609 | |
| Cash collateral received/paid | | | (476,709 | ) | | | - | |
| Total derivatives assetss/ liabilities | | | 223,572 | | | | - | |
| | | December 31, 2014 | |
| | | Derivatives Assets | | | Derivatives Liabilities | |
| | | In millions of COP | |
| Over-the-counter |
| Foreign exchange contracts |
| Swaps | | | 748,364 | | | | (535,758 | ) |
| Forwards | | | 496,748 | | | | (558,740 | ) |
| Option | | | 182,680 | | | | (87,348 | ) |
| Interest rate contracts |
| Swaps | | | 3,898 | | | | (22,924 | ) |
| Forwards | | | 14 | | | | - | |
| Equity contracts |
| Forwards | | | 17,141 | | | | (11,467 | ) |
| Option | | | - | | | | (255,542 | ) |
| Gross derivative assets/liabilities | | | 1,448,845 | | | | (1,471,779 | ) |
| Offsetting of derivatives | | | - | | | | - | |
| Net derivatives in statement of financial position | | | 1,448,845 | | | | (1,471,779 | ) |
| Master netting agreements | | | (939,489 | ) | | | 1,096,708 | |
| Cash collateral received/paid | | | (156,807 | ) | | | 123,124 | |
| Total derivatives assetss/ liabilities | | | 352,549 | | | | (251,947 | ) |
| | | January 1, 2014 | |
| | | Derivatives Assets | | | Derivatives Liabilities | |
| | | In millions of COP | |
| Over-the-counter |
| Foreign exchange contracts |
| Swaps | | | 283,529 | | | | (220,514 | ) |
| Forwards | | | 74,324 | | | | (60,375 | ) |
| Option | | | 32,319 | | | | (47,723 | ) |
| Interest rate contracts |
| Swaps | | | 139,042 | | | | (96,681 | ) |
| Forwards | | | 323 | | | | - | |
| Equity contracts |
| Forwards | | | 82 | | | | (4,248 | ) |
| Option | | | - | | | | (192,447 | ) |
| Gross derivative assets/liabilities | | | 529,619 | | | | (621,988 | ) |
| Offsetting of derivatives | | | - | | | | - | |
| Net derivatives in statement of financial position | | | 529,619 | | | | (621,988 | ) |
| Master netting agreements | | | (357,575 | ) | | | 308,671 | |
| Cash collateral received/paid | | | 60,472 | | | | 106,943 | |
| Total derivatives assetss/ liabilities | | | 232,516 | | | | (206,374 | ) |
For further information about offsetting of other financial assets and liabilities see Note 15 Interbank deposits and liabilities.
NOTE 6. LOANS AND ADVANCES TO CUSTOMERS
The following is the composition of the loans and financial leasing operations portfolio as of December 31, 2015 and 2014 and January 1, 2014:
Composition | | December 31, 2015 | | | December 31, 2014 | | | January 1, 2014 | |
| | | In millions of COP | |
| Commercial | | | 85,892,752 | | | | 65,473,755 | | | | 53,217,137 | |
| Consumer | | | 21,170,615 | | | | 18,927,154 | | | | 16,885,371 | |
| Mortgage | | | 17,118,783 | | | | 12,547,645 | | | | 10,358,363 | |
| Financial Leases | | | 20,551,576 | | | | 17,565,229 | | | | 15,415,715 | |
| Small Business Loan | | | 886,913 | | | | 659,870 | | | | 526,732 | |
| Total gross loan and financial leases | | | 145,620,639 | | | | 115,173,653 | | | | 96,403,318 | |
| Total allowance | | | (5,248,755 | ) | | | (4,789,257 | ) | | | (4,473,562 | ) |
| Total net loan and financial leases | | | 140,371,884 | (1) | | | 110,384,396 | | | | 91,929,756 | |
For more details on the composition of the loans and financial leasing operations portfolio, see section Risk Management paragraph Categories loans Concentration
| (1) | The portfolio acquired in the business combination of Grupo Agromercantil Holding amounts to COP 8,162,177, see Note 8.3. Additionally, Compañía de Financiamiento Tuya S.A. is considered a discontinued operation as of December 31, 2015. As a result Compañía de Financiamiento Tuya S.A.’s portfolio is classified within "assets held for sale and inventories"; the net balance amounted to COP 1,480,398. See Note 31 Discontinued Operations. |
Allowances for loan losses
The following table sets forth the changes in the allowance for accrued interest losses:loan and financial lease losses as of December 31, 2015 and 2014:
| | | 2012 | | | 2011 | | | 2010 | |
| | | | | | | | | | |
| Balance at beginning of year | | COP | 43,644 | | | COP | 38,952 | | | COP | 45,937 | |
| Provision | | | 48,085 | | | | 31,852 | | | | 33,540 | |
| Charge-offs | | | (15,142 | ) | | | (9,088 | ) | | | (18,057 | ) |
| Reversal of provisions | | | (22,067 | ) | | | (18,133 | ) | | | (22,118 | ) |
| Effect of changes in foreign exchange rates | | | (494 | ) | | | 61 | | | | (350 | ) |
| Balance at end of year | | COP | 54,026 | | | COP | 43,644 | | | COP | 38,952 | |
December 31, 2015 |
| Concept | | Commercial | | | Consumer | | | Mortgage | | | Small business
loans | | | Financial
Leases | | | Total | |
| In millions of COP |
| +Balance at beginning of period | | | 2,360,488 | | | | 1,479,460 | | | | 456,983 | | | | 76,560 | | | | 415,766 | | | | 4,789,257 | |
| - Discontinued Operation(1) | | | - | | | | (282,098 | ) | | | - | | | | - | | | | - | | | | (282,098 | ) |
| + Provisions for loan losses(2) | | | 2,671,337 | | | | 697,282 | | | | 145,663 | | | | 47,880 | | | | 498,092 | | | | 4,060,254 | |
| - Charges-off | | | (711,257 | ) | | | (629,628 | ) | | | (12,765 | ) | | | (36,682 | ) | | | (31,723 | ) | | | (1,422,055 | ) |
| - Recoveries(2) | | | (1,709,293 | ) | | | (64,340 | ) | | | (63,632 | ) | | | (9,947 | ) | | | (328,183 | ) | | | (2,175,395 | ) |
| +/- Translation adjustment | | | 83,690 | | | | 120,605 | | | | 46,523 | | | | 2,775 | | | | 25,199 | | | | 278,792 | |
| = Balance at end of year | | | 2,694,965 | | | | 1,321,281 | | | | 572,772 | | | | 80,586 | | | | 579,151 | | | | 5,248,755 | |
F-38 | (1) | As of December 31, 2015, Compañía de Financiamiento Tuya S.A. is consider as a discontinued operation, see Note 31. The changes in the allowance for loan losses for this company is as follows: |
| Concept | | December 31, 2015 | |
| +Balance at beginning of period | | | 282,098 | |
| + Provisions for loan losses | | | 446,614 | |
| - Charges-off | | | (236,196 | ) |
| - Recoveries | | | (141,141 | ) |
| +/- Translation adjustment | | | - | |
| = Balance at end of year | | | 351,375 | |
(8) Customers’ Acceptances and Derivatives
| (2) | The provision for loan losses, net COP 1,884,859 differs from the COP 1,667,680 presented in the line “Credit impairment charges on loans and financial leases, net” of the Consolidated Statement of Income in the amount of COP 217,179 due to the recovery of charged-off loans. |
| | | December 31, 2014 | |
| Concept | | Commercial | | | Consumer | | | Mortgage | | | Small business
loans | | | Financial
Leases | | | Total | |
| | | In millions of COP | |
| +Balance at beginning of period | | | 2,194,931 | | | | 1,353,718 | | | | 426,282 | | | | 71,213 | | | | 427,418 | | | | 4,473,562 | |
| + Provisions for loan losses(1) | | | 1,346,282 | | | | 1,540,144 | | | | 116,599 | | | | 46,422 | | | | 195,648 | | | | 3,245,095 | |
| - Charges-off | | | (355,881 | ) | | | (743,453 | ) | | | (8,674 | ) | | | (30,468 | ) | | | (40,272 | ) | | | (1,178,748 | ) |
| - Recoveries(1) | | | (888,108 | ) | | | (753,897 | ) | | | (106,608 | ) | | | (12,757 | ) | | | (174,900 | ) | | | (1,936,270 | ) |
| +/- Translation adjustment | | | 63,264 | | | | 82,948 | | | | 29,384 | | | | 2,150 | | | | 7,872 | | | | 185,618 | |
| = Balance at end of year | | | 2,360,488 | | | | 1,479,460 | | | | 456,983 | | | | 76,560 | | | | 415,766 | | | | 4,789,257 | |
| (1) | The provision for loan losses, net COP 1,308,825 differs from the COP 843,597 presents in the line “Credit impairment charges on loans and financial leases, net” of the Consolidated Statement of Income, in the amount of COP 465,228 due to the recovery of charged-off loans for COP 264,856 and the provision for loan losses, net for COP 200,372 of Compañía de Financiamiento Tuya S.A., which is classified in the "discontinued operation" at December 31, 2015. See Note 31 Discontinued Operations. |
Leasing operations:
Finance leases - lessor
The Bank’s rightsBank has subscribed lease agreements as lessor. These leases arrangements involve machinery and commitments from customers’ acceptancesequipment, computer equipment, automobile and derivatives operations werefurniture and fixtures and their terms range between three and ten years, as follows:
| | | | 2012 | | | | 2011 | |
| Assets | | | | | | | | | | |
| | | | | | | | | | | |
| Customer Acceptances | | | COP | 54,263 | | | | COP | 35,201 | |
| | | | | | | | | | | |
| Derivative Assets | | | | | | | | | | |
| Spot Transactions | | | | 206 | | | | | 180 | |
| Future Contracts | | | | 11 | | | | | 11 | |
| Forward Contracts | | | | 116,966 | | | | | 94,402 | |
| Swaps | | | | 597,890 | | | | | 547,991 | |
| Options | | | | 13,678 | | | | | 63,511 | |
| Total Derivative Assets | | | | 728,751 | | | | | 706,095 | |
| | | | | | | | | | | |
| Total Customer Acceptances and Derivative Assets | | | | 783,014 | | | | | 741,296 | |
| | | | | | | | | | | |
| Liabilities | | | | | | | | | | |
| Customers Acceptances | | | | 54,263 | | | | | 35,201 | |
| | | | | | | | | | | |
| Derivative Liabilities | | | | | | | | | | |
| Forward contracts | | | | 98,226 | | | | | 143,068 | |
| Swaps | | | | 422,839 | | | | | 297,864 | |
| Options | | | | 50,304 | | | | | 37,842 | |
| Total Derivative Liabilities | | | | 571,369 | | | | | 478,774 | |
| | | | | | | | | | | |
| Total Customers Acceptances and Derivative liabilities | | | COP | 625,632 | | | | COP | 513,975 | |
| | | As of December 31, 2015 | |
| Period | | Gross investment | | | Present value of minimum
payments | |
| | | In millions of COP | |
| Within 1 year | | | 3,198,897 | | | | 2,717,904 | |
| Over 1 year, but less than 5 years | | | 7,679,476 | | | | 6,227,836 | |
| Over 5 years | | | 18,896,256 | | | | 11,605,836 | |
| Total | | | 29,774,629 | | | | 20,551,576 | |
| Less: Future financial income(1) | | | (9,223,053 | ) | | | - | |
| Present value of payments receivable | | | 20,551,576 | | | | 20,551,576 | |
| Minimum non-collectable payments impairment | | | (553,071 | ) | | | (553,071 | ) |
| Total | | | 19,998,505 | | | | 19,998,505 | |
F-39 | (1) | Future financial income: Total Gross Investment - Total Present Value of minimum payments |
| | | As of December 31, 2014 | |
| Period | | Gross investment | | | Present value of minimum
payments | |
| | | In millions of COP | |
| Within 1 year | | | 931,729 | | | | 865,478 | |
| Over 1 year, but less than 5 years | | | 7,527,860 | | | | 6,285,804 | |
| Over 5 years | | | 14,726,962 | | | | 10,413,947 | |
| Total | | | 23,186,551 | | | | 17,565,229 | |
| Less:Future financial income(1) | | | (5,621,322 | ) | | | - | |
| Present value of payments receivable | | | 17,565,229 | | | | 17,565,229 | |
| Minimum non-collectable payments impairment | | | (352,680 | ) | | | (352,680 | ) |
| Total | | | 17,212,549 | | | | 17,212,549 | |
| (1) | Future financial income: Total Gross Investment - Total Present Value of minimum payments |
Unsecured residual values4
The unsecured residual values by type of asset are as follows:
| | | As of December | |
| Type of asset | | December 31, 2015 | | | December 31, 2014 | |
| | | In millions of COP | |
| Machinery and equipment | | | 66,493 | | | | 22,481 | |
| Properties | | | 63,102 | | | | 626 | |
| Automobile | | | 51,559 | | | | 38,580 | |
| Computer equipment | | | 23,759 | | | | 19,079 | |
| Furniture and fixtures | | | 8,446 | | | | 7,899 | |
| Other assets | | | 434 | | | | 435 | |
| Total | | | 213,793 | | | | 89,100 | |
Operating leases - lessor
Certain of the Bank’s subsidiaries lease assets to third parties under non-cancelable lease arrangements. Assets provided through operating leases are recorded as property, plant and equipment. The terms established for these agreements range from 1 to 10 years.
The following table presents the information of minimum payments by lease to be received as of December 31:
| | | 2015 | | | 2014 | |
| | | In millions of COP | |
| Within 1 year | | | 132,621 | | | | 101,208 | |
| Over 1 year, but less than 5 years | | | 664,673 | | | | 511,909 | |
| Over5 years | | | 169,520 | | | | 147,767 | |
| Total | | | 966,814 | | | | 760,884 | |
4 The unsecured residual value is the part of the residual value of the leased asset, whose realization is not secured or is secured by a third party related to the lessor.
(9) Accounts ReceivableNOTE 7. INVESTMENTS IN ASSOCIATES AND JOINT VENTURES
Accounts receivable consistedThe following table presents information regarding the Bank’s investments in associates and joint ventures:
| Composition | | December
31, 2015 | | | December
31, 2014 | | | January
1, 2014 | |
| | | In millions of COP | |
| Investments in associates | | | 540,955 | | | | 1,348,683 | | | | 1,028,376 | |
| Joint ventures | | | 5,594 | | | | 1,014 | | | | 1,106 | |
| Total | | | 546,549 | | | | 1,349,697 | | | | 1,029,482 | |
The following are the investments in associates that the Bank holds as of December 31, 2015 and 2014 and January 1, 2014:
| As of December 31, 2015 | |
| Investments in Associates | |
| Company Name | | Main activity | | Country | | % of Ownership
interest | | | Equity
method (1) | | | Total
OCI | | | OCI (Equity
method) | | | OCI (CTA)2 | | | Carrying
amount | |
| In millions of COP | |
| Protección S.A. | | Administration of pension funds and severances | | Colombia | | | 20.58 | % | | | 25,238 | | | | 10,504 | | | | (10,311 | ) | | | - | | | | 416,404 | |
| Titularizadora Colombiana S.A. | | Mortgage portfolio securities | | Colombia | | | 26.98 | % | | | 2,163 | | | | (632 | ) | | | (464 | ) | | | - | | | | 37,174 | |
| Redeban Multicolor S.A. | | Network data transmission services | | Colombia | | | 20.36 | % | | | 2,106 | | | | (602 | ) | | | (425 | ) | | | - | | | | 16,737 | |
| Avefarma S.A.S | | Manufacture and distribution of glass packing for pharmaceutical products | | Colombia | | | 21.00 | % | | | (4,613 | ) | | | 329 | | | | (2,349 | ) | | | - | | | | 15,159 | |
| Reintegra S.A.S. | | Collections and recovery of portfolio | | Colombia | | | 46.00 | % | | | 2,598 | | | | 2,690 | | | | (2,914 | ) | | | - | | | | 10,014 | |
| Panamerican Pharmaceutical Holding Inc. | | Advisory services, consultation, representation, agent for individuals or company | | Panamá | | | 21.00 | % | | | 1,227 | | | | 250 | | | | (782 | ) | | | (949 | ) | | | 9,928 | |
| Internacional Ejecutiva de Aviación S.A.S. | | aircraft and aircraft travel | | Colombia | | | 33.33 | % | | | (113 | ) | | | - | | | | - | | | | - | | | | 8,009 | |
| ACH Colombia S.A. | | Electronic transfer services | | Colombia | | | 19.94 | % | | | 1,566 | | | | (74 | ) | | | 72 | | | | - | | | | 5,678 | |
| Servicio Salvadoreño de Protección, S. A. de C.V. | | Custodial services and transfer of monetary types | | Colombia | | | 24.40 | % | | | 1,303 | | | | (1,922 | ) | | | 956 | | | | (686 | ) | | | 5,550 | |
| Multiactivos S.A. | | Securitization of non-mortgage assets | | El Salvador | | | 21.25 | % | | | (336 | ) | | | (70 | ) | | | 51 | | | | - | | | | 3,917 | |
| Servicios Financieros, S.A. de C.V. | | Processing of financial transactions and electronic payment methods | | Colombia | | | 46.72 | % | | | 287 | | | | 102 | | | | (93 | ) | | | 76 | | | | 3,667 | |
| Concesiones CCFC S.A. | | Construction of public works through an awarding system | | El Salvador | | | 25.50 | % | | | 3,213 | | | | (749 | ) | | | 720 | | | | - | | | | 3,174 | |
| Concesiones Urbanas S.A. (en liquidación) | | Construction of civil engineering projects | | Colombia | | | 33.33 | % | | | 154 | | | | - | | | | - | | | | - | | | | 2,489 | |
| Investments in Associates | |
| Company Name | | Main activity | | Country | | % of Ownership
interest | | | Equity
method (1) | | | Total
OCI | | | OCI (Equity
method) | | | OCI (CTA)2 | | | Carrying
amount | |
| In millions of COP | |
| Glassfarma Tech S.A.S | | Manufacturing, elaboration and commercialization of packages and pharmaceutical products | | Colombia | | | 21.00 | % | | | 91 | | | | 336 | | | | (199 | ) | | | - | | | | 2,337 | |
| ACH de El Salvador, S. A. de C.V. | | Electronic transfer services | | El Salvador | | | 24.40 | % | | | 117 | | | | 64 | | | | (58 | ) | | | 45 | | | | 718 | |
| Grupo Agromercantil Holding S.A.(2) | | Offering of financial products portfolio and the initiation of business | | Guatemala | | | - | | | | 84,141 | | | | - | | | | 41,304 | | | | - | | | | - | |
| Inversiones Inmobiliarias Arauco Alameda S.A.S.(3) | | Real estate activities with separate properties or leasings | | Colombia | | | - | | | | (1,232 | ) | | | - | | | | (1,714 | ) | | | - | | | | - | |
| Net investments in associates | | | | | | | | | | | 117,910 | | | | 10,226 | | | | 23,794 | | | | (1,514 | ) | | | 540,955 | |
| (1) | Corresponds to the income recognized as equity method in the statement of income for the year ended December 31, 2015 |
| (2) | On December 30, 2015 the Bank acquired 60% of Grupo Agromercantil Holding S.A., however, the table presents the recognition of the Equity Method before the control acquisition when the Bank’s investment was 40%. |
| (3) | On November 20, 2015 Bancolombia Group sold its investment in Inversiones Inmobiliarias Arauco Alameda S.A.S. |
As of December 31, 2014:
| Investments in Associates | |
| Company Name | | Main activity | | Country | | % of Ownership
interest | | | Equity method
(1) | | | OCI (Equity
method) | | | OCI (CTA)2 | | | Carrying
amount | |
| In millions of COP | |
| Grupo Agromercantil Holding S.A. | | Offering of financial products portfolio and the initiation of business | | Guatemala | | | 40.00 | % | | | (2,704 | ) | | | 41,304 | | | | 9,452 | | | | 663,118 | |
| Protección S.A. | | Administration of pension funds and severances | | Colombia | | | 20.58 | % | | | 53,137 | | | | 193 | | | | - | | | | 408,810 | |
| Inversiones Inmobiliarias Arauco Alameda S.A.S. | | Real estate activities with separate properties or leasings | | Colombia | | | 33.81 | % | | | (10,454 | ) | | | (1,713 | ) | | | - | | | | 158,794 | |
| Titularizadora Colombiana S.A. Hitos | | Mortgage portfolio securities | | Colombia | | | 26.98 | % | | | 2,832 | | | | (1,096 | ) | | | - | | | | 37,825 | |
| Avefarma S.A.S | | Manufacture and distribution of glass packing for pharmaceutical products | | Colombia | | | 21.00 | % | | | 6,455 | | | | (2,020 | ) | | | - | | | | 17,738 | |
| Redeban Multicolor S.A. | | Network data transmission services | | Colombia | | | 20.36 | % | | | 918 | | | | (1,027 | ) | | | - | | | | 14,601 | |
| Panamerican Pharmaceutical Holding Inc. | | Advisory services, consultation, representation, agent for individuals or company | | Panama | | | 21.00 | % | | | 4,667 | | | | (531 | ) | | | 2,532 | | | | 13,642 | |
| Concesiones CCFC S.A. | | Construction of public works through an awarding system | | Colombia | | | 25.50 | % | | | 3,629 | | | | (29 | ) | | | - | | | | 7,136 | |
| Reintegra S.A.S. | | Collections and recovery of portfolio | | Colombia | | | 46.00 | % | | | 1,666 | | | | (224 | ) | | | - | | | | 6,236 | |
| ACH Colombia S.A. | | Electronic transfer services | | Colombia | | | 19.94 | % | | | 859 | | | | (2 | ) | | | - | | | | 5,024 | |
| Multiactivos S.A. | | Securitization of non-mortgage assets | | Colombia | | | 21.25 | % | | | (23 | ) | | | (19 | ) | | | - | | | | 4,303 | |
| Investments in Associates | |
| Company Name | | Main activity | | Country | | % of Ownership
interest | | | Equity method
(1) | | | OCI (Equity
method) | | | OCI (CTA)2 | | | Carrying
amount | |
| In millions of COP | |
| Servicio Salvadoreño de Protección, S. A. de C.V. | | Custodial services and transfer of monetary types | | El Salvador | | | 24.40 | % | | | (938 | ) | | | (966 | ) | | | (417 | ) | | | 4,094 | |
| Servicios Financieros, S.A. de C.V. | | Processing of financial transactions and electronic payment methods | | El Salvador | | | 46.72 | % | | | 73 | | | | 8 | | | | 18 | | | | 2,536 | |
| Concesiones Urbanas S.A. (en liquidación) | | Construction of civil engineering projects | | Colombia | | | 33.33 | % | | | 158 | | | | - | | | | - | | | | 2,335 | |
| Glassfarma Tech S.A.S | | Manufacturing, elaboration and commercialization of packages and pharmaceutical products | | Colombia | | | 21.00 | % | | | 308 | | | | 137 | | | | - | | | | 2,047 | |
| ACH de El Salvador, S. A. de C.V. | | Electronic transfer services | | El Salvador | | | 24.40 | % | | | 61 | | | | 6 | | | | 13 | | | | 444 | |
| Net investments in associates | | | | | | | | | | | 60,644 | | | | 34,021 | | | | 11,598 | | | | 1,348,683 | |
| (1) | Corresponds to the income recognized as equity method in the statement of income for the year ended December 31, 2014. |
| (2) | CTA = currency translation adjustment. |
As of January 1, 2014
| Investments in Associates | |
| Company Name | | Main activity | | Country | | % of Ownership interest | | | Carrying
amount | |
| In millions of COP | |
| Grupo Agromercantil Holding S.A. | | Offering of financial products portfolio and the initiation of business | | Guatemala | | | 40.00 | % | | | 418,286 | |
| Protección S.A. | | Administration of pension funds and severances | | Colombia | | | 20.58 | % | | | 365,961 | |
| Inversiones Inmobiliarias Arauco Alameda S.A.S. | | Real estate activities with separate properties or leasing | | Colombia | | | 33.81 | % | | | 140,324 | |
| Titularizadora Colombiana S.A. Hitos | | Mortgage portfolio securities | | Colombia | | | 26.98 | % | | | 28,920 | |
| Redeban Multicolor S.A. | | Network data transmission services | | Colombia | | | 20.36 | % | | | 14,710 | |
| Avefarma S.A.S | | Manufacture and distribution of glass packing for pharmaceutical products | | Colombia | | | 21.00 | % | | | 13,503 | |
| Concesiones CCFC S.A. | | Construction of public works through an awarding system | | Colombia | | | 25.50 | % | | | 9,911 | |
| Panamerican Pharmaceutical Holding Inc. | | Advisory services, consultation, representation. agent for individuals or company | | Panama | | | 21.00 | % | | | 8,310 | |
| Reintegra S.A.S. | | Collections and recovery of portfolio | | Colombia | | | 46.00 | % | | | 7,397 | |
| Servicio Salvadoreño de Protección. S. A. de C.V. | | Custodial services and transfer of monetary types | | El Salvador | | | 24.40 | % | | | 5,167 | |
| ACH Colombia S.A. | | Electronic transfer services | | Colombia | | | 19.94 | % | | | 4,666 | |
| Multiactivos S.A. | | Securitization of non-mortgage assets | | Colombia | | | 21.25 | % | | | 4,346 | |
| Concesiones Urbanas S.A. | | Construction of civil engineering projects | | Colombia | | | 33.33 | % | | | 2,177 | |
| Servicios Financieros. S.A. de C.V. | | Processing of financial transactions and electronic payment methods | | El Salvador | | | 46.72 | % | | | 1,963 | |
| Glassfarma Tech S.A.S | | Manufacturing. elaboration and commercialization of packages and pharmaceutical products | | Colombia | | | 21.00 | % | | | 1,623 | |
| Saneal | | Real estate | | Panama | | | 35.83 | % | | | 819 | |
| ACH de El Salvador. S. A. de C.V. | | Electronic transfer services | | El Salvador | | | 24.40 | % | | | 293 | |
| Net investments in associates | | | | | | | | | | | 1,028,376 | |
The following is complementary information regarding the Bank’s most significant associates as of December 31, 2015 and 2014:
December 31, 2015
| Company Name | | Assets | | | Liabilities | | | Income from
ordinary
activities | | | Profits (loss) | | | Dividends | |
| | | In millions of COP | |
| Protección S.A. | | | 1,665,993 | | | | 485,279 | | | | 499,946 | | | | 164,342 | | | | 27,042 | |
| Titularizadora Colombiana S.A. Hitos | | | 145,246 | | | | 11,515 | | | | 24,295 | | | | 6,899 | | | | 3,278 | |
December 31, 2014
| Company Name | | Assets | | | Liabilities | | | Income from
ordinary
activities | | | Profits (loss) | | | Dividends | |
| | | In millions of COP | |
| Grupo Agromercantil Holding S.A. (1) | | | 8,332,635 | | | | 7,474,295 | | | | 350,383 | | | | 100,521 | | | | - | |
| Inversiones Inmobiliarias Arauco Alameda S.A.S. | | | 505,741 | | | | 182,144 | | | | 46,364 | | | | 23,230 | | | | - | |
| Titularizadora Colombiana S.A. Hitos | | | 152,293 | | | | 16,148 | | | | 32,075 | | | | 11,129 | | | | 4,734 | |
| (1) | On December 30, 2015 the Bank acquired 20% of Grupo Agromercantil Holding S.A., this company is a subsidiary of the Group with a total participation of 60%. |
As of December 31, 2015 and 2014, and January 1 2014, there are no restrictions on the capacity of associates for transferring funds to the Bank in the form of cash dividends.
The following are the Joint ventures that the Bank holds as of December 31, 2015 and 2014 and January 1, 2014:
| Investments in joint ventures December 31, 2015 |
| Company Name | | Main activity | | Country | | % of
Ownership
interest | | | Equity
method (1) | | | Total OCI | | | OCI
(Equity
method) | | | Value of
investment | |
| In millions of COP | |
| Fideicomiso Ruta del Sol - compartimento A | | Investment in infrastructure projects. | | Colombia | | | 50.00 | % | | | 4,567 | | | | 13 | | | | (13 | ) | | | 5,594 | |
| (1) | It corresponds to the income through equity participation of joint ventures recognized in the statement of income as of December 31, 2015. |
| Investments in joint ventures December 31, 2014 |
| Company Name | | Main activity | | Country | | % of
Ownership
interest | | | Equity method
(1) | | | Total OCI | | | Value of
investment | |
| In millions of COP | |
| Fideicomiso Ruta del Sol - compartimento A | | Investment in infrastructure projects | | Colombia | | | 50.00 | % | | | (97 | ) | | | - | | | | 1,014 | |
| (1) | It corresponds to the income through equity participation of joint ventures recognized in the statement of income as of December 31, 2014. |
| Investments in joint ventures January 1, 2014 |
| Company Name | | Main activity | | Country | | % of Participation | | | January 1, 2014 | |
| In millions of COP | |
| Fideicomiso Ruta del Sol - compartimento A | | Investment in infrastructure projects | | Colombia | | | 50,00 | % | | | 1,106 | |
As of December 31, 2015, there are no contingent liabilities incurred by the Bank regarding its interests in the joint ventures and associates aforementioned.
NOTE 8. GOODWILL AND INTANGIBLE ASSETS
Intangibles assets and goodwill are comprised as follows:
| | | December 31, 2015 | | | December 31, 2014 | | | January 1, 2014 | |
| | | In millions of COP | |
| Intangible assets | | | 607,586 | | | | 171,121 | | | | 305,824 | |
| Goodwill | | | 6,484,669 | | | | 4,414,728 | | | | 3,587,694 | |
| Total | | | 7,092,255 | | | | 4,585,849 | | | | 3,893,518 | |
8.1. Intangible assets.
The following table sets forth the Bank's intangible assets as of December 31, 2015 and 2014, including the reconciliation of initial and final balances of the following:cost, accrued amortization, and accrued impairment losses:
| | | | 2012(1) | | | | 2011(1) | |
| Advances to suppliers | | COP | 489,914 | | | COP | 348,366 | |
| Balance in favor on credit card clearing house | | | 488,218 | | | | 384,824 | |
| Commissions | | | 70,868 | | | | 60,478 | |
| Value Added Tax (VAT) - Asset | | | 39,808 | | | | 38,229 | |
| Recoveries of insurances on deposits (“Fogafin”) | | | 28,647 | | | | 20,342 | |
| Other credit card receivable (joint venture Tuya S.A.) | | | 27,705 | | | | 11,828 | |
| Treasury operations pending payment by the customers | | | 26,074 | | | | 2,964 | |
| Accounts receivables in branches | | | 20,966 | | | | 6,840 | |
| Overnight funds sold | | | 13,662 | | | | 13,638 | |
| Sale of goods and services | | | 12,606 | | | | 12,703 | |
| Fees on international wire transfers | | | 11,176 | | | | 11,860 | |
| Sierras del Chicó and Chicó Oriental | | | 5,330 | | | | 5,262 | |
| Insurance on securitization process | | | 3,723 | | | | 7,553 | |
| Dividends | | | 392 | | | | - | |
| Advances to employees | | | 272 | | | | 417 | |
| Insurance premium receivables(2) | | | - | | | | 55,311 | |
| Advances on commitments to purchase assets | | | - | | | | 2,041 | |
| Other receivables | | | 80,508 | | | | 82,565 | |
| Total accounts receivable | | | 1,319,869 | | | | 1,065,221 | |
| Allowance for account receivable | | | (76,606 | ) | | | (48,236 | ) |
| Account receivable, net | | COP | 1,243,263 | | | COP | 1,016,985 | |
| | | As of December 31, 2015 | |
Cost | | Trademarks | | | Licenses, software
and computer
applications | | | Client relationships | | | Total | |
| | | In millions of COP | |
| Balance at January 1, 2015 | | | - | | | | 774,236 | | | | - | | | | 774,236 | |
| Acquisitions | | | - | | | | 132,217 | | | | - | | | | 132,217 | |
| Terminated agreements/ Write off | | | - | | | | (20,405 | ) | | | - | | | | (20,405 | ) |
| Acquisition of Grupo Agromercantil Holding(1) | | | 18,069 | | | | 96,661 | | | | 330,497 | | | | 445,227 | |
| Assets classified as held for sale(2) | | | - | | | | (6,246 | ) | | | - | | | | (6,246 | ) |
| Foreign currency translation adjustment | | | - | | | | 58,888 | | | | - | | | | 58,888 | |
| Balance at December 31, 2015 | | | 18,069 | | | | 1,035,351 | | | | 330,497 | | | | 1,383,917 | |
(1)See section 8.3 of this Note
| (1) | Includes all accounts receivable except those originated for interest loans. |
| (2) | On September 27, 2012, Banagricola S.A. and Inversiones Financieras Banco Agrícola S.A., subsidiaries of Bancolombia S.A., sold to Suramericana 97.03% of its shares of capital stock of Aseguradora Suiza Salvadoreña, an insurance subsidiary in the Republic of El Salvador. See note 1, “Organization and background”. |
(2)See Note 31. Discontinued operations
| Amortization | | Trademarks | | | Licenses, software
and computer
applications | | | Client relationships | | | Total | |
| | | In millions of COP | |
| Balance at January 1, 2015 | | | - | | | | (603,115 | ) | | | - | | | | (603,115 | ) |
| Terminated agreements/ Write off | | | | | | | 23,309 | | | | - | | | | 23,309 | |
| Amortization expense | | | - | | | | (153,799 | ) | | | - | | | | (153,799 | ) |
| Assets classified as held for sale | | | - | | | | 3,979 | | | | - | | | | 3,979 | |
| Foreign currency translation adjustment | | | - | | | | (46,705 | ) | | | - | | | | (46,705 | ) |
| Balance at December 31, 2015 | | | - | | | | (776,331 | ) | | | - | | | | (776,331 | ) |
| | | | | | | | | | | | | | | | | |
| Intangible assets at December 31, 2015, net | | | 18,069 | | | | 259,020 | | | | 330,497 | | | | 607,586 | |
| | | As of December 31, 2014 | |
Cost | | Trademarks | | | Licenses | | | Client relationships | | | Total | |
| | | In millions of COP | |
| |
| Balance at January 1, 2014 | | | - | | | | 706,089 | | | | - | | | | 706,089 | |
| Acquisitions | | | - | | | | 48,972 | | | | - | | | | 48,972 | |
| Terminated agreements/ Write off | | | - | | | | (19,051 | ) | | | - | | | | (19,051 | ) |
| Foreign currency translation adjustment | | | - | | | | 38,226 | | | | - | | | | 38,226 | |
| Balance at December 31, 2014 | | | - | | | | 774,236 | | | | - | | | | 774,236 | |
| Amortization | | Trademarks | | | Licenses | | | Client relationships | | | Total | |
| | | In millions of COP | |
| Balance at January 1, 2014 | | | - | | | | (395,479 | ) | | | - | | | | (395,479 | ) |
| Amortization expense | | | - | | | | (178,261 | ) | | | - | | | | (178,261 | ) |
| Foreign currency translation adjustment | | | - | | | | (29,375 | ) | | | - | | | | (29,375 | ) |
| Balance at December 31, 2014 | | | - | | | | (603,115 | ) | | | - | | | | (603,115 | ) |
| | | | | | | | | | | | | | | | | |
| Intangible assets at December 31, 2014, net | | | - | | | | 171,121 | | | | - | | | | 171,121 | |
The changes in allowanceAs of December 31, 2015 and 2014, the Bank does not have intangible assets with restricted ownership, intangible assets pledged as collateral or contractual agreements for accounts receivable losses are as follows:
| | | 2012 | | | 2011 | | | 2010 | |
| | | | | | | | | | |
| Balance at beginning of year | | COP | 48,236 | | | COP | 63,759 | | | COP | 72,619 | |
| Sale of AFP Crecer(1) | | | - | | | | (150 | ) | | | - | |
| Sale of Asesuisa S.A. and Asesuisa Vida(2) | | | (615 | ) | | | - | | | | - | |
| Provision for uncollectible amounts | | | 104,015 | | | | 56,534 | | | | 63,224 | |
| Charge - offs | | | (34,958 | ) | | | (16,904 | ) | | | (24,920 | ) |
| Effect of difference in exchange rate | | | (586 | ) | | | 108 | | | | (2,170 | ) |
| Reversal of provision and recoveries | | | (39,486 | ) | | | (55,111 | ) | | | (44,994 | ) |
| Balance at end of year | | COP | 76,606 | | | COP | 48,236 | | | COP | 63,759 | |
| (1) | Corresponds to allowance accounted for AFP Crecer as of December 31, 2010. During 2011, the Bank sold 99.99% of the shares of capital stock in AFP Crecer. |
| (2) | On September 27, 2012, Banagricola S.A. and Inversiones Financieras Banco Agrícola S.A., subsidiaries of Bancolombia S.A., sold to Suramericana 97.03% of its shares of capital stock of Aseguradora Suiza Salvadoreña, an insurance subsidiary in the Republic of El Salvador. See note 1, “Organization and background”. |
(10) Premises and Equipmentthe acquisition of this class of assets.
AtResearch and development costs related to software development
During the periods ending December 31, 20122015 and 2011 Premises2014, the Bank incurred in costs that are directly related to software development amounted to COP 8,344 and Equipment consistedCOP 12,340, respectively. These costs were incurred during the design and implementation processes in connection with the updating and replacement of the following:mortgage core software application and SAP CRM software application. The expenses were recorded mainly as fees in the statement of income.
| | | 2012 | | | 2011 | |
| | | | | | | |
| Premises and Equipment | | | | | | | | |
| Lands | | COP | 124,031 | | | COP | 138,957 | |
| Buildings | | | 694,441 | | | | 702,936 | |
| Furniture, equipment and fixtures | | | 271,255 | | | | 265,931 | |
| Computer equipment | | | 388,234 | | | | 420,109 | |
| Vehicles | | | 7,930 | | | | 9,005 | |
| Construction in progress | | | 12,709 | | | | 12,392 | |
| Equipment in transit | | | 608,511 | | | | 823,260 | |
| Total | | | 2,107,111 | | | | 2,372,590 | |
| Less Accumulated depreciation | | | (758,623 | ) | | | (744,868 | ) |
| Allowance for impairment | | | (6,790 | ) | | | (5,411 | ) |
| Premises and equipment, net | | COP | 1,341,698 | | | COP | 1,622,311 | |
PremisesDuring 2014, there was also an initiative aimed at implementing the SAT software application related to credit card businesses, which had an investment for COP 9,869. This initiative was suspended; therefore, the asset was charged-off, and equipment depreciation expense forrecorded as expenses in the yearsyear ended December 31, 2012,2014.
Fully amortized intangible assets
As of December 31, 20112015 and December 31, 2010,2014, the Bank has intangible assets that have already fulfilled their estimated useful life but are still in use. The related gross basis cost amounted to COP 97,458, COP 97,80142,231 and COP 106,974,1,224, respectively.
(11) Premises and equipment under Operating Leases
Premises and equipment under operating leases whereIntangibles which did not meet the Bank or any of its subsidiaries actcriteria to be recognized as lessor consisted of the following:
| | | 2012 | | | 2011 | |
| | | | | | | |
| Machinery and equipment | | COP | 490,310 | | | COP | 257,013 | |
| Vehicles | | | 1,340,930 | | | | 910,320 | |
| Furniture, equipment and fixtures | | | 42,996 | | | | 33,420 | |
| Computer equipment | | | 450,828 | | | | 320,780 | |
| Real estate | | | 521,322 | | | | 321,984 | |
| Total | | | 2,846,386 | | | | 1,843,517 | |
| Lease payments receivables under lease contracts | | | 37,177 | | | | 32,425 | |
| Less accumulated depreciation | | | (645,743 | ) | | | (466,856 | ) |
| Allowance for impairment | | | (45,892 | ) | | | (29,029 | ) |
| Operating Leases, net | | COP | 2,191,928 | | | COP | 1,380,057 | |
Operating lease depreciation expense for the years ended December 31, 2012, 2011 and 2010, amounted to COP 222,144, COP 125,202 and COP 88,770, respectively.
(12) Prepaid Expenses and Deferred Charges
At December 31, 2012 and 2011, prepaid expenses and deferred charges consisted of the following:
| | | 2012 | | | 2011 | |
| Prepaid expenses: | | | | | | | | |
| Insurance premiums | | COP | 11,209 | | | COP | 13,695 | |
| Software licenses | | | 14,434 | | | | 10,212 | |
| Equipment maintenance | | | 1,053 | | | | 573 | |
| Commissions paid(1) | | | 2,692 | | | | - | |
| Other | | | 3,647 | | | | 5,682 | |
| Total prepaid expenses | | | 33,035 | | | | 30,162 | |
| | | | | | | | | |
| Deferred charges: | | | | | | | | |
| Equity tax and other contributions(2) | | | 228,056 | | | | 342,023 | |
| Software purchased and related capitalized costs under INNOVA project | | | 275,730 | | | | 259,130 | |
| Software other than under the Innova project | | | 59,095 | | | | 65,010 | |
| Discounts on issuance of bonds | | | 99,661 | | | | 47,139 | |
| Deferred tax asset(3) | | | 40,257 | | | | 382 | |
| Swaps fair value adjustment originated on their first contract day | | | 14,863 | | | | 20,953 | |
| Leasehold improvements | | | 1,522 | | | | 2,421 | |
| Commissions | | | 689 | | | | 1,292 | |
| Other | | | 20,022 | | | | 16,944 | |
| Total deferred charges | | | 739,895 | | | | 755,294 | |
| Total prepaid expenses and deferred charges | | COP | 772,930 | | | COP | 785,456 | |
| (1) | As a consequence of the merger of the Suramericana’s portfolio funds Renta Fija and Renta Variable with Fiduciaria’s portfolio funds F.C.O. Fiducuenta and Renta Acciones, that took place in November 2012, a deferred commission was recognized by Fiduciaria Bancolombia, the Bank’s trust subsidiary. |
| (2) | Since 2007 Colombian tax regulations require companies to pay annually in addition to the income tax, a special tax defined as “Equity tax”, calculated on their net assets on the basis of their tax basis as of January 1 of each year at the statutory tax rate of 1.2%. During 2010 and 2011 a new regulation required companies to calculate this tax only once for the next four years as of January 1, 2011 at the tax rate of 6% and payable in eight semi-annual installments over four years without interest. The equity tax calculated by the Bank and its subsidiaries amounts to approximately COP 469,002. In accordance with accounting rules in Colombia, this amount was recorded as a deferred asset to be amortized on a straight line and an equivalent amount was recorded as an account payable. |
| (3) | See Note 2 “Summary of significant accounting policies”, (t) Deferred Tax. |
(13) Other Assets
AtSoftware licenses and fees and other payments less than COP 120 that directly relate to software development, are recorded as an expense in operations as incurred, mainly due to the fact that it is not possibly to associate those assets to a major software development. As of December 31, 20122015 and 2011, other assets consisted2014, the Bank has recognized in the statement of income the following:amount of COP 3,583 and COP 1,496, respectively, as intangibles that did not meet the criteria to be recorded as assets.
| | | 2012 | | | 2011 | |
| | | | | | | |
| Other assets: | | | | | | | | |
| Value added tax deductible and withholding taxes | | COP | 68,658 | | | COP | 50,289 | |
| Investment in Trust | | | 1,511 | | | | 10,217 | |
| Deposits in derivative operations | | | 152,481 | | | | 104,176 | |
| Assets to place in lease contracts | | | 1,839,615 | | | | 1,455,527 | |
| Inventory | | | 2,284 | | | | 1,875 | |
| Joint Ventures | | | 13,758 | | | | 16,855 | |
| Other | | | 10,640 | | | | 58,709 | |
| Total other assets | | COP | 2,088,947 | | | COP | 1,697,648 | |
(14)8.2 Goodwill
The following table sets forth an analysis of the activity in the goodwill account:
| | | 2012 | | | 2011 | | | 2010 | |
| | | | | | | | | | |
| Balance at beginning of the year | | COP | 679,861 | | | COP | 750,968 | | | COP | 855,724 | |
| Additions derived from the acquisition of Banagricola by Bancolombia Panamá | | | - | | | | - | | | | 27 | |
| Additions derived from the purshase to noncontrolling interest of Renting Colombia by Leasing Bancolombia(1) | | | - | | | | - | | | | 6,038 | |
| Acquisition of Uff Movil S.A.S(2) | | | 21,995 | | | | - | | | | - | |
| Other Additions(3) | | | 12 | | | | 52 | | | | 137 | |
| Sale of AFP Crecer subsidiary(4) | | | - | | | | (28,553 | ) | | | - | |
| Sale of Asesuisa subsidiary (see note 1) | | | (24,146 | ) | | | - | | | | - | |
| Amortization | | | (45,690 | ) | | | (51,239 | ) | | | (55,966 | ) |
| Effect of change in foreign exchange rate | | | (60,659 | ) | | | 8,633 | | | | (54,992 | ) |
| Balance at end of the year | | COP | 571,373 | | | COP | 679,861 | | | COP | 750,968 | |
| | | 2015 | | | 2014 | |
| | | In millions of COP | |
| Balance at beginning of the year, net | | | 4,414,728 | | | | 3,587,694 | |
| Impairment of Uff! Móvil’s goodwill | | | - | | | | (3,179 | ) |
| Refund of the amount paid(1) | | | - | | | | (37,684 | ) |
| Sale of Uff! Móvil(2) | | | (18,083 | ) | | | - | |
| Sale of Banistmo Seguros | | | (77,082 | ) | | | - | |
| Preliminary goodwill resulting from the GAH acquisition(3) | | | 735,073 | | | | - | |
| Effect of change in foreign exchange rate | | | 1,430,033 | | | | 867,897 | |
| Balance at end of the year, net | | | 6,484,669 | | | | 4,414,728 | |
(1)In March 2010, Leasing Bancolombia increased its equity interest participation in Renting Colombia, by buying the shares that the foreign partners, Mitsubishi International Corporation and Mitsubishi Corporation, had in Renting Colombia. As of December 31, 2011, the Bank had a participation of 100 % in Renting Colombia.
| (2)(1)
| In August 2012, Banagrícola,December 2014, HSBC Latin America Holding refunded COP 59,502 due to adjustments made to the price paid for Banistmo, of which COP 37,684 corresponds to adjustments directly related to the pricing. This amount was recognized as a reduction of the goodwill and the difference, COP 21,818, was recorded as income, because those adjustments were recognized by the Bank preveusly as expenses acquisition. |
| (2) | On November 30, 2015, the Bank sold its 80.59% stake in Uff! Móvil, which was held through Inversiones CFNS S.A.S. and BIBA Inmobiliaria S.A.S., the transaction was carried out by means of the sale of all shares of Uff! Móvil to MVNO Holdings LLC, a company established under the laws of the State of Florida in the United States. |
| (3) | On December 30, 2015, Bancolombia Panama S.A., a subsidiary of Bancolombia Panamá,the Bank, acquired 70% of Uff Móvil S.A.S. a telecommunications operator in Colombia. The transaction price was COP 21,000, a sum paid in full on the datean additional 20% of the transaction.common stock of Grupo Agromercantil Holding S.A. (GAH), which represents a controlling stake of 60%. See '8.3 Acquisition of Grupo Agromercantil Holding (GAH)' |
(3)The additions to the goodwill derived from new acquisitions of Banco Agricola by IFBA in the amount of COP 12 during 2012; the additions derived from acquisitions of IFBA by Banagricola, COP 52 during the year 2011 and COP 21 during the year 2010; besides, the additions derived from a acquisitions of Banco Agrícola by IFBA in the amount of COP 116 during the year 2010.
(4)On January 28, 2011, Banagrícola S.A. and IFBA subsidiaries of Bancolombia S.A., and Protección S.A. Sociedad Administradora de Fondos de Pensiones y Cesantias (“Protección S.A.”), signed a contract under wich Banagrícola S.A. and IFBA. sold to Protección S.A. the equivalent of 99.99% of the shares of capital stock of AFP Crecer, an administrator of pension funds in the Republic of El Salvador. Banagrícola S.A. and IFBA received a total of USD 104,531 as payment for the shares.
Goodwill derived from the acquisition of Banagricola S.A., Renting Colombia S.A and Uff Móvil S.A.S. were allocated by segments at December 31, 2012 as follows:impairment
| Segments | | Gross | | | Net of amortization | |
| | | | | | | |
| Banking El Salvador | | COP | 770,185 | | | COP | 547,554 | |
| Renting | | | 6,037 | | | | 2,875 | |
| Mobile Network Operator | | | 21,995 | | | | 20,944 | |
| | | COP | 798,217 | | | COP | 571,373 | |
At December 31, 2012, goodwill derived from2014, after performing the acquisition of Banagricola S.A. was tested forrequired impairment usingtest, the discounted cash flow methodology. The Bank concluded that there is nowas an impairment of goodwill.Uff Movil goodwill due to the continuing losses during the last years, and therefore recorded an impairment charge in the Other Segments for the excess over the fair value amounting to COP 3,179:
| | 2014 | |
| Balance at beginning of the year, net | | COP | 21,262 | |
| Impairment | | | (3,179 | ) |
| Balance at end of the year, net | | COP | 18,083 | |
The recoverable amount of Uff Movil at December 31, 2014 amounts to COP11,283, and was determined using the fair value through the discounted cash flows valuation methodology. This valuation methodology determines the fair value of the company considering its cash generation capability attributable to the stockholders. This methodology estimates the available future cash flows by simulating the company or cash-generation unit operating performance taking into account reasonable and objective key assumptions and forward-looking projections based on the Bank’s general expectations related to the business, the company’s historical trends and the qualified evaluator’s independent criteria; and finally for estimating the present value of the available cash flows, the model uses a discount rate which implies the time value of money and the business risks. Consequently, the asset is categorized within Level 3 of the fair value hierarchy.
On November 30, 2015, Uff! Móvil was sold to a third party and the related goodwill was disposed at a loss.
The Bank tests goodwill recognized upon business combinations for impairment at least annually using a process that begins with an estimation of the recoverable amount of a cash-generation unit (CGU). Fair value is determined by management by reference to market value, if available, by pricing models, or with the assistance of a qualified evaluator. Determination of fair value by a qualified evaluator or pricing model requires management to make assumptions and use estimates to forecast cash flow for periods that are beyond the normal requirements of management reporting; the assessment of the discount rate appropriate to the reporting unit; estimation of the fair value of cash-generation units; and the valuation of the separable assets of each business whose goodwill is being reviewed.
The key assumptions used by management in determining the fair value are:
Operating
segment | | Cash generating unit (CGU) | | Goodwill 2015(1) | | | Valuation Methodology | | Key
Assumptions | | Discount Rate (real) | | | Growth rate (real) | |
| Banking El | | Corporate Banking | | COP | 197,319 | | | | | | | | | | | | | |
| Salvador | | Consumer Banking | | | 572,403 | | | Cash flow | | 10 years plan | | | 13.28 | % | | | - | |
| | | Mortgage Banking | | | 119,102 | | | | | | | | | | | | | |
| Banking | | Corporate Banking | | | 2,677,571 | | | Cash flow | | 5 years plan | | | 11.40 | % | | | 5.20 | % |
| Panama | | Consumer Banking | | COP | 2,183,201 | | | | | | | | | | | | | |
(15) Foreclosed Assets
Operating
segment | | Cash generating unit
(CGU) | | Goodwill 2014(1) | | | Valuation
Methodology | | Key
Assumptions | | Discount Rate
(real) | | | Growth rate
(real) | |
| Banking El | | Corporate Banking | | COP | 149,889 | | | | | | | | | | | | | |
| Salvador | | Consumer Banking | | | 434,814 | | | Cash flow | | 10 years plan | | | 13.03 | % | | | - | |
| | | Mortgage Banking | | | 90,473 | | | | | | | | | | | | | |
| Banking | | Corporate Banking | | | 1,994,504 | | | | | | | | 12.10 | % | | | 6.70 | % |
| Panama | | Consumer Banking | | | 1,626,252 | | | Cash flow | | 5 years plan | | | | | | | | |
| | | Insurance | | | 88,565 | | | | | | | | 13.30 | % | | | 2.50 | % |
Other
Segments | | Mobile network operator | | COP | 18,083 | | | Cash flow | | 10 years plan | | | 11.50 | % | | | - | |
| (1) | Goodwill was allocated to each cash generating unit considering their proportional part of the total assets measured at fair value. |
Sensitivity analysis:
Foreclosed assets consistedIn order to assess the impact of changes in certain significant inputs such as the discount rate and the growth rate in the operating segments’ fair value, the qualified evaluators made a sensitivity analysis of these inputs through the definition of alternative scenarios with their future evolution. The tables below present the outcomes of each sensitivity analysis:
Other segments
| | | As of December 31, 2014 | |
| Growth rate | | | Discount rate | |
| | | | 10.50 | % | | | 11.50 | % | | | 12.50 | % |
| 0.00% | | COP | 12,739 | | | COP | 11,283 | | | COP | 10,063 | |
Banking Panama
Corporate banking
| | | As of December 31, 2015 | |
| Growth rate | | | Discount rate | |
| | | | 11.60 | % | | | 11.40 | % | | | 11.20 | % |
| 5.20% | | COP | 4,378,598 | | | COP | 4,530,538 | | | COP | 4,692,729 | |
| | | | | | | | | | | | | |
| Discount rate | | | Growth rate | |
| | | | 4.90 | % | | | 5.20 | % | | | 5.40 | % |
| 11.40% | | COP | 4,426,517 | | | COP | 4,530,538 | | | COP | 4,643,317 | |
| | | As of December 31, 2014 | |
| Growth rate | | | Discount rate | |
| | | | 11.10 | % | | | 12.10 | % | | | 13.10 | % |
| 6.70% | | COP | 3,434,063 | | | COP | 2,752,636 | | | COP | 2,285,368 | |
| | | | | | | | | | | | | |
| Discount rate | | | Growth rate | |
| | | | 5.70 | % | | | 6.70 | % | | | 7.70 | % |
| 12.10% | | COP | 2,524,245 | | | COP | 2,752,636 | | | COP | 3,094,603 | |
Small business banking
| | | As of December 31, 2015 | |
| Growth rate | | Discount rate | |
| | | | 11.60 | % | | | 11.40 | % | | | 11.20 | % |
| 5.2% | | | COP 3,231,340 | | | COP | 3,341,235 | | | COP | 3,458,518 | |
| | | | | | | | | | | | | |
| Discount rate | | | Growth rate | |
| | | | 4.90 | % | | | 5.20 | % | | | 5.40 | % |
| 11.40% | | | COP 3,266,133 | | | COP | 3,341,235 | | | COP | 3,422,655 | |
| | | As of December 31, 2014 | |
| Growth rate | | Discount rate | |
| | | | 11.10 | % | | | 12.10 | % | | | 13.10 | % |
| 6.70% | | COP | 2,904,872 | | | COP | 2,332,930 | | | COP | 1,940,743 | |
| | | | | | | | | | | | | |
| Discount rate | | Growth rate | |
| | | | 5.70 | % | | | 6.70 | % | | | 7.70 | % |
| 12.10% | | COP | 2,123,280 | | | COP | 2,332,930 | | | COP | 2,646,832 | |
Insurance
| | | As of December 31, 2014 | |
| Growth rate | | Discount rate | |
| | | | 12.30 | % | | | 13.30 | % | | | 14.30 | % |
| 2.50% | | COP | 474,456 | | | COP | 456,595 | | | COP | 441,763 | |
| | | | | | | | | | | | | |
| Discount rate | | | Growth rate | |
| | | | 1.50 | % | | | 2.50 | % | | | 3.50 | % |
| 13.30% | | COP | 446,385 | | | COP | 456,595 | | | COP | 468,888 | |
Banking El Salvador
Corporate Banking
| | | As of December 31, 2015 | |
| Discount rate | | Growth rate | |
| | | | -0.39 | % | | | 0.00 | % | | | 0.59 | % |
| 12.30% | | COP | 1,140,004 | | | COP | 1,151,278 | | | COP | 1,170,065 | |
| 13.28% | | | 1,079,885 | | | | 1,088,903 | | | | 1,103,933 | |
| 14.26% | | COP | 1,027,282 | | | COP | 1,034,797 | | | COP | 1,046,819 | |
| | | As of December 31, 2014 | |
| Discount rate | | Growth rate | |
| | | | 0.00 | % | | | 1.00 | % | | | 2.00 | % |
| 12.90% | | COP | 1,044,988 | | | COP | 1,075,581 | | | COP | 1,110,975 | |
| 13.40% | | | 1,012,594 | | | | 1,039,589 | | | | 1,071,382 | |
| 13.90% | | COP | 982,001 | | | COP | 1,006,596 | | | COP | 1,034,791 | |
Consumer Banking
| | | As of December 31, 2015 | |
| Discount rate | | Growth rate | |
| | | | 0.00 | % | | | 1.00 | % | | | 2.00 | % |
| 12.30% | | COP | 2,946,107 | | | COP | 2,975,238 | | | COP | 3,023,789 | |
| 13.28% | | | 2,790,743 | | | | 2,814,045 | | | | 2,852,888 | |
| 14.26% | | COP | 2,654,797 | | | COP | 2,674,218 | | | COP | 2,705,291 | |
| | | As of December 31, 2014 | |
| Discount rate | | Growth rate | |
| | | | 0.00 | % | | | 1.00 | % | | | 2.00 | % |
| 12.90% | | COP | 2,516,736 | | | COP | 2,590,416 | | | COP | 2,675,654 | |
| 13.40% | | | 2,438,718 | | | | 2,503,731 | | | | 2,580,302 | |
| 13.90% | | COP | 2,365,036 | | | COP | 2,424,270 | | | COP | 2,492,174 | |
Mortgage Banking
| | | As of December 31, 2015 | |
| Discount rate | | Growth rate | |
| | | | -0.39 | % | | | 0.00 | % | | | 0.59 | % |
| 12.30% | | COP | 556,237 | | | COP | 561,735 | | | COP | 570,903 | |
| 13.28% | | | 526,903 | | | | 531,304 | | | | 538,637 | |
| 14.26% | | COP | 501,236 | | | COP | 504,904 | | | COP | 510,769 | |
| | | As of December 31, 2014 | |
| Discount rate | | Growth rate | |
| | | | 0.00 | % | | | 1.00 | % | | | 2.00 | % |
| 12.90% | | COP | 491,973 | | | COP | 506,376 | | | COP | 523,039 | |
| 13.40% | | | 476,722 | | | | 489,430 | | | | 504,399 | |
| 13.90% | | COP | 462,319 | | | COP | 473,896 | | | COP | 487,170 | |
The Bank considers goodwill as an asset with indefinite useful life.
8.3 Agromercantil Group Holding (GAH) acquisition
On December 18, 2012, Bancolombia Panama S.A. (a subsidiary of Bancolombia S.A.) and BAM Financial Corporation (BFC), entered into a stock purchase agreement, pursuant to which Bancolombia Panama agreed to purchase from BFC a 40% stake in the capital stock of the following:Panamanian company Grupo Agromercantil Holding (GAH).
| | | 2012 | | | 2011 | |
| | | | | | | | | |
| Equity securities | | COP | 30,056 | | | COP | 33,475 | |
| Real estate | | | 220,854 | | | | 176,855 | |
| Machinery and Equipment | | | 925 | | | | 3,661 | |
| Vehicles | | | 14,705 | | | | 13,034 | |
| Other assets | | | 4,394 | | | | 4,041 | |
| Total | | | 270,934 | | | | 231,066 | |
| Allowance for impairment | | | (186,116 | ) | | | (177,872 | ) |
| Total foreclosed assets, net | | COP | 84,818 | | | COP | 53,194 | |
On October 1, 2013, after obtaining the required regulatory authorizations Bancolombia Panama acquired 40% of the common stock of GAH. The consideration paid by Bancolombia was USD 217,000 in cash. Likewise, the agreement set forth a series of call options held by Bancolombia Panama and put options held by BFC, with which after 5 years since that date Bancolombia Panama had the right to buy and BFC the obligation to sell, the number of voting shares required to hold 51% of the total share capital of GAH, on the other hand, during 5 years since the effective date, BFC had the right to sell and Bancolombia Panama the obligation to buy, any number of voting shares; however, the option never could be for a number of shares that would result in a 50%/50% of ownership over GAH as of October 2013.
In September 2015, the Share Purchase Agreement aforementioned was modified:
| 1. | BFC agreed to sell 40,540,000 common shares of Grupo Agromercantil (equivalent to 20% of the subscribed and paid capital) to Bancolombia Panama. |
| 2. | The consideration payable in cash by Bancolombia Panama is USD 151,500. |
| 3. | At the time of share transfer, December 30, 2015, the consideration paid was based on the estimated consolidated net income of GAH as of December 31, 2015, and will be trued-up once audited numbers are available. As part of the modification of the agreement, the Bank entered into a put agreement to acquire the remaining 40% shares in Grupo Agromercantil Holding at a contractually determined future date and value. The puttable non-controlling interest liability was recognized in the statement of financial position. The non-controlling shareholders in Grupo Agromercantil Holding have the option to put their 40% interest in Agromercantil to the Bank, using a market valuation formula based on future profits. |
The acquisition achieved in stages of GAH and its subsidiaries is being accounted for under the acquisition method in accordance with IFRS 3. Accordingly, the Bank has remeasured its previously held equity interest in GAH at its acquisition-date fair value and recognized the resulting gain or loss considering any other comprehensive income previously recorded related to currency translation adjustment and equity method adjustment. The purchase price was preliminarily allocated to the acquired assets and liabilities based on their estimated fair values at the acquisition date as summarized in the following table. All acquired loans were also recorded at fair value. Preliminary goodwill of USD 233,396 (COP 735,073) is calculated as the purchase premium after adjusting for the fair value of net assets acquired, and the related deferred tax amounts of USD 28,954 (COP 91,191). The allocation of the purchase price will be finalized upon completion of the analysis of the fair values of GAH’s assets and liabilities.
For this acquisition, the estimated fair value of assets acquired and liabilities assumed are based on the information available at the end of the reporting period. The Bank considers this information provides a reasonable basis for determining fair values. Likewise, the Bank is currently evaluating these fair values and they are subject to review as more detailed analyses are completed and additional information becomes available. Any subsequent changes resulting from the evaluation of these estimates may adjust the provisional amounts recognized at the acquisition date to reflect new information obtained about facts and circumstances that existed as of the acquisition date that, if known, would have affected the measurement.
| GAH Preliminary Purchase Price Allocation | | U.S. dollar | | | Millions of COP(1) | |
| Purchase price on December 31, 2015 | | | 151,500 | | | | 477,145 | |
| Fair value of previously held invesment | | | 272,527 | | | | 858,316 | |
| Total | | | 424,027 | | | | 1,335,461 | |
| Preliminary allocation of the purchase price: | | | | | | | | |
| GAH stockholders’ equity at book value | | | 365,183 | | | | 1,150,132 | |
| GAH intangibles assets recognized at the acquisition date | | | 136,929 | | | | 431,252 | |
| Pre-tax adjustments to reflect acquired assets and liabilities at fair value: | | | | | | | | |
| Investment securities | | | 9,207 | | | | 28,999 | |
| Loans | | | (64,077 | ) | | | (201,809 | ) |
| Premises and equipment | | | 19,383 | | | | 61,046 | |
| Foreclosed assets | | | 550 | | | | 1,731 | |
| Other assets | | | (2,076 | ) | | | (6,538 | ) |
| Deposits | | | (3,685 | ) | | | (11,606 | ) |
| Other liabilities | | | (5,623 | ) | | | (17,711 | ) |
| Pre-tax total adjustment | | | (46,321 | ) | | | (145,888 | ) |
| Deferred income taxes | | | (28,954 | ) | | | (91,191 | ) |
| After-tax total adjustments | | | (75,275 | ) | | | (237,079 | ) |
| Fair value of net assets acquired | | | 426,835 | | | | 1,344,305 | |
| Fair value of put option over investee | | | (36,323 | ) | | | (114,399 | ) |
| Non-controlling interest at fair value | | | 272,527 | | | | 858,316 | |
| Preliminary goodwill | | | 233,395 | | | | 735,073 | |
| (1) | Amounts converted to Colombian pesos using the exchange rate applicable at December 31, 2015 (USD1 per COP 3,149.47). |
As a consequence of the terms included in the contract to acquire the shares held by Bank Financial Corporation -BFC- (currently, the Grupo Agromercantil Holding’s non-controlling interest), in which the latter can put its shares to Bancolombia Panama, the Bank’s Panamaniam subsidiary recognized a loss as of December 31, 2015, related to the remeasurement of the 20% of the derivative liability when it the Bank pay cash to acquire of an additional 20% of the common stock, which will represent a controlling stake of 60%, in Grupo Agromercantil Holding S.A. (“GAH”).
The goodwill has been allocated to the segment Banking Guatemala and represents the value expected from combining the GAH’s corporate banking portfolio with the Bank’s expertise commercial banking as well as the opportunity to increase its international operations by investing in the growing market of Central America.
Preliminary Condensed Statement of Net Assets Acquired
The following is a summarycondensed statement of equity securities classifiednet assets acquired reflects the preliminary fair value assigned to GAH’s net assets as foreclosed assets:of the acquisition date:
| | | 2012 | | | 2011 | |
| | | | | | | | | |
| Procampo Trust | | COP | 7,044 | | | COP | 7,044 | |
| Pizano S.A. (1) | | | 11,654 | | | | 6,884 | |
| FibraTolima Trust | | | 1,572 | | | | 1,572 | |
| Calima Resort Trust | | | 1,485 | | | | 1,485 | |
| Clinica Shaio Trust | | | 456 | | | | 456 | |
| Líneas Agromar Trust | | | 209 | | | | 209 | |
| Mercantil Nilo | | | 4,421 | | | | 4,857 | |
| C.I. Flores de la Sabana Trust | | | 1,530 | | | | - | |
| Guayacanes FA-3 Trust | | | - | | | | 9,205 | |
| Other | | | 1,685 | | | | 1,763 | |
| Total | | COP | 30,056 | | | COP | 33,475 | |
| | | 2015(1) | |
| | | U.S. dollar | | | Millions of COP | |
| Assets: | | | | | | | | |
| Cash and deposit funds | | | 400,368 | | | | 1,260,947 | |
| Derivative assets | | | 1,120 | | | | 3,526 | |
| Investment securities, net | | | 602,797 | | | | 1,898,493 | |
| Loan and leases, net | | | 2,588,093 | | | | 8,151,122 | |
| Intangible assets | | | 141,366 | | | | 445,227 | |
| Other assets | | | 120,002 | | | | 377,943 | |
| Total assets | | | 3,853,746 | | | | 12,137,258 | |
| Liabilities: | | | | | | | | |
| Deposits | | | 2,587,362 | | | | 8,148,820 | |
| Borrowings from other financial institutions | | | 338,276 | | | | 1,065,390 | |
| Accrued expenses and other liabilities | | | 194,822 | | | | 613,587 | |
| Debt securities in issue | | | 306,451 | | | | 965,156 | |
| Total liabilities | | | 3,426,911 | | | | 10,792,953 | |
| Fair value of net assets acquired(2) | | | 426,835 | | | | 1,344,305 | |
| (1) | During 2012,Amounts converted to Colombian pesos using the Bank has receivedexchange rate applicable at December 31, 2015 (USD1 per COP 4,770, due to3,149.47) |
| (2) | The fair value of net assets excludes preliminary goodwill resulting from the capitalizationGAH acquisition of the “Revaluation of equity” account carried out by the entity.USD 233,396. |
Unaudited Pro Forma Condensed Combined Financial Information
If the GAH acquisition had been completed on January 1, 2015 total revenue, net of interest expense and net income from continuing operations for the year ended December 31, 2015 would have been COP 7,052,535 and COP 2,323,729, respectively.
These results include the impact of amortizing certain purchase accounting adjustments such as intangible assets as well as fair value adjustments to loans, interbank borrowings and deposits. The activitypro forma financial information does not indicate the impact of possible business model changes nor does it consider any potential impacts of current market conditions or revenues or other factors. The results shown above combine the historical results of GAH and its subsidiaries and certain adjustments made according to the Bank's main accounting policies.
The Bank’s results for the reporting period ended December 31, 2015, does not include results from GAH and its subsidiaries, since the business combination took place on December 30, 2015.
Acquisition-related cost
In connection with the acquisition of GAH and its subsidiaries, the Bank incurred costs in the allowance for foreclosed assets is as follows:amount of COP 4,205 which are recorded in the ‘Other expenses’ line item of the Consolidated Statement of Income.
| | | 2012 | | | 2011 | | | 2010 | |
| | | | | | | | | | | | | |
| Balance at beginning of year | | COP | 177,872 | | | COP | 187,326 | | | COP | 170,308 | |
| Provision | | | 60,167 | | | | 59,633 | | | | 45,077 | |
| Charge offs | | | (920 | ) | | | (1,343 | ) | | | (502 | ) |
| Recoveries | | | (42,900 | ) | | | (69,357 | ) | | | (23,057 | ) |
| Sale of Asesuisa(1) | | | (280 | ) | | | - | | | | - | |
| Effect of changes in foreign exchange rates | | | (7,823 | ) | | | 1,613 | | | | (4,500 | ) |
| Balance at the end of year | | COP | 186,116 | | | COP | 177,872 | | | COP | 187,326 | |
Previously held interest
Prior to control being obtained, the Bank accounted for its investment in GAH and subsidiaries using the equity method:
| Date and nature of investment | | Share in equity | |
| October 2013 – Investment recorded as an associate | | | 40 | % |
| December 2015 – Acquisition of 20%, control obtained | | | 20 | % |
| Total at December 31, 2015 | | | 60 | % |
At the date of obtaining control (the acquisition date), the Bank remeasured any previously-held equity interest to fair value and recognized a revenue amounting to COP 2,977 in the Consolidated Statement of Income as ‘Interest and valuation on investment’.
NOTE 9. PREMISES AND EQUIPMENT, NET
As of December 31, 2015 and 2014 and January 1, 2014 the premises and equipment consisted of the following:
| | | | | | Roll - forward | | | | |
Premises and
equipment | | Balance at
January 1,
2015 | | | Acquisitions | | | Expenses -
depreciation | | | Disposals | | | Acquisitions
through business
combination(1) | | | Assets classified
as held for sale
(2) | | | Effect of
changes in
foreign
exchange rate | | | Balance at
December 31, 2015 | |
| | | In millions of COP | |
| Lands | | | | | | | | | | | | | | | | | | | | | | | | | | | | | | | | |
| Cost | | | 246,290 | | | | 29,330 | | | | - | | | | (9,526 | ) | | | 48,852 | | | | - | | | | 33,785 | | | | 348,731 | |
| Construction in progress | | | | | | | | | | | | | | | | | | | | | | | | | | | | | | | | |
| Cost | | | 2,285 | | | | 52,559 | | | | - | | | | (1,372 | ) | | | - | | | | - | | | | 7,685 | | | | 61,157 | |
| Buildings | | | | | | | | | | | | | | | | | | | | | | | | | | | | | | | | |
| Cost | | | 1,023,019 | | | | 12,079 | | | | - | | | | (21,870 | ) | | | 75,695 | | | | - | | | | 96,929 | | | | 1,185,852 | |
| Accumulated depreciation | | | (192,979 | ) | | | - | | | | (34,299 | ) | | | 5,795 | | | | - | | | | - | | | | (48,832 | ) | | | (270,315 | ) |
| Furniture and fixtures | | | | | | | | | | | | | | | | | | | | | | | | | | | | | | | | |
| Cost | | | 471,773 | | | | 48,048 | | | | - | | | | (44,058 | ) | | | 13,408 | | | | (328 | ) | | | 42,683 | | | | 531,526 | |
| Accumulated depreciation | | | (199,928 | ) | | | (3,970 | ) | | | (36,323 | ) | | | 5,770 | | | | (5,249 | ) | | | 202 | | | | (30,646 | ) | | | (270,144 | ) |
| Computer equipment | | | | | | | | | | | | | | | | | | | | | | | | | | | | | | | | |
| Cost | | | 569,808 | | | | 143,846 | | | | - | | | | (38,590 | ) | | | 24,675 | | | | (12,877 | ) | | | 83,868 | | | | 770,730 | |
| Accumulated depreciation | | | (358,943 | ) | | | (8,867 | ) | | | (84,162 | ) | | | 30,255 | | | | (11,613 | ) | | | 7,410 | | | | (57,919 | ) | | | (483,839 | ) |
| Vehicles | | | | | | | | | | | | | | | | | | | | | | | | | | | | | | | | |
| Cost | | | 1,067,658 | | | | 375,254 | | | | - | | | | (93,854 | ) | | | 1,545 | | | | (133,390 | ) | | | 38,735 | | | | 1,255,948 | |
| Accumulated depreciation | | | (314,318 | ) | | | (382 | ) | | | (130,753 | ) | | | 44,231 | | | | (696 | ) | | | 65,290 | | | | (8,712 | ) | | | (345,340 | ) |
| Airplane | | | | | | | | | | | | | | | | | | | | | | | | | | | | | | | | |
| Cost | | | 48,328 | | | | - | | | | - | | | | - | | | | - | | | | - | | | | 15,292 | | | | 63,620 | |
| Accumulated depreciation | | | (1,296 | ) | | | - | | | | (2,111 | ) | | | - | | | | - | | | | - | | | | (720 | ) | | | (4,127 | ) |
| Ongoing Imports | | | | | | | | | | | | | | | | | | | | | | | | | | | | | | | | |
| Cost | | | 49,678 | | | | 1,406 | | | | - | | | | (29,892 | ) | | | - | | | | - | | | | - | | | | 21,192 | |
| Leasehold improvements | | | | | | | | | | | | | | | | | | | | | | | | | | | | | | | | |
| Cost | | | 122,154 | | | | 117,645 | | | | - | | | | (2,798 | ) | | | 11,711 | | | | (105 | ) | | | 35,058 | | | | 283,665 | |
| | | | | | Roll - forward | | | | |
Premises and
equipment | | Balance at
January 1,
2015 | | | Acquisitions | | | Expenses -
depreciation | | | Disposals | | | Acquisitions
through business
combination(1) | | | Assets classified
as held for sale
(2) | | | Effect of
changes in
foreign
exchange rate | | | Balance at
December 31, 2015 | |
| | | In millions of COP | |
| Accumulated depreciation | | | (61,444 | ) | | | - | | | | (19,041 | ) | | | 775 | | | | - | | | | - | | | | (1,426 | ) | | | (81,136 | ) |
| Other Assets(3) |
| Cost | | | - | | | | - | | | | - | | | | - | | | | 15,404 | | | | - | | | | 2,260 | | | | 17,664 | |
| Total fixed assets in use - cost | | | 3,600,993 | | | | 780,167 | | | | - | | | | (241,960 | ) | | | 191,290 | | | | (146,700 | ) | | | 356,295 | | | | 4,540,085 | |
| Total fixed assets in use - accumulated depreciation | | | (1,128,908 | ) | | | (13,219 | ) | | | (306,689 | ) | | | 86,826 | | | | (17,558 | ) | | | 72,902 | | | | (148,255 | ) | | | (1,454,901 | ) |
| Other marketable and non-marketable for sale assets(4) | | | | | | | | | | | | | | | | | | | | | | | | | | | | | | | | |
| Cost | | | 184,038 | | | | - | | | | - | | | | (17,375 | ) | | | - | | | | - | | | | - | | | | 166,663 | |
| Accumulated depreciation | | | (9,802 | ) | | | - | | | | (483 | ) | | | - | | | | - | | | | - | | | | - | | | | (10,285 | ) |
| Total fixed assets - cost | | | 3,785,031 | | | | 780,167 | | | | - | | | | (259,335 | ) | | | 191,290 | | | | (146,700 | ) | | | 356,295 | | | | 4,706,748 | |
| Total fixed assets - accumulated depreciation | | | (1,138,710 | ) | | | (13,219 | ) | | | (307,172 | ) | | | 86,826 | | | | (17,558 | ) | | | 72,902 | | | | (148,255 | ) | | | (1,465,186 | ) |
| Total fixed assets | | | 2,646,321 | | | | | | | | | | | | | | | | | | | | | | | | | | | | 3,241,562 | |
| (1) | On September 27, 2012, BanagricolaPremises and equipment classified in this category relate to the acquisition of Grupo Agromercantil Holding S.A. For further information see Note 8.3. |
| (2) | It corresponds to Compañía de Financiamiento Tuya S.A.. For further information see Note 31. |
| (3) | Assets not used in active business. |
| (4) | The other marketable and IFBA, subsidiaries of Bancolombia S.A., soldnon-marketable assets are vehicles, premises and equipment with an estimated permanence under the Bank’s administration greater than one year and all those that do not fulfill the criteria for immediate sale, in both cases are classified under the premises and equipment account as other assets. Non-marketable assets correspond to Suramericana 97.03% of their shares of capital stock of Aseguradora Suiza Salvadoreña, an insurance subsidiaryassets that has no recoverable value and, thus, do not generate future economic benefits in the Republicshort term, and for which there is no certainty of El Salvador.sale since they can have legal usage limits or there is no a market available to fulfill the sale. The other marketable assets correspond to assets held for sale; however, their sale is not expected to be executed during the twelve months following from the reception. |
| | | | | | Roll - forward | | | | |
| Premises and equipment | | Balance at
January 1, 2014 | | | Acquisitions | | | Expenses -
depreciation | | | Disposals | | | Effect of changes
in foreign
exchange rate | | | Balance at
December 31, 2014 | |
| | | In millions of COP | |
| Lands | | | | | | | | | | | | | | | | | | | | | | | | |
| Cost | | | 235,592 | | | | 5,074 | | | | - | | | | (10,756 | ) | | | 16,380 | | | | 246,290 | |
| Construction in progress | | | | | | | | | | | | | | | | | | | | | | | | |
| Cost | | | 913 | | | | 1,372 | | | | - | | | | - | | | | - | | | | 2,285 | |
| Buildings | | | | | | | | | | | | | | | | | | | | | | | | |
| Cost | | | 970,113 | | | | 27,012 | | | | - | | | | (14,245 | ) | | | 40,139 | | | | 1,023,019 | |
| Accumulated depreciation | | | (136,954 | ) | | | - | | | | (24,441 | ) | | | 262 | | | | (31,846 | ) | | | (192,979 | ) |
| Furniture and fixtures | | | | | | | | | | | | | | | | | | | | | | | | |
| Cost | | | 421,927 | | | | 41,468 | | | | - | | | | (8,417 | ) | | | 16,795 | | | | 471,773 | |
| Accumulated depreciation | | | (164,530 | ) | | | | | | | (28,955 | ) | | | 4,682 | | | | (11,125 | ) | | | (199,928 | ) |
| Computer equipment | | | | | | | | | | | | | | | | | | | | | | | | |
| Cost | | | 475,835 | | | | 91,913 | | | | - | | | | (74,867 | ) | | | 76,927 | | | | 569,808 | |
| Accumulated depreciation | | | (260,747 | ) | | | - | | | | (68,492 | ) | | | 21,326 | | | | (51,030 | ) | | | (358,943 | ) |
| Vehicles | | | | | | | | | | | | | | | | | | | | | | | | |
| Cost | | | 849,456 | | | | 508,886 | | | | - | | | | (291,381 | ) | | | 697 | | | | 1,067,658 | |
| Accumulated depreciation | | | (257,502 | ) | | | - | | | | (113,663 | ) | | | 71,343 | | | | (14,496 | ) | | | (314,318 | ) |
| Airplane | | | | | | | | | | | | | | | | | | | | | | | | |
| Cost | | | - | | | | 38,922 | | | | - | | | | - | | | | 9,406 | | | | 48,328 | |
| Accumulated depreciation | | | - | | | | - | | | | (1,081 | ) | | | - | | | | (215 | ) | | | (1,296 | ) |
| Ongoing Imports | | | | | | | | | | | | | | | | | | | | | | | | |
| Cost | | | 29,944 | | | | 19,734 | | | | - | | | | - | | | | - | | | | 49,678 | |
| Leasehold improvements | | | | | | | | | | | | | | | | | | | | | | | | |
| Cost | | | 102,016 | | | | 13,074 | | | | - | | | | (1,173 | ) | | | 8,237 | | | | 122,154 | |
| Accumulated depreciation | | | (39,279 | ) | | | - | | | | (15,775 | ) | | | 269 | | | | (6,659 | ) | | | (61,444 | ) |
| Total fixed assets - cost | | | 3,085,796 | | | | 747,455 | | | | - | | | | (400,839 | ) | | | 168,581 | | | | 3,600,993 | |
| Total fixed assets - accumulated depreciation | | | (859,012 | ) | | | - | | | | (252,407 | ) | | | 97,882 | | | | (115,371 | ) | | | (1,128,908 | ) |
| Other marketable and non-marketable for sale assets(1) | | | | | | | | | | | | | | | | | | | | | | | | |
| Cost | | | 215,686 | | | | 27,521 | | | | - | | | | (59,169 | ) | | | - | | | | 184,038 | |
| Accumulated depreciation | | | (16,000 | ) | | | - | | | | - | | | | 6,198 | | | | - | | | | (9,802 | ) |
| Total fixed assets - cost | | | 3,301,482 | | | | 774,976 | | | | - | | | | (460,008 | ) | | | 168,581 | | | | 3,785,031 | |
| Total fixed assets - accumulated depreciation | | | (875,012 | ) | | | - | | | | (252,407 | ) | | | 104,080 | | | | (115,371 | ) | | | (1,138,710 | ) |
| Total fixed assets | | | 2,426,470 | | | | | | | | | | | | | | | | | | | | 2,646,321 | |
| (1) | The other marketable and non-marketable assets are vehicles, premises and equipment with an estimated permanence under the Bank’s administration greater than one year and all those that do not fulfill the criteria for immediate sale, in both categories are classified under the premises and equipment account as other assets. Non-marketable assets correspond to assets that have no recoverable value and, thus, do not generate future economic benefits in the short term, and for which there is no certainty of sale since they can have legal usage limits or there is no market available to fulfill the sale. The other marketable assets correspond to assets held for sale; however, their sale is not expected to be executed during the twelve months following from the reception. |
(16) Reappraisal of AssetsThe other non-marketable assets are considered as impaired assets at the full amount, which will not be subject to write-offs considering that the Bank assumes all risks associated with the asset. Those assets are subject to depreciation and surplus for Reappraisal of Assets
The following table describes reappraisals of assets:
| | | 2012 | | | 2011 | |
| | | | | | | | | |
| Reappraisal of Assets, net | | COP | 851,920 | | | COP | 783,989 | |
| Less: proportional revaluation of assets purchased under business combination process(1) | | | (110,790 | ) | | | (110,934 | ) |
| Less: minority interests | | | (48,295 | ) | | | (36,015 | ) |
| Total surplus for Reappraisal of Assets | | COP | 692,835 | | | COP | 637,040 | |
______________
| (1) | Refers to the business combination transaction involving Banca Inversión Bancolombia S.A., Leasing Bancolombia S.A., Fiduciaria Bancolombia S.A., Tuya S.A., Valores Bancolombia S.A., Factoring Bancolombia S.A. and Inversiones Financieras Banco Agrícola S.A., calculated at the respective acquisition dates. |
(17) Interbank Borrowings
Interbank borrowings, primarily denominated in U.S. Dollars, at December 31, are summarized as follows:
| | | 2012 | | | 2011 | |
| Foreign banks | | | | | | | | |
| Short-term | | COP | 730,092 | | | COP | 2,577,258 | |
| Long-term | | | 1,073,573 | | | | 1,553,657 | |
| Total | | COP | 1,803,665 | | | COP | 4,130,915 | |
For the purposes of this classification, short-term interbank borrowings, obtained from other banks for liquidity purposes, are unsecured and generally have maturities ranging from 90 to 180 days.impairment.
As of December 31, 20122015 and 2011,2014, there were no contractual commitments for the average interest rates on U.S. dollar-denominated short-term borrowings from foreign banks were 1.24% and 1.71%, respectively.
For long-term interbank borrowings, the weighted interest rate was 1.93% and 1.86% in 2012 and 2011, respectively.
Maturitiespurchase of interbank borrowings at the end of 2012 werefixed assets, or premises pledged as follows:
| | | 2012 | |
| | | | | |
| 2013 | | COP | 1,346,286 | |
| 2014 | | | 400,839 | |
| 2015 | | | 14,835 | |
| 2016 | | | 6,325 | |
| 2017 | | | - | |
| 2018 and thereafter | | | 35,380 | |
| | | COP | 1,803,665 | |
The unused credit lines of interbank borrowings at the end of the year 2012 and 2011 were USD 1,568,200 and USD 110,200, respectively.
The maximum amount of borrowing at any month-end during 2012 and 2011 was COP 3,693,395 and COP 4,130,915, respectively.
The minimum amount of borrowing at any month-end during 2012 and 2011 was COP 1,626,455 and COP 2,094,154 respectively.
(18) Borrowings from development and other domestic banks
The Colombian government has established programs to promote the development of specific sectors of the economy. These sectors include foreign trade, agriculture, tourism and many other industries. These programs are under the administration of the Colombian Central Bank and various government entities.
Loans under these programs generally bear interest from 3% to 6% above the average rates paid by domestic banks on short-term time deposits. Loan maturities vary depending on the program (ranging from one to 15 years). The bank funds approximately 0% to 2% of the total loan balance, with the reminder being provided by the respective government agencies. Loans to customers are in the same currency and maturities as the borrowings from the agencies.collateral.
As of December 31, 20122015 and 2011, borrowings from domestic development banks2014, the assessment made by the Bank indicates there is not any evidence of impairment of its premises and other domestic banks consisted of the following:equipment.
| | | 2012 | | | 2011 | |
| | | | | | | |
| Banco de Comercio Exterior de Colombia (“Bancoldex”) | | COP | 844,327 | | | COP | 749,898 | |
| Fondo para el Financiamiento del Sector Agropecuario (“Finagro”) | | | 582,901 | | | | 649,306 | |
| Findeter | | | 1,160,790 | | | | 1,239,678 | |
| Other | | | 879,825 | | | | 689,129 | |
| Total | | COP | 3,467,843 | | | COP | 3,328,011 | |
Interest rates on borrowings from development and other domestic banks averaged 7.0% and 5.7% in 2012 and 2011, respectively, in local currency and 5.4% and 3.9% in 2012 and 2011, respectively, in foreign currency. Maturities at December 31, 2012 were as follows:
| 2013 | | COP | 840,309 | |
| 2014 | | | 401,908 | |
| 2015 | | | 429,152 | |
| 2016 | | | 373,160 | |
| 2017 | | | 370,775 | |
| 2018 and thereafter | | | 1,052,539 | |
| Total | | COP | 3,467,843 | |
(19) Other Liabilities
Other liabilities consisted of the following:
| | | 2012 | | | 2011 | |
| | | | | | | |
| Deferred tax liability | | COP | 180,615 | | | COP | 167,228 | |
| Accrued payroll and other severance benefits | | | 177,406 | | | | 134,241 | |
| Advances | | | 140,313 | | | | 120,668 | |
| Accrued pension obligations net of deferred cost | | | 118,434 | | | | 118,595 | |
| Deferred interest on restructured troubled loans | | | 81,456 | | | | 66,713 | |
| Unearned income(1) | | | 36,406 | | | | 41,497 | |
| Insurance liabilities(2) | | | 28,250 | | | | 94,034 | |
| Accrued severance under Law 50, net of advances | | | 41,276 | | | | 37,639 | |
| Accrued severance before Law 50, net of advances to employees | | | 15,953 | | | | 16,947 | |
| Deferred profit on sales of assets | | | 2,926 | | | | 4,135 | |
| Deferred commissions on standby letters | | | - | | | | 2,360 | |
| Other | | | 65,155 | | | | 70,273 | |
| Total | | COP | 888,190 | | | COP | 874,330 | |
______________
| (1) | Unearned income principally consists of prepayments of interest by customers. |
| (2) | Insurance liabilities decrease due to the fact that Banagricola S.A. and IFBA, subsidiaries of Bancolombia S.A., sold to Suramericana 97.03% of its shares of capital stock of Aseguradora Suiza Salvadoreña, an insurance subsidiary in the Republic of El Salvador. |
In accordance with the Colombian Labor Code, employers must pay retirement pensions to employees who fulfill certain requirements as to age and time of service. However, the Social Security Institute and other private funds have assumed the pension obligation for the majority of the Bank’s employees.
Pension obligationNOTE 10. INVESTMENT PROPERTIES
The following is an analysistable below sets forth the reconciliation between the initial balance account and the balance at the end of the Bank’s pension obligations:period:
| | | Projected | | | | | | | |
| | | pension | | | | | | | |
| | | liability | | | Deferred cost | | | Net | |
| Balance at December 31, 2009 | | COP | 112,595 | | | COP | - | | | COP | 112,595 | |
| Adjustment per actuarial valuation | | | 10,824 | | | | - | | | | 10,824 | |
| Benefits paid | | | (10,824 | ) | | | - | | | | (10,824 | ) |
| Liability adjustment for changes in actuarial assumptions | | | 11,752 | | | | (11,752 | ) | | | - | |
| Balance at December 31, 2010 | | COP | 124,347 | | | COP | (11,752 | ) | | COP | 112,595 | |
| Adjustment per actuarial valuation | | | 10,867 | | | | - | | | | 10,867 | |
| Benefits paid | | | (9,907 | ) | | | - | | | | (9,907 | ) |
| Pension cost | | | - | | | | 5,040 | | | | 5,040 | |
| Liability adjustment for changes in actuarial assumptions | | | (3,722 | ) | | | 3,722 | | | | - | |
| Balance at December 31, 2011 | | COP | 121,585 | | | COP | (2,990 | ) | | COP | 118,595 | |
| Adjustment per actuarial valuation | | | 9,720 | | | | - | | | | 9,720 | |
| Benefits paid | | | (9,881 | ) | | | - | | | | (9,881 | ) |
| Liability adjustment for changes in actuarial assumptions | | | (2,990 | ) | | | 2,990 | | | | - | |
| Balance at December 31, 2012 | | COP | 118,434 | | | COP | - | | | COP | 118,434 | |
In compliance with Colombian law, the present value of the obligation for pensions was determined on the basis of actuarial calculations. The significant assumptions used in the actuarial calculations were the following:
| | | 2012 | | 2011 | | 2010 |
| Discount rate | | 4.80% | | 4.80% | | 4.80% |
| Future pension increases | | 3.26% | | 3.53% | | 4.51% |
(20) Long-Term Debt
Companies are authorized by the SFC to issue or place ordinary bonds or general unsecured bonds.
Long-term debt consists of bonds issued by Bancolombia S.A. and by its subsidiaries, Banco Agrícola S.A., Leasing Bancolombia, TUYA S.A. and Renting Colombia S.A.
| 2012 |
| Issuer | | Currency | | Originally issued | | | Balance | | | Rate |
| Bancolombia S.A. | | Local | | COP | 4,129,199 | | | COP | 2,750,467 | | | 5.17% –14.18% |
| Bancolombia S.A. | | Foreign | | USD | 3,766,970 | | | | 6,660,869 | | | 4.25% – 6.99% |
| Leasing Bancolombia S.A. | | Local | | COP | 2,283,555 | | | | 2,067,809 | | | 6.10% – 10.90% |
| Banco Agricola S.A. | | Foreign | | USD | 235,588 | | | | 416,574 | | | 3.56% – 4.50% |
| Renting Colombia S.A. | | Local | | COP | 46,000 | | | | 44,000 | | | IPC+5.90% - IPC+6.80% |
| Tuya S.A. | | Local | | COP | 119,500 | | | | 119,500 | | | IPC+2% |
| Total Long term debt | | | | | | | | COP | 12,059,219 | | | |
| 2011 |
| Issuer | | Currency | | Originally issued | | | Balance | | | Rate |
| Bancolombia S.A. | | Local | | COP | 4,490,529 | | | COP | 3,111,796 | | | 5.33%–14.18% |
| Bancolombia S.A. | | Foreign | | USD | 2,540,000 | | | | 4,933,487 | | | 4.25%–6.99% |
| Leasing Bancolombia S.A. | | Local | | COP | 1,907,463 | | | | 1,696,218 | | | 4.36%–10.90% |
| Banco Agricola S.A. | | Foreign | | USD | 204,630 | | | | 397,535 | | | 2.64%-4% |
| Renting Colombia S.A. | | Local | | COP | 360,000 | | | | 95,447 | | | Fix 9.10%
IPC + 6.80%
IPC + 5.90% |
| Tuya S.A. | | Local | | COP | 74,500 | | | | 74,500 | | | IPC + 2% |
| Total Long term debt | | | | | | | | COP | 10,308,983 | | | |
| | | As of December 31 | |
| | | 2015 | | | 2014 | |
| | | In millions of COP | |
| Balance at the beginning of the year | | | 1,114,180 | | | | 984,701 | |
| Acquisitions | | | 244,730 | | | | 80,978 | |
| Sales/Write-offs | | | (4,040 | ) | | | (7,734 | ) |
| Profits (loss) on valuation | | | 150,176 | | | | 56,235 | |
| Balance at the end of the period | | | 1,505,046 | | | | 1,114,180 | |
The scheduled maturities of long term-debt at December 31, 2012valuation adjustments recorded by the Bank's related to its investment properties are as follows:detailed below:
| 2013 | | COP | 1,094,261 | |
| 2014 | | | 800,714 | |
| 2015 | | | 315,782 | |
| 2016 | | | 1,155,622 | |
| 2017 | | | 447,142 | |
| 2018 and thereafter | | | 8,245,698 | |
| Total | | COP | 12,059,219 | |
| | | As of December 31, 2015 | |
| Type of asset | | Balance at the
beginning of the year | | | Appraisals | | | Net increase in
investment properties | | | Adjusted fair value at
the end of the year(1) | |
| | | In millions of COP | |
| Buildings | | | 949,413 | | | | 94,810 | | | | 231,343 | | | | 1,275,566 | |
| Lands | | | 164,767 | | | | 55,366 | | | | 9,347 | | | | 229,480 | |
| Total | | | 1,114,180 | | | | 150,176 | | | | 240,690 | | | | 1,505,046 | |
Foreign market:
In September 2012, Bancolombia S.A. sold an aggregate principal amount of USD 1,200,000 of its Subordinated Notes due September 11, 2022. This amount includes USD 50,000 of Subordinated Notes due September 11, 2022, which were sold in the Asian market. The notes have a 10-year maturity and a coupon of 5.125%, payable semi-annually on March 11 and September 11 of each year, commencing on March 11, 2013. They were issued at 99.421% of their nominal amount.
| | | As of December 31, 2014 | |
| Type of asset | | Balance at the
beginning of the year | | | Appraisals | | | Net increase in
investment properties | | | Adjusted fair value at the
end of the year(1) | |
| | | In millions of COP | |
| Buildings | | | 836,812 | | | | 49,726 | | | | 62,874 | | | | 949,412 | |
| Lands | | | 147,889 | | | | 6,509 | | | | 10,370 | | | | 164,768 | |
| Total | | | 984,701 | | | | 56,235 | | | | 73,244 | | | | 1,114,180 | |
In September 2012, Bancolombia S.A. commenced a private offer to exchange any and all of its outstanding Subordinated Notes due 2017 (the "Old Notes") for Subordinated Notes due 2022 (the "New Notes"). An aggregate principal amount of USD 200,488 of Old Notes, representing 50.12% of the USD 400,000 aggregate outstanding principal amount of Old Notes, was tendered and accepted pursuant to the Offer. The Offer expired on October 5, 2012 and the tenderors received USD 1.13 of New Notes for each USD1 of Old Notes. The New Notes were issued in October 2012. The Bank has recognized the discount of issuance of COP 48,698 as a deferred charge, which is amortized using the straight-line method over the maturity period (from 2012 to 2022).
In January 2011, Bancolombia S.A. issued and sold USD 520,000 in aggregate principal amount of its senior notes due 2016 that have a 5-year maturity and a coupon of 4.25%, payable semi-annually on January 12 and July 12 of each year, beginning on July 12, 2011.
In June, 2011, the Bank issued and sold USD 1,000,000 in aggregate principal amount of its senior notes due 2021 that have a 10-year maturity and a coupon of 5.95%, payable semi-annually on June 3 and December 3 of each year, beginning on December 3, 2011.
Local market:
As part of the Bank’s global ordinary notes program to issue up to an aggregate principal amount of COP 2,000,000 in ordinary notes, on July 26, 2011, the Bank issued COP 800,000 ordinary notes in the local market with an aggregate principal amount of COP 800,000 and on November 2, 2011 the Bank issued COP 600,000 ordinary notes in the local market with an aggregate principal amount of COP 600,000.
Leasing Bancolombia, a subsidiary of the Bank, as a part of its global ordinary notes program to issue up to an aggregate principal amount of COP 2,000,000 in ordinary notes, has issued COP 600,000 ordinary notes in the local market with an aggregate principal amount of COP 600,000 on April 18, 2012.
(21) Accrued Expenses
Accrued expenses consisted of the following:
| | | 2012 | | | 2011 | |
| | | | | | | |
| Labor Obligations | | COP | 217,101 | | | COP | 151,003 | |
| Fines and Sanctions(1) | | | 65,082 | | | | 56,412 | |
| FICAFE Contingency(2) | | | 31,658 | | | | 41,926 | |
| Membership Program | | | 6,896 | | | | 5,731 | |
| Income tax payable | | | 470 | | | | - | |
| Accrued expenses in joint venture with Almacenes Éxito | | | 64 | | | | 2,209 | |
| Other | | | 23,680 | | | | 23,001 | |
| Total | | COP | 344,951 | | | COP | 280,282 | |
| (1) | See Note 26 “Contingencies” (c). |
| (2) | As a result of acquisition of Banagrícola,Corresponds to the Bank since the year ended December 31, 2007, has established an allowance available to absorb probable losses inherentchange in the FICAFE investment, which is held by its subsidiary, Banco Agrícola S.A.commercial appraisal of real estate due to the FICAFE investment consists of fiduciary’s securities, issued bychange in the Foundation of Enviromental Preservation of Coffee-Producing Lands established by the Salvadorian government (See Note 5, “Investment Securities”Colombian consumer price index (“IPC”). |
Income taxAmounts recognized in the statement of income for the period
ColombianThe table sets forth the main income recorded by the Bank related to its investment properties:
| | | 2015 | | | 2014 | |
| | | In millions of COP | |
| Income from rentals | | | 89,389 | | | | 79,237 | |
| Operating expenses due to: | | | | | | | | |
| Investment properties that generated income through rentals | | | 11,693 | | | | 9,320 | |
| Investment properties that did not generate income through rentals | | | 2,539 | | | | 823 | |
Currently, there are no restrictions on the use or income derived from the buildings or lands that the Bank has as investment property, however, until October 18, 2015 the asset held by the trust P.A. Lote Abelardo Castro had a restriction, because in the negotiation with the Concessionaire Mining (Corona Group), the Bank accepted that directly or through a third authorized party undertakes mining operations on the asset for two (2) years since October 18, 2013, therefore in the accounting period as of December 31, 2015 the bank can dispose of these property.
Fair value of the investment properties
The fair value of the Bank’s investment properties for the year ending at December 31, 2014 and December 31, 2015 has been recorded according to the assessment made by independent external consulting companies.
The aforementioned companies are independent and have the appropriate capacity and experience in performing those assessments. The appraisers are either approved by the Property Market Auctions of Colombia or are foreign appraisers, who are required to provide a second signature by a Colombia appraiser accredited by the Property Market Auctions.
Fair value appraisals are carried out in accordance with IFRS 13. The reports made by the external consulting company contain the description of the valuation methodologies used, and key assumption such as: discount rates, calculation of applied expenses and income approach, among others. The fair value of the investment properties is based on the comparative market approach, which reflects the prices of recent transactions with similar characteristics. Upon determining the fair value of these assets, the greater and best use of these assets is their present use.
As of December 31, 2015 and 2014, the Bank does not have investment properties held under financial leases.
NOTE 11.A INCOME TAXES - CREE TAX AND DEFERRED TAX
Current tax is calculated in each country where the Grupo Bancolombia has operations, in accordance with the tax regulations in force in each of the jurisdictions.
Deferred tax asset and liability is recognized based on the temporary differences arising from the future estimate of tax and accounting effects attributable to differences between assets and liabilities in the statement of financial position and its tax base.
| 1. | Amounts recognized in Results |
| | | 2015 | | | 2014 | |
| | | In millions of COP | |
| Current tax | | | | | | | | |
| Fiscal year | | | 346,556 | | | | 457,338 | |
| Previous fiscal years | | | 6,159 | | | | 10,061 | |
| Total current tax | | | 352,715 | | | | 467,399 | |
| | | | | | | | | |
| Deferred tax | | | | | | | | |
| Fiscal year | | | 296,535 | | | | 270,277 | |
| Total deferred tax | | | 296,535 | | | | 270,277 | |
| | | | | | | | | |
| Total tax | | | 649,250 | | | | 737,676 | |
| 2. | Amounts recognized in Other Comprehensive Income |
| | | December 31, 2015 | |
| | | In millions of COP | |
| | | Before taxes | | | Expenses per
tax or benefit | | | Net taxes | |
| Net profit (loss) by financial instruments measured at fair value | | | 128,271 | | | | 9,052 | | | | 137,323 | |
| Net profit (loss) by benefits to employees | | | (59,434 | ) | | | 9,312 | | | | (50,122 | ) |
| Net | | | 68,837 | | | | 18,364 | | | | 87,201 | |
See Other Comprehensive Income
| | | December 31, 2014 | |
| | | In millions of COP | |
| | | Before taxes | | | Expenses per tax
or benefit | | | Net taxes | |
| Net profit (loss) by financial instruments measured at fair value | | | (120,627 | ) | | | (3,110 | ) | | | (123,737 | ) |
| Net profit (loss) by benefits to employees | | | (27,297 | ) | | | 6,407 | | | | (20,890 | ) |
| Net | | | (147,924 | ) | | | 3,297 | | | | (144,627 | ) |
See Consolidated Statement of Other Comprehensive Income
| 3. | The net deferred tax assets and liabilities by company is as follows |
| | | December 31,
2015 | | | December 31,
2015 | | | December 31,
2014 | | | December 31,
2014 | | | January
1, 2014 | | | January
1, 2014 | |
| Company | | Deferred tax
asset | | | Deferred tax
liability | | | Deferred tax
asset | | | Deferred tax
liability | | | Deferred tax
asset | | | Deferred tax
liability | |
| | | In millions of COP | |
| Bancolombia S.A. | | | | | | | (705,176 | ) | | | | | | | (470,940 | ) | | | | | | | (338,815 | ) |
| Leasing Bancolombia S.A. | | | 4,040 | | | | | | | | 56,104 | | | | | | | | 114,957 | | | | | |
| Leasing Perú S.A. | | | | | | | | | | | 1,632 | | | | | | | | 1,172 | | | | | |
| Renting Colombia S.A. | | | | | | | (8,893 | ) | | | | | | | (24,380 | ) | | | | | | | (33,510 | ) |
| Transportempo S.A.S. | | | | | | | (4,456 | ) | | | | | | | (4,773 | ) | | | | | | | (4,308 | ) |
| Arrendamiento Operativo CIB S.A.C. | | | 4,252 | | | | | | | | 2,138 | | | | | | | | | | | | | |
| Fiduciaria Bancolombia S.A. | | | 4,883 | | | | | | | | 1,306 | | | | | | | | 1,888 | | | | | |
| FiduPerú S.A. Sociedad Fiduciaria | | | | | | | | | | | | | | | | | | | 555 | | | | | |
| Banca de Inversión Bancolombia S.A. | | | 1,356 | | | | | | | | | | | | (2,003 | ) | | | | | | | (391 | ) |
| BIBA Inmobiliaria S.A.S. | | | | | | | | | | | | | | | (49 | ) | | | | | | | (151 | ) |
| Inversiones CFNS S.A.S. | | | | | | | (717 | ) | | | | | | | (773 | ) | | | | | | | (885 | ) |
| Valores Simesa S.A. | | | | | | | (7,016 | ) | | | | | | | (1,732 | ) | | | | | | | (1,959 | ) |
| Valores Bancolombia S.A. | | | 942 | | | | | | | | 802 | | | | | | | | | | | | (2,963 | ) |
| Factoring Bancolombia S.A. | | | | | | | | | | | | | | | | | | | | | | | (651 | ) |
| Compañía de Financiamiento Tuya S.A. | | | | | | | | | | | | | | | (18,473 | ) | | | | | | | (7,652 | ) |
| Banagrícola S.A. | | | | | | | (5,326 | ) | | | | | | | (3,977 | ) | | | | | | | (5,645 | ) |
| Inversiones Financieras Banco Agrícola S.A. | | | | | | | (19,144 | ) | | | | | | | (15,732 | ) | | | | | | | (12,690 | ) |
| Banco Agrícola S.A. | | | 40,239 | | | | | | | | 33,731 | | | | | | | | 17,462 | | | | | |
| Arrendadora Financiera S.A. | | | 128 | | | | | | | | 69 | | | | | | | | 20 | | | | | |
| Credibac S.A. de CV | | | | | | | | | | | | | | | | | | | | | | | (1 | ) |
| Bagricola Costa Rica S.A. | | | 48 | | | | | | | | 25 | | | | | | | | 22 | | | | | |
| Uff Móvil S.A.S. | | | | | | | | | | | 4,384 | | | | | | | | 4,646 | | | | | |
| Banistmo S.A. y Filiales | | | 114,594 | | | | | | | | 87,546 | | | | | | | | 98,637 | | | | | |
| Fideicomiso "Lote Abelardo Castro" | | | | | | | (372 | ) | | | | | | | (269 | ) | | | | | | | (221 | ) |
| Grupo Agromercantil Holding | | | | | | | (83,292 | ) | | | | | | | | | | | | | | | | |
| Net deferred tax | | | 170,482 | | | | (834,392 | ) | | | 187,737 | | | | (543,101 | ) | | | 239,359 | | | | (409,842 | ) |
| A. | Explanation of applicable rates |
The following are nominal rates of the income tax in each of the countries where Grupo Bancolombia has operations that are subject to earnings:
| | | | | 2014 | | | 2015 | | | 2016 | | | 2017 | | | 2018 | | | As from
2019 | |
| Companies from Colombia | | Income and CREE (plus CREE surcharge) | | | 34 | % | | | 39 | % | | | 40 | % | | | 42 | % | | | 43 | % | | | 34 | % |
| Companies from Peru | | Income | | | 30 | % | | | 28 | % | | | 28 | % | | | 27 | % | | | 27 | % | | | 26 | % |
| Companies from Panama (Banistmo and Subsidiaries) | | Income | | | 25 | % | | | 25 | % | | | 25 | % | | | 25 | % | | | 25 | % | | | 25 | % |
| Companies from Salvador | | Income | | | 30 | % | | | 30 | % | | | 30 | % | | | 30 | % | | | 30 | % | | | 30 | % |
| Companies from Guatemala | | Income | | | 25 | % | | | 25 | % | | | 25 | % | | | 25 | % | | | 25 | % | | | 25 | % |
| B. | Amount of temporary differences in subsidiaries, branches, associates on which no charged deferred tax has been recognized |
| | December 31, 2015 | | December 31, 2014 |
| Temporary differences | | | | |
| Subsidiaries | | COP 2,301,899 | | COP 318,556 |
In accordance with IAS 12 and considering that the Administration does not intend to sell its investments in subsidiaries over which it has control, no deferred tax is recognized for the aforementioned temporary differences.
C.1 Temporary differences to December 31, 2015.
Deferred tax
summary
in Balance
accounts | | December
31, 2014 | | | With effects
on the
statement
of income | | | With
OCI
effects | | | Grupo
Agromercantil
acquisition | | | Reclassifications
and discontinued
operations | | | Foreign
currency
translation
adjustment | | | December 31,
2015 | |
| | | In millions of COP | |
| Total deferred tax asset | | | 495,044 | | | | 171,606 | | | | 10,545 | | | | 97,685 | | | | (23,984 | ) | | | 40,183 | | | | 791,079 | |
| Total deferred tax liability | | | (850,408 | ) | | | (468,141 | ) | | | 7,819 | | | | (180,977 | ) | | | 28,562 | | | | 8,156 | | | | (1,454,989 | ) |
| Net deferred tax | | | (355,364 | ) | | | (296,535 | ) | | | 18,364 | | | | (83,292 | ) | | | 4,578 | | | | 48,339 | | | | (663,910 | ) |
With effects on the statement of income
| | | December
31, 2014 | | | Realization | | | Increase | | | Grupo
Agromercantil
acquisition | | | Discontinued
operation Tuya | | | December
31, 2015 | |
| | | In millions of COP | |
| Deferred tax asset: | | | | | | | | | | | | | | | | | | | | | | | | |
| Depreciated cost of the portfolio | | | 910 | | | | 16,766 | | | | 51,422 | | | | 82,652 | | | | 105 | | | | 118,113 | |
| Property and equipment | | | 65,312 | | | | 38,682 | | | | 1,517 | | | | 7,393 | | | | - | | | | 35,540 | |
| Intangible assets | | | 13,012 | | | | 12,952 | | | | - | | | | 15 | | | | - | | | | 75 | |
| Litigation and claims | | | 594 | | | | - | | | | 45 | | | | - | | | | - | | | | 639 | |
| Employee benefits | | | 142,066 | | | | 696 | | | | 9,127 | | | | 177 | | | | 4,558 | | | | 146,116 | |
| Municipal tax liabilities | | | 8,204 | | | | 467 | | | | 1,791 | | | | - | | | | - | | | | 9,528 | |
| Impairment evaluation | | | 5,939 | | | | 1,118 | | | | 3,718 | | | | - | | | | - | | | | 8,539 | |
| Tax loss carryforward | | | 132,710 | | | | 15,921 | | | | 3,271 | | | | - | | | | - | | | | 120,060 | |
| Financial obligations | | | 90,034 | | | | 26,684 | | | | 110,015 | | | | 1,074 | | | | - | | | | 174,439 | |
| Deferred income | | | 2,095 | | | | - | | | | - | | | | - | | | | - | | | | 2,095 | |
| Investment valuation | | | 617 | | | | 658 | | | | 75,585 | | | | - | | | | - | | | | 75,544 | |
| Others | | | 26,439 | | | | 18,858 | | | | 85,555 | | | | 6,374 | | | | 16,777 | | | | 82,733 | |
| Total deferred tax asset | | | 487,932 | | | | 132,802 | | | | 342,046 | | | | 97,685 | | | | 21,440 | | | | 773,421 | |
| | | December 31,
2014 | | | Realization | | | Increase | | | Grupo
Agromercantil
acquisition | | | Discontinued
operation
Tuya | | | December
31, 2015 | |
| | | In millions of COP | |
| Deferred tax liability: | | | | | | | | | | | | | | | | | | | | | | | | |
| Property and equipment | | | (234,941 | ) | | | 113,609 | | | | 142,392 | | | | 24,265 | | | | 2,754 | | | | (285,235 | ) |
| Inventories | | | (8,860 | ) | | | 10,357 | | | | 1,497 | | | | | | | | - | | | | - | |
| Leasing re-expression | | | (87,108 | ) | | | 175,037 | | | | 224,946 | | | | 108,423 | | | | - | | | | (245,440 | ) |
| Impairment evaluation | | | (135,370 | ) | | | 67,511 | | | | 101,761 | | | | | | | | 31,459 | | | | (138,161 | ) |
| Equity securities valuation | | | (18,110 | ) | | | 4,444 | | | | 662 | | | | 32,303 | | | | - | | | | (46,631 | ) |
| Derivatives valuation | | | (83,473 | ) | | | 68,011 | | | | 171,769 | | | | | | | | - | | | | (187,231 | ) |
| Goods received as payment | | | (45,809 | ) | | | 23,815 | | | | - | | | | | | | | - | | | | (21,994 | ) |
| Others | | | (157,575 | ) | | | 35,606 | | | | 326,700 | | | | 15,986 | | | | 5,701 | | | | (458,954 | ) |
| Total deferred tax liability | | | (771,246 | ) | | | 498,390 | | | | 969,727 | | | | 180,977 | | | | 39,914 | | | | (1,383,646 | ) |
Impact on Other Comprehensive Income
| | | December 31,
2014 | | | Realization | | | Increase | | | December 31,
2015 | |
| | | In millions of COP | |
| Deferred tax asset | | | | | | | | | | | | | | | | |
| Employee benefits | | | 7,112 | | | | 734 | | | | 11,280 | | | | 17,658 | |
| Total deferred tax asset | | | 7,112 | | | | 734 | | | | 11,280 | | | | 17,658 | |
| | | December 31,
2014 | | | Realization | | | Increase | | | December 31,
2015 | |
| | | In millions of COP | |
| Deferred tax liability | | | | | | | | | | | | | | | | |
| Debt securities valuation | | | (40 | ) | | | | | | | 1,428 | | | | (1,468 | ) |
| Investment valuation | | | (79,122 | ) | | | 10,516 | | | | 1,269 | | | | (69,875 | ) |
| Total deferred tax liability | | | (79,162 | ) | | | 10,516 | | | | 2,697 | | | | (71,343 | ) |
C.2 Temporary differences to December 31, 2014.
Deferred tax summary
in Balance accounts | | January 1,
2014 | | | With effects on
the statement
of income | | | With OCI
effects | | | Reclassifications and
discontinuous
operations | | | Foreign
currency
translation
adjustment | | | December 31,
2014 | |
| In millions of COP |
| Total deferred tax asset | | | 411,475 | | | | 51,017 | | | | 6,407 | | | | (2,183 | ) | | | 28,328 | | | | 495,044 | |
| Total deferred tax liability | | | (581,958 | ) | | | (321,294 | ) | | | (3,110 | ) | | | (8,645 | ) | | | 64,599 | | | | (850,408 | ) |
| Net deferred tax | | | (170,483 | ) | | | (270,277 | ) | | | 3,297 | | | | (10,828 | ) | | | 92,927 | | | | (355,364 | ) |
With effects on the statement of income
| | | January
1, 2014 | | | Realization | | | Increase | | | December
31, 2014 | |
| | | In millions of COP | |
| Deferred tax asset | | | | | | | | | | | | | | | | |
| Depreciated cost of the portfolio | | | 28,261 | | | | 87,123 | | | | 59,772 | | | | 910 | |
| Property and equipment | | | 50,923 | | | | 2,983 | | | | 17,372 | | | | 65,312 | |
| Intangible assets | | | 4,262 | | | | 17 | | | | 8,767 | | | | 13,012 | |
| Litigation and claims | | | 896 | | | | 306 | | | | 4 | | | | 594 | |
| Employee benefits | | | 96,515 | | | | 7,129 | | | | 52,680 | | | | 142,066 | |
| Municipal tax liabilities | | | 6,019 | | | | 308 | | | | 2,493 | | | | 8,204 | |
| Impairment evaluation | | | 3,291 | | | | 305 | | | | 2,953 | | | | 5,939 | |
| Tax loss carryforward | | | 109,811 | | | | 117 | | | | 23,016 | | | | 132,710 | |
| Financial obligations | | | 75,246 | | | | 451 | | | | 15,239 | | | | 90,034 | |
| Deferred income | | | 980 | | | | - | | | | 1,115 | | | | 2,095 | |
| Investment valuation | | | 3,169 | | | | 2,552 | | | | - | | | | 617 | |
| Others | | | 31,397 | | | | 7,414 | | | | 2,456 | | | | 26,439 | |
| Total deferred tax asset | | | 410,770 | | | | 108,705 | | | | 185,867 | | | | 487,932 | |
| | | January 1, 2014 | | | Realization | | | Increase | | | December 31, 2014 | |
| | | In millions of COP | |
| Deferred tax liability | | | | | | | | | | | | | | | | |
| Property and equipment | | | (246,637 | ) | | | 71,255 | | | | 59,559 | | | | (234,941 | ) |
| Inventories | | | (4,290 | ) | | | - | | | | 4,570 | | | | (8,860 | ) |
| Leasing re-expression | | | (44,057 | ) | | | 513,368 | | | | 556,419 | | | | (87,108 | ) |
| Impairment evaluation | | | (59,540 | ) | | | 30,985 | | | | 106,815 | | | | (135,370 | ) |
| Equity securities valuation | | | (30,187 | ) | | | 160,196 | | | | 148,120 | | | | (18,111 | ) |
| Derivatives valuation | | | (36,616 | ) | | | 109,176 | | | | 156,033 | | | | (83,473 | ) |
| Goods received as payment | | | (42,616 | ) | | | 8,140 | | | | 11,333 | | | | (45,809 | ) |
| Others | | | (41,963 | ) | | | 6,727 | | | | 122,339 | | | | (157,575 | ) |
| Total deferred tax liability | | | (505,906 | ) | | | 899,847 | | | | 1,165,188 | | | | (771,247 | ) |
Impact on Other Comprehensive Income
| | | January 1, 2014 | | | Realization | | | Increase | | | December 31, 2014 | |
| | | In millions of COP | |
| Deferred tax asset | | | | | | | | | | | | | | | | |
| Employee benefits | | | 705 | | | | 1,854 | | | | 8,261 | | | | 7,112 | |
| Total deferred tax asset | | | 705 | | | | 1,854 | | | | 8,261 | | | | 7,112 | |
| | | January 1, 2014 | | | Realization | | | Increase | | | December
31, 2014 | |
| | | In millions of COP | |
| Deferred tax liability | | | | | | | | | | | | | | | | |
| Debt securities valuation | | | (40 | ) | | | | | | | | | | | (40 | ) |
| Investment valuation | | | (76,012 | ) | | | 9,810 | | | | 12,920 | | | | (79,122 | ) |
| Total deferred tax liability | | | (76,052 | ) | | | 9,810 | | | | 12,920 | | | | (79,162 | ) |
The Bank expects to have future net income to recover values recognized as deferred tax asset. These estimates of future net income are based on financial projections that were prepared taking into account the information from Grupo Bancolombia's economic research about the economic environment expected for the next five (5) years, affecting the Parent Company and its subsidiaries. The main indicators on which the models are based are GDP growth, portfolio growth and interest rates. Apart from these elements, the company's long-term strategy is taken into consideration.
| 5. | Future consequences for the income tax and CREE tax of receiving dividends |
According to the Bankhistorical behavior of dividends and current tax regulations, if the Parent Company receives dividends from its Colombian subsidiaries, these would not be charged.
| 6. | Reconciliation of the effective tax rate |
| Reconciliation of the average effective tax rate and the applicable tax rate | | 2015 | | | 2014 | |
| | | In millions of COP | |
| Accounting earnings | | | 3,235,635 | | | | 3,104,594 | |
| Tax applicable to the nominal rate | | | 1,261,898 | | | | 1,055,562 | |
| Effect of the tax rate on non-deductible expenses for determining taxable profit (loss) | | | 290,291 | | | | 146,282 | |
| Effect of the tax rate on accounting and not fiscal expenses (income) for determining taxable profit (loss) | | | (972,015 | ) | | | (354,731 | ) |
| Effect of the tax rate on fiscal and not accounting expenses (income) for determining taxable profit (loss) | | | 352,543 | | | | 354,750 | |
| Effect of the tax rate on revenues from ordinary activities exempt from taxation | | | (172,466 | ) | | | (168,047 | ) |
| Effect of the tax rate on income from ordinary activities not constituting income or occasional earnings from taxation | | | (66,459 | ) | | | (103,938 | ) |
| Other fiscal deductions | | | (171,053 | ) | | | (216,569 | ) |
| Unrealized value of financial instruments | | | - | | | | 235 | |
| Effect of difference in statutory tax rates | | | 36,263 | | | | 18,495 | |
| Foreign profits taxed at other rates | | | 99,398 | | | | 71,614 | |
| Other effects of the tax rate from reconciling accounting earnings and tax expenses (income) | | | (11,899 | ) | | | (67,318 | ) |
| sale of assets | | | 2,749 | | | | 1,341 | |
| Total Tax | | | 649,250 | | | | 737,676 | |
The effective tax rate as of December 31, 2015 and 2014 were 20.07% and 23.76%, respectively.
| 7. | Discontinued operations |
| Compañía de Financiamiento Tuya S.A. | | 2015 | | | 2014 | |
| Earnings before taxes | | | 21,446 | | | | 99,852 | |
| Total income and CREE taxes | | | 21,635 | | | | 26,157 | |
| Total deferred tax | | | (22,702 | ) | | | 10,828 | |
| Total tax | | | (1,067 | ) | | | 36,985 | |
| Net profit of discontinued operations | | | 22,513 | | | | 62,867 | |
| 8. | Potential consequences on the payment of dividends |
If the Parent Company, or any of its subsidiaries, distributes dividends, these would be subject to the tax regulations of each of the countries where they are enacted.
| 9. | Tax contingent liabilities and assets |
On December 31, 2015, Grupo Bancolombia presented the following contingent liabilities for tax matters; sanctions and default interests are part of such provisions and are registered in Colombia provide the following:relevant expenses.
| Processes | | | December 31, 2015 | | | December 31, 2014 | |
| Income taxes of 2006 and 2008, the revised assessment was demanded, which aims to add income and disregard costs and deductions. | | | | | | | | |
| | | | | | | | |
| Bancolombia, Bancolombia securities and Investment Banking, it was claimed the resolution, which is intended to impose a sanction for correction to the wealth tax declaration. | | | - | | | COP | 64,469 | |
The following is the detail of the Tax loss carryforward and excesses of presumptive income on net income in the group entities which have not been used up to December 31, 2015.
| Base | | Tax deferred asset recognized |
| | |
| COP 465,526 | | COP 116,388 |
The following is the detail of the Tax loss carryforward and excesses of presumptive income on net income in the group entities which have not been used up to December 31, 2014.
| Base | | Tax deferred asset recognized |
| | |
| COP 530,838 | | COP 132,710 |
| 11. | Current tax regulations |
Current tax regulations generally include the following sections:
a) On December 26, 2012, pursuantCompanies domiciled in Colombia
1. In accordance to lawthe provisions contained in Act 1607 of 2012, Congress established and defined new criteria applicable tothe net taxable income tax, value added tax, among others:
1) Companies and individuals which are subject to income tax underrate as from the Colombian tax regulatory regime to calculate annually theImpuesto sobre la Renta para la Equidad (“CREE”)year 2013 is 25%.
The applicable statutory tax2. Occasional earnings are handled separately from ordinary income and taxed at a rate for CREE is 9%of 10% as from 2013 to 2015 and 8% in subsequent years.the year 2013.
3. The taxablebase for determining the ordinary income for CREE is calculated basedtax cannot be under three percent (3%) of liquid assets on ordinary taxable income, limiting some deductions such as donations, tax exempt income from interest on housing leasing, performing premises and equipment purchased during the year (see f. below) and compensation of tax loss carryforwards, among others. The minimum basis to determine the taxable income for CREE for the year may not be below 3% of an entity’s net assets, calculated based on the tax basis as of the last day of the immediately preceding taxableprevious fiscal year.
4. It is necessary to conduct a study for transfer prices and to present an informative statement along with supporting documentation regarding the operations carried out with ties or related parties abroad and in fiscal havens.
2) The applicable statutorySupported by economic studies and documentation supporting previous years, it is considered that it is not required the additional provision of tax income, the study and the transfer prices declaration of taxable year 2015; there is the formal obligation to submit them in 2016.
5. Operative leasing in Peru have signed a legal stability agreement which will be in force until 2017 and the companies Leasing Bancolombia and Renting Colombia until 2028.
Legal stability contracts are agreements made with the Colombian and Peruvian State to continue implementing certain fiscal regulations in exchange for the making an investment in assets, to pay a premium in Colombia and pay an additional rate in Peru.
In other countries
For companies domiciled inPeru, tax regulation changed after 2014; therefore, as from the year 2013 onwards is 25%2015, the income tax rate of 30% will be 28%, and this would decrease progressively until the year 2019, when it will reach 26%.
3) The aggregate tax burden remains at a tax rateFor the subsidiaries of 34% (ordinaryBancolombia whose address is inPanama and whose income tax at 25%come from transactions outside the Republic of Panama: Bancolombia Panamá S.A., Sistema de Inversiones y Negocios S.A., Banagrícola S.A., Suvalor Panamá Fondo de Inversión S.A. and CREE at 9%) from 2013 to 2015, and forValores Bancolombia Panamá S.A.; the subsequent years the tax burden will be decreased at a tax rate of 33% (due to the reduction in statutory rate of the income tax for the equality by 1%).
4) Companies will be exempted from their semi-fiscal contributions made for the maintenance and support of the SENA (Servicio Nacional de Apredizaje, a government entity dedicated to provide technical education among vulnerable populations), the ICBF (Instituto Colombiano de Bienestar Familiar,a government entity engaged in the comprehensive protection of the familiar well-being) and the portion of the health contributions which are paid by the employer as long as the payments were being made for employees who earn less than 10 SMMLV. The companies will be entitled to cease the payments once the regulation related to the withholding tax for the equality (retención del CREE) applicable to health contributions have been formally adopted. The current tax regulation related to contributions made to family funds remains in place.
5) Companies can deduct from their taxable income goodwill amortization expenses.
6) The new tax regime introduces changes to the computation used to determine dividend income subject to income tax for the year 2013. The amendments to the computation have introduced the figures of “carry forward” and “carry back”, and have taken into account tax discounts paid in foreign transactions.
7) Foreign exchange transactions have been excluded from the Value Added Tax (VAT), which were taxed at a tax rate of 16% before the new regulations went into effect.
8) VAT (Impuesto al valor agregado) paid by companies upon initial acquisition of capital goods can be deducted from their taxable income as a tax discount.
9) The new tax regulations establish as exempted of the tax on financial transactions “GMF” (Gravamen a los movimientos financieros) arise from electronic deposit withdrawals, electronic saving accounts and simplified saving accounts, as long as the tax amounts to less than 65 Tax Value Unit “UVT” (Unidad de valor tributario)
10) Likewise, all the transactions that take place between checking accounts or saving deposits belonging to mutual funds and the rights holders’ accounts are exempted from GMF, as long as the account is held in the same financial institution and in the name of a unique titleholder.
11) Under new regulations the Value Added Tax paid by companies upon initial acquisition of goods and services will be added as the amount recognized as an asset or the expense incurred without being considered a non-deductible tax.
12) The applicable statutory rate of income tax on occasional income from the year 2013 onwards is 10%, which was taxed at a tax rate of 33% before the new regulations went into effect. Gains on sales of premises and equipment held by companies for more than 2 years or gains arising from the disposition of companies with a productive stage greater than 2 years are taxed by the Income tax on occasional income.
b) The applicable statutory tax rate from 2008 to 2012 is 33%. However, the tax authorities allow entities, in order to avoid any uncertainty derived from changes in the tax framework of the country, to agree and fix the tax rates for a defined period of time (ranging from 10 to a maximum of 20 years) to be applied by each entity in their income tax returns to the regulator, and the compliance of certain covenants by the companies established in the contracts. Pursuant to the above, the Bank and some of its subsidiaries had signed individual agreements with the tax authorities to report their taxes under this option, as follows:
| Company | | Tax rate | | | Period | | Agreement expiration | |
| Bancolombia | | | 35 | % | | 2001-2010 | | 2010 | |
| Banca de Inversión | | | 35 | % | | 2001-2010 | | 2010 | |
| Leasing Bancolombia | | | 35 | % | | 2001-2010 | | 2010 | |
| Fiduciaria Bancolombia | | | 35 | % | | 2000-2009 | | 2009 | |
c) The minimum basis to determine taxable income for the year may not be below 3% of an entity’s net assets, calculated based on the tax basis as of the last day of the immediately preceding taxable year (presumptive income). However, any difference with the ordinary taxable income that would have been paid in the case the 3% net assets threshold, can be deducted in subsequent years, in a similar way as those procedures applied to compensate tax loss carryforwards.
d) Taxable loss carryforwards are deductible in future years, in periods established by the tax regulations. As of December 31, 2012, the Bank and its subsidiaries in Colombia had accumulated tax loss carryforwards and excesses of presumptive income generated in previous years, as follows:
| Expiration date | | Loss
carry-forwards | | | Excess of
presumed income | |
| With no Maximum expiry date | | COP | 338,357 | | | COP | 37,318 | |
| 2016 | | | 677 | | | | 26,568 | |
| 2015 | | | 673 | | | | - | |
| 2014 | | | 862 | | | | - | |
| 2013 | | | 435 | | | | - | |
| | | COP | 341,004 | | | COP | 63,886 | |
e) Any non-recurring taxable income is reported and taxed separately from any ordinary taxable income, although the same income tax rate as stated in a) is applicable to both. Non recurring taxable income is mainly generated by gains obtained from the disposal of fixed assets owned more than two years and gains resulting from the liquidation of partnerships inheritances, legacies and donations.
f) Companies can deduct from their taxable income a special allowance calculated on their performing premises and equipment purchased during the year in addition to their depreciation charges. For 2009 and 2010, the special allowance represented 40% and 30% of the purchased asset, respectively. If the premises and equipment subject to the allowance is disposed before the end of its useful life, an adjustment to income calculated in proportion to the remaining useful life of the asset should be added to the company’s taxable income basis in the year the asset is sold. This allowance has been eliminated in 2011, except for companies under special agreements with the tax authorities as explained in b) above
g) Intercompany transactions with overseas related parties in countries considered tax havens, are required for income tax purposes, to be considered as taxable income, by considering the prices and profit margins that should have been used in comparable third parties arm’s-length transactions. As of the date of the issuance of these financial statements, the Bank’s Management and its advisors have not yet concluded the transfer pricing analysis for 2012; however, they consider that based on the satisfactory results of the studies in 2011 and the operations for 2012, no significant additional tax provisions should be required.
Foreign tax regulations in the countries where the Bank has the main foreign subsidiaries provide the following:
1) In the Bank subsidiaries in Panama (Bancolombia Panamá and Subsidiaries, and Banagrícola) income tax is governed byaccording to the Panamanian Tax Code. Net incomesprovisions of the Fiscal Code of Panama, which provides that foreign source profits are not taxable; therefore, the profits obtained by the aforementioned companies mentioned above are not subject to income tax.
Bancolombia Cayman S.A., domiciled inCayman Islands and whose income come from transactions outside Cayman Islands is not subject to income tax in Panama.
2) Bank subsidiaries incorporatedCayman Islands according to the current tax regulations in El Salvador pay income taxes on taxable income at statutory rate of 25% obtained within the country.
StartingBanistmo S.A. and its subsidiaries and Bancolombia (Panama Branch) established in the Republic ofPanama pay an income tax on the profit obtained in the country at a rate of 25% as from the year 2014. According to the tax regulations in force in the country, profit from foreign transactions, interests earned on term deposits in local banks, Government of Panama debt securities and investments in securities listed on the Stock Exchange are exempt from the payment of income tax.
InEl Salvador, the income tax is determined applying the rate of 30% to the taxable income under the Income Tax Act of El Salvador, contained in Legislative Decree No. 134 of 1991, effective as from January 1, 2012, companies1992.
Companies whether or not domiciled for tax purposes in El Salvador are taxed at anwith taxable income tax rate of 30%, except for companies with annual revenuesequal or less than USD 150,000, which150 a year will pay only 25% of the taxable income. Dividends are excluded from the tax calculation, but are charged with a tax equal to 5% when paid or credited to its shareholders, except that these have been subject to retention and total of the tax in previous distributions.
The income tax to be paid in respect of 25%. Nevertheless, dividends paid to those companies are taxed at an income tax rate of 5%capital earnings from property realized after twelve months is 10%.
3) The Bank subsidiary in BancolombiaPuerto Rico, according to the law governing the International Banking Center of Puerto Rico, is 100% exemptfree of income, property and municipal taxes ifprovided that the income is obtainedderives from international banking activities, pursuant to said law.activities.
4)For companies located inGuatemala; in accordance with Book I, Income Tax of Decree No. 10-2012 of the Congress of the Republic of Guatemala, published on March 5, 2012, from January 1, 2013, the Bank subsidiaries incorporated in Peru payadopted the profit regime of lucrative activities that sets a tax rate of 25% for the year 2015 and following periods. Additionally, the income taxesfrom capital and capital earnings are charged with a tax rate of 10%, and the distribution of dividends, earnings and profits is charged with a tax rate of 5%.
Likewise, it is also possible for some companies to adopt the optional simplified regime of income from lucrative activities for the determination of the income tax, which sets a tax rate of 5% on the monthly taxable income at statutory rateup to Q. 30,000 plus 7% upon the remainder of 30% obtained within the country.monthly taxable income over this amount, considering as taxable income the total income affected.
NOTE 11B. Wealth tax
Profits obtained in Bank foreign subsidiaries are taxable income in Colombia only when they are distributedThe wealth was established as dividends on cash basis; however the parent company management has no plans to return to Colombia all those accumulated profits in their foreign operations that is why the Bank has not recorded any deferreda new tax liability for this matter. At December 31, 2012, profits accumulated in the Bank foreign operations amounting COP 846,587.
The following is a reconciliation of taxable income before income taxes:
| | | 2012 | | | 2011 | | | 2010 | |
| | | | | | | | | | |
| Income before income taxes | | COP | 2,169,120 | | | COP | 2,134,411 | | | COP | 1,944,911 | |
| Loss carry-forwards and excess of presumed income | | | 195,442 | | | | 138,583 | | | | 24,021 | |
| Non-deductible provisions, costs and expenses | | | 307,221 | | | | 369,368 | | | | 389,081 | |
| Non-taxable or exempt income | | | (551,992 | ) | | | (564,975 | ) | | | (582,716 | ) |
| Excess of accrued income over unrealized income on trading investments | | | (99,775 | ) | | | (122,774 | ) | | | (52,304 | ) |
| Amortization of excess of presumed income over ordinary income and amortization of net operating loss carry- forwards | | | (16,108 | ) | | | (49,270 | ) | | | (1,574 | ) |
| Difference between gains on sale of assets for tax purposes and for financial reporting purposes | | | (16,687 | ) | | | (2,000 | ) | | | (38,246 | ) |
| Unrealized income on derivative financial instruments | | | 72,742 | | | | (45,692 | ) | | | 18,851 | |
| Special tax allowance for investments in performing assets | | | (421,326 | ) | | | (327,326 | ) | | | (157,054 | ) |
| Minority interest | | | 10,527 | | | | 14,917 | | | | 16,601 | |
| Other | | | (80,415 | ) | | | (125,183 | ) | | | (172,310 | ) |
| Taxable income | | | 1,568,749 | | | | 1,420,059 | | | | 1,389,261 | |
| Statutory tax rate (weighted average) | | | 30.84 | % | | | 28.90 | % | | | 35.79 | % |
| Estimated current income tax | | COP | 483,794 | | | COP | 410,422 | | | COP | 497,231 | |
| Deferred income tax expense (benefit) | | | (16,720 | ) | | | 60,095 | | | | 11,186 | |
| Total | | COP | 467,074 | | | COP | 470,517 | | | COP | 508,417 | |
Income taxes for the years ended December 31, 2012, 20112015 to 2017. It applies to legal persons paying the income tax, whose liquid assets up to January 1, 2015, is equal to or greater than COP 1,000. This tax rate is marginal and 2010 are subject to reviewfor assets exceeding COP 5,000 it will be:
| Year | | Rate | |
| 2015 | | | 1.15 | % |
| 2016 | | | 1 | % |
| 2017 | | | 0.4 | % |
For 2016 and 2017, the base will be the one of 2015 increased by one quarter of each year's inflation and in the event that the taxable base of 2016 and 2017 is less than the one of 2015, the base of the year 2015 shall be reduced by one quarter of the inflation of each year.
The taxable base for payment of the wealth tax can also be diminished by the tax authorities. The Bank management and its legal advisors believe that no significant liabilities in addition to those recorded will arise from such a review. (See Note 26).
(22) Subscribed and Paid-in Capital
Subscribed and paid-in capital consistednet patrimonial value of the following:shares or contributions in national companies, whether is owned directly or through commercial trusts, collective investment funds or voluntary pension funds, as well as shares held through voluntary pension insurance and individual life insurance.
| | | 2012 | | | 2011 | | | 2010 | |
| | | | | | | | | | |
| Authorized shares | | | 1,000,000,000 | | | | 1,000,000,000 | | | | 1,000,000,000 | |
| Issued and outstanding: | | | | | | | | | | | | |
| Common shares with a nominal value of COP 500 (in pesos) | | | 509,704,584 | | | | 509,704,584 | | | | 509,704,584 | |
| Preference shares with a nominal value of COP 500 (in pesos)(1) | | | 342,122,416 | | | | 278,122,419 | | | | 278,122,419 | |
| Companies | (1) | On February 6, 2012, Bancolombia S.A. closed its public offering of preferred shares. The preferred shares were initially offered to the stockholders of Bancolombia S.A, in a preemptive rights offering conducted in Colombia, and subsequently offered exclusively outside ColombiaTaxes value | |
| | | | |
Total wealth tax paid in the form of American Depositary Shares (“ADSs”). Of the total 63,999,997 preferred shares that were offered, 43,543,793 preferred shares were subscribed in the local preemptive rights offering, at a price of COP 26,000 per share, for an aggregate amount of approximately COP 1,132,138. In the public offering outside Colombia, 5,114,051 ADSs, representing 20,456,204 preferred shares, were sold, at a price of USD 60 per ADS. As a result of this transaction, the Bank has recognized as additional paid-in capital the amount of COP 1,619,917.year 2015 | | | 161,554 | |
Pursuant to Colombian law, minimum regulatory capital for banks is required to be not less than 9% of their total assets weighted by credit risk ratings and credit risk contingencies. Under Decree 1720 of 2001, the calculation of minimum regulatory capital must incorporate market risk in addition to credit risk. This minimum regulatory capital was fully covered in 2012 and 2011. Calculations are made each month on an unconsolidated basis and in June and December on consolidated accounts which include the Bank’s financial subsidiaries in Colombia and abroad.
NOTE 12. ASSETS HELD FOR SALE AND INVENTORIES
AsThe breakdown of December 31, 2012inventories and 2011 the Bank’s consolidated minimum regulatory capital ratio was 15.77% and 12.46%, respectively.non-current assets held for sale of The Bank is as follows:
| | | December
31, 2015 | | | December
31, 2014 | | | January
1, 2014 | |
| | | In millions of COP | |
| Inventories | | | 76,543 | | | | 65,508 | | | | 12,913 | |
| Assets held for sale | | | 53,286 | | | | 32,236 | | | | 40,738 | |
| Assets related to discontinued operations(1) | | | 1,820,979 | | | | - | | | | - | |
| Total inventories and assets held for sale | | | 1,950,808 | | | | 97,744 | | | | 53,651 | |
(23) Appropriated Retained Earnings
Pursuant to Colombian law, 10% of the unconsolidated net income of the Bank and its Colombian subsidiaries in each year must be appropriated through a credit to a “legal reserve fund” until its balance is equivalent to at least 50% of the subscribed capital. This legal reserve may not be reduced to less than the indicated percentage, except to cover losses in excess of undistributed earnings.
Appropriated retained earnings consist of the following:
| | | 2012 | | | 2011 | | | 2010 | |
| | | | | | | | | | |
| Legal reserve(1) | | COP | 4,518,451 | | | COP | 4,278,282 | | | COP | 3,695,686 | |
| Additional paid-in capital(2) | | | 2,785,534 | | | | 1,165,617 | | | | 1,165,617 | |
| Other reserves | | | 1,391,154 | | | | 777,894 | | | | 536,670 | |
| Total | | COP | 8,695,139 | | | COP | 6,221,793 | | | COP | 5,397,973 | |
| (1) | Includes legal reserve and net income from previous years. |
| (2) | The increase in the additional paid-in capital in 2012 amounting to COP 1,619,917 resulted from the issuance of preferred shares. For further details about the transaction see “Note 22 Subscribed and Paid-in Capital” |
Reserve for Country Risk(1) Corresponds to assets of Compañía de financiamiento Tuya S.A . See Note 31 Discontinued Operations.
Banco Agrícola S.A. records reserves for country risk in their stockholder’s equity.12.1 Inventories
Institutions that place or commit funds in other countries use the sovereign risk ratings for the country in question in order to determine the country risk. Said ratings are issued by well-known international risk rating agencies for long-term obligations.
Any increase in these reserves gives rise to a debitDue to the appropriated retained earnings account – profits from prior years andnature of the financial services provided by the companies which comprise the Bank’s Leasing segment, when assets provided through operating or financial leases to third parties that do not exercise the purchase option or do no have a creditpurchase option, once the agreement expires those assets are recorded as inventories, considering that in the restricted equity account – profits from prior years. Drops incourse of the reserves cause a reverse effect in the accounts.ordinary activities performed by such subsidiaries, those assets are routinely sold.
(24) Dividends DeclaredThe Bank's inventories at December 31, 2015 and 2014, are summarized as follows:
Dividends are declared and paid to stockholders based on net income from the previous year based on the unconsolidated financial statements. Dividends were paid as indicated below:
| | | 2013 | | | 2012 | | | 2011 | |
| Preceding year’s unconsolidated net income | | COP | 1,284,490 | | | COP | 1,192,267 | | | COP | 1,177,999 | |
| | | | | | | | | | | | | |
| Dividends in cash (in Colombian pesos) | | | COP 754.00 per share payable in four quarterly installments of COP 188.50 per share from April 2013 on 509,704,584 and 342,122,416 common and preferred shares, respectively | | | | COP 708.00 per share payable in four quarterly installments of COP 177.00 per share from April 2012 on 509,704,584 and 342,122,416 common and preferred shares(includes 63,999,997 preferred shares issued on February 6, 2012), respectively. | | | | COP 668.64 per share payable in four quarterly installments of COP 167.16 per share from April 2011 on 509,704,584 and 278,122,419 common and preferred shares, respectively | |
| Total dividends declared | | COP | 642,278 | | | COP | 603,094 | | | COP | 526,773 | |
| Dividends payable at December 31(1) | | | | | | COP | 158,113 | | | COP | 138,440 | |
| (1) | The amount of the dividends payable at December 31, is recorded under accounts payable in the consolidated balance sheets. |
| | | 2015 | | | 2014 | |
| | | In millions of COP | |
| Leasing Segment: | | | | | | | | |
| Machinery | | | 63,631 | | | | 31,865 | |
| Lands and buildings | | | 15,223 | | | | 40,482 | |
| Inventory – vehicle | | | 12,577 | | | | 12,471 | |
| Other segments | | | | | | | | |
| Mobile phone inventory (1) | | | - | | | | 125 | |
| Mobile phone kit inventory(1) | | | - | | | | 54 | |
| Total inventory cost | | | 91,431 | | | | 84,997 | |
| Impairment | | | (14,888 | ) | | | (19,489 | ) |
| Total inventories | | | 76,543 | | | | 65,508 | |
(25) Memorandum Accounts
Memorandum accounts were composed of the following:
| | | 2012 | | | 2011 | |
| | | | | | | |
| Trust: | | | | | | | | |
| Managed by subsidiary companies | | COP | 78,025,985 | | | COP | 74,044,118 | |
| | | | | | | | | |
| Commitments: | | | | | | | | |
| Unused credit card limits | | COP | 9,274,593 | | | COP | 8,269,024 | |
| Civil law suits against the Bank | | | 560,345 | | | | 540,653 | |
| Unused letters of credit | | | 3,126,197 | | | | 2,538,637 | |
| Unused lines of credit | | | 1,330,940 | | | | 973,969 | |
| Bank guarantees | | | 1,314,318 | | | | 1,515,857 | |
| Approved loans not disbursed | | | 2,844,745 | | | | 2,414,124 | |
| Nation account payable (546 law) | | | 9,146 | | | | 13,644 | |
| Derivatives (notional amounts) | | | 23,026,065 | | | | 22,189,528 | |
| Insurance (coverages on written policies) | | | - | | | | 45,598,662 | |
| Other | | | 1,750,920 | | | | 1,751,362 | |
| Total | | COP | 121,263,254 | | | COP | 159,849,578 | |
Other memorandum accounts:
| | | 2012 | | | 2011 | |
| | | | | | | |
| Memorandum accounts in favor: | | | | | | | | |
| Tax value of assets | | COP | 87,109,444 | | | COP | 55,678,893 | |
| Assets and securities given in custody | | | 9,881,070 | | | | 23,680,766 | |
| Assets and securities given as collateral | | | 2,478,992 | | | | 2,735,378 | |
| Trading investments in debt securities | | | 6,039,520 | | | | 3,419,352 | |
| Written-off assets | | | 2,671,425 | | | | 2,212,918 | |
| Future lease payment receivables under lease contracts | | | 10,850,443 | | | | 9,936,637 | |
| Investments held to maturity | | | 2,659,794 | | | | 2,832,434 | |
| Inflation adjustments of assets | | | 60,851 | | | | 63,020 | |
| Interest receivables on trading investments in debt securities | | | 735,668 | | | | 377,154 | |
| Investments available for sale in debt securities | | | 499,752 | | | | 769,613 | |
| Remittances sent for collection | | | 22,006 | | | | 21,771 | |
| Amortized debt securities investment | | | 1,678,804 | | | | 1,548,804 | |
| Other memorandum accounts in favor | | | 32,545,087 | | | | 31,574,457 | |
| Total | | COP | 157,232,856 | | | COP | 134,851,197 | |
| | | | | | | | | |
| Memorandum accounts against: | | | | | | | | |
| Assets and securities received as collateral | | COP | 52,288,389 | | | COP | 45,317,617 | |
| Loans, financial and operating leases classified by credit risk | | | 72,650,090 | | | | 63,141,694 | |
| Assets and securities received in custody | | | 6,386,770 | | | | 6,231,016 | |
| Tax value of stockholders’ equity | | | 11,418,255 | | | | 7,738,399 | |
| Adjustment for inflation of equity | | | 884,552 | | | | 886,544 | |
| Other memorandum account against | | | 53,498,016 | | | | 36,756,016 | |
| Total | | COP | 197,126,072 | | | COP | 160,071,286 | |
| Total memorandum accounts | | COP | 475,622,182 | | | COP | 454,772,061 | |
(26) Contingencies
(1)At December 31, 2012,2015, the detailsBank does not have this type of our contingencies were as follows:
The Parent Company
a) Contingencies Covered by FOGAFIN:inventory, due to the sale of Uff Móvil S.A.S.
During the privatization process of Banco de Colombia (which merged with and into the Bank in 1998) completed on January 31, 1994, Fogafin made a commitment to assume the cost of contingentThere are no inventories pledged as collateral for liabilities resulting from events that occurred before the date of the stock purchase which were claimed within five years after such date. Fogafin’s guarantee covers 80% of the first COP 10,000 claimed, excluding provisions, and thereafter, 100%, all annually adjusted according to the consumer price index. Asas of December 31, 2012,2014 and December 31, 2015.
12.2 Non-current assets held for sale
The assets recognized by the Bank as non-current assets held for sale correspond to machinery, equipment, motor vehicles, technology, among others that have been received as foreclosed assets.
The total aggregate amountbalance of liabilities coverednon-current assets held for sale, by Fogafin amountedoperating segment, are detailed below:
| | | As of December 31, 2015 | |
| Non-current assets held for sale | | Banking
Colombia | | | Banking
Panama | | | Banking
El Salvador | | | Banking
Guatemala (1) | | | Leasing
Segment | | | Total | |
| | | In millions of COP | |
| Machinery and equipment | | | 3,451 | | | | 1,776 | | | | - | | | | - | | | | 18,264 | | | | 23,491 | |
| Cost | | | 3,506 | | | | 1,859 | | | | - | | | | - | | | | 19,241 | | | | 24,606 | |
| Impairment | | | (55 | ) | | | (83 | ) | | | - | | | | - | | | | (977 | ) | | | (1,115 | ) |
| Real estate for residential purposes | | | 1,880 | | | | 10,129 | | | | 5,785 | | | | 4,124 | | | | - | | | | 21,918 | |
| Cost | | | 2,032 | | | | 10,290 | | | | 5,967 | | | | 4,124 | | | | - | | | | 22,413 | |
| Impairment | | | (152 | ) | | | (161 | ) | | | (182 | ) | | | - | | | | - | | | | (495 | ) |
| Real estate different from residential properties | | | 166 | | | | 6,793 | | | | - | | | | 918 | | | | - | | | | 7,877 | |
| Cost | | | 175 | | | | 6,857 | | | | - | | | | 918 | | | | - | | | | 7,950 | |
| Impairment | | | (9 | ) | | | (64 | ) | | | - | | | | - | | | | - | | | | (73 | ) |
| Total non-current assets held for sale | | | 5,497 | | | | 18,698 | | | | 5,785 | | | | 5,042 | | | | 18,264 | | | | 53,286 | |
(1) Relate to approximatelythe acquisition of Grupo Agromercantil Holding S.A For further information see Note 8.3 Agromercantil Group Holding (GAH) acquisition
| | | As of December 31, 2014 | |
| Non-current assets held for sale | | Banking
Colombia | | | Banking
Panama | | | Banking
El Salvador | | | Segmento Leasing | | | Total | |
| | | In millions of COP | |
|
| Machinery and equipment | | | 1,737 | | | | 978 | | | | - | | | | - | | | | 2,715 | |
| Cost | | | 2,280 | | | | 978 | | | | - | | | | - | | | | 3,258 | |
| Impairment | | | (543 | ) | | | - | | | | - | | | | - | | | | (543 | ) |
| Real estate for residential purposes | | | 559 | | | | 8,364 | | | | 9,151 | | | | - | | | | 18,074 | |
| Cost | | | 583 | | | | 8,424 | | | | 9,151 | | | | - | | | | 18,158 | |
| Impairment | | | (24 | ) | | | (60 | ) | | | - | | | | - | | | | (84 | ) |
| Real estate different from residential properties | | | 161 | | | | 11,081 | | | | 205 | | | | - | | | | 11,447 | |
| Cost | | | 233 | | | | 11,198 | | | | 205 | | | | - | | | | 11,636 | |
| Impairment | | | (72 | ) | | | (117 | ) | | | - | | | | - | | | | (189 | ) |
| Total non-current assets held for sale | | | 2,457 | | | | 20,423 | | | | 9,356 | | | | - | | | | 32,236 | |
Assets held for sale had an impairment amounting COP 166,1,683 and COP 816 as of December 31, 2015 and December 31, 2014, respectively. The aforementioned impairment was mainly due to transactions with no provisions ata sale price below the same date.carrying value of assets and the estimated costs to sell, computed according to a percentage determined for each type of asset and business line, which decrease the fair value of non-current assets held for sale.
b) Legal ProcessesNOTE 13. OTHER ASSETS
As of December 31, 2012,2015 and 2011, several ordinary complaints, class action suits, civil actions within criminal prosecutions2014 and executive proceedings were pending againstJanuary 1, 2014 the Bank. Bank’s other assets consist of:
| Other Assets | | December
31, 2015 | | | December
31, 2014 | | | January
1, 2014 | |
| | | In millons of COP | |
| Tax advances(1) | | | 899,485 | | | | 279,202 | | | | 157,953 | |
| Interbank Borrowings not classified as cash equivalents | | | 386,367 | | | | - | | | | - | |
| Assets pledged as collateral | | | 325,458 | | | | 133,731 | | | | 118,910 | |
| Prepaid expenses | | | 292,416 | | | | 199,398 | | | | 156,234 | |
| Commission for letters of credit | | | 110,549 | | | | 39,034 | | | | 61,501 | |
| Receivable Sales of goods and service | | | 97,016 | | | | 173,413 | | | | 132,950 | |
| Commission receivables | | | 73,528 | | | | 80,537 | | | | 82,260 | |
| Balance in credit card clearning house | | | 61,251 | | | | 41,771 | | | | 64,742 | |
| Operating leases | | | 42,200 | | | | 35,340 | | | | 25,841 | |
| Taxes Receivable | | | 33,786 | | | | 57,366 | | | | 66,823 | |
| Debtors | | | 14,876 | | | | 366 | | | | 402 | |
| Interest receivable | | | 10,818 | | | | 9,334 | | | | 10,969 | |
| Other receivables | | | 414,544 | | | | 503,661 | | | | 470,187 | |
| Others | | | 87,362 | | | | 11,350 | | | | 12,581 | |
| Allowance Others | | | (12,981 | ) | | | (397 | ) | | | (379 | ) |
| Total | | | 2,836,675 | | | | 1,564,106 | | | | 1,360,974 | |
(1)The total aggregate amount of such claims was equalincrease is mainly due to approximately COP 270,153 for 2012 and COP 297,505 for 2011, and there were provisions for COP 4,592 and COP 5,388 respectively. Provisions are recorded considering the advance of the legal proceeding and the external legal counsel’s opinion related to the probability of occurrence: probable, reasonably possible or remote (without being binding to the Bank). See Note 2 “Summary of Significant Accounting Policies”.higher tax advances from Bancolombia S.A.
As of December 31, 2012 and 2011, pending litigations on labor matters against2015 the Bank amounted toCompañía de Financiamiento Tuya S.A had COP 16,820 and COP 18,125 respectively, the outcome of which is not certain at this stage due to the nature47.521 in other assets that are clasified as a discontinued operation.
NOTE 14. DEPOSITS
The detail of the claims. Provisions for these contingencies amounted to COP 9,752 for 2012deposits as of December 31, 2015 and COP 9,902 for 2011.2014 and as of January 1, 2014 is the following:
| Deposits | | December
31, 2015 | | | December
31, 2014 | | | January
1, 2014 | |
| | | In millions of COP | |
| Saving accounts | | | 47,813,680 | | | | 39,129,999 | | | | 34,650,004 | |
| Time deposits | | | 48,713,789 | | | | 36,105,096 | | | | 34,024,018 | |
| Checking accounts | | | 23,646,578 | | | | 18,147,025 | | | | 16,797,204 | |
| Other deposits | | | 1,627,981 | | | | 1,387,199 | | | | 1,040,878 | |
| Total(1) | | | 121,802,028 | | | | 94,769,319 | | | | 86,512,104 | |
(1)As of December 31, 2012, individual contingencies with a claimed value of2015, Tuya was considered as assets held for sale, and the related deposits amounted to COP 5,000 or more against1,266.30. For further information see Note 31 Discontinued Operations.
The following table details the Bank were:time deposits (‘CDT’) issued by the Bank:
| Proceeding | | Value of claim | | | Provision | | | Probability of occurrence |
| | | | | | | | | |
| Constitutional public interest action claim filed by José Reinaldo Bolaños | | COP | 88,500 | | | COP | - | | | Reasonably possible |
| Inversiones C.B. S.A. | | | 40,806 | | | | - | | | Remote |
| Constitutional public interest action filed by Carlos Julio Aguilar y otros | | | 30,210 | | | | - | | | Reasonably possible |
| Editorial Oveja Negra Ltda. y José Vicente Katarain | | | 9,635 | | | | - | | | Remote |
| Ordinary claim by Suescún & de Brigard Abogados Consultores | | | 8,250 | | | | - | | | Remote |
| Ordinary claim by Gloria Amparo Zuluaga Arcila | | | 5,784 | | | | - | | | Remote |
| Other less than COP 5,000 | | | 86,968 | | | | 4,592 | | | (Remote except COP 4,592) |
| Total | | COP | 270,153 | | | COP | 4,592 | | | |
| CDT | | | Effective interest rate | | | December 31, 2015 | |
| Modality | | | Minimum | | | Maximum | | | Carrying value | | | Fair value | |
| | | | In millions of COP | |
| Less than 6 Months | | | 0.05 | % | | | 7.09 | % | | | | | 10,383,845 | | | | | | 10,324,971 | |
| Equal to 6 months and less than 12 months | | | 0.10 | % | | | 8.91 | % | | | | | 8,196,680 | | | | | | 8,160,973 | |
| Equal to 12 months and less than 18 months | | | 0.10 | % | | | 9.34 | % | | | | | 6,037,867 | | | | | | 6,031,437 | |
| Equal to or greater than 18 months | | | 0.03 | % | | | 13.09 | % | | | | | 24,095,397 | | | | | | 24,136,462 | |
| Total | | | | | | | | | | COP | | | 48,713,789 | | | COP | | | 48,653,843 | |
| CDT | | | Effective interest rate | | | December 31, 2014 | |
| Modality | | | Minimum | | | Maximum | | | Carrying value | | | Fair value | |
| Less than 6 Months | | | 0.10 | % | | | 5.25 | % | | COP | | | 9,854,509 | | | COP | | | 8,885,776 | |
| Equal to 6 months and less than 12 months | | | 0.05 | % | | | 6.69 | % | | | | | 5,487,804 | | | | | | 5,329,350 | |
| Equal to 12 months and less than 18 months | | | 0.10 | % | | | 7.01 | % | | | | | 3,108,758 | | | | | | 3,086,744 | |
| Equal to or greater than 18 months | | | 0.05 | % | | | 12.50 | % | | | | | 17,654,025 | | | | | | 17,863,795 | |
| Total | | | | | | | | | | COP | | | 36,105,096 | | | COP | | | 35,165,665 | |
| CDT | | | Effective interest rate | | | January 1, 2014 | |
| Modality | | | Minimum | | | Maximum | | | Carrying value | | | Fair value | |
| Less than 6 Months | | | 0.10 | % | | | 6.66 | % | | COP | | | 10,733,845 | | | COP | | | 10,554,288 | |
| Equal to 6 months and less than 12 months | | | 0.10 | % | | | 6.66 | % | | | | | 4,850,219 | | | | | | 4,804,641 | |
| Equal to 12 months and less than 18 months | | | 0.10 | % | | | 7.02 | % | | | | | 3,835,477 | | | | | | 3,905,256 | |
| Equal to or greater than 18 months | | | 0.05 | % | | | 12.50 | % | | | | | 14,604,477 | | | | | | 14,925,616 | |
| Total | | | | | | | | | | COP | | | 34,024,018 | | | COP | | | 34,189,801 | |
The above proceedings are outlined below:
Constitutional public interest action filed by Jose Reinaldo Bolaños
The plaintiffs argue that several financial institutions, including Bancolombia, have illegally charged amounts not due through illegal capitalizationdetail of interest in connection with the agreements to restructure public debt by the municipality of Santiago de Cali, signed in accordance with the fiscal and financial relief law.
The plaintiffs alleged that the involved financial institutions, in addition to breach of laws regarding the charging of interest to clients, breached the collective rights to public administration’s morality and the protection of the public funds of the municipality of Santiago de Cali.
The plaintiffs seek reimbursement of amounts charged in excess of which Bancolombia would pay COP 88,500.
On June 2011, a public interest conciliation hearing took place without an agreement being reached. As of December 31, 2012 the court had served the order by which the evidentiary stage was opened; such stage is currently open.
Inversiones C.B. S.A.
In 1997, Conavi (currently Bancolombia) granted a COP 6,000 credit facility to Inversiones C.B. S.A. for a real estate development project. The credit agreement provided for multiple disbursements subject to advances in the construction of the project, among other requisites. Due to an interruption of the construction of the project and a default by the builder, Conavi suspended the disbursements, which in the opinion of the plaintiffs was a breach of contract that generated consequential damages. The claim filed by the plaintiff seeks for the paymentCDT’s maturities issued by the Bank of actual and expectation damages, including loss of profits and corresponding interests, the opportunity cost of capital, the value of the project’s liabilitiesis as well as the effects of inflation.follows:
| | | December 31, 2015 | |
| Period | | Carrying value | | | Fair value | |
| Less than one year | | COP | | | 34,353,150 | | | COP | | | 34,256,206 | |
| 1 to 3 years | | | | | 9,287,774 | | | | | | 9,326,760 | |
| 3 to 5 years | | | | | 2,918,071 | | | | | | 2,937,748 | |
| More than 5 years | | | | | 2,154,794 | | | | | | 2,133,129 | |
| Total | | COP | | | 48,713,789 | | | COP | | | 48,653,843 | |
| | | December 31, 2014 | |
| Period | | Carrying value | | | Fair value | |
| Less than one year | | COP | | | 26,690,094 | | | COP | | | 25,622,132 | |
| 1 to 3 years | | | | | 6,927,020 | | | | | | 6,991,694 | |
| 3 to 5 years | | | | | 1,440,682 | | | | | | 1,457,158 | |
| More than 5 years | | | | | 1,047,300 | | | | | | 1,094,681 | |
| Total | | COP | | | 36,105,096 | | | COP | | | 35,165,665 | |
| | | January 1, 2014 | |
| Period | | Carrying value | | | Fair value | |
| Less than one year | | COP | | | 24,125,424 | | | COP | | | 24,102,797 | |
| 1 to 3 years | | | | | 6,811,357 | | | | | | 6,961,499 | |
| 3 to 5 years | | | | | 1,675,151 | | | | | | 1,697,872 | |
| More than 5 years | | | | | 1,412,086 | | | | | | 1,427,633 | |
| Total | | COP | | | 34,024,018 | | | COP | | | 34,189,801 | |
This contingency is considered to be remote, since the Bank disbursed the funds according to the terms and conditions agreed upon, the plaintiff incurred in inadequate use of proceeds, and other external causes, such as the project’s lack of feasibility and the prevailing crisis within the construction sector, were the main reasons for the failure of the project.
In August 2010, a favorable ruling for the bank was issued by the courts, which was later appealed by the plaintiff. As of December 2012 the appeal is still pending.
Carlos Julio Aguilar and others.
This class action was filed by the plaintiff arguing that the restructuring of the financial obligations of the Departamento del Valle and the performance plan signed by the plaintiff allegedly breached the collective rights to public administration’s morality and the protection of the public funds. The proceeding is in the evidentiary stage, which was suspended due to accumulation of proceedings with another constitutional public interest action based on this same alleged grievance, filed by Carlos Aponte.
As of December 31, 2012, the proceeding is pending the rendering of an expert’s opinion on the amount of interest charged to Departamento del Valle by the financial institutions acting as defendants.
Editorial Oveja Negra Ltda and Jose Vicente Katarain Velez.
The plaintiffs alleged Conavi was liable for the damages caused by the issuance of a certification containing wrongful information, which supposedly misled a judicial officer. This fact caused pretrial detention against José Vicente Katarain Velez.
Mr. Katarain Vélez was investigated on charges of theft and criminal restraint. In 1992, the prosecutor served Conavi with a request to furnish information relating to the transactions made to and from the bank account from which Mr. Katarain Vélez allegedly withdrew funds. One of the statements of Conavi set forth an erroneous date, which did not match with the date stamped on the withdrawal receipt. According to the plaintiffs, such erroneous certification caused Mr. Katarain Vélez and Editorial Oveja Negra Ltda. financial damages.
As favorable facts to the Bank, there was evidence of misdoings by Mr. Katarain in the case file. The erroneous statement could have been easily recognized by the prosecutor by referring to the documents attached to the report. In our opinion, the mistake in the certificate was not a determinative factor in the criminal investigation proceeding.
In the ruling in the first instance the judge dismissed the claim and ordered the plaintiffs to pay the legal expenses. The plaintiff appealed that decision but the appeal was decided in favor of the Bank on March 14, 2011. On March 24, 2011, the plaintiff filed an extraordinary recourse against the ruling before the Supreme Court of Justice, which was admitted on February 9, 2012, and legal expenses were fixed by the judge in an amount of COP 10. The Bank objected to such amount and the case was remanded to the Jower court that originally decided the matter, which fixed the legal expenses in an amount of COP 400. As of December 31, 2012, still pending in the proceeding is a decision regarding legal expenses to be paid by the plaintiffs.
Suescún & de Brigard Abogados Consultores Ltda.
Law firm Suescún & de Brigard Abogados Consultores Ltda., who represented Bancolombia in the arbitration process initiated by the Bank against Jaime Gilinski and others, filed a suit against the Bank alleging that the settlement agreement reached between the parties to the arbitration proceeding entitled the firm to receive the success fee initially agreed between the Bank and the law firm.
The Bank received notice of the claim, and on June 1, 2012, presented a response to such claim. As of December 31, 2012, the proceeding is still pending.
Ordinary lawsuit filed by Gloria Amparo Zuluaga Arcila
The plaintiff alleged damages as a result of debits to the applicant’s checking accounts in 1995 and 1996. This proceeding is related to certain criminal acts performed in the Unicentro Branch of the former Banco Industrial Colombiano (currently Bancolombia).
As of June 30, 2011, the proceeding was in an evidentiary stage, and several testimonies were dismissed due to the difficulties to subpoena the witnesses that were former employees of the Bank. On November 25, 2011, the court selected an expert witness to render an opinion.
As of December 31, 2012, we are awaiting for the final allegations stage of the process.
c) DIAN “Dirección de Impuestos y Aduanas Nacionales”
| Income tax proceedings | | Actual | | | Provision | | | Probability(1) | |
| Income tax for 2006; Dian’s revised official assessment, according to which they intended to add up the income and ignore cost and deductions was sued by the Bank. | | COP | 41,909 | | | COP | 20,954 | | | | Probable | |
Income tax for 2008; This is under discussion with the DIAN.
Reconsideration recourse was filed against the revised official assessment. | | COP | 61,667 | | | | - | | | | - | |
Municipalities
Bogotá District Council
| Industry and Commerce tax | | Year | | | Actual | | | Provision | | | Probability(1) | |
| | | | 2006 | | | COP | 21,617 | | | COP | 10,808 | | | | Probable | | |
| The discussion hinges on the increase in the tax base | | | 2007 | | | | 3,683 | | | | 1,842 | | | | Probable | | |
| for industry and commerce tax because of yields | | | 2008 | | | | 16,966 | | | | 8,483 | | | | Probable | | |
| from the savings sector. | | | 2009 | | | | 22,237 | | | | - | | | | - | | |
| | | | 2010 | | | COP | 6,546 | | | COP | - | | | | - | | |
Barranquilla District Council
| Industry and Commerce tax | | Year | | | Actual | | | Provision | | | Probability | |
| | | | 2005 | | | COP | 247 | | | COP | 124 | | | | Remote | (2) |
| The discussion is about stamp duty in favor of | | | 2006 | | | | 478 | | | | 239 | | | | Remote | (2) |
| senior citizens. | | | 2007 | | | COP | 489 | | | COP | 244 | | | | Remote | (2) |
District of Cartagena
| Industry and Commerce tax | | Year | | | Actual | | | Provision | | | Probability(1) | |
| | | | 2008 | | | COP | 165 | | | | - | | | | | - | |
| The discussion is about industry and commerce tax to | | | 2009 | | | | 10,472 | | | | - | | | | | - | |
| which is subject to interest. | | | 2010 | | | COP | 4,701 | | | | - | | | | | - | |
| (1) | Those contingencies without rating of probability or provision are still being discussed with the Colombian Tax Administration and not before a court. |
| (2) | Contingencies rated as “Remote” are provisioned for and are no longer being discussed with the the Colombian Tax Administration. |
SUBSIDIARIES
BANCO AGRICOLA S.A.
On December 8, 2009, service of process was made to Banco Agrícola of a lawsuit filed against it in the Second Civil Court of San Salvador, consisting of a summary trial claim and settlement of material and pain and suffering for the alleged failure to return certain property seized by Banco Agrícola in a proceeding that started in 1989 mainly consisting of 31 heads of cattle, 13 calves, 11 horses, a tractor and other tools claiming compensation for material and pain and suffering quantified by the plaintiff in USD 284,470 and USD 5,000.
On September 7, 2011, the same Court, at the request of the plaintiff, updated the amount of damages being claimed increasing the amount of compensation for material damages to USD 361,470, and maintaining pain and suffering valued in USD 5,000.
On December 19, 2012, the Court´s first instance ruling was issued in favor of the plaintiff ordering the defendant to pay material damages for the amounts mentioned above. Such ruling was appealed by Banco Agrícola, seeking an overturn in the second instance, based on the legal mistakes present during the proceeding and considering Banco Agrícola’s defense arguments.
In its defense, Banco Agricola has argued that, according to El Salvador´s legislation, the judicial custodian is responsible for the custody and return of the seized assets. The judicial custodian was not Banco Agricola, but rather, it was an individual designated by the Court. Additionally, in a separate criminal proceeding filed by the plaintiff against the judicial custodian the court issued an absolutory based on the argument that the plaintiff did not prove that the assets were not returned.
As of the date of the financial statements, this proceeding was pending in the First Civil Chamber of San Salvador. The management, based on the external legal counsel in charge of the proceeding, has deemed it as remote, there is no provision for this contingency.
LEASING BANCOLOMBIA S.A.
As of December 31, 2012, the following were the proceedings against Leasing Bancolombia, with a claimed amount equal or above COP 1,000:
| Proceeding | | Claimed
amount | | | Current
amount | | | Probabilty |
| Aura Rosinda Ospina Avendaño* | | COP | 4,845 | | | COP | 5,021 | | | Remote |
| ODS impresores | | | 4,000 | | | | 4,000 | | | Remote |
| Lina Maria Rios Chaverra* | | | 3,678 | | | | 3,678 | | | Remote |
| Sandra Diaz* | | | 3,201 | | | | 3,201 | | | Remote |
| Carlos Andres Peña* | | | 2,520 | | | | 2,520 | | | Remote |
| Aura Liliana Rodriguez* | | | 1,301 | | | | 1,545 | | | Remote |
| Jhoana Tafur | | | 1,482 | | | | 1,482 | | | Remote |
| Transportes Cetta | | | 1,789 | | | | 1,418 | | | Reasonably Possible |
| Martha Lucia Castañeda* | | | 1,355 | | | | 1,355 | | | Remote |
| Jose Maria Arcila* | | | 1,229 | | | | 1,298 | | | Remote |
| Jose Manuel Sanabria* | | | 1,052 | | | | 1,234 | | | Remote |
| Samuel Patiño Jaimes | | | 1,234 | | | | 1,234 | | | Remote |
| Martha Edilma Ballesteros* | | | 1,034 | | | | 1,034 | | | Remote |
| Patricia Yolanda Ceballos* | | | 1,034 | | | | 1,034 | | | Remote |
| Fabio Hernando Gonzalez* | | COP | 1,030 | | | COP | 1,030 | | | Remote |
* Proceedings regarding civil liability for traffic accidents, in which our experience and the evidence in our favor, allows us to assess the risk probability as remote. The amount of these claims is a consequence of the moral damages allegedly suffered due to casualties in traffic accidents or due to the number of persons involved.
The assessment of “reasonably possible” was given to Transportes Cetta because, even if there is evidence in favor of Leasing Bancolombia, the stage of the case and the way it has developed so far makes it advisable to make such assessment.
In the opinion of our external counsels none of these contingencies is likely to materialize; therefore, no provisions have been made for any of the proceedings as of the date hereof.
FIDUCIARIA BANCOLOMBIA S.A.
As of December 31, 2012, and 2011, the following were the proceedings against Fiduciaria Bancolombia:
Tax proceedings
District of Barranquilla:
| Industry and Commerce | | Year | | | Claim | | | Provision | |
| The proceeding refers to the differences in the declared income in the Industry and Commerce Tax and the Value Added Tax returns. | | | 2010 | | | COP | 3,459 | | | | - | |
Contingencies of Fiduciaria Bancolombia, in its capacity as trustee.
| 1. | Ordinary proceeding filed by ASEO TOTAL E.S.P. The plaintiff is seeking the declaration of the trust company´s breach of its obligation to pay ASEO TOTAL E.S.P an amount of money as a result of an assignment by Corpoaseo Total S.A. E.S.P. to ASEO TOTAL E.S.P., corresponding to a recovered loan portfoliogenerated by the concession contract of Bogota’s cleaning service. The claimed amount was seized by the Colombian tax authority (Dirección de Impuestos y Aduanas Nacionales – DIAN). This proceding is pending the court’s first instance ruling. The amount claimed in this proceeding is COP 1,306 and accrued interest. |
This proceeding is deemed as a reasonably possible contingency.
Contingencies of Fiduciaria Bancolombia as a member of a consortium:
| 1. | Fidufosyga Consortium 2005. Fiduciaria Bancolombia S.A. is a member of a consortium which is currently involved in the following proceedings: |
| a) | Constitutional public interest actions.There is one ongoing constitutional public interest action in order to protect the collective rights to the public administration’s morality and public health. The plaintiff seeks repayment of an amount of money. This proceeding is pending a ruling. This contingency is deemed remote. |
| b) | Claims based on breaches of contract. There are currently two claims seeking the payment of damages related to catastrophic events and traffic accidents (in Spanish, ECAT- Eventos Catastroficos y accidentes de tránsito) for health care services provided to the population affected by the country’s violence. One of these claims has a first instance ruling and the other does not. These contingencies are deemed remote. |
| c) | Claims seeking annulment of administration’s acts. There is one claim seeking for an annulment relating compensation issues, which does not have a first instance ruling yet. This contingency is deemed remote. |
| d) | Direct claims for damages. Currently there are 85 direct claims for damages, out of which 76 are claims intended to recover expenses paid for medications that were not included in the basic health care plan (Plan Obligatorio de Salud - POS) and for which there are no substitutes; four are claims for delayed payments of recoverable expenses; three are claims relating to the payment of ECAT damages (catastrophic events and traffic accidents) and two are set-off proceedings. Out of the 76 claims to recover expenses, four of them have a favorable first instance ruling and the rest are still pending. These contingencies are deemed remote, except for those proceedings relating to the delayed payments of recoverable expenses which have been deemed probable. |
| e) | Ordinary Proceedings. There are thirteen ordinary proceedings: six proceedings to recover expenses paid for medications that were not included in the basic health care plan (Plan Obligatorio de Salud - POS) and claiming compliance of summary constitutional action rulings; one proceeding claiming the payment of a maternity leave; two proceedings claiming the repayment of employer contributions made to the Social Security System; two ordinary proceeding claiming the payment of ECAT damages (catastrophic events and traffic accidents); two proceedings claiming the interests on delayed payments and; As of December 31, 2012, one of the claims relating to default interest had a favorable ruling in the first stage, the rest have no court rulings. These contingencies are deemed as remote, except for the two default interest proceedings that are deemed probable. |
| f) | Summary proceedings. There are 18 summary proceedings relating to the payment of medication not included in the basic health care plan (Plan Obligatorio de Salud - POS) and claiming compliance of summary constitutional actions rulings. There are 10 proceedings with favorable first instance ruling and nine without any ruling. These contingencies are deemed remote. |
| g) | Fiscal responsibility proceedings. There are five tax responsibility proceedings, one of which is related to payments made as a result of meetings with the ministry of Social Security in which the ministry ordered the consortium to pay medicines and services not included in the basic health care plan (Plan Obligatorio de Salud – POS); one is a claim relating to the repayment for anti-hemophilia medication which is included in the POSand therefore should not have been paid by the consortium; one is a claim against the consortium for paying health brigades madeduring the flood emergency in 2008 with funds that were destined for ECAT damages (catastrophic events and traffic accidents) one for alleged wrongful payments to some health care providers and; one is related to the payments made to IPS Previsar, for services rendered to several patients, that supposedly, managed to obtain the right to be treated with alternative medicine through a summary constitutional action. These proceedings are in the preliminary investigation stage. These contingencies are deemed reasonably possible. |
| h) | Disciplinary investigation filed by the Public Ministry (Procuraduría General de la Nación) against a former legal representative of Fiduciaria Bancolombia, who at the moment of the investigation was also a representative of the FiduFosyga consortium 2005, for responsibility for the refusal to pay and deficient service rendered by FiduFosyga consortium 2005 relating to the repayment of medication authorized by the scientific medical committee and through summary constitutional actions. The court decided to terminate this proceeding because the date in which the claim was filed exceeded the statute of limitations; this decision is pending to be enforceable.This contingency is deemed remote. |
| 2. | Claims relating to FISALUD Consortium, currently there are twodirect claims for damages filed by Compañia Suramericana de Servicios Susalud, which do not have a first instance ruling yet. This contingency is deemed remote. |
| 3. | Claims relating to FOPEP Consortium, there are two relevant proceedings: one ordinary labor proceeding filed by John Freddy Bustos Lombana, who seeks for a declaration as to the fact that he rendered his services as an attorney and as an assistant to a department in FOPEP in two different contracts and therefore asks for the payment of a salary and other labor related payments. Additionally, he claims an indemnity because his resignation was the result of a suggestion madeby the manager of the consortium. A first instance court ruling was issued favorable to the interests of the consortium, which was partially revoked and condemning the defendants: Fiduagraria and the nation both members of the consortium, to pay the sum of COP 1,127. The plaintiff filed an extraordinary appeal against this ruling, which is waiting to be solved. One fiscal responsibility proceeding filed by the Comptroller General of the Republic investigating the possible liability of FOPEP Consortium for possible omissions in implementing internal controls to prevent the consortium from paying double monthly pensions to 47 retirees. This investigation is in the preliminary stage. The first contingency is deemed as probable and the second contingency is deemed remote. |
| 4. | Relating to Municali Consortium, there is a proceeding claiming the payment of a certain amount of money that the plaintiff states was paid by the Consortium to third parties in error and without any authorization. This proceeding is in its preliminary stage. This contingency is deemed probable. |
| 5. | Relating Fidupensional Cundinamarca Consortium, currently there is an administrative collection proceeding filed by the Social Security Institution (Instituto de Seguros Sociales) claiming the payment of default interest in relation to social security related payments recognized by the Department of Cundinamarca, which up to date has no court ruling. This contingency is deemed remote. |
| 6. | Relating FIA Consortium, there is a constitutional public interest action seeking that the municipality of Nátaga set aside an amount of money from its official budget to equip the sewers with adequate ventilation to avoid bad odors escaping, thus, protecting the physical integrity and quality of life of Nátaga´s community. This contingency is deemed remote. |
| 7. | Relating Fidupensiones Consortium, there are three existing proceedings relating to retirement issues. As of the date hereof, these proceedings do not have a first instance ruling. This contingencie is deemed remote. |
(27) Administrative and Other Expenses
Administrative and other expenses consisted of the following:
| | | Year ended December 31 | |
| | | 2012 | | | 2011 | | | 2010 | |
| | | | | | | | | | |
| Industry and trade, property, vehicle and other taxes | | COP | 354,354 | | | COP | 300,599 | | | COP | 213,668 | |
| Communication, postage and freight | | | 248,257 | | | | 228,643 | | | | 140,593 | |
| Maintenance and repairs | | | 235,098 | | | | 192,173 | | | | 157,365 | |
| Professional fees | | | 226,034 | | | | 212,277 | | | | 199,246 | |
| Rental expenses | | | 144,940 | | | | 124,830 | | | | 93,053 | |
| Advertising | | | 100,830 | | | | 99,726 | | | | 89,334 | |
| Joint Venture SUFI - Almacenes Éxito S.A. Expenses | | | 96,822 | | | | 87,070 | | | | 59,798 | |
| Public services | | | 82,325 | | | | 83,829 | | | | 75,327 | |
| Amortization of deferred charges | | | 80,588 | | | | 36,408 | | | | 15,917 | |
| Software amortization | | | 52,206 | | | | 41,552 | | | | 33,375 | |
| Temporary services | | | 47,661 | | | | 37,982 | | | | 74,623 | |
| Security services | | | 46,686 | | | | 44,301 | | | | 41,635 | |
| Stationery and supplies | | | 44,182 | | | | 40,156 | | | | 26,590 | |
| Information processes outsourcing | | | 40,888 | | | | 30,794 | | | | 17,754 | |
| Insurance | | | 33,337 | | | | 31,207 | | | | 26,116 | |
| Contributions and membership fees | | | 32,923 | | | | 28,229 | | | | 29,284 | |
| Travel expenses | | | 21,996 | | | | 23,977 | | | | 24,065 | |
| Electronic processing data | | | 16,008 | | | | 3,494 | | | | 340 | |
| Operational Risk | | | 12,247 | | | | 10,782 | | | | 16,356 | |
| Operational expenses related to joint ventures | | | 8,510 | | | | 20,304 | | | | 19,298 | |
| Call center services | | | 7,399 | | | | 6,260 | | | | 4,100 | |
| Public relationship | | | 3,326 | | | | 2,424 | | | | 2,531 | |
| Other | | | 103,606 | | | | 93,442 | | | | 94,657 | |
| Total | | COP | 2,040,223 | | | COP | 1,780,459 | | | COP | 1,455,025 | |
(28)Non-Operating Income (Expenses)NOTE 15. INTERBANK DEPOSITS AND LIABILITIES
The following table summarizessets forth information regarding the componentsmoney market operations recognized as liabilities in the statement of the Bank’s non-operating income and expenses for the last three fiscal years:financial position:
| | | Year ended December 31, | |
| | | 2012 | | | 2011 | | | 2010 | |
| | | | |
| Non-operating income (expenses): | | | | | | | | | | | | |
| Other income(1) | | COP | 148,751 | | | COP | 200,098 | | | COP | 267,472 | |
| Minority interest | | | (5,723 | ) | | | (11,351 | ) | | | (13,217 | ) |
| Other expenses(2) | | | (107,813 | ) | | | (112,692 | ) | | | (168,179 | ) |
| Total non-operating income (expenses), net | | COP | 35,215 | | | COP | 76,055 | | | COP | 86,076 | |
| (1) | Includes gains on sale of foreclosed assets, premises and equipment, and other assets, securitization residual benefit, income from sale of insurance contracts and rent. |
| (2) | Include fraud-related losses, losses from the sale of foreclosed assets, premises and equipment and payments for fines, sanctions, lawsuits and indemnities. |
(29) Related Party Transactions
Significant balances and transactions with related parties were as follows:
| 2012 |
| | | Stockholders with
participating stock
equal to or higher than
10% of Bank’s capital | | | Non-consolidated
investments | | | Bank’s officers and board of
directors | | | Stockholders with
participating stock lower
than 10% of the Bank’s
capital and with operations
higher than 5% technical
equity | |
| | | | | | | | | | | | | |
| Balance Sheet | | | | | | | | | | | | | | | | |
| Investment securities | | COP | - | | | COP | 113,792 | | | COP | - | | | COP | 10,178 | |
| Loans | | | 100,169 | | | | 504,367 | | | | 74,010 | | | | 553,710 | |
| Customer’s acceptances and derivatives | | | - | | | | - | | | | - | | | | 18,759 | |
| Accounts receivable | | | 1,122 | | | | 8,501 | | | | 3,732 | | | | 2,706 | |
| Other assets | | | - | | | | 245,946 | | | | - | | | | - | |
| Total | | COP | 101,291 | | | COP | 872,606 | | | COP | 77,742 | | | COP | 585,353 | |
| | | | | | | | | | | | | | | | | |
| Deposits | | COP | 2,384 | | | COP | 209,844 | | | COP | 7,088 | | | COP | 3,785,285 | |
| Derivatives | | | - | | | | - | | | | - | | | | 5,984 | |
| Accounts payable | | | - | | | | 17 | | | | 137 | | | | 1 | |
| Bonds | | | 1,000 | | | | - | | | | - | | | | 728,400 | |
| Total | | COP | 3,384 | | | COP | 209,861 | | | COP | 7,225 | | | COP | 4,519,670 | |
| | | | | | | | | | | | | | | | | |
| Transactions | | | | | | | | | | | | | | | | |
| Income | | | | | | | | | | | | | | | | |
| Interest and fees | | COP | 1,158 | | | COP | 26,012 | | | COP | 6,988 | | | COP | 25,840 | |
| Total | | COP | 1,158 | | | COP | 26,012 | | | COP | 6,988 | | | COP | 25,840 | |
| | | | | | | | | | | | | | | | | |
| Expenses | | | | | | | | | | | | | | | | |
| Interest | | COP | 1,221 | | | COP | 4,825 | | | COP | 774 | | | COP | 9,464 | |
| Fees | | | - | | | | 1 | | | | 331 | | | | - | |
| Total | | COP | 1,221 | | | COP | 4,826 | | | COP | 1,105 | | | COP | 9,464 | |
| 2011 |
| | | Stockholders with
participating stock
equal to or higher than
10% of Bank’s capital | | | Non-consolidated
investments | | | Bank’s officers and board of
directors | | | Stockholders with
participating stock lower
than 10% of the Bank’s
capital and with operations
higher than 5% technical
equity | |
| | | | | | | | | | | | | |
| Balance Sheet | | | | | | | | | | | | | | | | |
| Investment securities | | COP | - | | | COP | 582,989 | | | COP | - | | | COP | 512 | |
| Loans | | | 30 | | | | 235,921 | | | | 52,013 | | | | 991,062 | |
| Customer’s acceptances and derivatives | | | - | | | | - | | | | 6 | | | | 14,715 | |
| Accounts receivable | | | 4 | | | | 63,258 | | | | 654 | | | | 3,162 | |
| Other assets | | | - | | | | 257,586 | | | | - | | | | - | |
| Total | | COP | 34 | | | COP | 1,139,754 | | | COP | 52,673 | | | COP | 1,009,451 | |
| | | | | | | | | | | | | | | | | |
| Deposits | | COP | 68,824 | | | COP | 155,225 | | | COP | 5,190 | | | COP | 1,556,628 | |
| Derivatives | | | - | | | | - | | | | - | | | | 8,003 | |
| Bonds | | | 6,700 | | | | 4,000 | | | | - | | | | 467,667 | |
| Total | | COP | 75,524 | | | COP | 159,225 | | | COP | 5,190 | | | COP | 2,032,298 | |
| | | | | | | | | | | | | | | | | |
| Transactions | | | | | | | | | | | | | | | | |
| Income | | | | | | | | | | | | | | | | |
| Dividends received | | COP | - | | | COP | 20,276 | | | COP | - | | | COP | - | |
| Interest and fees | | | 19,968 | | | | 154,392 | | | | 4,805 | | | | 74,069 | |
| Total | | COP | 19,968 | | | COP | 174,668 | | | COP | 4,805 | | | COP | 74,069 | |
| | | | | | | | | | | | | | | | | |
| Expenses | | | | | | | | | | | | | | | | |
| Interest | | COP | 2,861 | | | COP | 35,978 | | | COP | 758 | | | COP | 104,211 | |
| Fees | | | - | | | | 1 | | | | 1,158 | | | | 33 | |
| Total | | COP | 2,861 | | | COP | 35,979 | | | COP | 1,916 | | | COP | 104,244 | |
(30) Subsequent Events
Agreement to acquire HSBC bank in Panamá
On February 19, 2013, the Bank announced the execution of an agreement with HSBC Holdings plc’s Latin American holding company, HSBC Latin America Holdings (UK) Limited (“HSBC”), to acquire HSBC Bank (Panama) S.A. (“HSBC Panamá”). The agreement provides for Bancolombia to pay total cash consideration of USD 2,100,000, subject to certain customary adjustments based upon estimated net asset value at completion of USD 700,000, in exchange for 100% of common shares, and 90.1% of preferred shares of HSBC Panamá.
The agreement provides for the acquisition of HSBC Panamá’s subsidiaries, including its securities, trust, consumer finance businesses and an insurance company. The transaction will not include the subsidiaries of HSBC Panamá in Colombia (HSBC Colombia S.A. and HSBC Fiduciaria S.A.), which are being sold to a third party by HSBC as part of a previously announced transaction.
The transaction is expected to close during the third quarter of 2013, subject to receipt of required regulatory approvals and other customary closing conditions.
Wind-down of Bancolombia’s Miami Agency
On March 5, 2013, Bancolombia announced its decision to wind-down the business and operations of its agency in Miami, Florida. This decision was made pursuant to the strategy to focus on other international markets. The wind-down process is expected to be completed by the third quarter of 2013.
Issuance of bonds by Leasing Bancolombia
Leasing Bancolombia, a subsidiary of the Bank, as a part of its global ordinary notes program to issue up to an aggregate principal amount of COP 4,500,000 in ordinary notes, has issued COP 600,000 ordinary notes in the local market with an aggregate principal amount of COP 600,000 on March 20, 2013.
DIAN proceeding for the income tax for 2006
In 2010, Bancolombia filed a claim seeking to declare as null and void a revised official assessment issued by the Colombian tax authority (Dirección de Impuestos y Aduanas Nacionales – DIAN) in reference to the income tax return for fiscal year 2006. In the revised official assessment, DIAN rejected certain costs and deductions from the income tax return, and included new income items.
In January 28, 2013, the Administrative Court of Antioquia issued a first instance ruling favorable to Bancolombia, in which the revised official assessment was declared null and void and the sanction imposed by DIAN to Bancolombia for the alleged inaccuracy in its income tax return for fiscal year 2006 was overturned.
Notwithstanding the favorable ruling, the Court failed to declare in its ruling that Bancolombia was entitled to include the disputed cost and deductions for an amount of COP 36,650 in its income tax return and that the added income for an amount of COP 17,979 was not legal. Accordingly, Bancolombia filed an appeal against the first instance ruling before the State’s Counsel (Consejo de Estado) seeking for such declarations.
As of December 31, 2012, this contingency amounted to COP 41,904 and an allowance for 50% of such amount was recorded.
(31) Differences between Colombian Accounting Principles for Banks and U.S. GAAP
The Bank’s financial statements are prepared in accordance with generally accepted accounting principles and practices prescribed by the SFC and other legal provisions (“Colombian banking GAAP”). These principles and regulations differ in certain significant respects from accounting principles generally accepted in the United States of America (“U.S. GAAP”). The principal differences between Colombian banking GAAP and U.S. GAAP and the effect on consolidated net income and consolidated stockholders’ equity are presented below, with an explanation of the adjustments.
The following is a summary of adjustments to consolidated net income and consolidated stockholders’ equity.
a) Reconciliation of consolidated net income:
| | | 2012 | | | 2011 | | | 2010 | |
| | | | | | | | | | |
| Consolidated net income under Colombian banking GAAP | | COP | 1,702,046 | | | COP | 1,663,894 | | | COP | 1,436,494 | |
| a) Deferred income taxes | | | (178,857 | ) | | | (74,173 | ) | | | 28,554 | |
| b) Employee benefit plans | | | 3,411 | | | | 3,328 | | | | (8,859 | ) |
| c) Premises and equipment | | | 29,455 | | | | 28,155 | | | | (11,650 | ) |
| e) Allowance for loans losses, financial lease losses, foreclosed assets and other receivables | | | | | | | | | | | | |
| e.i) Provisions for loan losses, financial lease losses and other receivables | | | 53,049 | | | | (97,247 | ) | | | (35,725 | ) |
| e.ii) Provisions for foreclosed assets | | | (1,791 | ) | | | 2,014 | | | | 18,374 | |
| f) Loan origination fees and costs | | | 34,051 | | | | 20,677 | | | | 7,006 | |
| g) Interest recognition on non-accrual loans | | | 4,638 | | | | (1,048 | ) | | | (5,310 | ) |
| h) Deferred charges | | | 30,635 | | | | 23,972 | | | | 35,011 | |
| i) Investment securities & derivatives | | | (49,209 | ) | | | (128,703 | ) | | | (43,438 | ) |
| j) Dividends received from investments in unaffiliated companies | | | (7,045 | ) | | | - | | | | (2,644 | ) |
| k) Investments in affiliates | | | 6,729 | | | | 5,901 | | | | 5,704 | |
| l) Lessor accounting | | | 38,125 | | | | 50,547 | | | | 17,221 | |
| m) Business combinations | | | | | | | | | | | | |
| m.i) Goodwill | | | 52,788 | | | | 55,791 | | | | 61,440 | |
| m.ii) Intangible assets | | | (59,805 | ) | | | (96,584 | ) | | | (58,559 | ) |
| m.iii) Fair value adjustments to assets and liabilities acquired | | | 2,994 | | | | 18,496 | | | | 34,810 | |
| n) Securitization | | | (5,599 | ) | | | 33,608 | | | | 34,013 | |
| o) Foreign currency translation adjustment | | | 9,997 | | | | (18,737 | ) | | | 1,579 | |
| p) Non-controlling interest | | | 3,295 | | | | 4,821 | | | | (1,292 | ) |
| r) Guarantees and off- balance sheet credit exposures | | | (12,444 | ) | | | (4,584 | ) | | | (7,230 | ) |
| s) Insurance Contracts | | | 248 | | | | (119 | ) | | | (2,903 | ) |
| v) Equity tax | | | 8,826 | | | | (434,675 | ) | | | (2,114 | ) |
| w) Contingencies | | | (31,974 | ) | | | (11,698 | ) | | | 44,279 | |
| Net income attributable to the controlling interest under U.S. GAAP | | | 1,633,563 | | | | 1,043,636 | | | | 1,544,761 | |
| (p) Non-controlling Interest under U.S. GAAP | | | (40,008 | ) | | | (53,253 | ) | | | 26,041 | |
| Total net income under U.S. GAAP | | COP | 1,593,555 | | | COP | 990,383 | | | COP | 1,570,802 | |
| | | | | | | | | | | | | |
| Net income from continuing operations attributable to the controlling interest | | COP | 1,584,690 | | | COP | 913,992 | | | COP | 1,483,832 | |
| Income from and disposal of discontinued operations | | COP | 48,873 | | | COP | 129,644 | | | COP | 60,929 | |
b) Reconciliation of Stockholders’ Equity:
| | | 2012 | | | 2011 | |
| | | | | | | |
| Consolidated stockholders’ equity under Colombian banking GAAP | | COP | 11,606,955 | | | COP | 8,993,360 | |
| a) Deferred income taxes | | | (301,332 | ) | | | (131,079 | ) |
| b) Employee benefit plans | | | (23,255 | ) | | | (1,944 | ) |
| c) Premises and equipment | | | 514,814 | | | | 453,494 | |
| Accumulated depreciation | | | 68,500 | | | | 42,882 | |
| d) Revaluation of assets | | | (637,631 | ) | | | (581,837 | ) |
| e) Allowance for loans losses, financial lease losses, foreclosed assets and other receivables | | | | | | | | |
| e.i) Allowance for loan losses, financial lease losses and other receivables | | | (270,201 | ) | | | (323,250 | ) |
| e.ii) Allowance for foreclosed assets | | | 64,577 | | | | 69,369 | |
| f) Loan origination fees and costs | | | 122,857 | | | | 88,806 | |
| g) Interest recognition on non-accrual loans | | | 8,480 | | | | 3,842 | |
| h) Deferred charges | | | 117,724 | | | | 87,089 | |
| i) Investment securities & derivatives | | | (526,420 | ) | | | (484,273 | ) |
| j) Dividends received from Investments in unaffiliated companies | | | (25,054 | ) | | | (18,009 | ) |
| k) Investments in affiliates | | | 136,492 | | | | 130,329 | |
| l) Lessor accounting | | | (20,444 | ) | | | (5,058 | ) |
| m) Business combinations | | | | | | | | |
| m.i) Goodwill | | | 508,929 | | | | 449,502 | |
| m.ii) Intangible assets (gross) | | | 407,395 | | | | 505,066 | |
| m.ii) Intangible assets (accumulated amortization) | | | (280,440 | ) | | | (305,321 | ) |
| m.iii) Fair value adjustments to assets and liabilities acquired | | | (28,061 | ) | | | (28,068 | ) |
| n) Securitization | | | 104,342 | | | | 113,356 | |
| p) Non-controlling interest | | | (144,064 | ) | | | (146,674 | ) |
| r) Guarantees and off-balance sheet credit exposures | | | (37,667 | ) | | | (25,223 | ) |
| s) Insurance contracts | | | - | | | | (248 | ) |
| v) Equity tax | | | (221,613 | ) | | | (329,490 | ) |
| w) Contingencies | | | 607 | | | | 32,581 | |
| Controlling interest stockholders’ equity under U.S. GAAP | | | 11,145,490 | | | | 8,589,202 | |
| p) Non-controlling interest under U.S. GAAP | | | 238,226 | | | | 206,888 | |
| Total stockholders’ equity under U.S. GAAP | | COP | 11,383,716 | | | COP | 8,796,090 | |
c)Supplemental Consolidated Statements of Cash Flows, Stockholders’ Equity and Comprehensive Income:
The following are the consolidated statements of cash flows, stockholders’ equity and other comprehensive income under U.S. GAAP for the years ended December 31, 2012, 2011 and 2010.
Supplemental Consolidated Condensed Statements of Cash Flows(2)
| | | 2012 | | | 2011 | | | 2010 | |
| Net income attributable to the controlling interest under U.S. GAAP | | COP | 1,633,563 | | | COP | 1,043,636 | | | COP | 1,544,761 | |
| Adjustments to reconcile net income to net cash provided by operating activities | | | (1,231,788 | ) | | | (134,541 | ) | | | 2,179,343 | |
| Net cash provided by operating activities | | | 401,775 | | | | 909,095 | | | | 3,724,104 | |
| Net cash used in investing activities | | | (12,166,508 | ) | | | (14,384,339 | ) | | | (10,779,060 | ) |
| Net cash provided by financing activities | | | 12,466,932 | | | | 14,965,763 | | | | 5,893,672 | |
| Increase (decrease) in cash and cash equivalents | | | 702,199 | | | | 1,490,519 | | | | (1,161,284 | ) |
| Effect of exchange rate changes on cash and cash equivalents | | | (269,292 | ) | | | 134,111 | | | | (105,434 | ) |
| Cash and cash equivalents at beginning of year | | | 7,759,328 | | | | 6,134,698 | | | | 7,401,416 | |
| Cash and cash equivalents at end of year(1) | | COP | 8,192,235 | | | COP | 7,759,328 | | | COP | 6,134,698 | |
| | | | | | | | | | | | | |
| Supplemental schedule of noncash financing activities: | | | | | | | | | | | | |
| Exchange offering of subordinated notes(3): | | | | | | | | | | | | |
| Aggregate principal amount tendered and accepted | | | (360,736 | ) | | | - | | | | - | |
| Aggregate principal amount issued | | COP | 409,263 | | | | - | | | | - | |
| | | December
31, 2015 | | | December
31, 2014 | | | January 1,2014 | |
| | | In millions of COP | |
| Interbank Deposits | | | | | | | | | | | | |
| Interbank liabilities | | | 400,062 | | | | 375,958 | | | | 229,201 | |
| Total interbank | | | 400,062 | | | | 375,958 | | | | 229,201 | |
| Liabilities | | | | | | | | | | | | |
| Short selling operations | | | 699,367 | | | | 724,395 | | | | 739,860 | |
| Temporary transfer of securities | | | 266,798 | | | | 1,165,350 | | | | 244,579 | |
| Repurchase agreements | | | 266,291 | | | | 2,214 | | | | 32,003 | |
| Total Repurchase agreements and other similar secured borrowing(1) | | | 1,232,456 | | | | 1,891,959 | | | | 1,016,442 | |
| Total monetary market transactions | | | 1,632,518 | | | | 2,267,917 | | | | 1,245,643 | |
| (1) | The assetsTotal repo liabilities have maturities of SPEs subject to consolidation under U.S. GAAP, include cash for an amount of COP 23,138, COP 30,331 and COP 78,102less than 30 days. |
Offsetting of Repurchase and Resale Agreements
For the Bank and its Colombian subsidiaries, substantially all of repurchase and resale activities are transacted under legally enforceable repurchase agreements that give the Bank, in the event of default by the counterparty, the right to liquidate securities held with the same counterparty. However, the local law for certain jurisdictions is unclear to determine the enforceability of offsetting rights.
The Bank does not offset repurchase and resale transactions with the same counterparty on the consolidated statement of financial positionevenwhere it has such a legally enforceable netting agreement.
The table below presents repurchases and resale transactions included in the consolidated statement of financial position as cash and due from banks at December 31, 2015 and 2014 and as of January 1, 2014:
| | | As of December 31, 2015 | |
| | | Assets /
liabilities gross | | | Amounts offset in
the statement of
financial position | | | Net balance
presented in the
statement of
financial position | | | Financial instruments
as collaterals | | | Assets /
liabilities
net | |
| | | In millions of COP | |
| Securities purchased under resale agreements | | | 3,303,231 | | | | - | | | | 3,303,231 | | | | (2,931,266 | ) | | | 371,965 | |
| Securities sold under repurchase agreements(1) | | | (533,089 | ) | | | - | | | | (533,089 | ) | | | 533,089 | | | | - | |
| Total repurchase and resale agreements | | | 2,770,142 | | | | - | | | | 2,770,142 | | | | (2,398,177 | ) | | | 371,965 | |
| (1) | As of December 31, 2012, 2011 and 2010, respectively. |
| (2) | These consolidated statements of cash flows do2015, short-sell operations amounted to COP 699,367, these are not includeoffset in the following non-cash transactions for the years 2012, 2011 and 2010 respectively: |
a) COP 142,278; COP 90,088 and COP 152,154 related to restructured loans that were transferred to foreclosed assets.
b) COP 6,630, COP 6,271 and COP 6,676 related to the donation of foreclosed assets.
| (3) | See note 20.table above. |
Supplemental Consolidated Condensed Changes in Stockholders’ Equity
| | | As of December 31, 2014: | |
| | | Assets /
liabilities gross | | | Amounts offset in
the statement of
financial position | | | Net balance presented
in the statement of
financial position | | | Financial
instruments as
collaterals | | | Assets /
liabilities
net | |
| | | In millions of COP | |
| Securities purchased under resale agreements | | COP | 1,302,267 | | | | - | | | COP | 1,302,267 | | | COP | (1,302,267 | ) | | | - | |
| Securities sold under repurchase agreements | | | (1,891,959 | ) | | | - | | | | (1,891,959 | ) | | | 1,657,803 | | | | (234,156 | ) |
| Total repurchase and resale agreements | | | (589,692 | ) | | | - | | | | (589,692 | ) | | | 355,536 | | | | (234,156 | ) |
| | | 2012 | | | 2011 | | | 2010 | |
| | | | | | | | | | |
| Controlling Interest | | | | | | | | | | | | |
| Balance at beginning of year | | COP | 8,589,202 | | | COP | 8,069,346 | | | COP | 7,095,266 | |
| Issuance of preferred shares and paid-in capital | | | 1,651,917 | | | | - | | | | - | |
| Net income | | | 1,633,563 | | | | 1,043,636 | | | | 1,544,761 | |
| Dividends declared | | | (603,094 | ) | | | (526,773 | ) | | | (501,688 | ) |
| Other comprehensive (loss) income | | | (126,098 | ) | | | 2,993 | | | | (62,954 | ) |
| Other movements | | | - | | | | - | | | | (6,039 | ) |
| Controlling interest stockholders’ equity under U.S. GAAP | | COP | 11,145,490 | | | COP | 8,589,202 | | | COP | 8,069,346 | |
| Non-controlling Interest under U.S. GAAP | | | | | | | | | | | | |
| Balance at beginning of year | | | 206,888 | | | | 160,526 | | | | 181,778 | |
| Net income in non-controlling interest | | | (40,008 | ) | | | (53,253 | ) | | | 26,041 | |
| Net change in non-controlling interest | | | 71,346 | | | | 99,615 | | | | (47,293 | ) |
| Balance at end of year | | | 238,226 | | | | 206,888 | | | | 160,526 | |
| Total stockholders’ equity under U.S. GAAP | | COP | 11,383,716 | | | COP | 8,796,090 | | | COP | 8,229,872 | |
| | | As of January 1, 2014 | |
| | | Assets /
liabilities gross | | | Amounts offset in
the statement of
financial position | | | Net balance
presented in the
statement of
financial position | | | Financial
instruments as
collaterals | | | Assets /
liabilities
net | |
| | | In millions of COP | |
| Securities purchased under resale agreements | | | 2,124,721 | | | | - | | | | 2,124,721 | | | | (2,093,052 | ) | | | 31,669 | |
| Securities sold under repurchase agreements | | | (1,016,442 | ) | | | - | | | | (1,016,442 | ) | | | 1,016,442 | | | | - | |
| Total repurchase and resale agreements | | | 1,108,279 | | | | - | | | | 1,108,279 | | | | (1,076,610 | ) | | | 31,669 | |
For further information about offsetting of other financial assets and liabilities see Note 5 Financial assets investments and derivatives.
NOTE 16. BORROWINGS FROM OTHER FINANCIAL INSTITUTIONS
As of December 31, 2015 and 2014 and as of January 1, 2014, the composition of the borrowings from other financial institutions measured at amortized cost is the following:
| | | December 31, 2015 | | | December 31, 2014 | | | January 1, 2014 | |
| Obligations granted by domestic banks | | COP | 5,634,692 | | | COP | 4,472,287 | | | COP | 4,771,143 | |
| Obligations granted by foreign banks (1) | | | 14,086,492 | | | | 9,379,997 | | | | 7,707,568 | |
| Total | | COP | 19,721,184 | | | COP | 13,852,284 | | | COP | 12,478,711 | |
(1) The Bank has recognized a financial liability with Bank Financial Corporation (BFC) amounting to USD 271.5 million as of December 31, 2015, due to its obligation to pay cash in future to purchase the non-controlling shares of Grupo Agromercantil Holding. The Bank will reclassify the liability to equity if the put expires unexercised. For further information see Note 8.3. Acquisition of Grupo Agromercantil Holding (GAH).
Obligations granted by domestic banks
| Financial entity | | Rate
Maximum | | | Rate
Minimum | | | December 31, 2015 | |
| Financiera de Desarrollo Territorial ("Findeter") | | | 11.70 | % | | | 0.16 | % | | COP | 1,953,996 | |
| Banco de Comercio Exterior de Colombia (“Bancoldex”) | | | 10.47 | % | | | 1.01 | % | | | 1,248,294 | |
| Fondo para el Financiamiento del Sector Agropecuario ("Finagro") | | | 7.38 | % | | | 0.27 | % | | | 320,332 | |
| Other private financial entities | | | 8.51 | % | | | 3.46 | % | | | 2,112,070 | |
| Total | | | | | | | | | | COP | 5,634,692 | |
| Financial entity | | Rate
Maximum | | | Rate
Minimum | | | December 31, 2014 | |
| Financiera de Desarrollo Territorial ("Findeter") | | | 8.83 | % | | | 0.00 | % | | COP | 1,649,214 | |
| Banco de Comercio Exterior de Colombia (“Bancoldex”) | | | 8.12 | % | | | 0.01 | % | | | 877,143 | |
| Fondo para el Financiamiento del Sector Agropecuario ("Finagro") | | | 19.79 | % | | | 0.01 | % | | | 278,245 | |
| Other private financial entities | | | 6.72 | % | | | 0.00 | % | | | 1,667,685 | |
| Total | | | | | | | | | | COP | 4,472,287 | |
Supplemental Consolidated Statement of Comprehensive Income
| | | 2012 | | | 2011 | | | 2010 | |
| | | | | | | | | | |
| Net income attributable to the controlling interest under U.S. GAAP | | COP | 1,633,563 | | | COP | 1,043,636 | | | COP | 1,544,761 | |
| Other comprehensive income, net of tax: | | | | | | | | | | | | |
| Unrealized gain or (loss) on securities available for sale: | | | 19,299 | | | | (24,806 | ) | | | (10,470 | ) |
| Unrealized holding gains (losses) arising during period | | | 9,976 | | | | (2,100 | ) | | | (4,598 | ) |
| Less: reclassification adjustment for gains (losses) included in net income | | | 9,323 | | | | (22,706 | ) | | | (5,872 | ) |
| | | | | | | | | | | | | |
| Pension liability: | | | (16,317 | ) | | | 624 | | | | 7,855 | |
| Net (loss) gain arising during period | | | (17,120 | ) | | | (191 | ) | | | 7,040 | |
| Amortization of prior service cost included in net periodic pension cost | | | 803 | | | | 815 | | | | 815 | |
| | | | | | | | | | | | | |
| Foreign currency translation adjustments | | | (129,080 | ) | | | 27,175 | | | | (60,339 | ) |
| Other comprehensive income (loss) | | | (126,098 | ) | | | 2,993 | | | | (62,954 | ) |
| Comprehensive income attributable to the controlling interest under U.S. GAAP | | | 1,507,465 | | | | 1,046,629 | | | | 1,481,807 | |
| Comprehensive income attributable to the non-controlling interest under U.S. GAAP(1) | | | (40,008 | ) | | | (53,253 | ) | | | 26,041 | |
| Comprehensive income | | COP | 1,467,457 | | | COP | 993,376 | | | COP | 1,507,848 | |
(1) See section p) Non-controlling interest
| Financial entity | | Rate
Maximum | | | Rate
Minimum | | | January 1, 2014 | |
| Financiera de Desarrollo Territorial ("Findeter") | | | 8.31 | % | | | 0.00 | % | | COP | 1,625,859 | |
| Banco de Comercio Exterior de Colombia (“Bancoldex”) | | | 8.66 | % | | | 0.06 | % | | | 1,304,042 | |
| Fondo para el Financiamiento del Sector Agropecuario ("Finagro") | | | 13.06 | % | | | 0.06 | % | | | 401,715 | |
| Other private financial entities | | | 6.19 | % | | | 2.05 | % | | | 1,439,527 | |
| Total | | | | | | | | | | COP | 4,771,143 | |
Total other comprehensive income (loss)
2012The maturities of financial obligations with domestic banks as of December 31, 2015 and 2014 and Juanuary 1,2014, are the following:
| | | Before-Tax | | | (Tax Expense) | | | Net-of-Tax | |
| | | Amount | | | or Benefit | | | Amount | |
| | | | | | | | | | |
| Unrealized gain (loss) on securities available for sale | | | | | | | | | | | | |
| Unrealized holding gains or (loss) arising during period | | COP | 2,273 | | | COP | 7,703 | | | COP | 9,976 | |
| Less: reclassification adjustment for gains or (loss) included in net income | | | 18,965 | | | | (9,642 | ) | | | 9,323 | |
| Net unrealized gains (loss)(1) | | | 21,238 | | | | (1,939 | ) | | | 19,299 | |
| Additional pension liability | | | | | | | | | | | | |
| Net loss arising during period | | | (25,939 | ) | | | 8,819 | | | | (17,120 | ) |
| Less: amortization of prior service cost, transition obligation and net actuarial loss included in net periodic pension cost | | | 1,217 | | | | (414 | ) | | | 803 | |
| Additional pension liability, net | | | (24,722 | ) | | | 8,405 | | | | (16,317 | ) |
| Foreign currency translation adjustment | | | (129,080 | ) | | | - | | | | (129,080 | ) |
| Other comprehensive income (loss) | | COP | (132,564 | ) | | COP | 6,466 | | | COP | (126,098 | ) |
_______________________
| Domestic | | December 31, 2015 | | | December 31, 2014 | | | January 1, 2014 | |
| Amount expected to be settled: | | | | | | | | | | | | |
| No more than twelve months after the reporting period | | COP | 1,326,192 | | | COP | 1,053,895 | | | COP | 1,204,380 | |
| More than twelve months after the reporting period | | | 4,308,500 | | | | 3,418,392 | | | | 3,566,763 | |
| Total | | COP | 5,634,692 | | | COP | 4,472,287 | | | COP | 4,771,143 | |
(1) Includes COP 15,301 related to non taxable unrealized gains.
2011Obligations granted by foreign banks
| | | Before-Tax | | | (Tax Expense) | | | Net-of-Tax | |
| | | Amount | | | or Benefit | | | Amount | |
| | | | | | | | | | |
| Unrealized gain (loss) on securities available for sale | | | | | | | | | | | | |
| Unrealized holding gains or (loss) arising during period | | COP | (6,315 | ) | | COP | 4,215 | | | COP | (2,100 | ) |
| Less: reclassification adjustment for gains or (loss) included in net income | | | (34,360 | ) | | | 11,654 | | | | (22,706 | ) |
| Net unrealized gains (loss)(1) | | | (40,675 | ) | | | 15,869 | | | | (24,806 | ) |
| Additional pension liability | | | | | | | | | | | | |
| Net loss arising during period | | | (286 | ) | | | 95 | | | | (191 | ) |
| Less: amortization of prior service cost, transition obligation and net actuarial loss included in net periodic pension cost | | | 1,217 | | | | (402 | ) | | | 815 | |
| Additional pension liability, net | | | 931 | | | | (307 | ) | | | 624 | |
| Foreign currency translation adjustment | | | 27,175 | | | | - | | | | 27,175 | |
| Other comprehensive income (loss) | | COP | (12,569 | ) | | COP | 15,562 | | | COP | 2,993 | |
| Financial entity | | Maximum
Rate | | | Minimum
Rate | | | December 31, 2015 | |
| | | in millions of COP | |
| Financing with correspondent banks | | | 8.45 | % | | | 0.13 | % | | COP | 12,392,735 | |
| Corporación Andina de Fomento (“CAF”) | | | 3.38 | % | | | 1.89 | % | | | 1,019,782 | |
| Banco Latinoamericano de Exportación (“Bladex”) | | | 3.28 | % | | | 0.60 | % | | | 426,707 | |
| Banco Interamericano de Desarrollo (BID) | | | 3.96 | % | | | 3.30 | % | | | 247,268 | |
| Total | | | | | | | | | | COP | 14,086,492 | |
| Financial entity | | Maximum
Rate | | | Minimum
Rate | | | December 31, 2014 | |
| | | in millions of COP | |
| Financing with correspondent banks | | | 7.000 | % | | | 0.005 | % | | COP | 8,042,847 | |
| Corporación Andina de Fomento (“CAF”) | | | 3.085 | % | | | 1.880 | % | | | 770,505 | |
| Banco Latinoamericano de Exportación (“Bladex”) | | | 2.995 | % | | | 0.529 | % | | | 342,082 | |
| Banco Interamericano de Desarrollo (BID) | | | 0.033 | % | | | 0.000 | % | | | 224,563 | |
| Total | | | | | | | | | | COP | 9,379,997 | |
| Financial entity | | Maximum
Rate | | | Minimum
Rate | | | January 1, 2014 | |
| | | in millions of COP | |
| Financing with correspondent banks | | | 7.10 | % | | | 0.20 | % | | COP | 6,537,416 | |
| Corporación Andina de Fomento (“CAF”) | | | 3.10 | % | | | 2.74 | % | | | 617,470 | |
| Banco Latinoamericano de Exportación (“Bladex”) | | | 3.32 | % | | | 2.84 | % | | | 378,422 | |
| Banco Interamericano de Desarrollo (BID) | | | 3.96 | % | | | 3.30 | % | | | 174,260 | |
| Total | | | | | | | | | | COP | 7,707,568 | |
The maturities of the financial obligations with foreign entities as of December 31 of 2015 and 2014 and January 1, 2014 are the following:
| Foreign | | 2015 | | | 2014 | | | January 1, 2014 | |
| Amount expected to be settled: | | | | | | | | | | | | |
| No more than twelve months after the reporting period | | COP | 9,803,308 | | | COP | 6,402,198 | | | COP | 4,802,831 | |
| More than twelve months after the reporting period | | | 4,283,184 | | | | 2,977,799 | | | | 2,904,737 | |
| Total | | COP | 14,086,492 | | | COP | 9,379,997 | | | COP | 7,707,568 | |
NOTE 17. DEBT SECURITIES IN ISSUE
Duly authorized by the authority in each country, bonds have been issued as follows:
| | | As of December 31, 2015 |
| Issuer | | Currency | | Face value | | | Balance | | | Rate Range |
| Bancolombia S.A. | | Local | | COP | | | 4,134,297 | | | | 2,813,865 | | | 5.19% - 6.99% |
| Bancolombia S.A. | | Foreign | | USD | | | 3,246,970 | | | | 10,290,398 | | | 4.95% - 14.18% |
| Leasing Bancolombia S.A. | | Local | | COP | | | 2,455,982 | | | | 2,474,308 | | | 5.5% - 10.90% |
| Banco Agrícola S.A. | | Foreign | | USD | | | 513,981 | | | | 1,610,198 | | | 4.00% - 6.75% |
| Renting Colombia S.A. | | Local | | COP | | | 300,000 | | | | 16,297 | | | IPC(1)+ 5.90% |
| Bancolombia Panamá S.A. | | Foreign | | USD | | | 397,511 | | | | 1,265,643 | | | 0.15% - 2.00% |
| Grupo Agromercantil Holding S.A. | | Foreign | | USD | | | 306,450 | | | | 965,156 | | | 0.25% - 7.25% |
| Total | | | | | | | | | | | 19,435,865 | | | |
(1) Includes COP 7,571 related to non taxable unrealized gains.Consumer price index
| 2010 |
| | | | | | | | | | |
| | | Before-Tax | | | (Tax Expense) | | | Net-of-Tax | |
| | | Amount | | | or Benefit | | | Amount | |
| | | | | | | | | | |
| Unrealized gain (loss) on securities available for sale | | | | | | | | | | | | |
| Unrealized holding gains or (loss) arising during period | | COP | (3,787 | ) | | COP | (811 | ) | | COP | (4,598 | ) |
| Less: reclassification adjustment for gains or (loss) included in net income | | | (3,489 | ) | | | (2,383 | ) | | | (5,872 | ) |
| Net unrealized gains (loss)(1) | | | (7,276 | ) | | | (3,194 | ) | | | (10,470 | ) |
| Additional pension liability | | | | | | | | | | | | |
| Net loss arising during period | | | 10,507 | | | | (3,467 | ) | | | 7,040 | |
| Less: amortization of prior service cost, transition obligation and net actuarial loss included in net periodic pension cost | | | 1,217 | | | | (402 | ) | | | 815 | |
| Additional pension liability, net | | | 11,724 | | | | (3,869 | ) | | | 7,855 | |
| Foreign currency translation adjustment | | | (60,339 | ) | | | - | | | | (60,339 | ) |
| Other comprehensive income (loss) | | COP | (55,891 | ) | | COP | (7,063 | ) | | COP | (62,954 | ) |
(1) IncludesAs of December 31, 2015 discontinued operation Tuya S.A. had bonds amounting to COP 7,507 related to non taxable unrealized losses.150.032, see Note 31.
| | | As of December 31, 2014 |
| Issuer | | Currency | | Face value | | | Balance
(in millions of
COP) | | | Rate Range |
| Bancolombia S.A.(1) | | Local | | COP | | | 4,134,297 | | | | 2,803,879 | | | 5.19% - 6.99% |
| Bancolombia S.A. | | Foreign | | USD | | | 3,246,970 | | | | 7,786,067 | | | 4.95% - 14.18% |
| Leasing Bancolombia S.A. | | Local | | COP | | | 2,634,424 | | | | 2,506,052 | | | 5.6% - 10.90% |
| Banco Agrícola S.A. | | Foreign | | USD | | | 217,739 | | | | 522,554 | | | 4.43% - 5.32% |
| Renting Colombia S.A. | | Local | | COP | | | 360,000 | | | | 16,000 | | | IPC(2) + 5.90% |
| Compañía de Financiamiento Tuya S.A. | | Local | | COP | | | 144,500 | | | | 145,754 | | | IPC + 2% |
| Bancolombia Panamá S.A. | | Foreign | | USD | | | 309,455 | | | | 747,097 | | | 0.1% - 2.3% |
| Total | | | | | | | | | | | 14,527,403 | | | |
Total accumulated other comprehensive income
| | | Unrealized | | | | | | Foreign | | | Accumulated | |
| | | Gains (Losses) | | | | | | Currency | | | Other | |
| | | on | | | Pension | | | Translation | | | Comprehensive | |
| | | Securities, net of taxes | | | Liability, net of taxes | | | Adjustment | | | Income | |
| | | | | | | | | | | | | |
| Beginning balance 2010 | | COP | 6,146 | | | COP | (17,396 | ) | | COP | (102,667 | ) | | COP | (113,917 | ) |
| OCI Before reclassifications | | | (4,598 | ) | | | 7,040 | | | | (60,339 | ) | | | (57,897 | ) |
| Amounts reclassified from AOCI | | | (5,872 | ) | | | 815 | | | | - | | | | (5,057 | ) |
| Net current-period OCI | | | (10,470 | ) | | | 7,855 | | | | (60,339 | ) | | | (62,954 | ) |
| Ending balance 2010 | | COP | (4,324 | ) | | COP | (9,541 | ) | | COP | (163,006 | ) | | COP | (176,871 | ) |
| | | | | | | | | | | | | | | | | |
| Beginning balance 2011 | | COP | (4,324 | ) | | COP | (9,541 | ) | | COP | (163,006 | ) | | COP | (176,871 | ) |
| OCI Before reclassifications | | | (2,100 | ) | | | (191 | ) | | | 27,175 | | | | 24,884 | |
| Amounts reclassified from AOCI | | | (22,706 | ) | | | 815 | | | | - | | | | (21,891 | ) |
| Net current-period OCI | | | (24,806 | ) | | | 624 | | | | 27,175 | | | | 2,993 | |
| Ending balance 2011 | | COP | (29,130 | ) | | COP | (8,917 | ) | | COP | (135,831 | ) | | COP | (173,878 | ) |
| | | | | | | | | | | | | | | | | |
| Beginning balance 2012 | | COP | (29,130 | ) | | COP | (8,917 | ) | | COP | (135,831 | ) | | COP | (173,878 | ) |
| OCI Before reclassifications | | | 9,976 | | | | (17,120 | ) | | | (129,080 | ) | | | (136,224 | ) |
| Amounts reclassified from AOCI | | | 9,323 | | | | 803 | | | | - | | | | 10,126 | |
| Net current-period OCI | | | 19,299 | | | | (16,317 | ) | | | (129,080 | ) | | | (126,098 | ) |
| Ending balance 2012 | | COP | (9,831 | ) | | COP | (25,234 | ) | | COP | (264,911 | ) | | COP | (299,976 | ) |
Summary of significant differences and required U.S. GAAP disclosures
Deferred tax assets or liabilities must be recorded for all temporary differences raised in the current period based on the consolidated statement of operations when comparing the amount of recognized income and expenses for accounting and tax purposes.
Under U.S. GAAP, deferred tax assets or liabilities must be recorded for all temporary differences between the financial and tax bases of assets and liabilities. Deferred tax assets and liabilities are included in the financial statements at currently enacted income tax rates applicable to the period in which the deferred tax assets and liabilities are expected to be realized and settled. A valuation allowance is provided for deferred tax assets to the extent that it is more likely than not that they will not be realized. For the years ended December 31, 2012, 2011 and 2010, part of the deferred income taxes included the tax benefits received upon the acquisition of certain property and equipment.
Income tax expense under U.S. GAAP is comprised of the following components for the years ended at December 31, 2012, 2011 and 2010:
| | | 2012 | | | 2011 | | | Amounts previously
reported
2011 | | | 2010 | | | Amounts previously
reported
2010 | |
| | | | | | | | | | | | | | | | |
| Current income tax expense | | COP | 483,794 | | | COP | 410,422 | | | COP | 410,422 | | | COP | 497,231 | | | COP | 497,231 | |
| Deferred income tax (benefit) expense(1) (2) | | | 161,030 | | | | 144,731 | | | | 101,730 | | | | (34,128 | ) | | | (70,943 | ) |
| Total | | COP | 644,824 | | | COP | 555,153 | | | COP | 512,152 | | | COP | 463,103 | | | COP | 426,288 | |
| (1) | In 2012, 2011 and 2010 the foreign currency adjustment of the foreign subsidiaries’ deferred tax assets and liabilities amounted to COP 2,139, COP (13,600), and COP 5,397 respectively. |
| (2) | For the year 2012 and 2011, the roll forward of the deferred tax asset and deferred tax liability from discontinued operations amounting to COP 8,661 and COP 11,783 has been incorporated in the line Income from and disposal of discontinued operations. |
| | | 2012 | | | 2011 | | | Amounts previously
reported
2011 | | | 2010 | | | Amounts previously
reported
2010 | |
| | | | | | | | | | | | | | | | |
| Income tax relating to continuing operations | | COP | 633,387 | | | COP | 538,111 | | | COP | 494,868 | | | COP | 447,918 | | | COP | 410,821 | |
| Income tax relating to discontinued operations(1) | | | 11,437 | | | | 17,042 | | | | 17,284 | | | | 15,185 | | | | 15,467 | |
| Income tax | | COP | 644,824 | | | COP | 555,153 | | | COP | 512,152 | | | COP | 463,103 | | | COP | 426,288 | |
| (1) | Includes income taxes relatedOn September 24, 2014, the Bank offered in the Colombian market its public offering of its Subordinated Notes in an aggregate amount of COP 750,000, with the possibility of allocating an additional amount of up to discontinued operations of Todo 1, Asesuisa, and AFP Crecer, for the years 2012, 2011 and 2010. See Note 31 q) Discontinued Operations.COP 250,000. The total allocated amount was COP 988,252.The Subordinated Notes were allocated as follows: |
| Series | | | D10 | | | | D15 | | | | D20 | |
| Demanded Amount | | COP | 556,352 | | | COP | 371,500 | | | COP | 328,500 | |
| Allocated Amount | | COP | 373,752 | | | COP | 360,000 | | | COP | 254,500 | |
| Maturity. | | | 10 years | | | | 15 years | | | | 20 years | |
| Maximum rate under the offering notice | | | IPC + 4.60% E.A | | | | IPC + 4.90% E.A | | | | IPC + 5.10% E.A | |
| Cut-off rate | | | IPC + 4.29% E.A | | | | IPC + 4.65% E.A | | | | IPC + 4.79% E.A | |
| | | As of January 1, 2014 |
| Issuer | | Currency | | Face value | | | Balance
(in millions of
COP) | | | Rate Range |
| Bancolombia S.A. | | Local | | COP | | | 3,619,148 | | | | 2,251,917 | | | 4.32% - 14.18% |
| Bancolombia S.A. | | Foreign | | USD | | | 3,967,458 | | | | 7,296,615 | | | 4.25% - 6.99% |
| Leasing Bancolombia S.A. | | Local | | COP | | | 2,462,705 | | | | 2,302,564 | | | 4.49% - 10.90% |
| Banco Agrícola S.A. | | Foreign | | USD | | | 550,000 | | | | 393,146 | | | 4.25% - 5.40% |
| Renting Colombia S.A. | | Local | | COP | | | 360,000 | | | | 16,000 | | | IPC1 + 5.90% |
| Compañía de Financiamiento Tuya S.A. | | Local | | COP | | | 140,500 | | | | 141,605 | | | IPC + 2% |
| Bancolombia Panamá S.A. | | Foreign | | USD | | | 144,001 | | | | 271,894 | | | 0.1% - 2.5% |
| Total | | | | | | | | | | | 12,673,741 | | | |
Temporary differences between the amounts reported in the financial statements and the tax bases for assets and liabilities result in deferred taxes. Deferred tax assets and liabilities at December 31, 2012 and 2011 were as follows:
| | | 2012 | | | 2011 | | | Amounts previously
reported
2011 | |
| Deferred tax assets and liabilities – U.S. GAAP | | | | | | | | | | | | |
| | | | | | | | | | | | | |
| Deferred tax assets: | | | | | | | | | | | | |
| Accrual of employee benefits | | COP | 77,669 | | | COP | 48,183 | | | COP | 48,183 | |
| Allowance for loan losses | | | 151,721 | | | | 172,691 | | | | 172,691 | |
| Allowance for foreclosed assets | | | 166 | | | | 43 | | | | 43 | |
| Premises and equipment | | | 264,100 | | | | 228,632 | | | | 116,255 | |
| Loss carryforwards and excess of presumed income over ordinary income | | | 104,044 | | | | 72,012 | | | | 72,012 | |
| Unrealized loss on forwards, futures and swaps | | | 11,450 | | | | 18,686 | | | | 18,686 | |
| Accrued expenses | | | 18,009 | | | | 14,678 | | | | 14,678 | |
| Unrealized loss on investments in trading securities | | | 957 | | | | 3,412 | | | | 3,412 | |
| Unrealized loss on investments in available for sale securities | | | 18,044 | | | | 19,935 | | | | 19,935 | |
| Other | | | 27,845 | | | | 26,058 | | | | 26,058 | |
| Total gross deferred tax assets | | | 674,005 | | | | 604,330 | | | | 491,953 | |
| Less valuation allowance | | | (48,825 | ) | | | (19,584 | ) | | | (19,584 | ) |
| Net deferred tax asset | | COP | 625,180 | | | COP | 584,746 | | | COP | 472,369 | |
| Deferred tax liabilities: | | | | | | | | | | | | |
| Unrealized gain on investments in available for sale securities | | | 1,112 | | | | 872 | | | | 872 | |
| Premises and equipment | | | 34,161 | | | | 24,810 | | | | 252,973 | |
| Allowance for loan losses | | | 6,166 | | | | 17,916 | | | | 17,916 | |
| Allowance for foreclosed assets | | | 20,851 | | | | 20,385 | | | | 20,385 | |
| Loan origination fees and costs | | | 41,895 | | | | 31,584 | | | | 31,584 | |
| Unrealized gains on forwards, futures and swaps | | | 53,279 | | | | 74,112 | | | | 74,112 | |
| Intangible assets | | | 38,176 | | | | 59,196 | | | | 59,196 | |
| Inflation adjustments | | | 12,088 | | | | 11,732 | | | | 11,732 | |
| Deferred charges | | | 40,335 | | | | 31,895 | | | | 31,895 | |
| Business combination | | | 27,577 | | | | 27,248 | | | | 27,248 | |
| Unrealized gains on investments in trading securities | | | 60,460 | | | | 31,878 | | | | 31,878 | |
| Accrued expenses | | | - | | | | 10 | | | | 10 | |
| Securitization | | | 38,269 | | | | 38,991 | | | | 38,991 | |
| Other | | | 21,688 | | | | 22,465 | | | | 22,465 | |
| Total deferred tax liabilities | | COP | 396,057 | | | COP | 393,094 | | | COP | 621,257 | |
| | | | | | | | | | | | | |
| Net deferred tax assets (liability) - US GAAP | | COP | 229,123 | | | COP | 191,652 | | | COP | (148,888 | ) |
| Net deferred tax liability under Colombian banking GAAP | | | 140,357 | | | | 166,847 | | | | 166,847 | |
| Difference related to deferred income taxes | | | 369,480 | | | | 358,499 | | | | 17,959 | |
| Difference related to the application of ASC 740-10-25-51 to the cost basis of certain premises and equipment | | | (670,812 | ) | | | (489,578 | )(1) | | | | |
| Difference to be recognized under U.S. GAAP stockholders’ equity | | COP | (301,332 | ) | | COP | (131,079 | ) | | | | |
(1) This amount was previously reported in the Bank’s Annual Report on Form 20-F as of December 31, 2011, as part of deferred income taxes under U.S. GAAP. The presentation of the deferred taxes above has been changed to separately identify the impacts of ASC 740-10-25-51 in premises and equipment. There is no impact on stockholders’ equity as consequence of this change.
Under U.S. GAAP, the tax effect of asset purchases that are not business combinations in which the amount paid differs from the tax basis of the asset shall not result in immediate income statement recognition. The simultaneous equations method is used to record the assigned value of the asset and the related deferred tax asset. During the application of ASC 740-10-25-51 for the year ended December 31, 2012, that results in the recognition of a difference between U.S. GAAP and Colombian banking GAAP in the cost basis, accumulated depreciation, depreciation expense, and deferred tax asset for certain premises and equipment, management became aware that in the Bank’s Annual Reports on Form 20-F, as of and for the years ended December 31, 2011 and December 31, 2010, for the purpose of the U.S. GAAP reconciliation adjustment the differences derived from the cost basis, accumulated depreciation and depreciation expense were incorrectly disclosed as being only a part of the deferred tax assets and related taxes in the income statement.
Application of ASC 740-10-25 on asset purchases during 2012 and 2011 resulted in a decrease of premises and equipment by COP 206,076 in 2012 and COP 161,220 in 2011.
On December 26, 2012, pursuant to law 1607 of 2012, Congress established and defined new criteria applicable to income tax and value added tax, among others. Under the new tax regime, Colombian companies and individuals are required to calculate annually theImpuesto sobre la Renta para la Equidad (“CREE”).
The applicable statutory tax rate for CREE is 9% from 2013 to 2015 and 8% in subsequent years. The CREE does not allow the discounting of carry forward losses neither the excess of presumptive income to establish the related taxable income. Therefore, deferred income tax expense (benefit) at December 31, 2012 was determined using a rate of 25% for carry forward losses and excess of presumpive income, a rate of 34% for other temporary differences which will be reversed up to year 2015 and a rate of 33% for other temporary differences that will be reversed from year 2016. The deferred income tax at December 31 2011 and 2010 was determined using a rate of 33%.
The valuation allowance for deferred tax assets as of December 31, 2012 and 2011 was COP 48,825 and COP 19,584, respectively. The net change in the total valuation allowance for the year ended December 31, 2012 was an increase of COP 29,242, and for the year ended December 31, 2011 was a increase of COP 871. The valuation allowance relates to the following: Loss carryforwards, Excess of presumed income over ordinary income, and higher fiscal costs of certain premises and equipment.
In assessing the realizability of deferred tax assets, management considers whether it is more likely than not that some portion or all of the deferred tax assets will not be realized. The ultimate realization of deferred tax assets is dependent upon the generation of future taxable income during the periods in which those temporary differences become deductible. Management considers the scheduled reversal over an entity level basis of deferred tax liabilities, projected future taxable income and tax planning strategies in making this assessment. Based upon the level of historical taxable income and projections for future taxable income over the periods for which the deferred tax assets are deductible, management believes it is more likely than not the Bank will realize the benefits of these deductible differences, net of the existing valuation allowances at December 31, 2012. The amount of the deferred tax asset considered realizable, however, could be reduced in the near term if estimates of future taxable income during the carry forward period are reduced.
Due to the expiration on December 31, 2010 of the tax stability regime entered into with the Government of Colombia, Bancolombia was taxed at a total income tax rate of 33% for the fiscal years 2012 and 2011. The nominal income tax rate was 35% for year 2010. This tax rate differs from the 28.29%, 34.95% and 22.87% effective tax rates for years 2012, 2011 and 2010, respectively, due to the following:
| | | 2012 | | | 2011 | | | Amounts previously
reported
2011 | | | 2010 | | | Amounts previously
reported
2010 | |
| | | | | | | | | | | | | | | | |
| Income before tax U.S. GAAP(1) | | COP | 2,319,502 | | | COP | 1,641,582 | | | COP | 1,598,580 | | | COP | 1,998,583 | | | COP | 1,961,767 | |
| Non-controlling interest | | | (40,008 | ) | | | (53,253 | ) | | | (53,253 | ) | | | 26,041 | | | | 26,041 | |
| Income before tax U.S. GAAP attributable to the controlling interest | | | 2,279,494 | | | | 1,588,329 | | | | 1,545,327 | | | | 2,024,624 | | | | 1,987,808 | |
| Income tax as per statutory rate | | | 753,334 | | | | 524,149 | | | | 509,958 | | | | 708,618 | | | | 695,733 | |
| Foreign profits taxed at other rates | | | 3,121 | | | | (29,654 | ) | | | (29,654 | ) | | | (31,864 | ) | | | (31,864 | ) |
| Foreign profits exempt from tax | | | (63,119 | ) | | | (26,146 | ) | | | (26,146 | ) | | | (32,203 | ) | | | (32,203 | ) |
| Non-deductible items | | | 101,941 | | | | 118,864 | | | | 118,864 | | | | 76,598 | | | | 76,598 | |
| Equity tax adjustment under U.S. GAAP | | | (3,001 | ) | | | 143,443 | | | | 143,443 | | | | 698 | | | | 698 | |
| Non-taxable income | | | (153,879 | ) | | | (181,534 | ) | | | (181,534 | ) | | | (183,694 | ) | | | (183,694 | ) |
| Others | | | (22,815 | ) | | | 5,160 | | | | (23,650 | ) | | | (18,120 | ) | | | (42,050 | ) |
| Increase (decrease) valuation allowance | | | 29,242 | | | | 871 | | | | 871 | | | | (56,930 | ) | | | (56,930 | ) |
| Income tax | | COP | 644,824 | | | COP | 555,153 | | | COP | 512,152 | | | COP | 463,103 | | | COP | 426,288 | |
(1) For continuingConsumer price index
The breakdown of the Bank securities in issue by maturity is as follows:
| | | As of December 31, 2015 | |
| Issuer | | Less than
a year | | | 1 to 3 years | | | 3 to 5 years | | | more than 5 years | | | Total amortized
cost | |
| | | In millions of COP | |
| Local currency | | | | | | | | | | | | | | | | | | | | |
| Subordinated bonds(1) | | | - | | | | - | | | | - | | | | 1,489,189 | | | | 1,489,189 | |
| Ordinary bonds | | | - | | | | 313 | | | | 938,808 | | | | 2,876,160 | | | | 3,815,281 | |
| Foreign currency | | | | | | | | | | | | | | | | | | | | |
| Subordinated bonds(1) | | | 1,172,037 | | | | 101,159 | | | | 957,602 | | | | 7,135,678 | | | | 9,366,476 | |
| Ordinary bonds | | | - | | | | 37,878 | | | | 1,002,490 | | | | 3,724,551 | | | | 4,764,919 | |
| Total | | | 1,172,037 | | | | 139,350 | | | | 2,898,900 | | | | 15,225,578 | | | | 19,435,865 | |
(1)The subordinated bonds, in the event of default of the Bank, will be subordinated to the claims of depositors and discontinued operations.all other creditors of the issuer, other than creditors whose claims rank equally with, or are junior to, the claims of the holders of the subordinated liabilities.
| | | As of December 31, 2014 | |
| Issuer | | Less than
a year | | | 1 to 3 years | | | 3 to 5 years | | | more than 5 years | | | Total amortized
cost | |
| | | In millions of COP | |
| Local currency | | | | | | | | | | | | | | | | | | | | |
| Subordinated bonds(1) | | | - | | | | - | | | | - | | | | 1,569,394 | | | | 1,569,394 | |
| Ordinary bonds | | | - | | | | 174,118 | | | | 901,524 | | | | 2,826,651 | | | | 3,902,293 | |
| Foreign currency | | | | | | | | | | | | | | | | | | | | |
| Subordinated bonds(1) | | | - | | | | - | | | | - | | | | 5,651,918 | | | | 5,651,918 | |
| Ordinary bonds | | | 664,902 | | | | 123,741 | | | | 47,217 | | | | 2,567,938 | | | | 3,403,798 | |
| Total | | | 664,902 | | | | 297,859 | | | | 948,741 | | | | 12,615,901 | | | | 14,527,403 | |
| (1) | The subordinated bonds, in the event of default of the Bank, will be subordinated to the claims of depositors and all other creditors of the issuer, other than creditors whose claims rank equally with, or are junior to, the claims of the holders of the subordinated liabilities. |
| | | As of January 1, 2014 | |
| Issuer | | Less than
a year | | | 1 to 3 years | | | 3 to 5 years | | | more than 5 years | | | Total amortized cost | |
| | | In millions of COP | |
| Local currency | | | | | | | | | | | | | | | | | | | | |
| Subordinated bonds(1) | | | - | | | | 1,896 | | | | 47,491 | | | | 503,589 | | | | 552,976 | |
| Ordinary bonds | | | - | | | | 251,967 | | | | 1,245,760 | | | | 2,661,383 | | | | 4,159,110 | |
| Foreign currency | | | | | | | | | | | | | | | | | | | | |
| Subordinated bonds(1) | | | - | | | | - | | | | - | | | | 4,561,749 | | | | 4,561,749 | |
| Ordinary bonds | | | 257,140 | | | | 17,091 | | | | 1,041,854 | | | | 2,083,821 | | | | 3,399,906 | |
| Total | | | 257,140 | | | | 270,954 | | | | 2,335,105 | | | | 9,810,542 | | | | 12,673,741 | |
| (1) | The subordinated bonds, in the event of default of the Bank, will be subordinated to the claims of depositors and all other creditors of the issuer, other than creditors whose claims rank equally with, or are junior to, the claims of the holders of the subordinated liabilities. |
The following is a schedule of the debt securities in issue by maturity:
| Debt Securities in Issue | | December 31, 2015 | | | December 31, 2014 | | | January 1, 2014 | |
| | | In millions of COP | |
| Amount expected to be settled: | | | | | | | | | | | | |
| No more than twelve months after the reporting period | | | - | | | | 1,176,920 | | | | 1,076,676 | |
| More than twelve months after the reporting period | | | 19,435,865 | | | | 13,350,483 | | | | 11,597,065 | |
| Total | | | 19,435,865 | | | | 14,527,403 | | | | 12,673,741 | |
As of December 31, 2015 and 2014, there were no covenants linked to the aforementioned securities in issue, nor were any of these instruments past due by the Bank in relation to its financial obligations.
For the years ended December 31, 2012, 2011 and 2010, non-taxable income mainly includes dividends received from affiliated companies, gains on sale of tax-exempt equity securities and tax-exempt interest income on mortgage securities and tax-exempt interest income on certain residential mortgage loans.
At December 31, 2012 and 2011, the Bank had undistributed earnings of foreign subsidiaries amounting to COP 846,587 and COP 848,496 respectively, on which deferred income taxes have not been provided because earnings are expected to be reinvested indefinitely outside of Colombia. Upon distribution of those earnings in the form of dividends or otherwise, the Bank would be subject to income tax.
Uncertainty in income taxes
Colombian banking GAAP does not specifically address accounting for tax uncertainties. Accordingly, the recognition and measurement provisions used are in accordanceinformation related with the policies describeddisclosures of fair value of the debt securities in w) Contingencies.issued, see Note 29.
Under U.S. GAAP, the guidance prescribes for the financial statement recognition and measurement of a tax position taken or expected to be taken in a tax return.NOTE 18. EMPLOYEES BENEFIT PLANS
The following table shows liabilities relating to post-employment benefit plans:
| | | December 31, 2015 | | | December 31, 2014 | |
| | | In millions of COP | |
| Defined benefit pension plan | | | 127,231 | | | | 131,469 | |
| Severance obligation | | | 52,209 | | | | 4,998 | |
| Retirement Pension Premium Plan | | | 95,331 | | | | 77,790 | |
| Other long term benefits | | | 271,651 | | | | 210,301 | |
| Post-employment and long-term benefit plans | | | 546,422 | | | | 424,558 | |
Other employment benefit plans consist of the following:
| | | December 31, 2015 | | | December 31, 2014 | |
| | | In millions of COP | |
| Current severance regimen | | | 69,689 | | | | 62,416 | |
| Other bonuses and short-term benefits | | | 209,866 | | | | 140,305 | |
| Other employment benefit plans | | | 279,555 | | | | 202,721 | |
These benefits include all types of payments that the Bank records interest and penalties relatedprovides to the unrecognized tax benefits (UTB) in other expenses in the Consolidated Statements of Operations. For the years ended December 31, 2012, 2011 and 2010, there was noits employees. The recognition of interestliabilities relating to post-employment and penalties.
The open tax years of the major companies of the Bancolombia Group are as follows:
Company | | Open tax year |
| | |
| | |
LOCAL SUBSIDIARIES | | |
Bancolombia S.A. | | 2010 – 2012 |
Leasing Bancolombia S.A. Compañía de Financiamiento | | 2010 – 2012 |
Factoring Bancolombia S.A. Compañía de Financiamiento | | 2007 and 2009 – 2012 |
Fiduciaria Bancolombia S.A. Sociedad Fiduciaria | | 2010 – 2012 |
Banca de Inversión Bancolombia S.A. Corporación Financiera | | 2011 – 2012 |
Valores Bancolombia S.A. Comisionista de Bolsa | | 2010 – 2012 |
Compañía de Financiamiento Tuya S.A. | | 2011 – 2012 |
Renting Colombia S.A. | | 2007 – 2012 |
| | |
FOREIGN SUBSIDIARIES | | |
Banco Agrícola S.A. | | 2009 – 2012 |
| b) | Employee benefit plans: |
Under both Colombian banking GAAP and U.S. GAAP the recognition of pension costslong-term employee benefit plans is based on actuarial computations; however,computations which involve judgments and assumptions made by the methodologies prescribed by each accounting framework present some differences, as indicated below:actuaries related to the future macroeconomic and employee demographic factors, among others, which will not necessarily coincide with the future outcome of such factors.
Post-employment benefits
Retirement plan contributions
Under Colombian regulation, pension obligations for employees have been managed as a contribution benefit since 1990; under this plan, employees of the Bank are automatically included upon formalizing the employment contract with the employer. A Pension PlanFund, independent of the Bank, administers the assets of this plan.
Defined benefit pension plan
Colombia
Under Colombian law, employee pension obligations are managed as a defined contribution plan since 1990. The Bank’s legal retirement benefit obligation as of December 31, 20122015 and 20112014 and January 1, 2014 relates to retired employees who rendered services to the Bank before the current regulations took effect. Under this unfunded plan, benefits are based on length of service and level of compensation. Actuarial gains or losses and prior serviceAs of December 2015, 731 participants were covered by this plan.
For purposes of the projected assessment of the pension plan, in absence of a deep market of high quality corporate debt, the sovereign bond curve of the Colombian Government is used, with maturation near the residual life of the obligation of the projected benefit. The net cost have been fully recognizedof pensions is accounted for in the Consolidated Statementstatement of Operations.income as “cost of salaries and employee benefits”, and includes the interest costs and cost of current service.
| | | 2015 | | | 2014 | |
| Unfunded defined benefit pension plan of the Parent Company | | In millions of COP | |
| Present value of the obligation as of January 1 | | | 126,379 | | | | 121,102 | |
| Interest cost | | | 5,886 | | | | 8,083 | |
| Benefits paid | | | (9,263 | ) | | | (11,007 | ) |
| Net actuarial (gain) / loss due to changes in demographic assumptions | | | (2,459 | ) | | | 7,652 | |
| Net actuarial (gain) / loss due to plan experience | | | - | | | | 549 | |
| Defined obligation, unfunded as of December 31 | | | 120,543 | | | | 126,379 | |
Panama
The pension plan for Banistmo and its subsidiaries provides defined benefits based on the average salary paid during the most recent 120 months before retirement and years of service of certain employees entitled to receive the benefits. The pension plan is applicable for any individual employed by Chase Manhattan Corporation, N.A. “Chase” (merged with HSBC Bank Panama in the year 2000) in Panama on July 31, 2000 who became an employee of Banistmo on August 1, 2000 after the acquisition. The pension benefit vests after 10 years of service (including service in Banistmo and those transferred from previous service with Chase). As of December 31, 2012,2015, there were 81067 participants (845 in 2011) covered by the Plan.Plan (3 active participants, 33 participants with deferred benefits and 31 participants receiving benefits):
| Unfunded defined benefit pension plan of Banistmo | | 2015 | | | 2014 | |
| | | In millions of COP | |
| Present value of the obligation as of January 1 | | | 5,090 | | | | 4,716 | |
| Current service cost | | | 1 | | | | 33 | |
| Interest cost | | | 213 | | | | 227 | |
| Actuarial (gain)/loss - experience | | | 121 | | | | (31 | ) |
| Actuarial (gain)/loss - financial assumptions | | | - | | | | 703 | |
| Benefits paid from plan assets | | | (346 | ) | | | (1,573 | ) |
| Foreign currency translation effect | | | 1,609 | | | | 1,015 | |
| Defined obligation, unfunded as of December 31 | | | 6,688 | | | | 5,090 | |
Colombian banking GAAP uses nominal average historical discount rates to calculate the projected benefit obligationand the liability is then amortized against expenses on a straight line basis over defined periods established by local rules. Since 2010, additional increases in the liability related to changes in mortality tables are amortized until the year 2029.Severance obligation
For U.S. GAAP purposes, actuarial valuations of pension plans are performed annually using discount rates based on a review of Colombian sovereign bond yields with maturities approximating the remaining life of the projected benefit obligation. Changes in the projected benefit obligation due to gains or losses for changes in actuarial assumptions and prior service costs are recorded against Accumulated Other Comprehensive Income, and amortized to expenses on a straight line basis over the future service periods of the employees or for inactive participants in the plan over their remaining life expectancy. Amortization of accumulated gains or losses only begins when they exceed 10% of the projected benefit obligations.Colombia
Net period pension costs recorded in the Consolidated Statement of Operations include the service cost attributed by the plans benefit formula, interest cost and amortization of prior service costs and actuarial gains or losses on the plan, as explained above.
Severance obligation
Under Colombian labor regulations, employees hired before 1990 are entitled to receive one month’s salary for each year of service. This benefit accumulates and is paid to the employees upon their termination or retirement from the Bank, calculated based on the employees’ last salary base; however, employees may request advances against this benefit at any time. In 1990, the Colombian government revised its labor regulations for new employees to permit companies, subject to the approval of the employees, to transfer this severance obligation annually to private pension funds. The Bank’s severance obligations relate to employees hired before 1990.
Under Colombian banking GAAP, the liability forAs of December 2015, 828 participants were covered by this unfunded employee benefit plan is recorded on an accrual basis. For U.S. GAAP purposes, the liability is calculated and recorded on an actuarial basis by pension plan.
AsThe balances recognized in the statement of financial position are listed below:
| Defined benefit plans |
| | | 2015 | | | 2014 | |
| | | In millions of COP | |
| Present value of the obligation as of January 1 | | | 4,998 | | | | 938 | |
| Current cost of service | | | 3,172 | | | | 3,112 | |
| Interest cost | | | 9,164 | | | | 6,883 | |
| Benefits paid | | | (10,512 | ) | | | (9,333 | ) |
| Net actuarial (gain) / loss due to assumption changes and plan experience(1) | | | 45,387 | | | | 3,398 | |
| Defined obligation, unfunded as of December 31 | | | 52,209 | | | | 4,998 | |
| Current severance regimen | | | 69,689 | | | | 62,416 | |
| Total | | | 121,898 | | | | 67,414 | |
(1)The increase in the net actuarial (gain) / loss due to assumption changes is related to the changes in the methodology applied to advances made by the Bank as of December 31, 2012, there were 1,166 participants (1,2772015, which has been considered by the management as a change in 2011) remaining in the severance plan.an accounting estimate.
Retirement Pension Premium Plan and Senior Management Pension Plan PremiumPremium.
Colombia.
Under Colombian labor regulations, employers and employees are entitled to negotiate compensation, other than the retirement benefit prescribed by law, by means of private agreements. The Bank’s employees participating in defined contribution plans are entitled to receive, on their retirement date, a one-time premium at the time based on the salary of the employee at their retirement date.
In 2011,On the other hand, the Bank officiallyhas established a retirement benefit plan for its senior management executives. Under this new plan, the executives are entitled to receive a one-off premium payment on their retirement date based on the number of years of service to the organization. The calculation
El Salvador
By means of senior managementDecree 592 of 2013, under Salvadorian labor regulations, employees are entitled to receive 15 days of salary for each year of service. This benefit is paid in case of termination due to retirement, resignation, unjustified dismissal, death and disability. As of December 31, 2015, there were 2,872 participants covered by the plan.
Employees of Banco Agrícola and its subsidiaries that were 50 years of age (45 for females) as of March 31, 2005 are entitled to receive one month of salary per year of service, net of the benefit established under Legislative Decree 592 in case of termination due to retirement. As of December 31, 2015, there were 46 participants covered by the plan.
Guatemala
Grupo Agromercantil Holding has established a retirement pension plan premium payment obligation was performed using actuarial valuations overfor its employees. Under this plan, the expectedemployees are entitled to receive 50% of the wage, if they are 70 years old and have 30 years of employment under both Colombian banking GAAPlabor seniority, or if they are 65 years old and U.S. GAAP.
Disclosurehave 40 years of labor seniority. On the other hand, the employees are entitled to receive 70% of the wage, if they are 70 years old and calculationhave worked 40 years of differences under U.S. GAAPlabor seniority, or they are 65 years old and have 45 years of labor seniority.
| | | 2012 | | | 2011 | | | 2010 | |
| | | | | | | | | | |
| Components of net periodic benefit cost | | | | | | | | | | | | |
| Service cost | | COP | 6,057 | | | COP | 6,062 | | | COP | 9,190 | |
| Interest cost | | | 19,042 | | | | 22,268 | | | | 23,234 | |
| Amortization of prior service cost | | | 1,217 | | | | 1,217 | | | | 1,217 | |
| Amortization of net transition obligation | | | 304 | | | | 304 | | | | 304 | |
| Amortization of net (gain) or loss | | | (906 | ) | | | (1,593 | ) | | | (477 | ) |
| Recognition of premium under pension plan for senior management | | | - | | | | 15,111 | | | | - | |
| Adjustment to be recognized | | | | | | | | | | | | |
| Net periodic pension cost under U.S. GAAP | | | 25,714 | | | | 43,369 | | | | 33,468 | |
| Net periodic pension cost under Colombian banking GAAP | | | 29,125 | | | | 46,697 | | | | 24,609 | |
| Difference to be recognized under U.S. GAAP (loss)/ gain | | COP | 3,411 | | | COP | 3,328 | | | COP | (8,859 | ) |
The combined costs forannual change of the above-mentionedpresent value of the obligations of defined benefit plans determined using U.S. GAAP, for the years ended December 31, 2012, 2011 and 2010, are summarized below:
| | | 2012 | | | 2011 | | | 2010 | |
| | | | | | | | | | |
| Change in projected benefit obligation | | | | | | | | | | | | |
| Unfunded benefit obligation at beginning of year | | COP | 191,079 | | | COP | 169,356 | | | COP | 169,391 | |
| Recognition of premium under pension plan for senior management | | | - | | | | 15,111 | | | | - | |
| Service cost | | | 6,057 | | | | 6,062 | | | | 9,190 | |
| Interest cost | | | 19,042 | | | | 22,268 | | | | 23,234 | |
| Actuarial (gain)/loss | | | 25,337 | | | | (1,003 | ) | | | (10,680 | ) |
| Benefits paid | | | (27,225 | ) | | | (20,715 | ) | | | (21,779 | ) |
| Unfunded benefit obligation at end of year | | COP | 214,290 | | | COP | 191,079 | | | COP | 169,356 | |
| | | | | | | | | | | | | |
| Accrued benefit cost under Colombian banking GAAP | | | (191,035 | ) | | | (189,135 | ) | | | (163,153 | ) |
| | | | | | | | | | | | | |
| Difference to be recognized under U.S. GAAP Stockholders’ equity | | COP | (23,255 | ) | | COP | (1,944 | ) | | COP | (6,203 | ) |
| | | 2012 | | | 2011 | |
| | | | | | | |
| Net Amount Recognized in the Consolidated Balance Sheet at December 31, Statement of Financial Position | | | | | | | | |
| Non-current Assets | | COP | - | | | COP | - | |
| Current Liabilities | | | 6,169 | | | | 18,719 | |
| Non-current Liabilities | | | 185,476 | | | | 155,343 | |
| Amount Recognized in Financial Position | | COP | 191,645 | | | COP | 174,062 | |
| | | | | | | | | |
| Accumulated Other Comprehensive Income | | | | | | | | |
| Net Actuarial Gain (Loss) | | COP | (31,069 | ) | | COP | (4,825 | ) |
| Net Prior Service (Cost)/Credit | | | (7,250 | ) | | | (8,467 | ) |
| Net Transition Obligation | | | (198 | ) | | | (502 | ) |
| Total at December 31 | | | (38,517 | ) | | | (13,794 | ) |
| Deferred income tax | | | 13,283 | | | | 4,877 | |
| Accumulated other comprehensive Income/(loss) | | COP | (25,234 | ) | | COP | (8,917 | ) |
The changes in Accumulated Other Comprehensive Income that took place during the years 2012 and 2011 are describedis as follows:
| | | 2012 | | | 2011 | |
| Increase (Decrease) in Accumulated Other Comprehensive Income | | | | | | | | |
| | | | | | | | | |
| Recognized during year - Transition Obligation/(asset) | | COP | 304 | | | COP | 304 | |
| Recognized during year - Prior Service Cost/(credit) | | | 1,217 | | | | 1,217 | |
| Recognized during year - Net Actuarial Losses/(gains) | | | (906 | ) | | | (1,593 | ) |
| Occurring during year - Net Actuarial (Losses)/gains | | | (25,337 | ) | | | 1,003 | |
| Accumulated other comprehensive Income/(loss) in current year | | COP | (24,722 | ) | | COP | 931 | |
The Bank expects the following amounts in accumulated other comprehensive income to be recognized as components of net periodic pension cost during 2013:
Net transition obligation/(asset) | | COP | 198 | |
Net prior service cost | | | 1,217 | |
Net loss/(gain) | | | 1,513 | |
Total | | COP | 2,928 | |
The economic assumptions used in determining the actuarial present value of the pension obligation and the projected pension obligations for the plan years, in nominal terms, were as follows:
| | | 2012 | | | 2011 | | | 2010 | |
| | | | | | | | | | |
| Discount rate | | | 6.20% | | | | 7.50% | | | | 7.90% | |
| Rate of compensation increases | | | 5.00% | | | | 5.50% | | | | 5.50% | |
| Rate of pension increases | | | 3.50% | | | | 4.00% | | | | 4.00% | |
Estimated Future Benefit Payments
The benefit payments, which reflect expected future service, as appropriate, are expected to be paid as follows:
| | | Pension Benefits | | | Other Benefits(1) | |
| | | | | | | |
| 2013 | | COP | 11,502 | | | COP | 27,439 | |
| 2014 | | | 11,677 | | | | 6,929 | |
| 2015 | | | 11,818 | | | | 6,156 | |
| 2016 | | | 11,910 | | | | 10,086 | |
| 2017 | | | 11,974 | | | | 26,374 | |
| Years 2018-2022 | | COP | 59,078 | | | COP | 117,844 | |
| | | 2015 | | | 2014 | |
| Retirement Pension Premium Plan | | In millions of COP | |
| Present value of the obligation as of January 1 | | | 77,790 | | | | 58,967 | |
| Current service cost | | | 11,763 | | | | 3,240 | |
| Interest cost | | | 4,854 | | | | 4,200 | |
| Benefits paid | | | (1,611 | ) | | | (3,217 | ) |
| Net actuarial (gain) / loss due to assumption changes and plan experience | | | 1,996 | | | | 14,349 | |
| Foreign currency translation effect | | | 539 | | | | 251 | |
| Defined obligation, unfunded as of December 31 | | | 95,331 | | | | 77,790 | |
| Other bonuses | | | 209,866 | | | | 140,305 | |
| Total | | | 305,197 | | | | 218,095 | |
| (1) | Includes expected future benefit payments for severance obligation and senior management retirement premium pension plan premium. |
Inflation adjustment
The consolidated financial statements under Colombian banking GAAP were adjusted for inflation based on the variation in the local consumer price index (IPC), from January 1, 1992 to December 31, 2000.
The U.S. GAAP adjustment represents the cumulative inflation adjustment on the Bank's non-monetary assets for inflation occurring prior to January 1, 2001, less depreciation expense.
For the years ended December 31, 2012 and 2011, the Bank has not recognized any reconciliation adjustment in results under U.S. GAAP, due to the fact that there was no sale of non-monetary assets adjusted for inflation acquired before January 1, 1992.
Capitalization of interest cost
Under Colombian banking GAAP, the interest costs incurred during the construction of premises and equipment are recorded as expenses in the Bank’s Consolidated Statement of Operations. Under U.S. GAAP, the Bank has capitalized interest costs incurred during the construction of qualifying premises and equipment. The capitalized interest is amortized over the estimated useful life of the asset.
Impairment of long-lived assets
Under Colombian banking GAAP, an impairment loss of long-lived assets is recorded in the Consolidated Statement of Operations against an allowance in the Balance Sheet when the fair value of the assets is lower than their carrying amounts.
Under U.S. GAAP, an impairment loss is recognized if the carrying amounts of those assets are not recoverable and exceed their fair value. The carrying amount is not recoverable if it exceeds the sum of the undiscounted cash flows expected to result from the use and eventual disposition of the asset. In such cases, an impairment loss is recorded for the difference between the carrying amount and the fair value of the assets and the new adjusted carrying amount becomes the new cost basis.
Real estate held for sale
According to Colombian banking GAAP, real estate held for sale is recorded similar to real estate in use.
Under U.S. GAAP, long lived assets classified as held for sale are recorded at the lower of the carrying amount and fair value less estimated costs to sell, and are not subject to depreciation.
Depreciation adjustment on premises and equipment purchased with income tax benefits
Under Colombian tax law, some specific purchases of premises and equipment have an additional deduction over the total depreciation of such assets, recognized in the income tax return on the period when the assets are acquired.
Under U.S. GAAP, the tax effect of asset purchases that are not business combinations in which the amount paid differs from the tax basis of the asset shall not result in immediate income statement recognition. The simultaneous equations method is used to record the assigned value of the asset and the related deferred tax asset.
During the application of ASC 740-10-25-51 for the year ended December 31, 2012, that results in the recognition of a difference between U.S. GAAP and Colombian banking GAAP in the cost basis, accumulated depreciation, depreciation expense, and deferred tax asset for certain premises and equipment, management became aware that in the Bank’s Annual Reports on Form 20-F, as of and for the years ended December 31, 2011 and December 31, 2010, for the purpose of the U.S. GAAP reconciliation adjustment the differences derived from the cost basis, accumulated depreciation and depreciation expense were incorrectly disclosed as being only a part of the deferred tax assets and related taxes in the income statement.
The following table shows the adjustments for each item:
| | | Net Income | |
| | | December 31, 2012 | | | December 31, 2011 | | | Amounts previously
reported
2011 | | | December 31,2010 | | | Amounts previously
reported
2010 | |
| Items | | | | | | | | | | | | | | | | | | | | |
| Inflation adjustment | | COP | - | | | COP | - | | | COP | - | | | COP | (45 | ) | | COP | (45 | ) |
| Capitalization of interest cost | | | (1,085 | ) | | | 1,017 | | | | 1,017 | | | | 5 | | | | 5 | |
| Depreciation expense of premises and equipment held by the Fund “See note 31 (i)”(1) | | | (21,402 | ) | | | (17,295 | ) | | | (17,295 | ) | | | (13,868 | ) | | | (13,868 | ) |
| Deferred income of the fund “See note 31 (i)” | | | - | | | | - | | | | - | | | | (26,255 | ) | | | (26,255 | ) |
| Assets held for sale | | | (38 | ) | | | 433 | | | | 433 | | | | (879 | ) | | | (879 | ) |
| Recovery (impairment) of long- lived assets | | | 4,483 | | | | 998 | | | | 998 | | | | (7,424 | ) | | | (7,424 | ) |
| Reversal of depreciation of premises and equipment acquired with income tax benefits | | | 47,497 | | | | 43,002 | | | | - | | | | 36,816 | | | | - | |
| Total | | COP | 29,455 | | | COP | 28,155 | | | COP | (14,847 | ) | | COP | (11,650 | ) | | COP | (48,466 | ) |
___________________
| (1) | Refers to the Fondo Capital Privado Colombia Inmobiliaria. See note 31(i) |
| | | Stockholders’ equity | |
| | | December 31, 2012 | | | December 31, 2011 | | | Amounts previously
reported
2011 | |
| Items | | | | | | | | | | | | |
| Inflation adjustment | | COP | 35,553 | | | COP | 35,553 | | | COP | 35,553 | |
| Capitalization of Interest Cost | | | 19,160 | | | | 19,160 | | | | 19,160 | |
| Premises and equipment of the Fund "See note 31 (i)" | | | 462,052 | | | | 405,177 | | | | 405,177 | |
| Assets held for sale | | | (8 | ) | | | 30 | | | | 30 | |
| Impairment of long-lived assets | | | (1,943 | ) | | | (6,426 | ) | | | (6,426 | ) |
| Total adjustment premises and equipment (gross) | | | 514,814 | | | | 453,494 | | | | 453,494 | |
| Accumulated depreciation interest cost | | | (4,002 | ) | | | (2,917 | ) | | | (2,917 | ) |
| Accumulated depreciation of the Fund “See note 31 (i)” | | | (124,032 | ) | | | (103,237 | ) | | | (103,237 | ) |
| Accumulated depreciation assets held for sale | | | - | | | | - | | | | - | |
| Reversal of accumulated depreciation of premises and equipment acquired with income tax benefits | | | 196,534 | | | | 149,036 | | | | - | |
| Total accumulated depreciation | | | 68,500 | | | | 42,882 | | | | (106,154 | ) |
| Total | | COP | 583,314 | | | COP | 496,376 | | | COP | 347,340 | |
Differences related to the application of ASC 740-10-25-51 to the cost basis of certain premises and equipment amounted to COP (670,812) in 2012 and COP (489,578) in 2011 have been included in item a) Deferred income taxes.
According to Colombian banking GAAP, reappraisals of a portion of the Bank’s premises and equipment, equity investments and other non-monetary assets are made periodically and the effects of the increase or decrease are recognized in the Balance Sheet under the assets caption “Reappraisal of assets” and in the stockholders’ equity caption “Surplus from reappraisals of assets”. The latest reappraisals were made during the years 2012 and 2011. Under U.S. GAAP, reappraisals of assets are not permitted and thus these amounts are reversed.
| e) | Allowance for loan losses, financial leases, foreclosed assets and other receivables |
As established by the SFC, the methodology for evaluating loans and financial leases under Colombian banking GAAP, as discussed in Note 2 (i), is based on their inherent risk characteristics and serves as a basis for recording loss allowances based on loss percentages estimated or established by the SFC. Under Colombian banking GAAP, the loan loss allowance is determined and monitored on an ongoing basis, and is established through periodic provisions charged to the statements of operations.
Under U.S. GAAP the Bank considers in determining that the loan is impaired, among other factors, the economic performance and trends in the client’s industry, the monthly analysis that considers the likelihood of receiving all principal and interest according to the contractual terms of the loan agreement and specific events that could affect in a negative way the client’s real capacity to pay.
All impaired loans that exceed a specific threshold COP 2,000 or that are Troubled Debt Restructurings (TDRs) are individually assessed for impairment. All other loans are assesed on a collective basis.
The allowance for significant impaired individually assessed loans and all TDRs is measured based on the present value of estimated future cash flows discounted at the original effective loan rate or the fair value of the collateral net of estimated costs to sell in the case where the loan is considered collateral-dependent. An allowance for impaired loans is provided when the estimated future cash flows discounted at their original effective rate or collateral fair value is lower than book value.
To calculate the allowance required for all other loans that are collectively evaluated for impairment, loss ratios are determined by analyzing historical losses. Loss estimates are analyzed by loan type and for homogeneous groups of clients established according to the underlying risk or other characteristics of each group. Such historical ratios are updated to incorporate the most recent data reflecting current economic conditions, industry performance trends and any other pertinent information that may affect the estimation of the allowance for loan losses.
Under Colombian banking GAAP allowances on homogeneous loan portfolios are established based on probability of default, which is defined as the probability of the debtor within a specific loan portfolio or segment and rating, defaulting on its obligations within the next twelve (12) months. Under U.S. GAAP, this probability of default is determined by analyzing estimated defaults or foreclosures based on portfolio trends, historical losses, client’s payment behavior regard to with past-due loans greater than 90 days, delinquencies, bankruptcies, economic conditions and credit scores.
Many factors can affect the Bank’s estimates of the allowance for loan losses, including volatility of default probability, migrations and estimated loss severity.
Credit losses relating to loans, which may be for all or part of a particular loan, are deducted from the allowance. The related loan balance is charged off in the year in which the loans are deemed uncollectible. Recoveries of loans and trade receivables previously charged off are credited to the allowance when received. The allowance is increased by provisions and recoveries of loans and leases previously charged off, and are reduced by charged-off loans and leases deemed uncollectible.
In addition, for U.S. GAAP purposes, the Bank maintains a provision for credit losses on off-balance sheet credit instruments, including commitments to extend credit, guarantees granted, standby letters of credit and other financial instruments. This provision is recorded as a liability. The Bank uses the same methodology as described for the allowance for loans losses, but including an estimated probability of drawdown by the borrower.
The loan portfolio under U.S. GAAP amounting to COP 75,999,091 differs from the loan portfolio under Colombian banking GAAP amounting to COP 70,528,733, which includes principal amounting to COP 69,988,679 and receivables amounting to COP 540,054, due to the consolidation of the loan portfolio of SPEs, and the reclassification of prepayments to suppliers(1) as receivables and the operating leases classified as finance leases under U.S. GAAP.
The Bank grants loans to customers in the following segments: residential mortgage, commercial, consumer, small business loans and through financial leases. A substantial portion of the Bank loan portfolio is represented by commercial loans throughout Colombia.
Loans are recorded at their principal outstanding balance less allowance for impairment and include loan origination fees and costs, and accrued interest receivables. Accrued interest unearned income is recorded as a liability.
Foreclosed assets
Under Colombian banking GAAP the SFC requires the Bank to record a provision equal to 60% for foreclosed real estate and a provision equal to 70% for other foreclosed assets of, the carrying value of the asset at the time of receipt, which must be recorded in proportional monthly installments within a two year period following foreclosure. Once the two year period has expired, the provision must be increased to 80% and 100%, respectively.
Also, it is the Bank’s policy, to increase the provision to 100% of its book value if a foreclosed asset is not sold within 5 years in the Bank’s possession.
Under U.S. GAAP, foreclosed assets are recorded as assets held for sale at the lower of the net carrying amount of the loan or fair value of the assets less its cost to sell.
(1)Corresponds to expenditures incurred by the Bank before signing off the leasing contract. Under COLGAAP, they are not consider as loans, but under US GAAP they are considered as receivables
The following summarizes the allowance for loan and financial lease losses and foreclosed assets under Colombian banking GAAP and U.S. GAAP:
| | | 2012 | | | 2011(1) | |
| | | | | | | |
| Allowance for loans losses , financial lease, and other receivables under Colombian banking GAAP | | COP | (3,383,306 | ) | | COP | (2,904,462 | ) |
| Difference in the allowance recognized in item e.i) Allowance for loan losses, financial leases loses and other receivables | | | (270,201 | ) | | | (323,250 | ) |
| (+) Increases in the allowance included within the following GAAP differences in the reconciliation: | | | | | | | | |
| Allowance on interests on the difference related to non-accrual loans presented in item(g) – interest recognition on non-accrual loans | | | (14,558 | ) | | | (7,577 | ) |
| Allowance on finance leases accounted for as operating leases under Colombian banking GAAP presented in item(l) lessor accounting | | | (60,340 | ) | | | (24,809 | ) |
| Allowance on loans acquired in Banagricola’s business acquisition presented in item(m) – business combinations | | | (36,220 | ) | | | (46,792 | ) |
| Allowance on other receivables for securitized non-performing loans presented in item(n) securitization | | | (1,069 | ) | | | (1,136 | ) |
| (+) GAAP difference related to the provision for credit losses on commitments to extend credit recognized in item (e) Allowance for loans losses , financial lease, and other receivables | | | 138,326 | | | | 32,827 | |
| | | | | | | | | |
| Allowance for loans losses , financial lease, and other receivables under US GAAP | | COP | (3,627,368 | ) | | COP | (3,275,199 | ) |
| | | | | | | | | |
| Allowance for foreclosed assets under Colombian banking GAAP | | COP | (190,537 | ) | | COP | (182,728 | ) |
| Difference in the allowance recognized in item eii) Allowance for foreclosed assets | | | 64,577 | | | | 69,369 | |
| Allowance for foreclosed assets under US GAAP | | COP | (125,960 | ) | | COP | (113,359 | ) |
(1)The 2011 balance of allowance for loans losses, financial lease and other receivables under US GAAP has been changed to include the allowance related to (a) interests on non-accrual loans; (b) finance leases accounted for operating leases under Colombian banking GAAP; (c) securitized loans acquired in Banagricola’s business acquisition and (d) other receivables for securitized non-performing loans.
| | | 2012 | | | 2011 | | | 2010 | |
| Difference recognized in net income under U.S. GAAP | | | | | | | | | | | | |
| Allowance for loans, financial lease losses and other receivables | | COP | 53,049 | | | COP | (97,247 | ) | | COP | (35,725 | ) |
| Allowance for foreclosed assets | | | (1,791 | )(1) | | | 2,014 | (2) | | | 18,374 | |
| | | COP | 51,258 | | | COP | (95,233 | ) | | COP | (17,351 | ) |
| Other long term benefits | | 2015 | | | 2014 | |
| | | In millions of COP | |
| Present value of the obligation as of January 1 | | | 210,301 | | | | 137,371 | |
| Current service cost | | | 30,826 | | | | 19,883 | |
| Interest cost | | | 11,970 | | | | 9,693 | |
| Past service cost | | | - | | | | 9,849 | |
| Benefits paid | | | (23,732 | ) | | | (21,916 | ) |
| Unfunded benefit obligation assumed for Grupo Agromercantil at December 30, 2015(1) | | | 9,250 | | | | - | |
| Net actuarial (gain) / loss due to assumption changes and plan experience | | | 36,959 | | | | 53,492 | |
| Liabilities relating to assets held for sale(2) | | | (8,312 | ) | | | - | |
| Foreign currency translation effect | | | 4,389 | | | | 1,929 | |
| Defined obligation, unfunded as of December 31 | | | 271,651 | | | | 210,301 | |
| (1) | For 2012,As a result of the differenceacquisition of COP (4,792) betweencontrol of Grupo Agromercantil Holding in 2015, the reconciliations forBank assumed the years 2012 COP 64,577 and 2011 COP 69,369 that are recognized as adjustments to Colombian banking GAAP stockholders’ equity is different from the difference recognized in net income under U.S.GAAP COP (1,791) in the amount of COP (3,001) dueobligations related to the cumulative translation adjustment related to foreign operations recorded in other comprehensive income.termination indemnity plan of Banco Agromercantil de Guatemala, Consejería, Mantenimiento y Mensajería, Seguros Agromercantil (subsidiaries of Grupo Agromercantil Holding). See Note 8. |
| (2) | For 2011, the difference of COP 2,475 between the reconciliations for the years 2011 COP 69,369 and 2010 COP 66,894 that are recognized as adjustments to Colombian banking GAAP stockholders’ equity is different from the difference recognized in net income under U.S.GAAP COP 2,014 in the amount of COP 461 due to the cumulative translation adjustment related to foreign operations recorded in other comprehensive income.See Note 31 'Discontinued operations' |
Plan Assets
AnThe Bank, through its subsidiary Banistmo, has established a plan with assets to secure benefits promised by Banistmo to the employees entitled to receive the Pension Plan under the terms described above and to comply with the Panamanian labor code, which specifies the terms for securing the payments to be made in the event of an employee’s termination (voluntary or involuntary) or upon retirement (termination indemnity plan).
Banistmo’s pension and post-retirement plan assets consider investments in fixed-term deposits and cash and due from banks, in order to reduce the investment risk. The plan assets are managed by a trustee (third party), and for the Pension Plan, the assets allocation is periodically reviewed by Banistmo and, when necessary, adjusted according to the investment strategy. The plan's investment assets are measured at fair value using significant, unobservable market data and, therefore, are classified as Level 3.
The expected return on assets assumption represents the long term rate of return based on analysis of historical returns, historical asset class volatilities and the activityfund’s past experience.
The components of the periodic net cost of the plans previously mentioned and the total of charges (credits) recognized in the allowance for loans and financial lease losses under U.S. GAAP during the years ended December 31, 2012, 2011 and 2010 isstatement of income are as follows:
| | | 2012 | | | 2011(1) | | | 2010(1) | |
| | | | | | | | | | |
| Allowance at the beginning of the year | | COP | (3,275,199 | ) | | COP | (2,908,013 | ) | | COP | (2,819,828 | ) |
| Sale of subsidiaries | | | 1,303 | | | | 150 | | | | - | |
| Provision for credit losses | | | (951,222 | ) | | | (670,324 | ) | | | (536,688 | ) |
| Effect of changes in foreign exchange rates | | | 36,963 | | | | (10,545 | ) | | | 23,584 | |
| Charge-offs | | | 728,606 | | | | 557,674 | | | | 701,128 | |
| Recoveries of charged-off loans | | | (167,819 | ) | | | (244,141 | ) | | | (276,209 | ) |
| Allowance at the end of the year | | COP | (3,627,368 | ) | | COP | (3,275,199 | ) | | COP | (2,908,013 | ) |
| | | | | | | | | | | | | |
| Allowance for credit losses on commitments to extend credit at beginning of the year | | COP | (32,827 | ) | | COP | (11,211 | ) | | COP | - | |
| Provision on off-balance sheet credit instruments | | | (105,499 | ) | | | (21,616 | ) | | | (11,211 | ) |
| Allowance for credit losses on commitments to extend creditat end of the year | | COP | (138,326 | ) | | COP | (32,827 | ) | | COP | (11,211 | ) |
| | | | | | | | | | | | | |
| Gross Loans and financial leases | | | 75,999,091 | | | | 67,151,490 | | | | 53,459,826 | |
| | | | | | | | | | | | | |
| Allowance at the end of the period as a percentage of gross loans | | | 4.77 | % | | | 4.81 | % | | | 5.31 | % |
| | | | | | | | | | | | | |
| Provision for credit losses as a percentage of gross loans | | | 1.25 | % | | | 1.03 | % | | | 1.02 | % |
| | | December 31, 2015 | | | December 31, 2014 | | | January 1, 2014 | |
| | | In millions of COP | |
| Employee pension plan | | | 6,087 | | | | 4,030 | | | | 4,705 | |
| Total | | | 6,087 | | | | 4,030 | | | | 4,705 | |
The following table details the change in plan assets:
| | | 2015 | | | 2014 | |
| | | In millions of COP | |
| Fair value of assets as of January 1 | | | 4,030 | | | | 4,705 | |
| Interest income on plan assets | | | 224 | | | | 226 | |
| Return on plan assets greater/(less) than discount rate | | | (133 | ) | | | (168 | ) |
| Plan participants’ contributions | | | 999 | | | | - | |
| Benefits paid | | | (346 | ) | | | (1,573 | ) |
| Foreign currency translation effect | | | 1,313 | | | | 840 | |
| Fair value assets as of December 31 | | | 6,087 | | | | 4,030 | |
The economic assumptions used in the determination of the present value of the pension obligations, in nominal terms, are as follows:
Colombia
| Main projected assumptions | | 2015 | | | 2014 | | | January 1, 2014 | |
| Discount rate | | | 7.90 | % | | | 6.20 | % | | | 7.00 | % |
| Rate of wage increase | | | 6.30 | % | | | 4.50 | % | | | 5.00 | % |
| Projected inflation | | | 4.30 | % | | | 3.00 | % | | | 3.00 | % |
Bancolombia Panama
| Main projected assumptions | | 2015 | | | 2014 | | | January 1, 2014 | |
| Discount rate | | | 3.65 | % | | | 3.75 | % | | | 5.50 | % |
| Rate of wage increase | | | 3.00 | % | | | 5.00 | % | | | 3.50 | % |
| Projected inflation | | | 2.00 | % | | | 3.50 | % | | | Not available | |
Banistmo
| Main projected assumptions | | 2015 | | | 2014 | | | January 1, 2014 | |
| Discount rate | | | 3.65 | % | | | 3.75 | % | | | - | |
| Expected long-term rate of return on plan assets | | | 0.70 | % | | | 2.50 | % | | | 2.65 | % |
| Rate of wage increase | | | 4.50 | % | | | 5.00 | % | | | - | |
| Projected inflation | | | 2.00 | % | | | 3.50 | % | | | - | |
El Salvador
| Main projected assumptions | | 2015 | | | 2014 | | | January 1, 2014 | |
| Discount rate | | | 5.60 | % | | | 5.60 | % | | | - | |
| Rate of wage increase | | | 3.50 | % | | | 3.50 | % | | | - | |
| Projected inflation | | | 2.50 | % | | | 2.50 | % | | | - | |
Guatemala
| Main projected assumptions | | 2015 | | | 2014 | | | January 1, 2014 | |
| Discount rate | | | 8.47 | % | | | - | | | | - | |
| Rate of wage increase | | | 5.03 | % | | | - | | | | - | |
In 2015, the assumption of mortality used in the preparation of the assessment of the estimated liabilities is based on tables RP-2000, CSO-80 and RV-08, which reflect average ages of mortality from 32-75 years.
The rate used to discount the obligation of the defined benefit to reflect the duration of the labor liabilities as of December 2015 corresponds to the yield of sovereign bonds of Colombia, Panama and El Salvador, as applicable, since the market transactions of these countries involving corporate bonds of high quality have no high levels of activity. The assumption of the rate of inflation is based on the long term projection of the Central Bank of Colombia, Panama and El Salvador.
The nature of the risks related to the obligations aforementioned are summarized below:
| Investment risk | | The present value of the obligation for the defined benefits plan is calculated using a discount rate determined with reference to high quality corporate bond yields. Currently, the plan includes investment in financial instruments that are not vulnerable to market risks. |
| | |
| Interest rate risks | | A reduction of the bond interest rates will increase the obligation of the plan. |
| | |
| Longevity risk | | The present value of the obligation of the defined benefit plan is calculated with reference to the highest estimate of the mortality of participants during their time of employment. An increase in the life expectancy of the participants will increase the plan obligation. |
| | |
| Salary risk | | The present value of the obligation of the benefit plan is calculated with reference to the future salaries of the participants. As such, an increase in the participants' wages will increase the obligation of the plan. |
Estimated payment of future benefits
The payments of benefits, which reflect future service rendered, are considered to be paid as follows:
| Years | | Pension Benefits | | | Other benefits | |
| | | In millions of COP | |
| 2016 | | | 11,894 | | | | 43,459 | |
| 2017 | | | 12,120 | | | | 36,037 | |
| 2018 | | | 12,305 | | | | 43,400 | |
| 2019 | | | 12,415 | | | | 51,078 | |
| 2020 | | | 12,498 | | | | 49,269 | |
| 2021 a 2024 | | | 61,125 | | | | 330,991 | |
Sensitivity analysis
Defined Benefit Obligations (DBO) were calculated using the Projected Unit Credit method. Obligations and expenses will change in the future as a result of future changes in the methods of projection and assumption, participant information, plan provisions and regulations, or as resulting from future gains and losses.
Pension plan Bancolombia
| Assumption | | Value | | | (Increase/Reduction) | | Effect in DBO | |
| Discount rate | | | 8.40% | | | 0.50% increase | | COP | (4,390 | ) |
| Discount rate | | | 7.40% | | | 0.50% decrease | | | 4,701 | |
| Salary increases | | | 4.80% | | | 0.50% increase | | | 5,121 | |
| Salary increases | | | 3.80% | | | 0.50% decrease | | | (4,814 | ) |
| Mortality | | | RV-08 | | | One year increase in life expectancy | | COP | 4,561 | |
Retirement Pension Premium Plan
| Assumption | | Value | | | (Increase/Reduction) | | Effect in DBO | |
| Discount rate | | | 8.40% | | | 0.50% increase | | COP | (3,371 | ) |
| Discount rate | | | 7.40% | | | 0.50% decrease | | | 3,682 | |
| Salary increase | | | 6.80% | | | 0.50% increase | | | 2,825 | |
| Salary increase | | | 5.80% | | | 0.50% decrease | | COP | (2,605 | ) |
Severance obligation
| Assumption | | Value | | | (Increase/Reduction) | | Effect in DBO | |
| Discount rate | | | 8.40% | | | 0.50% increase | | COP | (1,503 | ) |
| Discount rate | | | 7.40% | | | 0.50% decrease | | | 1,572 | |
| Salary increase | | | 6.80% | | | 0.50% increase | | | 3,263 | |
| Salary increase | | | 5.80% | | | 0.50% decrease | | COP | (3,151 | ) |
Senior Management Pension Plan Premium
| Assumption | | Value | | | (Increase/Reduction) | | Effect in DBO | |
| Discount rate | | | 8.40% | | | 0.50% increase | | COP | (994 | ) |
| Discount rate | | | 7.40% | | | 0.50% decrease | | | 1,047 | |
| Salary increase | | | 6.80% | | | 0.50% increase | | | 1,526 | |
| Salary increase | | | 5.80% | | | 0.50% decrease | | COP | (1,452 | ) |
Pension Plan Banistmo
| Assumption | | Value | | | (Increase/Reduction) | | Effect in DBO | |
| Discount rate | | | 4.15% | | | 0.50% increase | | COP | (329 | ) |
| Discount rate | | | 3.15% | | | 0.50% decrease | | | 358 | |
| Salary increases | | | 5.00% | | | 0.50% increase | | | 10 | |
| Salary increases | | | 4.00% | | | 0.50% decrease | | | (10 | ) |
| Mortality | | | RP-2000 | | | One year increase in life expectancy | | COP | 197 | |
Termination Indemnity
| Assumption | | Value | | | (Increase/Reduction) | | Effect in DBO | |
| Discount rate | | | 6.10% | | | 0.50% increase | | COP | (494 | ) |
| Discount rate | | | 5.10% | | | 0.50% decrease | | | 535 | |
| Salary increases | | | 4.00% | | | 0.50% increase | | | 54 | |
| Salary increases | | | 3.00% | | | 0.50% decrease | | | (80 | ) |
| Mortality | | | RP-2000 | | | One year increase in life expectancy | | COP | 3 | |
NOTE 19. OTHER LIABILITIES
Other liabilities consist of the following:
| Other liabilities | | December 31, 2015 | | | December 31, 2014 | | | January 1, 2014 | |
| | | In millions of COP | |
| Payables(1) | | | 1,160,760 | | | | 1,037,499 | | | | 1,246,747 | |
| Suppliers | | | 891,000 | | | | 1,103,802 | | | | 1,084,891 | |
| Unearned income(2) | | | 617,989 | | | | 360,776 | | | | 300,105 | |
| Salaries and other labor obligations | | | 357,023 | | | | 222,735 | | | | 194,938 | |
| Security contributions | | | 324,869 | | | | 282,856 | | | | 307,979 | |
| Dividends | | | 213,546 | | | | 198,964 | | | | 170,812 | |
| Deferred interests | | | 201,897 | | | | 101,703 | | | | 92,283 | |
| Employee benefits and bonuses(3) | | | 158,975 | | | | 181,472 | | | | 91,969 | |
| Provisions(4) | | | 72,203 | | | | 90,507 | | | | 97,159 | |
| Other | | | 283,627 | | | | 127,126 | | | | 23,911 | |
| Total | | | 4,281,889 | | | | 3,707,440 | | | | 3,610,794 | |
| (1) | The 2011most significant payable accounts correspond to tax withholding, dividends and 2010 balances of allowance for credit losses on loans, financial lease, and other receivables have been changed to include as part of the roll forward the changes associated with the allowance for (a) interests on non-accrual loans; (b) finance leases accounted for operating leases under Colombian banking GAAP; (c) securitized loans acquired in Banagricola’s business acquisition and (d) other receivables for securitized non-performing loans. These allowances of COP 112,187, COP 80,314 and COP 81,901 in 2012, 2011 and 2010 respectively,suppliers. All payable accounts are presented as part of the reconciliation items (g) interest recognition on non-accrual loans, (l) lessor accounting, (m) business combinations and (n) securitization, respectively. |
The average recorded investments in impaired loans for each segment for the year ended December 31, 2012 and 2011, were as follows:
| | | 2012 | | | 2011 | |
| | | Average | | | Average | |
| | | Impaired loans | | | Allowance | | | Impaired loans | | | Allowance | |
| Commercial | | COP | 2,216,790 | | | COP | 998,281 | | | COP | 2,412,013 | | | COP | 977,828 | |
| Consumer | | | 810,195 | | | | 526,813 | | | | 648,840 | | | | 374,233 | |
| Residential Mortgage | | | 297,251 | | | | 138,470 | | | | 291,262 | | | | 130,013 | |
| Small Loans | | | 38,994 | | | | 25,253 | | | | 39,793 | | | | 24,375 | |
| Financial Leases | | | 400,958 | | | | 115,532 | | | | 469,895 | | | | 118,739 | |
| | | COP | 3,764,188 | | | COP | 1,804,349 | | | COP | 3,861,803 | | | COP | 1,625,188 | |
The interest income that would have been recorded for impaired loans in accordance with the original contractual terms amounted to COP 492,426, COP 413,825 and COP 493,481 for the years ended December 31, 2012, 2011 and 2010 respectively.
For the years ended December 31, 2012, 2011 and 2010, the Bank recognized interest income from impaired loans others than TDRs of approximately COP 270,379, COP 182,007 and COP 200,283, respectively.
The balance of the portfolio representing small balance homogeneous loans was evaluated under a collective allowance methodology by segment, and amounted to COP 74,570,754 and COP 65,346,449 at December 31, 2012 and 2011, respectively.
The following summarizes the carrying amount of each segment of financing receivable and the respective allowance for credit losses under U.S. GAAP. See Note 2 (i) “Loans and financial leases”:
Loan Portfolio by Loan Type
December 31, 2012
| | | Commercial | | | Consumer | | | Residential
Mortgage | | | Small Business
Loans | | | Financial
Leases | | | Total | |
| | | | | | | | | | | | | | | | | | | |
| Loans and financial leases | | COP | 42,023,954 | | | COP | 12,875,680 | | | COP | 7,782,115 | | | COP | 334,829 | | | COP | 15,866,173 | | | COP | 78,882,751 | |
| Accrued interest receivable | | | 315,154 | | | | 132,315 | | | | 36,323 | | | | 4,576 | | | | 51,686 | | | | 540,054 | |
| Loans origination fees and costs | | | 15,270 | | | | 76,886 | | | | 17,721 | | | | 4,020 | | | | 8,959 | | | | 122,856 | |
| Unearned income | | | (6,185 | ) | | | - | | | | - | | | | - | | | | (3,589,833 | ) | | | (3,596,018 | ) |
| Unamortized discounts or premiums | | | 49,448 | | | | - | | | | - | | | | - | | | | - | | | | 49,448 | |
| Carrying Amount | | COP | 42,397,641 | | | COP | 13,084,881 | | | COP | 7,836,159 | | | COP | 343,425 | | | COP | 12,336,985 | | | COP | 75,999,091 | |
| | | | | | | | | | | | | | | | | | | | | | | | | |
| Allowance for loans losses , financial lease, and other receivables under U.S. GAAP | | | (1,648,890 | ) | | | (1,141,198 | ) | | | (399,209 | ) | | | (55,816 | ) | | | (382,255 | ) | | | (3,627,368 | ) |
| | | | | | | | | | | | | | | | | | | | | | | | | |
| Loans and financial leases net | | COP | 40,748,751 | | | COP | 11,943,683 | | | COP | 7,436,950 | | | COP | 287,609 | | | COP | 11,954,730 | | | COP | 72,371,723 | |
Loan Portfolio by Loan Type
December 31, 2011
| | | Commercial | | | Consumer | | | Residential
Mortgage | | | Small Business
Loans | | | Financial Leases | | | Total | |
| | | | | | | | | | | | | | | | | | | |
| Loans and financial leases | | COP | 37,954,865 | | | COP | 10,846,046 | | | COP | 7,955,671 | | | COP | 316,905 | | | COP | 12,195,636 | | | COP | 69,269,123 | |
| Accrued interest receivable | | | 267,899 | | | | 107,599 | | | | 27,438 | | | | 3,866 | | | | 42,242 | | | | 449,044 | |
| Loans origination fees and costs | | | 9,622 | | | | 53,341 | | | | 14,029 | | | | 3,366 | | | | 8,448 | | | | 88,806 | |
| Unearned income | | | (11,506 | ) | | | - | | | | - | | | | - | | | | (2,698,471 | ) | | | (2,709,977 | ) |
| Unamortized discounts or premiums | | | 54,494 | | | | - | | | | - | | | | - | | | | - | | | | 54,494 | |
| Carrying Amount | | COP | 38,275,374 | | | COP | 11,006,986 | | | COP | 7,997,138 | | | COP | 324,137 | | | COP | 9,547,855 | | | COP | 67,151,490 | |
| | | | | | | | | | | | | | | | | | | | | | | | | |
| Allowance for loans losses , financial lease, and other receivables under U.S. GAAP | | | (1,522,345 | ) | | | (989,314 | ) | | | (393,188 | ) | | | (51,381 | ) | | | (318,971 | ) | | | (3,275,199 | ) |
| | | | | | | | | | | | | | | | | | | | | | | | | |
| Loans and financial leases net | | COP | 36,753,029 | | | COP | 10,017,672 | | | COP | 7,603,950 | | | COP | 272,756 | | | COP | 9,228,884 | | | COP | 63,876,291 | |
Loans and asset quality
The following tables are presented for eachportfolio segmentof financing receivable, and provide additional information about our credit risks and the adequacy of our allowance for credit losses.
Allowance for credit losses
The following table sets forth the changes in the allowance and an allocation of the allowance by loan type:
Allowance for Credit Losses and Recorded Investment in Financing Receivables
For the year ended December 31, 2012
| | | Commercial | | | Consumer | | | Residential
Mortgage | | | Small Business
Loans | | | Financial Leases | | | Total | |
| Allowance for credit losses: | | | | | | | | | | | | | | | | | | | | | | | | |
| | | | | | | | | | | | | | | | | | | | | | | | | |
| Beginning Balance | | COP | 1,522,345 | | | COP | 989,314 | | | COP | 393,188 | | | COP | 51,381 | | | COP | 318,971 | | | COP | 3,275,199 | |
| Sale of Asesuisa S.A. and Asesuisa Vida | | | (1,303 | ) | | | - | | | | - | | | | - | | | | - | | | | (1,303 | ) |
| Provision, net | | | 257,019 | | | | 592,425 | | | | (5,674 | ) | | | 22,650 | | | | 84,802 | | | | 951,222 | |
| Charge-offs | | | (201,425 | ) | | | (478,066 | ) | | | (753 | ) | | | (18,836 | ) | | | (29,526 | ) | | | (728,606 | ) |
| Recoveries of charges-offs | | | 88,514 | | | | 52,138 | | | | 15,755 | | | | 811 | | | | 10,601 | | | | 167,819 | |
| Effect of difference in exchange rate | | | (16,260 | ) | | | (14,613 | ) | | | (3,307 | ) | | | (190 | ) | | | (2,593 | ) | | | (36,963 | ) |
| Ending Balance | | COP | 1,648,890 | | | COP | 1,141,198 | | | COP | 399,209 | | | COP | 55,816 | | | COP | 382,255 | | | COP | 3,627,368 | |
| | | | | | | | | | | | | | | | | | | | | | | | | |
| Ending balance: individually evaluated for impairment | | COP | 613,197 | | | COP | 3,557 | | | COP | 93 | | | COP | 1 | | | COP | 39,532 | | | COP | 656,380 | |
| Ending balance: collectively evaluated for impairment | | | 1,035,693 | | | | 1,137,641 | | | COP | 399,116 | | | | 55,815 | | | | 342,723 | | | | 2,970,988 | (1) |
| | | | | | | | | | | | | | | | | | | | | | | | | |
| Ending balance | | COP | 1,648,890 | | | COP | 1,141,198 | | | COP | 399,209 | | | COP | 55,816 | | | COP | 382,255 | | | COP | 3,627,368 | |
| | | | | | | | | | | | | | | | | | | | | | | | | |
| Financing receivables: | | | | | | | | | | | | | | | | | | | | | | | | |
| | | | | | | | | | | | | | | | | | | | | | | | | |
| Ending balance: individually evaluated for impairment | | COP | 1,383,078 | | | COP | 23,264 | | | COP | 226 | | | COP | 7 | | | COP | 121,762 | | | COP | 1,528,337 | |
| Ending balance: collectively evaluated for impairment | | | 41,014,563 | | | | 13,061,617 | | | | 7,835,933 | | | | 343,418 | | | | 12,215,223 | | | | 74,470,754 | |
| | | | | | | | | | | | | | | | | | | | | | | | | |
| Ending balance | | COP | 42,397,641 | | | COP | 13,084,881 | | | COP | 7,836,159 | | | COP | 343,425 | | | COP | 12,336,985 | | | COP | 75,999,091 | |
| (1) | Includes allowance for COP 1,320,668 related to impaired loans. |
Allowance for Credit Losses and Recorded Investment in Financing Receivables
For the Year Ended December 31, 2011
| | | Commercial | | | Consumer | | | Residential
Mortgage | | | Small Business
Loans | | | Financial Leases | | | Total | |
| | | | | | | | | | | | | | | | | | | |
| Allowance for credit losses: | | | | | | | | | | | | | | | | | | | | | | | | |
| | | | | | | | | | | | | | | | | | | | | | | | | |
| Beginning Balance | | COP | 1,509,815 | | | COP | 729,088 | | | COP | 380,479 | | | COP | 57,263 | | | COP | 231,368 | | | COP | 2,908,013 | |
| Provision, net | | | 154,435 | | | | 420,204 | | | | (8,175 | ) | | | 7,005 | | | | 96,706 | | | | 670,175 | |
| Charge-offs | | | (280,658 | ) | | | (239,822 | ) | | | (1,371 | ) | | | (14,318 | ) | | | (21,505 | ) | | | (557,674 | ) |
| Recoveries of charges-offs | | | 136,444 | | | | 73,843 | | | | 21,485 | | | | 1,363 | | | | 11,005 | | | | 244,140 | |
| Effect of difference in exchange rate | | | 2,309 | | | | 6,001 | | | | 770 | | | | 68 | | | | 1,397 | | | | 10,545 | |
| Ending Balance | | COP | 1,522,345 | | | COP | 989,314 | | | COP | 393,188 | | | COP | 51,381 | | | COP | 318,971 | | | COP | 3,275,199 | |
| | | | | | | | | | | | | | | | | | | | | | | | | |
| Ending balance: individually evaluated for impairment | | COP | 618,785 | | | COP | 1,729 | | | COP | - | | | COP | - | | | COP | 50,121 | | | COP | 670,635 | |
| | | | | | | | | | | | | | | | | | | | | | | | | |
| Ending balance: collectively evaluated for impairment | | | 903,560 | | | | 987,585 | | | | 393,188 | | | | 51,381 | | | | 268,850 | | | | 2,604,564 | (1) |
| | | | | | | | | | | | | | | | | | | | | | | | | |
| Ending balance | | COP | 1,522,345 | | | COP | 989,314 | | | COP | 393,188 | | | COP | 51,381 | | | COP | 318,971 | | | COP | 3,275,199 | |
| | | | | | | | | | | | | | | | | | | | | | | | | |
| Financing receivables: | | | | | | | | | | | | | | | | | | | | | | | | |
| | | | | | | | | | | | | | | | | | | | | | | | | |
| Ending balance: individually evaluated for impairment | | COP | 1,599,571 | | | COP | 5,842 | | | COP | - | | | COP | - | | | COP | 199,628 | | | COP | 1,805,041 | |
| Ending balance: collectively evaluated for impairment | | | 36,675,803 | | | | 11,001,144 | | | | 7,997,138 | | | | 324,137 | | | | 9,348,227 | | | | 65,346,449 | |
| | | | | | | | | | | | | | | | | | | | | | | | | |
| Ending balance | | COP | 38,275,374 | | | COP | 11,006,986 | | | COP | 7,997,138 | | | COP | 324,137 | | | COP | 9,547,855 | | | COP | 67,151,490 | |
| (1) | Includes allowance for COP 1,005,120 related to impaired loans. |
Past-due loans
The table below sets forth information about our past-due loans by segment and by class:
Age Analysis of Past-Due Financing Receivables
As of December 31, 2012
| | | 31–90 Days
Past- Due | | | 91–120 Days
Past-Due | | | 121-180 Days
Past-Due | | | 181- 360 Days
Past-Due | | | Greater than
360 Days | | | Total Past-Due | | | Current | | | Total Financing | |
| | | | | | | | | | | | | | | | | | | | | | | | | |
| Commercial | | | | | | | | | | | | | | | | | | | | | | | | | | | | | | | | |
| Corporate | | COP | 49,795 | | | COP | 6,102 | | | COP | 3,575 | | | COP | 21,409 | | | COP | 32,352 | | | COP | 113,233 | | | COP | 25,333,937 | | | COP | 25,447,170 | |
| SME(1) | | | 91,685 | | | | 28,696 | | | | 33,547 | | | | 100,398 | | | | 72,492 | | | | 326,818 | | | | 8,143,685 | | | | 8,470,503 | |
| Others | | | 64,386 | | | | 14,595 | | | | 20,937 | | | | 72,147 | | | | 40,398 | | | | 212,463 | | | | 8,267,505 | | | | 8,479,968 | |
| Total Commercial | | COP | 205,866 | | | COP | 49,393 | | | COP | 58,059 | | | COP | 193,954 | | | COP | 145,242 | | | COP | 652,514 | | | COP | 41,745,127 | | | COP | 42,397,641 | |
| | | | | | | | | | | | | | | | | | | | | | | | | | | | | | | | | |
| Consumer | | | | | | | | | | | | | | | | | | | | | | | | | | | | | | | | |
| Credit card | | COP | 142,309 | | | COP | 58,908 | | | COP | 71,280 | | | COP | 38,711 | | | COP | 19,226 | | | COP | 330,434 | | | COP | 4,923,571 | | | COP | 5,254,005 | |
| Vehicle loans | | | 60,664 | | | | 13,490 | | | | 16,041 | | | | 9,757 | | | | 1,343 | | | | 101,295 | | | | 2,122,774 | | | | 2,224,069 | |
| Payroll loan | | | 10,035 | | | | 1,887 | | | | 2,250 | | | | 360 | | | | 46 | | | | 14,578 | | | | 1,583,644 | | | | 1,598,222 | |
| Others | | | 94,833 | | | | 26,800 | | | | 37,750 | | | | 25,719 | | | | 13,098 | | | | 198,200 | | | | 3,810,385 | | | | 4,008,585 | |
| Total Consumer | | COP | 307,841 | | | COP | 101,085 | | | COP | 127,321 | | | COP | 74,547 | | | COP | 33,713 | | | COP | 644,507 | | | COP | 12,440,374 | | | COP | 13,084,881 | |
| | | | | | | | | | | | | | | | | | | | | | | | | | | | | | | | | |
| Residential Mortgage | | | | | | | | | | | | | | | | | | | | | | | | | | | | | | | | |
| VIS(2) | | COP | 115,927 | | | COP | 14,846 | | | COP | 16,766 | | | COP | 23,119 | | | COP | 29,896 | | | COP | 200,554 | | | COP | 1,893,308 | | | COP | 2,093,862 | |
| No VIS | | | 188,383 | | | | 27,539 | | | | 29,686 | | | | 52,686 | | | | 118,999 | | | | 417,293 | | | | 5,325,004 | | | | 5,742,297 | |
| Total Residential Mortgage | | COP | 304,310 | | | COP | 42,385 | | | COP | 46,452 | | | COP | 75,805 | | | COP | 148,895 | | | COP | 617,847 | | | COP | 7,218,312 | | | COP | 7,836,159 | |
| | | | | | | | | | | | | | | | | | | | | | | | | | | | | | | | | |
| Small business loans | | | 11,436 | | | | 3,594 | | | | 5,436 | | | | 8,307 | | | | 2,657 | | | | 31,430 | | | | 311,995 | | | | 343,425 | |
| | | | | | | | | | | | | | | | | | | | | | | | | | | | | | | | | |
| Financial leases | | | 72,299 | | | | 13,385 | | | | 17,086 | | | | 29,521 | | | | 31,950 | | | | 164,241 | | | | 12,172,744 | | | | 12,336,985 | |
| | | | | | | | | | | | | | | | | | | | | | | | | | | | | | | | | |
| TOTAL | | COP | 901,752 | | | COP | 209,842 | | | COP | 254,354 | | | COP | 382,134 | | | COP | 362,457 | | | COP | 2,110,539 | | | COP | 73,888,552 | | | COP | 75,999,091 | |
| (1) | SME refers to Small and Medium Sized Enterprisesshort term. |
| (2) | VIS refers in Spanish to “Vivienda de Interés Social”, a term used to describe residential mortgages grantedUnearned income principally consists of prepayments of interest by financial institutions in amounts that are less than 135 legal minimum monthly salaries in Colombia (currently COP 77).customers. |
Age Analysis of Past-due Financing Receivables
As of December 31, 2011
| | | 31–90 Days
Past-due | | | 91–120 Days
Past-due | | | 121-180 Days
Past-due | | | 181- 360 Days
Past-due | | | Greater than
360 Days | | | Total Past-due | | | Current | | | Total Financing | |
| | | | | | | | | | | | | | | | | | | | | | | | | | | | | | | | | |
| Commercial | | | | | | | | | | | | | | | | | | | | | | | | | | | | | | | | |
| Corporate | | COP | 17,949 | | | COP | 615 | | | COP | 7,630 | | | COP | 10,279 | | | COP | 26,358 | | | COP | 62,831 | | | COP | 23,830,543 | | | COP | 23,893,374 | |
| SME | | | 68,306 | | | | 22,148 | | | | 34,691 | | | | 82,692 | | | | 71,048 | | | | 278,885 | | | | 6,532,048 | | | | 6,810,933 | |
| Others | | | 65,436 | | | | 19,489 | | | | 15,707 | | | | 44,270 | | | | 31,590 | | | | 176,492 | | | | 7,394,575 | | | | 7,571,067 | |
| Total Commercial | | COP | 151,691 | | | COP | 42,252 | | | COP | 58,028 | | | COP | 137,241 | | | COP | 128,996 | | | COP | 518,208 | | | COP | 37,757,166 | | | COP | 38,275,374 | |
| | | | | | | | | | | | | | | | | | | | | | | | | | | | | | | | | |
| Consumer | | | | | | | | | | | | | | | | | | | | | | | | | | | | | | | | |
| Credit card | | COP | 92,589 | | | COP | 21,905 | | | COP | 45,080 | | | COP | 22,616 | | | COP | 17,579 | | | COP | 199,769 | | | COP | 4,380,617 | | | COP | 4,580,386 | |
| Vehicle loans | | | 29,499 | | | | 5,287 | | | | 7,126 | | | | 5,651 | | | | 421 | | | | 47,984 | | | | 1,764,314 | | | | 1,812,298 | |
| Payroll loan | | | 5,611 | | | | 484 | | | | 495 | | | | 475 | | | | 11 | | | | 7,076 | | | | 1,147,630 | | | | 1,154,706 | |
| Others | | | 51,019 | | | | 13,013 | | | | 15,728 | | | | 16,280 | | | | 1,997 | | | | 98,037 | | | | 3,361,559 | | | | 3,459,596 | |
| Total Consumer | | COP | 178,718 | | | COP | 40,689 | | | COP | 68,429 | | | COP | 45,022 | | | COP | 20,008 | | | COP | 352,866 | | | COP | 10,654,120 | | | COP | 11,006,986 | |
| | | | | | | | | | | | | | | | | | | | | | | | | | | | | | | | | |
| Residential Mortgage | | | | | | | | | | | | | | | | | | | | | | | | | | | | | | | | |
| VIS(1) | | COP | 73,086 | | | COP | 11,801 | | | COP | 11,701 | | | COP | 16,851 | | | COP | 23,693 | | | COP | 137,132 | | | COP | 2,117,438 | | | COP | 2,254,570 | |
| No VIS | | | 73,821 | | | | 12,185 | | | | 10,928 | | | | 19,300 | | | | 63,839 | | | | 180,073 | | | | 5,562,495 | | | | 5,742,568 | |
| Total residential mortgage | | COP | 146,907 | | | COP | 23,986 | | | COP | 22,629 | | | COP | 36,151 | | | COP | 87,532 | | | COP | 317,205 | | | COP | 7,679,933 | | | COP | 7,997,138 | |
| | | | | | | | | | | | | | | | | | | | | | | | | | | | | | | | | |
| Small business loans | | | 11,516 | | | | 3,263 | | | | 4,192 | | | | 6,374 | | | | 1,974 | | | | 27,319 | | | | 296,818 | | | | 324,137 | |
| | | | | | | | | | | | | | | | | | | | | | | | | | | | | | | | | |
| Financial leases | | | 40,733 | | | | 21,326 | | | | 23,989 | | | | 23,486 | | | | 24,523 | | | | 134,057 | | | | 9,413,798 | | | | 9,547,855 | |
| | | | | | | | | | | | | | | | | | | | | | | | | | | | | | | | | |
| TOTAL | | COP | 529,565 | | | COP | 131,516 | | | COP | 177,267 | | | COP | 248,274 | | | COP | 263,033 | | | COP | 1,349,655 | | | COP | 65,801,835 | | | COP | 67,151,490 | |
| (1)(3) | VIS refers in SpanishSee Note 18 for further information related to “Vivienda de Interés Social”, a term used to describe residential mortgages granted by financial institutions in amounts that are less than 135 legal minimum monthly salaries in Colombia (currently COP 72).other employee benefit plans. |
Credit quality indicators
The following table sets forth information about credit risks by class of financial receivable and internally assigned grades:
Credit Quality Indicators
As Of December 31 2012
| | | “A” Normal | | | “B” Acceptable | | | “C” Appreciable | | | “D” Significant | | | “E” Unrecoverable | | | TOTAL | |
| | | | | | | | | | | | | | | | | | | |
| Commercial | | | | | | | | | | | | | | | | | | | | | | | | |
| Corporate | | COP | 24,542,590 | | | COP | 251,215 | | | COP | 436,772 | | | COP | 90,890 | | | COP | 125,703 | | | COP | 25,447,170 | |
| SME | | | 7,633,313 | | | | 348,683 | | | | 168,113 | | | | 232,126 | | | | 88,268 | | | | 8,470,503 | |
| Others | | | 7,897,975 | | | | 196,548 | | | | 131,016 | | | | 162,133 | | | | 92,296 | | | | 8,479,968 | |
| Total Commercial | | COP | 40,073,878 | | | COP | 796,446 | | | COP | 735,901 | | | COP | 485,149 | | | COP | 306,267 | | | COP | 42,397,641 | |
| | | | | | | | | | | | | | | | | | | | | | | | | |
| Consumer | | | | | | | | | | | | | | | | | | | | | | | | |
| Credit card | | COP | 4,379,872 | | | COP | 422,269 | | | COP | 139,748 | | | COP | 219,996 | | | COP | 92,120 | | | COP | 5,254,005 | |
| Vehicle loans | | | 2,047,659 | | | | 49,673 | | | | 44,496 | | | | 48,098 | | | | 34,143 | | | | 2,224,069 | |
| Payroll loan | | | 1,544,000 | | | | 17,952 | | | | 6,981 | | | | 19,558 | | | | 9,731 | | | | 1,598,222 | |
| Others | | | 3,651,317 | | | | 155,291 | | | | 61,295 | | | | 85,278 | | | | 55,404 | | | | 4,008,585 | |
| Total Consumer | | COP | 11,622,848 | | | COP | 645,185 | | | COP | 252,520 | | | COP | 372,930 | | | COP | 191,398 | | | COP | 13,084,881 | |
| | | | | | | | | | | | | | | | | | | | | | | | | |
| Residential Mortgage | | | | | | | | | | | | | | | | | | | | | | | | |
| VIS | | COP | 1,947,687 | | | COP | 75,857 | | | COP | 33,266 | | | COP | 12,631 | | | COP | 24,421 | | | COP | 2,093,862 | |
| No VIS | | | 5,492,546 | | | | 90,027 | | | | 67,769 | | | | 23,928 | | | | 68,027 | | | | 5,742,297 | |
| Total Residential Mortgage | | COP | 7,440,233 | | | COP | 165,884 | | | COP | 101,035 | | | COP | 36,559 | | | COP | 92,448 | | | COP | 7,836,159 | |
| | | | | | | | | | | | | | | | | | | | | | | | | |
| Small business loans | | | 302,776 | | | | 10,458 | | | | 5,842 | | | | 5,391 | | | | 18,958 | | | | 343,425 | |
| | | | | | | | | | | | | | | | | | | | | | | | | |
| Financial leases | | | 11,933,953 | | | | 171,496 | | | | 104,971 | | | | 68,483 | | | | 58,082 | | | | 12,336,985 | |
| | | | | | | | | | | | | | | | | | | | | | | | | |
| Total loans and financial leases | | COP | 71,373,688 | | | COP | 1,789,469 | | | COP | 1,200,269 | | | COP | 968,512 | | | COP | 667,153 | | | COP | 75,999,091 | |
Credit Quality Indicators
As of December 31, 2011
| | | “A” Normal | | | “B” Acceptable | | | “C” Appreciable | | | “D” Significant | | | “E” Unrecoverable | | | TOTAL | |
| | | | | | | | | | | | | | | | | | | |
| Commercial | | | | | | | | | | | | | | | | | | | | | | | | |
| Corporate | | COP | 23,143,287 | | | COP | 311,410 | | | COP | 278,236 | | | COP | 80,891 | | | COP | 79,550 | | | COP | 23,893,374 | |
| SME | | | 6,038,269 | | | | 324,165 | | | | 121,407 | | | | 218,658 | | | | 108,434 | | | | 6,810,933 | |
| Others | | | 7,019,833 | | | | 201,114 | | | | 78,786 | | | | 186,843 | | | | 84,491 | | | | 7,571,067 | |
| Total Commercial | | COP | 36,201,389 | | | COP | 836,689 | | | COP | 478,429 | | | COP | 486,392 | | | COP | 272,475 | | | COP | 38,275,374 | |
| | | | | | | | | | | | | | | | | | | | | | | | | |
| Consumer | | | | | | | | | | | | | | | | | | | | | | | | |
| Credit card | | COP | 3,585,743 | | | COP | 547,603 | | | COP | 168,914 | | | COP | 160,249 | | | COP | 117,877 | | | COP | 4,580,386 | |
| Vehicle loans | | | 1,717,075 | | | | 36,279 | | | | 23,061 | | | | 20,687 | | | | 15,196 | | | | 1,812,298 | |
| Payroll loan | | | 1,121,731 | | | | 15,064 | | | | 5,717 | | | | 8,533 | | | | 3,661 | | | | 1,154,706 | |
| Others | | | 3,093,340 | | | | 235,458 | | | | 53,570 | | | | 45,429 | | | | 31,799 | | | | 3,459,596 | |
| Total Consumer | | COP | 9,517,889 | | | COP | 834,404 | | | COP | 251,262 | | | COP | 234,898 | | | COP | 168,533 | | | COP | 11,006,986 | |
| | | | | | | | | | | | | | | | | | | | | | | | | |
| Residential Mortgage | | | | | | | | | | | | | | | | | | | | | | | | |
| VIS | | COP | 2,054,373 | | | COP | 85,283 | | | COP | 46,811 | | | COP | 27,494 | | | COP | 40,609 | | | COP | 2,254,570 | |
| No VIS | | | 5,491,788 | | | | 86,084 | | | | 44,591 | | | | 25,508 | | | | 94,597 | | | | 5,742,568 | |
| Total Residential Mortgage | | COP | 7,546,161 | | | COP | 171,367 | | | COP | 91,402 | | | COP | 53,002 | | | COP | 135,206 | | | COP | 7,997,138 | |
| | | | | | | | | | | | | | | | | | | | | | | | | |
| Small business loans | | | 286,033 | | | | 10,285 | | | | 6,645 | | | | 6,094 | | | | 15,080 | | | | 324,137 | |
| | | | | | | | | | | | | | | | | | | | | | | | | |
| Financial leases | | | 9,172,438 | | | | 137,135 | | | | 111,360 | | | | 85,541 | | | | 41,381 | | | | 9,547,855 | |
| | | | | | | | | | | | | | | | | | | | | | | | | |
| Total loans and financial leases | | COP | 62,723,910 | | | COP | 1,989,880 | | | COP | 939,098 | | | COP | 865,927 | | | COP | 632,675 | | | COP | 67,151,490 | |
Internally assigned ratings are the same as those defined by SFC, described in Note 2 (i) “Loans and financial leases”.
Impaired loans
The following table sets forth information regarding loans considered impaired as of December 31, 2012 and 2011:
Impaired Loans(1)
As of December 31, 2012
| | | Recorded Investment | | | Unpaid Principal
Balance | | | Related Allowance | | | Interest Income
Recognized | |
| | | | | | | | | | | | | |
| With no related allowance recorded: | | | | | | | | | | | | | | | | |
| | | | | | | | | | | | | | | | | |
| Commercial | | | | | | | | | | | | | | | | |
| Corporate | | COP | 165,949 | | | COP | 164,858 | | | COP | - | | | COP | 12,652 | |
| SME | | | 122,002 | | | | 120,279 | | | | - | | | | 13,704 | |
| Others | | | 79,175 | | | | 77,645 | | | | - | | | | 9,438 | |
| Total Commercial | | COP | 367,126 | | | COP | 362,782 | | | COP | - | | | COP | 35,794 | |
| | | | | | | | | | | | | | | | | |
| Consumer | | | | | | | | | | | | | | | | |
| Credit card | | COP | 328 | | | COP | 312 | | | COP | - | | | COP | 188 | |
| Vehicle loans | | | 6,128 | | | | 5,955 | | | | - | | | | 543 | |
| Others | | | 147 | | | | 141 | | | | - | | | | 22 | |
| Total Consumer | | COP | 6,603 | | | COP | 6,408 | | | COP | - | | | COP | 753 | |
| | | | | | | | | | | | | | | | | |
| Residential Mortgage | | | | | | | | | | | | | | | | |
| VIS | | COP | 110 | | | COP | 108 | | | COP | - | | | COP | 113 | |
| No VIS | | | 124 | | | | 123 | | | | - | | | | 124 | |
| Total residential mortgage | | COP | 234 | | | COP | 231 | | | COP | - | | | COP | 237 | |
| | | | | | | | | | | | | | | | | |
| Small Business loans | | | 632 | | | | 627 | | | | - | | | | 68 | |
| | | | | | | | | | | | | | | | | |
| Financial leases | | | 32,435 | | | | 32,224 | | | | - | | | | 2,746 | |
| | | | | | | | | | | | | | | | | |
| With an allowance recorded: | | | | | | | | | | | | | | | | |
| | | | | | | | | | | | | | | | | |
| Commercial | | | | | | | | | | | | | | | | |
| Corporate | | COP | 714,779 | | | COP | 709,681 | | | COP | 443,975 | | | COP | 49,608 | |
| SME | | | 499,810 | | | | 491,972 | | | | 301,021 | | | | 63,551 | |
| Others | | | 517,603 | | | | 512,237 | | | | 286,260 | | | | 49,841 | |
| Total Commercial | | COP | 1,732,192 | | | COP | 1,713,890 | | | COP | 1,031,256 | | | COP | 163,000 | |
| | | | | | | | | | | | | | | | | |
| Consumer | | | | | | | | | | | | | | | | |
| Credit card | | COP | 502,382 | | | COP | 479,058 | | | COP | 407,413 | | | COP | 81,093 | |
| Vehicle loans | | | 126,176 | | | | 121,880 | | | | 65,309 | | | | 19,575 | |
| Payroll loan | | | 36,497 | | | | 35,951 | | | | 13,680 | | | | 4,377 | |
| Others | | | 222,095 | | | | 216,815 | | | | 133,687 | | | | 33,885 | |
| Total Consumer | | COP | 887,150 | | | COP | 853,704 | | | COP | 620,089 | | | COP | 138,930 | |
| | | | | | | | | | | | | | | | | |
| Residential Mortgage | | | | | | | | | | | | | | | | |
| VIS | | COP | 112,464 | | | COP | 111,208 | | | COP | 52,659 | | | COP | 10,319 | |
| No VIS | | | 247,019 | | | | 243,952 | | | | 137,136 | | | | 13,607 | |
| Total residential mortgage | | COP | 359,483 | | | COP | 355,160 | | | COP | 189,705 | | | COP | 23,926 | |
| | | | | | | | | | | | | | | | | |
| Small Business loans | | | 37,055 | | | | 36,251 | | | | 26,078 | | | | 7,344 | |
| | | | | | | | | | | | | | | | | |
| Financial leases | | | 308,910 | | | | 303,812 | | | | 109,920 | | | | 32,151 | |
| | | | | | | | | | | | | | | | | |
| Total | | COP | 3,731,820 | | | COP | 3,665,089 | | | COP | 1,977,048 | | | COP | 404,949 | |
| (1)(4) | Corresponds to loans with any impairment condition that increases its risk level, regardless of its past due days.See Note 20. |
Impaired Loans(1)
As of Ended December 31, 2011
| | | Recorded
Investment | | | Unpaid Principal
Balance | | | Related Allowance | | | Interest Income
Recognized | |
| | | | | | | | | | | | | |
| With no related allowance recorded: | | | | | | | | | | | | | | | | |
| | | | | | | | | | | | | | | | | |
| Commercial | | | | | | | | | | | | | | | | |
| Corporate | | COP | 139,261 | | | COP | 138,530 | | | COP | - | | | COP | 13,144 | |
| SME | | | 162,101 | | | | 159,477 | | | | - | | | | 15,833 | |
| Others | | | 83,489 | | | | 82,353 | | | | - | | | | 11,931 | |
| Total Commercial | | COP | 384,851 | | | COP | 380,360 | | | COP | - | | | COP | 40,908 | |
| | | | | | | | | | | | | | | | | |
| Consumer | | | | | | | | | | | | | | | | |
| Vehicle loans | | COP | 10 | | | COP | 10 | | | COP | - | | | COP | 3 | |
| Others | | | 625 | | | | 583 | | | | - | | | | 33 | |
| Total Consumer | | COP | 635 | | | COP | 593 | | | COP | - | | | COP | 36 | |
| | | | | | | | | | | | | | | | | |
| Residential Mortgage | | | | | | | | | | | | | | | | |
| VIS | | COP | 12 | | | COP | 12 | | | COP | - | | | COP | 2 | |
| No VIS | | | 184 | | | | 183 | | | | - | | | | 28 | |
| Total residential mortgage | | COP | 196 | | | COP | 195 | | | COP | - | | | COP | 30 | |
| | | | | | | | | | | | | | | | | |
| Small Business loans | | | 182 | | | | 179 | | | | - | | | | 20 | |
| | | | | | | | | | | | | | | | | |
| Financial leases | | | 82,831 | | | | 82,434 | | | | - | | | | 7,529 | |
| | | | | | | | | | | | | | | | | |
| With an allowance recorded: | | | | | | | | | | | | | | | | |
| | | | | | | | | | | | | | | | | |
| Commercial | | | | | | | | | | | | | | | | |
| Corporate | | COP | 840,882 | | | COP | 834,285 | | | COP | 386,079 | | | COP | 36,523 | |
| SME | | | 554,313 | | | | 546,751 | | | | 295,879 | | | | 54,819 | |
| Others | | | 554,220 | | | | 549,254 | | | | 283,346 | | | | 48,128 | |
| Total Commercial | | COP | 1,949,415 | | | COP | 1,930,290 | | | COP | 965,304 | | | COP | 139,470 | |
| | | | | | | | | | | | | | | | | |
| Consumer | | | | | | | | | | | | | | | | |
| Credit card | | COP | 506,159 | | | COP | 489,229 | | | COP | 318,911 | | | COP | 44,303 | |
| Vehicle loans | | | 62,946 | | | | 60,971 | | | | 32,106 | | | | 9,979 | |
| Payroll loan | | | 18,053 | | | | 17,798 | | | | 5,997 | | | | 2,132 | |
| Others | | | 138,844 | | | | 135,278 | | | | 76,523 | | | | 19,330 | |
| Total Consumer | | COP | 726,002 | | | COP | 703,276 | | | COP | 433,537 | | | COP | 75,744 | |
| | | | | | | | | | | | | | | | | |
| Residential Mortgage | | | | | | | | | | | | | | | | |
| VIS | | COP | 108,850 | | | COP | 107,764 | | | COP | 47,151 | | | COP | 10,630 | |
| No VIS | | | 172,011 | | | | 169,643 | | | | 84,192 | | | | 11,541 | |
| Total residential mortgage | | COP | 280,861 | | | COP | 277,407 | | | COP | 131,343 | | | COP | 22,171 | |
| | | | | | | | | | | | | | | | | |
| Small business loans | | | 40,119 | | | | 39,432 | | | | 24,427 | | | | 7,330 | |
| | | | | | | | | | | | | | | | | |
| Financial leases | | | 377,740 | | | | 372,214 | | | | 121,144 | | | | 40,461 | |
| | | | | | | | | | | | | | | | | |
| Total | | COP | 3,842,832 | | | COP | 3,786,380 | | | COP | 1,675,755 | | | COP | 333,699 | |
(1) Corresponds to loans with any impairment condition that increases its risk level, regardless its past due days.
Assets pledged as collateral
As of December 31, 20122015, Tuya has been considered as asset held for sale, and 2011, the Bank had pledged investment securities amountingrelated liabilities in the item ‘other liabilities’ amounts to COP 119,132158,380 and COP 1,984,210, respectively,are classified as collateral to secure lines of credit at international banks, domestic development banks and other financial institutions.
Nonaccrual loans
The table below sets forth information about loans and finance leases on nonaccrual status under U.S. GAAP:
Financing Receivables on Nonaccrual Status Under U.S. GAAP
As of December 31, |
| | | 2012 | | | 2011 | |
| Commercial | | | | | | | | |
| Corporate | | COP | 63,438 | | | COP | 44,882 | |
| SME | | | 235,133 | | | | 210,579 | |
| Others | | | 148,077 | | | | 111,056 | |
| Total Commercial | | COP | 446,648 | | | COP | 366,517 | |
| | | | | | | | | |
| Consumer | | | | | | | | |
| Credit card | | COP | 188,125 | | | COP | 107,180 | |
| Vehicle loans | | | 40,631 | | | | 18,485 | |
| Payroll loan | | | 4,543 | | | | 1,465 | |
| Others | | | 103,367 | | | | 47,018 | |
| Total Consumer | | COP | 336,666 | | | COP | 174,148 | |
| | | | | | | | | |
| Residential Mortgage | | | | | | | | |
| VIS | | COP | 84,627 | | | COP | 64,046 | |
| No VIS | | | 228,910 | | | | 106,252 | |
| Total residential mortgage | | COP | 313,537 | | | COP | 170,298 | |
| | | | | | | | | |
| Small business loans | | | 19,994 | | | | 15,803 | |
| | | | | | | | | |
| Financial leases | | | 91,942 | | | | 93,324 | |
| | | | | | | | | |
| TOTAL | | COP | 1,208,787 | | | COP | 820,090 | |
As of December 31, 2012 and 2011, Bancolombia did not have any performing loans which were past-due for 90 days or more.
Troubled Debt Restructurings
Troubled Debt Restructurings (“TDRs”) are loans where both:
a) The Bank has granted a concession to the customer for economic or legal reasons that it would not otherwise consider, and
b) The customer is in financial difficulty.
The modifications could include: term extensions, changes in the interest rate (generally a decrease on it), principal and/or interest forgiveness, capitalization of past due amounts, or combinations thereof. In a TDR a debtor usually cannot obtain funds from other sources at affordable interest rates.
Term extension
The Bank may extend the maturity date to reduce the monthly repayments where a customer’s financial distress significantly affects its ability to pay within the original terms of the contract.
Principal and/or interest forgiveness
The Bank provides assistance to help customers in order to avoid foreclosure providing forgiveness of principal balances and/or interest. Different collection strategies are applied to different classes of receivables considering the individual circumstances of each case, such us: past-due days and, collateral coverage, among others. In all cases, the maximum principal forgiveness is the difference between the outstanding record investment and the appraised value of the underlying collateral. The Bank only applies principal balance forgiveness and/or interest forgiveness to loans that are 120 days or more past-due.
Capitalization of past due amounts and changes in the interest rate
A common type of modification, that generally falls into a TDR classification, include a combination of rate reduction and/or capitalization of past due amounts. The customer’s arrears may be capitalized and added to the principal balance and the customer agrees to repay these arrears over a reasonable period.
Mortgage loans
Modifications of mortgage loans may include, but are not limited to deferment of principal. These modifications are measured as TDRs if concessions have been granted to customers experiencing financial difficulty. In any case, the amount recorded should not be greater than 100% of the appraisal at the time the concession is granted.
Commercial loans
Commercial loans represented 64.5% of the total TDRs in 2012. Modifications of commercial loans are granted to commercial customers experiencing financial difficulty, often to avoid foreclosure and bankruptcy. Modifications that result in a TDR may include term extension, changes in the interest rate, principal and/or interest forgiveness, capitalization of past due amounts and other actions considered to assist customer while the Bank mitigates its own risk exposure.
In accordance with Colombian regulatory guidance, certain private entities and territorial districts may seek private agreements enabling them to fulfill their obligations to repay debts. The Bank manages temporary forbearance programs to modify contractual amounts or terms where a customer is at risk of forebearance.
Consumer and small loans
Almost all of the credit card and other consumer loans that have been modified in TDRs involve reducing the interest rate and placing the customer on a payment plan not exceeding 60 months. Usually, modifications of vehicle loans consist entirely of term extensions, which are granted aligned with the automobile model.
For all TDRs, the credit rating shall be consistent with the customer’s current financial circumstances and ability to pay at the time the concession is granted. Any eventual improvement in a TDR rating could only be possible when the customer improves its payment behavior and timely payments take place sequentially over a period of time ranging from two to four months depending upon the customer’s credit rating at the time when the concession was granted.
The following table presents a summary of the effects of the modifications that the Bank has granted during the year ended December 31, 2012:
| | | 2012 | |
| | | Average interest
rate reduction(1) | | | Term Extensions
(years) | | | Average principal
and interest
forgiveness | |
| Commercial | | | | | | | | | | COP | 15,286 | |
| Corporate | | | 3.84 | % | | | 4.57 | | | | | |
| SME | | | 5.96 | % | | | 2.19 | | | | | |
| Others | | | 2.66 | % | | | 1.59 | | | | | |
| | | | | | | | | | | | | |
| Consumer | | | | | | | | | | COP | 950 | |
| Credit card | | | - | | | | Maximum 4 | | | | | |
| Vehicle loans | | | 2.66 | % | | | Maximum 3 | (2) | | | | |
| Others | | | 8.82 | % | | | - | | | | | |
| | | | | | | | | | | | | |
| Residential Mortgage | | | | | | | | | | COP | - | |
| Vis | | | 3.05 | % | | | - | | | | | |
| No Vis | | | 3.75 | % | | | 1.73 | | | | | |
| | | | | | | | | | | | | |
| Small loans | | | 6.25 | % | | | 1.07 | | | COP | 627 | |
| | | | | | | | | | | | | |
| Leasing | | | - | | | | 1.52 | | | COP | - | |
|
|
| (1) | Represents the average reduction of the contractual rate, at the moment of the debt restructuring. |
| (2) | Term extensions ranging from 1 to 3 years are granted by the parent company depending upon the automobile model given as collateral. |
The following table presents TDRs granted by the Bank during the year 2012:
| | | Loans modified during the period ended December 31, | |
| | | 2012 | |
| | | Number
of
Contracts | | | Pre-
Modification
Outstanding
Recorded
Investment | | | Post-
Modification
Outstanding
Recorded
Investment (1) | | | Unpaid
principal
Balance (2) | |
| | | | | | | | | | | | | |
| Commercial | | | | | | | | | | | | | | | | |
| Corporate | | | 29 | | | COP | 35,481 | | | COP | 81,187 | | | COP | 73,706 | |
| SME | | | 1,293 | | | | 171,443 | | | | 119,309 | | | | 115,164 | |
| Others | | | 5,910 | | | | 107,579 | | | | 94,862 | | | | 89,393 | |
| Total Commercial | | | 7,232 | | | | 314,503 | | | | 295,358 | | | | 278,263 | |
| | | | | | | | | | | | | | | | | |
| Consumer | | | | | | | | | | | | | | | | |
| Credit card | | | 10,146 | | | | 42,463 | | | | 46,148 | | | | 44,315 | |
| Vehicle loans | | | 493 | | | | 7,115 | | | | 11,512 | | | | 11,307 | |
| Others | | | 1,905 | | | | 9,237 | | | | 10,957 | | | | 10,340 | |
| Total Consumer | | | 12,544 | | | | 58,815 | | | | 68,617 | | | | 65,962 | |
| | | | | | | | | | | | | | | | | |
| Residential Mortgage | | | | | | | | | | | | | | | | |
| Vis | | | 650 | | | | 15,923 | | | | 16,115 | | | | 14,571 | |
| No Vis | | | 407 | | | | 32,326 | | | | 33,731 | | | | 31,922 | |
| Total residential mortgage | | | 1,057 | | | | 48,249 | | | | 49,846 | | | | 46,493 | |
| | | | | | | | | | | | | | | | | |
| Small loans | | | 879 | | | | 9,719 | | | | 8,106 | | | | 7,659 | |
| | | | | | | | | | | | | | | | | |
| Financial leases | | | 358 | | | | 76,292 | | | | 77,986 | | | | 71,184 | |
| | | | | | | | | | | | | | | | | |
| TOTAL | | | 22,070 | | | COP | 507,758 | | | COP | 499,913 | | | COP | 469,561 | |
|
|
| (1) | Corresponds to past due amounts and any non-accrued interest that as part of the restructuring are capitalized at modification date. |
| (2) | Corresponds to loan principal that still due from borrower at the balance sheet date. |
The following table presents for the period ended as of December 31, 2012, the financing receivables modified as troubled debt restructurings within the previous 12 months and for which there was a subsequent payment default during that period:
| | | 2012 | |
| | | Number of
Contracts | | | Record
Investment | |
| | | | | | | |
| Commercial | | | | | | | | |
| Corporate | | | 15 | | | COP | 35,360 | |
| SME | | | 847 | | | | 74,981 | |
| Others | | | 3,268 | | | | 44,017 | |
| Total Commercial | | | 4,130 | | | | 154,358 | |
| | | | | | | | | |
| Consumer | | | | | | | | |
| Credit card | | | 1,211 | | | | 10,625 | |
| Vehicle loans | | | 228 | | | | 4,680 | |
| Others | | | 757 | | | | 3,825 | |
| Total Consumer | | | 2,196 | | | | 19,130 | |
| | | | | | | | | |
| Residential Mortgage | | | | | | | | |
| Vis | | | 300 | | | | 6,943 | |
| No Vis | | | 171 | | | | 15,025 | |
| Total residential mortgage | | | 471 | | | | 21,968 | |
| | | | | | | | | |
| Small loans | | | 577 | | | | 5,147 | |
| | | | | | | | | |
| Financial leases | | | 349 | | | | 71,506 | |
| | | | | | | | | |
| TOTAL | | | 7,723 | | | COP | 272,109 | |
The tables below present an age analysis of the past-due TDRs:
| | | 31-90 days | | | 91-120 Days | | | 121-180 Days | | | 181-360 Days | | | Total Past - due | | | Current | | | | |
| | | Past - due | | | Past - due | | | Past – due | | | Past - due | | | COP | | | % | | | COP | | | % | | | Total | |
| Commercial | | | | | | | | | | | | | | | | | | | | | | | | | | | | | | | | | | | | |
| Corporate | | COP | - | | | COP | 2,914 | | | COP | - | | | COP | - | | | COP | 2,914 | | | | 4 | % | | COP | 70,792 | | | | 96 | % | | COP | 73,706 | |
| SME | | | 9,849 | | | | 4,929 | | | | 3,697 | | | | 7,590 | | | | 26,065 | | | | 23 | % | | | 89,099 | | | | 77 | % | | | 115,164 | |
| Others | | | 8,016 | | | | 2,739 | | | | 3,415 | | | | 4,415 | | | | 18,585 | | | | 21 | % | | | 70,808 | | | | 79 | % | | | 89,393 | |
| Total Commercial | | | 17,865 | | | | 10,582 | | | | 7,112 | | | | 12,005 | | | | 47,564 | | | | 17 | % | | | 230,699 | | | | 83 | % | | | 278,263 | |
| | | | | | | | | | | | | | | | | | | | | | | | | | | | | | | | | | | | | |
| Consumer | | | | | | | | | | | | | | | | | | | | | | | | | | | | | | | | | | | | |
| Credit card | | | 1,550 | | | | 310 | | | | 420 | | | | 55 | | | | 2,335 | | | | 5 | % | | | 41,980 | | | | 95 | % | | | 44,315 | |
| Vehicle loans | | | 2,265 | | | | 362 | | | | 447 | | | | 266 | | | | 3,340 | | | | 30 | % | | | 7,967 | | | | 70 | % | | | 11,307 | |
| Others | | | 559 | | | | 203 | | | | 260 | | | | 15 | | | | 1,037 | | | | 10 | % | | | 9,303 | | | | 90 | % | | | 10,340 | |
| Total Consumer | | | 4,374 | | | | 875 | | | | 1,127 | | | | 336 | | | | 6,712 | | | | 10 | % | | | 59,250 | | | | 90 | % | | | 65,962 | |
| | | | | | | | | | | | | | | | | | | | | | | | | | | | | | | | | | | | | |
| Residential Mortgage | | | | | | | | | | | | | | | | | | | | | | | | | | | | | | | | | | | | |
| Vis | | | 3,931 | | | | 389 | | | | 617 | | | | 413 | | | | 5,350 | | | | 37 | % | | | 9,221 | | | | 63 | % | | | 14,571 | |
| No Vis | | | 6,810 | | | | 1,028 | | | | 703 | | | | 1,011 | | | | 9,552 | | | | 30 | % | | | 22,370 | | | | 70 | % | | | 31,922 | |
| Total Residential Mortgage | | | 10,741 | | | | 1,417 | | | | 1,320 | | | | 1,424 | | | | 14,902 | | | | 32 | % | | | 31,591 | | | | 68 | % | | | 46,493 | |
| | | | | | | | | | | | | | | | | | | | | | | | | | | | | | | | | | | | | |
| Small loans | | | 1,102 | | | | 445 | | | | 279 | | | | 459 | | | | 2,285 | | | | 30 | % | | | 5,374 | | | | 70 | % | | | 7,659 | |
| | | | | | | | | | | | | | | | | | | | | | | | | | | | | | | | | | | | | |
| Financial leases | | | 6,672 | | | | 2,343 | | | | 3,014 | | | | 992 | | | | 13,021 | | | | 18 | % | | | 58,163 | | | | 82 | % | | | 71,184 | |
| | | | | | | | | | | | | | | | | | | | | | | | | | | | | | | | | | | | | |
| TOTAL | | COP | 40,754 | | | COP | 15,662 | | | COP | 12,852 | | | COP | 15,216 | | | COP | 84,484 | | | | 18 | % | | COP | 385,077 | | | | 82 | % | | COP | 469,561 | |
Allowance for TDR loan losses
All TDRs that exceed COP 2,000 are individually assessed for impairment. TDRs that are less than the threshold are collectively evaluated for impairment.
For all segments, when a loan is designated as a TDR and it is individually assessed, the allowance is estimated based on the present value of projected future cash flows discounted at the original effective loan rate. If the carrying value of a TDR exceeds this amount, a specific allowance is recorded as a component of the allowance for loan and finance lease losses. To determine expected future cash flows, the Bank analyzes the financial situation of the debtor to calculate its ability to pay, including financial variables and its payment behavior.
TDRs are also individually assessed for impairment based on the fair value of the collateral net of estimated costs to sell in the case where the loan is considered collateral-dependent. If the carrying value of a loan exceeds this amount, a specific allowance is recorded. Subsequent changes in economic trends and in real estate values may implicate a decline in the fair value of the collateral. As a consequence, the specific allowance is adjusted to reflect further credit risk associated to the loan.
TDRs that are less than COP 2,000 are included in homogeneous groups which are collectively evaluated for impairment. For these TDRs, loss estimation models use historical loss experienceand credit scores.
Also, the probability of default, loss given default and exposure at default models takes into account the recent experience and post-modification payment behavior with restructured loans.
The following table sets forth by segment and by class the allowance recorded for loans that were designated as TDRs during the year 2012:follows:
| | | Allowance for loan
losses | |
Commercial | | | | |
Corporate | | COP | 57,828 | |
SME | | | 58,763 | |
Others | | | 49,643 | |
Total Commercial | | | 166,234December 31, 2015 | |
| | | | In millions of COP | |
ConsumerAccruals | | | 119,806 | |
Credit cardSalaries and labor obligations | | | 18,64925,854 | |
Vehicle loansSurplus to be applied | | | 4,0791,591 | |
OthersDeferred income | | | 4,46311,017 | |
| Provisions | | | 112 | |
Total Consumer | | | 27,191 | |
| | | | |
Residential Mortgage | | | | |
Vis | | | 2,725 | |
No Vis | | | 4,071 | |
Total Residential Mortgage | | | 6,796 | |
| | | | |
Small loans | | | 4,351 | |
| | | | |
Financial leases | | | 20,584 | |
| | | | |
TOTAL | | COP | 225,156158,380 | |
However, modifications of loans that are both, past due 120 or more days and are classified as TDRs, do not have a significant impact on the allowance for loan and financial lease losses. Further charge-offs of these loans are not required at the time of modification.
NOTE 20. PROVISIONS AND CONTINGENTS LIABILITIES
Purchases of financing receivables
In 2012, the Bank purchased assets from Titularizadora Colombiana for COP 137,056. which were performing loans and financial leases classified in a category A or “Normal Risk”.
Sales of financing receivables
In 2012, the Bank sold residential mortgage loans to Titularizadora Colombiana for COP 413,526. The Bank recognized a gain on sale of COP 12,479.
| f) | Loan origination fees and costs |
Under Colombian banking GAAP, the Bank recognizes commissions (origination fees) on loans, lines of credit and letters of credit when collected and records related direct costs when incurred. For U.S. GAAP, loan origination fees and certain direct loan origination costs are deferred and recognized over the life of the related loans as an adjustment of yield.
| g) | Interest recognition – non-accrual loans |
Under Colombian banking GAAP, the Bank established that commercial, consumer and small business loans that are past-due more than 30 days and residential mortgages that are past-due more than 60 days will stop accruing interest in the Consolidated Statement of Operations and their entries will be made in memorandum accounts until effective payment is collected.
Under U.S. GAAP based on general banking practices for all of our classes of financing receivables, including impaired loans, the accrual of interest income is discontinued once a loan becomes more than 90 days past-due. While the loan is on non-accrual status, interest is generally recognized as income on a cash basis, unless collection of principal is doubtful, in which case, cash collections are applied against the unpaid principal balance. A loan in non-accrual status is returned to accrual when all the past-due balance has been collected.
For Colombian banking GAAP purposes, the Bank has deferred certain pre-operating expenses, and other charges, which are expensed as incurred under U.S. GAAP.
Under Colombian banking GAAP, the cost of issuance of bonds issued before 2012 are recorded by the Bank as a deferred charge and amortized on a monthly basis over a term of three years. However, since 2012 this deferred charge had been amortizedusing the straight-line method over the maturity period of issued bonds. Under U.S. GAAP, the cost of issuance of bonds must be amortized over the life of the bonds using the effective rate interest method.
Under Colombian banking GAAP, the payroll-related costs for employees who are directly associated with a software project are recorded by the Bank as an expense. Under U.S. GAAP the payroll-related costs are capitalized during the application development stage and amortized on a straight line since the beginning of the production stage.
Under Colombian banking GAAP, the Bank accounts for improvements on leased property in the Consolidated Statement of Operations as expenses. Under U.S. GAAP, leasehold improvements are recorded as a deferred charge and amortized on a monthly basis over the term of the lease.
Under Colombian banking GAAP, the interest costs that directly related to software development incurred during the Innova Project are recorded in the Bank’s Consolidated Statement of Operations. Under U.S. GAAP, the Bank has capitalized interest costs that are directly related to software development. The capitalized interest is amortized over a period of 36 months, which is considered its estimated useful life, from the date when the software begins to be used in the Bank´s operations.20.1 Provisions
The following table showstables show the adjustments for each item:detail of the provisions:
| | | Net Income | |
| | | December 31, 2012 | | | December 31, 2011 | | | December 31,2010 | |
| Items | | | | | | | | | | | | |
| | | | | | | | | | | | | |
| Leasehold improvements | | COP | 15,990 | | | COP | 9,793 | | | COP | 175 | |
| Interest Cost | | | 6,304 | | | | 9,338 | | | | 4,494 | |
| Payroll for employee’s directly associated with Innova project | | | (785 | ) | | | 12,656 | | | | 23,201 | |
| Discounts on issuance of long- term debt | | | (1,307 | ) | | | 2,442 | | | | 1,634 | |
| Other | | | 10,433 | | | | (10,257 | ) | | | 5,507 | |
| Total | | COP | 30,635 | | | COP | 23,972 | | | COP | 35,011 | |
| | | As of December 31, 2015 | |
| | | Judicial
proceedings | | | Administrative
proceedings | | | Financial
Guarantees | | | Total | |
| | | In millions of COP | |
| Initial balance at January 1, 2015 | | | 21,998 | | | | 63,480 | | | | 5,029 | | | | 90,507 | |
| Additions recognized in the period | | | 10,948 | | | | 26,376 | | | | 113,843 | | | | 151,167 | |
| Provisions used during the period | | | (4,320 | ) | | | (59,809 | ) | | | - | | | | (64,129 | ) |
| Provisions reversed during the period | | | (10,524 | ) | | | (29,721 | ) | | | (66,152 | ) | | | (106,397 | ) |
| Liabilities relating to assets held for sale | | | (208 | ) | | | - | | | | - | | | | (208 | ) |
| Acquisition of Grupo Agromercantil Holding | | | - | | | | 10 | | | | - | | | | 10 | |
| Foreign currency translation adjustment | | | 963 | | | | - | | | | - | | | | 963 | |
| Effect of discounted cash flows | | | 290 | | | | - | | | | - | | | | 290 | |
| Final balance at December 31, 2015 | | | 19,147 | | | | 336 | | | | 52,720 | | | | 72,203 | |
| | | Stockholders’ equity | |
| | | December 31, 2012 | | | December 31, 2011 | |
| Items | | | | | | | | |
| | | | | | | | | |
| Leasehold improvements | | COP | 35,795 | | | COP | 19,805 | |
| Interest Cost | | | 26,311 | | | | 20,007 | |
| Payroll for employee’s directly associated with Innova project | | | 49,668 | | | | 50,453 | |
| Discounts on issuance of long- term debt | | | 7,930 | | | | 9,237 | |
| Other | | | (1,980 | ) | | | (12,413 | ) |
| Total | | COP | 117,724 | | | COP | 87,089 | |
| i) | Investment securities and derivatives |
| | | As of December 31, 2014 | |
| | | Judicial
proceedings | | | Administrative
proceedings | | | Financial
Guarantees | | | Total | |
| | | In millions of COP | |
| Initial balance at January 1, 2014 | | | 23,669 | | | | 54,993 | | | | 18,497 | | | | 97,159 | |
| Additions recognized in the period | | | 3,217 | | | | 37,520 | | | | 19,918 | | | | 60,655 | |
| Provisions used during the period | | | (5,875 | ) | | | - | | | | - | | | | (5,875 | ) |
| Provisions reversed during the period | | | (54 | ) | | | (28,821 | ) | | | (33,386 | ) | | | (62,261 | ) |
| Foreign currency translation adjustment | | | 985 | | | | - | | | | - | | | | 985 | |
| Effect of discounted cash flows | | | 56 | | | | (212 | ) | | | - | | | | (156 | ) |
| Final balance at December 31, 2014 | | | 21,998 | | | | 63,480 | | | | 5,029 | | | | 90,507 | |
The table below provides details regarding the differences in investment securities and derivatives between Colombian banking GAAP and U.S. GAAP:
| Consolidated net income | | 2012 | | | 2011 | | | 2010 | |
| | | | | | | | | | |
| Fair value adjustment on trading securities | | COP | 5,517 | | | COP | (14,450 | ) | | COP | (2,498 | ) |
| Reserve of (Recovery of allowance) allowance for losses under Colombian banking GAAP | | | (21,823 | ) | | | (5,122 | ) | | | 34,110 | |
| Foreign exchange gains or losses on available for sale debt securities recognized in the statement of operations | | | 7,336 | | | | (5,578 | ) | | | 5,491 | |
| Fair value adjustment on derivative instruments | | | 32,559 | | | | (24,037 | ) | | | (25,886 | ) |
| Consolidation of VIEs | | | (72,798 | ) | | | (79,516 | ) | | | (54,655 | ) |
| Total | | COP | (49,209 | ) | | COP | (128,703 | ) | | COP | (43,438 | ) |
| | | | | | | | | | | | | |
| Consolidated stockholders' equity | | | | | | 2012 | | 2011 |
| | | | | | | | | | | | | |
| Fair value adjustment on trading securities | | | | | | COP | (99 | ) | | COP | (13,743 | ) |
| Fair value adjustment on available for sale securities | | | | | | | (2,237 | ) | | | (8,651 | ) |
| Impairment losses reversed | | | | | | | 7,165 | | | | 28,988 | |
| Change in classification of held to maturity to available for sale securities | | | | | | | (43,654 | ) | | | (46,798 | ) |
| Fair value adjustment on derivative instruments | | | | | | | (21,918 | ) | | | (54,477 | ) |
| Consolidation of VIEs | | | | | | | (465,677 | ) | | | (389,592 | ) |
| Total | | | | | | COP | (526,420 | ) | | COP | (484,273 | ) |
Fair value adjustmenton trading and available for sale investment securities
Under Colombian banking GAAP, some debt securities classified as either trading or available for sale are not recognized at fair value, but are recognized at amortized cost using a discounted cash flow methodology. Under U.S. GAAP such debt securities are also classified as either trading or available for sale and are measured at fair value.
Therefore, the Bank calculates the difference between the carrying amount of such securities under Colombian banking GAAP and the fair value under U.S. GAAP and recognizes the accumulated difference as part of the Reconciliation of Stockholders’ Equity and the difference from the period as part of the Reconciliation of Consolidated Net Income, or in Other Accumulated Comprehensive Income, for trading securities and available for sale securities, respectively.
Classification of securities as held to maturityJudicial proceedings
The classificationjudicial provisions refer to pending legal proceedings on employment matters, ordinary lawsuits, class actions suits, civil actions within criminal prosecutions and executive proceedings against the Bank. In the opinion of debt and equity securities under Colombian banking GAAP and U.S. GAAP is similar. However, if there is an exchange offer of securities issuedmanagement, after receiving pertinent legal advice, the payments that will be made by these processes will not generate significant losses in addition to the Colombian government, sales or exchanges of such securities are allowed under Colombian banking GAAP regardless of being initially classified as held to maturity. Consequently under U.S. GAAP, as the Bank does not have a definitive intent to hold those securities to maturity, they are reclassified as available for sale securities.
Foreign exchange gains and losses on securities available for sale
Under Colombian banking GAAP, changes in the fair value as a result of changes in foreign currency exchange rates on available for sale debt securities are reflected in the Consolidated Statements of Operations. Under U.S. GAAP, those changes are reflected in other comprehensive income (OCI).
Impairment of investments
For both Colombian and U.S. GAAP purposes, the Bank conducts regular reviews to assess whether the recognition of an impairment loss is required.
Under Colombian banking GAAP, the Bank reviews the ratings issued by international rating agencies, and if any security in its portfolio has been classified below B, the Bank applies “the maximum registered amount” methodology established by the SFC, as follows:
Rating | Maximum registered
amount – percentage rate |
| |
BB+, BB, BB- | Ninety (90) |
B+, B, B- | Seventy (70) |
CCC | Fifty (50) |
DD, EE | Zero (0) |
If the carrying amount is higher than the maximum registered amount (calculated as the product of the security’s face value net of amortization multiplied by the corresponding percentage rate), an impairment loss equivalent to such difference isprovisions recognized immediately in the Statement of Operations.
As an example, for a Eurobond issued by the government of El Salvador with a face value of USD 100,000, a credit rating of BB as of December 31, 20122015. The Bank does not expect to obtain any kind of reimbursement from judicial proceedings raised against it and, a carrying amount (fair value) of USD 140,000, an impairment loss of USD 50,000 would betherefore, has not recognized under Colombian banking GAAP [140,000 – (100,000 x 90%)].any assets for that purpose.
As a consequence of this procedure, under Colombian banking GAAP, the Bank has recognized valuation allowance for debt securities amounting to COP 14,159 and COP 16,854, as of December 31, 2012 and 2011, respectively. Changes in valuation allowances for debt securities are recorded in the Consolidated Statement of Operations as incurred.F-98
Under U.S. GAAP, we would not recognize any impairment as the fair value is higher than the amortized cost. Consequently, as of December 31, 2012 and 2011, the Bank has reversed allowances amounting to COP 11,148 and COP 9,896 respectively.
During 2012, under Colombian banking GAAP, the Bank has reversed COP 1,253 of valuation allowances. For U.S. GAAP purposes, valuation allowances are not allowed to be reversed.
Under U.S. GAAP, an available for sale or held to maturity security is impaired if the fair value is below its cost and it will be recognized in the Statement of Operations if it is considered to be an Other Than Temporary Impairment (“OTTI”).
For U.S. GAAP purposes, the Bank considers a number of factors in performing an impairment analysis of securities. Those factors include:
a. the length of time and the extent to which the market value of the security has been less than cost;
b. the financial condition and near-term prospects of the issuer, including any specific events which may influence the operations of the issuer (such as changes in technology that may impair the earnings potential of the investment, or the discontinuance of a segment of a business that may affect the future earnings potential); and
c. the intent and ability of the Bank to retain its investment in the issuer for a period of time that allows for any anticipated recovery in market value. The Bank evaluates the intention to sell an impaired debt security and the likelihood that it will be required to sell the debt security before the recovery of its amortized cost.Administrative proceedings
The Bank also takes into account changes in global and regional economic conditions and changesconstituted provisions correspond to proceedings related to specific issuers or industries that could adversely affect these values.
For debt securities, when the Bank intends to sell an impaired debt security or it is more likely than not it will be required to sell prior to recovery of its amortized cost basis, an OTTI is deemed to have occurred. In these instances, the OTTI loss is recognized in earnings equal to the entire difference between the debt security’s amortized cost basis and its fair value at the balance sheet date.
Otherwise, when the Bank does not intend to sell an impaired debt security and it is not more likely than not it will be required to sell prior to recovery of its amortized cost basis, the Bank determines whether it will recover its amortized cost basis. If it concludes it will not, a credit loss exists and the resulting OTTI is separated into the amount representing the credit loss, which is recognized in earnings, and the amount related to all other factors, which is recognized in other comprehensive income (OCI). The total OTTI (difference between the fair value and the amortized cost of the debt security) is presented in the Statement of Operations with an offset in a separate line item for any amount of the total OTTI that is recognized in OCI.
For U.S. GAAP purposes, the Bank determined that the impairment recognized under Colombian banking GAAP for debt securities rated as B or higher was not other than temporary.
The substantial majority of the investments in an unrealized loss position for 12 months or more are primarily mandatory securities issued or secured by the Colombian Government, denominated in pesos and Unidad de Valor Real (the “Real Value Unit” or “UVR”). These securities were issued with a fixed interest rate and average maturity of less than eight years. The Bank has determined that most of the unrealized losses on investments at December 31, 2012 are temporary in nature because it does not intend to sell an impaired debt security and it is not more likely than not it will be required to sell the debt security before the recovery of its amortized cost and expects to recover the entire amortized cost basis of the securities. The Bank has the ability and intent to hold these securities for a period of time sufficient to recover all gross unrealized losses.
For certain mortgage backed securities (“TIPS”) in an unrealized loss position for more than 12 months, the Bank has recognized other-than temporary impairment amounting to COP 6,115. The recognition of OTTI is based on a range of factors, including the credit ratings of the issuer and specific events such as the estimated prepayment speed and default rate of the underlying assets that collateralize the debt security. During 2012, OTTI recognized for corporate debt securities amounted to COP 247. Based on the same factors described above,tax for the years ending at December 31, 20112006 and 2010, the Bank has recognized OTTI under U.S. GAAP amounted to COP 6,357 and COP 10,358.
As of December 31, 2012 and 2011, 423 and 584 investment securities presented gross unrealized losses, respectively.
Fair value adjustment on derivatives instruments
Fair value measurement of derivative instruments under Colombian banking GAAP is similar to U.S. GAAP, except that under Colombian banking GAAP performance risk is not considered in the determination of the fair value. Likewise, the day one fair value of a swap instrument under Colombian banking GAAP is deferred and amortized on a straight line basis over the life of the instrument. Under U.S. GAAP, all the changes in the fair value of trading derivatives are recognized in the Statement of Operations. Counterparty credit-risk adjustments are applied to derivatives when the Bank’s position is a derivative asset2008, and the Bank’s credit risk is incorporated when the position is a derivative liability.
Consolidation of VIEs
In 2008, the Bank and Suramericana Group, created Fondo de Capital Privado Colombia Inmobiliaria (the “Fund”), with the purpose of investing in real estate property. As a result, during the years 2008 and 2009 Suramericana Group transferred to the Fund real estate property amounting COP 36,840.
Under Colombian banking GAAP, the interests in participations of funds are classified as trading or available for sale equity securities. Interest in the funds in the amount of COP 268,701 and COP 242,138 were classified as trading as of December 31, 2012 and 2011, respectively. Furthermore, under Colombian banking GAAP there is no specific guidance for consolidation of variable interest entities and therefore, the consolidation analysis is based solely on the voting rights concept, under which the condition for a controlling financial interest, is ownership of over 50% of the outstanding voting shares.
During 2009, the Bank ceased consolidating the Fund under Colombian banking GAAP due to the entrance of other investors that decreased the Bank’s voting shares in the Fund below 50%.
Under U.S. GAAP as of December 31, 2012 and 2011, the Bank has identified the Fund as a variable interest entity because the only holder of equity investment at risk lacks the direct or indirect ability through voting rights or similar rights to make decisions about the Fund's activities that have a significant effect on the success of the Fund. The Bank is identified as the primary beneficiary because it has the power to direct the activities of the Fund that most significantly impact the Fund’s economic performance and receive benefits or absorb losses that could potentially be significant to the VIE. For this reason, assets of the Fund, as well as its liabilities and results of operations were included in the consolidated financial statements of the Bank as of December 31, 2012 and 2011. The Bank recognizes a non-controlling interest in the amount of COP 132,413 and COP 136,920 at December 31, 2012 and 2011, respectively.
The table below presents a summary of the assets and liabilities of the Fund under U.S. GAAP consolidated by the Bank as of December 31, 2012 and 2011:
| | | 2012 | | | 2011 | | | | | 2012 | | | 2011 | |
| Assets | | | | | | | | | | Liabilities | | | | | | | | |
| Premises and equipments, net | | COP | 338,020 | | | COP | 301,940 | | | Other liabilities | | COP | 14,240 | | | COP | 72,740 | |
| Other assets | | | 107,380 | | | | 100,375 | | | Non-controlling interest | | | 132,413 | | | | 136,920 | |
| | | | | | | | | | | Stockholders’ equity | | | 298,747 | | | | 192,655 | |
| | | COP | 445,400 | | | COP | 402,315 | | | | | COP | 445,400 | | | COP | 402,315 | |
Additional disclosures for investment securities under U.S. GAAP
The carrying amounts, gross unrealized gains and losses and approximate fair value of debt securities classified as available for sale under U.S. GAAP are shown below:
| | | | | | Gross | | | Gross | | | | |
| | | | | | unrealized | | | unrealized | | | Cost | |
| | | Fair value | | | gains | | | losses | | | basis | |
| | | | | | | | | | | | | |
| Available for sale - Debt securities | | | | | | | | | | | | | | | | |
| December 31, 2012 | | | | | | | | | | | | | | | | |
| Securities issued or secured by Colombian government | | COP | 404,212 | | | COP | 2,678 | | | COP | (30,472 | ) | | COP | 432,006 | |
| Securities issued or secured by government entities | | | 1,233,815 | | | | 5 | | | | (15,320 | ) | | | 1,249,130 | |
| Securities issued or secured by other financial entities | | | 965,562 | | | | 20,780 | | | | (20,689 | ) | | | 965,471 | |
| Securities issued or secured by foreign governments | | | 583,331 | | | | 4,730 | | | | (458 | ) | | | 579,059 | |
| Securities issued or secured by the El Salvador Central Bank | | | 582,309 | | | | 103 | | | | (131 | ) | | | 582,337 | |
| Other investments | | | 131,843 | | | | 9,273 | | | | (111 | ) | | | 122,681 | |
| Total | | COP | 3,901,072 | | | COP | 37,569 | | | COP | (67,181 | ) | | COP | 3,930,684 | |
| | | | | | Gross | | | Gross | | | | |
| | | | | | unrealized | | | unrealized | | | Cost | |
| | | Fair value | | | gains | | | losses | | | basis | |
| | | | | | | | | | | | | |
| Available for sale - Debt securities | | | | | | | | | | | | | | | | |
| December 31, 2011 | | | | | | | | | | | | | | | | |
| Securities issued or secured by Colombian government | | COP | 559,830 | | | COP | 7,217 | | | COP | (21,527 | ) | | COP | 574,140 | |
| Securities issued or secured by government entities | | | 1,142,207 | | | | 11 | | | | (17,489 | ) | | | 1,159,685 | |
| Securities issued or secured by other financial entities | | | 852,651 | | | | 4,221 | | | | (24,321 | ) | | | 872,751 | |
| Securities issued or secured by foreign governments | | | 489,062 | | | | 1,596 | | | | (2,926 | ) | | | 490,392 | |
| Securities issued or secured by the El Salvador Central Bank | | | 685,722 | | | | 210 | | | | (273 | ) | | | 685,785 | |
| Other investments | | | 228,714 | | | | 10,340 | | | | (1,977 | ) | | | 220,351 | |
| Total | | COP | 3,958,186 | | | COP | 23,595 | | | COP | (68,513 | ) | | COP | 4,003,104 | |
| | | | | | Gross | | | Gross | | | | |
| | | | | | unrealized | | | unrealized | | | Cost | |
| | | Fair value | | | gains | | | losses | | | basis | |
| | | | | | | | | | | | | |
| Available for sale – Equity securities | | | | | | | | | | | | | | | | |
| December 31, 2012 | | | | | | | | | | | | | | | | |
| Inmobiliaria Cadenalco | | COP | 5,250 | | | COP | 2,759 | | | COP | - | | | COP | 2,491 | |
| Grupo Odinsa | | | 198,032 | | | | 86 | | | | - | | | | 197,946 | |
| Bolsa de Valores de Colombia | | | 16,133 | | | | 2,576 | | | | - | | | | 13,557 | |
| Enka de Colombia | | | 5,615 | | | | - | | | | (3,909 | ) | | | 9,524 | |
| Construcciones El Condor | | | 3,885 | | | | - | | | | - | | | | 3,885 | |
| Bladex | | | 2,833 | | | | 1,115 | | | | - | | | | 1,718 | |
| Total | | COP | 231,748 | | | COP | 6,536 | | | COP | (3,909 | ) | | COP | 229,121 | |
| | | | | | Gross | | | Gross | | | | |
| | | | | | unrealized | | | unrealized | | | Cost | |
| | | Fair value | | | gains | | | losses | | | basis | |
| | | | | | | | | | | | | |
| Available for sale – Equity securities | | | | | | | | | | | | | | | | |
| December 31, 2011 | | | | | | | | | | | | | | | | |
| Inmobiliaria Cadenalco | | COP | 5,150 | | | COP | 2,659 | | | COP | - | | | COP | 2,491 | |
| Grupo Odinsa | | | 186,949 | | | | - | | | | (3,567 | ) | | | 190,516 | |
| Bolsa de Valores de Colombia(1) | | | 14,558 | | | | 898 | | | | - | | | | 13,660 | |
| Enka de Colombia | | | 6,244 | | | | - | | | | (3,280 | ) | | | 9,524 | |
| Total | | COP | 212,901 | | | COP | 3,557 | | | COP | (6,847 | ) | | COP | 216,191 | |
(1) As a result of reclassification of a part of these equity securities from available for sale to trading, an unrealized gain of COP 26,631 was recognized during 2011.
The scheduled maturities of available for sale debt securities under U.S. GAAP as of December 31, 2012 were as follows:
| | | Available for sale | |
| | | Amortized | | | Fair | |
| | | cost | | | value | |
| | | | | | | |
| Due in one year or less | | COP | 2,391,706 | | | COP | 2,373,032 | |
| Due from one year to five years | | | 556,043 | | | | 540,410 | |
| Due from five years to ten years | | | 638,148 | | | | 648,623 | |
| Due more than ten years | | | 344,787 | | | | 339,007 | |
| Total | | COP | 3,930,684 | | | COP | 3,901,072 | |
Unrealized Losses Disclosure
Investments that have been in a continuous unrealized loss position for less than 12 as of December 31, 2012, months are as follow:
| | | | | | Gross | | | | |
| | | | | | unrealized | | | Cost | |
| | | Fair value | | | losses | | | basis | |
| | | | | | | | | | |
| Available for Sale Debt securities | | | | | | | | | | | | |
| Securities issued or secured by Colombian government | | COP | 11,360 | | | COP | (71 | ) | | COP | 11,431 | |
| Securities issued or secured by government entities | | | 1,233,697 | | | | (15,320 | ) | | | 1,249,017 | |
| Securities issued or secured by other financial entities | | | 160,907 | | | | (17,101 | ) | | | 178,008 | |
| Securities issued or secured by foreign governments | | | 130,377 | | | | (457 | ) | | | 130,834 | |
| Securities issued or secured by the El Salvador Central Bank | | | 513,252 | | | | (131 | ) | | | 513,383 | |
| Other investments | | | 7,572 | | | | (111 | ) | | | 7,683 | |
| Total | | COP | 2,057,165 | | | COP | (33,191 | ) | | COP | 2,090,356 | |
Investments that have been in a continuous unrealized loss position for 12 months or longer are as follows:
| | | | | | Gross | | | | |
| | | | | | unrealized | | | Cost | |
| | | Fair value | | | losses | | | basis | |
| | | | | | | | | | |
| Available for Sale Debt securities | | | | | | | | | | | | |
| Securities issued or secured by Colombian government | | COP | 340,605 | | | COP | (30,401 | ) | | COP | 371,006 | |
| Securities issued or secured by other financial entities | | | 116,983 | | | | (3,589 | ) | | | 120,572 | |
| Total | | COP | 457,588 | | | COP | (33,990 | ) | | COP | 491,578 | |
| | | | | | Gross | | | | |
| | | | | | unrealized | | | Cost | |
| | | Fair value | | | losses | | | basis | |
| Available for sale – Equity securities | | | | | | | | | |
| Enka de Colombia | | | 5,615 | | | | (3,909 | ) | | | 9,524 | |
| Total | | COP | 5,615 | | | COP | (3,909 | ) | | COP | 9,524 | |
Concentrations of credit risk exist when changes in economic, industry or geographic factors similarly affect groups of counterparties whose aggregate credit exposure is material in relation to the Bank´s total credit exposure. The Bank is principally a retail prime lender and has no intention or product offering for any type of sub-prime business. The Bank invests primarily in sovereign debt securities, asset backed securities, and substantially mortgage backed securities in which the loans underlying the portfolios are issued by the Bank and also other banks in Colombia.
The tables below present the Bank’s debt securities investment portfolio, by geographic location of the issuer:
| | | Colombia | | | El Salvador | | | Brazil | | | Chile | | | United States | | | Others | |
| | | | | | | | | | | | | | | | | | | | | | | | | |
| December 31, 2012 | | | | | | | | | | | | | | | | | | | | | | | | |
| Securities issued or secured by Colombian government | | COP | 6,165,857 | | | COP | - | | | COP | - | | | COP | - | | | COP | - | | | COP | - | |
| Securities issued or secured by government entities | | | 1,263,249 | | | | 118 | | | | - | | | | - | | | | - | | | | - | |
| Securities issued or secured by other financial entities | | | 1,078,189 | | | | 4,947 | | | | 144,032 | | | | 41,371 | | | | - | | | | 119,194 | |
| Securities issued or secured by foreign governments | | | 48,629 | | | | 403,437 | | | | 78,015 | | | | 76,235 | | | | 52,895 | | | | 48,390 | |
| Securities issued or secured by the El Salvador Central Bank | | | - | | | | 582,309 | | | | - | | | | - | | | | - | | | | - | |
| Other investments | | | 197,355 | | | | - | | | | 47,616 | | | | 26,063 | | | | - | | | | 7,602 | |
| Total | | COP | 8,753,279 | | | COP | 990,811 | | | COP | 269,663 | | | COP | 143,669 | | | COP | 52,895 | | | COP | 175,186 | |
| | | Colombia | | | El Salvador | | | Brazil | | | Chile | | | United States | | | Others | |
| | | | | | | | | | | | | | | | | | | | | | | | | |
| December 31, 2011 | | | | | | | | | | | | | | | | | | | | | | | | |
| Securities issued or secured by Colombian government | | COP | 3,585,567 | | | COP | - | | | COP | - | | | COP | - | | | COP | - | | | COP | - | |
| Securities issued or secured by government entities | | | 1,173,947 | | | | 187 | | | | - | | | | - | | | | - | | | | - | |
| Securities issued or secured by other financial entities | | | 1,125,872 | | | | 35,023 | | | | 79,530 | | | | 72,352 | | | | 5,122 | | | | 87,837 | |
| Securities issued or secured by foreign governments | | | - | | | | 309,608 | | | | 45,736 | | | | 170 | | | | 113,335 | | | | 21,600 | |
| Securities issued or secured by the El Salvador Central Bank | | | - | | | | 685,722 | | | | - | | | | - | | | | - | | | | - | |
| Other investments | | | 89,824 | | | | 30,165 | | | | 44,817 | | | | 22,216 | | | | 1,997 | | | | 109,644 | |
| Total | | COP | 5,975,210 | | | COP | 1,060,705 | | | COP | 170,083 | | | COP | 94,738 | | | COP | 120,454 | | | COP | 219,081 | |
Additional disclosures for derivatives instruments under U.S. GAAP
The tables below present the financial position of the derivatives contracts as of December 31, 2012 and 2011 and their gain and loss recognized in the Consolidated Statement of Operations as well as the notional amounts of derivatives contracts:
| | | Asset | | Liability |
| | | 2012 | | 2011 | | 2012 | | 2011 |
Derivatives not designated as
hedging instruments | | Balance sheet
location | | Fair Value | | | Balance sheet
location | | Fair Value | | | Balance sheet
location | | Fair Value | | | Balance sheet
location | | Fair Value | |
| | | |
| Interest rate contracts | | Other assets | | COP | 134,897 | | | Other assets | | COP | 133.929 | | | Other liability | | COP | (67,213 | ) | | Other liability | | COP | (49,928 | ) |
| Foreign exchange contracts | | Other assets | | | 570,920 | | | Other assets | | | 517,330 | | | Other liability | | | (503,151 | ) | | Other liability | | | (428,509 | ) |
| TOTAL | | | | COP | 705,817 | | | | | COP | 651,259 | | | | | COP | (570,364 | ) | | | | COP | (478,437 | ) |
| | | 2012 | | | 2011 | |
| Collateral | | COP | 103,508 | | | COP | 133,400 | |
| | | 2012 | | | 2011 | |
Derivatives not designated as
hedging instruments | | Amount of gain or (loss) recognized in income on
derivative | |
| | | | | | | |
| Interest rate contracts | | COP | (3,487 | ) | | COP | 71,739 | |
| Foreign exchange contracts | | | 41,515 | | | | (38,496 | ) |
| Other contracts | | | 90 | | | | 129 | |
| | | COP | 38,118 | | | COP | 33,372 | |
| | | 2012 | | | 2011 | |
Derivatives not designated as
hedging instruments | | Notional amounts as of
December 31 | |
| | | | | | | |
| Interest rate contracts | | COP | 10,080,312 | | | COP | 5,490,374 | |
| Foreign exchange contracts | | | 17,826,897 | | | | 18,278,583 | |
| | | COP | 27,907,209 | | | COP | 23,768,957 | |
| j) | Dividends received from Investments in unaffiliated companies. |
Under Colombian banking GAAP, stock dividends are recorded as income; under U.S. GAAP, dividends received in the form of additional shares of common stock are not recorded as income. Instead, the costs of the shares previously held are allocated equitably to the total shares held after receipt of the stock dividend. When any shares are later disposed of, a gain or loss is determined on the basis of the adjusted cost per share.
During the year ended December 31, 2012 stock dividends received amounted to COP 7,045, and consequently the Bank’s results of operations under U.S. GAAP have been affected by this amount. The stockholder’s equity adjustment under U.S. GAAP was COP (25,054) and COP (18,009) as of December 31, 2012 and 2011 respectively.
| k) | Investments in affiliates. |
Under Colombian banking GAAP, investments in affiliates where the investor has the ability to exercise significant influence are recorded at cost and classified as available for sale.
The difference between the cost and equity participation is recorded as reappraisal of assets in assets and stockholders’ equity. This reappraisal is reversed for U.S. GAAP purposes.
Under U.S. GAAP, investments where the investor has the ability to exercise significant influence are recorded using the equity method. The following table sets forth the adjustment recognized under U.S. GAAP due to the application of the equity methodtax for the year ended December 31:2011. Most of the subsidiaries with these types of provisions settled them during the year 2015.
Consolidated net incomeFinancial guarantees
| Equity Securities | | 2012 | | | 2011 | | | 2010 | |
| | | | | | | | | | |
| Planeco S.C. | | COP | (553 | ) | | COP | (767 | ) | | COP | (605 | ) |
| Reintegra S.A.S. | | | 596 | | | | 884 | | | | 753 | |
| Inversiones Inmobiliarias Arauco Alameda S.A.S. | | | (1,673 | ) | | | 747 | | | | (2,440 | ) |
| Materiales Industriales S.A. | | | (578 | ) | | | (451 | ) | | | 13 | |
| Erecos S.A. | | | (796 | ) | | | (2,205 | ) | | | (941 | ) |
| Concesiones Urbanas S.A. | | | 204 | | | | (350 | ) | | | (1,237 | ) |
| Servicios Financieros S.A. de C.V. | | | 370 | | | | (52 | ) | | | (179 | ) |
| Concesiones CCFC S.A. | | | 339 | | | | 1,708 | | | | (2,214 | ) |
| Protección S.A. | | | 270 | | | | 11,698 | | | | 17,659 | |
| Servicio Salvadoreño de Protección, S.A. de C.V. | | | 247 | | | | 104 | | | | (473 | ) |
| ACH El Salvador | | | 55 | | | | (237 | ) | | | - | |
| Titularizadora Colombiana S.A. | | | 143 | | | | (437 | ) | | | 985 | |
| Multiactivos S.A. | | | 87 | | | | 1,698 | | | | - | |
| Redeban Multicolor S.A. | | | 7,937 | | | | (906 | ) | | | 992 | |
| ACH Colombia S.A. | | | 81 | | | | (603 | ) | | | 322 | |
| Todo 1 Service Inc(1) | | | - | | | | (4,930 | ) | | | (1,102 | ) |
| Metrotel Redes S.A.(2) | | | - | | | | - | | | | (5,829 | ) |
| | | COP | 6,729 | | | COP | 5,901 | | | COP | 5,704 | |
| (1) | In August 2012, the Bank’s subsidiary, Sistema de Inversiones y Negocios S.A. (“SINESA”) sold its 47.72% participation in Todo1 Services Inc. |
| (2) | In 2010, Banca de Inversión, the Bank's investment banking unit disposed of its investment in its Metrotel Redes investment. As of December 31, 2009 the equity interest was 28.42%. |
Consolidated Stockholder’s Equity
| Equity Securities | | Equity
interest(3) | | | 2012(1) | | | 2011(1) | |
| | | | | | | | | | |
| Planeco S.C. | | | 50.00 | % | | COP | (467 | ) | | COP | 94 | |
| Todo 1 Service Inc(2) | | | 0.00 | % | | | - | | | | - | |
| Reintegra S.A.S. | | | 46.00 | % | | | 2,233 | | | | 1,637 | |
| Inversiones Inmobiliarias Arauco Alameda S.A.S. | | | 33.68 | % | | | (3,364 | ) | | | (1,693 | ) |
| Materiales Industriales S.A. | | | 33.77 | % | | | 2,220 | | | | 2,798 | |
| Erecos S.A. | | | 33.76 | % | | | 1,897 | | | | 2,692 | |
| Concesiones Urbanas S.A. | | | 33.34 | % | | | 4,086 | | | | 3,882 | |
| Servicios Financieros S.A. de C.V. | | | 46.71 | % | | | (146 | ) | | | (384 | ) |
| Concesiones CCFC S.A. | | | 25.50 | % | | | 5,346 | | | | 5,007 | |
| Protección S.A. | | | 20.58 | % | | | 92,640 | | | | 92,373 | |
| Servicio Salvadoreño de Protección, S.A. de C.V. | | | 24.40 | % | | | 324 | | | | 481 | |
| ACH El Salvador | | | 24.40 | % | | | (203 | ) | | | (236 | ) |
| Titularizadora Colombiana S.A. | | | 21.25 | % | | | 12,360 | | | | 12,217 | |
| Multiactivos S.A. | | | 21.25 | % | | | 1,785 | | | | 1,698 | |
| Redeban Multicolor S.A. | | | 20.36 | % | | | 15,231 | | | | 7,294 | |
| ACH Colombia S.A. | | | 19.94 | % | | | 2,550 | | | | 2,469 | |
| | | | | | | COP | 136,492 | | | COP | 130,329 | |
| (1) | The adjustment includes other comprehensive income for an amount of COP (566) and COP 103 for 2012 and 2011 respectively. |
| (2) | In August 2012, the Bank’s subsidiary, Sistema de Inversiones y Negocios S.A. (“SINESA”), sold its 47.72% participation in Todo1 Services Inc. |
| (3) | Changes in the equity interest are explained in Note 5. “Investment Securities”. |
Certain of the Bank’s subsidiaries lease assets to third parties under non-cancelable lease arrangements. These lease arrangements involve machinery and equipment, computer equipment, automobile and furniture and fixtures and their terms range between three and five years.
Under Colombian banking GAAP, for financial entities, leases are classified as either financial leases or operating leases, according to the terms of the lease agreements. Assets provided through leases to third parties with a purchase option are recorded in the loan portfolio. Assets provided through operating leases are recorded as property, plant and equipment. For both types of leases, their initial measurement represents the value to be financed of the assets to be leased (that is, the acquisition or construction cost). A leasehold improvement is capitalized when it represents a permanent improvement or betterment that increases the usefulness of the leased asset, and represents a greater value of the lease operation.
Under U.S. GAAP, from the lessor’s perspective, leases are classified as direct financing leases, sales-type leases, operating leases or leverage leases. Leases are classified as direct financing leases if certain criteria are met in the lease contract; otherwise they are classified as operating leases. The net investments in direct financing leases represent the present value of the minimum lease payments plus the unguaranteed residual value.
The adjustment under U.S. GAAP is related to certain leases signed by the Bank’s subsidiaries Renting Colombia and Leasing Bancolombia that are classified as operating leases under Colombian banking GAAP, but met the criteria to be classified as direct financing leases under U.S. GAAP.
The following lists the components of the net investment in direct financial leases under U.S. GAAP as of December 31, 2012 and 2011:
| | | 2012 | | | 2011 | |
| | | | | | | |
| Total minimum lease payments to be received | | COP | 12,879,707 | | | COP | 9,943,090 | |
| Less: Allowance for uncollectibles | | | (382,254 | ) | | | (318,971 | ) |
| Net minimum lease payments receivable | | | 12,497,453 | | | | 9,624,119 | |
| Estimated residual values of leased property | | | 873,699 | | | | 675,737 | |
| Less: Unearned income | | | (3,589,833 | ) | | | (2,698,471 | ) |
| Net investment in direct financing leases | | COP | 9,781,319 | | | COP | 7,601,385 | |
The following schedule shows the future minimum lease payments to be received under U.S. GAAP on direct financing leases and operating leases for each of the next five years and thereafter.
| Year Ended December 31, | | Direct Financing leases | | | Operating Leases | |
| 2013 | | COP | 619,475 | | | COP | 137,929 | |
| 2014 | | | 1,085,167 | | | | 108,667 | |
| 2015 | | | 1,556,888 | | | | 79,578 | |
| 2016 | | | 1,446,694 | | | | 51,249 | |
| 2017 | | | 1,788,325 | | | | 46,068 | |
| 2018 and later | | | 6,383,158 | | | | 117,912 | |
| Total minimum future lease payments to be received | | COP | 12,879,707 | | | COP | 541,403 | |
m) Business combinations
m.i) Purchase method of accounting
With regard to a business combination, the purchase method of accounting under Colombian banking GAAP requires that (i) the purchase price be allocated to the acquired assets and liabilities on the basis of their book value, (ii) the statement of income of the acquiring company for the period in which a business combination occurs include the income of the acquired company as if the acquisition had occurred on the first day of the reporting period and (iii) the costs directly related to the purchase business combination not be considered as a cost of the acquisition, but deferred and amortized over a reasonable period as determined by management.
The Banagrícola S.A. acquisition was accounted for using the purchase method under Colombian banking GAAP, in accordance with the methodology suggested by the SFC.
In regard to a business combination, the purchase method of accounting under U.S. GAAP requires that (i) the purchase price be allocated to the identifiable acquired assets and liabilities on the basis of fair market value, (ii) the statement of operations of the acquiring company for the period in which a business combination occurs include the income of the acquired company after the date of acquisition (iii) the acquirer accounts for acquisition-related costs as expenses in the periods in which the costs are incurred and the services are received, with one exception: the costs to issue debt or equity securities shall be recognized in accordance with other applicable GAAP.
m.ii) Goodwill
Under Colombian banking GAAP, goodwill derived from business combinations effective before October 2006, is amortized over a maximum period of ten years. For business combinations that occurred after October 2006, the resulting goodwill is amortized over a term of twenty (20) years, unless the entity voluntarily selects a shorter period of amortization using an exponential method. Under this method the charge for amortization is increased exponentially every year. However, the Bank, since January, 2008, has used the straight-line method to amortize goodwill, since the Bank considers this method provides a better association between the revenues and expenses corresponding to this investment.
Under Colombian banking GAAP, in the case of goodwill acquired by the Bank and its subsidiaries before the date when the new regulation came into full force in year 2007, the amortization term was maintained from three to ten years for goodwill recorded in the subsidiaries Banagrícola S.A. and Inversiones Financieras Banagrícola S.A., as permitted by the SFC at the acquisition date.
Under U.S. GAAP, the Bank does not amortize goodwill, but it is subject to an annual impairment test.
The goodwill impairment analysis is done in two steps. The first step requires a comparison of the fair value of the individual reporting unit to its carrying value including goodwill. If the fair value of the reporting unit is in excess of the carrying value, the related goodwill is considered not to be impaired and no further analysis is necessary. If the carrying value of the reporting unit exceeds the fair value, there is an indication of potential impairment and a second step of testing is performed to measure the amount of impairment, if any, for that reporting unit.
When required, the second step of testing involves calculating the implied fair value of goodwill for each of the affected reporting units. The implied fair value of goodwill is determined in the same manner as the amount of goodwill recognized in a business combination, which is the excess of the fair value of the reporting unit determined in step one over the fair value of the net assets and identifiable intangibles as if the reporting unit were being acquired. If the amount of the goodwill allocated to the reporting unit exceeds the implied fair value of the goodwill in thepro forma purchase price allocation, an impairment charge is recorded for the excess. An impairment charge recognized cannot exceed the amount of goodwill allocated to a reporting unit and cannot be reversed subsequently even if the fair value of the reporting unit recovers.
Under U.S. GAAP, the Bank annually has performed the required impairment test of each reporting segment’s goodwill. For December 31, 2012 and 2011, no impairment was recognized against goodwill. During 2009, the Bank concluded that there was an impairment of Factoring Bancolombia’s goodwill and recorded an impairtment charge for the excess over the fair value amounting to COP 7,787.
The changes in Goodwill by segment during 2012 and 2011 were as follows:
| | | Banking
Colombia | | | Banking El
Salvador | | | Leasing | | | Trust | | | Investments | | | Brokerage | | | Off Shore | | | All other
segments | | | Pension and
Insurance | | | Total | |
| Goodwill U.S. GAAP | | | | | | | | | | | | | | | | | | | | | | | | | | | | | | | | | | | | | | | | |
| Balance as of December 31, 2010 | | COP | 435,827 | | | COP | 568,065 | | | COP | 54,238 | | | COP | 2,493 | | | COP | 132,273 | | | COP | 43,722 | | | COP | 31,534 | | | COP | 1,330 | | | COP | - | | | COP | 1,269,482 | |
| Accumulated impairment losses | | | (7,787 | ) | | | - | | | | - | | | | - | | | | - | | | | - | | | | - | | | | - | | | | - | | | | (7,787 | ) |
| Balance as of January 1, 2011 | | | 428,040 | | | | 568,065 | | | | 54,238 | | | | 2,493 | | | | 132,273 | | | | 43,722 | | | | 31,534 | | | | 1,330 | | | | - | | | | 1,261,695 | |
| Additions | | | - | | | | 52 | | | | - | | | | - | | | | - | | | | - | | | | - | | | | - | | | | - | | | | 52 | |
| Foreign currency adjustment | | | - | | | | 8,672 | | | | - | | | | - | | | | - | | | | - | | | | - | | | | - | | | | - | | | | 8,672 | |
| Balance as of December 31, 2011 | | | 428,040 | | | | 576,789 | | | | 54,238 | | | | 2,493 | | | | 132,273 | | | | 43,722 | | | | 31,534 | | | | 1,330 | | | | - | | | | 1,270,419 | |
| Goodwill under Colombian banking GAAP | | | - | | | | 657,693 | | | | 3,924 | (1) | | | - | | | | - | | | | - | | | | - | | | | - | | | | 18,244 | | | | 679,861 | |
| Goodwill derecognized related to a disposal group classified as held for sale | | | - | | | | - | | | | - | | | | - | | | | - | | | | - | | | | - | | | | - | | | | 25,082 | | | | 25,082 | |
| Difference to be recognized under U.S. GAAP | | | 428,040 | | | | (80,904 | ) | | | 50,314 | | | | 2,493 | | | | 132,273 | | | | 43,722 | | | | 31,534 | | | | 1,330 | | | | 6,838 | | | | 615,640 | |
| Recognized in the Stockholders’ equity as: | | | | | | | | | | | | | | | | | | | | | | | | | | | | | | | | | | | | | | | | |
| Revaluation of assets | | | - | | | | - | | | | - | | | | - | | | | 166,138 | | | | - | | | | - | | | | - | | | | - | | | | 166,138 | |
| Goodwill | | COP | 428,040 | | | COP | (80,904 | ) | | COP | 50,314 | | | COP | 2,493 | | | COP | (33,865 | ) | | COP | 43,722 | | | COP | 31,534 | | | COP | 1,330 | | | COP | 6,838 | | | COP | 449,502 | |
| Goodwill U.S. GAAP | | | | | | | | | | | | | | | | | | | | | | | | | | | | | | | | | | | | | | | | |
| Balance as of December 31, 2011 | | COP | 435,827 | | | COP | 576,789 | | | COP | 54,238 | | | COP | 2,493 | | | COP | 132,273 | | | COP | 43,722 | | | COP | 31,534 | | | COP | 1,330 | | | COP | - | | | COP | 1,278,206 | |
| Accumulated impairment losses | | | (7,787 | ) | | | - | | | | - | | | | - | | | | - | | | | - | | | | - | | | | - | | | | - | | | | (7,787 | ) |
| Balance as of January 1, 2012 | | | 428,040 | | | | 576,789 | | | | 54,238 | | | | 2,493 | | | | 132,273 | | | | 43,722 | | | | 31,534 | | | | 1,330 | | | | - | | | | 1,270,419 | |
| Additions | | | - | | | | 21,995(2) | | | | - | | | | - | | | | - | | | | - | | | | - | | | | - | | | | - | | | | 21,995 | |
| Prior years adjustment | | | - | | | | - | | | | - | | | | - | | | | - | | | | - | | | | - | | | | - | | | | 6,838 | | | | 6,838 | |
| Foreign currency adjustment | | | - | | | | (52,957 | ) | | | - | | | | - | | | | - | | | | - | | | | - | | | | - | | | | - | | | | (52,957 | ) |
| Balance as of December 31, 2012 | | | 428,040 | | | | 545,827 | | | | 54,238 | | | | 2,493 | | | | 132,273 | | | | 43,722 | | | | 31,534 | | | | 1,330 | | | | 6,838 | | | | 1,246,295 | |
| Goodwill under Colombian GAAP | | | - | | | | 568,656 | | | | 2,717 | (1) | | | - | | | | - | | | | - | | | | - | | | | - | | | | - | | | | 571,373 | |
| Difference to be recognized under U.S. GAAP | | | 428,040 | | | | (22,829 | ) | | | 51,521 | | | | 2,493 | | | | 132,273 | | | | 43,722 | | | | 31,534 | | | | 1,330 | | | | 6,838 | | | | 674,922 | |
| Recognized in the Stockholders’ equity as: | | | | | | | | | | | | | | | | | | | | | | | | | | | | | | | | | | | | | | | | |
| Revaluation of assets | | | - | | | | - | | | | - | | | | - | | | | 165,993 | | | | - | | | | - | | | | - | | | | - | | | | 165,993 | |
| Goodwill | | COP | 428,040 | | | COP | (22,829 | ) | | COP | 51,521 | | | COP | 2,493 | | | COP | (33,720 | ) | | COP | 43,722 | | | COP | 31,534 | | | COP | 1,330 | | | COP | 6,838 | | | COP | 508,929 | |
| (1) | In March 2010, Leasing Bancolombia acquired 3,185,007 outstanding shares of Renting Colombia from Mitsubishi International Corporation and Mitsubishi Corporation. These shares formerly represented the non-controlling interest in Renting Colombia. The aggregate purchase price was COP 6,038. At December 31, 2012 and 2011, Bancolombia held an interest of 100% of Renting Colombia’s total stockholders’ equity. |
Under Colombian banking GAAP, the aggregate purchase was accounted for as goodwill by Leasing Bancolombia. Under U.S. GAAP, a subsequent adjustment by changes in the non-controlling interests’ share must be accounted for in equity.
| (2) | In August 2012, Banagrícola, a subsidiary of Bancolombia Panama, acquired 70% of Uff Móvil S.A.S. a telecommunications operator in Colombia. The transaction price was COP 21,000, a sum paid in full on the date of the transaction and the related goodwill of COP 21,995 was recognized. |
m.iii) Intangible Assets
Under Colombian banking GAAP, the purchase method of accounting allocates to goodwill all of the excess value of intangible and tangible assets paid derived from business combinations. Under U.S. GAAP fair values are assigned to acquired intangible assets, such as registered brands, deposits, customer relationship and others.
The activity of the Bank’s intangible assets during the years ended December 31, 2012, 2011 and 2010 is as follows:
| | | 2012 | | | 2011 | | | 2010 | |
| | | | | | | | | | |
| Intangible Assets | | | | | | | | | | | | |
| Balance at beginning of year | | COP | 168,031 | | | COP | 223,183 | | | COP | 369,234 | |
| Amortization | | | (30,937 | ) | | | (57,306 | ) | | | (58,559 | ) |
| Intangibles reclassified to assets held for sale (see Note 31, q - Discontinued operations) | | | - | | | | - | | | | (69,944 | ) |
| Foreign currency translation adjustment(1) (2) | | | (10,139 | ) | | | 2,154 | | | | (17,548 | ) |
| Balance at end of year | | COP | 126,955 | | | COP | 168,031 | | | COP | 223,183 | |
| (1) | As of December 31, 2012, the foreign currency translation adjustment for the amortization expense is COP 34,074. |
| (2) | As of December 31, 2012, the foreign currency translation adjustment for the carrying amount is COP 23,935. |
| | | 2012 | | | 2011 | |
| Difference recognized in stockholders equity under U.S. GAAP: | | | | | | | | |
| Intangibles under U.S. GAAP | | COP | 126,955 | | | COP | 168,031 | |
| Intangibles derecognized related to a disposal group classified as held for sale | | | - | | | | 31,714 | |
| Total Adjusment | | COP | 126,955 | | | COP | 199,745 | |
| | | 2012 | | | 2011 | | | 2010 | |
| Difference recognized in net income under U.S. GAAP: | | | | | | | | | | | | |
| Amortization of Intangibles under U.S. GAAP | | COP | (30,937 | ) | | COP | (57,306 | ) | | COP | (58,559 | ) |
| Sale of Aseguradora Suiza Salvadoreña | | | (28,868 | ) | | | - | | | | - | |
| Sale of AFP Crecer | | | - | | | | (39,278 | ) | | | - | |
| Total Adjusment | | COP | (59,805 | ) | | COP | (96,584 | ) | | COP | (58,559 | ) |
Intangible assets were as follows:
| | | December 31, 2012 | | | December 31, 2011 | |
| | | Gross carrying
amount | | | Accumulated
amortization | | | Impairment | | | Gross carrying
amount | | | Accumulated
amortization | | | Impairment | |
| | | | | | | | | | | | | | | | | | | |
| Amortizable intangible assets | | COP | 407,395 | | | COP | 280,440 | | | COP | - | | | COP | 431,333 | | | COP | 263,302 | | | COP | - | |
| Amortizable intangible related to a disposal group classified as held for sale | | | - | | | | - | | | | - | | | | 73,733 | | | | 42,019 | | | | - | |
| Total | | COP | 407,395 | | | COP | 280,440 | | | COP | - | | | COP | 505,066 | | | COP | 305,321 | | | COP | - | |
The following table shows the intangible assets gross carrying amount and accumulated amortization, detailed with their respective useful lives:
| December 31, 2012 |
| | | Gross carrying amount | | | Accumulated amortization | | | Weight useful life (months) | |
| Brand | | COP | 36,216 | | | COP | 36,216 | | | | 60 | |
| Service asset | | | 6,206 | | | | 6,206 | | | | 169 | |
| Asset management | | | 30,004 | | | | 22,251 | | | | 125 | |
| Benefits associated to Loans | | | 77,354 | | | | 49,088 | | | | 201 | |
| Core Deposits | | | 111,103 | | | | 75,563 | | | | 151 | |
| Customer relationship Conavi and Corfinsura | | | 22,400 | | | | 22,400 | | | | 105 | |
| Customer relationship Factoring Bancolombia | | | 7,267 | | | | 7,267 | | | | 48 | |
| Customer relationship Conglomerado Banagrícola | | | 112,981 | | | | 57,585 | | | | 159 | |
| Others | | | 3,864 | | | | 3,864 | | | | 105 | |
| Total | | COP | 407,395 | | | COP | 280,440 | | | | | |
The estimated aggregate amortization expense for the next five fiscal years is as follows:
Fiscal year ending
December 31, | | Aggregate amortization expense | |
| 2013 | | COP | 21,613 | |
| 2014 | | | 19,798 | |
| 2015 | | | 17,983 | |
| 2016 | | | 11,716 | |
| 2017 | | | 9,901 | |
| Total | | COP | 81,011 | |
m.iv) Fair value of assets and liabilities acquired
Under Colombian banking GAAP, the purchase method of accounting allocates to goodwill all of the excesses value of intangible and tangible assets paid derived from business combinations. For U.S. GAAP purposes, the primary financial statements allocate the fair value adjustments to each of the respective assets and liabilities. Currently, the Bank recognizes adjustments to the stockholders’ equity related to business combination due to fair value acquisition date differences in fixed and foreclosed assets, time deposits, long-term debt, loans and securitization of non-performing loans. Under U.S. GAAP, the amortizations of the premiums or discounts on acquisition are recognized in the consolidated statement of operations.
The following tables identify and quantify each adjustment to both the net income and stockholders’ equity:
| | | December 31, | |
| | | 2012 | | | 2011 | |
| | | | | | | |
| Stockholders’ equity | | | | | | | | |
| Securitized non-performing loans accounted for as sales under Colombian banking GAAP and consolidated under U.S. GAAP | | COP | 11,118 | | | COP | 12,721 | |
| | | | | | | | | |
| Securitized performing loans accounted for as sales under Colombian banking GAAP and consolidated under U.S. GAAP | | | 93,224 | | | | 100,635 | |
| Total | | COP | 104,342 | | | COP | 113,356 | |
| | | December 31, | |
| | | 2012 | | | 2011 | | | 2010 | |
| | | | | | | | | | |
| Consolidated net income | | | | | | | | | | | | |
| Securitized non-performing loans accounted for as sales under Colombian banking GAAP and consolidated under U.S. GAAP | | COP | (1,603 | ) | | COP | (3,186 | ) | | COP | (4,916 | ) |
| | | | | | | | | | | | | |
| Securitized performing loans accounted for as sales under Colombian banking GAAP and consolidated under U.S. GAAP | | | (3,996 | ) | | | 36,794 | | | | 38,929 | |
| Total | | COP | (5,599 | ) | | COP | 33,608 | | | COP | 34,013 | |
Transfers of financial assets
The Bank securitizes performing and non-performing mortgage loans using different securitization vehicles.
The Bank transfers performing and non-performing mortgages to Special Purpose Entities (SPE) which are not related parties. The SPEs issue notes (debt securities) and use the proceeds to buy residential mortgages portfolios from Bancolombia and other Colombian banks. In a securitization, various classes of debt securities may be issued and are generally collateralized by the transferor.
The securitized loans may be serviced by the Bank or by third parties. The Bank may also retain an interest in the form of the securities acquired from the SPE and fees for servicing the loans.
Under Colombian banking GAAP, the securitization of performing and non-performing residential mortgage loans is recorded as sales of financial assets and therefore, securitized loans have been removed from the Bank’s balance sheet. Additionally, the Bank recognizes in the Consolidated Statement of Operations at the moment of the operation the difference between the book value of the securitized portfolio and the proceeds received as gains or losses.
Under U.S. GAAP when an entity transfers financial assets, it must assess first whether the transferee should be consolidated. The party that has the power to direct the activities of a VIE, that most significantly impacts the VIE’s economic performance and has the obligation to absorb losses of the VIE (that could potentially be significant to the VIE) or the right to receive benefits from the VIE (that could potentially be significant to the VIE), is considered the primary beneficiary and therefore should consolidate the VIE.
For transfers of financial assets, the Bank first assesses the consolidation principle and for those financial assets where the Bank is not the primary beneficiary, the sale accounting under U.S. GAAP is further assessed. If considered a sale, the transferred assets are removed from the Bank’s consolidated balance sheet with a recognized gain or loss. If not a sale, the transfer is considered a secured borrowing, resulting in the recognition of a liability in the consolidated balance sheet.
The table below presents a summary of the assets and liabilities of the securitization vehicles which have been consolidated on the Bank’s balance sheet under U.S. GAAP at December 31, 2012 and 2011:
| | | 2012 | | | 2011 | |
| Assets(1) | | | | | | | | |
| Cash and cash equivalents | | COP | 20,447 | | | COP | 26,947 | |
| Investment securities | | | 21,071 | | | | 28,709 | |
| Mortgage loans | | | 1,803,404 | | | | 3,088,751 | |
| Allowance for loan losses | | | (133,427 | ) | | | (156,013 | ) |
| Accounts receivable | | | 17,966 | | | | 25,115 | |
| Foreclosed assets | | | 3,112 | | | | 2,856 | |
| Other assets | | | 4,942 | | | | 7,065 | |
| Total Assets | | COP | 1,737,515 | | | COP | 3,023,430 | |
| | | | | | | | | |
| Liabilities | | | | | | | | |
| Accounts payable | | | 11,278 | | | | 20,785 | |
| Long-term debt | | | 775,113 | | | | 1,614,107 | |
| Other liabilities | | | 1,694 | | | | 2,180 | |
| Total liabilities | | COP | 788,085 | | | COP | 1,637,072 | |
(1) The VIEs assets are only used to settle obligations of the VIE.
The allowance for loan losses represents management’s estimate of probable losses inherent in the portfolio. The allowance for loan losses is calculated based on criteria described in e) “Allowance for loan losses, financial leases, foreclosed assets and other receivables”.
The Bank did not provide any additional financial support to these VIEs or others during 2012. Further, the Bank does not have any contractual commitments or obligations to provide additional financial support to these VIEs or others. The investors in debt securities issued by the securitization entities have no recourse to other assets of the Bank.
The Bank received servicing fees from Titularizadora Colombiana S.A. (structuring) of COP 27,231 and COP 28,787 for the years ended December 31, 2012 and 2011, respectively. The Bank believes that the fees reflect adequate compensation for services and are priced based on market value.
Cash flows received from securitization entities subject to consolidation for the years ended December 31, 2012 and 2011 amounted to COP 0 and COP 898, respectively.
The securitization transactions are a source of funding for the Bank. The securitization of performing loans transfers the risks of the loan portfolio to the holders of the debt securities issued by the securitization entities.
Securitizations of Non-performing Loans
The Bank retains all the risks of the securitized non-performing loans portfolio. In the event of default of the borrower of the loan, the Bank is required to contribute other loans or cash to the securitization entity in order to ensure the debt securities issued are being paid. Those securitization transactions are consolidated under U.S. GAAP.
Retained Interests in the unconsolidated Securitization vehicles
Under Colombian banking GAAP, any residual beneficial interest retained by the Bank in a securitization process must be recorded as a held to maturity investment in an amount equal to the value established for the beneficial interest in the balance sheet of the special purpose entity created for such purpose.
Under U.S. GAAP, retained interests in the securitization vehicles that are not subject to consolidation as of December 31, 2012, as the Bank was not considered to be the primary beneficiary, should be recognized and recorded at fair value, as available-for-sale or trading securities. To determine the fair values of these securities, the Bank discounted the estimated future cash flows of these securities.
For securities classified as available for sale, unrealized gains or losses over the amortized cost basis are charged to the reconciliation of Stockholders’ Equity through Other Comprehensive Income, unless unrealized losses are deemed to be other than temporary, in which case they are charged to the Consolidated Statement of Operations.
Securities held for the purpose of selling them in the short term are classified as “trading” and are reported at fair value, with gains and losses included in the statements of operations.
For U.S. GAAP purposes, the amortized cost, unrealized gain/loss and fair value of retained interests in VIEs not subject to consolidation as of December 31, 2012 and 2011, are as follows:
| Balance Sheet | | 2012 | | | 2011 | |
| Available for Sale Securities | | | | | | | | |
| Amortized Cost | | COP | 615,398 | | | COP | 509,963 | |
| Net Unrealized Gain/(Loss) | | | (15,157 | ) | | | (17,610 | ) |
| Fair Value | | | 600,241 | | | | 492,353 | |
| | | | | | | | | |
| Trading Securities | | | | | | | | |
| Fair Value(1) | | COP | 5,350 | | | COP | 11,418 | |
| (1) | Under U.S. GAAP, using the discounted cash flow methodology, the Bank assesses the fair value using an internally developed valuation technique. These instruments would generally be classified as Level 3 if required. See note 31, t) Estimated Fair Value
"Quantitative Information about Level 3 Fair Value Measurements " |
The maximum exposure to loss in those VIEs includes the amount invested in, and advanced to, each VIE as of the reporting date plus any legal or contractual obligations to provide financing in the future. The Bank has neither legal or contractual obligations to provide financing in the future to the VIEs where it holds a variable interest but is not the primary beneficiary, therefore its maximum exposure to loss equals the carrying amounts of the variable interests recognized in the balance sheets as of December 31, 2012 and December 31, 2011.
For U.S. GAAP purposes, cash flows and proceeds received from SPEs qualifying for sale treatment but not subject to consolidation as of December 31, 2012 and 2011 are as follows:
| | | 2012 | | | 2011 | |
| | | | | | | |
| Cash Flows | | COP | (8,732 | ) | | COP | (6,622 | ) |
| Proceeds Received | | | 416,501 | | | | 324,192 | |
| o) | Foreign currency translation adjustment |
Under Colombian banking GAAP, for consolidation purposes, the income accounts of foreign currency financial statements, are converted to pesos using average exchange rates. The exchange difference originated in the consolidated statement of operations accounts is recorded as foreign exchange gain loss in the statement of operations.
Under U.S. GAAP, the translation adjustments shall be reported as a component of the reconciliation of stockholders’ equity, in other comprehensive income.
| p) | Non-controlling Interest |
The non-controlling interest corresponds to the proportional adjustments to the stockholders’ equity and net income originated by the subsidiaries where the Bank holds less than 100% of participation.
Under Colombian banking GAAP, the non-controlling interest is presented as minority interest outside stockholders’ equity. For U.S. GAAP purposes, the non-controlling interest in subsidiaries must be classified as a separate component of stockholders’ equity in the consolidated financial statements. Additionally, consolidated net income and comprehensive income are reported with separate disclosure of the amounts attributable to the parent and to the non-controlling interest.
The following table provides details regarding the differences in non-controlling interests between Colombian banking GAAP and U.S. GAAP:
| | | 2012 | | | 2011 | |
| Non-controlling interest under Colombian banking GAAP | | COP | 81,394 | | | COP | 73,455 | |
| Adjustments incoporated under U.S. GAAP reconciliation: | | | | | | | | |
| Non-controlling interest in securitzation performing loans | | | 60,795 | | | | 23,005 | |
| Business combination | | | (48,028 | ) | | | (35,952 | ) |
| Non-controlling interest in variable interest entities | | | 132,413 | | | | 136,920 | |
| Non-controlling interest participation in U.S. GAAP adjustments | | | 11,652 | | | | 9,754 | |
| | | | 238,226 | | | | 207,182 | |
| Non-controlling interest discontinued operations | | | - | | | | (294 | ) |
| Non-controlling interest under U.S. GAAP | | COP | 238,226 | | | COP | 206,888 | |
| q) | Discontinued Operations |
On September 27, 2012, after obtaining all authorizations required by the regulators in Colombia and El Salvador, Banagrícola S.A. and Inversiones Financieras Banco Agrícola S.A., subsidiaries of Bancolombia S.A., sold to Seguros Suramericana S.A., a company linked to Grupo de Inversiones Suramericana, 97.03% of its shares of capital stock of Asesuisa, an insurance company in the Republic of El Salvador.
In November 2011,after obtaining all authorizations required by the regulators in Colombia and El Salvador, Banagrícola S.A. and Inversiones Financieras Banco Agrícola S.A., subsidiaries of Bancolombia S.A., sold to Protección S.A. Sociedad Administradora de Fondos de Pensiones y Cesantias (“Protección S.A.”), 99.99% of its shares of capital stock of AFP Crecer, an administrator of pension funds in the Republic of El Salvador.
On January 29, 2010, Bancolombia sold to Inversiones EGEO I S.A.S 98.25% of its direct interest held through Banca de Inversión Bancolombia S.A. in Inversiones Valores y Logística S.A. The Bank registered a gain on the sale of this investment of COP 27,995 in 2010.
Under U.S. GAAP, the results of operations of a component of an entity that either has been disposed of or is classified as held for sale, shall be reported in discontinued operations if both of the following conditions are met:
a. The operations and cash flows of the component have been (or will be) eliminated from the ongoing operations of the entity as a result of the disposal transaction.
b. The entity will not have any significant continuing involvement in the operations of the component after the disposal transaction.
The results of the discontinued operations under U.S. GAAP were as follows:
| | | 2012 | | | 2011 | | | 2010 | |
| Profit (losses) from discontinued operations before income taxes | | COP | 60,310 | | | COP | 146,686 | | | COP | 76,114 | |
| Income taxes (benefit) expense | | | 11,437 | | | | 17,042 | | | | 15,185 | |
| Profit (losses) from discontinued operations | | COP | 48,873 | | | COP | 129,644 | | | COP | 60,929 | |
| r) | Guarantees and off- balance sheet credit exposures |
In order to meet the needs of its customers, the Bank issues financial standby letters of credit and bank guarantees. These are commitments issued by the Bank to guarantee the performance of a customer to a third party and are mainly issued to guarantee agreements established between parties from the energy sector, private sector and public procurement contracts.
Under U.S. GAAP, the Bank recognizes the premium received or receivable as a liability which presents the fair value of the obligations assumed at its inception. Such liabilities are being amortized over the expected terms of the related guarantees.
In addition, for U.S. GAAP purposes, the Bank maintains a provision for credit losses on off-balance sheet credit instruments. Off–balance sheet credit instruments include commitments to extend credit, guarantees granted, standby letters of credit and other financial instruments. The Bank uses the same methodology as described for the allowance for loans in note 31 (e), adjusted by an estimated probabilityexpects most of drawdown by the borrower. This provision is recorded as a liability.
The table below provides details regarding the differences between Colombian banking GAAP and U.S. GAAP with respectthose guarantees provided to the accounting for off-balance sheet credit instruments:
| Consolidated net income | | For the year ended December 31, | |
| | | 2012 | | | 2011 | | | 2010 | |
| | | | | | | | | | |
| Guarantees | | COP | (3,405) | | | COP | (4,959) | | | COP | (1,900) | |
| Allowances for credit losses on off-balance sheet credit instruments, except commitments to extend credit(1) | | | (9,039 | ) | | | 375 | | | | (5,330 | ) |
| | | COP | (12,444 | ) | | COP | (4,584 | ) | | COP | (7,230 | ) |
| Consolidated Stockholders’ Equity |
| | | 2012 | | | 2011 | |
| | | | | | | |
| Guarantees | | COP | (17,825) | | | COP | (14,420) | |
| Allowances for credit losses on off-balance sheet credit instruments, except commitments to extend credit(1) | | | (19,842 | ) | | | (10,803 | ) |
| | | COP | (37,667 | ) | | COP | (25,223 | ) |
| (1) | See e.i.)Allowance for loans losses , financial lease, and other receivables |
At December 31, 2012 and 2011, outstanding letters of credit and bank guarantees issued by the Bank totaled COP 4,440,515 and COP 4,054,494 respectively. Under Colombian banking GAAP, the Bank recognizes in memorandum accounts the full guaranteed amount.expire before they are used.
The events or circumstances that would require the Bank to perform under a guarantee are determined by the type of guarantee:
Commitment issued by the Bank to guarantee the performance of a customer fromGuarantees for the energy sector:
The Bank shall be responsible before the guarantee’s beneficiary in the following situations:
• Breach of the contract signed by the guaranteed entity.
• Lack of energy supply due to a low availability from the generating company (the guaranteed entity).
• Non-compliance by the guaranteed entity with the stipulated timeframe to operate the power premises in order to deliver the energy requested or promised to the system.Guarantees for public procurement
• The daily energy generation units delivered by the guaranteed entity were lower than the daily amount pledged or agreed.
Commitment issued by the Bank to guarantee the performance in public procurement contracts: The amount guaranteed should be reimbursed by the Bank to the beneficiary of the guarantee which is a governmentGovernment entity, in case the contractor breaches the agreed terms or its legal obligations.
Commitment issued by the Bank to guarantee the performance of a customer from the private sector:
The amount guaranteed should be reimbursed to the beneficiary of the guarantee in case of breach of agreed covenants by the customer guaranteed or upon its financial insolvency.
The table below summarizes, at December 31, 20122015 and 2011, all of2014, the Bank’s guarantees where the Bank is the guarantor:
| | | Expire within one year | | | Expire after one year | | | Total amount outstanding | | | Maximum potential amount of future
losses | |
| | | 2012 | | | 2011 | | | 2012 | | | 2011 | | | 2012 | | | 2011 | | | 2012 | | | 2011 | |
| Letters of credit | | COP | 1,681,099 | | | COP | 1,756,346 | | | COP | 1,027,423 | | | COP | 782,291 | | | COP | 2,708,522 | | | COP | 2,538,637 | | | COP | 2,708,522 | | | COP | 2,538,637 | |
| Bank guarantees | | | 1,072,320 | | | | 1,010,425 | | | | 659,673 | | | | 505,432 | | | | 1,731,993 | | | | 1,515,857 | | | | 1,731,993 | | | | 1,515,857 | |
| Total | | COP | 2,753,419 | | | COP | 2,766,771 | | | COP | 1,687,096 | | | COP | 1,287,723 | | | COP | 4,440,515 | | | COP | 4,054,494 | | | COP | 4,440,515 | | | COP | 4,054,494 | |
| | As of December 31, 2015 | |
| Maturity | | Financial Guarantees | |
| | In millions of COP | |
| Guarantees under 1 month | | | 572,363 | |
| Guarantees greater than 1 month and up to 3 months | | | 833,635 | |
| Guarantees greater than 3 months and up to 1 year | | | 3,398,029 | |
| Guarantees greater than 1 year and up to 3 years | | | 1,430,371 | |
| Guarantees greater than 3 year and up to 5 years | | | 548,991 | |
| Guarantees greater than 5 years | | | 340,132 | |
| Total | | | 7,123,521 | |
| | As of December 31, 2014 | |
| Maturity | | Financial Guarantees | |
| | In millions of COP | |
| Guarantees under 1 month | | | 928,540 | |
| Guarantees greater than 1 month and up to 3 months | | | 699,702 | |
| Guarantees greater than 3 months and up to 1 year | | | 2,765,640 | |
| Guarantees greater than 1 year and up to 3 years | | | 1,514,214 | |
| Guarantees greater than 3 year and up to 5 years | | | 322,383 | |
| Guarantees greater than 5 years | | | 459,605 | |
| Total | | | 6,690,084 | |
The total amount outstanding is the maximum potential payments which represent a “worse-case scenario”, and do not reflect expected results.
20.2 Contingent liabilities
Generally, customers that are guaranteed byBANCOLOMBIA
As of December 31, 2015, several ordinary lawsuits, class actions, civil lawsuits within criminal prosecutions and executory proceedings against the Parent Company were pending for a total aggregate amount of approximately COP 256,131. As of December 31, 2015, the possible contingencies with a claimed value higher than COP 5,000 against the Bank are not rated by external credit ratings. However, the Bank uses its internal groupings to manage the risk associated. This internal rating allocates the customer according to its financial status into the following four levels:were:
Internal RatingProceeding | | Characteristics |
AAAAmount of claim | | The financial status and cash flows show a strong financial structure and indicate an excellent capacity to pay. | Probability of
occurrence |
AA | | The financial status and cash flows show a stable financial structure and indicate a good capacity to pay.In Millions of COP |
A | | The financial status and cash flows show a good financial structure and indicate an adjusted capacity to pay. |
A- | | The financial status is weak | |
| Constitutional public interest action claim filed by José Reinaldo Bolaños | | | 88,500 | | | Possible |
| | | | | | |
| Ordinary claim by Inversiones C.B. S.A. | | | 40,806 | | | Remote |
| | | | | | |
| Constitutional public interest action filed by Carlos Julio Aguilar and others | | | 30,210 | | | Possible |
| | | | | | |
| Ordinary claim by Suescún & Brigard Abogados Consultores Ltda. | | | 8,250 | | | Remote |
| | | | | | |
Recalling Action (Acción Revocatoria) filed by Interbolsa S.A., Sociedad Administradora de Inversión Interbolsa SAI, entity in charge of winding up the financial structure indicates a possibility of default.collective investment fund “Interbolsa Credit” | | | Unspecified Amount | | | Remote |
| | | | | | |
| Recalling Action (Acción Revocatoria) filed by Interbolsa S.A., Comisionista de Bolsa in Compulsory Administrative liquidation, counter Bancolombia S.A | | | Unspecified Amount | | | Remote |
Under U.S.GAAP,Constitutional public interest action claim by José Reinaldo Bolaños:
The plaintiffs argue that several financial entities, including the Bank amongst them, have illegally charged undue amounts through illegal capitalization of interest in connection with the public debt restructuring agreements signed with the municipality of Santiago de Cali, in accordance with the fiscal and financial relief law.
The plaintiffs allege that the financial institutions involved breached the law regarding interest charging to clients, and in addition, breached the collective rights to public administration’s morality and protection of the municipality of Santiago de Cali's public funds. The plaintiffs seek for reimbursement of those amounts charged in excess. As of December 31, 2015, discovery was closed and closing arguments were presented.
Inversiones C.B. S.A.:
In 1997, Conavi (currently, Bancolombia), granted a 6,000 credit facility to Inversiones C.B.S.A. for a real estate construction project. The credit agreement provided for multiple disbursements subject to advances in the construction of the project, among other requirements. Due to an interruption of the construction of the project and a default by the builder, Conavi suspended the disbursements, which in the plaintiff's opinion was a breach of contract that caused him consequential damages. The claim filed by the plaintiff seeks to require the Bank to pay payment actual and expected damages, including loss of profits plus the corresponding interests, the opportunity cost of capital, the value of the project´s liabilities, as well as the effects of inflation.
This contingency is remote, as the Bank disbursed the funds according to the terms and conditions agreed upon. The Bank argues that the main reasons for the project's failure were liability ascribed to the plaintiff because of an inadequate use of profits and other external causes, such as the project’s lack of feasibility and the prevailing crisis within the construction sector.
In August, 2010, the court issued a decision in first instance in favor of the Bank, which was later appealed by the plaintiff.
In 2014, the appeal court issued a decision, again, in favor of the Bank. As of December 31, 2014, the case was appealed before the Supreme Court (petitioned by Inversiones CB), which was admitted and the plaintiff had to argue its claim before the Court on January 26, 2015.
In May 29, 2015, the Supreme Court did not admit the appeal considering that the claim did not comply with the plenitude of the conditions. In June 2015, the claim was sent to the court of origin as consequence of the plaintiff's failure to appeal the decision of rejection, whereby the second instance verdict in favor of the Bank remained final.
However, the plaintiff presented a letter (“Unconstitutionality Exception”) before the Supreme Court, alleging its disagreement with the rejection of the appeal. The complaint lacks of any legal basis; therefore, there has not been any response or proceeding.
Constitutional public interest action claim by Carlos Julio Aguilar and others:
This constitutional public interest action was filed by the plaintiff arguing that the restructuring of financial obligations by Departamento del Valle and the performance plan executed, allegedly violates the collective rights to public administration’s morality and the protection of the public funds of Departamento del Valle.
As of December 31, 2014, the proceeding is pending by the rendering of an expert´s opinion concerning the amount of interest charged to Departamento del Valle by the different financial institutions acting as defendants. This process merged to the constitutional public interest action filed by Carlos Aponte, and it is preliminary stages.
Suescun & de Brigard Abogados Consultores Ltda.
The law firm Suescún & de Brigard Abogados Consultores Ltda., who represented Bancolombia in an arbitration process, filed a suit against the Bank alleging that the settlement agreement reached between the parties to the arbitration proceeding entitled the firm to receive the success fee initially agreed between the Bank and the law firm. As of December 31, 2015, first and second instance verdict were issued in favor of the Bank and the proceeding is pending of an appeal action before the Supreme Court.
Interbolsa S.A., Sociedad Administradora de Interbolsa SAI, Sociedad Liquidadora de la Cartera Colectiva Escalonada “Interbolsa Credit” in liquidation, against Bancolombia S.A and Interbolsa S.A. in judicial liquidation.
The plaintiff seeks the reverse of a payment made to Bancolombia in an amount of COP 71,503, (made to cancel an obligation of Interbolsa S.A.) and its reinstatement in the company’s assets (which is now in judicial liquidation).
As of December 31, 2015, the proceeding has a first instance verdict in favor of the Bank, which was appeal by the plaintiff.
Recalling Action (Acción Revocatoria) filed by Interbolsa S.A., Comisionista de Bolsa in Compulsory Administrative liquidation, against Bancolombia S.A.
The plaintiff seeks reimbursement to Interbolsa´s assets of the amount paid by Interbolsa (for COP 14,000) due to an obligation on behalf of the Bank. In March 2015, the Bank submitted the statement of defense and it is pending of the public audience stage and further development of the proceeding.
BANISTMO
Contingencies with a claimed value higher than COP 5,000 as of December 31, 20122015, were:
| Proceeding | | Amount of claim | | | Provision | | | Probability of
occurrence |
| Ordinary claim filled by Deniss Rafael Perez Perozo and others. | | U.S. | 5,000 | | | | - | | | Remote |
| | | | | | | | | | |
| Ordinary claim filed by Melenao Mora against Banistmo. | | U.S. | 20,000 | | | | - | | | Possible |
Ordinary claim filed by Deniss Rafael Perez Perozo and 2011,others.
Promotara Terramar (a HSBC client) received USD 299,000 in payments through Visa Gift Cards issued by U.S Bank, as partial payment for two apartments in Panama City.
The Credit Card Securities and Fraud Prevention department of the HSBC bank detected an irregular activity promoted by Promotara Terramar. Therefore, pursuant to the Business Establishments Affiliate Agreement, HSBC held from Promotara Terramar´s accounts USD 286,000; nevertheless, before further investigations the money was refunded. The plaintiff claims a compensation payment of over USD 5,000. As of December 31, 2015, Banistmo had submitted the statement of defense.
Ordinary claim filed by Melenao Mora against Banistmo.
The plaintiff claims the payment of costs and damages resulting from a criminal proceeding filed by Banistmo against Melenao Mora for alleged criminal acts (issuance of credit lines to enterprises where they figured as legal representative). The claim seeks U.S. 20,000 and is pending of admission and taking of evidence stage.
NOTE 21. CAPITAL
The subscribed and paid-in capital is the following:
| | | December 31, 2015 | | | December 31, 2014 | | | January 1, 2014 | |
| | | In millions of COP | |
| Authorized shares(1) | | | 1,400,000,000 | | | | 1,000,000,000 | | | | 1,000,000,000 | |
| Subscribed and paid-in shares: | | | | | | | | | | | | |
| Ordinary shares with a nominal value of COP 500 pesos | | | 509,704,584 | | | | 509,704,584 | | | | 509,704,584 | |
| Preferential dividend without voting rights with nominal value of COP 500 pesos(2) | | | 452,122,416 | | | | 452,122,416 | | | | 342,122,416 | |
| Total shares | | | 961,827,000 | | | | 961,827,000 | | | | 851,827,000 | |
| Subscribed and paid capital (nominal value, in millions of COP) | | | 480,914 | | | | 480,914 | | | | 425,914 | |
(1)An extraordinary Shareholders meeting on October 30 2015, approved the increase of authorized capital through statutory reform. This decision was duly registered at the Chamber of Commerce of Medellin by public deed No. 6290 of November 27, 2015.
(2)In February 2014 the Parent Company issued one hundred and ten million (110,000,000) nonvoting shares with preferred dividend, authorized by the SFC through Resolutions 0164 and 0165 dated January 30, 2014. Consequently, the Parent Company's subscribed capital increased by COP 55,000.
Dividends declared
The declaration, amount and payment of dividends are based on Bancolombia S.A.’s unconsolidated earnings. Dividends must be approved at the ordinary annual shareholders’ meeting upon the recommendation of the Board of Directors. Under the Colombian Commercial Code, after payment of income taxes and appropriation of legal and other reserves, and after setting off losses from prior fiscal years, Bancolombia must distribute to its stockholders at least 50% of its annual net income or 70% of its annual net income if the total amount of reserves exceeds its outstanding capital, unless such minimum percentages are waived by an affirmative vote of the holders of 78% of the shares present and entitled to vote at the stockholders’ meeting. Such dividend distribution must be made to all stockholders, in cash or in issued stock of Bancolombia, as may be determined by the stockholders, and within a year from the date of the ordinary annual stockholders’ meeting in which the dividend was declared.
The annual net profits of Bancolombia must be applied as follows: (i) first, an amount equal to 10% of Bancolombia’s net profits to a legal reserve until such reserve is equal to at least 50% of the Bank’s paid-in capital; (ii) second, to the payment of the minimum dividend on the preferred shares; and (iii) third, as may be determined in the ordinary annual stockholders’ meeting by the vote of the holders of a majority of the shares entitled to vote.
| Dividends declared with respect to net income earned in: | | Cash dividends per share
(stated in pesos) | |
| 2015 | | | 888 | |
| 2014 | | | 830 | |
| 2013 | | | 776 | |
| 2012 | | | 754 | |
| 2011 | | | 708 | |
| 2010 | | | 669 | |
Preferred shares
Holders of preferred shares are entitled to receive dividends based on the profits of the preceding fiscal year, after deducting losses affecting the capital and once the amount that shall be legally set apart for the legal reserve has been deducted, but before creating or accruing for any other reserve, of a minimum preferred dividend equal to one per cent (1%) yearly of the subscription price of the preferred share, provided this dividend is higher than the dividend assigned to common shares. If this is not the case, the dividend shall be increased to an amount that is equal to the per share dividend on the common shares. The dividend received by holders of common shares may not be higher than the dividend assigned to preferred shares.
Payment of the preferred dividend shall be made at the time and in the manner established in the general shareholders’ meeting and with the priority indicated by Colombian law.
Any stock dividend payable in common shares requires the approval of 80% or more of the shares present at a shareholders’ meeting, which will include 80% or more of the outstanding preferred shares. In the event that none of the holders of preferred shares is present at such meeting, a stock dividend may only be paid to the holders of common shares that approve such a payment.
NOTE 22. APPROPIATED RESERVES
As of December 31, 2015 and 2014 and as of January 1, 2014, the appropriated retained earnings consist of the following:
| Concept | | 2015 | | | 2014 | | | January 1, 2014 | |
| | | In Millions of COP | |
| Appropriation of net profits(1) | | 5,331,624 | | | 4,805,813 | | | 3,891,975 | |
| For Fiscal provisions(2) | | | 427,265 | | | | 312,017 | | | | 268,062 | |
| Others | | | 118,490 | | | | 13,031 | | | | 212,632 | |
| Total Appropiated reserves | | | 5,877,379 | | | | 5,130,861 | | | | 4,372,669 | |
(1)Pursuant to article 452 of the Commercial Code of the Republic of Colombia, 10% of the unconsolidated net income of the Bank and its Colombian subsidiaries in each year must be appropriated through a credit to a “legal reserve fund” until its balance is equivalent to at least 50% of the subscribed capital.
The legal reserve fulfills two objetives: to increase and maintain the company's capital and to absorb economic losses. Based on the aforementioned, this amount shall not be distributed in dividends to the stockholders.
(2)Pusuant to Decree 2336 of 1995, which states that a reserve must be established for profits obtained in the valuation of investments held for trading purposes at the closing statement of financial position date and that correspond to non-tax income in accordance with article 27 of the Colombian Tax Code.
NOTE 23. UNCONSOLIDATED STRUCTURED ENTITIES
The term "unconsolidated structured entities" refers to all structured entities that are not controlled by the Bank. The Bank enters into transactions with unconsolidated structured entities in the normal course of business to facilitate customer transactions and for specific investment opportunities.
The table below shows the total assets of unconsolidated structured entities in which the Bank had an interest at the reporting date and its maximum exposure to loss in relation to those interests.
Nature and risks associated with the Bank’s interests in unconsolidated structured entities
| | | As of December 31, 2015 | |
| | | Securitisations | | | The Bank’s managed
funds | | | Total | |
| | | In millions of COP | |
| Total assets of the entities | | | 1,879,500 | | | | 97,929,459 | | | | 99,808,959 | |
| The Bank’s interest-assets | | | | | | | | | | | | |
| Investments at fair value through profit or loss | | | 475,723 | | | | - | | | | 475,723 | |
| Loans and advances to customers | | | - | | | | 2,130,965 | | | | 2,130,965 | |
| Total assets in relation to the Bank’s interests in the unconsolidated structured entities | | | 475,723 | | | | 2,130,965 | | | | 2,606,688 | |
| The Bank’s maximum exposure | | | 475,723 | | | | 2,130,965 | | | | 2,606,688 | |
| | | As of December 31, 2014 | |
| | | Securitisations | | | The Bank’s managed
funds | | | Total | |
| | | In millions of COP | |
| Total assets of the entities | | | 2,918,597 | | | | 95,023,703 | | | | 97,942,300 | |
| The Bank’s interest-assets | | | | | | | | | | | | |
| Investments at fair value through profit or loss | | | 696,978 | | | | - | | | | 696,978 | |
| Loans and advances to customers | | | - | | | | 1,697,251 | | | | 1,697,251 | |
| Total assets in relation to the Bank’s interests in the unconsolidated structured entities | | | 696,978 | | | | 1,697,251 | | | | 2,394,229 | |
| The Bank’s maximum exposure | | | 696,978 | | | | 1,697,251 | | | | 2,394,229 | |
| | | At 1 January 2014 | |
| | | Securitisations | | | The Bank’s
managed funds | | | Total | |
| | | In millions of COP | |
| Total assets of the entities | | | 3,978,617 | | | | 83,057,512 | | | | 87,036,129 | |
| The Bank’s interest-assets | | | | | | | | | | | | |
| Investments at fair value through profit or loss | | | 957,970 | | | | - | | | | 957,970 | |
| Loans and advances to customers | | | - | | | | 1,888,068 | | | | 1,888,068 | |
| Total assets in relation to the Bank’s interests in the unconsolidated structured entities | | | 957,970 | | | | 1,888,068 | | | | 2,846,038 | |
| The Bank’s maximum exposure | | | 957,970 | | | | 1,888,068 | | | | 2,846,038 | |
The Bank invests in asset-backed securities issued by securitization entities for which underlying assets are mortgages granted by financial institutions. The Bank does not have a significant exposure to sub-prime securities. The asset-backed securities are denominated in local market TIPS and accounted for as investment at fair value through profit or loss. These asset-backed securities have different maturities and are generally classified by credit ratings. Also, the Bank retains beneficial interests in the form of servicing fees on the securitized receivable.
Revenues generated by the Bank’s asset management business, come from a variety of funds that the Bank manages and distributes. These funds are divided into real estate development – related trusts, mutual funds sold to individuals, corporate trusts, escrow accounts, private equity funds, and delegated tailor-made mandates from third parties. Generally, the revenues correspond to the fees received from the management of resources that are invested in several instruments, and management of properties and premises related to real estate projects in progress.
Likewise, fees from management of resources pledged by clients in order to guarantee commitments and obligations with third parties, as well as fees from management of resources of government agencies and entities.
On the other hand, there is not an additional exposure to loss, such as funding commitments with regards to the Bank’s involvement with those entities.
NOTE 24. OPERATING INCOME AND OPERATING EXPENSES
24.1 Interest and valuation on investment
The following table sets forth the detail of interest and valuation on financial asset instruments for the years ended December 31, 2015 and 2014.
| | | 2015 | | | 2014 | |
| | | In millions of COP | |
| Interest on debt investments at amortized cost | | | 71,091 | | | | 28,470 | |
| Net gains on valuation from investment activities at fair value through profit or loss: | | | | | | | | |
| Debt investments | | | 294,979 | | | | 434,586 | |
| Derivatives | | | 31,835 | | | | (91,963 | ) |
| Spot transactions | | | (48,961 | ) | | | 35,990 | |
| Repos | | | (50,081 | ) | | | 164,198 | |
| Others | | | 2,977 | | | | - | |
| Total net gains from investment activities at fair value through profit and loss | | | 230,749 | | | | 542,811 | |
| Interest and valuation on investment | | | 301,840 | | | | 571,281 | |
24.2 Interest expenses
The following table sets forth the detail of interest on financial liability instruments for the years ended December 31, 2015 and 2014:
| | | 2015 | | | 2014 | |
| | | In millions of COP | |
| Deposits | | | (2,415,187 | ) | | | (1,881,821 | ) |
| Debt securities in issue | | | (1,057,748 | ) | | | (780,429 | ) |
| Financial obligations | | | (454,326 | ) | | | (384,313 | ) |
| Preferred shares | | | (58,714 | ) | | | (53,155 | ) |
| Borrowings from other financial institutions | | | (6,836 | ) | | | (3,719 | ) |
| Other interest | | | (45,130 | ) | | | (61,174 | ) |
| Interest expenses | | | (4,037,941 | ) | | | (3,164,611 | ) |
24.3 Fees and other services, net
The following table sets forth the detail of fee and income from services, net, for the years ended December 31, 2015 and 2014.
Fees and other service income:
| | | 2015 | | | 2014 | |
| | | In millions of COP | |
| Banking services | | | 630,616 | | | | 653,513 | |
| Credit and debit card fees | | | 524,646 | | | | 420,707 | |
| Electronic services and ATM fees | | | 490,607 | | | | 380,696 | |
| Trust | | | 265,215 | | | | 203,608 | |
| Bancas surance | | | 260,224 | | | | 212,223 | |
| Payments and Collections | | | 203,772 | | | | 182,669 | |
| Checks | | | 55,861 | | | | 60,998 | |
| Acceptances, Guarantees and Standby letters of credits | | | 44,539 | | | | 51,923 | |
| Brokerage | | | 23,453 | | | | 23,784 | |
| Others | | | 291,624 | | | | 305,296 | |
| Fees and other service income | | | 2,790,557 | | | | 2,495,417 | |
| | | | | | | | | |
| Discontinued operations Tuya S.A. see Note 31 | | | 388,306 | | | | 341,601 | |
Fees and other service expenses
| | | 2015 | | | 2014 | |
| | | In millions of COP | |
| Banking services | | | (298,415 | ) | | | (245,581 | ) |
| Call Center and Website | | | (254,769 | ) | | | (230,501 | ) |
| Credit and debit card fees | | | (85,798 | ) | | | (95,172 | ) |
| Others | | | (158,531 | ) | | | (98,453 | ) |
| Fees and other service expenses | | | (797,513 | ) | | | (669,707 | ) |
| | | | | | | | | |
| Discontinued operations Tuya S.A. see Note 31 | | | (152,500 | ) | | | (69,397 | ) |
| | | | | | | | | |
| Total fees and income from services, net | | | 1,993,044 | | | | 1,825,710 | |
24.4 Other operating income, net
The following table sets forth the detail of other operating income net for the years ended December 31, 2015 and 2014.
| | | 2015 | | | 2014 | |
| | | In millions of COP | |
| Derivatives FX contracts | | | 527,137 | | | | (150,451 | ) |
| Operating leases | | | 379,067 | | | | 302,022 | |
| Other credit card charges | | | 177,433 | | | | 148,746 | |
| Collection services | | | 121,105 | | | | 67,592 | |
| Rents | | | 69,687 | | | | 53,520 | |
| Returns on Bancassurance operations | | | 61,499 | | | | 47,616 | |
| Customer loyalty | | | 47,920 | | | | 67,855 | |
| Domestic wire transfers | | | 32,439 | | | | 32,052 | |
| Mobile operator services(1) | | | 16,852 | | | | 155,181 | |
| Penalties for failure to leasing contracts | | | 14,963 | | | | 9,164 | |
| Gains on sale of assets | | | 8,408 | | | | 31,913 | |
| Net foreign exchange | | | (157,933 | ) | | | 331,786 | |
| Other reversals | | | 8,110 | | | | 10,765 | |
| Others | | | 66,015 | | | | 28,782 | |
| Total Other operating income | | | 1,372,702 | | | | 1,136,543 | |
(1)The decrease is due mainly to the sale of Uff Móvil in 2015. For further information, see Note 2 section C.1
NOTE 25. OTHER ADMINISTRATIVE AND GENERAL EXPENSES
The following table sets forth the detail of other operating income and general expenses for the years ended December 31, 2015 and 2014:
| | | 2015 | | | 2014 | |
| Other Administrative and general expenses | | In millons of COP | |
| Maintenance and repairs | | | 356,655 | | | | 258,317 | |
| Fees, others | | | 256,852 | | | | 202,262 | |
| Insurance | | | 244,274 | | | | 228,670 | |
| Leasing | | | 218,394 | | | | 175,912 | |
| Transport | | | 138,084 | | | | 130,602 | |
| Advertising | | | 113,821 | | | | 94,433 | |
| Public services | | | 94,295 | | | | 85,900 | |
| Operational damages and risk | | | 81,836 | | | | 105,159 | |
| Cleaning and security services | | | 65,867 | | | | 57,716 | |
| Fines and sanctions | | | 58,821 | | | | 27,881 | |
| Properties improvements and installation | | | 58,141 | | | | 50,434 | |
| communications | | | 55,003 | | | | 66,051 | |
| Contributions and affiliations | | | 50,709 | | | | 48,705 | |
| Data processing | | | 46,536 | | | | 21,939 | |
| Useful and stationery | | | 42,232 | | | | 57,144 | |
| Travel expenses | | | 34,998 | | | | 31,384 | |
| Temporary services | | | 22,923 | | | | 12,074 | |
| Board of directors and audit fee | | | 19,223 | | | | 30,338 | |
| Legal and financial consultant | | | 18,785 | | | | 17,469 | |
| Real estate management. | | | 18,428 | | | | 17,477 | |
| Production and supply cards | | | 15,509 | | | | 20,948 | |
| Storage services | | | 14,918 | | | | 14,290 | |
| Donations | | | 13,031 | | | | 14,708 | |
| Trust | | | 10,637 | | | | 14,502 | |
| Legal expenses | | | 4,078 | | | | 3,326 | |
| Activities Joint Operations | | | 3,988 | | | | 13,729 | |
| Public relations | | | 3,270 | | | | 4,630 | |
| Others | | | 176,290 | | | | 141,375 | |
| Total other administrative and general expenses | | | 2,237,598 | | | | 1,947,375 | |
| Wealth tax, contributions and other tax burden(1) | | | 675,387 | | | | 438,711 | |
| Provision, depreciation and amortization | | | | | | | | |
| Provision for impairment | | | 16,314 | | | | 27,739 | |
| Depreciation of premises and equipment | | | 307,172 | | | | 253,703 | |
| Amortization of intangible assets | | | 153,799 | | | | 178,261 | |
| Total provision, depreciation and amortization | | | 477,285 | | | | 459,703 | |
(1)See Note11 taxes.
NOTE 26. EARNING PER SHARE (‘EPS’)
Basic EPS is calculated by reducing the income from continuing operations by the amount of dividends declared in the current period for each class of stock and by the contractual amount of dividends that must be paid for the current period, considering the allocation of remaining earnings to common stock and participating securities to the extent that each security may share in earnings as if all of the earnings for the period had been distributed. EPS is determined by dividing the total earnings allocated to each security by the weighted average number of common shares outstanding.
Diluted EPS assumes the issuance of common shares for all dilutive potential common shares outstanding during the reporting period. The Bank has no dilutive potential common shares as of December 31, 2015 and 2014.
The following table summarizes information related to the computation of basic EPS for the years ended December 31, 2015 and 2014 (in millions of pesos, except per share data):
| | | 2015 | | | 2014 | |
| | | In millions of COP | |
| Income from continuing operations before attribution of non-controlling interests | | | 2,586,385 | | | | 2,366,918 | |
| Less: Non-controlling interests from continuing operations | | | 90,008 | | | | 42,699 | |
| Net income from continuing operations | | | 2,496,377 | | | | 2,324,219 | |
| | | | | | | | | |
| Income from operations and disposals of discontinued operations, net of taxes | | | 22,513 | | | | 62,867 | |
| Less: Non-controlling interests from discontinuing operations | | | - | | | | - | |
| Net income attributable to the controlling interest | | | 2,518,890 | | | | 2,387,086 | |
| | | | | | | | | |
| Less: Preferred dividends declared | | | 316,548 | | | | 282,365 | |
| Less: Allocation of undistributed earnings to preferred stockholders | | | 836,383 | | | | 784,306 | |
| Continuing operations | | | 825,800 | | | | 755,458 | |
| Discontinued operations | | | 10,583 | | | | 28,848 | |
| Net income allocated to common shareholders for basic and diluted EPS | | | 1,365,959 | | | | 1,320,415 | |
| | | | | | | | | |
| Weighted average number of common shares outstanding used in basic EPS calculation (in millions) | | | 510 | | | | 510 | |
| | | | | | | | | |
| Basic and Diluted earnings per share to common shareholders | | | 2,680 | | | | 2,591 | |
| | | | | | | | | |
| From continuing operations | | | 2,656 | | | | 2,524 | |
| From discontinuing operations | | | 24 | | | | 67 | |
| | | | | | | | | |
| Basic and Diluted net income per ADS | | | 10,720 | | | | 10,364 | |
NOTE 27. RELATED PARTY TRANSACTIONS
FRAMEWORK UNDER IFRS.
IAS 24Related Party Disclosures requires that an entity discloses:
(a) Transactions with its related parties; and
(b) Relationships between a parent and its subsidiaries irrespective of whether there have been transactions between them.
Under IAS 24, an entity must disclose transactions with its related parties, outstanding balances, including commitments, recognized in the consolidated and separate financial statements of a parent or investors with joint control of, or significant influence over, an investee presented in accordance with IFRS 10.
Under this standard parties are considered to be related if one party has the ability to control the other party or exercise significant influence over the other party in making financial or operational decisions, or one other party controls both. This definition applies to the Bank in the cases below:
| · | Stockholders with ownership interest higher than 20% of the Bank’s capital: |
| · | Grupo de Inversiones Suramericana S.A. |
| · | Fondo Bancolombia ADR Program. |
| · | Members of Board of Directors and Senior Management, understood as the president and corporate Vice-presidents, as well as their close relatives. |
| · | Associates and joint ventures for which the Bank provides commercial banking services and deposits. For these purposes all companies that have been included companies in which the Bank has significant influence (in all cases, the Bank has between 20% and 50% share of capital). |
In addition, and in accordance with External Circular 067 of 2001 issued by the Financial Superintendence of Colombia, the Bank should record as transactions with related parties, the transactions with shareholders that have interest equal or higher than 10% of the Bank’s capital.
Between the Parent Company and its related parties, during the periods ending at December 31, 2015 and December 31, 2014, there were no:
| - | Loans implying for the borrower an obligation that does not correspond to the essence or nature of the mutual agreement. |
| - | Loans with interest rates different to those that are ordinarily paid or charged to third parties in similar conditions of term, risk, etc. |
| - | Operations whose characteristics differ from those carried out with third parties. |
| | | As of December 31, 2015 | |
| | | Stockholders with an
interest equal or
higher than 10% of
the Bank’s capital | | | Directors
and senior
management | | | Associates | |
| | | In millions of COP | |
| Assets | | | | | | | | | | | | |
| Cash and balances at central bank | | | - | | | | - | | | | - | |
| Interbank borrowings and Reverse repurchase agreements and other similar secured lend | | | - | | | | - | | | | - | |
| Investments | | | - | | �� | | - | | | | 974,366 | |
| Loans and advances to customers and financial leasing operations | | | 57 | | | | 20,194 | | | | 16,603 | |
| Derivative financial instruments | | | - | | | | - | | | | - | |
| Other assets | | | - | | | | - | | | | 5,063 | |
| Total assets | | | 57 | | | | 20,194 | | | | 996,032 | |
| Liabilities | | | | | | | | | | | | |
| Deposits | | | 1,093 | | | | 1,496 | | | | 148,823 | |
| Interbank Deposits and Repurchase agreements and other similar secured borrowing | | | - | | | | - | | | | - | |
| Derivative financial instrument | | | - | | | | - | | | | - | |
| Borrowings from other financial institutions | | | - | | | | - | | | | - | |
| Debt securities in issue | | | - | | | | - | | | | 2,031 | |
| Other liabilities | | | - | | | | 16 | | | | - | |
| Total Liabilities | | | 1,093 | | | | 1,512 | | | | 150,854 | |
| Income | | | | | | | | | | | | |
| Dividends | | | - | | | | - | | | | 45,736 | |
| Interest and Other operating income | | | - | | | | 1,389 | | | | 22,588 | |
| Others | | | - | | | | - | | | | 14 | |
| Net income | | | - | | | | 1,389 | | | | 68,338 | |
| Expenses | | | | | | | | | | | | |
| Interests | | | 16 | | | | 23 | | | | 4,879 | |
| Fees | | | - | | | | 792 | | | | - | |
| Others | | | - | | | | - | | | | 1,006 | |
| Total expenses | | | 16 | | | | 815 | | | | 5,885 | |
| | | As of December 31, 2014 | |
| | | Stockholders with an
interest equal or
higher than 10% of
the Bank’s capital | | | Directors
and senior
management | | | Associates | |
| | | In millions of COP | |
| | | | | | | | | | |
| Assets | | | | | | | | | | | | |
| Cash and balances at central bank | | | - | | | | - | | | | 2,870 | |
| Interbank borrowings and Reverse repurchase agreements and other similar secured lend | | | - | | | | - | | | | - | |
| Investments | | | - | | | | - | | | | 1,364,439 | |
| Loans and advances to customers and financial leasing operations | | | 34 | | | | 12,585 | | | | 72,403 | |
| Derivative financial instruments | | | - | | | | - | | | | - | |
| Other assets | | | - | | | | - | | | | - | |
| Total assets | | | 34 | | | | 12,585 | | | | 1,439,712 | |
| Liabilities | | | | | | | | | | | | |
| Deposits | | | 1,992 | | | | 943 | | | | 102,386 | |
| Interbank Deposits and Repurchase agreements and other similar secured borrowing | | | - | | | | - | | | | - | |
| Derivative financial instrument | | | - | | | | - | | | | - | |
| Borrowings from other financial institutions | | | - | | | | - | | | | 15,012 | |
| Debt securities in issue | | | - | | | | - | | | | | |
| Other liabilities | | | - | | | | - | | | | 66 | |
| Total Liabilities | | | 1,992 | | | | 943 | | | | 117,464 | |
| Income | | | | | | | | | | | | |
| Dividends | | | - | | | | - | | | | 16,043 | |
| Interest and Other operating income | | | 178 | | | | 913 | | | | 21,713 | |
| Others | | | - | | | | - | | | | 141 | |
| Net income | | | 178 | | | | 913 | | | | 37,897 | |
| Expenses | | | | | | | | | | | | |
| Interests | | | 723 | | | | 15 | | | | 5,077 | |
| Fees | | | - | | | | 776 | | | | - | |
| Others | | | - | | | | 94 | | | | 13,336 | |
| Total expenses | | | 723 | | | | 885 | | | | 18,413 | |
During the years ending December 31, 2015 and 2014, the Bank paid fees for COP 37,667792 and COP 25,223776 as compensation, for attending meetings of Board and Support Committee.
The remuneration of key management personnel is detailed below:
| Type of remuneration | | 2015 | | | 2014 | |
| | | In millions of COP | |
| Short-term benefits | | | 55,175 | | | | 47,633 | |
| Post-employment benefits | | | - | | | | 63 | |
| Other long-term benefits | | | 191 | | | | 3,824 | |
| Termination benefits | | | - | | | | - | |
| Total | | | 55,366 | | | | 51,520 | |
The Parent Company, which is also the ultimate parent company, is Bancolombia S.A. Transactions between companies included in consolidation Note 2.C and the Parent company meet the definition of related party transactions, and were eliminated from the consolidated financial statements and risk is taken into consideration.
The bank provides banking and financial services to its subsidiaries in order to satisfy their liquidity needs, and these transactions are conducted on similar terms to third-party transactions and are not individually material.
No guarantees, pledges or commitments have been given or received in respect of the aforementioned transactions in 2015 or 2014.
NOTE 28. SUBSEQUENT EVENTS
The amount per share of dividends declared before these financial statements are authorized is 888.12 per share and the total amount of dividends is 854,218. The approval of the financial statements by the Board of Directors took place on February 22, 2016.
The Audit Committee approved the filing of this Annual Report, including the Consolidated Financial Statements hereto, on April 15, 2016.
Sale of Cifin S.A.
Bancolombia entered into an agreement with TransUnion Netherlands II B.V., for the sale by Bancolombia of 100% of its stake in Cifin S.A (“Cifin”), an entity classified as a liabilityTechnical and Administrative Services Company and accredited as a provider of financial, credit, commercial information and services.
On February 8, 2016, Bancolombia sold 106,504 common shares of Cifin for a total amount of COP 629,563.37 per share, amount received on this day, which, together with the stakes sold by the other shareholders party the sale agreement, represents in the aggregate a 71% stake in Cifin.
The financial entities selling their shares seek a strategic investor with experience and international knowledge, looking to generate added value to this company, by incorporating new knowledge, advanced technologies and better international practices in the analysis of credit information, credit risk management, and money laundering, among others.
NOTE 29. FAIR VALUE OF ASSETS AND LIABILITIES
The following table presents the carrying amount and the fair value of the obligations assumed at its inception. The difference (from 2011 to 2012) corresponds to the increaseassets and liabilities as of commissions during 2012.December 31 2015 and 2014, and January 1, 2014
| | | December 31, 2015 | | | December 31, 2014 | | | January 1, 2014 | |
| Financial instrument | | Carrying
amount | | | Fair value | | | Carrying
amount | | | Fair value | | | Carrying
amount | | | Fair value | |
| | | In millions of COP | |
| Assets | | | | | | | | | | | | | | | | | | | | | | | | |
| Cash and cash equivalents | | | 18,597,614 | | | | 18,597,614 | | | | 13,466,783 | | | | 13,466,783 | | | | 15,445,977 | | | | 15,445,977 | |
| Debt securities at fair value | | | 9,651,268 | | | | 9,651,268 | | | | 9,572,074 | | | | 9,572,074 | | | | 9,191,657 | | | | 9,191,657 | |
| Debt securities at amortized cost | | | 3,492,146 | | | | 3,434,606 | | | | 1,930,863 | | | | 1,922,841 | | | | 2,801,861 | | | | 2,798,214 | |
| Equity securities at fair value | | | 1,164,681 | | | | 1,164,681 | | | | 1,281,288 | | | | 1,281,288 | | | | 1,089,339 | | | | 1,089,339 | |
| Derivatives | | | 2,382,168 | | | | 2,382,168 | | | | 1,448,845 | | | | 1,448,845 | | | | 529,619 | | | | 529,619 | |
| Loan portfolio | | | 140,371,884 | | | | 136,729,366 | | | | 110,384,396 | | | | 108,335,805 | | | | 91,929,756 | | | | 94,949,399 | |
| Investment properties | | | 1,505,046 | | | | 1,505,046 | | | | 1,114,180 | | | | 1,114,180 | | | | 984,701 | | | | 984,701 | |
| Total | | | 177,164,807 | | | | 173,464,749 | | | | 139,198,429 | | | | 137,141,816 | | | | 121,972,910 | | | | 124,988,906 | |
| Liabilities | | | | | | | | | | | | | | | | | | | | | | | | |
| Deposits | | | 121,802,028 | | | | 116,487,773 | | | | 94,769,319 | | | | 93,829,888 | | | | 86,512,104 | | | | 86,677,887 | |
| Interbank | | | 400,062 | | | | 400,062 | | | | 375,958 | | | | 375,958 | | | | 229,201 | | | | 229,201 | |
| Repos | | | 1,232,456 | | | | 1,232,456 | | | | 1,891,959 | | | | 1,891,959 | | | | 1,016,442 | | | | 1,016,442 | |
| Derivatives | | | 1,930,609 | | | | 1,930,609 | | | | 1,471,779 | | | | 1,471,779 | | | | 621,988 | | | | 621,988 | |
| Borrowings from other financial institutions | | | 19,721,184 | | | | 18,866,477 | | | | 13,852,284 | | | | 13,852,284 | | | | 12,478,711 | | | | 12,480,600 | |
| Debt securities in issue | | | 19,435,865 | | | | 19,734,430 | | | | 14,527,403 | | | | 15,086,109 | | | | 12,673,741 | | | | 12,873,877 | |
| Total | | | 164,522,204 | | | | 158,651,807 | | | | 126,888,702 | | | | 126,507,977 | | | | 113,532,187 | | | | 113,899,995 | |
| s)· | Insurance contractsFair value hierarchy |
Under U.S. GAAP, reserves for individual and group life insurance are computed on the basis of interest rates and mortality tables, including a margin for adverse deviations. For the year 2011, the reserve discount rate was 4.5%, based on the Bank’s own profitability experience.
Under Colombian banking GAAP, there are not reserves for adverse deviations.
On September 27, 2012, Banagricola S.A. and Inversiones Financieras Banco Agrícola S.A., subsidiaries of Bancolombia S.A., sold to Suramericana 97.03% of its shares of capital stock of Aseguradora Suiza SalvadoreñIFRS 13 establishes a an insurance subsidiary in the Republic of El Salvador. See note 1, “Organization and background”. Therefore, any reconciling adjustment would be no longer necessary.
| t) | Estimated Fair Value of Financial Instruments |
Fair value of financial instruments
U.S. GAAP defines fair value as the price that would be received to sell an asset or paid to transfer a liability in an orderly transaction between market participants at the measurement date, establishes a consistent framework for measuring fair value and expands disclosure requirements about fair-value measurements.
The framework for measuring fair value under Colombian banking GAAP is substantially consistent with U.S. GAAP, except for considerations about own credit risk, counterparty risk and valuation of collateral.
Fair-Value Hierarchy
U.S. GAAP specifies a hierarchy of valuation techniques based on whether the inputs to those valuation techniques are observable or unobservable.unobservable, that reflects the significance of inputs adopted in the measurement process. In accordance with IFRS the financial instruments are classified as follows:
Level 1: Observable inputs that reflect market data obtained from independent sources, while unobservable inputs reflect the Bank’s market assumptions. These two types of inputs have created the following fair-value hierarchy:
Level 1- Quotedquoted prices (unadjusted) in active markets for identical assets or liabilities. Level 1 assetsAn active market is a market in which transactions for the asset or liability being measured take place with sufficient frequency and liabilities include debt, futures, and equity securities that are traded involume to provide pricing information on an active exchange market.ongoing basis.
Level 2- Observable inputs2: Inputs other than quoted prices included in Level 1 prices, such asthat are observable for the asset or liability either directly or indirectly. Level 2 generally includes: (i) quoted prices for similar assets or liabilities;liabilities in active markets; (ii) quoted prices for identical or similar assets or liabilities in markets that are not active;active, that is, markets in which there are few transactions for the asset or other inputs that are observable or can be corroborated by observable market data for substantially the full term of the assets or liabilities. Level 2 assets and liabilities include debt securities with quoted prices that are traded less frequently than exchange-traded instruments and derivative contracts whose value is determined using a pricing model with inputs that are observable in the market or can be derived principally from or corroborated by observable market data. This category generally includes certain bonds issued by a government or its entities, corporate debt securities and derivative contracts.liability.
Level 3-3: Unobservable inputs that are supported by little or no market activity and that are significant to the fair value of the assets or liabilities. Level 3 assets and liabilities include financial instruments whose value is determined using pricing models, discounted cash flow methodologies, or similar techniques, as well as instruments for which the determination of fair value requires significant management judgment or estimation. This category generally includes certain retained residual interests in securitizations, asset-backed securities (ABS) and highly structured or long-term derivative contracts where independent pricing information was not able to be obtained for a significant portion of the underlying assets.
The Bank considers relevant and observable market prices in its valuations where possible. The frequency of transactions, the size of the bid-ask spread and the amount of adjustment necessary when comparing similar transactions are all factors in determining the liquidity of markets and the relevance of observed prices in those markets.
| · | Valuation process for fair value measurements |
As was mentioned above, the valuation to fair value measurements
For derivatives instruments, the Capital Market’s Risk Directorprices is in charge of designing the valuationperformed using prices, methodologies which must be approvedand inputs provided by the Board of Directors, before they are sentOfficial Price Supplier (Infovalmer) to the SFC in order to obtain a non-objection notice.
For debt securities, valuation techniques are based on quoted market pricesBank. All methodologies and models that project future cash flows and discount the future amounts to a present value using market-based observable inputs values given by price providers, which are authorizedprocedures developed by the SFC, and whose valuation methodologiesprice supplier are previously approvedknown by the SFC.Financial Superintendence of Colombia, which has not objected to them.
On a daily basis, the Financial Operations Direction verifies the valuation of investments, and, the Proprietary Trading Desk’s Risk Management area reports the results of the portfolio’s valuation. On a quarterly basis, the investment and derivative portfolios are measured under US GAAP and, if necessary, adjustments are made to the valuation methodologies.
Regarding the market inputs provided by price providers, an opposition proceeding may be initiated against such valuations by any market agent (financial institutions, pension funds, among others) who disagrees with the price, margin, or rate; as a consequence of such proceeding the market data services company must review the data provided.
For assets and liabilities carried at fairFair value the Bank measures such value using the procedures set out below. The Bank did not choose to utilize the fair value option to measure financial instruments and certain other items at fair value based on an elective basis.measurement
When available, the Bank generally uses quoted market prices to determine fair value and classifies such items in Level 1. The Bank will make use of acceptable practical expedients (mid-market pricing or other pricing conventions) to calculate fair value.
Where available, the Bank may also make use of quoted prices for recent trading activity in positions with the same or similar characteristics to that being valued. The frequency and size of transactions and the amount of the bid-ask spread are among the factors considered in determining the liquidity of markets and the relevance of observed prices from those markets. If relevant and observable prices are available, those valuations would be classified as Level 2.
If quoted market prices are not available, fair value is based upon internally developed valuation techniques such as discounted cash flows, pricing models and similar methodologies that use, where possible, current market-based or independently sourced market parameters, such as interest rates, currency rates, option volatilities, etc. Items valued using such internally generated valuation techniques are classified according to the lowest level input or value driver that is significant to the valuation. Thus, an item may be classified in Level 2 or 3 even though there may be some significant inputs that are readily observable.
Fair-value estimates from internal valuation techniques are verified, where possible, to prices obtained from independent price providers or non-bidding brokers. Price providers and non-bidding brokers’ valuations may be based on a variety of inputs ranging from observed prices to proprietary valuation models.When price providers’ services are used, the methods and assumptions used are reviewed by the Bank to support the completeness and accuracy of the prices received, using a combination of control processes, including evidence of observability and assessment of the price provider’s internal controls, obtaining evidence from independent accountants which have examined the maintenance of effective controls to assurance that its valuation system is protected against unauthorized access and the system is available for operation and use as committed. Also, where appropriate, management applies valuation adjustments to the pricing information from the sources.
The estimated fair value based upon internally developed valuation techniques could vary if other valuation methods or assumptions were used. The Bank believes its valuation methods are appropriate and consistent with those used by other market participants. Nevertheless, the use of different valuation methods or assumptions, including imprecision in estimating unobservable market inputs, to determine the fair value of certain financial instruments could result in different estimates of fair value at the reporting date and the amount of gain or loss recorded for a particular instrument. Most of the valuation models are not significantly subjective, because they can be tested and, if necessary, recalibrated by the internal calculation of and subsequent comparison to market prices of actively traded securities, where available.
Financial instruments that are classified as trading, or available for sale, and all derivatives, are stated at fair value. The fair value of such financial instruments is the estimated amount at which an asset could be sold or a liability transferred in a current transaction between willing parties in an orderly transaction.
The following section describes the valuation methodologies used by the Bank, including an indication of the level in the fair-value hierarchy in which each instrument is generally classified. Where appropriate, the description includes details of the valuation models, the key inputs to those models as well as any significant assumptions.
| (1) | Fair value measurement on a recurring and non-recurring basis |
Investment securities
When available,The Bank assigns price to those debt investments, using the Bank uses quoted market prices provided by the Official Price Supplier (Infovalmer) and assigns the appropriate level according to determine the procedure described above. (Hierarchy of fair value and such items are classified in Level 1 of the fair value hierarchy. For securities not traded or over-the-counter, the Bank generally determines fair value utilizing internal valuation and standard techniques. These techniques include determination of expected future cash flows which are discounted using curves of the applicable currencies and interest, modified by the credit risk. The interest and foreign exchange curves are generally observable market data and reference yield and exchange curves derived from quoted interest and exchange rates in appropriate time bandings, which match the timings of the cash flows and maturities of the instruments. Fair-value estimates from internal valuation techniques are verified and tested by independent personnel.
Price providers compile prices from various sources and may apply matrix pricing for similar securities where no price is observable. If available, the Bank may also use quoted prices for recent trading activity of assets with similar characteristics to the security. The securities priced using such methods are generally classified as Level 2. However, when less liquidity exists for a security, a quoted price is stale or prices from independent sources vary, a security is generally classified as Level 3.section).
When available,The Bank performs the market Price valuation of their investments in variable income using the prices provided by the Official Price Supplier (Infovalmer) and classifies those investments according to the procedure described above. (Hierarchy of fair value section).
The Bank holds positions in standardized derivatives, such as Futures over local stocks, over specific TES references and over the TRM. These instruments are valuated according to the information provided by Infovalmer, which perfectly matches the information provided by the Clearing and Settlement House.
Additionally, the Bank uses quoted marketholds positions in OTC derivatives, which in the absence of prices, to determineare valuated using the fair valueinputs and such items are classified in Level 1 and Level 2 of the fair value hierarchy and in trading or investment category.
Derivatives
Derivatives entered intomethodologies provided by the Bank are future contracts tradedPrice Supplier, to which has not objected the Colombian stock exchange and derivatives executed over-the-counter and so are valued using internal valuation techniques as no quoted market prices exist for such instruments. The valuation techniques and inputs depend on the typeFinancial Superintendence of derivative and the nature of the underlying instrument. For over-the-counter derivatives those trades in liquid markets are valued using industry standard valuation models. Where applicable, these models project future cash flows and discount the future amounts to a present value using market-based observable inputs including interest rate curves, foreign exchange rates, and forward and spot prices for currencies. In addition, these estimates consider assumptions for our own credit risk and the respective counterparty credit risk, as further discussed below.Colombia.
The key inputs depend upon the type of derivative and the nature of the underlying instrument and include interest rate yield curves, foreign exchange rates, the spot price of the underlying volatility, credit curves and correlation of such inputs. The item is placed in Level 2 or Level 3 depending on the observability of the significant inputs to the model. Correlation and items with longer tenors are generally less observable.
When appropriate, valuations are adjusted for various factors such as liquidity, bid/offer spreads and credit considerations.
Credit Valuation Adjustment
| d. | Credit valuation adjustment |
Under Colombian banking GAAP, the measurement of the fair value of derivatives does not include a credit valuation adjustment (“CVA”). Under U.S. GAAP, theThe Bank measures the effects of the credit risk of its counterparties and its own creditworthiness in determining fair value of the swap, option and forward derivatives.To see the total adjustment, please see i) investment securities and derivatives.
Counterparty credit-risk adjustments are applied to derivatives when the Bank’s position is a derivative asset and the Bank’s own credit risk is incorporated when the position is a derivative liability. The Bank attempts to mitigate credit risk to third parties which are international banks by entering into master netting agreements.
When assessing the impact of credit exposure, only the net counterparty exposure is considered at risk, due to the offsetting of certain same-counterparty positions and the application of cash and other collateral.
The Bank generally calculates the asset’s credit risk adjustment for derivatives transacted with international financial institutions by incorporating indicative credit related pricing that is generally observable in the market (“CDS”). The credit-risk adjustment for derivatives transacted with non-public counterparties is calculated by incorporating unobservable credit data derived from internal credit qualifications to the financial institutions and corporate companies located in Colombia. The Bank also considers its own creditworthiness when determining the fair value of an instrument, including OTC derivative instruments if the Bank believes market participants would take that into account when transacting the respective instrument. The approach to measuring the impact of the Bank’s credit risk on an instrument transacted with international financial institutions is done using the Asset Swap Curve calculated for subordinated bonds issued by the Bank in foreign currency. For derivatives transacted with local financial institutions, the Bank calculates the credit risk adjustment by incorporating credit data derived qualifications released in the Colombian financial market.
A hundred basis point and two hundred basis point increase in our own credit spreads when determining the credit valuation adjustment of our derivative portfolio, could result in a decrease of the associated adjustment of approximately COP 1,262 and COP 2,541, respectively, as of December 31, 2012. These sensitivity analyses do not represent management’s expectations of the changes in our own credit risk, but are provided as hypothetical scenarios to assess the sensitivity of the fair value of our derivative portfolio to changes in credit spreads.
| e. | Impaired loans measured at fair value |
A hundred basis point and two hundred basis point increase in the counterparty credit spreads when determining the credit valuation adjustment of our derivative portfolio, could result in an increase of the associated adjustment of approximately COP 6,875 and COP 13,440, respectively, as of December 31, 2012. These sensitivity analyses do not represent management’s expectations of the changes in the counterparties credit risk, but are provided as hypothetical scenarios to assess the sensitivity of the fair value of our derivative portfolio to changes in credit spreads.
Impaired loans measured at fair value
The Bank measured certain impaired loans based on the fair value of the associated collateral less costs to sell. The fair values were determined as follows using external and internal valuation techniques or third party experts, depending on the type of underlying asset:
For vehicles under leasing arrangements, the Bank uses an internal valuation model based on price curves for each type of vehicle. Such curves show the expected price of the vehicle at different points in time based on the initial price and projection of economic variables such as inflation, devaluation and customs. The prices modelled in the curves are compared every six months with market information for the same or similar vehicles and in the case of significant deviationdeviation; the curve is adjusted to reflect the market conditions.
Other vehicles are measured using matrix pricing from a third party. This matrix is used by most of the market participants and is updated monthly. The matrix is built from values provided by several price providers for identical or similar vehicles and considers brand, characteristics of the vehicles, and manufacturing date among other variables to determine the prices.
For real estate properties, a third-party qualified appraiser is used. The methodologies vary depending on the date of the last appraisal available for the property (The appraisal is estimated based on either of three approaches: cost, sale comparison and income approach, and is requested every three years)approach). When the property has been valued in the last 12 months and the market conditions have not shown significant changes, the most recent valuation is considered the fair value of the property. For all the other cases (i.e. appraisals older that 12 months) the value of the property is updated adjusting the value in the last appraisal by weighted factors such as location, type and characteristics of the property, size, physical conditions and expected selling costs, among others. The factors are determined based on current market information gathered from several external real estate experts.
F-123 | f. | Impaired foreclosed assets and premises and equipment held for sale measured at fair value |
Impaired foreclosed assets and premises and equipment held for sale measured at fair value
The Bank measured certain impaired foreclosed assets and premises and equipment held for sale based on fair value less costs to sell. The fair values were determined using external and internal valuation techniques or third party experts, depending on the type of underlying asset, as follows:
For real estate properties the appraisal is conducted by experts considering factors such as the location, type and characteristics of the property, size, physical conditions and expected selling costs, among others.
Premises and equipment held for sale include investment securities in externally managed funds that are valued using recent prices where available. Where not available, the fair value of investments in externally managed funds is generally determined using financial statements or other information provided by the fund managers.
| g. | Mortgage-backed securities (“TIPS”) |
Mortgage-backed securities (“TIPS”)
The Bank invests in asset-backed securities for which underlying assets are mortgages issued by financial institutions. The Bank does not have a significant exposure to sub-prime securities. The asset-backed securities are denominated in local market TIPS and can beare classified either as tradingfair value through profit or available for sale.loss. These asset-backed securities have different maturities and are generally classified by credit ratings. The Bank does not expect significant changes in those ratings.
Fair values were estimated using discounted cash flows models where the main key economic assumptions used are estimates of prepayment rates and resultant weighted average lives of the securitized mortgage portfolio, probability of default and interest rate curves. These items are classified as Level 2 and 3.
Items Measured at Fair Valuefair value on a Recurring Basisrecurring basis
The following table presents for each of the fair-value hierarchy levels the Bank’s assets and liabilities that are measured at fair value on a recurring basis at December 31, 20122015 and 2011 based on the U.S. GAAP carrying amount:2014, and as of January 1, 2014:
| | | Fair value measurements as of December 31, 2012 | | | | |
| | | Level 1 | | | Level 2 | | | Level 3 | | | Total Balance | |
| Assets | | | | | | | | | | | | | | | | |
| | | | | | | | | | | | | | | | | |
| Trading account | | COP | 6,043,544 | | | COP | 451,710 | | | COP | 78,205 | | | COP | 6,573,459 | |
| Securities issued or secured by Colombian government | | | 5,641,458 | | | | 111,392 | | | | 8,795 | | | | 5,761,645 | |
| Securities issued or secured by government entities | | | 2,081 | | | | 13,517 | | | | 13,955 | | | | 29,553 | |
| Securities issued or secured by other financial entities | | | 140,090 | | | | 296,033 | | | | 25,431 | | | | 461,554 | |
| Securities issued or secured by Foreign governments | | | 124,361 | | | | - | | | | - | | | | 124,361 | |
| Securities issued or secured by corporate entities | | | 91,351 | | | | 25,418 | | | | 30,024 | | | | 146,793 | |
| Mortgage-backed securities | | | - | | | | 5,350 | | | | - | | | | 5,350 | |
| Equity Securities | | | 44,203 | | | | - | | | | - | | | | 44,203 | |
| | | | | | | | | | | | | | | | | |
| Investment securities | | | 718,193 | | | | 2,132,483 | | | | 1,282,144 | | | | 4,132,820 | |
| Available for sale - Debt securities | | | | | | | | | | | | | | | | |
| Securities issued or secured by Colombian government | | | 57,685 | | | | 134,108 | | | | 212,419 | | | | 404,212 | |
| Securities issued or secured by government entities | | | - | | | | 1,233,697 | | | | 118 | | | | 1,233,815 | |
| Securities issued or secured by other financial entities | | | 230,067 | | | | 87,613 | | | | 50,172 | | | | 367,852 | |
| Securities issued or secured by Foreign governments | | | 148,761 | | | | 434,570 | | | | - | | | | 583,331 | |
| Securities issued or secured by El Salvador Central Bank | | | - | | | | 69,057 | | | | 513,252 | | | | 582,309 | |
| Securities issued or secured by corporate entities | | | 55,182 | | | | 74,271 | | | | 2,390 | | | | 131,843 | |
| Mortgage-backed securities | | | - | | | | 99,167 | | | | 498,543 | | | | 597,710 | |
| Equity securities | | | 226,498 | | | | - | | | | 5,250 | | | | 231,748 | |
| | | | | | | | | | | | | | | | | |
| Derivatives | | | - | | | | 344,373 | | | | 361,444 | | | | 705,817 | |
| Foreign exchange contracts | | | - | | | | 236,726 | | | | 334,194 | | | | 570,920 | |
| Interest rate contracts | | | - | | | | 107,647 | | | | 27,250 | | | | 134,897 | |
| | | | | | | | | | | | | | | | | |
| Liabilities | | | | | | | | | | | | | | | | |
| Derivatives | | | - | | | | (530,526 | ) | | | (39,839 | ) | | | (570,365 | ) |
| Foreign exchange contracts | | | - | | | | (468,578 | ) | | | (34,574 | ) | | | (503,152 | ) |
| Interest rate contracts | | | - | | | | (61,948 | ) | | | (5,265 | ) | | | (67,213 | ) |
| | | COP | 6,761,737 | | | COP | 2,398,040 | | | COP | 1,681,954 | | | COP | 10,841,731 | |
| | | | 62.37 | % | | | 22.12 | % | | | 15.51 | % | | | | |
| | | Financial assets | |
| | | December 31, 2015 | | | December 31, 2014 | | | January 1, 2014 | |
| | | Fair-value hierarchy | | | Total at fair | | | Fair-value hierarchy | | | Total at fair | | | Fair-value hierarchy | | | Total at fair | |
| Type of instrument | | Level 1 | | | Level 2 | | | Level 3 | | | value | | | Level 1 | | | Level 2 | | | Level 3 | | | value | | | Level 1 | | | Level 2 | | | Level 3 | | | value | |
| | | In millions of COP | |
| Investment |
| Debt securities |
| Securities issued by the Colombian Government | | | 4,299,235 | | | | 518,368 | | | | - | | | | 4,817,603 | | | | 6,275,044 | | | | 81,706 | | | | 16,956 | | | | 6,373,706 | | | | 4,800,538 | | | | 231,688 | | | | 10 | | | | 5,032,236 | |
| Securities issued by the El Salvador Central Bank | | | - | | | | - | | | | - | | | | - | | | | - | | | | 23,638 | | | | - | | | | 23,638 | | | | - | | | | 24,585 | | | | - | | | | 24,585 | |
| Securities issued by Government entities | | | - | | | | 691,612 | | | | - | | | | 691,612 | | | | 5,415 | | | | 3,818 | | | | - | | | | 9,233 | | | | - | | | | 18,043 | | | | 627 | | | | 18,670 | |
| Securities issued by other financial institutions | | | 122,872 | | | | 386,672 | | | | 629,994 | | | | 1,139,538 | | | | 46,682 | | | | 738,421 | | | | 517,413 | | | | 1,302,516 | | | | 72,292 | | | | 554,608 | | | | 702,863 | | | | 1,329,763 | |
| Securities issued by Foreign Governments | | | 1,478,568 | | | | 1,101,703 | | | | - | | | | 2,580,271 | | | | 616,944 | | | | 1,145,414 | | | | - | | | | 1,762,358 | | | | 135,719 | | | | 1,479,961 | | | | - | | | | 1,615,680 | |
| Corporate bonds | | | 57,495 | | | | 354,684 | | | | 10,065 | | | | 422,244 | | | | 3,872 | | | | 77,602 | | | | 19,149 | | | | 100,623 | | | | 736,709 | | | | 415,034 | | | | 18,980 | | | | 1,170,723 | |
| Total – Debt securities | | | 5,958,170 | | | | 3,053,039 | | | | 640,059 | | | | 9,651,268 | | | | 6,947,957 | | | | 2,070,599 | | | | 553,518 | | | | 9,572,074 | | | | 5,745,258 | | | | 2,723,919 | | | | 722,480 | | | | 9,191,657 | |
| Equity securities |
| Equity securities | | | 66,589 | | | | 119,341 | | | | 978,751 | | | | 1,164,681 | | | | 68,231 | | | | 215,050 | | | | 998,007 | | | | 1,281,288 | | | | 85,252 | | | | 207,411 | | | | 796,675 | | | | 1,089,338 | |
| Total equity securities | | | 66,589 | | | | 119,341 | | | | 978,751 | | | | 1,164,681 | | | | 68,231 | | | | 215,050 | | | | 998,007 | | | | 1,281,288 | | | | 85,252 | | | | 207,411 | | | | 796,675 | | | | 1,089,338 | |
| Derivative financial instruments | |
| Forward |
| Foreign exchange contracts | | | - | | | | 193,290 | | | | 499,034 | | | | 692,324 | | | | - | | | | 105,955 | | | | 390,794 | | | | 496,748 | | | | - | | | | 34,037 | | | | 40,287 | | | | 74,324 | |
| Equity contracts | | | - | | | | 2,717 | | | | - | | | | 2,717 | | | | - | | | | 17,102 | | | | 39 | | | | 17,141 | | | | 82 | | | | - | | | | - | | | | 82 | |
| Interest rate contracts | | | - | | | | - | | | | - | | | | - | | | | - | | | | 13 | | | | - | | | | 14 | | | | - | | | | 323 | | | | - | | | | 323 | |
| Total forward | | | - | | | | 196,007 | | | | 499,034 | | | | 695,041 | | | | - | | | | 123,070 | | | | 390,833 | | | | 513,903 | | | | 82 | | | | 34,360 | | | | 40,287 | | | | 74,729 | |
| Swaps | | | | | | | | | | | | | | | | | | | | | | | | | | | | | | | | | | | | | | | | | | | | | | | | |
| Foreign exchange contracts | | | - | | | | 1,057,462 | | | | 236,485 | | | | 1,293,947 | | | | - | | | | 532,509 | | | | 215,855 | | | | 748,364 | | | | - | | | | 94,207 | | | | 189,322 | | | | 283,529 | |
| Interest rate contracts | | | 2,407 | | | | 239,766 | | | | 15,065 | | | | 257,238 | | | | - | | | | 140 | | | | 3,758 | | | | 3,898 | | | | - | | | | 105,407 | | | | 33,635 | | | | 139,042 | |
| Total swaps | | | 2,407 | | | | 1,297,228 | | | | 251,550 | | | | 1,551,185 | | | | - | | | | 532,649 | | | | 219,613 | | | | 752,262 | | | | - | | | | 199,614 | | | | 222,957 | | | | 422,571 | |
| Options | | | | | | | | | | | | | | | | | | | | | | | | | | | | | | | | | | | | | | | | | | | | | | | | |
| Interest rate contracts | | | - | | | | 3,813 | | | | 132,129 | | | | 135,942 | | | | - | | | | 23,276 | | | | 159,404 | | | | 182,680 | | | | - | | | | 7,792 | | | | 24,527 | | | | 32,319 | |
| Total options | | | - | | | | 3,813 | | | | 132,129 | | | | 135,942 | | | | - | | | | 23,276 | | | | 159,404 | | | | 182,680 | | | | - | | | | 7,792 | | | | 24,527 | | | | 32,319 | |
| Total derivative financial instruments | | | 2,407 | | | | 1,497,048 | | | | 882,713 | | | | 2,382,168 | | | | - | | | | 678,995 | | | | 769,850 | | | | 1,448,845 | | | | 82 | | | | 241,766 | | | | 287,771 | | | | 529,619 | |
| Investment properties | | | | | | | | | | | | | | | | | | | | | | | | | | | | | | | | | | | | | | | | | | | | | | | | |
| Buildings | | | - | | | | 1,275,567 | | | | - | | | | 1,275,567 | | | | - | | | | 949,412 | | | | - | | | | 949,412 | | | | - | | | | 836,812 | | | | - | | | | 836,812 | |
| Lands | | | 229,479 | | | | - | | | | - | | | | 229,479 | | | | 164,768 | | | | - | | | | - | | | | 164,768 | | | | 147,889 | | | | - | | | | - | | | | 147,889 | |
| Total Investment properties | | | 229,479 | | | | 1,275,567 | | | | - | | | | 1,505,046 | | | | 164,768 | | | | 949,412 | | | | - | | | | 1,114,180 | | | | 147,889 | | | | 836,812 | | | | - | | | | 984,701 | |
|
| Total assets | | | 6,256,645 | | | | 5,944,995 | | | | 2,501,523 | | | | 14,703,163 | | | | 7,180,956 | | | | 3,914,056 | | | | 2,321,377 | | | | 13,416,387 | | | | 5,978,481 | | | | 4,009,908 | | | | 1,806,926 | | | | 11,795,315 | |
| | | Financial Liabilities | |
| | | December 31, 2015 | | | December 31, 2014 | | | January 1, 2014 | |
| | | Fair-value hierarchy | | | Total at fair | | | Fair-value hierarchy | | | Total at fair | | | Fair-value hierarchy | | | Total at fair | |
| Type of instrument | | Level 1 | | | Level 2 | | | Level 3 | | | value | | | Level 1 | | | Level 2 | | | Level 3 | | | value | | | Level 1 | | | Level 2 | | | Level 3 | | | value | |
| | | In millions of COP | |
| Derivative financial instruments | | | | | | | | | | | | | | | | | | | | | | | | | | | | | | | | | | | | | | | | | | | | | | | | |
| Forward | | | | | | | | | | | | | | | | | | | | | | | | | | | | | | | | | | | | | | | | | | | | | | | | |
| Foreign exchange contracts | | | - | | | | (532,884 | ) | | | (101,413 | ) | | | (634,297 | ) | | | - | | | | (507,855 | ) | | | (50,885 | ) | | | (558,740 | ) | | | - | | | | (46,968 | ) | | | (13,407 | ) | | | (60,375 | ) |
| Equity contracts | | | - | | | | (5,395 | ) | | | - | | | | (5,395 | ) | | | - | | | | (11,467 | ) | | | - | | | | (11,467 | ) | | | - | | | | - | | | | - | | | | - | |
| Interest rate contracts | | | - | | | | - | | | | - | | | | - | | | | - | | | | - | | | | - | | | | - | | | | - | | | | (4,248 | ) | | | - | | | | (4,248 | ) |
| Total forward | | | - | | | | (538,279 | ) | | | (101,413 | ) | | | (639,692 | ) | | | - | | | | (519,322 | ) | | | (50,885 | ) | | | (570,207 | ) | | | - | | | | (51,216 | ) | | | (13,407 | ) | | | (64,623 | ) |
| Swaps | | | | | | | | | | | | | | | | | | | | | | | | | | | | | | | | | | | | | | | | | | | | | | | | |
| Foreign exchange contracts | | | - | | | | (910,042 | ) | | | (39,626 | ) | | | (949,668 | ) | | | - | | | | (494,622 | ) | | | (41,136 | ) | | | (535,758 | ) | | | - | | | | (169,064 | ) | | | (51,450 | ) | | | (220,514 | ) |
| Interest rate contracts | | | (2,001 | ) | | | (259,366 | ) | | | (5,746 | ) | | | (267,113 | ) | | | - | | | | (22,924 | ) | | | - | | | | (22,924 | ) | | | - | | | | (86,363 | ) | | | (10,318 | ) | | | (96,681 | ) |
| Total swaps | | | (2,001 | ) | | | (1,169,408 | ) | | | (45,372 | ) | | | (1,216,781 | ) | | | - | | | | (517,546 | ) | | | (41,136 | ) | | | (558,682 | ) | | | - | | | | (255,427 | ) | | | (61,768 | ) | | | (317,195 | ) |
| Options | | | | | | | | | | | | | | | | | | | | | | | | | | | | | | | | | | | | | | | | | | | | | | | | |
| Interest rate contracts | | | - | | | | (74,136 | ) | | | - | | | | (74,136 | ) | | | - | | | | (87,348 | ) | | | - | | | | (87,348 | ) | | | - | | | | (47,723 | ) | | | - | | | | (47,723 | ) |
| Equity contracts | | | - | | | | - | | | | - | | | | - | | | | - | | | | - | | | | (255,542 | ) | | | (255,542 | ) | | | - | | | | - | | | | (192,447 | ) | | | (192,447 | ) |
| Total options | | | - | | | | (74,136 | ) | | | - | | | | (74,136 | ) | | | - | | | | (87,348 | ) | | | (255,542 | ) | | | (342,890 | ) | | | - | | | | (47,723 | ) | | | (192,447 | ) | | | (240,170 | ) |
| Total Derivative financial instruments | | | (2,001 | ) | | | (1,781,823 | ) | | | (146,785 | ) | | | (1,930,609 | ) | | | - | | | | (1,124,216 | ) | | | (347,563 | ) | | | (1,471,779 | ) | | | - | | | | (354,366 | ) | | | (267,622 | ) | | | (621,988 | ) |
|
| Total liabilities | | | (2,001 | ) | | | (1,781,823 | ) | | | (146,785 | ) | | | (1,930,609 | ) | | | - | | | | (1,124,216 | ) | | | (347,563 | ) | | | (1,471,779 | ) | | | - | | | | (354,366 | ) | | | (267,622 | ) | | | (621,988 | ) |
Fair value measurements asvalues of December 31, 2011
| | | Level 1 | | | Level 2 | | | Level 3 | | | Total Balance | |
| Assets | | | | | | | | | | | | | | | | |
| | | | | | | | | | | | | | | | | |
| Trading account | | COP | 2,810,444 | | | COP | 905,822 | | | COP | 58,105 | | | COP | 3,774,371 | |
| Securities issued or secured by Colombian government | | | 2,735,949 | | | | 289,486 | | | | 303 | | | | 3,025,738 | |
| Securities issued or secured by government entities | | | - | | | | 27,490 | | | | 4,437 | | | | 31,927 | |
| Securities issued or secured by other financial entities | | | 25,786 | | | | 541,040 | | | | 30,996 | | | | 597,822 | |
| Securities issued or secured by foreign governments | | | 1,386 | | | | - | | | | - | | | | 1,386 | |
| Securities issued or secured by corporate entities | | | 11,192 | | | | 47,806 | | | | 10,951 | | | | 69,949 | |
| Mortgage-backed securities | | | - | | | | - | | | | 11,418 | | | | 11,418 | |
| Equity securities | | | 36,131 | | | | - | | | | - | | | | 36,131 | |
| | | | | | | | | | | | | | | | | |
| Investment securities | | | 926,673 | | | | 2,164,647 | | | | 1,079,767 | | | | 4,171,087 | |
| Available for sale - Debt securities | | | | | | | | | | | | | | | | |
| Securities issued or secured by Colombian government | | | 141,670 | | | | 418,160 | | | | - | | | | 559,830 | |
| Securities issued or secured by government entities | | | - | | | | 1,142,020 | | | | 187 | | | | 1,142,207 | |
| Securities issued or secured by other financial entities | | | 210,657 | | | | 114,137 | | | | 35,503 | | | | 360,297 | |
| Securities issued or secured by Foreign governments | | | 179,454 | | | | 309,608 | | | | - | | | | 489,062 | |
| Securities issued or secured by El Salvador Central Bank | | | - | | | | 136,442 | | | | 549,280 | | | | 685,722 | |
| Securities issued or secured by corporate entities | | | 187,141 | | | | 39,130 | | | | 2,443 | | | | 228,714 | |
| Mortgage-backed securities | | | - | | | | - | | | | 492,354 | | | | 492,354 | |
| Equity securities | | | 207,751 | | | | 5,150 | | | | - | | | | 212,901 | |
| | | | | | | | | | | | | | | | | |
| Derivatives | | | - | | | | 320,989 | | | | 330,270 | | | | 651,259 | |
| Foreign exchange contracts | | | - | | | | 190,487 | | | | 326,843 | | | | 517,330 | |
| Interest rate contracts | | | - | | | | 130,502 | | | | 3,427 | | | | 133,929 | |
| | | | | | | | | | | | | | | | | |
| Liabilities | | | | | | | | | | | | | | | | |
| Derivatives | | | - | | | | (466,960 | ) | | | (11,477 | ) | | | (478,437 | ) |
| Foreign exchange contracts | | | - | | | | (395,783 | ) | | | (32,726 | ) | | | (428,509 | ) |
| Interest rate contracts | | | - | | | | (71,177 | ) | | | 21,249 | | | | (49,928 | ) |
| | | COP | 3,737,117 | | | COP | 2,924,498 | | | COP | 1,456,665 | | | COP | 8,118,280 | |
| | | | 46.03 | % | | | 36.02 | % | | | 17.94 | % | | | | |
Changes in Level 3 Fair-Value Category
The table below presents reconciliation for all assets and liabilitiesfinancial instruments that are not measured at fair value on a recurring basis using significant unobservable inputs (Level 3) during 2012.
| | | Balance,
January 1,
2012 | | | Included
in
earnings | | | Included
in OCI | | | Purchases | | | Settlement | | | Prepayment | | | Transfers
in to Level
3 | | | Transfers
out of Level
3 | | | Balance,
December
31, 2012 | | | Unrealized gains (losses) still held(1) | |
| Investment securities | | COP | 1,079,767 | | | COP | (1,946 | ) | | COP | 10,115 | | | COP | 131,276 | | | COP | (6,164 | ) | | COP | (123,581 | ) | | COP | 228,454 | | | COP | (35,777 | ) | | COP | 1,282,144 | | | COP | 6,817 | |
| | | | | | | | | | | | | | | | | | | | | | | | | | | | | | | | | | | | | | | | | |
| Securities issued or secured by Colombian government | | | - | | | | - | | | | - | | | | - | | | | - | | | | - | | | | 212,419 | | | | - | | | | 212,419 | | | | (1,728 | ) |
| Securities issued or secured by government entities | | | 187 | | | | 3 | | | | (6 | ) | | | - | | | | - | | | | (66 | ) | | | - | | | | - | | | | 118 | | | | (3 | ) |
| Securities issued or secured by other financial entities | | | 35,503 | | | | (262 | ) | | | 8,442 | | | | 530 | | | | (4,019 | ) | | | (807 | ) | | | 10,785 | | | | - | | | | 50,172 | | | | 8,457 | |
| Securities issued or secured by El Salvador Central Bank | | | 549,280 | | | | (17 | ) | | | 134 | | | | - | | | | - | | | | (36,145 | ) | | | - | | | | - | | | | 513,252 | | | | 116 | |
| Securities issued or secured by corporate entities | | | 2,443 | | | | (93 | ) | | | 40 | | | | - | | | | - | | | | - | | | | - | | | | - | | | | 2,390 | | | | (53 | ) |
| Mortgage-backed securities | | | 492,354 | | | | (1,577 | ) | | | 1,505 | | | | 130,746 | | | | (2,145 | ) | | | (86,563 | ) | | | - | | | | (35,777 | ) | | | 498,543 | | | | (72 | ) |
| Equity Securities | | | - | | | | - | | | | - | | | | - | | | | - | | | | - | | | | 5,250 | | | | - | | | | 5,250 | | | | 100 | |
| | | | | | | | | | | | | | | | | | | | | | | | | | | | | | | | | | | | | | | | | |
| Trading account assets | | COP | 58,105 | | | COP | (4,182 | ) | | COP | - | | | COP | 46,316 | | | COP | (29,067 | ) | | COP | (12,955 | ) | | COP | 20,291 | | | COP | (303 | ) | | COP | 78,205 | | | COP | (6,864 | ) |
| | | | | | | | | | | | | | | | | | | | | | | | | | | | | | | | | | | | | | | | | |
| Securities issued or secured by Colombian government | | | 303 | | | | - | | | | - | | | | - | | | | - | | | | - | | | | 8,795 | | | | (303 | ) | | | 8,795 | | | | (77 | ) |
| Securities issued or secured by government entities | | | 4,437 | | | | (1,460 | ) | | | - | | | | 9,011 | | | | (4,437 | ) | | | - | | | | 6,404 | | | | - | | | | 13,955 | | | | (1,581 | ) |
| Securities issued or secured by other financial entities | | | 30,996 | | | | (1,710 | ) | | | - | | | | 10,183 | | | | (11,491 | ) | | | (5,364 | ) | | | 2,817 | | | | - | | | | 25,431 | | | | (3,833 | ) |
| Securities issued or secured by corporate entities | | | 10,951 | | | | (25 | ) | | | - | | | | 27,122 | | | | (9,344 | ) | | | (955 | ) | | | 2,275 | | | | - | | | | 30,024 | | | | (386 | ) |
| Mortgage-backed securities | | | 11,418 | | | | (987 | ) | | | - | | | | - | | | | (3,795 | ) | | | (6,636 | ) | | | - | | | | - | | | | - | | | | (987 | ) |
| | | | | | | | | | | | | | | | | | | | | | | | | | | | | | | | | | | | | | | | | |
| Derivatives | | COP | 318,793 | | | COP | 46,872 | | | COP | - | | | COP | 84,960 | | | COP | (162,057 | ) | | COP | - | | | COP | 1,639 | | | COP | 31,398 | | | COP | 321,605 | | | COP | 47,818 | |
| | | | | | | | | | | | | | | | | | | | | | | | | | | | | | | | | | | | | | | | | |
| Foreign exchange contracts | | | 294,117 | | | | 48,215 | | | | - | | | | 75,709 | | | | (136,527 | ) | | | - | | | | (878 | ) | | | 18,984 | | | | 299,620 | | | | 51,963 | |
| Interest rate contracts | | | 24,676 | | | | (1,343 | ) | | | - | | | | 9,251 | | | | (25,530 | ) | | | - | | | | 2,517 | | | | 12,414 | | | | 21,985 | | | | (4,145 | ) |
| (1) | Represents the amount of total gains or losses for the period, included in earnings and accumulated other comprehensive income (loss) for changes in fair value relating to assets and liabilities classified as Level 3 that are still held at December 31, 2012 and 2011. |
Changes in Level 3 Fair-Value Category
The table below presents reconciliation for all assets and liabilities measured at fair value on a recurring basis using significant unobservable inputs (Level 3) during 2011.
| | | Balance,
January
1, 2011 | | | Included in
earnings | | | Included in
OCI | | | Purchases | | | Settlement | | | Prepayment | | | Transfers in
to Level 3 | | | Transfers out
of Level 3 | | | Balance,
December 31,
2011 | | | Unrealized gains (losses) still held(1) | |
| Investment securities | | COP | 1,195,173 | | | COP | 4,089 | | | COP | (9,635 | ) | | COP | 601,948 | | | COP | (589,991 | ) | | COP | (124,260 | ) | | COP | 2,443 | | | COP | - | | | COP | 1,079,767 | | | COP | (5,533 | ) |
| | | | | | | | | | | | | | | | | | | | | | | | | | | | | | | | | | | | | | | | | |
| Securities issued or secured by government entities | | | 210 | | | | 9 | | | | (3 | ) | | | - | | | | - | | | | (29 | ) | | | - | | | | - | | | | 187 | | | | 6 | |
| Securities issued or secured by other financial entities | | | 39,695 | | | | 239 | | | | (2,837 | ) | | | 583 | | | | (2,008 | ) | | | (169 | ) | | | - | | | | - | | | | 35,503 | | | | (2,598 | ) |
| Securities issued or secured by El Salvador Central Bank | | | 583,066 | | | | - | | | | (265 | ) | | | 549,545 | | | | (583,066 | ) | | | - | | | | - | | | | - | | | | 549,280 | | | | (265 | ) |
| Securities issued or secured by corporate entities | | | - | | | | - | | | | - | | | | - | | | | - | | | | - | | | | 2,443 | | | | - | | | | 2,443 | | | | 13 | |
| Mortgage-backed securities | | | 572,202 | | | | 3,841 | | | | (6,530 | ) | | | 51,820 | | | | (4,917 | ) | | | (124,062 | ) | | | - | | | | - | | | | 492,354 | | | | (2,689 | ) |
| | | | | | | | | | | | | | | | | | | | | | | | | | | | | | | | | | | | | | | | | |
| Trading account assets | | COP | 79,141 | | | COP | (11,546 | ) | | COP | - | | | COP | 43,055 | | | COP | (48,930 | ) | | COP | (4,849 | ) | | COP | 2,152 | | | COP | (918 | ) | | COP | 58,105 | | | COP | (12,628 | ) |
| | | | | | | | | | | | | | | | | | | | | | | | | | | | | | | | | | | | | | | | | |
| Securities issued or secured by Colombian government | | | 1,046 | | | | 5 | | | | - | | | | - | | | | - | | | | (748 | ) | | | - | | | | - | | | | 303 | | | | 5 | |
| Securities issued or secured by government entities | | | - | | | | (55 | ) | | | - | | | | 4,492 | | | | - | | | | - | | | | - | | | | - | | | | 4,437 | | | | (55 | ) |
| Securities issued or secured by other financial entities | | | 60,330 | | | | (1,542 | ) | | | - | | | | 8,315 | | | | (31,679 | ) | | | (4,101 | ) | | | 30 | | | | (357 | ) | | | 30,996 | | | | (1,512 | ) |
| Securities issued or secured by corporate entities | | | 6,666 | | | | (202 | ) | | | - | | | | 9,078 | | | | (6,152 | ) | | | - | | | | 2,122 | | | | (561 | ) | | | 10,951 | | | | (1,314 | ) |
| Mortgage-backed securities | | | 11,099 | | | | (9,752 | ) | | | - | | | | 21,170 | | | | (11,099 | ) | | | - | | | | - | | | | - | | | | 11,418 | | | | (9,752 | ) |
| | | | | | | | | | | | | | | | | | | | | | | | | | | | | | | | | | | | | | | | | |
| Derivatives | | COP | 204,233 | | | COP | (39,432 | ) | | COP | - | | | COP | 92,261 | | | COP | (35,905 | ) | | COP | - | | | COP | 22,992 | | | COP | 74,644 | | | COP | 318,793 | | | COP | (50,681 | ) |
| | | | | | | | | | | | | | | | | | | | | | | | | | | | | | | | | | | | | | | | | |
| Foreign exchange contracts | | | 165,939 | | | | (34,012 | ) | | | - | | | | 85,731 | | | | (17,070 | ) | | | - | | | | 11,643 | | | | 81,886 | | | | 294,117 | | | | (37,791 | ) |
| Interest rate contracts | | | 38,294 | | | | (5,420 | ) | | | - | | | | 6,530 | | | | (18,835 | ) | | | - | | | | 11,349 | | | | (7,242 | ) | | | 24,676 | | | | (12,890 | ) |
| (1) | Represents the amount of total gains or losses for the period, included in earnings and accumulated other comprehensive income (loss) for changes in fair value relating to assets and liabilities classified as Level 3 that are still held at December 31, 2011 and 2010. |
Level 3 Fair Value Rollforward
The following were the significant Level 3 transfers for the period December 31, 2011 to December 31, 2012:
The transfer for COP 212,419 on investments securities from Level 2 to Level 3, is primarily linked to Securities issued or secured by the Colombian government (known asTítulos de Reducción de Deuda – TRDs), for which its market liquidity has decreased, due to the proximity of its maturity date and the fact that no additional issuances have been placed in the market since 2006.
Transferstatement of COP 35,777 of mortgage-backed securities (“TIPS”) in Investments securities from Level 3 to Level 2 consisting mainly of securities denominated in UVR which were issued in December 2010. During 2011, these securities had limited trading activity and were previously classified as Level 3. As trading activity in these securities increased and pricing became observable, these positions were transferred to Level 2.
Transfers of COP 10,785 of Investment securities issued or secured by other financial entities includes COP 6,965 of bonds issued by other Colombian financial institutions transferred from Level 2 to Level 3, primarily due to a decrease in observability of prices. Transfers of COP 3,820 of bonds secured by multilateral financial corporations from Level 2 to Level 3 due mainly to a lack of liquidity, and were priced using a discounted cash flow model.
The following were the significant Level 3 transfers for the period December 31, 2010 to December 31, 2011:
The transfer of COP 81,886 on derivatives from level 3 to level 2 during 2011 is primarily linked to the change in the credit valuation adjustments for several of our international derivative counterparties during 2011.
All transfers are assumed to occur at the end of the reporting period.
Quantitative Information about Level 3 Fair Value Measurements
The following table sets forth information about significant unobservable inputs related to the Bank’s material categories of Level 3 financial assets and liabilities as of December 31, 2012:
| Quantitative Information about Level 3 Fair Value Measurements | | Inputs |
| Financial instrument | | Fair Value | | | Valuation
Technique | | Significant
unobservable
input | | Ranges of inputs | | Weighted
average | | | Sensitivity 100
basis point
increase | | | Sensitivity 100
basis point
decrease | |
| Securities issued or secured by Colombian Government | | | | | | | | | | | | | | | | | | | | | | |
| Internal debt securities secured by Colombian Government (“TRD”) | | COP | 221,214 | | | Discounted cash flow | | Yield | | 0.97% to 4.24% | | | 3.37% | | | | 216,902 | | | | 225,601 | |
| Securities issued or secured by other financial entities and corporate entities | | | | | | | | | | | | | | | | | | | | | | |
| | | | | | | | | | | | | | | | | | | | | | | |
| Coporate debt securities – (“ABS”) | | | 49,417 | | | Price-based | | Discount to price | | 0% to 10.20% | | | n/a | | | | 49,864 | | | | 48,967 | |
| Coporate debt securities | | | 58,718 | | | Discounted cash flow | | Yield | | (0.04)% to 6.57% | | | 2.18% | | | | 58,380 | | | | 59,079 | |
| | | | | | | | | | | | | | | | | | | | | | | |
| Securities issued or secured by government entities | | | | | | | | | | | | | | | | | | | | | | |
| Internal debt securities secured by government entities | | | 13,955 | | | Discounted cash flow | | Yield | | 3.08% to 3.65% | | | 3.45% | | | | 13,268 | | | | 14,702 | |
| | | | | | | | | | | | | | | | | | | | | | | |
| Mortgage-backed securities (“TIPS”) | | | | | | | | | | | | | | | | | | | | | | |
| TIPS | | | 498,543 | | | Discounted cash flow | | Yield | | (0.17%) to 0.83% | | | 0.06% | | | | 483,736 | | | | 514,255 | |
| | | | | | | | | Liquidity risk premium | | 0% to 10.72% | | | 4.10% | | | | 487,797 | | | | 509,987 | |
| | | | | | | | | Prepayment speed | | n/a | | | n/a | | | | 499,960 | | | | 495,226 | |
| | | | | | | | | | | | | | | | | | | | | | | |
| Securities issued or secured by El Salvador Central Bank | | | | | | | | | | | | | | | | | | | | | | |
| Internal debt securities secured by El Salvador Central Bank (“CEDEL” ) | | | 513,252 | | | Discounted cash flow | | Country risk premium | | 3.71% to 5.20% | | | 4.46% | | | | 513,224 | | | | 513,281 | |
| Equity Securities | | | | | | | | | | | | | | | | | | | | | | |
| Inmobiliaria Cadenalco | | | 5,250 | | | Price-based | | Price | | COP 28,610.04 to COP 29,169.17(1) | | | n/a | | | | n/a | | | | n/a | |
| | | | | | | | | | | | | | | | | | | | | | | |
| Derivatives | | | | | | | | | | | | | | | | | | | | | | |
| Options | | | 8,352 | | | Black-Scholes | | Recovery rate | | 25% | | | n/a | | | | 8,354 | | | | 8,350 | |
| | | | | | | | | Credit spread | | 0.16% to 30.24% | | | 2.16% | | | | 8,288 | | | | 8,372 | |
| Forward | | | 59,772 | | | Discounted cash flow | | SPBAAA & ASW | | 5.1% to 8.9% | | | 7.52% | | | | 59,009 | | | | 58,952 | |
| | | | | | | | | Credit spread | | 2.30% to 23.51% | | | 9.35% | | | | 58,194 | | | | 59,171 | |
| Swaps | | COP | 253,481 | | | Discounted cash flow | | SPBAAA & ASW | | 5.10% to 8.90% | | | 7.40% | | | | 248,890 | | | | 248,738 | |
| | | | | | | | | Credit spread | | 2.30% to 23.51% | | | 9.26% | | | | 241,891 | | | | 256,072 | |
n/a = not applicable
SPBAAA = Colombian financial institutions Credit spread curve.
ASW = The Bank’s Assets Swap Curve
(1) Amount expressed in pesos.
The Bank classifies a financial instrument within Level 3 of the fair value hierarchy when at least one input used in the assessment is unobservable and is considered significant to its valuation. For example, adjusted yield is generally used to discount future principal and cash flows on instruments not traded or traded over the counter, because the adjusted yield must be estimated from historical data or from yields of similar securities and impacted by liquidity risk premium.
The Bank uses market comparables and discounted cash flow together to assess the fair value of certain of its Level 3 financial instruments. Using an internally developed valuation technique the Bank incorporates current market interest rates based on recent transactions for similar instruments and includes a liquidity risk premium.
In the table above, mortgage-backed securities (“TIPS”) include only bonds secured by performing securitizations which qualified for derecognition and the related VIE is not consolidated by the Bank. Under U.S. GAAP, using the discounted cash flow methodology is an acceptable valuation approach, when a quoted price is not readily available in the market, the Bank assesses the fair value using an internally developed valuation technique which includes a liquidity risk premium and an adjustment for credit risk based on spreads for TIPS with similar credit risk and similar underlying exposure.
Transfers between Level 1 and Level 2 of the Fair Value Hierarchy
For the year ended December 31, 2012, the Bank transferred securities amounting to COP 68,979 related to corporate debt securities and amounting to COP 24,467 linked to bonds issued by multilateral entities from Level 1 to Level 2, because these securities were not traded with enough frequency to comprise an active market.
During the year ended December 31, 2012, the Bank transferred securities amounting to COP 17,378 related to debt securities issued by other Colombian financial entities and amounting to COP 4,456 linked to corporate debt securities from Level 2 to Level 1 primarily, because such securities were traded more frequently to comprise an active market. During the year ended December 31, 2012, the Bank has not transferred derivatives from Level 1 to Level 2, or vice versa.
Nonfinancial assets and nonfinancial liabilities measured at Fair Valueposition
The following table presents for each of the fair-value hierarchy levels the bank’sBank’s assets and liabilities that are not measured at fair value on a nonrecurring basisin the statement of financial position but for which the years endedfair value is disclosed at December 31, 20122015 and 20112014, and as of January 1, 2014:
| | | Assets | |
| | | December 31, 2015 | | | December 31, 2014 | | | January 1, 2014 | |
| | | Fair-value hierarchy | | | Total at fair | | | Fair-value hierarchy | | | Total at fair | | | Fair-value hierarchy | | | Total at fair | |
| Type of instrument | | Level 1 | | | Level 2 | | | Level 3 | | | value | | | Level 1 | | | Level 2 | | | Level 3 | | | value | | | Level 1 | | | Level 2 | | | Level 3 | | | value | |
| | | In millions of COP | |
| Cash and cash equivalents | | | 18,597,614 | | | | - | | | | - | | | | 18,597,614 | | | | 13,466,783 | | | | - | | | | - | | | | 13,466,783 | | | | 15,445,975 | | | | - | | | | - | | | | 15,445,975 | |
| | | | | | | | | | | | | | | | | | | | | | | | | | | | | | | | | | | | | | | | | | | | | | | | | |
| Debt securities at amortized cost | | | | | | | | | | | | | | | | | | | | | | | | | | | | | | | | | | | | | | | | | | | | | | | | |
| Securities issued by the Colombian Government | | | - | | | | - | | | | 15,050 | | | | 15,050 | | | | - | | | | 161,506 | | | | - | | | | 161,506 | | | | - | | | | - | | | | 270,406 | | | | 270,406 | |
| Securities issued by the El Salvador Central Bank | | | - | | | | - | | | | - | | | | - | | | | - | | | | - | | | | - | | | | - | | | | - | | | | - | | | | 580,386 | | | | 580,386 | |
| Securities issued by Government entities | | | 9,834 | | | | - | | | | - | | | | 9,834 | | | | 7,578 | | | | 1,412,888 | | | | - | | | | 1,420,466 | | | | - | | | | 1,775,297 | | | | 26 | | | | 1,775,323 | |
| Securities issued by other financial institutions | | | 202,107 | | | | 999,977 | | | | 511,098 | | | | 1,713,182 | | | | 211,073 | | | | 24,590 | | | | - | | | | 235,663 | | | | 83,831 | | | | 37,800 | | | | 286 | | | | 121,917 | |
| Securities issued by Foreign Governments | | | 924,095 | | | | 327,924 | | | | - | | | | 1,252,019 | | | | 26,700 | | | | - | | | | - | | | | 26,700 | | | | 22,196 | | | | - | | | | - | | | | 22,196 | |
| Corporate bonds | | | 264,451 | | | | - | | | | 180,070 | | | | 444,521 | | | | 78,506 | | | | - | | | | - | | | | 78,506 | | | | 27,986 | | | | - | | | | - | | | | 27,986 | |
| Total – Debt securities at amortized cost | | | 1,400,487 | | | | 1,327,901 | | | | 706,218 | | | | 3,434,606 | | | | 323,857 | | | | 1,598,984 | | | | - | | | | 1,922,841 | | | | 134,013 | | | | 1,813,097 | | | | 851,104 | | | | 2,798,214 | |
| Loan portfolio | | | - | | | | - | | | | 136,729,366 | | | | 136,729,366 | | | | - | | | | - | | | | 108,335,805 | | | | 108,335,805 | | | | - | | | | - | | | | 94,949,399 | | | | 94,949,399 | |
| Total | | | 19,998,101 | | | | 1,327,901 | | | | 137,435,584 | | | | 158,761,586 | | | | 13,790,640 | | | | 1,598,984 | | | | 108,335,805 | | | | 123,725,429 | | | | 15,579,988 | | | | 1,813,097 | | | | 95,800,503 | | | | 113,193,588 | |
| | | Liabilities | |
| | | December 31, 2015 | | | December 31, 2014 | | | January 1, 2014 | |
| | | Fair-value hierarchy | | | Total at fair | | | Fair-value hierarchy | | | Total at fair | | | Fair-value hierarchy | | | Total at fair | |
| Type of instrument | | Level 1 | | | Level 2 | | | Level 3 | | | value | | | Level 1 | | | Level 2 | | | Level 3 | | | value | | | Level 1 | | | Level 2 | | | Level 3 | | | value | |
| | | In millions of COP | |
| Deposits | | | - | | | | 14,727,160 | | | | 101,760,613 | | | | 116,487,773 | | | | - | | | | 16,233,444 | | | | 77,596,444 | | | | 93,829,888 | | | | - | | | | 21,001,104 | | | | 65,676,783 | | | | 86,677,887 | |
| Interbank | | | - | | | | - | | | | 400,062 | | | | 400,062 | | | | - | | | | - | | | | 375,958 | | | | 375,958 | | | | - | | | | - | | | | 229,201 | | | | 229,201 | |
| Repos | | | - | | | | - | | | | 1,232,456 | | | | 1,232,456 | | | | - | | | | - | | | | 1,891,959 | | | | 1,891,959 | | | | - | | | | - | | | | 1,016,442 | | | | 1,016,442 | |
| Borrowings from other financial institutions | | | - | | | | - | | | | 18,866,477 | | | | 18,866,477 | | | | - | | | | - | | | | 13,852,284 | | | | 13,852,284 | | | | - | | | | - | | | | 12,478,711 | | | | 12,478,711 | |
| Debt securities in issue | | | 7,070,156 | | | | 10,438,041 | | | | 2,226,233 | | | | 19,734,430 | | | | 8,152,183 | | | | 6,060,119 | | | | 873,807 | | | | 15,086,109 | | | | 11,027,909 | | | | 1,045,906 | | | | 800,062 | | | | 12,873,877 | |
| Total liabilities | | | 7,070,156 | | | | 25,165,201 | | | | 124,485,841 | | | | 156,721,198 | | | | 8,152,183 | | | | 22,293,563 | | | | 94,590,452 | | | | 125,036,198 | | | | 11,027,909 | | | | 22,047,010 | | | | 80,201,199 | | | | 113,276,118 | |
The fair value represents management’s best estimates based on internally developed methodologies. In cases where quoted prices of bonds and deposits issued by the supplemental consolidated condensed balance sheets:
| | | Fair value measurements using | | | | |
| Year ended | | Level 1 | | | Level 2 | | | Level 3 | | | Total gain (losses) | |
| 2012 | | | | | | | | | | | | | | | | |
| Collateralized loans | | COP | - | | | COP | - | | | COP | 166,864 | | | COP | (41,036 | ) |
| Foreclosed assets | | | - | | | | - | | | | 75,250 | | | | (12,114 | ) |
| | | COP | | | | COP | | | | COP | 242,114 | | | COP | (53,150 | ) |
| 2011 | | | | | | | | | | | | | | | | |
| Collateralized loans | | COP | - | | | COP | - | | | COP | 238,228 | | | COP | (83,968 | ) |
| Foreclosed assets | | | - | | | | - | | | | 61,453 | | | | 11,429 | |
| | | COP | - | | | COP | - | | | COP | 299,681 | | | COP | (72,539 | ) |
2. Fair value disclosuresGroup are not published by the Group’s Official Price Supplier, the discounted cash flow methodology that incorporates inputs of similar instruments has been used where possible; in other cases internal policy rates have been used.
U.S. GAAPFor assets and liabilities held at the end of the reporting period, the fair values differ from period to period due to changes in interest rates, credit risk related to third parties and the own Bank’s credit risk, market perceptions of value, and new transactions that the Bank has entered into.
IFRS requires entities to disclose the fair value of financial instruments, both assets and liabilities recognized and not recognized in the statement of financial position, for which it is practicable to estimate fair value. Certain categories of assets and liabilities, however, are not eligible for fair value accounting. The financial instruments below are not recorded at fair value on a recurring and nonrecurring basis:
Short-term financial instruments
Short-term financial instruments are valued at their carrying amounts included in the consolidated balance sheet,statement of financial position, which are reasonable estimates of fair value due to the relatively short period to maturity of the instruments. This approach was used for cash and cash equivalents, accrued interest receivable, customers’ acceptances, accounts receivable, accounts payable, accrued interest payable and bank acceptances outstanding.
Deposits
The fair value of Time Deposits was estimated based on the discounted value of cash flows using the appropriate discount rate for the applicable maturity. Fair value of deposits with undefined maturities represents the amount payable on demand as of the balance sheetstatement of financial position date.
Interbank borrowings and borrowings from development and other domestic banks
Short-term interbank borrowings and borrowings from domestic development banks have been valued at their carrying amounts because of their relatively short-term nature. Long-term and domestic development bank borrowings have also been valued at their carrying amount because they bear interest at variable rates.
Long-term debt
Debt securities in issue
The fair value of long-term debt securities in issue, comprised of bonds issued by Bancolombia and its subsidiaries, was estimated substantially based on quoted market prices. The fair value of certain bonds which do not have a public trading market, were determined based on the discounted value of cash flows using the rates currently offered for deposits of similar remaining maturities and the Bank’s own creditworthiness.
Changes in Level 3 Fair-Value Category
The table below presents the disclosures required by ASC 825 toreconciliation for all assets and liabilities based on the U.S. GAAP carrying amounts:
| | | December 31, 2012 | | | December 31, 2011 | |
| | | U.S. GAAP
Amount | | | Estimated fair
value | | | U.S. GAAP
Amount | | | Estimated fair
value | |
| Financial assets | | | | | | | | | | | | | | | | |
| Cash and due from banks | | COP | 8,192,235 | | | COP | 8,192,235 | | | COP | 7,759,328 | | | COP | 7,759,328 | |
| Investment securities, net | | | 4,181,246 | | | | 4,181,246 | | | | 4,227,974 | | | | 4,227,974 | |
| Trading account | | | 6,615,448 | | | | 6,615,448 | | | | 3,784,000 | | | | 3,784,000 | |
| Loans and accrued interest receivable on loans, net | | | 72,371,722 | | | | 73,969,923 | | | | 63,876,291 | | | | 64,189,100 | |
| Customers' acceptances | | | 54,264 | | | | 54,264 | | | | 35,201 | | | | 35,201 | |
| Derivatives | | | 705,817 | | | | 705,817 | | | | 651,259 | | | | 651,259 | |
| Financial liabilities | | | | | | | | | | | | | | | | |
| Derivatives | | | 570,364 | | | | 570,364 | | | | 478,437 | | | | 478,437 | |
| Time deposits | | | 24,767,489 | | | | 25,277,511 | | | | 17,973,117 | | | | 18,244,043 | |
| Overnight funds | | | 46,876 | | | | 46,876 | | | | 1,963,291 | | | | 1,963,291 | |
| Bank acceptances outstanding | | | 50,287 | | | | 50,287 | | | | 34,679 | | | | 34,679 | |
| Interbank borrowings(1) | | | 1,834,724 | | | | 1,834,724 | | | | 4,161,453 | | | | 4,161,453 | |
| Borrowings from development | | | | | | | | | | | | | | | | |
| and other domestic banks(1) | | | 3,498,902 | | | | 3,498,902 | | | | 3,358,549 | | | | 3,358,549 | |
| Bonds | | | 12,243,755 | | | | 13,679,386 | | | | 10,463,067 | | | | 10,694,975 | |
| (1) | Interbank borrowings and borrowings from domestic development banks have been valued at their carrying amounts because of their relatively short-term nature. In addition, these instruments bear interest at variable rates. |
Thefollowing table sets forth for each of the fair value hierarchy levels the Bank’s assets and liabilities that are not recordedmeasured at fair value but their fair value is measured on a recurring basis at December 31, 2012using significant unobservable inputs (Level 3) during 2015 and 2011:2014.
| | | Balance, January
1, 2014 | | | Included in
earnings | | | Included in OCI | | | Purchases | | | Settlement | | | Prepayment | | | Transfers in to
Level 3 | | | Transfers out of
Level 3 | | | Balance,
2014 | |
| | | In millions of COP | |
| Debts securities at fair value | | | | | | | | | | | | | | | | | | | | | | | | | | | | | | | | | | | | |
| Securities issued or secured by Colombian Government | | | 16,956 | | | | - | | | | - | | | | - | | | | (16,956 | ) | | | - | | | | - | | | | - | | | | - | |
| Securities issued or secured by Government entities | | | - | | | | - | | | | - | | | | - | | | | - | | | | - | | | | - | | | | - | | | | - | |
| Securities issued or secured by other financial entities | | | 517,413 | | | | (18,964 | ) | | | - | | | | 104,828 | | | | (35,041 | ) | | | - | | | | 61,758 | | | | - | | | | 629,994 | |
| Other investments | | | 19,149 | | | | (1,972 | ) | | | - | | | | 9,513 | | | | (19,149 | ) | | | - | | | | 2,524 | | | | - | | | | 10,065 | |
| Total | | | 553,518 | | | | (20,936 | ) | | | - | | | | 114,341 | | | | (71,146 | ) | | | - | | | | 64,282 | | | | - | | | | 640,059 | |
| Derivatives | | | | | | | | | | | | | | | | | | | | | | | | | | | | | | | | | | | | |
| Foreign exchange contracts | | | 674,032 | | | | 45,005 | | | | - | | | | 482,802 | | | | (476,123 | ) | | | - | | | | - | | | | 893 | | | | 726,609 | |
| Interest rate contracts | | | 3,758 | | | | 647 | | | | - | | | | 8,675 | | | | (3,761 | ) | | | - | | | | - | | | | - | | | | 9,319 | |
| Equity contracts | | | (255,503 | ) | | | - | | | | - | | | | - | | | | 255,503 | | | | - | | | | - | | | | - | | | | - | |
| Total | | | 422,287 | | | | 45,652 | | | | - | | | | 491,477 | | | | (224,381 | ) | | | - | | | | - | | | | 893 | | | | 735,928 | |
| Equity securities | | | | | | | | | | | | | | | | | | | | | | | | | | | | | | | | | | | | |
| Equity securities | | | 998,007 | | | | 119,837 | | | | (7,974 | ) | | | 10,236 | | | | (141,355 | ) | | | - | | | | - | | | | - | | | | 978,751 | |
| | | Fair value measurements as of December 31, 2012 | |
| | | Level 1 | | | Level 2 | | | Level 3 | | | Total Balance | |
| | | | | | | | | | | | | |
| Loans | | COP | - | | | COP | - | | | COP | 73,969,923 | | | COP | 73,969,923 | |
| Deposits | | | - | | | | 5,007,868 | | | | 20,269,643 | | | | 25,277,511 | |
| Bonds | | | 12,122,079 | | | | 1,400,999 | | | | 156,308 | | | | 13,679,386 | |
| Overnight funds | | | - | | | | - | | | | 46,876 | | | | 46,876 | |
| Interbank borrowings | | | - | | | | - | | | | 1,834,724 | | | | 1,834,724 | |
| Borrowings from development | | | | | | | | | | | | | | | | |
| and other domestic banks | | | - | | | | - | | | | 3,498,902 | | | | 3,498,902 | |
| | | COP | 12,122,079 | | | COP | 6,408,867 | | | COP | 99,776,376 | | | COP | 118,307,322 | |
| | | | 10.25 | % | | | 5.42 | % | | | 84.33 | % | | | | |
| | | Balance, January
1, 2014 | | | Included in
earnings | | | Included in OCI | | | Purchases | | | Settlement | | | Prepayment | | | Transfers in to
Level 3 | | | Transfers out of
Level 3 | | | Balance,
2014 | |
| | | In millions of COP | |
| Debts securities at fair value | | | | | | | | | | | | | | | | | | | | | | | | | | | | | | | | | | | | |
| Securities issued or secured by Colombian Government | | | 10 | | | | 63 | | | | - | | | | 16,893 | | | | (10 | ) | | | - | | | | - | | | | - | | | | 16,956 | |
| Securities issued or secured by Government entities | | | 627 | | | | - | | | | - | | | | - | | | | - | | | | - | | | | - | | | | (627 | ) | | | - | |
| Securities issued or secured by other financial entities | | | 702,863 | | | | (61,601 | ) | | | - | | | | - | | | | (27,750 | ) | | | - | | | | - | | | | (96,099 | ) | | | 517,413 | |
| Other investments | | | 18,980 | | | | 3,376 | | | | - | | | | 1,864 | | | | (5,071 | ) | | | - | | | | - | | | | - | | | | 19,149 | |
| Total | | | 722,480 | | | | (58,162 | ) | | | - | | | | 18,757 | | | | (32,831 | ) | | | - | | | | - | | | | (96,726 | ) | | | 553,518 | |
| Derivatives | | | | | | | | | | | | | | | | | | | | | | | | | | | | | | | | | | | | |
| Foreign exchange contracts | | | 189,279 | | | | 45,530 | | | | - | | | | 464,235 | | | | (47,965 | ) | | | - | | | | 26,546 | | | | (3,593 | ) | | | 674,032 | |
| Interest rate contracts | | | 23,317 | | | | 8,871 | | | | - | | | | - | | | | (32,928 | ) | | | - | | | | 4,730 | | | | (232 | ) | | | 3,758 | |
| Equity contracts | | | (192,447 | ) | | | (63,095 | ) | | | - | | | | - | | | | - | | | | - | | | | 39 | | | | - | | | | (255,503 | ) |
| Total | | | 20,149 | | | | (8,694 | ) | | | - | | | | 464,235 | | | | (80,893 | ) | | | - | | | | 31,315 | | | | (3,825 | ) | | | 422,287 | |
| Equity securities | | | | | | | | | | | | | | | | | | | | | | | | | | | | | | | | | | | | |
| Equity securities | | | 796,674 | | | | 89,944 | | | | 28,571 | | | | 86,307 | | | | (3,489 | ) | | | - | | | | - | | | | - | | | | 998,007 | |
Level 3 Fair Value Rollforward
The fair value represents management’s best estimates based on internally developed methodologies,following were the significant Level 3 transfers for the period January 1, 2014 to December 31, 2014 and for the period 2014 to 2015:
The transfer of COP 96,099 in cases where quoted prices2014 from Level 3 to Level 2 of bonds and depositsInvestment securities issued by financial entities, primarily linked to an increase in their market liquidity and the Bankobservability of prices.
All transfers are not directly observable in an active market, the Bank uses discounted cash flow methodology that incoporates curves derived from quoted instruments in appropriate time bandings, which match the timings of the cash flows and maturities of the instruments. For loans, cash flows are discounted at interest rates published by the SFC, which represents the current market origination rates for loans with similar terms and risk at the valuation date. For assets and liabilities heldassumed to occur at the end of the reporting period, the fair values differ from period to period due to changes in interest rates, credit risk related to third parties and the Bank’s own credit risk, market perceptions of value, and new transactions that the Bank has entered into.period.
In addition to the instruments in the tables above, the Bank holds COP 554,732 of private equity securities that are classified as Level 3 and reported within other assets as of December 31, 2012. Valuation of private equity securities are based on the most recent issuer’s financial information.
Quantitative Information about Level 3 Nonrecurring Fair Value Measurements
The following table sets forth information about significant unobservable inputs related to the Bank’s material categories of Level 3 financial assets and liabilities not carried at fair valueliabilities:
| | | As of December 31, 2015 | | | |
| Financial instrument | | Fair value | | | Valuation
Technique | | Significant
unobservable
input | | Ranges of inputs | | Weighted
average | | | Sensitivity
100
basis point
increase | | | Sensitivity
100
basis point
decrease | |
| Mortgage-backed securities (“TIPS”) | | | | | | | | | | | | | | | | | | | | | | |
| TIPS | | | 430,148 | | | Discounted cash flow | | Yield | | -0.2277% / 0.7551% | | | 0.15 | % | | | 423,092 | | | | 437,470 | |
| Other | | | | | | | | | | | | | | | | | | | | | | |
| Corporate bonds | | | 19,314 | | | Discounted cash flow | | Yield | | 0.0537% / 1.4554% | | | 0.35 | % | | | 18,780 | | | | 19,791 | |
| Time Deposits | | | 155,480 | | | Discounted cash flow | | Yield | | 1.608% | | | 1.608 | % | | | 155,472 | | | | 155,487 | |
| Securitizations | | | 35,117 | | | Discounted cash flow | | Yield | | 1.65% | | | 1.65 | % | | | 32,378 | | | | 35,455 | |
| Equity securities | | | | | | | | | | | | | | | | | | | | | | |
| Equity securities | | | 978,751 | | | Price-based | | Price | | n/a | | | n/a | | | | n/a | | | | n/a | |
| Derivatives | | | | | | | | | | | | | | | | | | | | | | |
| Options | | | 132,129 | | | Black-Scholes | | Recovery rate | | 25% | | | 25.00 | % | | | 132,141 | | | | 132,117 | |
| | | | | | | | | setoff COP (USD) | | 0.0813% a 16.8753% | | | 0.8822 | % | | | 132,129 | | | | 132,129 | |
| Forward | | | 397,622 | | | Discounted cash flow | | SPBAAA y ASW COP (USD) | | - | | | - | | | | 397,622 | | | | 397,622 | |
| | | | | | | | | Setoff COP (USD) | | 0% a 28.7559% | | | 5.0847 | % | | | 396,366 | | | | 398,877 | |
| Swaps | | | 206,178 | | | Discounted cash flow | | SPBAAA y ASW COP (USD) | | - | | | - | | | | 204,582 | | | | 204,582 | |
| | | | | | | | | Setoff COP (USD) | | 0% a 39.7004% | | | 3.7699 | % | | | 212,782 | | | | 193,908 | |
| | | | | | | | | Discount Rate | | 7.0% | | | | | | | 1,596 | | | | 1,596 | |
| | | As of December 31, 2014 | | | |
| Financial instrument | | Fair value | | | Valuation
Technique | | Significant
unobservable
input | | Ranges of inputs | | Weighted
average | | | Sensitivity
100
basis point
increase | | | Sensitivity
100
basis point
decrease | |
| Securities issued by the Colombian Government | | | | | | | | | | | | | | | | | | | | | | |
| Debt securities | | | 16,935 | | | Discounted cash flow | | Yield | | 0.55% a 0.77% | | | 0.55 | % | | | 16,774 | | | | 17,101 | |
| Mortgage-backed securities (“TIPS”) | | | | | | | | | | | | | | | | | | | | | | |
| TIPS | | | 517,413 | | | Discounted cash flow | | Interest rate | | -0.22% to 0.71% | | | 0.12 | % | | | 507,015 | | | | 528,258 | |
| Other | | | | | | | | | | | | | | | | | | | | | | |
| Corporate bonds | | | 17,270 | | | Discounted cash flow | | Yield | | 2.60% to 4.45% | | | | | | | 17,082 | | | | 17,082 | |
| | | | 1,104 | | | Discounted cash flow | | Yield | | -3.00% to 3.00% | | | | | | | 1,071 | | | | 1,137 | |
| | | | 775 | | | Discounted cash flow | | Yield | | -3.00% to 3.00% | | | | | | | 752 | | | | 798 | |
| Equity securities | | | | | | | | | | | | | | | | | | | | | | |
| Equity securities | | | 998,007 | | | Price-based | | Price | | n/a | | | n/a | | | | n/a | | | | n/a | |
| Derivatives | | | | | | | | | | | | | | | | | | | | | | |
| Options | | | 159,404 | | | Black-Scholes | | Recovery rate | | 25% to 40% | | | 25.00 | % | | | 159,451 | | | | 159,416 | |
| | | | | | | | | Credit spread | | 0% to 75.37% | | | 1.01 | % | | | 159,433 | | | | 159,433 | |
| Forward | | | 339,946 | | | Discounted cash flow | | SPBAAA & ASW | | 0.98% to 13.84% | | | 6.31 | % | | | 339,944 | | | | 339,946 | |
| | | | | | | | | Credit spread | | 0% to 75.37% | | | 4.11 | % | | | 311,454 | | | | 313,818 | |
| Swaps | | | 178,477 | | | Discounted cash flow | | SPBAAA & ASW | | 0.02% to 13.84% | | | 1.94 | % | | | 146,430 | | | | 144,863 | |
| | | | | | | | | Credit spread | | 0% to 75.37% | | | 2.86 | % | | | 133,282 | | | | 144,903 | |
NOTE 30. FIRST-TIME ADOPTION OF IFRS.
The consolidated financial statements of the Parent Company and its subsidiaries as of December 31, 2012:2015, are the first year-end financial statements prepared in accordance with IFRS, accepted in Colombia by means of Decree 2784 from the year 2012 and Decree 3023 of the year 2013. In such technical framework, as amended, the Government established that the transition period had to take place during 2014, and all the entities were required to prepare the opening statement of financial position under IFRS as of January 1, 2014. For the purposes of the consolidated financial statement and its related notes, the Bank has elected January 1, 2014 as the date of transition from previous Colombian banking GAAP to IFRS.
Quantitative Information about Level 3 Nonrecurring Fair Value Measurements |
30.1 Major changes in the accounting policies arising from the transition to IFRS:
| Financial instrument | | Fair Value | | | Valuation
Technique | | Significant
unobservable
input | | Low | | | High | |
| | | | | | | | | | | | | | |
| Loans | | COP | 73,969,923 | | | Discounted cash flow | | Discount rate | | | 6.33 | % | | | 35.92 | % |
| | | | | | | | | | | | | | | | | |
| Deposits | | | 20,269,643 | | | Discounted cash flow | | Yield | | | 1.90 | % | | | 9,22 | % |
| | | | | | | | | | | | | | | | | |
| Bonds | | | 156,308 | | | Discounted cash flow | | Yield | | | 0.63 | % | | | 4.01 | % |
| u)a. | Paid-in capitalAllowance for loan losses and financial leases losses: |
Colombian banking GAAP: the methodology for evaluating loans and financial leases is based on their inherent risk characteristics and serves as a basis for recording loss allowances based on loss percentages estimated or established by the SFC according to past due days. Under Colombian banking GAAP, the loan loss allowance is determined and monitored on an ongoing basis.
IFRS:IAS 39 “Financial instruments: recognition and measurements” determines that the entity should assess, at least on each reporting date, whether there is objective evidence that a loan or group of loans are impaired. A loan or group of loans is impaired if there is objective evidence of impairment as a result of one or more loss events (e.g., the economic performance and trends in the client’s industry) that occurred after the initial recognition of the loan and prior to the statement of financial position date and that loss event (or events) has an impact on the estimated future cash flows of the financial asset or group of financial assets that can be reliably estimated.
The amount of the loss is measured as the difference between the loan’s carrying amount and the present value of estimated future cash flows (excluding future credit losses that have not been incurred) discounted at the loan’s original effective interest rate.
Firstly, it is necessary to assess, on an individual basis, if there is objective evidence of impairment for exposures that are individually significant (impaired loans that exceed a specific threshold), or individually and collectively significant for exposures that are not individually significant. If there is no objective evidence for an exposure individually assessed, be it significant or not, it should be included in a group of exposures with similar characteristics and assessed collectively. The exposures that are individually assessed and for which a loss has been recorded should not be included in the collective assessment.
Colombian banking GAAP:for financial entities involved in lease arrangements as lessor, the leases must be classified as either financial leases or operating leases, according to the terms of the lease agreements. Assets provided through leases to third parties with a purchase option are recorded in the loan portfolio. Assets provided through operating leases are recorded as property, plant and equipment.
IFRS:According to IAS 17 “Leases”, leases are required to be classified as either (i) finance leases, when the lessor entity transfers substantially all the risks and rewards of ownership, and an asset and a liability must be recognized by the lessee and the present value of lease payments must be recognized as a receivable or (ii) operating leases, which result in expense recognition by the lessee, with the asset remaining recognized by the lessor.
Colombian banking GAAP:Deferred tax assets or liabilities must be recorded for all timing differences raised in the current period based on the consolidated statement of income when comparing the amount of recognized income and expenses for accounting and tax purposes. However, loss carry-forwards and excess of presumed income over ordinary income are restricted by the SFC.
IFRS:IAS 12 “Income tax” prescribes that deferred tax assets or liabilities should be measured using substantively enacted tax rates. IAS 12 also prescribes that deferred tax assets should be recognized when the generation of future taxable income is probable, allowing the realization of the assets.
d. Measurement of financial instruments:
Colombian banking GAAP:External Circular 100 of 1995 issued by the SFC provides guidance related to the measurement of financial instruments, considering the purchase cost as the initially recognition amount for investment securities and requires that traded securities must be valued using inputs and prices provided by the price provider authorized by the SFC. Nonetheless, some debt securities classified as either trading or available for sale are not recognized at fair value, but are recognized at amortized cost using a discounted cash flow methodology.
On the other hand, loans are recorded at the principal outstanding less allowance for impairment, except in cases of purchases of portfolios, which are recorded at the acquisition cost on day one. The SFC requires that interest income, lease payments and other items of income cease to be accrued in the consolidated statements of income after a loan is in arrears for more than two months for mortgage and consumer loans, three months for commercial loans and one month for small business loans.
IFRS:determines that all financial instruments are initially recognized when, and only when, the entity becomes party to the contractual provisions of the instrument. Financial assets are classified according to the entity’s business model for managing the financial assets and the contractual cash flow characteristic of the financial asset. At initial recognition the entity measures a financial asset or financial liability at its fair value, plus or minus transaction costs, and subsequently measured at amortized cost, using the effective interest rate method or at fair value through profit or loss. The interest income recognized in the consolidated statement of income includes the amortization of premiums and discounts. IFRS requires that valuation techniques of financial assets and liabilities at fair value incorporate all factors or inputs that a market participant would consider in setting a price when using consistent and accepted economic methodologies for pricing such financial instruments.
| e. | Compound financial instruments: |
Colombian banking GAAP: Bancolombia’s subscribed preferred shares are fully recognized as issued and outstanding capital.
IFRS:IAS 32 “Financial Instruments: Presentation” requires that the components of compound financial instruments, as defined by IAS 32, be separated and classified as debt instruments and equity instruments. This classification is made based on circumstances, economic substance and specific terms of these instruments on the date they are issued.
30.2 Overview of the IFRS 1 voluntary exemptions and mandatory exceptions applied by the administration in the preparation of these consolidated financial statement.
Exemptions:
| a) | Business combinations and past acquisitions: |
IFRS 1 “First time adoption” allows companies that are first-time adopters to maintain the accounting treatment adopted in the prior accounting practices (Colombian banking GAAP in the case of the Bank) with respect to business combinations and acquisition of investments in associates that were recognized before the transition date or an earlier date. Such transactions are not restated, retrospectively, by applying IFRS 3 (Revised).
In accordance with the exemption allowed by IFRS 1, the accounting policies used by the Bank for initial recognition and subsequent measurement of goodwill derived from acquisitions that took place prior to January 1, 2014 under Colombian banking GAAP paid-in capital in excess of par value of common and preferred shares issued is credited to a legal reserve. Under U.S. GAAP, capital in excess of par value is credited to paid-in capital.were maintained.
| v)b) | Equity taxFair value as deemed cost: |
During 2010 and 2011 a new regulation required companies to calculate this tax only once for the next four years as of JanuaryIFRS 1 2011 at the tax rate of 6% and payable in 8 semi-annual installments over four years without interest. The equity tax calculated byallows the Bank to individually measure certain premises and its subsidiaries amountsequipment at fair value or to approximately COP 469,002. The tax amount assessed is fixeduse a reappraisal of asset according the prior accounting practices (Colombian banking GAAP) as of January 1, 2011 and is not subject to further adjustment and the entity is not subject to any additional assessment through 2014.
The amount computed, in accordance with Colombian banking GAAP was recorded as a deferred asset to be amortized against the balance of a local special account named the “revaluation of equity” in stockholders’ equity (this account was created when in the past companies recorded inflation adjustments) on the date of each payment. If the balance in this account is less than the amountdeemed cost of the equity tax, the difference is amortized into the consolidated statement of operations also over four years without interest. As of December 31, 2012, under Colombian banking GAAP the deferred asset amounted to COP 234,408. The amount of COP 204,375 has been amortized against revaluation of equity.
Under U.S. GAAP, an equity tax liability was recorded on a discounted basis to reflect the time value of money as the aggregate amount of the liability and the amount and timing of cash payments are fixed. As of December 31, 2012 and 2011, the equity tax liability amounted to COP 221,684 and COP 329,490, respectively. For the years ended December 31, 2012 and 2011, the corresponding discount effect amounted to COP 9,434 and COP 17,907, respectively, and were recorded in the line “Administrative and other expenses”. The discount curve rate used was the risk free rate plus the Bank’s risk premium.
According to Colombian banking GAAP, provisions for legal proceedings with governmental entities must be recorded for at least 50% of the total value of the penalty when judgment against the Bank in a government court instance is issued (despite the fact that the contingency was not considered probable in such instance) and then adjusted at 100% of the penalty in question when the final sentence against Bank is confirmed.
For the year 2012, the Bank has recognized provisions related to the discussions with the Bogotá District Council and Barranquilla District Council amounting to COP 10,113. During 2011, the Bank had recognized a reversal of the provision related to the discussions with the Tax administration (DIAN) amounting to COP 11,698.
According to U.S. GAAP, an estimated loss from a loss contingency shall be accrued by a charge to income if information available prior to issuance of the financial statements indicates that it is probable that a liability had been incurredassets at the date of the financial statements and the amount of loss can be reasonably estimated.
Under U.S. GAAP, thetransition. The Bank has recognized provisions relatedelected to recognize as deemed cost the discussions with the Tax administration (DIAN), the Bogotá District Councilreappraisal of assets for certain premises and Barranquilla District Council amounting to COP 42,087, which have been assessed as “Probable” based on the Bank’s and its legal counsel’s judgment as of December 31, 2012. The provision recognized represents the individual most likely outcome of the amount required to settle each obligation.
There are no contingencies or other uncertainties that could affect the fairness of presentation of the financial data as of December 31, 2012. See “Consolidated Financial Statements note 26 Commitments and Contingencies”.equipment.
| x)c) | Earnings per shareCumulative differences on the translation of statement of financial positions of foreign subsidiaries: |
Under Colombian banking GAAP, earnings per share (“EPS”) is computed by dividing net income by the weighted average number of both common and preferred shares outstanding for each period presented.
U.S. GAAP requires dual presentation of basic and diluted EPS for entities with complex capital structures, as well as a reconciliation of the basic EPS computation to the diluted EPS computation. Some capital structures require the application of the two-class method, which is an earnings allocation formula that treats a participating security as having rights to earnings that otherwise would have been available to common shareholders but does not require the presentation of basic and diluted EPS for securities other than common stock.
Basic EPS is calculated by reducing the income from continuing operations by the amount of dividends declared in the current period for each class of stock and by the contractual amount of dividends that must be paid for the current period, considering the allocation of remaining earnings to common stock and participating securities to the extent that each security may share in earnings as if all of the earnings for the period had been distributed. EPS is determined by dividing the total earnings allocated to each security by the weighted average number of common shares outstanding. Diluted EPS assumes the issuance of common shares for all dilutive potential common shares outstanding during the reporting period. For the years ended December 31, 2012, 2011 and 2010, the Bank has applied the two-class method considering there was no difference between basic or diluted EPS on this basis for these years. Bancolombia S.A. has preferred shares which are participating securities as they may participate in earnings with the common shares after payment of the minimum dividend on the preferred shares.
The following table summarizes information related to the computation of basic EPS for the years ended December 31, 2012, 2011 and 2010(in millions of pesos, except per share data):
| | | 2012 | | | 2011 | | | 2010 | |
| | | | | | | | | | |
| Income from continuing operations before attribution of non-controlling interests | | COP | 1,544,682 | | | COP | 855,759 | | | COP | 1,506,819 | |
| Less: Non-controlling interests from continuing operations | | | (40,008 | ) | | | (53,253 | ) | | | 26,041 | |
| Net income from continuing operations | | | 1,584,690 | | | | 909,012 | | | | 1,480,778 | |
| | | | | | | | | | | | | |
| Income from operations and disposals of discontinued operations, net of taxes | | | 48,873 | | | | 134,624 | | | | 63,983 | |
| Less: Non-controlling interests from discontinuing operations | | | - | | | | - | | | | - | |
| Net income attributable to the controlling interest under U.S. GAAP | | | 1,633,563 | | | | 1,043,636 | | | | 1,544,761 | |
| | | | | | | | | | | | | |
| Less: Preferred dividends declared | | | 237,766 | | | | 185,964 | | | | 177,108 | |
| Less: Allocation of undistributed earnings to preferred stockholders | | | 411,051 | | | | 182,465 | | | | 368,231 | |
| Continuing operations | | | 391,639 | | | | 134,940 | | | | 345,643 | |
| Discontinued operations | | | 19,412 | | | | 47,525 | | | | 22,588 | |
| Net income allocated to common shareholders for basic and diluted EPS | | | 984,746 | | | | 675,207 | | | | 999.422 | |
| | | | | | | | | | | | | |
| Weighted average number of common shares outstanding used in basic EPS calculation (in millions) | | | 510 | | | | 510 | | | | 510 | |
| | | | | |
| Basic and Diluted earnings per share to common shareholders (U.S. GAAP) | | COP | 1,932.00 | | | COP | 1,324.64 | | | COP | 1,960.80 | |
| | | | | | | | | | | | | |
| From continuing operations | | | 1,874.00 | | | | 1,153.64 | | | | 1,879.80 | |
| From discontinued operations | | | 58.00 | | | | 171.00 | | | | 81.00 | |
Operating segments are defined as components of an enterprise about which separate financial information is available that is regularly used by the chief operating decision maker in deciding how to allocate resources and assessing performance.
The Bank’s consolidated group structure includes the following segments: Banking Colombia, Banking El Salvador, Leasing, Trust, Investment, Brokerage, Off Shore, and All Other segments.
The Bank manageshas applied this exemption by which all gains and measureslosses from currency translation of foreign subsidiaries on the performance of its operations through these business segments usingtransition date were set to zero. In accordance with IAS 21 the same accounting policies described in the summary of significant accounting policies (see Note 2). The reconciliationcurrency translation adjustment of the total ofsubsidiaries with a functional currency other than Colombian peso will be applied prospectively. These effects are recognized in other comprehensive income and only from the segments profit/loss to U.S. GAAP is already presented in note (31) (a).transition date onwards.
The Bank does not have any individual external customer which represents 10% or more of the enterprise’s revenues.
The following presents information on reported operating segment profit or loss, and segment assets under Colombian banking GAAP:
December 31, 2012(3)
| | | Banking
Colombia | | | Banking El
Salvador | | | Leasing | | | Trust | | | Investment
Banking | | | Brokerage | | | Off Shore | | | All Other
Segments | | | Total before
eliminations | | | Adjustments for
consolidation
purposes (1) | | | Total After
Eliminations | |
| | | | | | | | | | | | | | | | | | | | | | | | | | | | | | | | | | |
| Net Interest Income | | | 4,010,434 | | | | 333,789 | | | | 533,725 | | | | 12,635 | | | | 2,391 | | | | 20,284 | | | | 95,963 | | | | 1,353 | | | | 5,010,574 | | | | (243,551 | ) | | | 4,767,023 | |
| Interest income | | | 6,048,931 | | | | 401,309 | | | | 1,183,803 | | | | 12,665 | | | | 3,129 | | | | 29,175 | | | | 231,852 | | | | 1,616 | | | | 7,912,480 | | | | (250,597 | )(2) | | | 7,661,883 | |
| Interest expense | | | 2,038,497 | | | | 67,520 | | | | 650,078 | | | | 30 | | | | 738 | | | | 8,891 | | | | 135,889 | | | | 263 | | | | 2,901,906 | | | | (7,046 | )(2) | | | 2,894,860 | |
| Revenues (expenses) from transactions with | | | | | | | | | | | | | | | | | | | | | | | | | | | | | | | | | | | | | | | | | | | | |
| other operating segments of the Bank | | | (34,721 | ) | | | (1,890 | ) | | | 42,153 | | | | (28,771 | ) | | | 1,495 | | | | 35,872 | | | | (1,456 | ) | | | (12,682 | ) | | | - | | | | - | | | | - | |
| Net provisions | | | (1,057,745 | ) | | | 16,775 | | | | (91,389 | ) | | | (831 | ) | | | (137 | ) | | | (68 | ) | | | 5,268 | | | | 15,434 | | | | (1,112,693 | ) | | | 1,820 | | | | (1,110,873 | ) |
| Net Commissions | | | 1,445,429 | | | | 129,226 | | | | 36,528 | | | | 198,987 | | | | 38,415 | | | | 70,511 | | | | 15,461 | | | | (979 | ) | | | 1,933,578 | | | | (126,538 | )(2) | | | 1,807,040 | |
| Foreign exchange gains,and Derivatives | | | 159,976 | | | | (964 | ) | | | 3,372 | | | | (118 | ) | | | (65 | ) | | | (9 | ) | | | 4,084 | | | | (9,444 | ) | | | 156,832 | | | | 11,115 | | | | 167,947 | |
| Other operating income | | | 365,500 | | | | 66 | | | | 65,596 | | | | 602 | | | | 24,464 | | | | 2,558 | | | | 106,483 | | | | 402,602 | | | | 967,871 | | | | (302,721 | )(2) | | | 665,150 | |
| Total Operating Income | | | 4,888,873 | | | | 477,002 | | | | 589,985 | | | | 182,504 | | | | 66,563 | | | | 129,148 | | | | 225,803 | | | | 396,284 | | | | 6,956,162 | | | | (659,875 | ) | | | 6,296,287 | |
| Operating Income before provisions | | | 5,946,618 | | | | 460,227 | | | | 681,374 | | | | 183,335 | | | | 66,700 | | | | 129,216 | | | | 220,535 | | | | 380,850 | | | | 8,068,855 | | | | (661,695 | ) | | | 7,407,160 | |
| Salaries and employee benefits | | | 1,333,576 | | | | 96,488 | | | | 93,180 | | | | 42,100 | | | | 14,637 | | | | 72,782 | | | | 8,653 | | | | 5,835 | | | | 1,667,251 | | | | (273,224 | )(2) | | | 1,394,027 | |
| Administrative and other expenses | | | 1,962,690 | | | | 120,803 | | | | 221,819 | | | | 21,065 | | | | 4,744 | | | | 29,417 | | | | 48,847 | | | | 35,159 | | | | 2,444,544 | | | | 323,811 | (2) | | | 2,768,355 | |
| Operating expenses | | | 3,296,266 | | | | 217,291 | | | | 314,999 | | | | 63,165 | | | | 19,381 | | | | 102,199 | | | | 57,500 | | | | 40,994 | | | | 4,111,795 | | | | 50,587 | | | | 4,162,382 | |
| Non-operating income (expense) | | | 18,153 | | | | 4,290 | | | | (52,761 | ) | | | 1,106 | | | | 491 | | | | 4,333 | | | | (195 | ) | | | (2,882 | ) | | | (27,465 | ) | | | 62,680 | (2) | | | 35,215 | |
| Income before income taxes | | | 1,610,760 | | | | 264,001 | | | | 222,225 | | | | 120,445 | | | | 47,673 | | | | 31,282 | | | | 168,108 | | | | 352,408 | | | | 2,816,902 | | | | (647,782 | ) | | | 2,169,120 | |
| Income tax expense | | | (318,158 | ) | | | (66,473 | ) | | | (3,106 | ) | | | (38,827 | ) | | | (8,653 | ) | | | (5,962 | ) | | | - | | | | (25,895 | ) | | | (467,074 | ) | | | - | | | | (467,074 | ) |
| Segment profit/loss | | | 1,292,602 | | | | 197,528 | | | | 219,119 | | | | 81,618 | | | | 39,020 | | | | 25,320 | | | | 168,108 | | | | 326,513 | | | | 2,349,828 | | | | (647,782 | ) | | | 1,702,046 | |
| Segment assets | | | 71,566,337 | | | | 6,699,690 | | | | 13,179,545 | | | | 79,579 | | | | 165,326 | | | | 224,811 | | | | 5,215,286 | | | | 785,806 | | | | 97,916,380 | | | | - | | | | 97,916,380 | |
| (1)d) | Includes provisions, dividends, gains on sales and non-controlling interest. |
| (2) | Includes adjustments for reclassification according to the analysis process used by the chief operating decision maker. |
| (3) | During 2012 and 2011 both AFP Crecer and Asesuisa were sold, which were included in the Insurance segment. See note 1.Leases: |
December 31, 2011
| | | Banking
Colombia | | | Banking
El
Salvador | | | Leasing | | | Trust | | | Investment
Banking | | | Brokerage | | | Off Shore | | | Insurance (3) | | | All Other
Segments | | | Total before
eliminations | | | Adjustments for
consolidation
purposes (1) | | | Total After
Eliminations | |
| | | | | | | | | | | | | | | | | | | | | | | | | | | | | | | | | | | | | |
| Net Interest Income | | COP | 3,000,900 | | | | 355,778 | | | | 473,867 | | | | 14,906 | | | | 7,043 | | | | 22,149 | | | | 107,043 | | | | 2,454 | | | | 1,806 | | | | 3,985,946 | | | | (82,358 | ) | | | 3,903,588 | |
| Interest income | | | 4,418,999 | | | | 420,445 | | | | 904,109 | | | | 14,910 | | | | 7,682 | | | | 35,589 | | | | 226,768 | | | | 3,180 | | | | 2,164 | | | | 6,033,846 | | | | (88,252 | )(2) | | | 5,945,594 | |
| Interest expense | | | 1,418,099 | | | | 64,667 | | | | 430,242 | | | | 4 | | | | 639 | | | | 13,440 | | | | 119,725 | | | | 726 | | | | 358 | | | | 2,047,900 | | | | (5,894 | )(2) | | | 2,042,006 | |
| Revenues (expenses) from transactions withother operating segments of the Bank | | | (16,745 | ) | | | 18,314 | | | | 15,802 | | | | (1,478 | ) | | | 1 | | | | (686 | ) | | | (106 | ) | | | (18,235 | ) | | | 3,133 | | | | - | | | | - | | | | - | |
| Net provisions | | | (481,251 | ) | | | (38,787 | ) | | | (49,211 | ) | | | 158 | | | | (242 | ) | | | (86 | ) | | | 2,557 | | | | 1,033 | | | | (37,211 | ) | | | (603,040 | ) | | | 4,335 | (2) | | | (598,705 | ) |
| Net Commissions | | | 1,335,101 | | | | 107,442 | | | | 11,703 | | | | 166,736 | | | | 33,972 | | | | 81,094 | | | | 19,686 | | | | (65 | ) | | | (40 | ) | | | 1,755,629 | | | | (87,045 | )(2) | | | 1,668,584 | |
| Foreign exchange gains,and Derivatives | | | 150,322 | | | | 14,931 | | | | 748 | | | | 401 | | | | 193 | | | | 846 | | | | 9,230 | | | | 1,444 | | | | 21,582 | | | | 199,697 | | | | (27,425 | ) | | | 172,272 | |
| Other operating income | | | 318,754 | | | | 831 | | | | 52,380 | | | | 520 | | | | 41,753 | | | | 27,065 | | | | 174,148 | | | | 45,689 | | | | 348,376 | | | | 1,009,516 | | | | (490,551 | )(2) | | | 518,965 | |
| Total Operating Income | | | 4,307,081 | | | | 458,509 | | | | 505,289 | | | | 181,243 | | | | 82,720 | | | | 130,382 | | | | 312,558 | | | | 32,320 | | | | 337,646 | | | | 6,347,748 | | | | (683,044 | )(2) | | | 5,664,704 | |
| Operating Income before provisions | | | 4,788,332 | | | | 497,296 | | | | 554,500 | | | | 181,085 | | | | 82,962 | | | | 130,468 | | | | 310,001 | | | | 31,287 | | | | 374,857 | | | | 6,950,788 | | | | (687,379 | ) | | | 6,263,409 | |
| Salaries and employee benefits | | | 1,145,361 | | | | 92,521 | | | | 86,077 | | | | 39,242 | | | | 15,894 | | | | 68,740 | | | | 7,766 | | | | 3,997 | | | | 5,083 | | | | 1,464,681 | | | | (189,330 | )(2) | | | 1,275,351 | |
| Administrative and other expenses | | | 1,692,624 | | | | 112,783 | | | | 194,401 | | | | 30,268 | | | | 5,679 | | | | 30,207 | | | | 53,036 | | | | 5,555 | | | | 15,558 | | | | 2,140,111 | | | | 190,886 | (2) | | | 2,330,997 | |
| Operating expenses | | | 2,837,985 | | | | 205,304 | | | | 280,478 | | | | 69,510 | | | | 21,573 | | | | 98,947 | | | | 60,802 | | | | 9,552 | | | | 20,641 | | | | 3.604.792 | | | | 1,556 | | | | 3,606,348 | |
| Non-operating income (expense) | | | 53,989 | | | | 6,731 | | | | (488 | ) | | | 4,540 | | | | 1,062 | | | | 6,226 | | | | (392 | ) | | | 524 | | | | (7,404 | ) | | | 64,788 | | | | 11,267 | (2) | | | 76,055 | |
| Income before income taxes | | | 1,523,085 | | | | 259,936 | | | | 224,323 | | | | 116,273 | | | | 62,209 | | | | 37,661 | | | | 251,364 | | | | 23,292 | | | | 309,601 | | | | 2,807,744 | | | | (673,333 | )(2) | | | 2,134,411 | |
| Income tax expense | | | (319,572 | ) | | | (60,575 | ) | | | (2,720 | ) | | | (37,637 | ) | | | (9,186 | ) | | | (3,942 | ) | | | - | | | | (5,253 | ) | | | (31,631 | ) | | | (470,516 | ) | | | (1 | ) | | | (470,517 | ) |
| Segment profit/loss | | | 1,203,513 | | | | 199,361 | | | | 221,603 | | | | 78,636 | | | | 53,023 | | | | 33,719 | | | | 251,364 | | | | 18,039 | | | | 277,970 | | | | 2,337,228 | | | | (673,334 | ) | | | 1,663,894 | |
| Segment assets | | COP | 63,626,713 | | | | 6,931,582 | | | | 11,488,298 | | | | 303,579 | | | | 462,155 | | | | 364,962 | | | | 8,751,997 | | | | 173,006 | | | | 1,852,144 | | | | 93,954,429 | | | | (8,491,409 | ) | | | 85,463,020 | |
| (1) | Includes provisions, dividends, gains on sales and non-controlling interest. |
| (2) | Includes adjustments for reclassification according to the analysis process used by the chief operating decision maker. |
| (3) | Includes Asesuisa, which was sold in 2012. See Note 1. |
December 31, 2010
| | | Banking
Colombia | | | Banking El
Salvador | | | Leasing | | | Trust | | | Investment
Banking | | | Brokerage | | | Off Shore | | | Pension
and
Insurance(3) | | | All Other
Segments | | | Total before
eliminations | | | Adjustments
for
consolidation
purposes (1) | | | Total after
eliminations | |
| | | | | | | | | | | | | | | | | | | | | | | | | | | | | | | | | | | | | |
| Net Interest Income | | COP | 2,617,840 | | | | 362,155 | | | | 443,574 | | | | 16,933 | | | | 10,303 | | | | 28,102 | | | | 108,114 | | | | 4,046 | | | | 680 | | | | 3,591,747 | | | | (202,688 | ) | | | 3,389,059 | |
| Interest income | | | 3,645,216 | | | | 473,294 | | | | 932,697 | | | | 17,064 | | | | 11,630 | | | | 42,635 | | | | 205,345 | | | | 4,742 | | | | 1,843 | | | | 5,334,466 | | | | (373,826 | )(2) | | | 4,960,640 | |
| Interest expense | | | 1,027,376 | | | | 111,139 | | | | 489,123 | | | | 131 | | | | 1,327 | | | | 14,533 | | | | 97,231 | | | | 696 | | | | 1,163 | | | | 1,742,719 | | | | (171,138 | )(2) | | | 1,571,581 | |
| Revenues (expenses) from transactions with other operating segments of the Bank | | | (5,218 | ) | | | 17,418 | | | | 8,736 | | | | (790 | ) | | | 779 | | | | (174 | ) | | | (7,305 | ) | | | (17,695 | ) | | | 4,249 | | | | - | | | | - | | | | - | |
| Net provisions | | | (378,778 | ) | | | (102,681 | ) | | | (48,262 | ) | | | (394 | ) | | | 1,168 | | | | (208 | ) | | | (19,754 | ) | | | 593 | | | | (181 | ) | | | (548,497 | ) | | | 782 | | | | (547,715 | ) |
| Net Commissions | | | 1,197,419 | | | | 115,206 | | | | 4,895 | | | | 144,786 | | | | 31,913 | | | | 52,711 | | | | 12,432 | | | | 89,969 | | | | 840 | | | | 1,650,171 | | | | (69,257 | )(2) | | | 1,580,914 | |
| Foreign exchange gains,and Derivatives | | | 105,444 | | | | 947 | | | | 57 | | | | 1,196 | | | | 33 | | | | 299 | | | | (8,581 | ) | | | - | | | | 640 | | | | 100,035 | | | | - | | | | 100,035 | |
| Other operating income | | | 344,450 | | | | 111 | | | | 45,006 | | | | 468 | | | | 93,931 | | | | 4,456 | | | | 102,967 | | | | 2,808 | | | | 95,147 | | | | 689,344 | | | | (254,323 | )(2) | | | 435,021 | |
| Total Operating Income | | | 3,881,157 | | | | 393,156 | | | | 454,006 | | | | 162,199 | | | | 138,127 | | | | 85,186 | | | | 187,873 | | | | 79,721 | | | | 101,375 | | | | 5,482,800 | | | | (525,486 | )(2) | | | 4,957,314 | |
| Operating Income before provisions | | | 4,259,935 | | | | 495,837 | | | | 502,268 | | | | 162,593 | | | | 136,959 | | | | 85,394 | | | | 207,627 | | | | 79,128 | | | | 101,556 | | | | 6,031,297 | | | | (526,268 | ) | | | 5,505,029 | |
| Salaries and employee benefits | | | 1,024,904 | | | | 86,388 | | | | 71,384 | | | | 34,458 | | | | 12,587 | | | | 60,842 | | | | 6,937 | | | | 15,059 | | | | 3,819 | | | | 1,316,378 | | | | (176,431 | )(2) | | | 1,139,947 | |
| Administrative and other expenses | | | 1,417,600 | | | | 103,534 | | | | 142,049 | | | | 19,347 | | | | 4,086 | | | | 25,857 | | | | 59,874 | | | | 16,056 | | | | 21,524 | | | | 1,809,927 | | | | 148,605 | (2) | | | 1,958,532 | |
| Operating expenses | | | 2,442,504 | | | | 189,922 | | | | 213,433 | | | | 53,805 | | | | 16,673 | | | | 86,699 | | | | 66,811 | | | | 31,115 | | | | 25,343 | | | | 3,126,305 | | | | (27,826 | )(2) | | | 3,098,479 | |
| Non-operating income (expense) | | | 71,628 | | | | 600 | | | | (7,032 | ) | | | (742 | ) | | | 133 | | | | 15,206 | | | | (3,279 | ) | | | 1,752 | | | | 19,814 | | | | 98,080 | | | | (12,004 | )(2) | | | 86,076 | |
| Income before income taxes | | | 1,510,281 | | | | 203,834 | | | | 233,541 | | | | 107,652 | | | | 121,587 | | | | 13,693 | | | | 117,783 | | | | 50,358 | | | | 95,846 | | | | 2,454,575 | | | | (509,664 | )(2) | | | 1,944,911 | |
| Income tax expense | | | (334,712 | ) | | | (54,547 | ) | | | (47,208 | ) | | | (34,660 | ) | | | (18,632 | ) | | | (1,245 | ) | | | - | | | | (11,557 | ) | | | (5,856 | ) | | | (508,417 | ) | | | - | | | | (508,417 | ) |
| Segment profit/loss | | | 1,175,569 | | | | 149,287 | | | | 186,333 | | | | 72,992 | | | | 102,955 | | | | 12,448 | | | | 117,783 | | | | 38,801 | | | | 89,990 | | | | 1,946,158 | | | | (509,664 | ) | | | 1,436,494 | |
| Segment assets | | COP | 49,499,711 | | | | 7,093,621 | | | | 8,345,821 | | | | 272,797 | | | | 427,967 | | | | 851,844 | | | | 6,068,344 | | | | 229,156 | | | | 1,529,612 | | | | 74,318,873 | | | | (6,223,717 | )(2) | | | 68,095,156 | |
| (1) | Includes provisions, dividends, gains on sales and non-controlling interest. |
| (2) | Includes adjustments for reclassification according to the analysis process used by the chief operating decision maker. |
| (3) | Includes AFP Crecer and Asesuisa, which were sold in 2011and 2012, respectively. See Note 1. |
The following summarizesA first-time adopter may opt to apply the Bank’s revenuesspecific transition guidance of IFRIC 4 - “Determining Whether an Arrangement Contains a Lease”, and long-lived assets attributableit may determine if there is a lease agreement on the transition date to Colombia and other foreign countries:
| | | As of December 31, | |
| | | 2012 | | | 2011 | |
| | | | | | | | | | | | | |
| | | | | | Long | | | | | | Long | |
| Geographic Information | | Revenues | | | Term – Assets(1) | | | Revenues | | | Term – Assets(1) | |
| | | | | | | | | | | | | |
| Colombia | | COP | 13,239,996 | | | COP | 3,392,087 | | | COP | 9,762,829 | | | COP | 2,803,158 | |
| Panama and Cayman Islands | | | 748,636 | | | | 6,043 | | | | 653,867 | | | | 7,093 | |
| Puerto Rico | | | 27,675 | | | | 58 | | | | 31,166 | | | | 107 | |
| Perú | | | 55,367 | | | | 96,337 | | | | 43,607 | | | | 99,917 | |
| El Salvador | | | 817,406 | | | | 106,931 | | | | 1,120,456 | | | | 137,548 | |
| USA | | | 48,026 | | | | - | | | | 50,962 | | | | - | |
| Costa Rica | | | 828 | | | | 3 | | | | - | | | | - | |
| Total | | | 14,937,934 | | | | 3,601,459 | | | | 11,662,887 | | | | 3,047,823 | |
| Eliminations of intersegment operations | | | (1,389,808 | ) | | | (10,831 | ) | | | (1,082,279 | ) | | | (11,044 | ) |
| Total, net | | COP | 13,548,126 | | | COP | 3,590,628 | | | COP | 10,580,608 | | | COP | 3,036,779 | |
__________________
(1) Included foreclosed assets, net, and property, plant and equipment, net.
As of December 31, 2012, the following are the Bank’s operating segments:
Banking Colombia: This segment provides retail and corporate banking products and services to individuals, companies and national and local governments in Colombia. The Bank’s strategy in Colombia is to grow with these clientsIFRS based on value-added, long-term relationships. In order to offer specialized services to individualsthe facts and small and medium size enterprises (SMEs),circumstances existing on the Bank’s retail sales force targets the clients classified as: Personal, Private, Entrepreneurs, Foreign Residents and SMEs.transition date. The Bank’s corporate and government sales force targets and specializes in companies with more than COP 16,000 million in revenueapplication of nine economic sectors: Agribusiness, Commerce, Manufacturing of Supplies and Materials, Media, Financial Services, Non-Financial Services, Construction, Government and Natural Resources.This segment is also responsible for the management of the Bank’s proprietary trading activities, liquidity and distribution of treasury products and services to its client base in Colombia.
Banking El Salvador: This segment provides retail and commercial banking products and services to individuals, companies and national and local governments in El Salvador through Banco Agricola S.A. Banking El Salvador also includes operations of the following subsidiaries Arrendadora Financiera S.A., Credibac S.A. de CV,Valores Banagricola S.A. de C.V.
This segment is also responsible for the management of the Bank’s proprietary trading activities, liquidity and distribution of treasury products and services to its client base in El Salvador.
Leasing:This segment provides financial and operating leases, including cross-border and international leasing services to clients in Colombia, Central America, Mexico and Brazil. Bancolombia offers these services mainly through the following Subsidiaries: Leasing Bancolombia S.A., Renting Colombia S.A., Arrendamiento Operativo CIB S.A.C., Leasing Peru S.A., Transportempo S.A.S., Capital Investment Safi S.A., Fondo de Inversión en Arrendamiento Operativo Renting Perú and Patrimonio Autónomo Cartera LBC.
Trust:This segment provides trust services and asset management to clients in Colombia and Peru through Fiduciaria Bancolombia and FiduPerú S.A. Sociedad Fiduciaria. The main products offered by this segment include money market accounts, mutual and pension funds, private equity funds, payment trust, custody services, and corporate trust.
Investment Banking:This segment provides corporate and project finance advisory, underwriting, capital markets services and private equity management through Banca de Inversion Bancolombia S.A. Its customers include private and publicly-held corporations as well as government institutions.
Brokerage:This segment provides brokerage, investment advisory and private banking services to individuals and institutions through Valores Bancolombia S.A. Comisionista de Bolsa, Valores Bancolombia Panama S.A. and Suvalor Panamá Fondo de Inversión S.A. It sells and distributes equities, futures, foreign currencies, fixed income securities, mutual funds and structured products.
Off shore:This segment provides a complete line of offshore banking services to Colombian and Salvadorian customers through Bancolombia Panamá S.A., Bancolombia Cayman S.A., and Bancolombia Puerto Rico International, Inc. It offers loans to private sector companies, trade financing, lease financing, financing for industrial projects as well as a complete portfolio of cash management products, such as checking accounts, international collections and payments. Through these Subsidiaries, the Bank also offers investment opportunities in U.S. dollars, savings and checking accounts, time deposits, and investment funds to its high net worth clients and private banking customers.
All other segments:This segment includes results from small operation of particular investment vehicles of Bancolombia: Valores Simesa S.A., BIBA Inmobiliaria S.A.S, Inversiones CFNS S.A.S, CFNS Infraestructura S.A.S, Sistema de Inversiones y Negocios S.A. Sinesa, Vivayco S.A.S., Banagrícola S.A., Inversiones Financieras Banco Agrícola and others.
Recent U.S. GAAP Pronouncements
In March 2013, FASB issued ASU 2013-05, “Foreign Currency Matters (Topic 830)”: to resolve the diversity in practice about the cumulative translation adjustment derecognition guidance in Subtopic 830-30 for the derecognition of certain subsidiaries or groups of assets within a foreign entity and for changes in an investment in a foreign entity. Furthermore, the ASU 2013-05 resolves the diversity in practice for the treatment of business combinations achieved in stages (sometimes also referred to as step acquisitions) involving a foreign entity. The requirements will be effective prospectively for fiscal years beginning after December 15, 2012. Management is currently evaluating theIFRIC 4 did not have any impact the ASU 2013-05 would have on the Bank’s financial statements and U.S. GAAP disclosures.
In February 2013, FASB issued ASU 2013-02, “Reporting of Amounts Reclassified out of Accumulated Other Comprehensive Income (Topic 220)”. The amendments require additional disclosures of items reclassified from accumulated Other Comprehensive Income (OCI) to net income. The requirements will be effective prospectively for reporting periods beginning after December 15, 2012. Management has concluded that the adoption has no significant impact on the Bank’s U.S. GAAP disclosures and financial information.
In January 2013, the FASB issued ASU 2013-01, “Balance Sheet (Topic 210): Clarifying the Scope of Disclosures about Offsetting Assets and Liabilities.” The amendments clarify that the scope of Update 2011-11 applies to derivatives accounted for in accordance with Topic 815, Derivatives and Hedging, including bifurcated embedded derivatives, repurchase agreements and reverse repurchase agreements, and securities borrowing and securities lending transactions that are either offset in accordance with Section 210-20-45 or Section 815-10-45 or subject to an enforceable master netting arrangement or similar agreement. An entity is required to apply the amendments for fiscal years beginning on or after January 1, 2013, and interim periods within those annual periods. An entity should provide the required disclosures retrospectively for all comparative periods presented. The effective date is the same as the effective date of Update 2011-11. Management is currently evaluating the impact the amendments would have on the Bank’s financial statement and U.S. GAAP disclosures
In October 2012, FASB issued ASU 2012-04, “Technical Corrections and improvements” to provide: 1) clarification through updating wording, correcting references, or a combination of both, which affects a wide variety of Topics in the Codification; 2) clarify certain guidance in various Topics of the Codification to fully reflect the fair value measurement and disclosure requirements of Topic 820. The amendments are not introducing any new fair value measurements and are not intended to result in a change in the application of the requirements in Topic 820 or fundamentally change other principles of U.S. GAAP. For public entities, the amendments that are subject to the transition guidance will be effective for fiscal periods beginning after December 15, 2012. Management is currently evaluating the impact on the U.S. GAAP disclosures and financial information released by the Bank.
In August 2012, FASB issued ASU 2012-03, “Technical Amendments and Corrections to SEC Sections” to amends various SEC paragraphs pursuant to SAB 114 related to computation of restricted net assets of subsidiaries, Presentation of Financial Statements, Notes to Financial Statements and other topics; SEC Release No. 33-9250 and ASU 2010-22 which amend or rescind portions of certain SAB Topics related to: Form of condensed financial statements, Debt Issue Costs in Conjunction with a Business Combination, Business Combinations Prior to an Initial Public Offering, Accounting for Divestiture of a Subsidiary and other topics. The amendments do not include an effective date, applications must be considered after publication. The adoption had no impact on the U.S. GAAP disclosures and financial information released by the Bank.
In July 2012, FASB issued ASU 2012-02, “Testing Indefinite-Lived Intangible Assets for Impairment” to reduce the cost and complexity of performing an impairment test for indefinite-lived intangible assets by simplifying how an entity tests those assets for impairment and to improve consistency in impairment testing guidance among long-lived asset categories. The amendments permit an entity first to assess qualitative factors to determine whether it is more likely than not that an indefinite-lived intangible asset is impaired as a basis for determining whether it is necessary to perform the quantitative impairment test in accordance with Section 350-30. The amendments include a number of events and circumstances for an entity to consider in conducting the qualitative assessment. The amendments are effective for annual and interim impairment tests performed for fiscal years beginning after September 15, 2012. Management has concluded that the ASU 2012-02 has no impact on the Bank’s annual impairment test due to the fact that the Bank was not involved in any arrangement at the date of transition that should be accounted for as a lease agreement.
| e) | Classification and measurement of financial assets: |
The Bank has not recognized Indefinite-lived intangible assetsassessed whether a financial asset meets the criteria described in prior business combinations.IFRS 9 based on facts and circumstances existing at the transition date in order to the measurement of the asset at fair value through profit or loss, at fair value through other comprehensive income or at amortized cost, considering:
| · | The business model and those objectives within the financial asset are held. |
| · | The contractual terms of the financial asset and its cash flows considering whether those are solely payments of principal and interest on the principal amount outstanding. |
Exceptions:
| a) | Derecognition of financial assets and liabilities: |
In December 2011, FASB issued ASU 2011-11, “Disclosures about offsetting assets and liabilities (Topic 210)”accordance with IFRS 1 a first-time adopter shall apply the derecognition requirements in IFRS 9 prospectively for transactions occurring on or after the date of transition to IFRS.
However, IFRS 1 allows a first-time adopter to apply the derecognition requirements in IFRS 9 retrospectively from a date determined by the entity, provided that the information required to apply these standards had been obtained at the time of the initially accounting for the transaction. This exception was considered by the Bank to be applied prospectively.
IFRS 1 requires that, on the transition date, the estimates used by the management for IFRS purposes are consistent with estimates made as of the same dates under Colombian banking GAAP (prior regulatory accounting framework), unless there is evidence of errors in the preparation of estimates under Colombian banking GAAP as compared to provide enhanced disclosuresIFRS.
The Bank’s management considers that will enable usersthe estimates used for Colombian baking GAAP are consistent with those used on the transition date to IFRS.
IAS 39 requires the valuation of its financial statements to evaluate the effect or potential effect of netting arrangements on an entity’s financial position. This includes the effect or potential effect of rights of setoff associated with an entity’s recognized assets and recognized liabilities within the scope of this Update. The amendments require enhanced disclosures by requiring improved information aboutall derivative financial instruments and derivative instruments that are either (1) offsetat fair value, as well as the elimination of deferred gains or losses, recognized as assets or liabilities under Colombian banking GAAP prior to IFRS. Additionally, an entity should not apply hedge accounting (as defined by IAS 39) in its consolidated balance sheet at the transition date if the instrument did not qualify as a hedge in accordance with either Section 210-20-45 or Section 815-10-45 or (2) subjectIAS 39. As a result of this assessment, no hedge relationships were discontinued after the transition to an enforceable master netting arrangement or similar agreement, irrespective of whether they are offset inIFRS.
In accordance with either Section 210-20-45 or Section 815-10-45. Also, in January 2013, FASB issued ASU 2013-01, to clarify implementation issues aboutIFRS 9, the scope of ASU 2011-11, specifically, amendments related to accounting for derivatives and hedging. An entityBank has assessed whether an embedded derivative is required to applybe separated from the amendmentshost contract and accounted for annual reporting periods beginning on or after Januaryseparately at fair value. As a consequence the Bank has determined there is no embedded derivative that is required to be separated from the host contract at the transition date.
| e) | Non-controlling interest: |
IFRS 1 2013. Anrequires that the entity should providethat adopts IFRS for the disclosures required by those amendments retrospectively for all comparative periods presented. Management is currently evaluatingfirst time applies certain requirements of IFRS 10 prospectively from the transition date. However, these requirements did not have an impact the amendments would have on the Bank’s financial statement and U.S. GAAP disclosures.
In December 2011, FASB issued ASU 2011-10, “Derecognition of in substance Real Estate (Topic 360)”, to resolve the diversity in practice about whether the guidance in sup-topic 360-20 applies to a parent that ceases to have a controlling interest in a subsidiary that is in substance real estate. The amendments are effective for fiscal years, and interim periods within those years beginning on or after December 15, 2013. Early adoption is permitted. The adoption had no impact on the U.S. GAAP disclosures and financial information released by the Bank for the reporting period ending on December 31, 2012 and 2011.opening balance sheet.
In September 2011, FASB issued ASU 2011-08, “Intangibles – Goodwill30.3 Reconciliation between Colombian banking GAAP and Other (Topic 350)”,IFRS applicable to simplify the way entities, both public and nonpublic, test goodwill for impairment. The amendments in this update will allow an entity to first assess qualitative factors to determine whether it is necessary to perform the two-step quantitative goodwill impairment test. Under these amendments, an entity would not be required to calculate the fair valueBank’s statement of a reporting unit unless the entity determines, based on a qualitative assessment, that it is more likely than not that its fair value is less than its carrying amount. The amendments are effective for annual and interim goodwill impairment tests performed for fiscal years beginning after December 15, 2011. Early adoption is permitted, including for annual and interim goodwill impairment tests performed as of a date before September 15, 2011, if an entity’s financial statements for the most recent annual or interim period have not yet been issued or, for nonpublic entities, have not yet been made available for issuance. The adoption had no impact on the U.S. GAAP disclosures and financial information released by the Bank for the reporting period ending on December 31, 2012 and 2011.position:
| | | As of December 31, 2014 | |
| | | Colombian
Bankig GAAP
Balances | | | Adoption adjustments
and reclassifications | | | IFRS Balances | | | Ref. | |
| ASSETS | | | | | | | | | | | | | | | |
| Cash and balances at central bank | | | 11,192,825 | | | | 2,034 | | | | 11,194,859 | | | a. | |
| Interbank borrowings | | | 947,037 | | | | 22,620 | | | | 969,657 | | | b. | |
| Reverse repurchase agreements and other similar secured lend | | | 1,302,267 | | | | - | | | | 1,302,267 | | | - | |
| Financial assets at fair value through profit or loss | | | 7,432,102 | | | | 3,005,702 | | | | 10,437,804 | | | c. | |
| Financial assets at fair value through other comprehensive income | | | 3,383,661 | | | | (1,618,408 | ) | | | 415,556 | | | d. | |
| Investment in associates and joint ventures | | | - | | | | - | | | | 1,349,697 | | | e. | |
| Investment at amortized cost | | | 2,862,038 | | | | (931,175 | ) | | | 1,930,863 | | | f. | |
| Derivative financial instrument | | | 1,472,879 | | | | (24,034 | ) | | | 1,448,845 | | | g. | |
| Loans and advances to customers | | | 108,376,915 | | | | 6,796,738 | | | | 115,173,653 | | | h. | |
| Allowance for loan and lease losses | | | (4,817,102 | ) | | | 27,845 | | | | (4,789,257 | ) | | i. | |
| Assets held for sale | | | 89,491 | | | | 8,253 | | | | 97,744 | | | j. | |
| Investment property | | | - | | | | 1,114,180 | | | | 1,114,180 | | | k. | |
| Premises and equipment, net | | | 5,950,094 | | | | (3,303,773 | ) | | | 2,646,321 | | | l. | |
| Goodwill and Intangible assets | | | 4,253,501 | | | | 332,348 | | | | 4,585,849 | | | m. | |
| Deferred tax | | | 200,853 | | | | (13,116 | ) | | | 187,737 | | | n. | |
| Other assets | | | 4,467,449 | | | | (2,903,343 | ) | | | 1,564,106 | | | o. | |
| Reappraisal | | | 1,610,851 | | | | (1,610,851 | ) | | | - | | | p. | |
| Total Assets | | | 148,724,861 | | | | 905,020 | | | | 149,629,881 | | | | |
| LIABILITIES | | | | | | | | | | | | | | | |
| Deposit by customers | | | 95,337,222 | | | | (567,903 | ) | | | 94,769,319 | | | q. | |
| Interbank deposits | | | 223,155 | | | | 152,803 | | | | 375,958 | | | r. | |
| Repurchase agreements and other similar secured borrowing | | | 1,891,949 | | | | 10 | | | | 1,891,959 | | | - | |
| Derivative financial instrument | | | 1,230,434 | | | | 241,345 | | | | 1,471,779 | | | s. | |
| Borrowings from other financial institutions | | | 13,936,592 | | | | (84,308 | ) | | | 13,852,284 | | | t. | |
| Debt securities in issue | | | 13,682,855 | | | | 844,548 | | | | 14,527,403 | | | u. | |
| Preferred shares | | | - | | | | 579,946 | | | | 579,946 | | | v. | |
| Current tax | | | 157,702 | | | | (38,048 | ) | | | 119,654 | | | - | |
| Deferred tax | | | 237,896 | | | | 305,205 | | | | 543,101 | | | w. | |
| Post - employment benefit plans | | | 108,717 | | | | 315,841 | | | | 424,558 | | | x. | |
| Other liabilities | | | 4,606,597 | | | | (899,157 | ) | | | 3,707,440 | | | y. | |
| Total liabilities | | | 131,413,119 | | | | 850,282 | | | | 132,263,401 | | | | |
| EQUITY | | | | | | | | | | | | | | | |
| Share capital | | | 480,914 | | | | - | | | | 480,914 | | | - | |
| Additional paid-in-capital | | | 5,389,372 | | | | (531,918 | ) | | | 4,857,454 | | | z. | |
| Appropriate reserves | | | 8,636,160 | | | | (3,505,299 | ) | | | 5,130,861 | | | aa. | |
| Retained earnings | | | (527,009 | ) | | | - | | | | - | | | ab. | |
| Accumulated other comprehensive income (loss), net of tax | | | 1,878,721 | | | | 4,315,325 | | | | 5,667,037 | | | ac. | |
| Stockholders’ equity attributable the owners of the parent company | | | 959,197 | | | | (223,556 | ) | | | 735,641 | | | | |
| Cash and balances at central bank | | | 16,817,355 | | | | 54,552 | | | | 16,871,907 | | | | |
| Non-controlling interest | | | 494.387 | | | | 186 | | | | 494,573 | | | | |
| Total equity | | | 17,311,742 | | | | 54,738 | | | | 17,366,480 | | | | |
| Total liabilities and stockholders' equity | | | 148,724,861 | | | | 905,020 | | | | 149,629,881 | | | | |
In May 2011, FASB issued ASU 2011-04, “Amendments to Achieve Common Fair Value Measurement and Disclosure Requirements in U.S. GAAP and IFRSs”, as a resultF-128
| | | As of January 1, 2014 | |
| | | Colombian Bankig
GAAP Balances | | | Adoption
adjustments and
reclassifications | | | IFRS Balances | | | Ref. | |
| ASSETS | | | | | | | | | | | | | | | |
| Cash and balances at central bank | | | 11,427,441 | | | | 12,816 | | | | 11,440,257 | | | a. | |
| Interbank borrowings | | | 1,856,484 | | | | 24,515 | | | | 1,880,999 | | | b. | |
| Reverse repurchase agreements and other similar secured lend | | | 2,124,721 | | | | - | | | | 2,124,721 | | | - | |
| Financial assets at fair value through profit or loss | | | 6,949,684 | | | | 2,939,243 | | | | 9,888,927 | | | c. | |
| Financial assets at fair value through other comprehensive income | | | 3,066,408 | | | | (1,644,858 | ) | | | 392,068 | | | d. | |
| Investment in associates and joint ventures | | | - | | | | | | | | 1,029,482 | | | e. | |
| Investment at amortized cost | | | 3,789,698 | | | | (987,837 | ) | | | 2,801,861 | | | f. | |
| Derivative financial instrument | | | 563,820 | | | | (34,201 | ) | | | 529,619 | | | g. | |
| Loans and advances to customers | | | 90,122,448 | | | | 6,280,870 | | | | 96,403,318 | | | h. | |
| Allowance for loan and lease losses | | | (4,129,275 | ) | | | (344,287 | ) | | | (4,473,562 | ) | | i. | |
| Assets held for sale | | | 103,565 | | | | (49,914 | ) | | | 53,651 | | | j. | |
| Investment property | | | - | | | | 984,701 | | | | 984,701 | | | k. | |
| Premises and equipment, net | | | 5,110,858 | | | | (2,684,388 | ) | | | 2,426,470 | | | l. | |
| Goodwill and Intangible assets | | | 3,589,203 | | | | 304,315 | | | | 3,893,518 | | | m. | |
| Deferred tax | | | 202,197 | | | | 37,162 | | | | 239,359 | | | n. | |
| Other assets | | | 4,616,063 | | | | (3,255,089 | ) | | | 1,360,974 | | | o. | |
| Reappraisal | | | 1,422,926 | | | | (1,422,926 | ) | | | - | | | p. | |
| Total Assets | | | 130,816,241 | | | | 160,122 | | | | 130,976,363 | | | | |
| LIABILITIES | | | | | | | | | | | | | | | |
| Deposit by customers | | | 86,556,579 | | | | (44,475 | ) | | | 86,512,104 | | | q. | |
| Interbank deposits | | | 108,509 | | | | 120,692 | | | | 229,201 | | | r. | |
| Repurchase agreements and other similar secured borrowing | | | 1,016,293 | | | | 149 | | | | 1,016,442 | | | - | |
| Derivative financial instrument | | | 464,514 | | | | 157,474 | | | | 621,988 | | | s. | |
| Borrowings from other financial institutions | | | 12,508,092 | | | | (29,381 | ) | | | 12,478,711 | | | t. | |
| Debt securities in issue | | | 12,328,275 | | | | 345,466 | | | | 12,673,741 | | | u. | |
| Preferred shares | | | - | | | | 299,963 | | | | 299,963 | | | v. | |
| Current tax | | | 187,313 | | | | (30,637 | ) | | | 156,676 | | | - | |
| Deferred tax | | | 159,961 | | | | 249,881 | | | | 409,842 | | | w. | |
| Post - employment benefit plans | | | 113,653 | | | | 209,441 | | | | 323,094 | | | x. | |
| Other liabilities | | | 4,434,758 | | | | (823,964 | ) | | | 3,610,794 | | | y. | |
| Total liabilities | | | 117,877,947 | | | | 454,609 | | | | 118,332,556 | | | | |
| EQUITY | | | | | | | | | | | | | | | |
| Share capital | | | 425,914 | | | | - | | | | 425,914 | | | - | |
| Additional paid-in-capital | | | 2,812,494 | | | | (241,095 | ) | | | 2,571,399 | | | z. | |
| Appropriate reserves | | | 6,990,015 | | | | (2,617,346 | ) | | | 4,372,669 | | | aa. | |
| Retained earnings | | | 1,450,639 | | | | 3,276,180 | | | | 4,726,819 | | | ab. | |
| Accumulated other comprehensive income (loss), net of tax | | | 813,784 | | | | (728,963 | ) | | | 84,821 | | | ac. | |
| Stockholders’ equity attributable the owners of the parent company | | | 12,492,846 | | | | (311,224 | ) | | | 12,181,622 | | | | |
| Non-controlling interest | | | 445,448 | | | | 16,737 | | | | 462,185 | | | | |
| Total equity | | | 12,938,294 | | | | (294,487 | ) | | | 12,643,807 | | | | |
| Total liabilities and stockholders' equity | | | 130,816,241 | | | | 160,122 | | | | 130,976,363 | | | | |
Explanatory notes of the work developed by the FASBmain adjustments and the IASB to expand common requirements for measuring fair value and for disclosing information about fair value measurementsreclassification in accordance with U.S. generally accepted accounting principles (GAAP) and International Financial Reporting Standards (IFRSs). The amendments in this update requires additional disclosures including the following: (1) Information about transfers between Level 1 and Level 2 of the fair value hierarchy, (2) Information about the sensitivity of a fair value measurement categorized within Level 3 of the fair value hierarchy to changes in unobservable inputs and any interrelationships between those unobservable inputs, (3) The categorization by level of the fair value hierarchy for items that are not measured at fair valuefirst-time adoption in the statement of financial position, butposition:
| a. | | ↑ | | Increased by the removal of allowances for cash and cash equivalents. |
| b. | | ↑ | | By reclassification of receivable item under Colombian banking GAAP related to interbank and money market transaction. |
| c. | | ↑ | | Increase due to reclassification of non-compulsory investments that under Colombian banking GAAP were classified as held-to-maturity, and which are recognized at fair value under IFRS in accordance with the business model determined for these investments. Under Colombian banking GAAP investment securities intended to be held on a continuing basis were included in the balance sheet at cost less provision for any impairment. Under IFRS the portfolio shares was increased by the fair value measurement in accordance with IFRS 13. |
| d. | | ↓ | | Reclassification to Investments item under IFRS at fair value through profit or loss in accordance with the business model determined for these assets amounted to COP 2,035,522 and COP 2,196,610, as of January 1, 2014 and December 31, 2014, respectively. |
| e. | | ↑ | | Under Colombian banking GAAP the investments on which the Bank has significant influence or joint control were measured at cost and classified as investments available for sale. The difference between the cost and equity participation was recorded as reappraisal of assets in ‘other assets’ item and stockholders’ equity. Those investments are reclassified to ‘Investment in associates and joint ventures’ item under IFRS and are measured based on the equity method in accordance with IAS 28. The effect of applying the equity method to those investments amounted to COP 320,442 and COP 483,360 as of January 1, 2014 and December 31, 2014, respectively. |
| f. | | ↓ | | Reclassification of Investments held to maturity under Colombian banking GAAP, which under IFRS do not fulfill requirements provided by IFRS 9 to be recognized at amortized cost due to the fact that if there is an exchange offer of securities issued by the Colombian Government, sales or exchanges of such securities are allowed under Colombian banking GAAP regardless of being initially classified as held to maturity. |
| | | | Increase under IFRS for the first day of valuation as deferred charge amounted to COP 2,647 as of December 31, 2014. In accordance with IFRS 9, the fair value of a financial instrument at initial recognition is normally the transaction price. However, for certain derivatives the consideration given or received is other than the fair value of the financial instrument, in that case the adjustment to defer the difference must be recognized, and after initial recognition, the entity shall recognize that deferred difference as gain or loss only to the extent that it arises from a change in a factor that market participants would take into account when pricing the asset or liability. Under Colombian banking GAAP, the transaction price is considered as the fair value at the initial recognition. |
| g. | | ↓ | | Under Colombian banking GAAP, the measurement of the fair value of derivatives does not include a credit valuation adjustment (“CVA”) / debit value adjustment. Under IFRS, the Bank measures the effects of the credit risk of its counterparties and its own creditworthiness in determining fair value of the swap, option and forward derivatives. Reduction by COP 26,681 and COP 34,201 as of December 31, and January 1, 2014, respectively due to the inclusion of Credit Value Adjustment (CVA) / Debit Value Adjustment (DVA) in the valuation of contracts. |
| | | | Short-term credit investment issued by a non-financial firm and guaranteed by the Bank as to payment was accounted for as customers’ acceptances item under Colombian banking GAAP , and reclassified to the loan portfolio under IFRS by COP 90,049 and COP 38,589, as of December 31, 2014 and January, 1, 2014, respectively. |
| | | | Increase by reclassification of operating leases under Colombian banking GAAP into financial leases under IFRS. |
| | | | Financial Leasing-related advance payments item under Colombian banking GAAP were accounted for as ‘Other assets’ and reclassified into loans and leases under IFRS. |
| h. | | ↑ | | Increase due to the recognition of suspended interest as part of the loan. |
| i. | | ↓↑ | | Reduction by COP 40,021 in allowances as of December 31, 2014. Under Colombian banking GAAP, allowances are estimated based on expected losses while under IFRS, allowances are estimated based on incurred losses. The reduction in the level of the difference of allowances estimated by the Bank under Colombian banking GAAP and IFRS as of January 1, 2014 and December 31, 2014 is explained mainly by the increase in the level of corporate loans granted by the Parent Company during the year 2014 for which the probability of default is lower, |
| | | | Reclassification of returned assets by the customer in lease contracts that are recognized in the ‘Premises and equipment’ item under Colombian banking GAAP and under IFRS are classified as ‘inventories’ item under IFRS amounted to COP 48,087 and COP 5,987 as of December 31, 2014 and January 1, 2014, respectively. |
| j. | | ↑ | | Under IFRS, the Bank due to the course of its ordinary activities, routinely sells item of property and equipment held to be leased to third parties and then such assets are recognized as inventories. Those inventories are measured at the lower cost and net realizable value. Under Colombian banking GAAP those assets were recognized at cost. Due to the difference in measurement of inventories item the Bank has recognized a decreased in the related carrying amount of COP 38,275 and COP 93,677 as of December 31, 2014 and January 1, 2014, respectively. |
| | | | Under Colombian banking GAAP the property held to earn rentals are recognized at cost of acquisition and the depreciation is calculated on a straight-line basis over the estimated useful life of the asset, those assets were recognized as ‘premises and equipment’. Under IFRS, the Bank’s investment properties item were initially measured at deemed cost and subsequently measured using a fair value model. Reclassification of premises and equipment item under Colombian banking GAAP to investment properties under IFRS amounted to COP 513,529 and COP 527,986, respectively as of December 31, 2014 and January 1, 2014. |
| k. | | ↓ | | Under Colombian banking GAAP reappraisal of a portion of the entity’s properties was recognized as an increase or decrease in the balance sheet under the assets caption “Reappraisal of assets”. Under IFRS the Bank has used the reappraisal of asset recognized as investment properties according the prior accounting practices (Colombian banking GAAP) as the deemed cost of those assets at the date of transition. The related adjustment amounted to COP 456,715. |
| | | | Under Colombian banking GAAP, the Bank accounts for improvements on leased property in the statement of operations. Under IFRS, leasehold improvements that met certain criteria are recorded as premises and equipment and depreciated on a monthly basis over the term of the leases. The adjustment effect amounted to COP 109,344 and COP 100,437 as of December 31, 2014 and January 1, 2014, respectively. |
| | | | Reclassification of assets to place in operating leases recognized as ‘other assets’ item under Colombian banking GAAP to ’Premises and equipment’ under IFRS amounted to COP 2,129 and COP 1,495, as of December 31, 2014 and January, 1, 2014; respectively. |
| | | | According to Colombian banking GAAP, reappraisals of a portion of the Bank’s premises and equipment, must have been made periodically and the effects of the increase or decrease are recorded in the balance sheet under the assets caption “Reappraisal of assets” and in the stockholders’ equity caption “Surplus from reappraisals of assets”. Reappraisal of premises and equipment were considered as deemed cost at first-time adoption statement of financial position in accordance with IFRS 1. The reclassification from ‘reappraisal of assets’ to ‘premises and equipment’ amounted to COP 321,872 and COP 163,571, as of December 31, 2014 and January 1, 2014, respectively. |
| | | | Increase by COP 165,662 and COP 269,565 as of December 31, 2014 and January 1, 2014 due to the extension of the useful life of premises and equipment under IFRS. |
| | | | Under IFRS the cost of an item of premises and equipment shall be recognized as an asset if, and only if: |
| | | | | · | It is probable that the future economic benefits associated with the item will flow to the entity, and |
| | | | | · | The cost of the item can be measured reliably. |
| | | | Derecognition of assets that not meet the aforementioned criteria for being accounted as an assets under IFRS amounted to COP 12,159 and COP 22,870 as of December 31, 2014 and January 1, 2014. |
| l. | | ↑ | | Under Colombian banking GAAP properties held to earn rentals are recognized at cost of acquisition and the depreciation is calculated on a straight-line basis over the estimated useful life of the asset, which were recognized as ‘premises and equipment’. Under IFRS, the Bank’s investment properties item was initially measured at deemed cost and subsequently measured using a fair value model. Reclassification of premises and equipment item under Colombian banking GAAP to investment properties under IFRS amounted to COP 513,529 and COP 527,986, respectively as of December 31, 2014 and January 1, 2014. |
| | | | Under IFRS, the goodwill is not amortized; it is only subject to an annual impairment test. Under Colombian banking GAAP the goodwill was amortized. During the year 2014 the Bank has recognized the amount of COP 397,798 as an amortization charge under Colombian banking GAAP which was not considered for IFRS purposes. |
| m. | | ↑ | | Derecognition by COP 70,226 of assets that do not meet the definition of intangible assets in accordance with IAS 38. |
| n. | | ↓ | | Due to the recognition of the timing differences between the fiscal and accounting basis under IFRS. |
| o. | | ↓ | | Under Colombian banking GAAP, receivables for costumer payments and those resulting originated in sale of services were recognized as ‘other assets’ item in the balance sheet. Under IFRS, the aforementioned receivables are recorded as ‘loans and advances to customers’ item. The reclassification amounted to COP 1,705,770 and 1,537,218, as of December 31, 2014 and January 1, 2014. Reclassification of contracts related to assets to place in financial leases which were classified under Colombian banking GAAP in the ‘other assets’ item, instead of ‘loans and advances to customers’ as recognized under IFRS by the Bank. |
| p. | | ↓ | | Reappraisal of premises and equipment were considered as deemed cost at first-time adoption statement of financial position in accordance with IFRS 1. The reclassification from ‘reappraisal of assets’ to ‘premises and equipment’ amounted to COP 321,872 and COP 163,571, as of December 31, 2014 and January 1, 2014, respectively. |
| q. | | ↓ | | Under Colombian banking GAAP the interest payable related to deposits by customers was recognized as ‘other liabilities’. Under IFRS 9, a financial liability is measured as the present value of all future cash outflows discounting using the effective interest rate, Consequently, the Bank has reclassified the interest payable amount under Colombian banking GAAP of COP 172,455 to the balance of deposits by customers at amortized cost under IFRS. |
| r. | | ↑ | | Under Colombian banking GAAP the interest payable related to interbank deposits was recognized as ‘other liabilities’. Under IFRS 9, a financial liability is measured as the present value of all future cash outflows discounting using the effective interest rate, Consequently, the Bank has reclassified the interest payable amount under Colombian banking GAAP of COP 157,488 and COP 120,692 as of December 31, 2014 and January 1, 2014, respectively, to the balance of interbank deposits at amortized cost under IFRS. |
| s. | | ↑ | | Increased by the recognition of put options held by BFC that gives to the latter the right to sell and Bancolombia Panama the obligation to buy any number of voting shares of GAH, see Note 8.3 Acquisition of GAH. Under IFRS, written put/call options agreed upon by parties in a share purchase agreement (‘SPA’) are recognized in accordance with IAS 32. The fair value of the aforementioned option was USD 106.8 million and USD 99.8 million as of December 31, 2014 and January 1, 2014, respectively. Reduction due to the inclusion of Credit Value Adjustment (CVA) / Debit Value Adjustment (DVA) in the valuation of contracts by COP 14,197 and COP 34,973 as of December 31, 2014 and January 1, 2014, respectively. |
| | | | Reclassification of interest payable item under Colombian banking GAAP to the balance of borrowings under IFRS. |
| t. | | ↓ | | Under IFRS origination fees are recorded through the effective interest rate of the financial obligation. |
| | | | Reclassification of interest payable item under Colombian banking GAAP to debt securities in issue under IFRS. |
| u. | | ↑ | | Costs associated to the issuance of securities are recorded as a lower value of the obligation and recognized through the statement of income during the term of the securities using the amortized cost method |
| v. | | ↑ | | Under IFRS, the present value of the minimum dividend on preferred shares is recognized as a liability. |
| w. | | ↑ | | Due to the recognition of the timing differences between the fiscal and accounting basis under IFRS. |
| x. | | ↑ | | For IFRS purposes, actuarial valuations of seniority bonuses must be performed annually using the projected unit credit cost method and the discount rates must be based on a review of market bond yields with maturities approximating the remaining life of the projected benefit obligation. |
| y. | | ↓ | | Reclassification of estimated liabilities item under Colombian banking GAAP to suppliers, employee benefits and taxes and contributions under IFRS. |
| z. | | ↓ | | IFRS requires that the components of compound financial instruments, as defined by IAS 32, be separated and classified as debt instruments and equity instruments |
| aa. | | ↓ | | Under Colombian banking GAAP the consolidation process of combining the items of assets and liabilities, equity, income, expenses and cash flows of the Parent Company with those of its subsidiaries is performed offsetting the Bank’s participation in the stockholders’ equity of each subsidiary measured at the historical transaction rate, instead of eliminate the carrying amount (deemed cost at the adoption date) of the parent’s investment in each subsidiary. As a consequence, the consolidation adjustment of appropriated reserves differs between Colombian banking GAAP and IFRS. |
| ab. | | ↑ | | First-time adoption adjustments. |
| ac. | | ↓ | | Reappraisal of premises and equipment and investment were considered as deemed cost at first-time adoption statement of financial position in accordance with IFRS1. |
30.4 The reconciliation between Colombian banking GAAP and IFRS applicable to the statement of income:
| | | For the year ended at December 31, 2014 | |
| | | Colombian Banking
GAAP balances | | | IFRS adjustments and
reclassification | | | IFRS balances | | | Ref | |
| Interest income on loans | | | 8,594,670 | | | | (4,910 | ) | | | 8,589,760 | | | a | |
| Overnight and market funds | | | 11,129 | | | | (7 | ) | | | 11,122 | | | - | |
| Interest and valuation on investment | | | 710,879 | | | | (139,598 | ) | | | 571,281 | | | b | |
| Total interest and valuation | | | 9,316,678 | | | | (144,515 | ) | | | 9,172,163 | | | - | |
| Interest expenses | | | (3,164,715 | ) | | | 104 | | | | (3,164,611 | ) | | c | |
| Net margin on financial instruments | | | 6,151,963 | | | | (144,411 | ) | | | 6,007,552 | | | - | |
| Credit impairment charges on loans, net | | | (1,373,735 | ) | | | 530,138 | | | | (843,597 | ) | | d | |
| Allowances for credit losses on off balance sheet credit instruments | | | (30,610 | ) | | | 5,002 | | | | (25,608 | ) | | - | |
| Total net provisions | | | (1,404,345 | ) | | | 535,140 | | | | (869,205 | ) | | - | |
| Net interest and valuation income after provision for loans and financial leases | | | 4,747,618 | | | | 390,729 | | | | 5,138,347 | | | - | |
| Fees and other service income | | | 2,605,191 | | | | (109,774 | ) | | | 2,495,417 | | | e | |
| Fees and other service expenses | | | (349,881 | ) | | | (319,826 | ) | | | (669,707 | ) | | f | |
| Total fees and income from services, net | | | 2,255,310 | | | | (429,600 | ) | | | 1,825,710 | | | - | |
| Other operating income | | | 766,303 | | | | 370,240 | | | | 1,136,543 | | | g | |
| Dividends received and equity method | | | 95,133 | | | | 27,556 | | | | 122,689 | | | h | |
| Total income net | | | 7,864,364 | | | | 358,925 | | | | 8,223,289 | | | - | |
| Operating expenses | | | | | | | | | | | | | | | |
| Salaries and employee benefits | | | (1,937,775 | ) | | | (35,692 | ) | | | (1,973,467 | ) | | i | |
| Other administrative and general expenses | | | (2,280,278 | ) | | | 332,903 | | | | (1,947,375 | ) | | j | |
| Wealth tax, contributions and other tax burden | | | (494,899 | ) | | | 56,188 | | | | (438,711 | ) | | k | |
| Provision, depreciation and amortization | | | (537,129 | ) | | | 77,426 | | | | (459,703 | ) | | l | |
| Other expenses | | | (146,487 | ) | | | (152,952 | ) | | | (299,439 | ) | | m | |
| Total operating expenses | | | (5,396,568 | ) | | | 277,873 | | | | (5,118,695 | ) | | | |
| Profit before tax | | | 2,467,796 | | | | 636,798 | | | | 3,104,594 | | | | |
| Income tax | | | (589,075 | ) | | | (148,601 | ) | | | (737,676 | ) | | n | |
| Profit for the year from continuing operations | | | 1,878,721 | | | | 488,197 | | | | 2,366,918 | | | | |
| Discontinued operations net income | | | - | | | | 62,867 | | | | 62,867 | | | | |
| Net income | | | 1,878,721 | | | | 551,064 | | | | 2,429,785 | | | | |
| Net income attributable to equity holders of the Parent Company | | | 1,878,593 | | | | 508,493 | | | | 2,387,086 | | | | |
| Non-controlling interest | | | 128 | | | | 42,571 | | | | 42,699 | | | o | |
Explanatory notes for adjustments and reclassification of first-time adoption in the statement of income:
| a. | | - Increase due to the recognition of suspended interest as part of the loan. - Reversal of accrual of interests in arrears, under IFRS they are considered as contingent asset. - Increase in interest income due to the reclassification of operating leases into financial leases. |
| b. | | - Fair value adjustment on valuation of debt securities recognized as held-to-maturity under Colombian banking GAAP - CVA/DVA adjustment on valuation of derivatives. |
| c. | | - Interest expenses related to the interest cost of employee benefit plans and the valuation adjustment of the compound instruments classified as liabilities. - Bond issuance costs are recognized as a lower value of the obligation. |
| d. | | -Decrease in the impairment charges. Under Colombian banking GAAP, allowances are estimated based on expected losses while under IFRS, allowances are estimated based on incurred losses. |
| e. | | - Under Colombian banking GAAP, the Bank recognizes commissions (origination fees) on loans, lines of credit and letters of credit when collected and records related direct costs when incurred. Under IFRS, the Bank identifies origination commissions, which are recognized as an integral part of the effective interest rate of the financial instrument. Consequently, the differences between both frameworks results in reversal of income from commission recognized at the origination date under Colombian banking GAAP. - Adjustment related to commissions in financial guarantees and credit letters granted by the Bank. |
| f. | | - Under IFRS commissions paid by the Bank for financial obligations are amortized on a straight line basis during the life of the contract. Under Colombian banking GAAP, those commissions fees are recorded in the consolidated statement of income and expensed as incurred. The adjustment amounted to COP 1,819. - Under Colombian banking GAAP, certain royalties and expenses related to fees and other service income was recognized as ‘Other expenses’ item by COP 332,044. Under IFRS those expenses are recorded as ‘fees and other service expenses’ item in the statement of income. |
| g. | | - Under Colombian banking GAAP leases are classified as either financial leases or operating leases according to the terms of the leases agreements, considering that all leases to third parties with a purchase option were recognized as financial leases. Under IFRS, a finance lease is a lease that transfers substantially all the risk and rewards incidental to ownership of an asset. Due to the increase by reclassification of operating leases item under Colombian banking GAAP into financial leases under IFRS, the operating lease income was reduced by COP 166,665. - The exchange rate difference arising from currency translation is greater by COP 71,174 under Colombian banking GAAP than under IFRS mainly due to: 1. As a result of the differences in balance sheets accounts denominated in foreign currencies under Colombian banking GAAP and IFRS that are subject to conversion to Colombian pesos. 2. The income accounts of foreign currency financial statements converted to pesos using average exchange rates are recorded in the statement of OCI under IFRS, while under Colombian banking GAAP was recorded as foreign exchange gain/loss in the statement of income. - Under Colombian banking GAAP, the measurement of the fair value of derivatives does not include a credit valuation adjustment; the related adjustment amounted to COP 3,171. |
| h. | | - Under IFRS the Bank recognizes its significant influence on certain equity securities through the equity method. Under Colombian banking GAAP, investments where the investor had the ability to exercise significant influence were recorded at cost and classified as available for sale. The difference between the cost and equity participation was recorded as reappraisal of assets in assets and stockholders’ equity. -Fair value adjustment on portfolio shares which were recognized at amortized cost under Colombian banking GAAP. |
| i. | | - Increase in employee benefits expenses due to actuarial estimation of pension and long term benefit plan liabilities. |
| j. | | - Capital expenditures on software licenses that do not meet recognition criteria to be recognized as intangible assets under IFRS are not subject to amortization expense. |
| k. | | - Reversal of amortization of the equity tax recorded under Colombian banking GAAP as deferred charge. Under IFRS, an equity tax liability must be recorded on a discounted basis to reflect the time value of money as the aggregate amount of the liability and the amount and timing of cash payments are fixed. |
| l. | | - Decrease in the depreciation charge due to the extension of the useful life of premises and equipment. Under IFRS the goodwill is not subject to amortization. |
| m. | | - Reversal of operating leases expenses on contracts that were reclassified into financial leases under IFRS. - Adjustment of provisions for litigation under IFRS. |
| n. | | - Due to the recognition of the timing differences between the fiscal and accounting basis under IFRS. |
| o. | | Under Colombian banking GAAP and IFRS, consolidated net income and comprehensive income are reported with separate disclosure of the amounts attributable to the parent and to the non-controlling interest, and corresponds to net income originated by the subsidiaries where the Bank holds less than 100% of participation. The Bank held an interest in participation of FCP Colombia Inmobiliaria of 50.21% of the outstanding shares, being a significant non-controlling interest for the Bank. Under Colombian banking GAAP the assets held for rental and investments in real estate properties were recorded as premises and equipment subject to amortization charge; whereas under IFRS the changes in the fair value of investment properties are recognized in the statement of income. |
30.5 The reconciliation between Colombian banking GAAP and IFRS applicable to the statement of other comprehensive income:
| | | For the year ended 31, 2014 | |
| | | Colombian
banking GAAP | | | IFRS adjustments
and reclassification | | | IFRS | | | Ref | |
| | | In millions of COP | |
| Other comprehensive (loss)⁄income that will not be reclassified to profit or loss | | | | | | | | | | | | | | | |
| Gain (loss) retirement benefit remeasurement | | | - | | | | (20,890 | ) | | | (20,890 | ) | | a | |
| Reappraisal of assets | | | 960,123 | | | | (960,123 | ) | | | - | | | b | |
| Revaluation of equity | | | 24,623 | | | | (24,623 | ) | | | - | | | c | |
| Total other comprehensive (loss)⁄income that will not be reclassified to profit or loss | | | 984,746 | | | | (1,005,636 | ) | | | (20,890 | ) | | | |
| Other comprehensive loss that may be reclassified to profit and loss | | | | | | | | | | | | | | | |
| Foreign currency translation adjustments | | | - | | | | 745,381 | | | | 745,381 | | | d | |
| Unrealized gains or (loss) on equity securities at fair value through OCI | | | (36,054 | ) | | | (53,662 | ) | | | (89,716 | ) | | e | |
| Unrealized gains or (loss) on debt securities at fair value through OCI | | | 9,155 | | | | (9,155 | ) | | | - | | | f | |
| Unrealized gains or (loss) due to fair value hedging | | | 1,350 | | | | 4,384 | | | | 5,734 | | | g | |
| Total other comprehensive loss that may be reclassified to profit or loss | | | (25,549 | ) | | | 686,948 | | | | 661,399 | | | | |
| Total other comprehensive loss that may be reclassified to profit or loss | | | 959,197 | | | | (318,688 | ) | | | 640,509 | | | | |
Explanatory notes for adjustments and reclassification of first-time adoption in the statement of other comprehensive income:
| a. | | - Under Colombian banking GAAP the changes in the projected benefit obligation of employee benefit plans resulting from changes in actuarial assumption were recognized as a liability and then amortized against expenses on a straight line basis over defined periods established by local regulation. Under IFRS, those changes in the projected benefit obligation are recorded against cumulative other comprehensive income. |
| b. | | - According to Colombian banking GAAP, reappraisals of a portion of the Bank’s premises and equipment, equity investments and other non-monetary assets are made periodically and the effects of the increase or decrease are recorded in the statement of financial position under the assets caption “Reappraisal of assets” and in the stockholders’ equity. Reappraisal of premises and equipment and investment were considered as deemed cost at first-time adoption statement of financial position in accordance with IFRS1. |
| c. | | - Under Colombian banking GAAP, the Bank recognized the item ‘Revaluation of equity’ which was originated when in the past companies recorded inflation adjustments. |
| d. | | - Under Colombian banking GAAP, for consolidation purposes, the income accounts of foreign currency financial statements are converted to pesos using average exchange rates. The exchange difference originated in the consolidated statement of income accounts is recorded as foreign exchange gain/loss in the statement of income. Under IFRS, the translation adjustments shall be reported as a component of the other comprehensive income. |
| e. | | - Increased due to reclassification of certain investments under IFRS at fair value through OCI in accordance with the business model determined for these assets and the fair value measurement in accordance with IFRS 13. |
| f. | | - Due to reclassification for certain securities from ‘debt investment available for sale’ item under Colombian banking GAAP to ‘debt investments at fair value through profit or loss or debt investment at amortized cost’ considering the Bank’s business model under IFRS , the accumulated change in fair value of those investment under IFRS in the OCI is nil. |
| g. | | - Under Colombian banking GAAP, the measurement of the fair value of derivatives does not include a CVA/DVA. Under IFRS, the Bank measures the effects of the credit risk of its counterparties and its own creditworthiness in determining fair value of the derivatives designed as hedging instruments. |
NOTE 31. DISCONTINUED OPERATIONS
Compañía de financiamiento Tuya S.A is a private entity oriented to offer lines of credit directed to individuals, corporate credit cards, vehicle loan and payroll loans among others, wherewith Tuya has achieved a significant market share position in the consumer loan market in Colombia
On June 30, 2015 Bancolombia S.A, Fondo de Empleados of The Bank - FEBANC and Fundacion Bancolombia, acting as sellers, and Almacenes Éxito S.A (Almacenes Exito) and Almacenes Éxito Inversiones S.A.S acting as the buyers entered into a purchase and sale agreement whereby the sellers will transfer 50% of the shares of Tuya S.A, through which sellers and buyers have developed a commercial alliance for financing business growth and the strengthening of consumer credit.
The purchase price will be determined at the closing and will equal the sum of:
| a. | Fifty percent (50%) of the sum of the following accounts of Tuya according to the most recent financial statements before the closing: (a) equity (b) capital stock (c) additional paid in capital |
| b. | One thousand five hundred million Colombian pesos (COP1,500). |
The sale is subject to certain conditions, including, among others, receipt of the required regulatory approvals by the Colombian Superintendence of Finance.
This transaction will not produce a material impact on the Bank’s dividends from Tuya, due to subsisting commercial and business conditions in which the commercial alliance with Almacenes Exito has developed.
Compañía de financiamiento Tuya is included in the Bank’s operating segment Banking Colombia.
Assets classified as held for sale
At December 31, 2015 Compañía de financiamiento Tuya was composed of assets and liabilities as presented below:
| | 2015 | |
| | In millions of COP | |
| Assets | | | | |
| Cash and balances at central bank | | | 207,963 | |
| Financial assets investments | | | 31,265 | |
| Loans and advances to customers | | | 1,831,773 | |
| Allowance for loan and lease losses | | | (351,375 | ) |
| Intangible assets | | | 2,267 | |
| Premises and equipment | | | 5,746 | |
| Prepayments | | | 724 | |
| Tax receivables | | | 11,152 | |
| Deferred tax | | | 32,726 | |
| Other assets | | | 48,738 | |
| Total Assets | | | 1,820,979 | |
| Liabilities | | | | |
| Deposit from customers | | | 1,266,305 | |
| Borrowings from other financial institutions | | | 378 | |
| Debt securities in issue | | | 150,032 | |
| Currrent Tax | | | 1,535 | |
| Deferred tax liabilities | | | 28,503 | |
| Other liabilities | | | 158,380 | |
| Total liabilities | | | 1,605,133 | |
| Net assets classified as held for sale | | | 215,846 | |
Analysis of profit for the year from discontinued operations
The combined results of the discontinued operations included in the profit for the year are set out below. The comparative profit and cash flows from discontinued operations have been re-presented to include those operations classified as discontinued in the current year.
| A) | Profit for the year from discontinued operations |
| | | 2015 | | | 2014 | |
| | | In millions of COP | |
| Interest income on loans | | | 403,382 | | | | 378,612 | |
| Overnight and market funds | | | 53 | | | | - | |
| Interest and valuation on investment | | | 698 | | | | - | |
| Total interest and valuation | | | 404,133 | | | | 378,612 | |
| Interest expense | | | (74,919 | ) | | | (69,484 | ) |
| Net margin on financial instruments | | | 329,214 | | | | 309,128 | |
| Credit impairment charges on loans, net | | | (324,309 | ) | | | (208,959 | ) |
| Net interes and valuation income after provision for loans and financial leases | | | 4,905 | | | | 100,169 | |
| Fees and other service income, net | | | 235,806 | | | | 272,204 | |
| Other operating income | | | 267 | | | | 2,893 | |
| Total income, net | | | 240,978 | | | | 375,266 | |
| Total operating expenses | | | (219,532 | ) | | | (275,419 | ) |
| Profit before tax | | | 21,446 | | | | 99,847 | |
| Income tax | | | 1,067 | | | | (36,980 | ) |
| Net income of discontinued operations net income attributable the owners of the parent company | | | 22,513 | | | | 62,867 | |
| B) | Cash flow from discontinued operations |
| | | 2015 | | | 2014 | |
| | | In millions of COP | |
| Cash flows provided by operating activities: | | | | | | | | |
| Net Income | | | 22,508 | | | | 62,861 | |
| Total net income adjustments | | | 308,945 | | | | 267,223 | |
| Net changes of assets and liabilities | | | (243,153 | ) | | | (279,429 | ) |
| Net cash provided by operating activities | | | 88,300 | | | | 50,655 | |
| Cash flows provided by (used in) investing activities: | | | | | | | | |
| Net cash provided by (used in) investing activities | | | 12,259 | | | | (3,235 | ) |
| Cash flows used in financing activities: | | | | | | | | |
| Net cash used in financing activities | | | (42,823 | ) | | | (34,655 | ) |
| Net increased in cash | | | 57,736 | | | | 12,765 | |
| Cash at the beginning of the year | | | 150,225 | | | | 137,460 | |
| Cash at the end of the year | | | 207,961 | | | | 150,225 | |
Tuya’s loan portfolio designated as assets held for sale is comprised as follows:
Concentration by maturity:
| | | December 31, 2015 | |
| Maturity | | Less Than 1
Year | | | Between 1 and
3 Years | | | Between 3 and
5 Years | | | Greater Than
5 Years | | | Total | |
| | | In millions of COP | |
| Commercial | | | - | | | | - | | | | - | | | | - | | | | - | |
| Corporate | | | - | | | | - | | | | - | | | | - | | | | - | |
| SME | | | - | | | | - | | | | - | | | | - | | | | - | |
| Others | | | - | | | | - | | | | - | | | | - | | | | - | |
| Consumer | | | 676,570 | | | | 847,834 | | | | 296,512 | | | | 10,857 | | | | 1,831,773 | |
| Credit card | | | 676,454 | | | | 805,933 | | | | 275,666 | | | | 3,249 | | | | 1,761,302 | |
| Vehicle | | | 30 | | | | 35,809 | | | | 19,166 | | | | 7,242 | | | | 62,247 | |
| Order of payment | | | - | | | | - | | | | - | | | | - | | | | - | |
| Others | | | 86 | | | | 6,092 | | | | 1,680 | | | | 366 | | | | 8,224 | |
| Mortgage | | | - | | | | - | | | | - | | | | - | | | | - | |
| VIS | | | - | | | | - | | | | - | | | | - | | | | - | |
| Non-VIS | | | - | | | | - | | | | - | | | | - | | | | - | |
| Leasing | | | - | | | | - | | | | - | | | | - | | | | - | |
| Small business loans | | | - | | | | - | | | | - | | | | - | | | | - | |
| Total gross loans and financial leases | | | 676,570 | | | | 847,834 | | | | 296,512 | | | | 10,857 | | | | 1,831,773 | |
| Total allowance | | | - | | | | - | | | | - | | | | - | | | | (305,465 | ) |
| Total net loans and financial leases | | | - | | | | - | | | | - | | | | - | | | | 1,526,308 | |
Concentration by past-due loans:
| | | December 31, 2015 | |
| | | Past-due | |
| Period | | 0 - 30 Days | | | 31 - 90 Days | | | 91 - 120 Days | | | 121 - 360 Days | | | More Than
360 Days | | | Total | |
| | | In millions of COP | |
| Commercial | | | - | | | | - | | | | - | | | | - | | | | - | | | | - | |
| Consumer | | | 1,672,495 | | | | 89,472 | | | | 25,228 | | | | 40,455 | | | | 4,120 | | | | 1,831,770 | |
| Mortgage | | | - | | | | - | | | | - | | | | - | | | | - | | | | - | |
| Financial Leases | | | - | | | | - | | | | - | | | | - | | | | - | | | | - | |
| Small Business Loan | | | - | | | | - | | | | - | | | | - | | | | - | | | | - | |
| Total | | | 1,672,495 | | | | 89,472 | | | | 25,228 | | | | 40,455 | | | | 4,120 | | | | 1,831,770 | |
Rating System for Credit Risk Management
The following table shows the distribution of Tuya discontinued operations loan portfolio at the end of the period, according to the enunciated categories of risk:
| | | December 31, 2015 | |
| Category | | Balance | | | % | |
| | | In millions of COP | |
| A – Normal risk | | | 1,518,902 | | | | 82.92 | % |
| B - Acceptable risk | | | 80,017 | | | | 4.4 | % |
| C- Appreciable risk | | | 60,057 | | | | 3.3 | % |
| D- Significant risk | | | 105,247 | | | | 5.7 | % |
| E - Noncollectable | | | 67,550 | | | | 3.7 | % |
| Total | | | 1,831,773 | | | | 100.00 | % |
RISK MANAGEMENT
The Bank’s comprehensive risk management is developed in compliance with current regulations and internal standards as defined by the Board of Directors, in relation to market, credit, liquidity and operational risk.
The Board of Directors reviews and approves the resources , structure and processes of the organization associated with risk management, and the development of its supervisory functions has the support of the Risk Committee, it is in charge of the approval, monitoring and control of policies, methodologies, tools, guidelines and strategies for the identification, measurement, control and mitigation of risk.
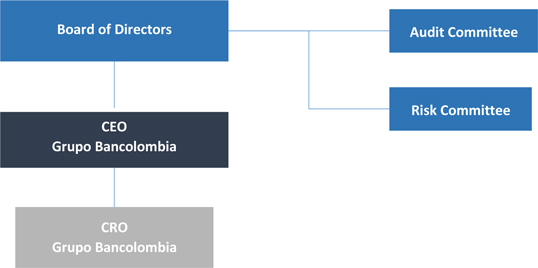
Risk team is made up of officials that are duly qualified to comprehensively and adequately oversee the different risks inherent to the activities undertaken in the fulfillment of their responsibilities, relying on correct technological infrastructure to obtain necessary data to manage and monitor risks, according to the particularities of the operations carried out. This allows the Vice-Presidency of Risk to generate and submit the consolidated risk management information to the different authorities, among them the Board of Directors and Upper Management.
Likewise, the organization duly documents procedures, allowing it to validate that operations are fulfilled according to the conditions specified, and that the accounting is correct. Also, the Internal and External Auditors are aware of the operations conducted by the organization and provide the corresponding reports in a timely manner, in accordance with the regulations.
Credit risk is the risk of an economic loss to the Bank due to a non-fulfillment of financial obligations by a customer or counterparty, and arises principally from the decline on borrower´s creditworthiness or changes in the business climate.
The information below contains the maximum exposure to credit risk as of December 31, 2015 and December 31 2014:
| | | As of December 31, 2015 | |
| | | Maximum
exposure | | | Collateral | | | Netting | | | Net exposure | |
| | | In millions of COP | |
| Loans and Financial Leases | | | 145,620,639 | | | | (63,835,897 | ) | | | - | | | | 81,784,742 | |
| Commercial | | | 85,892,752 | | | | (26,496,740 | ) | | | - | | | | 59,396,012 | |
| Consumer | | | 21,170,615 | | | | (5,954,699 | ) | | | - | | | | 15,215,916 | |
| Mortgage | | | 17,118,783 | | | | (16,070,752 | ) | | | - | | | | 1,048,031 | |
| Small Business Loans | | | 886,913 | | | | (482,194 | ) | | | - | | | | 404,719 | |
| Financial Leases | | | 20,551,576 | | | | (14,831,512 | ) | | | - | | | | 5,720,064 | |
| | | | | | | | | | | | | | | | | |
| Off-Balance Sheet Exposures | | | 16,396,103 | | | | - | | | | - | | | | 16,396,103 | |
| Financial Guarantees | | | 7,123,521 | | | | - | | | | - | | | | 7,123,521 | |
| Loan Commitments | | | 9,272,582 | | | | - | | | | - | | | | 9,272,582 | |
| | | | | | | | | | | | | | | | | |
| Other Financial Instruments(1) | | | 15,468,928 | | | | (905,388 | ) | | | 14,563,540 | | | | 14,563,540 | |
| Debt Securities | | | 13,171,189 | | | | (552,744 | ) | | | 12,618,445 | | | | 12,618,445 | |
| Derivatives | | | 1,135,149 | | | | (352,644 | ) | | | 782,505 | | | | 782,505 | |
| Equity Securities | | | 1,162,590 | | | | - | | | | 1,162,590 | | | | 1,162,590 | |
| | | | | | | | | | | | | | | | | |
| Total | | | 177,485,670 | | | | (64,741,285 | ) | | | 14,563,540 | | | | 112,744,385 | |
| | | As of December 31, 2014 | |
| | | Maximum
exposure | | | Collateral | | | Netting | | | Net exposure | |
| | | In millions of COP | |
| Loans and Financial Leases | | | 115,173,653 | | | | (46,772,651 | ) | | | - | | | | 68,401,002 | |
| Commercial | | | 65,473,755 | | | | (18,161,420 | ) | | | - | | | | 47,312,335 | |
| Consumer | | | 18,927,154 | | | | (4,952,853 | ) | | | - | | | | 13,974,301 | |
| Mortgage | | | 12,547,645 | | | | (11,650,740 | ) | | | - | | | | 896,905 | |
| Small Business Loans | | | 659,870 | | | | (325,402 | ) | | | - | | | | 334,468 | |
| Financial Leases | | | 17,565,229 | | | | (11,682,236 | ) | | | - | | | | 5,882,993 | |
| | | | | | | | | | | | | | | | | |
| Off-Balance Sheet Exposures | | | 16,023,596 | | | | - | | | | - | | | | 16,023,596 | |
| Financial Guarantees | | | 6,137,900 | | | | - | | | | - | | | | 6,137,900 | |
| Loan Commitments | | | 9,885,696 | | | | - | | | | - | | | | 9,885,696 | |
| | | | | | | | | | | | | | | | | |
| Other Financial Instruments(1) | | | 13,341,393 | | | | (1,351,974 | ) | | | 10,708,131 | | | | 11,989,419 | |
| Debt Securities | | | 11,239,541 | | | | (1,206,642 | ) | | | 10,032,900 | | | | 10,032,899 | |
| Derivatives | | | 820,564 | | | | (145,332 | ) | | | 675,231 | | | | 675,232 | |
| Equity Securities | | | 1,281,288 | | | | - | | | | - | | | | 1,281,288 | |
| | | | | | | | | | | | | | | | | |
| Total | | | 144,538,642 | | | | (48,124,625 | ) | | | 10,708,131 | | | | 96,414,017 | |
(1)Negative guarantees are received from counterparties and positive guarantees are delivered to counterparties.
Maximum exposure to credit risk of the loans and financial leases refers to the carrying amount at the end of the period. It does not take into account any collateral received or any other credit risk mitigants.
Maximum exposure to credit risk of financial guarantees corresponds to the total amount granted at the end of the period. This amount represents the worst case scenario and does not reflect the expected results.
Maximum exposure to derivatives refers to the Market Value (mark to market value) at the end of the period, without considering any guarantee received or any other credit risk mitigants.
Maximum exposure to credit risk of debt securities and equity securities refers to the carrying amount at the end of the period without considering any guarantee received or other credit risk mitigants.
a. Credit Risk Management - Loans and Financial Leases
Risk management during the credit life cycle is developed through the fulfillment of the policies, procedures and methodologies stipulated in the Credit Risk Administration System, in accordance with the strategy approved by the Board of Directors for monitoring and controlling credit risk.
The Credit Risk Administration System also contains the general criteria to evaluate, classify, measure and mitigate credit risk. In addition, the credit risk department has developed methodologies and manuals that specify the policies and procedures for different products and segments managed by the organization.
To maintain credit quality and manage the risk arising from its lending activities, the Bank has established general loan policies, including the following:
| · | Credit exposure limits:It contains guidelines with regard to the establishment of credit exposure limits to customers, geographies and industries. The Bank applies the lending limits to borrowers established under Colombian law, which require among other things that uncollateralized loans to a single customer or economic group may not exceed 10% of the Bank’s (unconsolidated) Technical Capital. |
| · | Origination policies:These policies aim to acquire ample and sufficient knowledge of the characteristics of potential clients and to select them properly. The riskiness of the customer is determined using credit rating models. These models use information as the character, reputation and credit history of the borrower, the type of business the borrower engages in, the borrower’s ability to repay the loan, and information received from the credit risk bureaus. The risk grading system is also used in determining the allowance for credit losses. |
Loan applications, depending on their amount, are presented for approval at the level of management authority required.
| · | Collaterals policies:For the purpose of mitigating risk associated with non-fulfillment of obligations agreed upon by the debtor, the Bank has established policies for the valuation of collateral received as well as for the determination of the maximum loan amount that can be granted against the value of the collateral. |
| · | Allowance policies:The definition of this type of policies underlies the fulfillment of legal guidelines, in what is stipulated by the organization and for the analysis of clients in terms of the actions that must be undertaken in order to cover loss risk through the Bank’s credit exposure. |
| · | Monitoring policies: Contains various monitoring procedures, portfolio reports and policies for the purpose of overseeing, in an adequate and timely manner, the evolution of credit risk. These procedures include a continuous process of classification and reassessment of credit operations and they maintain consistency with the policies implemented for granting loans. |
| · | Portfolio recovery policies:Through the definition of these policies, the organization aims to establish those mechanisms that allow it to anticipate possible delays or to minimize the impact resulting from non-fulfillment of payment or delays by the debtor. Additionally, the aspects established in this policy delimit what the organization has defined as collection management and that make it possible to obtain information to improve the origination policies and the models for establishing allowances for credit losses. |
Management of credit risk is carried out in all phases of the credit life cycle. These processes are defined in the following way:
| · | Origination: Knowing the client, payment capacity analysis, sector analysis, payment behavior and credit structure. |
| · | Monitoring: Knowing the client's situation during the life of the credit. |
| · | Recovery: Collection management during the different stages of the same credit. |
As part of the credit origination processes, the Bank develops scoring and rating models based on statistical information or criteria from experts, which differentiate the risk levels of potential clients in order to support the decision making process.
The Vice-Presidency of Risk is in charge of defining and documenting the specific characteristics of the models being utilized, as well as the parameters and variables to be used in each case and the cut-off points that are applied per situation in the process of issuing credit. On a biannual basis at minimum, the Vice-Presidency of Risk must perform backtesting5 of the Scoring and Rating models used in the granting process in order to validate their effectiveness. Additionally, on a monthly basis, the entire credit portfolio is rated taking into account the established internal models for the purpose of evaluating the credit risk of each debtor and establishing the required allowance for loan losses.
In addition to the evaluation and qualification of the portfolio, the monthly allowance for loan losses serves to measure the present condition of the portfolio. The methodologies used for calculation of the allowance serves as a tool to evaluate risk, be it in a collective or individual manner. Collective evaluation of the portfolio applies the following parameters for measuring risk: Probability of default (PD), loss given default (LGD) and exposure at default (EAD).
For the evaluation of individual risk, parameters such as recovery rates estimated by score sheets that include financial, behavioral information, collaterals and qualitative variables, serve as elements for measuring risk and defining an allowance for loan losses for that obligor.
Annual backtesting must be performed on the allowances for loan losses models for the purpose of maintaining suitable hedge levels in accordance with The Bank’s risk appetite.
The Bank is continuously monitoring the concentration of the risk groups, as well as carrying out a daily control of the exposure to different economic groups, evaluating the legal limits of indebtedness in order to fulfill the norms established about the concentration limits.
The Bank has models based on the optimization of risk and profit in order to determine the different concentration levels of portfolios, as well as international references determined by the rankings of external risks that allow the analysis of concentration levels in different geographic areas. On the other hand, at the legal level, Bancolombia is governed by the concepts and methodologies established by the external norms regarding the construction, administration and control of the concentration of economic groups.
The following classifications are established for the analysis of concentration:
| · | Analysis of concentration by country: the risk country of the client will be the one where the operation that generates the resources to pay the credit obligation has ocurred. |
| · | Analysis of concentration by sector: done through the economic sector defined by international code CIIU6. |
| · | Concentration analysis by categories: refers to the portfolio categories of each agreement (commercial and financial leases, consumer loans, small business loans and mortgages). |
| 5 | Statistical procedures used to validate the quality and accuracy of a model, through the comparison of actual results and risk measures generated by the models. |
| 6 | CIIU: International Standard Industrial Classification of All Economic Activities. |
| · | Concentration analysis by economic group: according to the characteristics of economic groups as established by regulations. |
| b. | Credit Quality Analysis - Loans and Financial Leases |
Rating System for Credit Risk Management
The principal aim is to determine the risk profile that the client represents, which is obtained through a rating.
The rating for corporate loans is assigned based on the analysis of the interrelation of both qualitative and quantitative elements that can affect the fulfillment of the financial commitments acquired by a client. They take information on the Bank’s statement of financial position, profit and loss statement, historical payment behavior both with the Bank and with other entities, and qualitative information on variables that are not explicit in the financial statements. The grading model is applied at the loan granting and is updated by a central qualification office to undertake a biannual evaluation of the loan portfolio, during the months of May and November of each year.
In the case of a retail customer, scoring models are used in order to identify the level of risk associated with the client. These models include information as personal details, financial information, historical behavior, the total number of credit products and external information from credit bureaus.
Since each of the companies, the Bank has different risk levels for their internal rating models, the following categories of risk have been determined in order to classify clients according to their payment behavior:
| Category | | Description |
| A- Normal Risk | | Loans and financial leases in this category are appropriately serviced. The debtor’s financial statements or its projected cash flows, as well as all other credit information available to the Bank, reflect adequate paying capacity. |
| B- Acceptable Risk | | Loans and financial leases in this category are acceptably serviced and guaranty protected, but there are weaknesses which may potentially affect, on a transitory or permanent basis, the debtor’s ability to pay or its projected cash flows, to the extent that, if not timely corrected, would affect the normal collection of credit or contracts. |
| C- Appreciable Risk | | Loans and financial leases in this category represent insufficiencies in the debtor’s paying capacity or in the project’s cash flow, which may compromise the normal collection of the obligations. |
| D- Significant Risk | | Loans and financial leases in this category have the same deficiencies as loans in category C, but to a larger extent; consequently, the probability of collection is highly doubtful. |
| E- Unrecoverable | | Loans and financial leases in this category are deemed uncollectible. |
Description of Loans and Financial Leases
In order to evaluate and manage credit risk, the credits and financial leasing operations have been classified into four categories, as follows:
| · | Commercial and Financial Leases: |
Loans granted to individuals or companies in order to carry out organized economic activities and are not classified as small business loans.
The counterparties of this portfolio are mainly made up of companies, segmented in homogenous groups that are constituted according to size, measured by the value of annual sales. The following variables are part of this classification:
| Segment | | Incomes/Sales |
| Business | | Companies with annual sales > = COP 17,500 M and < COP 45,000 M |
| Business Construction | | Companies that dedicate themselves professionally to the construction of buildings to be sold as their main activity, with annual sales >= COP 10,000 M and <= COP 20,000 M or with more than 3 projects. |
| Corporate Construction | | Companies that dedicate themselves professionally to the construction of buildings to be sold as their main activity, with annual sales > COP 20,000 M or more than 5 projects |
| Corporate | | Companies with annual sales >= COP 45,000 M, except for Banco Agrícola and Banistmo, which place clients with annual sales above USD 10 Million in this classification. |
| Institutional Financing | | Financial sector institutions. |
| Government | | Municipalities, districts, departments with their respective decentralized organizations and entities at the National level with Revenue > COP 17,500 M. |
| SME | | Annual sales >= COP 280 M and < COP 18,500 M, with a classification between small, medium and large, except for Banco Agrícola and Banistmo which place companies that do not surpass USD 10 Million in annual invoicing in this classification. |
Loans and financial leases, regardless of value, granted to individuals for the purchase of consumer goods or to pay for non-commercial or business services.
These loans are classified as follows:
| | Classification |
| Vehicles | | Credits granted for the acquisition of vehicles. The vehicle financed is used as collateral for the loan. |
| | |
| Credit Cards | | Revolving loans for the acquisition of consumer goods, utilized by means of a plastic card. |
| | |
| Prestanómina | | Credit line attached to an authorized individual payroll amount. |
| | |
| Others loans | | Loans granted for the acquisition of consumer goods different from automobiles and prestanómina. Credit cards are not included in this segment. |
The counterparties of this portfolio are mainly individuals, segmented in homogenous groups, which are formed according to their size, which is calculated by their monthly income.
These are loans, regardless of value, granted to individuals for the purchase of a new or used house or to build a home, all in accordance with Colombian Law 546 of 1999. These loans include loans denominated in UVR or local currency that are guaranteed by a senior mortgage on the property and that are financed with a total repayment term of five to 30 years.
The counterparty of the mortgage loan is mainly made up of individuals segmented in homogenous groups, which are formed according to their size, which is calculated based on their monthly income. Additionally, this credit portfolio modality is classified in VIS7 and no VIS.
7 VIS: Social Interest Homes, corresponds to mortgage loans granted by the financial institutions of amounts less than 135 SMMLV.
These are issued for the purpose of encouraging the activities of small business and are subject to the following requirements: (i) the maximum amount to be lent is equal to 25 SMMLV and at any time the balance of any single borrower may not exceed such amount (as stipulated in article 39 of Colombian Law 590 of 2000) and (ii) the main source of payment for the corresponding obligation shall be the revenues obtained from activities of the borrower’s micro business. The balance of indebtedness on the part of the borrower may not exceed 120 SMMLV, as applicable, at the moment the credit is approved.
The counterparty of this portfolio is mainly made up of individuals, segmented in homogenous groups, which are formed according to their commercial size, which is calculated by their monthly income.
Loans and Financial Leases Collateral
Collateral refers to a credit risk mitigant which is an alternative source of payment on credit granted in the events of client breach. Collateral is considered admissible and appropriate when it complies with the following conditions:
| · | Its economic value is enough to cover the exposure of the obligation and was established according to technical and objective criteria. |
| · | The entity is granted a preference or an improved right to obtain the payment of the obligation, becoming an effective collateral. |
| · | Its performance is reasonably possible. |
| · | It is a payment source that sufficiently attends to the credit as per the requirement of the organization. |
| · | The sovereign collateral that has certified and approved budgetary appropriation by the competent authority. |
The Bank has defined the criteria that allows the requirement of guarantees, which are established according to the classification of loan portfolio. Also, coverage has been set by type of guarantee and the necessary aspects to maintain it, such as their legalization and registry, the execution of evaluations by experts using objective criteria, the obligation to ensure those goods that are susceptible to suffering loss or deterioration, the exercise of their safekeeping and the necessary procedures for their cancellation.
The update of the fair value of mortgages and vehicles collaterals for the impaired loan portfolio is made on an annual basis. The methodology used to estimate the fair value of the properties is applied by external and independent entities. Updating the fair value of the vehicles is done through guides and valid values commonly used as reference to set the value of a vehicle. Valuation techniques used in updating the fair value of real state and vehicles are classified in levels 2 and 3 according to the hierarchy established by IFRS 13.
The following table shows the nature of the guarantees and the amounts covered for loans and financial leases, classified in commercial, consumer, small business loans and mortgage:
| | | December 31, 2015 | |
| | | Amount Covered by Guarantee | |
| | | In Millions of COP | |
| Nature of the Guarantee | | Commercial | | | Consumer | | | Mortgage | | | Financial
Leasing | | | Small Business | | | Total | |
| Real Estate and Residential | | | 15,705,003 | | | | 1,510,482 | | | | 16,051,801 | | | | 28,322 | | | | 170,445 | | | | 33,466,053 | |
| Goods Given in Real Estate Leasing | | | - | | | | - | | | | - | | | | 8,416,574 | | | | - | | | | 8,416,574 | |
| Goods Given in Leasing Other Than Real Estate | | | - | | | | - | | | | - | | | | 6,366,113 | | | | - | | | | 6,366,113 | |
| Stand by Letters of Credit | | | 223,183 | | | | - | | | | - | | | | - | | | | 72 | | | | 223,255 | |
| Security Deposits | | | 957,826 | | | | 257,268 | | | | - | | | | - | | | | 26,665 | | | | 1,241,759 | |
| Guarantee Fund | | | 2,208,015 | | | | 2,556 | | | | - | | | | 15,230 | | | | 268,013 | | | | 2,493,814 | |
| Sovereign of the Nation | | | 38,132 | | | | - | | | | - | | | | - | | | | - | | | | 38,132 | |
| Collection Rights | | | 3,584,217 | | | | 34,449 | | | | - | | | | 4,409 | | | | 1,242 | | | | 3,624,317 | |
| Other Collateral (Pledges) | | | 3,780,364 | | | | 4,149,944 | | | | 18,951 | | | | 864 | | | | 15,757 | | | | 7,965,880 | |
| Without Guarantee (Uncovered Balance) | | | 59,396,012 | | | | 15,215,916 | | | | 1,048,031 | | | | 5,720,064 | | | | 404,719 | | | | 81,784,742 | |
| Total loans and financial leases | | | 85,892,752 | | | | 21,170,615 | | | | 17,118,783 | | | | 20,551,576 | | | | 886,913 | | | | 145,620,639 | |
| | | December 31, 2014 | |
| | | Amount Covered by Guarantee | |
| | | In Millions of COP | |
| Nature of the Guarantee | | Commercial | | | Consumer | | | Mortgage | | | Financial
Leasing | | | Small Business | | | Total | |
| Real Estate and Residential | | | 10,102,315 | | | | 1,163,265 | | | | 11,639,390 | | | | 17,401 | | | | 80,143 | | | | 23,002,514 | |
| Goods Given in Real Estate Leasing | | | - | | | | - | | | | - | | | | 6,601,212 | | | | - | | | | 6,601,212 | |
| Goods Given in Leasing Other Than Real Estate | | | - | | | | - | | | | - | | | | 5,190,050 | | | | - | | | | 5,190,050 | |
| Stand by Letters of Credit | | | 149,342 | | | | - | | | | - | | | | - | | | | - | | | | 149,342 | |
| Security Deposits | | | 804,878 | | | | 197,561 | | | | - | | | | - | | | | 15,067 | | | | 1,017,506 | |
| Guarantee Fund | | | 1,954,125 | | | | 1,111 | | | | - | | | | 19,235 | | | | 219,021 | | | | 2,193,492 | |
| Sovereign of the Nation | | | 51,736 | | | | - | | | | - | | | | - | | | | - | | | | 51,736 | |
| Collection Rights | | | 2,449,097 | | | | 5 | | | | - | | | | 4,700 | | | | - | | | | 2,453,802 | |
| Other Collateral (Pledges) | | | 2,497,357 | | | | 3,590,911 | | | | 11,350 | | | | 2,208 | | | | 11,171 | | | | 6,112,997 | |
| Without Guarantee (Uncovered Balance) | | | 47,312,335 | | | | 13,974,301 | | | | 896,905 | | | | 5,882,993 | | | | 334,468 | | | | 68,401,002 | |
| Total loans and financial leases | | | 65,321,185 | | | | 18,927,154 | | | | 12,547,645 | | | | 17,717,799 | | | | 659,870 | | | | 115,173,653 | |
| | | January 1, 2014 | |
| | | Amount Covered by Guarantee | |
| | | In Millions of COP | |
| Nature of the Guarantee | | Commercial | | | Consumer | | | Mortgage | | | Financial
Leasing | | | Small Business | | | Total | |
| Real Estate and Residential | | | 8,284,299 | | | | 1,010,433 | | | | 9,460,157 | | | | 146,984 | | | | 88,780 | | | | 18,990,653 | |
| Goods Given in Real Estate Leasing | | | - | | | | - | | | | - | | | | 5,320,346 | | | | - | | | | 5,320,346 | |
| Goods Given in Leasing Other Than Real Estate | | | - | | | | - | | | | - | | | | 5,263,848 | | | | - | | | | 5,263,848 | |
| Stand by Letters of Credit | | | 129,655 | | | | 96 | | | | - | | | | - | | | | - | | | | 129,751 | |
| Security Deposits | | | 667,036 | | | | 172,136 | | | | - | | | | - | | | | 14,553 | | | | 853,725 | |
| Guarantee Fund | | | 1,691,256 | | | | 1,424 | | | | - | | | | 27,216 | | | | 162,151 | | | | 1,882,047 | |
| Sovereign of the Nation | | | 65,172 | | | | - | | | | - | | | | - | | | | - | | | | 65,172 | |
| Collection Rights | | | 1,796,148 | | | | 27 | | | | - | | | | 5,108 | | | | - | | | | 1,801,283 | |
| Other Collateral (Pledges) | | | 2,047,217 | | | | 3,328,898 | | | | 3,513 | | | | 3,679 | | | | 2,567 | | | | 5,385,874 | |
| Without Guarantee (Uncovered Balance) | | | 38,436,220 | | | | 12,372,357 | | | | 894,693 | | | | 4,748,668 | | | | 258,681 | | | | 56,710,619 | |
| Total loans and financial leases | | | 53,117,003 | | | | 16,885,371 | | | | 10,358,363 | | | | 15,515,849 | | | | 526,732 | | | | 96,403,318 | |
Guarantees Received and Other Credit Mitigants
The assets held for sale received in lieu of payment are recognized on the Statement of Financial Position when current possession of the good is in place.
The assets held for sale received in lieu of payment represented by immovable or movable property are received based on a commercial evaluation and those dations, such items is requiredas shares or equity, are received based on market value.
Up to December 31, 2015, the following are goods received as payment during the period:
| Type of Good | | December 31, 2015 | |
| | In millions of COP | |
| Real State | | | 84,996 | |
| Personal Property | | | 22,667 | |
| Total | | | 107,663 | |
The Bank classifies assets held for sale received in lieu of payment after acknowledgment of the exchange operation according to the intention of use, as follows:
| § | Non-current assets held for sale |
| § | Other non-marketable assets |
| § | Financial instruments (investments) |
| § | Property, plant and equipment |
The assets held for sale received in lieu of payment classified as maintained non-current assets for sale are those that are expected to be disclosed. For public entities,sold in the amendments are effective during interimfollowing 12 months. When market restrictions exist that do not allow for their sale in less than 12 months, and annual periods beginning after December 15, 2011. As a resultthis period is extended, retroactive depreciation is charged against results and the value of the Bank’s adoptionasset will be diminished by the value of ASU 2011-04 further information relateddepreciation.
| c. | Risk Concentration – Loans and Financial Leases |
The analysis of credit risk concentration is done by monitoring the portfolio by groupings such as: maturity loan, past due loan, loan categories and loan by sector and risk country, as shown here:
| · | Categories loansconcentration |
The composition of the credit portfolio in commercial, consumer, small business loans and financial leases categories for the periods ending December 2015, December 2014 and January 1, 2014 are as follows:
| Composition | | December
31, 2015 | | | December
31, 2014 | | | January
1, 2014 | |
| | | In millions of COP | |
| Commercial | | | 85,892,752 | | | | 65,473,755 | | | | 53,217,137 | |
| Corporate | | | 53,729,531 | | | | 38,668,350 | | | | 30,283,323 | |
| SME | | | 15,386,399 | | | | 13,098,493 | | | | 10,886,116 | |
| Others | | | 16,776,822 | | | | 13,706,912 | | | | 12,047,698 | |
| Consumer | | | 21,170,615 | | | | 18,927,154 | | | | 16,885,371 | |
| Credit card | | | 7,160,302 | | | | 7,082,026 | | | | 6,449,258 | |
| Vehicle | | | 3,089,976 | | | | 2,790,173 | | | | 2,340,048 | |
| Order of payment | | | 4,950,780 | | | | 4,118,862 | | | | 3,451,624 | |
| Others | | | 5,969,557 | | | | 4,936,093 | | | | 4,644,441 | |
| Mortgage | | | 17,118,783 | | | | 12,547,645 | | | | 10,358,363 | |
| VIS | | | 4,252,173 | | | | 3,042,888 | | | | 2,619,582 | |
| Non- VIS | | | 12,866,610 | | | | 9,504,757 | | | | 7,738,781 | |
| Financial Leases | | | 20,551,576 | | | | 17,565,229 | | | | 15,415,715 | |
| Small Business Loan | | | 886,913 | | | | 659,870 | | | | 526,732 | |
| Total gross loan and financial leases | | | 145,620,639 | | | | 115,173,653 | | | | 96,403,318 | |
| Total allowance | | | (5,248,755 | ) | | | (4,789,257 | ) | | | (4,473,562 | ) |
| Total net loan and financial leases(1) | | | 140,371,884 | | | | 110,384,396 | | | | 91,929,756 | |
| (1) | The portfolio acquired in the business combination of Grupo Agromercantil Holding amounts to COP 8,162,177, see Note 8.3.
Additionally, Tuya Finance Company S.A. is considered a discontinued operation as of December 31, 2015, so Tuya´s portfolio is classified within the "assets held for sale" item; the net balance amounted to COP 1,480,398, see Note 31. |
| · | Concentration of loans by Maturity |
The following table shows the ranges of maturity, understood as the remaining term for the completion of the contract of loans and financial leases at the end of the 2015, 2014 and January 1, 2014:
| | | December 31, 2015 | |
| Maturity | | Less Than 1
Year | | | Between 1 and 3
Years | | | Between 3 and 5
Years | | | Greater Than 5
Years | | | Total | |
| | | In millions of COP | |
| Commercial | | | 28,961,893 | | | | 15,299,262 | | | | 11,833,781 | | | | 29,797,816 | | | | 85,892,752 | |
| Corporate | | | 18,280,963 | | | | 8,585,749 | | | | 7,422,020 | | | | 19,440,799 | | | | 53,729,531 | |
| SME | | | 4,837,267 | | | | 4,845,179 | | | | 2,831,739 | | | | 2,872,214 | | | | 15,386,399 | |
| Others | | | 5,843,663 | | | | 1,868,334 | | | | 1,580,022 | | | | 7,484,803 | | | | 16,776,822 | |
| Consumer | | | 4,067,215 | | | | 4,749,430 | | | | 8,163,021 | | | | 4,190,949 | | | | 21,170,615 | |
| Credit card | | | 2,636,138 | | | | 1,395,015 | | | | 2,160,657 | | | | 968,492 | | | | 7,160,302 | |
| Vehicle | | | 73,875 | | | | 656,111 | | | | 1,401,635 | | | | 958,355 | | | | 3,089,976 | |
| Order of payment | | | 157,659 | | | | 837,630 | | | | 2,104,080 | | | | 1,851,411 | | | | 4,950,780 | |
| Others | | | 1,199,543 | | | | 1,860,674 | | | | 2,496,649 | | | | 412,691 | | | | 5,969,557 | |
| Mortgage | | | 44,099 | | | | 154,032 | | | | 297,668 | | | | 16,622,984 | | | | 17,118,783 | |
| VIS | | | 8,951 | | | | 46,270 | | | | 83,377 | | | | 4,113,575 | | | | 4,252,173 | |
| Non-VIS | | | 35,148 | | | | 107,762 | | | | 214,291 | | | | 12,509,409 | | | | 12,866,610 | |
| Financial Leases | | | 2,325,571 | | | | 3,825,292 | | | | 2,186,262 | | | | 12,214,451 | | | | 20,551,576 | |
| Small business loans | | | 189,206 | | | | 455,594 | | | | 116,515 | | | | 125,598 | | | | 886,913 | |
| Total gross loans and financial leases | | | 35,587,984 | | | | 24,483,610 | | | | 22,597,247 | | | | 62,951,798 | | | | 145,620,639 | |
| | | December 31, 2014 | |
| Maturity | | Less Than 1
Year | | | Between 1 and 3
Years | | | Between 3 and 5
Years | | | Greater Than 5
Years | | | Total | |
| | | In millions of COP | |
| Commercial | | | 22,171,501 | | | | 12,074,922 | | | | 8,950,482 | | | | 22,276,850 | | | | 65,473,755 | |
| Corporate | | | 13,673,861 | | | | 6,067,728 | | | | 5,184,750 | | | | 13,742,011 | | | | 38,668,350 | |
| SME | | | 4,006,882 | | | | 4,172,300 | | | | 2,471,937 | | | | 2,447,374 | | | | 13,098,493 | |
| Others | | | 4,490,758 | | | | 1,834,894 | | | | 1,293,795 | | | | 6,087,465 | | | | 13,706,912 | |
| Consumer | | | 3,063,853 | | | | 4,688,097 | | | | 6,205,156 | | | | 4,970,048 | | | | 18,927,154 | |
| Credit card | | | 2,021,733 | | | | 2,096,165 | | | | 1,921,688 | | | | 1,042,440 | | | | 7,082,026 | |
| Vehicle | | | 56,238 | | | | 661,361 | | | | 1,352,614 | | | | 719,960 | | | | 2,790,173 | |
| Order of payment | | | 47,207 | | | | 311,975 | | | | 759,806 | | | | 2,999,874 | | | | 4,118,862 | |
| Others | | | 938,675 | | | | 1,618,596 | | | | 2,171,048 | | | | 207,774 | | | | 4,936,093 | |
| Mortgage | | | 29,552 | | | | 110,909 | | | | 244,948 | | | | 12,162,236 | | | | 12,547,645 | |
| VIS | | | 5,038 | | | | 36,813 | | | | 78,072 | | | | 2,922,965 | | | | 3,042,888 | |
| Non-VIS | | | 24,514 | | | | 74,096 | | | | 166,876 | | | | 9,239,271 | | | | 9,504,757 | |
| Financial leases | | | 178,350 | | | | 2,938,223 | | | | 3,028,830 | | | | 11,419,826 | | | | 17,565,229 | |
| Small business loans | | | 102,010 | | | | 357,609 | | | | 95,650 | | | | 104,601 | | | | 659,870 | |
| Total gross loans and financial leases | | | 25,545,266 | | | | 20,169,760 | | | | 18,525,066 | | | | 50,933,561 | | | | 115,173,653 | |
| | | January 1, 2014 | |
| Maturity | | Less Than 1
Year | | | Between 1 and 3
Years | | | Between 3 and 5
Years | | | Greater Than 5
Years | | | Total | |
| | | In millions of COP | |
| Commercial | | | 16,178,106 | | | | 11,602,865 | | | | 8,840,786 | | | | 16,595,380 | | | | 53,217,137 | |
| Corporate | | | 10,256,510 | | | | 5,477,581 | | | | 4,789,811 | | | | 9,759,421 | | | | 30,283,323 | |
| SME | | | 3,105,083 | | | | 3,883,571 | | | | 2,207,998 | | | | 1,689,464 | | | | 10,886,116 | |
| Others | | | 2,816,513 | | | | 2,241,713 | | | | 1,842,977 | | | | 5,146,495 | | | | 12,047,698 | |
| Consumer | | | 3,250,857 | | | | 4,350,452 | | | | 6,239,001 | | | | 3,045,061 | | | | 16,885,371 | |
| Credit card | | | 2,638,088 | | | | 1,833,664 | | | | 1,739,626 | | | | 237,880 | | | | 6,449,258 | |
| Vehicle | | | 51,549 | | | | 484,733 | | | | 1,260,960 | | | | 542,806 | | | | 2,340,048 | |
| Order of payment | | | 82,422 | | | | 347,274 | | | | 1,063,058 | | | | 1,958,870 | | | | 3,451,624 | |
| Others | | | 478,798 | | | | 1,684,781 | | | | 2,175,357 | | | | 305,505 | | | | 4,644,441 | |
| Mortgage | | | 48,621 | | | | 95,736 | | | | 275,709 | | | | 9,938,297 | | | | 10,358,363 | |
| VIS | | | 4,146 | | | | 31,002 | | | | 82,412 | | | | 2,502,022 | | | | 2,619,582 | |
| Non-VIS | | | 44,475 | | | | 64,734 | | | | 193,297 | | | | 7,436,275 | | | | 7,738,781 | |
| Financial leases | | | 3,422,998 | | | | 2,814,902 | | | | 1,874,535 | | | | 7,303,280 | | | | 15,415,715 | |
| Small business loans | | | 81,244 | | | | 292,518 | | | | 74,391 | | | | 78,579 | | | | 526,732 | |
| Total gross loans and financial leases | | | 22,981,826 | | | | 19,156,473 | | | | 17,304,422 | | | | 36,960,597 | | | | 96,403,318 | |
| · | Past-due loans Concentration |
The following shows the detail of past-due credits according to fair value measurements has been included on the Bank’s financial statement and U.S. GAAP disclosuresperiod of default as of the date indicated:
| | | December 31, 2015 | |
| | | Past-due | |
| Period | | 0 - 30 Days | | | 31 - 90 Days | | | 91 - 120 Days | | | 121 - 360 Days | | | More Than
360 Days | | | TOTAL | |
| | | In millions of COP | |
| Commercial | | | 84,050,557 | | | | 663,131 | | | | 89,588 | | | | 665,556 | | | | 423,920 | | | | 85,892,752 | |
| Consumer | | | 20,143,667 | | | | 507,297 | | | | 129,684 | | | | 324,305 | | | | 65,662 | | | | 21,170,615 | |
| Mortgage | | | 15,943,609 | | | | 549,298 | | | | 112,261 | | | | 247,540 | | | | 266,075 | | | | 17,118,783 | |
| Financial Leases | | | 19,979,338 | | | | 130,336 | | | | 26,120 | | | | 212,315 | | | | 203,467 | | | | 20,551,576 | |
| Small Business Loan | | | 814,163 | | | | 22,830 | | | | 7,214 | | | | 31,544 | | | | 11,162 | | | | 886,913 | |
| Total | | | 140,931,334 | | | | 1,872,892 | | | | 364,867 | | | | 1,481,260 | | | | 970,286 | | | | 145,620,639 | |
| | | December 31, 2014 | |
| | | Past-due | |
| Period | | 0 - 30 Days | | | 31 - 90 Days | | | 91 - 120 Days | | | 121 - 360 Days | | | More Than
360 Days | | | TOTAL | |
| | | In millions of COP | |
| Commercial | | | 64,088,708 | | | | 340,423 | | | | 138,034 | | | | 472,644 | | | | 433,946 | | | | 65,473,755 | |
| Consumer | | | 17,991,597 | | | | 462,324 | | | | 121,065 | | | | 281,784 | | | | 70,384 | | | | 18,927,154 | |
| Mortgage | | | 11,722,874 | | | | 386,023 | | | | 74,375 | | | | 161,887 | | | | 202,486 | | | | 12,547,645 | |
| Financial Leases | | | 16,994,978 | | | | 282,061 | | | | 22,257 | | | | 102,782 | | | | 163,151 | | | | 17,565,229 | |
| Small Business Loan | | | 599,281 | | | | 20,399 | | | | 5,545 | | | | 23,313 | | | | 11,332 | | | | 659,870 | |
| Total | | | 111,397,438 | | | | 1,491,230 | | | | 361,276 | | | | 1,042,410 | | | | 881,299 | | | | 115,173,653 | |
| | | January 1, 2014 | |
| | | Past-due | |
| Period | | 0 - 30 Days | | | 31 - 90 Days | | | 91 - 120 Days | | | 121 - 360 Days | | | More Than
360 Days | | | TOTAL | |
| | | In millions of COP | |
| Commercial | | | 52,079,201 | | | | 339,081 | | | | 113,752 | | | | 348,342 | | | | 336,761 | | | | 53,217,137 | |
| Consumer | | | 16,037,371 | | | | 419,705 | | | | 111,695 | | | | 265,385 | | | | 51,215 | | | | 16,885,371 | |
| Mortgage | | | 9,634,492 | | | | 334,662 | | | | 71,548 | | | | 139,640 | | | | 178,021 | | | | 10,358,363 | |
| Financial Leases | | | 15,092,537 | | | | 87,441 | | | | 21,756 | | | | 91,704 | | | | 122,277 | | | | 15,415,715 | |
| Small Business Loan | | | 469,345 | | | | 17,940 | | | | 4,568 | | | | 25,660 | | | | 9,219 | | | | 526,732 | |
| Total | | | 93,312,946 | | | | 1,198,829 | | | | 323,319 | | | | 870,731 | | | | 697,493 | | | | 96,403,318 | |
| · | Concentration of Loans by Economic Sector |
The following is the detail of the credit portfolio by main economic activity of the debtor as of December 31, 2012. See note 31, t) “Estimated Fair Value”.2015 and 2014 and January 1, 2014:
In April 2011, FASB issued ASU 2011-03, “Reconsideration of Effective Control for Repurchase Agreements”, to improve the accounting for repurchase agreements (repos) and other agreements that both entitle and obligate a transferor to repurchase or redeem financial assets before their maturity. The amendments in this update remove from the assessment of effective control (1) the criterion requiring the transferor to have the ability to repurchase or redeem the financial assets on substantially the agreed terms, even in the event of default by the transferee, and (2) the collateral maintenance implementation guidance related to that criterion. Other criteria applicable to the assessment of effective control are not changed by the amendments in this update. The guidance in this update is effective for the first interim or annual period beginning on or after December 15, 2011. Management has not identified a significant impact on the Bank’s financial statements and U.S. GAAP disclosures.
| | | December 31, 2015 | |
| | | Loans and financial leases | |
| Economic Destination | | Local | | | Foreign(1) | | | Total | |
| | | In millions of COP | |
| Agriculture | | | 4,330,757 | | | | 1,942,147 | | | | 6,272,904 | |
| Petroleum and Mining Products | | | 1,791,910 | | | | 355,825 | | | | 2,147,735 | |
| Food, Beverages and Tobacco | | | 5,141,738 | | | | 330,038 | | | | 5,471,776 | |
| Chemical Production | | | 2,871,547 | | | | 331,651 | | | | 3,203,198 | |
| Government | | | 3,131,339 | | | | 668,463 | | | | 3,799,802 | |
| Construction | | | 14,577,061 | | | | 5,424,291 | | | | 20,001,352 | |
| Commerce and Tourism | | | 14,934,712 | | | | 5,833,248 | | | | 20,767,960 | |
| Transport and Communications | | | 8,189,789 | | | | 1,588,048 | | | | 9,777,837 | |
| Public Services | | | 4,881,297 | | | | 4,807,362 | | | | 9,688,659 | |
| Consumer Services | | | 22,439,817 | | | | 12,634,026 | | | | 35,073,843 | |
| Commercial Services | | | 15,956,430 | | | | 3,049,918 | | | | 19,006,348 | |
| Other Industries and Manufactured Products | | | 5,657,242 | | | | 4,751,983 | | | | 10,409,225 | |
| Total | | | 103,903,639 | | | | 41,717,000 | | | | 145,620,639 | |
| (1) | The increase in the foreign portfolio as of December 31, 2015, is mainly explained by inclusion of Grupo Agromercantil Holding portfolio, which amounted to COP 8,162,177, see Note 8.3 |
| | | December 31, 2014 | |
| | | Loans and financial leases | |
| Economic Destination | | Local | | | Foreign | | | Total | |
| | | In millions of COP | |
| Agriculture | | | 4,030,994 | | | | 752,267 | | | | 4,783,261 | |
| Petroleum and Mining Products | | | 2,559,701 | | | | 501,236 | | | | 3,060,937 | |
| Food, Beverages and Tobacco | | | 4,148,724 | | | | 323,446 | | | | 4,472,170 | |
| Chemical Production | | | 3,028,095 | | | | 109,137 | | | | 3,137,232 | |
| Government | | | 2,030,749 | | | | 309,947 | | | | 2,340,696 | |
| Construction | | | 11,515,240 | | | | 3,609,264 | | | | 15,124,504 | |
| Commerce and Tourism | | | 13,380,359 | | | | 3,362,533 | | | | 16,742,892 | |
| Transport and Communications | | | 5,200,661 | | | | 716,974 | | | | 5,917,635 | |
| Public Services | | | 4,832,527 | | | | 2,757,506 | | | | 7,590,033 | |
| Consumer Services | | | 21,109,019 | | | | 8,580,530 | | | | 29,689,549 | |
| Commercial Services | | | 14,299,832 | | | | 56,333 | | | | 14,356,165 | |
| Other Industries and Manufactured Products | | | 5,492,444 | | | | 2,466,135 | | | | 7,958,579 | |
| Total | | | 91,628,345 | | | | 23,545,308 | | | | 115,173,653 | |
In April 2011, FASB issued ASU 2011-02, “A Creditor’s Determination of Whether a Restructuring is a Troubled Debt Restructuring”, to help creditors in determining whether a creditor has granted a concession and whether a debtor is experiencing financial difficulties for purposes of determining whether a restructuring constitutes a troubled debt restructuring. The new guidance requires creditors evaluate modifications and restructurings of receivables using a more principles-based approach, which may result in more modifications and restructurings being considered troubled debt restructurings. In addition, the amendments to Topic 310 clarify that a creditor is precluded from using the effective interest rate test in the debtor’s guidance on restructuring of payables when evaluating whether a restructuring constitutes a troubled debt restructuring. As a result of applying these amendments, management believes that new considerations applied in its U.S. GAAP disclosures and financial information have not impacted significantly the Bank’s disclosures.
In January 2011, FASB issued ASU 2011-01, “Deferral of the Effective Date of Disclosures about Troubled Debt Restructurings in ASU 2010-20”, to temporarily delay the effective date of the disclosures about troubled debt restructurings in ASU 2010-20 for public entities. The delay is intended to allow the Board time to complete its deliberations on what constitutes a troubled debt restructuring. Under the existing effective date in ASU 2010-20, the Bank would have provided disclosures about troubled debt restructurings for periods beginning on or after December 15, 2010. According to ASU 2011-02, the amendments in this ASU are effective for the first interim or annual period beginning on or after June 15, 2011, and should be applied retrospectively to the beginning of the annual period of adoption. As a result of applying these amendments, management believes that new considerations applied in its U.S. GAAP disclosures and financial information have not impacted significantly the Bank’s disclosures.
| | | January 1, 2014 | |
| Economic Destination | | Local | | | Foreign | | | Total | |
| | | In millions of COP | |
| Agriculture | | | 3,566,063 | | | | 466,388 | | | | 4,032,451 | |
| Petroleum and Mining Products | | | 1,872,467 | | | | 376,032 | | | | 2,248,499 | |
| Food, Beverages and Tobacco | | | 3,252,247 | | | | 234,526 | | | | 3,486,773 | |
| Chemical Production | | | 1,829,720 | | | | 85,762 | | | | 1,915,482 | |
| Government | | | 1,782,773 | | | | 356,675 | | | | 2,139,448 | |
| Construction | | | 10,495,272 | | | | 2,679,291 | | | | 13,174,563 | |
| Commerce and Tourism | | | 11,355,067 | | | | 2,466,622 | | | | 13,821,689 | |
| Transport and Communications | | | 4,842,072 | | | | 449,879 | | | | 5,291,951 | |
| Public Services | | | 3,321,572 | | | | 216,842 | | | | 3,538,414 | |
| Consumer Services | | | 18,903,149 | | | | 7,306,251 | | | | 26,209,400 | |
| Commercial Services | | | 10,584,867 | | | | 3,067,940 | | | | 13,652,807 | |
| Other Industries and Manufactured Products | | | 4,929,226 | | | | 1,962,615 | | | | 6,891,841 | |
| Total | | | 76,734,495 | | | | 19,668,823 | | | | 96,403,318 | |
F-143 | · | Credit Concentration by Risk Country |
EXHIBIT INDEX
The following exhibitstable below shows the concentration of the loans and financial leases, detailing the participation of the countries in which the Bank's clients are filed as part of this Annual Report.located with respect to the total credit portfolio:
1.1 | English translation of corporate by-laws (estatutos sociales) of the registrant, as amended on March 7, 2011(1). |
2.1 | The Deposit Agreement entered into between Bancolombia and The Bank of New York, as amended on January 14, 2008(2). |
2.2 | Instruments defining the rights of the holders of long-term debt issued by Bancolombia S.A. and its subsidiaries. |
| We agree to furnish to the SEC upon request, copies of the instruments, including indentures, defining the rights of the holders of our long-term debt and of our subsidiaries’ long-term debt. |
7.1 | Selected Ratios’ Calculation. |
8.1. | List of Subsidiaries. |
12.1 | CEO Certification pursuant to Section 302 of the Sarbanes-Oxley Act of 2002, dated April 30, 2013. |
12.2 | CFO Certification pursuant to Section 302 of the Sarbanes-Oxley Act of 2002, dated April 30, 2013. |
13.1 | CEO Certification pursuant to Section 906 of the Sarbanes-Oxley Act of 2002, dated April 30, 2013. |
13.2 | CFO Certification pursuant to Section 906 of the Sarbanes-Oxley Act of 2002, dated April 30, 2013. |
15.1 | Consent of Pricewaterhouse Coopers Ltda. |
| | | December 31, 2015 | |
| Country | | Loans and financial
leases | | | % Participation | | | Allowance for loans
and financial leases | | | % Participation | |
| Colombia | | | 95,970,455 | | | | 65.90 | % | | | 4,257,441 | | | | 81.11 | % |
| Panamá | | | 31,001,163 | | | | 21.28 | % | | | 558,856 | | | | 10.65 | % |
| El Salvador | | | 8,998,603 | | | | 6.18 | % | | | 404,384 | | | | 7.70 | % |
| Puerto Rico | | | 1,217,737 | | | | 0.84 | % | | | 13,545 | | | | 0.26 | % |
| Perú | | | 256,511 | | | | 0.18 | % | | | 13,953 | | | | 0.27 | % |
| Guatemala(1) | | | 8,162,177 | | | | 5.61 | % | | | - | | | | 0.00 | % |
| Other Countries | | | 13,993 | | | | 0.01 | % | | | 576 | | | | 0.01 | % |
| Total | | | 145,620,639 | | | | 100.00 | % | | | 5,248,755 | | | | 100.00 | % |
(1) Incorporated by reference to the Bank’s Annual Report on Form 20-F for
| (1) | The growth in the Guatemala portfolio during 2015, is explained by the inclusion of portfolio of Grupo Agromercantil Holding, which amounted to COP 8.162.177, see Note 8.3 |
| | | December 31, 2014 | |
| Country | | Loans and financial
leases | | | % Participation | | | Allowance for loans and
financial leases | | | % Participation | |
| Colombia | | | 86,162,606 | | | | 74.80 | % | | | 4,040,256 | | | | 84.35 | % |
| Panamá | | | 21,375,381 | | | | 18.56 | % | | | 388,751 | | | | 8.12 | % |
| El Salvador | | | 6,654,912 | | | | 5.78 | % | | | 347,632 | | | | 7.26 | % |
| Puerto Rico | | | 720,138 | | | | 0.63 | % | | | 7,067 | | | | 0.15 | % |
| Perú | | | 248,699 | | | | 0.22 | % | | | 5,139 | | | | 0.11 | % |
| Other Countries | | | 11,917 | | | | 0.01 | % | | | 412 | | | | 0.01 | % |
| Total | | | 115,173,653 | | | | 100.00 | % | | | 4,789,257 | | | | 100.00 | % |
| | | January 1, 2014 | |
| Country | | Loans and financial
leases | | | % Participation | | | Allowance for loans and
financial leases | | | % Participation | |
| Colombia | | | 75,381,835 | | | | 78.19 | % | | | 3,768,452 | | | | 84.24 | % |
| Panamá | | | 14,913,659 | | | | 15.47 | % | | | 428,001 | | | | 9.57 | % |
| El Salvador | | | 5,211,264 | | | | 5.41 | % | | | 267,266 | | | | 5.97 | % |
| Puerto Rico | | | 687,170 | | | | 0.71 | % | | | 6,259 | | | | 0.14 | % |
| Perú | | | 198,999 | | | | 0.21 | % | | | 3,133 | | | | 0.07 | % |
| Other Countries | | | 10,391 | | | | 0.01 | % | | | 451 | | | | 0.01 | % |
| Total | | | 96,403,318 | | | | 100.00 | % | | | 4,473,562 | | | | 100.00 | % |
| d. | Past due and Impairment Credit Quality – Loans and Financial Leases |
The following table shows information about current, past due and impaired loans as of the year ended December 31, 2010 filed on April 28, 2011.2015; December 31, 2014 and January 1, 2014:
(2) Incorporated
| | | December 31, 2015 | |
| Risk Category | | Current loans
without
impairment | | | Past due loan
without
impairment | | | Current loans
with some type of
impairment | | | Past due and
impaired loans | | | Total | |
| | | In millions of COP | |
| A- Normal Risk | | | 130,982,505 | | | | 247,660 | | | | 755,456 | | | | 13,522 | | | | 131,999,143 | |
| B- Acceptable Risk | | | 6,101,551 | | | | 740,335 | | | | 778,519 | | | | 62,211 | | | | 7,682,616 | |
| C- Appreciable Risk | | | 1,937 | | | | - | | | | 1,398,056 | | | | 1,038,548 | | | | 2,438,541 | |
| D- Significant Risk | | | - | | | | - | | | | 576,447 | | | | 1,245,135 | | | | 1,821,582 | |
| E- Unrecoverable Risk | | | - | | | | 6,796 | | | | 389,377 | | | | 1,282,584 | | | | 1,678,757 | |
| Total | | | 137,085,993 | | | | 994,791 | | | | 3,897,855 | | | | 3,642,000 | | | | 145,620,639 | |
| | | December 31, 2014 | |
| Risk Category | | Current loans
without
impairment | | | Past due loan
without
impairment | | | Current loans with
Some type of
impairment | | | Past due and
impaired loans | | | Total | |
| | | In millions of COP | |
| A- Normal Risk | | | 102,455,956 | | | | 400,264 | | | | 2,599,456 | | | | 19,835 | | | | 105,475,511 | |
| B- Acceptable Risk | | | 3,424,403 | | | | 551,770 | | | | 819,185 | | | | 183,244 | | | | 4,978,602 | |
| C- Appreciable Risk | | | - | | | | - | | | | 1,249,321 | | | | 616,576 | | | | 1,865,897 | |
| D- Significant Risk | | | - | | | | - | | | | 459,583 | | | | 1,044,542 | | | | 1,504,125 | |
| E- Unrecoverable Risk | | | - | | | | - | | | | 382,577 | | | | 966,941 | | | | 1,349,518 | |
| Total | | | 105,880,359 | | | | 952,034 | | | | 5,510,122 | | | | 2,831,138 | | | | 115,173,653 | |
| | | January 1, 2014 | |
| Risk Category | | Current loans
without
impairment | | | Past due loan
without
impairment | | | Current loans with
some type of
impairment | | | Past due and
impaired loans | | | Total | |
| | | In millions of COP | |
| A- Normal Risk | | | 86,762,160 | | | | 198,359 | | | | 2,006,148 | | | | 13,281 | | | | 88,979,948 | |
| B- Acceptable Risk | | | 2,470,962 | | | | 502,258 | | | | 264,839 | | | | 58,707 | | | | 3,296,766 | |
| C- Appreciable Risk | | | 1,190 | | | | - | | | | 1,062,139 | | | | 594,216 | | | | 1,657,545 | |
| D- Significant Risk | | | - | | | | - | | | | 427,636 | | | | 898,571 | | | | 1,326,207 | |
| E- Unrecoverable Risk | | | 980 | | | | - | | | | 295,660 | | | | 846,212 | | | | 1,142,852 | |
| Total | | | 89,235,292 | | | | 700,617 | | | | 4,056,422 | | | | 2,410,987 | | | | 96,403,318 | |
In order to determine the loans and financial leases impairment the Group considers the economic conditions and performance of the client's industry, the analysis of payments behavior and events that could negatively affect the client's ability to pay, among other factors.
Impairment can be done by referencea collective or individual evaluation according to the Registration Statementamount and characteristics of the loan.
If the evaluation is collective, the impairment is determined in Form F-6, filedaccordance with the variables, Probability of Default (PD), Loss Given Default (LGD)andExposure at Default (EAD).
All impaired credits that exceed COP 2,000 million are individually assessed (USD 1 million for foreign subsidiaries). The allowance for significant impaired loans are assessed based on the presentvalue of estimated future cash flows discounted at the effective loan rate or the fair value of the collateral in the case where the loan is considered collateral-dependent. An allowance for impaired loans is provided when discounted future cash flows or the fair value of collateral is lower than the carrying amount.
The impaired loans individually analyzed amounted to COP 2,387 billion which represents 1.64% of the total portfolio.
The table below shows impairment loans and financial leases as of December 31, 2015; December 31, 2014 and January 1, 2014 according to their type of evaluation:
| | | December 31, 2015 | |
| Impairment | | Individual Evaluation | | | Collective Evaluation | |
| | | Carrying Amount | | | Impairment | | | Carrying Amount | | | Impairment | |
| | | In millions of COP | |
| Commercial | | | 2,061,218 | | | | 1,087,354 | | | | 1,839,366 | | | | 982,636 | |
| Consumer | | | 349 | | | | 349 | | | | 1,422,849 | | | | 989,868 | |
| Mortgage | | | - | | | | - | | | | 1,091,645 | | | | 385,137 | |
| Financial Leases | | | 325,950 | | | | 157,898 | | | | 724,043 | | | | 266,934 | |
| Small Business Loan | | | - | | | | - | | | | 74,435 | | | | 54,249 | |
| Total | | | 2,387,517 | | | | 1,245,601 | | | | 5,152,338 | | | | 2,678,824 | |
| | | December 31, 2014 | |
| Impairment | | Individual Evaluation | | | Collective Evaluation | |
| | | Carrying Amount | | | Impairment | | | Carrying Amount | | | Impairment | |
| | | In millions of COP | |
| Commercial | | | 1,706,757 | | | | 816,389 | | | | 3,506,039 | | | | 954,892 | |
| Consumer | | | 250,889 | | | | 158,007 | | | | 1,336,873 | | | | 691,070 | |
| Mortgage | | | - | | | | - | | | | 779,661 | | | | 304,356 | |
| Financial Leases | | | 47,768 | | | | 30,695 | | | | 596,108 | | | | 232,013 | |
| Small Business Loan | | | - | | | | - | | | | 117,165 | | | | 47,376 | |
| Total | | | 2,005,414 | | | | 1,005,091 | | | | 6,335,846 | | | | 2,229,707 | |
| | | January 1, 2014 | |
| Impairment | | Individual Evaluation | | | Collective Evaluation | |
| | | Carrying Amount | | | Impairment | | | Carrying Amount | | | Impairment | |
| | | In millions of COP | |
| Commercial | | | 1,041,134 | | | | 696,089 | | | | 2,796,074 | | | | 831,009 | |
| Consumer | | | 2,423 | | | | 439 | | | | 1,276,550 | | | | 757,395 | |
| Mortgage | | | - | | | | - | | | | 656,921 | | | | 282,397 | |
| Financial Leases | | | 91,418 | | | | 19,482 | | | | 543,048 | | | | 213,472 | |
| Small Business Loan | | | - | | | | - | | | | 59,841 | | | | 44,851 | |
| Total | | | 1,134,975 | | | | 716,010 | | | | 5,332,434 | | | | 2,129,124 | |
A one-percent increase or decrease in the probability of default (PD), in the Loss Given Default (LGD) and in the cash flows for impaired loans represents an increase of approximately COP 63,299 million in the allowance for loan and lease losses or in a recovery of COP 82,507 million respectively. These sensitivity analyses do not represent management’s expectations of a decline in risk ratings or an increase in loss rates, however provided as a hypothetical scenario to assess the sensitivity of the allowance for loan and lease losses to changes in key inputs. The Bank believes the risk ratings and loss severities currently inuse are appropriate and represent management’s expectations about the credit risk inherent in its loan portfolio.
The following table shows the past due loans and financial leases without impairment:
| | | December 31, 2015 | |
| | | Current Loan | | | Past Due Loan | |
| Period | | 0 - 30 Days | | | 31 - 90 Days | | | 91 - 120 Days | | | 121 - 360
Days | | | More Than
360 Days | | | Total | |
| | | In millions of COP | |
| Commercial | | | 81,751,070 | | | | 234,143 | | | | 139 | | | | 6,816 | | | | - | | | | 81,992,168 | |
| Consumer | | | 19,474,745 | | | | 272,251 | | | | 118 | | | | 303 | | | | - | | | | 19,747,417 | |
| Mortgage | | | 15,673,893 | | | | 289,159 | | | | 38,718 | | | | 25,368 | | | | - | | | | 16,027,138 | |
| Financial Leases | | | 19,325,515 | | | | 71,704 | | | | 371 | | | | 1,522 | | | | 102,471 | | | | 19,501,583 | |
| Small Business Loan | | | 797,959 | | | | 14,519 | | | | - | | | | - | | | | - | | | | 812,478 | |
| Total | | | 137,023,182 | | | | 881,776 | | | | 39,346 | | | | 34,009 | | | | 102,471 | | | | 138,080,784 | |
| | | December 31, 2014 | |
| | | Current
Loan | | | Past Due Loan | |
| Period | | 0 - 30 Days | | | 31 - 90 Days | | | 91 - 120 Days | | | 121 - 360
Days | | | More Than
360 Days | | | Total | |
| | | In millions of COP | |
| Commercial | | | 60,150,783 | | | | 108,783 | | | | 1,123 | | | | 270 | | | | - | | | | 60,260,959 | |
| Consumer | | | 17,169,439 | | | | 169,855 | | | | 30 | | | | 68 | | | | - | | | | 17,339,392 | |
| Mortgage | | | 11,452,684 | | | | 258,509 | | | | 34,387 | | | | 22,404 | | | | - | | | | 11,767,984 | |
| Financial Leases | | | 16,573,468 | | | | 234,741 | | | | 3,262 | | | | 19,462 | | | | 90,420 | | | | 16,921,353 | |
| Small Business Loan | | | 534,246 | | | | 8,459 | | | | - | | | | - | | | | - | | | | 542,705 | |
| Total | | | 105,880,620 | | | | 780,347 | | | | 38,802 | | | | 42,204 | | | | 90,420 | | | | 106,832,393 | |
| | | January 1, 2014 | |
| | | Current
Loan | | | Past Due Loan | |
| Period | | 0 - 30 Days | | | 31 - 90 Days | | | 91 - 120 Days | | | 121 – 360
Days | | | More Than
360 Days | | | Total | |
| | | In millions of COP | |
| Commercial | | | 49,193,603 | | | | 185,184 | | | | 1,133 | | | | 9 | | | | - | | | | 49,379,929 | |
| Consumer | | | 15,477,952 | | | | 128,388 | | | | 7 | | | | 51 | | | | - | | | | 15,606,398 | |
| Mortgage | | | 9,484,387 | | | | 165,267 | | | | 32,905 | | | | 18,883 | | | | - | | | | 9,701,442 | |
| Financial Leases | | | 14,642,272 | | | | 55,794 | | | | 2,705 | | | | 16,206 | | | | 64,272 | | | | 14,781,249 | |
| Small Business Loan | | | 455,746 | | | | 11,145 | | | | - | | | | - | | | | - | | | | 466,891 | |
| Total | | | 89,253,960 | | | | 545,778 | | | | 36,750 | | | | 35,149 | | | | 64,272 | | | | 89,935,909 | |
| e. | Credit Risk Management - Other Financial Instruments: |
Each one of the positions that make up the portfolio complies with adapts to policies and limits that seek to diminish credit risk exposure by Bancolombiameans of the definition of, among others:
| · | Term Limits: Each counterparty is studied by the Risk Committee, in which the result of the authorized model for this type of counterparty is reviewed (quantitative and qualitative variables),which allows the Committee to establish the maximum term for which the organization wishes to have exposure. |
| · | Credit Limits: Limits approved under the model and with authorization from the Risk Committee, as well as the exposure, are monitored in line or batch, in such a way that the presentation of excesses is mitigated, and if the need for these arises, this is applied to the attributions regime in effect at the time. |
| · | Counterparty Limits: These limits, derived from the Credit limits or with their own allocation model, are verified by the Front Office prior to the close of operations so that the availability to do it is confirmed. |
| · | Master Agreement: These bilateral agreements describe the handling of operations between the counterparties in accordance with good international practices and that limit the legal and financial risk of under the occurrence of events of default (failure to pay or delivery). Mitigation mechanisms, procedures to be carried out in the case of this events of default, special conditions by type of operation and that are applied to OTC derivatives, Repos and other securities financing transactions, are all agreed upon. |
| · | Margin Agreements: For OTC derivatives operations and other securities financing transactions, agreements that regulate the administration of guarantees, haircuts, adjustment periods, minimum transfer amounts, etc., and that limit risk for a period of time (one day, one week, etc.), are established for counterparties involved in the operation. |
| · | Counterparty Alerts: There are financial, qualitative and market indicators that allow The Bank´s to establish damages to the credit quality of an issuer or counterparty. |
| f. | Credit Quality Analysis - Other Financial Instruments: |
In order to evaluate the credit quality of a counterparty or issuer (to determine a risk level or profile), The Bank´s relies on January 14, 2008.two rating systems: an external one and an internal one, both of which allow it to identify a degree of impairment differentiated by segment - Country and to apply the policies that have been established for issuers or counterparties with different levels of risk, in order to limit the impact on liquidity and/or the earnings statement of the Bank.
The external credit rating system is divided by the type of rating applied to each instrument or counterparty; in this way the geographic location, the term and the type of instrument allow the assignment of a rating according to the methodology that each examining agency uses.
Agencies that support the ratings assignments are the following:
| · | International: Moody's, Fitch Ratings and Standard & Poors. |
| · | Local:Fitch Rating Colombia, BRC Investor Services S.A. Inc. and Value and Risk Rating S.A. Inc. |
Internal credit rating system: The “Ratings or risk profiles” scale is created with a range of levels that go from low exposure to high exposure (This can be reported in numerical or alphanumerical scales), where the rating model is sustained by the implementation and analysis of qualitative and quantitative variables at sector level, which according to the relative analysis of each variable, determine credit quality; in this way the internal credit rating system aims to establish adequate margin in decision-making regarding the management of financial instruments.
| · | Risk Exposure of the Group |
| | | Debt Securities | | | Equity | | | Derivatives | |
| | | 2015 | | | 2014 | | | 2015 | | | 2014 | | | 2015 | | | 2014 | |
| | | In Mill of COP | |
| Maximum Exposure to Credit Risk | | | | | | | | | | | | | | | | | | | | | | | | |
| Total Balance Sheet | | | 13,171,189 | | | | 11,239,541 | | | | 1,162,590 | | | | 1,281,288 | | | | 1,135,149 | | | | 820,564 | |
| Amortized Cost | | | | | | | | | | | | | | | | | | | | | | | | |
| Low Risk | | | 1,863,215 | | | | 1,930,863 | | | | 918,910 | | | | 831,486 | | | | - | | | | - | |
| Medium Risk | | | 1,373,209 | | | | - | | | | - | | | | - | | | | - | | | | - | |
| High Risk | | | - | | | | - | | | | 558 | | | | - | | | | - | | | | - | |
| Without Rating | | | 225,451 | | | | - | | | | 243,122 | | | | 234,681 | | | | - | | | | - | |
| Total | | | 3,461,875 | | | | 1,930,863 | | | | 1,162,590 | | | | 1,066,167 | | | | - | | | | - | |
| | | | | | | | | | | | | | | | | | | | | | | | | |
| Fair Value | | | | | | | | | | | | | | | | | | | | | | | | |
| Low Risk | | | 8,103,816 | | | | 8,863,148 | | | | - | | | | 195,615 | | | | 1,111,724 | | | | 780,464 | |
| Medium Risk | | | 613,816 | | | | 426,397 | | | | - | | | | - | | | | 102 | | | | 28,329 | |
| High Risk | | | 846,379 | | | | 1,863 | | | | - | | | | 883 | | | | 3,374 | | | | 5,128 | |
| Without Rating | | | 145,303 | | | | 17,270 | | | | - | | | | 18,623 | | | | 19,949 | | | | 6,643 | |
| ETF Funds without rating | | | - | | | | - | | | | - | | | | - | | | | - | | | | - | |
| Total | | | 9,709,314 | | | | 9,308,678 | | | | - | | | | 215,121 | | | | 1,135,149 | | | | 820,564 | |
Note: A negative value corresponds to negative assessment positions
In accordance with the criteria and considerations specified in the internal rating allocation and external credit rating systems methodologies, the following schemes of relation can be established, according to credit quality given to each one of the qualification scales:
Low Risk: All investment degree positions, as well as those issuers that according to the information available (financial statements, relevant information, external ratings, CDS, etc.) reflect adequate credit quality.
Medium Risk: All speculative degree positions (to BB-), as well as those issuers that according to the available information (financial statements, relevant information, external qualifications, CDS, etc.) reflect weaknesses that could affect their financial situation in the medium term.
High Risk: All positions of greater speculative quality (from B+), as well as those issuers that according to the information available (financial statements, relevant information, external qualifications, CDS, etc.) reflect a high probability of default of financial obligations or that already have failed to fulfill them.
F-144 | · | Financial Credit Quality of Other Instruments that Are Not in Default nor impaired in Value |
Debt Securities:100% of the debt securities are not in default.
Equity Securities:The positions are rated A under the internal rating system, which corresponds to low risk.
Derivatives:100% of the Credit Exposure does not present incidences of material default.
| · | Maximum Exposure Level to the Credit Risk Given for: |
| | | Maximum Exposure | | | Guarantees | | | Net exposure | |
| | | In millions of COP | |
| | | 2015 | | | 2014 | | | 2015 | | | 2014 | | | 2015 | | | 2014 | |
| Maximum Exposure to Credit Risk | | | | | | | | | | | | | | | | | | | | | | | | |
| Debt Securities | | | 13,171,189 | | | | 11,239,541 | | | | (552,744 | ) | | | (1,206,642 | ) | | | 12,618,446 | | | | 10,032,900 | |
| Derivatives | | | 1,135,149 | | | | 820,564 | | | | (352,644 | ) | | | (145,332 | ) | | | 782,505 | | | | 675,231 | |
| Equity | | | 1,162,590 | | | | 1,281,288 | | | | - | | | | - | | | | 1,162,590 | | | | 1,281,288 | |
| Total | | | 15,468,928 | | | | 13,341,393 | | | | (905,388 | ) | | | (1,351,974 | ) | | | 14,563,541 | | | | 11,989,419 | |
Note: Negative guarantees are received from counterparty and negative guarantees are given to counterparty.
Note: Collateral Held (+) and Collateral Pledged (-)
See Notes on this table (1)
(1)* Exposure in Derivatives with base in MTM (only positive values), netting by counterparty is applied
* Debt Securities Book value 100%
* Equity Instruments:
| - | Investment funds: Book value 100% |
| · | Analysis of the maturity of the assets that are Past due but not impaired |
| · | Debt Securities: Portfolio does not present default. |
| · | Equity securities: Portfolio does not present default. |
| · | Derivatives: The default is not Material. |
| · | The information corresponding to the individual evaluation of impairment at the end of the period for other financial instruments, is detailed as follows: |
| | | | | | | | | Debt Securities | | | | | | | |
| | | MTM | | | Impairment | | | Final Exposure | |
| | | 2015 | | | 2014 | | | 2015 | | | 2014 | | | 2015 | | | 2014 | |
| | | In millions of COP | |
| Maximum Exposure to Credit Risk | | | | | | | | | | | | | | | | | | | | | | | | |
| Fair Value | | | 9,709,314 | | | | 9,308,678 | | | | - | | | | - | | | | 9,709,314 | | | | 9,308,678 | |
| Amortized Cost | | | 3,461,875 | | | | 1,930,863 | | | | - | | | | - | | | | 3,461,875 | | | | 1,930,863 | |
| Total | | | 13,171,189 | | | | 11,239,541 | | | | - | | | | - | | | | 13,171,189 | | | | 11,239,541 | |
| | | | | | | | | Equity | | | | | | | |
| | | MTM | | | Impairment | | | Final Exposure | |
| | | In millions of COP | |
| | | 2015 | | | 2014 | | | 2015 | | | 2014 | | | 2015 | | | 2014 | |
| Maximum Exposure to Credit Risk | | | | | | | | | | | | | | | | | | | | | | | | |
| Fair Value through other comprehensive income | | | 761,907 | | | | 865,730 | | | | - | | | | - | | | | 761,907 | | | | 865,730 | |
| Fair Value through profit or loss | | | 400,683 | | | | 415,558 | | | | - | | | | - | | | | 400,683 | | | | 415,558 | |
| Total | | | 1,162,590 | | | | 1,281,288 | | | | - | | | | - | | | | 1,162,590 | | | | 1,281,288 | |
Collateral- Other Financial Instruments:
Level of Collateral:According to the type of asset or operation, a collateral level is determined according to the policies defined for each product and the market where the operation is carried out.
Assets held as collateral in organized markets:The only assets that can be received as collateral are those defined by the Central Counterparties, the stock market where the operation is negotiated, those assets that are settled separately in different contracts or documents, which can be managed by each organization and must comply with the investment policies defined by the Bank, taking into account the credit limit for each type of asset or operation received or delivered, which collateral received are the best credit quality and liquidity.
Assets received as bilateral collateral between counterparties:The collateral accepted in international OTC derivative operations is agreed on bilaterally in the CSA and with fulfillment in cash in dollars.
Collateral adjustments for Margin agreements:The adjustments will be determined by the criteria applied by both the external and internal regulations in effect, and at the same time, mitigation standards are maintained so that the operation fulfills the liquidity and solidity criteria for settlement. Among the main characteristics by product or market, we have:
| · | With respect to the derivative operations, these are carried out daily, with Threshold levels of zero for the majority of counterparties, which reduces the exposure to a term that does not exceed 10 days, according to Basel. |
| · | For buy-sell backs, repos and other Securities financing transactions, daily monitoring is done in order to establish the need to adjust the collateral in such a way that these are applied in as little time as possible, according to the contracts or market conditions. |
| · | For all international counterparties, margin agreements that limit exposure to the maximum and with a daily adjustment period are celebrated. These margin agreements are entered into under ISDA and GMRAs both for OTC Derivatives and securities financing transactions. |
| · | For every local counterparty, the local framework agreement is signed (agreement developed by the industry) and the mitigating actions to apply in each operation are agreed upon, whether for margin agreements, re-couponing or early termination, among others. |
| · | For Repos, Buy-sell backs and other securities financing transactions, these are agreed upon by organized markets that in general implicate complying with haircut or additional collateral rules. |
| · | The Central Counterparty carries out daily control and monitoring processes in order to comply with the rules imposed by these organizations in such a way that we are always making daily adjustments at the demanded collateral level. |
| g. | Concentration of the Credit Risk - Other Financial Instruments: |
According to the regulations, the Bank must control on a daily basis the risk of positions of the Bank's companies with the same issuer or counterparty stands, below the legal limits.
By the same way, the positions of the Bank are verifyed respect of the authorized risk levels in each country in order to guarantee the alerts and positions limits, that are considered outside of the The Bank risk appetite.
| · | Risk Exposure by Economic Sector and Risk Country: |
| | | Debt Securities | | | Equity | | | Derivatives | |
| | | 2015 | | | 2014 | | | 2015 | | | 2014 | | | 2015 | | | 2014 | |
| | | In Mill of COP | |
| Maximum Exposure to Credit Risk | | | | | | | | | | | | | | | | | | | | | | | | |
| Sector Concentration | | | | | | | | | | | | | | | | | | | | | | | | |
| Corporate | | | 800,366 | | | | 281,790 | | | | 997,314 | | | | 1,043,128 | | | | 290,423 | | | | 423,647 | |
| Financial | | | 1,211,737 | | | | 1,125,198 | | | | 113,645 | | | | 99,333 | | | | 840,793 | | | | 396,917 | |
| Goverment | | | 11,051,168 | | | | 9,832,552 | | | | - | | | | - | | | | - | | | | - | |
| Funds or ETF | | | 107,918 | | | | - | | | | 44,861 | | | | 138,827 | | | | - | | | | - | |
| Total | | | 13,171,189 | | | | 11,239,540 | | | | 1,155,820 | | | | 1,281,288 | | | | 1,131,216 | | | | 820,564 | |
| Concretation by location | | | | | | | | | | | | | | | | | | | | | | | | |
| North America | | | 539,462 | | | | 203,816 | | | | 7,814 | | | | 5,227 | | | | 296,186 | | | | 93,810 | |
| Latam | | | 12,607,260 | | | | 11,035,724 | | | | 1,154,776 | | | | 1,275,143 | | | | 716,005 | | | | 614,552 | |
| Europe | | | - | | | | - | | | | - | | | | 918 | | | | 116,473 | | | | 111,357 | |
| Others (Includes Funds and ETF) | | | 24,467 | | | | - | | | | - | | | | - | | | | 6,485 | | | | 845 | |
| Total | | | 13,171,189 | | | | 11,239,540 | | | | 1,162,590 | | | | 1,281,288 | | | | 1,135,149 | | | | 820,564 | |
Note: A negative value corresponds to negative assessment positions
At the moment, the Bank's positions do not present concentration risk.
Market risk refers to the risk of losses in the bank’s treasury book due to changes in equity prices, interest rates, foreign-exchange rates and other indicators whose values are set in a public market. It also refers to the probability of unexpected changes in net interest income and equity economic value as a result of a change in market interest rates.
Market risk stems from the following activities at The Bank:
| · | Trading: includes purchase, sale and positioning, mainly in fixed income securities, equities, currencies and derivatives, as well as the financial services provided to customers, such as brokerage. Trading instruments are recorded in the treasury book and are managed by the Treasury Division which is also responsible for the aggregated management of exchange rate exposures arising from the banking book and treasury book. |
| · | Balance Sheet Management: refers to the assets and liabilities management, due to mismatches in maturities and repricing of them. The Assets Liabilility Management Division is responsible for the balance sheet management, preserving the stability of the financial margin and the equity economic value, maintaining adequate levels of liquidity and solvency. Non-trading instruments are recorded in the Bank’s banking book (the “Banking Book”), which includes primarily loans, time deposits, checking accounts and savings accounts. |
In the Bank, the market risks are identified, measured, monitored, controlled and reported in order to support the decision-taking process for their mitigation, and to create greater shareholder value added.
The guidelines, policies and methodologies for market risks management are approved by the Board of Directors, thus guaranteeing the congruence and unity in the risk appetite between subsidiaries. Each country has a local Market and Liquidity Risk Management Office that applies at the individual level the principles of the Group´s Market Risk Management Strategy. The Board of Directors and senior management have formalized the policies, procedures, strategies and rules of action for market risk administration in its “Market Risk Manual”. This manual defines the roles and responsibilities within each subdivision of the Bank and their interaction to ensure adequate market risk administration.
The Bank´s Market and Liquidity Risks Management Office, responsible for monitoring and permanently controlling compliance with the limits established, is set up with clear independence from the trading and businesses units, ensuring enforcement authority. This independent control function is complemented by regular reviews conducted by the Internal Audit.
The Bank’s Market and Liquidity Risks Management Office is responsible for: (a) identifying, measuring, monitoring, analysing and controlling the market risk inherent in the Bank’s businesses: (b) analysing the Bank’s exposure under stress scenarios and confirming compliance with the Bank’s risk management policies: (c) designing the methodologies for valuation of the market value of certain securities and financial instruments: (d) reporting to senior management and the Board of Directors any violation of the Bank’s risk management policies: (e) reporting to the senior management on a daily basis the levels of market risk associated with the trading instruments recorded in its treasury book (the “Treasury Book”), and (f) proposing policies to the Board of Directors and to senior management that ensure the maintenance of predetermined risk levels. The Bank has also implemented an approval process for new products across each of its subdivisions. This process is designed to ensure that each subdivision is prepared to incorporate the new product into its procedures, that every risk is considered before the product is incorporated and that approval is obtained from the Board of Directors before the new product can be sold.
Market risks arising from trading instruments are measured at the Bank using two different Value at Risk (VaR) methodologies: the standard methodology provided by the Superintendency of Finance, and the internal methodology of historical simulation. The standard methodology is established by “chapter XXI of the Basic Accounting Circular”, based on the model recommended by the Amendment to the Capital Accord to Incorporate Market Risks of Basel Committee of 2005. The internal methodology of historical simulation uses a confidence level of 99%, a holding period of 10 days, and a time frame of one year or at least 250 days from the reference date of the VaR calculation is used, obtained from the reference date of calculating the VaR.
The Bank’s VaR limits structure for trading activities, is sufficiently granular to conduct an effective control of the various types of market risk factors on which an exposure is held. It ensures that the market risk is not concentrated in certain asset classes and maximizes the portfolio diversification effect. These limits are defined by companies, products or by risk takers. The majority of the limits are based on the maximum VaR values to which a certain portfolio can be exposed; nevertheless, loss triggers, stop loss and sensitivity warning levels are also set, especially in the derivatives portfolios. The limits are approved by the Board of Directors, and set based on factors such as tolerance for losses, capital resources and market´s complexity and volatility. They are monitored daily, and their excesses or violations are reported to the Board of Directors and the Risk Committee.
Additional measurements such as stress tests are done to identify extreme unusual situations that could cause severe losses. Stress simulations include historical events and hypothetical scenarios. Backtesting or model validation technics through comparison of predicted and actual loss level are applied on a regular basis to analyse and contrast the accuracy of the VaR calculation methodology in order to confirm its reliability, and make adjustments to the models if necessary.
Within the control and monitoring processes of market risks, reports are elaborated on a daily, weekly and monthly basis. They include an analysis of the most relevant risk measures and allow for monitoring the exposure levels to market risks and to the legal and internal limits established for each one of the levels of the Group. These reports are taken as an input for the decision-taking process in the different Committees and management of The Bank.
Market Risk Management
The following section describes the market risks to which The Bank is exposed and the tools and methodologies used to measure these risks as of December 31, 2015. The Bank faces market risk as a consequence of its lending, trading and investments businesses.
The Bank uses a VaR calculation to limit its exposure to the market risk of its treasury book. The Board of Directors is responsible for establishing the maximum VaR based on its assessment of the appropriate level of risk for The Bank.
For managing the interest rate risk from banking activities, the Bank analyses the interest rate mismatches between its interest earning assets and its interest bearing liabilities. In addition, the foreign currency exchange rate exposures arising from the Banking book are provided to the Treasury Division where these positions are aggregated and managed.
a. Measurement of Market Risk of Negotiation Instruments
The Bank currently measures the treasury book exposure to market risk (including over-the-counter derivatives positions) as well as the currency risk exposure of the Banking book, which is provided to the Treasury Division, using a VaR methodology established in accordance with “chapter XXI of the Basic Accounting Circular”, issued by the Superintendency of Finance.
The VaR methodology established by “chapter XXI of the Basic Accounting Circular” is based on the model recommended by the Amendment to the Capital Accord to Incorporate Market Risks of Basel Committee of 2005, which focuses on the treasury book and excludes investments classified as “held to maturity” which are not being given as collateral and any other investment that comprises the Banking book, such as non-trading positions. In addition, the methodology aggregates all risks by the use of correlations, through an allocation system based on defined zones and bands, affected by given sensitivity factors.
The total market risk for the Bank is calculated by the arithmetical aggregation of the VaR calculated for each subsidiary. The aggregated VaR is reflected in the Bank’s Capital Adequacy (Solvency) ratio, in accordance with Decree 1771 of 2012.
For purposes of VaR calculations, a risk exposure category is any market variable that is able to influence potential changes in the portfolio value. Taking into account a given risk exposure, the VaR model assesses the maximum loss not exceeded at a specified confidence level over a given period of time. The fluctuations in the portfolio’s VaR depend on volatility, modified duration and positions changes relating to the different instruments that are subject to market risk.
The relevant risk exposure categories for which VaR is computed by The Bank according to “chapter XXI, appendix 1 of the Basic Accounting Circular” are: (i) interest rate risks relating to local currency, foreign currency and UVR; (ii) currency risk; (iii) stock price risk; and (iv) fund risk.
| · | Interest Rate Risk (Treasury Book) |
The interest rate risk is the probability of decrease in the market value of the position due to fluctuations in market interest rates. The Bank calculates the interest rate risk for positions in local currency, foreign currency and UVR separately; in accordance with chapter XXI of the Basic Accounting Circular issued by the Superintendency of Finance.
In the first instance, the Interest Rate Risk exposure is determined by the sensitivity calculation for the net position of each instrument. This sensitivity is calculated as the net value market product, its corresponding modified duration and the estimated variation of interest rates. The possible variations in the interest rates are established by the SFC according to the historical behaviour of these variables in the markets, and they are a function of the duration and currency, as seen in the following table.
| | | | | Modified Duration | | Changes in Interest Rates (bps) |
| | | | | | | | | Legal | | | | |
| Zone | | Band | | Lower Limit | | Upper Limit | | Currency | | URV | | Foreign Currency |
| | | 1 | | 0 | | 0.08 | | 274 | | 274 | | 100 |
| | | 2 | | 0.08 | | 0.25 | | 268 | | 274 | | 100 |
| Zone 1 | | 3 | | 0.25 | | 0.5 | | 259 | | 274 | | 100 |
| | | 4 | | 0.5 | | 1 | | 233 | | 274 | | 100 |
| | | 5 | | 1 | | 1.9 | | 222 | | 250 | | 90 |
| Zone 2 | | 6 | | 1.9 | | 2.8 | | 222 | | 250 | | 80 |
| | | 7 | | 2.8 | | 3.6 | | 211 | | 220 | | 75 |
| | | 8 | | 3.6 | | 4.3 | | 211 | | 220 | | 75 |
| | | 9 | | 4.3 | | 5.7 | | 172 | | 200 | | 70 |
| | | 10 | | 5.7 | | 7.3 | | 162 | | 170 | | 65 |
| Zone 3 | | 11 | | 7.3 | | 9.3 | | 162 | | 170 | | 60 |
| | | 12 | | 9.3 | | 10.6 | | 162 | | 170 | | 60 |
| | | 13 | | 10.6 | | 12 | | 162 | | 170 | | 60 |
| | | 14 | | 12 | | 20 | | 162 | | 170 | | 60 |
| | | 15 | | 20 | | | | 162 | | 170 | | 60 |
Once sensitivity has been calculated for each net position, they are grouped in the zones and bands that are shown in the previous table, making use of the modified duration of each investment. This procedure allows a net sensitivity calculation for each band and zone, understood as the difference between the sensitivities associated with long positions (positive sensitivities) as opposed to sensitivities of short positions (negative sensitivities), of the instruments that conform each one of the bands or zones.
Nevertheless, making the direct sum of net sensitivities (positive and negative) for each one of the bands and zones would allow the compensation of Interest Rate Risk exposure between instruments that are clearly different, even though these instruments share the same currency, have exposure differentials in relation to movements of the interest rate curves for different terms. Therefore, the Interest Rate Risk cannot be compensated, at least not totally, between different instruments, especially from the point of view of duration.
In order to incorporate this fact into the measurement of Interest Rate Risk, the calculation of a charge by sensitivity adjustment has been implemented, which represents a portion of sensitivity that cannot be compensated between different instruments, bands or zones. The adjustment factors present a behaviour that increases as the instruments whose duration differs greatly are compensated.
It is important to emphasize that the changes in interest rates and adjustment factors can be modified by the Financial Superintendent of Colombia when it is provided to them, for the purpose of adequately reflecting the sensitivity of each one of the positions exposed to Interest Rate Risk.
The Group’s exposure to interest risk primarily arises from investments in Colombian government’s treasury bonds (TES) and securities issued by the Colombian government held on Bancolombia’s treasury book.
| · | Currency (Treasury and Banking Book), Equity (Treasury Book) and Fund (Treasury Book) Risk |
The VaR model uses a sensitivity factor to calculate the probability of loss due to fluctuations in the price of stocks, funds and currencies in which the Bank maintains a position. As previously indicated, the methodology used in this Annual Report to measure such risk consists of computing VaR, which is derived by multiplying the position by the maximum probable variation in the price of such positions (“Dp��). TheDp is determined by the Superintendency of Finance, as shown in the following table:
| Currency | | Sensitivity Factor | |
| United States Dollar | | | 5.5 | % |
| Euro | | | 6 | % |
| Other currencies and gold | | | 8 | % |
| Equity and Fund Risk | | | 14.7 | % |
The interest rate’s fluctuations and the sensitivity factors for currency, equity and fund risk used in the model are established by the Superintendency of Finance according to historical market performance, and have not changed since March 2011.
The total market risk VaR is calculated as the algebraic sum of the interest rate risk, the currency risk, the stock price risk and the fund risk, which are calculated as the algebraic sum of each company’s exposure to these risks.
The total market risk VaR, had a 123% surge going from COP 323 billion in December 31st, 2014 to COP 721 billion as of December 31st, 2015, due mainly to the increase in the currency risk, as a consequence of an increase on United States Dollar, Euro and Guatemalan quetzal positions.
The following table presents the total change on market risk and every risk factor.
| | | 2015 | |
| | | In millions of COP | |
| Factor | | End of Year | | | Average | | | Maximum | | | Minimum | |
| Interest Rate | | | 276,405 | | | | 212,472 | | | | 276,405 | | | | 134,113 | |
| Exchange Rate | | | 348,815 | | | | 144,018 | | | | 348,815 | | | | 58,516 | |
| Share Price | | | 54,947 | | | | 56,931 | | | | 80,676 | | | | 49,377 | |
| Collective Portfolios | | | 40,675 | | | | 41,108 | | | | 46,994 | | | | 35,616 | |
| Total Value at Risk | | | 720,842 | | | | 454,529 | | | | 720,842 | | | | 301,236 | |
Includes Grupo Agromercantil's market risk exposure at a 100%
| | | 2014 | |
| | | In millions of COP | |
| Factor | | End of Year | | | Average | | | Maximum | | | Minimum | |
| Interest Rate | | | 171,602 | | | | 177,166 | | | | 239,959 | | | | 109,623 | |
| Exchange Rate | | | 56,310 | | | | 82,443 | | | | 103,753 | | | | 56,310 | |
| Share Price | | | 50,949 | | | | 27,470 | | | | 50,949 | | | | 21,888 | |
| Collective Portfolios | | | 44,235 | | | | 40,206 | | | | 44,235 | | | | 38,535 | |
| Total Value at Risk | | | 323,096 | | | | 327,285 | | | | 402,112 | | | | 240,368 | |
| · | Assumptions and Limitations of VaR Models |
Although VaR models represent a recognized tool for risk management, they have inherent limitations, including reliance on historical data that may not be indicative of future market conditions or trading patterns. Accordingly, VaR models should not be viewed as predictive of future results. The Bank may incur losses that could be materially in excess of the amounts indicated by the models on a particular trading day or over a period of time, and there have been instances when results have fallen outside the values generated by the Bank’s VaR models. A VaR model does not calculate the greatest possible loss. The results of these models and analysis thereof are subject to the reasonable judgment of the Bank’s risk management personnel.
| b. | Non-Trading Instruments Market Risk Measurement |
The banking book’s relevant risk exposure is interest rate risk, which is the probability of unexpected changes in net interest income as a result of a change in market interest rates. Changes in interest rates affect The Bank’s earnings because of timing differences on the reprising of the assets and liabilities. The Bank manages the interest rate risk arising from banking activities in non-trading instruments by analyzing the interest rate mismatches between its interest earning assets and its interest bearing liabilities. The foreign currency exchange rate exposures arising from the banking book are provided to the Treasury Division where these positions are aggregated and managed.
The Bank has performed a sensitivity analysis of market risk sensitive instruments estimating the impact on the net interest income of each position in the banking book, using within a period of twelve months based on hypothetical changes in the interest rates, using a reprising model and assuming positive parallel shifts of 100 basis points (bps). The following table provides information about The Bank’s interest rate sensitivity for the balance sheet items comprising the banking book:
Sensitivity to Interest Rate Risk of the Banking Book
The chart below provides information about Bancolombia’s of interest rate risk sensitivity in local currency (pesos) at December 31, 2015 and 2014:
| | | Interest Rate Risk | |
| | | In millions of COP | |
| | | 2015 | | | 2014 | |
| | | | | | | |
| Assets sensitivity 100 pbs | | | 579,393 | | | | 492,890 | |
| Liabilities sensitivity 100 bps | | | 332,079 | | | | 306,541 | |
| Net interest income sensitivity 100 bps | | | 247,314 | | | | 186,349 | |
The chart below provides information about Bancolombia’s of interest rate risk sensitivity in foreing currency (US dollars) at December 31, 2015 and 2014:
| | | Interest Rate Risk | |
| | | (In thousands of US dollars) | |
| | | 2015 | | | 2014 | |
| | | | | | | |
| Assets sensitivity 100 pbs | | USD | 74,228 | | | USD | 70,345 | |
| Liabilities sensitivity 100 bps | | USD | 69,869 | | | USD | 65,746 | |
| Net interest income sensitivity 100 bps | | USD | 4,359 | | | USD | 4,599 | |
Grupo Agromercantil's market risk exposure at a 100%
Includes Grupo Agromercantil's market risk exposure at a 100%
A positive net sensitivity denotes a higher sensitivity of assets side and therefore a rise in interest rates affects positively the Bank´s net interest income. A negative sensitivity denotes a higher sensitivity of liabilities side and therefore a rise in the interest rates affects negatively the Bank´s net interest income. In the event of a decrease in interest rates, the impact in the net interest income would be opposite to the mentioned.
As of December 31, 2015, the net interest income sensitivity in local currency for the banking book instruments, entered into for other than trading purposes with positive parallel shifts of 100 basis points was COP 247 million. The sensitivity variation due to interest rate risk between 2014 and 2015 occurred due to the increase in the sensitivity of the loan portfolio.
On the other hand, the net interest income sensitivity in foreign currency in the face of 100 basis points was USD 4.4 million, which is not a significant difference between 2014 and 2015.
| o | Assumptions and Limitations: |
Net interest income sensitivity analysis is based on the repricing model and consider the following key assumptions: (a) does not consider prepaid, new operations, defaults, etc., (b); the fixed rate instruments sensitivity, includes the amounts with maturity lower than one year and assuming these will be disbursed at interest rates market and (c) changes in interest rate occur immediately and parallel in the yield curves from assets and liabilities for different maturities.
| · | Structural Equity Risk Exposure (Banking Book) |
Grupo Bancolombia’s investment banking affiliate, in its role of financial corporation, has, directly and through its affiliated companies, structural equity investments. These positions are maintained mostly in energy and construction sectors. Smaller positions are held on the financial sector.
Those investments had a 22% decrease in market value, going from COP 337 billion as of December 31st, 2014 to COP 262 billion as of December 31st, 2015.
The structural equity positions are exposed to market risk. Sensitivity calculations are made for those positions:
| | | | 2015 | | | | 2014 | |
| Market Value | | | COP | 261,648 | | | | COP | 337,097 | |
| Delta | | | | 14.7 | % | | | | 14.7 | % |
| Sensitivity | | | COP | 38,462 | | | | COP | 49,553 | |
A negative impact of 14,7%, apply to the market value, produces a decrease of COP 38 billion on the structural equity investments market value, going from COP 262 billion to 223 billion.
Liquidity risk is defined as the inability of a financial firm to meet its debt obligations without incurring unacceptably large losses. Thus, funding liquidity risk is the risk that a firm will not be able to meet its current and future cash flow and collateral needs, both expected and unexpected, without materially affecting its daily operations or overall financial condition. Banks are sensitive to funding liquidity risk since debt maturity transformation is one of their key business areas.
At Bancolombia, liquidity prevails over any objective of growth or revenue. Managing liquidity has always been a fundamental pillar of its business strategy, together with capital, in supporting its balance sheet strength.
The Bank’s liquidity management model promotes the autonomy of subsidiaries, which must be self-sufficient in their structural funding. Each subsidiary is responsible for meeting the liquidity needs of its current and future activity, within a framework of management coordination at the Group level. The metrics used to control liquidity risk are developed based on common and homogeneous concepts, but analysis and adaptation are made by each subsidiary.
In line with best governance practices, the Bank has established a clear division of function between executing liquidity management, which is the responsibility of the Asset and Liability Division, and their monitoring and control, responsibility of the Market and Liquidity Risks Management Office.
The different authorities of senior management define the policies and guidelines for managing Liquidity Risk. These authorities are the Board of Directors, the Risk Committee, and senior management of the Parent Company, which set the risk appetite and define the financial strategy. The ALCO committees define the objective positioning of liquidity and the strategies that ensure the funding needs derived from businesses. The ALM Division and the Market and Liquidity Risks Management Office support the mentioned committees, which elaborate analysis and management proposals, and control compliance with the limits established.
Liquidity Risks Management Office is responsible for proposing the minimum amount of the liquidity reserve, the policies of the liquidity portfolio, defining premises and metrics in order to model the behavior of the cash flows, proposing and monitoring liquidity limits in line with the Bank's risk appetite, simulating stress scenarios, evaluating and reporting the risks inherent to new products and operations, and submitting the reports required by the internal authorities for decision-making, as well as by regulators. All of the above activities are verified and evaluated by the Internal Audit.
The measures to control liquidity risk include maintaining a portfolio of high liquid assets, and the definition of triggers and liquidity limits, which enable evaluating the level of exposure of each one of the entities in a proactive way.
The methodologies used to control liquidity risk include the liquidity gaps and stress scenarios. The liquidity gaps measure the mismatches of assets, liabilities and off-balance sheet position´s cash flows, separately for legal currency and foreign currency. Regulatory metrics are also applied, in which the contractual maturities are used; and internal models in which the cash flows are adjusted by different ratios, for reflecting a more real behavior of them.
Each subsidiary creates their liquidity gap according to the characteristics of their business and they tackle them through the different financing resources they have available. The recurrence of the businesses that are going to be financed, the stability of the financing sources, and the ability of the assets to be converted into liquid are the fundamental factors that are taken into account in the definition of this metric. In practice, and given the different behaviors of a same item in the Bank’s subsidiaries, there are common standards and methodologies to homogenize the construction of liquidity risk profiles for each unit so they can be presented in a comparable way to the Bank's Senior Management.
Periodically, a validation of the policies, limits, processes, methodologies and tools for evaluation liquidity risk exposure is done, in order to establish its pertinence and functionality, and to carry out the necessary adjustments. The Market and Liquidity Risks Management Office elaborate daily, weekly and monthly reports in order to monitor the exposure levels and the limits and triggers set up, and to support the decision-making process.
Each subsidiary has its own liquidity contingency plan, which is tested annually. These contingency plans procure the optimization of different funding sources, among them going to the Parent Company.
| 2. | Liquidity Risk Management |
The Bank’s Board of Directors sets the strategy for managing liquidity risk and delegates responsibility for oversight of the implementation of this policy to ALCO committee that approves the Bank’s liquidity policies and procedures. The Treasury Division manages the Bank’s liquidity position on a day-to-day basis and reviews daily reports covering the liquidity position. A summary report, including any exceptions and remedial action taken, is submitted regularly to Risk Committee and ALCO committees.
| · | Liquidity Risk Exposure: |
In order to estimate liquidity risk, the Bank measures a liquidity coverage ratio to ensure holding “high quality liquid assets” (HQLA) sufficient to cover potential net cash outflows into 30 days. This indicator allows the Bank to meet liquidity coverage for the next month.
The liquidity coverage ratio is presented following:
| | | December 31, 2015 | | | December 31, 2014 | |
| Liquidity Coverage Ratio | | In millions of COP | |
| Net cash outflows into 30 days | | | 4,940,749 | | | | 5,620,543 | |
| Liquid Assets | | | 25,295,734 | | | | 19,611,798 | |
| Liquidity Ratio | | | 511.98 | % | | | 348.93 | % |
| o | Contractual Maturities of Financial Assets |
The tables below set out the remaining contractual maturities of the Group’s financial assets
| | | December 31, 2015 | |
| Assets | | 0 - 1 Year | | | 1- 3 Years | | | 3- 5 Years | | | More than 5 Years | |
| | | In millions of COP | |
| Cash and balances with central bank | | | 14,295,163 | | | | - | | | | - | | | | - | |
| Interbank borrowings - Repurchase agreements | | | 4,727,842 | | | | - | | | | - | | | | - | |
| Financial assets investments | | | 6,172,115 | | | | 5,246,429 | | | | 1,490,030 | | | | 3,884,006 | |
| Loans and advances to customers | | | 55,371,495 | | | | 45,822,004 | | | | 30,971,805 | | | | 48,150,359 | |
| Derivative financial instruments | | | 2,083,030 | | | | 570,041 | | | | 201,374 | | | | 616,116 | |
| Total Assets | | | 82,649,645 | | | | 51,638,474 | | | | 32,663,209 | | | | 52,650,481 | |
| | | December 31, 2014 | |
| Assets | | 0 - 1 Year | | | 1- 3 Years | | | 3- 5 Years | | | More than 5 Years | |
| | | In millions of COP | |
| Cash and balances with central bank | | | 11,194,859 | | | | - | | | | - | | | | - | |
| Interbank borrowings - Repurchase agreements | | | 2,315,079 | | | | - | | | | - | | | | - | |
| Financial assets investments | | | 6,442,136 | | | | 2,728,128 | | | | 1,705,487 | | | | 2,857,886 | |
| Loans and advances to customers | | | 43,217,081 | | | | 44,561,415 | | | | 18,364,413 | | | | 28,411,133 | |
| Derivative financial instruments | | | 2,492,929 | | | | 380,434 | | | | 73,606 | | | | 129,944 | |
| Total Assets | | | 65,662,084 | | | | 47,669,977 | | | | 20,143,506 | | | | 31,398,963 | |
| o | Contractual maturities of financial liabilities |
The tables below set out the remaining contractual maturities of the Group’s financial liabilities
| | | December 31, 2015 | |
| Liabilities | | 0 - 1 Year | | | 1- 3 Years | | | 3- 5 Years | | | More than 5 Years | |
| | | In millions of COP | |
| Demand deposit from customers | | | 73,088,239 | | | | - | | | | - | | | | - | |
| Time deposits from customers | | | 36,834,046 | | | | 10,102,847 | | | | 3,800,463 | | | | 3,009,904 | |
| Interbank deposits - Repurchase agreements | | | 1,660,910 | | | | - | | | | - | | | | - | |
| Borrowings from other financial institutions | | | 14,087,425 | | | | 4,587,870 | | | | 1,680,978 | | | | 1,646,747 | |
| Debt securities in issue | | | 2,907,077 | | | | 3,687,330 | | | | 7,456,174 | | | | 13,118,661 | |
| Derivative financial instruments | | | 2,072,756 | | | | 318,171 | | | | 110,677 | | | | 538,326 | |
| Total Liabilities | | | 130,650,453 | | | | 18,696,218 | | | | 13,048,292 | | | | 18,313,638 | |
| | | December 31, 2014 | |
| | | Liabilities | | | 1- 3 Years | | | 3- 5 Years | | | More than 5 Years | |
| | | In millions of COP | |
| Demand deposit from customers | | | 58,664,223 | | | | - | | | | - | | | | - | |
| Time deposits from customers | | | 27,825,295 | | | | 7,921,088 | | | | 2,362,990 | | | | 2,318,948 | |
| Interbank deposits - Repurchase agreements | | | 2,290,519 | | | | - | | | | - | | | | - | |
| Borrowings from other financial institutions | | | 8,531,192 | | | | 4,688,423 | | | | 1,431,325 | | | | 878,216 | |
| Debt securities in issue | | | 1,950,950 | | | | 5,679,883 | | | | 2,557,218 | | | | 13,044,729 | |
| Derivative financial instruments | | | 2,349,996 | | | | 163,176 | | | | 103,759 | | | | 123,894 | |
| Total Liabilities | | | 101,612,175 | | | | 18,452,568 | | | | 6,455,290 | | | | 16,365,787 | |
The expected cash flows for some assets and liabilities vary significantly in their contractual maturity. The main differences are the following:
| · | The demand deposits seen historically have maintained a tendency to remain stable and to increase. |
| · | The mortgages loans, in spite of having contractual maturity between 15 and 20 years, its average life that is less than these terms. |
The tables below set out the remaining contractual maturities of the Group’s financial guarantees
| | | December 31, 2015 | |
| | | 0 - 1 YEAR | | | 1- 3 YEARS | | | 3- 5 YEARS | | | MORE THAN 5
YEARS | |
| | | In millions of COP | |
| Financial guarantees | | | 4,804,027 | | | | 1,430,371 | | | | 548,991 | | | | 340,132 | |
| | | December 31, 2014 | |
| | | 0 - 1 YEAR | | | 1- 3 YEARS | | | 3- 5 YEARS | | | MORE THAN 5
YEARS | |
| | | In millions of COP | |
| Financial guarantees | | | 4,573,432 | | | | 1,758,352 | | | | 395,728 | | | | 514,756 | |
One of the main guidelines of the Bank is to maintain a solid liquidity position, therefore, the ALCO Committee has established a minimum level of liquid assets, based on the funding needs of each subsidiary, to ensure, as far as possible, that the Bank will always have sufficient liquidity to meet its liabilities when they are due, under both normal and stressed conditions, without incurring unacceptable losses or risking damage to the Bank’s reputation.
The following table shows the liquid assets held by The Bank:
| Liquid Assets | | December 31, 2015 | | | December 31, 2014 | |
| | | In millions of COP | |
| High quality liquid assets | | | | | | | | |
| Cash | | | 13,594,073 | | | | 11,243,495 | |
| High quality liquid securities(1) | | | 8,901,316 | | | | 6,837,000 | |
| Other Liquid Assets | | | | | | | | |
| Other securities | �� | | 2,800,345 | | | | 1,531,303 | |
| Total Liquid Assets | | | 25,295,734 | | | | 19,611,798 | |
| (1) | Feature possesses the high liquidity available in all cases, and those liquid assets received by the Central Bank for its operations expansion and monetary contraction. Liquid assets are adjusted for market liquidity. |
The Board of Directors is the maximum organ in capital management, responsible for determining the capital required to withstand the risks of the Bank and define the guidelines for the capital allocation models of the organizations of The Bank, for which it has the support of the Risk Committee.
Aware of the importance of optimizing capital, creating value for the shareholder and maintaining an adequate level of solvency, The Bank has developed a framework of principles and methodologies that allow us to evaluate the risk-return relationship in decision-making. The VAS model (Value Aggregate System) is the system we have adopted that includes risk evaluation, its relation to profit, makes determining prices easier and is the basis for variable remuneration.
The prudent and well-balanced policy for the allocation of capital adopted by The Bank to evaluate risk is designed mainly to cover unexpected losses that could arise from the risks to which it is exposed.
Also, the zone of Risk Appetite was defined for the eight most relevant indicators for the monitoring of risks. In addition, the Appetite Consumption indicator was constructed, which shows the relative measurement between the risk profile of the organization in a determined month and the maximum appetite in all of the indicators.
Finally, there were advances in the initial definition to disaggregate the limits of Risk Appetite: for credit risk by banks and markets, for market and liquidity risk by companies and for operational risk by country.