UNITED STATES
SECURITIES AND EXCHANGE COMMISSION
WASHINGTON, D.C. 20549
FORM 20-F
¨ | REGISTRATION STATEMENT PURSUANT TO SECTION 12(b) OR (g) | |
| OF THE SECURITIES EXCHANGE ACT OF 1934 | |
| OR | |
x | ANNUAL REPORT PURSUANT TO SECTION 13 OR 15(d) | |
| OF THE SECURITIES EXCHANGE ACT OF 1934 | |
| For the fiscal year ended December 31, 2012 | |
| OR | |
¨ | TRANSITION REPORT PURSUANT TO SECTION 13 OR 15(d) OF THE | |
| SECURITIES EXCHANGE ACT OF 1934 | |
| OR | |
¨ | SHELL COMPANY REPORT PURSUANT TO SECTION 13 OR 15(d) | |
| OF THE SECURITIES EXCHANGE ACT OF 1934 | |
¨ REGISTRATION STATEMENT PURSUANT TO SECTION 12(b) OR (g)
OF THE SECURITIES EXCHANGE ACT OF 1934
OR
x ANNUAL REPORT PURSUANT TO SECTION 13 OR 15(d)
OF THE SECURITIES EXCHANGE ACT OF 1934
For the fiscal year ended December 31, 2015
OR
¨ TRANSITION REPORT PURSUANT TO SECTION 13 OR 15(d) OF THE
SECURITIES EXCHANGE ACT OF 1934
OR
¨ SHELL COMPANY REPORT PURSUANT TO SECTION 13 OR 15(d)
OF THE SECURITIES EXCHANGE ACT OF 1934
Date of event requiring this shell company report
For the transition period from to
Commission file number 001-14370
COMPAÑÍA DE MINAS BUENAVENTURA S.A.A.
(Exact name of Registrant as specified in its charter)
BUENAVENTURA MINING COMPANY INC.
(Translation of Registrant’s name into English)
REPUBLIC OF PERU
(Jurisdiction of incorporation or organization)
CARLOS VILLARAN 790
SANTA CATALINA, LA VICTORIA,LAS BEGONIAS 415 FLOOR 19,
SAN ISIDRO, LIMA 13,27, PERU
(Address of principal executive offices)
Carlos E. Gálvez, Vice President and Chief Financial Officer
Telephone: (511) 419-2540
Facsimile: (511) 471-7349
419-2502
Address: Carlos Villarán 790, Santa Catalina, La Victoria, Lima 13, PerúLAS BEGONIAS 415 FLOOR 19,
SAN ISIDRO, LIMA 27, PERU
(Name, telephone, e-mail and/or facsimile number and address of company contact person)
Securities registered or to be registered pursuant to Section 12(b) of the Act:
| Title of each class | | Name of each exchange on which registered |
Common shares, nominal (par) value of ten Peruvian Nuevos Soles per share (Common Shares)(“Common Shares”)
| | New York Stock Exchange Inc.*
Lima Stock Exchange |
| | |
American Depositary Shares (ADSs)(“ADSs”) representing one Common Share each | | New York Stock Exchange Inc.٭ Lima Stock Exchange
New York Stock Exchange Inc.
|
*Not for trading but only in connection with the registration of ADSs pursuant to the requirements of the Securities and Exchange Commission.
Securities registered or to be registered pursuant to Section 12(g) of the Act: None
Securities for which there is a reporting obligation pursuant to Section 15(d) of the Act: None
Indicate the number of outstanding shares of each of the issuer’s classes of capital or common stock as of the close of the period covered by the annual report.
| Common Shares nominal (par) value of S/.10.00 per share | 274,889,924* |
| | | 274,889,924 | * |
Investment sharesShares nominal (par) value of S/.10.00 per share | | | 744,640 | |
Indicate by check mark if the registrant is a well-known seasoned issuer, as defined in Rule 405 of the Securities Act.
Yesx No¨
If this report is an annual or transition report, indicate by check mark if the registrant is not required to file reports pursuant to Section 13 or 15(d) of the Securities Exchange Act of 1934.
Yes¨Nox
Indicate by check mark whether the registrant (1) has filed all reports required to be filed by Section 13 or 15(d) of the Securities Exchange Act of 1934 during the preceding 12 months (or for such shorter period that the registrant was required to file such reports), and (2) has been subject to such filing requirements for the past 90 days.
Yesx No¨
*Not for trading but only in connection with the registration of ADSs pursuant to the requirements of the Securities and Exchange Commission.
Indicate by check mark whether the registrant has submitted electronically and posted on its corporate Web site, if any, every Interactive Data File required to be submitted and posted pursuant to Rule 405 of Regulation S-T (§232.405 of this chapter) during the preceding 12 months (or for such shorter period that the registrant was required to submit and post such files).
Yes¨ No¨
Indicate by check mark whether the registrant is a large accelerated filer, an accelerated filer, or a non-accelerated filer. See definition of “accelerated filer and large accelerated filer” in Rule 12b-2 of the Exchange Act.
Large accelerated filerx Accelerated filer¨ Non-accelerated filer¨
Indicate by check mark which basis of accounting the registrant has used to prepare the financial statements included in this filing:
U.S. GAAP ¨ | International Financial Reporting Standards as issued by the International Accounting Standards Boardx | Other¨ |
U.S. GAAP¨ International Financial Reporting Standards as issued by Other¨
the International Accounting Standards Boardx
If “Other” has been checked in response to the previous question, indicate by check mark which financial statement item the registrant has elected to follow.
Item 17¨ Item 18¨
If this is an annual report, indicate by check mark whether the registrant is a shell company (as defined in Rule 12b-2 of the Exchange Act).
Yes¨ Nox
TABLE OF CONTENTS
INTRODUCTION
Presentation of Financial Information
As used in this Annual Report on Form 20-F, or Annual“Annual Report,” unless the context otherwise requires, references to “we,” “us,” “our,” “Company,” “BVN” and “Buenaventura” mean Compañía de Minas Buenaventura S.A.A. and its consolidated subsidiaries. Unless otherwise specified or the context otherwise requires, references to “$,” “US$,” “Dollars” and “U.S. Dollars” are to United States Dollars, and references to “S/.,” “Nuevo Sol”“Sol” or “Nuevos Soles”“Soles” are to Peruvian Nuevos Soles, the legal currency of the Republic of Peru, or Peru.“Peru.”
Unless otherwise specified, references to a value denominated in “t” or “tons” refers to tons; references to a value denominated “DST” refers to dry short tons; the terms “g” or “gr” refer to metric grams; the terms “oz.” or “ounces” refer to troy ounces of a fineness of 999.9 parts per 1,000, equal to 31.1035 grams.
Until December 31, 2010, we presented our consolidated financial statements, which we refer to as our Financial Statements, in conformity with accounting principles generally accepted in Peru, or Peruvian“Peruvian GAAP.” Effective January 1, 2011, we changed the accounting principles governing the presentation ofbegan presenting our consolidated financial statements from Peruvian GAAP toin accordance with International Financial Reporting Standards or IFRS,(“IFRS”), as issued by the International Accounting Standards Board or the IASB.(the “IASB”).
Pursuant to the rules of the United States Securities and Exchange Commission, or the SEC, this Annual Report includes certain separate financial statements and other financial information of Minera Yanacocha S.R.L., or Yanacocha,“Yanacocha,” and Sociedad Minera Cerro Verde S.A.A., or Cerro“Cerro Verde.” Yanacocha and Cerro Verde maintain their financial books and records in U.S. Dollars and present their financial statements in accordance with accounting principles generally accepted in the United States of America, or U.S. GAAP, and IFRS as issued by the IASB, respectively. See Note 9 to the Financial Statements.IASB.
We record our investments in Yanacocha and Cerro Verde in accordance with the equity method as described in “Item 5. Operating and Financial Review and Prospects—Buenaventura—General” and Note 2.3(e)2.4(f) to the Financial Statements. Our partnership interest in Yanacocha was calculated at 43.65 percent43.65% for the years ended December 31, 20112013, 2014 and 2012.2015. As of December 31, 20112013, 2014 and 2012,2015, our equity interest in Cerro Verde was 19.35 percent and 19.58 percent, respectively.19.58%.
Forward-Looking Statements
Certain statements contained in thisThis Annual Report arecontains “forward-looking statements” as defined in the U.S. Private Securities Litigation Reform Act of 1995 and are intended to be covered by the safe harbor provided for under these sections. Our forward-looking statements are based on management’s assumptions and beliefs in light of the information currently available to it and may include, without limitation:
| · | our, Yanacocha’s and Cerro Verde’s costs and expenses; |
| · | estimates of future costs applicable to sales; |
| · | estimates of future exploration and production results; |
| · | plans for capital expenditures; |
| · | expected commencement dates of mining or metal production operations; and |
| · | estimates regarding potential cost savings and operating performance. |
The words “anticipate,” “may,” “can,” “plan,” “believe,” “estimate,” “expect,” “project,” “intend,” “likely,” “will,” “should,” “to be” and any similar expressions are intended to identify those assertions as forward-looking statements. In making any forward-looking statements, we believe that the expectations are based on reasonable assumptions. We caution readers that those statements are not guarantees of future performance and our actual results may differ materially from those anticipated, projected or assumed in the forward-looking statements. Important factors that can cause our actual results to differ materially from those anticipated in the forward-looking statements include:
| · | our, Yanacocha’s and Cerro Verde’s results of exploration; |
| · | the results of our joint ventures and our share of the production of, and the income received from, such joint ventures; |
| · | geological and metallurgical assumptions; |
| · | timing of receipt of necessary governmental permits or approvals; |
| · | inaccurate estimates of reserves orMineralized Material Not in Reserve;Reserve; |
| · | anti-mining protests or other potential issues with local community relationships; |
| · | environmental risks; and |
| · | other factors described in more detail under “Item 3. Key Information—Information — D. Risk Factors.” |
Many of the assumptions on which our forward-looking statements are based are likely to change after our forward-looking statements are made, including, for example, commodity prices, which we cannot control, and our, Yanacocha’s and Cerro Verde’s production volumes and costs, some aspects of which we may or may not be able to control. Further, we may make changes to our business plans that could or will affect our results. We do not intend to update our forward-looking statements, notwithstanding any changes in our assumptions, changes in our business plans, our actual experience or other changes, and we undertake no obligation to update any forward-looking statements more frequently than required by applicable securities laws.
PART I
ITEM 1. Identity of Directors, Senior Management and Advisers
| ITEM 1. | Identity of Directors, Senior Management and Advisers |
Not applicable.
ITEM 2. Offer Statistics and Expected Timetable
| ITEM 2. | Offer Statistics and Expected Timetable |
Not applicable.
ITEM 3. Key Information
| A. | Selected Financial Data |
A. Selected Financial Data
Selected Financial Information and Operating Data
The followingThis information should be read in conjunction with, and is qualified in its entirety by reference to, the Financial Statements, including the notes thereto appearing elsewhere in this Annual Report. The selected financial information as of December 31, 20112014 and 2012,2015 and for the years ended December 31, 2010, 20112013, 2014 and 2012,2015, is derived from the consolidated statementstatements of financial position, consolidated statements of incomeprofit or loss and statementconsolidated statements of other comprehensive income, respectively, included in the Financial Statements appearing elsewhere in this Annual Report. The selected financial information as of December 31, 2011 and 2012, and for the years ended December 31, 2011 and 2012 has been derived from a consolidated statement of financial position, consolidated statements of profit or loss and consolidated statements of other comprehensive income, respectively, which are not included in this Annual Report. The report of Medina,Paredes, Zaldívar, ParedesBurga & Asociados S. Civil de R.L. (a member firm of Ernst & Young Global) on our 2010, 20112013, 2014 and 20122015 Financial Statements appears elsewhere in this Annual Report.Our 2010, 2011Report. Our 2013, 2014 and 20122015 Financial Statements are prepared and presented in accordance with IFRS as issued by the IASB, which differs in certain respects from U.S. GAAP. For periods up to and including the year ended December 31, 2010, we prepared our financial statements in accordance with Peruvian GAAP. Our consolidated financial statements for the year ended December 31, 2011 were the first that we prepared in accordance with IFRS as issued by the IASB. The operating data presented below are derived from our records and has not been subject to audit. The financial information and operating data presented below should be read in conjunction with “Item 5. Operating and Financial Review and Prospects—Buenaventura,” the Financial Statements and the related notes thereto and other financial information included in this Annual Report.
| | | As of and for the year ended December 31, | |
| | | 2010 | | | 2011 | | | 2012 | |
| | | (In thousands of US$)(1) | |
| Income statement data: | | | | | | | | | | | | |
| IFRS(2) | | | | | | | | | | | | |
| Net sales | | | 1,047,885 | | | | 1,493,882 | | | | 1,496,349 | |
| Royalty income | | | 55,883 | | | | 62,742 | | | | 67,178 | |
| Total income | | | 1,103,768 | | | | 1,556,624 | | | | 1,563,527 | |
| | | | | | | | | | | | | |
| Operating costs: | | | | | | | | | | | | |
| Cost of sales, without considering depreciation and amortization | | | (347,129 | ) | | | (446,163 | ) | | | (629,492 | ) |
| Exploration in units in operation | | | (91,441 | ) | | | (109,355 | ) | | | (153,018 | ) |
| Depreciation and amortization | | | (74,864 | ) | | | (96,381 | ) | | | (123,043 | ) |
| Royalties | | | (52,270 | ) | | | (60,262 | ) | | | (37,667 | ) |
| Total operating costs | | | (565,704 | ) | | | (712,161 | ) | | | (943,220 | ) |
| Gross income | | | 538,064 | | | | 844,463 | | | | 620,307 | |
| | | | | | | | | | | | | |
| Operating expenses: | | | | | | | | | | | | |
| Administrative expenses | | | (107,237 | ) | | | (75,170 | ) | | | (99,295 | ) |
| Exploration in non-operating areas | | | (36,105 | ) | | | (49,593 | ) | | | (95,491 | ) |
| Selling expenses | | | (9,375 | ) | | | (11,617 | ) | | | (18,090 | ) |
| Reversal (provision) for impairment of long-lived assets | | | 13,135 | | | | - | | | | (3,617 | ) |
| Excess of workers’ profit sharing | | | - | | | | (6,221 | ) | | | (2,164 | ) |
| Reimbursement of exploration expenses on projects | | | 15,013 | | | | - | | | | - | |
| | | | | | | | | | | | | |
| Other, net | | | 10,653 | | | | 2,513 | | | | 16,584 | |
| Total operating expenses | | | (113,916 | ) | | | (140,088 | ) | | | (202,073 | ) |
| Operating income | | | 424,148 | | | | 704,375 | | | | 418,234 | |
| | | | | | | | | | | | | |
| Other income (expenses), net: | | | | | | | | | | | | |
| Share in the results of associates under equity method | | | 428,885 | | | | 468,363 | | | | 464,239 | |
| Interest income | | | 8,203 | | | | 11,827 | | | | 9,486 | |
| Interest expense | | | (12,271 | ) | | | (11,823 | ) | | | (8,290 | ) |
| Net gain (loss) from currency exchange difference | | | (750 | ) | | | (675 | ) | | | 1,715 | |
| Total other income, net | | | 424,067 | | | | 467,692 | | | | 467,150 | |
| | | | | | | | | | | | | |
| Income before income tax | | | 848,215 | | | | 1,172,067 | | | | 885,384 | |
| Income tax | | | (123,326 | ) | | | (211,589 | ) | | | (142,594 | ) |
| Net income | | | 724,889 | | | | 960,478 | | | | 742,790 | |
| Net income attributable to non-controlling interest | | | 64,068 | | | | 101,551 | | | | 58,105 | |
| | | | | | | | | | | | | |
| Net income attributable to Buenaventura | | | 660,821 | | | | 858,927 | | | | 684,685 | |
| | | | | | | | | | | | | |
| Basic and diluted earnings per share(3)(4) | | | 2.60 | | | | 3.38 | | | | 2.69 | |
| | | | | | | | | | | | | |
| Basic and diluted earnings per ADS(3)(4) | | | 2.60 | | | | 3.38 | | | | 2.69 | |
| Dividends per share | | | 0.46 | | | | 0.56 | | | | 0.60 | |
| | | | | | | | | | | | | |
| Average number of shares outstanding | | | 254,442,328 | | | | 254,442,328 | | | | 254,232,571 | |
| | | | | | | | | | | | | |
| Statement of financial position data: | | | | | | | | | | | | |
| IFRS(2) | | | | | | | | | | | | |
| Total assets | | | 3,279,346 | | | | 3,953,549 | | | | 4,588,653 | |
| Financial obligations | | | 57,152 | | | | 106,114 | | | | 179,304 | |
| | | As of and for the year ended December 31, | |
| | | 2010 | | | 2011 | | | 2012 | |
| | | (In thousands of US$)(1) | |
| Capital stock | | | 750,540 | | | | 750,540 | | | | 750,540 | |
| Shareholders’ equity | | | 2,845,337 | | | | 3,440,479 | | | | 3,964,386 | |
| | | | | | | | | | | | | |
| Operating data (unaudited): | | | | | | | | | | | | |
| Production(5) | | | | | | | | | | | | |
| Gold (oz.) | | | 481,768 | | | | 524,101 | | | | 447,472 | |
| Silver (oz.) | | | 14,840,678 | | | | 16,724,717 | | | | 18,884,824 | |
| Proven and probable reserves(6) | | | | | | | | | | | | |
| Gold (oz.) | | | 1,772,000 | | | | 1,485,000 | | | | 1,385,000 | |
| Silver (oz.) | | | 152,161,000 | | | | 155,437,000 | | | | 154,606,000 | |
| | | As of and for the year ended December 31, | |
| | | 2015 | | | 2014 | | | 2013(6) | | | 2012(6) | | | 2011(6) | |
| | | (In thousands of US$)(1) | | | | |
| Statements of profit or loss data: | | | | | | | | | | | | | | | | | | | | |
| Continuing operations: | | | | | | | | | | | | | | | | | | | | |
| Operating income: | | | | | | | | | | | | | | | | | | | | |
| Net sales of goods | | | 864,962 | | | | 1,067,271 | | | | 1,135,836 | | | | 1,376,179 | | | | 1,314,070 | |
| Net sales of services | | | 54,488 | | | | 71,642 | | | | 79,585 | | | | 46,664 | | | | 42,023 | |
| Royalty income | | | 32,414 | | | | 36,867 | | | | 44,185 | | | | 67,178 | | | | 62,742 | |
| Total operating income | | | 951,864 | | | | 1,175,780 | | | | 1,259,606 | | | | 1,490,021 | | | | 1,418,835 | |
| | | | | | | | | | | | | | | | | | | | | |
| Operating costs: | | | | | | | | | | | | | | | | | | | | |
| Cost of sales of goods, excluding depreciation and amortization | | | (537,713 | ) | | | (533,052 | ) | | | (513,165 | ) | | | (540,504 | ) | | | (365,831 | ) |
| Cost of services, excluding depreciation and amortization | | | (52,692 | ) | | | (81,487 | ) | | | (114,120 | ) | | | (30,739 | ) | | | (15,592 | ) |
| Exploration in operating units | | | (91,520 | ) | | | (97,852 | ) | | | (101,913 | ) | | | (103,215 | ) | | | (77,994 | ) |
| Depreciation and amortization | | | (242,465 | ) | | | (208,698 | ) | | | (159,140 | ) | | | (111,025 | ) | | | (71,392 | ) |
| Mining royalties | | | (27,407 | ) | | | (28,440 | ) | | | (30,402 | ) | | | (37,496 | ) | | | (58,546 | ) |
| Total operating costs | | | (951,797 | ) | | | (949,529 | ) | | | (918,740 | ) | | | (822,979 | ) | | | (589,355 | ) |
| Gross profit | | | 67 | | | | 226,251 | | | | 340,866 | | | | 667,042 | | | | 829,480 | |
| | | | | | | | | | | | | | | | | | | | | |
| Operating expenses: | | | | | | | | | | | | | | | | | | | | |
| Administrative expenses | | | (86,532 | ) | | | (101,102 | ) | | | (75,118 | ) | | | (94,118 | ) | | | (68,874 | ) |
| Exploration in non-operating areas | | | (30,610 | ) | | | (50,007 | ) | | | (32,805 | ) | | | (95,491 | ) | | | (49,568 | ) |
| Selling expenses | | | (19,481 | ) | | | (16,605 | ) | | | (14,842 | ) | | | (15,491 | ) | | | (8,214 | ) |
| Excess of workers’ profit sharing | | | - | | | | - | | | | (704 | ) | | | (2,164 | ) | | | (6,221 | ) |
| Impairment loss of long-lived assets | | | (11,255 | ) | | | - | | | | - | | | | - | | | | - | |
| Other, net | | | 209 | | | | 3,059 | | | | (2,154 | ) | | | 19,172 | | | | 4,523 | |
| Total operating expenses | | | (147,669 | ) | | | (164,655 | ) | | | (125,623 | ) | | | (188,092 | ) | | | (128,354 | ) |
| Operating profit (loss) | | | (147,602 | ) | | | 61,596 | | | | 215,243 | | | | 478,950 | | | | 701,126 | |
| | | | | | | | | | | | | | | | | | | | | |
| Other income (expenses), net: | | | | | | | | | | | | | | | | | | | | |
| Share in the results of associates under equity method | | | (173,375 | ) | | | (74,600 | ) | | | (114,145 | ) | | | 478,987 | | | | 496,769 | |
| Finance costs | | | (27,622 | ) | | | (11,318 | ) | | | (9,896 | ) | | | (8,290 | ) | | | (11,823 | ) |
| Net gain (loss) from currency exchange difference | | | (13,683 | ) | | | (8,452 | ) | | | (7,192 | ) | | | 1,855 | | | | (614 | ) |
| Gain on business combination | | | - | | | | 59,852 | | | | - | | | | - | | | | - | |
| | | As of and for the year ended December 31, | |
| | | 2015 | | | 2014 | | | 2013(6) | | | 2012(6) | | | 2011(6) | |
| | | (In thousands of US$)(1) | | | | |
| Finance income | | | 11,026 | | | | 8,408 | | | | 6,621 | | | | 9,486 | | | | 11,827 | |
| Total other income (expenses), net | | | (203,654 | ) | | | (26,110 | ) | | | (124,612 | ) | | | 482,038 | | | | 496,159 | |
| | | | | | | | | | | | | | | | | | | | | |
| Profit (loss) before income tax | | | (351,256 | ) | | | 35,486 | | | | 90,631 | | | | 960,988 | | | | 1,197,285 | |
| Current income tax | | | (14,225 | ) | | | (19,006 | ) | | | (57,328 | ) | | | (130,507 | ) | | | (168,191 | ) |
| Deferred income tax | | | (541 | ) | | | (47,006 | ) | | | (29,154 | ) | | | (12,451 | ) | | | (42,369 | ) |
| Profit (loss) from continuing operations | | | (366,022 | ) | | | (30,526 | ) | | | 4,149 | | | | 818,030 | | | | 986,725 | |
| Discontinued operations: | | | | | | | | | | | | | | | | | | | | |
| Profit (loss) from discontinued operations(7) | | | (9,523 | ) | | | (31,114 | ) | | | (83,885 | ) | | | (57,510 | ) | | | 2,159 | |
| Net profit (loss) | | | (375,545 | ) | | | (61,640 | ) | | | (79,736 | ) | | | 760,520 | | | | 988,884 | |
| Attributable to equity owners of the parent | | | (317,210 | ) | | | (76,065 | ) | | | (107,257 | ) | | | 701,100 | | | | 887,333 | |
| Attributable to non-controlling interest | | | (58,335 | ) | | | 14,425 | | | | 27,521 | | | | 59,420 | | | | 101,551 | |
| Net profit (loss) | | | (375,545 | ) | | | (61,640 | ) | | | (79,736 | ) | | | 760,520 | | | | 988,884 | |
| Basic and diluted profit (loss) per share attributable to equity holders of the parent(2)(3) | | | (1.25 | ) | | | (0.30 | ) | | | (0.42 | ) | | | 2.76 | | | | 3.49 | |
| Basic and diluted profit (loss) per ADS attributable to equity holders of the parent (2)(3) | | | (1.25 | ) | | | (0.30 | ) | | | (0.42 | ) | | | 2.76 | | | | 3.49 | |
| Basic and diluted profit (loss) per share attributable to equity holders of the parent, from continuing operations | | | (1.21 | ) | | | (0.18 | ) | | | (0.09 | ) | | | 2.98 | | | | 3.48 | |
| Dividends per share | | | - | | | | 0.03 | | | | 0.31 | | | | 0.60 | | | | 0.56 | |
| Average number of common and investment shares outstanding | | | 254,186,867 | | | | 254,186,867 | | | | 254,186,867 | | | | 254,232,571 | | | | 254,442,328 | |
| Statement of financial position data: | | | | | | | | | | | | | | | | | | | | |
| | | | | | | | | | | | | | | | | | | | | |
| Total assets | | | 4,547,181 | | | | 4,672,274 | | | | 4,552,267 | | | | 4,622,447 | | | | 3,969,613 | |
| Financial obligations | | | 353,710 | | | | 383,305 | | | | 234,397 | | | | 179,304 | | | | 106,114 | |
| Capital stock | | | 750,497 | | | | 750,497 | | | | 750,497 | | | | 750,540 | | | | 750,540 | |
| Total shareholders’ equity | | | 3,389,236 | | | | 3,762,125 | | | | 3,824,421 | | | | 4,011,879 | | | | 3,470,242 | |
| | | | | | | | | | | | | | | | | | | | | |
| Operating data (unaudited): | | | | | | | | | | | | | | | | | | | | |
| | | | | | | | | | | | | | | | | | | | | |
| Production(4) | | | | | | | | | | | | | | | | | | | | |
| Gold (oz.) | | | 371,344 | | | | 438,426 | | | | 462,856 | | | | 447,472 | | | | 524,101 | |
| Silver (oz.) | | | 23,228,392 | | | | 20,119,162 | | | | 19,193,075 | | | | 18,884,824 | | | | 16,724,717 | |
| Proven and probable reserves(5) | | | | | | | | | | | | | | | | | | | | |
| Gold (oz.) | | | 1,718,455 | | | | 1,119,000 | | | | 1,036,000 | | | | 1,385,000 | | | | 1,485,000 | |
| Silver (oz.) | | | 158,608,375 | | | | 139,699,000 | | | | 136,464,000 | | | | 154,606,000 | | | | 155,437,000 | |
| (1) | Except per share, per ADS, outstanding shares and operating data. |
| (2) | Effective January 1, 2011, we changed the accounting principles governing our presentation of our consolidated financial statements from Peruvian GAAP to IFRS. Acccordingly, our financial information for the year ended December 31, 2010 has been presented in accordance with IFRS. |
| (3) | IncomeProfit (loss) per share has been calculated for each year as net incomeprofit (loss) divided by average number of shares outstanding during the year. As of MarchDecember 31, 2010, 20112014 and 2012,2015, we had 274,889,924 outstanding Common Shares outstanding, including 21,130,26021,174,734 treasury shares.shares as of December 31, 2014 and 2015. As of MarchDecember 31, 2010, 2011, 2012, 2013, 2014 and 2012,2015, we had 744,640 outstandingof Investment Shares outstanding, including 61,976 treasury shares as of MarchDecember 31, 2010 and 2011, and 231,733 treasury shares as of MarchDecember 31, 2012.2012, 272,963 treasury shares as of December 31, 2013, 2014 and 2015. |
| (4)(3) | We have no outstanding options, warrants or convertible securities that would have a dilutive effect on earnings per share. As a result, there is no difference between basic and diluted earnings per share or ADS. |
| (5)(4) | The amounts in this table reflect the total production of all of our consolidated subsidiaries, including Sociedad Minera El Brocal S.A.A., or El“El Brocal,” in which we owned a 53.76%54.07% controlling equity interest, and Minera La Zanja S.R.L., or La“La Zanja,” in which we owned a 53.06% controlling equity interest, in each case as of December 31, 2012.2015. The production data in this table reflect 100% of El Brocal’s and La Zanja’s production. For the years ended December 31, 2010, 2011 and 2012 to 2015, El Brocal produced 3.1 million, 2.0 million, 2.5 million 2.9 million and 2.83.7 million ounces of silver, respectively, of which our equity share was 1.21.7 million, 1.61.1 million, 1.4 million and 1.42.0 million ounces of silver, and La Zanja produced 43,727, 134,190112,387, 137,395, 143,573 and 112,387141,071 ounces of gold, respectively, of which our equity share was 23,201, 71,20159,633, 72,902, 76,180 and 59,63374,852 ounces of gold, and 38,155, 363,927387,877, 391,832, 422,395 and 387,877331,080 ounces of silver, respectively, of which our equity share was 20,245, 193,100205,808, 207,906, 224,123 and 205,808175,671 ounces of silver. |
| (6)(5) | The amounts in this table reflect the reserves of all of our consolidated subsidiaries, including El Brocal, in which we owned a 54.07% controlling equity interest, and La Zanja, in which we owned a 53.06% controlling equity interest, in each case as of December 31, 2015. The conceptual framework used to estimate proven and probable reserves for our wholly-owned mines as of December 31, 20102012 and 20112013 were reviewed by an independent consultant Algon Investment S.R.L. Algon Investment S.R.L. is in the process of reviewing the framework used to estimate proven and probable reserves for our wholly-owned minesGeomineria S.A.C. as of December 31, 2012.2014 and 2015. The conceptual framework used to estimate proven and probable reserves for El Brocal’s mines as of December 31, 20102012, 2013 and 20112014 were reviewed by an independent consultants, AMEC plc and MINTEC Inc., respectively. MINTEC Inc.consultant, which is also in the process of reviewing the conceptual framework used to estimate proven and probable reserves for El Brocal’s mines as of December 31, 2012. 2015. |
| (6) | IFRIC 20 “Stripping Costs in Production Phase of a Surface Mine” became effective January 1, 2013. Our results for the year 2012 and 2011 include adjustments in connection with the application of IFRIC 20 “Stripping Costs in the Production Phase of a Surface Mine.” |
| (7) | In 2014, we publicly announced our decision to dispose of our four non-operational mining units (Poracota, Recuperada, Antapite and Shila-Paula); as a consequence, they are presented as mining units held for sale in accordance with IFRS 5 “Non-current Assets Held for Sale and Discontinued Operations.” See Note 1(e) to the Financial Statements. For comparative purposes, we modified figures for 2010, 2011, 2012 and 2013 which were previously reported in our Form 20-F for the year ended December 31, 2013. |
Yanacocha Selected Financial Information and Operating Data
The following table presents selected financial information and operating data for Yanacocha at the dates and for each of the periods indicated. This information should be read in conjunction with, and is qualified in its entirety by reference to, Yanacocha’s audited consolidated financial statements as of December 31, 20112014 and 20122015 and for the years ended December 31, 2010, 20112013, 2014 and 2012,2015, or the Yanacocha“Yanacocha Financial Statements.” The report of Dongo-Soria Gaveglio yParedes, Zaldívar, Burga & Asociados S. Civil de R.L. (a member firm of Ernst & Young Global) on the Yanacocha 2015 Financial Statements appears elsewhere in this Annual Report. The 2014 and 2013 Annual Reports were audited by Gaveglio, Aparicio y Asociados Sociedad Civil de Responsabilidad Limitada, a member firm of PricewaterhouseCoopers Limited. The selected financial information as of December 31, 2008, 2009 and 2010 and for the yearsyear ended December 31, 2008 and 20092012 has been derived from balance sheets andYanacocha’s financial statements of income, respectively, whichthat are not included in this Annual Report. The Yanacocha Financial Statements are prepared and presented in accordance with U.S. GAAP,IFRS as issued by the IASB, which differdiffers in certain respects from IFRS. SeeU.S. GAAP, as indicated in Note 9(e.1)25 to the Yanacocha Financial Statements for a reconciliation to U.S. GAAP of net income and shareholders’ equity as of and for the years ended December 31, 2010, 2011 and 2012.Statements. The operating data presented below, which are based on 100 percent100% of Yanacocha’s production and reserves, are derived from Yanacocha’s records and have not been subject to audit. The financial information presented below should be read in conjunction with “Item 5. Operating and Financial Review and Prospects-Yanacocha,Prospects –Yanacocha,” the Yanacocha Financial Statements and the related notes thereto and other financial information included in this Annual Report.
| | | As of and for the year ended December 31, | |
| | | 2008 | | | 2009 | | | 2010 | | | 2011 | | | 2012 | |
| | | (In thousands of US$)(1) | |
| | | | | | | | | | | | | | | | |
| Income statement data: | | | | | | | | | | | | | | | | | | | | |
| U.S. GAAP | | | | | | | | | | | | | | | | | | | | |
| | | | | | | | | | | | | | | | | | | | | |
| Revenues | | | 1,612,618 | | | | 2,013,228 | | | | 1,778,260 | | | | 2,002,602 | | | | 2,201,815 | |
| | | | | | | | | | | | | | | | | | | | | |
| Costs and expenses: | | | | | | | | | | | | | | | | | | | | |
| Costs applicable to sales | | | (659,867 | ) | | | (671,055 | ) | | | (655,007 | ) | | | (738,336 | ) | | | (694,146 | ) |
| Depreciation, depletion and amortization | | | (169,131 | ) | | | (166,053 | ) | | | (160,424 | ) | | | (231,520 | ) | | | (252,900 | ) |
| Reclamation and remediation | | | (11,174 | ) | | | (13,016 | ) | | | (14,632 | ) | | | (19,135 | ) | | | (20,090 | ) |
| Exploration costs | | | (28,151 | ) | | | (22,968 | ) | | | (34,549 | ) | | | (66,272 | ) | | | (121,724 | ) |
| Write-down of long-lived assets | | | (442 | ) | | | (2,923 | ) | | | (312 | ) | | | (1,864 | ) | | | (17,577 | ) |
| General and administrative costs | | | (3,168 | ) | | | (3,602 | ) | | | (3,824 | ) | | | (1,281 | ) | | | (3,021 | ) |
| Other expenses | | | (71,808 | ) | | | (70,530 | ) | | | (54,208 | ) | | | (39,193 | ) | | | (109,974 | ) |
| Total operating expenses | | | (943,741 | ) | | | (950,147 | ) | | | (922,956 | ) | | | (1,097,601 | ) | | | (1,219,432 | ) |
| Operating income | | | 668,877 | | | | 1,063,081 | | | | 855,304 | | | | 905,001 | | | | 982,383 | |
| Interest expense and other | | | 3,642 | | | | (712 | ) | | | 4,263 | | | | 30,424 | | | | 6,014 | |
| Pre-tax income | | | 672,519 | | | | 1,062,369 | | | | 859,567 | | | | 935,425 | | | | 988,397 | |
| Income tax provision | | | (196,057 | ) | | | (335,293 | ) | | | (269,673 | ) | | | (293,038 | ) | | | (361,857 | ) |
| Net income before cumulative effect of change in accounting principles | | | 476,462 | | | | 727,076 | | | | 589,894 | | | | 642,387 | | | | 626,540 | |
| Cumulative effect of change in accounting principle, net | | | - | | | | - | | | | - | | | | - | | | | - | |
| Net income and comprehensive income | | | 476,462 | | | | 727,076 | | | | 589,894 | | | | 642,387 | | | | 626,540 | |
| | | | | | | | | | | | | | | | | | | | | |
| Statement of financial position data: | | | | | | | | | | | | | | | | | | | | |
| U.S. GAAP | | | | | | | | | | | | | | | | | | | | |
| Total assets | | | 1,891,963 | | | | 2,466,500 | | | | 2,936,994 | | | | 3,787,234 | | | | 4,451,535 | |
| Total debt | | | 205,618 | | | | 178,336 | | | | 1,959 | | | | - | | | | - | |
| Partners’ equity | | | 1,212,787 | | | | 1,711,102 | | | | 2,302,145 | | | | 2,943,021 | | | | 3,570,690 | |
| Operating data (unaudited): | | | | | | | | | | | | | | | | | | | | |
| Gold produced (oz.) | | | 1,810,338 | | | | 2,058,180 | | | | 1,461,620 | | | | 1,293,123 | | | | 1,345,992 | |
| Gold proven and probable reserves (thousands of oz.) | | | 24,850 | | | | 22,362 | | | | 21,538 | | | | 20,295 | | | | 18,500 | |
| | | As of and for the year ended December 31, | |
| | | 2015 | | | 2014 | | | 2013 | | | 2012 | |
| | | (In thousands of US$)(1) | |
| Statement of comprehensive income: | | | | | | | | | | | | | | | | |
| Operating income: | | | | | | | | | | | | | | | | |
| Revenue from sales (2) | | | 1,031,174 | | | | 1,165,299 | | | | 1,406,825 | | | | 2,146,641 | |
| Other operating income | | | 10,625 | | | | 30,300 | | | | 37,207 | | | | 22,861 | |
| Total gross income | | | 1,041,799 | | | | 1,195,599 | | | | 1,444,032 | | | | 2,169,502 | |
| | | | | | | | | | | | | | | | | |
| Costs applicable to sales | | | (751,736 | ) | | | (920,300 | ) | | | (991,264 | ) | | | (832,116 | ) |
| Other operating costs | | | (2,524 | ) | | | (22,422 | ) | | | (28,672 | ) | | | (22,069 | ) |
| Total operating costs | | | (754,260 | ) | | | (942,722 | ) | | | (1,019,936 | ) | | | (854,185 | ) |
| Gross profit | | | 287,539 | | | | 252,877 | | | | 424,096 | | | | 1,315,317 | |
| | | | | | | | | | | | | | | | | |
| Operating expenses: | | | | | | | | | | | | | | | | |
| | | | | | | | | | | | | | | | | |
| Operating expenses, net | | | (82,846 | ) | | | (77,781 | ) | | | (77,534 | ) | | | (192,869 | ) |
| Administrative expenses | | | (26,325 | ) | | | (38,262 | ) | | | (67,064 | ) | | | (70,916 | ) |
| Selling Expenses | | | (3,534 | ) | | | (4,458 | ) | | | (3,740 | ) | | | (4,498 | ) |
| Impairment loss | | | ― | | | | (541,141 | ) | | | (1,038,548 | ) | | | ― | |
| Operating profit | | | 174,834 | | | | (408,765 | ) | | | (762,790 | ) | | | 1,047,034 | |
| | | | | | | | | | | | | | | | | |
| Other income (expense), net: | | | | | | | | | | | | | | | | |
| Finance income | | | 673 | | | | 298 | | | | 720 | | | | 1,019 | |
| Finance costs | | | (22,734 | ) | | | (23,504 | ) | | | (18,745 | ) | | | (13,135 | ) |
| Net gain (loss) from currency exchange difference | | | (251 | ) | | | 1,142 | | | | 2,065 | | | | (1,216 | ) |
| | | | (22,312 | ) | | | (22,064 | ) | | | (15,960 | ) | | | (13,332 | ) |
| | | | | | | | | | | | | | | | | |
| Income (loss) before income tax | | | 152,522 | | | | (430,829 | ) | | | (778,750 | ) | | | 1,033,702 | |
| Income tax benefit (expense) | | | (602,717 | ) | | | 30,491 | | | | 203,471 | | | | (385,827 | ) |
| Loss for the year | | | (450,195 | ) | | | (400,338 | ) | | | (575,279 | ) | | | 647,875 | |
| | | | | | | | | | | | | | | | | |
| Comprehensive income (loss): | | | | | | | | | | | | | | | | |
| Loss for the year | | | (450,195 | ) | | | (400,338 | ) | | | (575,279 | ) | | | 647,875 | |
| Other comprehensive income (loss) to be reclassified as profit or loss in subsequent periods | | | | | | | | | | | | | | | | |
| Changes in the fair value of available-for-sale financial asset, net of tax effect | | | (757 | ) | | | (65 | ) | | | (226 | ) | | | 1,129 | |
| | | | | | | | | | | | | | | | | |
| U.S. GAAP | | | | | | | | | | | | | | | | |
| Gold sales | | | 1,070,021 | | | | 1,210,457 | | | | 1,457,646 | 1 | | | 2,201,815 | |
| Net income (loss) | | | (252,159 | ) | | | (31,914 | ) | | | 140,997 | | | | 626,540 | |
| | | | | | | | | | | | | | | | | |
| Statement of financial position: | | | | | | | | | | | | | | | | |
| IFRS | | | | | | | | | | | | | | | | |
| Total assets | | | 2,965,430 | | | | 3,483,169 | | | | 3,754,692 | | | | 4,512,803 | |
| Total financial obligations | | | ― | | | | ― | | | | ― | | | | ― | |
| Issued capital | | | 398,216 | | | | 398,216 | | | | 398,216 | | | | 398,216 | |
| Total partners’ equity | | | 2,228,825 | | | | 2,679,777 | | | | 3,080,050 | | | | 3,655,555 | |
| | | | | | | | | | | | | | | | | |
| U.S. GAAP | | | | | | | | | | | | | | | | |
| Total assets | | | 4,209,818 | | | | 4,569,497 | | | | 4,511,964 | | | | 4,541,535 | |
| Total equity | | | 3,418,989 | | | | 3,671,148 | | | | 3,711,461 | | | | 3,570,690 | |
| | | | | | | | | | | | | | | | | |
| Operating data (unaudited) | | | | | | | | | | | | | | | | |
| Gold produced (oz.) | | | 917,691 | | | | 969,944 | | | | 1,017,259 | | | | 1,345,992 | |
| Gold proven and probable reserves (thousands of oz.) | | | 17,639 | | | | 17,436 | | | | 18,345 | | | | 18,500 | |
| (1) | Except operating data.data |
| (2) | Royalties netted to sales |
Cerro Verde Selected Financial Information and Operating Data
The following table presents selected financial information and operating data for Cerro Verde atas of the datesend of and for each of the periods indicated. This information should be read in conjunction with, and is qualified in its entirety by reference to, Cerro Verde’s audited financial statements as of December 31, 20112014 and 20122015 and for the years ended December 31, 2010, 20112013, 2014 and 2012,2015, or the Cerro“Cerro Verde Financial Statements.” The selected financial information as of and for the years ended December 31, 20102011 and 2012 has been derived from a balance sheetCerro Verde’s Financial Statements that isare not included in this Annual Report. The report of Medina,Paredes, Zaldívar, ParedesBurga & Asociados S. Civil de R.L. (a member firm of Ernst & Young Global) on Cerro Verde’s financial statements appears elsewhere in this Annual Report. The Cerro Verde Financial Statements are prepared and presented in accordance with IFRS as issued by the IASB, which differs in certain respects from U.S. GAAP. Until December 31, 2010,GAAP, as indicated in Note 28 to the Cerro Verde presented its financial statements in conformity with Peruvian GAAP.Financial Statements. The operating data presented below, which are based on 100 percent100% of Cerro Verde’s production and reserves, are derived from Cerro Verde’s records and have not been subject to audit. The financial information presented below should be read in conjunction with “Item 5. Operating and Financial Review and Prospects—Cerro Verde,” the Cerro Verde Financial Statements and the related notes thereto and other financial information included in this Annual Report.
| | | As of and for the year ended December 31, | |
| | | 2010(2) | | | 2011 | | | 2012 | |
| | | (In thousands of US$)(1) | |
| Income statement data: | | | | | | | | | | | | |
| IFRS(2) | | | | | | | | | | | | |
| Net sales | | | 2,368,988 | | | | 2,520,050 | | | | 2,127,023 | |
| Total revenues | | | 2,368,988 | | | | 2,520,050 | | | | 2,127,023 | |
| Costs of sales | | | | | | | | | | | | |
| Total costs of sales | | | (645,959 | ) | | | (824,700 | ) | | | (801,571 | ) |
| Gross margin | | | 1,723,029 | | | | 1,695,350 | | | | 1,325,452 | |
| Operating expenses | | | | | | | | | | | | |
| Selling expenses | | | (76,638 | ) | | | (83,612 | ) | | | (78,674 | ) |
| Excess of workers’ profit sharing | | | (34,427 | ) | | | (21,923 | ) | | | - | |
| Expenses related to water plant | | | (4,300 | ) | | | (13,670 | ) | | | (19,606 | ) |
| Voluntary contribution | | | (41,081 | ) | | | - | | | | - | |
| Other operating expenses | | | (10,749 | ) | | | (16,865 | ) | | | (9,898 | ) |
| Total operating expenses | | | (167,195 | ) | | | (136,070 | ) | | | (108,178 | ) |
| Operating income | | | 1,555,834 | | | | 1,559,280 | | | | 1,217,274 | |
| Other income (expenses), net | | | | | | | | | | | | |
| Financial expense | | | (101 | ) | | | (165 | ) | | | (6,951 | ) |
| Financial income | | | 1,261 | | | | 1,078 | | | | 1,886 | |
| Exchange Difference, net | | | 669 | | | | 1,924 | | | | 3,149 | |
| Total other income (expenses), net | | | 1,829 | | | | 2,837 | | | | (1,916 | ) |
| | | | | | | | | | | | | |
| Profit before income tax | | | 1,557,663 | | | | 1,562,117 | | | | 1,215,358 | |
| | | | | | | | | | | | | |
| Income tax | | | (483,270 | ) | | | (483,718 | ) | | | (443,288 | ) |
| Net income | | | 1,074,393 | | | | 1,078,399 | | | | 772,070 | |
| | | | | | | | | | | | | |
| Basic and diluted earnings per share | | | 3.069 | | | | 3.081 | | | | 2.206 | |
| Dividends per share | | | 2.714 | | | | - | | | | - | |
| | | | | | | | | | | | | |
| Average number of shares outstanding | | | 350,056,012 | | | | 350,056,012 | | | | 350,056,012 | |
| | | | | | | | | | | | | |
| Statement of financial position data: | | | | | | | | | | | | |
| IFRS(2) | | | | | | | | | | | | |
| Total assets | | | 2,294,078 | | | | 3,196,597 | | | | 4,042,771 | |
| Total debt | | | - | | | | - | | | | - | |
| Capital stock | | | 990,659 | | | | 990,659 | | | | 990,659 | |
| Shareholders’ equity | | | 1,599,239 | | | | 2,677,638 | | | | 3,449,708 | |
| | | | | | | | | | | | | |
| Operating data (unaudited): | | | | | | | | | | | | |
| Production: | | | | | | | | | | | | |
| Copper (in thousands of recoverable pounds) | | | 667,363 | | | | 647,234 | | | | 594,474 | |
| Proven and probable reserves: | | | | | | | | | | | | |
| Copper (in thousands of metric tons) | | | 3,571,531 | | | | 3,977,211 | | | | 4,194,537 | |
| | | As of and for the year ended December 31, | |
| | | | 2015 | | | | 2014 | | | | 2013(2) | | | | 2012(2) | | | | 2011(2) | |
| | | (In thousands of US$)(1) | |
| Statement of comprehensive income: | | | | | | | | | | | | | | | | | | | | |
| | | | | | | | | | | | | | | | | | | | | |
| Sales of goods | | | 1,115,617 | | | | 1,467,097 | | | | 1,811,488 | | | | 2,127,023 | | | | 2,520,050 | |
| Costs of sales of goods | | | (862,004 | ) | | | (797,481 | ) | | | (795,064 | ) | | | (765,789 | ) | | | (824,700 | ) |
| Gross profit | | | 253,613 | | | | 669,616 | | | | 1,016,424 | | | | 1,361,234 | | | | 1,695,350 | |
| Operating expenses | | | | | | | | | | | | | | | | | | | | |
| Selling expenses | | | (56,215 | ) | | | (54,210 | ) | | | (68,448 | ) | | | (78,674 | ) | | | (83,612 | ) |
| Excess of workers’ profit sharing | | | | | | | - | | | | - | | | | - | | | | (21,923 | ) |
| Expense related to water plant | | | | | | | - | | | | - | | | | (19,606 | ) | | | (13,670 | ) |
| Other operating (expenses), income net | | | (26,600 | ) | | | (3,629 | ) | | | 147 | | | | (9,898 | ) | | | (16,865 | ) |
| | | | (82,815 | ) | | | (57,839 | ) | | | (68,301 | ) | | | (108,178 | ) | | | (136,070 | ) |
| Operating profit | | | 170,798 | | | | 611,777 | | | | 948,123 | | | | 1,253,056 | | | | 1,559,280 | |
| Other income (expenses) | | | | | | | | | | | | | | | | | | | | |
| Finance income | | | 512 | | | | 2,443 | | | | 2,178 | | | | 1,886 | | | | 1,078 | |
| Finance costs | | | (16,010 | ) | | | (369 | ) | | | (1,843 | ) | | | (6,951 | ) | | | (165 | ) |
| Net gain (loss) from exchange differences | | | (75,770 | ) | | | 2,284 | | | | (1,858 | ) | | | 3,149 | | | | 1,924 | |
| | | | (91,268 | ) | | | 4,358 | | | | (1,523 | ) | | | (1,916 | ) | | | 2,837 | |
| | | | | | | | | | | | | | | | | | | | | |
| Profit before income tax | | | 79,530 | | | | 616,135 | | | | 946,600 | | | | 1,251,140 | | | | 1,562,117 | |
| | | | | | | | | | | | | | | | | | | | | |
| Income tax expense | | | (46,246 | ) | | | (238,529 | ) | | | (333,338 | ) | | | (454,556 | ) | | | (483,718 | ) |
| Profit for the year | | | 33,284 | | | | 377,606 | | | | 613,262 | | | | 796,584 | | | | 1,078,399 | |
| | | | | | | | | | | | | | | | | | | | | |
| Basic and diluted earnings per share | | | 0.095 | | | | 1.078 | | | | 1.752 | | | | 2.276 | | | | 3.081 | |
| Dividends per share | | | | | | | – | | | | – | | | | – | | | | – | |
| | | | | | | | | | | | | | | | | | | | | |
| Weighted average number of shares outstanding | | | 350,056,012 | | | | 350,056,012 | | | | 350,056,012 | | | | 350,056,012 | | | | 350,056,012 | |
| | | | | | | | | | | | | | | | | | | | | |
| Statement of financial position data: | | | | | | | | | | | | | | | | | | | | |
| | | | | | | | | | | | | | | | | | | | | |
| Total assets | | | 7,852,692 | | | | 5,771,984 | | | | 4,828,201 | | | | 4,042,771 | | | | 3,196,597 | |
| Total financial obligations | | | 2,425,164 | | | | 452,849 | | | | 5,903 | | | | – | | | | – | |
| Issued capital | | | 990,659 | | | | 990,659 | | | | 990,659 | | | | 990,659 | | | | 990,659 | |
| Total equity, net | | | 4,498,374 | | | | 4,465,090 | | | | 4,087,484 | | | | 3,449,708 | | | | 2,677,638 | |
| | | | | | | | | | | | | | | | | | | | | |
| Operating data (unaudited): | | | | | | | | | | | | | | | | | | | | |
| Production: | | | | | | | | | | | | | | | | | | | | |
| Copper (in thousands of recoverable pounds) | | | 544,482 | | | | 500,242 | | | | 557,239 | | | | 594,474 | | | | 647,234 | |
| Proven and probable reserves: | | | | | | | | | | | | | | | | | | | | |
| Copper Ore (in thousands of tons) | | | 3,855,939 | | | | 3,953,234 | | | | 4,047,372 | | | | 4,194,537 | | | | 3,977,211 | |
| (1) | Except per share and operating datadata. |
| (2) | EffectiveIFRIC 20 became effective January 1, 2011, Cerro Verde changed the accounting principles governing the presentation of its consolidated financial statements from Peruvian GAAP to IFRS. Accordingly, Cerro Verde’s financial information2013. Our results for the year ended December 31, 2010 has been presented2012 include adjustments in accordanceconnection with IFRS.the application of IFRIC 20 “Stripping Cost in the Production Phase.” See Note 32.2 to the Cerro Verde Financial Statements. |
Exchange Rates
The following table sets forth the high and low month-end rates and the average and end-of-period offered rates for the sale of Nuevos Soles in U.S. Dollars for the periods indicated, as published by theSuperintendencia de Bancos y Seguros (Superintendent of Bank and Insurance, or the SBS). The Federal Reserve Bank of New York does not report a noon buying rate for Nuevos Soles.
Exchange Rates
(Nuevos
The following table sets forth the high and low month-end rates and the average and end-of-period offered rates for the sale of Soles per US$in U.S. Dollars for the periods indicated, as published by theSuperintendencia de Banca y Seguros (Superintendent of Bank and Insurance, or the “SBS”)(1). The Federal Reserve Bank of New York does not report a noon buying rate for Soles.
| Year | | High(2) | | | Low(2) | | | Average(3) | | | Period end(4) | |
| | | | | | | | | | | | | |
| 2008 | | | 3.141 | | | | 2.690 | | | | 2.922 | | | | 3.139 | |
| 2009 | | | 3.259 | | | | 2.853 | | | | 3.012 | | | | 2.891 | |
| 2010 | | | 2.856 | | | | 2.787 | | | | 2.826 | | | | 2.809 | |
| 2011 | | | 2.834 | | | | 2.694 | | | | 2.755 | | | | 2.697 | |
| 2012 | | | 2.710 | | | | 2.551 | | | | 2.640 | | | | 2.551 | |
| | | High(5) | | | Low(5) | | | Average(6) | | | Period end(7) | |
| 2012 | | | | | | | | | | | | |
| October | | | 2.602 | | | | 2.578 | | | | 2.588 | | | | 2.592 | |
| November | | | 2.616 | | | | 2.579 | | | | 2.599 | | | | 2.579 | |
| December | | | 2.581 | | | | 2.551 | | | | 2.568 | | | | 2.551 | |
| | | | | | | | | | | | | | | | | |
| 2013 | | | | | | | | | | | | | | | | |
| January | | | 2.578 | | | | 2.541 | | | | 2.552 | | | | 2.578 | |
| February | | | 2.587 | | | | 2.567 | | | | 2.579 | | | | 2.587 | |
| March | | | 2.604 | | | | 2.586 | | | | 2.595 | | | | 2.589 | |
Exchange Rates
(Soles per US$)(1) |
| Year | | High(2) | | | Low(2) | | | Average(3) | | | Period end(4) | |
| 2013 | | | 2.820 | | | | 2.541 | | | | 2.702 | | | | 2.796 | |
| 2014 | | | 2.990 | | | | 2.761 | | | | 2.840 | | | | 2.989 | |
| 2015 | | | 3.413 | | | | 2.983 | | | | 3.187 | | | | 3.408 | |
| 2015 | | High(5) | | | Low(5) | | | Average(6) | | | Period end(7) | |
| October | | | 3.288 | | | | 3.218 | | | | 3.250 | | | | 3.287 | |
| November | | | 3.385 | | | | 3.287 | | | | 3.339 | | | | 3.376 | |
| December | | | 3.413 | | | | 3.369 | | | | 3.385 | | | | 3.413 | |
| | | | | | | | | | | | | | | | | |
| 2016 | | | | | | | | | | | | | | | | |
| January | | | 3.471 | | | | 3.417 | | | | 3.439 | | | | 3.471 | |
| February | | | 3.538 | | | | 3.478 | | | | 3.508 | | | | 3.527 | |
| March | | | 3.522 | | | | 3.328 | | | | 3.410 | | | | 3.328 | |
| (1) | Expressed in nominal (not inflation adjusted) Nuevos Soles. |
| (2) | Highest and lowest of the twelve month-end exchange rates for each year based on the offered rate. |
| (3) | Average of month-end exchange rates based on the offered rate. |
| (4) | End of periodEnd-of-period exchange rates based on the offered rate. |
| (5) | Highest and lowest of the exchange rates based on the offered rate on the last day of each month. |
| (6) | Average of the exchange rates based on the offered rate on the last date of each day in the relevant month. |
| (7) | The exchange rate based on the offered rate on the last day of each relevant month. |
Source: SBSBloomberg
On April 25, 2013,28, 2016, the offered rate for Dollars as published by the SBS was S/.2.624 =.3.29 per US$1.00.
B. Capitalization and Indebtedness
| B. | Capitalization and Indebtedness |
Not applicable.
C. Reasons for the Offer and Use of Proceeds
| C. | Reasons for the Offer and Use of Proceeds |
Not applicable.
D. Risk Factors
Factors Relating to the Company
Our financial performance is highly dependent on the performance of our partners under our mining exploration and operating agreements.
Our participation in joint venture mining exploration projects and mining operations with other experienced mining companies is an integral part of our business strategy. Our partners, co-venturers and other shareholders in these projects generally contribute capital to cover the expenses of the joint venture or provide critical technological, management and organizational expertise. The results of these projects can be highly dependent upon the efforts of our joint venture partners and we rely on them to fulfill their obligations under our agreements. For example, our Yanacocha joint venture with Newmont Mining Corporation, a Delaware corporation, or Newmont Mining, is dependent upondepends on Newmont Peru Limited, Peruvian Branch, or Newmont“Newmont Peru,” to provide management and other expertise to the Yanacocha project. If our counterparts do not carry out their obligations to us or to third parties, or any disputes arise with respect to the parties’ respective rights and obligations, the value of our investment in the applicable project could be adversely affected and we could incur significant expense in enforcing our rights or pursuing remedies. There can be no assuranceWe cannot assure you that our current or future partners will fulfill their obligations under our agreements. In addition, we may be unable to exert control over strategic decisions made in respect of such properties.For example, we currently depend on Newmont Peru to conduct operations at Yanacocha and the Conga project, and shouldshould Yanacocha be unable to continue with the current development plan at the Conga project, our mining partners in this project may reprioritize and reallocate capital to development alternatives. See “Item 4. Information on the Company—Company – Yanacocha” and “Item 4. Information on the Company—Buenaventura—Company – Buenaventura – B. Business Overview—Overview – Exploration.”
Our financial performance is highly dependent on the prices of gold, silver, copper and other metals.
The results of our operations are significantly affected by the market price of specific metals, which are cyclical and subject to substantial price fluctuations. Our revenues are derived primarily from the sale of ore concentrates containing gold and silver; the revenues of Yanacocha, in which we have a material equity investment, are derived primarily from the sale of gold and silver;silver, and the revenues of Cerro Verde, in which we have a material equity investment, are derived primarily from copper sales. The prices that we, Yanacocha and Cerro Verde obtain for gold, silver, copper and ore concentrates containing such metals, as applicable, are directly related to world market prices for such metals. Such prices have historically fluctuated widely and are affected by numerous factors beyond our control, including (i) the overall demand for and worldwide supply of gold, silver, copper and other metals,metals; (ii) levels of supply and demand for a broad range of industrial products; (iii) the availability and price of competing commodities,commodities; (iv) international economic trends,and political trends; (v) currency exchange fluctuations (specifically, the U.S. Dollar relative to other currencies); (vi) expectations with respect to the rate of inflation,inflation; (vii) interest rates; (viii) actions of commodity markets participants, consumptionparticipants; and demand patterns and(ix) global or regional political events in major producing countries. or economic crises.
We have in the past engaged in hedging activities, such as forward sales and option contracts, to minimize our exposure to fluctuations in the prices of gold, silver and other metals; however, we and our wholly-owned subsidiaries no longer hedge the price at which our gold and silver will be sold. In addition, neither Yanacocha nor Cerro Verde engages in hedging activities. As a result, the prices at which we, Yanacocha and Cerro Verde sell gold, silver, copper and ore concentrates, as applicable, are fully exposed to the effects of changes in prevailing market prices.Seeprices. See “Item 11. Quantitative and Qualitative Disclosures About Market Risk” and Note 2833 to the Financial Statements. For information on gold and silver prices for each of the years in the five-year period ended December 31, 2011,2015, see “Item 4. Information on the Company—Buenaventura—Company – Buenaventura – B. Business Overview—SalesOverview –Sales of Metal Concentrates.”
On December 31, 2012,2015 and March 31, 2013 and April 24, 2013,2016, the morning fixing price for gold on the London Bullion Market was US$1,664per ounce, US$1,6021,060.25 per ounce and US$1,4511,233.6 per ounce, respectively. On December 31, 20122015 and March 31, 2013,2016, the afternoon fixing spot price of silver on the London market, or London“London Spot,” was US$29.95per13.82 per ounce and US$28.64per15.38 per ounce, respectively. On December 31, 20122015 and March 31, 2013,2016, the London Metal Exchange Settlement price for copper was US$7,915,4,702 per metric ton and US$7,582,4,855.5, per metric ton, respectively.
The world market prices of gold, silver and copper have historically fluctuated widely and there is no assurance that the prices for these metals will continue to maintain their current high historical levels.widely. We cannot predict whether metal prices will rise or fall in the future. A continued decline in the market price of one or more of these metals could adversely impact our revenues, net income and cash flows and adversely affect our ability to meet our financial obligations.
In addition, sustained low If prices of gold, silver and/or copper pricesshould decline below our cash costs of production and remain at such levels for any sustained period, we could determine that it is not economically feasible to continue production at any or all of our mines. We may also curtail or suspend some or all of our exploration activities, with the result that our depleted reserves are not replaced. This could further reduce revenues further through production declines due to cessation of the mining of deposits,by reducing or portions of deposits, that have become uneconomic at the then-prevailing market price; reduce or eliminateeliminating the profit that we currently expect from reserves; halt or delay the development of new projects; reduce funds available for exploration; and reduce existing reserves by removing ores from reserves that can no longer be economically processed at prevailing prices.reserves. Such declines in price and/or reductions in operations could also cause significant volatility in our financial performance and adversely affect the trading prices of our Common Shares and ADSs.
Economic, mining and other regulatory policies of the Peruvian government, as well as political, regulatory and economic developments in Peru, may have an adverse impact on our, Yanacocha’s and Cerro Verde’s businesses.
Our, Yanacocha’s and Cerro Verde’s activities in Peru require us to obtain mining concessions or provisional permits for exploration and processing concessions for the treatment of mining ores from the Peruvian Ministry of Energy and Mines or MEM.(the “MEM”). Under Peru’s current legal and regulatory regime, these mining and processing rights are maintained by meeting a minimum annual level of production or investment and by the annual payment of a concession fee. A fine is payable for the years in which minimum production or investment requirements are not met. Although we are, and Yanacocha and Cerro Verde have informed us that they are, current in the payment of all amounts due in respect of mining and processing concessions, failure to pay such concession fees, processing fees or related fines for two consecutive years could result in the loss of one or more mining rights and processing concessions, as the case may be.
Mining companies are also required to pay the Peruvian government mining royalties and/or mining taxes. See “Item 4. Information on the Company—Buenaventura—Company – Buenaventura – B. Business Overview—Overview – Regulatory Framework—Framework – Mining Royalties and Taxes.” There can be no assuranceWe cannot assure you that the Peruvian government will not impose additional mining royalties or taxes in the future or that such mining royalties or taxes will not have an adverse effect on our, Yanacocha’s or Cerro Verde’s results of operations or financial condition. Future regulatory changes, changes in the interpretation of existing regulations or stricter enforcement of such regulations, including changes to our concession agreements, may increase our compliance costs and could potentially require us to alter our operations. We cannot assure you that future regulatory changes will not adversely affect our business, financial condition or results of operations.
Environmental and other laws and regulations may increase our costs of doing business, restrict our operations or result in operational delays.
Our, Yanacocha’s and Cerro Verde’s exploration, mining and milling activities, as well our and Yanacocha’s smelting and refining activities, are subject to a number of Peruvian laws and regulations, including environmental laws and regulations.
Additional matters subject to regulation include, but are not limited to, concession fees, transportation, production, water use and discharges, power use and generation, use and storage of explosives, surface rights, housing and other facilities for workers, reclamation, taxation, labor standards, mine safety and occupational health.
We anticipate additional laws and regulations will be enacted over time with respect to environmental matters. The development of more stringent environmental protection programs in Peru could impose constraints and additional costs on our, Yanacocha’s and Cerro Verde’s operations and require us, Yanacocha and Cerro Verde to make significant capital expenditures in the future. Although we believe that we are substantially in compliance, and Yanacocha and Cerro Verde have advised us that they are substantially in compliance, with all applicable environmental regulations, there can be no assurancewe cannot assure you that future legislative or regulatory developments will not have an adverse effect on our, Yanacocha’s or Cerro Verde’s business or results of operations. See “Item 4. Information on the Company—Buenaventura—Company – Buenaventura – B. Business Overview—Overview – Regulatory Framework—Framework – Environmental Matters” and “—Permits” and “Item 4. Information on the Company—Yanacocha—Company – Yanacocha – B. Business Overview—Overview – Regulation, Permit and Environmental Matters.”
Our and Yanacocha’s ability to successfully obtain key permits and approvals to explore for, develop and successfully operate mines will likely depend on our and Yanacocha’s ability to do so in a manner that is consistent with the creation of social and economic benefits in the surrounding communities. Our and Yanacocha’s ability to obtain permits and approvals and to successfully operate in particular communities or to obtain financing may be adversely impacted by real or perceived detrimental events associated with our orand Yanacocha’s activities or those of other mining companies affecting the environment, human health and safety or the surrounding communities. Delays in obtaining or failure to obtain government permits and approvals may adversely affect our and Yanacocha’s operations, including our and Yanacocha’s ability to explore or develop properties, commence production or continue operations.
Our metals exploration efforts are highly speculative in nature and may not be successful.
Precious metals exploration, particularly gold exploration, is highly speculative in nature, involves many risks and frequently is unsuccessful. There can be no assuranceWe cannot assure you that our, Yanacocha’s or Cerro Verde’s metals exploration efforts will be successful. Once mineralization is discovered, it may take a number of years from the initial phases of drilling before production is possible, during which time the economic feasibility of production may change. Substantial expenditures are required to establish proven and probable ore reserves through drilling, to determine metallurgical processes to extract the metals from the ore and, in the case of new properties, to construct mining and processing facilities. As a result of these uncertainties, no assurance can be givenwe cannot assure you that our or Yanacocha’s exploration programs will result in the expansion or replacement of current production with new proven and probable ore reserves.
We base our estimates of proven and probable ore reserves and estimates of future cash operating costs largely on the interpretation of geologic data obtained from drill holes and other sampling techniques, and feasibility studies. Advanced exploration projects have no operating history upon which to base estimates of proven and probable ore reserves and estimates of future cash operating costs. Such estimates are, to a large extent, based upon the interpretation of geologic data obtained from drill holes and other sampling techniques, and feasibility studies which derive estimates of cash operating costs based upon anticipated tonnage and grades of ore to be mined and processed, the configuration of the ore body, expected recovery rates of the mineral from the ore, comparable facility and equipment operating costs, anticipated climatic conditions and other factors. As a result, it is possible that actual cash operating costs and economic returns based upon proven and probable ore reserves may differ significantly from those originally estimated. Moreover, significant decreases in actual over expected prices may mean reserves, once found, will be uneconomical to produce. It is not unusual in new mining operations to experience unexpected problems during the start-up phase. See “Item 4. Information on the Company—Buenaventura—Company – Buenaventura – D. Property, Plants and Equipment—Equipment – Our Properties—Properties – Reserves,” “—Yanacocha—“– Yanacocha – D. Property, Plants and Equipment—Equipment – Yanacocha’s Properties—Properties – Reserves” and “Item 5. Operating and Financial Review and Prospects—Prospects – Cerro Verde—Verde – A. Operating Results” for the price per ounce used by us, Yanacocha and Cerro Verde, respectively, to calculate our respective proven and probable reserves.
Increased operating costs could affect our profitability.
Costs at any particular mining location frequently are subject to variation due to a number of factors, such as changing ore grade, changing metallurgy and revisions to mine plans in response to the physical shape and location of the ore body. In addition, costs are affected by the price of commodities, such as fuel and electricity, as well as by the price of labor. Commodity costs are at times subject to volatile price movements, including increases that could make production at certain operations less profitable. Reported costs may be affected by changes in accounting standards. A material increase in costs at any significant location could have a significant effect on our profitability.
Our business is capital-intensive and we may not be able to finance necessary capital expenditures required to execute our business plans.
Precious metals exploration requires substantial capital expenditures for the exploration, extraction, production and processing stages and for machinery, equipment and experienced personnel. Our estimates of the capital required for our projects may be preliminary or based on assumptions we have made about the mineral deposits, equipment, labor, permits and other factors required to complete our projects. If any of these estimates or assumptions change, the actual timing and amount of capital required may vary significantly from our current anticipated costs. In addition, we may require additional funds in the event of unforeseen delays, cost overruns, design changes or other unanticipated expenses. We may also incur debt in future periods or reduce our holdings of cash and cash equivalents in connection with funding future acquisitions, existing operations, capital expenditures or in pursuing other business opportunities. Our ability to meet our payment obligations will depend on our future financial performance, which will be affected by financial, business, economic and other factors, many of which we are unable to control. There can be no assurance that we or Yanacocha will generate sufficient cash flow and/or that we will have access to sufficient external sources of funds in the form of outside investment or loans to continue exploration activities at the same or higher levels than in the past or that we will be able to obtain additional financing, if necessary, on a timely basis and on commercially acceptable terms.
Estimates of proven and probable reserves are subject to uncertainties and the volume and grade of ore actually recovered may vary from our estimates.
The proven and probable ore reserve figures presented in this Annual Report are our, Yanacocha’s and Cerro Verde’s estimates, and there can be no assurance that the estimated levels of recovery of gold, silver, copper and certain other metals will be realized. Such estimates depend on geological interpretation and statistical inferences or assumptions drawn from drilling and sampling analysis, which may prove to be materially inaccurate. Actual mineralization or formations may be different from those predicted. As a result, reserve estimates may require revision based on further exploration, development activity or actual production experience, which could materially and adversely affect such estimates. No assurance can be given that our, Yanacocha’s or Cerro Verde’s mineral resources constitute or will be converted into reserves. Market price fluctuations of gold, silver and other metals, as well as increased production costs or reduced recovery rates, may render proven and probable ore reserves containing relatively lower grades of mineralization uneconomic to exploit and may ultimately result in a restatement of proven and probable ore reserves. Moreover, short-term operating factors relating to the reserves, such as the processing of different types of ore or ore grades, could adversely affect our or Yanacocha’s profitability in any particular accounting period. See “Item 4. Information on the Company—Buenaventura—Company – Buenaventura – D. Property, Plants and Equipment—Equipment – Our Properties—Reserves” and “Item 4. Information on the Company—Company – D. Property, Plants and Equipment—Yanacocha—Equipment – Yanacocha – Yanacocha’s Properties—Properties – Reserves.”
We and Yanacocha may be unable to replace reserves as they become depleted by production.
As we and Yanacocha produce gold, silver, zinc and other metals, we and Yanacocha deplete our respective ore reserves for such metals. To maintain production levels, we and Yanacocha must replace depleted reserves by exploiting known ore bodies and locating new deposits. Exploration for gold, silver and the other metals produced is highly speculative in nature. Our and Yanacocha’s exploration projects involve significant risks and are often unsuccessful. Once a site is discovered with mineralization, we and Yanacocha may require several years between initial drilling and mineral production, and the economic feasibility of production may change during such period. Substantial expenditures are required to establish proven and probable reserves and to construct mining and processing facilities. Based on the current recovery rate and estimated gold production levels in 2012, Yanacocha’s proven and probable reserves as of December 31, 2012 will be depleted by 2015 unless Yanacocha continues to add to its reserves. As a result, thereThere can be no assurance that current or future exploration projects will be successful and there is a risk that our depletion of reserves will not be offset by new discoveries. See “Item “Item��4. Information on the Company—Buenaventura—Company – Buenaventura – B. Business Overview—Exploration,” “—Yanacocha—“– Yanacocha – B. Business Overview—Overview – Exploration,” “—“– D. Property, Plants and Equipment—Equipment – Reserves,” “—“– Yanacocha’s Properties—Properties – Reserves” and “Item 5. Operating and Financial Review and Prospects—Prospects – Cerro Verde—Verde – A. Operating Results” for a summary of our, Yanacocha’s and Cerro Verde’s estimated proven and probable reserves as of December 31, 2012.2015.
Our operations are subject to risks, many of which are not insurable.
The business of mining, smelting and refining gold, silver, copper and other metals is generally subject to a number of risks and hazards, including industrial accidents, labor disputes, unavailability of materials and equipment, unusual or unexpected geological conditions, changes in the regulatory environment, environmental hazards and weather and other natural phenomena such as earthquakes, most of which are beyond our control. Such occurrences could result in damage to, or destruction of, mining properties or production facilities, personal injury or death, environmental damage, delays in mining, monetary losses and possible legal liability. We, Yanacocha, and Cerro Verde each maintain insurance against risks that are typical in the mining industry in Peru and in amounts that we, Yanacocha and YanacochaCerro Verde believe to be adequate but which may not provide adequate coverage in certain circumstances. No assurance can be given that such insurance will continue to be available at economically feasible premiums or at all. Insurance against certain risks (including certain liabilities for environmental pollution or other hazards as a result of exploration and production) is not generally available to us or Yanacocha or to other companies within the industry.
Increases in equipment costs, energy costs and other production costs, disruptions in energy supply and shortages in equipment and skilled labor may adversely affect our results of operations.
In recent years, there has been a significant increase in mining activity worldwide in response to increased demand and significant increases in the prices of natural resources. The opening of new mines and the expansion of existing minesones has led to increased demand for, and increased costs and shortages of, equipment, supplies and experienced personnel. These cost increases have significantly increased overall operating and capital budgets of companies like ours, and continuing shortages could affect the timing and feasibility of expansion projects.
Energy represents a significant portion of our production costs. Our principal energy sources are electricity, purchased petroleum products, natural gas and coal. An inability to procure sufficient energy at reasonable prices or disruptions in energy supply could adversely affect our profits, cash flow and growth opportunities. Our production costs are also affected by the prices of commodities we consume or use in our operations, such as sulfuric acid, grinding media, steel, reagents, liners, explosives and diluents. The prices of such commodities are influenced by supply and demand trends affecting the mining industry in general and other factors outside our control and such prices are at times subject to volatile movements. Increases in the cost of these commodities or disruptions in energy supply could make our operations less profitable, even in an environment of relatively high copper, gold or silver prices. Increases in the costs of commodities that we consume or use may also significantly affect the capital costs of new projects.
We may be adversely affected by labor disputes.
Our ability to achieve our goals and objectives is dependent, in part, on maintaining good relations with our employees. A prolonged labor disruption at any of our material properties could have a material adverse impact on our results of operations. We, Compañía Minera Coimolache S.A., or “Coimolache,” Yanacocha and Cerro Verde have all experienced strikes or other labor-related work stoppages in the past. Most recently, weIn June 2015, El Brocal experienced a 15-daytwo-day work stoppage at our Orcopampa mine due to strikesits concentrator plant in Huaraucaca in connection with the negotiation of salary and the collective bargaining agreement. Subsequently, in May and June 2015, we experienced a strike at the Uchucchacua mine that lasted for twenty-nine days and a further 9-day work stoppage at Orcopampa due to strikes in October 2012. was staged by workers’ and contractors’ unions claiming unsuitable working conditions.
As of December 31, 2012,2015, unions represented approximately 54 percent39% of the employees of our permanent employees.mining companies on a consolidated basis. Although we consider our relationsrelationship with our employees to be positive, there can be no assurance that we will not experience strikes or other labor-related work stoppages that could have a material adverse effect on our operations and/or operating results in the future.
Our, Yanacocha and Yanacocha’sCerro Verde’s operations are subject to political and social risks.
Our, Yanacocha and Yanacocha’sCerro Verde´s exploration and production activities are potentially subject to political and social risks. Over the past several years, we and Yanacocha have been the target of local political protests. In recent years, certain areas in the south and northern highlands of Peru with significant mining developments have experienced strikes and protests related to the environmental impact of mining activities. Such strikes and protests have resulted in commercial disruptions and a climate of uncertainty with respect to future mining projects. As a result of local political and community protests, construction and development activities at the Conga project were largely suspended in November 2011. The results of the Peruvian Central Government’s Environmental Impact Assessment (“EIA”) independent review were reported on April 20, 2012. The review indicated the project’s EIA met Peruvian and international standards. The review made recommendations to provide additional water capacity and social funds, which Yanacocha has largely accepted. Yanacocha announced the decision to advance the project on a “water-first” basis on June 22, 2012. In the first half of 2014, a Conga Restart Study was completed to identify and test alternatives to advancing development of the project. Following this assessment, a new plan was developed to reduce spending to focus only on the most critical work (protecting people and assets, engaging with communities, and maintaining existing project infrastructure), while maintaining optionality. Newmont will not proceed with the full development of the Conga project without social acceptance, solid project economics and, potentially, another partner to help defray costs and risk. It is difficult to predict when or whether such events may occur. Under the current social and political environment, we do not anticipate being able to develop the Conga project in the foreseeable future. The continued delay and evaluation of other alternatives may result in a potential accounting impairment or further reclassification of mineralized material.
There can be no assurance that these types incidents will not continue or that similar incidents will not occur in areas in which we and Yanacocha operate, or that the continuation or intensification of community protests will not adversely affect our or Yanacocha’s exploration and production activities or our or Yanacocha’s results of operations or financial condition.
In addition, during 2011, Peru enacted Law No. 29785, the Law of Prior Consultation for Indigenous and Native Communities(Communities (Ley del Derecho a la Consulta Previa a los Pueblos Indígenas y Originarios, Reconocido en el Convenio 169 de la Organización Internacional del Trabajo). Implementing regulations thereunder were approved by Supreme Decree No. 001-2012-MC, which became effective on April 2, 2012. This law establishes a prior consultation procedure that the Peruvian government must undertake in concert with any local indigenous communities whose collective rights may be directly affected by new legislative or administrative measures, including the granting of new mining concessions. The implementing regulations specify the form and circumstances of the required consultation and the manner in which agreements will be formalized, and cap the consultation process at 120 calendar days. Under the law, the Peruvian governmental body responsible for issuing or approving the administrative measure or decree in question, rather than the affected local indigenous community, retains the right to approve or reject the relevant legislative or administrative matter following such consultation. However, to the extent that any future projects operated by us, Yanacocha or Cerro Verde require legislative or administrative measures that impact local indigenous communities, the required prior consultation procedure may result in delays, additional expenses or failure to obtain approval for such new project.
We could face geotechnical challenges, which could adversely impact our production and profitability.
No assurances can be given that unanticipated adverse geotechnical and hydrological conditions, such as landslides and pit wall failures, will not occur in the future or that such events will be detected in advance. Geotechnical instabilities can be difficult to predict and are often affected by risks and hazards outside of our control, such as severe weather and considerable rainfall, which may lead to periodic floods, mudslides, wall instability and seismic activity, which may result in slippage of material.
Geotechnical failures could result in limited or restricted access to mine sites, suspension of operations, government investigations, increased monitoring costs, remediation costs, loss of ore and other impacts, which could cause one or more of our projects to be less profitable than currently anticipated and could result in a material adverse effect on our results of operations and financial position.
We rely on contractors to conduct a significant portion of our operations and mine development projects.
A significant portion of our operations and mine development projects are currently conducted by contractors. As a result, our operations are subject to a number of risks, some of which are outside our control, including:
| · | failure of a contractor to perform under its agreement; |
| · | interruption of operations or increased costs in the event thatif a contractor ceases its business due to insolvency or other unforeseen events; |
| · | failure of a contractor to comply with applicable legal and regulatory requirements, to the extent it is responsible for such compliance; and |
| · | problems of a contractor with managing its workforce, labor unrest or other employment issues. |
In addition, we may incur liability to third parties as a result of the actions of our contractors. The occurrence of one or more of these risks could adversely affect our results of operations and financial position.
We are not, and do not intend to become, regulated as an investment company under the U.S. Investment Company Act of 1940, as amended or the Investment(the “Investment Company Act,Act”), and if we were deemed an “investment company” under the Investment Company Act, applicable restrictions could make it impractical for us to operate as contemplated.
As of December 31, 2012,2015, we owned a 43.65 percent43.65% partnership interest in Yanacocha and a 19.58 percent19.584% equity interest in Cerro Verde. These interests may constitute “investment securities” for purposes of the Investment Company Act.
Under the Investment Company Act, an investment company is defined in relevant part to include (i) any company that is or holds itself out as being engaged primarily, or proposes to engage primarily, in the business of investing, reinvesting or trading in securities and (ii) any company that owns or proposes to acquire investment securities having a value exceeding 40 percent40% of such company’s total assets (exclusive of certain items) on an unconsolidated basis. Issuers that are investment companies within the meaning of the Investment Company Act, and which do not qualify for an exemption from the provisions of such act, are required to register with the SECSecurities and Exchange Commission (the “SEC”) and are subject to substantial regulations with respect to capital structure, operations, transactions with affiliates and other matters. If we were deemed to be an investment company and did not qualify for an exemption from the provisions of the Investment Company Act, we would be required to register with the SEC and would be subject to such regulations, which would be unduly burdensome and costly for us and possibly adversely impact us.
We received an order from the SEC on April 19, 1996 declaring us to be primarily engaged in a business other than that of an investment company and, therefore, not an investment company within the meaning of the Investment Company Act. We intend to conduct our operations and maintain our investments in a manner, and will take appropriate actions as necessary, to ensure we will not be deemed to be an investment company in the future. The SEC, however, upon its motion or upon application, may find that the circumstances that gave rise to the issuance of the order no longer exist, and as a result may revoke such order. There can be no assurance that such order will not be revoked.
Our or Yanacocha’s inability to maintain positive relationships with the communities in which we operate may affect our or Yanacocha’s reputation and financial condition.
Our and Yanacocha’s relationships with the communities in which we operate are critical to ensuring the future success of our existing operations and the construction and development of our projects. Adverse publicity generated by non-governmental organizations or local communities related to extractive industries generally, or our or Yanacocha’s operations specifically, could have an adverse effect on our reputations or financial condition and may impact our relationships with the communities in which we operate. In addition, following the enactment of Law No. 29785, the Law of Prior Consultation for Indigenous and Native Communities in 2011, the Peruvian government must undertake a prior consultation procedure in concert with local indigenous communities whose collective rights may be directly affected by new legislative or administrative measures, including the granting of new mining concessions. Implementing regulations under Law No. 29785 were approved by Supreme Decree No. 001-2012-MC, which became effective on April 2, 2012. The implementing regulations specify the form and circumstances of the required consultation and the manner in which agreements will be formalized, and cap the consultation process at 120 calendar days. Our and Yanacocha’s national reputation for maintaining positive relationships with the communities in which we operate may affect the outcome of any such prior consultation process involving approvals that we or Yanacocha seek for new projects. While we and Yanacocha are committed to operating in a socially responsible manner, there is no guarantee that our efforts in this regard will mitigate this potential risk. We and Yanacocha have implemented extensive community relations and security and safety initiatives to anticipate and manage social issues that may arise at our operations. See “Item 4. Information on the Company—Yanacocha—Company – Yanacocha – B. Business Overview—Overview – Social Development.”
In November 2011, construction activities at the Conga project were suspended at the request of Peru’s central government following increasing protests in Cajamarca by anti-mining activists led by the regional president. At the request of the Peruvian central government, the environmental impact assessment, or EIA, prepared in connection with the project, which was previously approved by the central government in October 2010, was reviewed by independent experts in an effort to resolve allegations surrounding the environmental viability of the Conga project. Construction was suspended for the duration of the review, except for sediment control work conducted in the project area. The report was released in April 2012. As of the date of this Annual Report, Yanacocha is evaluating the report’s findings. Progress continues on engineering and procurement work.
The Conga project is located within close proximity of existing operations at Yanacocha. Due to local political and community protests, construction and development activities at the Conga project were largely suspended in November 2011. The results of the Peruvian central government-initiated EIAEnvironmental Impact Study (“EIS”), independent review, announced on April 20, 2012, confirmed that Yanacocha’s initial EIAEIS met Peruvian and international standards. The review made recommendations to provide additional water capacity and social funds, which Yanacocha has largely accepted. Yanacocha announced its decision to move the project forward on a “water first” basis on June 22, 2012, which consists of building the originally planned community water reservoirs prior tobefore resuming any mine development. As a result, during 2013 the project will bewas focused on building water reservoirs, completing the remaining engineering activities, and accepting delivery of the main equipment purchases. In 2013, the Chailhuagon reservoir was completed. There were no major improvements carried out in 2014 or 2015. There can be no assurance that Yanacocha will be able to continue to develop the Conga project. Should Yanacocha be unable to continue with the current development plan at Conga, we or our mining partners in this project may reprioritize and reallocate capital to development alternatives, which may result in a potential accounting impairment. See “Item 4. Information on the Company—Yanacocha—Company – Yanacocha – B. Business Overview—Overview – Exploration.”
Deterioration in our financial position or a downgrade of our ratings by a credit rating agency could increase our borrowing costs and our business relationships could be adversely affected.
Credit rating agencies could downgrade our ratings either due to factors specific to Buenaventura, a prolonged cyclical downturn in the precious metals mining industries, macroeconomic trends (such as global or regional recessions) or trends in credit and capital markets more generally. For instance, on March 22, 2016, Moody’s downgraded our unsecured corporate rating from “Ba1” to “Ba2” due to the deterioration of the commodities markets and a downturn in the precious metals mining sector, as well as concerns about our liquidity. Our unsecured rating from Fitch remains a “BBB.”
A deterioration of our financial position or a further downgrade of any of our credit ratings for any reason could increase our borrowing costs and have an adverse effect on our business relationships with customers and suppliers. A subsequent downgrade could adversely affect our existing financings, limit access to the capital or credit markets, or otherwise adversely affect the availability of other new financing on favorable terms, if at all, result in more restrictive covenants in agreements governing the terms of any future indebtedness that we incur, increase our borrowing costs, or otherwise impair our business, financial condition and operating results.
Factors Relating to Peru
Peruvian political conditions may have an adverse impact on our, Yanacocha’s and Cerro Verde’s business.
All of our, Yanacocha’s and Cerro Verde’s operations are conducted in Peru. Accordingly, our, Yanacocha’s and Cerro Verde’s business, financial condition or results of operations could be affected by changes in economic or other policies of the Peruvian government or other political, regulatory or economic developments in Peru.
During the past several decades, Peru has had a history of political instability that has included military coups and a succession of regimes with differing policies and programs. Past governments have frequently played an interventionist role in the nation’s economy and social structure. Among other things, past governments have imposed controls on prices, exchange rates and local and foreign investment as well as limitations on imports, restricted the ability of companies to dismiss employees, expropriated private sector assets (including mining companies) and prohibited the remittance of profits to foreign investors.
In the second quarter of 2011, Presidential and Congressional elections resulted in a change in government in Peru. During the third quarter of 2011, the new government enacted four new tax laws. During 2012, the new administration, under President Ollanta Humala, largely supported mining as a driver for the continued growth and future development of Peru. However, Peru will be holding its elections for President during 2016 and we are unable tocannot predict whether the centralfuture government positions on mining concessions, land tenure, environmental regulation or taxation or assure you that future governments will continue to take similar positions in the future.maintain a generally favorable business climate and economic policies. Furthermore, the regional governmentgovernor in Cajamarca, who was re-elected in October 2014, actively opposed the Conga project in 2012 and continues to reject the viability of its development. We cannot predict the future positions of either the central government or regional governments on foreign investment, mining concessions, land tenure or other regulation. Any change in government positions or laws on these issues could adversely affect the assets and operations of us, Yanacocha or Conga, which could have a material adverse effect on our business, results of operations and financial position. Regulatory changes may include increased labor regulations, environmental and other regulatory requirements, and additional taxes and royalties, and we may experience future protests, community demands and road blockages. Additionally, any inability to continue to develop the Conga project or operate at Yanacocha could have a material adverse impact on our business, results of operations and financial position if Yanacocha is not able to replace its expected production.
Inflation, reduced economic growth and fluctuations in the Nuevo Sol exchange rate may adversely affect our financial condition and results of operations.
Over the past several decades, Peru has experienced periods of high inflation, slow or negative economic growth and substantial currency devaluation. The inflation rate in Peru, as measured by theIndice de Precios al Consumidor, or IPC, and published byInstituto Nacional de Estadística e Informática orINEI, has fallen from a high of 7,649.7 percent7,649.7% in 1990 to 2.6 percent4.40% in 2012.2015. The Peruvian currency has been devalued numerous times during the last 20 years. The devaluation rate has decreased from a high of 4,019.3 percent in 1990 to a revaluation of 5.5 percent in 2012. Our revenues and operating expenses are primarily denominated in U.S. Dollars. If inflation in Peru were to increase without a corresponding devaluation of the Nuevo Sol relative to the U.S. Dollar, our financial position and results of operations, and the market price of our Common Shares and ADSs, could be affected. Although the Peruvian government’s stabilization plan has significantly reduced inflation, and the Peruvian economy has experienced strong growth in recent years, there can be no assurance that inflation will not increase from its current level or that such growth will continue in the future at similar rates or at all.
Among the economic circumstances that could lead to a devaluation would be the decline of Peruvian foreign reserves to inadequate levels. Peru’s foreign reserves at December 31, 20122015 were US$64.061.54 billion as compared to US$48.862.35 billion at December 31, 2011. Although2014.Although actual foreign reserves must be maintained at levels that will allow the succeeding government the ability to manage the Peruvian economy and to assure monetary stability in the near future, there can be no assurance that Peru will be able to maintain adequate foreign reserves to meet its foreign currency denominated obligations, or that Peru will not devalue its currency should its foreign reserves decline. See “Item 3. Key Information—Information – A. Selected Financial Data—Data – Exchange Rates.”
Peru’s current account deficit is being funded partially by foreign direct investment. There can be no assurance that foreign direct investment will continue at current levels, particularly if adverse political or economic developments in Peru arise, a development that may also contribute to devaluation pressure.
Deterioration in economic and market conditions in Latin America, Peru and other emerging market countries could affect the prices of our Common Shares and American Depositary Receipts.
The market for securities issued by Peruvian companies is influenced by economic and market conditions in Peru and, to varying degrees, market conditions in other Latin American and emerging market countries. Within Peru, news of Ollanta Humala’s June 5, 2011 victory in the presidential election was followed by a 12 percent decline in both the Lima stock exchange (Bolsa de Valores de Lima, or BVL) and BVL’s mining sub-index the following day. The price of our American Depositary Receipts or ADRs, fell 15 percent. A number of banking analysts lowered their recommendations on Peruvian mining companies following the election as a result of concerns of higher taxes and delays in mining projects.(“ADRs”).
Although economic conditions are different in each country, the reaction of investors to developments in one country is likely to cause the capital markets in other countries to fluctuate. For example, political and economic events, such as the crises in Venezuela, Ecuador, Bolivia, Brazil and Argentina, have influenced investors’ perceptions of risk with regard to Peru. The negative investor reaction to developments in Latin America, particularly in our neighboring countries, may adversely affect the market for securities issued by countries in the region, cause foreign investors to decrease the flow of capital into Latin America and introduce uncertainty about plans for further integration of regional economies.
Peruvian exchange and investment control policies could affect dividends paid to holders of Common Shares and ADRs.
Peruvian law currently imposes no restrictions on the ability of companies operating in Peru to transfer foreign currency from Peru to other countries, to convert Peruvian currency into foreign currency or foreign currency into Peruvian currency or to remit dividends abroad, or on the ability of foreign investors to liquidate their investment and repatriate their capital. Prior toBefore 1991, Peru had restrictive exchange controls and exchange rates. During the latter part of the 1980s, exchange restrictions prevented payment of dividends to our shareholders in the United States in U.S. Dollars. Accordingly, should such or similar controls be instituted, dividends paid to holders of Common Shares and, consequently, holders of ADRs, could be affected. There can be no assurance that the Peruvian government will continue to permit such transfers, remittances or conversion without restriction. See “Item 10. Additional Information—Information – D. Exchange Controls.”
U.S. securities laws do not require us to disclose as much information to investors as a U.S. issuer is required to disclose, and you may receive less information about us than you might otherwise receive from a comparable U.S. company.
The corporate disclosure requirements applicable to us may not be equivalent to the requirements applicable to a U.S. company and, as a result, you may receive less information about us than you might otherwise receive in connection with a comparable U.S. company. We are subject to the periodic reporting requirements of the United States Securities Exchange Act of 1934, as amended, or the Exchange Act, that apply to “foreign private issuers.” The periodic disclosure required of foreign private issuers under the Exchange Act is more limited than the periodic disclosure required of U.S. issuers.
Holders of our securities may find it difficult to enforce judgments against us outside of Peru.
We are organized under the laws of Peru. A significant majority of our directors and officers reside outside the United States (principally in Peru). All or a substantial portion of our assets or the assets of such persons are located outside the United States. As a result, it may not be possible for investors to effect service of process within the United States upon us or upon such persons or to enforce against them in federal or state courts in the United States judgments predicated upon the civil liability provisions of the federal securities laws of the United States. We have been advised by our Peruvian counsel that there is uncertainty as to the enforceability, in original actions in Peruvian courts, of liabilities predicated solely under the United States federal securities laws and as to the enforceability in Peruvian courts of judgments of United States courts obtained in actions predicated upon the civil liability provisions of the United States federal securities laws.
Factors Relating to the Common Shares and ADSs
The concentration of our capital stock ownership with the Benavides Family will limit our stockholders’ ability to influence corporate matters.
The aggregate percentageAs of March 31, 2016, the Benavides family, referring to certain members, and their spouses, of the economic interestimmediate and extended family of our outstanding share capital controlled byElsa Ganoza Benavides, spouse of the late Alberto Benavides de la Quintana, our founder and former Chairman and Chief Executive Officer, and(collectively, the “Benavides Family”), held by certain members of his immediate and extended family and their spouses, or the Benavides Family, as of March 31, 2013 was 27.22 percent27.22% (including outstanding Common Shares and Investment Shares). of Buenaventura’s outstanding share capital. Because of the significant ownership interest the Benavides Family holds in common shares and because the InvestmentCommon Shares, held by others do not have voting rights, the Benavides Family has the power to elect a significant number of the outstanding directors and has significant influence over the outcome of substantially all matters to be decided by a vote of shareholders.
In addition, under the terms of the Amended and Restated Deposit Agreement dated May 3, 2002, as further amended and restated as of November 12, 2003, among us, The Bank of New York Mellon (formerly The Bank of New York), as depositary, or the Depositary,“Depositary”, and the owners and beneficial owners of ADSs, or the Amended and Restated Deposit Agreement, relating to our ADSs, if holders of ADSs do not provide the Depositary with timely instructions for the voting of Common Shares represented by such ADRs, the Depositary will be deemed to be instructed to give a person designated by us, which will likely be Albertoa member of the Benavides de la Quintana,Family, a discretionary proxy to vote such shares, unless we inform the Depositary that we do not wish such proxy to be given.
Shareholders’ rights under Peruvian law may be fewer and less well-defined than shareholders’ rights in other countries, including the United States.
Our shareholders have fewer and less well-defined rights under applicable Peruvian law than they might have as shareholders of a corporation incorporated in a jurisdiction of the United States or certain other countries. For example, Peruvian law does not provide for proceedings by which non-controlling shareholders may file class action lawsuits or shareholder derivative actions against controlling shareholders or officers and directors, and the procedural requirements to file shareholder actions in Peru differ from those of the United States. As a result, holders of our shares may face difficulty enforcing their rights.
A sale of a substantial number of shares by the Benavides Family could have an adverse impact on the price of our Common Shares and ADSs.
SalesThe sale of a substantial number of our shares by members of the Benavides Family, or a market perception of the intention of members of the Benavides Family to sell a substantial number of shares, could materially and adversely affect prevailing market prices for the Common Shares and ADSs. There is no contractual restriction on the disposition of shares of our share capital by our shareholders, including the Benavides Family. Furthermore, under theLey General de Sociedades PeruanaPeruanas, or Peruvian“Peruvian Companies Law,” any restriction on the free sale of shares in asociedad anónima abierta(open (open stock company) such as we are, is null and void.
Holders of ADSs may be unable to exercise preemptive rights and accretion rights available to the Common Shares underlying the ADSs.
Holders of the ADSs are, under Peruvian law, entitled to exercise preemptive rights and accretion rights on the Common Shares underlying the ADSs in the event of any future capital increase by us unless (x) the increase is approved, expressly stating that the shareholders have no preemptive rights to subscribe and pay for the Shares to be issued in such increase, by holders of Common Shares holding at least 40 percent40% of the Common Shares at a properly called meeting with a proper quorum and (y) the increase is not designed to improve directly or indirectly the shareholding of any shareholder. However, United States holders of ADSs may not be able to exercise through the Depositary for the ADSs the preemptive rights and accretion rights for Common Shares underlying their ADSs unless a registration statement under the Securities Act of 1933, as amended, or the Securities“Securities Act,” is effective with respect to such rights or an exemption from the registration requirement thereunder is available. Any such rights offering would have a dilutive effect upon shareholders who are unable or unwilling to exercise their rights. We intend to evaluate, at the time of any rights offering, the costs and potential liabilities associated with any registration statement as well as the associated benefits of enabling the holders of ADSs to exercise such rights and will then make a decision as to whether to file such a registration statement. Therefore, no assurance can be given that we will file any such registration statement. To the extent that holders of ADSs are unable to exercise such rights because a registration statement has not been filed and no exemption from such registration statement under the Securities Act is available, the Depositary will, to the extent practicable, sell such holders’ preemptive rights or accretion rights and distribute the net proceeds thereof, if any, to the holders of ADSs, and such holders’ equity interest in us will be diluted proportionately. The Depositary has discretion to make rights available to holders of ADSs or to dispose of such rights and to make any net proceeds available to such holders. If, by the terms of any rights offering or for any other reason, the Depositary is not able to make such rights or such net proceeds available to any holder of ADSs, the Depositary may allow the rights to lapse.
ITEM 4. Information on the Company
| ITEM 4. | Information on the Company |
In this Item 4, we present information first with respect to Buenaventura, followed by information with respect to Yanacocha, in which we have a 43.65 percent43.65% partnership interest.
BUENAVENTURA
A.
| A. | History and Development |
Overview
We are Peru’s largest publicly traded precious metals company and are engaged in the exploration, mining and processing of gold, silver and, to a lesser extent, other metals in Peru. We currently operate the Julcani, Recuperada, Orcopampa, Poracota, Uchucchacua, Antapite, Ishihuinca, Shila-Paula,Julcani, Mallay and Breapampa mines and have controlling interests in three other mining companies which operate the Colquijirca, Marcapunta,Colquijirca-Marcapunta, Tantahuatay and La Zanja mines.Wemines. We also own an electric power transmission company, a hydroelectric plant, a processing plant and an engineering services consulting company and have non-controlling interests in several other mining companies, including a significant ownership interest in Yanacocha, a Peruvian partnership that operates South America’sthe largest gold mine in South America, and Cerro Verde, a Peruvian company that operates a copper mine located in the south of Peru. For the year ended December 31, 2012,2015, our consolidated net sales were US$1,496US$919.4 million and our consolidated net incomeloss was US$684.7million.375.5 million.
Discontinued operations. In 2014, the Company publicly announced its decision to sell four of its mining units: Poracota, Recuperada, Antapite and Shila-Paula. As a consequence, these mining units are presented in the Financial Statements as mining units held for sale. According to IFRS 5 “Non-current Assets Held for Sale and Discontinued Operations,” the related assets and liabilities are presented in the consolidated statement of financial position at the lower of cost and fair value less cost to sale. The tablesdisposition of these discontinued mining units is expected to be completed by December 31, 2016 through sales to third parties. See Notes 1(e) and 2.4(x) to the Financial Statements.
The table below summarizesummarizes the total production and our equity share of production for the Julcani, Recuperada, Orcopampa, Poracota, Uchucchacua, Antapite, Ishihuinca, Shila-Paula, Mallay, Breapampa, Colquijirca-Marcapunta,Colquijirca, La Zanja, Tantahuatay, Yanacocha and Cerro Verde mines, as well as certain small assets for divestment, for the year ended December 31, 2012:2015:
| | | TOTAL PRODUCTION | | | BUENAVENTURA’S EQUITY SHARE OF PRODUCTION | | | Total Production | | | Buenaventura’s Equity Share of Production | |
| UNIT | | Buenaventura’s Equity Ownership | | | Silver Oz | | | Gold Oz | | | Lead DST | | | Zinc DST | | | Copper DST | | | Silver Oz | | | Gold Oz | | | Lead DST | | | Zinc DST | | | Copper DST | | | Buenaventura’s
Equity
Ownership | | | Silver
(oz.) | | | Gold
(oz.) | | | Lead
(t) | | | Zinc
(t) | | | Copper
(t) | | | Silver
(oz.) | | | Gold
(oz.) | | | Lead
(t) | | | Zinc
(t) | | | Copper
(t) | |
| | | | | | | | | | | | | | | | | | | | | | | | | |
| Orcopampa | | | 100 | % | | | 425,620 | | | | 260,379 | | | | - | | | | - | | | | - | | | | 425,620 | | | | 260,379 | | | | - | | | | - | | | | - | | | | 100 | % | | | 562,795 | | | | 204,629 | | | | - | | | | - | | | | - | | | | 562,795 | | | | 204,629 | | | | - | | | | - | | | | - | |
| Poracota | | | 100 | % | | | 16,181 | | | | 19,238 | | | | - | | | | - | | | | - | | | | 16,181 | | | | 19,238 | | | | - | | | | - | | | | - | | |
| Uchucchacua | | | 100 | % | | | 11,263,322 | | | | - | | | | 9,636 | | | | 10,824 | | | | - | | | | 11,263,322 | | | | - | | | | 9,636 | | | | 10,824 | | | | - | | | | 100 | % | | | 13,919,922 | | | | - | | | | 8,433 | | | | 5,692 | | | | - | | | | 13,919,922 | | | | - | | | | 8,433 | | | | 5,692 | | | | - | |
| Julcani | | | 100 | % | | | 2,438,084 | | | | 1,220 | | | | 2,529 | | | | - | | | | 423 | | | | 2,438,084 | | | | 1,220 | | | | 2,529 | | | | - | | | | 423 | | | | 100 | % | | | 3,266,453 | | | | 607 | | | | 2,592 | | | | - | | | | 339 | | | | 3,266,453 | | | | 607 | | | | 2,592 | | | | - | | | | 339 | |
| Recuperada | | | 100 | % | | | 467,475 | | | | - | | | | 3,516 | | | | 4,898 | | | | - | | | | 467,475 | | | | - | | | | 3,516 | | | | 4,898 | | | | - | | |
| Antapite | | | 100 | % | | | 13,254 | | | | 11,720 | | | | - | | | | - | | | | - | | | | 13,254 | | | | 11,720 | | | | - | | | | - | | | | - | | |
| Ishihuinca | | | 100 | % | | | - | | | | 4,016 | | | | - | | | | - | | | | 22 | | | | - | | | | 4,016 | | | | - | | | | - | | | | 22 | | |
| Shila-Paula | | | 100 | % | | | 95,485 | | | | 19,359 | | | | - | | | | - | | | | - | | | | 95,485 | | | | 19,359 | | | | - | | | | - | | | | - | | |
| Mallay | | | 100 | % | | | 682,708 | | | | 107 | | | | 4,952 | | | | 6,711 | | | | - | | | | 682,708 | | | | 107 | | | | 4,952 | | | | 6,711 | | | | - | | | | 100 | % | | | 1,285,361 | | | | - | | | | 7,193 | | | | 9,173 | | | | - | | | | 1,285,361 | | | | - | | | | 7,193 | | | | 9,173 | | | | | |
| Breapampa | | | 100 | % | | | 17,212 | | | | 8,817 | | | | - | | | | - | | | | - | | | | 17,212 | | | | 8,817 | | | | - | | | | - | | | | - | | | | 100 | % | | | 180,277 | | | | 13,757 | | | | - | | | | - | | | | - | | | | 180,277 | | | | 13,757 | | | | - | | | | - | | | | - | |
| Colquijirca & Marcapunta | | | 53.76 | % | | | 3,077,606 | | | | 10,229 | | | | 13,590 | | | | 38,525 | | | | 26,696 | | | | 1,654,521 | | | | 5,499 | | | | 7,306 | | | | 20,711 | | | | 14,352 | | |
| El Brocal | | | | 54.07 | % | | | 3,669,500 | | | | 11,263 | | | | 18,854 | | | | 53,319 | | | | 32,061 | | | | 1,984,098 | | | | 6,090 | | | | 10,194 | | | | 28,830 | | | | 17,335 | |
| La Zanja | | | 53.06 | % | | | 387,877 | | | | 112,387 | | | | - | | | | - | | | | - | | | | 205,808 | | | | 59,633 | | | | - | | | | - | | | | - | | | | 53.06 | % | | | 331,080 | | | | 141,071 | | | | - | | | | - | | | | - | | | | 175,671 | | | | 74,852 | | | | - | | | | - | | | | - | |
| Tantahuatay | | | 40.06 | % | | | 919,343 | | | | 141,268 | | | | - | | | | - | | | | - | | | | 367,737 | | | | 56,507 | | | | - | | | | - | | | | - | | | | 40.10 | % | | | 879,832 | | | | 144,782 | | | | - | | | | - | | | | - | | | | 352,769 | | | | 58,050 | | | | - | | | | - | | | | - | |
| Yanacocha | | | 43.65 | % | | | 553,092 | | | | 1,345,992 | | | | - | | | | - | | | | - | | | | 241,425 | | | | 587,526 | | | | - | | | | - | | | | - | | | | 43.65 | % | | | 447,375 | | | | 917,690 | | | | - | | | | - | | | | - | | | | 195,279 | | | | 400,572 | | | | - | | | | - | | | | - | |
| Cerro Verde | | | 19.58 | % | | | 2,134,632 | | | | - | | | | - | | | | - | | | | 307,594 | | | | 417,961 | | | | - | | | | - | | | | - | | | | 60,227 | | | | 19.58 | % | | | 1,989,059 | | | | - | | | | - | | | | - | | | | 246,973 | | | | 389,458 | | | | - | | | | - | | | | - | | | | 48,357 | |
| | | | | | | | | | | | | | | | | | | | | | | | | | | | | | | | | | | | | | | | | | | | | | |
| TOTAL PRODUCTION | | | | | | 22,491,891 | | | | 1,934,732 | | | | 34,223 | | | | 60,958 | | | | 334,735 | | | | 18,306,793 | | | | 1,034,021 | | | | 27,939 | | | | 43,144 | | | | 75,024 | | |
| Small assets for divestment | | | | 100 | % | | | 13,005 | | | | 17 | | | | 63 | | | | 56 | | | | - | | | | 13,005 | | | | 17 | | | | 63 | | | | 56 | | | | - | |
| Total Production | | | | - | | | | 26,544,658 | | | | 1,433,816 | | | | 37,135 | | | | 68,240 | | | | 279,373 | | | | 22,325,087 | | | | 758,575 | | | | 28,476 | | | | 43,750 | | | | 66,032 | |
Compañía de Minas Buenaventura S.A.A., asociedad anónima abierta (open stock company) under the laws of Peru,was originally established in 1953 as asociedad anónima (company)(stock company) under the laws of Peru, and currently operates under the laws of Peru. Our registered office is located at Carlos Villarán 790, Santa Catalina, La Victoria,Las Begonias 415 – Floor 19, Lima 13, Perú,27, Peru, telephone no. 5-11-419-2500.511-419-2500. Our Internet website address ismay be found at http://www.buenaventura.com. The information on our website is not a part of, and is not incorporated into, this document.
History
During the first several decades of our operations, we focused on the exploration and development of silver mines in Peru, including our Julcani, Orcopampa and Uchucchacua mines. Beginning in the early 1980s, we began to explore for gold and other metals in Peru to diversify our business and reduce our dependence on silver. We expanded our mineral reserves through property acquisition and intensive exploration programs designed to increase reserves and production of gold. We also conducted exploration leading to the discovery of gold mineralization and subsequent production of gold at our Orcopampa, Shila, IshihuincaLa Zanja, and AntapiteBreapampa mines. In addition, we made significant equity investments in Yanacocha, which operates South America’s largest gold mine, and Cerro Verde, which operates an open-pit copper mine in Peru.Peru, and Coimolache, which owns the Tantahuatay gold mine that we operate. As a result of these initiatives, the majority of our revenues are now derived from the production of gold.
In 2012, gold, copper, silver and other metals accounted for 59 percent, 19 percent, 18 percent and 4 percent, respectively,2014, we acquired 51% of our equity shareCanteras del Hallazgo S.A.C. (“CDH”), owner of revenuesthe Chucapaca Project, from our consolidated subsidiaries and our equity investees, Yanacocha, Cerro Verde andMinera Gold Fields Perú S.A. (“MGFPSA”). The Chucapaca Project involved a group of mining rights originally owned by MGFPSA. In 2008, Compañía Minera Coimolache S.A.de Minas Buenaventura S.A.A. entered into a contract of Mineral lease, Option of Transfer, Option to Operate a Project and Option to Acquire a Stake, with MGFPSA regarding these mineral rights.
Pursuant to this contract, Buenaventura would be the project’s operator and would retain the option to acquire 100% of the mineral rights through a payment of US$2 million. Likewise, MGFPSA would also have the option to operate a project that, during explorations conducted by Buenaventura, is identified as a project whose main mineral content is gold (a “Gold Project”), or Coimolache.in which case a new legal entity would be created to own the mineral rights to the project. Additionally, for this new legal entity, MGFPSA is awarded the right to purchase 51% of its shares as long as it fulfills its obligation to invest in explorations a sum equivalent to three times that which Buenaventura invested during the period it was the operator.
After Buenaventura discovered the ore deposit and it was identified as a gold project, CDH was created as owner to the project’s mineral rights; at which point MGFPSA, in charge of explorations in 2009, exercised its option to purchase 51% of CDH’s shares.
In August of 2014, Buenaventura purchased the totality of MGFPSA’s shares in CDH for a sale price of US$81 million and additional payments consisting of a Net Smelter Return Royalty of 1.5% in favor of MGFPSA for mining rights constituting the Chucapaca Project. Afterwards Buenaventura merged by absorption with CDH and registered the royalties in favor of MGFPSA in the title sheet of each one of the mining rights involved. Additionally, the Chucapaca Project has been renamed the San Gabriel Project. For more information about the San Gabriel Project, see “Item 4. B. Business Overview—Exploration Projects in Non-Operating Areas.”
Business Strategy
Our strategy is to sustain our position as Peru’s largest, publicly-traded gold and silver mining company by expanding our reserves and production. We are currently engaged in an active exploration and mine development program and participate in several mining exploration projects with Newmont Mining, Minera Gold Fields Peru S.A., or Gold Fields, and Southern Copper Corporation, or SCC.Corporación Aceros Arequipa S.A. and Compañia de Minas Caudalosa S.A.C. In addition, we seek to increase the efficiency and capacity of our mining operations. We are aware of our social and environmental responsibilities and aim to excel in the prevention, mitigation and rehabilitation of mining-related disturbances.
Maintaining an Active Exploration Program
We view an active exploration program as our primary means to obtain new reserves. As of December 31, 2012, we hold and currently evaluate, either directly or in conjunction with exploration partners, 230,896 hectares of mining rights, excluding an additional 443,393hectares in mining properties which are consolidated in our production units, including our La Zanja, Compañía Minera Colquirrumi S.A., or Colquirrumi, and Compañía de Exploraciones, Desarrollo e Inversiones Mineras S.A.C., or Cedimin, subsidiaries and our equity investee, Coimolache.
During 2012,2015, we spent approximately US$95.530.6 million on “greenfield”“exploration in non-operating areas” and US$153.091.5 million on “brownfield” exploration-related investments primarily“exploration in Peru and, to a lesser extent,units in Chile and Mexico.operations.” Our “greenfield”“exploration in non-operating areas” investments mainly focused on the following exploration projects: Trapiche, Tambomayo, San Gregorio, Chancas, Hualgayoc,Alejandra, Marcapunta Colquemayo, Surichata and El Faique.Pisacalla projects. Our “brownfield”“exploration in units in operations” investments were mainly focused in the Orcopampa, Poracota, Uchucchacua Antapite, Mallay, Recuperada and Julcani areas. We financed our 2012 exploration program with internal funds.mining units.
In 2013,2016, we intend to invest approximately US$100 to US$120 million in brownfield exploration projects. In 2013, we expect to invest approximately US$70 to US$80 million in exploration in units in operations and US$10 to US$20 million mainly in the following greenfield exploration projects:explorations in non-operating areas: Tambomayo, Trapiche, San Gregorio, Hualgayoc, ColquemayoYumpag, Palla Palla and El Faique,Daniela, among others.
Participation in Mining Exploration Agreements
In addition to managing and operating precious metals mines, we participate in mining exploration agreements with mining partners to reduce risks, gain exposure to new technologies and diversify revenues to include other base metals, such as copper and zinc. See “—B.“B. Business Overview—Overview – Exploration.” We believe that maintaining our focus on mining operations complements our partnership strategy because the engineering and geological expertise gained from such operations enhances our ability to participate in and contribute to those projects.
Capital Expenditures
Our capital expenditures induring the past three years have related principally to the acquisition of new mining properties, construction of new facilities and renewal of plant and equipment. Capital expenditures relating to exploration are not included in the table below and are discussed separately in “—B.“B. Business Overview—Overview – Exploration.” Set forth below is information concerning capital expenditures incurred by us in respect of each of our principal operating mines (not including capital expenditures for administrative purposes or other non-mining or non-energy subsidiaries) and by category of expenditure:
| | | Year Ended December 31, | | | Year Ended December 31, | |
| | | 2010 | | 2011 | | 2012 | | | 2013 | | | 2014 | | | 2015 | |
| | | | | (in thousands) | | | | | (US$ in thousands) | |
| Julcani | | US$ | 853 | | | US$ | 1,967 | | | US$ | 3,549 | | | | 8,927 | | | | 683 | | | | 7,056 | |
| Uchucchacua | | | 11,781 | | | | 10,689 | | | | 18,379 | | | | 16,038 | | | | 12,668 | | | | 22,140 | |
Orcopampa(a) | | | 17,490 | | | | 26,859 | | | | 19,047 | | | | 11,023 | | | | 8,963 | | | | 3,340 | |
| Recuperada | | | 1,284 | | | | 1,100 | | | | 2,224 | | |
| Ishihuinca | | | 17 | | | | 3 | | | | 139 | | | | 31 | | | | - | | | | - | |
| Shila-Paula | | | 1,429 | | | | 2,415 | | | | 3,012 | | |
| Colquijirca and Marcapunta(a) | | | 70,974 | | | | 64,013 | | | | 86,384 | | |
| Antapite | | | 302 | | | | 750 | | | | 1,126 | | |
| Colquijirca and Marcapunta | | | | 216,477 | | | | 105,477 | | | | 55,073 | |
| Conenhua | | | 3,204 | | | | 4,668 | | | | 5,760 | | | | 9,700 | | | | 670 | | | | 4,402 | |
| Mallay | | | 7,735 | | | | 36,058 | | | | 18,687 | | | | 16,643 | | | | 963 | | | | 3,627 | |
| Breapampa | | | - | | | | 20,314 | | | | 37,004 | | | | 16,233 | | | | 2,394 | | | | 3,398 | |
| La Zanja | | | 48,998 | | | | 34,043 | | | | 75,742 | | | | 84,858 | | | | 29,113 | | | | 57,950 | |
| Huanza | | | 62,828 | | | | 60,102 | | | | 66,378 | | | | 37,973 | | | | 16,373 | | | | 725 | |
| Río Seco | | | - | | | | 23,574 | | | | 62,163 | | | | 32,863 | | | | 10,064 | | | | 2,487 | |
| Molle Verde | | | | 24,166 | | | | 15,641 | | | | 4,049 | |
| Total | | US$ | 226,895 | | | US$ | 286,555 | | | US$ | 399,594 | | | | 474,931 | | | | 203,009 | | | | 164,247 | |
| | | Year Ended December 31,(a) | | | Year Ended December 31, | |
| | | 2010 | | 2011 | | 2012 | | | 2013 | | | 2014 | | | 2015 | |
| | | | | (in thousands) | | | | | (US$ in thousands) | |
| Machinery and equipment | | US$ | 12,658 | | | US$ | 5,622 | | | US$ | 3,462 | | | | 15,742 | | | | 11,741 | | | | 3,469 | |
| Infrastructure | | | 187,534 | | | | 222,743 | | | | 311,864 | | | | 352,115 | | | | 122,563 | | | | 44,973 | |
| Mining | | | 7,624 | | | | 23,325 | | | | 2,620 | | | | 91,407 | | | | 61,062 | | | | 27,431 | |
| Milling | | | 13,754 | | | | 5,533 | | | | 3,751 | | | | 6,338 | | | | 4,014 | | | | 4,199 | |
| Transportation | | | 1,108 | | | | 664 | | | | 316 | | | | 1,749 | | | | 368 | | | | 287 | |
| Communications | | | 309 | | | | 71 | | | | 562 | | | | 704 | | | | 85 | | | | 77 | |
| Environmental | | | 249 | | | | 105 | | | | 1,496 | | | | 339 | | | | 1,251 | | | | 64,528 | |
| Other | | | 3,659 | | | | 28,492 | | | | 75,523 | | | | 6,538 | | | | 1,925 | | | | 19,283 | |
| Total | | US$ | 226,895 | | | US$ | 286,555 | | | US$ | 399,594 | | | | 474,932 | | | | 203,009 | | | | 164,247 | |
| (a) | For 2010, 2011 and 2012, includes US$57.4 million, US$43.8 million and US$103.6 million, respectively, for the expansion of El Brocal plant from 6,000 metric tons per day to 18,000 metric tons per day. For 2010, includes $2.0 million for the development of the Orcopampa tailing dam retreatment project. For 2011 and 2012, includes US$55.6 million and US$57.6 million, respectively, for the construction of the Huanza hydroelectrical plant, US$20.3 million and US$37.0 million, respectively, for the construction of the Breapampa mine and facilities, US$36.1 million and US$18.7 million, respectively, for the construction of the Mallay mine and facilities and US$27.6 million and US$56.7 million, respectively, for the construction of the Rio Seco processing plant. |
We mainly financed our capital expenditures in 2010, 20112014 and 20122015 with internally-generated fundsfunds. We partially funded the El Brocal Expansion and a US$119 million financial lease agreement, which was used to financethe construction of the Huanza hydroelectric power station.plant with leasing facilities, with aggregate amounts of US$344.4 million outstanding thereunder as of December 31, 2015 (including US$156.3 and US$188.1 million, respectively). See “Item 5. Operating and Financial Review and Prospects—Buenaventura—Prospects – Buenaventura – B. Liquidity and Capital Resources—Resources – Long-Term Debt.”
We have budgeted approximately US$250 to US$300 million for capital expenditures for 2013.2016. We continuously evaluate opportunities to expand our business within Peru, as well as in other countries as opportunities arise, and expect to continue to do so in the future. We may in the future decide to acquire part or all of the equity of, or undertake other transactions with, other companies involved in the same business as us or in other related businesses. However, there can be no assurance that we will decide to pursue any such new activity or transaction.
Production
We principally produce refined gold and silver, either as concentrates or doré bars, and other metals such as lead, zinc and copper as concentrates that we distribute and sell locally and internationally. The following table sets forth the production of the Antapite,Orcopampa, Uchucchacua, Julcani, Uchucchacua, Orcopampa, Poracota, Recuperada, Mallay, Breapampa, Ishihuinca, Colquijirca, Marcapunta, La Zanja, and Shila-PaulaColquijirca - Marcapunta mines by type of product for the last three years, calculated in each case on the basis of 100 percent100% of the applicable mine’s production. Production from Cerro Verde, Yanacocha and Tantahuatay are not included in these production figures.
| | | Year Ended December 31,(1) | |
| | | 2010 | | | 2011 | | | 2012 | |
| Gold (oz.)(2) | | | 481,768 | | | | 524,101 | | | | 447,472 | |
| Silver (oz.) | | | 14,840,678 | | | | 16,724,717 | | | | 18,884,824 | |
| Zinc (ST)(3) | | | 49,151 | | | | 36,900 | | | | 60,958 | |
| Lead (ST) | | | 27,145 | | | | 24,029 | | | | 34,223 | |
| Copper (ST) | | | 19,012 | | | | 26,652 | | | | 27,141 | |
| | | Year Ended December 31,(1)(2) | |
| | | 2013 | | | 2014 | | | 2015 | |
| Gold (oz.) | | | 462,856 | | | | 438,426 | | | | 371,344 | |
| Silver (oz.) | | | 19,193,075 | | | | 20,119,162 | | | | 23,228,392 | |
| Zinc (t) | | | 46,178 | | | | 26,706 | | | | 68,240 | |
| Lead (t) | | | 29,757 | | | | 22,185 | | | | 37,135 | |
| Copper (t) | | | 27,845 | | | | 43,557 | | | | 32,400 | |
| (1) | The amounts in this table reflect the total production of all of our consolidated subsidiaries, including El Brocal and La Zanja, in which we owned a 53.76% and 53.06% controlling equity interest, respectively, as of December 31, 2012. The production data in this table reflect 100% of El Brocal’s and 100% of La Zanja’s production. For the years ended December 31, 2010, 2011 and 2012, El Brocal produced 2.5, 2.9 and 2.8 million ounces of silver, respectively, of which our equity share was 1.2, 1.6 and 1.4 million ounces of silver. For the years ended December 31, 2010, 2011 and 2012, La Zanja produced 43,727, 134,190 and 112,387 ounces of gold, respectively, of which our equity share was 23,201, 71,201 and 59,633 ounces of gold, and 38,155, 363,927 and 387,877 million ounces of silver, respectively, of which our equity share was 20,045, 193,100 and 205,808 million ounces of silver.Zanja. |
| (2) | Throughout this Annual Report, “oz.” refers to troy ounces of a fineness of 999.9 parts per 1,000, equal to 31.0135 grams. |
| (3) | Throughout this Annual Report, “ST” refers to short tons, each weighing 2,000avoirdupois pounds.Excludes production at four non-operating mines that are classified as discontinued operations. |
Exploration
We view exploration as our primary means of generating growth value for our shareholders and typically maintainmaintaining a portfolio of active exploration projects at various stages of exploration for mineral resources in Peru. We currently hold, either directly or in conjunction with exploration partners, 230,896 hectares of mining rights as part of our exploration program. We hold an additional 443,393 hectares in mining properties which are consolidated in our production units. We invested approximatelyDuring 2015, we spent US$95.430.6 million in exploration forMineralized Material Not“exploration in Reserve, or NRM,during 2012, including exploration related tonon-operating areas” mainly focused in the Trapiche, Tambomayo, San Gregorio, Chancas, Hualgayoc,Alejandra, Marcapunta Colquemayo, Surichata and El Faique projects.
In 2013,Pisacalla projects, and US$91.5 million on “exploration in units in operations” mainly focused in the Orcopampa, Uchucchacua and Julcani mining units. During 2016, we expect to invest approximately US$170.080 to US$200.0100 million in greenfieldthese exploration and brownfield exploration activities. Exploration programs at our principal operating mines are not included in our exploration budget and are accounted for as part of the operating costs for each mine. Exploration expenditures in greenfield and brownfield projects include all of the costs associated with geologists, contractors, engineering, drilling equipment, metallurgical testing and environmental, social, engineering and economic feasibility studies.
Our exploration team preparesdepartment develops programs and budgets for individual projects each year and we allocate, subject to board approval, the proper amount to financefund each particular exploration activity considered worthwhile. In lightprogram. Because of the nature of mining exploration and in order to maintain flexibility to take advantage of opportunities, we allocate budgeted amounts by property or project only in the case of high geological expectation as decided by management.Weprobability of success. We also allocate non-budgeted amounts over the course of the year to new projects based on factual results,that our needs and our geologists’ periodic evaluations and opinions regarding the progress of each opportunity and its potential for further exploration of minerals.technical team considers highly prospective.
An integral part of our exploration program is the participation in miningWe have active joint venture exploration agreements with affiliates of experiencedother mining companies, including Newmont Peru S.R.L., Compañía Minera Barrick Chile Limitada, Southern Copper Corporation, Gold Fields La CimaCorporación Aceros Arequipa S.A. and Minera Gold Fields Peru S.A. The benefits of these joint exploration projects include greater investment in theCompañia de Minas Caudalosa S.A.C. In this way we have access to financing for exploration of our own mining rights from the funds contributed by the partners, access to the assets of the partnersproperties as well as third-party properties without the costs and risks of outright acquisition, increased exposure to new exploration technologies and expansion of knowledge and sharing of experiences of management, geologists and engineers. In these mining exploration agreements, we may be the designated operator, an equity participant, the manager or a combination of these and other functions.
We generally do not conduct significant research and development activities other than our investments in geological research and exploration as described herein.
The following table lists our current mine developmentprincipal exploration projects in non-operating areas, our effective participation in each project, our partners with respect to each project, the total hectares in each project, observed mineralizationnumber of each project and exploration expenditures for each project during 2010, 2011 and 2012.
Exploration Projects | | Buenaventura’s Effective Participation | | | Principal Partners | | Property Hectares | | | Observed Mineralization | | Total Exploration Expenditures During 2010 | | | Total Exploration Expenditures During 2011 | | | Total Exploration Expenditures During 2012 | |
| | | At March 31, 2013 | | | | | Total (Buenaventura and Partners) | | | Buenaventura | | | Total (Buenaventura and Partners) | | | Buenaventura | | | Total (Buenaventura and Partners) | | | Buenaventura | |
| | | | | | | | | | | | | | | | | | | | | | | | |
| | | | | | | | (US$ in millions) | | | (US$ in millions) | | | (US$ in millions) | |
| | | | | | | | | | | | | | | |
| Buenaventura’s Projects: | | | | | | | | | | | | | | | | | | | | | | | | | | | | | |
| | | | | | | | | | | | | | | | | | | | | | | | | | | | | | |
| Breapampa(1) | | | 100.00 | % | | None | | | 41,866 | | | Gold & silver | | | 1.05 | | | | 1.05 | | | | 4.70 | | | | 4.70 | | | | 0.40 | | | | 0.40 | |
| Mallay(2) | | | 100.00 | % | | None | | | 7,030 | | | Silver, lead & zinc | | | 9.78 | | | | 9.78 | | | | 10.30 | | | | 10.30 | | | | 8.0 | | | | 8.0 | |
| | | | | | | | | | 99,459 | | | | | | 12.74 | | | | 11.84 | | | | 15.77 | | | | 15.41 | | | | 1.20 | | | | 1.20 | |
| (1) | Prior to 2010, Breapampa was classified as a greenfield exploration project. |
| (2) | Prior to 2010, Mallay was classified as a brownfield exploration project. Includes 2010 Tinta, Condorsenja and Isguiz exploration costs. |
The following table lists our current greenfield exploration projects, our effective participation in each project, our partners with respect to each project, the total hectares in each project, observed mineralization of each project and the exploration expenditures for each project during 2010, 20112014 and 2012.2015.
Exploration Projects(1)(2) | | Buenaventura’s Effective Participation | | | Principal Partners | | Property Hectares | | | Observed Mineralization | | Total Exploration Expenditures During 2010 | | | Total Exploration Expenditures During 2011 | | | Total Exploration Expenditures During 2012 | |
| | | at March 31, 2013 | | | | | Total (Buenaventura and Partners) | | | Buenaventura | | | Total (Buenaventura and Partners) | | | Buenaventura | | | Total (Buenaventura and Partners) | | | Buenaventura | |
| | | | | | | | | | | | | | | | | | | | | | | | |
| | | | | | | | (US$ in millions) | | | (US$ in millions) | | | (US$ in millions) | |
| | | | | | | | | | | | | | | |
| Joint Venture Projects: | | | | | | | | | | | | | | | | | | | | | | | | | | | | | | | | | | | | |
| | | | | | | | | | | | | | | | | | | | | | | | | | | | | | | | | | | | | |
| Hualgayoc | | | 50.00 | % | | Gold Fields | | | 15,417 | | | Silver, zinc & lead | | | 0.65 | | | | 0.32 | | | | 2.98 | | | | 1.49 | | | | 3.60 | | | | 1.80 | |
| Lucanas | | | 60.00 | % | | Sumitomo | | | 0 | | | Copper & gold | | | 0.19 | | | | 0.12 | | | | - | | | | - | | | | — | | | | — | |
Exploration Projects(1)(2) | | Buenaventura’s Effective Participation | | | Principal Partners | | Property Hectares | | | Observed Mineralization | | Total Exploration Expenditures During 2010 | | | Total Exploration Expenditures During 2011 | | | Total Exploration Expenditures During 2012 | |
| | | at March 31, 2013 | | | | | Total (Buenaventura and Partners) | | | Buenaventura | | | Total (Buenaventura and Partners) | | | Buenaventura | | | Total (Buenaventura and Partners) | | | Buenaventura | |
| | | | | | | | | | | | | | | | | | | | | | | | |
| | | | | | | | (US$ in millions) | | | (US$ in millions) | | | (US$ in millions) | |
| | | | | | | | | | | | | | | |
| Buenaventura’s Projects: | | | | | | | | | | | | | | | | | | | | | | | | | | | | | | | | | | | | |
| | | | | | | | | | | | | | | | | | | | | | | | | | | | | | | | | | | | | |
| Chaje | | | 100.00 | % | | None | | | 18,400 | | | Gold | | | 1.05 | | | | 1.05 | | | | 0.21 | | | | 0.21 | | | | 0.02 | | | | 0.02 | |
| Colquemayo | | | 100.00 | % | | None | | | 28,800 | | | Gold, silver & copper | | | 2.46 | | | | 2.46 | | | | 4.29 | | | | 4.29 | | | | 4.33 | | | | 4.33 | |
| El Faique | | | 100.00 | % | | None | | | 13,209 | | | Copper, zinc & gold | | | 0.49 | | | | 0.49 | | | | 0.62 | | | | 0.62 | | | | 0.96 | | | | 0.96 | |
| Pachuca Norte | | | 100.00 | % | | None | | | 31,000 | | | Silver & gold | | | - | | | | - | | | | 4.02 | | | | 4.02 | | | | 0.00 | | | | 0.00 | |
| Pisqahuanca(3) | | | 70.00 | % | | None | | | 0 | | | Silver & gold | | | 0.18 | | | | 0.18 | | | | 1.65 | | | | 1.65 | | | | - | | | | - | |
| Surichata | | | 100.00 | % | | None | | | 700 | | | Silver, zinc & lead | | | - | | | | - | | | | 0.38 | | | | 0.38 | | | | 1.28 | | | | 1,28 | |
| Terciopelo(4) | | | 100.00 | % | | None | | | 0 | | | Gold & copper | | | 1.36 | | | | 1.36 | | | | 0.14 | | | | 0.14 | | | | - | | | | - | |
| Trapiche | | | 100.00 | % | | None | | | 37,291 | | | Copper & molybdenum | | | 1.39 | | | | 1.39 | | | | 3.10 | | | | 3.10 | | | | 15.91 | | | | 15.91 | |
| Others(5) | | | 100.00 | % | | None | | | 172,577 | | | Gold & polymetallic | | | - | | | | - | | | | 3.55 | | | | 3.55 | | | | 6.65 | | | | 4.85 | |
| | | | | | | | | | 301,977 | | | | | | 28.95 | | | | 17.75 | | | | 88.46 | | | | 53.45 | | | | 29.15 | | | | 27.35 | |
Exploration
Projects(1)(2) | | Buenaventura’s
Effective
Participation | | | Principal
Partners | | | Property
Hectares | | | Observed
Mineralization | | Total Exploration
Expenditures During
2014 | | | Total Exploration
Expenditures During
2015 | |
| at March 31, 2016 | | Total
(Buenaventura
and Partners) | | | Buenaventura | | | Total
(Buenaventura
and Partners) | | | Buenaventura | |
| | | | | | | | | | | | | | (US$ in millions) | | | (US$ in millions) | |
| Buenaventura’s Projects: | | | | | | | | | | | | | | | | | | | | | | | | | | | | | | |
| Tambomayo | | | 100 | % | | | | | | | 3,900 | | | Gold, silver, lead and zinc | | | 11.51 | | | | 11.51 | | | | 11.19 | | | | 11.19 | |
| San Gabriel | | | 100 | % | | | | | | | 4,600 | | | Gold, Silver and Copper | | | 0.00 | | | | 0.00 | | | | 1.33 | | | | 1.33 | |
| Pisacalla | | | 100 | % | | | | | | | 2,100 | | | Gold | | | 0.51 | | | | 0.51 | | | | 0.74 | | | | 0.74 | |
| Trapiche | | | 100 | % | | | | | | | 4,600 | | | Copper and Molybdenum | | | 1.14 | | | | 1.14 | | | | 0.64 | | | | 0.64 | |
| Palla Palla | | | 100 | % | | | | | | | 3,282 | | | Gold and Silver | | | 0.42 | | | | 0.42 | | | | 0.42 | | | | 0.42 | |
| Livitaca | | | 100 | % | | | | | | | 10,600 | | | Gold and Cooper | | | 0.64 | | | | 0.64 | | | | 0.35 | | | | 0.35 | |
| San Gregorio | | | 54.07 | % | | | | | | | 4,382 | | | Zinc | | | 0.00 | | | | 0.00 | | | | 0.03 | | | | 0.02 | |
| (1) | This table does not include projects abandoned by us, consolidated mining units or those placed on hold prior to 2010. |
| (2) | In addition to these projects, we continue to conduct exploration at all of our operating mines and our subsidiaries. |
| (3)(2) | This project was terminated in 2011.Only includes explorations conducted by Buenaventura. |
| (4)22 | This project was terminated in 2012. |
| (5) | Includes generative exploration in new areas. |
The following table lists the mines in which we directed our current brownfield exploration projects, our effective participation in each project, the total hectares in each project, observedprincipal explorations efforts, mineralization of each projectmine and the exploration expenditures for each project during 2010, 20112014 and 2012.2015.
Exploration Projects | | Buenaventura’s Effective Participation | | | Principal Partners | | Property Hectares | | | Observed Mineralization | | Total Exploration Expenditures During 2010 | | | Total Exploration Expenditures During 2011 | | | Total Exploration Expenditures During 2012 | |
| | | at March 31, 2013 | | | | | Total (Buenaventura and Partners) | | | Buenaventura | | | Total (Buenaventura and Partners) | | | Buenaventura | | | Total (Buenaventura and Partners) | | | Buenaventura | |
| | | | | | | | | | | | | | | | | | | | | | | | |
| | | | | | | | (US$ in millions) | | | (US$ in millions) | | | (US$ in millions) | |
| | | | | | | | | | | | | | | |
| Buenaventura’s Projects: | | | | | | | | | | | | | | | | | | | | | | | | | | | | | | | | | | | | |
| | | | | | | | | | | | | | | | | | | | | | | | | | | | | | | | | | | | | |
| Orcopampa | | | 100.00 | %1 | | None | | | 18,000 | | | Gold & silver | | | 2.91 | | | | 2.91 | | | | 2.41 | | | | 2.41 | | | | 6.90 | | | | 5.85 | |
| | | | | | | | | | | | | | | | | | | | | | | | | | | | | | | | | | | | | |
| Yumpag(1) | | | 100.00 | % | | None | | | 1,847 | | | Silver, lead & zinc | | | 0.75 | | | | 0.75 | | | | 1.25 | | | | 1.25 | | | | 0.41 | | | | 0.41 | |
| Anamaray(1) | | | 100.00 | % | | None | | | 4,380 | | | Zinc, lead & silver | | | 0.64 | | | | 0.64 | | | | 1.70 | | | | 1.70 | | | | 2.19 | | | | 2.19 | |
| Mallay | | | 100.00 | % | | None | | | 2,300 | | | Zinc, lead & silver | | | 9.78 | | | | 9.78 | | | | 10.32 | | | | 10.32 | | | | - | | | | - | |
| Chanca(2) | | | 100.00 | % | | None | | | 3,880 | | | Silver | | | 1.40 | | | | 1.40 | | | | 3.69 | | | | 3.69 | | | | 10.98 | | | | 10.98 | |
| Julcani-Recuperada(3) | | | 100.00 | % | | None | | | 3,213 | | | Silver | | | 0.72 | | | | 0.72 | | | | 0.14 | | | | 0.14 | | | | 0.84 | | | | 0.84 | |
| Antapite | | | 100.00 | % | | None | | | 22,075 | | | Gold | | | 0.14 | | | | 0.14 | | | | - | | | | - | | | | - | | | | - | |
| Poracota(4) | | | 100.00 | % | | None | | | 6,680 | | | Gold & silver | | | 0.78 | | | | 0.78 | | | | 0.94 | | | | 0.94 | | | | 2.06 | | | | 2.06 | |
| Shila-Paula(6) | | | 100.00 | % | | None | | | 30,318 | | | Gold & silver | | | 1.90 | | | | 1.90 | | | | 6.57 | | | | 6.57 | | | | 16.97 | | | | 16.97 | |
| | | | | | | | | | | | | | | | | | | | | | | | | | | | | | | | | | | | | |
| | | | | | | | | | 96,865 | | | | | | 19.01 | | | | 19.01 | | | | 27.02 | | | | 27.02 | | | | 40.35 | | | | 39.25 | |
Operating
Units | | Observed
Mineralization | | Total Exploration
Expenditures During
2014 | | | Total Exploration
Expenditures During
2015 | |
| | | | | Total | | | Buenaventura | | | Total | | | Buenaventura | |
| | | | | (US$in millions) | | | (US$in millions) | |
| Buenaventura’s Units: | | | | | | | | | | | | | | | | | | |
| Orcopampa | | Silver and Gold | | | 51.82 | | | | 51.82 | | | | 41.71 | | | | 41.71 | |
| Uchucchacua | | Silver, lead and zinc | | | 26.63 | | | | 26.63 | | | | 27.78 | | | | 27.78 | |
| Julcani | | Silver | | | 10.98 | | | | 10.98 | | | | 12.70 | | | | 12.70 | |
| Mallay | | Zinc, lead and silver | | | 7.81 | | | | 7.81 | | | | 7.54 | | | | 7.54 | |
| Breapampa | | Gold | | | 0.49 | | | | 0.49 | | | | 1.82 | | | | 1.82 | |
| La Zanja | | Gold | | | 0.12 | | | | 0.12 | | | | 0.04 | | | | 0.04 | |
| Marcapunta | | Copper & Gold | | | 4.2 | | | | 2.27 | | | | 0.00 | | | | 0.00 | |
| (1) | Includes part of brownfield exploration costs of Uchucchacua (Yumpag, San Francisco and Anamaray mines). |
| (2) | Includes exploration costs of Candelaria and Santa Rosa (part of our brownfield explorations of the Mallay mine). |
| (3) | Includes exploration costs of Escopeta, Carmela and Patara prospects (part of our brownfield explorations of the Recuperada mine). |
| (4) | Includes exploration costs of Huamanihuayta Oeste (part of our brownfield explorations of the Poracota mine). |
| (5) | Includes exploration costs of Pucay (through option agreement with SCC) and Pariguanas (through joint venture with Minera Ares), in addition to our own Saya, Aseruta, Ocoruro and Quello projects. |
| (6) | Includes exploration and development costs of Tambomayo (formerly known as the Tuyumina project) and Japotani (part of our brownfield explorations of the Shila-Paula mine). |
The following is a brief summary of current mine development and exploration activities conducted by usBuenaventura directly and through joint exploration agreements, which we believe represent the best prospects for discovering new reserves. There can be no assurance, however, that any of our current exploration projects will result in viable mineral production or that any of the mineralization identified to date will ultimately result in an increase in our ore reserves. Non-reserve mineralization has been included in our 2012 Annual Report from the Tantahuatay, Chucapaca, Tambomayo, Parihuanas, Breapampa, Mallay and Yumpag exploration and mine development projects.SetSet forth below is a map of all of our mine development andprincipal exploration projects in Peru as of December 31, 2012:2015.
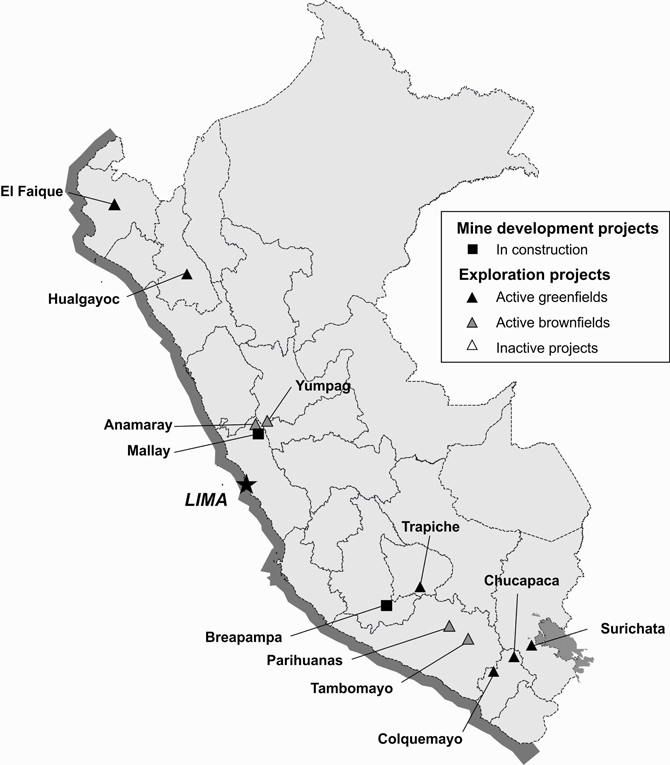
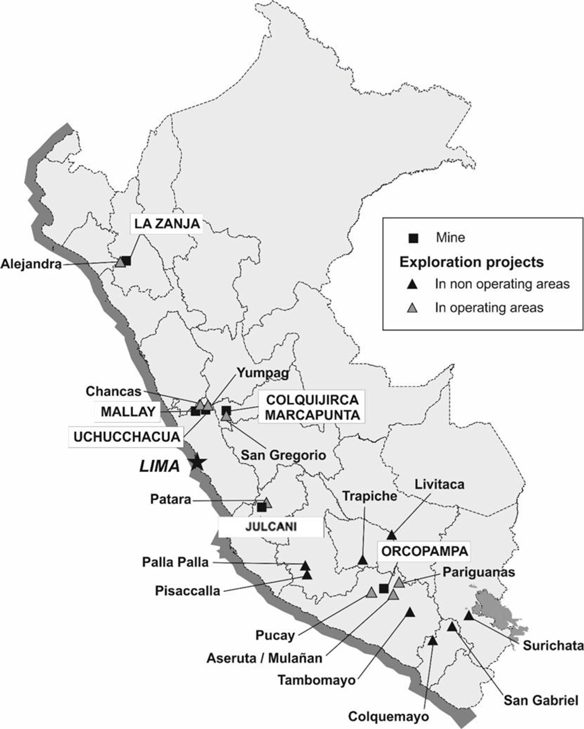
Greenfield Exploration Projects in Non-Operating Areas
Chucapaca.Tambomayo. The ChucapacaTambomayo project is located 50 kilometers southeast of the Orcopampa mine and includes a total of 1,600 hectares of mining properties. This project is a gold-copper-silver greenfield exploration project wholly owned by Canteras del Hallazgo S.A.C., or CDH, which is 51 percent-owned by Minera Gold Fields Peru S.A.low sulfidation epithermal deposit with significant gold and 49 percent-owned by us. The project encompasses a total of 12,900 hectares of mining concessions owned by CDH, which are locatedsilver mineralization in the Moquegua region in southern Peru. Our preliminary exploration activities at the Chucapaca project have included geophysical magnetic surveys, induced polarization surveys and diamond drilling, which resulted in the discovery of gold mineralization. During 2012, our equity investment in CDH was US$32.4 million, which was mainly for the preparation of a feasibility study. During 2013, CDH intends to conduct infill diamond drilling in the underground areas.veins. As of December 31, 2012, CDH2015, we had estimated resources of 1.08 million tons, with 9.4 grams per ton of gold, 9.3 ounces per ton of silver, 2.0% lead and 3.0% zinc. In addition, we had estimated a non-reserve mineralization (“NRM”) of 0.77 million tons, with 9.6 grams per ton of gold, 4.1 ounces per ton of silver, 1.8% lead and 3.3 percent zinc. The project is currently in its development phase, and the construction of the mine is well advanced with seven levels completed and with encouraging drill intercepts at lower levels. Construction permits were granted in June 2015 for a 1,500 tons-per-day plant. In 2016, we will focus our exploration efforts in the Mayra and Gaby prospects. We plan to invest US$1.39 million to conduct geological mapping and sampling. In addition, we expect to obtain environmental permits and surface rights for a drilling campaign at the Asuncion vein.
San Gabriel. San Gabriel is located in the region of Moquegua and is wholly-owned by Buenaventura. This deposit is an intermediate sulfidation deposit hosted by diatreme breccia body at the sediment-intrusive contact. As of December 31, 2015 we estimated a NRM for the Chucapaca project to be 132.7of 12.25 million tons, with an average grade of 1.46.5 grams per ton of gold and 10.8 grams per ton of silver. Exploration expenses relatedgold. We began using a mine ramp in June 2015 in order to this project are not consolidated in Buenaventura’s financial results, but are reflected in “Shareexplore opportunities for additional diamond drilling in the resultsCanahuire ore body and to obtain bulk samples for metallurgical tests. In addition, we completed 3,418 meters of associates”diamond drilling in Buenaventura’s Consolidated Income Statement. See Note 9the Pachacutec prospect without positive results. In 2016, we plan to the Financial Statements.invest US$2.69 million to conduct diamond drilling and to carry out geological mapping and sampling to define new exploration targets.
Trapiche. The Trapiche project is wholly owned by us and encompasses 29,798consists of 30,591 hectares of mining concessions, owned by us, with porphyry copper and skarn mineralization in the Apurimac region.region, Antabamba province and Juan Espinoza Medrano district. The Apurimac region is part of a mineralized belt known as the Abancay Batholith where several iron, copper and gold deposits have been identified. Our exploration activities at the Trapiche project have included diamond drilling and magnetic and induced polarization surveys. In 2011, we negotiated and obtained a 30-year lease with the Mollebamba community for 2,300 hectares of surface rights to conduct infill and additional diamond drilling and other engineering studies. We invested US$3.1 million in payments to the local community, to start preliminary engineering studies and to restart drilling at the end of 2011. We created a new company to operate the Trapiche project, El Molle Verde S.A.C, which is wholly owned by us, and we leased all mining properties to the new company. In 2012, we invested US$16.1 million to conduct 26,000 meters of diamond drilling, both into the copper oxide zone and as an infill program into the porphyry area, and to conduct 3,714 meters of diamond drilling for metallurgical testing. Independent consultant AMEC plc also conducted a preliminary engineering study of this area. We currently do not plan to make further investments in the Trapiche project in 2013. As of December 31, 2012,2015, we estimated a NRM of 925 million tons for the Trapiche project, to be 571 million tons, with an average grade of 0.46 percent0.39% of copper, and 0.075 percent0.01% of molybdenum into the Trapiche porphyry and Millocucho skarn.
Hualgayoc. Hualgayoc is3.2 grams per ton of silver. During 2016 we expect to have a silver, zinc and lead exploration project,positive scoping study for a leach only alternative. We estimate there are 251 million tons of leachable material with copper and gold potential, owned by Consolidada de Hualgayoc S.A., or Consolidada, which is 50 percent owned by Colquirrumi, our 99.99 percent-owned subsidiary, and 50 percent owned by Gold Fields La Cima S.A.A., a wholly-owned subsidiaryan average grade of Gold Fields. Colquirrumi has been the operator of the project since 2011. Consisting of 15,417 hectares of mining concessions owned by Consolidada, the project is located0.54% copper in the Hualgayoc district, Cajamarca region. During 2012, we invested US$5.7 million to conduct 7,143 meters of diamond drilling and, in 2013, we intend to invest US$1.0 million to continue our drilling campaign.
project.
El Faique.
Pisaccalla.The El Faique project is wholly owned and operated by us. The project encompasses 13,209 hectares of mining concessions owned by us and is located in the Sechura desert of northern Peru in the Piura region. The El FaiquePisaccalla project consists of a deep massive sulfide deposit evidenced by diamond drilling. Pursuant to our exploration program, we have invested in social infrastructure and support for local communities in order to obtain surface permits and properties. In 2012, we invested US$1.0 million to continue our efforts to negotiate with local communities. In 2013, we plan to invest US$2.5 million to conduct a diamond drilling campaign. We are working to obtain community consent and environmental permits in the second half of 2013.
Colquemayo.The Colquemayo project is wholly owned by us and encompasses 28,80011,331 hectares of mining concessions located in the MoqueguaAyacucho region in southern Peru 70 kilometers southwestand is wholly-owned by Buenaventura. In 2015, we explored 822 meters of the Chucapaca project.Accocuruz project through diamond drilling without positive results. We do not plan to conduct any further work in this project and all exploratory surface work has been remediated. On the other hand, in the geological mapping and sampling for the Ccelloccasa project, we identified 5.33 kilometers of outcropping veins with encouraging results. During 2016, we plan to carry out a geophysical survey and obtain the necessary environmental and social permits in order to conduct a drilling campaign in 2017.
Livitaca. The Livitaca project is located in tertiary volcanic rocks covered by younger volcanic events. The high sulfidation alteration system covers an area of 40 square kilometers. During 2012, we invested US$4.0 million to conduct 5,319 meters of diamond drilling and, during 2013, we intend to invest US$1.5 million to continue drilling.
Surichata. Surichata is a new exploration project locatedthe Cusco region in the Puno region of southern Peru, consisting8 kilometers north of 17,800the Constancia copper project owned by Hudbay. The project consists of 9,095 hectares of mining concessions owned by Corporación Aceros Arequipa S.A., which has leased those hectares to Cía. de Minas Cerro Hablador S.A.C., our newly formed wholly-owned subsidiary. The project is an iron skarn with surrounding gold and copper mineralization. In 2015, we determined that the project does not have adequate potential. We do not plan to carry out any additional work at this project.
Palla Palla. Palla Palla is located in the Ayacucho region. The property consists in 6,894 hectares of mining concessions owned by Cia. de Minas Caudalosa S.A., which we own 15,900has leased those hectares and lease 1,900 hectares fromto Minera JoncijircaAzola S.A.C. The Surichata project shows evidence of epithermal silver enriched polymetallic veins. In 2012, we invested US$1.1 million, our wholly-owned subsidiary. We are working to conduct 2,932 meters ofobtain the environmental permit needed to execute a diamond drilling as partcampaign of a first-pass4,000 meters at the Cerro Runtus project during the second half of 2016.
San Gregorio. The drilling campaign. In 2013,program at this project continues to be suspended due to the opposition of the Vicco community. We have resumed discussions with the community and, due to the active participation of the Conflict Resolution Office, an entity operating under the auspices of thePresidencia del Consejo de Ministros(“PCM”), in such discussions, we planexpect to invest US$3.1 million in a secondresume the drilling campaign.program at this project.
Brownfield
Exploration Projectsin Operating Areas
Uchucchacua. The Uchucchacua brownfield exploration project is located throughout 8,430 hectares of our mining and exploration properties and 1,500 hectares of property owned by a joint venture between us and Minera Focus S.A.C. We are currently focusing our exploration efforts on three prospects: Anamaray,the Yumpag and Chanca.
The Anamaray prospectproject, which is considered an epithermal deposit of silver, lead and zinc in a setting of tectonic breccias and veins in cretaceous limestone. In 2012, we invested US$2.19 million to explore the parallel veins close to the Falla longitudinal fault and explore the San Francisco mineralized structure in greater depth with 5,253 meters of diamond drilling and 2,205 meters of underground tunnels. We decided to halt our exploration of the Anamaray prospect at the end of 2012 due to disappointing results, and do not plan to invest further in this prospect in 2013.
The Yumpag prospect consists of 1,847 hectares located 4four kilometers northeast of the Uchucchacua mine. The Yumpag prospectproject is an epithermal deposit of silver lead, zinc and manganesedeposit, structurally influenced by the Cachipampa geologicalfault. This fault which also influences significant areas of silver mineralization at the Uchucchacua mine. During 2012,2015, we invested US$0.413.63 million mainly to complete mine audits and obtain necessary permits. In 2013, we plan to invest approximately US$5.74 million to complete 2,150 meters of tunnels and undertake 1,500completed 8,398 meters of diamond drilling in an effort to continue exploration of the Yumpag prospect.and conducted metallurgical tests with encouraging results. As of December 31, 2012,2015 we had estimated NRM of 147,096 dry short0.63 million tons, or DST, with 9.2626.3 ounces per ton of silver, 0.016 ounces per ton of gold, 1.68 percent0.5% lead, 1.3% zinc and 1.23 percent zinc.
Mallay. Our exploration efforts19.3% manganese. In 2016, we expect to invest US$2.30 million in this area include the old Chanca silver mine and surrounding area of Chanca, which encompasses the Candelaria, Santa Rosa and Chiptaj brownfield exploration areas.
The Chanca prospect is located in the province of Oyón, department of Lima, about 15 kilometers northwest of Mallay-Isguiz and adjacentorder to the old Chanca silver mine. The Chanca prospect consists of about 3,880 hectares, including the Chiptaj exploration area, and 1,500 hectares of what has historically been a joint venture between us and Minera Focus S.A.C. During 2012, we invested US$10.00 million and completed 10,421conduct 8,000 meters of diamond drilling and 3,906 meters of exploration tunnels, focusing primarily on the Shirley, Tarazca, Poderoso, Candelaria and Santa Rosa veins. In 2013, we plan to invest US$4.80 million to complete 4,200 meters of exploration tunnels and 7,200 meters of diamond drilling.at this project.
Orcopampa. The Orcopampa brownfieldDuring 2015, our main exploration focus was in the Pucay project, is located on a total of 18,000 hectares of our mining and exploration concessions and 6,850 hectares of property to which we have access as a result of option agreements with SCC (in respect of Pucay) and Compañía Minera Ares S.A.C., or Minera Ares (in respect of Pariguanas). We are currently focusing our exploration efforts on Pariguanas, Ocoruro, Quello and Aseruta.
The Pariguanas project is located 243.5 kilometers northeast of Chipmo and consists of 4,440 hectares, 2,240 hectares of which we own and 2,200 hectares to which we have access as a result of a joint venture agreement with Minera Ares. Pariguanas is considered an epithermal low sulfidation deposit mainly of silver and gold. During 2012, we invested US$2.69 million in diamond drilling works.
The Ocoruro project consists of 2,085 hectares and is located 2 kilometers west of the Chipmo mine. In 2012, we continued the diamond drilling campaign to define a mineralized vein system with gold and silver deposits, which we classified as low sulphidation epithermal deposits. In 2012, we invested US$2.75 million, mainly in diamond drilling. In 2013, we plan to invest US$1.40 million to complete a diamond drilling program and conduct geophysical surveys.
The Quello project consists of 1,118 hectares and is located 3.3 kilometers northwestsouthwest of the Chipmo mine. This project consists of 2,400 hectares of mining concessions owned by SCCO, which leased those hectares to Apu Coropuna S.R.L., our newly formed wholly-owned subsidiary. In Pucay, we focused on the Anquicha project, which shows encouraging results of epithermal gold mineralization in sandstone-hosted oxidized fractures and breccias. Preliminary column leach tests show gold recoveries of around 89%. In 2016, we will continue geological mapping and sampling at the Anquicha and Huiscatori projects.
The Alejandra - La Zanja. In April 2015, we ceased underground explorations in the Alejandra vein. As of December 31, 2015, we estimated a systemNRM of veins that contain gold. In 2012, we performed a geophisycal survey which showed two interesting geophisycal anomalies that may be related to the mineralized structures Sausa Norte0.22 million tons, with 10.4 grams per ton of gold and Sausa Centro. During 2012,170 grams per ton of silver. Additionally, we invested US$0.776.6 million mainlyto conduct geological mapping, sampling and a geophysical survey in geological surveys. In 2013, we planthe northeast extension of the Alejandra trend, which allowed us to identify a series of echelon epithermal veins with encouraging values in gold and silver. We expect to invest US$1.5 million in order to explore mineralized structures that were evidenced by our geophysical survey.
The Aseruta-Allhuire project consists of 2,925 hectares and is located 8 kilometers southeast of the town of Orcopampa. It consists of a system of veins with mainly silver content. We performed geophysical studies, which showed mapped veins and probable hydrothermal breccia body at depth. During 2012, we invested US$0.29 million, mainly to perform geological mapping and sampling. In 2013, we plan to invest US$1.50 million to develop a diamond drilling program at the main veins.
Poracota.The Poracota brownfield exploration project currently encompasses 6,680 hectares of mining concessions owned and operated by us and is located 20 kilometers west of the Orcopampa mine in southern Peru. The mineral deposit is considered an epithermal high sulfidation system, hosted in volcanic rocks, mainly tuffs. The deposit is comprised of two main areas, Huamanihuayta and Perseverancia.
The Huamanihuayta Oeste project consists of 440 hectares and is located 1 kilometer southwest of the Poracota mine. In 2012, we invested US$2.07 million in diamond drilling, focusing primarily in the southwest extension of the main veins María Fe, Silvana and Malena. We also explored additional veins that are part of the vein system for the Poracota mine. In 2013, we plan to invest US$1.0 million to continue exploration of these veins and the Faculla and Soras projects, which consist of 1,102 hectares.
Julcani-Recuperada. The Julcani-Recuperada brownfield exploration project currently encompasses 3,213 hectares of mining concessions and is wholly owned and operated by us. During 2012, we invested US$0.84 million to perform geological surveys, outcrops sampling and 792conduct 5,000 meters of diamond drilling. In 2013, we expect to invest US$1.4 million, mainly on diamond drilling in the Escopeta and Patara prospects.second quarter of 2016.
Tambomayo.Tambomayo project is wholly owned and operated by us. The project encompasses a total of 27,900 hectares, of which 25,700 hectares are owned by us and 2,200 hectares are optioned by Minera Ares. This option contract expires in 2015.
Tambomayo project is located 20 kilometers east of the Paula mine. The project is considered a low sulfidation epithermal deposit with significant gold and silver mineralization in a vein system. During 2012, we continued the underground exploration tunnels to explore the Mirtha and Paola veins. As of December 31, 2012, we had estimated NRM of 1,269,296 DST, with 0.323 ounces per ton of gold, 7.69 ounces per ton of silver, 1.5 percent lead and 2.86 percent zinc. In 2012, we invested US$16.77 million in the exploration and development of the Mirtha vein and a diamond drilling campaign. In 2013, we plan to invest US$38.0 million, mainly for preparation and construction of basic infrastructure, underground exploration and tunnel development.
Competition
We believe that competition in the metals market is based primarily upon cost. We also compete with other mining companies and private individuals for the acquisition of mining concessions and leases in Peru and for the recruitment and retention of qualified employees.
Sales of Metal Concentrates
All of our metal production is sold to smelters, traders and banks, either in concentrate or metal form, such as gold-silver concentrate, silver-lead concentrate, zinc concentrate, lead-gold-copper concentrate and gold and silver bullion. Our concentrates sales are made under one- to three-year, U.S. Dollar-denominated contracts, pursuant to which the selling price is based on world metal prices as follows: generally, in the case of gold and silver-based concentrates, the London Spot settlement prices for gold, less certain allowances, and the London Spot or the United States Commodities Exchange settlement price for silver, less certain allowances; and, in the case of base-metal concentrates, such as zinc, lead and copper, the London Metals Exchange or LME,(“LME”) settlement prices for the specific metal, less certain allowances. Sales prices vary according to formulas that take into account agreed contractual average prices for a quotational period, generally being the month of, the month prior to,before, or the month following the scheduled month of shipment or delivery according to the terms of the contracts.
The historical average annual prices for gold and silver per ounce and our average annual gold and silver prices per ounce for each of the last five years are set forth below:
| | | Gold | | | Silver | |
| | | Average Annual Market Price | | | Our Average Annual Price(1) | | | Average Annual Market Price | | | Our Average Annual Price(1) | |
| | | US$/oz. (2) | | | US$/oz. | | | US$/oz.(3) | | | US$/oz. | |
| 2008 | | | 871.71 | | | | 872.21 | | | | 15.02 | | | | 14.26 | |
| 2009 | | | 972.98 | | | | 988.32 | | | | 14.65 | | | | 15.52 | |
| 2010 | | | 1,224.66 | | | | 1,253.35 | | | | 20.16 | | | | 20.86 | |
| 2011 | | | 1,568.58 | | | | 1,574.45 | | | | 35.11 | | | | 35.36 | |
| 2012 | | | 1,668.98 | | | | 1,678.92 | | | | 31.15 | | | | 31.25 | |
| 2013 (through March 31, 2013) | | | 1,631.77 | | | | 1,606.08 | | | | 30.11 | | | | 29.92 | |
| | | Gold | | | Silver | |
| | | Average Annual
Market Price | | | Our Average
Annual Price(1) | | | Average Annual
Market Price | | | Our Average
Annual Price(1) | |
| | | US$/oz.(2) | | | US$/oz. | | | US$/oz.(3) | | | US$/oz. | |
| 2014 | | | 1,266.40 | | | | 1,263.53 | | | | 19.08 | | | | 18.65 | |
| 2015 | | | 1,218.45 | | | | 1,151.44 | | | | 16.71 | | | | 15.06 | |
2016
(through March 31, 2016) | | | 1,182.56 | | | | 1,107.87 | | | | 14.85 | | | | 13.34 | |
| (1) | Our average annual price includes only the consolidated average annual price from the Julcani, Uchucchacua, Orcopampa, Antapite, Recuperada, Colquijirca, Marcapunta, Ishihuinca and Shilaour mines. |
| (2) | Average annual gold prices are based on the London PM fix as provided byMetals Week. |
| (3) | Average annual silver prices are based on London Spot prices. |
Most of the sales contracts we enter into with our customers state a specific amount of metal or concentrate the customer will purchase. We have sales commitments from various parties for nearly all of our estimated 20132016 production; however, concentrates not sold under any of our contracts may be sold on a spot sale basis to merchants and consumers.
Sales and Markets
The following table sets forth our total revenues from the sale of gold, silver, lead, zinc and copper in the past threetwo fiscal years:
| | | Year ended December 31(1) | | | Year ended December 31,(1) | |
| Product | | 2010 | | 2011 | | 2012 | | | 2014 | | | 2015 | |
| | | (In thousands of US$) | | | (US$ in thousands) | |
| Gold | | | 578,582 | | | | 791,387 | | | | 738,477 | | | | 554,805 | | | | 438,585 | |
| Silver | | | 274,624 | | | | 526,380 | | | | 544,947 | | | | 356,021 | | | | 316,692 | |
| Lead | | | 46,913 | | | | 36,880 | | | | 52,834 | | | | 39,658 | | | | 55,445 | |
| Zinc | | | 92,884 | | | | 72,095 | | | | 82,873 | | | | 47,653 | | | | 102,110 | |
| Copper | | | 129,444 | | | | 193,215 | | | | 177,573 | | | | 271,282 | | | | 131,356 | |
(1) Does not include refinery charges and penalties incurred in 2012, 2011 and 2010 of US$147,930, US$127,957and US$112,254, respectively.
| (1) | Does not include refinery charges and penalties incurred in 2015 of US$196.2 million and in 2014 of US$184.51 million. |
We sold our concentrates to 20 customers in 2012. Approximately 54 percent, 57 percent60.12% and 62 percent62.83% of our concentrate and gold bullion sales in 2010, 20112014 and 2012, respectively,2015 (without considering adjustments to prior periods, embedded derivatives from sale of concentrate or hedge operations), were sold outside Peru. Set forth below is a table that shows the percentage of sales of concentrate and gold bullion from our mines and gold bullion that were sold to our various customers from 20102014 to 2012.2015.
| | | Percentage of Concentrates and Gold Bullion Sales | |
| | | 2010 | | | 2011 | | | 2012 | |
| Export Sales: | | | | | | | | | | | | |
| Johnson Matthey Limited | | | 49.90 | % | | | 47.42 | % | | | 47.75 | % |
| Glencore International AG | | | 0.75 | | | | 0.48 | | | | - | |
| N.V. Umicore SA | | | 2.18 | | | | 4.14 | | | | 1.34 | |
| Transamine Trading SA | | | - | | | | - | | | | 0.35 | |
| J.P. Morgan Chase Bank | | | - | | | | - | | | | 1.97 | |
| MRI Trading AG | | | 0.13 | | | | 3.20 | | | | 5.60 | |
| MK Metal Trading GMBH | | | 0.19 | | | | 1.23 | | | | 1.36 | |
| Lois Dreyfus Commodities Metal Suisse SA | | | - | | | | - | | | | 0.24 | |
| Standard Bank PLC | | | 0.04 | | | | - | | | | - | |
| Korea Zinc Company Ltd. | | | - | | | | - | | | | 2.99 | |
| Mintrade Ltd. | | | 0.39 | | | | - | | | | - | |
| Xstrata Commodities | | | 0.39 | | | | 0.19 | | | | 0.36 | |
| Total Export Sales | | | 53.97 | % | | | 56.66 | % | | | 61.96 | % |
| | | | | | | | | | | | | |
| Domestic Sales: | | | | | | | | | | | | |
| Doe Run Perú SRL | | | - | | | | - | | | | 1.08 | |
| Glencore Peru S.A.C. | | | 7.76 | | | | 18.93 | | | | 17.91 | |
| Consorcio Minero SA | | | 10.62 | | | | 6.89 | | | | 5.88 | |
| Votorantim Metais – Cajamarquilla SA | | | 3.33 | | | | 2.57 | | | | 0.42 | |
| Sudamericana Trading SRL | | | 1.15 | | | | 2.58 | | | | 2.44 | |
| Ays SA | | | 10.50 | | | | - | | | | - | |
| MK Metal Trading Perú SAC | | | 0.88 | | | | 0.39 | | | | 0.14 | |
| Louis Dreyfus Peru SAC | | | 10.54 | | | | 10.66 | | | | 8.11 | |
| Traxxys Peru SAC | | | 1.25 | | | | 1.23 | | | | 0.95 | |
| Cia. Minera Casapalca S.A. | | | - | | | | 0.09 | | | | 0.20 | |
| Total Domestic Sales | | | 46.03 | % | | | 43.34 | % | | | 38.04 | % |
| Total Sales | | | 100 | % | | | 100 | % | | | 100 | % |
| | | Percent of Concentrates and Gold Bullion Sales | |
| | | 2014 | | | 2015 | |
| Export Sales: | | | | | | | | |
| Asahi Refining Canada Ltd (former Johnson Matthey) | | | 49.31 | | | | 50.58 | |
| N.V. Umicore SA | | | 3.89 | | | | 3.75 | |
| Werco Trade AG | | | 3.34 | | | | 2.07 | |
| Mercuria Energy Trading SA | | | 0.00 | | | | 1.43 | |
| MRI Trading AG | | | 0.00 | | | | 0.99 | |
| Lois Dreyfus Commodities Metal Suisse SA | | | 0.00 | | | | 2.06 | |
| MCC non Ferrous Trading Inc. | | | 2.61 | | | | 0.00 | |
| Others | | | 0.97 | | | | 1.98 | |
| Total Export Sales | | | 60.12 | % | | | 62.86 | % |
| | | | | | | | | |
| Domestic Sales: | | | | | | | | |
| Andina Trade S.A.C. | | | 0.93 | | | | 0.36 | |
| Glencore Peru S.A.C. | | | 15.27 | | | | 23.43 | |
| Consorcio Minero SA | | | 4.11 | | | | 0.00 | |
| Trafigura Peru S.A.C. | | | 4.59 | | | | 6.73 | |
| Sudamericana Trading SRL | | | 2.65 | | | | 2.85 | |
| Lois Dreyfus Commodities Peru S.R.L. | | | 10.21 | | | | 2.45 | |
| Optamine S.A.C. | | | 1.26 | | | | 0.17 | |
| Others | | | 0.86 | | | | 1.16 | |
| Total Domestic Sales | | | 39.88 | % | | | 37.14 | % |
| Total Sales | | | 100 | % | | | 100 | % |
The following table shows our committed sales volumes of silver-lead, gold-silver and zinc concentrates from 20132016 to 2015:2018:
| | | Wet metric
tons | | Wet metric
tons | | Wet metric
tons | | | Wet tons | | | Wet tons | | | Wet tons | |
| Concentrate | | 2013 | | | 2014 | | | 2015 | | | 2016 | | | 2017 | | | 2018 | |
| Recuperada’s Silver-Lead | | | 6,000 | | | | 6,000 | | | | 6,000 | | |
| Recuperada’s Zinc | | | 9,600 | | | | - | | | | - | | |
| Uchucchacua’s Silver-Lead | | | 31,900 | | | | 21,500 | | | | - | | | | 68,000 | | | | 55,800 | | | | 28,000 | |
| Uchucchacua’s Zinc | | | 25,000 | | | | 25,000 | | | | - | | | | 23,800 | | | | 23,900 | | | | 0 | |
| Poracota’s Gold-Silver | | | - | | | | - | | | | - | | |
| Julcani’s Silver-Lead | | | 6,800 | | | | - | | | | - | | | | 7,600 | | | | 3,200 | | | | 4,000 | |
| Mallay’s Silver-Lead | | | | 20,000 | | | | 14,700 | | | | 0 | |
| Mallay’s Zinc | | | | 20,000 | | | | 17,700 | | | | 5,000 | |
Note: The price of the concentrate supplied under the contract is based on specified market quotations minus deductions.
We also sell refined gold, which is derived from our operations at Orcopampa, Shila-Paula, Antapite, IshihuincaBreapampa, Coimoloache and La Zanja and processed at a local smelter in Lima, to Johnson Matthey Public Limited Company, or Johnson Matthey, which further refines the gold. Pursuant to our agreement with Johnson Matthey, we supplied Johnson Matthey, at our option, with gold assaying in excess of 75 percent gold and approximately 25 percent silver, monthly from January 1, 2012 to December 31, 2012. TheDuring 2015, the price of the gold supplied was determined based on, for the gold content, the quotation for gold at the London Gold Market PM fixing in U.S. Dollars, and for the silver content, the quotation for silver at the London Silver Market spot fixing in U.S. Dollars or at spot prices, minus, in each case, certain minimum charges, as well as charges for customs clearance and treatment of the gold (which varies depending on its gold and silver content). We may elect to have our material toll refined at Johnson Matthey’s Brampton, Canada works and returned to our account for sale to third parties. Pursuant to our agreement, we are responsible for delivering the gold to Johnson Matthey’s designated flight at the Lima airport.
Hedging/Normal Sales Contracts
We and our wholly-owned subsidiaries are completely unhedged as to the priceprices at which our gold and silver will be sold. See “Item 3. Key Information—D. Risk Factors—Factors Relating to the Company—Our financial performance is highly dependent on the prices of gold, silver, copper and other metals.”
El Brocal has notuses derivative instruments to manage its exposure to changes in the price of metals. Such derivative financial instruments are initially recognized at fair value on the date on which a derivative contract is entered into any new hedging transactions since 2010 and has no outstanding hedging commitments.are subsequently re-measured at fair value. Derivatives are carried as financial assets when the fair value is positive and as financial liabilities when the fair value is negative.
El Brocal’s hedge is classified as a cash flow hedge. The effective portion of gain or loss on the hedging instrument is initially recognized in the consolidated statements of changes in equity, under the caption other equity reserves, while the ineffective portion is recognized immediately in the consolidated statements of profit or loss in the interest expense caption. Yanacocha and Cerro Verde have not engaged in, and are currently not engaged in, gold or copper price hedging activities, such as forward sales or option contracts, to minimize their respective exposures to fluctuations in the price of gold and copper. El Brocal had no outstanding hedging commitments in 2015.
Regulatory Framework
Mining and Processing Concessions
In Peru, as in many other countries, while surface land is owned by private landowners, the government retains ownership of all subsurface land and mineral resources. Our right to explore, extract, process and/or produce silver, gold and other metals is granted by the Peruvian government in the form of mining and processing concessions. The rights and obligations of holders of mining concessions, provisional permits and processing concessions are currently set forth in the General Mining Law (Single Unified Text approved by Supreme Decree 014-92-EM), which is administered by the MEM.
Pursuant to the General Mining Law, filers of mining claims must obtain a mining concession before they may explore the areas claimed. Applications for mining concessions must be filed with the regional mining directors of each regional government and with INGEMMET (Instituto Geológico Minero y Metalúrgico, or the Geological, Mining and Metallurgical Institute of Peru)Peru (“INGEMMET”).
Mining concessions granted since October 2008are irrevocable, provided the holder of a mining concession complies with the obligations set forth in the General Mining Law. Such concessions have an indefinite term, subject to payment of an annual concession fee per hectare claimed and achievement of minimum annual production for each hectare. Failure to achieve annual production targets will result in a fine. Failure to pay concession fees or fines for two consecutive years could result in the loss of one or more of the mining rights. Failure to satisfy minimum annual production thresholds for a specified period of time could result in cancellation of the concessions.
Our and Yanacocha’s processing concessions enjoy the same duration and tenure as our mining rights, subject to payment of a fee based on nominal capacity for the applicable processing plant. Failure to pay processing fees or fines for two consecutive years could result in the loss of the processing concessions.
As of December 31, 2012, we owned and administered, directly or indirectly, through subsidiaries or in conjunction with joint venture partners, approximately 1,194,021 hectares ofOur mining concessions devoted to mineral exploration and mining operations. Mining rights and processing concessions are in full force and effect under applicable Peruvian laws. We believe that we are in compliance with all material terms and requirements applicable to the mining rights and processing concessions and that we are not subject to any condition, occurrence or event that would cause the revocation, cancellation, lapse, expiration or termination thereof, except that we may, from time to time, allow to lapse, revoke, cancel or terminate mining rights and processing concessions that are not material to the conduct of our business.
In addition to obtaining mining rights from the Peruvian government, applicable Peruvian regulations require us to obtain easements or other rights from private landowners that own the surface land above the mineral resources that we intend to explore or mine. Supreme Decree 020-2008-EM requires us to obtain such easements or other rights prior tobefore commencing exploration activities. We have been actively seeking to acquire land surface, easements to land containing prospective geological exploration target sites, deposits that can be exploited in the future and areas suitable as plant or facility sites. In the case of processing concessions, article 35 of Supreme Decree Nº 018-92-EM, as amended, requires holders of such concessions to own the land underlying the concession or to have the authorization of the owner of the land.
The Law Regulating Mining Concessions in Urban Areas and Urban Expansion Areas and related regulations set forth procedures for the granting of mining rights in urban and urban expansion areas. In order toTo grant a mining concession in an urban or urban expansion area, the MEM is required to receive the approval of the council of the applicable provincial municipality. The council has sixty days to issue its decision. Mining concessions in urban expansion areas are granted for 10-year terms, which may be renewed by the MEM subject to the approval of municipal authorities.authorities, but cannot exceed 100 hectares.
Law No. 28964, which became effective on January 25, 2007, created theOrganismo Supervisor de la Inversión en Energía y Minería(OSINERGMIN (“OSINERGMIN”) as the government agency in charge of regulating and auditing the electricity, hydrocarbon and mining activities of companies. Law No. 28964 provides that the overview and audit of activities related to the environment, mining safety and health regulations may be performed by companies duly certified and approved by OSINERGMIN.However, pursuant to Supreme Decree 001-2010-MINAM, OSINERGMIN has transferred its environmental supervisory functions to the Environmental Evaluation and Oversight Agency, or OEFA.(“OEFA”). Beginning July 22, 2010, OEFA assumed the authority to carry out unexpected audits and levy fines on companies if they fail to comply with prescribed environmental standards. Contributions that mining companies are required to make to OSINERGMIN were approved by Supreme Decree No. 128-2013-PCM and contributions required to be made to OEFA by Supreme Decree No. 130-2013-PCM.
Law No. 28964 has been abrogated by Law No. 29783 withWith respect to employee safety and employer liability, whichLaw No. 28964 has been replaced by Law No. 29783. Such employee safety and employer liability and related matters are audited by theMinisterio de Trabajo y Promoción del Empleo. Law No. 29783, as amended by Law No. 30222, establishes the minimum rules designed to prevent employee safety risks and allocate liabilities in relation to such risks. The main principle of this law is that the employer assumes the economic, legal and any other type of liability arising from accidents or diseases suffered by the employee while working, and guarantees the employee’s health and safety in connection with the employee’s work. This legislation entitles labor inspectors to inspect commercial facilities and, under certain circumstances, suspend operations. Such law amended the relevant provision of the criminal code, which currently establishes that a person who intentionally breaches the safety and health provisions, and who after being required by the relevant authority, does not adopt the measures contemplated in such provisions, is deemed to jeopardize the life, health or physical integrity of such person’s employees and may be held criminally liable for such behavior.
Environmental Matters
In 2005, Peru enacted the General Environmental Law (Law No. 28611), which establishes the main environmental guidelines and principles applicable in Peru. Pursuant to the General Environmental Law, the MEM hasMinistry of the Environment (“MINAM”) issued regulations mandatingnational environmental standards, for the mining industry and reviews and approveswhich have gradually replaced prior guidelines governing governmental agencies environmental studies for mining operations.competencies. OEFA has the authority to inspect mining operations and fine companies that fail to comply with prescribed environmental standards.
The MEM has issued regulations that establish maximum permissible levels of (i) emissions of liquid effluents and (ii) elements and compounds present in gaseous emissions resulting from the mining activities. Generally, holders of mining rights and processing plants that were in operation prior to May 1993 are required to comply with maximum permissible levels within 10 years. In the interim, mining operators are required to prepare Environmental Adaptation and Management Programs, or PAMAs, that set forth plans to ensure compliance with more stringent maximum permissible levels.
In addition, eachEach mining company that initiatedbegan operations prior tobefore May 1993 was required to file a Preliminary Environmental Evaluation, or EVAP,(“EVAP”), for each of its mining units to disclose any pollution problems in its operations and, thereafter, to submit a follow-up PAMAPrograma de Adecuación y Manejo Ambiental (“PAMA”) aimed at implementing measures in order to solve problems identified in the EVAP. Companies must correct the pollution problems relating to their mining activities within five years, while smelters must complytake corrective measures within ten years. These companies must allocate funds in an amount corresponding to no less than 1 percent1% of their annual sales to redress the problems identified in their EVAPs and contemplated in their PAMAs.
SinceIn addition, the MEM has issued regulations that establish maximum permissible levels (“LMP”) of (i) emissions of liquid effluents and (ii) elements and compounds present in gaseous emissions resulting from the mining activities. Generally, mining rights holders and processing plants that were in operation before May 1993 new mining and processing activities have been required to file and obtain approval for an EIS before being authorized to commence operations. New mining and plant processing activities arewere required to comply with LMP within 10 years. In the maximum permissible levels for liquid effluents from the initiation of their operations.
Many of ourmeantime, mining rightsoperators are required to prepare Environmental Adaptation and processing plants were in operation priorManagement Programs, or PAMAs, that set forth plans to May 1993, and we are in substantialensure compliance with the maximum permissible levels set forth in the MEM’s regulations. EVAPs for Julcani, Uchucchacua, Orcopampa, Recuperada, Ishihuinca and Shila were all accepted between August and September 1995. Between November 2002 and April 2003, the MEM approved and verified the PAMAs for all these entities, issuing and approving resolution for each respective mining unit. The EISs for Paula, Antapite, Esperanza, Poracota and Pozo Rico were approved in 2001, 2001, 2006, 2007 and 2008, respectively.
EISs for capacity expansion at the Orcopampa, Uchucchacua and Antapite mines were approved in 2004, 2006 and 2008, respectively.
The MEM approved the EISs for the Huancarama-Chipmo-Poracota and La Zanja transmission lines and their substations in 2006 and 2008, respectively. This connection to the national grid should result in lower energy costs.more stringent LMP.
In May 2008, the Environmental Ministry of PeruEnvironment was established by legislative decree. The principal functions of the Environmental Ministry of Environment include formulating and implementing policies and regulations relating to environmental matters and controlling pollution, including regulating air and water quality standards, through supervision and education.
In 2008 and 2010, the Ministry of Environment enacted new water quality standards and new LMP for liquid effluents. In 2009, all Peruvian mining companies were required to submit updated environmental management plans to the MEM that complied with water quality standards and new LMP for liquid effluents. At the end of 2015, Supreme Decree No. 015-2015 - MINAM (the “2015 Decree”) was published, which modified the water quality standards and established supplementary provisions related to compliance.
Under the 2015 Decree, mining companies must incorporate new water quality standards into affected environmental management plans by (1) where the MEM has already approved such plan, submitting an updated plan or (2) where the MEM is currently evaluating a plan, submitting a modified plan. The Company plans to submit updated and modified plans to the MEM as required by the 2015 Decree.
On March 26, 2013, Supreme Decree No. 002-2014-MINAM became effective. It approves the Environmental Quality Standards (Estándares de Calidad Ambiental) (“ECA”) for soils, or “Standards,” which are applicable to any project or activity that may generate an environmental risk. Subsequently, on March 25, 2014, supplementary provisions for the application of the Standards were approved through Supreme Decree No. 002-2014-MINAM. Operations of projects existing at that time were required to submit the first phase of soil characterization within twelve months of the passage of the decree. Buenaventura and its associated companies submitted this information within the required time.
Since May 1993, new mining and processing activities have been required to file and obtain approval for an EISd before being authorized to commence operations. New mining and plant processing activities are required to comply with the LMP from the initiation of their operations. In 2009, MINEM approved the EISsEISd for the La Zanja, Mallay, Tantahuatay and Esperanza projects. In 2010, the MEMMINEM approved the EISsEISd for the Angélica Rublo Chico project. In 2011, the MEM approved the EISsEISd for our Orcopampa and Breampampa projects. The MEMMINEM approved the modified EISEISd for the Mallay mine and the second modified EISEISd for the Shila cyanidation circuit in 2012. In 2014, MINEM approved the modified EISsd of Uchucchacua. In 2015, the EISd of Tambomayo was approved.
We and our subsidiaries are subject to ongoing administrative and judicial proceedings relating to environmental matters for which we have reserved contingencies of up to US$1.2 million This amount does not include loss contingencies reserved for associates accounted for under the equity method (Yanacocha, Cerro Verde and Coimolache).
In 2012, Peru enacted Supreme Decree N° 020-2012,No. 020-2012-EM, which requires all activitiesadded Chapter XVII to the Mining Proceedings Regulations approved by Supreme Decree No. 018-92-EM. The new provisions require the approval of the General Mining Directorate of the MEM or of the relevant Regional Government before proceeding to start and re-start exploration, development, preparation and exploitation to obtain the approval of the Mining Department of the Ministry of Energy and Mines. With regard to water regulation, all Peruvian mining companies were required to submit their updated environmental management plans to comply with water quality standards and the new maximum permissible levels for liquid effluents by August 31, 2012. Buenaventura and its associated companies submitted our plans. We expect that we will be required to implement these plans and be in compliance with the new maximum permissible levels for liquid effluents and water quality standards by 2014 and 2015, respectively.
Except as described above, there are no material legal or administrative proceedings pending against us with respect to any environmental matters.exploitation.
Regulations governing mining explorations. InIn May 2008, the Peruvian government enacted DS 020-2008-EM, which governs mining exploration activities and related matters. Under DS 020-2008-EM, exploration activities are dividedfall into 2 categories,categories: Category I and Category II. Category I exploration activities are those involving no more than 20 drilling platforms and environmentallyor affecting no morea surrounding area that measures less than 10 hectares in size, while Category II exploration activities are those involving more than 20 drilling platforms and environmentally affecting morean area larger than 10 hectares. For Category I exploration activities, an Environmental Impact Declaration or EID,(Declaración de Impacto Ambiental) (“EID”) is required. For Category II exploration activities, a Semi-detailed Environmental Impact Study, or EISsd,EIS (Estudio de Impacto Ambiental) (“EISsd”) which is required which incorporates technical, environmental and social matters. Exploration activities must start within twelve months following the date that an EID or EISsd is approved. TheBoth the EID and the EISsd must be approved before exploration activities begin. Any commitments assumed by mining companies in theiran EID or EISsd and EIS are mandatory;mandatory and, if they are not fulfilled, OSINERGMINOEFA has the authority to fine thesenon-compliant mining companies. The regulation also provides that during exploration programs the holder of mining concessions will perform specified closure and post closure activities. In addition, fines can be imposed if exploration programs begin before the EID and the EISsd are approved, and the approval of environmental studies for exploration activities performed within protected natural areas requires the approval of the applicable water authority. Exploration in Prehispanic Archeological Sites (referred to in DS N° 004-2000-ED) is forbidden, unless expressly authorized by the National Institute of Culture.
Also in May 2008, MEMMINEM enacted DS 028-2008 which establishesregulated the rightcitizen participation process within the framework of every person to participate in the process of making decisions related to the sustainable development of mining activities on government territory.environmental permit approval. The EID EIS and EISsd requireprovide local communities to havewith an opportunity to actively participateengage in this process.
The following EIDs and EISsd were approved in 2012:2015:
| Buenaventura |
| Mine/Project | | Type of Study | | Approving Resolution | | Date of Approval |
Escopeta | | EID | | N° 064-2012-MEM-AAM | | June 20, 2012 |
Aguila | | EID | | N° 349-2012-MEM-AAM | | October 10, 2012 |
San LorenzoGabriel | | EID3ra Modf. EIAsd | | RD N° 083-2012-MEM-AAM345-2015-MEM-DGAAM | | October 10, 2012 |
Surichata | | EID | | N° 060-2012-MEM-AAM | | June 6, 2012 |
Esperanza | | EISsd | | N° 212-2012-MEM-AAM | | July 7, 2012 |
Pariguana | | EISsd | | N° 304-2012-MEM-AAM | | September 18, 2012 |
Yumpag | | EISsd | | N° 193-2012-MEM-AAM | | June 6, 2012 |
Santa Rosa | | EISsd | | N° 066-2012-MEM-AAM | | February 28, 201204 – 09 - 2015 |
| La Zanja SRL |
| Mine/Project | | Type of Study | | Approving Resolution | | Date of Approval |
| La Zanja | | EISsd9na Modf. EIAsd | | RD N° 285-2012-MEM-AAM483-2015-MEM-DGAAM | | September 5, 201216 – 12 - 2015 |
Mollé Verde S.A.C. |
Mine/Project | | Type of Study | | Approving Resolution | | Date of Approval |
Trapiche | | Mod EISsd | | N° 214-2012-MEM-AAM | | July 4, 2012 |
Investment Promotion Regulations.Supreme Decree 054-2013-PCM was passed to promote investment projects. It allows companies to submit a technical report to modify ancillary components, capacity expansions, or introduce technological improvements. MINEM will then issue a compliance waiver within no more than 15 working days from the date of submission.
Regulations governing mine closures. In 2003, Law No. 28090,Ley que Regula el Cierre de Minas (Law that Regulates the Closing of Mines), established the obligations and procedures that mining companies must follow to prepare, submit and execute plans for the closing of mines, or Closure“Closure Plans,” and the granting of environmental guarantees to secure compliance with Closure Plans. We are required to submit a Closure Plan for new projects to the MEMMINEM within one year following approval of an EIS or PAMA; inform the MEMMINEM semi-annually of any progress on the conditions established in the Closure Plan; perform the Closure Plan consistent with the schedule approved by the MEMMINEM during the life of the concession;project; and grantset up an environmental guarantee that covers the estimated amount of the Closure Plan.
In addition, Supreme Decree No. 020-2008-EM requires mining companies that perform exploration activities to conduct certain closing activities in accordance with the applicable environmental study approved by the relevant authority, subject to deferral under certain circumstances, and contemplates a Closure Plan to be submitted by the mining companyfollowing the terms and conditions of Supreme Decree Nº 033-2005-EM.
We have presented
Our Closure Plans to the MEMwere approved by MINEM for all of our mines and advanced explorations. To date, the MEMMINEM has approved our Closure Plans for Julcani, Recuperada, Uchucchacua, Orcopampa, Poracota, Antapite, Caravelí, Shila, Paula, Esperanza, Pozo Rico, Mallay, Trapiche, Breapampa, Angélica Rublo Chico, Anamaray-Jancapata, La Zanja, Tantahuatay and Anamaray-Jancapata.Tambomayo.
The follow Closure Plan Studiesfollowing mine closure plan modifications were approved in 2012:2015:
| Buenaventura |
| Mine/Project | | Type of Study | | Approving Resolution | | Date of Approval |
| Julcani | | Closure Plan Modification | | R.D.N°119-2015-MEM/AAM | | 02.03.2015 |
| Orcopampa | | Update Closure Plan Modification | | N° 172-2012-MEM-AAMR.D.N°212-2015-MEM/AAM | | May 29, 201220.05.2015 |
AntapiteMallay | | Modified Closure Plan Modification | | N° 182-2012-MEM-AAMR.D.N°386-2015-MEM/AAM | | June 6, 2012 |
Caravelí | | Update Closure Plan | | N° 213-2012-MEM-AAM | | July 3, 201202.10.2015 |
| Breapampa | | Closure Plan Update | | N° 237-2012-MEM-AAMR.D.N°398-2015-MEM/AAM | | July 17, 2012 |
CEDIMIN SAC15.10.2015 |
Mine/Project | | | | | | |
| La Zanja SRL |
| Mine/Project | | Type of Study | | Approving Resolution | | Date of Approval |
ShilaLa Zanja | | Update Closure Plan Modification | | RD N° 197-2012-MEM-AAM237-2015-MEM/DGAAM | | June 15, 201105.06.2015 |
| | | | | | |
| Compañía Minera Coimolache S.R.L. |
| Mine/Project | | Type of Study | | Approving Resolution | | Date of Approval |
| Tantahuatay | | Closure Plan Update | | R.D. N° 373-2015-MEM-DGAAM | | 22.09.2015 |
On November 9, 2009 Supreme Decree No. 078-2009-EM became effective, creating additional environmental obligations for the holders of mining concessions.concessions holders. Under this provision, holders of mining concessions holders that have performed mining activities, including mining exploration, exploitationproduction and processing activities or related activities, without having an Environmental Certification will be required to prepare and perform an Environmental Remediation Plan to cureaddress the environmental impact in the areas in which such activities have been conducted. The Environmental Remediation Plan willPlans could only be filed once mining activities have ceased. Environmental Remediation Plans would contain a detailed description of all the mining itemsfacilities and activities performed without the correspondent Environmental Certification, including maps and related information, a detailed description of the environmental impacts created by such activities, a detailed description of the remediation actions, a detailed description of the compensation that is proposed to be made, a budget and schedule of the remediation activities, including their costs, a bond in favor of MEMMINEM for the cost of the execution of the measures contained in the Environmental Remediation Plan. Once the Environmental Remediation Plan is completed, mining concessions holders are required to inform the auditing entity so it can verify that the actions were carried out as approved. The auditing entity is required to send the respective report to the relevant authority so that the bond may be returned.
Law No. 28271, Law that Regulates the Environmental Liabilities of Mining Activities (Ley que Regula los Pasivos Ambientales de la Actividad Minera (Law that Regulates the Environmental Liabilities of Mining Activities)), became effectivecame into force on July 7, 2004 and serves to regulate the identification of liabilities in mining activities and financial responsibility for remediation in mining activities, in each case to mitigate any negative impact mining may have with respect to the health of the population, environment and property. Pursuant to Law No. 28271, as amended by Law No. 28526 and Legislative Decree No. 1042, the technical branch of the MEMMINEM will identify environmental liabilities, mining companies responsible for abandoned mining facilities, mining works and residue deposits that may be linked to such environmental liabilities and holders of inactive mining concessions with mining liabilities. Holders of inactive mining concessions with environmental mining liabilities will be required to submit a Closure Plan and enter into environmental remediation agreements with the MEMMINEM to perform any studies and work necessary to control and mitigate the risk and effects of any contamination. Regulations under Law No. 28271, Regulations of Environmental Liabilities of Mining Activities(Reglamento de Pasivos Ambientales de la Actividad Minera (Regulations of Environmental Liabilities of Mining Activities)), were approved by Supreme Decree No. 059-2005-EM.
We have presented Closure Plans to the MEMMINEM for all our mining concessions with environmental mining liabilities. To date, the MEM has approved the mining liabilities for Hualchocopa, Lircay, Bella Unión-Pucarayn-Paucaray and Chaquelle mining units have all been closed and allpost-closure activities at each of these concessions have been closed.units are currently underway.
On November 12, 2014, a new Environmental Protection and Management by-law was enacted, which covers mining production, processing, common labor, transport, and storage, and sets forth a new set of requirements for these activities. Going forward, social and technical teams from MINEM will accompany the collection of baseline information. Early involvement of the statutory authority throughout the environmental studies process is expected to bring about shorter approval times.
On December 28, 2015, theServicio Nacional de Certificación Ambiental, which operates under the auspices of MINAM took responsibility for the approval of detailed EIS, submitted by private, public, or mixed-capital organizations. This development is consistent with the expansion of MINAM’s technical and regulatory capacities.
We anticipate additional laws and regulations relating to environmental matters will be enacted over time with respect to environmental matters.time. The development of more stringent environmental protection programsregulations in Peru could impose additional constraints and additional costs on our operations, and we would be required to make significant additional capital expenditures in the future. Although we believe that we are substantially in compliance with all applicable environmental regulations of which we are now aware, there is no assurance that future legislation or regulatory developments will not have an adverse effect on our business or results of operations.
In connection with the approval of environmental studies, the Peruvian government has issued several decrees intended to simplify the issuance of permits, including Supreme Decree No. 054-2013-PCM (effective since June 2, 2013), Supreme Decree No. 060-2013-PCM (effective since May 26, 2013) and Ministerial Resolution No. 092-2014-MEM/DM (effective since May 27, 2014). We believe these provisions should facilitate the approval of environmental studies for our new exploration projects and simplify the issuance of certificates of non-existence of archeological remains required for mining projects.
Prior Consultation with Local Indigenous Communities
In 2011, Peru enacted Law No. 29785, the Law of Prior Consultation for Indigenous and Native Communities (Ley del Derecho a la Consulta Previa a los Pueblos Indígenas y Originarios, Reconocido en el Convenio 169 de la Organización Internacional del Trabajo). This law establishes a prior consultation procedure that the Peruvian government must undertake in concert with local indigenous communities whose collective rights may be directly affected by new legislative or administrative measures, including the granting of new mining concessions. Under thethis law, the Peruvian governmental bodyagency responsible for issuing or approving the administrative measure or decree in question, rather than the affected local indigenous community, retains the right to approve or reject the relevant legislative or administrative matter following such consultation. However, to the extent that any of our future projects require the promulgation of us, Yanacocha or Cerro Verde require legislative or administrative measures that impact local indigenous communities, the required prior consultation procedure may result in delays, additional expenses or failure to obtain approval for such new project.
Regulations under Law No. 29785 were approved by Supreme Decree No. 001-2012-MC, which became effective on April 2, 2012. These regulations specify the form and circumstances of the required consultation and the manner in which agreements will be formalized, and cap theprovide for a consultation process atthat lasts no more than 120 calendar days.
Permits
We believe that our mines and facilities have all necessary material permits.permits to operate. All future exploration projects will require a variety of permits. Although we believe the permits for these projects can be obtained in a timely fashion, permitting procedures are complex, time-consuming and subject to potential regulatory delay. We cannot predict whether we will be able to renew our existing permits or whether material changes in existing permitting conditions will be imposed. Non-renewal of existing permits or the imposition of additional permitting conditions could have a material adverse effect on our financial condition or results of operations.
Insurance
We maintain a comprehensive insurance program designed to address specific risks associated with our operations, in addition to covering the insured risks common to major mining companies. Our insurance program is provided through the local Peruvian insurance market and includes employers’ liability, comprehensive third party general liability and comprehensive automobile liability, all risk property on a replacement basis, including transit risks, as well as business interruption insurance and mining equipment.equipment insurance.
Mining Royalties and Taxes
Under Peruvian law, holders of mining concessions are required to pay the Peruvian government a mining royalty (regalia minera) for the exploitation of metallic and non-metallic resources. In accordance with Law No. 28258, as amended by Law No. 29788, mining royalties shall beare payable either as a specified percentage of operating profit or 1 percent1% of revenues, whichever is higher. If the mining royalty is calculated as a percentage of operating profit, marginal rates ranging from 1 percent1% to 12 percent,12%, increasing progressively for companies with higher operating margins, will apply.
Mining companies that are a party to mining stabilization agreements will not be required to pay a mining royalty during the tenure of their stabilization agreements. Although we are not party to aany stabilization agreement,agreements, Yanacocha currently has effectivestabilization agreements for the Yanacocha, La Quinua and Maqui mines.
In addition to mining royalties, pursuant to Law No. 29789, effective from October 1, 2011, mining operations in Peru are subject to a new extraordinary mining tax. Mining companies that do not have taxation stability agreements with the Peruvian government, such as Buenaventura, will pay the “Special Mining Tax” (Impuesto Especial dea la Minería). The Special Mining Tax is calculated as a percentage of operating profit. Marginal rates range from 2 percent2% to 8.4 percent,8.4%, increasing progressively for companies with higher operating margins. Mining companies that have stability agreements with the Peruvian government will pay the “Special Mining Duty” (Gravamen Especial dea la Minería). The Special Mining Duty is calculated as a percentage of operating profit, with marginal rates ranging from 4 percent4% to 13.12 percent,13.12%, increasing progressively for companies with higher operating margins.
Safety
During 2015, we experienced 70 reportable injuries, which were comprised of 67 lost-time injuries and 3 fatal injuries, as compared to 86 total reportable injuries during 2014, which were comprised of 81 lost-time injuries and 5 fatal injuries. Under Peruvian legislation, reportable injuries include: accidental injuries resulting in lost-time, fatal accidents, accidents that require medical treatment or result in a loss of consciousness, an inability to perform all job duties on any workday after the injury or the temporary assignment or transfer to another job. Injuries involving first-aid only are not reportable as they are considered minor accidents.
The safetyfollowing activities and health of our employees is our highest priority. We believe that we haveprograms were implemented robust safety measures and work continuouslyduring 2015 in order to improve our occupational health and safety training and performance. We regularly monitor occupational health and safety performance and compliance through safety training programs, review and analysis of accident reports and other routine safety measures at our operating mines. Our Uchucchacua, Julcani, Antapite, Orcopampa and Shila-Paula mining units are Occupational Health and Safety Assessment Series 18001 certified.
Our safety program includes the following core components:management system:
| · | Risk Detection Training and Log Book:a defensive driving course was taught to train workers to detect, identify and record job-related hazards.hazardous materials truck drivers; |
| · | Safety Performance Indicators: to regularly monitor the performance of each operating unita Corporate Crisis Committee Operating Plan was developed and target safety efforts and training. |
| · | Specialized Safety Training: to provide training related to safety techniques and tools tailored to the risks associated with each employee’s job.distributed; |
| · | Mine School:a compliance program was developed to provide on-site theoreticalminimize accidents due to rock fall, ventilation and practical training to employees in different fields of work.electric shocks; |
| · | Implementation of Internationala meeting with the Operations Vice President, the Business Development Vice President, Regional Operations Managers, Site Managers, Site Safety Standards:Managers and Safety Directors was held in Lima in order to establishimprove visible leadership and comply with internationally acceptedfurther our safety standards.system; |
| · | Safety Audits:our Operations Vice President and his team toured all sites to regularly auditreinforce our safety procedures and systems at each operating mine by certified auditors.policy; |
During 2012, we experienced 117 total reportable injuries, 115 lost-time injuries and 2 fatal injuries, as compared to 105 total reportable injuries, 101 lost-time injuries and 4 fatal injuries for the year ended December 31, 2011. Under Peruvian law, the number of lost-time injuries recorded includes days away from work as a result of injury, restricted duty injuries and certain medical treatment injuries. The total number of reportable injuries includes lost-time injuries, as well as other minor and major first aid injuries and fatal injuries.
| · | a score of 63% was achieved in the Annual General Safety Audit; |
| · | the Buenaventura Integrated System was re-certified by Bureau Veritas in ISO 9001, ISO 14001 and OSHAS 18001 standards; |
C. Organizational Structure
| · | the program “one production day without a lost time accident” became “five production days without a lost time accident,” reaching 50% effectiveness as we achieved 8 out of 16 weeks without a lost time accident; and |
| · | with respect to industrial hygiene, our positions were monitored to control physical, chemical, biological, ergonomic and psychosocial hazards. |
| C. | Organizational Structure |
As of March 31,2013,31, 2016, we conducted our mining operations, explorations projects and other activities directly and through various majority-owned subsidiaries, controlled companies and other affiliatedassociate companies as described in the following organizational chart.
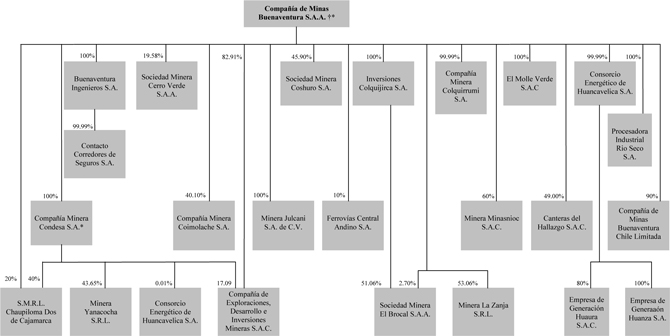
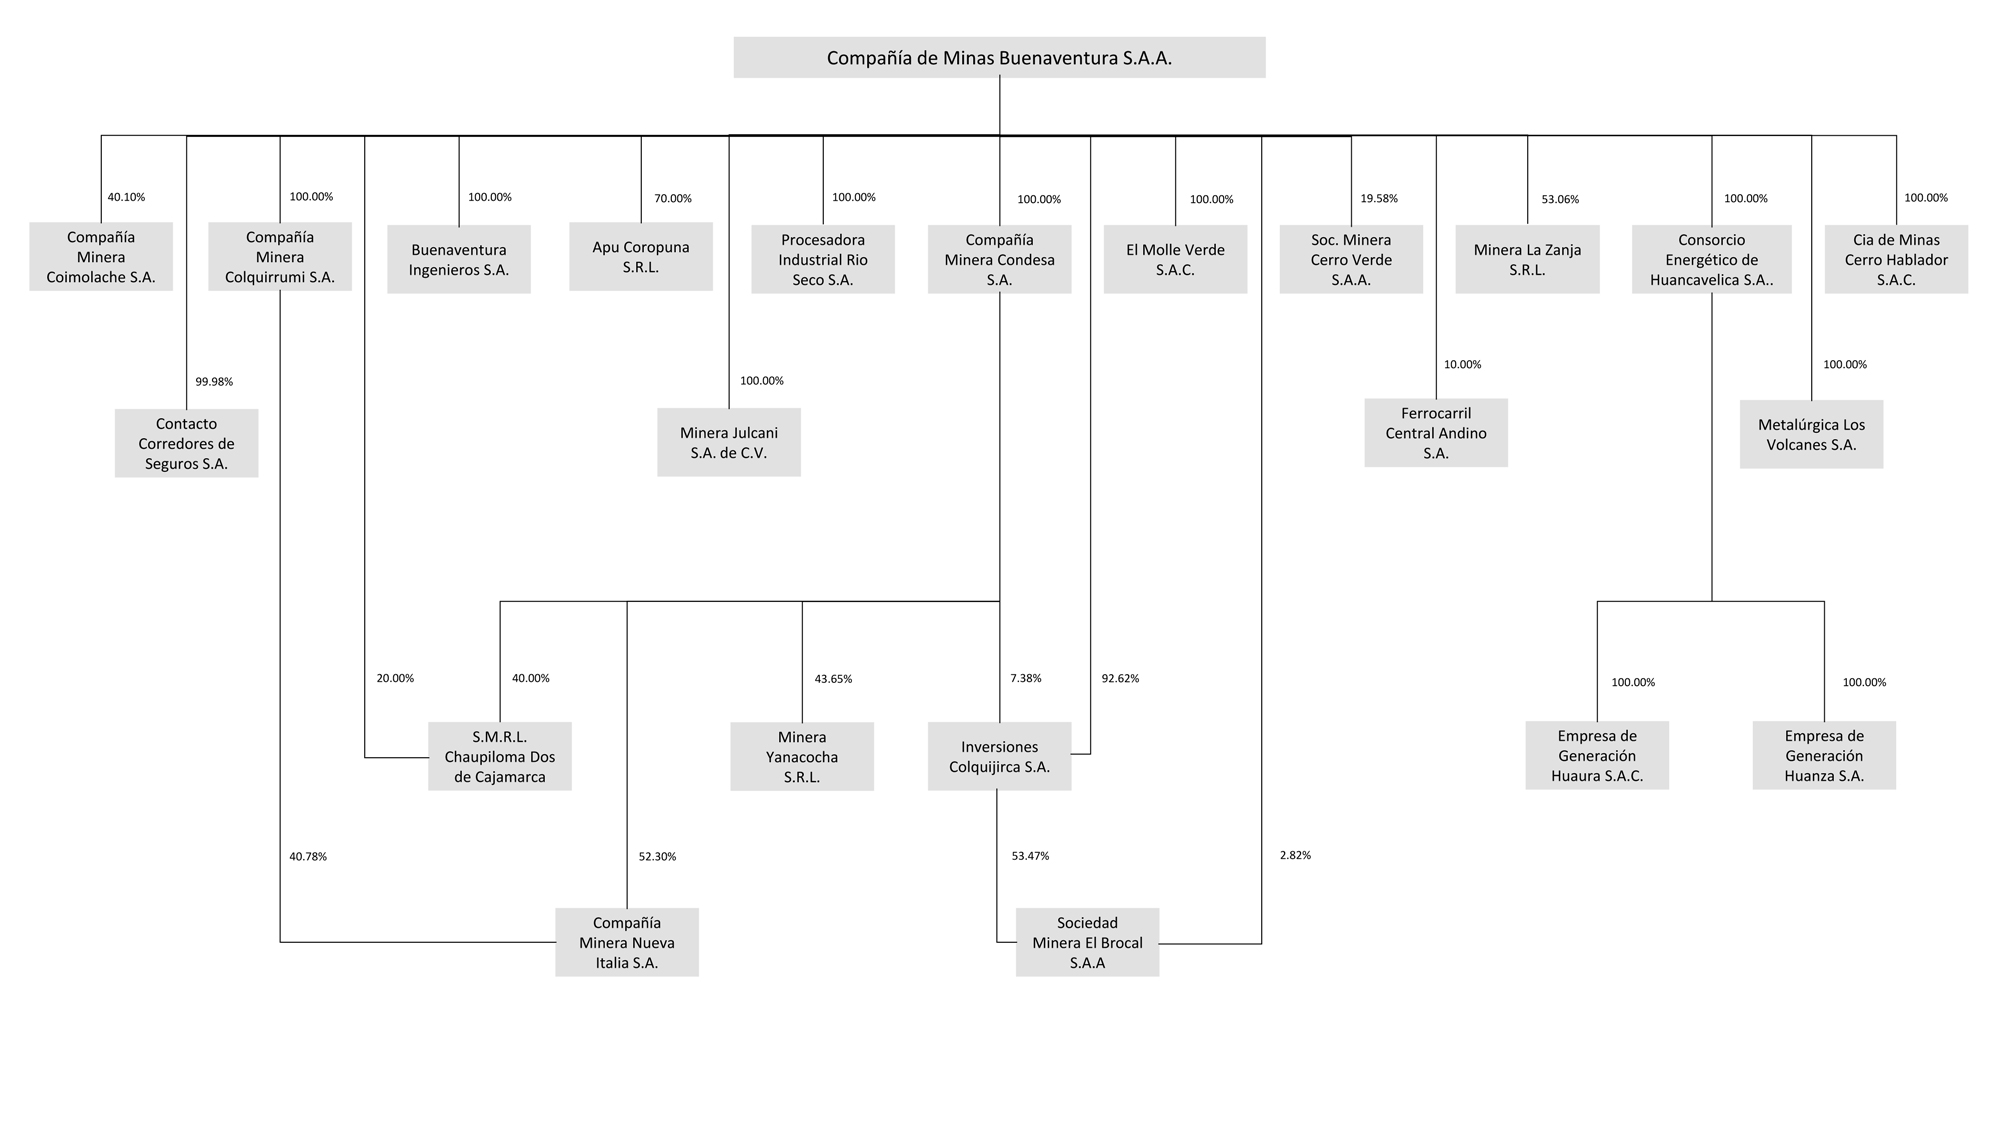
| † | All entities in this chart, with the exception of Minera Julcani S.A. de C.V. and Compañía de Minas Buenaventura Chile Limitada (which areis organized in Mexico and Chile, respectively)Mexico), are incorporated in Peru. |
| * | Compañía Minera Condesa S.A. also holds 21,222,236 treasury21,160,260 common shares of Compañía de Minas Buenaventura S.A.A., or approximately 7.687.70 percent of our outstanding equity.total common shares. |
Intermediate Holding Companies, Subsidiaries and Equity Participations
Compañía Minera Condesa S.A.
Compañía Minera Condesa S.A., or “Condesa,” which is wholly owned by us,our wholly-owned subsidiary, is a mining and facilities holding company with both direct and indirect ownership participation in two mining-related entities, Cedimin and Yanacocha, and in exploration projects conducted by Minas Conga and Conenhua (as defined below). See “—B. Business Overview—Exploration.”Yanacocha. As a partner in Yanacocha, Condesa shares responsibility for the investments made in the Yanacocha mine. In addition, Condesa holds an equity interest in Chaupiloma, and, as a result, receives a portion of the royalty revenues paid by Yanacocha to Chaupiloma in an amount equal to suchits ownership interest. See “—S.M.R.L. Chaupiloma Dos de Cajamarca” below. Condesa also holds a 7.68 percent7.70% interest in us.
Compañía de Exploraciones, Desarrollo e Inversiones Mineras S.A.C.
Cedimin, wholly owned by us, is a mining and facilities holding company that operates the Shila-Paula mine and conducts explorations at the Tambomayo project. At our annual shareholders’ meeting on March 26, 2013, the shareholders approved the merger of Cedimin with and into Buenaventura, with Buenaventura as the surviving entity of the merger, and accordingly, in 2013, Cedimin will be merged with and into Buenaventura.
S.M.R.L. Chaupiloma Dos de Cajamarca
S.M.R.L. Chaupiloma Dos de Cajamarca, or Chaupiloma,“Chaupiloma,” is a Peruvian limited liability company that holds all of the mining rights for the areas mined by Yanacocha and Minas Conga.Yanacocha. Chaupiloma receives a royalty that is calculated as a percentage of the total revenues of Yanacocha. We own, directly and indirectly, through our interest in Condesa, a 60 percent60% interest in Chaupiloma. Newmont Peru owns the remaining 40 percent40% equity interest.
Consorcio Energético Huancavelica S.A. / Empresa de Generación Huanza S.A.
Consorcio Energético Huancavelica S.A., or Conenhua,“Conenhua,” is an electrical transmission and generation company that provides a significant portion of our electrical needs through its transmission facilities. We own 100 percent100% of Conenhua and manage its operations. Conenhua obtained theits concession for power transmission in the Huancavelica area in 1983 and subsequently obtained concessions in the Cajamarca and Arequipa regions, enablingwhich enabled us to buy energy from Electro Perú and to transmit electric power to certain of our mining units and affiliates, including Uchucchacua, Orcopampa, Poracota, Shila-Paula, Antapite, Yanacocha, La Zanja and Coimolache, as well as to other mining companies and municipalities in the area, through our own facilities.
In order toTo secure a reliable energy supply from a clean and renewable source for our direct operations and projects at competitive prices, Conenhua, through its subsidiary Empresa de Generación Huanza S.A., or Huanza,“Huanza,” was commissioned to construct a 90.6 megawatt or MW,(“MW”), capacity hydroelectric power plant in the valley of Santa Eulalia. The construction of the 90.6 MW Huanza Hydroelectric Power Plant isThis hydroelectrical plant began operating at full capacity in progress and should be completed by the end of the second quarter of 2013. This US$180-200 million project commenced in March 2010 and has been partially financed through a US$119 million finance lease obtained from Banco de Crédito del Peru.June 2014.
Buenaventura Ingenieros S.A.
Buenaventura Ingenieros S.A., or BISA,“BISA,” one of our wholly-owned subsidiaries, has provided geological, engineering, design and construction consulting services to the mining sector for over 30 years. During this time, BISA has consulted in Peru, Chile, Argentina, Mexico and Ecuador on a range of projects, operations and expansions.
Contacto Corredores de Seguros S.A.
During 2015, Buenaventura paid US$8.8 million to BISA owns a 99.99 percent interest in order to obtain 99.98% ownership of Contacto Corredores de Seguros S.A., an insurance brokerage company that provides insurance brokerage and related services to us and our affiliates.
Minera Julcani S.A. de C.V.affiliates
Minera Julcani S.A. de C.V., or
Minera Julcani S.A. de C.V. is aone of our wholly-owned subsidiarysubsidiaries and was created for the purpose of conducting mining activities in Mexico. Currently, we are conducting exploration activities pursuant to our joint venturean agreement with Solitario MéxicoSurutato Mining, S.A. de C.V., or Solitario.“Surutato.” Under this agreement, SolitarioSurutato granted us the exclusive right to conduct exploration activities within its properties situatedproperty located in Hidalgo,Sinaloa, Mexico. In January 2012, we terminated the agreement with Solitario.
Currently we are conducting due diligence on the Guadalupe project, an exploration property owned by First Mexican Gold Corp.
Inversiones Colquijirca S.A. / Sociedad Minera El Brocal S.A.A.
Sociedad Minera El Brocal S.A.A., or El Brocal owns the Colquijirca and Marcapunta Norte mines.mines and the San Gregorio exploration project. El Brocal was formed in 1956 and is engaged in the extraction, concentration and sale of concentrates of polymetallic minerals, mainly zinc, lead and silver. On July 22, 2011,Currently, we completed the purchase of all of the outstanding equity of Inversiones Colquijirca S.A., which, in turn, owns 51.06 percent of El Brocal. As a result of this transaction, we increased our equity holdingown 56.29% of El Brocal from 46.08 percent to a 53.76 percent controlling interest, including shares held directly by usthrough both direct and indirectly through our wholly-owned subsidiary, Inversiones Colquijirca S.A.
Minera La Zanja S.R.L.indirect ownership interests.
Minera La Zanja S.R.L., or
La Zanja controls 32,070 hectares of mineralized ground in the La Zanja project, which is located 35 kilometers northwest of the city of Cajamarca. La Zanja, which is currently 53.06 percent53.06% owned by us, and 46.94 percent owned by Newmont Peru, began operations in September 2010 as an open-pit mine producing gold and silver.
Compañía Minera Coimolache S.A.
Compañía Minera Coimolache S.A., or Coimolache is a mining company that owns the Tantahuatay project,mine which is located in the province and district of Hualgayoc in the Cajamarca region, which is 35 kilometers northwest of the Yanacocha mine. We SCC and other third parties hold a 40 percent interest, a 40 percent40.10% interest and a 20 percent interest, respectively, in Coimolache. Construction of mining infrastructure at the Tantahuatayoperate this mine, which commenced in July 2010. Gold mining operations commenced in mid-2011.
Canteras del Hallazgo S.A.C.
Canteras del Hallazgo S.A.C. holds mining rights to the Chucapaca project. We and Gold Fields hold a 49 percent interest and a 51 percent interest, respectively, inthis company.
Ferrovías Central Andino S.A.
We hold 10 percent10% of Ferrovías Central Andino S.A., or Ferrovías, a railroad company, pursuant to a concession granted to a consortium of several companies in April 2000. Among the other companies holding interests in the share capital of Ferrovías are Railroad Development Corporation, Cemento Andino S.A., Commonwealth Development Corporation and others. Ferrovías provides transportation for concentrates from El Brocal’s mining operations.
Sociedad Minera Cerro Verde S.A.A.Apu Coropuna S.R.L.
WeApu Coropuna S.R.L., is currently hold 70% owned by us and 30% owned by Southern Peru Copper Corporation. Apu Coropuna S.A. was created for the purpose of conducting exploration within properties situated in Castilla, Arequipa.
Compañía 19.58 percent interestde Minas Cerro Hablador S.A.C.
Compañía de Minas Cerro Hablador S.A.C., is our wholly-owned subsidiary created for the purpose of conducting exploration activities pursuant to our agreement with Corporación Aceros Arequipa S.A. Under this agreement, Corporación Aceros Arequipa S.A. granted us the exclusive right to conduct exploration activities within its properties situated in CerroLivitaca, Cusco.
Procesadora Industrial Rio Seco S.A.
Procesadora Industrial Rio Seco S.A. is our wholly-owned subsidiary that owns and operates a monohydrate manganese sulphate crystallization plant situated in Huaral, Lima. This processing plant will allow mining from areas with high silver and manganese content within the Uchucchacua mine, which will improve silver recovery.
El Molle Verde which ownsS.A.C.
El Molle Verde S.A.C. is our wholly-owned subsidiary that develops the Cerro Verde copper depositTrapiche project, located approximately 1,100 kilometers southeastin the Apurimac region. See “Item 4. B. Business Overview–Exploration Projects in Non-Operating Areas” for further information of Lima. For more detail, see “Item 5. Operating and Financial Review and Prospects—Buenaventura” and “Item 5. Operating and Financial Review and Prospects—Cerro Verde.”this project.
YANACOCHA
A. History and Development of the Company
Founded in Peru in 1992, Yanacocha is one of the largest gold producerproducers in South America. YanacochaAmerica, having produced 1,345,992ounces917,691 ounces of gold in 2012.2015. Yanacocha’s operations are located in the Andes Mountains in Northern Peru in the arearegion of Cajamarca, located approximately 900600 kilometers north of Lima and north of the city of Cajamarca at an altitude of 4,000 meters above sea level. The Yanacocha property consists of sixthe following open-pit mines: Carachugo, Chaquicocha, Maqui Maqui, San JoséCerro Yanacocha, La Quinua Complex (La Quinua, El Tapado, El Tapado Oeste), Cerro YanacochaNegro Este, Western Oxide pits (La Quinua Sur and La Quinua. As of December 31, 2012, the Chaquicocha, Cerro YanacochaNegro Oeste), Eastern Oxide pits (Quecher Norte and La Quinua mines were in operation.Marleny) and Carachugo Alto.
Yanacocha continues to developalso owns the Conga project, which is located approximately 24 kilometers northeast of the Yanacocha operating mine in the provinces of Celendin, Cajamarca and Hualgayoc. The project consists of two gold-copper porphyry deposits that are estimated to more than double Yanacocha’s proven and probable reserves. However, since the middle of 2012, theThere was no exploration or development of new reserves because the Conga has been based on a “water first” approach, which consists of building the originally planned community water reservoirs priorproject's development and reserve balances reported in 2014 were reclassified to resuming any mine development. At the end of 2012, the first of these reservoirsmineralized material in San Nicolás and associated roads were under construction. Activity relating to design and procurement continued throughout 2012 and will be completed in early 2013, with the majority of equipment having already been delivered to the Yanacocha mine site. Work to ensure the economic viability as well as the social acceptance of the project continues in parallel with the site reservoir construction activities.2015.
As of December 31, 2012,2015, Yanacocha’s proven and probable reserves (excluding the Conga project’s proven and probable reserves)project, for which reserves were reclassified as resources or NRM as of December 31, 2015) were estimated to be 5.95.1 million ounces of gold, representing a 23percent decrease4% increase over Yanacocha’s proven and probable reserves as of December 31, 2011,2014, which were estimated to be 7.74.9 million ounces of gold. As of December 31, 2012, theThe Conga project’s proven and probable reserves are excluded because they were estimatedreclassified due to be 12.6 million ouncesthe expiration of gold and 3.3 billion pounds of copper, unchanged from the estimated 2011 gold and copper reserves. As of December 31, 2012, Yanacocha’s total proven and probable reserves (including the Conga project) were estimated to be 18.5 million ounces of gold, representing a 9 percent decrease over Yanacocha’s total proven and probable reserves as of December 31, 2011, which were estimated to be 20.3 million ounces of gold. Yanacocha’s total proven and probable reserves of copper were 3.3 billion pounds as of December 31, 2012.current permit.
Proven and probable reserves are based on extensive drilling, sampling, mine modeling and metallurgical testing from which economic feasibility has beenis determined. Under the Management Contract (as defined below), Newmont Mining, in conjunction with Yanacocha, calculates Yanacocha’s reserves by methods generally applied within the mining industry and in accordance with SEC Industry Guide 7. Reserves represent estimated quantities of proven and probable ore that, under present and anticipated conditions, may be economically mined and processed.
In 2012,2015, Yanacocha produced 1,345,992917,691 ounces of gold, compared to 1,293,123969,944 ounces of gold produced in 2011.The increase2014. This decrease in gold production in 20122015 as compared to 20112014 was mainly attributable tohigher production at the gold mill facility at Yanacocha, or theYanacocha Gold Mill, due to high ore grades from El Tapado pit.to:
| · | lower gold mill production (0.51 million ounces of gold produced in 2015 as compared to 0.46 million ounces of gold produced in 2014) due to lower feed grade (3.265 grams per ton in 2015 as compared to 3.871 grams per ton in 2014), lower recovery (80.2% in 2014 as compared to 83.2% in 2014) and lower throughput (6.1 million tons in 2015 as compared to 6.3 million tons in 2014) by the deep transitional campaigns; and |
| · | higher leach pad production (0.41 million ounces produced in 2015 as compared to 0.33 million ounces produced in 2014) resulting from the inventory reduction campaign and increased ounce placement during the first half of 2015 (301,631 ounces in 2015 as compared to 142,946 ounces in 2014) due to increased ore mining at Yanacocha, Cerro Negro, La Quinua Sur and Tapado Oeste. |
Silver production was 1,348,004574,110 ounces in 20112014 and 553,092447,376 ounces in 2012.The2015. This decrease in silver production in 20122015 as compared to 20112014 was mainly attributable to beginning the deep transitional process with lower ounces placed due to Yanacocha’s decision not to conductrecovery on silver mining activities atin the Yanacocha mine, which has high grade silver.gold mill.
Yanacocha is owned 51.35 percent by
Newmont Mining owns 51.35% of Yanacocha through its wholly-owned subsidiary Newmont Second, 43.65 percent by usSecond. We own 43.65% of Yanacocha through our wholly-owned subsidiary Condesa and 5 percentthe remaining 5% is owned by IFC. Yanacocha is managed by Newmont Peru. See “—“ – Management of Yanacocha—Yanacocha – General Manager/Management Agreement.” Although Yanacocha has no fixed dividend policy, there is an understanding among the partners that the net income not required for sustaining capital expenditures or future development projects should be distributed after agreement betweenfollowing approval by the two major shareholders of Yanacocha, Newmont Mining and us.
Capital Expenditures
Yanacocha’s capital expenditures from its formation in 1992 through 20122015 have related principally to the construction of the Carachugo, Maqui Maqui, San José, Cerro Yanacocha and La Quinua mining operations, the construction of two plants at Carachugo and Yanacocha, each of which includes a leach solution processing facility and a smelter at each plant, the construction of four carbon column plants at Cerro Yanacocha and La Quinua, the acquisition of both new and used mining equipment, the construction of two dams, the construction of one agglomeration plant at La Quinua, the construction of the Yanacocha Gold Mill, and several expansions of the leach pads located at the Carachugo, Maqui Maqui, Cerro Yanacocha and La Quinua mining operations.Yanacocha’sto:
| · | the construction of the Carachugo, Chaquicocha, Maqui Maqui, San José, Cerro Yanacocha, La Quinua Complex (La Quinua, El Tapado and Tapado Oeste), Cerro Negro Este, Western Oxide pits (La Quinua Sur and Cerro Negro Oeste), Eastern Oxide pits (Quecher Norte and Marleny) and Carachugo Alto mining operations; |
| · | the construction of two plants at Carachugo and Yanacocha, each of which includes a leach solution processing facility and a smelter; |
| · | the construction of the Yanacocha Gold Mill; |
| · | the construction of four carbon column plants at Cerro Yanacocha and La Quinua; |
| · | the acquisition of both new and used mining equipment; |
| · | the construction of two dams; |
| · | the construction of one agglomeration plant at La Quinua; |
| · | the expansion of storage at La Quinua Tailings; |
| · | the initial construction of a water treatment plant at La Quinua Tailings; |
| · | the construction of gold mill tailing pipeline and equipment components; and |
| · | several expansions of the leach pads located at the Carachugo, Maqui Maqui, Cerro Yanacocha, and La Quinua mining operations. |
Yanacocha’s capital expenditures from its formation through December 31, 2012 totaled2015 amounted to approximately US$5,393527 million, including capital expenditures of US$1,094311 million in 20112013, US$117 million in 2014 and US$1,14896 million in 2012. 2015.
In 2012,2015, Yanacocha’s principal capital expenditures included US$498 million for engineering, construction and equipment at the Conga project, US$338 million for mine development at El Tapado Oeste, the Western Oxides and the Eastern Oxides deposits, US$30 million for equipment components, US$25 million for water treatment plant studies and construction, US$18 million for gold mill tailings improvements, US$17 million for bio-leach studies and plant construction and US$15 million for the standardization of information technology systems.included:
| · | US$29 million associated with the initial construction of one water treatment plant at La Quinua; |
| · | US$28 million for the expansion of storage at La Quinua Tailings and the construction of the North Tailings Dump; |
| · | US$14 million for equipment components; |
| · | US$5 million for equipment upgrades in the Verde Bioleach Pilot Plant; |
| · | US$3 million for drilling activities in the Quecher project; |
| · | US$3 million for hydrogeological activities in the Western Oxides; and |
| · | US$17 million for other minor projects. |
Yanacocha anticipates that its capital expenditures for 20132016 will be approximately US$56679 million, of which it plans to use approximately US$30039 million for Yanacocha laybacks, US$24 million to continue with the construction of a water treatment plant at La Quinua, and US$4 million in connection with the construction of the Conga project.improvements in a residual water treatment plant. The remaining capital expenditure budget has been allocated for investment in current operations and development of future operations. No capital will be employed at the Conga Project in 2016.
Yanacocha expects that it will meet its working capital, capital expenditure and exploration requirements for the next several years from internally-generated funds, cash on hand and financing from banks and financial institutions.Thereinstitutions, if required. There can be no assurance that sufficient funding will be available to Yanacocha from internal or external sources to finance future working capital, capital expenditures and exploration and construction requirements, or that external funding will be available for such purposes on terms or at prices favorable to Yanacocha. A very significantfurther decline in the price of gold would be reasonably likely to affect the availability of such sources of liquidity. See “Item 5. Operating and Financial Review and Prospects—Yanacocha—B. Liquidity and Capital Resources—Exploration Costs; Capital Expenditures.”
B. Business Overview
Description of Yanacocha’s Operations
The Yanacocha property consists of the following open-pit mines: Carachugo, Chaquicocha, Maqui Maqui, San José, Cerro Yanacocha, La Quinua Complex (La Quinua, El Tapado, Tapado Oeste), Cerro Negro Este, Western Oxide pits (La Quinua Sur and Cerro Negro Oeste), Eastern Oxide pits (Quecher Norte and Marleny) and Carachugo Alto.
Leach pads are located atCarachugo (410 million ton capacity), Maqui Maqui (70 million ton capacity), Cerro Yanacocha (470 million ton capacity) and La Quinua (640 million ton capacity, including the Western Oxides). Each of these leach pads includes at least two leach solution storage ponds and storm water ponds located down gradient from each leach pad. The Cerro Yanacocha site has two additional solution ponds for the segregation of solution generated from the treatment of transition ores. A raw water pond is used both for storm containment and to store excess solution during the wet season.
Yanacocha has four processing facilities: Pampa Larga, Yanacocha Norte, La Quinua and the Yanacocha Gold Mill. The processing facilities can be used to process gold-bearing solutions from any of the leach pads through a network of solution pumping facilities located adjacent to the solution storage ponds or, in the case of the Yanacocha Gold Mill, to process high-grade gold ore to produce a gold-bearing solution for treatment at the La Quinua processing plant. The Yanacocha Gold Mill commenced operations in March 2008, and its total annual production is between 5.5 and 6.0 million dry metric tons, or DMT.tons. Production at the Yanacocha Gold Mill is expected to significantly impact Yanacocha’s future production capabilities, with total production measured in life-of-mine ounces at the Yanacocha Gold Mill representing 38percent38% of the total ounces produced by Yanacocha. In order toTo balance mining production and Yanacocha Gold Mill total production capacity, Yanacocha has established ore stockpiles in which it deposits most of the ore from the pits, and feeds a small portion directly to the plant. The Yanacocha Gold Mill sources mill ore from the Yanacocha, Chaquicocha, El Tapado and Tapado Oeste pits.
Mining consists of a sequence of drilling, blasting, loading and hauling. Ore containing gold is transported from each mine to the nearest active leach pad while waste is taken to specially designed storage facilities. Ore is then leached by introducing diluted solutions of cyanide through an irrigation system placed on top of the ore. This solution percolates through the ore, dissolving gold and silver as AuCN and AgCN complexes, respectively, and results in a “pregnant” solution which drains to solution storage ponds to be transferred to the nearest recovery facility. The end product is doré bars currently assayingcomprised of approximately 52 percent65-66% gold and 45 percentapproximately 29% silver. The doré bars are transported from the processing plant by an outside security firm to be refined outside of Peru. See “—Transportation and Refining.” The solution from which the gold is removed (barren solution) is recycled to the leach pads for further heap-leaching after having been reconstituted with cyanide. The leaching process is generally a closed system. However, during periods of high rainfall, excess water must be treated at the facilities located at Yanacocha Norte and Pampa Larga, which have been designed to meet or exceed standards for drinking water and for agriculture and livestock as set out by the Peruvian Ministry of Health, the U.S. Environmental Protection Agency, the State of Nevada Regulations and World Bank guidelines. See “Regulation, Permit and Environmental Matters.”
ElectricSince 1997, the energy and power supply for Yanacocha’s operations is currently provided by local power companies via two separate networks from the Cajamarca Norte substation in 60 kilovolts, or kV, and 220 kV, respectively. Yanacocha also maintains diesel generation capacity for emergency requirements, which have an aggregate power generation capacity of 33.75 MW. In addition, Yanacocha has been connected toobtained from the Peruvian national electricity grid since the end of 1997. Yanacocha currently receives its supply of electric powersystem through a 220 kV powerkilovolt (“kV”) transmission line originatingfrom the Trujillo-Norte substation in Trujillo whichto the Cajamarca-Norte substation in Cajamarca. This transmission line is owned by BuenaventuraConsorcio Energético Huancavelica–CONEHUA, and has a design capacity of approximately 150MW.
In August 2011, a new 220kV called Interandina line was brought online from Carhuamayo-Paracsha–Conococha-Kiman Ayllu (Huallanca) and connected to the Cajamarca-Norte substation. This line belongs to Abengoa and provides Yanacocha with energy and power, leaving the old transmission line with the energy flow to Trujillo.
Minera Yanacocha also has a 60kV double triad line and a 220kV simple triad line. Both are connected to Cajamarca-Norte Substation for the direct supply of its process plants.
Alternatively, in case of emergency, reduced supply or other event affecting the national electrical system, Yanacocha has its own power generators with a capacity of approximately 27MW. This system allows the Company to provide upmaintain the sustainability of its operation system and reduce its operational risks.
In connection with a bidding process carried out during 2014, the supply of energy and power for the period from 2015 to 150 MW2018 was awarded to Yanacocha (although current contractedDuke Energy (Egenor), which is expected to achieve reductions in energy prices and result in savings of over US$25 million during the four-year term of the contract.
In 2015, Yanacocha’s power consumption was approximately 469 Giga Watt Hours at a cost of US$28.46 million. The maximum demand is limited to 70 MW). In addition, a 60 kV power line routed through Cajamarca permits Yanacocha to receive up to 10 MW. This power line is used onlywas 63.3MW in emergencies. July 2015.See “Item 5. Operating and Financial Review and Prospects.”
Water for Yanacocha’s operations is collected from rainfall and wells. All excess water used by Yanacocha undergoes treatment at the facilities described above.
Set forth below are certain unaudited operating data for the years shown for each of Yanacocha’s mining operations that were then in operation:
| | | 2010 | | | 2011 | | | 2012 | |
| Mining Operations: | | | | | | | | | | | | |
| Ore mined (DST): | | | | | | | | | | | | |
| Cerro Yanacocha | | | 28,817,797 | | | | 1,434,279 | | | | 1,244,162 | |
| Carachugo | | | 23,455,796 | | | | 31,494,122 | | | | 26,270,839 | |
| Maqui Maqui | | | 1,267 | | | | 542,447 | | | | 1,590,491 | |
| La Quinua | | | 26,348,322 | | | | 27,161,711 | | | | 9,988,448 | |
| San José | | | 5,090,528 | | | | 3,556,183 | | | | 692,086 | |
| Cerro Negro | | | — | | | | 24,231 | | | | 2,872,609 | |
| Total ore mined (DST) | | | 83,713,710 | | | | 64,212,973 | | | | 42,658,634 | |
| Average gold grade of ore mined (oz./DST): | | | | | | | | | | | | |
| Cerro Yanacocha | | | 0.032 | | | | 0.011 | | | | 0.052 | |
| Carachugo | | | 0.028 | | | | 0.034 | | | | 0.032 | |
| Maqui Maqui | | | 0.007 | | | | 0.010 | | | | 0.016 | |
| San José | | | 0.016 | | | | 0.019 | | | | 0.017 | |
| La Quinua | | | 0.019 | | | | 0.030 | | | | 0.052 | |
| Cerro Negro | | | — | | | | 0.004 | | | | 0.012 | |
| Total average gold grade of ore mined (oz./DST) | | | 0.025 | | | | 0.031 | | | | 0.035 | |
| | | | | | | | | | | | | |
| Gold production (oz.): | | | | | | | | | | | | |
| Cerro Yanacocha | | | 659,080 | | | | 659,996 | | | | 141,038 | |
| Carachugo | | | 344,698 | | | | 274,723 | | | | 690,503 | |
| Maqui Maqui | | | 12,701 | | | | 9,906 | | | | 5,810 | |
| San José | | | 54,570 | | | | 45,271 | | | | 8,117 | |
| La Quinua | | | 390,571 | | | | 303,226 | | | | 488,320 | |
| Cerro Negro | | | — | | | | — | | | | 12,204 | |
| Total gold (oz.) | | | 1,461,620 | | | | 1,293,123 | | | | 1,345,992 | |
| | | 2013 | | | 2014 | | | 2015 | |
| Mining Operations: | | | | | | | | | | | | |
| Ore mined (DST): | | | | | | | | | | | | |
| Cerro Yanacocha | | | 1,477,391 | | | | 883,573 | | | | 6,379,952 | |
| Carachugo | | | 13,590,412 | | | | 7,721,830 | | | | 2,775,440 | |
| Maqui Maqui | | | 2,467,205 | | | | 619,755 | | | | 1,490,496 | |
| La Quinua | | | 21,098,589 | | | | 27,414,341 | | | | 17,312,927 | |
| San José | | | - | | | | - | | | | - | |
| Cerro Negro | | | 4,733,308 | | | | 3,644,896 | | | | 12,875,105 | |
| Total ore mined (DST) | | | 43,366,905 | | | | 40,281,395 | | | | 40,833,920 | |
| Average gold grade of ore mined (oz./DST): | | | | | | | | | | | | |
| Cerro Yanacocha | | | 0.016 | | | | 0.019 | | | | 0.010 | |
| Carachugo | | | 0.035 | | | | 0.031 | | | | 0.031 | |
| Maqui Maqui | | | 0.020 | | | | 0.025 | | | | 0.066 | |
| San José | | | - | | | | - | | | | - | |
| La Quinua | | | 0.031 | | | | 0.043 | | | | 0.037 | |
| Cerro Negro | | | 0.015 | | | | 0.024 | | | | 0.018 | |
| Total average gold grade of ore mined (oz./DST) | | | 0.029 | | | | 0.038 | | | | 0.027 | |
| | | | | | | | | | | | | |
| Gold production (oz.): | | | | | | | | | | | | |
| Cerro Yanacocha | | | 16,393 | | | | 30,713 | | | | 54,677 | |
| Carachugo | | | 437,095 | | | | 286,062 | | | | 87,146 | |
| Maqui Maqui | | | 5,856 | | | | 5,669 | | | | 67,195 | |
| San José | | | - | | | | - | | | | - | |
| La Quinua | | | 530,437 | | | | 595,751 | | | | 596,638 | |
| Cerro Negro | | | 27,478 | | | | 51,749 | | | | 112,033 | |
| Total gold (oz.) | | | 1,017,259 | | | | 969,944 | | | | 917,690 | |
Exploration
Exploration
Yanacocha’s mining activities encompass 313,049219,533 hectares, which are covered by 439328 mining concessions.concessions and applications. Of these 313,049219,533 hectares, Chaupiloma holds the mining rights related to 105,666102,803 hectares, which are covered by 144138 mining concessions. Yanacocha holds the mining rights related to 116,730 hectares underlying 190 concessions.
Chaupiloma has assigned these mining concessions to Yanacocha pursuant to several assignments of mining rights, each with an initial term of 20 years and one agreement with an extension of 17 years, which are renewable at Yanacocha’s request for an additional 20-year term.17, 20 or 30-year terms, as the case may be.
Yanacocha has threefour processing concessions from the MEM for its processing plants: Cerro Yanacocha (Yanacocha Gold Mill, Cerro Negro, La Quinua and Yanacocha), Yanacocha (Carachugo and Pampa Larga) and China Linda.Linda (non-metallic). The processing concessions have indefinite terms, subject to the payment of an annual fee based on nominal capacity for the processing plant. An additionalThese four processing concessionconcessions include the Conga project, which is pendingin the process of being granted.
Advanced exploration and early-stage development expenditures for the Conga project.Yanacocha District during 2015 totaled US$64.2 million as compared to US$8.9 million in 2014. Expenditures focused on oxide development and advanced exploration projects which included:
| · | reserve and resource infill drilling on the Quecher Main deposit; |
Exploration expenditures amounted to approximately US$24.0 million and US$40.0 million in 2011 and 2012, respectively. These expenditures have been used to identify deep sulfide mineralization beneath the oxide deposits at Tapado Oeste North,
| · | reserve conversion infill drilling on the Los Pinos layback at Yanacocha Sur; |
| · | advanced exploration at the Marleny target; |
| · | development support on the Verde Bioleach Demonstration Facility; and |
| · | exploration drilling in the Antonio and Tapado deposits. |
During 2016, Yanacocha Sur, La Quinua Sur and Cerro Negro, to reevaluate and advance the Chaquicocha Sulfides and Yanacocha Verde projects and to complete additional drilling designed to increase ore grade and resources and continue exploration in the Yanacocha district and surrounding areas. In 2013, exploration efforts willexpects focus on continuing the development of the Chaquicocha Sulfides project, testing the extension of the Yanacocha Verde deposit, continuing exploration activities in the Yanacocha district and conducting an exploration program in the Yanacocha concession block outside of the operation district.its area of operations.
Yanacocha’s exploration expenditures include all of the costs associated with exploration activities such as drilling and geological and metallurgical testing. In addition, exploration costs cover engineering and project development costs on advanced stage projects. Yanacocha prepares a budget for each yearannually and allocates an amount for exploration activities based on specific projects or regions.
Yanacocha intends to continue to develop the Cerro Yanacocha, La Quinuadeveloping other oxide and Chaquicocha gold depositsulfide projects and the Conga gold-copper deposit project over the next several years, while continuing to explore the remainder of the Yanacocha district along with the adjacent Minas Conga and Solitario mineral holdings. The Conga project currently consists of two gold-copper porphyry deposits that are estimated to more than double Yanacocha’s proven and probable reserves.deposits. The Conga project is located approximately 24 kilometers northeast of Yanacocha’s operating mine in the provinces of Celendin, Cajamarca and Hualgayoc. This project, incorporated into reserves beginning in 2004 and 2005, reported 12.6 million ounces of gold reserves and 3.3 billion pounds of copper reserves as of December 31, 2012.
Due to local political and community protests, construction and development activities at the Conga project were largely suspended in November 2011. The results of the Peruvian central government-initiated EIA independent review were announced on April 20, 2012 and confirmed that our initial EIA met Peruvian and international standards. The review made recommendations to provide additional water capacity and social funds, which Yanacocha has largely accepted. Yanacocha announced its decision to move the project forward on a “water first” approach on June 22, 2012. As a result, investment on the project will be reduced in 2013 to approximately US$250 million to US$300 million, and focus on building water reservoirs, completing the last engineering activities and accepting delivery of the main equipment purchases. Construction of Conga and the implementation of the independent EIA review recommendations will continue provided it can be done in a safe manner with risk-adjusted returns that justify future investment. Should Yanacocha be unable to continue with the current development plan at Conga, we or our mining partners in the project may reprioritize and reallocate capital to development alternatives which may result in a potential accounting impairment.2015.
For 2013,2016, Yanacocha estimates expenditures of US$19.83.5 million for exploration, and an additional US$1.24.41 million related to reserve delineation, characterization and sterilization activities for ore bodies that are currently classified as reserves. Both expenditure estimates are exclusive of significant development engineering charges. This budgeted amount will be expended mainly on oxide reserve conversion, extension drilling of known near-surface oxide inventories, sulfide exploration and early stage development atwithin the Yanacocha and an extensive exploration program in district and regional properties that Yanacocha controls.district.
As of December 31, 2012,2015, the Yanacocha district’s proven and probable reserves (excluding the Conga project’s proven and probable reserves) were estimated to be 5.95.1 million ounces of gold, a 234 percent decreasefromincrease from the Yanacocha district’s proven and probable reserves as of December 31, 2011,2014, which were estimated to be 7.74.9 million ounces of gold. The decreasein reserves of gold was mainly due to mine depletion, and to a lesser extent, to reserve revisions and leach and stockpile inventory changes.
As of December 31, 2012, the Conga project’s2015, proven and probable gold reserves were estimated to be 12.6 million ouncescalculated using a gold price assumption of gold and 3.3 billion pounds of copper, unchanged from the 2011 gold and copper reserves.US$1,200 per ounce.
Transportation and Refining
The doré bars produced by Yanacocha are transported to refineries outside of Peru and, accordingly,as a result, Yanacocha has entered into pre-established transportation contracts. Yanacocha has engaged Hermes Transportes Blindados S.A., or Hermes,“Hermes,” to service its local transportation requirements. Under the terms of Yanacocha’s agreement with Hermes, the risk of loss with respect to the doré bars is assumed in its entirety by Hermes during the transportation of the doré bars from the mines to Jorge Chávez Airport in Lima. Thereafter, the responsibility for the doré bars shifts to the refiner, which has entered into a contract with an outside security firm to provide offshore transportation. The doré bars are melted, weighed and sampled in refineries abroad, which store the doré bars in strong-room vaults and assume responsibility there for the doré bars. Yanacocha pays a predetermined fee for the refining service. The final output from refineries, known as London Good Delivery gold and silver, is credited to Yanacocha’s London bullion accounts until transferred to purchasers.
Sales of Gold
Yanacocha’s gold sales are made through a monthly open-bidding process in which Yanacocha auctions its production corresponding to the next four to five weeks. This bidding process is set up by Yanacocha with approximately 10 financial institutions and trading firms prior tobefore each month. Yanacocha collects bids and confirms sales. The gold is typically sold on the date of departure from Jorge Chávez Airport in Lima. If a portion of gold remains unsold, it is sold on the spot market within a few days. Silver is sold on the spot market approximately once a month to financial institutions or trading firms. The cash from such sales is received into a collection account in London against orders to the London bullion bank for deliveries of the gold and silver to the purchasers.
Delivery is made once a week and payments are collected on the day of confirmation. The payment price for the gold consists of either (i) the market price at the confirmation of the sale, or (ii) the average London PM Fixingfixing price over the tendered period plus a small premium established pursuant to the bidding process. Since 1994, Yanacocha has consistently sold to five or six financial institutions and trading firms at each auction. Such buyers are market makers and active participants in precious metal markets.
Employees
As of December 31, 2012,2015, Yanacocha had 2,647 employees.Compensation received1,745 employees.The compensation granted by Yanacocha’sYanacocha to its employees includes a base salary and other non-cash benefits such as a health program and term life insurance. In addition, pursuantAdditionally, according to the profit sharing plan mandatedrequired by Peruvian labor legislation,laws, Yanacocha employees at Yanacocha are entitledhave the right to receive 8 percent8% of Yanacocha’s annual pre-tax profits or the Employee Profit Sharing Amount, with 50before taxes. Fifty percent of suchthese profits tomust be distributed based onin proportion to the number of days each employee worked during the precedingprevious year, and the remaining 50 percent50% of such profits tomust be distributed among the employees based on the aggregateaccording to each employee’s total annual salary of each employee.salary.
Yanacocha has entered into arrangementsagreements with independent contractors that are responsible for the security services and staffing for several operational and administrative areas.the execution of the Company’s projects in compliance with applicable legal regulations. As of December 31, 2012,2015, independent contractors employed 9,790had hired 4,239 persons who worked at Yanacocha’s operations. were working in the Company’s operations, including the Conga Project.
In 2004, Yanacocha entered intosigned its first collective bargaining agreement with a union representing certain of its employees, which was created on December 9, 2003. In 2012, a new union was established. During 2013, direct collective bargaining agreements were signed with both unions for a three-year period (2013-2016). The Labor Relations Department of Industrial Relations meets regularly with union leaders on a monthly basis to address labor problemsvarious subjects and concerns in the organization andorder to promote the creation of a productive and harmonious laborwork environment. The parties addressresolve their issuesdifferences through open and transparent dialogue.talks. In 2012, a new union was established, and in 2013, a new2016, we expect to begin negotiating an extension of the collective bargaining agreement with the two existing unions for the following period.
In order to strengthen the relations and communication process will occur with bothits employees, Yanacocha’s upper management held about four face-to-face meetings with important Yanacocha stake-holders, where they had the new unionopportunity to listen to the business plans and existing unions.operating results, as well as to raise their concerns and make suggestions.
During 2015, key development programs have been implemented in order to increase technical, leadership and management skills based on talent management analysis process at all levels in our employee population. The total number of training hours in 2015 was 161,458. One program was the First Line Supervisor Program held for 216 individual collaborators and supervisors with the support of Adolfo Ibanez University. Additionally 43 managers and superintendents attended the “Talent Management during Change Environment” run by CEB Valtera.
Yanacocha offers its employees opportunities to collaborate, innovate and succeed in their careers. Its employee performance assessment system is associated with Yanacocha’s core values and measures its employees’ performance from a social responsibility, relationship management and leadership point of view. The work culture encompasses diversity, interacts with employees, encourages environmental and social responsibility, rewards outstanding performance and tries to develop great leaders at all levels.
Social Development
Since its formation,creation, Yanacocha has been attentive to social development andfocused on its relationships with local communities.
During 2012, Yanacocha invested a total of US$40.5 million for social development at various projects, including the Conga project and The Associaiton Los Andes of Cajamarca (ALAC), of which US$24.4 million was used for farming activities, promotion of community capabilities, education and public infrastructure. Additionally, Yanacocha invested US$16.1 million for social impact mitigation related to the implemention of social development projects, farming, construction of irrigation infrastructure, development of a former landowner families program and completion of pending commitmentsrelationship with the surronding communitties.
In addition, Yanacocha also invested US$10.1 millioncommunity and actively participating in contributions for social investment through the Cajamarca Mining Solidarity Fund in 2012.
its development. Since 1993, Yanacocha has invested nearly US$395.5444 million in social development programs including education, health, social infrastructure (schools and medical posts), productive infrastructure projects, rural electrification, roads, business promotion programs, local tourism programs and agricultural assistance programs.
Despite significant social investment, in recent years Yanacocha has experienced several conflicts that in some cases have affected the normal course of its operations. As a result of these conflicts, Yanacocha has increased its efforts to listen to and address the concerns and expectations of the local population.
To this end, in 2014 Yanacocha began implementing the legitimacy approach in its community engagement with a special emphasis on the following aspects: respect for Cajamarca, transparency and credibility, responsibility for water and environmental care and being a partner for development. Yanacocha believes this new engagement approach has been recognized by the community as a sign of positive change in Yanacocha.
During 2015, Yanacocha invested a total of US$5.25 million on social matters, US$4.61 million of which (including Conga Project and the Association Los Andes of Cajamarca - ALAC) were invested mainly in farming activities, the promotion of community capabilities, education and public infrastructure. Additionally, Yanacocha invested US$0.64 million in the mitigation of mining’s social impacts in its areas of operation and implemented agricultural and livestock projects, irrigation infrastructure, social development projects and the fulfillment of pending commitments with surrounding communities.
In addition, in 2015 Yanacocha invested US$2.38 million in contributions for social investment through the Cajamarca Mining Solidarity Fund. Also, Yanacocha has invested US$1.57 million on maintenance of the Kuntur Wasi road.
During 2016 Yanacocha will be focused on further improving its relationship with local communities and maximizing the value and recognition of its social investment to ensure the viability and legitimacy of its activities.
Security
Yanacocha has 5111 security employees on its payroll, including 7five employees responsible for the security of the region as a whole. In addition, Yanacocha has a contracted security force of over 221288 persons assigned to rotating shifts at its mine,mines, its Lima offices and the city of Cajamarca, checkpoints along the road to the coast of Peru and residential areas in Cajamarca. The Conga project has a total of 13092 contracted security personnel responsible for patrolling and providing security to the project including Yanacocha’s offices in the city of Cajamarca.rotating shifts.
As of March 31, 2013, noneNone of Yanacocha’s employees, the properties on which it conducts mining operations or its Lima headquarters had beenwas the target of a terrorist incident.incidents during 2015.
Mining and Processing Concessions
Yanacocha’s mining activities encompass 313,049 hectares covered by 439 mining concessions. Of these 313,049 hectares, Chaupiloma holds the mining rights related to 105,666 hectares, covered by 144 mining concessions. Chaupiloma has assigned these mining concessions to Yanacocha pursuant to several assignments of mining rights, each with an initial term of 20 years, which are renewable at Yanacocha’s request for an additional 20-year term. The rights to four additional concessions are currently pending, one of which relates to the Conga project.
Yanacocha believes that the mining concessions assigned to it are in full force and effect under applicable Peruvian laws and that it is in compliance with all material terms and requirements applicable to thethese mining concessions. To the best of its knowledge, Yanacocha is not experiencingsubject to any condition, occurrence or event known to it that would cause the revocation, cancellation, lapse, expiration or termination thereof,of any of its concessions, except that Yanacocha and Chaupiloma may, from time to time, remake, cancel, terminate or allow to lapse mining concessions assigned to Yanacocha that are not material to the conduct of Yanacocha’s business.
Yanacocha has been actively pursuing the acquisition of the land surface rights or obtaining easements relating to land positions containing prospective geological exploration target sites, deposits that can be developed in the future or areas that would be considered for plant or facility sites. To date, Yanacocha has acquired all the surface rights with respect to 24,50224,685.32 hectares of the surface land covering its Carachugo, Chaquicocha, Maqui Maqui, Haussing, Laboratorio, Línea de Alta Tensión, Presas, Museo, Sorpresa Mishacocha, San José, Cerro Yanacocha, Las Lagunas, the Conga project, China Linda, Amaru,Amaro, Chasu, Solitario, La Carpa, Canjes and La Quinua (which includes the Cerro Negro deposit) mining operations, and a majority of the Cerro Quilish deposit and Calera China Linda.
In addition, as of December 31, 2012,2015, Yanacocha had acquired 24,69224,685.32 hectares, including 5,8045,800.88 hectares of surface rights with respect to the Conga deposit, 3,5893,588.25 hectares for Carachugo/San José/Chaquicocha, 2,1542,153.84 hectares for Yanacocha and 1,6511,649.94 hectares for Quilish. During 2015, the Company did not acquire any hectares. See “Yanacocha—“Yanacocha – A. History and Development of the Company.”
Regulation, Permit and Environmental Matters
Yanacocha is subject to a full range of governmental regulation and supervision generally applicable to companies engaged in business in Peru, including mining laws, labor laws, social security laws, public health, consumer protection laws, environmental laws, securities laws and antitrust laws. See “—Buenaventura—“– Buenaventura – B. Business Overview—Overview – Regulatory Framework—Framework – Mining and Processing Concessions” and “—Buenaventura—“– Buenaventura – B. Business Overview—Overview – Regulatory Framework—Framework – Environmental Matters” for a general description of Peruvian regulations of mining companies and environmental obligations. See “—Mining and Processing Concessions” above for a discussion of Peruvian regulations relating to the mining and processing concessions utilized by Yanacocha in its mining operations.
Yanacocha is required to submit certaintechnical documentation with respect to its plansmining and operations plans for the review and approval of various Peruvian government entities, including the MEM, the Ministry of Agriculture, the National and the Local Water National Authority,Authorities, and the Ministry of Health. Yanacocha is required to file and obtain approval of an EIS with a Benefit Concession and Mining Permit for each of its mining operations before being authorized to operate such mine. EISsoperate. The EIS for the Carachugo, Maqui Maqui, San José, Cerro Yanacocha, La Quinua (including Cerro Negro) mining operations and China Linda lime plant have been reviewed and approved. Pursuant to current Peruvian regulations, Yanacocha also submits supplemental EISs each time a project’s production rate or disturbed area used is expanded by more than 50 percent.expanded. In 2006, Yanacocha filed an EIS modification to expand its operations at Yanacocha with the Supplemental Environmental Impact Assessment East (“SYE”) and in the vicinity of La Quinua with the Supplemental Environmental Impact Assessment West (“SYO”). Since 2006, two additional modifications have been submitted and approved for the original supplemental SYE EIS and one additional modification has been submitted and approved for the original supplemental SYO EIS.
The improved permit application processing times by most of the regulatory authorities observed since the third quarter of 2013 continued into 2015. A total of 31 permits of different types were approved at Yanacocha and La Quinua areas. After ananother four permits, mainly related to environmental controls, were approved for the Conga project. The approvals of greatest significance in 2015 were a group of several minor modifications to the existing EIS pursued throughInformes Técnicos Sustentatorios (“ITS”) for the components of Marleny Open Pit, Bioleaching Plant, China Linda and Water Treatement Plant LQ. The Beneficiation Concession Permits that were approved included the Benefit Concession Permit are approved and construction activities are initiated, a governmental-accredited environmental auditing firm is required to audit the operation. Each of the Carachugo,north TSF phase 1 LQ, the construction of Water Treatment Plant LQ and operation of 10 hectares of the leach pad 8A LQ. ITS for exploration of the projects of Yanacocha, San Jose 2 and Maqui Maqui San José, Cerro Yanacocha, La Quinua (including Cerro Negro) mining operations and China Linda lime plant has been and continues to be audited as required with no pollution problems identified.were also approved, the latter includes the Chaquiocha underground project, whose modification involved the relocation of the entrance portal.
Yanacocha’s corporate policy is tooperate in compliance with all applicable laws and regulations and adopt and adhere to standards that are protective of both human health and the environment at the facilities it builds and operates.
Yanacocha has informed us that its management believes that its operations are conducted in accordance with applicable laws and regulations. Audits and corrective action plans are used to assure compliance. Future exploration, expansion and new projects will require a variety of permits. Although procedures
On December 20, 2015, the Ministry of Environment issued a regulation that modifies the ECA and extends the deadline for permit applications and approvals have been historically faster in Peru than incompliance. The new regulation provides 60 days to notify the United States, current procedures andauthority whether the existing regulatory environment are more complex, time-consuming and susceptible to potential delays.
Yanacocha has informed us that as a result of the enactment of the new Water Resources Law and the new Rule for Exploration Activities,new environmental quality standards for water and new maximum permissible limitscompany will require the adoption of new technologies for the adjustment of water treatment and management systems. In 2010, Yanacocha implemented a Water Management Project to improve its treatment system and water management in orderbe able to comply with the new water regulations.ECA, and a year to prepare and submit a modification of EIA – Plan Integral and a total of four years for the implementation phase.
During 2005, Yanacocha became a signatory to the International Cyanide Management Code, which provides specific and strict standards on how to manage cyanide. The required audit process was completed in September 2007 and certification under the International Cyanide Management Code occurred during April 2008. Yanacocha commissioned and successfully completed recertification audits to maintain International Cyanide Code Certification. Another Cyanide Code recertification audit was conducted in 2014 and, after having addressed the recommendations accordingly, Yanacocha was re-certified in February 2015. The Yanacocha environmental laboratory was recertified under ISO 17025 in 2015.
Yanacocha has informed us that its management believes that it is in compliance with all applicable regulations and international standards concerning safety. For the year ended December 31, 2012,2015, Yanacocha experienced 119five lost time injuries, compared to 67 during the year ended December 31, 2011.same number of lost time injuries it experienced in 2014.
Insurance
Yanacocha maintains a comprehensive insurance program designed to address the specific risks associated with its operations, in addition to covering the normal insured risks encountered by major mining companies.
Yanacocha’s insurance program consists of a “Primary Program” and an “Umbrella/Excess Program.” Coverage under the Primary Program is provided through the local Peruvian insurance market and includes employers’ liability, comprehensive third party general liability, comprehensive automobile liability, and all risk property on a replacement basis, including transit risks, business interruption insurance and mining equipment. Coverage under the Umbrella/Excess Program is provided through Newmont Mining’s master worldwide insurance program and addresses claims that the Primary Program cannot, or will not, cover. Yanacocha received an additional US$14.4 million settlement in 2008 from its insurance program in connection with a mercury spill.
By-Laws of Yanacocha
Yanacocha is governed by the Peruvian Companies Law and theestatutos (the combined articles of incorporation and by-laws) of Yanacocha, or the Yanacocha“Yanacocha By-Laws.”
Control Over Major Corporate Events
Pursuant to the Peruvian Companies Law and the Yanacocha By-Laws (including applicable quorum requirements), without the affirmative vote of the partners of Yanacocha representing at least 51 percent51% of the voting shares, none of the following may occur: (i) an increase or decrease in Yanacocha’s capital, (ii) the issuance of any debentures, (iii) any sale of an asset whose book value is at least 50 percent of the paid-in capital relating to such asset, (iv) any amendment to the Yanacocha By-Laws in order to change its business form, (v) the merger, consolidation, dissolution or liquidation of Yanacocha or (vi) any other amendment of the Yanacocha By-Laws.
| · | an increase or decrease in Yanacocha’s capital; |
| · | the issuance of any debentures; |
| · | any sale of an asset whose book value is at least 50% of the paid-in capital relating to such asset; |
| · | any amendment to the Yanacocha By-Laws to change its business form; |
| · | the merger, consolidation, dissolution or liquidation of Yanacocha; or |
| · | any other amendment of the Yanacocha By-Laws. |
Pursuant to the Shareholders Agreement among Newmont Second, Condesa,Compagnie Miniére Internationale Or S.A.and IFC, dated as of August 16, 1993, as amended by a General Amendment Letter, dated August 17, 1994, any member of the Executive Committee of Yanacocha who wishes to propose that Yanacocha’s Executive Committee authorize Yanacocha to take a Significant Action (as defined below) must (i) give written notice to each partner of such proposal prior tobefore consideration thereof at a meeting of the Executive Committee and (ii) refrain from voting to approve such Significant Action until (x) the Executive Committee has received the consent of 80 percent80% of the partners of Yanacocha (a partner is deemed to have consented if no objection is received from such partner within 30 days after being notified) or (y) the Executive Committee has received the consent of at least 51 percent51% of the partners of Yanacocha and 45 days have elapsed since the member of the Executive Committee who proposed the Significant Action has responded in writing to objections received from objecting partners. “Significant Action” means (i) a disposal or sale of more than 20 percent by value of Yanacocha’s fixed assets, (ii) any planned shutdown or cessation of Yanacocha’s mining activities that is planned to last for more than one year, (iii) any capital expenditure by Yanacocha exceeding US$20 million, (iv) any disposal or sale by Yanacocha of the mining rights covered by certain concessions or (v) the approval of the construction of a project in the area owned by Yanacocha (other than the Carachugo mine and processing facilities).means:
| · | a disposal or sale of more than 20% by value of Yanacocha’s fixed assets; |
| · | any planned shutdown or cessation of Yanacocha’s mining activities that is planned to last for more than one year; |
| · | any capital expenditure by Yanacocha exceeding US$20 million; |
| · | any disposal or sale by Yanacocha of the mining rights covered by certain concessions; or |
| · | the approval of the construction of a project in the area owned by Yanacocha (other than the Carachugo mine and processing facilities). |
Preemptive Rights
The Peruvian Companies Law and the Yanacocha By-Laws provide preemptive rights to all partners of Yanacocha. In the event of a capital increase, any partner has a preemptive right to pay its pro rata share of such increase in order to maintain such partner’s existing participation in Yanacocha.
In the event of a proposed transfer, exchange or sale, either voluntary or involuntary, of participation, collectively referred to as the Offered“Offered Participation,” of one or more partners, any partner has a right to acquire the Offered Participation in proportion to its holdings of partners’ capital. InIf the event that not all of the partners wishentire partnership fails to exercise this right or some partners indicate their decision to acquire a smaller share than that to which they are entitled, the other partners will be entitled toreceive an increase, and consequently, the remaining participation will be distributed among them in proportion to such partners’ capital participation and within the maximum limit of the participation they have stated their intention to acquire. Finally, any Offered Participation remaining unsubscribed by the partners must first be offered to Yanacocha before they may be offered to third parties.
In addition, in the event of the occurrence of a change of control (as defined) with respect to a significant partner, or the parent of a significant partner, in Yanacocha, the other significant partner will have the right to acquire the first partner’s participation interest in Yanacocha. No change of control will occur with respect to a significant partner so long as the parent of such partner is publicly traded or if such partner’s parent is acquired, the acquiring company is publicly traded.
Legal Proceedings
For a discussion of legal proceedings, see Note 1920 to the Yanacocha Financial Statements.
Other than the legal proceedings described in the Yanacocha Financial Statements, Yanacocha is also involved in certain legal proceedings arising in the normal course of its business, none of which individually or in the aggregate is material to Yanacocha or its operations.
Management of Yanacocha
Executive Committee
Pursuant to the Yanacocha By-Laws, Yanacocha’s Executive Committee consists of six members, all of whom are appointed by the partners of Yanacocha. Richard T. O’Brien,Gary J. Goldberg, President and Chief Executive Officer of Newmont Mining Corporation, has been appointed Chairman of Yanacocha’s Executive Committee, and AlbertoRoque Benavides, our former Chairman,President and Chief Executive Officer, serves as the Vice Chairman of Yanacocha’s Executive Committee through 2013.Committee. The Vice Chairman has the power to preside over the meetings of Yanacocha’s Executive Committee in the Chairman’s absence. The members of the Executive Committee are elected for a three-year term but may continue in their positions until the next election takes place and the newly elected members accept their positions. Alternate members are elected in the same manner as members and can act in place of and with all the authority of members when a member is unavailable, except that an alternate member may not act as either Chairman or Vice Chairmanpreside over the meetings of Yanacocha’s Executive Committee. The Chairman has the right to cast the deciding vote in the event of a deadlock among Yanacocha’s Executive Committee.
General Manager/Management Agreement
The Yanacocha By-Laws provide that the Yanacocha Partners’ Meeting has the power to appoint and remove the Manager of Yanacocha; the Executive Committee has the power to appoint and remove other officers of Yanacocha, determine their duties and compensation and grant and revoke powers of attorney. Newmont Peru was named as Yanacocha’s Manager according to a publicly filed deed, and it continues to hold that position. Newmont Peru’s duties as Manager are defined in the Management Contract dated February 28, 1992, as amended, between Yanacocha and Newmont Peru. Pursuant to the Management Contract, Newmont Peru is responsible for managing, conducting and controlling the day-to-day operations of Yanacocha and keeping Yanacocha’s Executive Committee informed of all operations through the delivery of various written reports. The Management Contract was amended as of December 19, 2000. The amendment extends the term of the Management Contract for a period of 20 years starting at the date of amendment and provides that it may be extended for additional terms of 20 years upon request by Newmont Peru. Newmont Peru, however, may cancel the Management Contract by giving six months’ prior notice to Yanacocha. The Management Contract will be deemed terminated if, due to reasons attributable to the bad management of Yanacocha, except for reasons beyond its control, Newmont Peru is unable to substantially complete the agreed work programs. In exchange for its services as Manager, Newmont Peru receives remuneration of US$2 per ounce of gold production and its equivalent for copper production paid on a quarterly basis, which amount is expected to cover the overhead and administrative expenses for the management of the operations. Also, Newmont Peru may charge Yanacocha for the salaries of employees of Newmont Peru or its affiliates who are directly involved in the operation of Yanacocha. In 2012,2015, Yanacocha accrued fees of US$8813.3 million owed to Newmont Peru and its affiliates under the Management Contract.
Control Over Major Corporate Events
See “—By-Laws of Yanacocha” above for a description of certain provisions of Peruvian law and of the Yanacocha By-Laws relating to control over major corporate events.
Preemptive Rights and Rights of First Refusal
See “—By-Laws of Yanacocha” above for a description of certain provisions of Peruvian law and of the Yanacocha By-Laws relating to preemptive rights and rights of first refusal.
D.Property, Plants and Equipment
| D. | Property, Plants and Equipment |
Our Properties
Introduction
We operate ten mines:currently have five wholly-owned operating mines (Orcopampa, Uchucchacua, Julcani, Recuperada, Uchucchacua, Orcopampa, Poracota, Mallay Breapampa, Antapite, Ishihuinca and Shila-Paula. We also haveBreapampa) and controlling interests in two mining companies which operate the Colquijirca, MarcapuntaColquijirca-Marcapunta and La Zanja mines. We also own an electric power transmission company, andan energy generation company, a chemical processing company, an engineering services consulting company and an insurance brokerage company. We also have non-controlling interests in several other mining companies, including a significant ownership interest in companies that own and operate the Yanacocha, Cerro Verde and Tantahuatay mines.See “—Buenaventura—C. Organizational Structure” and “—Intermediate“Intermediate Holding Companies, Subsidiaries and Equity Participations.” Set forth below is a map of our principal mining operations as of April 30, 2013.operations.
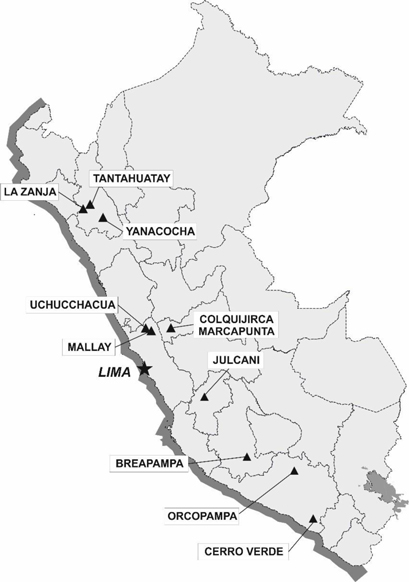
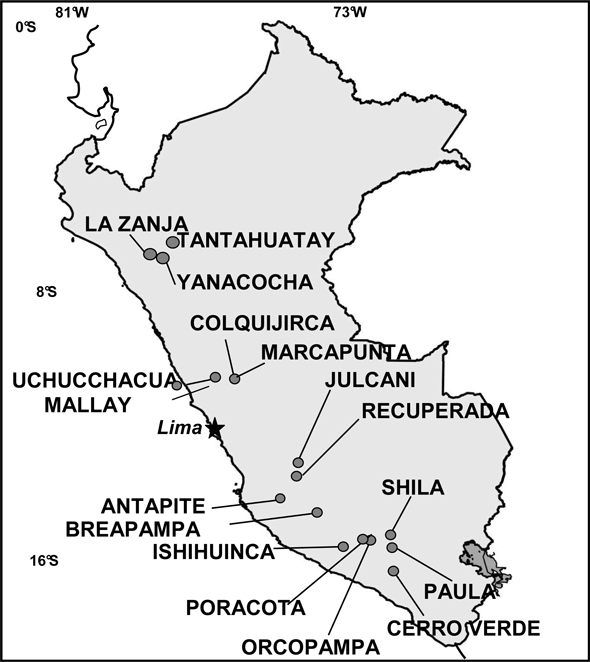
OperatingDirectly Operated Properties
Orcopampa
The Orcopampa mine is wholly ownedwholly-owned and operated by us. We lease the rights to the mining concessions of Orcopampa from a group of private investors. This lease, which expires in 2043, requires a payment from us equal to 10 percent10% of production value, subject to certain conditions. Operations started in the Orcopampa mine in 1965. In 2012,2015, we made lease payments of US$38.39million. We21.9 million.We operated Orcopampa as a silver mine until the late 1990s, when we also began to mine gold-bearing veins. At December 31, 2012, the net total fixed assets of Orcopampa were approximately US$60.3 million.
The Orcopampa mine is located in the province of Castilla, department of Arequipa, approximately 1,350 kilometers southeast of the city of Lima, at an altitude of between 3,800 and 4,500 meters above sea level. Access is by a 192-kilometer unpaved public road, which connects to the Pan American highway, and by airstrip.
The Orcopampa mining propertymine consists of an epithermal gold telluride deposit, hosted by early Miocene to Holocene calc-alkaline to high potassium calc-alkalineinto lava flows and domes of the Sarpane Complex,complex (calc-alkaline to high potassium), of early Miocene to Holocene, which forms part of the tertiary metallogenic (Au-Ag) belt of Southern Peru.Peru (Au-Ag).
Mining at Orcopampa is conducted underground using the mechanized cut-and-fill method. OreMine ore is processed atby the Carbon in Leach method in a millplant located at Orcopampa.in Orcopampa, which was also outfitted for the treatment of old tailings. Electric power is generated and supplied by a 3,900 kW hydroelectric plant that is owned by us and a power line, which is connected toprimarily obtained from the Peruvian national electricity grid. Water for operations at Orcopampa is obtained from a lake and three rivers. When water is scarce, electric power for the Orcopampa mine can be provided by a 3,976 kW diesel generator. In 2012, we completed construction of a new tailing dam to extend the life of this mine. The 4A tailing dam has a capacity of 2.5 million cubic meters and is expected to be operational until 2016.
During 2012, we focused our
In 2015, geological exploration belowactivities were continued on the 3,440-meter levelLucía – Julissa veins system, extension east of Prometida Ramal 1 in the Prometida mine and on the Nazareno Esperanza, Prosperidad, Lucia Angelaveins system, which includes Nazareno Este, Pucará Sur, Denisse and Concepción veins and below the 3,540-meter level on the Natividad-Ocoruro vein system. We completed 13,283 meters of underground mining exploration works and 33,630 meters of diamond drilling. We also deepened the Nazareno and Prometida shafts, which will improve our exploration of the lower levels of the Chipmo mine. In 2013, we plan to continue exploration of the lower levels of the Chipmo mine. We also plan to explore the southeast extension of mineralized structures at Pucay and Natividad-Ocoruro at the 3,540-meter level through underground tunnel development and diamond drilling.Oliva.
As of December 31, 2012, we calculated2015, proven and probable ore reserves of 673,722 DST,totaled 648,353 tons, with 0.53 ounces51.32 grams per ton of silver and 0.43 ounces per ton of gold, and probable ore reserves of 417,169 DST, with 0.56 ounces per ton of silver and 0.40 ounces per ton of gold. We have estimated NRM of 420,030 DST, with 5.05 ounces per ton of silver and 0.435 ounces14.78 grams per ton of gold.
Set forth below are certain unaudited operating data for the periods shown for Orcopampa, calculated on the basis of 100 percent100% of the mine’s production.
| | | Year Ended December 31,(1) (2) | | | Year Ended December 31,(1) | |
| | | 2010 | | 2011 | | 2012 | | | 2014 | | | 2015 | |
| Mining Operations: | | | | | | | | | | | | | | | | | | | | |
| Ore mined (ST) | | | 484,767 | | | | 499,732 | | | | 508,647 | | |
| Average gold grade (oz./ST) | | | 0.625 | | | | 0.551 | | | | 0.492 | | |
| Average silver grade (oz./ST) | | | 0.30 | | | | 0.40 | | | | 0.43 | | |
| Ore mined (t) | | | | 454,694 | | | | 458,222 | |
| Average gold grade (g/t) | | | | 14.15 | | | | 14.32 | |
| Average silver grade (g/t) | | | | 56.26 | | | | 69.86 | |
| Production: | | | | | | | | | | | | | | | | | | | | |
| Gold (oz.) | | | 319,694 | | | | 285,200 | | | | 260,379 | | | | 203,226 | | | | 204,629 | |
| Silver (oz.) | | | 104,400 | | | | 320,964 | | | | 425,620 | | | | 430,494 | | | | 562,795 | |
Recovery rate (gold) (%)(3) | | | 95.9 | | | | 94.8 | | | | 95.9 | | | | 97.72 | | | | 95.30 | |
Recovery rate (silver) (%)(3) | | | 53.5 | | | | 54.3 | | | | 50.5 | | | | 51.44 | | | | 53.64 | |
| Cost applicable to sales per oz. of gold(2) | | | US$ | 777 | | | US$ | 680 | |
| Cost applicable to sales per oz. of silver(2) | | | US$ | 11.29 | | | US$ | 8.85 | |
| (1) | Incorporates losses for mining dilution and recovery. |
| (2) | Incorporates goldCost applicable to sales per unit of mineral sold is not a measure of financial performance under IFRS and silver production from final tail treatment. During 2012, 20,245 ouncesmay not be comparable to similarly titled measures of other companies. Cost applicable to sales per ounce of gold and 314,574 ouncesor ounce of silver were recovered. |
| (3) | Only reflects recovery rateconsists of cost applicable to sales for gold or silver sold, divided by the volume of gold or silver produced in the specified period. The cost applicable to sales per unit of mineral sold figures disclosed herein are calculated without adjusting for by-product revenue amounts. We consider cost applicable to sales per unit of mineral to be a key measure in managing and silver from Chipmo ore.evaluating our operating performance. We believe this measure is widely reported in the precious metals industry as a benchmark for performance, but does not have standardized meanings. You should not consider cost applicable to sales per unit of mineral sold as an alternative to cost of sales determined in accordance with IFRS as an indicator of our operating performance. See “Item 5. Operating and Financial Review Prospects—Buenaventura—F. Reconciliation of Cost Applicable to Sales and Cost Applicable to Sales per Unit Sold” for a reconciliation of Cost applicable to sales per unit sold to Cost of sales, excluding depreciation and amortization. |
PoracotaUchucchacua
Poracota is an underground mine that is wholly owned and operated by us. Poracota is located in the province of Condesuyos, department of Arequipa, at an altitude of between 4,500 and 5,000 meters above sea level. Access to the mine is available by means of a 33-kilometer unpaved road connected to the Orcopampa mine. Operations at our Poracota mine commenced in February 2007. As of December 31, 2012, Poracota’s net total fixed assets were approximately US$2.4 million.
Gold mineralization at Poracota has been classified as an epithermal high sulfidation system, which is formed by two main areas, Huamanihuayta and Perseverancia. The more important veins are María Fé, Silvana, Rocio and Malena, which are hosted by the tertiary rocks of the Huamanihuayta volcano.
Ore from the Poracota mine is treated by flotation at the Orcopampa concentrator plant.
During 2012, we conducted 9,554 meters of underground exploration tunnels and 34,361 meters of diamond drilling. In 2013, we plan to continue our exploration efforts in Huamanihuayta Oeste and evaluate three new structures, Juliana, Milagros and Marely, as well as the southwest extension of the Malena, Silvana and Paoloa veins.
As of December 31, 2012, we calculated Poracota’s proven reserves of 29,741 DST, with 0.332 ounces per ton of gold and 0.096 ounces per ton of silver, and probable reserves of 6,746 DST, with 0.330 ounces per ton of gold and 0.004 ounces per ton of silver. The NRM for sulfides and oxides was 29,212 DST, with 0.386 ounces per ton of gold and 4,093,924 DST, with 0.037 ounces per ton of gold, respectively.
Set forth below are certain unaudited operating data for the periods shown for Poracota, calculated on the basis of 100 percent of the mine’s production.
| | | Year Ended December 31, | |
| | | 2010 | | | 2011 | | | 2012 | |
| Mining Operations: | | | | | | | | | | | | |
| Ore mined (ST) | | | 245,041 | | | | 260,475 | | | | 134,886 | |
| Average gold grade (oz./ST) | | | 0.290 | | | | 0.236 | | | | 0.183 | |
| Average silver grade (oz./ST) | | | 0.15 | | | | 0.23 | | | | 0.180 | |
| Production: | | | | | | | | | | | | |
| Gold (oz.) | | | 59,803 | | | | 49,201 | | | | 19,238 | |
| Silver (oz.) | | | 27,169 | | | | 43,092 | | | | 16,181 | |
| Recovery rate (gold) (%) | | | 84.2 | | | | 81.8 | | | | 77.8 | |
| Recovery rate (silver) (%) | | | 73.8 | | | | 74.6 | | | | 67.4 | |
Uchucchacua
The Uchucchacua mine is wholly ownedwholly-owned and operated by us. Operations startedbegan in 1975, and Uchucchacua is currently our largest producer of silver. Uchucchacua is located in the province of Oyón, department of Lima, approximately 265 kilometers northeast of the city of Lima at an altitude of between 4,000 and 5,000 meters above sea level. At December 31, 2012, the net total fixed assets of Uchucchacua were approximately US$55.1 million.
Uchucchacua’s mineral structures are hosted by Mesozoic limestone of the Jumasha Formation and are classified as a mesothermal polymetallic deposit of silver-lead-zinc with important contents of manganese. The main mineralized structures are veins and ore bodies with high-grade silver mineralization.content.
Mining at Uchucchacua is conducted underground utilizing cut-and-fill stopping, shrinkage stopping, and sublevel stopping methods. Ore is processed at a mill located at Uchucchacua. The mill has a rated capacity of 3,000 DST3,800 tons per day and utilizes differential flotation to obtain a lead-silver concentrate and a zinc concentrate. Electric power is generated byobtained from the Peruvian national electricity grid, a 3,400 kW hydroelectric plant that we own and by a 3,025 kW diesel generator. We utilize a power line connecting Uchucchacua to the Peruvian national electricity grid and have electrical distribution facilities within the Uchucchacua mine. Water for operations at Uchucchacua is obtained from three lakes.
In 2012,December 2013, we continuedcompleted construction of a manganese sulfate plant Rio Seco, located in Sayan, Lima which will treat Uchucchacua’s mine concentrate, improve silver recovery and increase102 kilometers north of Lima. In January 2014, operations began with the average realized price fortreatment of manganese – silver concentrates produced at thisfrom the Uchucchacua mine.During 2015, 24,065 tons were treated, with 144.7ounces per ton of silver, 7.1%lead, 25.4%manganese, and following treatment 15,319 tons were obtained, with 225.0 ounces per ton of silver, 10.9% lead and 4.2%manganese. This process also allowed for the production of 14,935 tons of sulfuric acid of 98.0 percent purity and 12,880 tons of commercial grade manganese sulfate monohydrate.
During 2015, the main exploration focused on the Socorro mine. We will begin opearatingalso explored the manganese sulfate plant in May 2013.
In 2012, we conducted exploration efforts on three mines: Socorro,Huantajalla mine, Carmen mine and Huantajalla. We completed 52,494 meters of diamond drilling and constructed 23,236 meters of underground exploration tunnels. During 2013, we plan to focus our exploration efforts mainly on Huantajalla and Socorroto to incease our reservesCasualidad mine with relative success, finding narrow structures with high gradescontents of silver-maganese.silver.
At December 31, 2012,2015, proven ore reserves were 3,498,580 DST, with 12.6 ounces per ton of silver, 1.21 percent lead and 1.77 percent zinc, and probable ore reserves were 2,186,410 DST,4,271,220 tons, with 12.8 ounces of silver per ton, 1.32 percent lead and 1.78 percent zinc. Total NRM was 3,815,346 DST, with 13.2 ounces444.95 grams per ton of silver, 1.66 percent1.30% lead and 2.20 percent1.80% zinc.
Set forth below are certain unaudited operating data for the periods shown for Uchucchacua, calculated on the basis of 100 percent100% of the mine’s production.
| | | Year Ended December 31,(1) | | | Year Ended December 31,(1) | |
| | | 2010 | | 2011(2) | | 2012(2) | | | 2014 | | | 2015 | |
| Mining Operations: | | | | | | | | | | | | | | | | | | | | |
| Ore mined (ST) | | | 1,013,395 | | | | 1,086,124 | | | | 1,156,656 | | |
| Average silver grade (oz./ST) | | | 12.93 | | | | 13.04 | | | | 13.00 | | |
| Ore mined (t) | | | | 1,013,633 | | | | 1,121,474 | |
| Average silver grade (g/t) | | | | 452.87 | | | | 460.33 | |
| Average zinc grade (%) | | | 1.47 | | | | 1.31 | | | | 1.51 | | | | 1.04 | | | | 1.05 | |
| Average lead grade (%) | | | 0.98 | | | | 0.89 | | | | 1.02 | | | | 0.81 | | | | 0.82 | |
| Production: | | | | | | | | | | | | | | | | | | | | |
| Silver (oz.) | | | 9,269,718 | | | | 10,090,337 | | | | 11,263,322 | | | | 12,055,570 | | | | 13,919,922 | |
| Zinc (ST) | | | 7,702 | | | | 7,351 | | | | 10,824 | | |
| Lead (ST) | | | 8,687 | | | | 8,319 | | | | 9,636 | | |
| Zinc (t) | | | | 6,349 | | | | 5,693 | |
| Lead (t) | | | | 7,605 | | | | 7,947 | |
| Recovery rate (silver) (%) | | | 70.7 | | | | 71.20 | | | | 74.88 | | | | 81.67 | | | | 83.87 | |
| Cost applicable to sales per oz. of silver(2) | | | US$ | 16.34 | | | US$ | 13.97 | |
| Cost applicable to sales per ton of zinc(2) | | | US$ | 2,478 | | | US$ | 2,430 | |
| Cost applicable to sales per ton of lead(2) | | | US$ | 1,843 | | | US$ | 1,551 | |
| (1) | Incorporates losses for mining dilution and recovery. |
| (2) | Incorporates total Socorro, CarmenCost applicable to sales per unit of mineral sold is not a measure of financial performance under IFRS and Huantajalla mine production.may not be comparable to similarly titled measures of other companies. Cost applicable to sales per ounce of silver, ton of zinc or ton of lead consists of cost applicable to sales for silver, zinc or lead sold, divided by the volume of silver, zinc or lead produced in the specified period. The cost applicable to sales per unit of mineral sold figures disclosed herein are calculated without adjusting for by-product revenue amounts. We consider cost applicable to sales per unit of mineral to be a key measure in managing and evaluating our operating performance. We believe this measure is widely reported in the precious metals industry as a benchmark for performance, but does not have standardized meanings. You should not consider cost applicable to sales per unit of mineral sold as an alternative to cost of sales determined in accordance with IFRS as an indicator of our operating performance. See “Item 5. Operating and Financial Review Prospects—Buenaventura—F. Reconciliation of Cost Applicable to Sales and Cost Applicable to Sales per Unit Sold” for a reconciliation of Cost applicable to sales per unit sold to Cost of sales, excluding depreciation and amortization. |
Julcani
Julcani is an underground mine that is wholly ownedwholly-owned and operated by us. We acquired Julcani in 1953 as our first operating mine. Julcani is located in the province of Angaraes, department of Huancavelica, approximately 500 kilometers southeast of Lima at an altitude of between 4,200 and 5,000 meters above sea level. As of December 31, 2012, the net total fixed assets of Julcani were approximately US$6.2million.
Julcani is a large polymetallic deposit in Central Peru, which principally produces silver, that occurs mainly as tetrahedrite andin sulfosalts in a multitude of mineralogically complex veins hosted byin dacite domes, surge depositstuffs, breccias and other tertiary volcanic rocks.
Ore is processed in a concentrator plant located adjacent to the mine entrance. The ore is crushed and ground, andby bulk flotation is used thereafter to obtain a silver-gold-lead concentrate.concentrate of silver-lead-copper-gold. The plant has a rated capacity of 500 DST550 tons per day and had a 79 percent utilization rate in 2012. day.
Electric power is generated by three Conenhua hydroelectric plants. Power generation capacity from these plants, is 800 kW, 1,200 kWHuapa, Tucsipampa and 760 kW, respectively.El Ingenio. We are also rely onconnected to the Peruvian national electricity grid for the mine’s remaining electrical power.grid. Water for operations ofin Julcani is obtained from mine drainage, a creek, two springsstream and a lake.small lagoon.
During 2012,2015, we focused our exploration activities were focused on deepening the main mineralized structures of ourthe Acchilla and Estela mines, wheremines. In the Acchilla mine, we completed 12,668 metershave begun exploration to test the deepening of underground exploration tunnels and 12,830 meters of diamond drilling. In 2013, we plansilver mineralization in all main veins. We have also begun to perform intense underground mining explorationexplore for silver in an area that is adjacent to the Acchilla and Estela, exploring, at the 610-meter, 660-meter and 710-meter levels, all recognized veins of Acchilla, and at the 560-meter, 610-meter and 660-meter of Estela, complemented by a diamond drilling program.mine called Taype-Galindo.
At December 31, 2012,2015, total proven and probable ore reserves were 261,405 DST,288,779 tons, with 18.5 ounces648.20 grams per ton of silver, 0.021 ounces0.50 grams per ton of gold, 1.8 percent2.52% lead and 0.52 percent copper, and total probable ore reserves were 163,200 DST, with 18.7 ounces per ton of silver, 0.012 ounces per ton of gold, 1.9 percent lead and 0.44 percent copper. Total estimated NRM was 315,475 DST, with 19.1 ounces per ton of silver, 0.034 ounces per ton of gold, 2.0 percent lead and 0.60 percent0.55% copper.
Set forth below are certain unaudited operating data for the periods shown for Julcani, calculated on the basis of 100 percent100% of the mine’s production.production
| | | Year Ended December 31,(1) | |
| | | 2010 | | | 2011 | | | 2012(2) | |
| Mining Operations: | | | | | | | | | | | | |
| Ore mined (ST) | | | 127,500 | | | | 140,300 | | | | 141,820 | |
| Average gold grade (oz./ST) | | | 0.024 | | | | 0.022 | | | | 0.017 | |
| Average silver grade (oz./ST) | | | 18.96 | | | | 18.62 | | | | 18.50 | |
| Average lead grade | | | 1.89 | | | | 1.61 | | | | 1.94 | |
| Average copper grade (%) | | | 0.27 | | | | 0.31 | | | | 0.32 | |
| Production: | | | | | | | | | | | | |
| Gold (oz.) | | | 2,118 | | | | 2,051 | | | | 1,220 | |
| Silver (oz.) | | | 2,237,063 | | | | 2,428,330 | | | | 2,438,084 | |
| Lead (ST) | | | 2,202 | | | | 2,065 | | | | 2,529 | |
| Copper (ST) | | | 3.5 | | | | 394 | | | | 423 | |
| Recovery rate (gold) (%) | | | 76.1 | | | | 66.6 | | | | 51.2 | |
| Recovery rate (silver) (%) | | | 92.5 | | | | 92.9 | | | | 92.9 | |
| | | Year Ended December 31,(1) | |
| | | 2014(2)(3) | | | 2015(2)(3) | |
| Mining Operations: | | | | | | | | |
| Ore mined (t) | | | 167,750 | | | | 177,948 | |
| Average gold grade (g/t) | | | 0.25 | | | | 0.22 | |
| Average silver grade (g/t) | | | 600.97 | | | | 597.66 | |
| Average lead grade (%) | | | 1.69 | | | | 1.55 | |
| Average copper grade (%) | | | 0.18 | | | | 0.21 | |
| Production: | | | | | | | | |
| Gold (oz.) | | | 414 | | | | 607 | |
| Silver (oz.) | | | 3,084,347 | | | | 3,266,453 | |
| Lead (t) | | | 2,619 | | | | 2,592 | |
| Copper (t) | | | 275 | | | | 339 | |
| Recovery rate (silver) (%) | | | 95.16 | | | | 95.52 | |
| Cost applicable to sales per oz. of gold(4) | | US$ | 603 | | | US$ | 955 | |
| Cost applicable to sales per oz. of silver(4) | | US$ | 14.14 | | | US$ | 12.30 | |
| Cost applicable to sales per ton of lead(4) | | US$ | 1,603 | | | US$ | 1,425 | |
| Cost applicable to sales per ton of copper(4) | | US$ | 5,195 | | | US$ | 4,416 | |
| (1) | IncorporatesIncludes losses fordue to mining dilution and recovery. |
| (2) | IncorporatesIncludes total Acchilla and Estela mine production. |
| (3) | Reflects total recovery percentage of Acchilla and Estela ore. |
| (4) | Cost applicable to sales per unit of mineral sold is not a measure of financial performance under IFRS and may not be comparable to similarly titled measures of other companies. Cost applicable to sales per ounce of gold, ounce of silver, ton of lead or ton of copper consists of cost applicable to sales for gold, silver, lead or copper sold, divided by the volume of gold, silver, lead or copper produced in the specified period. The cost applicable to sales per unit of mineral sold figures disclosed herein are calculated without adjusting for by-product revenue amounts. We consider cost applicable to sales per unit of mineral to be a key measure in managing and evaluating our operating performance. We believe this measure is widely reported in the precious metals industry as a benchmark for performance, but does not have standardized meanings. You should not consider cost applicable to sales per unit of mineral sold as an alternative to cost of sales determined in accordance with IFRS as an indicator of our operating performance. See “Item 5. Operating and Financial Review Prospects—Buenaventura—F. Reconciliation of Cost Applicable to Sales and Cost Applicable to Sales per Unit Sold” for a reconciliation of Cost applicable to sales per unit sold to Cost of sales, excluding depreciation and amortization. |
Recuperada
Mallay
The RecuperadaMallay mine is wholly ownedwholly-owned and operated by us. Recuperadaus and is located 21 kilometers southwest of the Uchucchacua mine in the district of Mallay, province of Huancavelica,Oyón, department of Huancavelica, approximately 540 kilometers southeastLima. Mallay is considered an epithermal deposit of Lima at an altitude of between 4,300silver, lead, zinc and 4,800 meters above sea level. Access is by a 242-kilometer unpaved public road, which connects togold. We have recognized the Pan-American Highway. Electricity is supplied by access to the Peruvian national electricity grid via a 50-kilometer power line, which has a capacity of 22 kilovolts and 4,000 kilowatts. At December 31, 2012, the net total fixed assets of Recuperada were approximately US$3.8million.
The Recuperada mining district mainly contains polymetallic mineralization in veins of zinc,following main ore structures: Isguiz body-vein (silver, lead, and silver (including the Teresita, Esperanza and Angelica deposits)zinc), as well as some silver-rich veins (including thePierina (gold vein), María Luz, Nancy Luz(silver vein) and Rico Antimonio deposits)Fortuna (skarn type lead, zinc, silver).
Recuperada is an underground mine that uses the conventional cut and fill mining method. Mine ore is processed at a concentrator plant on site with a processing capacity rate of 600 stpd. The tailing dam on site currently provides us with approximately 3.0 years of storage capacity based on current production rates.
During 2012,2015, we completed 9,494 meters ofcontinued geological exploration with tunnels and diamond drilling mainly focused on the Isguiz body-vein and the María-Dana system silver veins. In 2016, we plan to construct exploration tunnels and 7,995conduct diamond drilling on the Nicole area in the Jumasha limestones. The San Sebastian project (2.5 kilometers northeast from Isguiz) will be explored for silver, lead and zinc with at least 3,500 meters of diamond drilling. We focused on searching for silver mineraldrilling in the Germana, Esperanza and Nancy Luz areas and completing exploration at the 40-meter level of the Teresita mine. In 2013, we plan to continue exploration, focusing mainly in mines with silver mineralization, such as Germana Este, Nancy Luz, Acchisayhua and Escopeta.recognized mineralized structures by geological mapping.
AtAs of December 31, 2012, total2015, proven and probable ore reserves were 66,480 DST,86,446 tons, with 8.3 ounces341.21 grams per ton of silver, 4.51 percent lead and 7.64 percent zinc, and total probable ore reserves were 48,005 DST, with 9.5 ounces0.50 grams per ton of silver, 3.39 percentgold, 6.35% lead and 6.24 percent8.93% zinc. Total estimated NRM was 121,560 DST, with 8.50 ounces per ton of silver, 4.67 percent lead and 6.74 percent zinc.
Set forth below are certain unaudited operating data for the periods shown for Recuperada,Mallay mine, calculated on the basis of 100 percent100% of the mine’s production.
| | | Year Ended December 31,(1) | |
| | | 2010 | | | 2011(2) | | | 2012(2) | |
| Mining Operations: | | | | | | | | | | | | |
| Ore mined (ST) | | | 120,800 | | | | 112,450 | | | | 117,600 | |
| Average silver grade (oz./ST) | | | 5.03 | | | | 4.67 | | | | 4.19 | |
| Average lead grade (%) | | | 3.10 | | | | 3.07 | | | | 3.20 | |
| Average zinc grade (%) | | | 2.54 | | | | 3.77 | | | | 4.88 | |
| Production: | | | | | | | | | | | | |
| Silver (oz.) | | | 571,189 | | | | 498,424 | | | | 467,475 | |
| Lead (ST) | | | 3,488 | | | | 3,213 | | | | 3,516 | |
| Zinc (ST) | | | 2,494 | | | | 3,581 | | | | 4,898 | |
| Recovery rate (silver) (%) | | | 94.1 | | | | 94.9 | | | | 94.78 | |
| (1) | Incorporates losses for mining dilution and recovery. |
| (2) | Incorporates total Teresita, Esperanza and Angélica mine production. |
Antapite
Antapite is an underground mine that is wholly owned and operated by us. Antapite is located in the province of Huaytará, department of Huancavelica, approximately 434 kilometers southeast of the city of Lima at an altitude of approximately 3,400 meters above sea level. The Antapite mine consists of an epithermal low sulfidation gold deposit in veins hosted by calc-alkaline volcanic rocks. At December 31, 2012, the net total fixed assets of Antapite were approximately US$2.0million.
Mining is conducted underground utilizing the conventional cut-and-fill stopping method. Ore is processed at a cyanidation plant located at Antapite. The plant has a capacity of 600 DST per day and had a 52.0 percent utilization rate in 2012.
The Antapite mine obtains substantially all of its electric power through the Peruvian national electricity grid. Water for operations at Antapite is obtained from an underground drainage system.
During 2012, we focused our exploration efforts on the Antapite, Euriosa, Soledad, Olvidada, Pampeñita 1, Pucarumi, Fabiola, Nidia, Verónica and Alicia veins. We completed 9,117 meters of exploration tunnels and 20,830 meters of diamond drilling. In 2013, we plan to continue our exploration efforts for ore reserves in the southeastern region over the mineralized alignments formed by the Soledad, Carolina, Amatista, Furiosa, Pucarumi and Zorro Rojo veins.
As of December 31, 2012, total proven ore reserves were 29,951 DST with 0.330 ounces per ton of gold and 0.22 ounces per ton of silver, and total probable ore reserves were 17,794 DST with 0.210 ounces per ton of gold and 0.22 ounces per ton of silver. Total estimated NRM was 6,790 DST, with 0.280 ounces per ton of gold and 0.20 ounces per ton of silver.
Set forth below are certain unaudited operating data for the periods shown for Antapite, calculated on the basis of 100 percent of the mine’s production.
| | | Year Ended December 31,(1)(2) | |
| | | 2010 | | | 2011 | | | 2012 | |
| Mining Operations: | | | | | | | | | | | | |
| Ore mined (ST) | | | 145,915 | | | | 155,842 | | | | 86,113 | |
| Average gold grade (oz./ST) | | | 0.254 | | | | 0.190 | | | | 0.142 | |
| Average silver grade (oz./ST) | | | 0.34 | | | | 0.295 | | | | 0.219 | |
| Production: | | | | | | | | | | | | |
| Gold (oz.) | | | 35,803 | | | | 28,588 | | | | 11,720 | |
| Silver (oz.) | | | 36,870 | | | | 33,521 | | | | 13,254 | |
| Recovery rate (gold) (%) | | | 96.8 | | | | 96.4 | | | | 95.6 | |
| Recovery rate (silver) (%) | | | 74.0 | | | | 72.8 | | | | 70.2 | |
| (1) | Incorporates losses for mining dilution and recovery. |
| (2) | Data reflect only mining operations at the Antapite mine. |
Shila-Paula
Shila and Paula are underground mines that are wholly owned and operated by Cedimin, our wholly-owned subsidiary. Shila and Paula encompass an aggregate of41,152 hectares of mining concessions, which are owned by Cedimin.At December 31, 2012, the net total fixed assets of the Shila and Paula mining operations were approximately US$3.5 million.
The Shila mine is located in the province of Castilla, department of Arequipa, approximately 1,350 kilometers southeast of Lima and 25 kilometers south of the Orcopampa mining operation, at an altitude of between 4,650 and 5,400 meters above sea level. Access is by a 250-kilometer unpaved road. The Shila mine is currently not operating due to a lack of ore reserves.
The Paula mine is located in the province of Castilla, department of Arequipa, approximately 1,400 kilometers southeast of the city of Lima and 40 kilometers south of the Orcopampa mining operation, at an altitude of between 5,000 and 5,400 meters above sea level.
Gold mineralization deposits in Shila-Paula have been classified as epithermal low sulfidation of the Quartz-Adularia-Sericite type. The veins are hosted in tertiary volcanic rocks associated with the Chinchón and Huayta calderas.
Mining operations are currently conducted only in the Paula mine. Mining is conducted underground using the cut-and-fill ascending method. Ore is processed at a metallurgical plant located at the Shila mine with a rated capacity of 230 DST per day. The plant had an approximately 72 percent utilization rate in 2012. The cyanidation plant at the Shila mine has a net capacity of 3,200 metric tons per year.
Electric power for Shila-Paula is currently provided by the Peruvian national electricity grid. Four diesel generators with a total installed capacity of 3,850 kW ensure the availability of electric power. The water for operations at Paula is obtained from runoff from snow peaks.
During 2012, we completed 11,397 meters of underground mining explorations and 27,201 meters of diamond drilling, mainly below the 4,830-meter level, on the Nazareno, Ramal Crucero, Nazareno 3, Angélica Maria, Lucia, Ramal Chapi, Liliana, Maria Belen and Juliana veins. In 2013, we plan to continue our exploration efforts.
As of December 31, 2012, our proven ore reserves were 5,971 DST, with 0.410 ounces per ton of gold and 0.910 ounces per ton of silver and our probable ore reserves were 2,400 DST, with 0.364 ounces per ton of gold and 0.950 ounces per ton of silver. Total NRM was 31,427 DST, with 0.373 ounces per ton of gold and 0.91 ounces per ton of silver. All ore reserves and NRM are in the Paula mine.
Set forth below are certain unaudited operating data for Shila-Paula, calculated on the basis of 100 percent of both mines’ combined production.
| | | Year Ended December 31,(1)(2) | |
| | | 2010 | | | 2011 | | | 2012(2) | |
| Mining Operations: | | | | | | | | | | | | |
| Ore mined (ST) | | | 64,047 | | | | 47,590 | | | | 59,056 | |
| Average gold grade (oz./ST) | | | 0.234 | | | | 0.319 | | | | 0.342 | |
| Average silver grade (oz./ST) | | | 0.96 | | | | 0.90 | | | | 2.022 | |
| Production: | | | | | | | | | | | | |
| Gold (oz.) | | | 14,157 | | | | 14,594 | | | | 19,359 | |
| Silver (oz.) | | | 46,578 | | | | 34,833 | | | | 95,485 | |
| Recovery rate (gold) (%) | | | 94.4 | | | | 96.1 | | | | 95.98 | |
| Recovery rate (silver) (%) | | | 75.9 | | | | 79.3 | | | | 79.96 | |
| | | Year Ended December 31,(1)(2) | |
| | | 2014 | | | 2015 | |
| Mining Operations: | | | | | | | | |
| Ore mined (t) | | | 148,058 | | | | 158,124 | |
| Average silver grade (g/t) | | | 272.77 | | | | 269.48 | |
| Average lead grade (%) | | | 5.80 | | | | 5.05 | |
| Average zinc grade (%) | | | 7.79 | | | | 6.60 | |
| Production: | | | | | | | | |
| Silver (oz.) | | | 1,216,064 | | | | 1,285,361 | |
| Lead (t) | | | 7,513 | | | | 7,193 | |
| Zinc (t) | | | 9,893 | | | | 9,173 | |
| Recovery rate (silver) (%) | | | 93.68 | | | | 93.82 | |
| Cost applicable to sales per oz. of silver(3) | | US$ | 13.76 | | | US$ | 13.90 | |
| Cost applicable to sales per ton of lead(3) | | US$ | 1,547 | | | US$ | 1,544 | |
| Cost applicable to sales per ton of zinc(3) | | US$ | 1,855 | | | US$ | 1,794 | |
| (1) | Incorporates losses for mining dilution and recovery. |
| (2) | Data reflect 5,166 ST, 11.4 ouncesmining operations at Mallay mine. |
| (3) | Cost applicable to sales per unit of mineral sold is not a measure of financial performance under IFRS and may not be comparable to similarly titled measures of other companies. Cost applicable to sales per ounce of silver, ton of silver and 0.163 ounces perlead or ton of gold (48,677 ounceszinc consists of cost applicable to sales for silver, lead or zinc sold, divided by the volume of silver, lead or zinc produced in the specified period. The cost applicable to sales per unit of mineral sold figures disclosed herein are calculated without adjusting for by-product revenue amounts. We consider cost applicable to sales per unit of mineral to be a key measure in managing and 701 ouncesevaluating our operating performance. We believe this measure is widely reported in the precious metals industry as a benchmark for performance, but does not have standardized meanings. You should not consider cost applicable to sales per unit of gold) based on metallurgical tests conducted at the Tambomayo mine.mineral sold as an alternative to cost of sales determined in accordance with IFRS as an indicator of our operating performance. See “Item 5. Operating and Financial Review Prospects—Buenaventura—F. Reconciliation of Cost Applicable to Sales and Cost Applicable to Sales per Unit Sold” for a reconciliation of Cost applicable to sales per unit sold to Cost of sales, excluding depreciation and amortization. |
IshihuincaBreapampa
The IshihuincaBreapampa mine is wholly ownedwholly-owned and operated by us. We lease the rights to the mining concessions of Ishihuinca from a third party. The lease agreement, which expires in 2015, requires payment by Inminsur to the lessor of a royalty of 7 percent of the price of the concentrates sold.At December 31, 2012, the net total fixed assets of Ishihuinca were approximately US$0.2million.
The Ishihuinca mineIt is located in the district of Chumpi, province of Caravelí,Parinacochas, department of Arequipa, approximately 780 kilometers southeastAyacucho. The ore deposit consists of gold and silver mineralization in an epithermal system high-sulfidation, emplaced into breccias of tertiary volcanic rocks. We located higher concentrations of gold-silver in oxides in the city of Limafollowing geological prospects: Cerro Parccaorcco, Senccata, Pucagallo, Andrea, Ccaccapaqui, Sancos and Grace. In July 2012, we began the production phase at an altitude of 2,200 meters above sea level. AccessCerro Parccaorcco, where gold is by the Pan-American Highway.
Mining is conducted underground utilizing the conventional cut-and-fill stopping method. Ore is processed at a metallurgical plant located at Ishihuinca. The metallurgical plant, which has a rated capacity of 220 DST per day, utilizes bulk flotation and gravity concentration processes. The bulk flotation process produces a copper/gold concentrate. The gravity concentrates and gold-bearing concentrates are treated by cyanidation in vats and agitator tanks, respectively. The dissolved gold obtained from the cyanidation of both concentrates is precipitated using zinc dust. The resulting precipitate is refined in Lima and then sold to Johnson Matthey.
Electric power is provided by three electric generators with total installed capacity of 2,315 kW. Water for operations at Ishihuinca is obtained from underground wells.contained within silica-oxides.
During 2012,the productive period of Breacampa in 2014, we completed 1,156 metersperformed diamond drilling to update ore distribution at Parccaorcco and define the gold ore within the colluvial deposit close to the Parccaorcco open pit, where we recognized disseminated gold that is part of underground exploration tunnels. In 2013,current reserves.
We ceased mining activities at Breapampa in November 2014. However, in 2015 we plan to continue our exploration efforts to increase our reservesrecovered 13,757 ounces of gold ore by conducting explorationfrom the leachpads. Currently, the mine is in surrounding areas.closure stage.
As of December 31, 2012, our proven ore reserves were 8,620 DST, with 0.330 ounces per ton of gold,Proven and probable ore reserves at December 31, 2015 were 4,327 DST,519,539 tons, with 0.342 ounces17.11 grams per ton of gold. Total NRM was 2,938 DST, with 0.369 ouncessilver and 0.44 grams per ton of gold.
Set forth below are certain unaudited operating data for the periods shown for Ishihuinca,Breapampa mine, calculated on the basis of 100 percent100% of the mine’s production.
| | | Year Ended December 31,(1) | |
| | | 2010 | | | 2011 | | | 2012 | |
| Mining Operations: | | | | | | | | | | | | |
| Ore mined (ST) | | | 4,708 | | | | 8,092 | | | | 17,751 | |
| Average gold grade (oz./ST) | | | 0.223 | | | | 0.269 | | | | 0.261 | |
| Average copper grade (%) | | | 0.53 | | | | 0.50 | | | | 0.18 | |
| Production: | | | | | | | | | | | | |
| Gold (oz.) | | | 917 | | | | 1,773 | | | | 4,016 | |
| Copper (ST) | | | 16 | | | | 27 | | | | 22 | |
| Recovery rate (gold) (%) | | | 80.3 | | | | 8,092 | | | | 86.57 | |
| Recovery rate (copper) (%) | | | 68.7 | | | | 0.269 | | | | 67.29 | |
| | | Year Ended December 31,(1) | |
| | | 2014(2) | | | 2015(3) | |
| Mining Operations: | | | | | | | | |
| Ore mined (t) | | | 2,264,111 | | | | — | |
| Average gold grade (g/t) | | | 1.54 | | | | — | |
| Average silver grade (g/t) | | | 35.02 | | | | — | |
| Production: | | | | | | | | |
| Gold (oz.) | | | 74,807 | | | | 13,757 | |
| Silver (oz.) | | | 369,032 | | | | 180,277 | |
| Cost applicable to sales per oz. of silver(4) | | US$ | 6.56 | | | US$ | 9.26 | |
| Cost applicable to sales per oz. of gold(4) | | US$ | 452 | | | US$ | 715 | |
| (1) | Incorporates losses for mining dilution and recovery.recovery and reflects operations through 2014. |
| (2) | Data reflects mining operations only at Parccaorcco and its Colluvial deposit. |
| (3) | Mining operations at Breapampa were suspended in 2014. Production data for 2015 reflects gold and silver recovered from leach pads. |
| (4) | Cost applicable to sales per unit of mineral sold is not a measure of financial performance under IFRS and may not be comparable to similarly titled measures of other companies. Cost applicable to sales per ounce of gold or ounce of silver consists of cost applicable to sales for gold or silver sold, divided by the volume of gold or silver produced in the specified period. The cost applicable to sales per unit of mineral sold figures disclosed herein are calculated without adjusting for by-product revenue amounts. We consider cost applicable to sales per unit of mineral to be a key measure in managing and evaluating our operating performance. We believe this measure is widely reported in the precious metals industry as a benchmark for performance, but does not have standardized meanings. You should not consider cost applicable to sales per unit of mineral sold as an alternative to cost of sales determined in accordance with IFRS as an indicator of our operating performance. See “Item 5. Operating and Financial Review Prospects—Buenaventura—F. Reconciliation of Cost Applicable to Sales and Cost Applicable to Sales per Unit Sold” for a reconciliation of Cost applicable to sales per unit sold to Cost of sales, excluding depreciation and amortization. |
La Zanja
The La Zanja mine is located in the district of Pulan, province of Santa Cruz, department of Cajamarca in northern Peru. La Zanja consists of approximately 37,000 hectares of mining concessions and is located 48 kilometers northwest of the Yanacocha gold mine, at an average altitude of 3,500 meters above sea level. We hold a 53.06 percent53.06% interest in La Zanja and Newmont holds a 46.94 percent interest.46.94% interest.
La Zanja is located within a large area of hydrothermal alteration, mainly related to epithermal gold deposits in high sulfidation environments, in addition to some vein systems of intermediate to low sulfidation. We have recognized two ore deposits: San Pedro Sur and Cerro Pampa Verde.
Mining operations are conducted through the open-pit method, andthe plant utilizes a carbon-in-column circuits are utilizedcircuit as well as a Merrill Crowe circuit to recover gold from heap leach operations. The gold-ladengold laden carbon is then transported to Yanacocha to continue processing into doré bars.
During 2012,In 2013, we completed 26,026 metersthe construction of the road to Pampa Verde, which allowed us to begin open pit mining in February 2014, coinciding with the launching of the Merrill Crowe plant.
During 2015, we continued tunneling and diamond drilling exploration in the Alejandra underground project. We also continued exploring with diamond drilling in other areas around San Pedro Sur, Pampa Verde and Cocan. In 2013, we plan to perform 20,000 meters of diamond drilling at the Pampa Verde, San Pedro SurAlejandra, such as Cocán and Cocan projects. We plan to start mining at Pampa Verde in July 2013.Campana.
Total proven and probable ore reserves at December 31, 20122015 were 24,795,233 DST,11,905,137 tons, with 0.018 ounces4.04 grams per ton of goldsilver and 0.208 ounces0.62 grams per ton of silver. Total NRM was 12,131,615 DST, with 0.015 ounces per ton of gold and 0.211 ounces per ton of silver.gold.
Set forth below are certain unaudited operating data for La Zanja, calculated on the basis of 100 percent100% of the mine’s production.
| | | Year Ended December 31,(1) | | | Year Ended December 31, | |
| | | 2010 | | 2011 | | 2012 | | | 2014 | | | 2015 | |
| Mining Operations: | | | | | | | | | | | | | | | | | | | | |
| Ore mined (ST) | | | 64,047 | | | | 8,408,399 | | | | 10,231,321 | | |
| Average gold grade (oz./ST) | | | 0.234 | | | | 0.022 | | | | 0.017 | | |
| Average silver grade (oz./ST) | | | 0.96 | | | | 0.40 | | | | 0.24 | | |
| Ore treated (t) | | | | 7,501,654 | | | | 8,576,614 | |
| Average gold grade (g/t) | | | | 0.84 | | | | 0.70 | |
| Average silver grade (g/t) | | | | 8.71 | | | | 5.97 | |
| Production: | | | | | | | | | | | | | | | | | | | | |
| Gold (oz.) | | | 14,157 | | | | 134,190 | | | | 112,387 | | | | 143,573 | | | | 141,071 | |
| Silver (oz.) | | | 46,578 | | | | 363,927 | | | | 387,877 | | | | 422,395 | | | | 331,080 | |
| Cost applicable to sales per oz. of gold(1) | | | US$ | 569 | | | US$ | 789 | |
| Cost applicable to sales per oz. of silver(1) | | | US$ | 8.35 | | | US$ | 10.55 | |
| (1) | Data reflect mining operations atCost applicable to sales per unit of mineral sold is not a measure of financial performance under IFRS and may not be comparable to similarly titled measures of other companies. Cost applicable to sales per ounce of gold or ounce of silver consists of cost applicable to sales for gold or silver sold, divided by the San Pedro Sur deposit only.volume of gold or silver produced in the specified period. The cost applicable to sales per unit of mineral sold figures disclosed herein are calculated without adjusting for by-product revenue amounts. We consider cost applicable to sales per unit of mineral to be a key measure in managing and evaluating our operating performance. We believe this measure is widely reported in the precious metals industry as a benchmark for performance, but does not have standardized meanings. You should not consider cost applicable to sales per unit of mineral sold as an alternative to cost of sales determined in accordance with IFRS as an indicator of our operating performance. See “Item 5. Operating and Financial Review Prospects—Buenaventura—F. Reconciliation of Cost Applicable to Sales and Cost Applicable to Sales per Unit Sold” for a reconciliation of Cost applicable to sales per unit sold to Cost of sales, excluding depreciation and amortization. |
Tantahuatay
Tantahuatay is a gold-copper mine located in the district and province of Hualgayoc, department of Cajamarca, in northern Peru, at an average altitude of 3,900 meters above sea level. The project includes a total of 17,721 hectares of mining claims. The Tantahuatay mine is wholly ownedoperated by us and wholly-owned by Coimolache, in which we hold a 40 percent40.10% equity interest.
Geologically, the Tantahuatay deposits are located at diatremes or volcanic necks in a predominantly sequence volcano magmaticvolcano-magmatic hydrothermal manifestation,predominant linked to the regional mineralized sector north of Peru.
Tantahuatay consists of five areas of Au-Ag mineralization, contained in material of supergenic oxidation (Mirador Norte, Mirador Sur, Cienaga Norte, Cienaga Sur and Tantahuatay). We have identified several geologic targets with gold mineralization and have conducted detailed studiesalso discovered that below the oxides level of the Cerro Tantahuatay area, there is a significant resource of Cu-Au-Ag in pyrite-enargite ore (sulphides), which is present as disseminations and fracture fillings associated with advanced argillic alteration and multiphase breccia bodies.
During 2015, we performed diamond drilling to update the reserves block model of the open pits Tantahuatay 2 and Ciénaga Norte and to explore the Mirador Sur, Mirador Norte, deposits.
Tantahuatay 2 consists of hydrothermal breccia bodies, formed by silicified tuff fragments in a matrix of quartz-alunite-pyrophyllite, with iron oxides inside fractures and cavities, which contain free gold and electrum as submicroscopic particles.
Ciénaga Norte and Mirador Norte consist of hydrothermal breccia bodies, formed in facies of vuggy silica and sandy silica, hosted in tuffs and hornblende lavas, which contain free submicroscopic gold mainly in iron oxides.
In August 2011, we received approvalprojects to commence operations at the Tantahuatay processing plant and began to produce gold and silver at Tantahuatay 2.
In 2012, we launched a new smelting furnace and completed the expansion in the capacity of our Merrill-Crowe-type ore processing facility from 800 to 1,100 cubic meters per hour. We also completed 6,763 meters of reverse circulation drilling to explore ore deposits and conduct metallurgical tests. In 2013, we expect to complete infrastructure construction to allow for mining of the Ciénaga Norte deposit in the fourth quarter of 2013.increase mineral resources.
Total proven and probable ore reserves at December 31, 20122015 were 24,427,771 DST,66,196,953 tons, with ore grades of 0.019 ounces per ton of gold and 0.24 ounces per ton of silver. Total NRM in oxides was 105,884,751 DST, with ore grades of 0.012 ounces per ton of gold and 0.17 ounces per ton of silver. Total NRM in sulfides was 422,318,006 DST, with ore grades of 0.007 ounces per ton of gold, 0.18 ounces7.09 grams per ton of silver and 0.67 percent copper.0.43 grams per ton of gold.
Set forth below are certain unaudited operating data for the Tantahuatay mine, calculated on the basis of 100 percent100% of the mine’s production.
| | | Year Ended December 31,(1)(2) | | | Year Ended December 31,(1)(2) | |
| | | 2011 | | 2012 | | | 2014 | | | 2015 | |
| Mining Operations: | | | | | | | | | | | | | | | | |
| Ore mined (ST) | | | 3,963,580 | | | | 10,881,767 | | |
| Average silver grade (oz./ST) | | | 0.63 | | | | 0.48 | | |
| Average gold grade (oz./ST) | | | 0.017 | | | | 0.017 | | |
| Ore treated (t) | | | | 9,854,334 | | | | 12,185,425 | |
| Average gold grade (g/t) | | | | 0.57 | | | | 0.50 | |
| Average silver grade (g/t) | | | | 11.08 | | | | 13.00 | |
| Production: | | | | | | | | | | | | | | | | |
| Gold (oz.) | | | | 143,643 | | | | 144,782 | |
| Silver (oz.) | | | 260,073 | | | | 919,343 | | | | 754,357 | | | | 879,832 | |
| Gold (oz.) | | | 46,164 | | | | 141,268 | | |
| Cost applicable to sales per oz. of gold(3) | | | US$ | 455 | | | US$ | 489 | |
| Cost applicable to sales per oz. of silver(3) | | | US$ | 6.71 | | | US$ | 6.59 | |
| (1) | Incorporates losses for mining dilution and recovery. |
| (2) | Data reflect mining operations at the Tantahuatay 2 deposit only. |
Breapampa
The Breapampa mine, is wholly owned and operated by us and encompasses 38,690 hectares of mining concessions. It is located in the district of Chumpi, province Parinacochas, department of Ayacucho. The ore deposit consists of gold and silver mineralization in an epithermal system high-sulfidation, emplaced into breccias of tertiary volcanic rocks. We located higher concentrations of gold-silver in oxides in the Cerro Parccaorcco, Senccata, Pucagallo, Andrea, Ccaccapaqui, Sancos and Grace prospects. In July 2012, we began the production phase at Cerro Parccaorcco, having disseminated gold in silica-oxides.
We performed 10,387 meters of diamond drilling to update model ore distribution and explore around the Parccaorcco open pit, where we have recognized an ore body that is part of current reserves. In Senccata and Pucagallo, we performed a geophisycal survey of induced polarization that confirmed the existence of two silicified bodies to over 50 meters deep.
Proven ore reserves as of December 31, 2012 were 4,542,614 DST, with 0.041 ounces per ton of gold and 0.77 ounces per ton of silver. Probable ore reserves were 590,683 DST, with 0.017 ounces per ton of gold and 0.40 ounces per ton of silver. Total NRM in oxides were 1,692,792 DST, with 0.038 ounces per ton of gold and 0.11 ounces per ton of silver, 56.8% of which were derived from the Pucagallo prospect and 43.2% of which derived from the Senccata prospect. In 2013, we plan to conduct an intense drilling program, focusing primarily in new areas, and also complete modeling of the Senccata and Pucagallo prospects.
Set forth below are certain unaudited operating data for the Breapampa mine, calculated on the basis of 100 percent of the mine’s production.
| | | Year Ended December 31,(1)(2) | |
| | | 2011 | | | 2012 | |
| Mining Operations: | | | | | | | | |
| Ore mined (ST) | | | - | | | | 579,115 | |
| Average silver grade (oz./ST) | | | - | | | | 0.502 | |
| Average gold grade (oz./ST) | | | - | | | | 0.028 | |
| Production: | | | | | | | | |
| Silver (oz.) | | | - | | | | 17,212 | |
| Gold (oz.) | | | - | | | | 8,817 | |
| (1)(3) | Incorporates lossesCost applicable to sales per unit of mineral sold is not a measure of financial performance under IFRS and may not be comparable to similarly titled measures of other companies. Cost applicable to sales per ounce of gold or ounce of silver consists of cost applicable to sales for mining dilutiongold or silver sold, divided by the volume of gold or silver produced in the specified period. The cost applicable to sales per unit of mineral sold figures disclosed herein are calculated without adjusting for by-product revenue amounts. We consider cost applicable to sales per unit of mineral to be a key measure in managing and recovery. |
| (2) | Data reflect mining operations atevaluating our operating performance. We believe this measure is widely reported in the Parccaorcco deposit only.precious metals industry as a benchmark for performance, but does not have standardized meanings. You should not consider cost applicable to sales per unit of mineral sold as an alternative to cost of sales determined in accordance with IFRS as an indicator of our operating performance. See “Item 5. Operating and Financial Review Prospects—Buenaventura—F. Reconciliation of Cost Applicable to Sales and Cost Applicable to Sales per Unit Sold” for a reconciliation of Cost applicable to sales per unit sold to Cost of sales, excluding depreciation and amortization |
Mallay
The Mallay mine is wholly owned and operated by us and is located 21 kilometers southwest of the Uchucchacua mine in the district of Mallay, province of Oyón, department of Lima. The project is comprised of approximiately 2,300 hectares of mining concessions. Mallay is considered an epithermal deposit of silver, lead, zinc and gold. We have recognized the following major ore structures: Isguiz, Pierina, María and Fortuna Body.
The metallurgical processing plant began operations in mid-July 2012 with an average of 450 DST/day. During 2012, we constructed 9,389 meters of exploration tunnels and 20,380 meters of diamond drilling, focused mainly on mineralized structures of the Isguiz mine.
As of December 31, 2012, the proven ore reserves were 192,679 DST, with ore grades of 0.025 ounces per ton of gold, 10.29 ounces per ton of silver, 6.50 percent lead and 7.50 percent zinc, and the probable reserves were 95,434 DST, with ore grades of 0.028 ounces per ton of gold, 12.05 ounces per ton of silver, 5.71 percent lead and 6.26 percent zinc. Total NRM was 179,639 DST, with ore grades of 0.060 ounces per ton of gold, 11.56 ounces per ton of silver, 4.62 percent lead and 5.12 percent zinc. In 2013, we will focus exploration efforts on the Isguis and María-Dana vein systems, mainly at the 4370-meter and 4090-meter levels, as well as continue exploration of the Pierina vein at the 4310-meter and 4250-meter levels.
Set forth below are certain unaudited operating data for the Mallay mine, calculated on the basis of 100 percent of the mine’s production.
| | | Year Ended December 31,(1)(2) | |
| | | 2011 | | | 2012 | |
| Mining Operations: | | | | | | | | |
| Ore mined (ST) | | | - | | | | 114,166 | |
| Average silver grade (oz./ST) | | | - | | | | 6.65 | |
| Average gold grade (oz./ST) | | | - | | | | 0.011 | |
| Average lead grade (%) | | | - | | | | 5.18 | |
| Average zinc grade (%) | | | - | | | | 7.24 | |
| Production: | | | | | | | | |
| Silver (oz.) | | | - | | | | 682,708 | |
| Gold (oz.) | | | - | | | | 107 | |
| Lead (ST.) | | | - | | | | 4,952 | |
| Zinc (ST.) | | | - | | | | 6,711 | |
| Recovery rate silver (%) | | | - | | | | 89.9 | |
| (1) | Incorporates losses for mining dilution and recovery. |
| (2) | Data reflects mining operations at the Mallay deposit only. |
Colquijirca and Marcapunta Norte
The Colquijirca (also known as Tajo Norte) and Marcapunta Norte mines are wholly ownedwholly-owned by El Brocal. El Brocal was founded in 1956 and is engaged in the extraction, concentration and sale of concentrates of polymetallic minerals—mainly zinc, copper, lead and silver. Our aggregate direct and indirect equity interest in El Brocal was 53.76 percent54.07% at December 31, 2012. At December 31, 2012 the net total fixed assets of Colquijirca and Marcapunta Norte were approximately US$343 million.2015.
The Colquijirca and Marcapunta Norte mines are adjacent and are located 285 kilometers east of the city of Lima and 10 kilometers south of the city of Cerro de Pasco. El Brocal produces zinc and lead/silver concentrates from the Colquijirca mine and copper concentrates from the Marcapunta Norte mine. The Colquijirca mine consists of three important polymetallic deposits: (1) Tajo Norte, which contains zinc, silver and lead ore; (2) Marcapunta, which contains an auriferous mineralization in breccia oxides and an arsenic copper enargite mineralization as a continuation of the mineralized mantles of the Marcapunta Norte mine; and (3) San Gregorio, which contains zinc.
Mining at Colquijirca is conducted through the open-pit method from which zinc and lead concentrates are produced. El Brocal’s zinc concentrate typically contains 50 percent50% zinc, while its lead concentrate typically contains 51 percent50% lead. The concentrates are sold to local smelters and traders depending on market conditions. Mining at Marcapunta Norte is conducted through the room and pillarssublevel stopping method, from which copper concentrates are produced. El Brocal’s copper concentrates typically contains 25 percent26% copper, 7 ounces of4% silver and 8 percentand8% arsenic. The concentrates are sold to local traders.
The Huaraucaca concentrator plant processes ore from both mines. In 2012,2015, average treated ore at the plant reached up to 10,634metric13,875 tons per day. as result of increased capacity from 10,732 tons per day in the first quarter of 2015 to 16,591 tons per day in the fourth quarter of 2015 due to the completion of an expansion project. The Colquijirca mine primarily relies on a power line connected to the Peruvian national electricity grid.
El Brocal has conducted an exploration program at the Marcapunta deposit to confirm mineralization and find possible extensions, as well as to increase reserves at the Colquijirca and Marcapunta Norte mines. This program will continue throughout 2013.was discontinued in 2014. At the end of 2014, El Brocal obtained approval for its EIS relating to a diamond drilling program at the Marcapunta deposit.
In 2012,2015, we invested US$103.724 million to expandin tailings capacity expansion and complementary equipment for a processing plant. The construction of the expansion project operations were completed in 2014 (which, since 2008, has cost US$500 million) and have invested a totalreached the full expected capacity of US$278.0 million since 2008. We also continued18,000 tons per day in December 2015.In 2015, exploration was halted in prospective areas such as San Gregorio, Marcapunta Oeste and other areas at a cost of US$18.4 million. We also continued the construction and implementation ofto focus efforts on increasing the crushing, milling and floatationflotation processes under our expansion program, as well as construction ofto the Huachuacaca tailings facility.
In 2013, we plan to conduct an initial exploration program in Huancavelica at the Yanamina Millocucho zone to continue with prospecting activities. The expansion project, which will enable us to increase treatment capacity to up to 18,000 tpd of ore, should be completed during the second half of 2013.expected capacity.
Total proven and probable reserves of Colquijirca as of December 31, 20122015 were 63,333,000 DST,56,200,000 tons, with 0.76 ounces35.15 grams of silver per ton, 2.4 percent2.3% of zinc and 0.8 percent0.85% of lead. Total proven and probable reserves of Marcapunta Norte as of December 31, 20122015 were 20,016,145 DST,21,749,700 tons with 0.47 ounces18.973 grams of silver per ton, 0.010 ounces0.39 grams of gold per ton and 1.99 percent2.25% copper. Total NRM as of December 31, 2012 for Colquijirca was 45,532,188 DST, with 0.42 ounces per ton of silver, 1.76 percent zinc and 0.52 percent lead. Total NRM for Marcapunta Norte was 56,430,044 DST, with 0.57 ounces per ton of silver, 0.013 ounces per ton of gold and 1.71 percent copper.
Set forth below are certain unaudited operating data for the Colquijirca mine, calculated on the basis of 100 percent100% of the mine’s production.
| | | Year Ended December 31,(1) | | |
| | | 2010 | | 2011 | | 2012 | | | Year Ended December 31,(1) | |
| | | | | | | | | | 2014 | | | 2015 | |
| Mining Operations: | | | | | | | | | | | | | | | | | | | | |
| Ore mined (ST) | | | 1,150,527 | | | | 929,032 | | | | 1,862,717 | | |
| Average silver grade (oz./ST) | | | 2.30 | | | | 2.67 | | | | 1.20 | | |
| Ore mined (t) | | | | 481,589 | | | | 3,101,851 | |
| Average silver grade (oz./t) | | | | 1.92 | | | | 1.34 | |
| Average zinc grade (%) | | | 4.69 | | | | 3.90 | | | | 2.93 | | | | 3.12 | | | | 2.77 | |
| Average lead grade (%) | | | 1.68 | | | | 1.69 | | | | 1.10 | | | | 1.20 | | | | 1.03 | |
| Production: | | | | | | | | | | | | | | | | | | | | |
| Silver (oz.) | | | 1,901,661 | | | | 1,876,434 | | | | 1,409,877 | | | | 603,342 | | | | 2,811,391 | |
| Zinc (ST) | | | 38,955 | | | | 25,968 | | | | 33,268 | | |
| Lead (ST) | | | 12,768 | | | | 10,432 | | | | 10,654 | | |
| Zinc (t) | | | | 10,126 | | | | 53,319 | |
| Lead (t) | | | | 3,459 | | | | 18,854 | |
| Recovery rate (silver) (%) | | | 69.1 | | | | 76.1 | | | | 63.2 | | | | 64.30 | | | | 67.52 | |
| Recovery rate (zinc) (%) | | | 72.17 | | | | 71.92 | | | | 67.11 | | | | 67.06 | | | | 61.96 | |
| Recovery rate (lead) (%) | | | 66.00 | | | | 66.57 | | | | 57.25 | | | | 56.42 | | | | 58.73 | |
| Cost applicable to sales per ton of mine(2) | | | | 1,369 | | | | 1,601 | |
| (1) | Incorporates losses for mining dilution and recovery. |
| (2) | Represents cost applicable to sales per ton of zinc for El Brocal. Cost applicable to sales per unit of mineral sold is not a measure of financial performance under IFRS and may not be comparable to similarly titled measures of other companies. Cost applicable to sales per ton of zinc consists of cost applicable to sales for zinc divided by the volume of zinc produced in the specified period. The cost applicable to sales per unit of mineral sold figures disclosed herein are calculated without adjusting for by-product revenue amounts. We consider cost applicable to sales per unit of mineral to be a key measure in managing and evaluating our operating performance. We believe this measure is widely reported in the precious metals industry as a benchmark for performance, but does not have standardized meanings. You should not consider cost applicable to sales per unit of mineral sold as an alternative to cost of sales determined in accordance with IFRS as an indicator of our operating performance. See “Item 5. Operating and Financial Review Prospects—Buenaventura—F. Reconciliation of Cost Applicable to Sales and Cost Applicable to Sales per Unit Sold” for a reconciliation of Cost applicable to sales per unit sold to Cost of sales, excluding depreciation and amortization. |
Set forth below are certain unaudited operating data for the Marcapunta Norte mine, calculated on the basis of 100 percent100% of the mine’s production.
| | | Year Ended December 31,(1) | | |
| | | 2010 | | 2011 | | 2012 | | | Year Ended December 31,(1) | |
| | | | | | | | | | 2014 | | | 2015 | |
| Mining Operations: | | | | | | | | | | | | | | | | | | | | |
| Ore mined (ST) | | | 946,659 | | | | 1,961,759 | | | | 2,042,904 | | |
| Average silver grade (oz./ST) | | | 1.06 | | | | 1.03 | | | | 0.38 | | |
| Average gold grade (%) | | | 0.013 | | | | 0.010 | | | | 0.011 | | |
| Ore mined (t) | | | | 2,773,738 | | | | 1,962,627 | |
| Average silver grade (oz./t) | | | | 0.84 | | | | 0.75 | |
| Average gold grade (gr/t) | | | | 0.31 | | | | 0.35 | |
| Average copper grade (%) | | | 2.30 | | | | 1.60 | | | | 1.41 | | | | 1.71 | | | | 1.92 | |
| Production: | | | | | | | | | | | | | | | | | | | | |
| Silver (oz.) | | | 608,438 | | | | 1,035,315 | | | | 421,512 | | | | 1,463,872 | | | | 858,109 | |
| Gold (oz) | | | 5,549 | | | | 8,498 | | | | 10,220 | | |
| Copper (ST) | | | 18,707 | | | | 26,231 | | | | 22,785 | | |
| Gold (oz.) | | | | 14,134 | | | | 11,263 | |
| Copper (t) | | | | 43,282 | | | | 32,061 | |
| Recovery rate (silver) in copper (%) | | | 60.81 | | | | 50.67 | | | | 54.37 | | | | 62.36 | | | | 58.48 | |
| Recovery rate (gold) in copper (%) | | | 45.79 | | | | 45.02 | | | | 45.21 | | | | 56.50 | | | | 50.27 | |
| Recovery rate copper (%) | | | 85.86 | | | | 83.06 | | | | 86.52 | | | | 86.23 | | | | 87.0 | |
| Cost applicable to sales per ton of mine(2) | | | | 5,096 | | | | 5,322 | |
| (1) | Incorporates losses for mining dilution and recovery. |
| (2) | Represents cost applicable to sales per ton of copper for El Brocal. Cost applicable to sales per unit of mineral sold is not a measure of financial performance under IFRS and may not be comparable to similarly titled measures of other companies. Cost applicable to sales per ton of copper consists of cost applicable to sales for copper divided by the volume of copper produced in the specified period. The cost applicable to sales per unit of mineral sold figures disclosed herein are calculated without adjusting for by-product revenue amounts. We consider cost applicable to sales per unit of mineral to be a key measure in managing and evaluating our operating performance. We believe this measure is widely reported in the precious metals industry as a benchmark for performance, but does not have standardized meanings. You should not consider cost applicable to sales per unit of mineral sold as an alternative to cost of sales determined in accordance with IFRS as an indicator of our operating performance. See “Item 5. Operating and Financial Review Prospects—Buenaventura—F. Reconciliation of Cost Applicable to Sales and Cost Applicable to Sales per Unit Sold” for a reconciliation of Cost applicable to sales per unit sold to Cost of sales, excluding depreciation and amortization. |
Reserves
We calculate our ore reserves by methods generally applied within the mining industry and in accordance with CommissionSEC Industry Guide 7. All mineral reserves are estimated quantitiesestimates of proven and probable ore quantities that under present conditions may be economically mined and processed.
The proven and probable ore reserve figures presented in this Annual Report are estimates, and no assurance can be given that the level of recovery of gold, silver and certain other metals will be realized. See “Item 3. Key Information—D. Risk Factors—Factors Relating to the Company—Estimates of proven and probable reserves are subject to uncertainties and the volume and grade of ore actually recovered may vary from our estimates.”
The term “reserves” refers to mineral deposits that could be economically and legally extracted or produced at the time of reserve determination. The term “proven reserves” means ore reserves for which (a) quantity is computed from dimensions revealed in outcrops, trenches, workings or drill holes, and grade and/or quality are computed from the results of detailed sampling, and (b) the sites for inspection, sampling and measurement are spaced so closely and the geologic character is so well defined that size, shape, depth and mineral content of reserves are well established. The term “probable reserves” means ore reserves for which quantity and grade and/or quality are computed from information similar to that used for proven reserves, but the sites for inspection, sampling and measurement are farther apart or are otherwise less adequately spaced. The degree of assurance, although lower than that for proven reserves, is high enough to assume continuity between points of observation.
As of December 31, 2012,2015, our total proven and probable reserves, including our equity share in the proven and probable reserves of El Brocal (54.07%), La Zanja (53.06%), Coimolache (40.10%) and Yanacocha (43.65%), were estimated to be 1,3853.52 million ounces of gold, representing a 7%60.23% decrease compared to our total proven and probable reserves as of December 31, 2014, which were estimated to be 8.85 million ounces of gold. This decrease is primarily due to the reclassification of the Conga mine gold reserves (5.5 million ounces as of December 31, 2014) as resources or NRM as of December 31, 2015.
As of December 31, 2015, our total proven and probable reserves, including our equity share in El Brocal (54.07%), La Zanja (53.06%), Coimolache (Tantahuatay) (40.10%) and Yanacocha (43.65%), were estimated to be 139.04 million ounces of silver, representing a 17.29% decrease over our total proven and probable reserves as of December 31, 2011,2014, which were estimated to be 1,485168.10 million ounces of gold. Thesilver. This decrease in reserves of gold was mainlyis primarily due to the reclassification of the Conga mine depletion and the lack of replacements for gold production at La Zanja.
As of December 31, 2012, our total proven and probablesilver reserves were estimated to be 154,606(37.8 million ounces of silver, representing a 1% decrease over our total proven and probable reserves as of December 31, 2011, which were estimated to be 155,437 million ounces2014) as resources or NRM as of silver. The decrease in reserves of silver was mainly due to mine depletion and the lack of replacements for silver production at El Brocal.December 31, 2015.
The following table lists the proven and probable ore reserves and the average grade of such ore, as of December 31, 2012,2015 for each of our consolidated mining operations, and the Tantahuatay mine, in whichwhere we have a 40 percent40.10% equity interest, calculated on the basisLa Zanja mine, where we have a 53.06% equity interest, and the Colquijirca & Marcapunta (El Brocal) mines, where we have a 54.07% equity interest. The reserves show in the table below are the total reserves for each mine and do not reflect our equity share of 100 percent of each mine’s reserves and US$1,400 per ounce of gold and US$30.00 per ounce of silver.in non-wholly-owned mines.
Proven and Ore Reserves at December 31, 2015(1) (2)
| | | Orcopampa(3) | | | Uchucchacua(4) | | | Julcani(5) | | | Mallay(6) | | | Tambomayo(7) | | | Antapite(8) | | | Breapampa(9) | | | La Zanja(10) | | | Tantahuatay(11) | | | Colquijirca(12)(13) | | | Marcapunta(12)(14) | | | Total/
Average | |
| | | | | | | | | | | | | | | | | | | | | | | | | | | | | | | | | | | | | | | | | | | | | | | | | |
| Ore Reserves (t) | | | 447,911 | | | | 2,688,395 | | | | 198,365 | | | | 66,572 | | | | 747,639 | | | | 24,538 | | | | 519,539 | | | | 4,672,820 | | | | 53,810,366 | | | | 18,400,000 | | | | 5,833,113 | | | | 87,409,258 | |
| | | | | | | | | | | | | | | | | | | | | | | | | | | | | | | | | | | | | | | | | | | | | | | | | |
| Grade: | | | | | | | | | | | | | | | | | | | | | | | | | | | | | | | | | | | | | | | | | | | | | | | | |
| Gold (g/t) | | | 14.86 | | | | - | | | | 0.53 | | | | 0.50 | | | | 9.01 | | | | 10.16 | | | | 0.45 | | | | 0.63 | | | | 0.45 | | | | - | | | | 0.40 | | | | 0.50 | |
| Silver (g/t) | | | 45.97 | | | | 433.42 | | | | 647.91 | | | | 338.86 | | | | 312.92 | | | | - | | | | 17.18 | | | | 4.26 | | | | 6.42 | | | | 30.87 | | | | 18.35 | | | | 29.87 | |
| Copper (%) | | | - | | | | - | | | | 0.57 | | | | - | | | | - | | | | - | | | | - | | | | - | | | | - | | | | 0.09 | | | | 2.36 | | | | 0.13 | |
| Zinc (%) | | | - | | | | 2.00 | | | | - | | | | 8.91 | | | | 2.87 | | | | - | | | | - | | | | - | | | | - | | | | 2.68 | | | | - | | | | 0.99 | |
| Lead (%) | | | - | | | | 1.38 | | | | 2.70 | | | | 6.38 | | | | 1.86 | | | | - | | | | - | | | | - | | | | - | | | | 0.91 | | | | - | | | | 0.37 | |
| | | | | | | | | | | | | | | | | | | | | | | | | | | | | | | | | | | | | | | | | | | | | | | | | |
| Content: | | | | | | | | | | | | | | | | | | | | | | | | | | | | | | | | | | | | | | | | | | | | | | | | |
| Gold (oz.) | | | 213,918 | | | | - | | | | 3,364 | | | | 1,076 | | | | 216,503 | | | | 8,017 | | | | 7,515 | | | | 94,920 | | | | 782,032 | | | | - | | | | 75,016 | | | | 1,402,361 | |
| Silver (oz.) | | | 662,012 | | | | 37,461,786 | | | | 4,132,117 | | | | 725,265 | | | | 7,521,652 | | | | - | | | | 286,981 | | | | 639,878 | | | | 11,107,786 | | | | 18,264,000 | | | | 3,441,537 | | | | 84,243,014 | |
| Copper (t) | | | - | | | | - | | | | 1,135 | | | | - | | | | - | | | | - | | | | - | | | | - | | | | - | | | | 15,840 | | | | 137,661 | | | | 154,636 | |
| Zinc (t) | | | - | | | | 53,793 | | | | - | | | | 5,931 | | | | 21,490 | | | | - | | | | - | | | | - | | | | - | | | | 492,720 | | | | - | | | | 573,934 | |
| Lead (t) | | | - | | | | 37,177 | | | | 5,346 | | | | 4,250 | | | | 13,882 | | | | - | | | | - | | | | - | | | | - | | | | 168,160 | | | | - | | | | 228,815 | |
Probable Ore Reserves at December 31, 20122015(1)(2)(3)
| | | Julcani(4) | | Uchucchacua(5) | | Orcopampa(6) | | Recuperada(7) | | Mallay(8) | | Colquijirca(9)(10) | | Marcapunta(9)(11) | | Ishihuinca | | Antapite(12) | | Shila-
Paula(13) | | Poracota(14) | | Breapampa(15) | | Tantahuatay(16) | | La
Zanja(17) | | Total/
Average | | | Orcopampa(3) | | | Uchucchacua(4) | | | Julcani(5) | | | Mallay(6) | | | Tambomayo(7) | | | Antapite(8) | | | Breapampa(9) | | | La Zanja(10) | | | Tantahuatay(11) | | | Colquijirca(12)(13) | | | Marcapunta(12)(14) | | | Total/
Average | |
| Ore Reserves (ST) | | | 424,605 | | | | 5,684,990 | | | | 1,090,891 | | | | 114,485 | | | | 288,113 | | | | 63,333,221 | | | | 20,016,327 | | | | 12,947 | | | | 47,745 | | | | 8,371 | | | | 36,487 | | | | 5,133,297 | | | | 39,273,107 | | | | 24,795,233 | | | | 160,259,819 | | |
| | | | | | | | | | | | | | | | | | | | | | | | | | | |
| Ore Reserves (t) | | | | 200,442 | | | | 1,582,825 | | | | 90,414 | | | | 19,874 | | | | 333,392 | | | | 13,009 | | | | - | | | | 7,232,317 | | | | 12,386,587 | | | | 37,800,000 | | | | 15,916,645 | | | | 75,575,505 | |
| | | | | | | | | | | | | | | | | | | | | | | | | | | | | | | | | | | | | | | | | | | | | | | | | | |
| Grade: | | | | | | | | | | | | | | | | | | | | | | | | | | | | | | | | | | | | | | | | | | | | | | | | | | | | | | | | | | | | | | | | | | | | | | | | | | | | | | | | | | | | | | | | | | | | | | | | | | | | | | | | | | | | |
| Gold (oz./ST) | | | 0.017 | | | | - | | | | 0.421 | | | | - | | | | 0.026 | | | | - | | | | 0.010 | | | | 0.334 | | | | 0.300 | | | | 0.397 | | | | 0.332 | | | | 0.038 | | | | 0.013 | | | | 0.018 | | | | 0.014 | | |
| Silver (oz./ST) | | | 18.56 | | | | 12.68 | | | | 0.54 | | | | 8.80 | | | | 10.87 | | | | 0.76 | | | | 0.47 | | | | - | | | | 0.22 | | | | 0.92 | | | | 0.079 | | | | 0.73 | | | | 0.313 | | | | 0.208 | | | | 1.02 | | |
| Gold (g/t) | | | | 14.64 | | | | - | | | | 0.45 | | | | 0.55 | | | | 10.41 | | | | 10.91 | | | | - | | | | 0.61 | | | | 0.35 | | | | - | | | | 0.39 | | | | 0.57 | |
| Silver (g/t) | | | | 63.69 | | | | 464.58 | | | | 648.82 | | | | 349.19 | | | | 231.88 | | | | - | | | | - | | | | 4.02 | | | | 9.99 | | | | 37.17 | | | | 18.97 | | | | 35.63 | |
| Copper (%) | | | 0.50 | | | | - | | | | - | | | | - | | | | - | | | | - | | | | 1.99 | | | | - | | | | - | | | | - | | | | - | | | | - | | | | - | | | | - | | | | - | | | | - | | | | - | | | | 0.50 | | | | - | | | | - | | | | - | | | | - | | | | - | | | | - | | | | 0.42 | | | | 2.21 | | | | 0.93 | |
| Zinc (%) | | | - | | | | 1.77 | | | | - | | | | 7.05 | | | | 7.09 | | | | 2.40 | | | | - | | | | - | | | | - | | | | - | | | | - | | | | - | | | | - | | | | - | | | | - | | | | - | | | | 1.45 | | | | - | | | | 9.01 | | | | 3.31 | | | | - | | | | - | | | | - | | | | - | | | | 2.11 | | | | – | | | | 0.09 | |
| Lead (%) | | | 1.88 | | | | 1.25 | | | | - | | | | 4.04 | | | | 6.24 | | | | 0.80 | | | | - | | | | - | | | | - | | | | - | | | | - | | | | - | | | | - | | | | - | | | | - | | | | - | | | | 1.12 | | | | 2.14 | | | | 6.23 | | | | 2.31 | | | | - | | | | - | | | | - | | | | - | | | | 0.82 | | | | – | | | | 0.08 | |
| | | | | | | | | | | | | | | | | | | | | | | | | | | | | | | | | | | | | | | | | | | | | | | | | | |
| Content: | | | | | | | | | | | | | | | | | | | | | | | | | | | | | | | | | | | | | | | | | | | | | | | | | | | | | | | | | | | | | | | | | | | | | | | | | | | | | | | | | | | | | | | | | | | | | | | | | | | | | | | | | | | | |
| Gold (oz.) | | | 7,398 | | | | - | | | | 459,265 | | | | - | | | | 7,596 | | | | - | | | | 204,333 | | | | 4,326 | | | | 14,324 | | | | 3,323 | | | | 12,114 | | | | 197,144 | | | | 528,346 | | | | 437,345 | | | | 2,206,514 | | | | 94,338 | | | | - | | | | 1,295 | | | | 350 | | | | 111,561 | | | | 4,564 | | | | - | | | | 140,705 | | | | 138,450 | | | | - | | | | 199,575 | | | | 690,838 | |
| Silver (oz.) | | | 7,879,249 | | | | 72,097,949 | | | | 589,081 | | | | 1,007,468 | | | | 3,132,941 | | | | 48,262,200 | | | | 9,442,435 | | | | | | | | 10,504 | | | | 7,732 | | | | 2,882 | | | | 3,749,722 | | | | 12,278,957 | | | | 5,156,137 | | | | 163,617,257 | | | | 410,457 | | | | 23,641,913 | | | | 1,886,037 | | | | 223,118 | | | | 2,485,514 | | | | - | | | | - | | | | 933,664 | | | | 3,979,665 | | | | 45,169,000 | | | | 9,709,154 | | | | 88,438,522 | |
| Copper (ST) | | | 2,102 | | | | - | | | | - | | | | - | | | | - | | | | - | | | | 398,325 | | | | - | | | | - | | | | - | | | | - | | | | - | | | | - | | | | - | | | | 400,427 | | |
| Zinc (ST) | | | - | | | | 100,345 | | | | - | | | | 8,071 | | | | 20,427 | | | | 1,519,997 | | | | - | | | | - | | | | - | | | | - | | | | - | | | | - | | | | - | | | | - | | | | 1,648,840 | | |
| Lead (ST) | | | 7,990 | | | | 71,139 | | | | - | | | | 4,625 | | | | 17,978 | | | | 506,666 | | | | - | | | | - | | | | - | | | | - | | | | - | | | | - | | | | - | | | | - | | | | 608,398 | | |
| Copper (t) | | | | - | | | | - | | | | 454 | | | | - | | | | - | | | | - | | | | - | | | | - | | | | - | | | | 157,510 | | | | 351,758 | | | | 509,722 | |
| Zinc (t) | | | | - | | | | 23,013 | | | | - | | | | 1,790 | | | | 11,028 | | | | - | | | | - | | | | - | | | | - | | | | 799,270 | | | | – | | | | 835,101 | |
| Lead (t) | | | | - | | | | 17,743 | | | | 1,931 | | | | 1,239 | | | | 7,688 | | | | - | | | | - | | | | - | | | | - | | | | 308,560 | | | | – | | | | 337,161 | |
| (1) | Algon Investment S.R.L.Geominería S.A.C., an independent consultant is incompany, audits the process of reviewing the framework used to estimate proven and probable ore reserves forin our wholly-owned mines, as of December 31, 2012.2015. In 2014 MINTEC Inc., an independent consultant, is inupdated the processproven and probable reserves for El Brocal and defined the final limits of reviewing the conceptual frameworkopen pit. As of December 31, 2015, we have updated topographically subtracting the 2015 production. HATCH, an independent consultant, audits the process used to estimate proven and probable ore reserves for El Brocal’s mines as ofLa Zanja and Tantahuatay at December 31, 2012.
2015. |
| (2) | The metallurgical recovery factors used to calculate reserves for each of our mines include ore quality, gradation of ore (which impacts the effectiveness of reagents in releasing valuable particles), quality of water used to treat ore (recycled water contains impurities that can interfere with the chemical reaction of the reagents) and quality of reagent used to treat ore. |
| (3) | For the year ended December 31, 2012,2015, reserves for our wholly-owned and operated mines (which include all of the mines listed above other than Colquijirca, Marcapunta, Tantahuatay and La Zanja) were calculated using the following prices: US$1,4001,250 per ounce of gold, US$3019 per ounce of silver, US$2,0282,000 per metric ton of zinc, US$2,000 per metric ton of lead and US$6,6005,500 per metric ton of copper. |
| (4) | The metallurgical recovery factors that impacted the calculated reserves for Julcani at December 31, 2012 were whether the ore contained iron sulfide (Pirite) higher than 8% and the quality of water. |
| (5) | The metallurgical recovery factors that impacted the calculated reserves for Uchucchacua at December 31, 2012 were the complexity of the ore, the variation of ore grade and the high manganese content. |
| (6)(3) | The metallurgical recovery factors that impacted the calculated reserves for Orcopampa at December 31, 20122015 were water quality (recycled water contains impurities that can interfere with the chemical reaction of the reagents) and ore grade being lower than estimated or expected ore grade.expected. |
| (7)(4) | The metallurgical recovery factors that impacted the calculated reserves for RecuperadaUchucchacua at December 31, 20122015 were the complexity of the ore, the variation of head ore grades and the high variation inmanganese content. |
| (5) | The metallurgical recovery factors that impacted the calculated reserves for Julcani at December 31, 2015 were when the ore gradecontained iron sulfide (Pyrite) higher than 8% and the quality of water.water used in the processing plant. |
| (8)(6) | The metallurgical recovery factors that impacted the calculated reserves for Mallay at December 31, 20122015 were the high variation in ore grade and the variation in the hardness of the host rocks. |
| (7) | The metallurgical recovery factors that impacted the calculated reserves for Tambomayo at December 31, 2015 were the complex process to treat polymetallic ore and the variation in the hardness of the host rocks. |
| (8) | The metallurgical recovery factors that impacted the calculated reserves for Antapite at December 31, 2015 were the high variation in ore grade and the quality of water used in process plant. |
| (9) | The metallurgical recovery factors that impacted the calculated reserves for Breapampa at December 31, 2015 were the clay content in ore higher than 10% and the iron sulfide (Pyrite) content in ore higher than 3%. |
| (10) | The reserves shown for La Zanja, in which we owned a 53.06% of equity interest at December 31, 2015, are the total reserves of the mine and do not indicate our equity share. The metallurgical recovery factors that impacted the calculated reserves were when the clay content in ore being higher than 10% and the copper presence in the ore. |
| (11) | The reserves shown for Tantahuatay, in which we own a 40.10% of equity interest at December 31, 2015, are the total reserves for the mine and do not indicate our equity share. The metallurgical recovery factors that impacted the calculated reserves were when the clay content in ore being higher than 10% and the iron sulfide (Pyrite) content in ore being higher than 3%. |
| (12) | El Brocal, in which we owned a 53.76%own 54.07% controlling equity interest at December 31, 2012,2015, owns the Colquijirca and Marcapunta mines. The reserves shown for Colquijirca and Marcapunta are the total reserves of the Colquijirca and Marcapunta mines and do not indicate our equity share. They were calculated using the following metal prices: US$1,400 per ounce of gold, US$30 per ounce of silver, US$2,028 per metric ton of zinc, US$2,000 per metric ton of lead and US$6,600 per metric ton of copper.shareholdings. |
| (10)(13) | The metallurgical recovery factors that impacted the calculated reserves for Colquijirca at December 31, 20122015 were the high content of clay, and soluble salts in the ore. |
| (11)(14) | The metallurgical recovery factors that impacted the calculated reserves for Marcapunta at December 31, 20122015 were the high content of arsenic in the ore and the hardness of the host rocks. |
| (12) | The metallurgical recovery factors that impacted the calculated reserves for Antapite at December 31, 2012 were the high variation in ore grade and the quality of water. |
| (13) | The metallurgical recovery factors that impacted the calculated reserves for Shila-Paula at December 31, 2012 was the high variation in ore grade. |
| (14) | The metallurgical recovery factors that impacts the calculated reserves for Poracota at December 31, 2012 were the high variation of the ore grade and the presence of coal content in the ore. |
| (15) | The metallurgical recovery factors that impacted the calculated reserves for Breapampa at December 31, 2012 were the clay content in ore being higher than 10% and the iron sulfide (Pirite) content in ore being higher than 3%. |
| (16) | The reserves shown for Tantahuatay, in which we owned a 40% of equity interest at December 31, 2012, are the total reserves for the mine and do not indicate our equity share. They were calculated using the following prices: US$1,200 per ounce of gold and US$ 22.0 per ounce of silver. The metallurgical recovery factors that impacted the calculated reserves were the clay content in ore being higher than 10% and the iron sulfide (Pirite) content in ore being higher than 3%. |
| (17) | The reserves shown for La Zanja, in which we owned a 53.06% of equity interest at December 31, 2012, are the total reserves of the mine and do not indicate our equity share. They were calculated using the following metal prices: US$1,400 per ounce of gold and US$ 30 per ounce of silver. The metallurgical recovery factors that impacted the calculated reserves were the clay content in ore being higher than 10% and the high copper content in the ore. |
We operate ten underground mines and four open pit mines. The following table sets forth the aggregate amount of production of ore, gold and silver and the average grade of gold and silver for each of our fourteen mines for the ten-year period ended December 31, 2012, calculated in each case on the basis of 100 percent of the relevant mine’s production.
| | | Julcani | | | Uchucchacua | | | Orcopampa(1) | | | Recuperada | | | Mallay | | | Colquijirca(2)(6) | | | Marcapunta(2) | | | Ishihuinca | | | Antapite | | | Shila -
Paula(3) | | | Poracota | | | Breapampa(6) | | | Tantahuatay(4) (6) | | | La Zanja(5) (6) | | | Total | |
| Ore mined (ST) | | | 957,120 | | | | 9,239,911 | | | | 4,693,309 | | | | 682,640 | | | | 114,166 | | | | 16,397,908 | | | | 5,690,763 | | | | 368,511 | | | | 1,611,585 | | | | 634,734 | | | | 1,124,909 | | | | 579,115 | | | | 14,845,347 | | | | 23,821,022 | | | | 80,761,040 | |
| Gold produced (oz.) | | | 6,942 | | | | - | | | | 2,612,923 | | | | - | | | | 107 | | | | - | | | | 31,300 | | | | 125,096 | | | | 611,405 | | | | 250,031 | | | | 242,563 | | | | 8,817 | | | | 187,432 | | | | 290,304 | | | | 4,366,920 | |
| Average gold grade (oz./ST) | | | 0.011 | | | | - | | | | 0.556 | | | | - | | | | 0.011 | | | | - | | | | 0.012 | | | | 0.402 | | | | 0.399 | | | | 0.416 | | | | 0.262 | | | | 0.028 | | | | 0.017 | | | | 0.021 | | | | 0.059 | |
| Silver produced (oz.) | | | 16,266,407 | | | | 101,784,006 | | | | 1,458,349 | | | | 3,718,219 | | | | 682,708 | | | | 42,636,134 | | | | 2,379,792 | | | | - | | | | 667,609 | | | | 2,278,745 | | | | 130,660 | | | | 17,212 | | | | 1,179,416 | | | | 788,047 | | | | 173,987,304 | |
| Average silver grade (oz./ST) | | | 18.25 | | | | 14.97 | | | | 0.30 | | | | 5.79 | | | | 6.65 | | | | 3.71 | | | | 0.75 | | | | - | | | | 0.60 | | | | 4.36 | | | | 0.15 | | | | 0.50 | | | | 0.52 | | | | 0.31 | | | | 3.05 | |
| (1) | Includes a cumulative total of 116,146 ounces of gold and 587,961 ounces of silver from final tail treatment. |
| (2) | El Brocal, in which we own a 53.76 % controlling equity interest as of December 31, 2012, owns the Colquijirca and Marcapunta mines. The production data shown for Colquijirca and Marcapunta are the total production data of the Colquijirca and Marcapunta mines and do not indicate our equity share. |
| (3) | Includes a cumulative total of 701 ounces of gold and 48,677 ounces of silver from metallurgical test treatments to ore from the Tambomayo mine. |
| (4) | The production data shown for Tantahuatay, in which we own a 40.0 % controlling equity interest, are the total production data of the mine and do not indicate our equity share. |
| (5) | The production data shown for La Zanja, in which we own a 53.06 % controlling equity interest, are the total production data of the mine and do not indicate our equity share. |
| (6) | Colquijirca, Breapampa, Tantahuatay and La Zanja are open pit mines. |
Yanacocha’s Properties
Operating Properties
For operating data (including ore mined, average gold grade of ore mined and gold production) for each of Yanacocha’s operating properties and a description of how ore is processed and the source of electricity and water for each of Yanacocha’s operating properties, see “—Yanacocha—Business Overview” and “—Description of Yanacocha’s Operations.”
Carachugo -– Chaquicocha
Chaquicocha Sur is an 85-hectare gold deposit (ultimate pit) which lies in the east-central part of the Yanacocha district, approximately 1one kilometer southeast of the mined out Carachugo deposit and 300 meters south of the Chaquicocha Norte pit. Mining at this deposit was completed in late 2015.
Carachugo is a 90-hectare gold deposit with a leach pad that covers approximately 306 hectares. Carachugo, Yanacocha’s first mine, commenced operations in August 1993. Mining iswas conducted by the open-pit method. The Carachugo open-pit mine ceased mining operations in 2004, although one ore processing facility remains in operation.
Maqui Maqui
Maqui Maqui is a 75-hectare gold deposit with a leach pad covering 67 hectares, located five kilometers northeast of the Carachugo pit. Mining operations at Maqui Maqui began in October 1994 and used the open-pit mining method. Although mining operations at Maqui Maqui ceased in September 2000, gold recovery from the leach pad continues. The Maqui Maqui East expansion commenced operations in 2010 and will finishmining at this deposit was completed in February 2014. late 2015.
San José
San José is a 100-hectare gold deposit, located 1.5 kilometers southwest of the Carachugo pit, that shares the leach pad located at Carachugo. Mining operations at San José began in January 1996 using the open-pit mining method. Mining operations at San José temporarily ceased during the fourth quarter of 2002 and reopened in 2005 to complete San José East. San José West started operations in early 2010 and ceased operations in November 2012.
Cerro Yanacocha
Cerro Yanacocha is a 247-hectare gold deposit (ultimate pit) with a leach pad covering approximately 310 hectares. The Cerro Yanacocha pit is located two kilometers northwest of the Carachugo pit. Operations began in the fourth quarter of 1997 using the open-pit mining method. Cerro Yanacocha includes a carbon column gold recovery plant and a Merrill-Crowe-type ore processing facility. Cerro Yanacocha temporarily ceased operations in October 2010 and expectsrestarted operations in 2015 with mining in the layback area and the deep transitional stockpiles located inside the current open pit. Mining activities are scheduled to reopen in 2017.cease by 2019.
La Quinua
La Quinua is a 450-hectare gold deposit (ultimate pit) with a leach pad covering 426 hectares. The La Quinua, El Tapado and El Tapado Oeste pits are located three kilometers southwest of the Cerro Yanacocha pit. Operations began in the fourth quarter of 2001 using the open-pit mining method. All solution processing occurs at the Cerro Yanacocha plant following treatment at the La Quinua leach pad and carbon column facility.
The La Quinua mining operation included Cerro Negro Este, a 15-hectare gold deposit (ultimate pit) which is located six kilometers southwest of the La Quinua pit. Cerro Negro Este utilized the La Quinua leach pad. Operations began in April 2004 using the open-pit mining method and all solution processing occurred at the Cerro Yanacocha plant following treatment at the La Quinua leach pad and carbon column facility. Mining operations at Cerro Negro Este ceased in March 2005.
Mining operations in Tapado Oeste was completed at the end of 2015, while the construction of the Tapado Oeste layback was approved in early 2015. The Tapado Oeste layback began mining operations in the first quarter of 2015.
Western Oxides
The Western Oxides are comprised of the Cerro Negro Oeste and La Quinua Sur open-pit mines. Cerro Negro Oeste, a 40-hectare gold deposit, is located 6.5 kilometers southwest of the La Quinua pit. This pit utilizes the La Quinua leach pad as its ore facility. La Quinua Sur, a 110-hectare gold deposit, is located south of the Tapado Oeste pit and is completely covered by La Quinua gravel. Mining activities started in Cerro Negro West in August 2011 and are scheduled to be finished in 2016. La Quinua Sur commenced mining activities in July 2014 and is scheduled to commence mining activitiescease operations in May 2014 and finish in 2015.2019. The ore mined from this pit will be processed at the La Quinua leach pad.pad expansion.
Eastern Oxides
The Eastern Oxides consist of the Marleny open-pit mine. The Marleny pit, an 8-hectare deposit, is located to the west of the Carachugo backfill. Marleny is scheduled to commencestarted mining operations in May 2013 and completeceased operations in 2015.April 2014. Mining will restart to deepen the current pit in the first half of 2016.
Carachugo Alto
The Carachugo Alto pit, a 9-hectare deposit, is located to the east of the Carachugo backfill. Carachugo Alto commenced mining operations in July 2010, and its second phase will finishwas completed in AugustOctober 2013.
China Linda
Yanacocha owns and operates the China Linda lime plant, which is located in Cajamarca, 12 kilometers to the northeast of the Yanacocha installations. Access to the plant from Yanacocha is by a ten-kilometer private, unpaved road. Lime is used in the gold and silver mining process to regulate the alkalinity of the cyanide solutions in the leaching process and for pH control in water treatment applications. Currently, the plant has a production capacity of 78,000 tons of lime per year.
Reserves
Proven and probable reserves are based on extensive drilling, sampling, mine modeling and metallurgical testing from which economic feasibility is determined. Under the Management Contract, Newmont Mining, in conjunction with Yanacocha, calculates Yanacocha’s reserves by methods generally applied within the mining industry and in accordance with SEC Industry Guide 7. Reserves represent estimated quantities of proven and probable ore that under present and anticipated conditions may be economically mined and processed.
The following table lists proven and probable reserves and the average grade of ore as of December 31, 20122015 for Yanacocha and the Conga project.Yanacocha. Calculations with respect to the estimates of proven and probable reserves are based on a gold price of US$1,4001,200 per ounce as of December 31, 2012. Calculations with respect to the Conga project’sand a copper reserves were calculated at a price of US$3.252.75 per pound as of December 31, 2012.2015. The proven and probable reserves presented below represent the total quantity of ore to be extracted from the deposits, allowing for mining efficiencies and ore dilution. Ounces of gold and pounds of copper in the districts of Yanacocha’s and the Conga project’s proven and probable reserves are calculated prior tobefore any losses during metallurgical treatment.
| | | Proven and Probable
Reserves at
December 31, 2012 | |
| | | Tonnage
(thousands of
DST) | | | Average
Gold Grade
(oz./DST) | | | Ounces
Contained
(thousands of
ounces) | |
| Maqui Maqui | | | 10,181 | | | | 0.025 | | | | 254 | |
| Carachugo | | | 11,297 | | | | 0.041 | | | | 459 | |
| San José | | | - | | | | - | | | | - | |
| Giuliana | | | - | | | | - | | | | - | |
| Marleny | | | 8,873 | | | | 0.010 | | | | 91 | |
| Cerro Yanacocha | | | 4,122 | | | | 0.058 | | | | 238 | |
| La Quinua | | | - | | | | - | | | | - | |
| Tapado | | | - | | | | - | | | | - | |
| Corimayo | | | 48,674 | | | | 0.044 | | | | 2,120 | |
| La Quinua Sur | | | 71,549 | | | | 0.013 | | | | 932 | |
| Cerro Negro | | | 33,021 | | | | 0.015 | | | | 499 | |
| In process | | | 33,061 | | | | 0.040 | | | | 1,314 | |
| Subtotal Yanacocha/avg | | | 220,778 | | | | 0.027 | | | | 5,907 | |
| Subtotal Conga project/avg.* | | | 590,855 | | | | 0.021 | | | | 12,582 | |
| Total/average | | | 811,633 | | | | 0.023 | | | | 18,489 | |
| | | Proven and Probable Reserves at December 31, 2015ǂ | |
| | | Tonnage
(thousands of DST) | | | Average Gold Grade
(oz./DST) | | | Ounces Contained
(thousands of ounces) | |
| Quecher Main | | | 96,237 | | | | 0.01 | | | | 1,442 | |
| Marleny | | | 967 | | | | 0.01 | | | | 9 | |
| Yanacocha | | | 3,986 | | | | 0.04 | | | | 152 | |
| Yanacocha Layback | | | 41,356 | | | | 0.01 | | | | 490 | |
| La Quinua Sur | | | 44,790 | | | | 0.01 | | | | 646 | |
| Tapado Oeste Layback | | | 26,428 | | | | 0.04 | | | | 963 | |
| Cerro Negro | | | 6,682 | | | | 0.01 | | | | 89 | |
| Transition Stockpile | | | 5,295 | | | | 0.03 | | | | 145 | |
| Deep Transitional Stockpile | | | 7,317 | | | | 0.06 | | | | 431 | |
| Gold Mill Stockpile | | | 2,639 | | | | 0.08 | | | | 218 | |
| Maqui Maqui Leach Pad | | | 519 | | | | 0.04 | | | | 23 | |
| Carachugo Leach Pad | | | 1,961 | | | | 0.02 | | | | 34 | |
| Yanacocha Leach Pad | | | 87 | | | | 0.03 | | | | 2 | |
| La Quinua Leach Pad | | | 21,981 | | | | 0.02 | | | | 410 | |
| Total | | | 260,244 | | | | 0.02 | | | | 5,057 | |
| ǂ | Proven and probable reserves, as of December 31, 2015, were calculated using a gold price assumption of US$1,200 per ounce. |
* The Conga project’s proven and probable reserves as of December 31, 2012 included 0.6 billion ST of 0.28 percent grade copper.
As of December 31, 2012, the Yanacocha district’s2015, Yanacocha’s total proven and probable reserves (excluding the Conga project’s proven and probable reserves)project, the reserves for which were reclassified as resources or NRM as of December 31, 2015) were estimated to be 5.95.1 million ounces of gold, representing a 23 percent decreasefrom the Yanacocha district’s proven and probable reserves as of December 31, 2011, which were estimated to be 7.7 million ounces of gold. The decreasein reserves of gold was mainly due to mine depletion, and to a lesser extent, to reserve revisions and leach and stockpile inventory changes.
As of December 31, 2012, the Conga project’s proven and probable reserves were estimated to be 12.6 million ounces of gold and 3.3 billion pounds of copper, unchanged from reserves reported in 2011.
As of December 31, 2012,4% increase over Yanacocha’s total proven and probable reserves (including(excluding the Conga project) were estimated to be 18.5million ounces of gold, representing a 9percent decreaseover Yanacocha’s total proven and probable reservesProject) as of December 31, 2011,2014, which were estimated to be 20.34.9 million ounces of gold. Yanacocha’s total proven and probable reserves of copper were 3.3 billion pounds as of December 31, 2012, the same as2015 representing no change from of copper reserves reported as of December 31, 2011.2014.
Based on the current recovery rate and estimated gold production levels in 2012,2015, most of Yanacocha’s proven and probable reserves as of December 31, 20122015 will be depleted by 20152019 unless Yanacocha continues adding reserves to add to its reserves.the production plan (such as the Quecher Main). Yanacocha’s management believes that its prospective land positions and mining concessions provide it with potential for future exploration and additions to its reserves.
| ITEM 4A. | Unresolved Staff Comments |
None.
| ITEM 5. | Operating and Financial Review and Prospects |
In this Item 5, we present information first with respect to Buenaventura, followed by information with respect to Yanacocha, in which we have a 43.65 percent43.65% partnership interest, followed by information with respect to Cerro Verde, in which we have a 19.58 percent19.58% equity interest.
BUENAVENTURA
Introduction
The following discussion should be read in conjunction with the Financial Statements as of December 31, 20112014 and 20122015 and for the years ended December 31, 2010, 20112013, 2014 and 20122015 and the related notes thereto included elsewhere in this Annual Report. The Financial Statements are prepared and presented in accordance with IFRS as issued by the IASB.For periods up to and including the year ended December 31, 2010, we prepared our financial statements in accordance with Peruvian GAAP. Our consolidated financial statements for the year ended December 31, 2011 were the first that we prepared in accordance with IFRS.IASB. Wepresent our financial statements in U.S. Dollars.
A. Operating Results
General
Overview.We were established in 1953 and are one of Peru’s leading producers of gold, silver and other metals. Our consolidated financial statements comprise all of our accounts and those of our subsidiaries, which include: (i) the Julcani, Mallay, Breapampa, Recuperada, Uchucchacua, Orcopampa, Poracota, Antapite and Ishihuinca mining units; (ii) the Colquijirca, Marcapunta, Shila-Paula and La Zanja mines, which are owned through consolidated subsidiaries; (iii) Chaupiloma, which receives a royalty payment from Yanacocha; (iv) Condesa, which is mainly a holding company for investments in us, Yanacocha and other affiliated mining companies; (v) Conenhua, which is mainly engaged in the transmission of electric power to Yanacocha and other mining companies; and (vi) other minor subsidiaries.
| · | the Julcani, Mallay, Breapampa, Uchucchacua, Orcopampa, mining units; |
| · | the Colquijirca, Marcapunta, and La Zanja mines, which are owned through consolidated subsidiaries; |
| · | Chaupiloma, which receives a royalty payment from Yanacocha; |
| · | Condesa, which is mainly a holding company for investments in us, Yanacocha and other affiliated mining companies; |
| · | Conenhua, which is mainly engaged in the transmission of electric power to Yanacocha and other mining companies; |
| · | other minor subsidiaries; and |
| · | discontinued operations. |
We also have material equity investments in (i) Yanacocha, which is an equity investee engaged in the exploitation and commercialization of gold, (ii) Cerro Verde, which is an equity investee engaged in the exploitation and commercialization of copper and (iii) Tantahuatay,Coimolache, which is an equity investee engaged in the exploitation and commercialization of gold and silver. We account for these investments under the equity method.
Yanacocha.A Historically, a substantial part of our net incomeloss before income tax was derived from our equity interest in Yanacocha. We have a 43.65 percent43.65% equity participation in Yanacocha, which is held through our wholly-owned subsidiary, Condesa. Our partnership interest in Yanacocha is accounted for under the equity method and is included under the caption “Investment in associates” on our consolidated balance sheets.statements of financial position. Although Yanacocha has no fixed dividend policy, there is an understanding among the partners that the net income not required for sustaining capital expenditures or future development projects should be distributed after agreement between the two major shareholders, Newmont Mining and us.
Cerro Verde.As of December 31, 2012,2015, we had a 19.58 percent19.58% equity participation in Cerro Verde, which allows us to exercise significant influence over this company. As a result, we account for our investment in Cerro Verde using the equity method. Although Cerro Verde has no fixed dividend policy, there is an understanding that earnings not required for capital expenditures or future development projects are expected to be distributed.
Results of operations. The primary factors affecting our results of operations are (i) the amount of gold, silver, zinc and copper produced and sold by us; (ii) prevailing world market prices for gold, silver, zinc and copper; (iii) commercial terms with respect to the sale of ore concentrates; and (iv) our operating expenses.are:
83 | · | the amount of gold, silver, zinc and copper produced and sold by us; |
| · | prevailing world market prices for gold, silver, zinc and copper; |
| · | commercial terms with respect to the sale of ore concentrates; and |
Gold and silver price hedging. Our revenues and earnings are strongly influenced by world market prices for gold, silver, zinc and copper that fluctuate widely and over which we have no control. Depending upon the metal markets and other conditions, we may from time to time hedge our gold and silver sales in order to decrease our exposure to fluctuations in the prices of these metals. We and our wholly-owned subsidiaries are currently completely unhedged as to the price at which our gold and silver will be sold. As a result, we are fully exposed to the effects of changes in prevailing market prices of gold and silver.
Operating costs and expenses. Operating costs and expenses consist of (i) operating costs, which are direct production costs, the major component of operating expenses; (ii) exploration costs in operational mining sites; (iii) depreciation and amortization expenses; (iv) exploration costs in non-operational mining areas; (v) administrative expenses, which principally consist of personnel expenses; (vi) royalties, which consist of payments to third parties and the Peruvian government to operate leased mining rights; and (vii) selling expenses, which principally consist of freight expenses.of:
| · | operating costs, which are direct production costs, the major component of operating expenses; |
| · | exploration costs in operational mining sites; |
| · | depreciation and amortization expenses; |
| · | exploration costs in non-operational mining areas; |
| · | administrative expenses, which principally consist of personnel expenses; |
| · | royalties, which consist of payments to third parties and the Peruvian government to operate leased mining rights; and |
| · | selling expenses, which principally consist of freight expenses. |
Reserves. We utilize geological mapping, projection of ore-bearing structures, diamond drilling, core logging and chemical assaying, in addition to drifting along previously indicated mineralization, to replace and grow reserves. In addition, we use metallurgical test-work of core and bulk samples as a follow-up activity to prove the amenability of any previously indicated mineralization to certain methods available on site. We continuously analyze this information with respect to tonnage, precious-metals average grades, metallurgical recoveries and economic value and allocate funds preferentially to those projects that have the best potential to sustain or enhance profitable mine production in the near-term. Our mining operations are primarily conducted underground and consist of deposits that are difficult to explore and measure in advance of mining and in which the value or prospects for ore based on geologic evidence exceeds the value based on proved reserves throughout most of the life of mines supported by them, or extramensurate deposits.
In addition, underground mine infrastructure, such as declines, shafts and/or dewatering/ore haulage crosscuts, that facilitate access to ore reserves are constructed and categorized as mine development. We consider such underground mine infrastructure vital to assure sustainable mine production and reserve production. The design, construction and implementation of our underground mine infrastructure are presented and supervised by our Operations Manager with the Board of Directors’ approval. We capitalize mine development and mineral land costs incurred after we have identified proven and probable reserves. Upon commencement of production, we amortize these costs over the expected life of the mining area, based on proven and probable reserves and other factors.
Our other mining operations are smaller and have variable fluctuations in production and reserves due to complexities of the ore located in certain mining operations (such as the Colquijirca mine); the sale of certain mining operations (such as the Huallanca mine); partial and temporary closures of mining operations (such as the Shila-Paula and Recuperada mines); and the production of silver only as by-product of gold (such as the Orcopampa, Antapite and Shila-Paula mines).
Net income and net distributable income.Under Peruvian law, each company is required to establish a legal reserve ofequal to at least 20 percent20% of its paid-in capital on an unconsolidated basis. An annual contribution of at least 10 percent10% of net income must be made until such legal reserve equals 20 percent20% of paid-in capital. The legal reserve may offset losses or be capitalized. However, following any instance in which the reserve is used, Peruvian law calls for mandatory replenishment of the reserve.
Royalties.Royalty expenses consist mainly of payments made by us pursuant to lease agreements relating to mining rights for the Orcopampa and Ishihuinca mines.mine. Specifically, we pay the applicable lessor a royalty of 10 percent10% of the value of the concentrates produced in the Orcopampa mine and 7 percent of the value of the concentrates produced in the Ishihuinca mine.produced. We are also required to pay the Peruvian government mining royalties and taxes. In addition to mining royalties, pursuant to Law No. 29789, effective October 1, 2011, mining operations in Peru are subject to a new extraordinary mining tax. See “Item 4. Information on the Company—Buenaventura—B. Business Overview—Regulatory Framework—Mining Royalties and Taxes.”
Environmental protection laws and related regulations. Our business is subject to Peruvian laws and regulations relating to the exploration and mining of mineral properties, as well as the possible effects of such activities on the environment. We conduct our operations substantially in accordance with such laws and regulations.
Discontinued operations. In 2014, we publicly announced our decision to discontinue operations and sell any remaining assets and equipment at four of our mining units: Poracota, Recuperada, Antapite and Shila-Paula. As a consequence, these mining units are presented in the Financial Statements as mining units held for sale. According to IFRS 5 “Non-current Assets Held for Sale and Discontinued Operations,” the related assets and liabilities are presented in the consolidated statement of financial position at the lower of cost and fair value less cost to sale. See Notes 1(e) and 2.4(x) to the Financial Statements.
Critical Accounting Policies and Estimates
The following is a discussion of our application of critical accounting policies that require our management, or Management, to make certain assumptions about matters that are highly uncertain at the time the accounting estimate is made, and where different estimates that Management reasonably could have used in the current period, or changes in the accounting estimate that are reasonably likely to occur from period to period, would have a material impact on our financial statements. Management has identified the following accounting estimates and policies as critical:
| §· | mineral reserves and resources; |
| §· | mine development costs;unit-of-production depreciation; |
| §· | mine rehabilitation provision; |
| · | impairment of non-financial assets; |
| §· | deferred income tax asset and recoverability; |
| § | accrual for mine closing costs; |
| § | fair value of derivative instruments; |
| § | fair value of the liability related to share-based payment transactions; |
| § | unit-of-production depreciation;taxes; and |
| §· | expected recovery rates used to estimate mineral contained in in-process inventories.fair value of contingent consideration. |
Other significant accounting policies include:
| §· | deferred stripping costs;contingencies; |
| §· | useful life of property, plant and equipment; |
| § | fair value of embedded derivative for concentrates sales;development start date; and |
| §· | revenues.production start date. |
We also have certain accounting policies that we consider to be important, such as our policies for investments carried at fair value, revenue recognition and exploration costs, that do not meet the definition of critical accounting estimates as they do not require Management to make estimates or judgments that are subjective or highly uncertain.
Management has discussed the development and selection of our critical accounting estimates with the Audit Committee of the Board of Directors.
Mineral reserves and resources
Recoverable proven and probable reserves are the part of a mineral deposit that can be economically and legally extracted or produced at the time of the reserve determination. The determination of reserves involves numerous uncertainties with respect to the ultimate geology of the ore bodies, including quantities, grades and recovery rates. Estimating the quantity and grade of reserves requires us to determine the size, shape and depth of our ore bodies by analyzing geological data, such as samplings of drill holes, tunnels and other underground workings. In addition to the geology of our mines, assumptions are required to determine the economic feasibility of mining these reserves, including estimates of future commodity prices and demand, the mining methods we use and the related costs incurred to develop and mine our reserves. The conceptual framework used to estimate proven and probable reserves for our wholly-owned mines as of December 31, 2010 and 20112013 were reviewed by an independent consultant Algon InvestmentInvestments S.R.L. Algon Investment S.R.L. is in the process of reviewing the framework used to estimate proven and probable reserves for our wholly-owned minesGeomineria S.A.C. as of December 31, 2012.2014 and 2015. The conceptual framework used to estimate proven and probable reserves for El Brocal’s mines as of December 31, 20102013 and 20112014 were reviewed by independent consultants, AMEC plc andconsultant MINTEC Inc., respectively. MINTEC Inc.which is in the process of reviewing the conceptual framework used to estimate proven and probable reserves for El Brocal’s mines as of December 31, 2012.2015.
Changes in estimated reserves could affect mainly the depreciation of fixed assets related directly to mining activity, the provision for mine closure, the assessment of the deferred asset’s recoverability and the amortization period for development costs.
Unit-of-production depreciation
Reserves are used in determining the depreciation and amortization of mine-specific assets. This results in a depreciation or amortization charge proportional to the depletion of the anticipated remaining life of mine production. Each mine’s life is assessed annually to evaluate: (i) physical life limitations and (ii) present assessments of economically recoverable reserves of the mine property. These calculations require the use of estimates and assumptions, including the amount of recoverable reserves. Changes are recorded prospectively.
This results in a depreciation/amortization charge proportional to the depletion of the anticipated remaining life-of-mine production. The life of each item, which is assessed at least annually, is determined based on both its physical life limitations and present assessments of economically recoverable reserves of the mine property at which the asset is located. These calculations require the use of estimates and assumptions, including the amount of recoverable reserves. Changes in estimates are accounted for prospectively.
Mine development costsrehabilitation provision
We review and evaluate our accounting policy regardingrecord a provision for mine development costs,closure when a legally enforceable obligation arises, which requires judgment in determining whetheris independent of the full depletion of the mine reserves. Once such an obligation has been appropriately measured, it is likely that future exploitation will result in future economic benefits. The determination of reserves and mineral resources isrecorded by creating a complex estimation that entails varying degrees of uncertainty depending on sub-classification, and these estimates directly impact the point of deferral of exploration and mine development costs and the amortization method for development costs. The deferral policy requires usliability equal to make certain estimates and assumptions about future events or circumstances—in particular, whether an economically viable extraction operation and mineral sale can be established. Estimates and assumptions made may change as new information becomes available. If, after the expenditure is capitalized, information becomes available suggesting that we are unlikely to recover the expenditure, the amount of the obligation and recording a corresponding increase to the carrying amount of the related long-lived asset (mine development cost and property, plant and equipment). Over time, the amount of the obligation changes, impacting recording and accretion expenses. Additionally, the capitalized cost is written offdepreciated and/or amortized based on the useful lives of the related assets.
Any difference in our profit and loss statement forthe settlement of the liability will be recorded in the results of the period in which such settlement occurs. The changes in the new information becomes available.fair value of an obligation or the useful life of the related assets that occur from the revision of the initial estimates should be recorded as an increase or decrease in the book value of each of the obligation and related asset.
Following our accounting treatment, as of December 31, 2015, we have recorded an accrual for mine closure costs of US$166.4 million to comply with governmental requirements for environmental remediation for Buenaventura and its mining subsidiaries. Please see Note 16(b) to the Consolidated Financial Statements.
We assess our provision for closure of mining units annually. This assessment entails significant estimates and assumptions because there are a number of factors that will affect the ultimate liability for this obligation. These factors include estimating the scope and costs of closing activities, technological changes, regulatory changes, increases in costs compared to inflation rates and changes in the discount rates. Such estimates or assumptions may result in actual expenses in the future that differ from the amounts provisioned at the time the provisions were established. The provision at the date of this report presents our best estimate of the present value of future costs for the closure of mining units.
Inventories
Inventories are classified as short-term or long-term depending on the length of time that management estimates will be needed to reach the production state of concentrate extraction for each mining unit.
Net realizable value tests are performed at least annually and represent the estimated future sales price of the product based on prevailing spot metals prices at the reporting date, less estimated costs to complete production and bring the product to sale. Additionally, management also considers the time value of money in calculating the net realizable value of our long-term inventories.
Classified minerals, which are materials with metal content that were removed from the pit of the Colquijirca mining unit for treatment at the expansion operation plant, contain lower grade ore than the average of treated minerals and are available to continue in the process of recovery of mineral and concentrates. Because it is generally impracticable to determine the mineral contained in the classified mineral located in the deposit field near Tajo Norte by physical count, reasonable estimation methods are employed. The quantity of minerals delivered to classified mineral is based on surveyed volumes of mined material and daily production records. Sampling and assaying of blasthole cuttings determine the estimated copper, lead and zinc grades of material delivered to classified minerals.
For minerals outside leach platform inventories, finished and in-progress goods are measured by estimating the number of tons added and removed. The number of contained gold ounces is based on assay data, and the estimated recovery percentage is based on the expected processing method. Tonnages and ounces of mineral are verified by periodic surveys.
For minerals inside leach platform inventories, reasonable estimation methods are employed because it is generally impracticable to determine the mineral contained in leach platforms by physical count. The quantity of material delivered to leach platforms are based on surveyed volumes of mined material and daily production records. Sampling and assaying of blasthole cuttings determine the estimated ore grades of material delivered to leach platforms.
Impairment of non-financial assets
We determine whether the operations of each mining unit are cash generating units, considering each mining unit operation independently. We assess at each reporting date whether there is an indication that an asset may be impaired. If any such indication exists, we estimate the asset’s recoverable amount. An asset’s recoverable amount is the higher of the asset’s fair value less costs to sell and its use value and is determined for an individual asset (cash-generating unit) unless the asset does not generate cash inflows that are clearly independent of those from other assets or groups of assets. These assessments require the use of estimates and assumptions such as long-term commodity prices, discount rates, operating costs, and others.
A cash-generating unit is the smallest identifiable group of assets that generates cash inflows from continuing use that are independent of the cash inflow generated by other assets or groups of assets.
In assessing use value, the estimated future cash flows are discounted to their present value using a discount rate that reflects current market assessments of the time value of money and the risks specific to the asset.
During the fourth quarter of 2010, we updated our assessment of the recoverability of the book value of our long-term assets under the procedures established by IAS 36 – “Impairment of Assets” and reversed the impairment of the Antapite, Recuperada and Poracota mining units as of December 31, 2010 following positive changes in the assumptions used to calculate the impairment provision recorded in order to determine the recovery carrying amount of our long-lived assets. The impairment reversed as of December 31, 2010 amounted to US$13.1 million.
During the fourth quarter of 2011, we updated our assessment of the recoverability of the book value of our long-term assets under the procedures established by IAS 36 – “Impairment of Assets” and identified no impairment indication in our long-lived assets.
During the fourth quarter of 2012,2013, we updated our assessment of the recoverability of the book value of our long-term assets under the procedures established by IAS 36 – “Impairment of Assets” for all of our mining units and as a result we recorded an impairment loss for three of our mining units (Recuperada, Poracota and Antapite), which resulted in the recognition of asset impairment charges ofamounted to US$3.66.6 million (recognized as operating expense). These impairment charges had no impact on our operating cash flows. Cash flows used to assess recoverability of our long-lived assets and measure the carrying value of our mining operations were derived from current business plans using near-term price forecasts reflective of the current environment and Management’s projections for long-term average metal prices and operating costs.
During 2014, we updated our assessment of the recoverability of the book value of our long-term assets under the procedures established by IAS 36 – “Impairment of Assets” for all of our mining units and as a result we recorded an impairment loss for one of our mining units (Shila-Paula), which resulted in the recognition of asset impairment amounted to US$0.8 million (recognized as operating expense). This impairment charge had no impact on our operating cash flows. Cash flows used to assess recoverability of our long-lived assets and measure the carrying value of our mining operations were derived from current business plans using near-term price forecasts reflective of the current environment and Management’s projections for long-term average metal prices and operating costs. As noted above, as of December 31, 2015 and as of the date of this Form 20-F, four of our mining units (Recuperada, Poracota, Shila-Paula and Antapite) were and are held for sale.
During 2015, we updated our assessment of the recoverability of the book value of our long-term assets under the procedures established by IAS 36 – “Impairment of Assets” for all of our mining units and, as a result, we recorded an impairment loss for two of our mining units (La Zanja and Breapampa), which resulted in the recognition of asset impairment amount of US$11.2 million (recognized as an operating expense). These impairment charges had no impact on our operating cash flows. Cash flows used to assess recoverability of our long-lived assets and measure the carrying value of our mining operations were derived from current business plans using near-term price forecasts reflecting of the current environment and Management’s projections for long-term average metal prices and operating costs.
Our asset impairment evaluations required us to make several assumptions in the discounted cash flow valuation of (i) our individual mining operations, including near and long-term metal price assumptions, production volumes, estimates of commodity-based and other input costs and (ii) proven and probable reserve estimates, including any costs to develop the reserves and the timing of producing the reserves, as well as the appropriate discount rate. Our December 31, 20112013, 2014 and 20122015 impairment evaluation was based on price assumptions reflecting prevailing metals prices for the following four years.
We believe events that could result in additional impairment of our long-lived assets include, but are not limited to, (i) decreases in future metal prices, (ii) decreases in estimated recoverable proven and probable reserves and (iii) any event that might otherwise have a material effect on mine site production levels or costs.
Deferred income tax asset and recoverability
In preparing our annual consolidated financial statements, we estimate the actual amount of taxes currently payable or receivable as well as deferred tax assets and liabilities attributable to temporary differences between the tax and book bases of assets and liabilities. Deferred income tax assets and liabilities are measured using tax rates applicable to taxable income in the years in which these temporary differences are expected to be recovered or settled. The effect on deferred tax assets and liabilities of a change in tax rates and laws is recognized in income in the period in which such changes are enacted.
All deductible temporary differences and loss carry-forwards generate the recognition of deferred assets to the extent that it is probable that they can be used in calculating taxable income in future years. Deferred income tax liability is recognized for all deductible temporary differences and tax loss carry-forwards, to the extent that it is probable that taxable profit will be available against which the deductible temporary differences and unused tax losses can be utilized. The carrying amount of the deferred income tax asset is reviewed at each consolidated statement of financial position date and reduced to the extent that it is no longer probable that sufficient taxable profit will be available to allow all or part of the deferred asset to be utilized. Unrecognized deferred assets are reassessed at each consolidated statement of financial position date.
Deferred assets and liabilities are offset if there is a legal right to set them off and the taxes deferred relate to the same entity and the same tax authority.
Deferred tax assets, including those resulting from unused tax losses, require that we assess the likelihood that we would generate taxable earnings in future periods to apply the deferred tax assets. Estimated future taxable income is based on projections of cash flow from operations and application of the tax law existing in each jurisdiction. To the extent to which actual future cash flows and taxable income differ significantly from those estimated, our ability to realize the deferred tax assets posted as of the reporting date may be affected.
In addition, future changes in the tax law in jurisdictions where we operate could limit our ability to obtain tax deductions in future periods.
AtAs of December 31, 2012, 20112015, 2014 and 2010,2013, our valuation allowance totaled US$5.318.2 million, US$3.84.2 million, and US$2.6 million, respectively.6.4 million.
Fair Value of contingent consideration
Inventories
Inventories are classifiedThe contingent consideration arising from a business combination is measured at fair value at the date of acquisition, as short-term or long-term depending on the length of time that management estimates will be needed to reach the production state of concentrate extraction for each mining unit.
Net realizable value tests are performed at least annually and represent the estimated future sales pricepart of the product based on prevailing spot metals pricesbusiness combination. If the contingent consideration is eligible to be recognized as a financial liability the fair value is subsequently re-measured at the reportingeach date less estimated costs to complete production and bring the product to sale. Additionally, management also considers the time value of money in calculating the net realizable value of our long-term inventories.
Classified minerals, which are materials with metal content that were removed from the pit of the Colquijirca mining unit for treatment at the expansion operation plant, contain lower grade ore than the average of treated minerals and are available to continue in the process of recovery of mineral and concentrates. Because it is generally impracticable to determine the mineral contained in the classified mineral located in the deposit field near Tajo Norte by physical count, reasonable estimation methods are employed. The quantity of minerals delivered to classified mineral is based on surveyed volumes of mined material and daily production records. Sampling and assaying of blasthole cuttings determine the estimated copper, lead and zinc grades of material delivered to classified minerals.
For minerals outside leach platform inventories, finished and in-progress goods are measured by estimating the number of tons added and removed. The number of contained gold ounces is based on assay data, and the estimated recovery percentage is based on the expected processing method. Tonnages and ounces of mineral are verified by periodic surveys.
For minerals inside leach platform inventories, reasonable estimation methods are employed because it is generally impracticable to determine the mineral contained in leach platforms by physical count. The quantity of material delivered to leach platforms are based on surveyed volumes of mined material and daily production records. Sampling and assaying of blasthole cuttings determine the estimated ore grades of material delivered to leach platforms.
Accrual for mine closing costs
We record a provision for mine closure when a legally enforceable obligation arises, which is independent of the full depletion of the mine reserves. Once such an obligation has been appropriately measured, it is recorded by creating a liability equal to the amount of the obligation and recording a corresponding increase to the carrying amount of the related long-lived asset (mine development cost and property, plant and equipment). Over time, the amount of the obligation changes, impacting recording and accretion expenses. Additionally, the capitalized cost is depreciated and/or amortized based on the useful lives of the related assets.
Any difference in the settlement of the liability will be recorded in the results of the period in which such settlement occurs. The changes inconsolidated financial statements. Determining the fair value of an obligation or the useful lifecontingent consideration is based on a model of discounted future cash flows. The key assumptions take into account the likelihood of achieving each goal of financial performance as well as the discount factor.
Segment Reporting
Management has determined its operating segments based on reports that the Company’s Chief Operating Decision Maker (the “CODM”) uses for making decisions. The Company’s operations are organized into business units based on its products and services, activities and geographic locations. The broad categories of the related assets that occur fromCompany’s business units are:
| · | Production and sale of minerals; |
| · | Exploration and development activities; |
| · | Construction and engineering services; |
| · | Energy generation and transmission services; |
| · | Rental of mining concessions; |
| · | Holding of investment in shares (mainly in Yanacocha and Chaupiloma); and |
The CODM monitors the revisionoperating results of the initial estimates should be recorded as an increasebusiness units separately for the purpose of making decisions about resource allocation and performance assessment. Segment performance is evaluated based on operating profit or decreaseloss and is measured consistently with operating profit or loss in the book value of the obligation and related asset.
Following our accounting treatment, we have recorded an accrual for mine closure costs of US$99.4 million, as of December 31, 2012 in order to comply with governmental requirements for environmental remediation.
We assess our provision for closure of mining units annually. It is necessary to make significant estimates and assumptions in determining this provision because there are a number of factors that will affect the ultimate liability for this obligation. These factors include estimating the scope and costs of closing activities, technological changes, regulatory changes, increases in costs compared to inflation rates and changes in the discount rates. Such estimates or assumptions may result in actual expenses in the future that differ from the amounts provisioned at the time the provisions were established. The provision at the date of this report presents our best estimate of the present value of future costs for the closure of mining units.
Fair value of derivative financial instruments
Outstanding derivative contracts.We recognize derivative instruments as assets or liabilities, measured at their fair value, in our consolidated statements of financial position pursuant to IAS 39, “Financial Instruments — Recognition and Measurement.”
Subsidiary derivative contracts. During 2010 and 2011, our indirect subsidiary, El Brocal, entered into price-hedgingoption contracts at zero cost to protect future cash flows derived from sales in 2011 and 2012. Derivative contracts are recognized as assets and liabilities at fair value in theCompany’s consolidated financial statements. El Brocal applies hedge accountingAlso, the Company’s financing and income taxes are managed at the corporate level and are not allocated to the operating segments, except for those transactions that meet the specific criteria applicable in accordance with IAS-39. As of December 31, 2012, El Brocal was not a party to any hedging transactions and had no outstanding hedging commitments.
Our derivative contracts. As of December 31, 2010, 2011 and 2012, neither we nor any of our wholly-owned subsidiaries held gold derivative contracts.
Fair value of the liability related to long-term officer compensation
Our senior executive officersentities which are granted share appreciation rights, which can only be settled in cash, if the executive is working for us at each program’s settlement date. These programs are mainly structured in a ten-year term, allocated in several programs with progressive maturities. The average price of the granted share appreciation rights is assigned based on last quarter market quotation of the shares before the grant date and the settlement price is determined based on the variation of the market prices at the maturity date as compared to the price at the date of the grant.
We used the Turnbull & Wakeman Method to estimate the fair value of this liability and the principal assumptions made are as follows: the historical volatility, risk-free interest rate, dividend yield, period covered by the program and market value of the shares at closing.managed independently. See Note 1431 to the Financial Statements.
Contingencies
Contingent liabilities, when identified, are assessed as either remote, possible or probable. Contingent liabilities are recorded in the consolidated financial statements when it is probable that future events will confirm them and when their amount can be reasonably estimated. Contingent liabilities deemed as possible are only disclosed, together with a possible debit range, when determinable, in notes to the Financial Statements.
Contingent assets are not recognized in the financial statements; however, they may be disclosed in notes to the financial statements if it is probable that such contingent assets will be realized. See Note 3029(f) and (g) to the Financial Statements.
Determining contingencies inherently involves the exercise of judgment and calculation of the estimated outcomes of future events.
Development start date
We assess the status of each exploration project of our mining units to determine when the development phase begins. One of the criteria used to evaluate the development start date is when we determine that the property can be economically developed.
Production start date
We assess the stage of each mine under development to determine when a mine moves into the production stage. The criteria used to assess the start date are determined based on the nature of each mining project, the complexity of a plant and its location. We consider various relevant criteria for assessing when the mine is substantially complete and ready for its planned use. Some of these criteria are the level of capital expenditure compared to development cost estimates, a reasonable testing period for the mine’s plant and equipment and the ability to produce ongoing production of metal.
When a mine development project moves into the production stage, the capitalization of certain costs ceases, and they are considered as inventory or expenses, except for costs that qualify for capitalization relating to mining asset additions or improvements, underground mine development or mineable reserve development. It is also at this point that depreciation or amortization commences.
Unit-of-production depreciation
Reserves are used in determining the depreciation and amortization of mine-specific assets. This results in a depreciation or amortization charge proportional to the depletion of the anticipated remaining life of mine production. Each mine’s life is assessed annually to evaluate: (i) physical life limitations and (ii) present assessments of economically recoverable reserves of the mine property. These calculations require the use of estimates and assumptions, including the amount of recoverable reserves. Changes are recorded prospectively.
Depreciation and amortization of assets whose useful life is longer than the life of the mine is calculated on a unit-of-production basis over the economically recoverable reserves of the mine. Depreciation and amortization of assets whose useful life is shorter than the life of the mine is calculated using the straight-line method.
The units of production are measured in recoverable metric tons of concentrate. The unit-of-production rate for depreciation and amortization takes into account expenditures incurred to date.
Expected recovery rates used to estimate mineral contained in in-process inventories
For determining the quantity of mineral contained in the products in process we use a reasonable methodology to estimate the mineral content that is treated at the date of the consolidated financial statement. The amount of mineral added in the products in process is determined by the sampling of mill volumes and the daily production records. The sampling and assays determine the head grade of the mineral added to the products in process.
The recovery rates for leach platforms in process are determined by metallurgical sampling. The mineral recoverability of the leach platforms, once the production process begins, can be reasonably estimated. The rate is determined using pilot laboratory tests, historic trends and others factors. Process and recovery rates are monitored continuously, and recovery rates are adjusted periodically as additional information becomes available and as related technology changes.
Deferred stripping cost
Stripping costs incurred in the development of a mine before production commences are capitalized as part of the cost of constructing the mine and subsequently amortized over the life of the mine on a unit-of-production basis.
Where a mine operates several open pits that are regarded as separate operations for the purpose of mine planning, stripping costs are accounted for separately by reference to the ore from each separate pit. If, however, the pits are highly integrated for the purpose of the mine planning, the second and subsequent pits are regarded as extensions of the first pit in accounting for stripping costs. In such cases, the initial stripping (i.e., overburden and other waste removal) of the second and subsequent pits is considered to be production-phase stripping relating to the combined operation.
Deferred stripping cost is included in “Mining rights, development cost and property, plant and equipment, net” caption in the consolidated statement of financial position. These form part of the total investment in the relevant cash generating units, which are reviewed for impairment if events or changes of circumstances indicate that the carrying value may not be recoverable.
The stripping costs incurred during the production phase are recognized as an operating expense when they are incurred. Theses costs of products are included as part of the cost of inventory.
Useful life of property, plant and equipment
Straight-line method
Depreciation is calculated under the straight-line method of accounting considering the lower of estimated useful lives of the asset or estimated reserves of the mining unit. The useful lives are the following:
| Property, Plant and Equipment | | Estimated Years of Useful Life | |
| | | |
Buildings, constructionconstructions and other | | | Between 6 and 20 | |
| Machinery and equipment | | | Between 5 and 10 | |
| Transportation units | | | 5 | |
| Furniture and fixtures | | | 10 | |
| Computer equipment | | | 4 | |
An item of property, plant and equipment is de-recognized upon disposal or when no future economic benefits are expected from its use or disposal. Any gain or loss arising from de-recognizing an asset (calculated as the difference between the proceeds from the sale and the book value of the asset) is included in the consolidated income statement of profit or loss in the year the asset is de-recognized.
The asset’s residual value, useful lives and methods of depreciation are reviewed, and adjusted if appropriate, at each financial year end.Revenues
According to our accounting policies, revenue is recognized to the extent that it is probable that the economic benefits will flow to us. Revenue is measured at the fair value of the consideration received, excluding discounts and other sales taxes or duty.
Revenues from sales of concentrates, gold and silver are recognized when the significant risks and rewards of ownership have been transferred, which is considered to occur when title passes to the customer. This generally occurs when the product is physically transferred to the buyer.
Revenues for engineering services rendered by BISA are recognized based on the progress of the current service contracts.
Revenues for construction services rendered by BISA Construction S.A. are recognized when the outcome of a contract can be estimated reliably. Contract revenue associated with a construction contract is recognized by reference to the stage of completion of the contract activity at the end of the reporting period.
Fair value of embedded derivative for concentratesconcentrate sales
Substantially all of our concentrate sales contracts provide final copper pricing in a specified period (generally one to four months from the shipment date) based on quoted LME prices. We ultimately receive market prices based on prices in the specified future period;period, however, the accounting rules applied to these sales result in changes recorded as revenue until the specified future period. We record revenues and invoice customers at the time of shipment based on the current LME prices, which result in an embedded derivative on our provisional priced concentrate sales that are adjusted to fair value through earnings of each period until the date of final pricing. To the extent final prices are higher or lower than what was recorded on a provisional basis, an increase or decrease to revenues is recorded in each reporting period until the date of final pricing. See Notes 1821(a) and 27(c)32(b) to the Financial Statements.
Revenues
According to our accounting policies, revenue is recognized to the extent that it is probable that the economic benefits will flow to us. Revenue is measured at the fair value of the consideration received, excluding discounts and other sales taxes or duty.
Revenues from sales of concentrates, gold and silver are recognized when the significant risks and rewards of ownership have been transferred, which is considered to occur when title passes to the customer. This generally occurs when the product is physically transferred to the buyer.
Revenues for engineering services rendered by Buenaventura Ingenieros S.A. are recognized based on the progress of the current service contracts.
Revenues for construction services are recognized when the outcome of a contract can be estimated reliably. Contract revenue associated with a construction contract is recognized by reference to the stage of completion of the contract activity at the end of the reporting period.
Results of Operations for the Years Ended December 31, 20122015 and 20112014
Net sales.sales of goods. Net salesincreased of goods decreased by 0.16 percent,18.95%, from US$1,493.91,067.3 million in 20112014 to US$1,496.3865.0 million in 2012, principally due to anincrease in the average realized prices of gold and increases in the volume of silver, lead and zinc sold, partially offset bylower volumes of gold and copper sold.2015. The following tables reflect the average realized priceprices and volume soldvolumes of gold, silver, lead, zinc and copper sold during the years ended December 31, 20112014 and 2012:2015, as well as the variation in such average realized prices and volumes recorded for the year ended December 31, 2015 as compared to the year ended December 31, 2014:
| Average Realized Price | | Year ended December 31, | | | | |
| | | 2011 | | | 2012 | | | Variation | |
| | | | | | | | | | |
| Gold (US$/oz.) | | US$ | 1,574.45 | | | US$ | 1,678.92 | | | | 6.64 | % |
| Silver (US$/oz.) | | | 35.36 | | | | 31.25 | | | | (11.62 | )% |
| Lead (US$/MT) | | | 2,262.34 | | | | 2,064.65 | | | | (8.74 | )% |
| Zinc (US$/MT) | | | 2,199.72 | | | | 1,919.04 | | | | (12.76 | )% |
| Copper (US$/MT) | | | 8,567.64 | | | | 7,937.08 | | | | (7.36 | )% |
| Volume Sold | | Year ended December 31, | | | | |
| | | 2011 | | | 2012 | | | Variation | |
| | | | | | | | | | |
| Gold (oz.) | | | 505,894 | | | | 439,816 | | | | (13.06 | )% |
| Silver (oz.) | | | 14,843,193 | | | | 17,474,113 | | | | 17.72 | % |
| Lead (MT) | | | 18,192 | | | | 25,589 | | | | 40.66 | % |
| Zinc (MT) | | | 33,307 | | | | 43,180 | | | | 29.64 | % |
| Copper (MT) | | | 23,231 | | | | 22,373 | | | | (3.69 | )% |
| Average Realized Price | | Year ended December 31, | |
| | | 2014 | | | 2015 | | | Variation* | |
| | | | |
| Gold (US$/oz.) | | | 1,263.32 | | | | 1,151.45 | | | | (8.86 | )% |
| Silver (US$/oz.) | | | 18.65 | | | | 15.06 | | | | (19.25 | )% |
| Lead (US$/t) | | | 2,106.87 | | | | 1,711.87 | | | | (18.75 | )% |
| Zinc (US$/t) | | | 2,243.76 | | | | 1,838.86 | | | | (18.05 | )% |
| Copper (US$/t) | | | 6,737.78 | | | | 4,514.93 | | | | (32.99 | )% |
| Volume Sold | | Year ended December 31, | |
| | | 2014 | | | 2015 | | | Variation* | |
| | | | | | | | | | |
| Gold (oz.) | | | 439,093 | | | | 380,899 | | | | (13.25 | )% |
| Silver (oz.) | | | 19,088,923 | | | | 21,023,873 | | | | 10.14 | % |
| Lead (t) | | | 18,820 | | | | 32,389 | | | | 72.10 | % |
| Zinc (t) | | | 21,231 | | | | 55,529 | | | | 161.55 | % |
| Copper (t) | | | 40,263 | | | | 29,094 | | | | (27.74 | )% |
(a) Gold salessales.. The average Average realized sales priceprices for gold increaseddecreased from US$1,574.451,263.32 per ounce in 20112014 to US$1,678.921,151.45 per ounce in 2012.2015. Gold sales volume decreased from 505,894ounces in 2011 to 439,816439,093 ounces in 2012, primarily2014 to 380,899 ounces in 2015, mainly due to a decreased gold production at our Poracota and AntapiteBreapampa mining units. Theseunit. The combined effect of these changes resulted in a US$52.9112.5 million decrease in income from sales of gold in 20122015 as compared to 2011.2014.
(b) Silver sales. Average realized sales prices for silver prices decreased from US$35.3618.65 per ounce in 20112014 to US$31.2515.06 per ounce in 2012. The2015. Silver sales volume of silver sales increased from 14,843,19319,088,923 ounces in 20112014 to 17,474,11321,023,873 ounces in 2012, primarily2015, mainly due to increased silver production at our Uchucchacua, Colquijirca and ColquijircaJulcani mining units. TheseThe combined effect of these changes resulted in a US$18.638.5 million increasedecrease in income from sales of silver in 20122015 as compared to 2011.2014.
(c) Lead sales.Average realized sales prices for lead prices decreased from US$2,262.342,106.87 per metric ton in 20112014 to US$2,064.651,711.87 per metric ton in 2012. Additionally, the2015.Lead sales volume of lead sold increased from 18,192 metric18,820 tons in 20112014 to 25,589 metric32,389 tons in 2012, primarily2015, mainly due to increased lead production at our Colquijirca mining unit. The combined effect of these changes resulted in a US$15.916.3 million increase in income from sales of lead in 2012 compared to 2011.
(d) Zinc sales.Average realized zinc prices decreased from US$2,199.72 per metric ton in 2011 to US$1,919.04 per metric ton in 2012. The volume of zinc sold increased from 33,307 metric tons in 2011 to 43,180 metric tons in 2012, primarily due to increased zinc production at our Uchucchacua and Mallay mining units. The combined effect of these changes resulted in a US$10.8 million increase in income from sales of zinc in 2012 compared to 2011.
(e) Copper sales.Average copper prices decreased from US$8,567.64 per metric ton in 2011 to US$7,937.08 per metric ton in 2012. The volume of copper sold decreased from 23,231 metric tons in 2011 to 22,373 metric tons in 2012, largely due to decreased copper production at our Colquijirca mine. These changes resulted in a US$15.6 million decrease in income from sales of copper in 2012 compared to 2011.
The revenues from gold, silver, lead, zinc and copper mentioned above do not include refinery charges and penalties incurred, which amounted to US$147.9 million in 2012, compared to US$127.9million in 2011.
Royalty income. In 2012, royalty income received by our subsidiary, Chaupiloma, amounted to US$67.2 million, representing a7 percent increasefrom the US$62.7 million of royalty income received in 2011. This increase is attributed to increased sales by Yanacocha in 2012, which resulted primarily from an increase in the average realized price of gold and an increase in Yanacocha’s production. See Note 31(a) to the Financial Statements. Yanacocha pays Chaupiloma, in which we directly and indirectly hold a 60 percent interest, a royalty equal to 3 percent of Yanacocha’s net sales.
Total operating costs. Total operating costsincreasedby32 percent, from US$712.2 million in 2011to US$943.2 in 2012, due to the following:
(a) Cost of sales, without considering depreciation and amortization,increasedby41 percent, from US$446.2million in 2011to US$629.5 million in 2012, mainly due to a US$100.9 million increase in services provided by third parties and a US$32.9 million increase as a result of spare parts and supplies. The increase was mainly due to: (i) a US$54.6 million increase in the cost of the inventories held at the beginning of 20122015 as compared to the beginning of 2011 (ii) a US$44.3 million increase reflecting the impact of costs incurred in connection with commencing operations at our Mallay and Breapampa mining units; and (iii) a US$36.6 million increase reflecting an increase in the services and raw materials provided by contractor suppliers at our Orcopampa and Uchucchacua mining units due to an increase in exploration activities and diamond drilling works in order to maintain our ore reserves level and an increase in cost related to the higher volume of mineral treated in 2012.2014.
(b) Exploration in units in operation increased by 40 percent, from US$109.4 million in 2011to US$153.0 million in 2012. These increasedcosts were principally due to anincrease in exploration projects at our Orcopampa, Poracota, Uchucchacua, Mallay and Antapite mines. See Note 20 to the Financial Statements.
(c) Depreciation and amortization costsincreased by28 percent, from US$96.4 million in 2011to US$123.0 million in 2012, mainly due to: (i) a US$13.4 million increase inthe depreciation and amortization of the tailing areas put into operationat our Colquijirca mining unit during 2012 and (ii) a US$9.9 million increase in acquired assets put into operation during 2012 at our La Zanja mining unit.
(d)Royalty expenses to third parties and the Peruvian governmentdecreased by37 percent, from US$60.3 million in 2011to US$37.7 million in 2012. Royalties paid to third parties amounted to US$32.0 million and US$35.2 million in 2011 and 2012, respectively. Royalties paid to the Peruvian government amounted to US$28.2 million and US$2.5million in 2011 and 2012, respectively. Thedecreasein royalties paid to third parties and the Peruvian government was mainly due to Peruvian legislative changes. Peruvian legislation requires owners of mining concessions to pay the Peruvian government for the exploitation of metallic and non-metallic resources. Prior to October 1, 2011, mining royalties were calculated with rates ranging from 1 to 3 percent of the value of mineral concentrates or the equivalent, according to the quoted market price published by the Ministry of Energy and Mines. Beginning on October 1, 2011, the Peruvian government instituted a new mining royalty and tax regime.See “Item 4. Information on the Company—Buenaventura—B. Business Overview—Regulatory Framework—Mining Royalties and Taxes” for additional information regarding the mining royalties and taxes now applicable to us.
Total operating expenses. Operating expensesincreased by44 percent, from US$140.1 million in 2011to US$202.1 million in 2012, due to changes in the following components:
(a) Administrative expensesincreased by32 percent, from US$75.2million in 2011to US$99.3 million in 2012, mainly due to (i) a US$7.7 million increase in expenses recorded for long-term officers’ compensation (stock appreciation rights) and (ii) a US$5.7 million increase in other management expenses related to foreign engineering consulting services.See Note 22 to the Financial Statements.
(b) Exploration in non-operational areasincreased by92 percent, from US$49.6 million in 2011to US$95.5 million in 2012, due to higher expenditures in exploration areas, primarily Shila, Trapiche, San Gregorio and Chancas.See Note 23 to the Financial Statements.
(c) Impairment of long-lived assets resulted in a loss of US$3.6 million being recorded in 2012. We evaluated our long-lived assets for impairment as of December 31, 2012, which resulted in a reduction in the carrying amount of mining concessions, development costs and property, plant and equipment to their recoverable amount. See Note 11 to the Financial Statements.
Operating income. As a result of the foregoing, operating incomedecreased by41 percent, from US$704.4 million in 2011to US$418.2 million in 2012.
Share in the results of related parties under equity method. Income from equity investments in related partiesdecreased by1 percent, from US$468.4 million in 2011to US$464.2 million in 2012, principally due to decreases in income from our equity investments in Yanacocha and Cerro Verde, partially offset by the effect of an increase in income from our equity investment in Coimolache. Income from our interest in Yanacocha decreased by 2 percent, from US$279.7 million in 2011 to US$272.9 million in 2012.Income from our interest in Cerro Verde decreased by 28 percent, from US$208.7 million in 2011 to US$151.2 million in 2012. Income from our interest in Coimolache increased from US$9.6 million in 2011 to US$40.2 million in 2012, due to the impact of increased gold production at the Tantahuatay mine.
Income tax. Provision for income taxdecreased from US$211.6 million in 2011to US$142.6 million in 2012, principally due to a US$286.7 million decrease in pre-tax income, from US$1,172.1 million in 2011 to US$885.4 million in 2012.
Non-controlling interest. Non-controlling interest expense decreased by 43 percent, from US$101.6 million in 2011 to US$58.1 million in 2012, mainly due to a decrease in contribution of profits from El Brocal and La Zanja, partially offset an increase in contribution of profits from Chaupiloma.
Net income. As a result of the foregoing, net income decreased by 20 percent, from US$858.9 million in 2011 to US$684.7 million in 2012. As a percentage of net sales, net income was 44 percent in 2012 as compared to 55 percent in 2011.
Results of Operations for the Years Ended December 31, 2011 and 2010
Net sales. Net salesincreased by 43 percent, from US$1,047.9 million in 2010 to US$1,493.9 million in 2011, principally due to anincrease in the average realized prices of gold and silver and increases in the volume of gold, silver and copper sold, partially offset bylower volumes of other base metals sold. The following tables reflect the average realized price and volume sold of gold, silver, lead, zinc and copper during the years ended December 31, 2010 and 2011:
| Average Realized Price | | Year ended December 31, | | | | |
| | | 2010 | | | 2011 | | | Variation | |
| | | | | | | | | | |
| Gold (US$/oz.) | | US$ | 1,253.35 | | | US$ | 1,574.45 | | | | 25.62 | % |
| Silver (US$/oz.) | | | 20.86 | | | | 35.36 | | | | 69.51 | % |
| Lead (US$/MT) | | | 2,106.41 | | | | 2,262.34 | | | | 7.40 | % |
| Zinc (US$/MT) | | | 2,135.57 | | | | 2,199.72 | | | | 3.00 | % |
| Copper (US$/MT) | | | 8,113.56 | | | | 8,567.64 | | | | 5.60 | % |
| Volume Sold | | Year ended December 31, | | | | |
| | | 2010 | | | 2011 | | | Variation | |
| | | | | | | | | | |
| Gold (oz.) | | | 461,817 | | | | 505,894 | | | | 9.54 | % |
| Silver (oz.) | | | 13,176,383 | | | | 14,843,193 | | | | 12.65 | % |
| Lead (MT) | | | 22,970 | | | | 18,192 | | | | (20.80 | )% |
| Zinc (MT) | | | 43,562 | | | | 33,307 | | | | (23.54 | )% |
| Copper (MT) | | | 15,946 | | | | 23,231 | | | | 45.69 | % |
(a) Gold sales. The average sales price for gold increased from US$1,253.35 per ounce in 2010 to US$1,574.45 per ounce in 2011. Gold sales volume increased from 461,817 ounces in 2010 to 505,894ounces in 2011, primarily due to the impact of a full year of gold production at our La Zanja mining unit, partially offset by decreased gold production at our Orcopampa mining unit. These changes resulted in a US$212.8 million increasein income from sales of gold in 2011 compared to 2010.
(b) Silver sales. Average realized silver prices increased from US$20.86 per ounce in 2010 to US$35.36 per ounce in 2011. The volume of silver sales increased from 13,176,383 ounces in 2010 to 14,843,193 ounces in 2011, primarily due to increased silver production at our Julcani and Colquijirca mining units. These changes resulted in a US$251.8 million increase in income from sales of silver in 2011 compared to 2010.
(c) Lead sales. Average realized lead prices increased from US$2,106.41 per metric ton in 2010 to US$2,262.34 per metric ton in 2011. Additionally, the volume of lead sold decreased from 22,970 metric tons in 2010 to 18,192 metric tons in 2011. The combined effect of these changes resulted in a US$10.0 million decrease in income from sales of lead in 2011 compared to 2010.
(d) Zinc sales. Average realized sales prices for zinc pricesdecreased from US$2,243.76 per ton in 2014 to US$1,838.86 per ton in 2015. Zinc sales volume increased from US$2,135.57 per metric ton in 2010 to US$2,199.72 per metric ton in 2011. The volume of zinc sold decreased from 43,562 metric21,231 tons in 20102014 to 33,307 metric55,529 tons in 2011, primarily2015, mainly due to decreasedincreased zinc production at our Colquijirca mining unit. The combined effect of these changes resulted in a US$20.855.2 million increase in income from sales of zinc in 2015 as compared to 2014.
(e) Copper sales. Average realized sales prices for copper decreased from US$6,737.78 per ton in 2014 to US$4,514.93 per ton in 2015. Copper sales volume decreased from 40,263 tons in 2014 to 29,094 tons in 2015, mainly due to decreased copper production at our Colquijirca mining unit. The combined effect of these changes resulted in a US$139.9 million decrease in income from sales of copper in 2015 as compared to 2014.
Net sales of goods figures are obtained by deducting the refinery charges and penalties incurred (a total of US$196.2 million of refinery charges and penalties were incurred in 2015, compared with US$184.5 million incurred in 2014) and revenues from mining units held for sale (a total of US$0.4 million revenues provided from mining units held for sales in 2015, compared with US$5.1 million provided in 2014) from the gross sales of all metals sold. See Note 21(a) to the Financial Statements.
Sales of servicesdecreased by 23.9%, from US$71.6 million in 2014 to US$54.5 million in 2015, mainly due to a US$18.1 million decrease in sales of services in our construction and engineering segments, a result of a reduction in the number of contracts related to the development and construction of mining projects in 2015.
Royalty income. In 2015, royalty income received by our subsidiary Chaupiloma amounted to US$32.4 million, representing a 12.1% decrease from the US$36.9 million in royalty income received in 2014. This decrease was due to a decrease in 2015 in the net sales of Yanacocha, which was primarily due to a decrease in the average realized price of gold and a decrease in production at Yanacocha. We hold a 60% interest in Chaupiloma, to which Yanacocha pays a royalty that corresponds to three percent of its net sales.
Total operating costs. Total operating costs increased by 0.2%, from US$949.5 million in 2014 to US$951.8 million in 2015, due to changes in the following components:
(a) Cost of sales of goods, excluding depreciation and amortization, increased by 0.87%, from US$533.0 million in 2014 to US$537.7 million in 2015.
(b) Cost of services, excluding depreciation and amortization, decreased by 35.3% from US$81.5 million in 2014 to US$52.7 million in 2015, which was mainly due to costs from our construction and engineering unit decreasing by US$20.5 million as a result of lower net sales and a lower headcount.
(c) Exploration in operating units decreased by 6.5%, from US$97.9 million in 2014 to US$91.5 million in 2015. This decrease was primarily due to a decrease of US$10.1 million in diamond drilling activities at the Orcopampa mining unit, which was partially offset by an increase of US$1.7 million and US$1.3 million at the Julcani and Breapampa mining units, respectively, due to increased exploration efforts. See Note 23 to the Consolidated Financial Statements.
(d) Depreciation and amortization costs increased by 16.2%, from US$208.7 million in 2014 to US$242.5 million in 2015, mainly due to:
| · | higher depreciation and amortization costs incurred in the La Zanja mining unit of US$51.8 million, which increased from US$53.2 million in 2014 to US$105.0 million in 2015 as a result of the decrease in the reserves during 2015. |
| · | higher depreciation and amortization costs incurred in the Colquijirca mining unit of US$18.7 million, which increased from US$27.0 million in 2014 to US$45.7 million in 2015 as a result of the capitalization of the expansion project at the beginning of 2015. |
| · | lower depreciation costs incurred in the Breapampa mining unit of US$25.8 million, which decreased from US$35.7 million in 2014 to US$9.9 million in 2015 due to the lower operations during 2015. |
| · | lower depreciation and amortization costs incurred in the Orcopampa and Mallay mining units of US$6.0 million and US$9.3 million, respectively, which decreased from US$48.0 million in 2014 to US$32.7 million in 2015 as a result of changes in the reserves during 2015. |
(e) Mining Royalties decreased by 3.6%, from US$28.4 million in 2014 to US$27.4 million in 2015. Royalties paid to third parties by Orcopampa amounted to US$21.7 million and US$21.9 million in 2014 and 2015, respectively. Royalties paid to the Peruvian government amounted to US$6.7 million and US$5.5 million in 2014 and 2015, respectively. The increase in royalties paid to third parties are explained by the higher production in Orcopampa, partially offset by the decrease in the price of gold in 2015. The decrease in royalties paid to Peruvian government was primarily due to the decrease in the price of gold in 2015, compared with 2014.
Total operating expenses. Operating expenses decreased by 10.3%, from US$164.7 million in 2014 to US$147.7 million in 2015, due to changes in the following components:
(a) Administrative expenses decreased by 14.4%, from US$101.1 million in 2014 to US$86.5 million in 2015, mainly due to:
| · | a decrease of US$8.3 million in the construction and engineering unit due to a decrease in the contracts during 2015; |
| · | a decrease of US$3.7 million in the La Zanja mining unit due to a provision for environmental contingencies for US$4.3 million recorded in 2014; and |
| · | a decrease of US$5.2 million in the Breapampa mining unit due to the reduction of operations during 2015 in line with the depletion of its reserves. |
(b) Exploration in non-operating areas decreased by 38.8 percent, from US$50.0 million in 2014 to US$30.6 million in 2015 due to decreased expenditures in exploration activities beginning in 2014, primarily in the Tambomayo and Alejandra projects. See Note 26 to the Financial Statements.
(c) Impairment loss of long-lived assets increased by US$11.2 million as a result of our assessment of the recoverability of the book value of our long-term assets under the procedures established by IAS 36 for two of our mining units (La Zanja and Breapampa).
Operating profit (loss). As a result of the foregoing, we generated an operating profit of US$61.6 million in 2014 compared to an operating loss of US$147.6 million in 2015.
Other income (expense), net. Other income (expenses), net increased by 680.0% from US$26.1 million in 2014 to US$203.7 million in 2015, mainly explained by:
(a) Share in the results of associates under equity method. Loss from equity investments in associates increased by 132.4%, from US$74.6 million in 2014 to US$173.4 million in 2015, primarily due to an increase in net loss from our equity investment in our associate company, Yanacocha, and a decrease in net income from our equity investment in Cerro Verde.
Net loss from our interest in Yanacocha increased by 12.5%, from US$174.7 million in 2014 to US$196.5 million in 2015. Net income from our interest in Cerro Verde decreased by 91.6 percent, from US$77.9 million in 2014 to US$6.5 million in 2015. Finally, net income from our interest in Coimolache decreased by 25.3%, from US$22.3 million in 2014 to US$16.6 million in 2015.
(b) Gain on business combination. In 2014, we recognized a gain of US$59.9 million in connection with our acquisition of the controlling interest in Canteras del Hallazgo S.A.C. (“CDH”) from Minera Gold Fields Perú S.A. (“MGFPSA”) due to the revaluation of the previously held equity interest at fair value as of the acquisition date.
(c) Finance costs. Finance costs increased by 144.1%, from US$11.3 million in 2014 to US$27.6 million in 2015, primarily due to:
| · | lower capitalization of borrowings costs of US$18.8 million due to the lack of significant qualifying assets in 2015; |
| · | a decrease of the interests of financial obligations of US$8.9 million, partially offset by the increase of the interests of bank loans of US$4.8 million; and |
| · | an increase of US$1.6 million in the financial cost related to closing mining units, due to the higher provision recorded in 2015. |
Income tax. Provision for income tax decreased by 77.6%, from US$66.0 million in 2014 to US$14.8 million in 2015, primarily due to a decrease in the provision for income tax at the El Brocal and La Zanja mining units, and at the corporate unit of US$25.7 million, US$18.1 million and US$11.3 million, respectively, due to those segments showing net losses during 2015.
Non-controlling interest income (loss). Non-controlling interest changed from an income of US$14.4 million in 2014 to a loss of US$58.3 million in 2015, primarily due to a decrease in contribution of profits from the La Zanja and El Brocal units by US$33.2 million and US$38.4 million, respectively. See Note 19(a) to the Financial Statements.
Net loss. As a result of the foregoing, net loss increased from US$61.6 million in 2014 to US$375.5 million in 2015. Net loss was 5.2% of operating income in 2014 and 39.5% of operating income in 2015.
Results of Operations for the Years Ended December 31, 2015 and 2014 by Segment
We present the operating results for each of our operating segments for the years ended December 31, 2014 and 2015 in more detail in Note 31 to the Financial Statements.
Sales of goods -Mining Segments
The following tables set forth the volumes of gold, silver, lead, zinc and copper sold at each of our principal mining segments during the years ended December 31, 2015 and 2014, as well as the variation in such volumes sold for the year ended December 31, 2015 as compared to the year ended December 31, 2014:
| Mining Segment | | Volume Sold for the year ended December 31, 2015 | |
| | | Gold (oz.) | | | Silver (oz.) | | | Lead (t) | | | Zinc (t) | | | Copper (t) | |
| Julcani | | | 94 | | | | 3,493,166 | | | | 2,478 | | | | - | | | | 103 | |
| Mallay | | | 396 | | | | 1,134,528 | | | | 6,612 | | | | 7,482 | | | | - | |
| Breapampa | | | 16,069 | | | | 212,826 | | | | - | | | | - | | | | - | |
| Orcopampa | | | 214,821 | | | | 555,314 | | | | - | | | | - | | | | - | |
| Uchucchacua | | | 38 | | | | 12,666,673 | | | | 6,560 | | | | 4,750 | | | | - | |
| La Zanja | | | 142,300 | | | | 324,151 | | | | - | | | | - | | | | - | |
| Colquijirca | | | 7,181 | | | | 2,637,215 | | | | 16,739 | | | | 43,297 | | | | 28,991 | |
| Mining Segment | | Volume Sold for the year ended December 31, 2014 | |
| | | Gold (oz.) | | | Silver (oz.) | | | Lead (t) | | | Zinc (t) | | | Copper (t) | |
| Julcani | | | 12 | | | | 2,851,318 | | | | 2,057 | | | | - | | | | 64 | |
| Mallay | | | - | | | | 1,121,202 | | | | 7,253 | | | | 8,609 | | | | - | |
| Breapampa | | | 80,358 | | | | 383,733 | | | | - | | | | - | | | | - | |
| Orcopampa | | | 204,862 | | | | 401,782 | | | | - | | | | - | | | | - | |
| Uchucchacua | | | - | | | | 11,940,167 | | | | 6,530 | | | | 4,288 | | | | - | |
| La Zanja | | | 143,151 | | | | 418,565 | | | | - | | | | - | | | | - | |
| Colquijirca | | | 7,874 | | | | 1,928,243 | | | | 2,759 | | | | 8,007 | | | | 40,198 | |
| Mining Segment | | 2015 vs 2014 Change (%) | |
| | | Gold (oz.) | | | Silver (oz.) | | | Lead (t) | | | Zinc (t) | | | Copper (t) | |
| Julcani | | | 683 | % | | | 23 | % | | | 20 | % | | | - | | | | 61 | % |
| Mallay | | | 100 | % | | | 1 | % | | | (9 | )% | | | (13 | )% | | | - | |
| Breapampa | | | (80 | )% | | | (45 | )% | | | - | | | | - | | | | - | |
| Orcopampa | | | 5 | % | | | 38 | % | | | - | | | | - | | | | - | |
| Uchucchacua | | | 100 | % | | | 6 | % | | | - | | | | 11 | % | | | - | |
| La Zanja | | | (1 | )% | | | (23 | )% | | | - | | | | - | | | | - | |
| Colquijirca | | | (9 | )% | | | 37 | % | | | 507 | % | | | 441 | % | | | (28 | )% |
Julcani. Net sales of goods increased by US$0.5 million in 2015 as compared to 2014 due to increases in the volume of silver and lead sold at that unit, partially offset by a decline in the average realized price of silver.
Mallay. Net sales of goods decreased by US$11.0 million in 2015 as compared to 2014 due to a decline in the average realized price of silver, partially offset by an increase in the amount of silver sold at that unit.
Breapampa.Net sales of goods decreased by US$86.1 million in 2015 as compared to 2014 due to a decrease in the volume of silver and gold sold and a decline in the average realized price of those minerals.
Orcopampa. Net sales of goods decreased by US$9.9 million in 2015 as compared to 2014 due to a decline in the average realized prices of gold and silver, partially offset by a 5% increase in gold sold (from 204,862 ounces sold in 2014 to 214,821 ounces sold in 2015) and a 38% increase in silver sold (from 401,782 ounces sold in 2014 to 555,314 ounces sold in 2015) at that unit.
Uchucchacua. Net sales of goods decreased by US$36.5 million in 2015 as compared to 2014 due to a decline in the average realized prices of lead and silver, partially offset by an increase in the amount of lead and silver sold at that unit.
La Zanja. Net sales of goods decreased by US$24.3 million in 2015 as compared to 2014 due to a decline in gold and silver prices, and a decrease in the volume of silver sold from 418,565 ounces sold in 2014 to 324,151 ounces sold in 2015 and gold sold from 143,151 ounces sold in 2014 to 142,300 ounces sold in 2015.
Colquijirca. Net sales of goods decreased by US$38.7 million in 2015 as compared to 2014 due to a decline in mineral prices, partially offset by an increase in tons of lead and zinc and ounces of silver sold during 2015.
Sales of services - construction and engineering segment.Net sales for the construction and engineering segment decreased by US$18.1 million in 2015 as compared to 2014 due to a reduction in the development and construction of mining projects.
Sales of services - insurance brokerage segment.Net sales for the insurance brokerage segment increased by US$1.3 million in 2015 as compared to 2014 due to an increase in the number of clients in the insurance portfolio due to our strategic associations with smaller brokers.
Sales of services - energy generation and transmission segment. Net sales for the energy and transmission segment increased by US$9.4 million in 2015 as compared to 2014 due to the increase in the demand of energy from our other operating segments.
Total operating expenses- Mining Segments
Orcopampa. During 2015, total operating expenses decreased by US$4.9 million due to a decrease in other income as a result of lower sales to third parties.
Julcani. During 2015, total operating expenses decreased by US$4.2 million due to other expenses of US$4.6 million compared to 2014.
Breapampa. During 2015, total operating expenses increased by US$1.7 million due to an impairment loss recorded during 2015 of US$7.5 million, offset by a decrease in administrative expenses compared to 2014 of US$5.2 million.
Colquijirca. During 2015, total operating expenses increased by US$3.7 million due to increases in administrative expenses and selling expenses, which were partially offset by an increase in other expenses-net, each as compared to 2014.
La Zanja. During 2015, total operating expenses decreased by US$12.9 million due to a decrease in exploration in non-operating areas of US$10.7 million which were partially offset by an increase an impairment loss by US$3.8 million, each as compared to 2014.
Uchucchacua. During 2015, total operating expenses decreased by US$2.0 million due to a decrease in administrative expenses as compared to 2014, as a result of a cost reduction plan adopted in 2014.
Mallay. During 2015, total operating expenses increased by US$0.1 million due to increases in other expenses as compared to 2014, which was partially offset by a decrease in administrative expenses and selling expenses.
Total operating expenses—construction and engineering segment. During 2015, total operating expenses for the construction and engineering segment decreased by US$7.6 million for the year ended December 31, 2015 as compared to 2014 due to decrease in administrative expenses.
Total operating expenses—insurance brokerage segment. During 2015, total operating expenses for the insurance brokerage segment increased by US$2.5 million as compared to 2014 due to an increase in administrative expenses.
Total operating expenses—energy generation and transmission segment. During 2015, total operating expenses for the energy and transmission segment decreased by US$7.6 million as compared to 2014 due to a decrease of US$8.0 million in other expenses-net.
Results of Operations for the Years Ended December 31, 2014 and 2013
Net sales of goods. Sales of goods decreased by 6%, from US$1,135.8 million in 2013 to US$1,067.2 million in 2014. The following tables reflect the average realized prices and volumes of gold, silver, lead, zinc and copper sold during the years ended December 31, 2013 and 2014:
| Average Realized Price | | Year ended December 31, | |
| | | 2013 | | | 2014 | | | Variation | |
| | | | |
| Gold (US$/oz.) | | | 1,392.18 | | | | 1,263.32 | | | | (9.26 | )% |
| Silver (US$/oz.) | | | 22.33 | | | | 18.65 | | | | (16.48 | )% |
| Lead (US$/t) | | | 2,104.63 | | | | 2,106.87 | | | | 0.11 | % |
| Zinc (US$/t) | | | 1,869.22 | | | | 2,243.76 | | | | 20.04 | % |
| Copper (US$/t) | | | 7,179.50 | | | | 6,737.78 | | | | (6.15 | )% |
| Volume Sold | | Year ended December 31, | |
| | | 2013 | | | 2014 | | | Variation | |
| Gold (oz.) | | | 458,499 | | | | 439,093 | | | | (4.23 | )% |
| Silver (oz.) | | | 16,329,314 | | | | 19,088,923 | | | | 16.90 | % |
| Lead (t) | | | 26,584 | | | | 18,820 | | | | (29.21 | )% |
| Zinc (t) | | | 38,084 | | | | 21,231 | | | | (44.25 | )% |
| Copper (t) | | | 25,406 | | | | 40,263 | | | | 58.48 | % |
(a) Gold sales. Average realized sales prices for gold decreased from US$1,392.18 per ounce in 2013 to US$1,263.32 per ounce in 2014. Gold sales volume decreased from 458,499 ounces in 2013 to 439,093 ounces in 2014, mainly due to a decreased gold production at our Orcopampa and Breapampa mining units. The combined effect of these changes resulted in a US$85.9 million decrease in income from sales of gold in 2014 as compared to 2013.
(b) Silver sales. Average realized sales prices for silver decreased from US$22.33 per ounce in 2013 to US$18.65 per ounce in 2014. Silver sales volume increased from 16,329,314 ounces in 2013 to 19,088,923 ounces in 2014, mainly due to increased silver production at our Uchucchacua, Colquijirca and Julcani mining units. The combined effect of these changes resulted in a US$7.6 million decrease in income from sales of silver in 2014 as compared to 2013.
(c) Lead sales. Average realized sales prices for lead increased from US$2,104.63 per ton in 2013 to US$2,106.87 per ton in 2014. Lead sales volume decreased from 26,584 tons in 2013 to 18,820 tons in 2014, mainly due to decreased lead production at our Colquijirca and Uchucchacua mining units. The combined effect of these changes resulted in a US$16.8 million decrease in income from sales of lead in 2014 as compared to 2013.
(d) Zinc sales. Average realized sales prices for zinc increased from US$1,869.22 per ton in 2013 to US$2,243.76 per ton in 2014. Zinc sales volume decreased from 38,084 tons in 2013 to 21,231 tons in 2014, mainly due to decreased zinc production at our Colquijirca and Uchucchacua mining units. The combined effect of these changes resulted in a US$24.3 million decrease in income from sales of zinc in 20112014 as compared to 2010.2013.
(e) Copper sales. Average realized sales prices for copper pricesdecreased from US$7,179.50 per ton in 2013 to US$6,737.78 per ton in 2014. Copper sales volume increased from US$8,113.56 per metric ton in 2010 to US$8,567.64 per metric ton in 2011. The volume of copper sold increased from 15,946 metric25,406 tons in 20102013 to 23,231 metric40,263 tons in 2011, largely2014, mainly due to increased copper production at our Colquijirca mine.mining unit. The combined effect of these changes resulted in a US$63.888.9 million increase in income from sales of copper in 20112014 as compared to 2010.2013.
The revenues from gold, silver, lead, zinc and copper mentioned above do not include
Sales of goods figures are obtained by deducting the refinery charges and penalties incurred which amounted(a total of US$184.5 million of refinery charges and penalties were incurred in 2014, compared with US$178.9 million incurred in 2013) and revenues from mining units held for sale (a total of US$5.1 million revenues provided from mining units held for sales in 2014, compared with US$25.8 million provided in 2013) from the gross sales of all metals sold. See Note 21(a) to the Financial Statements.
Net sales of services.Sales of Servicesdecreased by 10%, from US$127.979.6 million in 2011,2013 to US$71.6 million in 2014, mainly explained by the decrease of US$29.6 million in 2014 as compared to 2015 due to a reduction in the development and construction of mining projects and an increase of US$112.35.1 million in 2010.2014 as compared to 2013 due to an increase in the energy generation and transmission.
Royalty income. In 2011,2014, royalty income received by our subsidiary Chaupiloma amounted to US$62.736.9 million, representing a12 percentincrease 17% decrease from the US$55.944.2 million ofin royalty income received in 2010.2013. This increase is attributeddecrease was due to increaseda decrease in 2014 in the net sales byof Yanacocha, in 2011, which resultedwas primarily from an increasedue to a decrease in the average realized price of gold partially offset by lowerand a decrease in production. See Note 31(a) at Yanacocha. We hold a 60% interest in Chaupiloma, to the Financial Statements.which Yanacocha pays Chaupiloma, in which we directly and indirectly hold a 60 percent interest, a royalty equalthat corresponds to 3 percent3% of Yanacocha’sits net sales.
Total operating costs. Total operating costsincreasedby26 percent, 3%, from US$565.7918.7 million in 20102013 to US$712.2949.5 million in 2011,2014, due to changes in the following:following components:
(a) Cost of sales without consideringof goods, excluding depreciation and amortization,increasedby29 percent, 3.9%, from US$347.1513.2 million in 20102013 to US$446.2533.0 million in 2011. The2014, due to:
| · | a US$35.6 million increase in the services rendered by third parties at the Ucchuchacua mining unit, which was partially offset by (i) a decrease of US$14.7 million in our Orcopampa mining unit due to fewer services provided by third parties and a decrease in the consumption of materials and supplies. |
(b) Cost of sales of services, excluding depreciation and amortization, decreased by 28.6%, from US$114.1 million in 2013 to US$81.5 million in 2014, mainly due to: (i)
| · | a decrease of US$22.8 million in our construction and engineering unit as a result of lower net sales and a lower headcount; and |
| · | a decrease of US$6.2 million in the energy generation and transmission segment due to the decline in energy purchases resulting from the Huanza hydroelectric plant beginning operations in 2014. |
(c) The cost of exploration of units in operation decreased by 4%, from US$27.6101.9 million increasein 2013 to US$97.9 million in 2014. This decrease was primarily due to a decrease of US$6.1 million and US$2.5 million in diamond drilling activities at the impact of a full year of gold production at our La ZanjaOrcopampa and Breapampa mining unit; (ii) a US$22.2 million increase due tounits, respectively, which was partially offset by an increase inof US$3.9 million at the services provided by contractor suppliers at our Colquijirca mining unit, (iii) a US$16.9 million increase due to the acquisition of zinc concentrate from third parties as a result ofdecreased zinc production at our Colquijirca mining unit and (iv) a US$14.5 million increase due to fixed costs at our OrcopampaJulcani mining unit due to a decrease in gold production.
(b) Exploration in units in operationincreased by 20 percent, from US$91.4 million in 2010 to US$109.4 million in 2011. Theseincreasedcosts were principally due to anincrease in exploration projectsefforts at our Uchucchacua, Orcopampa, Shila-Paula and La Zanja mines.Acchilla. See Note 2023 to the Financial Statements.
(c)(d) Depreciation and amortization costsincreased by29 percent, 31%, from US$74.9159.1 million in 20102013 to US$96.4208.7 million in 2011, mainly2014, due to: (i)the impact of a full year of depreciation of the assets of La Zanja S.R.L. and (ii) the depreciation of the assets of a new plant put into operationat our Colquijirca mining unit during 2011.
(d)Royalty expenses to third parties and the Peruvian governmentincreased
| · | higher depreciation and amortization costs incurred in the La Zanja mining unit, which increased from US$27.9 million in 2013 to US$53.2 million in 2014 as a result of increased mine development costs and amortization and fixed assets purchases; |
| · | higher depreciation and amortization costs incurred in the Julcani and Mallay mining units, which increased from US$24.9 million in 2013 to US$36.5 million in 2014 as a result of work-in-progress put into operation; |
| · | higher depreciation costs incurred in the Breapampa mining unit, which increased from US$25.5 million in 2013 to US$35.7 million in 2014 due to the start of operations in new pad stages; and |
| · | depreciation costs incurred by our corporate unit, which increased by US$7.2 million in 2014 due to the start of operations at the Rio Seco subsidiary, which was partially offset by a decrease in depreciation costs incurred in the Colqujirca mine from US$35.6 million in 2013 to US$26.9 million in 2014 due to the full depreciation of the R-7 tailing dam in 2013. |
(e) Mining royalties decreased by15 percent, 6.6%, from US$52.330.4 million in 20102013 to US$60.328.4 million in 2011.2014. Royalties paid to third parties by Orcopampa amounted to US$27.723.8 million and US$32.021.7 million in 20102013 and 2011,2014, respectively. Royalties paid to the Peruvian government amounted to US$24.66 million and US$28.26.8 million in 20102013 and 2011,2014, respectively. Theincrease decrease in royalties paid to third parties and the Peruvian government was mainlyprimarily due to a 10% decrease in gold production at the increased valueOrcopampa mining unit from 224,671 ounces produced in 2013 to 203,226 ounces produced in 2014, and the decrease in the price of metals and concentrates sold. Peruvian legislation requires owners of mining concessions to pay the Peruvian government for the exploitation of metallic and non-metallic resources. Prior to October 1, 2011, mining royalties were calculatedgold in 2014, compared with rates ranging from 1 to 3 percent of the value of mineral concentrates or equivalent, according to the quoted market price published by the Ministry of Energy and Mines. Beginning on October 1, 2011, the Peruvian government instituted a new mining royalty and tax regime. See “Item 4. Information on the Company—Buenaventura—B. Business Overview—Regulatory Framework—Mining Royalties and Taxes” for additional information regarding the mining royalties and taxes now applicable to us.2013.
Total operating expenses. Operating expensesincreased by23 percent, 31.1%, from US$113.9125.6 million in 20102013 to US$140.1164.7 million in 2011,2014, due to changes in the following components:
(a) Administrative expensesdecreased increased by30 percent, 35%, from US$107.275.1 million in 20102013 to US$75.2101.1 million in 2011, mainly2014, due to decreasedan increase of administrative expenses at the corporate unit of US$21.2 million from the reversal of expenses by US$20.2 million recorded in 2013 for long-term officers’ compensation (stock appreciation rights)., and an increase of US$7.9 million in the construction and engineering unit due to increased labor costs, which was partially offset by a decrease of US$4.3 million in the Orcopampa mining unit due to a decrease in labor expenses. See Note 2225 to the Financial Statements.
(b) Exploration in non-operationalnon-operating areasincreased by37 percent, 52%, from US$36.132.8 million in 20102013 to US$49.650.0 million in 2011,2014, due to higherincreased expenditures in exploration areas,activities beginning in 2014, primarily Mallay, Breapampa, Trapiche, Colquemayo, Pachucain the Alejandra and Marcapunta.Tambomayo projects. See Note 2326 to the Financial Statements.
(c) Reimbursement of exploration expenses on projects. During 2010, US$15.0 million considered as an exploration expense from Coimolache was reversed and capitalized on our balance sheet as an Investment in associates. No comparable amounts were received in 2011.
(d) Reversal for impairment of long-lived assets resulted in a net recovery of US$13.1 million being recorded in 2010. We updated our assessment of the recoverability of the book value of our long-lived assets and reversed the impairment of the Antapite, Recuperada and Poracota mining units as of December 31, 2010 following positive changes in the assumptions used to calculate the impairment provision recorded in order to determine the recovery carrying amount of our long-lived assets. The impairment reversed as of December 31, 2010 amounted to US$16.2 million, with US$8.6 million recorded as “Mining concessions and property, plant and equipment” and US$7.6 million recorded as “Development costs.” We also recorded an impairment of our long-lived assets from the Shila-Paula mining unit in the amount of US$3.1 million, with US$1.3 million recorded as “Mining concessions and property, plant and equipment” and US$1.8 million recorded as “Development costs.” See Note 11 to the Financial Statements. During 2011, we updated our assessment of the value in use of our long-lived assets and concluded that there was no impairment indication.
Operating incomeprofit.. As a result of the foregoing, operating incomeincreased decreased by66 percent, 71% from US$424.1215.2 million in 20102013 to US$704.461.6 million in 2011.2014.
Other income (expense), net. Other income (expenses), net decreased by 79.0% from US$124.6 million in 2013 to US$26.1 million in 2014, mainly explained by:
(a) Share in the results of related parties byassociates under equity method. IncomeLoss from equity investments in related partiesincreasedassociates decreased by9 percent, 35%, from US$428.9114.1 million in 20102013 to US$468.474.6 million in 2011, principally2014, primarily due toincreases a decrease in net loss from our equity investment in our associate company, Yanacocha, which was partially offset by a decrease in net income from our equity investmentsinvestment in Coimolache, Yanacocha and Cerro Verde. IncomeNet loss from our interest in Yanacocha increaseddecreased by 11 percent30%, from US$251.5251.1 million in 20102013 to US$279.7174.7 million in 2011. This increase is attributable2014. Net income from our interest in Cerro Verde decreased by 33%, from US$116.2 million in 2013 to an increaseUS$77.9 million in the average realized price of gold, partially offset bydecreased gold production. Income2014. Finally, net income from our interest in Coimolache increased by 7%, from US$20.8 million in 2013 to US$22.3 million in 2014.
(b) Gain on business combination. In 2014, we recognized a lossgain of US$15.959.9 million in 2010 to an incomeconnection with our acquisition of US$9.6 millionthe controlling interest in 2011,CDH from MGFPSA due to the commencementrevaluation of gold productionthe previously held equity interest at fair value as of the Tantahuatay mineacquisition date.
(c) Finance costs. Finance costs increased by 14%, from US$9.9 million in mid-2011.2013 to US$11.3 million in 2014, primarily due to an increase in the cost of the financial leasing facility related to the construction of the Huanza hydroelectric plant.
Income tax. Provision for income taxincreased decreased by 24%, from US$123.386.5 million in 20102013 to US$211.666.0 million in 2011, principally2014, primarily due to a decrease in the provision for income tax at the corporate unit of US$323.918.1 million caused by a decrease in taxable income of that unit, a decrease in the provision for income tax at the La Zanja mining unit of US$16.8 million and a decrease in other units of US$1.1 million, which was partially offset by an increase in pre-taxof US$16.6 million at the Colquijirca mining unit due to higher sales.
Non-controlling interest. Non-controlling interest income decreased by 48%, from US$848.227.5 million in 20102013 to US$1,172.114.4 million in 2011.
Non-controlling interest. Non-controlling interest expense increased by 59 percent, from US$64.1 million in 2010 to US$101.6 million in 2011, mainly2014, primarily due to an increase in contribution of profits to non-controlling investors in La Zanja and Chaupiloma, partially offset by a decrease in contribution of profits from El Brocal.the La Zanja and Chaupiloma units by US$18.0 million and US$2.1 million, respectively. See Note 19(a) to the Financial Statements.
Net incomeprofit (loss). As a result of the foregoing, net income increasedloss decreased by 30 percent,23%, from US$660.879.7 million in 20102013 to US$858.961.6 million in 2011. As a percentage2014. Net loss was 7% of net sales, netoperating income was 55 percent in 20112013 and 5% of operating income in 2014.
Results of Operations for the Years Ended December 31, 2014 and 2013 by Segment
We present the operating results for each of our operating segments for the years ended December 31, 2013 and 2014 in more detail in Note 31 to the Financial Statements.
Sales of goods - Mining Segments
The following tables set forth the volumes of gold, silver, lead, zinc and copper sold at each of our principal mining segments during the years ended December 31, 2014 and 2013, as well as the variation in such volumes sold for the year ended December 31, 2014 as compared to 60 percentthe year ended December 31, 2013:
| Mining Segment | | Volume Sold for the year ended December 31, 2014 | |
| | | Gold (oz.) | | | Silver (oz.) | | | Lead (t) | | | Zinc (t) | | | Copper (t) | |
| Julcani | | | 12 | | | | 2,851,318 | | | | 2,057 | | | | - | | | | 64 | |
| Mallay | | | - | | | | 1,121,202 | | | | 7,253 | | | | 8,609 | | | | - | |
| Breapampa | | | 80,358 | | | | 383,733 | | | | - | | | | - | | | | - | |
| Orcopampa | | | 204,862 | | | | 401,782 | | | | - | | | | - | | | | - | |
| Uchucchacua | | | - | | | | 11,940,167 | | | | 6,530 | | | | 4,288 | | | | - | |
| La Zanja | | | 143,151 | | | | 418,565 | | | | - | | | | - | | | | - | |
| Colquijirca | | | 7,874 | | | | 1,928,243 | | | | 2,759 | | | | 8,007 | | | | 40,198 | |
| Mining Segment | | Volume Sold for the year ended December 31, 2013 | |
| | | Gold (oz.) | | | Silver (oz.) | | | Lead (t) | | | Zinc (t) | | | Copper (t) | |
| Julcani | | | 378 | | | | 2,227,960 | | | | 1,713 | | | | - | | | | 140 | |
| Mallay | | | - | | | | 1,146,442 | | | | 6,570 | | | | 7,614 | | | | - | |
| Breapampa | | | 80,178 | | | | 311,634 | | | | - | | | | - | | | | - | |
| Orcopampa | | | 221,322 | | | | 516,033 | | | | - | | | | - | | | | - | |
| Uchucchacua | | | - | | | | 9,748,206 | | | | 6,977 | | | | 6,340 | | | | - | |
| La Zanja | | | 132,992 | | | | 381,091 | | | | - | | | | - | | | | - | |
| Colquijirca | | | 4,619 | | | | 1,460,681 | | | | 8,392 | | | | 20,011 | | | | 25,266 | |
| Mining Segment | | 2014 vs 2013 Change (%) | |
| | | Gold (oz.) | | | Silver (oz.) | | | Lead (t) | | | Zinc (t) | | | Copper (t) | |
| Julcani | | | (97 | )% | | | 28 | % | | | 20 | % | | | - | | | | (54 | )% |
| Mallay | | | - | | | | (2 | )% | | | 10 | % | | | 13 | % | | | - | |
| Breapampa | | | 0 | % | | | 23 | % | | | - | | | | - | | | | - | |
| Orcopampa | | | (7 | )% | | | (22 | )% | | | - | | | | - | | | | - | |
| Uchucchacua | | | - | | | | 22 | % | | | (6 | )% | | | (32 | )% | | | - | |
| La Zanja | | | 8 | % | | | 10 | % | | | - | | | | - | | | | - | |
| Colquijirca | | | 70 | % | | | 32 | % | | | (67 | )% | | | (60 | )% | | | 59 | % |
Julcani. Net sales of goods increased by US$3.8 million in 2010.2014 as compared to 2013 due to increases in the volume of silver and lead sold at that unit.
Mallay. Net sales of goods decreased by US$1.9 million in 2014 as compared to 2013 due to a decrease in the amount of silver sold at that unit and a decline in the average realized price of silver.
Breapampa. Net sales of goods decreased by US$11.4 million in 2014 as compared to 2013 due to a decline in gold and silver prices.
Orcopampa. Net sales of goods decreased by US$60.3 million in 2014 as compared to 2013 due to a 7% decline in gold sold at that unit, from 221,322 ounces sold in 2013 to 204,862 ounces sold in 2014, and a decline in the average realized prices of gold and silver.
Uchucchacua. Net sales of goods decreased by US$2.7 million during 2014 as compared to 2013 due to decreases in the amount of lead and zinc sold at that unit.
B. LiquidityLa Zanja. Net sales of goods decreased by US$8.0 million in 2014 as compared to 2013 due to decreases in the amount of lead and Capital Resourceszinc sold at that unit.
Colquijirca. Net sales of goods increased by US$22.2 million in 2014 as compared to 2013 due to a 59% increase in the volume of copper sold from 25,266 mt. sold in 2013 to 40,198 mt. sold in 2014.
Sales of services - construction and engineering segment.Nets sales for the construction and engineering segment decreased by US$29.7 million in 2014 compared to 2013 due to a reduction in the development and construction of mining projects.
Sales of services - insurance brokerage segment.Net sales for the insurance brokerage segment increased by US$2.1 million in 2015 as compared to 2014 due to an increase in the number of clients in the insurance portfolio due to our strategic associations with smaller brokers.
Sales of services - energy generation and transmission segment.Net sales for the energy and transmission segment increased by US$5.1 million in 2014 as compared to 2013 due to the increase in the demand of energy from our other operating segments, in particular the Colquijirca mining unit.
Total operating expenses- Mining Segments
Orcopampa.During 2014, total operating expenses increased by US$5.1 million due to an increase in exploration in non-operating areas of US$7.2 million, which was partially offset by a decrease in administrative expenses, each as compared to 2013.
Julcani.During 2014, total operating expenses increased by US$6.5 million due to increases in administrative expenses and selling expenses, each as compared to 2013.
Breapampa.During 2014, total operating expenses increased by US$0.57 million due to increases in administrative expenses and selling expenses, each as compared to 2013.
Colquijirca.During 2014, total operating expenses decreased by US$0.68 million due to decreases in administrative expenses and selling expenses, which were partially offset by an increase in other expenses-net, each as compared to 2013.
La Zanja.During 2014, total operating expenses increased by US$20.3 million mainly due to an increase in the exploration in non-operating areas of US$13.1 million.
Uchucchacua.During 2014, total operating expenses increased by US$1.9 million due to increases in administrative expenses and selling expenses, each as compared to 2013.
Mallay. During 2014, total operating expenses decreased by US$0.37 million due to an increase in other expenses-net, which was partially offset by increases in administrative expenses and selling expenses, each as compared to 2013.
Total operating expenses—construction and engineering segment.During 2014, total operating expenses for the construction and engineering segment increased by US$0.21 million for the year ended December 31, 2014 as compared to 2013 due to an increase in administrative expenses due to increased labor costs.
Total operating expenses—insurance brokerage segment.During 2014, total operating expenses for the insurance brokerage segment increased by US$1.1 million as compared to 2013 due to an increase in administrative expenses.
Total operating expenses—energy generation and transmission segment.During 2014, total operating expenses for the energy and transmission segment decreased by US$5.6 million as compared to 2013 due to a decrease of US$7.7 million in other expenses-net, which was partially offset by increases in administrative expenses and selling expenses.
| A. | Liquidity and Capital Resources |
As of December 31, 2012,2015 and 2014, we had cash and cash equivalents of US$186.7 million, compared to US$470.8 million at December 31, 2011.78.5 million.
Cash provided by operating activities for the years ended December 31 2012, 2015 and 2011.2014. Net cash and cash equivalents provided by operating activities were US$335.7127.3 million in 20122015, compared towith US$567.5162.5 million in 2011.The2014. This decrease in net cash flow provided by operating activities was mainly attributable to (i)decreased proceeds from sales, from US$1,505.5primarily due to:
| · | a decrease in proceeds from sales, from US$1,144.4 million in 2014 to US$965.3 million in 2015; and |
| · | an increase in the interest expenses, from US$9.4 million in 2014 to US$21.5 million in 2015. |
These changes in 2011 to US$1,410.1 million in 2012; (ii) increased payments to third parties, from US$672.5 million in 2011 to US$838.3 million in 2012; and (iii) increased income tax paid, from US$111.8 million in 2011 to US$136.3 million in 2012;net cash flow were partially offset by (i) increased royalties received, from US$56.2 million in 2011 to US$76.1 million in 2012; (ii) increased dividends received from Coimolache, from no dividends received in 2011 to US$16.5 million in 2012; (iii) an increase in value-added tax recovered, from US$22.6 million in 2011 to US$40.9 million in 2012; and (iv) decreased royalty payments, from US$73.8 million in 2011 to US$38.9 million in 2012, as a result of increased royalty payments to third parties and decreased payments to the Peruvian government.by:
| · | an increase in value-added tax recovered, from US$39.7 million in 2014 to US$81.7 million in 2015; |
| · | a decrease in the payments to suppliers and third parties, from US$805.4 million in 2014 to US$727.0 million in 2015; |
| · | a decrease in the payments to workers, from US$203.5 million in 2014 to US$175.3 million in 2015; and |
| · | a decrease in income taxes paid, from US$33.1 million in 2014 to US$22.3 million in 2015. |
Cash provided by operating activities for the years ended December 31 2011, 2014 and 2010.2013. Net cash and cash equivalents provided by operating activities were US$567.5162.5 million in 20112014, compared towith US$537.6408.7 million in 2010.The increase2013. This decrease in net cash flow provided by operating activities was mainly attributable to (i)increased proceeds from sales, from US$997.8 million in 2010 to US$1,505.5 million in 2011 and (ii) an increase in value-added tax recovered, from US$7.5 million in 2010 to US$22.6 million in 2011;primarily due to:
| · | a decrease in proceeds from sales, from US$1,351.4 million in 2013 to US$1,144.4 million in 2014; |
| · | a decrease in value-added tax recovered, from US$66.9 million in 2013 to US$39.7 million in 2014; |
| · | a decrease in royalties received from Yanacocha, from US$50.6 million in 2013 to US$31.3 million in 2014; and. |
| · | an increase in payments to suppliers and third parties, from US$752.8 million in 2013 to US$805.4 million in 2014. |
These changes were partially offset by (i) increased payments to third parties, from US$473.6 million in 2010 to US$672.5 million in 2011; (ii) decreased dividends received from Yanacocha and Cerro Verde, from US$183.0 million received in 2010 to no dividends received in 2011; (iii) increased income tax paid, from US$56.3 million in 2010 to US$111.8 million in 2011; and (iv) increased royalty payments, from US$55.3 million in 2010 to US$73.8 million in 2011, as a result of increased royalty payments to third parties and increased payments to the Peruvian government.by:
| · | a decrease in income tax paid, from US$66.4 million in 2013 to US$33.2 million in 2014; |
| · | a decrease in payments to workers, from US$216.8 million in 2013 to US$203.5 million in 2014; |
| · | a decrease in royalty payments made, from US$30.6 million in 2013 to US$22.6 million in 2014, primarily due to fewer royalty payments made to third parties; |
| · | an increase in dividends received from Coimolache, from US$9.8 million in 2013 to US$12.9 million in 2014; and |
| · | a decrease in interest payments made, from US$11.5 million in 2013 to US$9.4 million in 2014. |
Cash used in investing activities for the years ended December 31 2012, 2015 and 2011. Net cash and cash equivalents used in investingactivities were US$487.5 million in 2012 compared to US$354.3 million in 2011.The increase in net cash flowused in investingactivitieswas mainly attributable to: an increase in mining concessions, development cost and property, plant and equipment, from US$317.8 million in 2011 to US$442.9 million in 2012, in connection with hydroelectric construction at our subsidiary, Huanza; and the expansion of the refining plant capacity at our subsidiary, El Brocal.
Cash used in investment activities for the years ended December 31, 2011 and 2010.2014. Net cash and cash equivalents used in investing activities were US$340.1341.7 million in 20102015, compared towith US$354.3292.7 million in 2011.2014. Theincrease in net cash flow used in investing activities in 2011 compared with 2010 was mainly attributableprimarily due to: an increase in payments for the purchase of investment shares, from US$19.6 million in 2010 to US$52.2 million in 2011; an increase in mining concessions, development cost and property, plant and equipment, from US$253.3 million in 2010 to US$317.8 million in 2011, in connection with hydroelectric construction at Huanza; and the expansion of the refining plant capacity at El Brocal.
| · | an increase in loans granted to associates (Cerro Verde), from US$0 in 2014 to US$124.8 million in 2015; |
| · | a decrease in proceeds from loans to associates, from US$15.5 million in 2014 to US$0 in 2015; and |
| · | an increase in payments related to acquisitions of other assets, from US$0 in 2014 to US$10.2 million in 2015. |
These changes were partially offset by:
| · | the payment, net of cash acquired, of US$80.3 million for the acquisition of a controlling interest in CDH made in 2014; and |
| · | a decrease in mining concessions, development costs, and property, plant and equipment acquisitions, from US$227.6 million in 2014 to US$211.3 million in 2015. |
Cash used in investing activities for the years ended December 31, 2014 and 2013. Net cash and cash equivalents used in investing activities were US$292.7 million in 2014, compared with US$428.1 million in 2013. The decrease in net cash flow used in investing activities was primarily due to:
| · | a decrease in mining concessions, development costs, and property, plant and equipment acquisitions, from US$503.6 million in 2013 to US$227.6 million in 2014; and |
| · | a decrease in cash contributions granted to associates, from US$7.0 million in 2013 to US$2.0 million in 2014. |
These changes were partially offset by:
| · | the payment, net of cash acquired, of US$80.3 million for the acquisition of a controlling interest in CDH; |
| · | the inflow of US$52.9 million in 2013 as a result of the settlement of financial assets at fair value through profit or loss; |
| · | a decrease in loan collection from Coimolache, from US$24.5 million in 2013 to US$15.6 million in 2014; and |
| · | a decrease in income from the sale of mining concessions, development costs, property, plants and equipment, from US$5.0 million in 2013 to US$1.7 million in 2014. |
Cash provided by financing activities for the years ended December 31 2012, 2015 and 2011.2014. Net cash and cash equivalents used in financingactivitiesprovided by financing activities were US$132.3 in 2012 compared to US$325.2214.4 million in 2011.2015, compared with US$157.4 million in 2014. The decreaseincrease in net cash flowused in financingactivities provided by financing activities was mainly attributable to:a decrease in payments for purchase of shares to non-controlling shareholder, from US$225.3 million in 2011 from nil in 2012; an increase in financial obligations, from US$50.9 million in 2011 to US$74.3 million in 2012; and a decrease in the payment of dividends to non-controlling shareholders, from US$66.7 million in 2011 to US$44.9 million in 2012;primarily due to:
| · | an increase in short-term bank loans, from US$40.0 million in 2014 to US$344.5 million in 2015; |
| · | a decrease in the payment of financial obligations, from US$42.2 million in 2014 to US$29.9 million in 2015; and |
| · | a decrease in the payment of dividends to controlling shareholders of US$8.6 million. |
These changes were partially offset by a decrease in proceeds from the sale of investments, shares from US$60.4 million in 2011 to nil in 2012; and an increase in the payment of dividends to shareholders, from US$142.5 million in 2011 to US$152.7 million in 2012.by:
| · | a decrease in proceeds from financial obligations, from US$177.1 million in 2014 to US$0.3 million in 2015; |
| · | payments of bank loans made in 2015 of US$90.0 million; and |
| · | an increase in the payment of dividends to non-controlling shareholders from US$8.9 million in 2014 to US$10.5 million in 2015. |
Cash used inprovided by (used in) financing activities for the years ended December 31 2011, 2014 and 2010.2013. Net cash and cash equivalents used inprovided by financing activities were US$352.2157.4 million in 20112014, compared to net cash used in financing activities ofwith US$329.1116.1 million in 2010.The decrease in net cash flow used in financing activities in 2011 compared with 2010 was mainly attributable to a decrease in payments of financial obligations, from US$226.1 million in 2010 to US$2.0 million in 2011, and a decrease in financial obligations, from US$53.3 million in 2010 to US$51.0 million in 2011, partially offset by an2013. The increase in net cash flow provided by financing activities was primarily due to:
| · | a decrease in the payment of financial obligations, from US$260.2 million in 2013 to US$42.2 million in 2014; |
| · | a decrease in the payment of dividends to shareholders, from US$78.8 million in 2013 to US$8.6 million in 2014; |
| · | a bank loan received in 2014 for US$40.0 million; |
| · | a decrease in the payment of dividends to non-controlling shareholders, from US$13.5 million in 2013 to US$8.9 million in 2014; and |
| · | a decrease in financial obligations, from US$237.0 million in 2013 to US$177.1 million in 2014. |
Short-Term Debt
We borrow from time to time short-term unsecured loans from local Peruvian banks to supplement our working capital needs at favorable short-term interest rates. As of December 31, 2015 and 2014, the paymentamount outstanding under such short-term loans was US$344.5 million and US$40.0 million, respectively. In 2015, we used the proceeds of dividendssuch short-term loans to shareholders, from US$117.0 millionfund the construction of the Tambomayo project, to loan funds to Cerro Verde, to increase capital in 2010 to US$142.5 million in 2011, an increase in the payment of dividends to non-controlling shareholders, from US$39.2 million in 2010 to US$66.7 million in 2011, an increase of US$60.4 million in sales of investments related to sales of El Brocal shares, and an increase in payments for the purchase of shares to non-controlling shareholders, from nil in 2010 to US$225.3 million in 2011.other general working capital purposes.
Long-Term Debt
On December 2, 2009 Banco de CréditoCredito del Peru executed a financial lease agreement with Conenhua, Huanza and us in the amount of US$119119.0 million for construction of a hydroelectric power station. The lease was executed in favor of Huanza as lessee, and commits us to act as joint surety of Huanza to guarantee Huanza’s payment obligations.lessee. The term of the lease is 10six years from August 2014 and the interest rate is (i)three-month LIBOR plus 4 percent from the first disbursement until six months after the start of commercial operation of the power station and (ii) LIBOR plus 4.1 percent from six months after the start of commercial operation of the power station until maturity.4.00%. As of December 31, 20122015 and 2011, amounts2014, the amount outstanding under this lease werewas US$119.0104.1 million and US$105.1114.2 million, respectively.
On June 30, 2014, Banco de Credito del Perú extended this financial lease agreement with Conenhua, Huanza and us in the amount of US$108.8 million. The term of the lease is six years from August 22, 2012,2014 and the interest rate is three-month LIBOR plus 4.20%. As of December 31, 2015 and 2014, the amount outstanding under this lease was US$84.0 million and US$85.0 million, respectively.
On September 25, 2013, El Brocal enteredbegan the process of entering into a medium-term loan contractfinancing arrangement with Banco de Crédito del PeruPerú in an aggregate amount of US$180.0 million in the form of a series of sale and leaseback agreements relating to certain specified El Brocal assets, including equipment, machinery and production plants located in the Colquijirca mining unit. The first disbursement of US$116.5 million was received in November 2013, which was used to repay El Brocal’s medium term loan with Banco de Crédito del Perú during the fourth quarter of 2013. The second disbursement of US$63.5 million was received in January 2014. The renewable arrangement had a term of five years that commenced on the first lease payment date in March 2014. During the term of the arrangement, El Brocal has the right to repurchase the assets. On June 9, 2015, the Board of Directors of El Brocal approved the modification of the sale and finance leaseback contract in an aggregate amount of US$166.5 million. The new arrangement has a term of five years that commenced on the payment date in June 2015. The quarterly lease payments have an embedded interest rate of three-month LIBOR plus 4.7%. The agreements contain certain covenants, including several financial covenants such as a limitation on the payment of dividends by El Brocal. El Brocal’s obligations under the agreements are supported by trust contracts, which, among other things, relate to collection rights, sales contracts and cash flows granting Banco de Crédito del Perú the right to receive all cash flows before any funds are made available to El Brocal. The obligations of El Brocal under these agreements are not recourse to, or guaranteed by, Buenaventura or any of its other subsidiaries. The compliance with the financial ratios described above is monitored by El Brocal’s management. In 2015, Management obtained a waiver for any possible breach of the financial ratios that occur until December 31, 2016.
On March 28, 2014, Banco de Crédito del Perú executed a financial lease agreement with BISA in the amount of US$120 million. This loan14.9 million for the construction of a building with administrative offices. The term of the lease is variablefive years and four months starting April 2014 and the interest rate (three-monthis three-month LIBOR plus 3 percent) and has a term of four years. The loan is guaranteed by a pledge of one contract for the sale of copper concentrate and one contract for the sale of lead concentrate. As of December 31, 2012, US$60.0 million was outstanding under this loan. The interest expense related to this loan was US$0.3 million during the year ended December 31, 2012, which resulted in an increase in mining concessions, development cost and property, plant and equipment, net.4.60%.
Exploration Costs;Costs and Capital Expenditures
CapitalWe have budgeted approximately US$250 to US$300 million for capital expenditures for 2013 are estimated to be approximately US$300 million.2016. These budgeted capital expenditures include the following projects: the expansion of El Brocal treatment plant,finishing the construction of the Procesadora Industrial Rio Seco chemical plant to treat concentrates from UchucchacuaTambomayo project and continuing with the constructiondevelopment of the Huanza hydroelectrical plant.San Gabriel project.
During 2012,2015, we spent approximately US$95.530.6 million on “greenfield”“exploration in non-operating areas” and US$153.091.5 million on “brownfield” exploration-related investments primarily“exploration in Peru and, to a lesser extent,units in Chile and Mexico.operations.” Our “greenfield”“exploration in non-operating areas” investments mainly focused on the following exploration projects: Trapiche, Tambomayo, San Gregorio, Chancas, Hualgayoc,Alejandra, Marcapunta, Colquemayo, Surichata and El Faique.Pisacalla projects. Our “brownfield”“exploration in units in operations” investments were mainly focused in the Orcopampa, Poracota, Uchucchacua Antapite, Mallay, Recuperada and Julcani areas. We financed our 2012 exploration program with internal funds.mining units.
In 2013,2016, we intend to invest approximately US$100 to US$12070 million in brownfield exploration projects. In 2013, we expect to invest approximately US$70 to US$80 million in greenfield exploration projects,of units in operation and US$10 million to US$20 million mainly in the following greenfield exploration projects:of non-operating areas, including Tambomayo, Trapiche, San Gregorio, Hualgayoc, ColquemayoYumpag, Palla Palla and El Faique,Daniela, among others.
We expect that we will meet our working capital, capital expenditure and exploration expense requirements for the next several years from internally generated funds, cash on hand and dividends received from our investments in non-consolidated mining operations, including Yanacocha. Additional financing, if necessary for the construction of any project, is expected to be obtained from borrowings under bank loans and the issuance of debt securities. There can be no assurance, however, that sufficient funding will be available to us from the internal or external sources to finance any future capital expenditure program, or that external funding will be available to us for such purpose on terms or at prices favorable to us. A very significant decline in the prices of gold and silver would be reasonably likely to affect the availability of such sources of liquidity. In addition, if we fund future capital expenditures from internal cash flow, there may be lessfewer funds available for the payment of dividends.
Recent Accounting Pronouncements
IFRS
We prepare and present the Financial Statements in accordance withIFRS as issued by the IASB. For periods up to and including the year ended December 31, 2010, we prepared our financial statements in accordance with Peruvian GAAP. Our consolidated financial statements for the year ended December 31, 2011 arewere the first that we have prepared in accordance with IFRS. We have applied IFRS 1 “First-time“First-Time Adoption of International Financial Reporting Standards” to the opening balance as of January 1, 2010, the date of our transition to IFRS. The IFRS 1 application implies that all the standards are applied retrospectively at the transition date, including certain mandatory exceptions and voluntary exemptions defined in the standard. In addition, as a foreign private issuer in the United States, we are subject to less intensive reporting requirements and information regarding us may not be as readily disseminated into the market.
Improvements and interpretations issued as of December 31, 2012, include the following:
Effective the year 2012 –
There were no newThe standards and interpretations that wereare issued, but not yet effective, up to the date of issuance of our Financial Statements are disclosed below. We intend to adopt these standards, if applicable, when they become effective:
IFRS 9, “Financial Instruments: Classification and Measurement” In July 2014, the IASB issued the final version of IFRS 9 Financial Instruments which reflects all phases of the financial instruments project and replaces IAS 39 and all previous versions of IFRS 9. IFRS 9 brings together all three aspects of the accounting for financial instruments project: classification and measurement, impairment and hedge accounting. IFRS 9 is effective for annual periods beginning on or after January 1, 2018, with early application permitted. Except for hedge accounting, retrospective application is required, but the provision of comparative information is not compulsory. For hedge accounting, the requirements are generally applied prospectively, with some limited exceptions. The adoption of IFRS 9 would have not significant effect on the classification and measurement of our financial assets and liabilities. IFRS 15, “Revenues from Contracts with Customers”
IFRS 15 was issued in May 2014 and establishes a new five-step model that will apply to revenue arising from contracts with customers. Under IFRS 15, revenue is recognized at an amount that reflects the consideration to which an entity expects to be entitled in exchange for transferring goods or services to a customer. The principles in IFRS 15 provide a more structured approach to measuring and recognizing revenue. The new revenue standard is applicable to usall entities and will supersede all current revenue recognition requirements under IFRS. Either a full retrospective application or a modified retrospective application is required for 2012.annual periods beginning on or after January 1, 2018. Early adoption is permitted. We are currently assessing the impact of IFRS 15 and plans to adopt the new standard on the required effective date.
Effective as from January 1, 2013 -
| - | IAS 1, Presentation of Financial Statements, effective for annual periods beginning on July 1, 2012. The amendments to IAS 1 change the grouping of items presented in the statement of comprehensive income. |
| - | IAS 27, Separate Financial Statements (revised in 2011), effective for annual periods beginning on January 1, 2013. As a consequence of the new IFRS 10 and IFRS 12, what remains in IAS 27 is limited to accounting for subsidiaries, joint arrangements and associates in separate financial statements. |
| - | IAS 28, Investments in associates and joint ventures (revised in 2011), effective for annual periods beginning on January 1, 2013. As a consequence of the new IFRS 11 and IFRS 12, IAS 28 Investments in Associates and Joint Ventures, describes the application of the equity method to investments in joint ventures in addition to associates. |
| - | IFRS 9, “Financial Instruments”, effective January 1, 2015, modifies the treatment and classification of financial assets established by IAS 39, “Financial Instruments: Recognition and Measurement”. |
| - | IFRS 10, “Consolidated Financial Statements”, effective January 1, 2013, replaces the consolidation requirements in SIC-12, “Consolidation—Special Purpose Entities” and IAS 27, “Consolidated and Separate Financial Statements”. |
| - | IFRS 11, “Joint Arrangement”, effective January 1, 2013, addresses inconsistencies in the reporting of joint arrangements by requiring a single method to account for interests in jointly controlled entities. The guidance focuses on the rights and obligations of the joint arrangement, rather than its legal form (as is currently the case). |
| - | IFRS 12, “Disclosure of Interests in Other Entities”, effective January 1, 2013, is a new and comprehensive standard on disclosure requirements for all forms of interests in other entities, including subsidiaries, joint arrangements, associates and unconsolidated structured entities. |
| - | IFRS 13, “Fair Value Measurement”, effective January 1, 2013, defines fair value, sets out a framework for measuring fair value and requires disclosures about fair value measurements. |
| - | IFRIC 20, “Stripping Costs in the Production Phase of a Surface Mine”, effective January 1, 2013, clarifies when the stripping cost in the production phase should be recognized as an asset and how that asset should be measured, both initially and in subsequent periods. |
Annual improvementsAmendments to IFRS (issued in May 2012) -10 and IAS 28, Sale or contributions of assets between an investor and its associate or joint venture.
| - | IAS 1, Presentation of Financial Statements, clarifies the difference between voluntary annual comparative informationThe amendments address the conflict between IFRS 10 Consolidated Financial Statements and IAS 28 in dealing with the loss of control of a subsidiary that is sold or contributed to an associate or joint venture. The amendments clarify that the gain or loss resulting from the sale or contribution of assets that constitute a business, as defined in IFRS 3, between an investor and its associate or joint venture, is recognized in full. Any gain or loss resulting from the sale or contribution of assets that do not constitute a business, however, is recognized only to the extent of unrelated investors’ interests in the associate or joint venture. These amendments must be applied prospectively and the minimum required of comparative period is the previous period. |
| - | IAS 16, Property, Plant and Equipment, clarifies that major spare parts and servicing equipments that meet the definition of property, plant and equipment are not inventories. |
| - | IAS 32, Financial Instruments: Presentation, clarifies that income taxes arising from distributions to equity holders are accounted for in accordance with IAS 12. |
Such improvements are effective for annual periods beginning on or after January 1, 2013.2016, with early adoption permitted. These amendments will impact us to the extent that it undertakes future transactions of this nature, as this accounting approach differs from that which it would currently apply.
Although we do not believe the new pronouncements will have a significant impact on us, we are currently evaluating their impact, if any, on our consolidated financial statements for 2013.
C. Research and Development
| B. | Research and Development |
Not applicable.
D. Trend Information
Other than as disclosed in this Annual Report, we are not aware of any trends, uncertainties, demands, commitments or events which are reasonably likely to have a material effect upon our net sales or revenues, income from continuing operations, profitability, liquidity or capital resources, or that would cause reported financial information to be not necessarily indicative of future operating results or financial condition.
For our exploration activities, there is no production, sales or inventory in a conventional sense. Our financial success is dependent upon the extent to which we are capable of discovering mineralization and the economic viability of exploration properties. The construction and operation of such properties may take years to complete and the resulting income, if any, cannot be determined with certainty. Further, the sales value of mineralization discovered by us is largely dependent upon factors beyond our control, including the market value at any given time of the metals produced.
E. Off-Balance Sheet Arrangements
| D. | Off-Balance Sheet Arrangements |
There are no off-balance sheet arrangements that have or are reasonably likely to have a current or future effect on our financial condition, changes in financial condition, revenues or expenses, results of operations, liquidity, capital expenditures or capital resources that are material to investors.
103 | E. | Tabular Disclosure of Contractual Obligations |
F. Tabular Disclosure of Contractual Obligations
The following table shows our contractual obligations as of December 31, 2012:2015:
| | | | | Payments due by Period (US$ in millions) | | | Payments due by Period (US$ in millions) | |
| | | | | Less than | | 1-2 | | 2-5 | | More than | | | Total | | | Less than
1 year | | | 1-2
years | | | 2-5
years | | | More than
5 years | |
| | | Total | | 1 year | | years | | years | | 5 years | | |
| Long-Term Debt (principal and interest)(*) | | | 188.5 | | | | 6.1 | | | | 29.8 | | | | 29.7 | | | | 122.9 | | |
| Capital Lease Obligations | | | - | | | | - | | | | - | | | | - | | | | - | | |
| Long-Term Debt (principal and interest) | | | | – | | | | – | | | | – | | | | – | | | | – | |
| Capital Lease Obligations (*) | | | | 414.6 | | | | 47.9 | | | | 92.5 | | | | 274.2 | | | | – | |
| Open Purchase Orders | | | - | | | | - | | | | - | | | | - | | | | - | | | | – | | | | – | | | | – | | | | – | | | | – | |
| Other Long-Term Obligations | | | - | | | | - | | | | - | | | | - | | | | - | | | | – | | | | – | | | | – | | | | – | | | | – | |
| Total Contractual Cash Obligations | | | 188.5 | | | | 6.1 | | | | 29.8 | | | | 29.7 | | | | 122.9 | | | | 414.6 | | | | 47.9 | | | | 92.5 | | | | 274.2 | | | | – | |
| (*) | Long-term debt includesCapital lease obligations include: (i) US$119.0222.8 million (including US$188.1 million in principal and US$34.7 million interest payments), which relates to a financial lease agreement between Banco de Crédito del Perú and Conenhua, Huanza and us for construction of a hydroelectric power station.station; (ii) US$182.6 million (including US$156.3 million in principal and US$26.3 million interest payments), which relates to a sale and leaseback arrangement between Banco de Crédito del Perú and El Brocal; and (iii) US$9.1 million, which relates to a financial lease between Banco de Crédito del Perú and BISA for construction of administrative offices. |
As of December 31, 2012,2015, we had no other commercial commitments.
104 | F. | Reconciliation of Costs Applicable to Sales and Cost Applicable to Sales per Unit Sold |
Cost applicable to sales and Cost applicable to sales per unit of mineral sold are not measures of financial performance under IFRS, and may not be comparable to similarly titled measures of other companies. We consider Cost applicable to sales and Cost applicable to sales per unit of mineral sold to be key measures in managing and evaluating our operating performance. These measures are widely reported in the precious metals industry as a benchmark for performance, but do not have standardized meanings. You should not consider Cost applicable to sales or Cost applicable to sales per unit of mineral sold as alternatives to cost of sales determined in accordance with IFRS, as indicators of our operating performance. Cost applicable to sales and Cost applicable to sales per unit of mineral sold are calculated without adjusting for by-product revenue amounts.
In calculating these figures, we utilize financial records maintained with respect to the various mining units and subsidiaries, each on a standalone basis. Within the stand-alone accounts for each mining unit or subsidiary, we then allocate cost of sales (excluding depreciation and amortization), exploration in units in operation and selling expenses in the proportion to each mineral’s commercial value (realized price multiplied by volume sold).
The tables below set forth (i) a reconciliation of consolidated Cost of sales, excluding depreciation and amortization to consolidated Cost applicable to sales, (ii) reconciliations of the components of Cost applicable to sales (by mine and mineral) to the corresponding consolidated line items set forth on our consolidated statements of profit or loss for the years ended December 31, 2014 and 2015, and (iii) reconciliations of Cost of sales, excluding depreciation and amortization to Cost applicable to sales for each of our mining units. The amounts set forth in Cost applicable to sales and Cost applicable to sales per unit sold for each mine and mineral indicated in the tables below can be reconciled to the amounts set forth on our consolidated statements of profit or loss for the years ended December 31, 2014 and 2015 by reference to the reconciliations of Cost of sales, excluding depreciation and amortization (by mine and mineral), Selling Expenses (by mine and metal) expenses and Exploration in units in operations (by mine and mineral) to consolidated Cost of sales, excluding depreciation and amortization, consolidated Selling Expenses and consolidated Exploration in units in operations expenses, set forth below.
Set forth below is a reconciliation of consolidated Cost of sales, excluding depreciation and amortization, to consolidated Cost applicable to sales:
| | | For the year ended December 31, | |
| | | 2014 | | | 2015 | |
| | | (in thousands of US$) | |
| Consolidated Cost of sales excluding depreciation and amortization | | | 614,539 | | | | 590,405 | |
| Add: | | | | | | | | |
| Consolidated Exploration in units in operation | | | 97,853 | | | | 91,520 | |
| Commercial Deductions | | | 184,483 | | | | 196,211 | |
| Consolidated Selling expenses | | | 16,605 | | | | 19,481 | |
| Consolidated Cost applicable to sales | | | 913,480 | | | | 897,618 | |
Set forth below is a reconciliation of Cost of sales, excluding depreciation and amortization (by mine and mineral) to consolidated cost of sales Cost of sales, excluding depreciation and amortization:
| | | For the year ended December 31, | |
| | | 2014 | | | 2015 | |
| Cost of sales by mine and mineral | | (US$ in thousands) | |
| Julcani, Gold | | | 3 | | | | 49 | |
| Julcani, Silver | | | 23,117 | | | | 23,135 | |
| Julcani, Lead | | | 1,891 | | | | 1,906 | |
| Julcani, Copper | | | 190 | | | | 242 | |
| Mallay, Gold | | | 0 | | | | 201 | |
| Mallay, Silver | | | 8,135 | | | | 8,014 | |
| Mallay, Lead | | | 5,959 | | | | 5,190 | |
| Mallay, Zinc | | | 7,497 | | | | 6,256 | |
| Breapampa, Gold | | | 35,389 | | | | 9,780 | |
| Breapampa, Silver | | | 2,459 | | | | 1,681 | |
| Orcopampa, Gold | | | 107,550 | | | | 104,603 | |
| Orcopampa, Silver | | | 3,070 | | | | 3,525 | |
| Uchucchacua, Gold | | | 0 | | | | 25 | |
| Uchucchacua, Silver | | | 132,110 | | | | 110,724 | |
| Uchucchacua, Lead | | | 8,115 | | | | 6,377 | |
| Uchucchacua, Zinc | | | 5,618 | | | | 4,841 | |
| La Zanja, Gold | | | 79,713 | | | | 110,848 | |
| La Zanja, Silver | | | 3,426 | | | | 3,367 | |
| El Brocal, Gold | | | 3,491 | | | | 4,258 | |
| El Brocal, Silver | | | 12,331 | | | | 21,024 | |
| El Brocal, Lead | | | 2,051 | | | | 15,244 | |
| El Brocal, Zinc | | | 6,478 | | | | 42,157 | |
| El Brocal, Copper | | | 96,934 | | | | 68,711 | |
| Non Mining Units | | | 69,011 | | | | 38,246 | |
| Consolidated Cost of sales, excluding depreciation and amortization | | | 614,539 | | | | 590,405 | |
Set forth below is a reconciliation of Exploration in units in operation expenses (by mine and mineral) to consolidated Exploration in units in operation expenses:
| | | For the year ended December 31, | |
| Exploration in units in operation by mine and mineral | | 2014 | | | 2015 | |
| | | (US$ in thousands) | |
| Julcani, Gold | | | 2 | | | | 25 | |
| Julcani, Silver | | | 10,072 | | | | 11,598 | |
| Julcani, Lead | | | 824 | | | | 956 | |
| Julcani, Copper | | | 83 | | | | 121 | |
| Mallay, Gold | | | 0 | | | | 77 | |
| Mallay, Silver | | | 2,942 | | | | 3,073 | |
| Mallay, Lead | | | 2,155 | | | | 1,990 | |
| Mallay, Zinc | | | 2,711 | | | | 2,399 | |
| Breapampa, Gold | | | 463 | | | | 1,554 | |
| Breapampa, Silver | | | 32 | | | | 267 | |
| Orcopampa, Gold | | | 50,378 | | | | 40,307 | |
| Orcopampa, Silver | | | 1,438 | | | | 1,358 | |
| Uchucchacua, Gold | | | 1 | | | | 6 | |
| Uchucchacua, Silver | | | 24,125 | | | | 25,222 | |
| Uchucchacua, Lead | | | 1,482 | | | | 1,453 | |
| Uchucchacua, Zinc | | | 1,026 | | | | 1,103 | |
| La Zanja, Gold | | | 115 | | | | 11 | |
| La Zanja, Silver | | | 5 | | | | 0 | |
| El Brocal, Gold | | | 0 | | | | 0 | |
| El Brocal, Silver | | | 0 | | | | 0 | |
| El Brocal, Lead | | | 0 | | | | 0 | |
| El Brocal, Zinc | | | 0 | | | | 0 | |
| El Brocal, Copper | | | 0 | | | | 0 | |
| Non Mining Units | | | 0 | | | | 0 | |
| Consolidated Exploration in units in operation | | | 97,853 | | | | 91,520 | |
Set forth below is a reconciliation of Commercial deductions (by mine and mineral) to consolidated Commercial deductions in operation expenses:
| | | For the year ended December 31, | |
| Commercial Deductions in units in operation by mine and mineral | | 2014 | | | 2015 | |
| | | (US$ in thousands) | |
| Julcani, Gold | | | 2 | | | | 14 | |
| Julcani, Silver | | | 6,148 | | | | 7,258 | |
| Julcani, Lead | | | 502 | | | | 591 | |
| Julcani, Copper | | | 53 | | | | 81 | |
| Mallay, Gold | | | 0 | | | | 89 | |
| Mallay, Silver | | | 3,687 | | | | 4,098 | |
| Mallay, Lead | | | 2,620 | | | | 2,655 | |
| Mallay, Zinc | | | 5,153 | | | | 4,313 | |
| Breapampa, Gold | | | 99 | | | | 62 | |
| Breapampa, Silver | | | 0 | | | | 5 | |
| Orcopampa, Gold | | | 288 | | | | 255 | |
| Orcopampa, Silver | | | 1 | | | | 0 | |
| Uchucchacua, Gold | | | 0 | | | | 7 | |
| Uchucchacua, Silver | | | 35,786 | | | | 37,753 | |
| Uchucchacua, Lead | | | 2,248 | | | | 2,161 | |
| Uchucchacua, Zinc | | | 3,850 | | | | 5,457 | |
| La Zanja, Gold | | | 240 | | | | 194 | |
| La Zanja, Silver | | | 4 | | | | 18 | |
| El Brocal, Gold | | | 3,777 | | | | 4,847 | |
| El Brocal, Silver | | | 12,345 | | | | 13,583 | |
| El Brocal, Lead | | | 1,317 | | | | 6,669 | |
| El Brocal, Zinc | | | 4,105 | | | | 24,622 | |
| El Brocal, Copper | | | 102,258 | | | | 81,479 | |
| Non Mining Units | | | 0 | | | | 0 | |
| Consolidated Commercial Deductions in units in operation | | | 184,483 | | | | 196,211 | |
Set forth below is a reconciliation of Selling expenses (by mine and mineral) to consolidated selling expenses:
| | | For the year ended December 31, | |
| Selling expenses by mine and mineral | | 2014 | | | 2015 | |
| | | (US$ in thousands) | |
| Julcani, Gold | | | 0 | | | | 2 | |
| Julcani, Silver | | | 979 | | | | 963 | |
| Julcani, Lead | | | 80 | | | | 79 | |
| Julcani, Copper | | | 8 | | | | 10 | |
| Mallay, Gold | | | 0 | | | | 15 | |
| Mallay, Silver | | | 661 | | | | 580 | |
| Mallay, Lead | | | 484 | | | | 376 | |
| Mallay, Zinc | | | 609 | | | | 453 | |
| Breapampa, Gold | | | 367 | | | | 99 | |
| Breapampa, Silver | | | 26 | | | | 17 | |
| Orcopampa, Gold | | | 929 | | | | 823 | |
| Orcopampa, Silver | | | 27 | | | | 28 | |
| Uchucchacua, Gold | | | 0 | | | | 1 | |
| Uchucchacua, Silver | | | 3,099 | | | | 3,228 | |
| Uchucchacua, Lead | | | 190 | | | | 186 | |
| Uchucchacua, Zinc | | | 132 | | | | 141 | |
| La Zanja, Gold | | | 1,382 | | | | 1,172 | |
| La Zanja, Silver | | | 59 | | | | 36 | |
| El Brocal, Gold | | | 204 | | | | 255 | |
| El Brocal, Silver | | | 722 | | | | 1,258 | |
| El Brocal, Lead | | | 120 | | | | 912 | |
| El Brocal, Zinc | | | 379 | | | | 2,522 | |
| El Brocal, Copper | | | 5,677 | | | | 4,110 | |
| Non Mining Units | | | 470 | | | | 2,217 | |
| Consolidated Selling expenses | | | 16,605 | | | | 19,481 | |
Set forth below is a reconciliation of Cost of sales, excluding depreciation and amortization, to Cost applicable to sales and Cost applicable to sales per unit of mineral for the Julcani mine:
| | | JULCANI | |
| | | COPPER (t) | | | GOLD (oz.) | | | LEAD (t) | | | SILVER (oz.) | |
| | | For the year ended December 31, | | | For the year ended December 31, | | | For the year ended December 31, | | | For the year ended December 31, | |
| | | 2014 | | | 2015 | | | 2014 | | | 2015 | | | 2014 | | | 2015 | | | 2014 | | | 2015 | |
| | | (US$ in thousands except operating and per unit data) | |
| Cost of Sales, excluding depreciation and amortization | | | 190 | | | | 242 | | | | 3 | | | | 49 | | | | 1,891 | | | | 1,906 | | | | 23,117 | | | | 23,135 | |
| Add: | | | | | | | | | | | | | | | | | | | | | | | | | | | | | | | | |
| Exploration in units in operation | | | 83 | | | | 121 | | | | 2 | | | | 25 | | | | 824 | | | | 956 | | | | 10,072 | | | | 11,598 | |
| Commercial Deductions | | | 53 | | | | 81 | | | | 2 | | | | 14 | | | | 502 | | | | 591 | | | | 6,148 | | | | 7,258 | |
| Selling expenses | | | 8 | | | | 10 | | | | 0 | | | | 2 | | | | 80 | | | | 79 | | | | 979 | | | | 963 | |
| Cost applicable to sales | | | 335 | | | | 454 | | | | 7 | | | | 90 | | | | 3,297 | | | | 3,533 | | | | 40,316 | | | | 42,954 | |
| Divide: | | | | | | | | | | | | | | | | | | | | | | | | | | | | | | | | |
| Volume Sold | | | 64 | | | | 103 | | | | 12 | | | | 94 | | | | 2,057 | | | | 2,478 | | | | 2,851,318 | | | | 3,493,166 | |
| | | | 5,195 | | | | 4,416 | | | | 603 | | | | 955 | | | | 1,603 | | | | 1,425 | | | | 14.14 | | | | 12.30 | |
Set forth below is a reconciliation of Cost of sales, excluding depreciation and amortization, to cost applicable to sales and Cost applicable to sales per unit of mineral for the Mallay mine:
| | | MALLAY | |
| | | LEAD (t) | | | SILVER (oz.) | | | ZINC (t) | |
| | | For the year ended December 31, | | | For the year ended December 31, | | | For the year ended December 31, | |
| | | 2014 | | | 2015 | | | 2014 | | | 2015 | | | 2014 | | | 2015 | |
| | | (US$ in thousands except operating and per unit data) | |
| Cost of Sales, excluding depreciation and amortization | | | 5,959 | | | | 5,190 | | | | 8,135 | | | | 8,014 | | | | 7,497 | | | | 6,256 | |
| Add: | | | | | | | | | | | | | | | | | | | | | | | | |
| Exploration in units in operation | | | 2,155 | | | | 1,990 | | | | 2,942 | | | | 3,073 | | | | 2,711 | | | | 2,399 | |
| Commercial Deductions | | | 2,620 | | | | 2,655 | | | | 3,687 | | | | 4,098 | | | | 5,153 | | | | 4,313 | |
| Selling expenses | | | 484 | | | | 376 | | | | 661 | | | | 580 | | | | 609 | | | | 453 | |
| Cost applicable to sales | | | 11,217 | | | | 10,211 | | | | 15,425 | | | | 15,766 | | | | 15,970 | | | | 13,421 | |
| Divide: | | | | | | | | | | | | | | | | | | | | | | | | |
| Volume Sold | | | 7,253 | | | | 6,612 | | | | 1,121,202 | | | | 1,134,528 | | | | 8,609 | | | | 7,482 | |
| Cost applicable to sales per unit of mineral sold (US$) | | | 1,547 | | | | 1,544 | | | | 13.76 | | | | 13.90 | | | | 1,855 | | | | 1,794 | |
Set forth below is a reconciliation of Cost of sales, excluding depreciation and amortization, to cost applicable to sales and Cost applicable to sales per unit of mineral for the Breapampa mine:
| | | BREAPAMPA | |
| | | GOLD (oz.) | | | SILVER (oz.) | |
| | | For the year ended December 31, | | | For the year ended December 31, | |
| | | 2014 | | | 2015 | | | 2014 | | | 2015 | |
| | | (US$ in thousands except operating and per unit data) | |
| Cost of Sales, excluding depreciation and amortization | | | 35,389 | | | | 9,780 | | | | 2,459 | | | | 1,681 | |
| Add: | | | | | | | | | | | | | | | | |
| Exploration in units in operation | | | 463 | | | | 1,554 | | | | 32 | | | | 267 | |
| Commercial Deductions | | | 99 | | | | 62 | | | | - | | | | 5 | |
| Selling expenses | | | 367 | | | | 99 | | | | 26 | | | | 17 | |
| Cost applicable to sales | | | 36,318 | | | | 11,495 | | | | 2,517 | | | | 1,970 | |
| Divide: | | | | | | | | | | | | | | | | |
| Volume Sold | | | 80,358 | | | | 16,069 | | | | 383,733 | | | | 212,826 | |
| Cost applicable to sales per unit of mineral sold (US$) | | | 452 | | | | 795 | | | | 6.56 | | | | 9.26 | |
Set forth below is a reconciliation of Cost of sales, excluding depreciation and amortization, to cost applicable to sales and Cost applicable to sales per unit of mineral for the Orcopampa mine:
| | | ORCOPAMPA | |
| | | GOLD (oz.) | | | SILVER (oz.) | |
| | | For the year ended December 31, | | | For the year ended December 31, | |
| | | 2014 | | | 2015 | | | 2014 | | | 2015 | |
| | | (US$ in thousands except operating and per unit data) | |
| Cost of Sales, excluding depreciation and amortization | | | 107,550 | | | | 104,603 | | | | 3,070 | | | | 3,525 | |
| Add: | | | | | | | | | | | | | | | | |
| Exploration in units in operation | | | 50,378 | | | | 40,307 | | | | 1,438 | | | | 1,358 | |
| Commercial Deductions | | | 288 | | | | 255 | | | | 1 | | | | 0 | |
| Selling expenses | | | 929 | | | | 823 | | | | 27 | | | | 28 | |
| Cost applicable to sales | | | 159,144 | | | | 145,988 | | | | 4,536 | | | | 4,912 | |
| Divide: | | | | | | | | | | | | | | | | |
| Volume Sold | | | 204,862 | | | | 214,821 | | | | 401,782 | | | | 555,314 | |
| Cost applicable to sales per unit of mineral sold (US$) | | | 777 | | | | 680 | | | | 11.29 | | | | 8.85 | |
Set forth below is a reconciliation of Cost of sales, excluding depreciation and amortization, to cost applicable to sales and Cost applicable to sales per unit of mineral for the Uchucchacua mine:
| | | UCHUCCHACUA | |
| | | LEAD (t) | | | SILVER (oz.) | | | ZINC (t) | |
| | | For the year ended December 31, | | | For the year ended December 31, | | | For the year ended December 31, | |
| | | 2014 | | | 2015 | | | 2014 | | | 2015 | | | 2014 | | | 2015 | |
| | | (US$ in thousands except operating and per unit data) | |
| Cost of Sales, excluding depreciation and amortization | | | 8,115 | | | | 6,377 | | | | 132,110 | | | | 110,724 | | | | 5,618 | | | | 4,841 | |
| Add: | | | | | | | | | | | | | | | | | | | | | | | | |
| Exploration in units in operation | | | 1,482 | | | | 1,453 | | | | 24,125 | | | | 25,222 | | | | 1,026 | | | | 1,103 | |
| Commercial Deductions | | | 2,248 | | | | 2,161 | | | | 35,786 | | | | 37,753 | | | | 3,850 | | | | 5,457 | |
| Selling expenses | | | 190 | | | | 186 | | | | 3,099 | | | | 3,228 | | | | 132 | | | | 141 | |
| Cost applicable to sales | | | 12,035 | | | | 10,177 | | | | 195,120 | | | | 176,927 | | | | 10,626 | | | | 11,543 | |
| Divide: | | | | | | | | | | | | | | | | | | | | | | | | |
| Volume Sold | | | 6,530 | | | | 6,560 | | | | 11,940,167 | | | | 12,666,673 | | | | 4,288 | | | | 4,750 | |
| Cost applicable to sales per unit of mineral sold (US$) | | | 1,843 | | | | 1,551 | | | | 16.34 | | | | 13.97 | | | | 2,478 | | | | 2,430 | |
| | | | | | | | | | | | | | | | | | | | | | | | | |
Set forth below is a reconciliation of Cost of sales, excluding depreciation and amortization, to cost applicable to sales and Cost applicable to sales per unit of mineral for the La Zanja mine:
| | | LA ZANJA | |
| | | GOLD (oz.) | | | SILVER (oz.) | |
| | | For the year ended December 31, | | | For the year ended December 31, | |
| | | 2014 | | | 2015 | | | 2014 | | | 2015 | |
| | | (US$ in thousands except operating and per unit data) | |
| Cost of Sales, excluding depreciation and amortization | | | 79,713 | | | | 110,848 | | | | 3,426 | | | | 3,367 | |
| Add: | | | | | | | | | | | | | | | | |
| Exploration in units in operation | | | 115 | | | | 11 | | | | 5 | | | | 0 | |
| Commercial Deductions | | | 240 | | | | 194 | | | | 4 | | | | 18 | |
| Selling expenses | | | 1,382 | | | | 1,172 | | | | 59 | | | | 36 | |
| Cost applicable to sales | | | 81,450 | | | | 112,224 | | | | 3,495 | | | | 3,421 | |
| Divide: | | | | | | | | | | | | | | | | |
| Volume Sold | | | 143,151 | | | | 142,299 | | | | 418,565 | | | | 324,151 | |
| Cost applicable to sales per unit of mineral sold (US$) | | | 569 | | | | 789 | | | | 8.35 | | | | 10.55 | |
Set forth below is a reconciliation of Cost of sales, excluding depreciation and amortization, to cost applicable to sales and Cost applicable to sales per unit of mineral for the El Brocal mine:
| | | EL BROCAL | |
| | | COPPER (t) | | | GOLD (oz.) | | | LEAD (t) | | | SILVER (oz.) | | | ZINC (t) | |
| | | For the year ended December 31, | | | For the year ended December 31, | | | For the year ended December 31, | | | For the year ended December 31, | | | For the year ended December 31, | |
| | | 2014 | | | 2015 | | | 2014 | | | 2015 | | | 2014 | | | 2015 | | | 2014 | | | 2015 | | | 2014 | | | 2015 | |
| | | (US$ in thousands except operating and per unit data) | |
| Cost of Sales, excluding depreciation and amortization | | | 96,934 | | | | 68,711 | | | | 3,491 | | | | 4,258 | | | | 2,051 | | | | 15,244 | | | | 12,331 | | | | 21,024 | | | | 6,478 | | | | 42,157 | |
| Add: | | | | | | | | | | | | | | | | | | | | | | | | | | | | | | | | | | | | | | | | |
| Exploration in units in operation | | | - | | | | - | | | | - | | | | - | | | | - | | | | - | | | | - | | | | - | | | | - | | | | - | |
| Commercial Deductions | | | 102,258 | | | | 81,479 | | | | 3,777 | | | | 4,847 | | | | 1,317 | | | | 6,669 | | | | 12,345 | | | | 13,583 | | | | 4,105 | | | | 24,622 | |
| Selling expenses | | | 5,677 | | | | 4,110 | | | | 204 | | | | 255 | | | | 120 | | | | 912 | | | | 722 | | | | 1,258 | | | | 379 | | | | 2,522 | |
| Cost applicable to sales | | | 204,869 | | | | 154,300 | | | | 7,472 | | | | 9,359 | | | | 3,488 | | | | 22,826 | | | | 25,398 | | | | 35,865 | | | | 10,962 | | | | 69,301 | |
| Divide: | | | | | | | | | | | | | | | | | | | | | | | | | | | | | | | | | | | | | | | | |
| Volume Sold | | | 40,198 | | | | 28,991 | | | | 7,874 | | | | 7,181 | | | | 2,759 | | | | 16,739 | | | | 1,928,243 | | | | 2,637,215 | | | | 8,007 | | | | 43,297 | |
| Cost applicable to sales per unit of mineral sold (US$) | | | 5,096 | | | | 5,322 | | | | 949 | | | | 1,303 | | | | 1,264 | | | | 1,364 | | | | 13.17 | | | | 13.60 | | | | 1,369 | | | | 1,364 | |
Set forth below is a reconciliation of Cost of sales, excluding depreciation and amortization, to cost applicable to sales and Cost applicable to sales per unit of mineral for non-mining units:
| | | NON-MINING UNITS | |
| | | TOTAL | |
| | | For the year ended December 31, | |
| | | 2014 | | | 2015 | |
| | | (US$ in thousands) | |
| Cost of Sales, excluding depreciation and amortization | | | 69,011 | | | | 38,246 | |
| Add: | | | | | | | | |
| Exploration in units in operation | | | 0 | | | | 0 | |
| Commercial Deductions | | | 0 | | | | 0 | |
| Selling expenses | | | 470 | | | | 2,217 | |
| Total Cost applicable to sales | | | 69,481 | | | | 40,463 | |
YANACOCHA
Introduction
The following discussion should be read in conjunction with the Yanacocha Financial Statements as of December 31, 20112014 and 20122015 and for the years ended December 31, 2010, 20112013, 2014 and 20122015 and the related Notes thereto included elsewhere in this Annual Report. The Yanacocha Financial Statements are prepared and presented in accordance with U.S. GAAPIFRS and in U.S. Dollars.
A. Operating Results
Overview
Yanacocha, the largest gold producer in South America, was established in Peru in January 1992, and commenced production activities in August 1993. Yanacocha’s operations are located in the Andes mountains in Northern Peru, in the area of Cajamarca which is located approximately 900600 kilometers north of Lima and north of the city of Cajamarca, at an altitude of 4,000 meters above sea level. Yanacocha is 51.35 percent51.35% owned by Newmont Mining, through its wholly-owned subsidiary Newmont Second, 43.65 percent43.65% by us through our wholly-owned subsidiary Condesa, and 5 percent5% by IFC.YanacochaIFC. Yanacocha is managed by Newmont Peru S.R.L. See “Item 4. Information on the Company—Yanacocha—B. Business Overview—Management of Yanacocha—General Manager/Management Agreement.”
The table below highlights Yanacocha’s key financial and operating results:
Summary of Financial and Operating Performance
| | | Year Ended December 31, | |
| | | 2012 | | | 2011 | | | 2010 | |
| Gold Sales (in thousands of US$) | | | 2,201,815 | | | | 2,002,602 | | | | 1,778,260 | |
| Gold sold (oz.) | | | 1,335,065 | | | | 1,294,194 | | | | 1,465,541 | |
| Average gold price received (US$/oz.) | | | 1,662 | | | | 1,576 | | | | 1,216 | |
| Costs applicable to sales (US$/oz.) | | | 517 | | | | 581 | | | | 448 | |
| Other expenses(in thousands of US$) | | | 147,641 | | | | 60,192 | | | | 69,152 | |
| Net income (in thousands of US$) | | | 626,540 | | | | 642,387 | | | | 589,894 | |
| Dividends paid (in thousands of US$) | | | - | | | | - | | | | - | |
| | | Year Ended December 31, | |
| | | 2015 | | | 2014 | | | 2013 | |
| Gold sales (in thousands of US$) | | | 1,070,035 | | | | 1,210,457 | | | | 1,458,145 | |
| Gold sold (oz.)(*) | | | 924,175 | | | | 967,970 | | | | 1,023,173 | |
| Average gold price received (US$/oz.) | | | 1,159 | | | | 1,250 | | | | 1,425 | |
| Costs applicable to sales (US$/oz.) | | | 819 | | | | 949 | | | | 983 | |
| Other expenses, net (in thousands of US$) | | | 82,846 | | | | 77,781 | | | | 77,534 | |
| Net income (loss) (in thousands of US$) | | | (450,195 | ) | | | (400,338 | ) | | | (575,279 | ) |
(*) Ounces sold included El Tapado Oeste Pit, Cerro Negro Pit, Marleny Pit production and Verde Bioleach Demonstration Facility.
Gold sales.sales. Gold sales increaseddecreased by 10 percent,12%, or US$199.2140 million, from 20112014 to 2012,2015, due principally toan increase in the average realized price of gold combined with an increase a decrease in the number of ounces sold. and a decreased average realized price of gold. Lower ounces sold were proportionate to lower gold production. Gold ounces produced decreased 4.5% due to lower leach grade material placed on the leach pads containing fewer ounces. Yanacocha has not engaged in gold price hedging activities, such as forward sales or option contracts, to minimize its exposure to fluctuations in the price of gold.
Costs applicable to sales.Costs applicable to sales decreased by 11 percent from 2011 to 2012, due primarily to lower operating costs and lower production taxes, partially offset by higher third-party royalties due to higher sales revenues and lower by-product metal and silver sales credit due to lower production.Costs. Costs applicable to sales include: (i) operating costs, consisting primarily of direct production costs such as mining and treatment of the ore, which are the most significant components of costs applicable to sales, (ii) employeeworkers’ participation profit sharing of 8 percent8% of pre-tax profits calculated in accordance withbased on Peruvian GAAP,labor legislation, (iii) royaltieswrite downs of 3 percent of the quarterlyore on leach pads to net salerealizable value of all goldexpense and silver extracted from the mining concessions payable(iv) other costs. Costs applicable to Chaupiloma after deducting refinery and transportation costs, (iv) management fees payable to Newmont Peru, the operator of Yanacocha, (v) selling expenses, (vi) credit from by-product sales mainly in connection with silver sales, (vii) government mining royalties in connection with the Carachugo mine, which resulted from the expiration of its 15-year stability agreement on January 1, 2010 and (viii) other costs.
Other expenses.Other expenses increased by 45 percent,decreased 19% or US$87.4170 million from 20112014 to 2012, mainly2015. Ounces sold decreased by 4.5% from 2014 to 2015. Costs applicable to sales per ounce of gold decreased by 14%, from US$949 in 2014 to US$819 in 2015.
Other expense (net). Other expense (net) increased 20% or US$15.7 million from 2014 to 2015, primarily due to an employee severance programhigher losses associated with asset sales incurred in order2015 compared to align Yanacocha’s organization with future business needs and increased community development and community affairs activities.2014.
Income tax.tax benefit (expense).Yanacocha’s financial and operating results were impacted by aincluded income and mining tax benefit of US$602.7 million in 2015 compared to an expense of US$361.930.5 million in 2012,2014. The difference was primarily due to Yanacocha’s decreased profitability as the result of lower expenses compared to US$293.0 million in 2011, which reflects Yanacocha’s increased profitability and the full year impact of a new mining tax payable to the Peruvian government for extracting metallic and non-metallic resources.prior year.
Dividends.During the years ended December 31, 20112014 and 2012,2015, Yanacocha did not pay dividends to its partners and did not reserve any money related to reinvestment programs.
Critical Accounting Policies
Yanacocha has furnished us with a discussion of its critical accounting policies or methods used in the preparation of its financial statements. Critical accounting policies are defined as those that are reflective of significant judgments and uncertainties and could potentially impact results under different assumptions and conditions. See Note 2to2 to the Yanacocha Financial Statements includesfor a summary of the significantmore complete listing Yanacocha’s accounting policies and methods used in the preparation of the Yanacocha Financial Statements. The following is a brief discussion of the identified critical accounting policies and the estimates and judgments made by Yanacocha.policies.
Principles of Consolidation
The Consolidated Financial Statements include the accounts of Minera Yanacocha S.R.L. and the San José Reservoir Trust, or the Trust. In November 2008, Yanacocha funded the Trust to ensure the continuous operation of the San José Reservoir after 2018. Yanacocha transferred US$13 million to the Trust in 2008. No withdrawals are allowed until 2018 and Yanacocha is committed to a US$23 million fund as of such date. This Trust is irrevocable and is a separate legal entity. The trustee is FiduPeru S.A. and Yanacocha is the grantor and beneficiary. As a result, Yanacocha consolidates the Trust in the Yanacocha Financial Statements.
Use of EstimatesCurrency
The Yanacocha Financial Statements have been prepared in accordance with U.S. GAAP. The preparation of the Yanacocha Financial Statements requires Yanacocha to make estimates and assumptions that affect the reported amounts of assets and liabilities and the related disclosure of contingent assets and liabilities at the date of the Consolidated Financial Statements and the reported amounts of revenues and expenses during the reporting period. The more significant areas requiring the use of management estimates and assumptions relate to (i) mineral reserves that are the basis for future cash flow estimates utilized in impairment calculations and unit-of-production amortization calculations; (ii) environmental, reclamation and closure obligations; (iii) estimates of recoverable gold and other minerals in stockpile and leach pad inventories; (iv) write-downs of inventory, ore on leach pads and stockpiles to net realizable value; (v) employee benefit liabilities; (vi) valuation allowances for deferred tax assets; (vii) workers’ profit participation; (viii) reserves for contingencies and litigation; and (ix) the fair value and accounting treatment of financial instruments. Yanacocha bases its estimates on historical experience and on various other assumptions that are believed to be reasonable under the circumstances. Accordingly, actual results may differ significantly from these estimates under different assumptions or conditions.
Currency
TheYanacocha Financial Statements are stated in U.S. Dollars, Yanacocha’s functional currency, as most of its transactions are traded, collected and paid in such currency. Transactions in other currencies are recorded in U.S. Dollars based on exchange rates prevailing at the time of such transactions. Monetary assets and liabilities denominated in other currencies are translated into the U.S. Dollar at exchange rates prevailing at the statement of financial positionbalance sheet dates, and any resulting gains or losses are reflected in current earnings.
Cash and Cash Equivalents
Cash and cash equivalents consist of all cash balances and highly liquid investments with an original maturity of three months or less. Because of the short maturity of these balances, the carrying amounts approximate their fair value. Restricted cash is excluded from cash and cash equivalents and is included in other current assets or long-term assets depending on restrictions.
Investments
Management determines the appropriate classification of its investments in equity securities at the time of purchase and reevaluates such determinations at each reporting date. Yanacocha accounts for its marketable security investments as available for sale securities in accordance with FASB Accounting Standards Codification, or ASC, guidance on accounting for certain investments in debt and equity securities. Yanacocha periodically evaluates whether declines in fair values of its investments below Yanacocha’s carrying value are other-than-temporary in accordance with guidance for the meaning of other-than-temporary impairment and its application to certain investments. Yanacocha’s policy is to generally treat a decline in the investment’s quoted market value that has lasted continuously for more than six months as an other-than-temporary decline in value. Yanacocha also monitors its investments for events or changes in circumstances that have occurred that may have a significant adverse effect on the fair value of the investment and evaluates qualitative and quantitative factors regarding the severity and duration of the unrealized loss and Yanacocha’s ability to hold the investment until a forecasted recovery occurs to determine if the decline in value of an investment is other-than-temporary. Declines in fair value below Yanacocha’s carrying value deemed to be other-than-temporary are charged to earnings.
Stockpiles, Ore on Leach Pads and Inventories
As described below, costsCosts that are incurred in or benefit the productive process are accumulated as stockpiles, ore on leach pads and inventories. Stockpiles, ore on leach pads and inventories are carried at the lower of average cost or net realizable value. Net realizable value represents the estimated future sales price of the product based on current and long-term metals prices, less the estimated costs to complete production and bring the product to sale. Write-downs of stockpiles, ore on leach pads and inventories to net realizable value are reported as a component ofCosts applicable to sales.sales. The current portion of stockpiles, ore on leach pads and inventories is determined based on the expected amounts to be processed within the next twelve months. Stockpiles, ore on leach pads and inventories not expected to be processed within the next twelve months are classified as long-term. The major classifications are as follows:
Stockpiles.
Stockpile.Stockpiles represent ore that has been extracted from athe mine and is available for further processing. Stockpiles are measured by estimating the number of tons added and removed from the stockpile, the number of contained ounces (based on assay data) and the estimated metallurgical recovery rates (based on the expected processing method). Stockpile ore tonnages are verified by periodic surveys. Costs are allocated to stockpiles based on relative values of material stockpiled and processed using current mining costs incurred up to the point of stockpiling the ore, including applicable overhead and amortization relating to mining operations, and removed at each stockpile’s average cost per recoverable unit.unit.
Ore on Leach PadsPad.. The recovery of gold from certain gold oxide ores is achieved through the heap leaching process. Under this method, ore is placed on leach pads where it is treated with a chemical solution, which dissolves the gold contained in the ore. The resulting gold-bearing solution is further processed in a plant where the gold is recovered. Costs are added to ore on leach pads based on current mining costs, including applicable overhead and amortization relating to mining operations. Costs are removed from ore on leach pads as ounces are recovered based on the average cost per recoverable ounce of gold on the leach pad.
The estimates of recoverable gold on the leach pads are calculated from the quantities of ore placed on the pads (measured tons added to the leach pads), the grade of ore placed on the leach pads (based on assay data) and a recovery percentage (based on ore type). In general, the leach pads recover approximately 50 percent50% to 95 percent95% of the ultimate recoverable ounces in the first year of leaching, declining each year thereafter until the leaching process is complete.
Although the quantities of recoverable gold placed on the leach pads are reconciled by comparing the grades of ore placed on the pads to the quantities of gold actually recovered (metallurgical balancing), the nature of the leaching process inherently limits the ability to precisely monitor inventory levels. As a result, the metallurgical balancing process is constantly monitored and estimates are refined based on actual results over time. Historically, Yanacocha’s operating results have not been materially impacted by variations between the estimated and actual recoverable quantities of gold on its leach pads. Variations between actual and estimated quantities resulting from changes in assumptions and estimates that do not result in write-downs to net realizable value are accounted for on a prospective basis.
In-process InventoryInventory.. In-process inventories represent materials that are currently in the process of beingconverted to a saleable product. Yanacocha’s conversion processes vary depending on the nature of the ore and the specific processing facility, and include mill in-circuit and leach in-circuit. In-process material is measured based on assays of the material fed into the process and the projected recoveries of the respective plants. In-process inventories are valued at the average cost of the material fed into the process attributable to the source material coming from the mines, stockpiles and/or leach pads plus the in-process conversion costs, including applicable amortization relating to the process facilities incurred to that point in the process.
Precious Metals InventoryInventory.. Precious metals include gold doré and/or gold bullion. Precious metals thatresult from Yanacocha’s mining, processing and refining activities are valued at the average cost of the respective in-process inventories incurred prior tobefore the refining process, plus applicable refining costs.
Concentrate Inventory. Concentrate inventory represents silver, gold and copper concentrate available forshipment. Yanacocha values concentrate inventory at the average cost, including an allocable portion of support costs and amortization. Costs are added and removed to the concentrate inventory based on tons of concentrate and are valued at the lower of average cost or net realizable value.
Materials and Supplies
Materials and supplies are valued at the lower of average cost or net realizable value. Cost includes applicable taxes and freight.
Property, Plant and Mine DevelopmentDevelopment.
Facilities and Equipment. Expenditures for new facilities or equipment and expenditures that extend the useful lives of existing facilities or equipment are capitalized and recorded at cost. The facilities and equipment are amortized using the straight-line method at rates sufficient to amortize such costs over the estimated productive lives, which do not exceed the related estimated mine lives, of such facilities based on proven and probable reserves.
Mine Development.Mine development costs include engineering and metallurgical studies, drilling and other related costs to delineate an ore body, and the removal of overburden to initially expose an ore body at open-pitopen pit surface mines. Costs incurred before mineralization is classified as proven and probable reserves are expensed and classified as an Exploration and orAdvanced projects expense. Capitalization of mine development project costs, that meet the definition of an asset, begins once mineralization is classified as proven and probable reserves.
Drilling and related costs are capitalized for an ore body where proven and probable reserves exist,exist; the activities are directed at obtaining additional information on the ore body or converting non-reserve mineralizationmineralized material to proven and probable reserves. All other drilling and related costs are expensed as incurred. Drilling costs incurred during the production phase for operational ore control are allocated to inventory costs and then included as a component ofCosts applicable to sales.sales.
The cost of removing overburden and waste materials to access the ore body at an open-pitopen pit mine prior tobefore the production phase isare referred to as “pre-stripping costs.” Pre-stripping costs are capitalized during the development of an open-pitopen pit mine. Where multiple open pits exist at a mining complex utilizing common processing facilities, pre-stripping costs are capitalized at each pit. The removal and production of de minimis saleable materials may occur during development and are recorded asOther income, net of incremental mining and processing costs.
The production phase of an open pit mine commences when saleable minerals, beyond a de minimis amount, are produced. Stripping costs incurred during the production phase of a mine are variable production costs that are included as a component of inventory to be recognized inCosts applicable to sales in the same period as the revenue from the sale of inventory.
Yanacocha’s definition of a mine and the mine’s production phase may differ from that of other companies in the mining industry resulting in incomparable allocations of stripping costs to deferred mine development and production costs. Other mining companies may expense pre-stripping costs associated with subsequent pits within a mining complex. Other mining companies may capitalize stripping costs incurred in connection with the production phase.
Mine development costs are amortized using the unit-of-productionunits-of-production (“UOP”) method based on estimated recoverable ounces in proven and probable reserves. To the extent that these costs benefit an entire ore body, they are amortized over the estimated life of the ore body. Costs incurred to access specific ore blocks or areas that only provide benefit over the life of that area are amortized over the estimated life of that specific ore block or area.
Stripping activity asset.Stripping costs are incurred during the production phase of surface mining in accordance with IFRIC 20 “Stripping costs in the production phase of as surface mine,” whereby a stripping asset is recognized only if all of the following criteria are met:
(i) It is probable that the future economic benefit (improved access to the ore body) associated with the stripping activity will flow to the entity;
(ii) The entity can identify the component of the ore body for which access has been improved; and
Mineral Interests(iii) The costs relating to the stripping activity associated with that component can be measured reliably.
The primary components of the ore body on a pit by pit basis, as well as within major pits are identified. Based on these components, stripping activities are analyzed and costs are assigned based on whether they pertained to current inventory production or improved access to future ore bodies (or components of an ore body).
Based on this analysis, Yanacocha allocates the costs associated with improved access to production stripping assets. This allocation is based on the volume of waste and ore extracted in the period compared to expected volume life-of-mine per component of ore body.
Costs allocated to the production stripping activity asset basis in the “waste-to-ore ratio” are subsequently depreciated using the method over the expected useful life of the identified component of the ore body that becomes more accessible as a result of the stripping costs. This depreciation is a production cost and included in the adjustments in inventories.
Mineral Interests.Mineral interests include acquired interests in production, development and exploration stage properties. The mineral interests are capitalized at their fair value at the acquisition date, either as an individual asset purchase or as part of a business combination.
The value of such assets is primarily driven by the nature and amount of mineralized material believed to be contained in such properties. Production stage mineral interests represent interests in operating properties that contain proven and probable reserves. Development stage mineral interests represent interests in properties under development that contain proven and probable reserves. Exploration stage mineral interests represent interests in properties that are believed to potentially contain mineralized material consisting of (i) mineralized material such as inferred material within pits; measured, indicated and inferred material with insufficient drill spacing to qualify as proven and probable reserves; and inferred material in close proximity to proven and probable reserves; (ii) around-mine exploration potential such as inferred material not immediately adjacent to existing reserves and mineralization, but located within the immediate mine area; (iii) other mine-related exploration potential that is not part of measured, indicated or inferred material and is comprised mainly of material outside of the immediate mine area; (iv) greenfield exploration potential that is not associated with any other production, development or exploration stage property, as described above; or (v) any acquired right to explore or extract a potential mineral deposit. Yanacocha’s mineral rights generally are enforceable regardless of whether proven and probable reserves have been established. Yanacocha has the ability and intent to renew mineral interests where the existing term is not sufficient to recover all identified and valued proven and probable reserves and/or undeveloped mineralized material.
Asset ImpairmentImpairment.
Yanacocha reviews and evaluates its long-lived assets for impairment when events or changes in circumstances indicate that the related carrying amounts may not be recoverable. ImpairmentAn impairment is considered to exist if the total of the assets’ estimated future cash flows on an undiscounted basis are less than the carrying amount of the assets. ImpairmentAn impairment loss is measured and recorded based on discounted estimated future cash flows. Future cash flows are estimated based on quantities of recoverable minerals, expected gold and other commodity prices (considering current and historical prices, trends and related factors), production levels, operating costs, capital requirements and reclamation costs, all based on life-of-mine plans. Existing proven and probable reserves and value beyond proven and probable reserves, including mineralization that is not part of the measured, indicated or inferred resource base, are included when determining the fair value of mine site reporting units at acquisition and, subsequently, in determining whether the assets are impaired. The term “recoverable minerals” refers to the estimated amount of gold or other commodities that will be obtained after taking into account losses during ore processing and treatment. Estimates of recoverable minerals from such exploration stage mineral interests are risk adjusted based on management’s relative confidence in such materials. In estimating future cash flows, assets are grouped at the lowest level for which there areis identifiable cash flows that are largely independent of future cash flows from other asset groups. Yanacocha’s estimates of future cash flows are based on numerous assumptions and it is possible that actual future cash flows will be significantly different than the estimates, as actual future quantities of recoverable minerals, gold and other commodity prices, production levels and costs and capital are each subject to significant risks and uncertainties.
Revenue Recognition
Revenue is recognized, net of treatment and refining charges, from a sale when persuasive evidence of an arrangement exists, the price is determinable, the product has been delivered, the title has been transferred to the customer and collection of the sales price is reasonably assured. Revenues from silver and copper sales are credited to Costs applicable to sales as a by-product credit.
Income and Mining Taxes and Profit Sharing
Yanacocha accounts for income and mining taxes and legally required profit sharing using the liability method, recognizing certain temporary differences between the financial reporting basis of Yanacocha’s liabilities and assets and the related income tax basis for such liabilities and assets. This method generates a net deferred income tax liability and profit sharing liability or net deferred income tax asset and profit sharing asset for Yanacocha, as measured by the statutory tax and profit sharing rates in effect as enacted. Yanacocha derives its deferred income tax charge or benefit and profit sharing charge or benefit by recording the change in the net deferred income tax liability and profit sharing liability or net deferred income tax asset and profit sharing asset balance for the year, based on Peruvian income and mining tax and profit sharing rates.
Yanacocha’s deferred income tax assets include certain future tax benefits. Yanacocha records a valuation allowance against any portion of those deferred income tax assets when it believes, based on the weight of available evidence, it is more likely than not that some portion or all of the deferred income tax asset will not be realized.
Deferred income tax assets are recognized only to the extent that it is probable that future taxable profit will be available against which the temporary differences can be utilized.
Deferred income tax assets and liabilities are offset when there is a legally enforceable right to offset current tax assets against current tax liabilities and when the deferred income tax assets and liabilities relate to income taxes levied by the same taxation authority on either the same taxable entity or different taxable entities where there is an intention to settle the balances on a net basis.
Reclamation and Remediation Costs
Asset retirementReclamation obligations are recognized when incurred and recorded as liabilities at fair value. The liability is accreted over time through periodic charges to earnings. In addition, the asset retirement cost (“ARC”) is capitalized as part of the asset’s carrying value and amortized over the life of the related asset. Reclamation costs are periodically adjusted to reflect changes in the estimated present value resulting from the passage of time and revisions to the estimates of either the timing or amount of the reclamation costs. The estimated retirement obligation is based on when spending for an existing environmental disturbance willis expected to occur. Yanacocha reviews, on an annual basis, unless otherwise deemed necessary, the reclamation obligation at each mine site in accordance with ASC guidance for reclamation obligations.site.
Future remediation costs for inactive mines are accrued based on management’s best estimate at the end of each period of the costs expected to be incurred at a site. Such cost estimates include, where applicable, ongoing care, maintenance and monitoring costs. Changes in estimates at inactive mines are reflected in earnings in the period an estimate is revised.
Comprehensive Income
In addition to Net income, Comprehensive income (loss) includes all changes in equity during a period, such as cumulative unrecognized changes in fair value of marketable securities available-for-sale or other investments, except those resulting from investments by and distributions to owners.
Recently Adopted Accounting Pronouncements
Fair Value Accounting.In May 2011, ASC guidance was issued related to disclosures around fair value accounting. The updated guidance clarifies different components of fair value accounting, including the application of the highest and best use and valuation premise concepts, measuring the fair value of an instrument classified in a reporting entity’s shareholders’ equity and disclosing quantitative information about the unobservable inputs used in fair value measurements that are categorized in Level 3 of the fair value hierarchy. Yanacocha’s January 1, 2012 adoption of the updated guidance had no impact on Yanacocha’s consolidated financial position, results of operations or cash flows. Refer to note 6 for further details regarding Yanacocha’s assets and liabilities measured at fair value.
Comprehensive Income.In June 2011, ASC guidance was issued related to comprehensive income. Under the updated guidance, an entity will have the option to present the total of comprehensive income either in a single continuous statement of comprehensive income or in two separate but consecutive statements. In addition, the update requires certain disclosure requirements when reporting other comprehensive income. The update does not change the items reported in other comprehensive income or when an item of other comprehensive income must be reclassified to income. Yanacocha adopted the new guidance and its deferral and opted to present the total of comprehensive income in two separate but consecutive statements effective for its fiscal year beginning January 1, 2011. The early adoption had no impact on Yanacocha’s consolidated financial position, results of operations or cash flows.
Recently Issued Accounting Pronouncements
Reporting of Amounts reclassified out of Accumulated Other Comprehensive Income.Income
In February 2013, ASC guidance was issued related to items reclassified from Accumulated Other Comprehensive Income.Income (Loss). The new standard requires the disclosure, either in a single note or parenthetically on the face of the financial statements, as to:of: (i) the effect of significant amounts reclassified from each component of accumulated other comprehensive income based on its source and (ii) the income statement line items affected by the reclassification. The update isAdoption of the new guidance, effective for Yanacocha’s fiscal year beginning January 1, 2013, with early adoption permitted. Yanacocha does not expect the updated guidance to have a significanthad no impact on the consolidated financial position, results of operations or cash flows.
Disclosures about Offsetting Assets and Liabilities.Liabilities
In November 2011, ASC guidance was issued related to disclosures about offsetting assets and liabilities. The new standard requires disclosures to allow investors to better compare financial statements prepared under U.S. GAAP with financial statements prepared under IFRS. The update is effective for Yanacocha’s fiscal year beginning January 1, 2013, and interim periods within those annual periods. Retrospective application is required.
In January 2013, ASC guidancean update was issued to further clarify that the disclosure requirements are limited to derivatives, repurchase agreements, and securities lending transactions to the extent that they are (i) offset in the financial statements or (ii) subject to an enforceable master netting arrangement or similar agreement.
Adoption of the new guidance, effective for the fiscal year beginning January 1, 2013, had no impact on the consolidated financial position, results of operations or cash flows.
Recently Issued Accounting Pronouncements
Presentation of an Unrecognized Tax Benefit
In July 2013, Accounting Standards Codification (“ASC”) guidance was issued related to the presentation of an unrecognized tax benefit when a net operating loss carry forward, a similar tax loss or a tax credit carry forward exists. The updated guidance requires an entity to net its unrecognized tax benefits against the deferred tax assets for all same jurisdiction net operating loss carry forward, a similar tax loss, or tax credit carry forwards. A gross presentation will be required only if such carry forwards are not available or would not be used by the entity to settle any additional income taxes resulting from disallowance of the uncertain tax position. The update is effective prospectively for the Yanacocha’s fiscal year beginning January 1, 2014. Yanacocha does not expectis still evaluating the impact of the updated guidance to have an impact on the consolidated financial position, results of operations or cash flows.
Results of Operations for the Years Ended December 31, 20122015 and 20112014
Sales
Sales increasedGold sales. Gold sales decreased by 10 percent12%, or US$140 million, from US$2,002.6 million in 20112014 to US$2,201.8 million in 2012,2015, due primarily tohigher average realized prices combined with an increase a decrease in the number of ounces sold. and a decreased average realized price of gold. The decline in ounces sold was proportionate to lower gold production. Gold ounces produced decreased 5.2% due to a decrease in the amount of leach grade material placed on the leach pads compared to prior year as well as lower mill grade and recovery. Yanacocha has not engaged in gold price hedging activities, such as forward sales or option contracts, to minimize its exposure to fluctuations in the price of gold. Production by mine was as follows:
Mine | | 2012 | | | 2011 | | | 2015 | | | 2014 | |
| | | (ounces) | | | (ounces) | |
| Cerro Yanacocha | | | 662,577 | | | | 659,996 | | | | 52,020 | | | | 30,713 | |
| Carachugo | | | 300,368 | | | | 319,995 | | | | 89,635 | | | | 286,062 | |
| Maqui Maqui | | | 5,811 | | | | 9,906 | | | | 47,712 | | | | 5,669 | |
| La Quinua | | | 377,236 | | | | 303,226 | | | | 728,324 | | | | 647,500 | |
| Total | | | 1,345,992 | | | | 1,293,123 | | | | 917,691 | | | | 969,944 | |
The increase in gold produced in 2012 as compared to 2011 was mainly attributable to an increase of milling activities
| (1) | Ounces produced included El Tapado Oeste Pit, Cerro Negro Pit, Marleny Pit production and Verde Bioleach Demonstration Facility. |
Costs related to higher volume of tons milled, which was 6.3 million DMTsales
Costs related to sales for the year endedending December 31, 2012 as compared to 6.2 million DMT for the year ended December 31, 2011,2015 and a higher gold grade and recovery rate of 3.89 grams per ton mined and 87.1%, respectively, for the year ended December 31, 2012 as compared to 2.92 and 82.3%, respectively, for the year ended December 31, 2011.2014 comprise:
| | | 2015 | | | 2014 | |
| | | US$(000) | | | US$(000) | |
| | | | | | | |
| Beginning balance of inventories | | | 497,669 | | | | 522,596 | |
| Consumption of supplies | | | 210,384 | | | | 246,106 | |
| Personnel expenses | | | 102,867 | | | | 87,290 | |
| Other services | | | 76,490 | | | | 82,805 | |
| Maintenance | | | 38,646 | | | | 38,526 | |
| Power | | | 27,713 | | | | 24,942 | |
| Depreciation and amortization | | | 223,142 | | | | 360,334 | |
| Workers' profit participation | | | 28,852 | | | | 35,055 | |
| Reclamation expenses related to Yanacocha leach pad | | | - | | | | 20,315 | |
| Net realizable value adjustment | | | 64,497 | | | | 95,859 | |
| Ending balance of inventories | | | (518,524 | ) | | | (593,528 | ) |
| | | | | | | | | |
| | | | 751,736 | | | | 920,300 | |
Costs applicable to sales
. Costs applicable to sales include: (i) operating costs, consisting primarily of direct production costs such as mining and treatment of the ore, which are the most significant components of costs applicable to sales, (ii) workers’ participation profit sharing of 8% of pre-tax profits based on Peruvian labor legislation, (iii) write downs of ore on leach pads to net realizable value expense and (iv) other costs. Costs applicable to sales decreased by 6 percent19% or US$170 million from 20112014 to 2012 due primarily2015. Ounces sold decreased 4.5% from 2014 to lower operating costs and lower production taxes, partially offset by higher third-party royalties due to higher sales revenues andlower by-product metal silverand coppersales credit due to lower production.Costs2015. Costs applicable to sales per ounce of gold decreased by 11 percent,14%, from US$581949 in 20112014 to US$517819 in 2012, primarily due to lower direct mining cost per ounce of US$409 in 2012 as compared to US$497 in 2011, lower production taxes per ounce of US$9 in 2012 as compared to US$4 in 2011, partially offset by a lower silver credit per ounce of US$13 in 2012 as compared to US$36 in 2011.2015.
Operating costs decreased by 11 percent32% from US$618.9674.6 million in 20112014 to US$549.9456.0 million in 2012.2015. Operating costs consist primarily of drilling, blasting, loading, hauling and milling costs. These costs which decreased in 20122015 primarily as a result of a decrease in the volume of ore mined, which was 42.6 million DST comparedlower expenses relating to 64.2 million DST for the year ended December 31, 2011.surface mining costs (lower diesel price and lower repairs and maintenance) and lower heap leaching costs, partially offset by higher milling costs (related to cyanide and lime consumption).
Royalty expense wasWorkers’ profit participation decreased by 18%, from US$66.635 million in 2012 as compared2014 to US$60.829 million in 2011. The increase in the royalty expense paid to Chaupiloma, which equals 3 percent of Yanacocha’s net sales,2015. This decrease was directly related to the increasedecrease in Yanacocha’s sales revenues.
Workers’ profit participation increased by 2 percent,taxable income from US$79.1 million in 20112014 to US$80.7 million in 2012. The increase in workers’ profit participation expense is related to the increase in Yanacocha’s sales revenues.2015. Workers’ profit participation expense is calculated based on taxable net income and in accordance with Peruvian labor legislation. See “Item 4. Information on the Company—Yanacocha—B. Business Overview—Employees.”
Depreciation, depletionThe portion of leach pad inventory write-downs associated with costs applicable to sales decreased from US$95.8 million in 2014 to US$64.5 million in 2015 due to lower costs of inventory compared to the prior year.
Inventory variation decreased by 39%, from US$70.9 million in 2014 to US$20.9 million in 2015, due to lower stock of ounces at the beginning of year and amortizationlower costs per ounce compared to the prior year.
Depreciation, depletion and amortization increaseddecreased by 9 percent38% from US$231.5360 million in 20112014 to US$252.9223 million in 2012.2015. This increasedecrease was attributable principally to higherlower depreciation from inventory variation expenses.associated with assets retirement costs and deferred mine development.
ExplorationAdministrative expenses
Exploration costs, which include advanced projects, increased by 84 percent, from US$66.3 million in 2011 to US$121.7 million in 2012. This increase was attributable principally to increased advanced project activities related toAdministrative expenses for the Conga project, an increased number of exploration works in the Yanacocha areayears ended December 31, 2015 and other regional/oxide development programs.2014 where comprised of:
| | | 2015 | | | 2014 | |
| Management expenses | | $ | 18,108 | | | $ | 19,938 | |
| Community development expenses and | | | | | | | | |
| external affairs | | | 6,297 | | | | 15,653 | |
| Other | | | 1,920 | | | | 2,671 | |
| | | $ | 26,325 | | | $ | 38,262 | |
Other expensesoperating expense (net)
Other expenses, net for the years ended December 31, 2015 and 2014 were as follows:
| | | 2015 | | | 2014 | |
| | | | | | | |
| Exploration and advance project | | $ | 64,223 | | | $ | 58,880 | |
| Severance program | | | 14,904 | | | | 16,438 | |
| Disposal of fixed assets | | | (135 | ) | | | 13,530 | |
| Other expenses | | | (671 | ) | | | (6,149 | ) |
| Others, net | | | 4,525 | | | | (4,918 | ) |
| | | $ | 82,846 | | | $ | 77,781 | |
Advanced projects costs also increased by 180 percent, orfrom US$70.816.5 million from 2011in 2014 to 2012, mainlyUS$22 million in 2015. This increase was primarily due to lower activities in 2014 than 2015 for projects such as the execution of an employee severance program in order to align Yanacocha’s organization with future business needs, higher regional administration expensesChaquicocha tunnel and higher community developmentQuecher main.
Impairment.
Impairment calculations were conducted for Yanacocha and external affairs activities.the Conga project for the 2015 financial statements. Despite the lower market prices for gold and the water first approach at the Conga project, the calculations yielded no write-downs for 2015.
Income tax provisionprovision.
Yanacocha’s financial and operating results included income and mining tax expense of US$(602.7) million in 2015 compared to US$30.5 million in 2014. The increasedifference was primarily due to the write-off of the deferred income tax asset of US$510 million.
Net income.
Net income decreased by US$49.9 million, from US$(400.3) million in 2014 to US$(450.2) million in 2015, mainly explained by higher expenses in income tax provision was directly relateddue to Yanacocha’s increasea the write-off of the deferred income tax asset and lower revenues from sales due to lower production, offset by reduction in taxable incomeoperating costs and the full year impactlack of the new Peruvian mining and income taxes. The net effective tax rate was 39.0 percent in 2012 compared to 32.2 percent in 2011. The statutory rate for both years was a weighted average of 30 percent. The factors that most significantly impacted Yanacocha’s net effective tax rate were related to higher non-deductible expenses and the full year impact of the Special Mining Tax (Impuesto Especial de Minería), which applies to mines that are not party to a tax stabilization agreement and requires the payment of rates ranging from 2 percent to 8.4 percent of operating profit, as determined in accordance with Peruvian GAAP, payable on a quarterly basis, and the Special Mining Duty (Gravamen Especial a la Minería), which applies to companies that are party to tax stability agreements and is calculated as a percentage of operating profit, with marginal rates ranging from 4 percent to 13.12 percent, increasing progressively for companies with higher operating margins.
Net income
As a consequence of the foregoing, net income decreased by 2 percent, or US$15.8 million,from US$642.4 millionin 2011 to US$626.5 millionin 2012. As a percentage of sales, net income decreased from 32 percent in 2011 to 28 percent in 2012.asset impairments during 2015.
Results of Operations for the Years Ended December 31, 20112014 and 20102013
Sales
Sales increasedGold sales. Gold sales decreased by 13 percent17%, or US$247 million, from US$1,778.3 million in 20102013 to US$2,002.6 million in 2011,2014, due primarily tohigher average realized prices.This increase was partially offset bya decrease in the number of ounces sold. and a decreased average realized price of gold. The decline in ounces sold was proportionate to lower gold production. Gold ounces produced decreased 5% due to a decrease in the amount of leach grade material placed on the leach pads compared to prior year as well as lower mill grade and recovery. Yanacocha has not engaged in gold price hedging activities, such as forward sales or option contracts, to minimize its exposure to fluctuations in the price of gold. Production by mine was as follows:
| Mine | | 2011 | | | 2010 | | | 2014 | | | 2013 | |
| | | (ounces) | | | (ounces) | |
| Cerro Yanacocha | | | 659,996 | | | | 659,080 | | | | 30,713 | | | | 16,393 | |
| Carachugo | | | 319,995 | | | | 399,268 | | | | 286,062 | | | | 437,095 | |
| Maqui Maqui | | | 9,906 | | | | 12,701 | | | | 5,669 | | | | 5,858 | |
| La Quinua | | | 303,226 | | | | 390,571 | | | | 647,500 | | | | 557,914 | |
| Total | | | 1,293,123 | | | | 1,461,620 | | | | 969,944 | | | | 1,017,259 | |
The decrease in goldOunces produced in 2011 as comparedincluded El Tapado Oeste Pit, Cerro Negro Pit, Marleny Pit production and Verde Bioleach Demonstration Facility.
Costs related to 2010 was mainly attributablesales
Costs related to a decrease in the volume of leach tons placed, which was 39.2 million DMTsales for the year endedending December 31, 2011 as compared to 53.2 million DMT for the year ended December 31, 20102014 and a higher waste to ore ratio, which was 1.57 for the year ended December 31, 2011 as compared to 1.38 for the year ended December 31, 2010.2013 comprise:
| | | 2014 | | | 2013 | |
| | | US$(000) | | | US$(000) | |
| Beginning balance of inventories | | | 522,596 | | | | 545,183 | |
| Consumption of supplies | | | 246,106 | | | | 300,792 | |
| Personnel expenses | | | 87,290 | | | | 120,568 | |
| Other services | | | 82,805 | | | | 66,670 | |
| Maintenance | | | 38,526 | | | | 52,486 | |
| Power | | | 24,942 | | | | 29,142 | |
| Depreciation and amortization | | | 360,334 | | | | 349,760 | |
| Workers' profit participation | | | 35,055 | | | | 49,259 | |
| Reclamation expenses related to Yanacocha leach pad | | | 20,315 | | | | - | |
| Net realizable value adjustment | | | 95,859 | | | | 146,051 | |
| Ending balance of inventories | | | (593,528 | ) | | | (668,647 | ) |
| | | | 920,300 | | | | 991,264 | |
Costs applicable to sales
. Costs applicable to sales increased by 14 percentinclude: (i) operating costs, consisting primarily of direct production costs such as mining and treatment of the ore, which are the most significant components of costs applicable to sales, (ii) workers’ participation profit sharing of 8% of pre-tax profits based on Peruvian labor legislation, (iii) write downs of ore on leach pads to net realizable value expense and (iv) other costs. Costs applicable to sales decreased 7% or US$70.9 million from 20102013 to 2011 due primarily2014. Ounces sold decreased 5.4% from 2013 to higher operating costs,higher third-party royalties due to higher sales revenues andlower by-product metal silverand coppersales credit due to lower production, partially offset by lower operating costs.Costs2014. Costs applicable to sales per ounce of gold increased by 30 percent,2%, from US$448974 in 20102013 to US$581949 in 2011, primarily due to the effect of lower ounces sold, higher direct mining cost per ounce of US$497 in 2011 as compared to US$391 in 2010, a higher royalty expense per ounce of US$48 in 2011 as compared to US$38 in 2010 and a higher workers’ profit participation expense per ounce of US$57 in 2011 as compared to US$53 in 2010.2014.
Operating costs decreased by 8 percent13% from US$669.1776.1 million in 20102013 to US$618.9674.6 million in 2011.2014. Operating costs consist primarily of drilling, blasting, loading, hauling and milling costs. These costs which decreased in 20112014 primarily as a result of lower expenses in supplies, (including a decreasedecline in diesel prices beginning in the third quarter of 2014 and minor usage of CAT 785 for advance works in Marleny Pit Mining) and lower personnel expenses due to lower headcount. The volume of orecommercial tons mined which was 64.2decreased from 161.8 million DST comparedin 2013 to 83.7US$118.8 million DST for the year ended December 31, 2010.
Royalty expense was US$60.8 million in 2011 as compared to US$55.8 million in 2010. The increase in the royalty expense paid to Chaupiloma, which equals 3 percent of Yanacocha’s net sales, was directly related to the increase in Yanacocha’s sales revenues.2014.
Workers’ profit participation increaseddecreased by 2 percent,29%, from US$77.449 million in 20102013 to US$79.135 million in 2011. The increase in workers’ profit participation expense2014. This decrease is directly related to the increasedecrease in Yanacocha’s sales revenues.taxable income from 2013 to 2014. Workers’ profit participation expense is calculated based on taxable net income and in accordance with Peruvian labor legislation. See “Item 4. Information on the Company—Yanacocha—B. Business Overview—Employees.”legislation
Depreciation, depletionThe portion of leach pad inventory write-downs associated with costs applicable to sales decreased from US$146 million in 2013 to US$95.8 million in 2014 due to lower costs of inventory compared to the prior year.
Inventory variation decreased by 43%, from US$123.5 million in 2013 to US$70.9 million in 2014, due to lower stock of ounces at the beginning of year and amortizationlower costs per ounce compared to the prior year.
Depreciation, depletion and amortization increased by 44 percent3% from US$160.4349.7 million in 20102013 to US$231.5360 million in 2011.2014. This increase was attributable principally to leach pad inventory write-downs combined higher amortization fromdepreciation associated with assets retirement costs and deferred mine development and higher amortization from asset retirement costs.development.
ExplorationAdministrative expenses
Exploration costs, which include advanced projects, increased by 92 percent, from US$34.6 million in 2010 to US$66.3 million in 2011. This increase was attributable principally to increased perforationAdministrative expenses for the year ended December 31, 2014 and advanced projects related to the Conga project, an increased number of exploration works in connection with regional/oxide development programs and an increased number of advanced projects related to water treatment and information solutions.2013 where comprised of:
| | | 2014 | | | 2013 | |
| Management expenses | | $ | 19,938 | | | $ | 17,480 | |
| Community development expenses and | | | | | | | | |
| external affairs | | | 15,653 | | | | 46,482 | |
| Other | | | 2,671 | | | | 3,102 | |
| | | $ | 38,262 | | | $ | 67,064 | |
Other expensesoperating expense (net)
Other expenses, net for the years ended December 31 were as follows:
| | | 2014 | | | 2013 | |
| Exploration and advance project | | $ | 58,880 | | | $ | 64,510 | |
| Severance program | | | 16,438 | | | | 19,323 | |
| Disposal of fixed assets | | | 13,530 | | | | 6,562 | |
| Other expenses | | | (6,149 | ) | | | (8,924 | ) |
| Others, net | | | (4,918 | ) | | | (3,966 | ) |
| | | $ | 77,781 | | | $ | 77,534 | |
Exploration costs decreased by 13 percent, or23%, from US$920.0 million in 2013 to US$15.4 million in 2014. This decrease was attributable principally to lower drilling works in 2014 for Chaquicocha Underground and other minor exploration activities.
Advanced projects costs also decreased from 2010US$44.5 million in 2013 to 2011, mainlyUS$43.5 million in 2014. This decline was primarily due to lower voluntary contributionactivities in 2014 than in 2013 for projects as a result of the expiration of the agreement requiring payment of the contribution during 2011.Geotechnical Investigation Project and Verde Stage 2 Study project.
Income tax provision
Impairment.
The increase2014 financial results included an impairment loss of US$541million related exclusively to the Conga project, compared to US$1,038.5 million in 2013 (Yanacocha and Conga). The discount interest rate used in the impairment calculations under the fair value less costs of sale methodology was 8.04% after taxes, which was based on a peer group of mining companies adjusted for Peru country risk. The rate is a “real” versus “nominal” rate as the cash flow models were not escalated for inflation. This discount rate was used for both segments Yanacocha and Conga.
Income tax provision.
Yanacocha’s financial and operating results included income and mining tax provisionexpense of US$30.5 million in 2014 compared to US$203.5 million in 2013. The difference was directly relatedprimarily due to Yanacocha’s increase in taxable income. The net effective tax rate was 32.2 percent in 2011increased profitability as the result of lower expenses compared to 31.4 percent in 2010. The statutory rate for both years was a weighted average of 30 percent. The factors that most significantly impacted Yanacocha’s net effective tax rate were related to higher non-deductible expenses and the enactment of the Special Mining Tax (Impuesto Especial de Minería), which applies to mines that are not party to a tax stabilization agreement and requires the payment of rates ranging from 2 percent to 8.4 percent of operating profit, as determined in accordance with Peruvian GAAP, payable on a quarterly basis, and the Special Mining Duty (Gravamen Especial a la Minería), which applies to companies that are party to tax stability agreements and is calculated as a percentage of operating profit, with marginal rates ranging from 4 percent to 13.12 percent, increasing progressively for companies with higher operating margins.prior year.
Net incomeincome.
As a consequence of the foregoing, net income increasedloss decreased by 9 percent, or US$52.5175 million,from US$589.9(575) million in 20102013 to US$642.4 millionin 2011. As a percentage of sales, net income decreased from 33 percent(400) million in 2010 to 32 percent in 2011.2014.
B. Liquidity and Capital Resources
As of December 31, 2012,2015, Yanacocha had cash and cash equivalents of US$618.1million,944 million, substantially all of which were held in U.S. Dollars, as compared to US$798.0million787 million as of December 31, 2011.2014.
Cash provided by operating activities
Yanacocha’s operations generated a net cash flow from operations of US$936.7275 million in 2012, US$911.6million in 20112015 and US$621.7372.2 million in 2010.2014. The net cash flow from operations in 20122015 was essentially the same as34% or US$101 million lower than in 2011 as the benefit from increased sales volumes and average realized prices2014. The decrease was primarily driven by decrease in 2012 were offset in part by increased costs driven in part by higher Peruvian tax rates and employee severance costs. The increase in net cash flow provided by operating activities in 2011 was mainly due to higher sales revenuesassets as a resultprovision for reclamation and remediation, the write-off of an increase in average realized prices, partially offset by a lower volumefixed assets and the write-down of ounces sold and higher working capital.ore on leach pads to realizable value.
Cash used in investing activities
Net cash used in investing activities was US$1.1 billion117.3 million in 2012, US$992.5million in 20112015 and US$296.7176 million in 2010. In 2012, 2014.
Yanacocha’s investing activities consisted primarilycapital expenditures from its formation in 1992 through 2015 have related principally to:
| · | The construction of the Carachugo, Chaquicocha, Maqui Maqui, San José, Cerro Yanacocha, La Quinua Complex (La Quinua, El Tapado and Tapado Oeste), Cerro Negro Este, Western Oxide pits (La Quinua Sur and Cerro Negro Oeste), Eastern Oxide pits (Quecher Norte and Marleny) and Carachugo Alto mining operations; |
| · | The construction of two plants at Carachugo and Yanacocha, each of which includes a leach solution processing facility and a smelter; |
| · | The construction of four carbon column plants at Cerro Yanacocha and La Quinua; |
| · | The acquisition of both new and used mining equipment; |
| · | The construction of two dams, the construction of one agglomeration plant at La Quinua, the construction of the Yanacocha Gold Mill, and several expansions of the leach pads located at the Carachugo, Maqui Maqui, Cerro Yanacocha, La Quinua mining operations; and |
| · | The construction of Gold Mill Tailing Pipeline and equipment components. |
Yanacocha’s capital expenditures from its formation through December 31, 2014 totaled approximately US$5,821 million, including capital expenditures of US$498311 million for engineering, constructionin 2013, US$117 million in 2014 and equipment at the Conga project, US$33896.2 million for mine development at El Tapado Oeste, the Western Oxides and the Eastern Oxides, US$30 million for equipment components, US$25 million for water treatment plant studies and construction, US$18 million for gold mill tailings improvements, US$17 million for bio-leach studies and plant construction and US$15 million for the standardization of information technology systems. in 2015.
In 2011,2015, Yanacocha’s investing activities consisted primarily of US$739 million for engineering, construction, equipment and off-site infrastructure at the Conga project, US$156.3 million for mine development at El Tapado Oeste, the Western Oxides and the Maqui Maqui deposits, US$55 million for leach pad expansions at La Quinua (area of the Western Oxides), US$24 million for land purchases, US$14.5 million for the standardization of information technology systems across the Newmont Group and the selection of SAP as its global information technology platform, US$9.9 million for water treatment project studies, US$9.6 million for La Quinua 2C studies of the instability and failure of the pit, US$8.6 million for life extension of the haul trucks fleet and US$4.9 million for construction of a new central warehouse.principal capital expenditures included:
| · | US$29 million associated with the initial construction of one water treatment plant at La Quinua; |
| · | US$28 million for the storage expansion of La Quinua Tailings and the construction of North Tailings Dump; |
| · | US$14 million for equipment components; |
| · | US$5 million for equipment upgrade in Verde Bioleach Pilot Plant; |
| · | US$3 million for drilling activities in Quecher project; |
| · | US$3 million for hydrogeological activities in Western Oxides; and |
| · | US$17 million for other minor projects. |
Cash used in financing activities
Net cash used in financing activities was US$0 in 2012, US$2million in 2011 and US$176.7 million in 2010.both 2015 and 2014. In 2012,2015 and 2014, Yanacocha carried no debt and accordingly had no financing costs. In 2011, Yanacocha’s financing activities consisted primarily of the last four installments of lease payments for haul trucks.
Exploration Costs; Capital Expenditures
Exploration
Yanacocha’s basic exploration and advanced project costs during the period from 1992 through 2012 were financed with a combination of internally generated funds, advances from partners and loans from DEG and IFC.During 2010, 2011 and 2012,Yanacocha incurred US$34.6 million, US$66.3 million and US$121.7 million, respectively, in exploration costs.In 2013, exploration efforts will focus on continued development of the Chaquicocha Sulfides project, testing the extension of the Yanacocha Verde deposit, continued exploration in the Yanacocha district and conducting an exploration program in the Yanacocha concession block outside of the operation district.
Capital Expenditures
Yanacocha’s capital expenditures from its formation in 1992 through 2012 were financed with a combination of internally generated funds, advances from partners, loans from DEG and IFC and proceeds from Yanacocha’s Receivables Securitization (see Note 11 to the Yanacocha Financial Statements). Yanacocha’s capital expenditures from its formation in 1992 through 2012 have related principally to the construction of the Carachugo, Maqui Maqui, San José, Cerro Yanacocha and La Quinua mining operations, the construction of two plants at Carachugo and Yanacocha, each of which includes a leach solution processing facility and a smelter at each plant, the construction of four carbon column plants at Cerro Yanacocha and La Quinua, the acquisition of both new and used mining equipment, the construction of two dams, the construction of one agglomeration plant at La Quinua, the construction of the Yanacocha Gold Mill, and several expansions of the leach pads located at the Carachugo, Maqui Maqui, Cerro Yanacocha and La Quinua mining operations.Yanacocha’s capital expenditures from its formation through December 31, 2012 totaled approximately US$5,393 million, including capital expenditures of US$1,094 million in 2011 and US$1,148 million in 2012. In 2012, Yanacocha’s principal capital expenditures included US$498 million for engineering, construction and equipment at the Conga project, US$338 million for mine development at El Tapado Oeste, the Western Oxides and the Eastern Oxides deposits, US$30 million for equipment components, US$25 million for water treatment plant studies and construction, US$18 million for gold mill tailings improvements, US$17 million for bio-leach studies and plant construction and US$15 million for the standardization of information technology systems.
Yanacocha anticipates that its capital expenditures for 2013 will be approximately US$566 million, of which it plans to use approximately US$300 million in connection with the construction of the Conga project. The remaining capital expenditure budget has been allocated for sustaining investment in current operations and development capital for upcoming operations.
C. Research and Development
Yanacocha is a mining exploration and production company and does not engage in research and development activities.
D. Trend Information
Other than as disclosed in this Annual Report and the Yanacocha Financial Statements (included elsewhere in this Annual Report), Yanacocha has informed us that it is not aware of any trends, uncertainties, demands, commitments or events which are reasonably likely to have a material effect upon Yanacocha’s net sales or revenues, income from continuing operations, profitability, liquidity or capital resources, or that would cause reported financial information to not necessarily be indicative of future operating results or financial condition.
E. Off-Balance Sheet Arrangements
Yanacocha has informed us that there are no off-balance sheet arrangements that have or are reasonably likely to have a current or future effect on Yanacocha’s financial condition, changes in financial condition, revenues or expenses, results of operations, liquidity, capital expenditures or capital resources that are material to investors.
F. Tabular Disclosure of Contractual Obligations
The following table shows Yanacocha’s contractual obligations as of December 31, 2012:2015:
| | | | | Payments due by Period (US$ in millions) | | |
| | | | | Less than | | 1-3 | | 3-5 | | More than | | | Payments due by Period (US$ in millions) | |
| | | Total | | 1 year | | years | | years | | 5 years | | | Total | | | Less than
1 year | | | 1-3 years | | | 3-5 years | | | More than
5 years | |
| Long-Term Debt | | | - | | | | - | | | | - | | | | - | | | | - | | | | - | | | | - | | | | - | | | | - | | | | - | |
| Capital Lease Obligations | | | - | | | | - | | | | - | | | | - | | | | - | | | | - | | | | - | | | | - | | | | - | | | | - | |
| Reclamation and Remediation Liability | | | 529.4 | | | | -4.7 | | | | 28.1 | | | | 30.0 | | | | 476.0 | | | | 578.9 | | | | 6.7 | | | | 86.5 | | | | 145.7 | | | | 340. | |
| Open Purchase Orders | | | - | | | | - | | | | - | | | | - | | | | - | | |
| Open Purchase Orders receipt | | | | - | | | | - | | | | - | | | | - | | | | - | |
| Other Long-Term Obligations(*) | | | 18.0 | | | | 18.0 | | | | - | | | | - | | | | - | | | | 29.1 | | | | - | | | | 23.2 | | | | 5.9 | | | | - | |
| Total Contractual Cash Obligations | | | 547.4 | | | | 13.3 | | | | 28.1 | | | | 30.0 | | | | 476.0 | | | | - | | | | - | | | | - | | | | - | | | | - | |
| (*) | Other long-term contracts include deferred workers’ compensationLong-Term Obligations includes obligations powerrelating to social development projects and fuel supply contract commitments and fuel and inventory obligations.commitments. |
CERRO VERDE
Introduction
The following discussion should be read in conjunction with the Cerro Verde Financial Statements as of December 31, 20112014 and 20122015 and for the years ended December 31, 2010, 20112013, 2014, and 20122015 and the related notes thereto included elsewhere in this Annual Report. The Cerro Verde Financial Statements are prepared and presented in accordance with IFRS as issued by the IASB. Cerro Verde adopted IFRS effective January 1, 2010. The Cerro Verde Financial Statements for the year ended December 31, 2011 were the first that Cerro Verde prepared in accordance with IFRS. We applied IFRS 1 “First-time Adoption of International Financial Reporting Standards” to the opening balance as of January 1, 2010, Cerro Verde’s transition date to IFRS. The IFRS 1 application implies that all the standards are applied retrospectively at the transition date, including certain mandatory exceptions and voluntary exemptions defined in the standard. See Note 3 to the Cerro Verde Financial Statements for further details and a description of the exceptions and exemptions applicable to first-time adopters.
A. Operating Results
Overview
We hold a 19.58 percent19.58% interest in Cerro Verde, which operates an open-pit copper and molybdenum mining complex located 20 miles southwest of Arequipa, Peru. The site is accessible by paved highway. The Cerro Verde mine has been in operation since 1976, and was previously owned by the Peruvian government prior tobefore its privatization in 1993. Freeport-McMoRan Copper & Gold Inc. holds a majority interest in Cerro Verde.
The Cerro Verde mine is a porphyry copper deposit that has leachable oxide and secondary sulfide mineralization, and millable primary sulfide mineralization. The predominant oxide copper minerals are brochantite, chrysocolla, malachite and copper “pitch.” Chalcocite and covellite are the most important secondary copper sulfide minerals. Chalcopyrite and molybdenite are the dominant primary sulfides.
Cerro Verde’s current operations consist of an open-pit copper mine, a 120,000 metric ton-per-day concentrator and leaching facilities. Leach-copper production is derived from a 39,000 metric ton-per-day crushed leach facility and a leach system. This leaching operation has a capacity of approximately 200 million pounds of copper per year.
Cerro Verde has sufficient equipment to move an average of 308,000 metric tons of material per day using a fleet of haul trucks. Copper cathodes and concentrate production are transported approximately 70 miles by truck and rail to the Pacific Port of Matarani for shipment to international markets.
Cerro Verde receives electrical power under long-term contracts with electric utility companies. Water for Cerro Verde’s processing operations comes from renewable sources through a series of storage reservoirs, which Cerro Verde believes will be sufficient to support its currently planned operations.
Presented in the table below are certain summary financial and operating data regarding Cerro Verde for the years ended December 31, 2010, 20112013, 2014, and 2012:2015:
| | | As of and for the year ended December 31, | |
| | | 2010 | | | 2011 | | | 2012 | |
| Income statement data(1) | | | | | | | | | | | | |
| Total revenues (US$ in thousands) | | | 2,368,988 | | | | 2,520,050 | | | | 2,127,023 | |
| Net income (US$ in thousands) | | | 1,074,393 | | | | 1,078,399 | | | | 772,070 | |
| | | | | | | | | | | | | |
| Proven and Probable Reserves(2) | | | | | | | | | | | | |
| Proven: | | | | | | | | | | | | |
| Leachable ore reserves (metric tons in thousands) | | | 145,302 | | | | 127,684 | | | | 64,462 | |
| Millable ore reserves (metric tons in thousands) | | | 903,950 | | | | 888,371 | | | | 995,134 | |
| Probable: | | | | | | | | | | | | |
| Leachable ore reserves (metric tons in thousands) | | | 97,911 | | | | 96,857 | | | �� | 137,691 | |
| Millable ore reserves (metric tons in thousands) | | | 2,424,368 | | | | 2,864,299 | | | | 2,997,250 | |
| Average copper grade of leachable ore reserves (%) | | | 0.41 | | | | 0.40 | | | | 0.34 | |
| Average copper grade of millable ore reserves (%) | | | 0.40 | | | | 0.39 | | | | 0.38 | |
| | | | | | | | | | | | | |
| Production(3) | | | | | | | | | | | | |
| Cathodes (in thousands of recoverable pounds) | | | 183,426 | | | | 166,017 | | | | 118,703 | |
| Concentrates (in thousands of recoverable pounds) | | | 483,937 | | | | 481,217 | | | | 445,771 | |
| Average realized price of copper sold (US$ per pound payable) | | | 3.42 | | | | 4.00 | | | | 3.61 | |
| | | As of and for the year ended December 31, | |
| | | 2013 | | | 2014 | | | 2015 | |
| Income statement data(1) | | | | | | | | | | | | |
| Sales of goods (US$ in thousands) | | | 1,811,488 | | | | 1,467,097 | | | | 1,115,617 | |
| Profit for the year (US$ in thousands) | | | 613,262 | | | | 377,606 | | | | 33,284 | |
| | | | | | | | | | | | | |
| Proven and Probable Reserves(2) | | | | | | | | | | | | |
| Proven: | | | | | | | | | | | | |
| Leachable ore reserves (tons in thousands) | | | 52,676 | | | | 46,426 | | | | 47,603 | |
| Millable ore reserves (tons in thousands) | | | 1,123,205 | | | | 881,338 | | | | 925,365 | |
| Probable: | | | | | | | | | | | | |
| Leachable ore reserves (tons in thousands) | | | 114,990 | | | | 121,954 | | | | 104,963 | |
| Millable ore reserves (tons in thousands) | | | 2,756,501 | | | | 2,903,516 | | | | 2,778,009 | |
| Average copper grade of leachable ore reserves (%) | | | 0.33 | | | | 0.37 | | | | 0.35 | |
| Average copper grade of millable ore reserves (%) | | | 0.37 | | | | 0.38 | | | | 0.38 | |
| | | | | | | | | | | | | |
| Production(3) | | | | | | | | | | | | |
| Cathodes (in thousands of recoverable pounds) | | | 104,314 | | | | 124,804 | | | | 105,077 | |
| Concentrates (in thousands of recoverable pounds) | | | 452,925 | | | | 375,438 | | | | 439,405 | |
| Average realized price of copper sold (US$ per pound payable) | | | 3.24 | | | | 2.93 | | | | 2.26 | |
| (1) | Derived from Cerro Verde’s financial statements filed with theSuperintendencia del Mercado de Valores, or the SMV. See the Cerro Verde Financial Statements, including the notes thereto, appearing elsewhere in this Annual Report. |
| (2) | Reserve calculations are derived from the audited financial statements filed by Cerro Verde with the SMV. Cerro Verde used US$2.00 per pound of copper to determine copper reserves as of December 31, 2012.2015. See the Cerro Verde Financial Statements, including the notes thereto, appearing elsewhere in this Annual Report. The calculation or estimation of proven and probable ore reserves for Cerro Verde may differ in some respects from the calculations of proven and probable reserves for us and Yanacocha located elsewhere in this Annual Report. According to Cerro Verde, ore estimates for Cerro Verde are based upon engineering evaluations of assay values derived from samplings of drill holes and other openings. Cerro Verde’s ore estimates include assessments of the resource, mining and metallurgy, as well as consideration of economic, marketing, legal, environmental, social and governmental factors, including projected long-term prices for copper and molybdenum and Cerro Verde’s estimate of future cost trends. |
| (3) | Derived from Cerro Verde’s financial statements filed with the SMV. See the Cerro Verde Financial Statements, including the notes thereto, appearing elsewhere in this Annual Report. |
Cerro Verde Mining Royalties
SUNAT,Superintendencia Nacional de Administración Tributaria (“SUNAT”), the Peruvian national tax authority, has assessed mining royalties on materialsore processed by the Cerro Verde concentrator, thatwhich commenced operations in late 2006. These assessments cover the period from OctoberDecember 2006 to December 2007 and the years 2008 and 2009. SUNAT has issued rulings denying Cerro Verde’s protest of the assessments. Cerro Verde has appealed these decisions and currently these cases are pending beforeIn July 2013, the Peruvian Tax Tribunal.Tribunal, or the “Tax Tribunal,” issued two decisions affirming SUNAT's assessments for the period December 2006 through December 2008. Decisions by the Tax Tribunal end the administrative stage of the appeal procedures for the assessments. In September 2013, Cerro Verde is challenging these royaltiesfiled judiciary appeals related to the assessments because it believescontinues to believe that its 1998 stability agreement provides an exemption forexempts all minerals extracted from its mining concession from royalties, irrespective of the method used for processing those minerals. AlthoughWith respect to the judiciary appeal related to the assessment for the year 2008, on December 17, 2014, the Eighteenth Contentious Administrative Court rendered its decision upholding Cerro Verde’s position and nullifying SUNAT’s assessment and the Tax Tribunal’s resolution (S/.106.4 million). On December 31, 2014, SUNAT and the Tax Tribunal appealed this decision. The court’s position also invalidates all penalties and interest assessed by SUNAT for that period (S/. 139.7 million). On January 29, 2016 the Sixth Superior Justice Court nullified the decision of the Eighteenth Contentious Administrative Court. Cerro Verde believes its interpretation ofwill appeal the stability agreement is correct, ifdecision to the Supreme Court.
On October 1, 2013, SUNAT served Cerro Verde is ultimately found responsiblewith a demand for these assessments, it will also be liable forpayment totaling S/.492 million (US$144 million based on exchange rates as of December 31, 2015, including interest which accrues at rates that range from approximately 7 to 18 percentand penalties of US$85 million) based on the year accruedTax Tribunal’s decisions for the period December 2006 through December 2008. As permitted by law, Cerro Verde requested and was granted an installment payment program that defers payment for six months and thereafter satisfies the currency in which the amounts would be payable.amount via sixty-six equal monthly payments. As of December 31, 2012,2015, Cerro Verde had made payments totaling S/. 219 million (US$64 million based on December 31, 2015 exchange rates) under the aggregateinstallment program, which are presented in the long-term portion of other non-financial assets in the statement of financial position. See Note 7 to the Cerro Verde Financial Statements for further discussion. Based on the results rendered by the Eighteenth Contentious Administrative Court, as described in the previous paragraph, Cerro Verde requested and was granted an injunction, which modified the installment program by excluding the 2008 portion through SUNAT’s resolution provided to Cerro Verde on October 29, 2015.
In July 2013, a hearing on SUNAT’s assessment for 2009 was held, but no decision has been issued by the Tax Tribunal for that year. As of December 31, 2015 the amount of the assessments,assessment, including interest and penalties, totaledfor the year 2009 was S/247 million (approximately US$218 million. SUNAT may continue to assess72 million based on December 31, 2015 exchange rates). As of December 31, 2015, Cerro Verde estimates that the total exposure associated with mining royalties annually until this matter is resolved byfor the Peruvian Tax Tribunal.period from December 2006 to December 2013, including accumulated interest and penalties amounted to approximately US$500 million at December 31, 2015 exchange rates.
As of December 31, 2015, no amounts were accrued for these assessment or for the amounts paid under the installment and its external legal advisors believe Cerro Verde’s 1998 stability agreement exempted it from these royalties and believes that the resolution will be favorable to Cerro Verde and any payment should be recoverable.
Critical Accounting Policies
Cerro Verde has furnished us with a discussion of its critical accounting policies and methods used in the preparation of its financial statements. Critical accounting policies are defined as those that are reflective of significant judgments and uncertainties and could potentially impact results under different assumptions and conditions. Note 2to2 to the Cerro Verde Financial Statements includes a summary of the significant accounting policies and methods used in the preparation of the Cerro Verde Financial Statements. The following is a brief discussion of the identified critical accounting policies and the estimates and judgments made by Cerro Verde.
Estimates of Ore Reserves and Resources
Ore reserves are estimates of the ore quantity that can be economically and legally extracted from the mine properties. Cerro Verde estimates its ore reserves based on information compiled by individuals qualified in reference to geological data about the size, depth and form of the ore body, which requires complex judgments in order to interpret the data.
The estimation of recoverable reserves is based on factors such as estimated exchange rates, commodity prices, future requirements of capital and production costs, together with geological hypotheses and judgments made when estimating the size and quality of ore. Revisions in reserve or resource estimates may have an impact on the value of mining properties, property, plant and equipment, provisions for cost of mine closure, recognition of assets for deferred taxes and depreciation and amortization of assets.
Units of Production (“UOP”)UOP Depreciation
Estimates of recoverable reserves are used in determining the depreciation and amortization of mine assets. This results in a depreciation/amortization charge proportional to the depletion of the anticipated remaining life of mine production. Each item’s life, which is assessed annually, takes into account its physical life limitations and the present assessments of economically recoverable reserves. These calculations require the use of estimates and assumptions, including the amount of recoverable reserves that may be recovered.
Inventories
Net realizable value tests are performed at least annually and represent the estimated future sales price of the product based on prevailing spot metals prices, less estimated costs to complete production and bring the inventory to sale. Additionally, in calculating the net realizable value of Cerro Verde’s long-term stockpiles, management also considers the time value of money.
Mill and leach stockpiles generally contain lower grade ores that have been extracted from the ore body and are available for copper recovery. For mill stockpiles, recovery is through milling and concentrating. For leach stockpiles, recovery is through exposure to acidic solutions that dissolve copper and deliver it in solution form to extraction processing facilities.
Because it is generally impracticable to determine copper contained in mill and leach stockpiles by physical count, reasonable estimation methods are employed. The quantity of material delivered to mill and leach stockpiles is based on surveyed volumes of mined material and daily production records. Sampling and assaying of blasthole cuttings determine the estimated copper grades of material delivered to mill and leach stockpiles.
Expected copper recovery rates for mill stockpiles are determined by metallurgical sampling. The recoverable copper in mill stockpiles, once entered into the production process, can be produced into copper concentrate almost immediately.
Estimated copper recovery rates for leach stockpiles are determined using small-scale laboratory tests, historical trends and other factors. Ultimate recovery of copper contained in leach stockpiles can vary significantly depending on several variables, including the type of copper recovery, mineralogy and particle size of the rock. Processes and recovery rates are monitored continuously, and recovery rates are adjusted periodically as additional information becomes available and as related technology changes.
Mine Closure Provision
Cerro Verde assesses its mine closure provision annually. It is necessary to make estimates and assumptions in determining this provision, including cost estimates of activities that are necessary for the rehabilitation of the site, technological and regulatory changes, and interest rates and inflation rates. As discussed in Note 2.3(h)2.2(i) to the Cerro Verde Financial Statements, estimated changes in the fair value of the mine closure provision or the useful life of the related assets are recognized as an increase or decrease in the book value of the provision and related asset retirement cost (ARC)ARC in accordance with IAS 16, “Property, Plant and Equipment.” If any change in the estimate results in an increase to the mine closure provision and related ARC, Cerro Verde will consider whether or not this is an indicator of impairment of the assets and apply impairment tests in accordance with IAS 36, “Impairments of Assets.”
Impairment of Long-lived Assets
Cerro Verde has determined that its operation consists of one cash generating unit, which is the operation as a whole. Therefore, the Cerro Verde operation is evaluated annually in order to determine if there are any impairment indicators. If any such indication exists, Cerro Verde makes an estimate of the recoverable amount, which is the greater of the fair value less costs to sell and the value in use. These assessments require the use of estimates and assumptions, such as long-term commodity prices, discount rates, operating costs and others.
Fair value is defined as the amount that would be obtained from the sale of the asset in an arm’s-length transaction between willing and knowledgeable parties. The fair value of assets is generally determined as the current value of future cash flows derived from the continuous use of the asset, which includes estimates, such as the cost of future expansion plans and eventual disposal, while applying assumptions that an independent market participant may take into account. The cash flows are discounted by applying a discount rate that reflects the current market, the time value of money and risks specific to the asset. See Note 2.3(g)2.2(g) to the Cerro Verde Financial Statements for further discussion.
Contingencies
By their nature, contingencies will only be resolved when one or more uncertain future events dooccur or do notfail to occur. DeterminingThe assessment of the existence and potential quantum of contingencies inherently involves the exercise of significant judgment and calculationthe use of estimates regarding the estimated resultsoutcome of future events.
Stripping cost
In accordance with IFRIC 20, “Stripping Cost in the Production Phase of a Surface Mine,” stripping costs incurred in the production phase are capitalized as a component of property, plant and equipment if the stripping activity improves access to the ore body or enhances an existing asset. See Note 9 to the Cerro Verde Financial Statements for further discussion. The stripping activity asset is subsequently amortized using the UOP method.
Results of Operations for the Years Ended December 31, 20122015 and 20112014
Net sales. Net sales, including and mark-to-market adjustments for pounds of copper pending settlement, decreaseddecreased by 16 percent,24%, from US$2,520.11,467.1 million in 20112014 to US$2,127.01,115,6 million in 2012,2015, principally due to a decrease in average realized copper prices during 2014 partially offset by higher volume of copper sold. The following table reflects the average realized price and volume sold of copper (both cathode and concentrate) during 2012the years ended December 31, 2014 and 2015:
| | | Year ended December 31, | | | | |
| | | 2014 | | | 2015 | | | Variation | |
| Average price | | | | | | | | | | | | |
| Copper (US$ per ton) | | $ | 6,452 | | | | 4,518 | | | | -30 | % |
| | | | | | | | | | | | | |
| Volume sold | | | | | | | | | | | | |
| Copper (in tons) | | | 227,402 | | | | 246,913 | | | | 9 | % |
Average realized copper prices per ton decreased from US$6,452 in 2014 to US$4,518 in 2015. The volume of copper sold increased from 227,402 tons in 2014 to 246,913 tons in 2015, due to an increase in the volume of copper concentrates sold associated with Cerro Verde’s new concentrator plant that commenced operation in September 2015. The combined effect of these changes resulted in a US$351.5 million decrease in income from sales of copper in 2015 compared to 2014.
Total costs of sales of goods. Total costs of sales of goods increased from US$797.5 million in 2014 to US$862.0 million in 2015, due mainly to the net effect of the following:
(a) Material and supplies consumption cost increased by 9%, from US$333.5 million in 2014 to US$364.2 million in 2015, mainly due to increased consumption of supplies for Cerro Verde’s new concentrator plant.
(b) Labor costs, including workers’ profit sharing, decreased by 15%, from US$171.6 million in 2014 to US$146.4 million in 2015, mainly due to lower profit sharing in 2015 as compared to 2014 as a result of lower profits;
(c) The variation of in process inventories increased from US$70.5 million in 2014 to US$118.3 million in 2015 as a result of higher material due to the new concentrator plant and the current mining plan of processing high grade concentrates first and then low grade concentrates;
(d) Depreciation and amortization costs increased by 48%, from US$165.0 million in 2014 to US$244.5 million in 2015, mainly due to depreciation associated with Cerro Verde’s new concentrator plant;
(e) Repair and maintenance services increased by 9%, from US$87.5 million in 2014 to US$95.1 million in 2015; and
(f) Energy costs increased by 29%, from US$91.8 million in 2014 to US$118.0 million in 2015, mainly due to Cerro Verde’s new concentrator plant.
Total operating expenses. Operating expenses increased by 43%, from US$57.8 million in 2014 to US$82.8 million in 2015, due mainly to changes in the following components:
(a) Selling expenses increased by 4%, from US$54.2 million in 2014 to US$56.2 million in 2015, mainly due to higher copper concentrate sales during 2015; and
(b) Other expenses increased by US$23.0 million in 2015 mainly due tocosts associated with commencing operations at Cerro Verde’s new concentrator plant.
Income tax. Income tax expense, including current and deferred expense, decreased by 81%, from an expense of US$238.5 million in 2014 to an expense of US$46.2 million in 2015. Net current income tax expense (including mining taxes) decreased by US$262.1 million due to lower taxable income and an increase in deferred tax expense by 69.8 million (mainly related to a temporary tax difference associated with the depreciation of fixed assets).
Net income. As a result of the foregoing, net income decreased by 9%, from US$377.6 million in 2014 to US$33.3 million in 2015. As a percentage of net sales, net income was 3% in 2015, compared with 26% in 2014.
Results of Operations for the Years Ended December 31, 2014 and 2013
Net sales. Net sales, including and mark-to-market adjustments for pounds of copper pending settlement, decreased by 19%, from US$1,811.5 million in 2013 to US$1,467.1 million in 2014, principally due to a decrease in average realized copper prices during 2014 and lower volume of copper sold. The following table reflects the average realized price and volume sold of copper (both cathode and concentrate) during the years ended December 31, 20112013 and 2012:2014:
| | | Year ended December 31, | | | | |
| | | 2011 | | | 2012 | | | Variation | |
| Average price | | | | | | | | | |
| Copper (US$/MT) | | US$ | 8,584 | | | US$ | 7,965 | | | | (7 | )% |
| | | | | | | | | | | | | |
| Volume sold | | | | | | | | | | | | |
| Copper (MT) | | | 293,581 | | | | 267,040 | | | | (9 | )% |
| | | Year ended December 31, | | | | |
| | | 2013 | | | 2014 | | | Variation | |
| Average price | | | | | | | | | | | | |
| Copper (US$ per ton) | | $ | 7,137 | | | $ | 6,452 | | | | -10 | % |
| | | | | | | | | | | | | |
| Volume sold | | | | | | | | | | | | |
| Copper (in tons) | | | 253,828 | | | | 227,402 | | | | -10 | % |
Average realized copper prices per metric ton decreaseddecreased from US$8,5847,137 in 20112013 to US$7,9656,452 in 2012.2014. The volume of copper solddecreased from 293,581 metric253,828 tons in 20112013 to 267,040 metric227,402 tons in 2012, mainly2014, due to a decrease in the volume of copper cathodesconcentrates sold. The combined effect of these changes resulted in a US$393.0344.4 million decreasedecrease in income from sales of copper in 20122014 compared to 2011.2013.
Total costs of sales. Total costs of sales decreased by 3 percent,increased from US$824.7795.1 million in 20112013 to US$801.6797.5 million in 2012,2014, due mainly to the net effect of the following:
(a) Material and supplies consumption costscost increased by 15 percent,3%, from US$315.5324.9 million in 20112013 to US$362.3333.5 million in 2012,2014, mainly due to increased consumption of supplies in the increase in pricemine area (associated with haulage and quantity of fuel consumption used for the process of waste removal;mining equipment);
(b) Labor costs, including workers’ profit sharing, decreaseddecreased by 25 percent,20%, from US$256.2215.4 million in 20112013 to US$191.9million171.6 million in 2012,2014, mainly due mainly to lower workers’ profit sharinga charge of US$35.2 million related to bebonuses paid to employees calculated in 2012connection with the newly signed union workers’ collective labor agreement in 2013, and lower profit sharing in 2014 as compared to 2013 due to lower income tax basis was obtained;profits;
(c)The variation of in process inventories decreasedincreased from US$19.157.9 million in 20112013 to US$48.170.5 million in 20122014 as a result of the current mining plan of processing high grade concentrates first and then low grade concentrates;
(d) Depreciation and amortization costs increasedincreased by 14 percent,52%, from US$84.1109.3 million in 20112013 to US$95.9166.6 million in 2012,2014, mainly due mainly to an increase in depreciation charges as the levelamortization of fixeddeferred stripping assets increased;by US$44.9 million;
(e)Repair and maintenance services increaseddecreased by 19 percent,5%, from US$74.291.9 million in 20112013 to US$88.587.5 million in 2012;2014; and
(f) Energy costsincreased by 6percent,22%, from US$69.373.9 million in 20112013 to US$73.190.2 million in 2012,2014, mainly due to an increase in the unit cost per kilowatt during 2012.2014 as compared to 2013.
Total operating expenses. Operating expensesdecreased by 21 percent,15%, from US$136.168.3 million in 20112013 to US$108.257.8 million in 2012,2014, due mainly to changes in the following components:
(a) Selling expenses decreaseddecreased by 6 percent,21%, from US$83.668.4 million in 20112013 to US$78.754.2 million in 2012,2014, due mainly to lower copper sales during 2012;2014; and
(b) Excess of workers’ profit sharing expensedecreased fromOther expenses increased by US$21.9 million3.7 in 2011 to US$0 million in 2012,2014 mainly due to lower profit and taxable income during 2012.disposal losses associated with fixed assets.
Operating income.As a result of the foregoing, operating income decreased by 22percent, from US$1,559.3 million in 2011 to US$1,217.3 million in 2012.
Income tax. Income tax expense,, including current and deferred expense, decreased decreased by 8percent,28%, from an expense of US$483.7333.3 million in 20112013 to an expense of US$443.3238.5 million in 2012.2014. Net current income tax expense decreased(including mining taxes) decreased by US$50.9 million due to lower taxable income partially offsetand lower deferred tax expense by (i) higher deferred taxes mainly43.9 million (mainly related to a temporary tax difference associated with the deductiondepreciation of costs for construction of the water treatment plant, mark-to-market adjustments and an increase of the effective tax rate from 30% to 32% beginning in 2014 pursuant to the New Tax Stability Agreement executed in July 2012 and (ii) higher mining taxes expense due to new taxes in force since the fourth quarter of 2011.fixed assets).
Net income. As a result of the foregoing, net income decreaseddecreased by 28 percent,38%, from US$1,078.4613.3 million in 20112013 to US$772.0377.6 million in 2012.2014. As a percentage of net sales, net income was 36 percent26% in 2012,2014, compared with 43 percent34% in 2011.
Results of Operations for the Years Ended December 31, 2011 and 2010
Net sales. Net sales, including mark-to-market adjustments for pounds of copper pending settlement,increasedby 6 percent, from US$2,369.0 million in 2010 to US$2,520.1 million in 2011, mainly due to an increase in average realized copper price during 2011. The following table reflects the average realized price and volume sold of copper (both cathode and concentrate) during the years ended December 31, 2010 and 2011:
| | | Year ended December 31, | | | | |
| | | 2010 | | | 2011 | | | Variation | |
| Average price | | | | | | | | | |
| Copper (US$/MT) | | | US$7,981 | | | | US$8,584 | | | | 11 | % |
| | | | | | | | | | | | | |
| Volume sold | | | | | | | | | | | | |
| Copper (MT) | | | 296,821 | | | | 293,581 | | | | (1 | )% |
Average realized copper prices per metric tonincreased from US$7,981 in 2010 to US$8,584 in 2011. The volume of copper solddecreased from 296,821 metric tons in 2010 to 293,581 metric tons in 2011, mainly due to a decrease in the volume of copper cathodes sold, partially offset by higher volumes of copper concentrates sold. The combined effect of these changes resulted in a US$151.1 millionincrease in income from sales of copper in 2011 compared to 2010.
Total costs of sales. Total costs of salesincreased by 28 percent, from US$646.0 million in 2010 to US$824.7 million in 2011, due to the following:
(a) Material and supplies consumption costsincreased by 14 percent, from US$276.3 million in 2010 to US$315.5 million in 2011, mainly related to increased utilization of materials and operating supplies, primarily in the concentrator plant;
(b) Depreciation and amortization costsdecreased by 4 percent, from US$87.7 million in 2010 to US$84.1 million in 2011, due mainly to a decrease in depreciation charges;
(c) Energy costsincreased by 31percent, from US$53.0 million in 2010 to US$69.3 million in 2011, mainly due to increases in energy consumption during the milling process and in the unit cost per kilowatt negotiated with the electricity supplier during 2011; and
(d) Labor costs, including workers’ profit sharing,increasedby 54 percent, from US$166.5 million in 2010 to US$256.2million in 2011, due mainly to signing bonuses paid to employees pursuant to the new collective bargaining agreement entered into with union employees and higher workers’ profit sharing to be paid to employees calculated in 2011.
Total operating expenses. Operating expensesdecreased by 19 percent, from US$167.2 million in 2010 to US$136.1 million in 2011, due to changes in the following components:
(a) Selling expensesincreased by 9 percent, from US$76.6 million in 2010 to US$83.6 million in 2011, due mainly to an increase in freight expenses relating to the transport of copper concentrates;
(b) Other operating expensesincreased by 57 percent, from US$10.7 million in 2010 to US$16.9 million in 2011, principally due toan increase in costs incurred in connection with pre-feasibility studies for the expansion of mining operations;
(c) Voluntary contribution expensedecreased from US$41.1 million in 2010 to US$0.0 in 2011. The agreement mandating payment of the voluntary contribution expired as of December 31, 2010 as a result of Supreme Decree 071-2006 ME, and, as a result, Cerro Verde did not recognize any voluntary contribution expense for 2011; and
(d) Excess of workers’ profit sharing expensedecreased by 36 percent, from US$34.4 million in 2010 to US$21.9 million in 2011, due to lower taxable income.
Operating income.As a result of the foregoing, operating incomeincreased by 0.22percent, from US$1,555.8 million in 2010 to US$1,559.3 million in 2011.
Income tax. Income tax expense, including current and deferred expense,increased by 0.1percent, from an expense of US$483.3 million in 2010 to an expense of US$483.7 million in 2011. Net current income tax expenseincreased due to higher taxable income, partially offset by lower deferred taxes mainly related to mark-to-market adjustments.
Net income. As a result of the foregoing, net incomeincreased by0.4 percent, from US$1,074.4 million in 2010 to US$1,078.4 million in 2011. As a percentage of net sales, net income was 43 percent in 2011, compared with 45 percent in 2010.2013.
B. Liquidity and Capital Resources
As of December 31, 2012,2015, Cerro Verde had cash and cash equivalents of US$1,427.56.0 million, compared to US$1,383.619.6 million at December 31, 2011.2014.
Cash provided by operating activities for the years ended December 31 2012, 2015 and 2011.2014.Net cash and cash equivalents provided by operating activities were US$644.7(194.4) million in 20122015 and US$1,190.7186.6 million in 2011. The2014. This decrease in net cash flow provided by operating activities in 20122015 compared with 20112014 was mainly attributable to the following factors: (i) decrease in proceeds from sales from US$2,865 million in 2011 to US$1,961 million in 2012; (ii) decrease in payments to suppliers and salaries from US$1,057 million in 2011 to US$805 million in 2012 and (iii) decrease in payment of income tax from US$622 million in 2011 to US$413 million in 2012.
| · | a decrease in proceeds from sales from US$1,691 million in 2014 to US$1,120 million in 2015; |
| · | a decrease in payment of income tax from US$315 million in 2014 to US$121 million in 2015; and |
| · | a decrease in payments under protest related to tax assessments from SUNAT from US$166 million in 2014 to US$35 million in 2015; partially offset by: |
| · | an increase of payments to supplier and operational expenses from US$1,023 million in 2014 to US$1,158 million in 2015. |
Cash provided by operating activities for the years ended December 31 2011, 2014 and 2010.2013.Net cash and cash equivalents provided by operating activities were US$1,190.7186.6 million in 20112014 and US$1,256.9768.3 million in 2010. The2013. This decrease in net cash flow provided by operating activities in 20112014 compared with 20102013 was mainly attributable to the following factors: (i)
| · | a decrease in proceeds from sales from US$1,976 million in 2013 to US$1,691 million in 2014; |
| · | an increase in payment of income tax from US$275 million in 2013 to US$315 million in 2014; and |
| · | an increase in payments under protest related to tax assessments from SUNAT from US$44 million in 2013 to US$166 million in 2014. |
Cash used in investing activities for the years ended December 31, 2015 and 2014. Net cash used in investing activities increased proceeds from sales, from US$2,3011,469.4 million in 20102014 to US$2,865.51,784.7 million in 20112015, mainly due to the return in 2014 of a time deposit in the amount of US$225 million at a local bank in order to endorse a guarantee letter as an injunction to SUNAT, and (ii) an increase in value-added tax recovered, fromstripping asset activity of US$56.362.7 million in 2010 to US$61.5 million in 2011; partially offset by (i) increased payments to suppliers and of salaries, from US$505 million in 2010 to US$708.5 million in 2011; (ii) increased payments to contractors, from US$238 million in 2010 to US$316.4 million in 2011; (iii) increased payments of income tax, from US$327.1 million in 2010 to US$626.9 million in 2011; and (iv) an increase in other operating expenses, from US$52.4 million in 2010 to US$106.8 million in 2011.2015.
Cash used in investing activities for the years ended December 31, 20122014 and 20112013.. Net cash used in investing activities increased from US$195.21,340.5 million in 20112013 to US$600.81,469.4 million in 2012,2014, mainly due to an increase in purchases of property, plant and equipment (mainly related to the expansion of production at Cerro Verde.
Cash used in investing activities for the years ended December 31, 2011 and 2010. Net cash used in investing activities increasedVerde from US$122.2938 million in 20102013 to US$195.21,663.7 million in 2011, mainly due to an increase2014), which was partially offset by the cancellation in 2014 of a time deposit in the purchaseamount of property, plant and equipment during 2011.US$225 million at a local bank in order to endorse a guarantee letter as an injunction to SUNAT in 2013.
Cash used in financing activities for the years ended December 31 2012, 2015 and 20112014.Net. Net cash and cash equivalents used in financing activities was US$01,965.5 million in 20112015, mainly associated with aggregate drawings of US$1,375 million from the US$1.8 billion available under a syndicated credit facility that Cerro Verde entered into in March 2014 and 2012.US$600 million borrowed under a shareholder loan. Net cash used in financing activities was US$447.8 million in 2014.
Cash used in financing activities for the years ended December 31 2011, 2014 and 2010.2013. Net cash and cash equivalents used in financing activities decreased fromwas US$950.0 in 2010 to US$0447.8 million in 2011. The decrease2014, mainly associated with aggregate drawings of US$425 million from the US$1.8 billion available under a syndicated credit facility that Cerro Verde entered into in netMarch 2014. Net cash flow used in financing activities was US$0.8 million in 2011 compared with 2010 was mainly attributable to the non-payment of dividends during 2011.2013.
Long-term Debt
As of December 31, 2012,2015, Cerro Verde had nototal long-term debt outstanding.of US$1.8 million in connection with amounts drawn from a five year US$1.8 billion unsecured credit facility and financial lease contract liability.
C. Research and Development
Not applicable.
D. Trend Information
Expansion of operations
During 2010, Cerro Verde completed its concentrator plant expansion to increase the treatment of copper concentrate from 108,000 to 120,000 metric tons per day. During the second half of 2011, Cerro Verde completed the feasibility study for a major expansion of its concentrator and leaching facilities. The approximately US$4.04.6 billion project willwhich are expected to expand the processing capacityconcentrator facilities from 120,000 metric tons per day of ore to 360,000 metric tons per day, targeting incremental annual production of approximately 600 million pounds of copper and 15 million pounds of molybdenum beginning in 2016. Cerro Verde submitted the EIS to the Peruvian authorities for review and approval in December 2011 and received approval from the MEM in December 2012. In 2012, Cerro Verde continued with the execution of its unit of production expansion by undertaking detailed engineering studies and procuring long-lead items. As of December 31, 2015, the physical progress in the execution of the expansion project is 95.6% and Cerro Verde expects to begin the construction phasehas invested a total of this project in 2013.US$4.4 billion.
Other than as disclosed in this Annual Report, Cerro Verde has informed us that it is not aware of any trends, uncertainties, demands, commitments or events which are reasonably likely to have a material effect upon Cerro Verde’s net sales or revenues, income from continuing operations, profitability, liquidity or capital resources, or that would cause reported financial information to not necessarily be indicative of future operating results or financial condition.
E. Off-Balance Sheet Arrangements
Cerro Verde has informed us that there are no off-balance sheet arrangements that have or are reasonably likely to have a current or future effect on Cerro Verde’s financial condition, changes in financial condition, revenues or expenses, results of operations, liquidity, capital expenditures or capital resources that are material to investors.
F. Tabular Disclosure of Contractual Obligations
The following table shows Cerro Verde’s contractual obligations as of December 31, 2012:2015:
| | | | | Payments due by Period (US$ in millions) | | |
| | | | | Less than | | 1-3 | | 3-5 | | More than | | | Payments due by Period (US$ in millions) | |
| | | Total | | 1 year | | years | | years | | 5 years | | | Total | | | Less than 1
year | | | 1-5
years | | | More than 5
years | |
| Provision for Remediation and Mine Closure | | | 80 | | | | - | | | | - | | | | - | | | | 80 | | | | 161 | | | | 2 | | | | - | | | | 159 | |
| Other Long-Term Contractual Obligations | | | 176 | | | | 175 | | | | 1 | | | | - | | | | - | | |
| Other Current and Long-Term Contractual Obligations | | | | 2,876 | | | | 432 | | | | 1,800 | | | | 601 | |
| Total Contractual Cash Obligations | | | 256 | | | | 175 | | | | 1 | | | | - | | | | 80 | | | | 3,037 | | | | 434 | | | | 1,800 | | | | 760 | |
| ITEM 6. | Directors, Senior Management and Employees |
A. Board of Directors and Senior Management
Our Board of Directors is responsible for policy decisions and our overall direction and other corporate matters in accordance with our By-laws and the Peruvian Companies Law. Our executive officers oversee our business and are responsible for the execution of the policy decisions of the Board of Directors. The Board of Directors, which must be comprised of seven members, is elected at the annual obligatory meeting of shareholders, or the Annual“Annual Obligatory Meeting,” for a three-year term. The last election took place in March 2011,2014, and the next election is scheduled for March 2014. See2017. “Item 10. Additional Information—B. Memorandum and Articles of Association.”
Our current directors and executive officers are as follows:
| Name | | Age | | Position | | Date First
Appointed | | Current
Term Ends | | Age | | Position | | Date First
Appointed | | Current Term
Ends |
| Directors | | | | | | | | | | | |
| Roque Benavides | | 58 | | Chairman of the Board | | 1980 | | March 2014 | | 61 | | Chairman of the Board | | 1980 | | March 2017 |
| Timothy Snider | | 63 | | Director | | 2011 | | March 2014 | |
| Jose Miguel Morales(1) | | 67 | | Director | | 2012 | | March 2014 | | 70 | | Director | | 2012 | | March 2017 |
| Aubrey Laurence Paverd | | 74 | | Director | | 2002 | | March 2014 | |
| Igor Gonzales | | | 61 | | Director | | 2014 | | March 2017 |
| Felipe Ortiz-de-Zevallos | | 65 | | Director | | 2003 | | March 2014 | | 68 | | Director | | 2003 | | March 2017 |
| Carlos del Solar | | 72 | | Director | | 2011 | | March 2014 | | 75 | | Director | | 2011 | | March 2017 |
| Germán Suárez | | 71 | | Director | | 2005 | | March 2014 | | 74 | | Director | | 2005 | | March 2017 |
| William Champion(2) | | | 62 | | Director | | 2016 | | March 2017 |
| | | | | | | | | | | | |
| Executive Officers | | | | | | | | | | | |
| Roque Benavides(1) | | 58 | | President and Chief Executive Officer | | 2001 | | | 61 | | President and Chief Executive Officer | | 2001 | | |
| Carlos E. Gálvez | | 60 | | Vice President and Chief Financial Officer | | 2001 | | | 62 | | Vice President and Chief Financial Officer | | 2001 | | |
| Raúl Benavides(1) | | 57 | | Business Development Vice President | | 1997 | | | 60 | | Vice President Business Development | | 2014 | | |
| Alejandro Hermoza | | 51 | | Vice President Community Relations | | 2008 | | | 54 | | Vice President Community Relations | | 2008 | | |
| Francois Muths | | 61 | | Operations Vice President | | 2007 | | |
| César E. Vidal | | 58 | | Explorations Vice President | | 1996 | | |
| Igor Gonzales | | | 64 | | Vice President Operations | | 2014 | | |
| Gulnara la Rosa | | 48 | | General Counsel | | 2012 | | | 51 | | General Counsel | | 2012 | | |
| Leandro Garcia | | 44 | | General Comptroller and Compliance Officer | | 2011 | | | 47 | | General Comptroller and Compliance Officer | | 2011 | | |
| (1) | Roque Benavides is the brother of Raúl Benavides, and José Miguel Morales is the brother-in-law of Roque Benavides and Raúl Benavides. |
| (2) | Mr. Champion replaced Mr. Marsden following Mr. Marsden’s resignation in December 2015. Mr. Marsden replaced Mr. Snider following Mr. Snider’s resignation in August 2015. |
Set forth below is biographical information concerning members of our management:management.
Roque Benavides, Chairman of the Board, President and Chief Executive Officerand member of the Nominating Committee. Mr. Benavides has been a director since July 2004 and was our Chief Financial Officer from 1985 to February 2001, when he was appointed President and Chief Executive Officer. Prior toBefore that time, he served as Assistant to our Chairman of the Board from 1980 to 1985 and as a Project Engineer from 1977 to 1979. Mr. Benavides also has been an alternate member of the Executive Committee of Yanacocha since 1992. In addition, he is an alternate board member of Cerro Verde and was the General Manager of Recuperada S.A., formerly one of our majority-owned subsidiaries that has since merged into us, from 1981 to 1996. He currently is serving as an executive officer and as a director of several of our related companies. He also has served as a director of theSociedad Nacional de Minería, Petróleo y Energía (National Association of Minerals, Petroleum and Energy) since 1988, serving as Chairman of the Board from 1993 to 1995. Mr. Benavides served as chairman of theConfederación Nacional de Instituciones Empresariales Privadas(National (National Confederation of Private Companies, or CONFIEP)“CONFIEP”) from 1999 to March 2001. In 2001, Mr. Benavides was appointed Vice Chairman of the World Gold Council and Vice Chairman of the Silver Institute in 2007. Mr. Benavides received a B.S. in Engineering fromPontificia Universidad Católica del Perú (Pontifical Catholic University of Peru) in Lima, Peru in 1977 and an M.B.A. from Henley, The Management College of Brunnel University in 1980, and completed the Program for Management Development at the Harvard Business School in 1985 and the Advanced Management Program at Templeton College of Oxford University in 1997. He is a board member of Banco de Crédito and Cementos Lima,UNACEM, both Peruvian companies.
Timothy Snider,William Champion, Director.Mr. Champion has been a director since January 2016. He serves currently as a Principal with Gladiator Mining Group, LLC, a company formed to pursue global investment opportunities within the mining sector. Mr. Champion has worked for over 40 years in the mining industry, and he has extensive executive, management and operations experience across a wide range of mining commodities and global mining jurisdictions. From 2002 to 2014, Mr. Champion worked for Rio Tinto PLC in various senior executive management roles that included Managing Director of Rio Tinto Coal Australia, Managing Director of Rio Tinto Diamonds and President and CEO of Kennecott Utah Copper. Prior to that, Mr. Champion held the position of Executive Vice President for Cyprus Climax Metals from 1995 to 2000, with worldwide responsibilities for copper and molybdenum operations. Additionally, he worked for Phelps Dodge Mining Company in various capacities from 1984 to 1995 where, among other duties, he was President of Phelps Dodge Chile. Mr. Champion received Bachelor of Science degrees in Chemical Engineering and Biological Sciences from the University of Arizona.
José Miguel Morales, Director and member of the Nominating/Nominating and Corporate Governance Committee. Mr. Snider was appointed a director in March 2011. He serves as Chairman of Cupric Canyon Capital, LLC., a private equity company seeking investments in copper mining. In addition, he is a director of Compass Minerals International, Inc., and is Chairman of the Institute for Mineral Resources, a research organization sponsored by the University of Arizona. Mr. Snider is also a board member of the Northern Arizona University Foundation. Mr. Snider’s career in the copper business spans 41 years, the vast majority of which were with Phelps Dodge Corporation (now Freeport-McMoRan Copper and Gold). He began his career in 1970 as an underground mine laborer in the Copper Queen operation in Bisbee, Arizona, and held numerous operational, technical, and exploration positions at several of Phelps Dodge’s operations in the United States and Chile. He led Phelps Dodge in the application of hydrometallurgical processing during the 1980s and 1990s. In 1998, Mr. Snider was appointed President of Phelps Dodge Mining Company and in 2003 was promoted to President and Chief Operating Officer of Phelps Dodge Corporation. In these roles, he led the operational and technical integration of Phelps Dodge’s Cyprus-AMAX acquisition, led several greenfield and brownfield expansion projects, and helped to establish Phelps Dodge as one of the industry leaders in technology development and operational excellence. In early 2007, he assumed the role of President and Chief Operating Officer of Freeport-McMoRan Copper and Gold, Inc. upon Freeport’s acquisition of Phelps Dodge, a position he held until the end of the first quarter of 2008. Mr. Snider holds a B.S. in Geology and Chemistry from Northern Arizona University and is a graduate of the Wharton Advanced Management Program at the University of Pennsylvania.
Aubrey Laurence Paverd, Director and member of the Nominating/Corporate Governance Committee and Audit Committee. Dr. Paverd is currently a private consultant based in Melbourne, Australia. He has been a director since 2002. From 1994 to 2000, he held the position of Group Executive Exploration with North Ltd., a diversified mining company with gold and base metal mines in Australia, Europe and North and South America. His career with Newmont Mining Corporation spanned 21 years. He began as Chief Geologist of South Africa in 1973, rising through the positions of Chief Geologist at Tsumeb Corporation Ltd., Namibia, a subsidiary of Newmont, to assistant to the Vice President of Exploration in New York in 1979, Director of Foreign Exploration in 1981 and ultimately Vice President of Exploration when he left Newmont in 1994. Dr. Paverd was also a lecturer in geology at Rhodes University during 1972 and 1973 and worked as a field and mining geologist in Australia and Zambia during the period from 1962 to 1969. He received B.S. (Hons) and M.S. degrees from Rhodes University in 1961 and 1966, respectively, and a Ph.D. from the University of James Cook North Queensland in 1972. Dr. Paverd is currently also a director of Randgold Resources Ltd., a London-listed West African gold mining company.
José Miguel Morales, Director and member of the Nominating/Corporate Governance CommitteeCommittees. Mr. Morales was our General Counsel from 1973 to 2012 and was appointed a member of the Board in 2012. From 1992 to 1995, Mr. Morales served as an alternate member of the Executive Committee of Yanacocha. Mr. Morales has also served as a member of the Executive Committee of Yanacocha since 1995. Mr. Morales currently serves as a director of seven of our nineteen mining and mining-related subsidiaries or affiliates. In addition, he has served as a director of theInstituto Nacional de Derecho de Minería y Petróleo (National Institute of Mining and Petroleum Law), serving as its President from 1989 to 1990 and as a director of theSociedad de Minería y Petróleo del Perú (Mining and Petroleum Society of Peru) since 1998, serving as its vice chairman since 2000.–from 2000 to 2002 . He has been a director of the following non-mining related companies: Almaceneradel Perú S.A. from 1992, Inversiones Cosepa S.A. from 1979, Hotel Costa del Pacífico S.A. from 1994 to present and El Pacífico—Peruana Suiza Compañía de Seguros from 1979.1979 to 2015. Since 1973, he also has been a partner of Estudio Aurelio García Sayán Abogados, a Lima law firm.firm, and has been the Senior Partner since 2007. In February 2003, Mr. Morales was elected president of theSociedad Nacional de Minería, Petróleo y Energía(National (National Association of Minerals, Petroleum and Energy). On January 31, 2005, Mr. Morales ended his tenure as President ofSociedad Nacional de Minería, Petróleoyleo y Energía and was elected onserved as President of CONFIEP from March 16, 2005 until 2007. He promoted the incorporation of Empresarios por la Educación, a non-profit organization to improve education in Peru, serving as its President ofConfederación Nacional de Instituciones Empresariales Privadas (National Confederation of Private Companies, or CONFIEP) untilsince 2007. Mr. Morales received his law degree fromPontificia Universidad Católicadellica del Perú in 1968 and completed the Sloan Program at Stanford University’s Graduate School of Business in 1976.
Igor Gonzales, Director, Vice President Operations and member of the Nominating/Corporate Governance Committee.Mr. Gonzales is a Chemical Engineer from San Antonio Abad University, Cusco, Peru, with 35 years of experience. He is currently a Managing Partner at Magris Resources. He has been a director since February 27, 2014. He was Vice President and General Manager of Pierina Mine Peru, President of Barrick South America, Chief Operating Officer of Barrick Gold Corporation and worked for Southern Peru Copper Corporation Toquepala –Perú from 1980 to 1997. He has been a director of Hudbay Minerals Incorporated, Sierra Metals and Minera Corona. Mr. Gonzales received an M.S. in Extractive Metallurgy from New Mexico Institute of Mining and Technology – Socorro, N.M U.S.A. in 1983 and completed the Advance Management Programme at Henley Management College-England in 2007.
Felipe Ortiz-de-Zevallos, Director and member of the Audit Committee, Compensation Committee and Nominating/Corporate Governance Committee.Committee. Mr. Ortiz-de-Zevallos has been a director since August 2003. He was President of theUniversidad del Pacífico de Lima from 2004 to 2006 and is the founder and chairman of the Board ofGrupo APOYO since 1977. Mr. Ortiz-de-Zevallos received a degree in Industrial Engineering from The National University of Engineering in 1968, received an M.S. in Administration and System Analysis from the University of Rochester in 1970 and completed the Owner/President Management program at Harvard Business School in 1996. He was the Peruvian ambassador to the United States of America from 2006 to March 2009.
Carlos del Solar, Director, member of the Audit Committee, Compensation Committee and Nominating/Corporate Governance CommitteeCommittee.. Mr. del Solar was appointed a director in March 2011.He graduated with degrees in Geology and Geological Engineering from the National University of San Marcos, earned a Master of Science degree from Stanford University, California and completed the Advanced Executive Management Program at the University of Piura.BetweenPiura. He started his professional career as an exploration geologist for Mobil Oil in Peru and Central America. Between 1977 and 1998 he worked for Occidental Petroleum in Peru as Exploration Vice President, California as Regional Exploration Manager for Latin America and the Caribbean. Then as Exploration Vice President in Malaysia, Regional Operations Manager for Latin America and later, President and General Manager of the Business Unit in Venezuela. Between 1998 and 2001, Mr. del Solar served as President and General Manager of ARCO for Brazil, Colombia, Peru, and Trinidad. In April 2001, he joined Hunt Oil in Peru as President and General Manager.Manager and participated in the development of the Camisea gas project and the LNG export project. From January 2005 through January 2007, he served as President of the National Society of Mining, Petroleum and Energy and as First Vice President of the Peruvian Confederation of Private Business Associations (CONFIEP)CONFIEP from March 2007 through March 2009. SinceFrom March 2010 to March 2012 Mr. del Solar has served as Second Vice President of the Peruvian Exporters Committee (COMEXPERU)(“COMEXPERU”). He is currently a director and member of the Executive Committees of the National Society of Mining, Petroleum and Energy, of the Peruvian Confederation of Private Business Associations (CONFIEP) and of COMEXPERU. Mr. del Solar also serves as President of the Advisory Council of the Graduate School of the Peruvian University of Applied Sciences (UPC)Universidad de Ciencias Aplicadas (“UPC”).
German Suárez, Director and Chairman of the Audit Committee and Compensation Committee and Nominating/Corporate Governance CommitteeCommittee.. Mr. Suárez has been a director since March 2005. Mr. Suárez is an economist who was employed by the Central Bank from 1964 to 1990. From 1979 to 1980, he worked at the International Monetary Fund or IMF,(the “IMF”), representing Peru, and from 1981 to 1990 he was in charge of different posts at the Ministry of Economy and Finance. Mr. Suárez served as Chairman ofBanco de la Naciónfrom 1990 to 1992 and Chairman of the Central Bank of Peru from 1992 to 2001. He was a member of the board of directors at Bladex, Extebandes and Arlabank, Latin American Reserves Fund, Credicorp Ltd. and Banco de Créditodel Peru.dito del Perú. From 1993 to 2001, Mr. Suárez served as Governor of the IMF and Alternate Governor of the Inter-American Development. For the period from 2000 to 2001, Mr. Suárez was elected Chairman of the G-24 (IMF-World Bank). Mr. Suárez graduated from UNMSMthe National University of San Marcos with a B.S. in Economics in 1965 and received an M.A. in Economics from Columbia University in 1969.
Carlos E. Gálvez, Vice President and Chief Financial Officer. Mr. Gálvez was the Deputy Manager, Finance and Information Systems, from 1985 to February 2001, when he was appointed Vice President and Chief FinancialOfficer.Financial Officer. He served as Deputy Manager of our Treasury from 1980 to 1985, and as Treasurer from 1978 to 1980. Mr. Gálvez has also served as director of Colquirrumi, our subsidiary, and was appointed director and General Manager of Conenhua in 2000, Director and General Manager of Empresa de Generacion Huanza in 2007, director of Compañia Minera Condesa in 2010, director of El Brocal in 2002, and director of Contacto S.A. in 2005.2005 and other three related companies. He has served as an alternate member of the Executive Committee of Yanacocha since 2005, Minera La Zanja since 2012 and an alternate board member of Cerro Verde since 2005. He also has served as directorwas named President of theSociedad Nacional de Minería, Petróleo y Energía del Perú(Mining, (Mining, Petroleum and Energy Society of Peru) in 2015 and has served as director of the same since 2000. Prior toBefore joining us, Mr. Gálvez served as Managerial Adjunct for Finance and Credit from 1971 to 1978 atBanco Minero del Perú (Mining Bank of Peru). He has also served as a board member of theComité de Operación Económica del Sistema Eléctrico Nacional (Committee of Economic Operation of the National Electric System). Mr. Gálvez received his B.A. in Economics from theUniversidad Nacional Federico Villarreal in 1976, his M.B.A. from theUniversidad del Pacifico de Lima in 1980 and completed the Program for Management Development, in 1997, and the Advanced Management Program, in 2005, at The Harvard Business School.
Raúl Benavides Ganoza,Vice President of Business Development.Mr. Benavides has been Vice President of Business Development since 1992. He is also a member of the Executive Committee of Yanacocha and board member of Cerro Verde and several of our related companies. From 1984 to 1996 he was General Manager (CEO) of Compañía de Minas Orcopampa. Prior toBefore that time, Mr. Benavides was Manager of Operations from 1983 to 1984 and Mine Manager from 1980 to 1983 at Colquirrumi.SinceColquirrumi. Since 1995, he has been a professor of mining administration atPontificia Universidad Católica del Perú. Mr. Benavides also has served as President of theInstituto de Ingenieros de Minas (Institute of Mining Engineering), was also the Founder and President of theInstituto de Seguridad Minera del Perú(Mining (Mining Safety Institute of Peru) from 1996 to 2000. Mr. Benavides received a B.S. in Mining Engineering from the University of Missouri-Rolla in 1980, an M.S. in Mineral Engineering-Management from Pennsylvania State University in 1984 and completed the Advanced Management Program at The Harvard Business School in 2001. Since 2014, Mr. Benavides has assumed the management of the Explorations Department.
Alejandro Hermoza Maraví, Vice President Community RelationsSocial and Environmental Affairs. A Mechanical Engineer graduated from the University of Maryland, Mr. Hermoza also holds an MSc in Engineering from the same University and an MBA from theUniversidad de Ciencia Aplicadas – UPC. He worked as Development Manager for theConfederación Nacional de Instituciones Empresariales Privadas – CONFIEP, and later joined us in 2003, where he began as Deputy Manager for Administration and Human Resources. In 2011, Mr. Hermoza completed the Advance Management Program at Harvard Business School.
Francois Muths, Vice President of Operations. Mr. Muths was appointed Vice President of Operations in February 2007. Prior to that time, Mr. Muths served as a director and general manager of Inversiones Mineras del Sur S.A., our wholly-owned subsidiary from 2005 to 2006, general manager from 1985 to 2005 and general superintendent of the Uchucchacua mine from 1981 to 1983. He received a B.S. in engineering from the National Engineering University of Peru and a M.S. in Mining Engineering from the Colorado School of Mines. In 2005, Mr. Muths completed the Program for Management Development at Harvard Business School.
César E. Vidal, Vice President of Exploration. Dr. Vidal has been our Exploration Manager from 1996 to 2010 and Vice President of Exploration from 2011 onwards. Dr. Vidal received his B.Sc. in Geology from Universidad Nacional de Ingenieria (UNI) in 1977, a Ph.D. in Geology from the University of Liverpool, UK, in 1980 and certification as an engineering geologist in Peru from UNI in 1984. He was post-doctoral research fellow at the University of Heidelberg, Germany, from 1985 to 1986. From 1981 to 1987, he served as a geologist for Buenaventura Ingenieros S.A. From 1987 to 1991, he served as an exploration geologist for Perubar S.A., a Peruvian zinc mining company of the Glencore Group. Prior to rejoining Buenaventura, from 1991 to 1995, he served as an independent consultant to several mining companies. In 2002, he received the “Distinguished Engineering Geologist” award given by the Colegio de Ingenieros del Perú. He completed the Advanced Management Program at Templeton College, Oxford University in 2005 and currently serves as an alternate member of Minera Yanacocha’s Executive Committee.
Leandro Garcia, General Comptroller and Compliance Officer. Mr. Garcia received his Bachelor in Business Administration and Bachelor in Accounting from Universidad del Pacifico and his M.B.A. from the University of Miami, Florida. Mr. Garcia worked at Buenaventura from 1990 to 1997, where he served as Head of Treasury. He performed as CFO inSociedad Minera El Brocal until 2000. He was also General Manager of BTL Drugstores until 2005 and General Manager ofInkafarma Drugstores until June 2011. He rejoined Buenaventura as General Comptroller in July 2011.
Gulnara La Rosa,General Counsel. Ms. La Rosa has worked at Buenaventura since 1990. She was the Legal Director from 2006 to June 2012 and was appointed as Legal Manager and General Counsel in July 2012. Ms. La Rosa served as Head of the Legal Department from 1997 to 2006 and as a lawyer from 1991 to 1997. Ms. La Rosa received her law degree fromPontificia Universidad Católica del Perú in 1992. She also completed the Corporate Law Specialization Program atUniversidad de Navarra, Spain, in 1991 and the High Specialization Program of Finance and Corporate Law at ESAN Graduate School of Business, Perú, in 2001. In addition, Ms. La Rosa attended the Management Program for Lawyers at Yale School of Management in 2005 and the Corporate Governance and Performance Program at Yale School of Management in 2012.
B. Compensation
During the year ended December 31, 2012,2015, the aggregate amount of compensation that we paid to all directors and executive officers was approximately US$27.57.8 million, including director’s fees accrued in 20112014 and paid in 2012.2015. We do not disclose to our shareholders or otherwise make public information with respect to the compensation of our individual directors or executive officers.
We have a long-term stock appreciation program, with a term of ten years once initiated, that allows certain executives Please refer to receive a cash remuneration equivalent to any excessNote 30 of the market value at a future date over a stated price of a stated number of our ADSs. This program is in effect as long as the executives are employed by us at the settlement date of the program. See Note 14(b) to the Financial Statements.Statements for further information.
C. Board Practices
Audit Committee
The Audit Committee, which is composed entirely of independent directors as defined in Section 303A.02 of the New York Stock Exchange’s Listed Company Manual, is responsible for assisting the Board of Directors in the appointment of independent auditors, upon delegation of such responsibility by the shareholders at the general meeting of shareholders, or the General“General Meeting,” and reviewing the scope of internal and external audits. The Audit Committee also reviews compliance with internal control systems, reviews our annual and quarterly financial statements, reviews financial statements before their presentation to theSuperintendencia del Mercado de Valores, or the SMV(formerlySMV (formerly known as theComisión Nacional Supervisora de Empresas y Valores (National Supervisory Commission of Business and Securities), or CONASEV) (“CONASEV”)), theBolsa de Valores de Lima (Lima Stock Exchange) and the SEC and maintains the integrity of the preparation of audits. The members of the Audit Committee are currently Messrs. Suárez, Paverd, Ortiz-de-Zevallos and del Solar.
Compensation Committee
The Compensation Committee is responsible for evaluating executive performance and approving executive compensation, including compensation of the chief executive officer and any stock option compensation plans. The members of the Compensation Committee are currently Messrs. del Solar, Ortiz-de-Zevallos and Suárez.
Nominating/Corporate GovernanceNominating Committee
The Nominating/Corporate Governance CommitteeNominating is responsible for preparing the proposals for the general meetings in respect of the composition of the Board of Directors along with the director remuneration to be approved by the shareholders,shareholders. The members of the Nominating Committee are currently Messrs. Benavides-Ganoza, Morales and Ortiz-de-Zevallos.
Corporate Governance Committee
The Corporate Governance Committee is responsible for monitoring issues and practices related to corporate governance and proposing necessary actions in respect thereof. The members of the Nominating/Corporate Governance Committee are currently Messrs. Benavides-Ganoza, Suárez, Morales del Solar, Paverd, Ortiz-de-Zevallos and Snider.Ortiz-de-Zevallos.
D. Employees
As of December 31, 2012,2015 we, andincluding our subsidiaries and Coimolache, had 5,088 employees.3,419 employees (including 45 employees from our mining trainee program). In addition, we have entered into arrangements with independent contractors which employed 15,535 persons who worked11,668 workers at our operations. We have sought to strengthen our workforce by implementing a qualifications-based hiring policy and, with respect to employees working in the mines, reducing the average age of the workforce. As of December 31, 2012,2015, the average tenure of ourBuenaventura’s permanent laborers at the Julcani, Uchucchacua, Orcopampa, Poracota, Recuperada, Ishihuinca, Mallay, Breapampa and Antapite mines (the only mines for which we have long-term historical records) was approximately 108 years.
Of our 1,954the 2,634 permanent employees employed by Buenaventura and its subsidiaries directly, approximately 84 percent39% are members of nine11 different labor unions (including threefour unions and one labor union committee for clerical workers, and fiveseven unions for laborers), which represent all clerical workers and laborers in collective bargaining negotiations with us. There are also five unions for workers employed by independent contractors that were formed over the last foursix years in our mines at Uchucchacua, Antapite, Orcopampa, PoracotaLa Zanja, Julcani and Julcani.El Brocal.
Each of the labor unions is a company-based union with an affiliation to a national union. Administrative personnel are not represented by unions. Labor relations for unionized and non-unionized employees in our production facilities, including compensation and benefits, are governed by collective bargaining agreements, the terms and length of which are negotiated throughout the year as the various collective bargaining agreements come up for renewal. These collective bargaining agreements are typically one year in length and set wages for the applicable period, including increases as negotiated and certain other employee benefits, such as overtime, bonuses and family benefits.
During the six years prior to April 30, 2007, we did not experience any strikes. Between April 2007 and June 2008, we were affected by five strikes, each lasting three to seven days, at our Uchucchacua, Orcopampa, Ishihuinca and Antapite mines. On October 19, 2009, the National Mining Federation held a two-day strike at our Uchucchacua mine. In 2010, we experienced two simultaneous strikes, each lasting approximately seven days, affecting operations at our Orcopampa, Uchucchacua and Antapite mines. In April 2011,2015, we experienced a 21-daystrike at one of our mines. Between May and June 2015, we had a strike at the Uchucchacua mine for 29 days that was staged by workers’ and contractors’ unions claiming unsuitable working conditions. The Peruvian Ministry of Labor declared the Uchucchacua workers’ work stoppages illegal. In June of 2015, El Brocal experienced two days of work stoppage at our Uchucchacua mine due to a strikeits concentrator plant in Huaraucaca in connection with the negotiation of salaries and related local community demonstrations. In May and October 2011, we experienced two three-day strikes at our Orcopampa mine. In May and June 2012, we experienced a 15-day work stoppage at our Orcopampa mine due to strikes related to the collective bargaining process with our labor unions and a further 9-day work stoppage at our Orcopampa mine in October 2012 due to a strike by a contract labor union.agreement.
Compensation received by our employees includes salary, other cash payments (such as overtime, vacation pay and bonuses including, but not limited to, high altitude and underground mining bonuses) and non-cash benefits. Non-cash benefits include medical insurance, life insurance and training programs for workers and administrative staff. For mine and processing plant workers, benefits also include transportation services, meals or food allowances, education for children of our employees and housing, hospitals and a full range of social services for our permanent employees and their families at town sites near our mines in compliance with mining regulations. We voluntarily provide power, water and sewage services for the camp and houses of the workers as well as for certain towns nearby. In addition, pursuant to a profit-sharing plan mandated by Peruvian labor legislation, employees of mining companies in Peru are entitled to receive the Employee Profit Sharing Amount equivalent to 8 percent8% of the annual pre-tax profits of their employer, 50 percent50% of such profits to be distributed based on the number of days each employee worked during the preceding year and the remaining 50 percent50% of such profits to be distributed based on the aggregate annual salary of each employee. Effective January 1, 1997, the annual payment to each employee under the profit sharing plan cannot exceed 18 times such employee’s monthly salary, and any difference between the Employee Profit Sharing Amount and the aggregate amount paid to employees must be contributed by us to theFONDO-EMPLEO,FONDOEMPLEO, a fund established to promote employment and employee training.
Under Peruvian law, we may dismiss workers for cause by following certain formal procedures. We may dismiss a worker without cause, provided that we pay such worker a layoff indemnification in an amount equal to one and a half month’s salary for each full year worked plus the pro rata portion for any uncompleted year, not to exceed in the aggregate 12 months’ salary. Several decisions adopted by the Peruvian Constitutional Court, holding that an employee is entitled for reinstatement if no cause for dismissal is expressed by the employer or for failure to present evidence supporting the employer’s grounds, have limited our ability to dismiss a worker without cause. However, all employees are entitled to a severance payment upon termination of their employment, regardless of the reason for such termination, equal to approximately one month’s salary for each full year worked plus the pro rata portion for any uncompleted year. Pursuant to the Peruvian labor laws enacted in 1991,1992, we deposit funds for severance payments in a bank account selected by each employee and for the benefit of such employee, in both May and November of each year.
Our permanent employees receive the benefit of one of two types of pension arrangements. All workers can choose to enroll in the ONP (aa public pension fund managed by the state)state (the “ONP” system) or in AFPs (privatea private pension funds)funds (the “AFP” system). We are required to withhold from each of the salaries of the employees enrolled in the ONP system approximately 13 percent13% of such employee’s salary, and pay such amount to the ONP system and withhold from the salary of each employee enrolled in the AFP system approximately 13 percent12.5% of such employee’s salary, and pay such amounts to the respective AFP (exact amount varies from one AFP to another). Additionally, for workers involved in mining and metallurgical processes, an additional 2 percent2% is withheld from their salaries, and we contribute an additional 2 percent to increase their pension funds. We have no liability for the performance of these pension plans. In addition, our independent contractors are responsible for covering severance and pension payments with respect to their employees.
In addition, we pay ESSALUD 9 percent9% of our total payroll for general health services for all permanent employees. Prior to May 1997, we were required to pay to ESSALUD 1 percent of our payroll of blue collar employees for employment-related illness and accidents, or the Workers Compensation Fund Payment. In addition,Further, Law No. 26790 also requires us to provide private insurance representing an average payment equal to 1.30 percent of the payroll of covered employees for employment-related incapacity and death for blue collar employees and other employees exposed to mining-related hazards.
E. Share Ownership
As of March 31, 2013,2016, our directors and executive officers, as a group, owned 948,62441,588,448 Common Shares, representing 0.37 percent16.36% of all the 254,232,571254,186,867 Common and Investment Shares outstanding. Our directors and executive officers do not own any Investment Shares.
The share ownership of the Company’s directors and executive officers on an individual basis as of March 31, 20132016 is set forth below:
| Shareholder | | Number of
Common
Shares | | Percentage
Beneficial
Ownership
of Common
Shares | | Number of
Investment
Shares | | Percentage
Beneficial
Ownership
of
Investment
Shares | | Number of
Common
Shares
and Investment
Shares | | Percentage
Beneficial
Ownership of
Common Shares
and Investment
Shares | | | Number of
Common Shares | | | Percentage
Beneficial
Ownership of
Common Shares | | | Number of
Investment Shares | | | Percentage
Beneficial
Ownership of
Investment Shares | | | Number of
Common Shares
and Investment
Shares | | | Percentage
Beneficial
Ownership of
Common Shares
and Investment
Shares | |
| | | | | | | | | | | | | | | | | | | | | | | | | | | | | | | | | | | | | | |
| Roque Benavides† | | | 365,398 | | | | 0.14 | | | | — | | | | — | | | | 365,398 | | | | 0.14 | | | | 13,912,006 | | | | 5.48 | | | | | | | | | | | | 13,912,006 | | | | 5.47 | |
| Timothy Snider | | | — | | | | — | | | | — | | | | — | | | | — | | | | — | | |
| William Champion | | | | — | | | | — | | | | — | | | | — | | | | — | | | | — | |
| José Miguel Morales† | | | 267,228 | | | | 0.11 | | | | — | | | | — | | | | 267,228 | | | | 0.11 | | | | 13,813,836 | | | | 5.44 | | | | | | | | | | | | 13,813,836 | | | | 5.43 | |
| Aubrey Laurence Paverd | | | — | | | | — | | | | — | | | | — | | | | — | | | | — | | |
| Igor Gonzalez | | | | — | | | | — | | | | — | | | | — | | | | — | | | | — | |
| Felipe Ortiz-de-Zevallos | | | — | | | | — | | | | — | | | | — | | | | — | | | | — | | | | — | | | | — | | | | — | | | | — | | | | — | | | | — | |
| Carlos del Solar | | | — | | | | — | | | | — | | | | — | | | | — | | | | — | | | | — | | | | — | | | | — | | | | — | | | | — | | | | — | |
| Germán Suárez | | | — | | | | — | | | | — | | | | — | | | | — | | | | — | | | | — | | | | — | | | | — | | | | — | | | | — | | | | — | |
| Raúl Benavides† | | | 267,228 | | | | 0.11 | | | | — | | | | — | | | | 267,228 | | | | 0.11 | | | | 13,813,836 | | | | 5.44 | | | | | | | | — | | | | 13,813,836 | | | | 5.43 | |
| Carlos E. Gálvez. | | | 48,770 | | | | 0.02 | | | | — | | | | — | | | | 48,770 | | | | 0.02 | | | | 48,770 | | | | 0.02 | | | | — | | | | — | | | | 48,770 | | | | 0.02 | |
| Alejandro Hermoza | | | — | | | | — | | | | — | | | | — | | | | — | | | | — | | | | — | | | | — | | | | — | | | | — | | | | — | | | | — | |
| Francois Muths | | | — | | | | — | | | | — | | | | — | | | | — | | | | — | | |
| César E. Vidal | | | — | | | | — | | | | — | | | | — | | | | — | | | | — | | |
| Gulnara la Rosa | | | — | | | | — | | | | — | | | | — | | | | — | | | | — | | | | — | | | | — | | | | — | | | | — | | | | — | | | | — | |
| Leandro Garcia | | | — | | | | — | | | | — | | | | — | | | | — | | | | — | | | | — | | | | — | | | | — | | | | — | | | | — | | | | — | |
| | | | | | | | | | | | | | | | | | | | | | | | | | |
| Directors and Executive Officers as a Group† | | | 948,624 | | | | 0.37 | % | | | — | | | | — | | | | 948,624 | | | | 0.37 | % | | | 41,588,448 | | | | 16.39 | | | | | | | | | | | | 41,588,448 | | | | 16.36 | |
| † | Does not includeIncludes Common Shares owned by Roquethe applicable Benavides Raúl Benavidesfamily member and the spouse of José Miguel Morales that are subject to usufructo agreements and related legal instruments with Alberto Benavides. These usufructo agreements and related legal instruments grant Alberto Benavides voting control over the Common Shares subject thereto and entitle Mr. Benavides to receive all dividends payable thereon during his lifetime. Alberto Benavides exercises voting control over the Common Shares subject to the usufructo agreements and related legal instruments, including 13,546,608, 13,546,608 and 13,546,608 Common Shares owned by each of Roque Benavides, Raúl Benavides and the spouse of José Miguel Morales, respectively. The Common Shares subject to the usufructo agreements and related legal instruments are not included in the separate calculations of share ownership for Roque Benavides, Raúl Benavides and José Miguel Morales in the table above.or her spouse. |
| ITEM 7. | Major Shareholders and Related Party Transactions |
A. Major Shareholders
As of March 31, 2013,2016, we had 274,889,924 Common Shares outstanding, including 21,130,26021,144,734 treasury shares, and 744,640 Investment Shares, including 271,733272,963 treasury shares. The Common Shares are voting securities. The table below sets forth certain information concerning ownership of (i) the Common Shares and Investment Shares and (ii) the aggregate Common Shares and Investment Shares, as of March 31,2013,31, 2016, with respect to each shareholder known to us to own more than 2.5 percent of the outstanding Common Shares and with respect to all directors and executive officers as a group.
Control of the Company(1)
| Shareholder | | Number of
Common Shares | | | Percentage Beneficial
Ownership of
Common Shares (1)(2) | | | Number of
Investment Shares | | | Percentage Beneficial
Ownership of
Investment Shares
(1)(3) | | | Number of Common
Shares and
Investment Shares | | | Percentage Beneficial
Ownership of
Common Shares and
Investment Shares
(1)(4) | |
| | | | | | | | | | | | | | | | | | | |
| Benavides Family(5) | | | 69,187,744 | | | | 27.27 | | | | — | | | | — | | | | 69,187,744 | | | | 27.2 | |
| Market Vectors ETF Trust Gold Miners ETF | | | 16,866,914 | | | | 6.1 | | | | — | | | | — | | | | 16,866,914 | | | | 6.1 | |
| Templeton Asset Management Ltd. Hong Kong | | | 8,542,95 | | | | 3.1 | | | | — | | | | — | | | | 8,542,957 | | | | 3.1 | |
| BlackRock Investment Management (UK) Ltd. | | | 7,933,466 | | | | 2.9 | | | | — | | | | — | | | | 7,933,466 | | | | 2.9 | |
| Shareholder | | Number of
Common Shares | | | Percentage
Beneficial
Ownership of
Common
Shares(3) | | | Number of
Investment
Shares | | | Percentage
Beneficial
Ownership of
Investment
Shares(4) | | | Number of Common
Shares
and Investment Shares | | | Percentage Beneficial
Ownership of
Common Shares and
Investment Shares(5) | |
| | | | | | | | | | | | | | | | | | | |
| Benavides Family(2) | | | 69,187,744 | | | | 27.27 | | | | — | | | | — | | | | 69,187,744 | | | | 27.21 | |
| BlackRock Investment Management (UK) Ltd. | | | 19,206,054 | | | | 7.57 | | | | — | | | | — | | | | 19,206,054 | | | | 7.55 | |
| BlackRock Global Funds-World Mining Fund | | | 8,750,000 | | | | 3.45 | | | | — | | | | — | | | | 8,750,000 | | | | 3.44 | |
| Prima, AFP | | | 12,806,114 | | | | 5.05 | | | | — | | | | — | | | | 12,806,114 | | | | 5.04 | |
| Integra, AFP | | | 12,619,755 | | | | 4.97 | | | | — | | | | — | | | | 12,619,755 | | | | 4.96 | |
| Market Vectors ETF Trust Gold Miners ETF | | | 11,015,164 | | | | 4.34 | | | | | | | | | | | | 11,015,164 | | | | 4.33 | |
| Van Eck Global | | | 12,079,992 | | | | 4.76 | | | | | | | | | | | | 12,079,992 | | | | 4.75 | |
| BlackRock Global Funds-World Gold Fund | | | 7,800,000 | | | | 3.08 | | | | — | | | | — | | | | 7,800,000 | | | | 3.07 | |
| Fidelity Management & Research Co | | | 4,288,376 | | | | 1.69 | | | | — | | | | — | | | | 4,288,376 | | | | 1.69 | |
| Horizonte, AFP | | | 9,349,815 | | | | 3.68 | | | | — | | | | — | | | | 9,349,815 | | | | 3.68 | |
| BlackRock Fund Advisors | | | 8,064,437 | | | | 3.18 | | | | — | | | | — | | | | 8,064,437 | | | | 3.17 | |
| (1) | The table above excludes treasury shares. As of March 31, 2013,2016 Buenaventura held 14,474 common shares and 1,230 Investment Shares and our wholly-owned subsidiary, Condesa, held 21,160,260 Common Shares and 271,733 Investment Shares. |
| (2) | ThesePercentage calculated on the basis of 253,715,190 Common Shares are owned by certain members of Alberto Benavides de la Quintana’s immediate and extended family and their spouses and include the Common Shares overoutstanding, which Alberto Benavides de la Quintana exercises voting and dispositive control pursuant to usufructo agreements and related legal instruments.excludes 21,174,734 treasury shares. |
| (3) | Percentage calculated on the basis of 253,729,664 Common417,677 Investment Shares outstanding, which excludes 21,160,260272,963 treasury shares. |
| (4) | Percentage calculated on the basis of 472,907 Investment Shares outstanding, which excludes 271,733 treasury shares. |
| (5) | Percentage calculated on the basis of 254,232,571254,186,867 Common Shares and Investment Shares outstanding, which excludes 21,431,993 treasury21,447,697treasury shares. |
| (5) | These Common Shares are owned by certain members, and their spouses, of the immediate and extended family of Elsa Ganoza Benavides (spouse of the late Alberto Benavides de la Quintana, our founder and former Chairman). |
As of March 31, 2013,2016, we estimate that 152,022,687185,756,736 ADSs were held in the United States, which represented approximately 55.31 percent73.21% of Common Shares outstanding. The number of institutional record holders of our Common Shares (or of ADSs representing our Common Shares) in the United States was 5869 institutions.
B. Related Party Transactions
Except as otherwise disclosed herein, no director, senior officer, principal shareholder or any associate or affiliate thereof had any material interest, direct or indirect, in any transaction since the beginning of our last financial year that has materially affected us, or in any proposed transaction that would materially affect us. Except as otherwise disclosed herein, we have entered into no transactions with parties that are not “related parties” but who would otherwise be able to negotiate terms not available on an arm’s-length basis. From time to time in the ordinary course of business, we enter into management, exploration, mine construction, engineering and employment contracts with joint venture companies in which one or more of our direct or indirect subsidiaries holds equity or partnership interests.
The compensation of our key executives (including the related income taxes we assumed in connection therewith) totaled US$51.12.8 million in 20112014 and US$32.34.8 million in 2012.2015.
Chaupiloma is the legal owner of the mineral rights operated by Yanacocha and receives a 3 percent3% royalty based on quarterly sales, after deducting refinery and transportation costs. Royalties amounted to US$55.944.2 million, US$62.736.9 million and US$67.232.4 million in 2010, 20112013, 2014 and 2012, respectively,2015, and are presented as royalty income in our consolidated statements of income.
Condesa did not receive a cash dividend from Yanacocha in 2010, 20112013, 2014 or 2012.2015.
We received cash dividends from Cerro Verde of approximately US$183.0million in 2010. We did not receive a cash dividend from Cerro Verde in 20112013, 2014 or 2012.2015.
We received cash dividends from Coimolache of approximately US$16.59.8 million in 2012.2013, US$12.9 million in 2014 and US$6.7 million in 2015.
In March 2002, Buenaventura Ingenieros S.A.BISA signed a technical service agreement with Yanacocha to perform a number of specialized activities and services. Pursuant to the agreement, the services performed relate to the construction of mining projects and include completion of analysis and studies, work plan design, and functions related to planning, monitoring and administrating the infrastructure projects required by Yanacocha in its operations.
In November 2000, Conenhua signed an agreement with Yanacocha for the construction and operation of a 220 kW transmission line between Trujillo and Cajamarca, a 60 kW transmission line between Cajamarca and La Pajuela, and the Cajamarca Norte substation; this agreement also encompassed activities necessary to enlarge the Trujillo substation. Pursuant to this contract, the construction work was completed in October 2001.Concurrently,2001. Concurrently, we and Yanacocha signed a 10-year agreement covering electric energy transmission and infrastructure operation beginning in November 2001. In exchange for us operating and managing the transmission project, Yanacocha pays an annuala fee of US$3.7 million.US3.7 million with annual maturities. The annual revenues for these services amounted to approximately US$4.30.9 million in each of 20112013, 2014 and 2010, respectively.2015.
C. Interests of Experts and Counsel
Not applicable.
| ITEM 8. | Financial Information |
A. Consolidated Statements and Other Financial Information
Consolidated Financial Statements
See “Item 19. Exhibits” for a list of financial statements filed under Item 18.
Other Financial Information
Export Sales
See “Item 4. Information on the Company—Buenaventura—B. Business Overview—Sales of Metal Concentrates—Sales and Markets” for information on export sales.
Legal Proceedings
Other than the legal proceedings relating to Yanacocha described in “Item 4. Information on the Company—Yanacocha—B. Business Overview—Legal Proceedings,” we and Yanacocha are each parties to certain other legal proceedings arising in the normal course of business, none of which, individually or in the aggregate, is material.
Dividends and Dividend Policy
We can distribute three kinds of dividends: (i) cash dividends, which are paid out of our net distributable income for each year, (ii) stock dividends that are akin to stock splits rather than distributions of earnings, which are issued for the purpose of adjusting the book value per share of our stock, and (iii) stock dividends for the purpose of capitalizing profits, in each case as described in more detail below. All shares outstanding and fully paid are entitled to share equally in any dividend declared based on the portion of our capital represented by such share. Shares of capital stock which are only partially paid participate in a dividend or distribution in the same proportion that such shares have been paid at the time of the dividend or distribution. No cash dividend may be declared in respect of a given year unless we have earned net distributable income in respect of such year. However, we may declare dividends during the year. We may make interim provisional payments to shareholders in respect of net distributable income for the current fiscal year, which are referred to as “provisional dividends,” as explained below.
The Board of Directors, following the end of each fiscal year, makes a recommendation at the annual obligatory shareholders’ meeting regarding the amount and timing of payments, if any, to be made as dividends on our Common Shares and Investment Shares.
The dividend policy establishes that dividendsBuenaventura will distribute an annual cash dividend of at least 20% of net income generated by majority-owned operations and subsidiaries. In the case of Buenaventura’s Associates (Coimolache, Cerro Verde and Yanacocha), 20% of attributable to Buenaventura’s net income will be not less than 20 percent of our net profits.included if they distribute cash dividends to Buenaventura. In principle there are two kinds of dividend payments: interim dividends, which are approved by the Board and are generally paid during the fourth quarter of the year, and the final dividend payment, which will be paid in accordance with the general shareholders’ meeting resolutions. However, the amount and timing of such payments is subject to the final approval at such annual obligatory shareholders’ meeting and Board meeting, as well as to the availability of earnings to distribute. According to the Peruvian Companies Law, holders of at least 20 percent20% of the total Common Shares outstanding can request a dividend of 50 percent50% or less of the previous year’s after-tax profits, net of amounts allocated to the legal reserve.
Available earnings are subject to the following priorities. First, the mandatory employee profit sharing of 8 percent8% of pre-tax profits (which may differ from pre-tax profits determined under IFRS due to different depreciation treatment and different adjustments of non-taxable income and/or non-deductible expenses) is paid. Next, remaining earnings are taxed at the standard corporate income tax rate, which has been 30 percent since January 1, 2004. Such rate has been reduced to 28% for 2015 and 2016, to 27% for 2017 and 2018 and to 26% for 2019 and thereafter. Not less than 10 percent of such after-tax net profits must then be allocated to a legal reserve, which is not available thereafter except to cover future losses or for use in future capitalizations. Amounts reserved are nevertheless included in taxable income. The obligation to fund this reserve continues until the reserve constitutes 20 percent20% of the paid-in share capital. In addition, the holders of Common Shares can agree to allocate any portion of the net profits to any special reserve. The remainder of the net profits is available for distribution to shareholders. Any dividend approved by a shareholders’ meeting after December 31, 2002 ishas been subject until 2014 to an additional withholding tax at the rate of 4.1 percent4.1% of the total amount of dividends distributed to shareholders who are either (i) individuals, whether domiciled or non-domiciled in Peru, or (ii) non-domiciled companies or entities. For dividends paid out from our accumulated net profits after December 31, 2014, such withholding rate has been increased to 6.8% for 2015 and 2016, to 8.0% for 2017 and 2018 and to 9.3% for 2019 and thereafter. Dividends paid to domiciled companies or entities are not subject to such withholding tax. If any tax or other governmental charge will become payable by Scotiabank Peru, as custodian, the Depositary or us with respect to any ADR or any deposited securities represented by the ADSs evidenced by such ADR, such tax or other governmental charge will be payable by the owner or beneficial owner of such ADR to the Depositary.
Dividends on issued and outstanding Common Shares and Investment Shares are distributed in accordance with the proportion of the total capital represented by such respective shares. Dividends are distributed pro rata in accordance with the number of Common Shares or Investment Shares. Accordingly, any dividend declared would be apportioned 99.73 percent99.73% to the holders of Common Shares and 0.27 percent0.27% to the holders of Investment Shares. This proportion will not change in the future except and to the extent holders of Common Shares and Investment Shares exercise their preemptive rights disproportionately in any future issuance of Common Shares and Investment Shares, or we issue Common Shares without preemptive rights in accordance with Article 259 of the Peruvian Companies Law.
Holders of Common Shares and Investment Shares are not entitled to interest on dividend payments.
Holders of ADRs are entitled to receive dividends with respect to the Common Shares underlying the ADSs evidenced by such ADRs, subject to the terms of the related Amended and Restated Deposit Agreement, to the same extent as owners of Common Shares.
To the extent that we declare and pay dividends on the Common Shares, owners of the ADSs on the relevant record date are entitled to receive the dividends payable in respect of the Common Shares underlying the ADSs, subject to the terms of the Amended and Restated Deposit Agreement. Cash dividends are paid to the Depositary in Nuevos Soles and, except as otherwise described under the Amended and Restated Deposit Agreement, are converted by the Depositary into U.S. Dollars and paid to owners of ADRs net of currency conversion expenses. Under the Amended and Restated Deposit Agreement, the Depositary may, and will if we so request, distribute stock dividends in the form of additional ADRs evidencing whole ADSs resulting from a dividend or free distribution of Common Shares by us received by the Depositary. Cash dividends paid with respect to the Common Shares and amounts distributed with respect to ADSs are currentlyhave been subject until 2014 to a Peruvian withholding income tax of 4.1 percent. Such withholding rate has been increased for dividends paid out from our accumulated net profits after December 31, 2014 to 6.8% for 2015 and 2016, to 8.0% for 2017 and 2018 and to 9.3% for 2019 and thereafter. See “Item 10. Additional Information—Information – E. Taxation—Taxation – Peruvian Tax Considerations.”
We issue stock dividends for value per share of our stock. The book value of our share capital is based on the nominal (par) value of each share but is adjusted to account for inflation; thus, in inflationary periods, our book value will increase while the nominal value will remain constant. In order toTo adjust the book value of each share to equal or approximate the nominal value, we periodically issue new shares that are distributed as stock dividends to each existing shareholder in proportion to such shareholder’s existing holdings, unless it increases the nominal value of the existing shares. These stock dividends (which under the Peruvian income tax law are not considered dividends) do not change a stockholder’s percentage of interest in us. In addition, we may from time to time capitalize profits and, in such case, we have to distribute stock dividends representing the profits capitalized.
Dividends not collected within ten years will be retained by us, increasing our legal reserve, and the right to collect such dividends will expire.
Under Peruvian law, each company may make formal cash distributions only out of net distributable income (calculated on an individual, unconsolidated basis and demonstrated by a statement of financial position at any given time). We, however, may pay provisional dividends. Payment of provisional dividends will be approved on the basis of financial statements which show the existence of net distributable income obtained during the current fiscal year. In the event that,If, following such an interim provisional payment, we suffer a loss or if we finish the fiscal year with a net income that is lower than the amount of provisional dividends paid during such fiscal year, we could legally require all shareholders (including holders of ADRs) to return such payment to us with interest. However, it has been and continues to be our policy not to require shareholders to return such payment of provisional dividends, but rather to cover such contingency through a “dividends paid in advance” account to be offset by future net distributable income.
The following table sets forth the amounts of interim and final cash dividends and the aggregate of cash dividends paid with respect to the years 20082012 to 2012.2015. Dividends with respect to the years 20082012 to 20122015 were paid per Common Share and ADS.
Year ended
December 31,(1) | | Per
Common Share | | | Per
ADSs | | | Per
Investment Share | |
| | | Interim | | | Final | | | Total | | | Interim | | | Final | | | Total | | | Interim | | | Final | | | Total | |
| 2008 | | | 0.09 | | | | 0.02 | | | | 0.11 | | | | 0.09 | | | | 0.02 | | | | 0.11 | | | | 0.09 | | | | 0.02 | | | | 0.11 | |
| 2009 | | | 0.02 | | | | 0.14 | | | | 0.16 | | | | 0.02 | | | | 0.14 | | | | 0.16 | | | | 0.02 | | | | 0.14 | | | | 0.16 | |
| 2010 | | | 0.30 | | | | 0.16 | | | | 0.46 | | | | 0.30 | | | | 0.16 | | | | 0.46 | | | | 0.30 | | | | 0.16 | | | | 0.46 | |
| 2011 | | | 0.33 | | | | 0.23 | | | | 0.56 | | | | 0.33 | | | | 0.23 | | | | 0.56 | | | | 0.33 | | | | 0.23 | | | | 0.56 | |
| 2012 | | | 0.40 | | | | 0.20 | | | | 0.60 | | | | 0.40 | | | | 0.20 | | | | 0.60 | | | | 0.40 | | | | 0.20 | | | | 0.60 | |
| Year ended December 31,(1) | | Per
Common Share | | | Per
ADSs | | | Per
Investment Share | |
| | | Interim | | | Final | | | Total | | | Interim | | | Final | | | Total | | | Interim | | | Final | | | Total | |
| 2012 | | | 0.200 | | | | 0.300 | | | | 0.500 | | | | 0.200 | | | | 0.300 | | | | 0.500 | | | | 0.200 | | | | 0.300 | | | | 0.500 | |
| 2013 | | | 0.010 | | | | 0.011 | | | | 0.021 | | | | 0.010 | | | | 0.011 | | | | 0.021 | | | | 0.010 | | | | 0.011 | | | | 0.021 | |
| 2014 | | | 0.023 | | | | 0.000 | | | | 0.023 | | | | 0.023 | | | | 0.000 | | | | 0.023 | | | | 0.023 | | | | 0.000 | | | | 0.023 | |
| 2015 | | | 0.000 | | | | 0.000 | | | | 0.000 | | | | 0.000 | | | | 0.000 | | | | 0.000 | | | | 0.000 | | | | 0.000 | | | | 0.000 | |
| (1) | Interim and final dividend amounts are expressed in U.S. Dollars. |
Non-controlling Shareholders
Law No. 28370, published on October 30, 2004, included in the Peruvian Companies Law certain provisions for the protection of non-controlling shareholders that were formerly contained in Law No. 26985, which had been abrogated. Legislative Decree No. 1061, effective since June 29, 2008, hasLaw No. 29782, effective since July 29, 2011, and most recently Law No. 30050, effective since June 27, 2013, have abrogated or amended certain of these provisions. Pursuant to Article 262-A of the Peruvian Companies Law, we will issue a notice withinfurnish on our website and on the SMV’s website, upon the earlier to occur of (1) sixty days after the Annual Obligatory Shareholders’ Meeting, or after(2) the expiration of the three-month period after the end of the prior fiscal year in which such Annual Obligatory Shareholders’ Meeting is required to be held, containingthe information regarding total number and value of any shares not claimed by shareholders, the name of such shareholders, the share quote in the securities market for such shares;shares, the total amount of uncollected dividends;dividends and where shares and dividends pending claim are available for the non-controlling shareholders. The publication must be made in the official gazette “El Peruano,” on our website and on the SMV’s website. Article 262-B describes the procedure to request share certificates and/or dividends.dividends and that the holder of the shares can instruct us to deposit the dividends in a specific bank account. Article 262-F describes the procedure for handling any claim that the non-controlling shareholders may file, such claims to be resolved by the SMV.
B. Significant Changes
No significant change in our financial affairs has occurred since the date of the annual financial statements included in this Annual Report.
| ITEM 9. | The Offer and Listing |
A. Offer and Listing Details
Trading Information
The table below sets forth the trading volume and the high and low closing prices of the Common Shares and Investment Shares in Nuevos Soles. The table also includes the trading volume and the high and low closing prices of the ADSs representing the Common Shares in U.S. Dollars for the same periods.
| | | Common Shares(1) | | | ADSs(2) | | | Investment Shares(1) | |
| | | Trading
Volume | | | High | | | Low | | | Trading
Volume | | | High | | | Low | | | Trading
Volume | | | High | | | Low | |
| | | (in
millions) | | | (in nominal
S/. per share) | | | (in
millions) | | | (in US$ per
ADS) | | | (in
millions) | | | (in nominal
S/. per share) | |
| Annual highs and lows | | | | | | | | | | | | | | | | | | | | | | | | | | | | | | | | | | | | |
| | | | | | | | | | | | | | | | | | | | | | | | | | | | | | | | | | | | | |
| 2008 | | | 1.63 | | | | 118.75 | | | | 33.00 | | | | 274.92 | | | | 42.89 | | | | 9.00 | | | | 0.02 | | | | 90.00 | | | | 40.00 | |
| 2009 | | | 2.53 | | | | 122.00 | | | | 45.05 | | | | 345.53 | | | | 42.69 | | | | 14.00 | | | | 0.61 | | | | 90.00 | | | | 40.00 | |
| 2010 | | | 1.44 | | | | 155.50 | | | | 83.00 | | | | 271.37 | | | | 57.20 | | | | 28.59 | | | | 0.04 | | | | 110.00 | | | | 78.00 | |
| 2011 | | | 2.50 | | | | 136.00 | | | | 98.72 | | | | 323.07 | | | | 49.53 | | | | 35.33 | | | | 0.02 | | | | 110.00 | | | | 98.00 | |
| 2012 | | | 2.15 | | | | 117.00 | | | | 82.55 | | | | 236.28 | | | | 43.90 | | | | 30.86 | | | | 0.22 | | | | 109.30 | | | | 75.00 | |
| | | | | | | | | | | | | | | | | | | | | | | | | | | | | | | | | | | | | |
| Quarterly highs and lows | | | | | | | | | | | | | | | | | | | | | | | | | | | | | | | | | | | | |
| | | | | | | | | | | | | | | | | | | | | | | | | | | | | | | | | | | | | |
| 2011 | | | | | | | | | | | | | | | | | | | | | | | | | | | | | | | | | | | | |
| 1st quarter | | | 0.22 | | | | 136.00 | | | | 113.00 | | | | 75.72 | | | | 49.53 | | | | 39.30 | | | | 0.01 | | | | 110.00 | | | | 100.00 | |
| 2nd quarter | | | 0.87 | | | | 121.80 | | | | 99.10 | | | | 101.09 | | | | 44.78 | | | | 35.33 | | | | 0.01 | | | | 100.00 | | | | 100.00 | |
| 3rd quarter | | | 0.71 | | | | 134.10 | | | | 100.40 | | | | 82.42 | | | | 49.45 | | | | 36.12 | | | | 0.01 | | | | 105.00 | | | | 98.00 | |
| 4th quarter | | | 0.70 | | | | 123.00 | | | | 98.72 | | | | 63.84 | | | | 45.80 | | | | 35.58 | | | | 0.00 | | | | 104.60 | | | | 101.40 | |
| | | | | | | | | | | | | | | | | | | | | | | | | | | | | | | | | | | | | |
| 2012 | | | | | | | | | | | | | | | | | | | | | | | | | | | | | | | | | | | | |
| 1st quarter | | | 0.52 | | | | 117.00 | | | | 99.50 | | | | 54.58 | | | | 43.90 | | | | 37.71 | | | | 0.01 | | | | 109.30 | | | | 99.50 | |
| 2nd quarter | | | 0.52 | | | | 113.00 | | | | 93.50 | | | | 67.42 | | | | 43.04 | | | | 35.03 | | | | 0.22 | | | | 110.00 | | | | 89.42 | |
| 3rd quarter | | | 0.22 | | | | 95.00 | | | | 86.00 | | | | 59.88 | | | | 40.09 | | | | 31.05 | | | | 0.00 | | | | 77.00 | | | | 77.00 | |
| 4th quarter | | | 0.90 | | | | 100 | | | | 82.55 | | | | 54.42 | | | | 39.28 | | | | 30.86 | | | | 0.01 | | | | 77.00 | | | | 75.00 | |
| | | | | | | | | | | | | | | | | | | | | | | | | | | | | | | | | | | | | |
| Monthly highs and lows | | | | | | | | | | | | | | | | | | | | | | | | | | | | | | | | | | | | |
| | | | | | | | | | | | | | | | | | | | | | | | | | | | | | | | | | | | | |
| 2012 | | | | | | | | | | | | | | | | | | | | | | | | | | | | | | | | | | | | |
| October | | | 0.02 | | | | 100.00 | | | | 90.90 | | | | 13.97 | | | | 39.28 | | | | 34.56 | | | | 0.00 | | | | 77.00 | | | | 77.00 | |
| November | | | 0.84 | | | | 93.55 | | | | 83.00 | | | | 19.06 | | | | 37.52 | | | | 32.00 | | | | 0.01 | | | | 77.00 | | | | 77.00 | |
| December | | | 0.05 | | | | 92.50 | | | | 82.55 | | | | 21.39 | | | | 36.27 | | | | 30.86 | | | | 0.01 | | | | 75.00 | | | | 75.00 | |
| 2013 | | | | | | | | | | | | | | | | | | | | | | | | | | | | | | | | | | | | |
| January | | | 0.34 | | | | 90.09 | | | | 75.25 | | | | 27.25 | | | | 36.58 | | | | 29.50 | | | | 0.00 | | | | 0.00 | | | | 0.00 | |
| February | | | 0.20 | | | | 76.30 | | | | 65.00 | | | | 27.72 | | | | 30.42 | | | | 25.42 | | | | 0.00 | | | | 0.00 | | | | 0.00 | |
| March | | | 0.07 | | | | 67.31 | | | | 63.80 | | | | 27.40 | | | | 26.59.59 | | | | 24.00 | | | | 0.00 | | | | 0.00 | | | | 0.00 | |
| | | Common Shares(1) | | | ADSs(2) | | | Investment Shares(1) | |
| | | Trading
Volume | | | High | | | Low | | | Trading
Volume | | | High | | | Low | | | Trading
Volume | | | High | | | Low | |
| | | (in millions) | | | (in nominal S/. per share) | | | (in millions) | | | (in US$ per ADS) | | | (in millions) | | | (in nominal S/. per share) | |
| Annual highs and lows | | | | | | | | | | | | | | | | | | | | | | | | | | | | | | | | | | | | |
| | | | | | | | | | | | | | | | | | | | | | | | | | | | | | | | | | | | | |
| 2012 | | | 2.14 | | | | 117.00 | | | | 82.55 | | | | 236.34 | | | | 43.90 | | | | 30.86 | | | | 0.22 | | | | 109.30 | | | | 75.00 | |
| 2013 | | | 2.06 | | | | 90.99 | | | | 29.70 | | | | 472.08 | | | | 36.58 | | | | 10.54 | | | | 0.00 | | | | 30.00 | | | | 30.00 | |
| 2014 | | | 0.44 | | | | 39.80 | | | | 28.11 | | | | 467.73 | | | | 14.82 | | | | 8.64 | | | | 0.001 | | | | 26.00 | | | | 26.00 | |
| 2015 | | | 1.31 | | | | 38.8 | | | | 14.35 | | | | 409.75 | | | | 12.37 | | | | 3.88 | | | | - | | | | - | | | | - | |
| | | | | | | | | | | | | | | | | | | | | | | | | | | | | | | | | | | | | |
| Quarterly highs and lows | | | | | | | | | | | | | | | | | | | | | | | | | | | | | | | | | | | | |
| | | | | | | | | | | | | | | | | | | | | | | | | | | | | | | | | | | | | |
| 2014 | | | | | | | | | | | | | | | | | | | | | | | | | | | | | | | | | | | | |
| 1st quarter | | | 0.22 | | | | 39.00 | | | | 31.45 | | | | 136.12 | | | | 14.12 | | | | 11.08 | | | | 0.001 | | | | 26.00 | | | | 26.00 | |
| 2nd quarter | | | 0.04 | | | | 38.00 | | | | 28.11 | | | | 111.12 | | | | 13.88 | | | | 9.75 | | | | - | | | | - | | | | - | |
| 3rd quarter | | | 0.15 | | | | 39.80 | | | | 29.40 | | | | 93.37 | | | | 14.82 | | | | 10.71 | | | | - | | | | - | | | | - | |
| 4th quarter | | | 0.02 | | | | 34.00 | | | | 29.40 | | | | 127.130 | | | | 12.28 | | | | 8.64 | | | | - | | | | - | | | | - | |
| | | | | | | | | | | | | | | | | | | | | | | | | | | | | | | | | | | | | |
| 2015 | | | | | | | | | | | | | | | | | | | | | | | | | | | | | | | | | | | | |
| 1st quarter | | | 0.25 | | | | 35.51 | | | | 31.00 | | | | 106.07 | | | | 11.74 | | | | 9.67 | | | | - | | | | - | | | | - | |
| 2nd quarter | | | 0.46 | | | | 38.80 | | | | 32.55 | | | | 83.37 | | | | 12.37 | | | | 10.38 | | | | - | | | | - | | | | - | |
| 3rd quarter | | | 0.41 | | | | 32.10 | | | | 18.50 | | | | 107.61 | | | | 10.15 | | | | 5.80 | | | | - | | | | - | | | | - | |
| 4th quarter | | | 0.20 | | | | 25.46 | | | | 14.00 | | | | 112.68 | | | | 8.22 | | | | 3.88 | | | | - | | | | - | | | | - | |
| | | | | | | | | | | | | | | | | | | | | | | | | | | | | | | | | | | | | |
| Monthly highs and lows | | | | | | | | | | | | | | | | | | | | | | | | | | | | | | | | | | | | |
| | | | | | | | | | | | | | | | | | | | | | | | | | | | | | | | | | | | | |
| 2015 | | | | | | | | | | | | | | | | | | | | | | | | | | | | | | | | | | | | |
| October | | | 0.071 | | | | 25.46 | | | | 19.43 | | | | 41.49 | | | | 8.22 | | | | 6.09 | | | | - | | | | - | | | | - | |
| November | | | 0.124 | | | | 21.26 | | | | 15.78 | | | | 39.01 | | | | 6.41 | | | | 4.50 | | | | - | | | | - | | | | - | |
| December | | | 0.003 | | | | 14.35 | | | | 14.00 | | | | 32.68 | | | | 5.01 | | | | 3.88 | | | | - | | | | - | | | | - | |
| 2016 | | | | | | | | | | | | | | | | | | | | | | | | | | | | | | | | | | | | |
| January | | | 0.003 | | | | 12.05 | | | | 12.05 | | | | 27.98 | | | | 4.44 | | | | 3.38 | | | | - | | | | - | | | | - | |
| February | | | 0.084 | | | | 19.17 | | | | 15.60 | | | | 45.36 | | | | 5.49 | | | | 4.14 | | | | - | | | | - | | | | - | |
| March | | | 0.024 | | | | 24.66 | | | | 17.22 | | | | 14.06 | | | | 7.38 | | | | 5.06 | | | | - | | | | - | | | | - | |
| (1) | Source: Lima Stock Exchange |
| (2) | Source: Bloomberg; Yahoo Finance |
As of March 31, 2013,2016, the share capital with respect to the Common Shares was S/.2,748,899,240 represented by 274,889,924 shares and the share capital with respect to the Investment Shares was S/.7,446,400 represented by 744,640 shares. The Common Shares represent 100 percent100% of our outstanding share capital. The Investment Shares have no voting rights and are not, under Peruvian law and accounting rules, characterized as share capital. As of March 31, 2013,2016, there were 1,2101,191 owners of record of the Common Shares and 918902 owners of record of the Investment Shares.
B. Plan of Distribution
Not applicable.
C. Markets
The Common Shares and ADSs representing the Common Shares (each ADS representing twoone Common Shares)Share) have been listed and traded on the New York Stock Exchange under the symbol “BVN.” In addition, the Common Shares and Investment Shares are listed and traded on the Lima Stock Exchange.
D. Selling Shareholders
Not applicable.
E. Dilution
Not applicable.
F. Expenses of the Issue
Not applicable.
| ITEM 10. | Additional Information |
A. Share Capital
Not applicable.
B. Memorandum and Articles of Association
Organization and Register
We were formed on September 7, 1953 by public deed as a Peruviansociedad anónima.However, in May of 1998, our By-laws were changed to conform with the new Peruvian Companies Law. The term of existence is indefinite and our principal place of business is Lima, Peru. We are registered under file number 02136988 at the Companies Registry of Lima.
We are managed by the General Meeting, the Board of Directors and the management.
Objectives and Purposes
Our legal purpose, as set forth in our Articles of Association and By-laws, is to engage in mining operations and related activities either directly or through majority-owned subsidiaries and controlled companies. Likewise, we may hold shares of companies performing mining operations.
Directors
The Board of Directors, which must be comprised of seven members, is elected at the Annual Obligatory Meeting. Any changes in the Board of Directors require the approval of the shareholders. The removal of the Board of Directors must be approved at a shareholders’ meeting, attended by holders of 75 percent75% of the Common Shares in the first summons and 70 percent70% of the Common Shares in the second summons, by resolution approved by at least two thirds of the total number of Common Shares outstanding. In the case of resignation of Directors, the Board of Directors may appoint substitute Directors who will serve until the next shareholders’ meeting.
Directors are elected as a group for a term of three years and may be reelected indefinitely. Pursuant to Article 29 of our By-laws, Directors are not required to be shareholders. The Board of Directors, in its first meeting after the Annual Obligatory Meeting during which elections are held, must choose from among its members a Chairman and a Vice Chairman. The Peruvian Companies Law requires that all companies (sociedades anónimas) provide for the representation of non-controlling shareholders on their Boards of Directors. To that effect, each of our Common Shares gives the holder the right to as many votes as there are directors to be elected. Each holder may pool his votes in favor of one person or distribute them among various persons. Those candidates for the Board who receive the most votes are elected directors.
The Board of Directors meets when called by the Chairman of the Board, who is appointed by the Board. The Board of Directors is validly convened when all Directors are present and unanimously agree to carry out the meeting for the purpose of transacting the business that has been proposed. Pursuant to Article 177 of the Peruvian Companies Law, Directors may be jointly and severally liable to us, the shareholders and third parties for their actions if they act with willful misconduct, gross negligence or abuse their powers. In addition, Article 3 of Law No. 29720, which has been in force since June 26, 2011, as amended by Law No. 30050 in force since June 27, 2013, provides that directors and managers are liable for economic damages or any other kind of damages caused to us by any transaction we may enter into with them.
Our By-laws do not contain any provisions related to a director’s power to vote on matters in which the director is materially interested. However, Article 180 of the Peruvian Companies Law requires a director with an interest that conflicts with an interest of ours on a specific matter to disclose such interest to us and abstain from participating in the deliberation and decision of the said matter. A director that contravenes such requirement is liable for the damages suffered by us and can be removed by the Board of Directors or a shareholders’ meeting upon the request of any shareholder or any member of the Board.
Our By-laws also do not contain any provisions with respect to the power of the Directors to vote upon matters relating to their own compensation. Nevertheless, Article 30 of the By-laws requires that the Board of Directors receive compensation of no more than 4 percent4% of the profits of each fiscal year after making deductions for workers’ profit sharing, taxes, reinvestment of profits for tax benefits and legal reserves. This amount will be submitted for ratification by the General Meeting during the annual obligatory meeting, at which time it approves the statement of financial position, taxes, reinvestment of profits for tax benefits and legal reserves.
Our By-laws contain no provision relating to the directors’ power to borrow from us. However, Article 179 of the Peruvian Companies Law provides that directors of a company may enter into an agreement with such company only in the event thatif the agreement relates to operations the company performs in the regular course of business and in an arms-length transaction. Further,Furthermore, a company may provide a loan to a director or grant securities in his favor only in connection with operations that the company usually performs with third parties. Agreements, credits, loans or guarantees that do not meet the requirements set forth above require prior approval from at least two thirds of the members of the company’s Board of Directors. Directors are jointly liable to the company and the company’s creditors for contracts, credit, loans or securities executed or granted without complying with Article 179 of the Peruvian Companies Law. In addition, as mentioned above, Article 3 of Law No. 29720 as amended provides that directors and managers are liable for economic or other damages we incurthat they may cause because of the approval of resolutions that favor such director’s, or a related party’s, interest instead of the company’s, when: (i) one of the parties involved in the transaction is a company whose shares are listed in the local stock exchange, as a resultin our case; (ii) the shareholder controlling such listed company also controls the other party involved in the transaction; and (iii) the transaction is not made under arm’s-length conditions and represents at least 10% of transactions we may enter into with them.such Company’s assets.
Neither our By-laws nor the Peruvian Companies Law contain age limit requirements for the retirement or non-retirement of directors.
Shares and Voting Rights
We have two classes of shares, the Common Shares and the Investment Shares. The Common Shares represent 100 percent100% of our outstanding share capital. The Investment Shares have no voting rights and are not, under Peruvian law and accounting rules, characterized as share capital. The Common Shares and the Investment Shares may be either physical share certificates in registered form or book-entry securities in the CAVALI ICLV S.A. book-entry settlement system, also in registered form.
Holders of Common Shares are entitled to one vote per share, with the exception of the election of the Board of Directors, where each such holder is entitled to one vote per share per nominee. Each holder’s votes may be cast all for a single nominee or distributed among the nominees at the holder’s discretion. Holders of Common Shares may attend and vote at shareholders’ meetings either in person or through a proxy. Additionally, holders of Common Shares have the right to participate in the distribution of dividends and shareholder equity resulting from liquidation. Our By-laws do not establish a maximum time limit for the payment of the dividends. However, according to Article 232 of the Peruvian Companies Law, the right to collect past-due dividends in the case of public companies that aresociedades anónimas abiertas, as we are, expires at 10 years from the date on which the payment was due in accordance with the dividend declaration.
Our share capital may be increased by holders of Common Shares at a shareholders’ meeting. Capital reductions may be voluntary or mandatory and must be approved by holders of Common Shares at a shareholders’ meeting. Capital reductions are mandatory when accumulated losses exceed 50 percent of capital to the extent such accumulated losses are not offset by accumulated earnings and capital increases within the following fiscal year. Capital increases and reductions must be communicated to the SMV, the Lima Stock Exchange and theSuperintendencia Nacional de Administración Tributaria (SUNAT) SUNAT and published in the official gazette El Peruano and in a widely circulated newspaper in the city in which we are located.
The Investment Shares do not represent our stock obligations. Holders of Investment Shares are neither entitled to exercise voting rights nor to participate in shareholders’ meetings. However, Investment Shares confer upon the holders thereof the right to participate in the dividends distributed according to their nominal value, in the same manner as Common Shares.
Changes in the Rights of Shareholders
Our By-laws do not contain special provisions relating to actions necessary to change the rights of holders of the classes of shares. However, Article 88 of the Peruvian Companies Law establishes that all shares of a same class must have the same rights and obligations, and that in the event thatif we decide to establish different rights and obligations we must create a different class of shares, which creation will be agreed upon by the General Meeting in accordance with the requirements for modification of the By-laws. The Common Shares are the only class of shares representing 100 percent100% of our share capital, and, therefore, each Common Share has the same rights and obligations of each other Common Share. These requirements are described under “—Shares and Voting Rights” above.
The rights of any class of shares may not be reduced except in accordance with the Peruvian Companies Law.
Shareholders’ Meetings
Pursuant to Peruvian law and our By-Laws,By-laws, the Annual Obligatory Meeting must be held during the three-month period after the end of each fiscal year. Additional General Meetings may be held during the year. Because we are asociedad anónima abierta, we are subject to the special control of the SMV, as provided in Article 253 of the Peruvian Companies Law. If we do not hold the Annual Obligatory Meeting during the three-month period after the end of each fiscal year or any other shareholders’ meeting required by the Peruvian Companies Law or our By-Laws, the SMV will directly, or at the request of at least one shareholder of the Common Shares, call for such a meeting, which will take place in a reasonable period of time. Other shareholders’Shareholders’ meetings are convened by the Board of Directors when deemed convenient for us or when it is requested by the holders of at least 5 percent5% of the Common Shares, provided that such Common Shares do not have their voting rights suspended. If, at the request of holders of at least 5 percent of the Common Shares, the shareholders’ meeting is not convened by the Board of Directors within 15 business days of the receipt of such request, such holders of at least 5 percent of the Common Shares may request a notary public or the Board expressly or implicitly refusesa judge to convene the shareholders’ meeting, the SMV will call for such meeting after giving notice to the Board of such request.meeting. The Board is deemed to have implicitly refused to convene the meeting if the Board (a) does not convene a shareholders’ meeting within 15 business days of receipt of the request, (b) suspends or amends the terms of the agenda or in any other way amend the dateterms of the meeting prescribed bysummons already made upon the request of at least 5% of the Common Shares or (c) schedules the shareholders’ meeting more than 40 days after the date on which the summons is published. IfThe notary public or the SMV calls for a shareholders’ meeting, the SMV will indicate the place, time and hourjudge of the meeting,domicile of the agenda andcompany shall call for the person who will preside. If it is a meeting other than the Annual Obligatory Meeting or a shareholders’ meeting required by the Peruvian Companies Law or our By-Laws, the agenda will contain those matters requested by the shareholders who requested the meeting. Resolución CONASEV No. 111-2003-EF-94.10, as amended by Resolución CONASEV No. 016-2004-EF/94.10, Resolución CONASEV No. 015-2005-EF/94.10 and Resolución CONASEV No. 078-2010-EF/94.01.1, approved provisions related to the right of the non-controlling shareholders to obtain information regarding asociedad anónima abiertasuch as us and to request the SMV to call a shareholders’ meeting if it is not called by thesociedad anónima abierta upon request.ourselves. Notwithstanding the notice requirements as described in the preceding two sentences, any shareholders’ meeting will be deemed called and legally installed,commenced, provided that the shareholders representing all of the voting shares are present, and provided that every present shareholder, whether or not such shareholder has paid the full price of such shareholder’s shares, agrees to hold the shareholders’ meeting and accepts the business to be discussed therein. Holders of Investment Shares have no right to request the Board to convene shareholders’ meetings.
Since we are asociedad anónima abierta, notice of shareholders’ meetings must be given by publication of a notice, with the publication occurring at least 25 days prior tobefore any shareholders’ meeting, in El Peruano and in a widely circulated newspaper in the city in which we are located. The notice requirement may be waived at the shareholders’ meeting by holders of 100 percent100% of the outstanding Common Shares. According to Article 25 of our By-LawsBy-laws and Article 257 of the Peruvian Companies Law, shareholders’ meetings called for the purpose of considering a capital increase or decrease, the issuance of obligations, a change in our By-Laws,By-laws, the sale in a single act of assets with an accounting value that exceeds 50 percent50% of our capital stock, a merger, division, reorganization, transformation or dissolution, are subject to a first, second and third quorum call, each of the second and third quorum to occur upon the failure of the preceding one. A quorum for the first call requires the presence of shareholders holding 50 percent50% of our total voting shares. For the second call, the presence of shareholders holding at least 25 percent25% of our total voting shares constitutes a quorum, and for the third call there is no quorum requirement. These decisions require the approval of the majority of the voting shares represented at the shareholders’ meeting. General Meetings convened to consider all other matters are subject to a first and second quorum call, the second quorum call to occur upon the failure of the first quorum.
In the case of shareholders’ meetings called for the purpose of considering the removal of members of the Board of Directors, at least 75 percent75% and 70 percent70% of the total number of Common Shares outstanding are required to be represented at the shareholders’ meeting on the first quorum call and second quorum call respectively.call. Provided such quorum is attained, the affirmative vote of no less than two thirds of the total number of Common Shares outstanding is required to effect the removal of members of the Board of Directors. The special quorum and voting requirements described above cannot be modified at a shareholders’ meeting called for the purpose of considering the removal of members of the Board of Directors.
Under our By-Laws,By-laws, the following actions are to be taken at the annual obligatory shareholders’ meetings: approval of our statements of financial position, profit and loss statements and annual reports; the approval of management performance; the allocation of profits; the election of external auditors; the election of the members of the Board of Directors; and any other matters submitted by the Board of Directors. The following actions are to be taken at the same annual shareholders’ meetings if the quorum and majority requirements are met or at any other shareholders’ meeting: any amendment of our By-Laws;By-laws; any decision to increase or reduce capital; any decision to issue debt; initiating investigations or requesting auditor’s reports; liquidating, spinning-off, merging, consolidating, dissolving, or changing our business form or structure.
In accordance with Article 21 of the By-laws, only those holders of Common Shares whose names are inscribed in the Share Register not less than 10 days in advance of a meeting will be entitled to attend shareholders’ meetings and to exercise their rights.
Limitations on the Rights of Nonresident or Foreign Shareholders
There are no limitations in our By-laws or the Peruvian Companies Law on the rights of nonresident or foreign shareholders to own securities or exercise voting rights on our securities.
Change in Control
There are no provisions in our By-laws that would have the effect of delaying, deferring or preventing a change in control.
Disclosure of Share Holdings
There are no provisions in our By-laws governing the ownership threshold above which share ownership must be disclosed. However, according to Regulation No. 009-2006-EF.94.10 of the SMV, which became effective on May 3, 2006, as amended by Regulation No. 020-2006-EF.94.10 and Regulation No. 05-2009-EF-94.01.1 of the SMV, when an individual or financial group acquires, in one act or various successive acts, a significant percentage (more than 25 percent)25%) of the voting shares of a company, as well as upon any person or group increasing its ownership above the 50 percent and 60 percent60% thresholds, a procedure known asOferta Pública de Adquisición, or Takeovera “Takeover Bid,” must be followed. This has the effect of alerting other shareholders and the market that an individual or financial group has acquired a significant percentage of a company’s voting shares, and gives other shareholders the opportunity to sell their shares at the price offered by the purchaser. The purchaser is obliged to launch a Takeover Bid unless it is exempt pursuant to Regulation No. 009-2006-EF.94.10 of the SMV as amended. The purchase of ADRs is exempted from the Takeover Bid unless the holders: (i) exercises the voting rights of the Common Shares underlying the ADSs evidenced by such ADRs, or (ii) requests the delivery of such underlying Common Shares. In addition, the SMV and the Lima Stock Exchange must be notified of any transfer of more than 5 percent of our paid-in capital.
Changes in Capital
Our By-laws do not establish special conditions for increases or reductions of capital that are more stringent than is required by the Peruvian Companies Law. Furthermore, the Peruvian Companies Law forbidssociedades anónimas abiertas, such as us, from including in their by-lawsBy-laws stipulations limiting the transfer of their shares or restraining their trading in other ways. We cannot recognize a shareholders’ agreement that contemplates limitations, restrictions or preferential rights on the transfer of shares, even if such agreement is recorded in our Share Register (matrícula de acciones) or in CAVALI.CAVALI ICLV S.A.
C. Material Contracts
On December 2, 2009, Banco de Crédito del Peru, as lessor, executed a financial lease agreement with Conenhua, Huanza, as lessee, and us, as guarantor, in the amount of US$119 million for construction of a hydroelectric power station. The term of the lease is ten years and the interest rate is (i) LIBOR plus 4 percent from the first disbursement until six months after the start of commercial operation of the power station and (ii) LIBOR plus 4.1 percent from six months after the start of commercial operation of the power station until maturity. An English summary of the financial lease agreement is filed as Exhibit 4.2 of our Annual Report on Form 20-F for the year ended December 31, 2010.Not Applicable.
D. Exchange Controls
Since August 1990, there have been no exchange controls in Peru and all foreign exchange transactions are based on free market exchange rates. Prior toBefore August 1990, the Peruvian foreign exchange market consisted of several alternative exchange rates. Additionally, during the 1990s, the Peruvian currency has experienced a significant number of large devaluations, and Peru has consequently adopted, and operated under, various exchange rate control practices and exchange rate determination policies, ranging from strict control over exchange rates to market determination of rates. Current Peruvian regulations on foreign investment allow the foreign holders of equity shares of Peruvian companies to receive and repatriate 100 percent100% of the cash dividends distributed by such companies. Such investors are allowed to purchase foreign exchange at free market currency rates through any member of the Peruvian banking system and transfer such foreign currency outside Peru without restriction.
E. Taxation
The following summarizes the material Peruvian and United States tax consequences under present law of the purchase, ownership and disposition of ADSs or Common Shares. The discussion is not a full description of all tax considerations that may be relevant to a decision to purchase ADSs or Common Shares. In particular, this discussion deals only with holders that hold ADSs or Common Shares as capital assets and that have the U.S. Dollar as their functional currency. The summary does not address the tax treatment of certain investors that may be subject to special tax rules, such as banks, securities dealers, insurance companies, tax-exempt entities, persons that will hold ADSs or Common Shares as a position in a “straddle” or “conversion transaction” for tax purposes and holders of 10 percent10% or more of our voting shares. This discussion does not address any U.S. state or local taxes, the U.S. federal alternative minimum tax or the U.S. Medicare tax on net investment income. There is no tax treaty currently in effect between Peru and the United States, except for a treaty to exchange tax information. The information to be exchanged is defined in such treaty as any data or declaration that may be relevant or essential to the administration and application of taxes. Accordingly, the discussions below of Peruvian and U.S. tax considerations are based on the domestic law of each of Peru and the United States which are subject to change and possibly with retroactive effect.
As used herein, “Peruvian holder” means an owner of ADSs or Common Shares that is (i) an individual domiciled in Peru, (ii) a business entity created under the laws of Peru, or (iii) a Peruvian branch, agency or permanent establishment of a non-Peruvian individual or entity. “U.S.“U.S. Holder” means a beneficial owner of ADSs or Common Shares that is (i) a United States citizen or resident, (ii) a domestic corporation or partnership, (iii) a trust subject to the control of a U.S. fiduciary and the primary supervision of a U.S. court or (iv) estate the income of which is subject to United States Federalfederal income taxation regardless of its source.
Peruvian Tax Considerations
Cash Dividends and Other Distributions
Cash dividends paid with respect to Common Shares and amounts distributed with respect to ADSs are currently subject to a Peruvian withholding Income Tax, at a rate of 4.1 percent4.1% over the dividend paid (as long as such dividend is paid out from our accumulated net profits as of December 31, 2015), when the dividend is paid to shareholders that are: (i) individuals, whether resident or nonresident in Peru or (ii) nonresident entities. Asentities.As a general rule, the distribution of additional Common Shares representing profits, distribution of shares which differ from the distribution of earnings or profits, as well as the distribution of preemptive rights with respect to Common Shares, which are carried out as part of a pro rata distribution to all shareholders, will not be subject to Peruvian Income Tax or withholding taxes. If the dividend distribution is paid out from our net profits after December 31, 2014, the Peruvian withholding Income Tax rate will increase to 6.8%, if the distribution is approved during 2015 and 2016, to 8% if it is approved during 2017 and 2018, and to 9.3% if it is approved in 2019 or later.
Law No. 30296, enacted on December 31, 2014, established certain amendments to the Peruvian Income Tax Law, (the “ITL”), effective from January 1, 2015. The most significant changes are the following: (i) a gradual increase of Peruvian withholding income tax over dividends paid from 4.1% to 6.8% in 2015 and 2016, to 8.0% in 2017 and 2018, and to 9.3% in 2019 and beyond. These tax rates will apply to profit distribution adopted or made available in cash or in kind, whichever occurs first, since January 1, 2015; and (ii) Peruvian withholding income tax of 4.1% will be applied to retained earnings or other items subject to generate taxable dividends, obtained up to December 31, 2014, and forming part of dividends distribution or any other profit distribution.
Capital Gains
Pursuant to Article 6 of the Peruvian Income Tax Law, or the ITL, individuals and entities resident in Peru are subject to Peruvian Income Tax on their worldwide income while non-resident individuals or entities are subject to Peruvian Income Tax on their Peruvian source income only.
Furthermore, the ITL states that income deriving from the disposal of securities issued by Peruvian entities is considered Peruvian source income subject to the Income Tax.
With respect to this matter, Article 2 of the ITL, as amended by Legislative Decree 945, defines: (i) capital gains as any revenue deriving from the disposal of capital goods; and (ii) capital goods as those whose purpose is not to be traded in the regular course of a business. Moreover, Article 2 of the ITL states that income deriving from the disposal of shares and similar securities is considered a capital gain.
Accordingly, capital gains deriving from the disposal of securities issued by legal entities incorporated in Peru are considered Peruvian source income subject to Peruvian Income Tax.
Currently, regardless of whether or not the transferor is domiciled in Peru, the ITL establishes that taxable income resulting from the disposal of securities is determined by the difference between the sale price of the securities and its tax basis. However, prior tobefore December 31, 2009, capital gains resulting from the disposal of ADSs or Common Shares issued by legal entities incorporated in Peru were exempt from Peruvian Income Tax if: (i) in the case of non-regular individuals (i.e., individuals who do not frequently trade securities), the transaction was carried out prior tobefore December 31, 2009; and (ii) in the case of shareholders other than individuals, the transaction was carried out on the Lima Stock Exchange (floor session) prior tobefore December 31, 2009.
Effective January 1, 2010, the exemption was repealed and, as such, capital gains resulting from the disposal of ADSs or Common Shares issued by legal entities incorporated in Peru became subject to Peruvian Income Tax, or the “Income Tax.” For non-resident entities or individuals, capital gains will be subject to an Income Tax rate of either 5 percent5% or 30 percent,30%, depending where the transaction takes place. If the transaction is consummated within Peru, the Income Tax rate is 5 percent;5%; if the transaction is consummated outside of Peru, capital gains are taxed at a rate of 30 percent.
The ITL Regulations have defined transactions consummated within Peru to mean that the securities at issue are transferred through the Lima Stock Exchange. In contrast, the transaction is considered to have been consummated abroad when (i) the securities at issue are not registered on the Lima Stock Exchange or (ii) registered securities are not transferred through the Lima Stock Exchange.
Prior to
Before December 31, 2012, for nonresident individuals, the first five Tax Units (approximately US$6,800) of capital gains deriving from the transfer of securities were exempted from the Income Tax. Effective January 1, 2013, this exemption was repealed. If the transferor is a resident entity, capital gains deriving from the disposal of securities will be treated as any other taxable income subject to the 30 percent Corporate30% corporate Income Tax rate.
Furthermore, prior tobefore December 31, 2012, if the transferor was a resident individual, the first five Tax Units (approximately US$6,800) of capital gains deriving from the transfer of securities were exempted from the Income Tax. Effective January 1, 2013, such exemption was repealed. Any capital gain earned by a resident individual is subject to the five percent5% annual Income Tax rate regardless of whether or not the transaction is carried out on the Lima Stock Exchange and regardless of how many transactions are carried out by such individual. In this case, the five percent Income Tax rate will be applicable over the annual net capital gain, which is calculated by deducting from the annual gross capital gain of the annual losses resulting from the disposal of shares during the same fiscal year.
Moreover, if the transferor, either a resident or nonresident individual or entity, acquired the ADSs or Common Shares that were exempt from the Income Tax before January 1, 2010, pursuant to a special provision of the ITL, the tax basis is the higher of: (i) the acquisition cost; (ii) the face or nominal value of the sharesshares; or (iii) the stock market value at closing on December 31, 2009.
If the transferor, whether resident or nonresident in Peru, acquires the ADSs or Common Shares on or after January 1, 2010, the tax basis is: (i) for shares purchased by the transferor, the acquisition price paid for the shares; (ii) for shares received by the transferor as a result of a capital stock increase because of a capitalization of net profits, the face or nominal value of such shares; (iii) for other shares received free of any payment, the stock market value of such shares if listed on the Lima Stock Exchange or, if not, the face or nominal value of such sharesshares; and (iv) for shares of the same type acquired at different opportunities and at different values, the tax basis will be the weighted average cost.
The aforementioned rules are also applicable to ADSs or Common Shares acquired before January 1, 2010 that were not exempt from the Income Tax as of December 31, 2009.
On December 31, 2010, Law No. 29645 was promulgated and took effect from January 1, 2011. This law states that in any transaction of Peruvian securities through the Lima Stock Exchange, CAVALI ICLV S.A. (the Peruvian clearing house) will act as withholding agent. As a result of this amendment, the nonresident will no longer have to self-assess and pay its Income Tax liability directly to the Peruvian Tax Administration.
Law No. 29645 has technically been in force since January 1, 2011. Implementing regulations were enacted in July 2011, and CAVALI begunICLV S.A. began acting as a withholding agent on November 1, 2011. As a result, with regard to securities transferred thoughthrough the Lima Stock Exchange by a nonresident transferor subsequent toafter November 1, 2011, such nonresident transferor is no longer obliged to self-assess and pay its Income Tax liability directly to Peruvian tax authorities within the first 12 working days following the month in which Peruvian source income was earned.
If the purchaser is resident in Peru and the sale is not performed through the Lima Stock Exchange, the purchaser will act as withholding agent, except in cases in which the transferor is a resident individual.
However, if the transferor is a resident entity, such transferor is solely responsible for its Peruvian Income Tax on capital gains resulting from the disposal of ADSs or Common Shares, regardless of whether such securities are listed on the Lima Stock Exchange or elsewhere.
Other Considerations
No Peruvian estate or gift taxes are imposed on the gratuitous transfer of ADSs or Common Shares. No stamp, transfer or similar tax applies to any transfer of Common Shares, except for commissions payable by seller and buyer to the Lima Stock Exchange (0.15 percent(0.15% of value sold), fees payable to the SMV (0.05 percent(0.05% of value sold), brokers’ fees (about 0.05 percent0.05% to 1 percent1% of value sold) and Value Added Tax (at the rate of 18 percent)18%) on commissions and fees. Any investor who sells its Common Shares on the Lima Stock Exchange will incur these fees and taxes upon purchase and sale of the Common Shares.
United States Federal Income Tax Considerations
Assuming the obligations contemplated by the Amended and Restated Deposit Agreement are being performed in accordance with its terms, holders of ADSs (or ADRs evidencing ADSs) generally will be treated for United States federal income tax purposes as the owners of the Common Shares represented by those ADSs.
Cash Dividends and Other Distributions
Cash dividends paid with respect to Common Shares or Common Shares represented by ADSs generally are includible in the gross income of a U.S. Holder as ordinary income. Dividends generally are treated as foreign source income. Dividends paid to a U.S. Holder that is a corporation are not eligible for the dividends received deduction available to corporations. Under current law, a maximum 20 percent20% U.S. tax rate is imposed on the dividend income of an individual U.S. holderHolder with respect to dividends paid by a domestic corporation or “qualified foreign corporation” if certain holding period requirements are met. A qualified foreign corporation generally includes a foreign corporation if (i) its shares are readily tradable on an established securities market in the U.S. or (ii) it is eligible for benefits under a comprehensive U.S. income tax treaty. Clause (i) will apply with respect to ADSs if such ADSs are readily tradable on an established securities market in the U.S. The ADSs are traded on the New York Stock Exchange. As a result, we believe that we should be treated as a qualified foreign corporation and, therefore, dividends paid to an individual U.S. holderHolder with respect to ADSs for which the minimum holding period requirement is met should be taxed at a maximum rate of 20 percent.20%. Dividends paid in Nuevos Soles are includible in a United States dollar amount based on the exchange rate in effect on the date of receipt (which, in the case of ADSs, will be the date of receipt by the Depositary) whether or not the payment is converted into U.S. Dollars at that time. Any gain or loss recognized upon a subsequent sale or conversion of the Nuevos Soles for a different amount of U.S. Dollars will be United States source ordinary income or loss. Distributions to U.S. Holders of additional Common Shares or preemptive rights with respect to Common Shares that are made as part of a pro rata distribution to all of our shareholders generally will not be subject to United States federal income tax but in other circumstances may constitute a taxable dividend.
A U.S. Holder will be entitled to a foreign tax credit for Peruvian taxes imposed by withholding or otherwise, subject to generally applicable limitations and restrictions. In the case of U.S. individuals for whom the reduced rate of tax on dividends applies, such limitations and restrictions will appropriately take into account the rate differential under rules similar to section 904(b)(2)(B) of the Internal Revenue Code. The rules governing foreign tax credits are complex and U.S. Holders should consult their tax advisors regarding their application to the particular circumstances of such holder.
A non-U.S. Holder generally is not subject to United States Federalfederal income or withholding tax on dividends paid with respect to Common Shares or Common Shares represented by ADSs, unless such income is effectively connected with the conduct by the non-U.S. Holder of a trade or business within the United States.
Capital Gains
U.S. Holders will recognize capital gain or loss on the sale or other disposition of ADSs or Common Shares (or preemptive rights with respect to such shares) held by the U.S. Holder or by the Depositary. U.S. Holders will not recognize gain or loss on deposits or withdrawals of Common Shares in exchange for ADSs or on the exercise of preemptive rights. Any gain recognized by a U.S. Holder generally will be treated as United States source income. Consequently, in the case of a disposition of Common Shares or ADSs in a transaction subject to Peruvian tax, the U.S. Holder may not be able to claim the foreign tax credit for any Peruvian tax imposed on the gain unless it has sufficient foreign source income from other sources against which it can apply the credit. Generally, gain or loss will be a long-term capital gain or loss if the U.S. Holder’s holding period for such Common Shares or ADSs exceeds one year. Long-term capital gain for an individual U.S. Holder is generally subject to a reduced rate of tax.
A non-U.S. Holder of ADSs or Common Shares will not be subject to United States income or withholding tax on gain from the sale or other disposition of ADSs or Common Shares unless (i) such gain is effectively connected with the conduct of a trade or business within the United States or (ii) the non-U.S. Holder is an individual who is present in the United States for at least 183 days during the taxable year of the disposition and certain other conditions are met.
Passive Foreign Investment Company
We believe that we are not and will not become a passive foreign investment company for United States Federalfederal income tax purposes. A foreign corporation is a passive foreign investment company or PFIC,(“PFIC”) in any taxable year in which, after taking into account the income and assets of certain subsidiaries pursuant to the applicable look-through rules, either (i) at least 75 percent75% of its gross income is passive income or (ii) at least 50 percent50% of the average value of its assets is attributable to assets that produce passive income or are held for the production of passive income.
If we were a PFIC in any year during which a U.S. Holder owned ADSs or Common Shares, we would not be treated as a “qualified foreign corporation” for purposes of qualifying dividends paid to a U.S. Holder for the preferential 20 percent20% maximum U.S. tax rate noted above and the U.S. Holder would be subject to additional taxes on any excess distributions received from us and any gain realized from the sale or other disposition of ADSs or Common Shares (regardless of whether we continued to be a PFIC). A U.S. Holder has an excess distribution to the extent that distributions on ADSs or Common Shares during a taxable year exceed 125 percent of the average amount received during the three preceding taxable years (or, if shorter, the U.S. Holder’s holding period for the ADSs or Common Shares). To compute the tax on an excess distribution or any gain, (i) the excess distribution or the gain is allocated ratably over the U.S. Holder’s holding period for the ADSs or Common Shares, (ii) the amount allocated to the current taxable year is taxed as ordinary income and (iii) the amount allocated to other taxable years is taxed at the highest applicable marginal rate in effect for each year and an interest charge is imposed to recover the deemed benefit from the deferred payment of the tax attributable to each year.
If we were a PFIC, U.S. holdersHolders of interests in a holder of ADSs or Common Shares may be treated as indirect holders of their proportionate share of the ADSs or Common Shares and may be taxed on their proportionate share of any excess distribution or gain attributable to the ADSs or Common Shares. An indirect holder also must treat an appropriate portion of its gain on the sale or disposition of its interest in the actual holder as gain on the sale of the ADSs or Common Shares.
Information Reporting and Backup Withholding
Dividends in respect of the ADSs or Common Shares and the proceeds from the sale, exchange, or redemption of the ADSs or Common Shares may be reported to the United States Internal Revenue Service and a backup withholding tax may apply to such amounts unless the holder (i) is a domestic corporation (which may be required to establish its exemption by carrying its status on U.S. Internal Revenue Service Form W-9), (ii) in the case of a U.S. Holder other than a corporation, provides an accurate taxpayer identification number in the manner required by applicable law, (iii) in the case of a non-U.S. Holder, provides a properly executed U.S. Internal Revenue Service Form W-8BEN, or other successor Form, or (iv) otherwise establishes a basis for exemption. The amount of any backup withholding from a payment to a U.S. Holder generally will be allowed as a credit against the U.S. Holder’s United States Federalfederal income tax liability.
F. Dividends and Paying Agents
Not applicable.
G. Statement by Experts
Not applicable.
H. Documents on Display
We are subject to the informational requirements of Exchange Act. In accordance with these requirements, we file annual reports and other information to the SEC. These materials, including this Annual Report on Form 20-F and the exhibits hereto, may be inspected and copied at the SEC’s Public Reference Room at 100 F Street, N.E., Washington, D.C. 20549 and at the SEC’s regional offices at 175 W. Jackson Boulevard, Suite 900, Chicago, Illinois 60604, and 3 World Financial Center, Suite 400, New York, New York 10281-1022. Copies of the materials may be obtained from the Public Reference Room of the SEC at 100 F Street, N.E., Washington, D.C. 20549 at prescribed rates. The public may obtain information on the operation of the SEC’s Public Reference Room by calling the SEC in the United States at 1-800-SEC-0330. The SEC also maintains a web site athttp://www.sec.govthat contains reports, proxy statements and other information regarding registrants that file electronically with the SEC. Form 20-F reports and some of the other information submitted by us to the SEC may be accessed through this web site.
I. Subsidiary Information
Not applicable.
| ITEM 11. | Quantitative and Qualitative Disclosures About Market Risk |
The following discussion contains forward-looking statements that are subject to risks and uncertainties, many of which are outside of our control. Our primary market risks are related to fluctuations in the prices of gold, silver, zinc and lead. To a lesser extent, we are subject to market risk related to fluctuations in US$/Nuevo Sol exchange rates and to market risk related to interest rate fluctuation on our cash balances.
Commodity Contracts
Gold, silver, lead and copper hedging and sensitivity to market price
Our revenues and earnings are to a great extent influenced by world market prices for gold, copper, silver, zinc and lead that fluctuate widely and over which we have no control. We and our wholly-owned subsidiaries are completely unhedged as to the price at which our gold and silver will be sold. See “Item 3. Key Information—D. Risk Factors—Factors Relating to the Company—Our financial performance is highly dependent on the prices of gold, silver, copper and other metals.”
As of March 31, 2013,2016, we had no fixed price commitments for the sale of our metals. As of March 31, 2013,2016, we had no silver derivative contracts or gold convertible put option contracts in place.
Yanacocha and Cerro Verde have informed us that they have generally not engaged in, and are currently not engaged in, gold or copper price hedging activities, such as forward sales or option contracts, to minimize their exposure to fluctuations in the prices of gold or copper.
Normal Sales
We had no normal sales contracts with fixed or capped prices outstanding as of March 31, 2013.2016.
Foreign currency risk
We buy and sell our products and obtain capital facilities and investment in U.S. Dollars. The assets and liabilities in different currencies from the U.S. Dollar (Nuevos Soles)(Soles) are not significant. We estimate that the future exchange rate fluctuations of Peruvian currency versus the U.S. Dollar will not significantly affect the results of our future operations.
Interest Rate Sensitivity
We reduce our exposure to the risks due to variations in interest rates by engaging in financial obligations and capital leasing with fixed interest rates. See Note 2831 to the Financial Statements. Consequently, we do not use derivative instruments to manage this risk and we do not expect to incur significant losses based on interest risks.
| ITEM 12. | Description of Securities Other Than Equity Securities |
A. Debt Securities
Not applicable.
B. Warrants and Rights
Not applicable.
C. Other Securities
Not applicable.
D. American Depositary Shares
The Depositary collects its fees for delivery and surrender of ADSs directly from investors depositing shares or surrendering ADSs for the purpose of withdrawal or from intermediaries acting for them. The Depositary collects fees for making distributions to investors by deducting those fees from the amounts distributed or by selling a portion of distributable property to pay the fees. The Depositary may collect its annual fee for depositary services by deductions from cash distributions or by directly billing investors or by charging the book-entry system accounts of participants acting for them. The Depositary may generally refuse to provide fee-attracting services until its fees for those services are paid. The following table summarizes the fees and expenses payable by holders of ADSs:
| Persons depositing or withdrawing shares must pay: | | For: |
| | | | |
| US$5.00 (or less) per 100 ADSs (or portion of 100 ADSs) | | • | Issuance of ADSs, including issuances resulting from a distribution of shares or rights or other property |
| | | | |
| | | • | Cancellation of ADSs for the purpose of withdrawal, including if the deposit agreement terminates |
| | | |
| A fee equivalent to the fee that would be payable if securities distributed to you had been shares and the shares had been deposited for issuance of ADSs | | • | Distribution of securities distributed to holders of deposited securities which are distributed by the depositary to ADS registered holders |
| | | | |
| Registration or transfer fees | | • | Transfer and registration of shares on our share register to or from the name of the Depositary or its agent when you deposit or withdraw shares |
| | | | |
| Expenses of the Depositary | | • | Cable, telex and facsimile transmissions (when expressly provided in the deposit agreement) |
| | | | |
| | | • | Converting foreign currency to U.S. Dollars |
| | | |
| Taxes and other governmental charges the Depositary or the custodian have to pay on any ADS or share underlying an ADS, for example, stock transfer taxes, stamp duty or withholding taxes | | • | As necessary |
| | | |
| Any charges incurred by the Depositary or its agents for servicing the deposited securities | | • | As necessary |
Fees Incurred in Past Annual Period
From January 1, 20122015 to March 31, 2013,April 30, 2016, we received no fees from the Depositary related to our ADR facility, including continuing annual stock exchange listing fees, standard out-of-pocket maintenance costs for the ADRs (consisting of the expenses of postage and envelopes for mailing annual and interim financial reports, printing and distributing dividend checks, electronic filing of U.S. Federalfederal tax information, mailing required tax forms, stationery, postage, facsimile, and telephone calls), any applicable performance indicators relating to the ADR facility, underwriting fees and legal fees.
Fees to be Paid in the Future
The Depositary has agreed to reimburse us for expenses we incur that are related to establishment and maintenance expenses of the ADS program. The Depositary has agreed to reimburse us for our continuing annual stock exchange listing fees. The Depositary has also agreed to pay the standard out-of-pocket maintenance costs for the ADRs, which consist of the expenses of postage and envelopes for mailing annual and interim financial reports, printing and distributing dividend checks, electronic filing of U.S. Federalfederal tax information, mailing required tax forms, stationery, postage, facsimile, and telephone calls. It has also agreed to reimburse us annually for certain investor relationship programs or special investor relations promotional activities. In certain instances, the Depositary has agreed to provide additional payments to us based on any applicable performance indicators relating to the ADR facility. There are limits on the amount of expenses for which the Depositary will reimburse us, but the amount of reimbursement available to us is not necessarily tied to the amount of fees the Depositary collects from investors.
The Depositary collects its fees for delivery and surrender of ADSs directly from investors depositing shares or surrendering ADSs for the purpose of withdrawal or from intermediaries acting for them. The Depositary collects fees for making distributions to investors by deducting those fees from the amounts distributed or by selling a portion of distributable property to pay the fees. The Depositary may collect its annual fee for depositary services by deduction from cash distributions or by directly billing investors or by charging the book-entry system accounts of participants acting for them. The Depositary may generally refuse to provide fee-attracting services until its fees for those services are paid.
PART II
| ITEM 13. | Defaults, Dividend Arrearages and Delinquencies |
Not applicable.
| ITEM 14. | Material Modifications to the Rights of Security Holders and Use of Proceeds |
Not applicable.
| ITEM 15. | Controls and Procedures |
Evaluation of Disclosure Controls and Procedures
As of December 31, 2012,2015, we carried out an evaluation under the supervision and with the participation of our management, including our Chief Executive Officer and Chief Financial Officer, of the effectiveness of the design and operation of our disclosure controls and procedures. There are inherent limitations to the effectiveness of any system of disclosure controls and procedures, including the possibility of human error and the circumvention or overriding of the controls and procedures. Accordingly, even effective disclosure controls and procedures can only provide reasonable assurance of achieving their control objectives. Based upon and as of the date of our evaluation, our Chief Executive Officer and Chief Financial Officer concluded that the disclosure controls and procedures are effective to provide reasonable assurance that information required to be disclosed in the reports we file and submit under the Exchange Act is recorded, processed, summarized and reported as and when required.
Management’s Annual Report on Internal Control over Financial Reporting
Our management is responsible for establishing and maintaining adequate internal control over financial reporting. Internal control over financial reporting is a process designed to provide reasonable assurance regarding the reliability of financial reporting and the preparation of financial statements for external reporting purposes in accordance with generally accepted accounting principles. Because of its inherent limitations, internal control over financial reporting may not prevent or detect misstatements. Our management has assessed the effectiveness of our internal control over financial reporting as of December 31, 2012.2015. In making its assessment, management has utilized the criteria set forth by the Committee of Sponsoring Organizations (COSO)(the “COSO”) of the Treadway Commission inInternal Control—Integrated Framework.Framework(1992).Our management concluded that based on its assessment, our internal control over financial reporting was effective as of December 31, 2012.2015.
Our independent registered public accounting firm, Medina,Paredes, Zaldívar, ParedesBurga & Asociados S. Civil de R.L., has issued an attestation report on our internal control over financial reporting, which is included below.
Attestation Report of the Independent Registered Public Accounting Firm
To the Board of Directors and Shareholders ofCompañía de Minas Buenaventura S.A.A.
We have audited Compañía de Minas Buenaventura S.A.A.’s internal control over financial reporting as of December 31, 2012,2015, based on criteria established in Internal Control - Integrated Framework issued by the Committee of Sponsoring Organizations of the Treadway Commission (the- the COSO criteria).criteria. Compañía de Minas Buenaventura S.A.A.’s management is responsible for maintaining effective internal control over financial reporting, and for its assessment of the effectiveness of internal control over financial reporting included in the accompanying Management’s report.Annual report on Internal Control Over Financial Reporting. Our responsibility is to express an opinion on the company’s internal control over financial reporting based on our audit.
We conducted our audit in accordance with the standards of the Public Company Accounting Oversight Board (United States). Those standards require that we plan and perform the audit to obtain reasonable assurance about whether effective internal control over financial reporting was maintained in all material respects. Our audit included obtaining an understanding of internal control over financial reporting, assessing the risk that a material weakness exists, testing and evaluating the design and operating effectiveness of internal control based on the assessed risk, and performing such other procedures as we considered necessary in the circumstances. We believe that our audit provides a reasonable basis for our opinion.
A company’s internal control over financial reporting is a process designed to provide reasonable assurance regarding the reliability of financial reporting and the preparation of financial statements for external purposes in accordance with generally accepted accounting principles. A company’s internal control over financial reporting includes those policies and procedures that (1) pertain to the maintenance of records that, in reasonable detail, accurately and fairly reflect the transactions and dispositions of the assets of the company; (2) provide reasonable assurance that transactions are recorded as necessary to permit preparation of financial statements in accordance with generally accepted accounting principles, and that receipts and expenditures of the company are being made only in accordance with authorizations of management and directors of the company; and (3) provide reasonable assurance regarding prevention or timely detection of unauthorized acquisition, use, or disposition of the company’s assets that could have a material effect on the financial statements.
Because of its inherent limitations, internal control over financial reporting may not prevent or detect misstatements. Also, projections of any evaluation of effectiveness to future periods are subject to the risk that controls may become inadequate because of changes in conditions, or that the degree of compliance with the policies or procedures may deteriorate.
In our opinion, Compañía de Minas Buenaventura S.A.A. and subsidiaries maintained, in all material respects, effective internal control over financial reporting as of December 31, 2012,2015, based on the COSO criteria.
We also have audited, in accordance with the standards of the Public Company Accounting Oversight Board (United States), the consolidated statementstatements of financial position of Compañía de Minas Buenaventura S.A.A. and subsidiaries as of December 31, 20122015 and 2011,2014, and the related consolidated statements of profit or loss, other comprehensive income, shareholders’changes in equity, and cash flows for each of the three years in the period ended December 31, 20122015 of Compañía de Minas Buenaventura S.A.A. and subsidiaries and our report dated April 30, 2013,February 25, 2016, expressed an unqualified opinion thereon.
/S/ MEDINA, ZALDIVAR, PAREDES & ASOCIADOSLima, Perú
February 25, 2016
/s/ Paredes, Zaldívar, Burga & Asociados S. Civil de R.L.
Countersigned by:
/S/ MARCO ANTONIO ZALDÍVAR
| /s/ Victor Burga | |
| Victor Burga | |
| C.P.C.A. Register No. 14859 | |
Marco Antonio Zaldívar
C.C.P.A. Register No. 12477
Lima, Peru
April 30, 2013
Changes in Internal Control Over Financial Reporting
There has been no change in our internal control over financial reporting during 20122015 that has materially affected, or is reasonably likely to materially affect, our internal control over financial reporting.
| ITEM 16A. | Audit Committee Financial Expert |
The Board of Directors has determined that Mr. German Suárez is the Audit Committee financial expert as defined in Item 16A of Form 20-F. The Board of Directors has also determined that Mr. Suárezandrez and each of the other members of the Audit Committee are “independent directors” as defined in Section 303A.02 of the NYSE’sNew York Stock Exchange’s, (“NYSE”), Listed Company Manual.
We have adopted a written code of business conduct and ethics that applies to our principal executive officer, principal financial officer, principal accounting officer and controller, or persons performing similar functions, as well as all other employees. Our code of business conduct and ethics is posted on, and within five days following the date of any amendment or waiver we intend to disclose any amendments to or waivers from our code of business conduct and ethics on, our website, which is located athttp://www.buenaventura.com. The information on our website is not a part of, nor incorporated into, this document.
| ITEM 16C. | Principal Accountant Fees and Services |
The Audit Committee proposed at the General Meeting that Medina,Paredes, Zaldívar, ParedesBurga & Asociados S. Civil de R.L., a member firm of Ernst & Young Global, be elected as the independent auditor for 2012. Medina,2015. Paredes, Zaldívar, ParedesBurga & Asociados S. Civil de R.L. has served as our independent public accountant for each of the fiscal years in the two-year period ended December 31, 20112014 and 2012,2015, for which audited financial statements appear in this annual report on Form 20-F.
The following table presents the aggregate fees for professional services and other services rendered by Medina,Paredes, Zaldívar, ParedesBurga & Asociados S. Civil de R.L. for 20112014 and 2012.2015.
| | | Year ended December 31, | | | Year ended December 31, | |
| | | 2011 | | 2012 | | | 2014 | | | 2015 | |
| Audit Fees | | US$ | 1,124,451 | | | US$ | 1,002,413 | | | US$ | 1,684,569 | | | US$ | 1,314,910 | |
| Tax Fees | | US$ | 213,764 | | | US$ | 362,832 | | | US$ | 284,987 | | | US$ | 292,589 | |
| All other fees | | | US$ | 4,275 | | | US$ | 21,845 | |
| Total | | US$ | 1,338,215 | | | US$ | 1,365,245 | | | US$ | 1,973,831 | | | US$ | 1,629,344 | |
Audit Fees. Audit fees in the above table are the aggregate fees billed by Medina,Paredes, Zaldívar, ParedesBurga & Asociados S. Civil de R.L. in connection with the audit of our annual financial statements, the review of our quarterly financial statements and statutory and regulatory audits. In addition, the amounts in the above table includes fees that were incurred in connection with the audit of internal control over financial reporting in 20112014 and 2012.2015.
Tax Fees. Tax fees in the above table are fees billed by Medina,Paredes, Zaldívar, ParedesBurga & Asociados S. Civil de R.L. in connection with review of income tax filings, transfer pricing studies and tax consultations.
Audit Committee Pre-approval Policies and Procedures
Our Audit Committee is responsible for the oversight of the independent auditor. The Audit Committee has adopted a policy regarding pre-approval of audit services provided by our independent auditors, or the Policy.“Policy.” In accordance with the Policy, the Audit Committee must pre-approve the provision of services by our independent auditor for all audit and non-audit services prior tobefore commencement of the specified service. The requests for pre-approval are submitted to the Audit Committee by the Chief Financial Officer and following approval by audit committee members an engagement letter is executed. The Audit Committee approved all audit and tax fees in 2012.2014 and 2015.
| ITEM 16D. | Exemptions from the Listing Standards for Audit Committees |
Not applicable.
| ITEM 16E. | Purchases of Equity Securities by the Issuer and Affiliated Purchasers |
For the year ended December 31, 2012,2015, neither we nor any person acting on our behalf made any purchase of our Common Shares.
| ITEM 16F. | Change in Registrant’s Certifying Accountant |
None.
| ITEM 16G. | Corporate Governance |
There are significant differences in the corporate governance practices followed by us as compared to those followed by United States domestic companies under the New York Stock Exchange, or NYSE, listing standards. The NYSE listing standards provide that the board of directors of a United States domestic listed company must consist of a majority of independent directors and that certain committees must consist solely of independent directors. Under Peruvian corporate governance practices, a Peruvian company is not required to have a majority of the members of the board of directors be independent.
The listing standards for the NYSE also require that United States domestic companies have an audit committee, a nominating/corporate governance committee and a compensation committee. Each of these committees must consist solely of independent directors and must have a written charter that addresses certain matters specified in the listing standards. Peruvian corporate governance practices permit the Board of Directors of a Peruvian company to form special governance bodies in accordance with the needs of such company and do not require that these special governance bodies be composed partially or entirely of independent directors. We maintain three committees, which include the Audit Committee, the Compensation Committee and the Nominating/Corporate Governance Committee. Our Board of Directors has determined that our Audit Committee is composed entirely of independent directors, as defined in the NYSE’s Listed Company Manual.
The NYSE’s listing standards also require United States domestic companies to adopt and disclose corporate governance guidelines. In July 2002, the SMV and a committee comprised of regulatory agencies and associations prepared and published a list of suggested corporate governance guidelines called “Principles of Good Governance for Peruvian Companies.” These principles are disclosed on the SMV’s website athttp://www.smv.gob.pe. Our code of business conduct and ethics establishes our principles of good corporate governance and, as indicated in “Item 16B. Code of Ethics,” is posted on our website.
| ITEM 16H. | Mine Safety Disclosure |
Not applicable.
PART III
| ITEM 17. | Financial Statements |
Not applicable.
| ITEM 18. | Financial Statements |
Please refer to Item 19.
| | | | Page |
| | | |
| (a) | Index to Financial Statements and Schedules | |
| | | | |
COMPAÑIAÍA DE MINAS BUENAVENTURA S.A.A. AND SUBSIDIARIES | F-1 |
| | | |
| MINERA YANACOCHA S.R.L. | F-99 |
| | | |
| SOCIEDAD MINERA CERRO VERDE S.A.A. | F-152 |
| | | |
| | | |
| 1.1 | By-LawsBy-laws (Estatutos) of Compañía de Minas Buenaventura S.A.A., as amended April 30, 2002 (incorporated by reference from Compañía de Minas Buenaventura S.A.A. Annual Report on Form 20-F for the year ended December 31, 2002, filed on June 25, 2003). | |
| | | |
| 1.2 | By-LawsBy-laws (Estatutos) of Minera Yanacocha S.R.L., as amended October 18, 1999 (incorporated by reference from Compañía de Minas Buenaventura S.A.A. Annual Report on Form 20-F for the year ended December 31, 2002, filed on June 25, 2003). | |
| | | |
| 4.1 | Shareholders Agreement among SMM Cerro Verde Netherlands B.V., Sumitomo Metal Mining Co., Ltd., Sumitomo Corporation, Summit Global Management B.V., CompañCompañía de Minas Buenaventura S.A.A., Cyprus Climax Metals Company, Phelps Dodge Corporation and Sociedad Minera Cerro Verde S.A.A., dated June 1, 2005 (incorporated by reference from CompañCompañía de Minas Buenaventura S.A.A. Annual Report on Form 20-F for the year ended December 31, 2005, filed on June 6, 2006). | |
| | | |
| 4.2 | English Summary of the Financial Lease Agreement (Arrendamiento Financiero), dated as of December 2, 2009, by and among Banco de Crédito del Peru, as lessor, Compañía de Minas Buenaventura S.A.A., as guarantor, Empresa de Generación de Huanza, S.A., as lessee, and Consorcio Energético Huancavelica S.A. (incorporated by reference from Compañía de Minas Buenaventura S.A.A. Annual Report on Form 20-F for the year ended December 31, 2010, filed on June 28, 2011). | |
| | | |
| 11 | Code of Conduct and Ethics (incorporated by reference from Compañía de Minas Buenaventura S.A.A. Annual Report on Form 20-F for the year ended December 31, 2002,2013, filed on June 25, 2003)April 30, 2014). | |
| | | |
| 12.1 | Certification of Chief Executive Officer of Compañía de Minas Buenaventura S.A.A. pursuant to Section 302 of the Sarbanes-Oxley Act of 2002.† | |
| | | |
| 12.2 | Certification of Chief Financial Officer of Compañía de Minas Buenaventura S.A.A. pursuant to Section 302 of the Sarbanes-Oxley Act of 2002.† | |
| | | |
| 13.1 | Certification of Chief Executive Officer of Compañía de Minas Buenaventura S.A.A. pursuant to Section 906 of the Sarbanes-Oxley Act of 2002.† | |
| | | |
| 13.2 | Certification of Chief Financial Officer of Compañía de Minas Buenaventura S.A.A. pursuant to Section 906 of the Sarbanes-Oxley Act of 2002.† | |
† Filed herewith.
SIGNATURE
The registrant hereby certifies that it meets all of the requirements for filing on Form 20-F and that it has duly caused and authorized the undersigned to sign this annual report on its behalf.
| | COMPAÑÍA DE MINAS BUENAVENTURA S.A.A. |
| | | |
| | By: | /s/ /s/Carlos E. Gálvez Pinillos |
| | | Carlos E. Gálvez Pinillos |
| | | Chief Financial Officer |
Dated: April 30, 2013May 2, 2016
Exhibit Index
| Exhibit No. | | Document Description |
| | | |
| 1.1 | | By-LawsBy-laws (Estatutos) of Compañía de Minas Buenaventura S.A.A., as amended April 30, 2002 (incorporated by reference from Compañía de Minas Buenaventura S.A.A. Annual Report on Form 20-F for the year ended December 31, 2002, filed on June 25, 2003). |
| | | |
| 1.2 | | By-LawsBy-laws (Estatutos) of Minera Yanacocha S.R.L., as amended October 18, 1999 (incorporated by reference from Compañía de Minas Buenaventura S.A.A. Annual Report on Form 20-F for the year ended December 31, 2002, filed on June 25, 2003). |
| | | |
| 4.1 | | Shareholders Agreement among SMM Cerro Verde Netherlands B.V., Sumitomo Metal Mining Co., Ltd., Sumitomo Corporation, Summit Global Management B.V., Compañía de Minas Buenaventura S.A.A., Cyprus Climax Metals Company, Phelps Dodge Corporation and Sociedad Minera Cerro Verde S.A.A. dated June 1, 2005 (incorporated by reference from Compañía de Minas Buenaventura S.A.A. Annual Report on Form 20-F for the year ended December 31, 2005, filed on June 6, 2006). |
| | | |
4.111 | | English SummaryCode of the Financial Lease Agreement (Arrendamiento Financiero), dated as of December 2, 2009, byConduct and among Banco de Crédito del Peru, as lessor, Compañía de Minas Buenaventura S.A.A., as guarantor, Empresa de Generación de Huanza, S.A., as lessee, and Consorcio Energético Huancavelica S.A.Ethics. (incorporated by reference from Compañía de Minas Buenaventura S.A.A. Annual Report on Form 20-F for the year ended December 31, 2010,2013, filed on June 28, 2011). |
| | |
11 | | Code of Conduct and Ethics (incorporated by reference from Compañía de Minas Buenaventura S.A.A. Annual Report on Form 20-F for the year ended December 31, 2002, filed on June 25, 2003)April 30, 2014). |
| | | |
| 12.1 | | Certification of Chief Executive Officer of Compañía de Minas Buenaventura S.A.A. pursuant to Section 302 of the Sarbanes-Oxley Act of 2002.† |
| | | |
| 12.2 | | Certification of Chief Financial Officer of Compañía de Minas Buenaventura S.A.A. pursuant to Section 302 of the Sarbanes-Oxley Act of 2002.† |
| | | |
| 13.1 | | Certification of Chief Executive Officer of Compañía de Minas Buenaventura S.A.A. pursuant to Section 906 of the Sarbanes-Oxley Act of 2002.† |
| | | |
| 13.2 | | Certification of Chief Financial Officer of Compañía de Minas Buenaventura S.A.A. pursuant to Section 906 of the Sarbanes-Oxley Act of 2002.† |
† Filed herewith.
Index to the Financial Statements
| Page |
| |
Compañía de Minas Buenaventura S.A.A. and subsidiaries | |
| |
Report of Independent Registered Public Accounting Firm | F-3 |
| |
Consolidated Statement of Financial Position as of December 31, 2011 and 2012 | F-4 |
| |
Consolidated Income Statement for the years ended December 31, 2010, 2011 and 2012 | F-6 |
| |
Consolidated Statement of Comprehensive Income for the years ended December 31, 2010, 2011 and 2012 | F-7 |
| |
Consolidated Statement of Changes in Shareholders’ Equity for the years ended December 31, 2010, 2011 and 2012 | F-8 |
| |
Consolidated Statement of Cash Flows for the years ended December 31, 2010, 2011 and 2012 | F-10 |
| |
Notes to the Consolidated Financial Statements | F-13 |
| |
Minera Yanacocha S.R.L. | |
| |
Report of the Independent Registered and Certified Public Accounting Firm | F-110 |
| |
Consolidated Statements of Income and Comprehensive Income | F-111 |
| |
Consolidated Statements of Cash Flows | F-112 |
| |
Consolidated Balance Sheets | F-113 |
| |
Consolidated Statements of Changes in Partners’ Equity | F-114 |
| |
Notes to the Consolidated Financial Statements | F-115 |
| |
Sociedad Minera Cerro Verde S.A.A. | |
| |
Report of Independent Registered Public Accounting Firm | F-145 |
| |
Statement of Financial Position | F-146 |
| |
Statements of Comprehensive Income | F-147 |
| |
Statements of Changes in Equity | F-148 |
| |
Statements of Cash Flows | F-149 |
| |
Notes to the Financial Statements | F-151 |
Compañía de Minas Buenaventura S.A.A. and Subsidiaries
Compañía de Minas Buenaventura S.A.A. and Subsidiaries | |
| |
Consolidated Financial Statements as of December 31, 2012, 2011 and 2010,Consolidated Financial Statements for the years 2015, 2014 and 2013, together with the Report of Independent Registered Public Accounting Firm |
| |
Contents | |
| |
Report of Independent Registered Public Accounting Firm | F-3 |
| |
Consolidated Statement of Financial Position as of December 31, 2011 and 2012 | F-4 |
| |
Consolidated Income Statement for the years ended December 31, 2010, 2011 and 2012 | F-6 |
| |
Consolidated Statement of Comprehensive Income for the years ended December 31, 2010, 2011 and 2012 | F-7 |
| |
Consolidated Statement of Changes in Shareholders’ Equity for the years ended December 31, 2010, 2011 and 2012 | F-8 |
| |
Consolidated Statement of Cash Flows for the years ended December 31, 2010, 2011 and 2012 | F-10 |
| |
Notes to the Consolidated Financial Statements | F-13 |
Report of Independent Registered Public Accounting Firm
Compañía de Minas Buenaventura S.A.A. and Subsidiaries
Consolidated Financial Statements for the years 2015, 2014 and 2013, together with the Report of Independent Registered Public Accounting Firm.
Report of Independent Registered Public Accounting Firm
To the Board of Directors and Shareholders of Compañía de Minas Buenaventura S.A.A.
Introduction
We have audited the accompanying consolidated financial statements of Compañía de Minas Buenaventura S.A.A. (a Peruvian public corporation) and Subsidiariessubsidiaries (together the “Company”“Group”), which comprise the consolidated statementstatements of financial position as of December 31, 20122015 and 2011,2014, and the related consolidated income statement, statementstatements of profit or loss, statements of other comprehensive income, statementstatements of shareholders’changes in equity and statementstatements of cash flows for the years ended December 31, 2012 , 20112015, 2014 and 2010.2013. These consolidated financial statements are the responsibility of the Company'sGroup's Management. Our responsibility is to express an opinion on these consolidated financial statements based on our audit.audits. We havedid not auditedaudit the financial statements for each of the years ended December 31, 2012, 2011 and 2010 of Minera Yanacocha S.R.L (an associate in which the Company has a 43.65% interest through its subsidiary, Compañía Minera Condesa S.A.). as of December 31, 2014 and for the years ended December 31, 2014 and 2013. In the consolidated statements of financial position, the Group’s investment in Minera Yanacocha S.R.L., is stated at US$1,186 million as of December 31, 2014, and the Group’s equity in the results of Minera Yanacocha S.R.L. is stated at a loss of US$175 million and US$251 million for the years ended December 31, 2014 and 2013, respectively. Those statements were audited by other auditors whose reports were furnished to us, and our opinion, insofar as it relates to the amounts included for Minera Yanacocha S.R.L., is based solely on the reports of the other auditors. In the consolidated financial statements of the Company, the investment on the statement of financial position amounts to US$1,585.4 and US$1,312.1 million as of December 31, 2012 and 2011, respectively; and the share in the net income of this entity amounts to US$272.9, US$279.7, and US$251.5 million for the years ended December 31, 2012, 2011 and 2010, respectively.
Scope
We conducted our audits in accordance with the standards of the Public Company Accounting Oversight Board (United States). Those standards require that we plan and perform the audit to obtain reasonable assurance about whether the consolidated financial statements are free of material misstatement. An audit includes examining, on a test basis, evidence supporting the amounts and disclosures in the financial statements. An audit also includes assessing the accounting principles used and significant estimates made by Management, as well as evaluating the overall financial statement presentation. We believe that our audits and the reportsreport of the other auditors provide a reasonable basis for our opinion.
Opinion
In our opinion, based on our auditaudits and the reportsreport of other auditors, on Minera Yanacocha S.R.L., the consolidated financial statements referred to above present fairly, in all material respects, the consolidated financial position of Compañía de Minas Buenaventura S.A.A. and Subsidiaries as of December 31, 20122015 and 2011,2014, and their results of operations and their cash flows for each of the years ended on December 31, 2012, 20112015, 2014 and 2010,2013, in accordance with International Financial Reporting Standards as issued by the International Accounting Standards Board (IASB).
Additional information
We also have audited, in accordance with the standards of the Public Company Accounting Oversight Board (United States), Compañía de Minas Buenaventura S.A.A.´s’s internal control over financial reporting as of December 31, 2012,2015, based on criteria established in Internal Control - Integrated Framework issued by the Committee of Sponsoring Organizations of the Treadway Commission “(2013 framework)” and our report dated April 30, 2013February 25, 2016 expressed an unqualified opinion thereon.
Report of Independent Registered Public Accounting Firm (continued)
Lima, Peru,
April 30, 2013February 25, 2016
/s/ Medina, Zaldivar, Paredes & Asociados
Countersigned by:
Paredes, Zaldívar, Burga & Asociados S. Civil de R.L.
/s/ Marco Antonio Zaldívar
| /s/ Victor Burga | |
| Victor Burga | |
| C.P.C.A. Register No. 14859 | |
Marco Antonio Zaldívar
C.P.C.A. Register No.12477
Compañía de Minas Buenaventura S.A.A. and Subsidiaries
Consolidated Statementstatements of Financial Positionfinancial position
As of December 31, 20122015 and 20112014
| | | Note | | 2012 | | | 2011 | |
| | | | | US$(000) | | | US$(000) | |
| Asset | | | | | | | | | | |
| Current asset | | | | | | | | | | |
| Cash and cash equivalents | | 4(a) | | | 186,712 | | | | 480,968 | |
| Financial assets at fair value through profit or loss | | 5 | | | 54,509 | | | | 52,178 | |
| Trade accounts receivable, net | | 6(a) | | | 256,431 | | | | 172,569 | |
| Other accounts receivable | | 7 | | | 108,568 | | | | 48,521 | |
| Accounts receivable from associates | | 31(c) | | | 22,534 | | | | 47,425 | |
| Hedge derivative financial instruments | | 27(a) | | | - | | | | 1,283 | |
| Inventory, net | | 8(a) | | | 163,067 | | | | 149,108 | |
| Prepaid expenses | | | | | 11,837 | | | | 16,234 | |
| | | | | | | | | | | |
| Total current asset | | | | | 803,658 | | | | 968,286 | |
| | | | | | | | | | | |
| Other accounts receivable | | 7 | | | 6,702 | | | | 5,570 | |
| Accounts receivable from associates | | 31(c) | | | 33,377 | | | | 32,262 | |
| Long-term inventory | | 8(a) | | | 55,937 | | | | 48,845 | |
| Investment in associates | | 9(a) | | | 2,436,237 | | | | 1,935,004 | |
| Mining concessions, development costs, property, plant and equipment, net | | 10(a) | | | 1,134,276 | | | | 830,997 | |
| Deferred income tax asset, net | | 24(a) | | | 113,343 | | | | 125,538 | |
| Other assets | | | | | 5,123 | | | | 7,047 | |
| | | | | | | | | | | |
| Total assets | | | | | 4,588,653 | | | | 3,953,549 | |
| | | Note | | 2015 | | | 2014 | |
| | | | | US$(000) | | | US$(000) | |
| Asset | | | | | | | | | | | |
| Current asset | | | | | | | | | | | |
| Cash and cash equivalents | | | 7 | | | 78,519 | | | | 78,512 | |
| Trade and other receivables, net | | | 8(a) | | | 219,862 | | | | 281,604 | |
| Inventories, net | | | 9(a) | | | 101,473 | | | | 150,284 | |
| Income tax credit | | | | | | 45,919 | | | | 53,746 | |
| Prepaid expenses | | | 10 | | | 8,231 | | | | 16,954 | |
| Derivative financial instruments | | | 32(a) | | | - | | | | 3,688 | |
| | | | | | | 454,004 | | | | 584,788 | |
| Assets held for sale | | | 1(e) | | | 15,592 | | | | 18,683 | |
| | | | | | | | | | | | |
| | | | | | | 469,596 | | | | 603,471 | |
| Non-current asset | | | | | | | | | | | |
| Trade and other receivables, net | | | 8(a) | | | 162,567 | | | | 26,651 | |
| Inventories, net | | | 9(a) | | | 26,029 | | | | 34,088 | |
| Investments in associates | | | 11(a) | | | 2,043,983 | | | | 2,224,381 | |
| Mining concessions, development costs, property, plant and equipment, net | | | 12 | | | 1,747,624 | | | | 1,715,452 | |
| Investment properties, net | | | 13 | | | 10,719 | | | | 11,200 | |
| Deferred income tax asset, net | | | 28(b) | | | 41,574 | | | | 47,675 | |
| Prepaid expenses | | | 10 | | | 29,235 | | | | - | |
| Other assets | | | | | | 15,854 | | | | 9,356 | |
| | | | | | | 4,077,585 | | | | 4,068,803 | |
| Total assets | | | | | | 4,547,181 | | | | 4,672,274 | |
| Liabilities and shareholders’ equity, net | | | | | | | | | | | |
| Current liabilities | | | | | | | | | | | |
| Bank loans | | | 14 | | | 285,302 | | | | 40,000 | |
| Trade and other payables | | | 15(a) | | | 247,114 | | | | 254,000 | |
| Provisions | | | 16(a) | | | 49,829 | | | | 67,895 | |
| Income tax payable | | | | | | 2,444 | | | | 3,556 | |
| Embedded derivatives for sale of concentrate, net | | | 32(b) | | | 1,694 | | | | 9,072 | |
| Financial obligations | | | 17(a) | | | 33,394 | | | | 69,950 | |
| Derivative financial instruments | | | 32(c) | | | 10,643 | | | | - | |
| | | | | | | 630,420 | | | | 444,473 | |
| Liabilities directly associated with the assets held for sale | | | 1(e) | | | 20,611 | | | | 28,890 | |
| | | | | | | 651,031 | | | | 473,363 | |
| Non-current liabilities | | | | | | | | | | | |
| Trade and other payables | | | 15(a) | | | 15,057 | | | | 15,240 | |
| Provisions | | | 16(a) | | | 141,885 | | | | 63,571 | |
| Financial obligations | | | 17(a) | | | 320,316 | | | | 313,355 | |
| Contingent consideration liability | | | 5 | | | 16,994 | | | | 23,026 | |
| Deferred income tax liabilities, net | | | 28(b) | | | 12,662 | | | | 21,594 | |
| | | | | | | 506,914 | | | | 436,786 | |
| Total liabilities | | | | | | 1,157,945 | | | | 910,149 | |
| Shareholders’ equity, net | | | 18 | | | | | | | | |
| Capital stock | | | | | | 750,497 | | | | 750,497 | |
| Investment shares | | | | | | 1,396 | | | | 1,396 | |
| Additional paid-in capital | | | | | | 219,055 | | | | 219,055 | |
| Legal reserve | | | | | | 162,714 | | | | 162,710 | |
| Other reserves | | | | | | 269 | | | | 269 | |
| Retained earnings | | | | | | 2,024,895 | | | | 2,328,423 | |
| Other reserves of equity | | | | | | 2,240 | | | | 1,755 | |
| Shareholders’ equity, net attributable to owners of the parent | | | | | | 3,161,066 | | | | 3,464,105 | |
| Non-controlling interest | | | 19(a) | | | 228,170 | | | | 298,020 | |
| Total shareholders’ equity, net | | | | | | 3,389,236 | | | | 3,762,125 | |
| Total liabilities and shareholders’ equity, net | | | | | | 4,547,181 | | | | 4,672,274 | |
The accompanying notes are an integral part of this consolidated statement of financial position.
| | | Note | | 2012 | | | 2011 | |
| | | | | US$(000) | | | US$(000) | |
| Liabilities and shareholders’ equity, net | | | | | | | | | | |
| Current liability | | | | | | | | | | |
| Trade accounts payable | | 12 | | | 199,551 | | | | 142,375 | |
| Accounts payable to associates | | 31(c) | | | 890 | | | | 883 | |
| Other accounts payable | | 13 | | | 59,096 | | | | 41,150 | |
| Provisions | | 14 | | | 71,780 | | | | 91,287 | |
| Embedded derivatives for purchase and sale of concentrates, net | | 27(c) | | | 4,939 | | | | 7,306 | |
| Income tax payable | | | | | 7,935 | | | | 36,423 | |
| Financial obligations | | 15(a) | | | 5,815 | | | | 1,042 | |
| Total current liabilities | | | | | 350,006 | | | | 320,466 | |
| | | | | | | | | | | |
| Other non-current provisions | | 14 | | | 100,041 | | | | 86,528 | |
| Accounts payable to associates | | 31(c) | | | 731 | | | | 1,004 | |
| Financial obligations | | 15(a) | | | 173,489 | | | | 105,072 | |
| Total liability | | | | | 624,267 | | | | 513,070 | |
| Shareholders’ equity, net | | 16 | | | | | | | | |
| Capital stock, net of treasury shares for US$(000)62,622 | | | | | 750,540 | | | | 750,540 | |
| Investment shares, net of treasury shares for US$(000)762 | | | | | 1,399 | | | | 2,019 | |
| Additional paid-in capital | | | | | 219,471 | | | | 225,978 | |
| Legal reserve | | | | | 162,663 | | | | 162,639 | |
| Other reserves | | | | | 269 | | | | 269 | |
| Retained earnings | | | | | 2,566,787 | | | | 2,034,768 | |
| Other reserves of equity | | | | | 925 | | | | 2,068 | |
| Shareholders’ equity, net attributable to owners of the parent | | | | | 3,702,054 | | | | 3,178,281 | |
| Non-controlling interest | | | | | 262,332 | | | | 262,198 | |
| Total shareholders’ equity, net | | | | | 3,964,386 | | | | 3,440,479 | |
| Total liabilities and shareholders’ equity, net | | | | | 4,588,653 | | | | 3,953,549 | |
The accompanying notes are an integral part of this consolidated statement of financial position.
Compañía de Minas Buenaventura S.A.A. and Subsidiaries
Consolidated Income Statement
statements of profit or loss
For the years ended December 31, 2012, 20112015, 2014 and 20102013
| | | Note | | 2012 | | | 2011 | | | 2010 | |
| | | | | US$(000) | | | US$(000) | | | US$(000) | |
| Operating income | | | | | | | | | | | | | | |
| Net sales | | 18 | | | 1,496,349 | | | | 1,493,882 | | | | 1,047,885 | |
| Royalty income | | 31(a) | | | 67,178 | | | | 62,742 | | | | 55,883 | |
| Total income | | | | | 1,563,527 | | | | 1,556,624 | | | | 1,103,768 | |
| Operating costs | | | | | | | | | | | | | | |
| Cost of sales, without considering depreciation and amortization | | 19 | | | (629,492 | ) | | | (446,163 | ) | | | (347,129 | ) |
| Exploration in units in operation | | 20 | | | (153,018 | ) | | | (109,355 | ) | | | (91,441 | ) |
| Depreciation and amortization | | | | | (123,043 | ) | | | (96,381 | ) | | | (74,864 | ) |
| Royalties | | 21 | | | (37,667 | ) | | | (60,262 | ) | | | (52,270 | ) |
| Total operating costs | | | | | (943,220 | ) | | | (712,161 | ) | | | (565,704 | ) |
| Gross income | | | | | 620,307 | | | | 844,463 | | | | 538,064 | |
| Operating expenses | | | | | | | | | | | | | | |
| Administrative expenses | | 22 | | | (99,295 | ) | | | (75,170 | ) | | | (107,237 | ) |
| Exploring in non-operating areas | | 23 | | | (95,491 | ) | | | (49,593 | ) | | | (36,105 | ) |
| Selling expenses | | | | | (18,090 | ) | | | (11,617 | ) | | | (9,375 | ) |
| Reversal (provision) for impairment of long-lived assets | | 11 | | | (3,617 | ) | | | - | | | | 13,135 | |
| Excess of workers’ profit sharing | | 14(b) | | | (2,164 | ) | | | (6,221 | ) | | | - | |
| Reimbursement of exploration expenses on projects | | | | | - | | | | - | | | | 15,013 | |
| Other, net | | | | | 16,584 | | | | 2,513 | | | | 10,653 | |
| Total operating expenses | | | | | (202,073 | ) | | | (140,088 | ) | | | (113,916 | ) |
| Operating income | | | | | 418,234 | | | | 704,375 | | | | 424,148 | |
| Other income (expenses), net | | | | | | | | | | | | | | |
| Share in the results of associates under equity method | | 9(b) | | | 464,239 | | | | 468,363 | | | | 428,885 | |
| Interest income | | | | | 9,486 | | | | 11,827 | | | | 8,203 | |
| Interest expense | | | | | (8,290 | ) | | | (11,823 | ) | | | (12,271 | ) |
| Net gain (loss) from currency exchange difference | | | | | 1,715 | | | | (675 | ) | | | (750 | ) |
| Total other income, net | | | | | 467,150 | | | | 467,692 | | | | 424,067 | |
| Income before income tax | | | | | 885,384 | | | | 1,172,067 | | | | 848,215 | |
| Income tax | | 24(b) | | | (142,594 | ) | | | (211,589 | ) | | | (123,326 | ) |
| Net income | | | | | 742,790 | | | | 960,478 | | | | 724,889 | |
| Attributable to: | | | | | | | | | | | | | | |
| Owners of the parent | | | | | 684,685 | | | | 858,927 | | | | 660,821 | |
| Non-controlling interest | | | | | 58,105 | | | | 101,551 | | | | 64,068 | |
| | | | | | 742,790 | | | | 960,478 | | | | 724,889 | |
| Basic and diluted earnings per share attributable to owners of the parent, stated in U.S. dollars | | 25 | | | 2.69 | | | | 3.38 | | | | 2.60 | |
| Weighted average number of shares outstanding (common and investment), in units | | 25 | | | 254,232,571 | | | | 254,442,328 | | | | 254,442,328 | |
| | | Note | | 2015 | | | 2014 | | | 2013 | |
| | | | | US$(000) | | | US$(000) | | | US$(000) | |
| | | | | | | | | | | | | | | |
| Continuing operations | | | | | | | | | | | | | | |
| Operating income | | | | | | | | | | | | | | |
| Net sales of goods | | 21(a) | | | 864,962 | | | | 1,067,271 | | | | 1,135,836 | |
| Net sales of services | | 21(a) | | | 54,488 | | | | 71,642 | | | | 79,585 | |
| Royalty income | | 30(a) | | | 32,414 | | | | 36,867 | | | | 44,185 | |
| Total operating income | | | | | 951,864 | | | | 1,175,780 | | | | 1,259,606 | |
| Operating costs | | | | | | | | | | | | | | |
| Cost of sales of goods, excluding depreciation and amortization | | 22(a) | | | (537,713 | ) | | | (533,052 | ) | | | (513,165 | ) |
| Cost of services, excluding depreciation and amortization | | 22(b) | | | (52,692 | ) | | | (81,487 | ) | | | (114,120 | ) |
| Exploration in operating units | | 23 | | | (91,520 | ) | | | (97,852 | ) | | | (101,913 | ) |
| Depreciation and amortization | | | | | (242,465 | ) | | | (208,698 | ) | | | (159,140 | ) |
| Mining royalties | | 24 | | | (27,407 | ) | | | (28,440 | ) | | | (30,402 | ) |
| Total operating costs | | | | | (951,797 | ) | | | (949,529 | ) | | | (918,740 | ) |
| Gross profit | | | | | 67 | | | | 226,251 | | | | 340,866 | |
| Operating expenses | | | | | | | | | | | | | | |
| Administrative expenses | | 25 | | | (86,532 | ) | | | (101,102 | ) | | | (75,118 | ) |
| Exploration in non-operating areas | | 26 | | | (30,610 | ) | | | (50,007 | ) | | | (32,805 | ) |
| Selling expenses | | | | | (19,481 | ) | | | (16,605 | ) | | | (14,842 | ) |
| Impairment loss of long-lived assets | | 12(b) | | | (11,255 | ) | | | - | | | | - | |
| Other, net | | | | | 209 | | | | 3,059 | | | | (2,858 | ) |
| Total operating expenses, net | | | | | (147,669 | ) | | | (164,655 | ) | | | (125,623 | ) |
| Operating profit (loss) | | | | | (147,602 | ) | | | 61,596 | | | | 215,243 | |
| Other income (expense), net | | | | | | | | | | | | | | |
| Share in the results of associates under equity method | | 11(b) | | | (173,375 | ) | | | (74,600 | ) | | | (114,145 | ) |
| Finance costs | | 27 | | | (27,622 | ) | | | (11,318 | ) | | | (9,896 | ) |
| Net gain (loss) from currency exchange difference | | | | | (13,683 | ) | | | (8,452 | ) | | | (7,192 | ) |
| Gain on business combination | | 5 | | | - | | | | 59,852 | | | | - | |
| Finance income | | 27 | | | 11,026 | | | | 8,408 | | | | 6,621 | |
| Total other income (expenses), net | | | | | (203,654 | ) | | | (26,110 | ) | | | (124,612 | ) |
| Profit (loss) before income tax | | | | | (351,256 | ) | | | 35,486 | | | | 90,631 | |
| | | | | | | | | | | | | | | |
| Current income tax | | 28(c) | | | (14,225 | ) | | | (19,006 | ) | | | (57,328 | ) |
| Deferred income tax | | 28(c) | | | (541 | ) | | | (47,006 | ) | | | (29,154 | ) |
| Profit (loss) from continuing operations | | | | | (366,022 | ) | | | (30,526 | ) | | | 4,149 | |
| | | | | | | | | | | | | | | |
| Discontinued operations | | | | | | | | | | | | | | |
| Loss from discontinued operations | | 1(e) | | | (9,523 | ) | | | (31,114 | ) | | | (83,885 | ) |
| Loss for the year | | | | | (375,545 | ) | | | (61,640 | ) | | | (79,736 | ) |
| Attributable to: | | | | | | | | | | | | | | |
| Owners of the parent | | | | | (317,210 | ) | | | (76,065 | ) | | | (107,257 | ) |
| Non-controlling interest | | 19(a) | | | (58,335 | ) | | | 14,425 | | | | 27,521 | |
| | | | | | (375,545 | ) | | | (61,640 | ) | | | (79,736 | ) |
| Basic and diluted loss per share attributable to equity holders of the parent, stated in U.S. dollars | | 18(e) | | | (1.25 | ) | | | (0.30 | ) | | | (0.42 | ) |
| Loss for continuing operations, basic and diluted per share attributable to equity holders of the parent, expressed in US dollars | | 18(e) | | | (1.21 | ) | | | (0.18 | ) | | | (0.09 | ) |
The accompanying notes are an integral part of this statement.
Compañía de Minas Buenaventura S.A.A. and Subsidiaries
Consolidated Statementstatements of Comprehensive Income
other comprehensive income
For the years ended December 31, 2012, 20112015, 2014 and 20102013
| | | Note | | 2012 | | | 2011 | | | 2010 | |
| | | | | US$(000) | | | US$(000) | | | US$(000) | |
| | | | | | | | | | | | |
| Net income | | | | | 742,790 | | | | 960,478 | | | | 724,889 | |
| | | | | | | | | | | | | | | |
| Net change in unrealized gain (loss) on hedging derivative | | 27(b) | | | (1,283 | ) | | | 24,471 | | | | (16,345 | ) |
| Income tax for the effect on change in unrealized gain (loss) on hedging derivative | | 27(b) | | | 439 | | | | (7,395 | ) | | | 4,903 | |
| Net change in unrealized gain (loss) on other investments | | | | | (715 | ) | | | (687 | ) | | | 477 | |
| | | | | | | | | | | | | | | |
| Other comprehensive income, net of taxes | | | | | (1,559 | ) | | | 16,389 | | | | (10,965 | ) |
| | | | | | | | | | | | | | | |
| Total comprehensive income, net of taxes | | | | | 741,231 | | | | 976,867 | | | | 713,924 | |
| | | | | | | | | | | | | | | |
| Attributable to: | | | | | | | | | | | | | | |
| Owners of the parent | | | | | 683,542 | | | | 866,901 | | | | 656,319 | |
| Non-controlling interest | | | | | 57,689 | | | | 109,966 | | | | 57,605 | |
| | | | | | | | | | | | | | | |
| | | | | | 741,231 | | | | 976,867 | | | | 713,924 | |
| | | 2015 | | | 2014 | | | 2013 | |
| | | US$(000) | | | US$(000) | | | US$(000) | |
| | | | | | | | | | |
| Net loss | | | (375,545 | ) | | | (61,640 | ) | | | (79,736 | ) |
| | | | | | | | | | | | | |
| Other comprehensive profit (loss): | | | | | | | | | | | | |
| Other comprehensive income to be reclassified to profit or loss in subsequent periods | | | | | | | | | | | | |
| Net change in unrealized gain (loss) on cash flow hedges | | | (3,368 | ) | | | 4,781 | | | | (1,093 | ) |
| Loss on available-for-sale investments | | | (546 | ) | | | (80 | ) | | | (434 | ) |
| Income tax effect | | | 3,372 | | | | (1,581 | ) | | | 378 | |
| | | | (542 | ) | | | 3,120 | | | | (1,149 | ) |
| Total other comprehensive loss | | | (376,087 | ) | | | (58,520 | ) | | | (80,885 | ) |
| | | | | | | | | | | | | |
| Attributable to: | | | | | | | | | | | | |
| Equity holders of the parent | | | (316,725 | ) | | | (74,414 | ) | | | (108,078 | ) |
| Non-controlling interests | | | (59,362 | ) | | | 15,894 | | | | 27,193 | |
| | | | | | | | | | | | | |
| | | | (376,087 | ) | | | (58,520 | ) | | | (80,885 | ) |
The accompanying notes are an integral part of this statement.
Compañía de Minas Buenaventura S.A.A. and Subsidiaries
Consolidated Statementsstatements of Changeschanges in Shareholders’ Equityequity
For the years ended December 31, 2012, 20112015, 2014 and 20102013
| | | Attributable to owners of the parent | |
| | | Capital stock, net
of treasury shares | | | | | | | | | | | | | | | | | | | | | | | | | | | | |
| | | Number of
shares
outstanding | | | Common
shares | | | Investment
shares | | | Additional
paid-in
capital | | | Legal
reserve | | | Other
reserves | | | Retained
earnings | | | Other
reserves of
equity | | | Total | | | Non-
controlling
interest | | | Total
equity | |
| | | | | | US$(000) | | | US$(000) | | | US$(000) | | | US$(000) | | | US$(000) | | | US$(000) | | | US$(000) | | | US$(000) | | | US$(000) | | | US$(000) | |
| Balance as of January 1, 2010 | | | 253,759,664 | | | | 750,540 | | | | 2,019 | | | | 225,978 | | | | 112,363 | | | | 269 | | | | 974,818 | | | | (1,404 | ) | | | 2,064,583 | | | | 202,520 | | | | 2,267,103 | |
| Net income | | | - | | | | - | | | | - | | | | - | | | | - | | | | - | | | | 660,821 | | | | - | | | | 660,821 | | | | 64,068 | | | | 724,889 | |
| Net change in unrealized loss on hedging derivative, net of taxes | | | - | | | | - | | | | - | | | | - | | | | - | | | | - | | | | - | | | | (4,979 | ) | | | (4,979 | ) | | | (6,463 | ) | | | (11,442 | ) |
| Net change in unrealized gain on other investments | | | - | | | | - | | | | - | | | | - | | | | - | | | | - | | | | - | | | | 477 | | | | 477 | | | | - | | | | 477 | |
| | | | | | | | | | | | | | | | | | | | | | | | | | | | | | | | | | | | | | | | | | | | | |
| Total comprehensive income of the year | | | - | | | | - | | | | - | | | | - | | | | - | | | | - | | | | 660,821 | | | | (4,502 | ) | | | 656,319 | | | | 57,605 | | | | 713,924 | |
| | | | | | | | | | | | | | | | | | | | | | | | | | | | | | | | | | | | | | | | | | | | | |
| Dividends declared and paid, note 16(d) | | | - | | | | - | | | | - | | | | - | | | | - | | | | - | | | | (117,043 | ) | | | - | | | | (117,043 | ) | | | (39,176 | ) | | | (156,219 | ) |
| Proceeds of expire dividends | | | - | | | | - | | | | - | | | | - | | | | 27 | | | | - | | | | - | | | | - | | | | 27 | | | | - | | | | 27 | |
| Capitalization of debt to minority shareholder of La Zanja | | | - | | | | - | | | | - | | | | - | | | | - | | | | - | | | | - | | | | - | | | | - | | | | 19,634 | | | | 19,634 | |
| Transfer to legal reserve | | �� | - | | | | - | | | | - | | | | - | | | | 50,243 | | | | - | | | | (50,243 | ) | | | - | | | | - | | | | - | | | | - | |
| Capitalization of debt to minority shareholder | | | - | | | | - | | | | - | | | | - | | | | - | | | | - | | | | 2,659 | | | | - | | | | 2,659 | | | | (1,791 | ) | | | 868 | |
| | | | | | | | | | | | | | | | | | | | | | | | | | | | | | | | | | | | | | | | | | | | | |
| Balance as of December 31, 2010 | | | 253,759,664 | | | | 750,540 | | | | 2,019 | | | | 225,978 | | | | 162,633 | | | | 269 | | | | 1,471,012 | | | | (5,906 | ) | | | 2,606,545 | | | | 238,792 | | | | 2,845,337 | |
| | | | | | | | | | | | | | | | | | | | | | | | | | | | | | | | | | | | | | | | | | | | | |
| Net income | | | - | | | | - | | | | - | | | | - | | | | - | | | | - | | | | 858,927 | | | | - | | | | 858,927 | | | | 101,551 | | | | 960,478 | |
| Net change in unrealized gain on hedging derivative, net of taxes | | | - | | | | - | | | | - | | | | - | | | | - | | | | - | | | | - | | | | 8,661 | | | | 8,661 | | | | 8,415 | | | | 17,076 | |
| | | Attributable to equity holders of the parent | |
| | | Capital stock, net of treasury shares | | | | | | | | | | | | | | | | | | | | | | | | | | | | |
| | | Number of
shares outstanding | | | Common shares | | | Investment
shares | | | Additional paid-in capital | | | Legal reserve | | | Other reserves | | | Retained earnings | | | Other reserves of equity | | | Total | | | Non-controlling interest | | | Total equity | |
| | | | | | | | US$(000) | | | | US$(000) | | | | US$(000) | | | | US$(000) | | | | US$(000) | | | | US$(000) | | | | US$(000) | | | | US$(000) | | | | US$(000) | | | | US$(000) | |
| | | | | | | | | | | | | | | | | | | | | | | | | | | | | | | | | | | | | | | | | | | | | |
| As of January 1, 2013 | | | 253,729,664 | | | | 750,540 | | | | 1,399 | | | | 219,471 | | | | 162,663 | | | | 269 | | | | 2,599,266 | | | | 925 | | | | 3,734,533 | | | | 263,647 | | | | 3,998,180 | |
| | | | | | | | | | | | | | | | | | | | | | | | | | | | | | | | | | | | | | | | | | | | | |
| Net profit (loss) | | | - | | | | - | | | | - | | | | - | | | | - | | | | - | | | | (107,257 | ) | | | - | | | | (107,257 | ) | | | 27,521 | | | | (79,736 | ) |
| Other comprehensive loss | | | - | | | | - | | | | - | | | | - | | | | - | | | | - | | | | - | | | | (821 | ) | | | (821 | ) | | | (328 | ) | | | (1,149 | ) |
| Total other comprehensive income | | | - | | | | - | | | | - | | | | - | | | | - | | | | - | | | | (107,257 | ) | | | (821 | ) | | | (108,078 | ) | | | 27,193 | | | | (80,885 | ) |
| | | | | | | | | | | | | | | | | | | | | | | | | | | | | | | | | | | | | | | | | | | | | |
| Dividends declared and paid, Note 18(d) | | | - | | | | - | | | | - | | | | - | | | | - | | | | - | | | | (78,879 | ) | | | - | | | | (78,879 | ) | | | (13,533 | ) | | | (92,412 | ) |
| Treasury shares purchase | | | (14,474 | ) | | | (43 | ) | | | (3 | ) | | | (416 | ) | | | - | | | | - | | | | - | | | | - | | | | (462 | ) | | | - | | | | (462 | ) |
| As of December 31, 2013 | | | 253,715,190 | | | | 750,497 | | | | 1,396 | | | | 219,055 | | | | 162,663 | | | | 269 | | | | 2,413,130 | | | | 104 | | | | 3,547,114 | | | | 277,307 | | | | 3,824,421 | |
| | | | | | | | | | | | | | | | | | | | | | | | | | | | | | | | | | | | | | | | | | | | | |
| Net profit (loss) | | | - | | | | - | | | | - | | | | - | | | | - | | | | - | | | | (76,065 | ) | | | - | | | | (76,065 | ) | | | 14,425 | | | | (61,640 | ) |
| Other comprehensive profit | | | - | | | | - | | | | - | | | | - | | | | - | | | | - | | | | - | | | | 1,651 | | | | 1,651 | | | | 1,469 | | | | 3,120 | |
| Total other comprehensive profit (loss) | | | - | | | | - | | | | - | | | | - | | | | - | | | | - | | | | (76,065 | ) | | | 1,651 | | | | (74,414 | ) | | | 15,894 | | | | (58,520 | ) |
| | | | | | | | | | | | | | | | | | | | | | | | | | | | | | | | | | | | | | | | | | | | | |
| Dividends declared and paid, Note 18(d) | | | - | | | | - | | | | - | | | | - | | | | - | | | | - | | | | (8,642 | ) | | | - | | | | (8,642 | ) | | | (8,880 | ) | | | (17,522 | ) |
| Expired dividends | | | - | | | | - | | | | - | | | | - | | | | 47 | | | | - | | | | - | | | | - | | | | 47 | | | | - | | | | 47 | |
| Increases in non-controlling interest | | | - | | | | - | | | | - | | | | - | | | | - | | | | - | | | | - | | | | - | | | | - | | | | 13,699 | | | | 13,699 | |
| As of December 31, 2014 | | | 253,715,190 | | | | 750,497 | | | | 1,396 | | | | 219,055 | | | | 162,710 | | | | 269 | | | | 2,328,423 | | | | 1,755 | | | | 3,464,105 | | | | 298,020 | | | | 3,762,125 | |
| Net loss | | | - | | | | - | | | | - | | | | - | | | | - | | | | - | | | | (317,210 | ) | | | - | | | | (317,210 | ) | | | (58,335 | ) | | | (375,545 | ) |
| Other comprehensive loss | | | - | | | | - | | | | - | | | | - | | | | - | | | | - | | | | - | | | | 485 | | | | 485 | | | | (1,027 | ) | | | (542 | ) |
| Total other comprehensive income | | | - | | | | - | | | | - | | | | - | | | | - | | | | - | | | | (317,210 | ) | | | 485 | | | | (316,725 | ) | | | (59,362 | ) | | | (376,087 | ) |
| | | | | | | | | | | | | | | | | | | | | | | | | | | | | | | | | | | | | | | | | | | | | |
| Dividends declared and paid, Note 19(b) | | | - | | | | - | | | | - | | | | - | | | | - | | | | - | | | | - | | | | - | | | | - | | | | (10,488 | ) | | | (10,488 | ) |
| Expired dividends | | | - | | | | - | | | | - | | | | - | | | | 4 | | | | - | | | | - | | | | - | | | | 4 | | | | - | | | | 4 | |
| Other items | | | - | | | | - | | | | - | | | | - | | | | - | | | | - | | | | 13,682 | | | | - | | | | 13,682 | | | | - | | | | 13,682 | |
| As of December 31, 2015 | | | 253,715,190 | | | | 750,497 | | | | 1,396 | | | | 219,055 | | | | 162,714 | | | | 269 | | | | 2,024,895 | | | | 2,240 | | | | 3,161,066 | | | | 228,170 | | | | 3,389,236 | |
The accompanying notes are an integral part of this consolidated statement of financial position.
| | | Attributable to owners of the parent | |
| | | Capital stock, net
of treasury shares | | | | | | | | | | | | | | | | | | | | | | | | | | | | |
| | | Number of
shares
outstanding | | | Common
shares | | | Investment
shares | | | Additional
paid-in
capital | | | Legal
reserve | | | Other
reserves | | | Retained
earnings | | | Other
reserves of
equity | | | Total | | | Non-
controlling
interest | | | Total
equity | |
| | | | | | US$(000) | | | US$(000) | | | US$(000) | | | US$(000) | | | US$(000) | | | US$(000) | | | US$(000) | | | US$(000) | | | US$(000) | | | US$(000) | |
| | | | | | | | | | | | | | | | | | | | | | | | | | | | | | | | | | |
| Net change in unrealized loss on other investments | | | - | | | | - | | | | - | | | | - | | | | - | | | | - | | | | - | | | | (687 | ) | | | (687 | ) | | | - | | | | (687 | ) |
| | | | | | | | | | | | | | | | | | | | | | | | | | | | | | | | | | | | | | | | | | | | | |
| Total comprehensive income of the year | | | - | | | | - | | | | - | | | | - | | | | - | | | | - | | | | 858,927 | | | | 7,974 | | | | 866,901 | | | | 109,966 | | | | 976,867 | |
| | | | | | | | | | | | | | | | | | | | | | | | | | | | | | | | | | | | | | | | | | | | | |
| Dividends declared and paid, note 16(d) | | | - | | | | - | | | | - | | | | - | | | | - | | | | - | | | | (142,488 | ) | | | - | | | | (142,488 | ) | | | (66,736 | ) | | | (209,224 | ) |
| Expired dividends | | | - | | | | - | | | | - | | | | - | | | | 6 | | | | - | | | | - | | | | - | | | | 6 | | | | - | | | | 6 | |
| Acquisition of non-controlling interest in El Brocal and Colquijirca, note 1(f) | | | - | | | | - | | | | - | | | | - | | | | - | | | | - | | | | (141,235 | ) | | | - | | | | (141,235 | ) | | | (24,107 | ) | | | (165,342 | ) |
| Other acquisitions of non-controlling interests | | | - | | | | - | | | | - | | | | - | | | | - | | | | - | | | | (11,448 | ) | | | - | | | | (11,448 | ) | | | 4,283 | | | | (7,165 | ) |
| | | | | | | | | | | | | | | | | | | | | | | | | | | | | | | | | | | | | | | | | | | | | |
| Balance as of December 31, 2011 | | | 253,759,664 | | | | 750,540 | | | | 2,019 | | | | 225,978 | | | | 162,639 | | | | 269 | | | | 2,034,768 | | | | 2,068 | | | | 3,178,281 | | | | 262,198 | | | | 3,440,479 | |
| | | | | | | | | | | | | | | | | | | | | | | | | | | | | | | | | | | | | | | | | | | | | |
| Net income | | | - | | | | - | | | | - | | | | - | | | | - | | | | - | | | | 684,685 | | | | - | | | | 684,685 | | | | 58,105 | | | | 742,790 | |
| Net change in unrealized loss on hedging derivative, net of taxes | | | - | | | | - | | | | - | | | | - | | | | - | | | | - | | | | - | | | | (428 | ) | | | (428 | ) | | | (416 | ) | | | (844 | ) |
| Net change in unrealized gain on other investments | | | - | | | | - | | | | - | | | | - | | | | - | | | | - | | | | - | | | | (715 | ) | | | (715 | ) | | | - | | | | (715 | ) |
| | | | | | | | | | | | | | | | | | | | | | | | | | | | | | | | | | | | | | | | | | | | | |
| Total comprehensive income of the year | | | - | | | | - | | | | - | | | | - | | | | - | | | | - | | | | 684,685 | | | | (1,143 | ) | | | 683,542 | | | | 57,689 | | | | 741,231 | |
| | | | | | | | | | | | | | | | | | | | | | | | | | | | | | | | | | | | | | | | | | | | | |
| Dividends declared and paid, note 16(d) | | | - | | | | - | | | | - | | | | - | | | | - | | | | - | | | | (152,666 | ) | | | - | | | | (152,666 | ) | | | (44,881 | ) | | | (197,547 | ) |
| Capitalization of debt to minority shareholder of La Zanja | | | - | | | | - | | | | - | | | | - | | | | - | | | | - | | | | - | | | | - | | | | - | | | | (12,674 | ) | | | (12,674 | ) |
| Treasury shares | | | - | | | | - | | | | (620 | ) | | | (6,507 | ) | | | - | | | | - | | | | - | | | | - | | | | (7,127 | ) | | | - | | | | (7,127 | ) |
| Expired dividends | | | - | | | | - | | | | - | | | | - | | | | 24 | | | | - | | | | - | | | | - | | | | 24 | | | | - | | | | 24 | |
| | | | | | | | | | | | | | | | | | | | | | | | | | | | | | | | | | | | | | | | | | | | | |
| Balance as of December 31, 2012 | | | 253,759,664 | | | | 750,540 | | | | 1,399 | | | | 219,471 | | | | 162,663 | | | | 269 | | | | 2,566,787 | | | | 925 | | | | 3,702,054 | | | | 262,332 | | | | 3,964,386 | |
Las notas a los estados financieros adjuntas son parte integrante de este estado consolidado.
Compañía de Minas Buenaventura S.A.A. and Subsidiaries
Consolidated Statementstatements of Cash Flowscash flows
For the years ended December 31, 2012, 20112015, 2014 and 20102013
| | | 2012 | | | 2011 | | | 2010 | |
| | | US$(000) | | | US$(000) | | | US$(000) | |
| Operating activities | | | | | | | | | | | | |
| Proceeds from sales | | | 1,410,120 | | | | 1,505,476 | | | | 997,829 | |
| Royalty received | | | 76,106 | | | | 56,153 | | | | 58,825 | |
| Value added tax (VAT) recovered | | | 40,940 | | | | 22,585 | | | | 7,480 | |
| Dividends received | | | 16,467 | | | | - | | | | 182,955 | |
| Interest received | | | 8,606 | | | | 8,528 | | | | 8,098 | |
| Payments to suppliers and third parties | | | (838,250 | ) | | | (672,479 | ) | | | (473,630 | ) |
| Payments to employees | | | (201,494 | ) | | | (164,677 | ) | | | (126,042 | ) |
| Income tax paid | | | (136,336 | ) | | | (111,802 | ) | | | (56,251 | ) |
| Payments of royalties | | | (38,985 | ) | | | (73,776 | ) | | | (55,265 | ) |
| Payments of interest | | | (1,485 | ) | | | (2,543 | ) | | | (6,377 | ) |
| | | | | | | | | | | | | |
| Net cash and cash equivalents provided by operating activities | | | 335,689 | | | | 567,465 | | | | 537,622 | |
| | | | | | | | | | | | | |
| Investment activities | | | | | | | | | | | | |
| Decrease in time deposits | | | 10,121 | | | | 7,814 | | | | (17,935 | ) |
| Proceeds from sale of investment shares | | | 3,658 | | | | - | | | | - | |
| Proceeds from sale of mining concessions, development costs, property, plant and equipment | | | 255 | | | | 7,891 | | | | 694 | |
| Additions to mining concessions, development costs, property, plant and equipment | | | (442,927 | ) | | | (317,816 | ) | | | (253,275 | ) |
| Contributions to associates and payments for purchase of investment shares | | | (58,594 | ) | | | (52,182 | ) | | | (19,625 | ) |
| Additions to financial assets at fair value through profit or loss | | | - | | | | - | | | | (50,000 | ) |
| | | | | | | | | | | | | |
| Net cash and cash equivalents used in investment activities | | | (487,487 | ) | | | (354,293 | ) | | | (340,141 | ) |
| | | | | | | | | | | | | |
| Financing activities | | | | | | | | | | | | |
| Increase in financial obligations | | | 74,258 | | | | 50,962 | | | | 53,262 | |
| Dividends paid | | | (152,666 | ) | | | (142,488 | ) | | | (117,043 | ) |
| Dividends paid to non-controlling shareholders | | | (44,881 | ) | | | (66,736 | ) | | | (39,176 | ) |
| Capital stock reduction paid to non-controlling interest | | | (7,980 | ) | | | - | | | | - | |
| Payments of financial obligations | | | (1,068 | ) | | | (2,000 | ) | | | (226,117 | ) |
| Proceeds from sale of shares investments | | | - | | | | 60,379 | | | | - | |
| Disbursements related to incorporation of non-controlling interests | | | - | | | | (225,303 | ) | | | - | |
| Net cash and cash equivalents used in financing activities | | | (132,337 | ) | | | (325,186 | ) | | | (329,074 | ) |
| | | | | | | | | | | | | |
| Decrease in cash and cash equivalents for the period, net | | | (284,135 | ) | | | (112,014 | ) | | | (131,593 | ) |
| | | 2012 | | | 2011 | | | 2010 | |
| | | US$(000) | | | US$(000) | | | US$(000) | |
| Cash and cash equivalents at beginning of year | | | 470,847 | | | | 582,861 | | | | 714,454 | |
| Cash and cash equivalents at the year-end, note 4(a) | | | 186,712 | | | | 470,847 | | | | 582,861 | |
| | | Note | | 2015 | | | 2014 | | | 2013 | |
| | | | | US$(000) | | | US$(000) | | | US$(000) | |
| | | | | | | | | | | | | | | |
| Operating activities | | | | | | | | | | | | | | |
| Proceeds from sales | | | | | 965,273 | | | | 1,144,394 | | | | 1,351,359 | |
| Value added tax recovered | | | | | 81,692 | | | | 39,685 | | | | 66,921 | |
| Royalty received | | | | | 38,983 | | | | 31,252 | | | | 50,562 | |
| Dividends received | | 30 | | | 6,691 | | | | 12,938 | | | | 9,803 | |
| Interest received | | | | | 3,650 | | | | 8,333 | | | | 8,235 | |
| Payments to suppliers and third parties | | | | | (727,017 | ) | | | (805,413 | ) | | | (752,770 | ) |
| Payments to employees | | | | | (175,329 | ) | | | (203,496 | ) | | | (216,799 | ) |
| Payments of mining royalties | | | | | (22,836 | ) | | | (22,631 | ) | | | (30,623 | ) |
| Income tax paid | | | | | (22,330 | ) | | | (33,161 | ) | | | (66,427 | ) |
| Interest paid | | | | | (21,518 | ) | | | (9,405 | ) | | | (11,494 | ) |
| Net cash and cash equivalents provided by operating activities | | | | | 127,259 | | | | 162,496 | | | | 408,767 | |
| Investing activities | | | | | | | | | | | | | | |
| Proceeds from settlement of financial assets at fair value through profit or loss | | | | | - | | | | - | | | | 52,944 | |
| Proceeds from collection of loan to an associate | | 30 | | | - | | | | 15,553 | | | | 24,537 | |
| Proceeds from sale of mining concessions, development costs, property, plant and equipment | | | | | 5,481 | | | | 1,681 | | | | 5,010 | |
| Additions to mining concessions, development costs, property, plant and equipment | | 12 | | | (211,286 | ) | | | (227,564 | ) | | | (503,576 | ) |
| Loans to associates | | 30 | | | (124,800 | ) | | | - | | | | - | |
| Loans to third parties | | 8 | | | (829 | ) | | | - | | | | - | |
| Payments for acquisition of other assets | | | | | (10,238 | ) | | | - | | | | - | |
| Payments for acquisition of shares in associate, net of cash acquired | | | | | - | | | | (80,316 | ) | | | - | |
| Contributions in associates | | | | | - | | | | (2,012 | ) | | | (6,988 | ) |
| Net cash and cash equivalents used in investing activities | | | | | (341,672 | ) | | | (292,658 | ) | | | (428,073 | ) |
| Financing activities | | | | | | | | | | | | | | |
| Proceeds from financial obligations | | 17 | | | 296 | | | | 177,125 | | | | 236,975 | |
| Proceeds from bank loans | | 14 | | | 344,503 | | | | 40,000 | | | | - | |
| Payments of bank loans | | 14 | | | (90,000 | ) | | | - | | | | - | |
| Payments of financial obligations | | 17 | | | (29,891 | ) | | | (42,205 | ) | | | (260,231 | ) |
| Dividends paid to controlling shareholders | | 18(d) | | | - | | | | (8,642 | ) | | | (78,879 | ) |
| Dividends paid to non-controlling shareholders | | 19(b) | | | (10,488 | ) | | | (8,880 | ) | | | (13,533 | ) |
| Purchase of treasury shares | | | | | - | | | | - | | | | (462 | ) |
| Net cash and cash equivalents provided by (used in) financing activities | | | | | 214,420 | | | | 157,398 | | | | (116,130 | ) |
| Increase (decrease) in cash and cash equivalents for the year, net | | | | | 7 | | | | 27,236 | | | | (135,436 | ) |
| Cash and cash equivalents at beginning of year | | | | | 78,512 | | | | 51,276 | | | | 186,712 | |
| | | | | | | | | | | | | | | |
| Cash and cash equivalents at year-end | | | | | 78,519 | | | | 78,512 | | | | 51,276 | |
| Financing and investing activities not affecting cash flows: | | | | | | | | | | | | | | |
| Changes in mine closures plans | | | | | 74,907 | | | | 398 | | | | 57,657 | |
| Contingent consideration liability | | | | | - | | | | 23,026 | | | | - | |
Consolidated Statements of Cash Flows (continued)
| | | 2012 | | | 2011 | | | 2010 | |
| | | US$(000) | | | US$(000) | | | US$(000) | |
| | | | | | | | | | |
| Reconciliation of net income to cash and cash equivalents provided by operating activities | | | | | | | | | | | | |
| Net income attributable to owners of the parent | | | 684,685 | | | | 858,927 | | | | 660,821 | |
| Add (less) | | | | | | | | | | | | |
| Depreciation and amortization | | | 147,449 | | | | 118,322 | | | | 90,021 | |
| Net income attributable to non-controlling interest | | | 58,105 | | | | 101,551 | | | | 64,068 | |
| Deferred income tax, mining royalties and special mining tax | | | 10,809 | | | | 42,369 | | | | 34,744 | |
| Changes in the fair value of embedded derivatives of purchase and sale of concentrates and adjustments on open liquidations | | | (16,592 | ) | | | 33,889 | | | | (20,500 | ) |
| Accretion expense of the provision for closure of mining units and exploration projects | | | 6,812 | | | | 9,100 | | | | 6,392 | |
| Net cost of plant and equipment retired and sold | | | 4,120 | | | | 1,858 | | | | 3,136 | |
| Provision for impairment of long-lived assets | | | 3,617 | | | | - | | | | - | |
| Loss (gain) from currency exchange difference | | | (1,715 | ) | | | 675 | | | | 750 | |
| Share in the results of associates under equity method, net of dividends received in cash, note 9(b) | | | (447,772 | ) | | | (468,363 | ) | | | (245,930 | ) |
| Provisions | | | (6,200 | ) | | | (12,274 | ) | | | 74,009 | |
| Net changes in assets and liabilities accounts | | | | | | | | | | | | |
| Decrease (increase) in operating assets - | | | | | | | | | | | | |
| Trade accounts receivable, net | | | (83,862 | ) | | | (11,641 | ) | | | (37,978 | ) |
| Other accounts receivable | | | (60,047 | ) | | | 2,552 | | | | (23,921 | ) |
| Accounts receivable from associates | | | 23,776 | | | | (40,048 | ) | | | (17,773 | ) |
| Inventory | | | (21,051 | ) | | | (88,461 | ) | | | (64,646 | ) |
| Prepaid expenses | | | (4,397 | ) | | | (13,244 | ) | | | 5,246 | |
| Increase (decrease) in operating liabilities - | | | | | | | | | | | | |
| Trade accounts payable | | | 57,176 | | | | 51,001 | | | | 30,017 | |
| Other accounts payable | | | 9,264 | | | | (28,046 | ) | | | (27,431 | ) |
| Income tax payable | | | (28,488 | ) | | | 9,298 | | | | 6,597 | |
| | | | | | | | | | | | | |
| Net cash and cash equivalents provided by operating activities | | | 335,689 | | | | 567,465 | | | | 537,622 | |
The accompanying notes are an integral part of this statement.
Compañía de Minas Buenaventura S.A.A. and Subsidiaries
Notes to the Consolidated Financial Statementsconsolidated financial statements
For the years 2012, 20112015, 2014 and 20102013
| 1. | Identification and business activity of the Company |
| | |
Compañía de Minas Buenaventura S.A.A. (hereafter “Buenaventura”“the Company”) is a publicly traded corporation incorporated in 1953. Buenaventura’sThe Company stock is traded on the Lima and New York Stock Exchanges through American Depositary Receipts (ADRs), which represent Companythe Company’s shares deposited in the Bank of New York. Buenaventura’sThe Company’s legal domicile is at Carlos Villaran Avenue 790, Santa Catalina,Las Begonias Street N°415, San Isidro, Lima, Peru.
Buenaventura (individuallyThe Company and in association with third parties) isits subsidiaries (hereinafter “the Group") are principally engaged in the exploration, extraction,mining, concentration, smelting and commercializationmarketing of polymetallic ores and metals.
Buenaventura
The Group operates directly operates ninefive operating mining units located in Peru: Uchucchacua,Peru (Uchucchacua, Orcopampa, Poracota, Julcani, Mallay and Breapampa), four mining units held for sale (Poracota, Recuperada, Antapite Ishihuinca Mallay and Breapampa.Shila-Paula), and two mining units under development stage (Tambomayo and San Gabriel). In addition, the CompanyGroup has a controlling interest in Sociedad Minera El Brocal S.A.A. (hereinafter ���El“El Brocal”), which operates the Colquijirca mining unit,unit; Minera La Zanja S.R.L. (hereinafter “La Zanja”), which operates La Zanja mining unit and Compañía de Exploraciones, Desarrollo e Inversiones Mineras S.A.C.unit; Molle Verde S.A. (hereinafter “Cedimin”“Molle Verde”), which operates the Shila - Paula mining unit. The Company also holds interests in a number of other mining companies. The Company also holds interests in a number of other mining companies. The Company also owns an electric power distribution company, an electric power generation company (construction stage),Trapiche, a mining unit at the development stage; and other entities dedicated to energy generation and transmission services, construction and engineering services company, a construction services company and another company which will provide chemical processing to treat concentrates from Uchucchacua with high manganese content. See note 1(h).other activities.
| (c) | Approval of consolidated financial statements - |
The consolidated financial statements as of December 31, 2012 and 20112015 were approved by the Company’s Management on April 30, 2013February 25, 2016 and, will be presented for the approval of the Board of Directors and the Shareholders within the terms established by Law. In Management’sin its opinion, the accompanying consolidated financial statements will be approved without changes bymodifications in the Board of Directors and Shareholders’ Meetings.Meetings within the terms established by Law.
The consolidated financial statements as of December 31, 2014 were approved on February 24, 2015.
Notes to the consolidated financial statements(continued)
| (d) | The consolidated financial statements include the financial statements of the following subsidiaries: |
| | | Ownership in capital | | | Country of
incorporation | | Ownership | |
| | | December 31, 2012 | | December 31, 2011 | | | and business | | December 31, 2015 | | | December 31, 2014 | |
| | | Direct | | Indirect | | Direct | | Indirect | | | | | Direct | | Indirect | | Direct | | Indirect | |
| | | % | | % | | % | | % | | | | | % | | % | | % | | % | |
| | | | | | | | | | | |
| Investment and mining concessions held, exploration and exploitation of minerals | | | | | | | | | | | | | | | | | |
| Compañía de Exploraciones, Desarrollo e Inversiones Mineras S.A.C. – CEDIMIN | | | 82.91 | | | | 17.09 | | | | 82.91 | | | | 17.09 | | |
| Mining activities: | | | | | | | | | | | | | | | | | | | |
| Compañía Minera Condesa S.A. | | | 100.00 | | | | - | | | | 100.00 | | | | - | | | Peru | | | 100.00 | | | | - | | | | 100.00 | | | | - | |
| Compañía Minera Colquirrumi S.A. | | | 100.00 | | | | - | | | | 100.00 | | | | - | | | Peru | | | 100.00 | | | | - | | | | 100.00 | | | | - | |
| Sociedad Minera El Brocal S.A.A. (*) (e), (f) | | | 2.54 | | | | 48.18 | | | | 2.54 | | | | 48.18 | | |
| Inversiones Colquijirca S.A. (*) (f) | | | 99.99 | | | | - | | | | 99.99 | | | | - | | |
| Sociedad Minera El Brocal S.A.A. (*) | | | Peru | | | 2.71 | | | | 51.36 | | | | 2.71 | | | | 51.36 | |
| Inversiones Colquijirca S.A. (*) | | | Peru | | | 89.76 | | | | 10.24 | | | | 89.76 | | | | 10.24 | |
| S.M.R.L. Chaupiloma Dos de Cajamarca | | | 20.00 | | | | 40.00 | | | | 20.00 | | | | 40.00 | | | Peru | | | 20.00 | | | | 40.00 | | | | 20.00 | | | | 40.00 | |
| Minera La Zanja S.R.L. | | | 53.06 | | | | - | | | | 53.06 | | | | - | | | Peru | | | 53.06 | | | | - | | | | 53.06 | | | | - | |
| Minera Julcani S.A. de C.V. | | | 100.00 | | | | - | | | | 100.00 | | | | - | | | Mexico | | | 99.80 | | | | 0.20 | | | | 99.80 | | | | 0.20 | |
| Compañía de Minas Buenaventura Chile Ltda. | | | 100.00 | | | | - | | | | 100.00 | | | | - | | | Chile | | | 90.00 | | | | 10.00 | | | | 90.00 | | | | 10.00 | |
| El Molle Verde S.A.C. | | | 100.00 | | | | - | | | | 100.00 | | | | - | | | Peru | | | 99.98 | | | | 0.02 | | | | 99.98 | | | | 0.02 | |
| Apu Coropuna S.R.L. | | | Peru | | | 70.00 | | | | - | | | | 70.00 | | | | - | |
| Metalúrgica Los Volcanes S.A. | | | Peru | | | 99.99 | | | | - | | | | 99.99 | | | | - | |
| Cerro Hablador S.A.C. | | | Peru | | | 99.00 | | | | 1.00 | | | | 99.00 | | | | 1.00 | |
| Minera Azola S.A.C. | | | Peru | | | 99.00 | | | | 1.00 | | | | 99.00 | | | | 1.00 | |
| Compañía Minera Nueva Italia S.A. | | | Peru | | | - | | | | 93.36 | | | | - | | | | 93.36 | |
| | | | | | | | | | | | | | | | | | | | | | | | | | | | | | | | | | | |
| Electric power activity | | | | | | | | | | | | | | | | | |
| Energy generation and transmission services: | | | | | | | | | | | | | | | | | | | |
| Consorcio Energético de Huancavelica S.A. | | | 100.00 | | | | - | | | | 100.00 | | | | - | | | Peru | | | 100.00 | | | | - | | | | 100.00 | | | | - | |
| Empresa de Generación Huanza S.A. (g) | | | - | | | | 100.00 | | | | - | | | | 100.00 | | |
| Empresa de Generación Huanza S.A. | | | Peru | | | - | | | | 100.00 | | | | - | | | | 100.00 | |
| Empresa de Generación Huaura S.A.C. | | | Peru | | | 0.01 | | | | 99.99 | | | | 0.01 | | | | 99.99 | |
| | | | | | | | | | | | | | | | | | | | | | | | | | | | | | | | | | | |
| Services | | | | | | | | | | | | | | | | | |
| Construction, engineering services and insurance brokerage: | | | | | | | | | | | | | | | | | | | |
| Buenaventura Ingenieros S.A. | | | 100.00 | | | | - | | | | 100.00 | | | | - | | | Peru | | | 100.00 | | | | - | | | | 100.00 | | | | - | |
| BISA Construcción S.A. | | | - | | | | 100.00 | | | | - | | | | 100.00 | | |
| BISA Construcción S.A. (**) | | | Peru | | | - | | | | - | | | | - | | | | 100.00 | |
| Contacto Corredores de Seguros S.A. | | | - | | | | 100.00 | | | | - | | | | 100.00 | | | Peru | | | 99.98 | | | | 0.02 | | | | 0.02 | | | | 99.98 | |
| BISA Argentina S.A. (antes Minera San Francisco S.A.) | | | Argentina | | | 56.42 | | | | 43.58 | | | | 56.42 | | | | 43.58 | |
| Contacto Risk Consulting S.A. | | | Peru | | | - | | | | 98.00 | | | | - | | | | - | |
| | | | | | | | | | | | | | | | | | | | | | | | | | | | | | | | | | | |
| Industrial activities | | | | | | | | | | | | | | | | | | | | | | | | | | | | | | | | | | |
| Procesadora Industrial Rio Seco S.A. (h) | | | 100.00 | | | | - | | | | 100.00 | | | | - | | |
| Procesadora Industrial Río Seco S.A. | | | Peru | | | 100.00 | | | | - | | | | 100.00 | | | | - | |
| (*) | As of December 31, 20122015 and 2011 Buenaventura´s2014, the participation of the Company in the voting rights of El Brocal common shares was 53.72 percent.is 53.72%. Inversiones Colquijirca S.A. (hereafter “Colquijirca”), a Buenaventura´sGroup’s subsidiary (99.99 percent(99.99% as of December 31, 20122015 and 2011)2014), has a 51.06 percent51.06% interest in El Brocal,Brocal’s capital stock, through which Buenaventura heldthe Group holds an indirect participation in El Brocal of 48.18 percent51.36% as of December 31, 20122015 and 2011. See note 1(f).2014. |
| (**) | In December 2015, the Board of Directors’ and Shareholders’ Meetings of Buenaventura Ingenieros S.A. and BISA Construcción S.A., approved the merger between these subsidiaries whereby Buenaventura Ingenieros S.A. has absorbed BISA Construcción S.A. |
Notes to the consolidated financial statements(continued)
| (e) | Project for the expansion of El BrocalDiscontinued operations - |
On August 15, 2008,In 2014, the BoardGroup publicly announced its decision to sell its four paralyzed mining units mentioned in Note 1(b); as a consequence, they are presented as mining units held for sale. According to IFRS 5 “Non-current Assets Held for Sale and Discontinued Operations”, the related assets and liabilities are presented in the consolidated statement of Directorsfinancial position at the lower of El Brocal approved a projectcost and fair value less cost to expand its operations in ordersale. There were delays during the selling process related to reach a treatment levelregulatory issues; however, management expects to complete the sale of 18,000 DMT/day of ore. This project, will allow processing ore with lower lead–zinc grade from Tajo Norte and copper from Marcapunta, divided in three stages:
| - | First: Optimization of the current plant of 5,000 DMT/day to 7,000 DMT/day. |
| - | Second: New concentrate plant 2,490 DMT/day. |
| - | Third: Expansion of the new plant from 2,490 DMT/day to 11,000 DMT/day. |
Optimization Plant No. 1 (first stage) and the new concentrator (second stage) with additional treatment capacity of 2,000 DMT/day and 2,490 DMT/day, respectively started operations in October 2010 and January 2011.these discontinued mining units to third parties no later than December 31, 2016.
AsThe major classes of assets and liabilities of these four mining units held for sale as of December 31, 20122015 and 2011, the works related to the project to expand operations, which costs have been capitalized, considering the project economic feasibility study by El Brocal’s Management criteria,2014 are the following:presented below:
| | | 2012 | | | 2011 | |
| | | US$(000) | | | US$(000) | |
| Mine development costs | | | | | | | | |
| Expansion of Tajo Norte – Marcapunta Norte | | | 16,429 | | | | 16,429 | |
| | | | | | | | | |
| Mining concessions, property, plant and equipment | | | | | | | | |
| Expansion of refining plant capacity to 18,000 DMT/day | | | 127,262 | | | | 103,337 | |
| Optimization of crushing plant and conveyor belt | | | 53,674 | | | | 17,018 | |
| Huachacaja tailings areas | | | 38,060 | | | | 7,825 | |
| New offices and camps | | | 16,188 | | | | 13,350 | |
| Expansion of power grid | | | 14,812 | | | | 7,941 | |
| Support area | | | 4,311 | | | | 3,067 | |
| Program management | | | 3,852 | | | | 2,476 | |
| Mineral storage | | | 2,098 | | | | 2,098 | |
| Borrowing cost | | | 334 | | | | - | |
| Other minor activities | | | 928 | | | | 759 | |
| | | | | | | | | |
| Total investment made | | | 277,948 | | | | 174,300 | |
| | | 2015 | | | 2014 | |
| | | US$(000) | | | US$(000) | |
| | | | | | | |
| Asset | | | | | | | | |
| Cash | | | 4 | | | | 18 | |
| Trade and other receivables, net | | | 172 | | | | 849 | |
| Inventories, net | | | 1,940 | | | | 2,581 | |
| Prepaid expenses | | | 170 | | | | 197 | |
| Mining concessions, development costs, property, plant and equipment, net | | | 13,306 | | | | 15,038 | |
| Assets classified as held for sale | | | 15,592 | | | | 18,683 | |
| | | | | | | | | |
| Liabilities | | | | | | | | |
| Trade and other payables | | | (2,862 | ) | | | (5,224 | ) |
| Provisions | | | (17,749 | ) | | | (23,666 | ) |
| Liabilities directly associated with the assets held for sale | | | (20,611 | ) | | | (28,890 | ) |
Notes to the consolidated financial statements(continued)
| (f) | Changes in the participation of Colquijirca and El Brocal - |
Inversiones Colquijirca S.A.
On July and August of 2011, the Company increased its participation of 81.42 to 99.99 percent in Colquijirca; acquiring shares amounted to US$197,021,000, which was totally paid in cash as part of the investment.
The difference between price paidresults of the four mining units held for sale for the years 2015, 2014 and the carrying amount of these shares amounted to US$166,692,000, was recorded in “Retained earnings” caption in the consolidated statement of changes in shareholders´ equity.
Sociedad Minera El Brocal S.A.A.
During the year 2011, the Company purchased and sold El Brocal´s shares. The disbursements to acquire 1.38 percent of El Brocal´s shares amounted to US$28,282,000, which was totally paid in cash at the date of consolidated statement of financial position. Revenues from the sale of 3.09 percent of El Brocal´s shares amounted to US$68,142,000.2013 are presented below:
The difference between price paid and the carry amount of these shares and the price received net of cost from shares sold, amounted to US$23,292,000, was recorded in “Retained earnings” caption in the consolidated statement of changes in shareholders´ equity.
| | | 2015 | | | 2014 | | | 2013 | |
| | | US$(000) | | | US$(000) | | | US$(000) | |
| | | | | | | | | | |
| Operating income | | | | | | | | | |
| Net sales | | | 398 | | | | 5,117 | | | | 25,835 | |
| Total income | | | 398 | | | | 5,117 | | | | 25,835 | |
| | | | | | | | | | | | | |
| Operating costs | | | | | | | | | | | | |
| Cost of sales, excluding depreciation and amortization | | | (8,011 | ) | | | (28,566 | ) | | | (26,094 | ) |
| Exploration | | | (26 | ) | | | (2,853 | ) | | | (65,230 | ) |
| Depreciation and amortization | | | - | | | | (823 | ) | | | (6,337 | ) |
| Mining royalties | | | (4 | ) | | | (47 | ) | | | (221 | ) |
| Total operating costs | | | (8,041 | ) | | | (32,289 | ) | | | (97,882 | ) |
| Gross loss | | | (7,643 | ) | | | (27,172 | ) | | | (72,047 | ) |
| Operating expenses, net | | | | | | | | | | | | |
| Administrative expenses | | | (74 | ) | | | (523 | ) | | | (2,358 | ) |
| Selling expenses | | | (2 | ) | | | (201 | ) | | | (1,193 | ) |
| Provision for contingencies | | | (44 | ) | | | 372 | | | | (1,589 | ) |
| Other, net | | | (1,039 | ) | | | (2,929 | ) | | | (5,674 | ) |
| Total operating expenses | | | (1,159 | ) | | | (3,281 | ) | | | (10,814 | ) |
| Operating loss | | | (8,802 | ) | | | (30,453 | ) | | | (82,861 | ) |
| Other income (expenses), net | | | | | | | | | | | | |
| Finance income | | | - | | | | 1 | | | | 2 | |
| Finance costs | | | (840 | ) | | | (799 | ) | | | (1,074 | ) |
| Net gain from currency exchange difference | | | 119 | | | | 145 | | | | 180 | |
| Total other expenses, net | | | (721 | ) | | | (653 | ) | | | (892 | ) |
| Loss before income tax | | | (9,523 | ) | | | (31,106 | ) | | | (83,753 | ) |
| Income tax | | | - | | | | (8 | ) | | | (132 | ) |
| | | | | | | | | | | | | |
| Loss associated with the mining units classified as held for sale | | | (9,523 | ) | | | (31,114 | ) | | | (83,885 | ) |
| (g) F-12 | Construction of hydroelectric power station - |
In November 2009, the Consorcio Energético de Huancavelica S.A. Board of Directors approved the construction of 90.6 MW capacity Huanza Hydroelectric Power Station, located in the Santa Eulalia river valley. This initial investment of US$145,000,000, is in progress since March 2010. This project is being financed with a US$119,000,000 financial leasing agreement executed with Banco de Credito del Peru and with Consorcio Energético de Huancavelica S.A.’s own resources. The hydroelectric power station will start operations in the third quarter of 2013 and the estimated investment is US$180,000,000.
As of December 31, 2012, the investment in this project amounted to US$177,133,000 (US$119,509,000 as of December 31, 2011), and it is composed as follows:
| | | 2012 | | | 2011 | |
| | | US$(000) | | | US$(000) | |
| | | | | | | |
| Development costs | | | | | | | | |
| Concessions and other minors | | | 2,171 | | | | 2,142 | |
| Property, plant and equipment | | | | | | | | |
| Water conductor system | | | 86,967 | | | | 50,468 | |
| Preliminary work | | | 38,216 | | | | 41,812 | |
| Borrowing cost | | | 10,974 | | | | 6,364 | |
| Pallca dam and water intake | | | 9,977 | | | | 1,564 | |
Notes to the consolidated financial statements(continued)
| | | 2012 | | | 2011 | |
| | | US$(000) | | | US$(000) | |
| | | | | | | |
| Round house and yard keys | | | 7,754 | | | | 3,128 | |
| Access road | | | 7,387 | | | | 6,305 | |
| Conduction tube line – Conay river | | | 6,445 | | | | 2,189 | |
| Transmition line in 60 KV | | | 3,293 | | | | 2,766 | |
| Other minor activities | | | 3,949 | | | | 2,771 | |
| | | | | | | | | |
| | | | 174,962 | | | | 117,367 | |
| | | | | | | | | |
| Total included in work in progress | | | 177,133 | | | | 119,509 | |
| (h) | Construction of washing plant, sulfuric acid and manganese sulfate - |
At Board of Directors held on October 28, 2010, agreed the constitution of Procesadora Industrial Rio Seco S.A., in order to carry out the plant for the manganese sulfate project. The project is located in the community of Lomera in Huaral at 102 kilometers from Lima. The main objective of this project is to wash with sulfuric acid, the manganese content in the lead-silver concentrate of Uchucchacua mining unit to reduce chemically the level of manganese and to obtain a higher value added in ore concentrate. This process will also improve and increase recovery of silver reserves. For the treatment of gaseous effluents of the process, a sulfuric acid recovery plant will be installed, that will be used for the acid wash of the concentrate.
The total estimated investmentnet cash flows used by the four mining units held for sale for the constructionyears 2015, 2014 and 2013 are presented below:
| | | 2015 | | | 2014 | | | 2013 | |
| | | US$(000) | | | US$(000) | | | US$(000) | |
| | | | | | | | | | |
| Operating activities | | | (8 | ) | | | 261 | | | | 5,195 | |
| Investing activities | | | (6 | ) | | | (296 | ) | | | (5,325 | ) |
| Financing activities | | | - | | | | - | | | | - | |
| Net decrease in cash and cash equivalents during the year | | | (14 | ) | | | (35 | ) | | | (130 | ) |
Basic and diluted earnings per share for the years 2015, 2014 and 2013, resulting from the discontinued operations are as follow:
| | | 2015 | | | 2014 | | | 2013 | |
| | | US$ | | | US$ | | | US$ | |
| | | | | | | | | | | | | |
| Loss from the discontinued operations, per basic and diluted share | | | (0.04 | ) | | | (0.12 | ) | | | (0.33 | ) |
Write-down of property, plant and equipment
Before the classification of the washingfour mining units as held for sale, the recoverable amount was estimated for certain items of property, plant the plantand equipment and impairment loss of sulfuric acid and manganese sulphate plant amounted to US$93,379,000, and it is expected to be completed794,000 was identified in the third quarter2014 (accumulated impairment loss of 2013. As of December 31, 2012, the investment in this project amounts to US$84,288,000 (US$27,606,00019,805,000 as of December 31, 2011).
| (i) | Mallay’s mining unit start up - |
On April 2, 2012, the Company obtained the authorization to operate the plant and other services of Mallay mining unit, located 15 kilometers from the Uchucchacua mining unit. The new plant has a treatment capacity of 400 MT / day, and it operates since April 2012. As of December 31, 2012, Mallay mining unit has produced 668,327 ounces of silver. Total investment in fixed assets was US$64,392,000 of which US$19,958,000 were disbursed in 2012.
| (j) | Breapampa’s mining unit start up - |
On November 2012, the Company obtained the authorization of the operation of the processing plant of Breapampa mining unit, located in the district of Chumpi, Parinacochas province, Ayacucho. The new plant has a treatment capacity of 10,000 MT / day, and it operates since November 2012. As of December 31, 2012, Breapampa mining unit has produced 5,922 ounces of gold. Total investment in fixed assets was US$52,125,000 of which US$31,560,000 were disbursed in 2012.
Notes to the consolidated financial statements (continued)
| (k) | Capital reduction of Minera La Zanja S.R.L. (La Zanja) - |
On January 26, 2012, the Shareholder’s meeting agreed to reduce the capital stock of La Zanja by US$27,000,000, returning cash contributions. This agreement was registered in the public records on March 30, 2012. The amount of the refund to the non-controlling interest amounted to US$4,694,000 (US$12,674,000 net disbursements of US$7,980,000)2013).
| 2. | SignificantBasis for preparation, consolidation and accounting principlespolicies |
| | |
| 2.1. | Basis of preparation - |
Statement of compliance -
TheseThe consolidated financial statements of the Group have been prepared in accordance with International Financial Reporting Standards (hereinafter “IFRS”)(IFRS), as issued by the International Accounting Standards Board (hereinafter “IASB”) and its interpretations issued by the IFRS Interpretations Committee (hereinafter “IFRS”), effective as of December 31, 2012.(IASB).
Measurement basis -
The consolidated financial statements have been prepared on a historical cost basis, from the Company records, except for financial assets and liabilities at fair value through profit or loss which include the derivative financial instruments and the liability for stock appreciation rights that have been measured at fair value.
The consolidated financial statements are presented in U.S. dollars and all values are rounded to the nearest thousand,thousands, except when otherwise indicated, see note 2.3(a).indicated.
BasisThe preparation of consolidation -consolidated financial statements require that Management use judgments, estimates and assumptions, as detailed on the following Note 3.
These consolidated financial statements provide comparative information in respect of prior periods.
| 2.2. | Basis of consolidation - |
The consolidated financial statements comprise Buenaventura’sthe financial statements of the company and its subsidiaries in which Buenaventura controls, which generally is represented by more than 50 percent equity participation and/or exercises control. All significant inter-company balances and transactions have been eliminated.to the date of the statements of financial position.
Notes to the consolidated financial statements(continued)
See note 1(d) forControl is achieved when the Group is exposed, or has rights, to variable returns from its involvement with the investee and has the ability to affect those returns through its power over the investee. Specifically, the Group controls an investee if, and only if, the Group has:
| - | Power over the investee (i.e., existing rights that give it the current ability to direct the relevant activities of the investee); |
| - | Exposure, or rights, to variable returns from its involvement with the investee; |
| - | The ability to use its power over the investee to affect its returns. |
Generally, there is a listpresumption that a majority of voting rights result in control. To support this presumption and when the Group has less than a majority of the companiesvoting or similar rights of an investee, the Group considers all relevant facts and circumstances in assessing whether it has power over an investee, including:
| - | The contractual arrangement with the other vote holders of the investee; |
| - | Rights arising from other contractual arrangements; |
| - | The Group’s voting rights and potential voting rights or a combination of rights. |
The Group re-assesses whether or not it controls an investee if facts and circumstances indicate that there are changes to one or more of the three elements of control. Consolidation of a subsidiary begins when the Group obtains control over the subsidiary and ceases when the Group loses control of the subsidiary. Assets, liabilities, income and expenses of a subsidiary acquired or disposed of during the year are included in the consolidated financial statements.statements from the date the Group gains control until the date the Group ceases to control the subsidiary.
TheProfit or loss and each component of other comprehensive income are attributed to the equity holders of the Parent of the Group and to the non-controlling interests, even if this results in the non-controlling interests having a deficit balance. When necessary, adjustments are made to the financial statements of subsidiaries to bring their accounting policies into line with the subsidiaries are prepared for the same reporting period as the parent company, usingGroup’s accounting consistent principles and policies.
The shareholders’All intra-group assets and liabilities, equity, attributableincome, expenses and cash flows relating to transactions between members of the non-controlling interest is shownGroup are eliminated in the consolidated statement of financial position. Earnings attributable to the non-controlling interest are shown separately in the consolidated income statement.
Notes to the consolidated financial statements (continued)full on consolidation.
The Company changedA change in the ownership interest of its subsidiaries,a subsidiary, without a loss of control. Consequently, they arecontrol, is accounted for as an equity transaction.
| 2.2. F-14 | Significant judgments, estimates and assumptions - |
The preparation of consolidated financial statements in conformity with IFRS requires Management to make judgments, estimates and assumptions that affect the reported amounts of assets, liabilities and the disclosure of contingent assets and liabilities at the date of consolidated financial statements, and reported amounts of revenues and expenses to be reported for the years ended December 31, 2012, 2011 and 2010. In Management´s opinion, these estimates were made on the basis of their best knowledge of the relevant facts and circumstances at the date of preparation of consolidated financial statements; however, uncertainty about these assumptions and estimates could result in outcomes that can differ from the estimates included in the consolidated financial statement. The Company’s Management does not expect that these changes would have a significant effect on the consolidated financial statements.
Company´s Management considers the following significant estimates to prepare the consolidated financial statements:
| (a) | Provision for closure of mining units – (note 2.3(n) and note 14(a)) - |
The Company assesses its provision for closure of mining units annually. Significant estimates and assumptions are made in determining this provision, as there are numerous factors that will affect the ultimate liability payable. These factors include estimates of the extent and costs of rehabilitation activities, technological changes, regulations changes, costs increases as compared to the inflation rates and changes in the discount rates. These uncertainties may result in future actual expenditure differing from the amounts currently provided. The provision at reporting date represents Management´s best estimate of the present value of future rehabilitation costs required.
| (b) | Determination of mineral reserves and resources - |
The Company computes its reserves using methods generally applied by the mining industry in accordance with international guidelines. All reserves computed represent the estimated amounts of proved and probable ore that can be processed economically under the present conditions.
The process of estimating the amount of reserves is complex and requires making subjective decisions at the time of evaluating all the geologic, geophysical, engineering and economic information that is available. Revisions could occur in estimated reserves due to, among other things, revisions of the geologic data or assumptions, changes in assumed prices, production costs and the results of exploration activities.
Notes to the consolidated financial statements(continued)
Changes in estimated reserves could affect mainly the depreciation of fixed assets related directly to mining activity, provision for mine closure, assessment of the deferred asset’s recoverability and the amortization period for development costs.
| (c) | Unit-of-production depreciation - (note 2.3(g)) - |
Reserves are used in determining the depreciation and amortization of mine specific assets. This results in a depreciation or amortization charge proportional to the depletion of the anticipated remaining life of mine production. Each item’s life, which is assessed annually, has regarded to: i) physical life limitations, and ii) present assessments of economically recoverable reserves of the mine property. These calculations require the use of estimates and assumptions, including the amount of recoverable reserves. Changes are recorded prospectively.
| (d) | Mine development costs - (note 10 (c)) - |
The application of the Company’s accounting policy for exploration and mine development costs requires judgment in determining whether it is likely that future economic benefits are likely either from future exploitation. The determination of reserves and mineral resources is a complex estimation that requires varying degrees of uncertainty depending on sub-classification and these estimates directly impact the point of deferral of exploration and mine development costs and its amortization method for development costs. The deferral policy requires Management to make certain estimates and assumptions about future events or circumstances, in particular whether an economically viable extraction, operation and sale of mineral can be established. Estimates and assumptions made may change if new information becomes available. If, after expenditure is capitalized, information becomes available suggesting that the recovery of expenditure is unlikely, the amount capitalized is written off in profit or loss in the period when the new information becomes available.
| (e) | Share-based payment transactions - (note 14(b)) - |
The Company measures the cost of cash-settled share-based payments to employees by reference to the fair value of the equity instruments at the date at which they are granted. Estimating fair value for share-based payment transactions requires determining the most appropriate valuation model, which is dependent on the terms and conditions of the grant. This estimate also requires determining the most appropriate inputs to the valuation model including the expected life of the share option, volatility and dividend yield and making assumptions about them. The assumptions and models used for estimating fair value for share-based payment transactions are disclosed in note 14(c).
Notes to the consolidated financial statements (continued)
| (f) | Impairment of non-financial assets - (note 11) - |
The Company has determined that the operations of each mining unit are cash generating units, considering each mining unit operation independently.
The Company assesses at each reporting date whether there is an indication that an asset may be impaired. If any such indication exists, the Company makes a formal estimate of the asset’s recoverable amount. An asset’s recoverable amount is the higher of an asset’s fair value less costs to sell and its value in use and is determined for an individual asset (cash-generating unit) unless the asset does not generate cash inflows that are clearly independent of those from other assets or groups of assets. These assessments require the use of estimates and assumptions such as long-term commodity prices, discount rates, operating costs, and others.
In assessing value in use, the estimated future cash flows are discounted to their present value using a discount rate that reflects current market assessments of the time value of money and the risks specific to the asset.
| (g) | Contingencies - (note 30) - |
By their nature, contingencies will only be resolved when one or more future events do or do not occur. Determining contingencies inherently involves the exercise of judgment and estimates of the outcome of future events.
| (h) | Fair value of financial instruments - (note 29) - |
Where the fair value of financial assets and financial liabilities recorded in the consolidated statement of financial position cannot be derived from active markets, their fair value is determined using valuation techniques including the discounted cash flow model. The inputs to these models are taken from observable markets where possible. Where this is not feasible, a degree of judgment is required in establishing fair values. The judgments include considerations of inputs such as liquidity risk, credit risk and volatility. Changes in assumptions about these factors could affect the reported fair value of financial instruments.
| (i) | Production start date - (note 10(c)) - |
The Company assesses the stage of each mine under development to determine when a mine moves into the production stage. The criteria used to assess the start date are determined based on the nature of each mining project, the complexity of a plant and its location. The Company considers various relevant criteria for assessing when the mine is substantially complete and ready for its planned use. Some of the criteria used will include, but are not limited to, the following:
Notes to the consolidated financial statements (continued)
| - | Level of capital expenditure incurred compared to the original construction cost estimates. |
| - | Completion of a reasonable period of testing of the mine plant and equipment. |
| - | Ability to produce metal in saleable form (within specifications). |
| - | Ability to sustain ongoing production of metal. |
When a mine development project moves into the production stage, the capitalization of certain mine development costs ceases and costs are either regarded as forming part of the cost of inventory or expensed, except for costs that qualify for capitalization (relating to mining asset additions or improvements), underground mine development or mineable reserve development. It is also at this point that depreciation or amortization commences.
| (j) | Recovery of deferred tax assets - (note 24) - |
An assessment is required to determine whether deferred tax assets should be recognized in the consolidated statement of financial position. Deferred tax assets, including those resulting from unused tax losses, require Management to assess the likelihood that the Company would generate taxable earnings in future periods to apply the deferred tax assets. Estimated future taxable income is based on projections of cash flows from operations and application of the tax law existing in each jurisdiction. To the extent to which future cash flows and taxable income differ significantly from those estimated; they could have an impact on the Company’s capability to realize the deferred tax assets posted as of the reporting date.
Additionally, future changes in tax law in the jurisdictions in which the Company operates could limit the Company’s ability to obtain tax deductions in future periods.
| (k) | Inventories - (note 8) - |
Inventories are classified in short and long-term according to the period of time in which Management estimates will begin the production stage of concentrate extracted of each mining unit.
Net realizable value tests are performed at least annually and represent the estimated future sales price of the product based on prevailing spot metals prices at the reporting date, less estimated costs to complete production and bring the product to sale. Additionally, in calculating the net realizable value of the Company’s long-term inventories, Management also considers the time value of money.
Notes to the consolidated financial statements (continued)
Classified mineral inventories –
Classified mineral contain lower grade ore than the average of the mineral treated, which have been removed from the pit of Colquijirca mining unit, and that are available to continue in the process of recovery of mineral and concentrates.
Because it is generally impracticable to determine the mineral contained in the classified mineral located in the deposit field near to the Tajo Norte by physical count, reasonable estimation method are employed. The quantity of mineral delivered to classified mineral is based on surveyed volumes of mined material and daily production records. Sampling and assaying of blasthole cuttings determine the estimated copper, lead and zinc grades of material delivered to classified mineral.
Mineral outside leach platforms inventories –
Finished and in-progress goods are measured by estimating the number of tonnes added and removed. The number of contained gold ounces is based on assay data, and the estimated recovery percentage is based on the expected processing method. Tonnages and ounces of mineral are verified by periodic surveys.
Mineral inside leach platforms inventories –
Because it is generally impracticable to determine the mineral contained in leach platforms by physical count, reasonable estimation method are employed. The quantity of material delivered to leach platforms based on surveyed volumes of mined material and daily production records. Sampling and assaying of blasthole cuttings determine the estimated ore grades of material delivered to leach platforms.
Recovery rates determination –
Expected ore recovery rates for leach platforms are determined by metallurgical sampling. The recoverability of ore in leach platforms, once entered into the production process, can be produced into mineral and concentrate almost immediately.
Estimated ore recovery rates are determined using laboratory tests, historical trends and other factors. Ultimate recovery of ore contained in leach platforms can vary significantly depending on several variables, including type of ore recovery, mineralogy and the size of the rocks. Processes and recovery rates are monitored continuously, and recovery rates are adjusted periodically as additional information becomes available and as related technology changes.
Notes to the consolidated financial statements (continued)
| (l) | Deferred stripping costs - (note 10) - |
The costs of waste removal or overburden to access the ore body (waste removal) in an open pit drilling, incurred by the Company before the operation of the mining project begins are capitalized as deferred stripping cost and are included in ¨Mining rights, development costs and property, plant and equipment, net¨ caption in the consolidated statement of financial position. Such costs will be amortized since the project is completed, using units of production method based on proven and probable reserves.
The stripping costs incurred during the production phase of its operations are recognized as an operating expense when they are incurred. These costs of production are included as part of the cost of the inventories extracted during the period in which the stripping cost was incurred.
| 2.3. | Changes in accounting policies and disclosures - |
Certain standards and amendments applied for the first time in 2015; however, they did not have material impact on the annual consolidated financial statements of the Group and therefore, have not been disclosed.The Group has not early adopted any other standard, interpretation or amendment that has been issued but is not yet effective.
| 2.4. | Summary of significant accounting principles and policies – |
| (a) | Foreign currency translation currencies- |
Functional and presentation currency
FinancialThe consolidated financial statements are presented in U.S. dollars, which is also the Company’sGroup’s functional and presentation currency.
For each entity, the Group determines the functional currency and the items included in the financial statements of each entity are measured using that functional currency.
Transactions and balances in foreign currency
Transactions in foreign currency (any(a currency different fromother than the functional currency) are initially recorded by the Group at the functional currency rate in forceexchange rates prevailing at the datedates of the transaction. The exchange rates issuedtransactions, published by the Superintendencia de Banca y Seguros y AFP (SBS) are usedSuperintendence of Banking and Insurance and Pension Fund Administrators (AFP for its acronym in translating foreign currency. Spanish).
Monetary assets and liabilities denominated in foreign currencies are translated at the functional currency ratespot rates of exchange ruling at the consolidated statement of financial position. Exchangereporting date. Gains or losses from exchange differences resultingarising from the settlement of the transactions in foreign currencies and from theor translation of the monetary assets and liabilities at the exchange rates at year-end are recognized in the consolidated income statement.statements of profit or loss.
Non-monetary items that are measuredassets and liabilities recognized in terms of historical cost in a foreign currency are translated using the exchange rates as ofprevailing at the dates of the initial transactions.
Notes to the consolidated financial statements (continued)
| (b) | Financial instruments - |
Initial recognition and measurement
A financial instrument is any contract that gives rise to a financial asset of one entity and a financial liability or equity instrument of another entity.
Initial recognition and measurement
Financial assets within the scope of IAS 39 are classified, as:at initial recognition, as financial assets at fair value through profit or loss, loans and receivables, held-to-maturity investments, available-for-sale financial assets, or as derivatives designated as hedging instruments. Wheninstruments in an effective hedge, as appropriate. All financial assets are recognized initially they are measured at fair value directly attributable transaction costs, exceptplus, in the case of financial assets not recorded at fair value through profit or loss, which does not include transaction costs. The Company determinescosts that are attributable to the classificationacquisition of itsthe financial asset.
Notes to the consolidated financial statements(continued)
Subsequent measurement -
For purposes of subsequent measurement, financial assets after initial recognition and, where allowed and appropriate, re-evaluates this designation at each financial year end.are classified in four categories:
Purchases or sales of financial assets that require delivery of assets within a time frame established by regulation or convention in the marketplace (conventional transactions) are recognized on the date of the transaction, that is to say, on the date on which the Company commits to sell the asset.
The Company’s financial assets include cash and cash equivalents, financial assets at fair value through profit or loss, trade accounts receivable, embedded derivatives for purchase and sale of concentrates, other accounts receivable, and account receivable from associate.
Subsequent measurement -
The subsequentmeasurement of financial assets depends on their classification, as detailed below:
| - | Financial assets at fair value through profit or loss; |
| - | Held-to-maturity investments; |
| - | Available-for-sale financial investments. |
Financial assets at fair value through profit or loss -
Financial assets at fair value through profit or loss includesinclude financial assets held for trading and financial assets designated upon initial recognition as at fair value through profit or loss. Derivatives are also classified as held for trading unless they are designated as effective hedging instruments. Assets within this category are classified as current assets if they are held for trading or it is expected to realize them within the next twelve months counted as from the consolidated statement of financial position date. Gain or losses on investments held for trading are recognized in profit and loss. The Company has classified as financial assets at fair value through profit or loss its mutual funds of variable income, see note 5.
The Company evaluates its financial assets held for trading, other than derivatives, to determine whether the intention to sell them in the near term is still appropriate. The reclassification to loans and receivables, available-for-sale or held to maturity depends on the nature of the asset. This evaluation does not affect any financial assets designated at fair value through profit or loss using the fair value option at designation.
Notes to the consolidated financial statements (continued)
Any embedded derivatives contained in commercial contracts are recorded as separated derivatives and posted at their fair value if the directly associated economic features and risks are not related to the commercial contract and the contract has not been classified as a negotiable financial asset or at fair value with a charge to results. Any gains or losses from changes in the fair value of embedded derivatives are posted in the consolidated income statement.
Loans and receivables -
The Company has the following accounts: cash and cash equivalents, trade accounts receivable, accounts receivable from associates and other accounts receivable, in this category; they are stated at the transaction value, net of an allowance for doubtful accounts when applicable.
All such instruments are non-derivative financial assets with fixed or determinable payments that are not quoted in an active market. After initial measurement loans and receivables are subsequently carried at amortized cost using the effective interest method less any provision for impairment.
The Company assesses whetheras of the date of its consolidated financial statements, there is objective evidence of an impairment in the value of financial assets (such as the debtor’s probability of insolvency, significant financial difficulties, failure to pay principal or interest or any observable evidence indicating that the estimated future flows associated with the loans or accounts receivable have decreased). The amount of the impairment is measured as the difference between the book value of the assets and the present value of the estimated future cash flows, discounted at the original effective interest rate if it’s a fixed rate or one applicable for similar transactions if it’s a variable rate. The carrying amount of the receivable is reduced by means of an allowance account. The amount of the loss must be recognized in the consolidated income statement. Impaired accounts receivable or loans are written off when they are considered uncollectible.
If the amount of the loss should decrease in a subsequent period, the Company reverses it with a credit entry to the consolidated income statement.
Held-to-maturity investments -
Held-to-maturity investments are non-derivative financial assets with fixed or determinable payments and fixed maturities that the Company’s Management has the positive intention and ability to hold to maturity. After initial recognition the Company measures their held-to-maturity investments at amortized cost using the effective interest method. Gains and losses are recognized in the consolidated income statement when the investment is disposed, had impairment or through amortization. The Company did not maintain any held-to-maturity investment as of December 31, 2012 and 2011.
Notes to the consolidated financial statements (continued)
Available-for-sale financial investments -
Available-for-sale financial assets are those non-derivative financial assets that are designated as available-for-sale or are not classified in any of the other categories. After initial measurement, available for sale financial assets are measured at fair value with unrealized gains or losses being recognized directly in equity. When the investment is disposed of, the cumulative gain or loss previously recorded in equity is recognized in the consolidated income statement. The Company did not maintain any significant available-for-sale financial investment as of December 31, 2012 and 2011.
Derecognition of financial assets -
A financial asset is derecognized when:
| - | The rights to receive cash flows from such asset have expired. |
| - | The Company has transferred its rights to receive cash flows from the asset or has assumed an obligation to pay the received cash flows to a third party under a pass-through arrangement; and |
| (i) | The Company has transferred substantially all of the risks and rewards of the asset or; |
| (ii) | Not having transferred or retained substantially all of the risks and rewards of the asset, it has transferred its control. |
In the event that the Company transfers its rights to receive cash flows from an asset or has entered into a pass-through arrangement, but has not transferred substantially all the risks and rewards and still maintains control over of the asset, it must recognize the liabilities associated. Assets transferred and the liabilities associated are measured on a basis that reflects the rights and obligations that the Company has retained.
Impairment of financial assets -
The Company assesses at each reporting date whether there is any objective evidence that a financial asset or a group of financial assets is impaired.
A financial asset or a group of financial assets is deemed to be impaired if, and only if, there is objective evidence of impairment as a result of one or more events that has occurred after the initial recognition of the asset (an incurred ‘loss event’) and if loss event has an impact on the estimated future cash flows of the financial asset or the group of financial assets that can be reliably estimated. Evidence of impairment may include indications that the debtors or a group of debtors are experiencing significant financial difficulty, default or delinquency in interest or principal payments, the probability that they will enter bankruptcy or other financial reorganization and where observable data indicate that there is a measurable decrease in the estimated future cash flows, such as changes in arrears or economic conditions that correlate with unpaid counts.
Notes to the consolidated financial statements (continued)
Offsetting of financial instruments -
Financial assets and liabilities are offset and the net amount reported in the consolidated statement of financial position, if (i) there is a currently enforceable legal right to offset the recognized amounts and (ii) there is an intention to settle on a net basis, or to realize the assets and settle the liability simultaneously.
Fair value of financial instruments -
The fair value of financial instruments that are traded in active markets is determined on each reporting date by reference to quoted market prices or dealer price quotations (bid price for long positions and ask price for short positions), without any deduction for transaction costs.
In the case of financial instruments that are not traded in an active market, fair value is determined using appropriate valuation techniques. Such techniques may include using recent arm´s length market transactions; reference to the current fair value of another instrument that is substantially same, an analysis of the adjusted flow of funds or other valuation models.
An analysis of fair values of financial instruments and further details as to how they are measured are provided in note 29.
| (c) | Cash and cash equivalents- |
The “Cash and cash equivalents” caption presented in the Company’s consolidated statement of financial position includes all cash on hand and deposited in banks, including time deposits whose maturities are three months or more.
Furthermore, this caption presented in the Company’s consolidated statements of cash flows includes cash on hand, time deposits and highly liquid investments with original maturities of three months or less.
| (d) | Business combinations and goodwill - |
Business combinations are accounted for using the acquisition method. The cost of an acquisition is measured as the aggregate of the consideration transferred, measured at acquisition date fair value and the amount of any non-controlling interest in the acquiree. For each business combination, the Company elects whether it measures the non-controlling interest in the acquiree either at fair value or at the proportionate share of the acquiree’s identifiable net assets. Acquisition costs incurred are expensed and included in “Administrative expenses” caption.
Notes to the consolidated financial statements (continued)
When the Company acquires a business, it assesses the financial assets and liabilities assumed for appropriate classification and designation in accordance with the contractual terms, economic circumstances and pertinent conditions as at the acquisition date. This includes the separation of embedded derivatives in host contracts by the acquiree.
If the business combination is achieved in stages, the acquisition date fair value of the acquirer’s previously held equity interest in the acquiree is remeasured to fair value at the acquisition date through profit or loss.
Any contingent consideration to be transferred by the acquirer will be recognized at fair value at the acquisition date. Subsequent changes in the fair value of the contingent consideration which is deemed to be an asset or liability will be recognized in accordance with IAS 39 either in profit or loss or as a change to other comprehensive income. If the contingent consideration is classified as equity, it will not be remeasured. Subsequent settlement is accounted for within equity. In instances where the contingent consideration does not fall within the scope of IAS 39, it is measured in accordance with the appropriate IFRS.
Difference between price and the carrying amount is initially measured at cost, being the excess of the aggregate of the consideration transferred and the amount recognized for non-controlling interest over the fair value of the identifiable net assets acquired and liabilities assumed. If the fair value of the identifiable net assets acquired is in excess of the aggregate consideration transferred, the gain is recognized in profit or loss.
After initial recognition, difference between price and the carrying amount is measured at cost less any accumulated impairment losses. For the purpose of impairment testing, this difference is allocate to each of the Company’s cash-generating units that are expected to benefit from the combination, irrespective of whether other assets or liabilities of the acquiree are assigned to those units.
Where this difference forms part of a cash-generating unit and part of the operation within that unit is disposed of, the difference associated with the operation disposed of is included in the carrying amount of the operation when determining the gain or loss on disposal of the operation. Difference disposed of in this circumstance is measured based on the relative values of the operation disposed of and the portion of the cash-generating unit retained.
Notes to the consolidated financial statements (continued)
| (e) | Investments in associates - |
Investments in entities in which the Company’s ownership is greater than 20 percent or exercise significant influence are accounted for using the equity method. Under this method, the investment in the associateis carried in the consolidated statement of financial position at cost plus acquisition changes in the Company’s share of net assets of the associate. The amount paid in excess of the fair value of the share of net assets of the associate is included in the carrying amount of the investment and is neither amortized nor individually tested for impairment.
The consolidated income statement reflects the share of the results of operations of the associate. When there has been a change recognized directly in the equity of the associate, the Company recognizes its share of any changes and discloses this, when applicable, in the consolidated statements of changes in shareholders´ equity. Unrealized gains and losses resulting from transactions between the Company and the associate are eliminated to the extent of the interest in the associate.
The reporting dates of the associates and the Company are identical and the associates’ accounting policies are consistent with those used by the Company for like transactions and events in similar circumstances. The functional and presentation currency of the associates Yanacocha (through its subsidiary, Compañía Minera Condesa S.A.) and Cerro Verde is the U.S. dollar.
After the application of the equity method, the Company determines whether it is necessary to recognize an additional impairment loss of the Company’s investment in associates. The Company determines at each consolidated statement of financial position date whether there is any objective evidence that the investment in associate is impaired. If this is the case, the Company calculates the amount of impairment as being the difference between the fair value of the associate and the acquisition cost and recognizes the amount in the consolidated income statement.
Upon loss of significant influence over the associate, the Company measures and recognizes any retaining investment at its fair value. Any difference between the carrying amount of the associate upon loss of significant influence and the fair value of the retaining investment and proceeds from disposal is recognized in the consolidated income statement.
Notes to the consolidated financial statements (continued)
Finished goods and products in process are valued at the lower of average cost or net realizable value. Net realizable value is defined as the estimated future sales price obtainable in the ordinary course of business, less estimated costs to complete production and bring the product to sale.
Cost is determined by using the weighted-average method and comprises direct purchase costs and an appropriate portion of fixed and variable overhead costs, including depreciation and amortization, incurred in converting materials into finished goods.
The accrual for obsolescence for spare parts and supplies are based on an item-by-item analysis completed by the Company’s Management and related amounts are charged to expense in the period in which the obsolescence is deemed to have occurred.
Products in process -
Products in process represent mineral that are currently accumulated to be treated in the production of concentrate and mineral content of gold and silver deposited in the leach platforms, whose recovery is accomplished through exposure to sulfuric acid (leaching). Conversion processes for mining operations vary depending on the nature of the mineral and the specific mining operation.
Products in process material is measured based on assays of gold and silver in the minerals deposited in the platforms and daily production records.
Classified mineral
Low grade ore are placed in stockpiles to be processed in midterm until the project to expand El Brocal´s operations will be concluded (see note 1(e)). In this sense, low grade ore that is stockpiled with the expectation that is will be processed in the future is accounted for in the same way as minerals and concentrates.
According to the mine planning, classified mineral will be treated on the next three years. As consequence, the ore is accounted for as non-current inventory and measured at the lower of cost and net realizable value. Annually, the Company’s Management assess the net realizable value of its non-current inventory based on the cash-flow projections obtained by the production and sales of the low grade ore stockpiled considering to: (i) the forward copper price at the year that to be expected to process the low grade ore, (ii) the future costs of processing (considering inflation rates, technological changes and other significant aspects would change), and (iii) the discount rate.
Notes to the consolidated financial statements (continued)
| (g) | Property, plant and equipment - |
The property, plant and equipment, is stated at cost, net of accumulated depreciation and accumulated impairment in value. The initial cost of an asset comprises its purchase price or construction cost, including customs duties and non-reimbursable taxes, as well as any expense necessary to put such asset into operation, the initial estimates of any rehabilitation obligation and, in the case of qualifying assets, the cost of debt and any expense directly attributable to bringing the asset into operation. The capitalized value of leasing is included in this caption.
Depreciation -
Unit-of-production method
Depreciation and amortization of assets whose useful life is higher than the life of mine, is calculated base on a unit-of-production basis over the economically recoverable reserves of the mine, except in the case of assets whose useful life is shorter, in which case the straight-line method is applied.
The units of production are measured in recoverable metric tons of concentrate. The unit-of-production rate for the depreciation and amortization takes into account expenditures incurred to date.
Straight-line method
Depreciation of assets whose useful life is less than the mining unit life is calculated under the straight-line method of accounting considering the lower of estimated useful lives of the asset or useful life of the mining unit. The useful lives are the following:
| | Years |
| | |
Buildings, construction and other | | Between 6 and 20 |
Machinery and equipment | | Between 5 and 10 |
Transportation units | | 5 |
Furniture and fixtures | | 10 |
Computer equipment | | 4 |
An item of property, plant and equipment is derecognized upon disposal or when no future economic benefits are expected from its use or disposal. Any gain or loss arising from derecognizing an asset (calculated as the difference between the proceeds from the sale and the book value of the asset) is included in the consolidated income statement in the year the asset is derecognized.
The asset’s residual value, useful lives and methods of depreciation are reviewed, and adjusted if appropriate, at each financial year end.
Notes to the consolidated financial statements (continued)
Major maintenance and repairs -
Expenses on major maintenance refits or repairs comprise the cost of replacement assets or parts of assets and overhaul costs. The expense is capitalized when an asset or part of an asset that was depreciated separately is replaced and eliminated from the books and it is probable that the future economic benefits associated with such asset or part of an asset will flow to the Company during an additional period of useful life.
When the replaced part of the assets was not considered separately as a component, replacement value is used in order to estimate the book value of the assets replaced, which is immediately written off.
| (h) | Mining rights and concessions - |
Mining rights are presented as part of the “Mining rights, development costs, property, plant and equipment, net” correspond to the mineral reserves and acquisitions of mining concessions allocated as part of the cost of non controlling interest acquisition that took place before transition date to IFRS. Mining rights are capitalized in the consolidated statement of financial position, and represent the Company’s ownership of mining properties that contain the mineral reserves acquired.
Mining concessions are depreciated starting from the production phase following the units-of-production method based on proven and probable reserves. In the event that the Company abandons these concessions, the costs associated are written off in the consolidated income statement.
At the end of each year, the Company assesses each mining unit to see whether there is any indication of that the value of its mining rights has been impaired. If such indication exists, the Company estimates the recoverable amount of the assets. See note 2.2(f).
| (i) | Exploration and mine development costs - |
Exploration costs are charged to expense as incurred. These costs primarily include costs for material and fuels used in exploration, costs of topographical surveys, drilling costs and payments made to contractors. When the Company determines that a mineral property can be economically developed by establishing the existence of proved and probable reserves, the costs incurred to develop the property, including the costs incurred to further delineate the ore body and remove topsoil, rocks and other mineral waste to initially expose the ore body are capitalized. Mine development costs are amortized using the units-of-production method, based on proven and probable reserves.
Development costs at the production phase are charged to expense as incurred.
Notes to the consolidated financial statements (continued)
| (j) | Deferred stripping costs - |
Stripping costs incurred in the development of a mine before production commences are capitalized as part of the cost of constructing the mine and subsequently amortized over the life of the mine on a units-of-production basis.
Where a mine operates several open pits that are regarded as separate operations for the purpose of mine planning, stripping costs are accounted for separately by reference to the ore from each separate pit. If, however, the pits are highly integrated for the purpose of the mine planning, the second and subsequent pits are regarded as extensions of the first pit in accounting for stripping costs. In such cases, the initial stripping, (i.e. overburden and other waste removal) of the second and subsequent pits is considered to be production phase stripping relating to the combined operation.
Deferred stripping cost is included in “Mining rights, development costs, property, plant and equipment, net” caption in the consolidated statement of financial position. These form part of the total investment in the relevant cash generating units, which are reviewed for impairment if events or changes of circumstances indicate that the carrying value may not be recoverable.
| (k) | Financial liabilities - |
Initial recognition and measurement -
Financial liabilities within the scope of IAS 39 are classified as: financial liabilities at fair value through profit or loss, loans or as derivatives designated as hedging instruments, as relevant.
The Company determines the classification of its financial liabilities at initial recognition. All financial liabilities are recognized initially at fair value, plus directly attributable transaction costs, except in the case of loans, which are recognized initially at the fair value of the cash received, less any costs directly attributable to the transaction.
The Company’s financial liabilities include trade accounts payable, other liabilities, derivative financial instruments, financial obligation and embedded derivative for purchase and sale of concentrates.
Subsequent measurement -
The subsequentmeasurement of financial liabilities depends on their classification, as detailed below:
Notes to the consolidated financial statements (continued)
Financial liabilities at fair value through profit or loss -
Financial liabilities at fair value through profit or loss include financial liabilities held for trading and financial liabilities designated upon initial recognition as at fair value through profit or loss. Financial liabilitiesassets are classified as held for trading if they are acquired for the purpose of selling or repurchasing in the near term. This category includes derivative financial instruments entered into by the Company that are not designated as hedging instruments as defined in IAS 39. SeparatedDerivatives, including separated embedded derivatives, are also classified as held for trading unless they are designated as cash-floweffective hedging instruments. Any gains or losses on liabilities held for trading are recognized in the consolidated income statement. Except for the embedded derivative for sales of concentrates, the Company has not designated any financial liabilityinstruments as defined by IAS 39.
Financial assets at fair value through profit or loss.
Interest-bearing loans and borrowing -
After their initial recognition, interest-bearing loans and borrowingsloss are subsequently measured at amortized cost using the effective interest rate (EIR) method. Any profit or loss is recognized in the consolidated income statement when the liability is terminated, as well as through the process of amortizing the effective interest rate. Amortized costs are calculated taking into account any discount or premium on acquisition and fees or costs that are an integral part of the effective interest rate. Amortization of the effective interest rate is included in financial cost in the consolidated income statement.
Derecognition of financial liabilities -
A financial liability is derecognized when the obligation under the liability is discharged or cancelled or expired. When an existing financial liability is replaced by another one from the same lender on substantially different terms, or the terms are substantially modified, such replacement or amendment is treated as a derecognitionof the original liability and the recognition of a new liability, and the difference in the respective carrying amount is recognized in the consolidated income statement.
The determination of whether an arrangement is, or contains, a lease is based on the substance of the agreement on its inception date. It requires consideration as to whether the fulfillment of the arrangement is dependent on the use of a specific asset or assets or the arrangement conveys a right to use the asset. A reassessment is made after inception of the lease if one of the following applies:
| (i) | There is a change in the contractual terms, other than a renewal or extension of the arrangement. |
| (ii) | A renewal option is exercised or extension granted, unless the term of the renewal or extension was initially included in the lease term. |
| (iii) | There is a change in the determination of whether fulfillment is dependent on a specific asset; or |
Notes to the consolidated financial statements (continued)
| (iv) | There is a substantial change to the asset. |
Where a reassessment is made, lease accounting shall commence or cease starting from the date when the change of circumstances gives rise to reassessment for scenarios (i), (iii) or (iv), and at the date of the renewal or extension period for scenario (ii).
Embedded leases
All take-or-pay contracts are reviewed for indicators of a lease on inception.
| (m) | Share-based payments - |
Senior executives of the Company are granted share appreciation rights, which can only be settled in cash. The liability for these transactions is measured at each reporting date until settlement.
According to IFRS 2 “Share-Based Payments”, the cost of cash-settled transactions is measured initially at fair value at the grant date using a binomial model (see more details in note 14(c)). This fair value is expensed over the period until vesting with recognition of a corresponding liability. The liability is re-measured at each consolidated statement of financial position date up to and including the settlement date with changes in fair value recognized in the consolidated income statement.
General -
Provisions are recognized when the Company has a present obligation (legal or constructive) as a result of a past event, it is probable that an outflow of resources embodying economic benefits will be required to settle the obligation and a reliable estimate can be made of the amount of the obligation. Provisions are reviewed periodically and are adjusted to reflect the best estimate available as of the date of the consolidated statement of financial position. The expense relating to any provision is presented in the consolidated income statement. When they are significant, provisions are discounted using a current rate that reflects, where appropriate, the risks specific to the liability. When discounting is used, the increase in the provision due to the passage of time is recognized as a financial expense.
Loss contingencies are recorded in the consolidated financial statements when it is probable their occurrence and they can be reasonably estimated. In other case, they are only disclosed in notes to the consolidated financial statements.
Notes to the consolidated financial statements (continued)
Contingent assets are not recognized in the consolidated financial statements; however, they are disclosed in notes to the consolidated financial statements if it is probable that such contingent assets will be realized.
Provision for closure of mining units -
On initially entering the liability for this obligation, it is posted at its fair value, offset by a greater a book value for long-lived assets related to development costs and fixed assets.
The liability is subsequently increased in each period to reflect the cost of interest considered in the initial estimate of fair value and, in addition, the capitalized cost is depreciated or amortized based on the useful life of the related asset. When eliminating the liability, the Company posts any resulting gain or loss. Changes in the fair value of the obligation or the useful life of the related asset that arise from review of the initial estimates are recognized as an increase or decrease in the book value of the obligation and the related assets in accordance with IAS 16 “Property, Plant and Equipment”. Any reduction in a mine closure liability and, therefore, any reduction of the related asset, may not exceed the book value of such asset. If so, any excess over book value is immediately transferred to the consolidated income statement.
If a change in estimate results in an increase in the closure liability and, therefore, an addition to the asset’s book value, the Company must consider whether or not this is an indication of impairment of the asset as a whole, and conduct impairment testing pursuant to IAS 36 “Impairment of assets”. Furthermore, in the case of mature mines, if the revised mining assets net of the closure provisions exceed the recoverable value, such portion of the increase is charged directly to expense. In the case of mines already closed, changes in estimated costs are recognized immediately in the consolidated income statement. Likewise, any closure liability that arises as a result of a mine’s production phase must be included in expenses when incurred.
The Company, through a subsidiary, has treasury shares (common and investment shares). The nominal values of these shares are presented net of the capital stock and investment shares amounts.
The effect of the dividends income arising from the treasury shares held by the subsidiary are excluded for calculating the share in subsidiary and associates income and are presented net from declared a paid dividendscarried in the consolidated statements of financial position at fair value with net changes in shareholders´ equity.
Notes to the consolidated financial statements (continued)
Revenue is recognized to the extent that it is probable that the economic benefits will flow to the Company. Revenue is measured at the fair value of the consideration received, excluding discounts. The following specific recognition criteria must also be met beforepresented as finance costs (negative changes) or finance revenue is recognized:
Sales of concentrates, gold and silver -
Revenues from sales of concentrates, gold and silver are recognized when the significant risks and rewards of ownership are transferred to the buyer, and selling price are known or can be reasonably estimated.
As far as the measurement of revenues from the sale of concentrate, the Company assigns a provisional value to these sales, since they are subject to a final price adjustment at the end of a contractually-set period, which normally ranges between 30 and 180 days after delivery of the concentrate to the customer. Exposure to changes in metals price is considered to contain an embedded derivative which is required to be separated from the host commercial contract for accounting purposes. At the close of each period, the sale price used initially is adjusted in accordance with the future price for the quotation period stipulated in the contract. Adjustment of the provisional sale value is posted as an increase or decrease in net sales.
Interest received -
Financial income is recognized as interest accrues.
Income for engineering service rendered -
Income for engineering service rendered by Buenaventura Ingenieros S.A., a subsidiary of the Company, is recognized based on the progress of the current service contracts.
Income for construction services –
When the outcome of a contract can be estimated reliably, contract revenue associated with the construction contract shall be recognized by reference to the stage of completion of the contract activity at the end of the reporting period.
Notes to the consolidated financial statements (continued)
Borrowing costs directly relating to the acquisition, construction or production of a qualifying asset are capitalized, and added to the project’s cost until such time as the assets are considered substantially ready for their planned use, that is to say, when they are capable of generating commercial production. A qualifying asset is which value is higher than US$5 million and its substantial period is greater than 12 months. Where funds are borrowed specifically to finance a project, the amount capitalized represents the actual borrowing costs incurred. Where surplus funds are available for a short term out of money borrowed specifically to finance a project, the income generated from the temporary investment of such amounts is also capitalized and deducted from the total capitalized borrowing cost. Where the funds used to finance a project form part of general borrowings, the amount capitalized is calculated using a weighted average of rates applicable to relevant general borrowings of the Company during the period. All other borrowing costs are recognized(positive changes) in the consolidated income statement in the period in which they are incurred.
Current taxes –
Income tax
Income Tax for the current period are measured based on the separate financial statements of Buenaventura and each subsidiary in Nuevos Soles and for the amount expected to be paid to the tax authorities. The rates and laws used to compute the amount are those in force as of the date of the consolidated statement of financial position.
Current income tax relating to items recognized directly in other comprehensive income or equity is recognized in other comprehensive income or equity and not in the consolidated income statement. Management periodically evaluates positions taken in the tax returns with respect to situations in which applicable tax regulations are subject to interpretation and establishes provisions where appropriate.
Mining Royalties and Special Mining Tax
Mining Royalties and Special Mining Tax are accounted for under IAS 12 “Income tax” when they have the characteristics of an income tax. This is considered to be the case when they are imposed under government authority and the amount payable is based on revenues less expenses after adjustments for temporary differences, rather than based on quantity produced or as a percentage of revenue. Tax rates and tax laws used to compute the amount are those that have been enacted by the end of the reporting period as of the date of the consolidated statement of financial position.
| | Therefore, payments made by the Company to government authority as Mining Royalties and Special Mining Tax are in the scope of IAS 12 and be considered as income tax. Both, Mining Royalties and Special Mining Tax generated deferred assets and liabilities which should be measured using average rates that have to be applied to operating income in those quarters in which the Company expects to reverse the temporary differences. |
Notes to the consolidated financial statements (continued)
Deferred tax
The income tax, mining royalties and special mining tax for future periods are recognized using the liability method, considering the temporary differences between the taxes and accounting bases of assets and liabilities as of the date of the consolidated statement of financial position.
Deferred income tax liabilities are recognized for all taxable temporary differences, except for taxable temporary differences associated with investments in subsidiaries and associates where the timing of the reversal of the temporary differences can be controlled and it is probable that the temporary differences will reverse in the foreseeable future.
All deductible temporary differences and loss carryforwards generate the recognition of deferred assets to the extent that it is probable that they can be used in calculating taxable income in future years. Deferred income tax liabilities are recognized for all deductible temporary differences and tax loss carry-forwards, to the extent that is probable that taxable profit will be available against which the deductible temporary differences and unused tax losses can be utilized.
The carrying amount of the deferred income tax assets is reviewed at each consolidated statement of financial position date and reduced to the extent that it is no longer probable that sufficient taxable profit will be available to allow all or part of the deferred asset to be utilized. Unrecognized deferred assets are reassessed at each consolidated statement of financial position date.
Deferred tax relating to items recognized outside profit or loss is recognized outside profit and loss. Deferred tax items are recognized in correlation to the underlying transaction either in other comprehensive income or directly in equity.
Deferred assets and liabilities are offset if there is a legal right to set them off and the taxes deferred relate to the same entity and the same tax authority.
| (s) | Derivative financial instruments - |
Embedded derivative
Derivatives embedded in host contracts are accounted for as separate derivatives and recorded at fair value if their economic characteristics and risks are not closely related to those of the host contracts and the host contracts are not held for trading or designated at fair value though profit or loss. These embedded derivatives are measured at fair value, with changes in fair value recognized in profit or loss.
Loans and receivables -
Loans and receivables are non-derivative financial assets with fixed or determinable payments that are not quoted in an active market. After initial measurement, such financial assets are subsequently measured at amortized cost using the effective interest rate method, less impairment. The losses arising from impairment are recognized in the consolidated statements of profit or loss.
This category generally applies to trade and other receivables, net.
Held-to-maturity investments -
Non-derivative financial assets with fixed or determinable payments and fixed maturities are classified as held to maturity when the Group has the positive intention and ability to hold them to maturity. The Group did not have any held-to-maturity investment as of December 31, 2015 and 2014.
Available-for-sale financial assets -
The available-for-sale financial assets include equity investments and debt securities. Equity investments classified as available for sale are those that are neither classified as held for trading nor designated at fair value through profit or loss. Debt securities in this category are those that are intended to be held for an indefinite period of time and may be sold in response to needs for liquidity or in response to changes in the market conditions. The Group did not have these financial assets as of December 31, 2015 and 2014.
Notes to the consolidated financial statements(continued)
Derecognition -
A financial asset (or, where applicable a part of a financial asset or part of a group of similar financial assets) is primarily derecognized when:
| - | The rights to receive cash flows from the asset have expired; |
| - | The Group has transferred its rights to receive cash flows from the asset or has assumed an obligation to pay the received cash flows in full without material delay to a third party under a pass-through arrangement; and either (a) the Group has transferred substantially all the risks and rewards of the asset or, (b) the Group has neither transferred nor retained substantially all the risks and rewards of the asset, but has transferred control of the asset. |
When the Group has transferred its rights to receive cash flows from an asset or has entered into a pass-through arrangement, it evaluates if and to what extent, it has retained the risk and rewards of ownership. When it has neither transferred nor retained substantially all of the risks and rewards of the asset, nor transferred control of the asset, the Group continues to recognize the transferred asset to the extent of the Group´s continuing involvement. In that case, the Group also recognizes an associated liability. The transferred asset and the associated liability are measured on a basis that reflects the rights and obligations that the Group has retained.
Impairment of financial assets -
The Group assesses, at each reporting date, whether there is objective evidence that a financial asset or group of financial assets is impaired. An impairment exists if one or more events that has occurred since the initial recognition of the asset (an incurred "loss event"), has an impact on the estimated future cash flows of the financial asset or the group of financial assets that can be reliably estimated.
Evidence of impairment may include indications that the debtors or a group of debtors is experiencing significant financial difficulty, default or delinquency in interest or principal payments, the probability that they will enter bankruptcy or other financial reorganization and observable data indicating that there is a measurable decrease in the estimated future cash flows, such as changes in economic conditions that correlate with defaults.
For financial assets carried at amortized cost, the Group first assesses whether impairment exists for financial assets that are individually significant, or collectively for financial assets that are individually insignificant.
The amount of any impairment loss in the impairment identified is measured as the difference between the asset’s carrying amount and the present value of estimated future cash flows. The present value of the estimated future cash flows is discount at the financial asset’s original effective interest rate.
The carrying amount of the asset is reduced through the use of an allowance account and the loss is recognized in the consolidated statements of profit or loss. Interest income (recorded as revenue in the statements of profit or loss) continues to be accrued on the reduced carrying amount and is accrued using the interest rate used to discount the future cash flows for the purpose of measuring the impairment loss. Loans together with the associated allowance are written off when there is no realistic prospect of a future recovery and all collateral has been realized or has been transferred to the Group. If, in a subsequent year, the amount of the estimated impairment loss increases or decreases because of an event occurring after the impairment was recognized, the previously recognized impairment loss is increased or reduced by adjusting the allowance account. If a write-off is later recovered, the recovery is credited to finance costs in the consolidated statements of profit or loss.
Notes to the consolidated financial statements(continued)
| (ii) | Financial liabilities – |
Initial recognition and measurementDerivatives-
Financial liabilities are classified, at initial recognition, as financial liabilities at fair value through profit or loss, accounts payable, financial obligations, or as derivatives designated as hedging instruments -
El Brocal subsidiary uses derivative instruments to manage its exposure to changes in metals prices. In order to manage special risks, El Brocal appliesan effective hedge, accounting for those transactions that meet the specific criteria applicable.
At the inception date of the hedge relation, El Brocal formally documents the relationship between the item hedged and the hedging instrument, including the nature of the risk, the objective and the strategy to be taken to carry out the hedging, and the method to be used to estimate the effectiveness of the hedge relation.
A formal assessment is made upon beginning the hedge relation, to assure that the hedging instrument is highly effective in offsetting the risk designated in the item hedged. Hedges are formally assessed every half. A hedge is considered as highly effective if it is expected that the changes in cash flow attributed to the risk hedged during the period for which the hedge is designated are offset within a range from 80 to 125 percent.appropriate.
All the hedges maintained by the Company classifies as cash flow hedges, as consequence, any gain or loss from the effective portion of the hedging instrument isfinancial liabilities are recognized initially recognizedat fair value and, in the consolidated statementcase of changes in shareholders’ equity in the “Other reservesinterest-bearing loans and borrowings and payables, net of equity” caption. Any gain or loss from the ineffective portion of the hedging instrument is initially recognized indirectly attributable transaction costs.
The Group’s financial liabilities include trade and other payables, financial obligations, derivatives financial instruments and embedded derivatives.
Notes to the consolidated income statement in the “Interest expenses” caption. Amounts recognizedfinancial statements(continued)
Subsequent measurement -
The measurement of financial liabilities depends on their classification, as equity transaction are transferred to the income statement when the hedge transaction affectsdescribed below:
Financial liabilities at fair value through profit or loss such-
Financial liabilities at fair value through profit or loss include financial liabilities held for trading and financial liabilities designated upon initial recognition as when a forecast sale occurs and is postedat fair value through profit or loss.
Financial liabilities are classified as held for trading if they are incurred for the purpose of repurchasing in the “Net sales” caption ofnear term. This category also includes derivative financial instruments entered into by the consolidated income statement.
As of December 31, 2011, El Brocal subsidiary had contracted derivative instruments on metals quotes under the Asian swap and collar option modes that qualify as cash-flow hedging instruments. As of December 31, 2012, El Brocal does not have hedging financial instruments.
Current versus non-current classification -
Derivative instrumentsGroup that are not designated as hedging instruments in hedge relationships as defined by IAS 39. Separated embedded derivatives are also classified as currentheld for trading unless they are designated as effective hedging instruments.
Gains or non-current,losses on liabilities held for trading are recognized in the consolidated statements of profit or loss.
Except for the embedded derivative for concentrate sales, the Group has not designated any financial liability in this category.
Loans and borrowings -
After initial recognition, interest-bearing loans and borrowing are separatedsubsequently measured at amortized cost using the effective interest rate method. Gains and losses are recognized in the consolidated statements of profit and cost when the liabilities are derecognized as well as through the amortization process.
Amortized cost is calculated taking into a currentaccount any discount or premium on acquisition and a non-current portion based onfees or costs that are an assessmentintegral part of the factseffective interest rate. Amortization under the effective interest rate method is included as financial costs in the consolidated statements of profit or loss.
Derecognition -
A financial liability is derecognized when the obligation under the liability is discharged or cancelled, or expires.
When an existing financial liability is replaced by another from the same lender on substantially different terms, or the terms of an existing liability are substantially modified, such an exchange or modification is treated as the derecognition of the original liability and circumstances (for example, the underlying cash flows).recognition of a new liability. The difference in the respective carrying amounts is recognized in the consolidated statements of profit or loss.
| (iii) | Offsetting of financial instruments - |
Financial assets and financial liabilities are offset and the net amount is reported in the consolidated statements of financial position if there is a currently enforceable legal right to offset the recognized amounts and there is an intention to settle on a net basis, to realize the assets and settle the liabilities simultaneously.
Notes to the consolidated financial statements(continued)
| (c) | Cash and cash equivalents - |
Cash and cash equivalents in the consolidated statements of financial position comprise cash at banks and on hand.
Embedded derivatives thatFor the purpose of the consolidated statements of cash flows, cash and cash equivalents consist of cash and short term deposits with a maturity of three months or less, which are subject to an insignificant risk of changes in value.
Materials and supplies are valued at the lower of cost or net realizable value.
Cost is determined using the average method. In the case of finished goods and work in progress, cost includes the cost of materials and direct labor and a portion of indirect manufacturing expenses, excluding borrowing costs.
The current portion of the inventories is determined based on the expect amounts to be processed within the next twelve months. Inventories not closely relatedexpected to be processed within the main contractnext twelve months are classified consistently with the cash flows of the host contract.as long-term.
Derivative instruments designated as hedging instruments are classifiedNet realizable value is the estimated selling price in accordance with the classificationordinary course of business, less estimated costs of completion and the underlying element hedged. The derivative instrument is separated into a current and a non-current portion only if a reliable allocation can be made.estimated costs to make the sale.
As of December 31, 2012,Provision (reversal) for losses on the Company has not have instruments that qualify as hedging. As of December 31, 2011,net realizable value are calculated based on a specific analysis conducted annually by the Company held those instruments (see note 27)Management and is charged to income in the period in which it determines the need for the provision (reversal).
| (t)(e) | Impairment of non financial instrumentsBusiness combinations and goodwill - |
Business combinations are accounted for using the acquisition method. The cost of an acquisition is measured as the aggregate of the consideration transferred measured at acquisition date fair value and the amount of any non-controlling interest in the acquiree. For each business combination, the Group elects whether to measure the non-controlling interests in the acquiree at fair value or at the proportionate share of the acquiree’s identifiable net assets. Acquisition-related costs are expensed as incurred and included in administrative expenses.
Notes to the consolidated financial statements(continued)
When the Group acquires a business, it assesses the financial assets and liabilities assumed for appropriate classification and designation in accordance with the contractual terms, economic circumstances and pertinent conditions as at the acquisition date. This includes the separation of embedded derivatives in host contracts by the acquiree.
If the business combination is achieved in stages, any previously held equity interest is re-measured at its acquisition date fair value and any resulting gain or loss is recognized in profit or loss.
Any contingent consideration to be transferred by the acquirer will be recognized at fair value at the acquisition date. Contingent consideration classified as an asset or liability that is a financial instrument and within the scope of IAS 39 Financial Instruments: Classification and Measurement, is measured at fair value, with changes in fair value recognized in either profit or loss or as a change to other comprehensive income. If the contingent consideration is not within the scope of IAS 39, it is measured in accordance with the appropriate IFRS. Contingent consideration that is classified as equity is not re-measured and subsequent settlement is accounted for within equity.
Goodwill is initially measured at cost, being the excess of the aggregate of the consideration transferred and the amount recognized for non-controlling interests, and any previous interests held, over the net identifiable assets acquired and liabilities assumed. If the fair value of the net assets acquired is in excess of the aggregate consideration transferred, the Group re-assesses whether it has correctly identified again all of the assets acquired and all of the liabilities assumed and reviews the procedures used to measure the amounts to be recognized at the acquisition date. If the re-assessment still results in an excess of the fair value of net assets acquired over the aggregate consideration transferred, then the gain is recognized in profit of loss.
After initial recognition, goodwill is measured at cost less any accumulated impairment losses. For the purpose of impairment testing, this difference is allocate to each of the Group’s cash-generating units that are expected to benefit from the combination, irrespective of whether other assets or liabilities, of the acquiree, are assigned to those units.
Where goodwill has been allocated to a cash-generating unit and part of the operation within that unit is disposed of, the goodwill associated with the disposed operation is included in the carrying amount of the operation when determining the gain or loss on disposal. Goodwill disposed of in these circumstances is measured based on the relative values of the disposed operation and the portion of the cash-generating unit retained.
Notes to the consolidated financial statements(continued)
| (f) | Investments in associates - |
An associate is an entity over which the Group has significant influence. Significant influence is the power to participate in the financial and operating policy decisions of the investee, but is not control over those policies. The Group's investments in associates are accounted for using the equity method. Under this method, the investment in an associate is initially recognized at cost.
The carrying amount of the investment is adjusted to recognize changes in the Group's share of net assets of the associate since the acquisition date. Goodwill relating to the associate is included in the carrying amount of the investment and is not tested for impairment individually.
The consolidated statement of profit or loss reflects the Group’s share of the results of operations of the associate.
Any change in other comprehensive income of those investees is presented as part of the Group’s other comprehensive income. In addition, when there has been a change recognized directly in the equity of the associate, the Group recognizes its share of any changes, when applicable, in the consolidated statements of changes in shareholders’ equity. Unrealized gains and losses resulting from transactions between the Group and the associate are eliminated to the extent of the interest in the associate.
The aggregate of the Group´s share of profit or loss of an associate is shown on the face of the consolidated statements of profit or loss outside operating profit and represents profit or loss after tax and non-controlling interests in the subsidiaries of the associates.
The financial statements of the associate are prepared for the same reporting period as the Group. When necessary, adjustments are made to bring the accounting policies in line with those of the Group.
After the application of the equity method, the Group determines whether it is necessary to recognize an impairment loss of its investment in associates. At each reporting date, the Group determines whether there is objective evidence that the investment in the associate is impaired. If there is such evidence, the Group calculates the amount of impairment as the difference between the recoverable amount of the associate and its carrying value, and then recognizes the loss in the consolidated statements of profit or loss.
Upon loss of significant influence over the associate, the Group measures and recognizes any retained investment at its fair value. Any difference between the carrying amount of the associate upon loss of significant influence and the fair value of the retained investment and proceeds from disposal is recognized in consolidated statements of profit or loss.
Notes to the consolidated financial statements(continued)
Non-monetary assets which represent an entity’s right to receive goods or services are presented as prepaid expenses. The asset is subsequently derecognized when the goods are received and the services are rendered.
| (h) | Property, plant and equipment - |
Property, plant and equipment is stated at cost, net of accumulated depreciation and accumulated impairment losses, if any.
The initial cost of an asset comprises its purchase price or construction cost, any costs directly attributable to bringing the asset into operation, the initial estimate of the obligation for mine closing and for qualifying assets, borrowing costs. The capitalized value of a finance lease is also included in this caption.
When significant parts of property, plant and equipment are required to be replaced at intervals, the Group depreciates them separately based on their specific useful lives. Also, when a major inspection is performed, its cost is recognized in the carrying amount of plant and equipment as a replacement if the recognition criteria are satisfied. All other maintenance and repair costs are recognized in the consolidated statement of profit or loss as incurred.
Depreciation -
Unit-of-production method:
In mining units with a long-term useful life, depreciation of assets directly related to the operation of the mine, is calculated using the units-of-production method, which is based on economically recoverable reserves of the mining unit. Other assets related to these mining units are depreciated using the straight-line method with the lives detailed in the next paragraph.
Straight-line method:
Depreciation of assets in mining units with short useful lives or used for administrative purposes, is calculated using the straight-line method of accounting. The useful lives are the following:
| Years |
| |
| Buildings, construction and other | Between 6 and 20 |
| Machinery and equipment | Between 5 and 10 |
| Transportation units | 5 |
| Furniture and fixtures | 10 |
| Computer equipment | 4 |
The Companyresidual values, useful lives and methods of depreciation of property, plant and equipment are reviewed at each financial year end, and adjusted prospectively, if appropriate.
Disposal of assets-
An item of property, plant and equipment and any significant part initially recognized is derecognized upon disposal or when no future economic benefits are expected from its use or disposal. Any gain or loss arising on derecognition of the asset (calculated as the difference between the net disposal proceeds and the carrying amount of the asset) is included in the consolidated statements of profit or loss when the asset is derecognized.
Notes to the consolidated financial statements(continued)
The determination of whether an arrangement is, or contains, a lease is based on the substance of the arrangement at the inception of the lease. The arrangement is, or contains, a lease if fulfillment of the arrangement is dependent on the use of a specific asset or assets and the arrangement conveys a right to use the asset or assets, even if that right is not explicitly specified in an arrangement.
Group as a lessee -
A lease is classified at the inception date as a finance lease or an operating lease. A lease that transfers substantially all the risk and rewards incidental to ownership to the Group is classified as a finance lease. Finance leases are capitalized at the commencement of the lease at the fair value of the leased property or, if lower, at the present value of the minimum lease payments. Lease payments are apportioned between finance charges and reduction of the lease liability so as to achieve a constant rate of interest on the remaining balance of the liability. Finance charges are recognized in finance costs in the consolidated statements of profit or loss.
A leased asset is depreciated over the useful life of the asset. However, if there is no reasonable certainty that the Group will obtain ownership by the end of the lease term, the asset is depreciated over the shorter of the estimated useful life of the asset and the lease term.
Operating lease payments are recognized as operating expenses in the statements of profit or loss on a straight-line basis over the lease term.
Group as a lessor -
Leases in which the Group does not transfer substantially all the risk and rewards of ownership of an asset are classified as operating leases.
Initial direct cost incurred in negotiating and arranging an operating lease are added to the carrying amount of the leased asset and recognized over the lease term on the same basis as rental income. Contingent rents are recognized as revenue in the period in which they are earned.
Notes to the consolidated financial statements(continued)
Mining concessions represent ownership of the right of exploration and exploitation to the Group on mining properties contains ore reserves acquired. Mining concessions are stated at cost and are amortized on units of production method, using as the basis of proven and probable reserves. If the Group leaves these concessions, the costs associated are written off in the consolidated statements of profit or loss.
Cost includes the fair value attributable to mineral reserves and the portion of mineral resources considered to be probable of economic extraction at the time of an acquisition.
At end of each year, the Group evaluates if there is any indicator. If any impairment indicator exists, the Group estimates the asset’s recoverable amount.
Mining concessions are presented in the caption of mining concessions, development costs, property, plant and equipment, net.
| (k) | Exploration and mine development costs – |
Exploration expenditure -
Exploration costs are expensed as incurred. These costs primarily include materials and fuels used, surveying costs, drilling costs and payments made to the contractors.
Exploration and evaluation activity includes:
| - | Researching and analyzing historical exploration data; |
| - | Gathering exploration data through geophysical studies; |
| - | Exploratory drilling and sampling; |
| - | Determining and examining the volume and grade of the resource; |
| - | Surveying transportation and infrastructure requirements; |
| - | Conducting market and finance studies. |
Development costs -
When the Group’s Management approves the feasibility of the conceptual study of a project, the costs incurred to develop such property, including additional costs to delineate the ore body and remove impurities it contains, are capitalized as development costs under the caption mining concessions, development costs and property, plant and equipment, net. These costs are amortized when production begins, on the units-of-production basis over the proven and probable reserves.
The development costs include:
| - | Metallurgical and engineering studies; |
| - | Drilling and other costs necessary to delineate ore body; |
| - | Removal of the initial clearing related to an ore body. |
Development costs necessary to maintain production are expensed as incurred.
Notes to the consolidated financial statements(continued)
| (l) | Stripping (waste removal) costs - |
As part of its mining operations, the Group incurs waste removal costs (stripping costs) during the development and production phases of its mining operations. Stripping costs incurred in the development phase of a mine, before the production phase commences (development stripping), are capitalized as part of the cost of constructing the mine and subsequently amortized over its useful life using units of production method. The capitalization of development stripping costs ceases when the mine starts production.
Stripping costs incurred during the production phase (production stripping costs) are generally considered to create two benefits, being either the production of inventory or improved access to the ore to be mined in the future. Where the benefits are realized in the form of inventory produced in the period, the production stripping costs are accounted for as part of the cost of producing those inventories. Where the benefits are realized in the form of improved access to ore to be mined in the future, the costs are recognized as a non-current asset, referred to as a stripping activity asset, if the following criteria are met:
| - | Future economic benefits are probable; |
| - | The component of the ore body for which access will be improved can be accurately identified; |
| - | The costs associated with the improved access can be reliably measured. |
To identify components of deposit, the Group works closely with the operating personnel to analyze the mine plans. Mostly, an ore body can have several components. The mine plans, and therefore, the identification of components, will vary among mines for a number of reasons.
The stripping activity asset is initially measured at cost, which surges from an accumulation of costs directly incurred during the stripping activity. The production stripping cost is presented within mining concessions, development costs, property, plant and equipment, net in the consolidated statements of financial position.
The production stripping cost is subsequently depreciated using the units of production method over the expected useful life of the component identified of the ore body that has been made more accessible by the activity. This cost is stated at cost less accumulated depreciation and accumulated impairment losses, if any.
| (m) | Investment properties – |
Investment properties are measured at cost, net of accumulated depreciation and impairment loss, if any.
Depreciation of the investment properties is determined using the straight-line method with useful life of 20 years.
Investment properties are derecognized either when they have been disposed of or when they are permanently withdrawn from use and no future economic benefit is expected from their disposal. The difference between the net disposal proceeds and the carrying amount of the asset is recognized in profit or loss in the period of derecognition.
Transfers are made to (or from) investment property only when there is a change in use.
For a transfer from investment property to an item of property, plant and equipment, the deemed cost for subsequent accounting is the fair value at the date of change in use. If an item of property, plant and equipment becomes an investment property, the Group accounts for such property in accordance with the policy stated under property, plant and equipment up to the date of change in use.
Notes to the consolidated financial statements(continued)
| (n) | Impairment of non-financial assets - |
The Group assesses, at each reporting date, whether there is an indication that an asset may be impaired. If any indication exists, or when annual impairment testing for an asset is required, the Group estimates the asset’s recoverable amount. An asset’s recoverable amount is the higher of an asset’s or cash-generating unit (CGU) fair value less costs of disposal and its value in use. Recoverable amount is determined by eachfor an individual asset, (cash-generating unit) may be impaired.
A cash-generating unit isunless the smallest identifiable group of assets, denominated a mining unit, that generatesasset does not generate cash inflows from continuing use that are largely independent of the cash inflow generated bythose from other assets or groups of assets. In orderWhen the carrying amount of an asset or CGU exceeds its recoverable amount, the asset is considered impaired and is written down to determine cash-generating units, the Company has determined whether there is an active market for the minerals and metals produced by a mining unit.its recoverable amount.
In assessing value in use, the estimated future cash flows are discounted to their present value using a pre-tax discount rate that reflects current market assessments of the time value of money and the risks specific to the asset. In determining fair value less cost of disposal, recent market transactions are taken into account. If no such transactions can be identified, an appropriate valuation model is used.
Impairment losses of continuing operations, including impairment of inventories, are recognized in the consolidated statementstatements of incomeprofit or loss in those expense categories consistent with the function of the impaired asset.
For assets in general, an assessment is made at each reporting date to determine whether there is an indication that previously recognized impairment losses may no longer exist or have decreased. If such indication exists, the Group estimates the asset’s or CGU’s recoverable amount. A previously recognized impairment loss is reversed only if there has been a change in the estimatesassumptions used to determine the asset’sasset or CGU’s recoverable amount since the last impairment loss was recognized. The increasedreversal is limited so that the carrying amount cannotof the asset does not exceed its recoverable amount, nor exceed the carrying amount that would have been determined, net of depreciation, had no impairment loss been recognized for the asset in prior years. Such reversal is recognized in the consolidated income statement.statements of profit or loss.
| (u)(o) | Basic and diluted earnings per shareShare-based payments - |
Basic and diluted earnings perSenior executives of the Group receive remuneration in the form of share have been calculated based onappreciation rights, which can only be settled in cash. For these transactions, the weighted average numberamount of common and investment shares outstandingthe liability is estimated at each reporting date until settlement.
The cost of share-based payments program is measured initially at fair value at the grant date using a binomial model. This fair value is expensed over the period until the vesting date with recognition of a corresponding liability. The liability is re-measured to fair value at each reporting date up to, and including the settlement date, with changes in fair value recognized in its consolidated statementstatements of financial position; treasury shares have been excluded fromprofit or loss.
General-
Provisions are recognized when the calculation. When the number of shares is modifiedGroup has a present obligation (legal or constructive) as a result of capitalizationa past event, it is probable that an outflow of retained earnings, share splits or share grouping,resources embodying economic benefits will be required to settle the net income per basicobligation and diluted shares is adjusted retroactively for alla reliable estimate can be made of the periods reported.amount of the obligation. If the change occurs aftereffect of the datetime value of money is material, provisions are discounted using a current pre-tax rate that reflects, when appropriate, the risks specific to the liability. When discounting is used, the increase in the provision due to the passage of time is recognized as a finance cost.
Notes to the consolidated financial statements but before(continued)
Provision for closure of mining units -
When the financial statement are authorized for issue,liability is initially recognized, the calculation of net income per basic and diluted share for allpresent value of the reported periods must beestimated costs is capitalized by increasing the carrying amount of the related mining assets (property, plant and equipment). Over time, the discounted liability is increased for the change in present value based on discounted rates that reflects current market assessments and the risks specify to the liability, in addition, the capitalized cost is depreciated and/or amortized based on the new numberuseful life of the asset. Any gain or loss resulting from the settlement of the obligation is recorded in the current results.
Changes in the estimated timing of rehabilitation or changes to the estimated future costs are dealt with prospectively by recognizing an adjustment to the rehabilitation liability and a corresponding adjustment to the related asset. Any reduction in the rehabilitation liability and, therefore, any deduction from the asset to which it relates, may not exceed the carrying amount of the asset. If it does, any excess over the carrying amount is taken immediately to the consolidated statements of profit or loss.
If the change in estimate results in an increase in the rehabilitation liability and, therefore, an addition to the carrying value of the asset, the Group considers whether this is an indication of impairment of the asset as a whole, and if so, tests for impairment, in accordance with IAS 36 "Impairment of Assets".
For closed mines, changes to estimated costs are recognized immediately in the consolidated statements of profit or loss.
Own equity instruments that are reacquired (treasury shares) are recognized at cost and deducted from equity. No gain or loss is recognized in profit or loss on the purchase, sale, issue or cancellation of the Group’s own equity instruments. Any difference between the carrying amount and the consideration, if reissued, is recognized as additional capital in equity. The voting rights related to treasury shares see note 25.are cancelled for the Group and no dividends on such shares are allocated.
Revenue is recognized to the extent that it is probable that the economic benefits will flow to the Group and the revenue can be reliably measured, regardless of when the payment is being made. Revenue is measured at the fair value of the consideration received or receivable, taking into account contractually defined terms of payment and excluding taxes or duty. The specific recognition criteria described below must also be met before revenue is recognized:
Sales of concentrates and metals -
Revenue from sale of concentrates and metals is recognized when the significant risks and rewards of ownership of the goods have passed to the buyer, usually on delivery of the goods.
Notes to the consolidated financial statements(continued)
Contract terms for the Company’s sale of metal in concentrate to customers allow for a price adjustment based on final assay results of the metal in concentrate by the customer to determine the final content. These are referred to as provisional pricing arrangements and are such that the selling price for metal in concentrate is based on prevailing spot prices on a specified future date after shipment to the customer (the quotation period). Adjustments to the sales price occurs based on movements in quoted market prices up to the date of final settlement. The period between provisional invoicing and final settlement can be between one and six months.
Sales contracts for metal in concentrate that have provisional pricing features are considered to contain an embedded derivative, which is required to be separated from the host contract for accounting purposes. The host contract is the sale of metals in concentrate, and the embedded derivative is the forward contract for which the provisional sale is subsequently adjusted with final liquidations. The embedded derivative is originated by the metals prices since the date of issuance of issuance of the provisional liquidation until the date of issuance of the final liquidation.
Notes to the consolidated financial statements(continued)
The embedded derivative, which does not qualify for hedge accounting, is initially recognized at fair value with subsequent changes in the fair value recognized in the consolidated statements of profit or loss until final settlement, and presented as part of net sales. Changes in fair value over the quotation period and up until final settlement are estimated by reference to forward market prices.
Interest income-
For all financial instruments measured at amortized cost, interest income is recorded using the effective interest rate (EIR). EIR is the rate that exactly discounts the estimated future cash payments or receipts over the expected life of the financial instrument or a shorter period, where appropriate, to the net carrying amount of the financial asset or liability. Interest income is included in finance income in the consolidated statements of profit or loss.
Royalty income-
The royalty income is recognized in accordance with the accrual method considering the substance of the relevant agreements.
Dividends-
Revenue is recognized when the Group's right to receive the payment is established, which is generally when shareholders approve the dividend.
Revenue from engineering and construction services -
Revenue is recognized based on the stage of completion of contracts for existing services. The stage of completion is measured by reference to services performed to date as a percentage of total services to be performed by each contract.
Rental income -
Rental income arising from operating leases on investment properties is accounted for on a straight-line basis over the lease term and is included in revenue in the consolidated statement of profit or loss due to its operating nature.
| (v)(s) | Workers’ profit sharingBenefits to employees - |
Salaries and wages, bonuses, post-employment benefits and vacations are calculated in accordance with IAS 19, "Employee Benefits" and are calculated in accordance with current Peruvian legislation based on the accrual basis.
Workers’ profit sharing
The Company recognizes workers’ profit sharing in accordance with IAS 19, “Employees Benefits". Workers' profit sharing is calculated according toin accordance with the Peruvian law in force at today (Legislative Decree No. 892) over, and the same taxable net basis used to calculate the income tax. For the Company’s case, the workers’ profit sharingapplicable rate is 8% over the taxable net base of current year. According to Peruvian Lawlaw, the limit in the workers’workers' profit sharing that an employee wouldcan receive is equivalent to 18 monthly wages. According to the article 3months of Law No. 28756 (and its regulation law), it has been established thatwages, and any excess amounts above such limit willhas be transferred to the Regional Government and “National FoundFund for Employment’s Promotion and TrainingTraining” (“FONDOEMPLEO”, by its Spanish acronym)”). Such funds are used for workers training, employment promotion and public investment projects. The excess amount is retained and paid by the Company to the Peruvian government entities (FONDO EMPLEO and regional government).
The Company recognizes the current portion ofCompany’s workers’ profit sharing paid directly to them according tois recognized as a liability in the IAS 19 “Employees Benefits” approach, considering themstatement of financial position and as benefits are all formsan operating expense in the statements of consideration given by an entity in exchange for service rendered by employees. As a consequence, the Company recognized the workers’ profit sharing as cost or expenses, according to their duties or function.comprehensive income.
In the periods in which the excess over the 18 wages limit arises, the Company considers this as part to the contributions made by the Company to the Government (FONDOEMPLEO) related to the workers’ profit sharing. This is classified as operating expenses in the consolidated income statement.
| | An operating segment is a component of an entity: (i) that engages in business activities from which it may earn revenues and incur expenses (including revenues and expenses relating to transactions with other components of the same entity), (ii) whose operating results are regularly reviewed by the Company´s Management to make decisions about resources to be allocated to the segment and assess its performance, and (iii) for which discrete financial information is available. See note 26. |
| 2.4. | Reclassifications to the consolidated financial statements of prior years - |
As of December 31, 2012, the Company made the following reclassifications in its consolidated financial statements for the year ended on December 31, 2011:
Notes to the consolidated financial statements(continued)
Costs directly attributable to the acquisition, construction or production of a qualifying asset are capitalized as finance part of the cost of an asset. A qualifying asset is one whose value is greater than US$5 million and requires a longer period to 12 months to get ready for its intended use. All other borrowing costs are expensed in the period in which they occur. Borrowing costs consist of interest and other costs that the Group incurs in connection with the borrowing of funds.
Current income tax -
Current income tax assets and liabilities are measured at the amount expected to be recovered from or paid or the tax authority. The tax rates and tax laws used to compute the amount are those that are enacted or substantively enacted, at the reporting period.
Current income tax relating to items recognized directly in equity is recognized in equity and not in the consolidated statements of profit or loss. Management periodically evaluates positions taken in the tax returns with respect to situations in which applicable tax regulations are subject to interpretation and establishes provisions where appropriate.
Deferred income tax -
Deferred income tax is provided using the liability method on temporary differences between the tax bases of assets and liabilities and their carrying amounts for financial reporting purposes at the reporting date.
Deferred income tax liabilities are recognized for all taxable temporary differences, except for taxable temporary differences associated with investments in associates, when the timing of the reversal of the temporary differences can be controlled and it is probable that the temporary differences will not reverse in the foreseeable future.
Deferred income tax assets are recognized for all deductible temporary differences, the carry forward of unused tax credits and any unused tax losses. Deferred tax assets are recognized to the extent that is probable that taxable profit will be available against which the deductible temporary differences, and the carry forward of unused tax credits and unused tax losses can be utilized.
The carrying amount of deferred tax assets is reviewed at each reporting date and reduced to the extent that it is no longer probable that sufficient taxable profit will be available to allow all or part of the deferred tax asset to be utilized. Unrecognized deferred tax assets are re-assessed at each reporting date and are recognized to the extent that it has become probable that future taxable profits will allow the deferred tax asset to be recovered.
Deferred tax assets and liabilities are measured at the tax rates that are expected to apply in the year when the asset is realized or the liability is settled, based on tax rates and tax laws that have been enacted or substantively enacted at the reporting date.
Deferred tax items are recognized in correlation to the underlying transaction either in other comprehensive income or directly in equity.
Notes to the consolidated financial statements(continued)
Deferred tax assets and deferred tax liabilities are offset if a legally enforceable right to compensate current tax assets against current income tax liabilities and the deferred taxes relate to the same taxable entity and the same taxation authority.
Peruvian mining royalties and special mining tax -
Mining royalties and special mining tax are accounted for in accordance with IAS 12 “Income Tax” because they have the characteristics of an income tax. This is considered to be the case when they are imposed under government authority and the amount payable is based on taxable income-rather than physical quantities produced or as a percentage of revenue-after adjustment for temporary differences. Legal rules and rates used to calculate the amounts payable are those in effect on the date of the consolidated statements of financial position.
Therefore, obligations arising from Mining Royalties and Special Mining Tax are recognized as income tax under the scope of IAS 12. Both, Mining Royalties and Special Mining Tax generated deferred assets and liabilities which must be measured using the average rates expected to apply to operating profit in the quarter in which the Group expects to reverse temporary differences.
Sales tax -
Expenses and assets are recognized net of the amount of sales tax, except:
| (i) | When the sales tax incurred on a purchase of assets or services is not recoverable from the taxation authority, in which case, the sales tax is recognized as part of the cost of acquisition of the asset or as part of the expense item, as applicable; |
| (ii) | When receivables and payables are stated with the amount of sales tax included. |
The net amount of sales tax recoverable from, or payable to, the taxation authority is included as part of receivables or payables in the consolidated statements of financial position.
| (v) | Fair value measurement |
The Group measures its financial instruments, such as, derivatives and embedded derivatives, at fair value at the date of the consolidated statements of financial position.
Fair value is the price that would be received to sell an asset or paid to transfer a liability in an orderly transaction between market participants at the measurement date. The fair value measurement is based on the presumption that the transaction to sell the asset or transfer the liability takes place either:
| - | In the consolidated statement of cash flows, US$164,924,000 fromprincipal market for the net sale of investment shares to non-controlling interest (see note 1 (f)), was reclassified from cash flows related to investment activities to cash flows related financing activities.asset or liability, or |
| 2.5. | New International Financial Reporting Standards (IFRS) internationally issued but not effective on the issuance date of the consolidated financial statements - |
Improvements and interpretations issued as of December 31, 2012, include the following:
Effective the year 2012 –
There were no new standards and interpretations that were applicable to the Company for 2012.
Effective as from January 1, 2013 -
| - | IAS 1, PresentationIn the absence of Financial Statements, effective for annual periods beginning on July 1, 2012. The amendments to IAS 1 change the grouping of items presenteda principal market, in the statement of comprehensive income.most advantageous market for the asset or liability. |
The Group uses valuation techniques that are appropriate in the circumstances and for which sufficient data are available to measure fair value, maximizing the use of relevant observable inputs and minimizing the use of unobservable inputs.
| - F-32 | IAS 27, Separate Financial Statements (revised in 2011), effective for annual periods beginning on January 1, 2013. As a consequence of the new IFRS 10 and IFRS 12, what remains in IAS 27 is limited to accounting for subsidiaries, joint arrangements and associates in separate financial statements. |
| - | IAS 28, Investments in associates and joint ventures (revised in 2011), effective for annual periods beginning on January 1, 2013. As a consequence of the new IFRS 11 and IFRS 12, IAS 28 Investments in Associates and Joint Ventures, describes the application of the equity method to investments in joint ventures in addition to associates. |
| - | IFRS 9, “Financial Instruments”, effective January 1, 2015, modifies the treatment and classification of financial assets established by IAS 39, “Financial Instruments: Recognition and Measurement”. |
| - | IFRS 10, “Consolidated Financial Statements”, effective January 1, 2013, replaces the consolidation requirements in SIC-12, “Consolidation—Special Purpose Entities” and IAS 27, “Consolidated and Separate Financial Statements”. |
| - | IFRS 11, “Joint Arrangement”, effective January 1, 2013, addresses inconsistencies in the reporting of joint arrangements by requiring a single method to account for interests in jointly controlled entities. The guidance focuses on the rights and obligations of the joint arrangement, rather than its legal form (as is currently the case). |
Notes to the consolidated financial statements(continued)
All assets and liabilities for which fair value is measured or disclosed in the consolidated financial statements are categorized within the fair value hierarchy, described, as follows, based on the lowest level input that is significant to the fair value measurement as a whole:
| - | IFRS 12, “Disclosure of InterestsLevel 1 - Quoted (unadjusted) market prices in Other Entities”, effective January 1, 2013,active markets for identical assets or liabilities; |
| - | Level 2 - Valuation techniques for which the lowest level input that is a new and comprehensive standard on disclosure requirementssignificant to the fair value measurement is directly or indirectly observable; |
| - | Level 3 - Valuation techniques for all forms of interests in other entities, including subsidiaries, joint arrangements, associates and unconsolidated structured entities.which the lowest level input that is significant to the fair value measurement is unobservable. |
For assets and liabilities that are recognized in the consolidated financial statements on a recurring basis, the Group determines whether transfers have occurred between levels in the hierarchy by reassessing categorization (based on the lowest-level input that is significant to the fair value measurement as a whole) at the end of each reporting period.
The Group's Management determines the policies and procedures for both recurring fair value measurement and non-recurring measurement. At each reporting date, the Group's Management analyzes the movements in the values of assets and liabilities which are required to be re-measured or re-assessed as per the Group’s accounting policies.
For the purpose of fair value disclosures, the Group has determined classes of assets and liabilities based on the nature, characteristics and risks of the asset or liability and the level of the fair value hierarchy as explained above.
| -(w) | IFRS 13, “Fair Value Measurement”, effective January 1, 2013, defines fair value, sets out a framework for measuring fair valueDerivative financial instruments and requires disclosures about fair value measurements.hedge accounting - |
Initial recognition and subsequent measurement–
The Group uses derivative instruments to hedge its commodity price risk (forward commodity contracts) and its foreign exchange risk (forward exchange rate contracts). Such derivative financial instruments are initially recognized at fair value on the date on which a derivative contract is entered into and are subsequently re-measured at fair value. Derivatives are carried as financial assets when the fair value is positive and as financial liabilities when the fair value is negative.
At the inception of the hedge relationship, the Group formally designates and documents the hedge relationship to which it wishes to apply hedge accounting and the risk management objective and strategy for undertaking the hedge.
The documentation includes identification of the hedging instrument, the hedge item or transaction, the nature of the risk being hedged and how the entity will assess the effectiveness of changes in the hedging instrument’s fair value in offsetting the exposure to changes in cash flows attributable to the hedged risk. Such hedges are expected to be highly effective in achieving offsetting changes in cash flows and are assessed on an ongoing basis to determine that they actually have been highly effective throughout the financial reporting periods for which they were designated.
Notes to the consolidated financial statements(continued)
The Group’s hedge is classified as cash flow hedge. The effective portion of gain or loss on the hedging instrument is initially recognized in the consolidated statements of changes in equity, under the caption other equity reserves, while the ineffective portion is recognized immediately in the consolidated statements of profit or loss in the finance costs caption.
| -(x) | IFRIC 20, “Stripping Costs in the Production Phase of a Surface Mine”, effective January 1, 2013, clarifies when the stripping cost in the production phase should be recognized as an asset and how that asset should be measured, both initially and in subsequent periods.Discontinued operations - |
The Group classifies disposal groups as held for sale if their carrying amounts will be recovered principally through sale rather than through continuing use. Such disposal groups classified as held for sale are measured at the lower of their carrying amount and fair value less costs to sell.
Annual improvements
The criteria for held for sale classification is regarded as met only when the sale is highly probable and the disposal group is available for immediate sale in its present condition. Actions required to IFRS (issuedcomplete the sale should indicate that it is unlikely that significant changes to the plan will be made or that the sale will be withdrawn. Management must be committed to the sale expected within one year from the date of the classification.
An extension of the period required to complete a sale does not preclude an asset (or disposal group) from being classified as held for sale if the delay is caused by events or circumstances beyond the entity’s control and there is sufficient evidence that the entity remains committed to its plan to sell the asset.
Property, plant and equipment are not depreciated or amortized once classified as held for sale.
Assets and liabilities classified as held for sale are presented separately as current items in May 2012) -the consolidated statement of financial position.
A disposal group qualifies as discontinued operation if it is a component of an entity that either has been disposed of, or is classified as held for sale, and:
| - | IAS 1, PresentationRepresents a separate major line of Financial Statements, clarifies the difference between voluntary annual comparative informationbusiness or geographical area of operations; |
| - | Is part of a single coordinated plan to dispose of a separate major line of business or geographical area of operations; or |
| - | Is a subsidiary acquired exclusively with a view to resale. |
Discontinued operations are excluded from the results of continuing operations and are presented as a single amount as profit or loss after tax from discontinued operations in the consolidated statement of profit or loss.
Additional disclosures are provided in Note 1(e). All other notes to the consolidated financial statements include amounts for continuing operations, unless otherwise mentioned.
| 3. | Significant judgments, estimates and the minimum required of comparative period is the previous period.assumptions |
The preparation of the Group’s consolidated financial statements requires Management to make judgments, estimates and assumptions that affect the reported amounts of revenues, expenses, assets and liabilities, and the accompanying disclosures, and the disclosure of contingent liabilities. The estimates and assumptions are continuously evaluated and based on Management´s experience and other facts, including the expectations about future events which are reasonable under current situation. Uncertainty about these estimates and assumptions could result in outcomes that require material adjustment to the carrying amount of assets and liabilities affected in future periods. Further information on each of these areas and how they impact the various accounting policies are described below and also in the relevant notes to the consolidated financial statements.
Notes to the consolidated financial statements(continued)
In the process of applying the Group’s accounting policies, Management has made the following judgments, which have the most significant effect on the amounts recognized in the consolidated financial statements:
By their nature, contingencies will be resolved only when one or more uncertain future events occur or fail to occur. The assessment of the existence and potential quantum of contingencies inherently involves the exercise of significant judgment and the use of estimates regarding the outcome of future events.
| (b) | Development start date - |
The Group assesses the status of each exploration project of its mining units to determine when the development phase begins. One of the criteria used to evaluate the development start date is when the Group determines that the property can be economically developed.
Notes to the consolidated financial statements(continued)
| (c) | Production start date - |
The Group assesses the stage of each mine under development to determine when a mine moves into the production phase. The criteria used to assess the start date are determined based on the unique nature of each mining project, such as the complexity of the project and its location. The Group considers various relevant criteria to assess when the production phase is considered to have commenced. Some of the criteria used to identify the production start date include, but are not limited to:
| - | IAS 16, Property, Plant and Equipment, clarifies that major spare parts and servicing equipments that meetLevel of capital expenditure incurred compared to the definitionoriginal construction cost estimates; |
| - | Completion of property,a reasonable period of testing of the mine plant and equipment are not inventories.equipment; |
| - | Ability to produce metal in saleable form (within specifications); |
| - | Ability to sustain ongoing production of metal. |
When a mine development /construction project moves into the production phase, the capitalization of certain mine development costs ceases and costs are either regarded as forming part of the cost of inventory or expensed, except for costs that qualify for capitalization relating to mining asset additions or improvements. It is also at this point that depreciation or amortization commences.
| -3.2. | IAS 32, Financial Instruments: Presentation, clarifies that income taxes arising from distributions to equity holders are accounted for in accordance with IAS 12.Estimates and assumptions |
The key assumptions concerning the future and other key sources of estimation uncertainty at the reporting date that have a significant risk of causing a material adjustment to the carrying amounts of assets and liabilities within the next financial year, are described below. The Group based its assumptions and estimates on parameters available when the consolidated financial statements were prepared. Existing circumstances and assumptions about future developments, however, may change due to market change or circumstances arising beyond the control of the Group. Such changes are reflected in the assumptions when they occur.
Such improvements
| (a) | Determination of mineral reserves and resources - |
The Group calculates its reserves using methods generally applied by mining and industry according to international guidelines. All estimated reserves represent estimated quantities of mineral proven and probable that under current conditions can be economically and legally processed.
The process of estimating quantities of reserves is complex and requires making subjective decisions when evaluating all geological, geophysical, engineering and economic information available choices. Reviews could occur on reserve estimates due to, among others, revisions to the data or geological assumptions, changes in prices, production costs and results of exploration activities. Changes in estimated reserves could mainly affect the carrying value of mining concessions, development costs and property, plant and equipment; the charges in result for depreciation and amortization; and the carrying amount of the provision for closure of mining units.
| (b) | Units of production depreciation - |
Estimated economically recoverable reserves are used in determining the depreciation and/or amortization of mine-specific assets.
This results in a depreciation/amortization charge proportional to the depletion of the anticipated remaining life-of-mine production. The life of each item, which is assessed at least annually, has regard to both its physical life limitations and present assessments of economically recoverable reserves of the mine property at which the asset is located. These calculations require the use of estimates and assumptions, including the amount of recoverable reserves. Changes in estimates are accounted for prospectively.
Notes to the consolidated financial statements(continued)
| (c) | Mine rehabilitation provision - |
The Group assesses its mine rehabilitation provision at each reporting date. The ultimate rehabilitation costs are uncertain, and cost estimates can vary in response to many factors, including estimates of the extent and costs of rehabilitation activities, technological changes, regulatory changes, cost increases as compared to the inflation rates, and changes in discount rates. These uncertainties may result in future actual expenditure differing from the amounts currently provided. The provision at reporting date represents Management’s best estimate of the present value of the future rehabilitation costs required.
Inventories are classified in short and long term in accordance with the time that Management estimates will start the production of the concentrate extracted from the mining unit.
Net realizable value tests are performed at each reporting date and represent the estimated future sales price of the product the entity expects to realize when the product is processed and sold, less estimated costs to complete production and bring the product to sale.
| (e) | Impairment of non-financial assets - |
The Group assesses each asset or cash generating unit in each reporting period to determine whether any indication of impairment exists. Where an indicator of impairment exists, a formal estimate of the recoverable amount is made, which is considered to be the higher of the fair value less costs of disposal and value in use. The assessments require the use of estimates and assumptions such as long-term commodity prices, discount rates, operating costs, among others. These estimates and assumptions are subject to risk and uncertainty.
Notes to the consolidated financial statements(continued)
The fair value of mining assets is generally calculated by the present value of future cash flows arising from the continued use of the asset, which include some estimates, such as the cost of future expansion plans, using assumptions that a third party might consider. The future cash flows are discounted to their present value using a discount rate that reflects current market assessment of the value of money over time, as well as specific risks of the asset or cash-generating unit under evaluation.
The Group has determined the operations of each mining unit as a single cash generating unit.
Deferred tax assets are recognized for unused tax losses to the extent that it is probable that taxable profit will be available against which the losses can be utilized. Significant Management judgment is required to determine the amount of deferred tax assets that can be recognized, based upon the likely timing and the level of future taxable profits together with future tax planning strategies.
| (g) | Fair value of contingent consideration - |
The contingent consideration arising from a business combination is measured at fair value at the date of acquisition, as part of the business combination. If the contingent consideration is eligible to be recognized as a financial liability the fair value is subsequently re-measured at each date of the consolidated financial statements. Determining the fair value of the contingent consideration is based on a model of discounted future cash flows. The key assumptions take into account the likelihood of achieving each goal of financial performance as well as the discount factor.
| 4. | Standards issued but not effective |
The relevant standards and interpretations that are issued, but not yet effective, up to the date of issuance of the Group’s financial statements are disclosed below. The Group intends to adopt these standards, if applicable, when they become effective.
IFRS 9 Financial Instruments
In July 2014, the IASB issued the final version of IFRS 9 Financial Instruments which reflects all phases of the financial instruments project and replaces IAS 39 and all previous versions of IFRS 9. IFRS 9 brings together all three aspects of the accounting for financial instruments project: classification and measurement, impairment and hedge accounting. IFRS 9 is effective for annual periods beginning on or after January 1, 2018, with early application permitted. Except for hedge accounting, retrospective application is required, but the provision of comparative information is not compulsory. For hedge accounting, the requirements are generally applied prospectively, with some limited exceptions.
The adoption of IFRS 9 would have not significant effect on the classification and measurement of the Group’s financial assets and liabilities.
Notes to the consolidated financial statements(continued)
IFRS 15 Revenue from Contracts with Customers
IFRS 15 was issued in May 2014 and establishes a new five-step model that will apply to revenue arising from contracts with customers. Under IFRS 15, revenue is recognized at an amount that reflects the consideration to which an entity expects to be entitled in exchange for transferring goods or services to a customer. The principles in IFRS 15 provide a more structured approach to measuring and recognizing revenue. The new revenue standard is applicable to all entities and will supersede all current revenue recognition requirements under IFRS. Either a full retrospective application or a modified retrospective application is required for annual periods beginning on or after January 1, 2018. Early adoption is permitted. The Group is currently assessing the impact of IFRS 15 and plans to adopt the new standard on the required effective date.
Amendments to IFRS 10 and IAS 28: Sale or Contribution of Assets between an Investor and its Associate or Joint Venture
The amendments address the conflict between IFRS 10 Consolidated Financial Statements and IAS 28 in dealing with the loss of control of a subsidiary that is sold or contributed to an associate or joint venture. The amendments clarify that the gain or loss resulting from the sale or contribution of assets that constitute a business, as defined in IFRS 3, between an investor and its associate or joint venture, is recognized in full. Any gain or loss resulting from the sale or contribution of assets that do not constitute a business, however, is recognized only to the extent of unrelated investors’ interests in the associate or joint venture. These amendments must be applied prospectively and are effective for annual periods beginning on or after January 1, 2013.
Although Management does not believe2016, with early adoption permitted. These amendments will impact the new pronouncements will have a significant impact onGroup to the Company, Management isextent that it undertakes future transactions of this nature, as this accounting approach differs to that which it would currently evaluating their impact, if any, on the Company’s consolidated financial statements for 2013.apply.
| 3.5. | Transactions in Nuevos SolesBusiness combination |
Acquisition of controlling interest in Canteras del Hallazgo S.A.C. -
On August 18, 2014, Buenaventura acquired from Minera Gold Fields Peru S.A. (“Gold Fields”) 51% of the voting shares of Canteras del Hallazgo S.A.C., which represent the whole interest of Gold Fields in the equity of such entity.
Canteras del Hallazgo is a privately-held entity incorporated in 2009 and owner of the Chucapaca project, which is located in the Ichuña district, in the General Sanchez Cerro province, in the Moquegua department, Peru. According to previously performed studies, there is evidence of the existence of gold, silver, copper and antimony in the area, specifically in the Canahuire deposit.
The purchase consideration amounted to:
| | US$(000) | |
| | | |
| Cash paid | | | 81,000 | |
| Contingent consideration liability | | | 23,026 | |
| | | | |
| As of December 31, 2014 | | | 104,026 | |
Moreover, the Group recognized a gain of US$59,852,000 in the 2014 consolidated statement of profit or loss as a result of re-measuring the previously held equity interest (US$40,094,000) at its acquisition date fair value (US$99,946,000) in accordance with IFRS 3.
Notes to the consolidated financial statements(continued)
Assets acquired and liabilities assumed -
The fair values of the identifiable assets and liabilities assumed of Canteras del Hallazgo S.A.C. as at the date of acquisition were:
| | US$(000) | |
| | | |
| Assets | | | | |
| Cash and cash equivalents | | | 684 | |
| Income tax credit | | | 29 | |
| Value added tax credit | | | 10,599 | |
| Mining concessions, property, plant and equipment, net | | | 202,658 | |
| | | 213,970 | |
| Liabilities | | | | |
| Deferred income tax liabilities, net | | | 9,235 | |
| Trade and other payables and provisions | | | 724 | |
| | | 9,959 | |
| | | | |
| Total identifiable net assets at fair value | | | 204,011 | |
Contingent consideration -
The purchase and sale agreement considered a contingent consideration of US$23,026,000, which corresponds to the present value of the future royalty payments equivalent to 1.5% over the future sales of the minerals arising from the mining properties acquired. The fair value has been determined using the income approach. Significant unobservable valuation inputs are provided below:
| Annual average of future sales of mineral (US$000) | | | 208,574 | |
| Useful life of mining properties | | | 12 | |
| Discount rate (%) | | | 10 | |
Significant increase (decrease) in the future sales of mineral would result in higher (lower) fair value of the contingent consideration liability, while significant increase (decrease) in the discount rate would result in lower (higher) fair value of the liability. Changes in the fair value of this contingent consideration have been recognized through profit or loss in the consolidated statement of profit or loss.
Notes to the consolidated financial statements(continued)
As of December 31, 2015, it is highly probable that the Group reaches the projected future sales. The fair value of the contingent consideration determined as of December 31, 2015 reflects this assumption and changes in metal prices. A reconciliation of fair value measurement of the contingent consideration liability is provided below:
| | US$(000) | |
| As of January 1, 2014 | | | - | |
| Liability arising on business combination | | | 23,026 | |
| | | | |
| As of December 31, 2014 | | | 23,026 | |
| | | | |
| Unrealized fair value changes recognized in profit or loss | | | (6,032 | ) |
| As of December 31, 2015 | | | 16,994 | |
The Group has the preferential right of acquisition of the royalty in case Gold Fields decides to sell it.
Merger -
On September 22, 2014, the General Shareholders’ meeting of the Company approved the merger of the Company (absorbing entity) and its subsidiary Canteras del Hallazgo S.A.C. (absorbed entity) effective December 3, 2014.
The statement of profit or loss of Canteras del Hallazgo S.A.C. for the eleven-month period ended December 3, 2014 is a follows:
| | US$(000) | |
| | | |
| Administrative expenses | | | (2,344 | ) |
| Net loss from currency exchange difference | | | (2,319 | ) |
| | | | |
| Net loss | | | (4,663 | ) |
Notes to the consolidated financial statements(continued)
Transactions in Nuevos Soles are completed using exchange rates published by the Superintendent of Banks, Insurance and AFP. As of December 31, 2012,2015, the exchange rates for U.S. dollars published by this Institution were US$0.39230.2934 for buying and US$0.39200.2930 for selling (US$0.37110.3355 for buying and US$0.37080.3346 for selling as of December 31, 2011)2014) and have been applied by the Group for the assets and liabilities accounts, respectively.
Notes to the consolidated financial statements (continued)
As of December 31, 20122015 and 2011,2014, the CompanyGroup had the following assets and liabilities denominated in Nuevos Soles:
| | | 2012 | | 2011 | | | 2015 | | 2014 | |
| | | S/.(000) | | S/.(000) | | | S/(000) | | S/(000) | |
| | | | | | | | | | | |
| Asset | | | | | | | | | | | | | | | | |
| Cash and cash equivalents | | | 23,744 | | | | 25,085 | | | | 53,218 | | | | 30,431 | |
| Other accounts receivable | | | 54,331 | | | | 60,721 | | |
| Trade and other receivables | | | | 474,442 | | | | 399,914 | |
| Income tax credit | | | | 155,014 | | | | 160,647 | |
| Prepaid expenses | | | 2,484 | | | | - | | | | 36,984 | | | | 68,883 | |
| | | | 80,559 | | | | 85,806 | | | | 719,658 | | | | 659,875 | |
| Liabilities | | | | | | | | | | | | | | | | |
| Trade accounts payable | | | (125,601 | ) | | | (95,098 | ) | |
| Other accounts payable | | | (129,624 | ) | | | (192,947 | ) | |
| Bank loans | | | | (769,360 | ) | | | (5,000 | ) |
| Trade and other payables | | | | (414,385 | ) | | | (381,036 | ) |
| Provisions | | | (40,908 | ) | | | (24,135 | ) | | | (71,264 | ) | | | (78,215 | ) |
| | | | (296,133 | ) | | | (312,180 | ) | | | (1,255,009 | ) | | | (464,251 | ) |
| | | | | | | | | | | | | | | | | |
| Liability position, net | | | (215,574 | ) | | | (226,374 | ) | |
| Net asset (liability) position | | | | (535,351 | ) | | | 195,624 | |
| 4.7. | Cash and cash equivalents |
(a) The table below presents the components of this caption:This caption is made up as follows:
| | | 2012 | | 2011 | | | 2015 | | 2014 | |
| | | US$(000) | | US$(000) | | | US$(000) | | US$(000) | |
| | | | | | | | | | | |
| Cash | | | 1,017 | | | | 908 | | | | 417 | | | | 1,371 | |
| Bank accounts | | | 67,695 | | | | 71,883 | | | | 38,102 | | | | 33,115 | |
Time deposits (b) | | | 118,000 | | | | 398,056 | | | | 40,000 | | | | 44,026 | |
| Cash balances included in the consolidated statement of cash flows | | | 186,712 | | | | 470,847 | | |
| Time deposits with original maturity greater than 90 days (c) | | | - | | | | 10,121 | | |
| | | | | | | | | | | | | | | | | |
| | | | 186,712 | | | | 480,968 | | | | 78,519 | | | | 78,512 | |
Bank accounts earn interest at floating rates based on market rates.
As of December 31, 2015, time deposits were kept in prime financial institutions, which generated interest at annual market rates and had original maturities of less than 90 days, according to the immediate cash needs of the Group.
Notes to the consolidated financial statements(continued)
| 8. | Trade and other receivables, net |
| (a) | This caption is made up as follows: |
| | | 2015 | | | 2014 | |
| | | US$(000) | | | US$(000) | |
| | | | | | | |
| Trade receivables, net (b) | | | | | | | | |
| Domestic clients | | | 76,078 | | | | 107,638 | |
| Foreign clients | | | 45,162 | | | | 59,377 | |
| Related entities, Note 30(b) | | | 9,426 | | | | 15,081 | |
| | | | | | | | | |
| | | | 130,666 | | | | 182,096 | |
| Allowance for doubtful accounts (e) | | | (21,741 | ) | | | (21,741 | ) |
| | | | | | | | | |
| | | | 108,925 | | | | 160,355 | |
| Other receivables | | | | | | | | |
| Related entities, Note 30(b) | | | 125,487 | | | | 334 | |
| Value added tax credit | | | 73,145 | | | | 76,532 | |
| Refund application of value added tax (c) | | | 40,421 | | | | 34,805 | |
| Tax deposits (d) | | | 12,055 | | | | 13,843 | |
| Claims to third parties | | | 10,870 | | | | 13,853 | |
| Account receivable for sale of buildings | | | 4,343 | | | | - | |
| Loans to third parties | | | 2,041 | | | | 1,212 | |
| Interest receivable | | | 1,879 | | | | 535 | |
| Other | | | 3,263 | | | | 6,786 | |
| | | | | | | | | |
| | | | 273,504 | | | | 147,900 | |
| | | | | | | | | |
| Total trade and other receivables, net | | | 382,429 | | | | 308,255 | |
| Classification by maturity: | | | | | | | | |
| Current portion | | | 219,862 | | | | 281,604 | |
| Non-current portion | | | 162,567 | | | | 26,651 | |
| | | | | | | | | |
| Total trade and other receivables, net | | | 382,429 | | | | 308,255 | |
| | | | | | | | | |
| Classification by nature: | | | | | | | | |
| Financial receivables | | | 268,863 | | | | 196,918 | |
| Non-financial receivables | | | 113,566 | | | | 111,337 | |
| | | | | | | | | |
| Total trade and other receivables, net | | | 382,429 | | | | 308,255 | |
Notes to the consolidated financial statements(continued)
| (b) | The table below presents the components of time deposits as of December 31, 2012: |
Currency | | Original maturities | | AnnualTrade accounts receivable are denominated in U.S. dollars, are neither due nor impaired, do not yield interest rate | | | |
| | | | % | | US$(000) | |
| | | | | | | |
U.S. dollars | | From 5 to 13 days | | From 1.3 to 1.70 | | | 118,000 | |
| | | | | | | | |
| | | | | | | 118,000 | |
The table below presents the components of time deposits as of December 31, 2011:
Currency | | Original maturities | | Annual interest rate | | | |
| | | | % | | US$(000) | |
| | | | | | | |
U.S. dollars | | From 5 to 63 days | | From 0.50 to 1.42 | | | 381,000 | |
Nuevos Soles | | From 42 to 90 days | | From 4.05 to 4.35 | | | 17,056 | |
| | | | | | | | |
| | | | | | | 398,056 | and have no specific guarantees. |
| (c) | AsThis item mainly corresponds to value added tax pending to be refunded as of December 31, 2011, it mainly corresponds2015 and 2014. In November 2013 and January 2015, Buenaventura filed claims procedures by S/19,500,000 (equivalent to time deposits maintainedUS$6,541,000) and by El Brocal andS/71,100,000 (equivalent to US$20,862,000), respectively, in connection with undue offsets made by the tax authorities against tax debts of prior years. In January 2016, Buenaventura Ingenieros S.A.: |
Currency | | Original maturities | | Annual interest rate | | | |
| | | | % | | US$(000) | |
| | | | | | | |
U.S. dollars | | From 113collected S/71,100,000 after the tax authorities accepted the appeal; the resolution of the appeal process related to 168 days | | From 0.90 to 1.07 | | | 4,000 | |
Nuevos Soles | | From 104 to 198 days | | From 4.10 to 4.48 | | | 6,121 | |
| | | | | | | | |
| | | | | | | 10,121 | the S/19,500,000 claim is pending. |
| 5. | Financial assets at fair value through profit or loss |
Buenaventura’s Management decided to invest the excess cash in mutual funds of variable income, which had been designated as financial assets at fair value through profit or loss. According to note 2.3.(b), the Company recorded in the year 2012 an increase in the net investment amounted to US$2,331,000 (US$2,024,000 in the year 2011), to profit and loss to take this investment at fair value as of December 31, 2012. The table below presents the components of this caption:
| | | 2012 | | | 2011 | |
| | | US$(000) | | | US$(000) | |
| | | | | | | |
| Credifondo S.A. SAF | | | 54,509 | | | | 52,178 | |
| | | | | | | | | |
| | | | 54,509 | | | | 52,178 | |
Notes to the consolidated financial statements (continued)
This fund is comprised by a portfolio of investments issued by Peruvian Government and financial entities with high reputation in the local market. The outcome of the investment is variable.
| 6. | Trade accounts receivable, netIn the opinion of the Group’s legal advisors, the tax offset made by the tax authorities have no legal support, so there are enough arguments to obtain a favorable outcome in the claim process initiated by the Group. |
| (a)(d) | The table below presentsCorresponds to deposits held in the components of this caption:Peruvian State bank which only can be used to offset tax obligations. |
| | | 2012 | | | 2011 | |
| | | US$(000) | | | US$(000) | |
| | | | | | | |
| Johnson Matthey Limited | | | 80,214 | | | | 78,520 | |
| Louis Dreyfus Commodities Metals | | | 48,253 | | | | 19,874 | |
| Glencore Peru S.A. | | | 45,014 | | | | 32,250 | |
| Doe Run Peru S.R.L. | | | 16,822 | | | | 16,814 | |
| MCC Non Ferrous Trading Inc. | | | 16,306 | | | | - | |
| MRI Trading GMBH | | | 11,805 | | | | - | |
| N.V. Umicore | | | 8,485 | | | | 12,175 | |
| Consorcio Minero S.A. – CORMIN | | | 7,340 | | | | 9,108 | |
| Minera Suyamarca S.A. | | | 5,045 | | | | - | |
| BHL Peru S.A.C. | | | 4,927 | | | | 4,927 | |
| Sumitomo Corporation of America | | | 4,367 | | | | - | |
| Rímac Internacional Cia. Seguros y Reaseguros | | | 4,210 | | | | - | |
| Sudamericana Trading S.R.L. | | | 3,358 | | | | 4,197 | |
| Werco Trade AG | | | 2,467 | | | | - | |
| Andina Trade S.A.C. | | | 2,458 | | | | - | |
| Traxys Peru S.A.C. | | | 2,002 | | | | 2,452 | |
| MK Metal Trading GMBH | | | 1,794 | | | | 3,318 | |
| Sinclair Knight Merz S.A.C. | | | 1,255 | | | | - | |
| Compañía Minera Ares S.A.C. | | | 1,251 | | | | - | |
| MR Trading AG | | | 1,080 | | | | 1,478 | |
| Transportadora Callao S.A. | | | 836 | | | | - | |
| Hudbay Peru S.A. | | | 695 | | | | - | |
| Empresa Administradora Cerro S.A. | | | 655 | | | | - | |
| Compañía Minera Antamina S.A. | | | 294 | | | | 1,207 | |
| Glencore International A.G. | | | - | | | | 631 | |
| Other minors | | | 7,239 | | | | 7,359 | |
| | | | 278,172 | | | | 194,310 | |
| Allowance for doubtful accounts (b) | | | (21,741 | ) | | | (21,741 | ) |
| | | | | | | | | |
| | | | 256,431 | | | | 172,569 | |
Notes to the consolidated financial statements (continued)
The accounts receivable are denominated in U.S. dollars, have current maturities, do not accrue interest, have no specific guarantees and are unsecured.
The aging of the trade accounts receivable balance was as follows:
As of December 31, 2012:
| | | Not impaired | | | Impaired | | | Total | |
| | | US$(000) | | | US$(000) | | | US$(000) | |
| | | | | | | | | | |
| Not due | | | 256,431 | | | | - | | | | 256,431 | |
| | | | | | | | | | | | | |
| Due | | | | | | | | | | | | |
| From 1 to 120 days | | | - | | | | - | | | | - | |
| More than 120 days | | | - | | | | 21,741 | | | | 21,741 | |
| | | | | | | | | | | | | |
| | | | 256,431 | | | | 21,741 | | | | 278,172 | |
As of December 31, 2011:
| | | Not impaired | | | Impaired | | | Total | |
| | | US$(000) | | | US$(000) | | | US$(000) | |
| | | | | | | | | | |
| Not due | | | 172,569 | | | | - | | | | 172,569 | |
| | | | | | | | | | | | | |
| Due | | | | | | | | | | | | |
| From 1 to 120 days | | | - | | | | - | | | | - | |
| More than 120 days | | | - | | | | 21,741 | | | | 21,741 | |
| | | | | | | | | | | | | |
| | | | 172,569 | | | | 21,741 | | | | 194,310 | |
In the process of estimating the allowance for doubtful accounts, the Company’s Management constantly evaluates market conditions, for which it uses analysis of aging and risk-rating reports for commercial operations.
| (b)(e) | The allowanceprovision for doubtful accounts hadhas shown no movement during 2012, 2011the years 2015, 2014 and 2010.2013. In the opinion of the Company’sGroup’s Management, the allowancebalance of the provision for doubtful accounts is sufficient to cover adequately the riskrisks of non-performance asfailure to date of the consolidated statement of financial position date. |
Notes to the consolidated financial statements (continued)
| 7. | Other accounts receivableposition. |
| (a) | The table below presents the components of this caption: |
| | | 2012 | | | 2011 | |
| | | US$(000) | | | US$(000) | |
| | | | | | | |
| Value added tax credit | | | 52,655 | | | | 22,235 | |
| Income tax credit | | | 24,629 | | | | 1,558 | |
| Other accounts receivable to contractors | | | 16,993 | | | | 10,166 | |
| Advances to suppliers | | | 13,929 | | | | 7,457 | |
| Loans to employees | | | 1,421 | | | | 1,025 | |
| Loans to third parties | | | 725 | | | | 2,966 | |
| Other advances to employees | | | 662 | | | | 360 | |
| Claims to third parties | | | 580 | | | | - | |
| Warrant deposits | | | 363 | | | | 397 | |
| Interest receivable, other | | | 47 | | | | 1,497 | |
| Mining royalty credit | | | - | | | | 1,057 | |
| Valued added tax claimed | | | - | | | | 1,502 | |
| Other accounts receivable | | | 3,266 | | | | 3,871 | |
| | | | 115,270 | | | | 54,091 | |
| Less – Non current portion | | | | | | | | |
| Value added tax credit | | | (6,695 | ) | | | (5,537 | ) |
| Other minors | | | (7 | ) | | | (33 | ) |
| | | | (6,702 | ) | | | (5,570 | ) |
| | | | | | | | | |
| Current portion | | | 108,568 | | | | 48,521 | |
| (a) | The table below presents the components of this caption:This caption is made up as follows: |
| | | 2012 | | | 2011 | |
| | | US$(000) | | | US$(000) | |
| | | | | | | |
| Finished goods | | | 31,163 | | | | 19,026 | |
| Products in process (b) | | | 148,533 | | | | 140,775 | |
| Spare parts and supplies | | | 42,552 | | | | 41,205 | |
| | | | 222,248 | | | | 201,006 | |
| Provision for impairment of value of inventory (f) | | | (3,244 | ) | | | (3,053 | ) |
| | | | 219,004 | | | | 197,953 | |
| Less non-current portion (b) | | | (55,937 | ) | | | (48,845 | ) |
| | | | | | | | | |
| Current portion | | | 163,067 | | | | 149,108 | |
Notes to the consolidated financial statements (continued)
| | | 2015 | | | 2014 | |
| | | US$(000) | | | US$(000) | |
| | | | | | | |
| Finished goods | | | 12,787 | | | | 32,375 | |
| Products in process | | | 87,275 | | | | 119,239 | |
| Spare parts and supplies | | | 47,912 | | | | 40,493 | |
| | | | 147,974 | | | | 192,107 | |
| Provision for impairment of value of inventory (b) | | | (20,472 | ) | | | (7,735 | ) |
| | | | | | | | | |
| | | | 127,502 | | | | 184,372 | |
| | | | | | | | | |
| Classification by use: | | | | | | | | |
| Current portion | | | 101,473 | | | | 150,284 | |
| Non-current portion | | | 26,029 | | | | 34,088 | |
| | | | | | | | | |
| | | | 127,502 | | | | 184,372 | |
| (b) F-44 | The products in process include the following: |
| | | 2012 | | | 2011 | |
| | | US$(000) | | | US$(000) | |
| | | | | | | |
| Classified mineral (c) | | | 69,149 | | | | 62,052 | |
| Leach platform (d) | | | 35,885 | | | | 19,646 | |
| Ore cyanidation process | | | 21,044 | | | | 14,956 | |
| Activated coal (e) | | | 16,269 | | | | 21,541 | |
| Current mineral | | | 4,344 | | | | 18,748 | |
| Other | | | 1,842 | | | | 3,832 | |
| | | | | | | | | |
| | | | 148,533 | | | | 140,775 | |
| Less non-current position (e) | | | (55,937 | ) | | | (48,845 | ) |
| | | | | | | | | |
| Current position | | | 92,596 | | | | 91,930 | |
| (c) | The table below presents the detail of long-term inventory which corresponds to classified mineral that is kept in Tajo Norte deposit field by the subsidiary El Brocal: |
| | | 2012 | | | 2011 | |
| | | US$(000) | | | DMT | | | US$(000) | | | DMT | |
| | | | | | | | | | | | | |
| Classified mineral | | | | | | | | | | | | | | | | |
| Type II (copper mineral) | | | 3,672 | | | | 494,280 | | | | 8,584 | | | | 859,556 | |
| Type III (lead/zinc mineral) | | | 65,477 | | | | 2,405,266 | | | | 53,468 | | | | 2,828,274 | |
| Total | | | 69,149 | | | | 2,899,546 | | | | 62,052 | | | | 3,687,830 | |
| | | | | | | | | | | | | | | | | |
| Non-current portion | | | 55,937 | | | | | | | | 48,845 | | | | | |
| | | | | | | | | | | | | | | | | |
| Current portion | | | 13,212 | | | | | | | | 13,207 | | | | | |
As part of the mining unit preparation to extract and treat mineral to a 18,000 DMT/per day, El Brocal´s Management decided to accumulate the material with metal content in stock nearby to Tajo Norte in order to be treated when the expansion operation plant, which is estimated to be in the first semester of 2013.
El Brocal´s Management assessed the recoverability of its inventories in process based on the cash flow projections obtained by the production and sale of the different minerals. As of December 31, 2012 and 2011 Management has a plan to treat mineral in stock when the expansion operation plan finish, mentioned before, including the future costs of treatment and finishing, based on this plan these products will be recovery through trading.
Notes to the consolidated financial statements(continued)
Products in process include mineral deposits located in the Tajo Norte mining unit. The detail of this mineral as of December 31, 2015 and 2014 is presented below:
| | | 2015 | | | 2014 | |
| | | US$(000) | | | DMT | | | US$(000) | | | DMT | |
| | | | | | | | | | | | | |
| Type I and II (copper) | | | 73 | | | | 6,923 | | | | 1,261 | | | | 68,782 | |
| Type III (lead/zinc) | | | 31,004 | | | | 1,848,414 | | | | 45,963 | | | | 2,746,634 | |
| Provision for impairment of value in mineral classified in process (type I, II and III) | | | (4,975 | ) | | | - | | | | - | | | | - | |
| | | | | | | | | | | | | | | | | |
| | | | 26,102 | | | | 1,855,337 | | | | 47,224 | | | | 2,815,416 | |
| | | | | | | | | | | | | | | | | |
| Classification by use: | | | | | | | | | | | | | | | | |
| Current portion | | | 73 | | | | | | | | 13,136 | | | | | |
| Non-current portion | | | 26,029 | | | | | | | | 34,088 | | | | | |
| | | | | | | | | | | | | | | | | |
| | | | 26,102 | | | | | | | | 47,224 | | | | | |
As part of the preparation of the mining unit to extract and process ore at a volume of 18,000 DMT/ day, Management of El Brocal decided to accumulate mineral with metal content in the proximity of the Tajo Norte mine, which has been treated since the first quarter of 2015.
| (d) | It includes gold content of mineral deposited in leach platforms, whose recovery is achieved through its exposure to acid sulphuric solutions (leaching) and subsequent transfer to the electro-winning plant to produce gold bars. The recovery factor of ounces of gold contained in leach is estimated based upon metallurgical assays performed on the material treated. |
| (e) | Activated coal is related to granules of precious metals with crushed coconut shell which are the result of the gold and silver recovery method through cyanide saturated solutions. This material is available for the next precious metals recovery process. |
| (f)(b) | The provision for impairment of value of inventory had the following movement during the years 2012, 20112015, 2014 and 2010:2013: |
| | | 2012 | | | 2011 | | | 2010 | |
| | | US$(000) | | | US$(000) | | | US$(000) | |
| | | | | | | | | | |
| Opening balance | | | 3,053 | | | | 5,091 | | | | 3,066 | |
| Provision for impairment of finished goods, note 19 | | | 212 | | | | 383 | | | | 1,648 | |
| Reversal of provision | | | (21 | ) | | | (2,413 | ) | | | (339 | ) |
| Provision for impairment of spare parts and Supplies | | | - | | | | - | | | | 716 | |
| Write-offs | | | - | | | | (8 | ) | | | - | |
| | | | | | | | | | | | | |
| Ending balance | | | 3,244 | | | | 3,053 | | | | 5,091 | |
| | | 2015 | | | 2014 | | | 2013 | |
| | | US$(000) | | | US$(000) | | | US$(000) | |
| | | | | | | | | | |
| Beginning balance | | | 7,735 | | | | 6,647 | | | | 3,160 | |
| | | | | | | | | | | | | |
| Provision for impairment of finished goods and products in process, Note 22(a) | | | 11,621 | | | | 1,152 | | | | 3,931 | |
| Provision (reversal) of provision for impairment of spare parts and supplies | | | 1,116 | | | | (64 | ) | | | (444 | ) |
| | | | | | | | | | | | | |
| Final balance | | | 20,472 | | | | 7,735 | | | | 6,647 | |
In the opinion of Company’sGroup’s Management, the provision for impairment of value of inventory adequately covers this risk as of the date of the consolidated statementstatements of financial position.
Notes to the consolidated financial statements(continued)
| (a) | This caption is made up as follows: |
| | | 2015 | | | 2014 | |
| | | US$(000) | | | US$(000) | |
| | | | | | | |
| Prepaid rentals (b) | | | 29,235 | | | | - | |
| Prepaid insurances | | | 3,471 | | | | 9,655 | |
| Deferred costs of works for taxes | | | 1,801 | | | | 1,462 | |
| Deferred royalties and rentals of mining concessions | | | 463 | | | | 1,697 | |
| Other prepaid expenses | | | 2,496 | | | | 4,140 | |
| | | | | | | | | |
| | | | 37,466 | | | | 16,954 | |
| | | | | | | | | |
| Classification by maturity: | | | | | | | | |
| Current portion | | | 8,231 | | | | 16,954 | |
| Non-current portion | | | 29,235 | | | | - | |
| | | | | | | | | |
| | | | 37,466 | | | | 16,954 | |
| (b) | This item corresponds to the balance of an original prepayment of US$31,007,190 for the lease of hydraulic installations by the subsidiary Empresa de Generacion Huanza S.A. This prepayment is being charged to results during the life of the underlying assets (35 years). |
| 11. | Investments in associates |
| | |
| (a) | The table below presents the components of this caption:This caption is made up as follows: |
| | | Share in
shareholders’ equity | | | Amount | |
| | | 2012 | | | 2011 | | | 2012 | | | 2011 | |
| | | % | | | % | | | US$(000) | | | US$(000) | |
| Investments held under the equity method | | | | | | | | | | | | |
| Minera Yanacocha S.R.L. (d) and (e) | | | 43.65 | | | | 43.65 | | | | 1,585,395 | | | | 1,312,051 | |
Notes to the consolidated financial statements (continued)
| | | Share in
shareholders’ equity | | | Amount | |
| | | 2012 | | | 2011 | | | 2012 | | | 2011 | |
| | | | | | | | | | | | | |
| Sociedad Minera Cerro Verde S.A.A. (c), (e) and (h) | | | 19.584 | | | | 19.349 | | | | 783,368 | | | | 602,790 | |
| Canteras del Hallazgo S.A.C. (g) | | | 49.00 | | | | 49.00 | | | | 32,423 | | | | 5,237 | |
| Compañía Minera Coimolache S.A. (f) | | | 40.095 | | | | 40.095 | | | | 32,365 | | | | 9,879 | |
| Available-for-sale investments | | | | | | | | | | | | | | | | |
| Other | | | | | | | | | | | 2,686 | | | | 5,047 | |
| | | | | | | | | | | | | | | | | |
| | | | | | | | | | | | 2,436,237 | | | | 1,935,004 | |
| | | Share in equity | | | | |
| | | 2015 | | | 2014 | | | 2015 | | | 2014 | |
| | | % | | | % | | | US$(000) | | | US$(000) | |
| | | | | | | | | | | | | |
| Minera Yanacocha S.R.L. | | | 43.65 | | | | 43.65 | | | | 989,130 | | | | 1,185,971 | |
| Sociedad Minera Cerro Verde S.A.A. | | | 19.584 | | | | 19.584 | | | | 988,725 | | | | 982,206 | |
| Compañía Minera Coimolache S.A. | | | 40.095 | | | | 40.095 | | | | 62,609 | | | | 52,685 | |
| Other minor investments | | | | | | | | | | | 3,519 | | | | 3,519 | |
| | | | | | | | | | | | | | | | | |
| | | | | | | | | | | | 2,043,983 | | | | 2,224,381 | |
| (b) | The table below presents the net share in resultsprofit (loss) of associates: |
| | | 2012 | | | 2011 | | | 2010 | |
| | | US$(000) | | | US$(000) | | | US$(000) | |
| | | | | | | | | | |
| Minera Yanacocha S.R.L. (c) | | | 272,851 | | | | 279,726 | | | | 251,497 | |
| Sociedad Minera Cerro Verde S.A.A. (c) | | | 151,201 | | | | 208,659 | | | | 206,907 | |
| Compañía Minera Coimolache S.A.C. (f) | | | 40,187 | | | | 9,648 | | | | (15,859 | ) |
| Canteras del Hallazgo S.A.C. (g) | | | - | | | | (29,670 | ) | | | (13,660 | ) |
| | | | | | | | | | | | | |
| | | | 464,239 | | | | 468,363 | | | | 428,885 | |
| (c) | The investments held in Yanacocha (a gold mine located in Cajamarca, Peru), through Compañía Minera Condesa S.A., and Cerro Verde (a copper mine located in Arequipa, Peru), represent the Company’s most significant investments. The share in their results has been significant in relation to the Company’s net earnings in 2012, 2011 and 2010. |
| (d) | Yanacocha is developing the Conga project, which consists of two gold-copper porphyry deposits located northeast of the Yanacocha operating area in the provinces of Celendín, Cajamarca and Hualgayoc. As of April 17, 2012, the independent experts hired by Peruvian Government, issued the international report on water component of the environmental impact study for Conga mining project, which validates essentially the environmental impact study approved in 2010 and includes recommendations for improvement. On June 22, 2012, Yanacocha´s Management has approved the recommendations made by independent experts. As a result, Yanacocha’s Management has reprogrammed the development activities, focusing on recommended water sustainability activities. |
Notes to the consolidated financial statements (continued)
| (e) | In order to calculate the investment amount and share in the result of Minera Yanacocha S.R.L. (hereinafter “Yanacocha”) and Sociedad Minera Cerro Verde S.A.A. (hereinafter “Cerro Verde”), the Company had used the following information: |
Yanacocha issues financial statements under Generally Accepted Accounting Principles in Peru and also under U.S. GAAP for its parent. There were no significant differences between US GAAP and Peruvian GAAP for Yanacocha.
As part of the adoption to IFRS, in 2011, the Company assessed the significant differences in Yanacocha´s financial statements between U.S. GAAP and IFRS and prepared a reconciliation of equity net as of December 31, 2012, 2011 and 2010 and the net income in the years 2012, 2011 and 2010 prepared under U.S. GAAP and IFRS in order to calculate its investment and participation under IFRS in Yanacocha to these dates.
The table below presents the principal amounts under U.S. GAAP as of December 31, 2012, 2011 and 2010.
| | | Yanacocha | |
| | | 2012 | | | 2011 | | | 2010 | |
| | | US$(000) | | | US$(000) | | | US$(000) | |
| Statement of financial position | | | | | | | | | | | | |
| Total assets | | | 4,541,535 | | | | 3,787,235 | | | | 2,936,994 | |
| Total liabilities | | | 970,845 | | | | 844,213 | | | | 634,848 | |
| Shareholders’ equity | | | 3,570,690 | | | | 2,943,022 | | | | 2,302,146 | |
| | | | | | | | | | | | | |
| Results | | | | | | | | | | | | |
| Total income | | | 2,201,815 | | | | 2,002,602 | | | | 1,778,260 | |
| Operating income | | | 982,367 | | | | 905,001 | | | | 855,309 | |
| Net income | | | 626,540 | | | | 642,387 | | | | 589,894 | |
The table below presents the reconciliation of the shareholders´ equity prepared under U.S. GAAP with those prepared under IFRS prepared by the Company´s Management as of December 31, 2012 and 2011, and net income as of December 31, 2012, 2011 and 2010:
Notes to the consolidated financial statements (continued)
| | | 2012 | | | 2011 | | | 2010 | |
| | | US$(000) | | | US$(000) | | | US$(000) | |
| | | | | | | | | | |
| Shareholders´equity under U.S. GAAP | | | 3,570,691 | | | | 2,943,022 | | | | 2,302,146 | |
| | | | | | | | | | | | | |
| Reversal of deferred workers´ profit sharing | | | 19,800 | | | | 16,979 | | | | 18,150 | |
| Deemed cost of property, plant and equipment | | | 17,130 | | | | 21,084 | | | | 28,069 | |
| Deferred income tax for IFRS adjustments | | | (9,661 | ) | | | (10,971 | ) | | | (11,766 | ) |
| Valuation of inventories | | | (3,123 | ) | | | (1,494 | ) | | | (7,307 | ) |
| | | | | | | | | | | | | |
| Shareholders´equity under IFRS | | | 3,594,837 | | | | 2,968,620 | | | | 2,329,292 | |
| | | | | | | | | | | | | |
| Net income under U.S. GAAP | | | 626,540 | | | | 642,387 | | | | 589,894 | |
| | | | | | | | | | | | | |
| Deferred income tax | | | 4,131 | | | | (376 | ) | | | 6,742 | |
| Increased of depreciation for deemed cost of property, plant and equipment | | | (3,954 | ) | | | (6,985 | ) | | | (12,442 | ) |
| Valuation of inventories | | | (1,629 | ) | | | 5,813 | | | | (8,027 | ) |
| | | | | | | | | | | | | |
| Net income under IFRS | | | 625,088 | | | | 640,839 | | | | 576,167 | |
The table below presents the principal amounts in Cerro Verde as of December 31, 2012, 2011 and 2010 under IFRS.
| | | 2012 | | | 2011 | | | 2010 | |
| | | US$(000) | | | US$(000) | | | US$(000) | |
| | | | | | | | | | |
| Statement of financial position | | | | | | | | | | | | |
| Total assets | | | 4,042,771 | | | | 3,196,597 | | | | 2,294,078 | |
| Total liabilities | | | 593,063 | | | | 518,959 | | | | 694,839 | |
| Shareholders’ equity | | | 3,449,708 | | | | 2,677,638 | | | | 1,599,239 | |
| | | | | | | | | | | | | |
| Results | | | | | | | | | | | | |
| Total income | | | 2,127,023 | | | | 2,520,050 | | | | 2,368,988 | |
| Operating income | | | 1,217,274 | | | | 1,559,280 | | | | 1,555,834 | |
| Net income | | | 772,070 | | | | 1,078,399 | | | | 1,074,393 | |
On July 17, 2012, Cerro Verde subscribed a new Agreement of Guarantees and Measures to Promote Investments with the Government of Peru, under the General Mining Law and in connection with the Expansion of operations program. This new agreement will enable the Cerro Verde’s Management to establish a tax system for the expansion and according to the management’s option; it will be in force in 2014. According to this agreement, from the time it is in force, the new income tax rate will be 32 per cent.
Notes to the consolidated financial statements (continued)
| (f) | Compañía Minera Coimolache S.A.- |
Compañía Minera Coimolache S.A. (hereafter “Coimolache”) is located in the province of Hualgayoc, which includes the districts of Hualgayoc and Chugur in Cajamarca region and has reserves of 528,000 ounces of gold (unaudited). Coimolache started operations in the third quarter of 2011. As December 31, 2012, the production amounted to 139,253 ounces of gold and 914,779 ounces of silver (50,916 ounces of gold and 298,674 ounces of silver as of December 31, 2011).
The table below presents the main figures audited from financial statements of Coimolache, restructured according to Buenaventura’s accounting practices:
| | | 2012 | | | 2011 | | | 2010 | |
| | | US$(000) | | | US$(000) | | | US$(000) | |
| Statement of financial position |
| Total assets | | | 218,380 | | | | 181,372 | | | | 67,948 | |
| Total liabilities | | | 137,658 | | | | 156,734 | | | | 80,395 | |
| Equity, net | | | 80,722 | | | | 24,638 | | | | (12,447 | ) |
| | | | | | | | | | | | | |
| Income Statement |
| Total income | | | 262,596 | | | | 79,176 | | | | - | |
| Net income (loss) | | | 100,229 | | | | 26,886 | | | | (40,639 | ) |
| (g) | Canteras del Hallazgo S.A.C.: Chucapaca Project - |
The mining project is located in Moquegua. There are evidences of gold, copper and silver in Chucapaca project zone, at Canahuire deposit.
As of December 31, 2012, the project is in Feasibility and Environmental Studies, which are expected to be concluded at the end of 2013 and it continues with exploration works in order to dimension the magnitude of mining field. Based on investment program agreed with the other shareholder, the Company disbursed contributions which allow the project development. As of December 31, 2012, Buenaventura’s contribution amounted to US$153,303,000 (US$97,820,000 as of December 31, 2011).
Notes to the consolidated financial statements (continued)
The table below presents the main figures audited from financial statements of Canteras del Hallazgo, restructured according to Buenaventura’s accounting practices:
| | | 2012 | | | 2011 | | | 2010 | |
| | | US$(000) | | | US$(000) | | | US$(000) | |
| | | | | | | | | | |
| Statement of financial position |
| Total assets | | | 73,013 | | | | 18,980 | | | | 9,018 | |
| Total liabilities | | | 6,842 | | | | 8,292 | | | | 3,468 | |
| Equity, net | | | 66,171 | | | | 10,688 | | | | 5,550 | |
| | | | | | | | | | | | | |
| Income Statement |
| Total income | | | - | | | | - | | | | - | |
| Net income (loss) | | | - | | | | (59,377 | ) | | | (32,030 | ) |
| | | 2015 | | | 2014 | | | 2013 | |
| | | US$(000) | | | US$(000) | | | US$(000) | |
| | | | | | | | | | |
| Minera Yanacocha S.R.L. | | | (196,510 | ) | | | (174,747 | ) | | | (251,109 | ) |
| Sociedad Minera Cerro Verde S.A.A. | | | 6,518 | | | | 77,891 | | | | 116,160 | |
| Compañía Minera Coimolache S.A. | | | 16,617 | | | | 22,256 | | | | 20,804 | |
| | | | | | | | | | | | | |
| | | | (173,375 | ) | | | (74,600 | ) | | | (114,145 | ) |
Notes to the consolidated financial statements(continued)
Investments held by the Group in its associates Minera Yanacocha S.R.L. (through its subsidiary Compañía Minera Condesa S.A.) and Sociedad Minera Cerro Verde S.A.A., represent the most significant investments of the Group. Its operations are strategic to the Group's activities and participation in their results has been important in relation to profits (losses) of the Group in the years 2015, 2014 and 2013. The following relevant information on these investments is as follows:
Investment in Minera Yanacocha S.R.L. -
The Company, through its subsidiary Compañía Minera Condesa S.A., has an interest of 43.65% of Yanacocha. Yanacocha is engaged in gold production and exploration and development of gold and copper in its own concessions or owned by S.R.M.L. Chaupiloma Dos de Cajamarca, with which it signed a contract for use of mineral rights.
During the last several years, Yanacocha has been developing the Conga project, which consists of two deposits of gold and porphyry of copper located at northeast of the Yanacocha operating area in the provinces of Celendín, Cajamarca and Hualgayoc (Peru).
Because of local communities and political protests for potential water impacts of the project development activities and construction the projects are suspended since November 2011. To date, Yanacocha’s management has been making only water support activities recommended by independent experts, mainly the construction of water reservoirs, before carrying out any development project.
The table below presents key financial data from the financial statements of Yanacocha under IFRS:
| | | 2015 | | | 2014 | |
| | | US$(000) | | | US$(000) | |
| | | | | | | |
| Statements of financial position as of December 31: | | | | | | | | |
| Current assets | | | 1,345,682 | | | | 1,275,288 | |
| Non-current assets | | | 1,619,748 | | | | 2,207,881 | |
| Current liabilities | | | (85,033 | ) | | | (189,212 | ) |
| Non-current liabilities | | | (651,572 | ) | | | (614,180 | ) |
| | | | | | | | | |
| Shareholders’ equity, reported | | | 2,228,825 | | | | 2,679,777 | |
| | | | | | | | | |
| Groups’ interest (43.65%) | | | 972,882 | | | | 1,169,723 | |
| Goodwill | | | 16,248 | | | | 16,248 | |
| | | | | | | | | |
| | | | 989,130 | | | | 1,185,971 | |
Notes to the consolidated financial statements(continued)
| | | 2015 | | | 2014 | | | 2013 | |
| | | US$(000) | | | US$(000) | | | US$(000) | |
| | | | | | | | | | |
| Statements of profit or loss as of December 31, | | | | | | | | | | | | |
| Net sales | | | 1,031,174 | | | | 1,165,299 | | | | 1,406,825 | |
| Other operating income | | | 10,625 | | | | 20,705 | | | | 29,181 | |
| Costs of sales | | | (751,736 | ) | | | (910,705 | ) | | | (983,238 | ) |
| Cost of other operating income | | | (2,524 | ) | | | (22,422 | ) | | | (28,672 | ) |
| Operating expenses | | | (82,846 | ) | | | (77,781 | ) | | | (77,534 | ) |
| Administrative expenses | | | (26,325 | ) | | | (38,262 | ) | | | (67,064 | ) |
| Selling expenses | | | (3,534 | ) | | | (4,458 | ) | | | (3,740 | ) |
| Impairment loss of long-lived assets | | | - | | | | (541,141 | ) | | | (1,038,548 | ) |
| Finance income (costs) | | | (22,061 | ) | | | (23,206 | ) | | | (18,025 | ) |
| Gain (loss) from currency exchange difference | | | (251 | ) | | | 1,142 | | | | 2,065 | |
| Income (loss) before income tax | | | 152,522 | | | | (430,829 | ) | | | (778,750 | ) |
| Income tax | | | (602,717 | ) | | | 30,491 | | | | 203,471 | |
| Net loss reported | | | (450,195 | ) | | | (400,338 | ) | | | (575,279 | ) |
| | | | | | | | | | | | | |
| Group’s interest (43.65%) | | | (196,510 | ) | | | (174,747 | ) | | | (251,109 | ) |
During the years 2014 and 2013, Yanacocha recorded impairment charges of its long-lived assets, net of tax, of US$378,799,000 and US$726,984,000, respectively, which reduced Yanacocha´s net equity and, therefore, the equity participation of the Group in this associate in those years. These impairment losses mainly resulted from the postponement of the development activities due to the serious difficulties to get the social license to operate the Conga project.
In December 2015, Yanacocha recorded charges for deferred income tax recoverability by US$510,000,000 since Management considers it improbable that taxable profit will be available to compensate against the deductible temporary differences.
In February 2016, the Committee agreed unanimously the distribution to the partners, in proportion to its social share, of US$ 300 million, which correspond to the portion of the retained earnings as of December 31, 2014, originated in 2011.
Investment in Sociedad Minera Cerro Verde S.A.A. (Cerro Verde) -
Cerro Verde is engaged in the extraction, production and marketing of cathodes and copper concentrate from its mining unit that is located in Uchumayo, Arequipa, Peru.
Notes to the consolidated financial statements(continued)
The table below presents the key financial data from the financial statements of Cerro Verde under IFRS:
| | | 2015 | | | 2014 | |
| | | US$(000) | | | US$(000) | |
| | | | | | | |
| Statements of financial position as of December 31: | | | | | | | | |
| Current assets | | | 1,056,525 | | | | 677,652 | |
| Non-current assets | | | 6,796,167 | | | | 5,094,332 | |
| Current liabilities | | | (548,517 | ) | | | (552,572 | ) |
| Non-current liabilities | | | (2,805,801 | ) | | | (754,322 | ) |
| | | | | | | | | |
| Shareholders’ equity, reported | | | 4,498,374 | | | | 4,465,090 | |
| | | | | | | | | |
| Group’s interest (19.584%) | | | 880,962 | | | | 874,443 | |
| Goodwill | | | 107,763 | | | | 107,763 | |
| | | | | | | | | |
| | | | 988,725 | | | | 982,206 | |
| | | 2015 | | | 2014 | | | 2013 | |
| | | US$(000) | | | US$(000) | | | US$(000) | |
| | | | | | | | | | |
| Statements of profit or loss for the years ended December 31: | | | | | | | | | | | | |
| Revenue | | | 1,115,617 | | | | 1,467,097 | | | | 1,811,488 | |
| Cost of sales | | | (862,004 | ) | | | (797,481 | ) | | | (795,064 | ) |
| Sales expenses | | | (56,215 | ) | | | (54,210 | ) | | | (68,448 | ) |
| Other operating income (expenses) | | | (26,600 | ) | | | (3,629 | ) | | | 147 | |
| Finance costs | | | (16,010 | ) | | | (369 | ) | | | (1,843 | ) |
| Finance income | | | 512 | | | | 2,443 | | | | 2,178 | |
| Net gain (loss) of exchange difference | | | (75,770 | ) | | | 2,284 | | | | (1,858 | ) |
| Profit before income taxes | | | 79,530 | | | | 616,135 | | | | 946,600 | |
| Income tax | | | (46,246 | ) | | | (238,529 | ) | | | (333,338 | ) |
| Net profit, reported | | | 33,284 | | | | 377,606 | | | | 613,262 | |
| Adjustments to conform to the accounting policies of the Group | | | - | | | | 20,124 | | | | (20,124 | ) |
| Net profit, adjusted | | | 33,284 | | | | 397,730 | | | | 593,138 | |
| | | | | | | | | | | | | |
| Group’s interest (19.584%) | | | 6,518 | | | | 77,891 | | | | 116,160 | |
Market capitalization:
As of December 31, 2015 and 2014, total market capitalization of 68,555,000 shares maintained by the Group in Cerro Verde was US$994,047,000 and US$1,645,319,000, respectively (market capitalization value of US$14.50 and US$24.00 per unit, respectively).
Notes to the consolidated financial statements(continued)
Investment in Compañía Minera Coimolache S.A. (Coimolache) -
Coimolache is involved in the production and the sales of gold and silver from its open-pit mining unit located in Cajamarca, Peru.
The table below presents the key financial data from the financial statements of Coimolache under IFRS:
| | | 2015 | | | 2014 | |
| | | US$(000) | | | US$(000) | |
| Statements of financial position as of December 31: | | | | | | | | |
| Current assets | | | 62,823 | | | | 69,640 | |
| Non-current assets | | | 175,351 | | | | 139,421 | |
| Current liabilities | | | (27,283 | ) | | | (37,115 | ) |
| Non-current liabilities | | | (35,836 | ) | | | (18,607 | ) |
| Shareholders’ equity, reported | | | 175,055 | | | | 153,339 | |
| Adjustments to conform to the accounting policies of the Group | | | (18,901 | ) | | | (21,939 | ) |
| | | | | | | | | |
| Shareholders’ equity, adjusted | | | 156,154 | | | | 131,400 | |
| | | | | | | | | |
| Group’s interest (40.095%) | | | 62,609 | | | | 52,685 | |
| | | 2015 | | | 2014 | | | 2013 | |
| | | US$(000) | | | US$(000) | | | US$(000) | |
| | | | | | | | | | |
| Statements of profit or loss for the years ended December 31: | | | | | | | | | | | | |
| Revenue | | | 177,347 | | | | 192,369 | | | | 209,636 | |
| Cost of sales | | | (104,549 | ) | | | (100,649 | ) | | | (124,325 | ) |
| Administrative expenses | | | (2,185 | ) | | | (2,073 | ) | | | (1,843 | ) |
| Sales expenses | | | (1,111 | ) | | | (1,077 | ) | | | (522 | ) |
| Other operating income (expenses) | | | 765 | | | | 929 | | | | 779 | |
| Finance income | | | 23 | | | | 47 | | | | 335 | |
| Finance costs | | | (723 | ) | | | (583 | ) | | | (2,385 | ) |
| Exchange difference | | | (1,300 | ) | | | (1,465 | ) | | | (524 | ) |
| Profit before income taxes | | | 68,267 | | | | 87,498 | | | | 81,151 | |
| Income tax | | | (29,861 | ) | | | (36,090 | ) | | | (34,156 | ) |
| Net profit, reported | | | 38,406 | | | | 51,408 | | | | 46,995 | |
| Adjustments to conform to the accounting policies of the Group | | | 3,038 | | | | 4,099 | | | | 4,892 | |
| | | | | | | | | | | | | |
| Net profit, adjusted | | | 41,444 | | | | 55,507 | | | | 51,887 | |
| | | | | | | | | | | | | |
| Group’s interest (40.095%) | | | 16,617 | | | | 22,256 | | | | 20,804 | |
Notes to the consolidated financial statements(continued)
| 10.12. | Mining concessions, development costs, property, plant and equipment, net |
| (a) | Below is presented the movement in cost, depreciation and amortization, as well as the provision for accumulated impairment of long-lived assets:cost: |
| | | As of
January 1,
2011 | | | Additions | | | Retirements | | | Sales | | | Transfers | | | As of
December 31,
2011 | | | Additions | | | Retirements | | | Sales | | | Transfers | | | As of
December 31,
2012 | |
| | | US$(000) | | | US$(000) | | | US$(000) | | | US$(000) | | | US$(000) | | | US$(000) | | | US$(000) | | | US$(000) | | | US$(000) | | | US$(000) | | | US$(000) | |
| | | | | | | | | | | | | | | | | | | | | | | | | | | | | | | | | | |
| Cost | | | | | | | | | | | | | | | | | | | | | | | | | | | | | | | | | | | | | | | | | | | | |
| Land | | | 2,668 | | | | 359 | | | | - | | | | - | | | | 1,034 | | | | 4,061 | | | | 1,968 | | | | - | | | | - | | | | - | | | | 6,029 | |
| Mining land | | | 7,215 | | | | - | | | | - | | | | - | | | | - | | | | 7,215 | | | | - | | | | - | | | | - | | | | - | | | | 7,215 | |
| Mining concessions | | | 15,000 | | | | - | | | | - | | | | - | | | | - | | | | 15,000 | | | | - | | | | - | | | | - | | | | - | | | | 15,000 | |
| Mining concessions (b) | | | 123,881 | | | | - | | | | - | | | | - | | | | - | | | | 123,881 | | | | - | | | | - | | | | - | | | | - | | | | 123,881 | |
| Development costs (c) | | | 233,127 | | | | 24,414 | | | | - | | | | - | | | | - | | | | 257,541 | | | | 35,391 | | | | - | | | | - | | | | - | | | | 292,932 | |
| Buildings, construction and other | | | 261,156 | | | | 849 | | | | (1,055 | ) | | | - | | | | 63,925 | | | | 324,875 | | | | 8,673 | | | | (612 | ) | | | (12 | ) | | | 172,825 | | | | 505,749 | |
| Machinery and equipment | | | 304,308 | | | | 36,024 | | | | (895 | ) | | | (531 | ) | | | 27,809 | | | | 366,715 | | | | 76,850 | | | | (597 | ) | | | (8,378 | ) | | | 25,331 | | | | 459,921 | |
| Transportation units | | | 9,671 | | | | 1,248 | | | | (118 | ) | | | (391 | ) | | | 753 | | | | 11,163 | | | | 742 | | | | (212 | ) | | | (460 | ) | | | 734 | | | | 11,967 | |
| Furniture and mixtures | | | 10,419 | | | | 215 | | | | (37 | ) | | | - | | | | 175 | | | | 10,772 | | | | 785 | | | | - | | | | (82 | ) | | | 781 | | | | 12,256 | |
| Units in transit | | | 9,284 | | | | 106,667 | | | | - | | | | - | | | | (71,625 | ) | | | 44,326 | | | | 49,970 | | | | (8 | ) | | | - | | | | (50,616 | ) | | | 43,672 | |
| Works in progress | | | 205,693 | | | | 130,212 | | | | - | | | | (1,491 | ) | | | (22,071 | ) | | | 312,343 | | | | 268,548 | | | | - | | | | - | | | | (149,055 | ) | | | 431,836 | |
| Stripping cost | | | 1,266 | | | | 17,828 | | | | - | | | | - | | | | - | | | | 19,094 | | | | - | | | | - | | | | - | | | | - | | | | 19,094 | |
| Mine closure costs | | | 33,654 | | | | 785 | | | | - | | | | - | | | | - | | | | 34,439 | | | | 21,779 | | | | - | | | | - | | | | – | | | | 56,218 | |
| | | | 1,217,342 | | | | 318,601 | | | | (2,105 | ) | | | (2,413 | ) | | | - | | | | 1,531,425 | | | | 464,706 | | | | (1,429 | ) | | | (8,932 | ) | | | - | | | | 1,985,770 | |
| Accumulated depreciation and amortization | | | | | | | | | | | | | | | | | | | | | | | | | | | | | | | | | | | | | | | | | | | | |
| Mining land | | | 2,304 | | | | - | | | | - | | | | - | | | | - | | | | 2,304 | | | | 898 | | | | - | | | | - | | | | - | | | | 3,202 | |
| Mining concessions (b) | | | 59,943 | | | | 12,269 | | | | - | | | | - | | | | - | | | | 72,212 | | | | 3,643 | | | | - | | | | - | | | | - | | | | 75,855 | |
| Development costs (c) | | | 144,386 | | | | 35,930 | | | | - | | | | - | | | | - | | | | 180,316 | | | | 40,727 | | | | - | | | | - | | | | - | | | | 221,043 | |
| Buildings, construction and other | | | 142,837 | | | | 29,491 | | | | (1,049 | ) | | | - | | | | - | | | | 171,279 | | | | 46,130 | | | | (610 | ) | | | (2 | ) | | | - | | | | 216,797 | |
| Machinery and equipment | | | 193,064 | | | | 38,228 | | | | (863 | ) | | | (251 | ) | | | - | | | | 230,178 | | | | 55,653 | | | | (215 | ) | | | (4,801 | ) | | | 4 | | | | 280,819 | |
Notes to the consolidated financial statements (continued)
| | | As of
January 1,
2011 | | | Additions | | | Retirements | | | Sales | | | Transfers | | | As of
December 31,
2011 | | | Additions | | | Retirements | | | Sales | | | Transfers | | | As of
December 31,
2012 | |
| | | US$(000) | | | US$(000) | | | US$(000) | | | US$(000) | | | US$(000) | | | US$(000) | | | US$(000) | | | US$(000) | | | US$(000) | | | US$(000) | | | US$(000) | |
| | | | | | | | | | | | | | | | | | | | | | | | | | | | | | | | | | |
| Transportation units | | | 6,406 | | | | 1,182 | | | | (96 | ) | | | (365 | ) | | | - | | | | 7,127 | | | | 1,228 | | | | (122 | ) | | | (462 | ) | | | - | | | | 7,771 | |
| Furniture and mixtures | | | 5,098 | | | | 1,018 | | | | (35 | ) | | | (1 | ) | | | - | | | | 6,080 | | | | 1,008 | | | | (1 | ) | | | (28 | ) | | | (4 | ) | | | 7,055 | |
| Stripping cost | | | 223 | | | | 1,171 | | | | - | | | | - | | | | - | | | | 1,394 | | | | 891 | | | | - | | | | - | | | | - | | | | 2,285 | |
| Mine closure costs | | | 19,045 | | | | 1,693 | | | | - | | | | - | | | | - | | | | 20,738 | | | | 3,512 | | | | - | | | | - | | | | - | | | | 24,250 | |
| | | | 573,306 | | | | 120,982 | | | | (2,043 | ) | | | (617 | ) | | | - | | | | 691,628 | | | | 153,690 | | | | (948 | ) | | | (5,293 | ) | | | - | | | | 839,077 | |
| | | | | | | | | | | | | | | | | | | | | | | | | | | | | | | | | | | | | | | | | | | | | |
| Provision for impairment of long-lived assets, note 11 | | | | | | | | | | | | | | | | | | | | | | | | | | | | | | | | | | | | | | | | | | | | |
| Mining concessions of Antapite (b) | | | 2,805 | | | | - | | | | - | | | | - | | | | - | | | | 2,805 | | | | - | | | | - | | | | - | | | | - | | | | 2,805 | |
| Property, plant and equipment | | | 2,432 | | | | - | | | | - | | | | - | | | | - | | | | 2,432 | | | | 2,303 | | | | - | | | | - | | | | - | | | | 4,735 | |
| Development costs (c) | | | 3,563 | | | | - | | | | - | | | | - | | | | - | | | | 3,563 | | | | 1,314 | | | | - | | | | - | | | | - | | | | 4,877 | |
| | | | 8,800 | | | | - | | | | - | | | | - | | | | - | | | | 8,800 | | | | 3,617 | | | | - | | | | - | | | | - | | | | 12,417 | |
| | | | | | | | | | | | | | | | | | | | | | | | | | | | | | | | | | | | | | | | | | | | | |
| Net cost | | | 635,236 | | | | | | | | | | | | | | | | | | | | 830,997 | | | | | | | | | | | | | | | | | | | | 1,134,276 | |
Notes to the consolidated financial statements (continued)
The table below presents the movement of the cost and accumulated amortization of the mining concessions for mining units:
| | | As of
January 1,
2011 | | | Additions | | | As of
December 31,
2011 | | | Additions | | | As of
December 31,
2012 | |
| | | US$(000) | | | US$(000) | | | US$(000) | | | US$(000) | | | US$(000) | |
| | | | | | | | | | | | | | | | |
| Cost | | | | | | | | | | | | | | | | | | | | |
| Compañía de Exploraciones, Desarrollo e Inversiones Mineras S.A.C.- CEDIMIN | | | 51,138 | | | | - | | | | 51,138 | | | | - | | | | 51,138 | |
| Inversiones Colquijirca S.A. | | | 43,103 | | | | - | | | | 43,103 | | | | - | | | | 43,103 | |
| Sociedad Minera El Brocal S.A.A. | | | 13,542 | | | | - | | | | 13,542 | | | | - | | | | 13,542 | |
| Inversiones Mineras del Sur S.A. | | | 11,662 | | | | - | | | | 11,662 | | | | - | | | | 11,662 | |
| Minas Poracota S.A. | | | 2,864 | | | | - | | | | 2,864 | | | | - | | | | 2,864 | |
| Minera Paula 49 S.A.C. | | | 1,572 | | | | - | | | | 1,572 | | | | - | | | | 1,572 | |
| | | | 123,881 | | | | - | | | | 123,881 | | | | - | | | | 123,881 | |
| Accumulated amortization | | | | | | | | | | | | | | | | | | | | |
| Compañía de Exploraciones, Desarrollo e Inversiones Mineras S.A.C. – CEDIMIN | | | 32,898 | | | | 1,277 | | | | 34,175 | | | | 1,352 | | | | 35,527 | |
| Inversiones Colquijirca S.A. | | | 14,189 | | | | 1,087 | | | | 15,276 | | | | 1,086 | | | | 16,362 | |
| Sociedad Minera El Brocal S.A.A. | | | 2,675 | | | | 7,881 | | | | 10,556 | | | | 117 | | | | 10,673 | |
| Inversiones Mineras del Sur S.A. | | | 6,430 | | | | 1,387 | | | | 7,817 | | | | 1,040 | | | | 8,857 | |
| Minas Poracota S.A. | | | 2,179 | | | | 637 | | | | 2,816 | | | | 48 | | | | 2,864 | |
| Minera Paula 49 S.A.C. | | | 1,572 | | | | - | | | | 1,572 | | | | - | | | | 1,572 | |
| | | | 59,943 | | | | 12,269 | | | | 72,212 | | | | 3,643 | | | | 75,855 | |
| Provision for impairment of mining concessions | | | | | | | | | | | | | | | | | | | | |
| Inversiones Mineras del Sur S.A., note 11 | | | 2,805 | | | | | | | | 2,805 | | | | | | | | 2,805 | |
Notes to the consolidated financial statements (continued)
| (c) | Mining development costs – |
The table below presents the movement of the cost, accumulated amortization and provision for impairment:
| | | As of
January 1,
2011 | | | Additions | | | As of
December 31,
2011 | | | Additions | | | As of
December 31,
2012 | |
| | | US$(000) | | | US$(000) | | | US$(000) | | | US$(000) | | | US$(000) | |
| | | | | | | | | | | | | | | | |
| Cost | | | | | | | | | | | | | | | | | | | | |
| Orcopampa | | | 60,332 | | | | 1,445 | | | | 61,777 | | | | 1,442 | | | | 63,219 | |
| Uchucchacua | | | 47,312 | | | | 5,317 | | | | 52,629 | | | | 767 | | | | 53,396 | |
| Poracota | | | 32,035 | | | | - | | | | 32,035 | | | | - | | | | 32,035 | |
| Antapite | | | 18,999 | | | | - | | | | 18,999 | | | | - | | | | 18,999 | |
| La Llave, note 1(e) | | | 16,127 | | | | 302 | | | | 16,429 | | | | - | | | | 16,429 | |
| Shila – Paula | | | 6,945 | | | | 8,388 | | | | 15,333 | | | | - | | | | 15,333 | |
| Recuperada | | | 10,438 | | | | 413 | | | | 10,851 | | | | - | | | | 10,851 | |
| Julcani | | | 7,808 | | | | 2,555 | | | | 10,363 | | | | 2,111 | | | | 12,474 | |
| La Zanja | | | 4,578 | | | | 1,342 | | | | 5,920 | | | | 1,648 | | | | 7,568 | |
| Mallay | | | 575 | | | | 3,866 | | | | 4,441 | | | | 4,216 | | | | 8,657 | |
| Ishihuinca | | | 1,027 | | | | - | | | | 1,027 | | | | - | | | | 1,027 | |
| Mine closure costs | | | 26,951 | | | | 786 | | | | 27,737 | | | | 25,207 | | | | 52,944 | |
| | | | 233,127 | | | | 24,414 | | | | 257,541 | | | | 35,391 | | | | 292,932 | |
| | | | | | | | | | | | | | | | | | | | | |
| Accumulated amortization | | | | | | | | | | | | | | | | | | | | |
| Orcopampa | | | 43,389 | | | | 7,152 | | | | 50,541 | | | | 4,108 | | | | 54,649 | |
| Uchucchacua | | | 32,132 | | | | 3,929 | | | | 36,061 | | | | 4,921 | | | | 40,982 | |
| Poracota | | | 20,153 | | | | 11,479 | | | | 31,632 | | | | 400 | | | | 32,032 | |
| Antapite | | | 18,731 | | | | 268 | | | | 18,999 | | | | - | | | | 18,999 | |
| Shila – Paula | | | 3,382 | | | | 7,575 | | | | 10,957 | | | | - | | | | 10,957 | |
| Recuperada | | | 2,437 | | | | 637 | | | | 3,074 | | | | 6,897 | | | | 9,971 | |
| Julcani | | | 961 | | | | 256 | | | | 1,217 | | | | 695 | | | | 1,912 | |
| La Zanja | | | 4,466 | | | | 1,236 | | | | 5,702 | | | | 3,087 | | | | 8,789 | |
| Ishihuinca | | | 1,027 | | | | - | | | | 1,027 | | | | - | | | | 1,027 | |
Notes to the consolidated financial statements (continued)
| | | As of
January 1,
2011 | | | Additions | | | As of
December 31,
2011 | | | Additions | | | As of
December 31,
2012 | |
| | | US$(000) | | | US$(000) | | | US$(000) | | | US$(000) | | | US$(000) | |
| Mallay | | - | | | - | | | - | | | 1,431 | | | 1,431 | |
| Mine closure costs | | | 17,708 | | | | 3,398 | | | | 21,106 | | | | 19,188 | | | | 40,294 | |
| | | | 144,386 | | | | 35,930 | | | | 180,316 | | | | 40,727 | | | | 221,043 | |
| | | | | | | | | | | | | | | | | | | | | |
| Provision for impairment of mine development costs | | | | | | | | | | | | | | | | | | | | |
| Shila - Paula | | | 3,563 | | | | - | | | | 3,563 | | | | - | | | | 3,563 | |
| Recuperada | | | - | | | | - | | | | - | | | | 1,314 | | | | 1,314 | |
| | | | 3,563 | | | | - | | | | 3,563 | | | | 1,314 | | | | 4,877 | |
Notes to the consolidated financial statements (continued)
| (d) | During the year 2009, the Company started the construction of Huanza Hydroelectric plant, which is expected to be completed in August 2012, date in which the asset will be transfer from work in progress to machinery and equipment. The carrying amount of this work in progress amount to US$177,133,000. This construction is financed by a long-term financial obligation, see note 15. The amount of borrowing costs capitalized as of December 31, 2012 was US$10,974,000 (US$6,364,000 as of December 31, 2011). The rate used to calculate the borrowing costs eligible for capitalization was LIBOR rate to 90 days plus 4 per cent, which is the effective interest rate of the specific loan. |
The carrying value of plant and equipment held under finance leases contracts as of December 31, 2012 was US$119,000,000 (US$105,042,000 as of December 31, 2011). Additions of leasing during the year include US$13,958,000 (US$50,915,000 in 2011) and are disclosed in “Works in progress” caption. Leased assets contracts are pledged as security for the related finance lease.
| 11. | Reversal for impairment of long-lived assets and investments in associates |
Mining concessions, property, plant and equipment and development costs -
The table below presents the components and movement of the reversal for impairment of long-lived assets:
| | | As of
January 1 and
December 31,
2011 | | | Additions | | | As of
December 31,
2012 | |
| | | US$(000) | | | US$(000) | | | US$(000) | |
| | | | | | | | | | |
| Mining concessions, property, plant and equipment - | | | | | | | | | | | | |
| Antapite | | | 2,805 | | | | 743 | | | | 3,548 | |
| Shila-Paula | | | 2,432 | | | | - | | | | 2,432 | |
| Recuperada | | | - | | | | 810 | | | | 810 | |
| Poracota | | | - | | | | 750 | | | | 750 | |
| | | | 5,237 | | | | 2,303 | | | | 7,540 | |
| Development costs - | | | | | | | | | | | | |
| Shila-Paula | | | 3,563 | | | | - | | | | 3,563 | |
| Recuperada | | | - | | | | 1,314 | | | | 1,314 | |
| | | | 3,563 | | | | 1,314 | | | | 4,877 | |
| | | | | | | | | | | | | |
| Total | | | 8,800 | | | | 3,617 | | | | 12,417 | |
Notes to the consolidated financial statements (continued)
As a result of the decrease in the level and quality of the reserves in some mining units, during the year 2012, the Company’s Management updated its assessment of the recoverability of the book value of its long-lived assets. The provision made in the year 2012 amounts to US$3,617,000.
Assessing the impairment of long-lived assets involves comparing their respective carrying amount with their recoverable values. The recoverable value of assets is the greater of its fair value less the costs of sale or its value in use. The recoverable amount used in assessing the Antapite, Recuperada and Poracota mining unit is the fair value. The Company estimated the use value of its long-lived assets using a discounted cash-flow model. Cash flow was projected for the useful life of the mining units based on Management’s expectations. This useful life depends on several variables, including the mineral reserves of each unit.
The following assumptions have been used for calculating the value in use:
| (i) | Production volumes: the production volumes of the Antapite, Recuperada and Poracota units are substantiated by the reserves and resources audited as of December 31, 2012, considering Management’s production plan for the coming years. According to such reserves, the Poracota unit has a production horizon of one year, Antapite of two years and Recuperada of three years. Management believes that there will not be significant changes in estimated production volumes that would result in the present value of long-lived assets exceeding their recoverable value. |
| (ii) | Discount rates: Future cash flows have been adjusted according to the specific risk assigned to this type of asset and discounted at a pre-tax rate of 6.21 per cent. The discount rate used is the Weighted Average Cost of Capital (pre-tax WACC). Management believes that there will not be significant changes in the discount rate that could increase the impairment loss. |
| (iii) | Metals prices: The Company has used future metals prices (forward metal prices) obtained from the average of estimates made by foreign investment banks. |
| (iv) | Operating costs: The Company has projected its operating costs in relation to its cost structure as of the date of the consolidated statement of financial position. Management believes that there will not be significant changes in estimated operating costs considered that could increase the impairment loss. |
In the opinion of the Company’s Management, the provision for impairment of long-lived assets covers the risk of impairment at the date of the consolidated statement of financial position.
Notes to the consolidated financial statements (continued)
Investments in associates -
In the case of Yanacocha (investment held through its subsidiary Compañía Minera Condesa S.A.) the Company’s Management concluded that there was no objective evidence of impairment as of the consolidated statement of financial position date derived from internal and external indicators (rising trend in the international price of gold, constant level of reserves and an increase in the annual net profit reported). In addition, in the case of associate Cerro Verde, the Company’s Management compared the investment’s fair value according to market capitalization with the investment’s book value, and determined that there was no impairment as of the consolidated statement of financial position date. On the other hand, in the case of Coimolache, and Canteras del Hallazgo, the Company´s Management concluded that there was no objective evidence of impairment as of the consolidated statement of financial position date derived from internal and external indicators. See notes 9(f)
and (g).
| 12. | Trade accounts payable |
Trade accounts payable arise mainly from the acquisition of material, supplies and spare parts and services provided by third parties. These obligations are mostly denominated in U.S. dollars, have current maturities, do not accrue interest and no specific guarantees have been granted for these obligations. Trade accounts payable amount to US$199,551,000 as of December 31, 2012 (US$142,375,000 as of December 31, 2011).
| 13. | Other accounts payable |
The table below presents the components of this caption:
| | | 2012 | | | 2011 | |
| | | US$(000) | | | US$(000) | |
| | | | | | | |
| Remuneration and similar benefits payable | | | 17,487 | | | | 19,026 | |
| Taxes payable | | | 16,454 | | | | 12,680 | |
| Royalties payable to the Peruvian State | | | 7,350 | | | | 3,755 | |
| Accounts payable to non-controlling interest | | | 4,694 | | | | - | |
| Dividends payable | | | 1,928 | | | | 1,052 | |
| Royalties payable to third parties | | | - | | | | 633 | |
| Other liabilities | | | 11,183 | | | | 4,004 | |
| | | | | | | | | |
| | | | 59,096 | | | | 41,150 | |
| | | Balance as of
January 1, 2014 | | | Additions | | | Disposals | | | Sales | | | Transfers | | | Merger with
Canteras
del Hallazgo | | | Transfer to
assets
held for sale | | | Balance as of
December 31,
2014 | | | Additions | | | Disposals | | | Sales | | | Transfers | | | Balance as of
December 31,
2015 | |
| | | US$(000) | | | US$(000) | | | US$(000) | | | US$(000) | | | US$(000) | | | US$(000) | | | US$(000) | | | US$(000) | | | US$(000) | | | US$(000) | | | US$(000) | | | US$(000) | | | US$(000) | |
| | | | | | | | | | | | | | | | | | | | | | | | | | | | | | | | | | | | | | | | |
| Cost | | | | | | | | | | | | | | | | | | | | | | | | | | | | | | | | | | | | | | | | | | | | | | | | | | | | |
| Lands | | | 12,069 | | | | 10,590 | | | | (357 | ) | | | - | | | | 129 | | | | 130 | | | | (560 | ) | | | 22,001 | | | | 2,293 | | | | (1,892 | ) | | | - | | | | 52 | | | | 22,454 | |
| Mining lands | | | 7,215 | | | | - | | | | - | | | | - | | | | - | | | | - | | | | - | | | | 7,215 | | | | - | | | | - | | | | - | | | | - | | | | 7,215 | |
| Mining concessions | | | 137,309 | | | | 67 | | | | (6,061 | ) | | | - | | | | - | | | | 74,005 | | | | (14,526 | ) | | | 190,794 | | | | - | | | | - | | | | - | | | | - | | | | 190,794 | |
| Development costs | | | 354,509 | | | | 138,527 | | | | (2,586 | ) | | | - | | | | 2,575 | | | | 127,809 | | | | (89,377 | ) | | | 531,457 | | | | 62,765 | | | | - | | | | - | | | | (52,459 | ) | | | 541,763 | |
| Buildings, constructions and other | | | 516,004 | | | | 3,467 | | | | (2,222 | ) | | | (1,536 | ) | | | 521,960 | | | | 688 | | | | (40,170 | ) | | | 998,191 | | | | 1,715 | | | | (1,690 | ) | | | (168 | ) | | | 20,908 | | | | 1,018,956 | |
| Machinery and equipment | | | 567,878 | | | | 6,716 | | | | (6,893 | ) | | | (20 | ) | | | 214,808 | | | | 840 | | | | (33,246 | ) | | | 750,083 | | | | 29,550 | | | | (887 | ) | | | (3,799 | ) | | | 52,278 | | | | 827,225 | |
| Transportation units | | | 13,236 | | | | 484 | | | | (1,230 | ) | | | (658 | ) | | | 78 | | | | - | | | | (960 | ) | | | 10,950 | | | | 491 | | | | (245 | ) | | | (990 | ) | | | 443 | | | | 10,649 | |
| Furniture and fixtures | | | 13,609 | | | | 1,587 | | | | (79 | ) | | | (5 | ) | | | 1,208 | | | | 5 | | | | (3,300 | ) | | | 13,025 | | | | 137 | | | | (25 | ) | | | (84 | ) | | | 376 | | | | 13,429 | |
| Units in transit | | | 36,474 | | | | 3,233 | | | | (19,450 | ) | | | - | | | | (8,421 | ) | | | - | | | | - | | | | 11,836 | | | | 15,212 | | | | (113 | ) | | | - | | | | (644 | ) | | | 26,291 | |
| Work in progress | | | 707,415 | | | | 114,151 | | | | (30,272 | ) | | | - | | | | (732,337 | ) | | | - | | | | (1,037 | ) | | | 57,920 | | | | 81,333 | | | | - | | | | - | | | | (71,130 | ) | | | 68,123 | |
| Stripping activity asset | | | 79,652 | | | | 6,069 | | | | - | | | | - | | | | - | | | | - | | | | - | | | | 85,721 | | | | 17,790 | | | | - | | | | - | | | | 3,327 | | | | 106,838 | |
| Mine closure costs | | | 89,531 | | | | 1,031 | | | | (11,464 | ) | | | - | | | | - | | | | - | | | | (15,012 | ) | | | 64,086 | | | | 76,799 | | | | (2,414 | ) | | | - | | | | 49,132 | | | | 187,603 | |
| | | | 2,534,901 | | | | 285,922 | | | | (80,614 | ) | | | (2,219 | ) | | | - | | | | 203,477 | | | | (198,188 | ) | | | 2,743,279 | | | | 288,085 | | | | (7,266 | ) | | | (5,041 | ) | | | 2,283 | | | | 3,021,340 | |
| | | | | | | | | | | | | | | | | | | | | | | | | | | | | | | | | | | | | | | | | | | | | | | | | | | | | |
| Accumulated depreciation and amortization | | | | | | | | | | | | | | | | | | | | | | | | | | | | | | | | | | | | | | | | | | | | | | | | | | | | |
| Mining lands | | | 3,202 | | | | - | | | | (3,202 | ) | | | - | | | | - | | | | - | | | | - | | | | - | | | | - | | | | - | | | | - | | | | - | | | | - | |
| Mining concessions | | | 84,059 | | | | 5,058 | | | | - | | | | - | | | | - | | | | - | | | | (11,721 | ) | | | 77,396 | | | | 54 | | | | - | | | | - | | | | - | | | | 77,450 | |
| Development costs | | | 231,684 | | | | 35,480 | | | | (2,492 | ) | | | - | | | | - | | | | - | | | | (80,394 | ) | | | 184,278 | | | | 49,771 | | | | - | | | | - | | | | (34,838 | ) | | | 199,211 | |
| Buildings, construction and other | | | 281,401 | | | | 65,962 | | | | (932 | ) | | | - | | | | - | | | | 246 | | | | (32,632 | ) | | | 314,045 | | | | 69,353 | | | | (1,915 | ) | | | (81 | ) | | | 39 | | | | 381,441 | |
| Machinery and equipment | | | 342,975 | | | | 87,215 | | | | (5,058 | ) | | | (8 | ) | | | - | | | | 571 | | | | (25,934 | ) | | | 399,761 | | | | 77,546 | | | | (277 | ) | | | (1,941 | ) | | | 852 | | | | 475,941 | |
| Transportation units | | | 8,405 | | | | 842 | | | | (684 | ) | | | (562 | ) | | | - | | | | - | | | | (725 | ) | | | 7,276 | | | | 1,385 | | | | (221 | ) | | | (916 | ) | | | 408 | | | | 7,932 | |
| Furniture and fixtures | | | 7,979 | | | | 1,253 | | | | (143 | ) | | | - | | | | - | | | | 2 | | | | (2,770 | ) | | | 6,321 | | | | 1,252 | | | | (87 | ) | | | (66 | ) | | | 157 | | | | 7,577 | |
| Stripping activity asset | | | 3,139 | | | | 3,343 | | | | - | | | | - | | | | - | | | | - | | | | - | | | | 6,482 | | | | 6,434 | | | | - | | | | - | | | | - | | | | 12,916 | |
| Mine closure costs | | | 37,586 | | | | 4,216 | | | | (365 | ) | | | - | | | | - | | | | - | | | | (9,169 | ) | | | 32,268 | | | | 33,381 | | | | (491 | ) | | | - | | | | 34,835 | | | | 99,993 | |
| | | | 1,000,430 | | | | 203,369 | | | | (12,876 | ) | | | (570 | ) | | | - | | | | 819 | | | | (163,345 | ) | | | 1,027,827 | | | | 239,176 | | | | (2,991 | ) | | | (3,004 | ) | | | 1,453 | | | | 1,262,461 | |
| | | | | | | | | | | | | | | | | | | | | | | | | | | | | | | | | | | | | | | | | | | | | | | | | | | | | |
| Provision for impairment of long-lived assets | | | | | | | | | | | | | | | | | | | | | | | | | | | | | | | | | | | | | | | | | | | | | | | | | | | | |
| Mining concessions | | | 2,805 | | | | - | | | | - | | | | - | | | | - | | | | - | | | | (2,805 | ) | | | - | | | | 3,345 | | | | - | | | | - | | | | - | | | | 3,345 | |
| Property, plant and equipment | | | 4,735 | | | | 794 | | | | - | | | | - | | | | - | | | | - | | | | (5,529 | ) | | | - | | | | 27 | | | | - | | | | - | | | | - | | | | 27 | |
| Development costs | | | 8,789 | | | | - | | | | - | | | | - | | | | - | | | | - | | | | (8,789 | ) | | | - | | | | 3,803 | | | | - | | | | - | | | | - | | | | 3,803 | |
| Mine closure costs | | | 1,668 | | | | - | | | | - | | | | - | | | | - | | | | - | | | | (1,668 | ) | | | - | | | | 4,080 | | | | - | | | | - | | | | - | | | | 4,080 | |
| Work in progress | | | 1,014 | | | | - | | | | - | | | | - | | | | - | | | | - | | | | (1,014 | ) | | | - | | | | - | | | | - | | | | - | | | | - | | | | - | |
| | | | 19,011 | | | | 794 | | | | - | | | | - | | | | - | | | | - | | | | (19,805 | ) | | | - | | | | 11,255 | | | | - | | | | - | | | | - | | | | 11,255 | |
| | | | | | | | | | | | | | | | | | | | | | | | | | | | | | | | | | | | | | | | | | | | | | | | | | | | | |
| Net cost | | | 1,515,460 | | | | | | | | | | | | | | | | | | | | | | | | | | | | 1,715,452 | | | | | | | | | | | | | | | | | | | | 1,747,624 | |
Notes to the consolidated financial statements(continued)
| (b) | Impairment of long-lived assets |
In accordance with its accounting policies and processes, each asset or CGU is evaluated annually at year end to determine whether there are any indications of impairment. If any such indications of impairment exist, a formal estimate of the recoverable amount is performed.
In assessing whether impairment is required, the carrying value of the asset or CGU is compared with its recoverable amount. The recoverable amount is the higher of the CGU’s fair value less costs of disposal (FVLCD) and value in use (VIU). Given the nature of the Group’s activities, information on the fair value of an asset is usually difficult to obtain unless negotiations with potential purchasers or similar transactions are taking place. Consequently, the recoverable amount for each CGU is estimated based on discounted future estimated cash flows expected to be generated from the continued use of the CGUs using market based commodity price and exchange assumptions, estimated quantities of recoverable minerals, production levels, operating costs and capital requirements, and its eventual disposal, based on the latest life of mine (LOM) plans. These cash flows were discounted using a real pre-tax discount rate that reflected current market assessments of the time value of money and the risks specific to the CGU.
The estimates of quantities of recoverable minerals, production levels, operating costs and capital requirements are obtained from the planning process, including the LOM plans, one-year budgets and CGU-specific studies.
As a result of the recoverable amount analysis performed during the year, the Group recognized impairment losses related to mine properties forUS$11,255,000,in relation to La Zanja andBreapampamining units.
Key assumptions
The determination of value in use is most sensitive to the following key assumptions:
• Production volumes;
• Commodity prices;
• Discount rate.
Production volumes: Estimated production volumes are based on detailed life-of-mine plans and take into account development plans for the mines agreed by management as part of planning process. Production volumes are dependent on a number of variables, such as: the recoverable quantities; the production profile; the cost of the development of the infrastructure necessary to extract the reserves; the production costs; the contractual duration of mining rights; and the selling price of the commodities extracted.
As each producing mining unit has specific reserve characteristics and economic circumstances, the cash flows of the mines are computed using appropriate individual economic models and key assumptions established by management. The production profiles used were consistent with the reserves and resource volumes approved as part of the Group’s process for the estimation of proved and probable reserves and resource estimates.
Commodity prices: Forecast commodity prices are based on management’s estimates and are derived from forward price curves and long-term views of global supply and demand, building on past experience of the industry and consistent with external sources. These prices were adjusted to arrive at appropriate consistent price assumptions for the different qualities and type of commodities, or, where appropriate, contracted prices were applied. These prices are reviewed at least annually.
Notes to the consolidated financial statements(continued)
Estimates prices for the current and long-term periods that have been used to estimate future revenues are as follows:
| | | 2016 | | | 2017 | | | 2018 | | | 2019 | |
| | | US$ | | | US$ | | | US$ | | | US$ | |
| | | | | | | | | | | | | |
| Gold | | | 1,074 | /OZ | | | 1,145 | /OZ | | | 1,200 | /OZ | | | 1,071 | /OZ |
| Silver | | | 15.05 | /OZ | | | 16.24 | /OZ | | | 17.34 | /OZ | | | 18.18 | /OZ |
| Copper | | | 5,050 | /MT | | | 5,250 | /MT | | | 5,500 | /MT | | | 5,194 | /MT |
| Lead | | | 1,800 | /MT | | | 1,875 | /MT | | | 1,995 | /MT | | | 1,819 | /MT |
| Zinc | | | 1,830 | /MT | | | 1,935 | /MT | | | 2,000 | /MT | | | 1,870 | /MT |
Discount rate: In calculating the value in use, a pre-tax discount rate of 10.03% was applied to the pre-tax cash flows. This discount rate is derived from the Group’s post-tax weighted average cost of capital (WACC), with appropriate adjustments made to reflect the risks specific to the CGU. The WACC takes into account both debt and equity. The cost of equity is derived from the expected return on investment by the Group’s investors. The cost of debt is based on its interest bearing borrowings the Group is obliged to service. The beta factors are evaluated annually based on publicly available market data.
| (c) | The book value of assets held under finance leases amounted to US$226,429,000at December 31, 2015(US$233,826,000at December 31, 2014) and is presented in various items of property, plant and equipment. Additions during the year include US$262,000 (US$142,315,000during the year2014).Leased assets are pledged as security for the related finance lease liabilities. |
| (d) | The amount of capitalized finance costs during the year 2015 wasUS$1,307,000 (US$20,079,000during 2014) and is presented under investing activities in the consolidated statements of cash flows. The average rate used to determine the financial cost to be capitalized was 3.90%during 2015. |
Notes to the consolidated financial statements(continued)
| 13. | Investment properties, net |
The Group's investment properties consist of administrative offices in seven floors (6,252 meters square), 154 parking spaces and 20 tanks, all in the building “Capital El Derby”, located in the district of Surco, Lima, Peru.
The movement of cost and accumulated depreciation for the years 2015 and 2014 is presented below:
| | | Cost | | | Accumulated
depreciation | | | Net
cost | |
| | | US$(000) | | | US$(000) | | | US$(000) | |
| | | | | | | | | | |
| Balance as of January 1, 2014 | | | - | | | | - | | | | - | |
| Additions | | | 12,103 | | | | (903 | ) | | | 11,200 | |
| Balance as of December 31, 2014 | | | 12,103 | | | | (903 | ) | | | 11,200 | |
| | | | | | | | | | | | | |
| Additions | | | - | | | | (481 | ) | | | (481 | ) |
| | | | | | | | | | | | | |
| Balance as of December 31, 2015 | | | 12,103 | | | | (1,384 | ) | | | 10,719 | |
The Group does not have restrictions in the realization of its investment properties.
During 2015, the fair value of the investment property amounted to US$22,583,000 and the rental income from these investment properties amounted to US$1,670,000.
The table below presentsAs of December 31, 2015, the componentsGroup maintains bank loans amounting to US$285,302,000, which were obtained for working capital purposes, have current maturity and accrue interest at market annual rates ranging from 1.32% to 5.61% (as of this caption:December 31, 2014, the Group held a loan of US$40,000,000, which accrued interest an annual rate of 1.5%).
| | | 2012 | | | 2011 | |
| | | US$(000) | | | US$(000) | |
| | | | | | | |
| Provision for closure of mining units and exploration projects (a) | | | 99,438 | | | | 81,914 | |
| Workers’ profit sharing payable (b) | | | 28,427 | | | | 39,157 | |
| Stock appreciation rights (c) | | | 28,258 | | | | 43,188 | |
| Provision for labor contingencies | | | 7,490 | | | | 2,444 | |
| Board of Directors’ participation, note 31(e) | | | 2,721 | | | | 3,567 | |
| Provision for environmental liabilities | | | 1,932 | | | | 6,136 | |
| Provision for security contingencies | | | 1,717 | | | | - | |
| Provision for community contingencies | | | 1,613 | | | | 1,409 | |
| Other provisions | | | 225 | | | | - | |
| | | | | | | | | |
| | | | 171,821 | | | | 177,815 | |
| | | 2012 | | | 2011 | |
| | | US$(000) | | | US$(000) | |
| Less – Non current portion | | | | | | | | |
| Provision for closure of mining units and exploration projects (a) | | | (77,665 | ) | | | (59,132 | ) |
| Stock appreciation rights (b) | | | (22,203 | ) | | | (26,457 | ) |
| Provision for environmental liabilities | | | (173 | ) | | | (939 | ) |
| | | | (100,041 | ) | | | (86,528 | ) |
| | | | | | | | | |
| Current portion | | | 71,780 | | | | 91,287 | |
Notes to the consolidated financial statements(continued)
| 15. | Trade and other payables |
This caption is made up as follows:
| | | 2015 | | | 2014 | |
| | | US$(000) | | | US$(000) | |
| | | | | | | |
| Trade payables (b) | | | | | | | | |
| Domestic suppliers | | | 209,107 | | | | 206,844 | |
| Related entities, Note 30(b) | | | 1,175 | | | | 1,794 | |
| | | | | | | | | |
| | | | 210,282 | | | | 208,638 | |
| | | | | | | | | |
| Other payables | | | | | | | | |
| Accounts payable to non-controlling interests | | | 15,403 | | | | 15,181 | |
| Remuneration and similar benefits payable | | | 10,409 | | | | 12,879 | |
| Taxes payable | | | 9,320 | | | | 13,409 | |
| Royalties payable to the Peruvian State | | | 2,103 | | | | 2,654 | |
| Dividends payable | | | 1,044 | | | | 1,117 | |
| Other liabilities | | | 13,610 | | | | 15,362 | |
| | | | 51,889 | | | | 60,602 | |
| | | | | | | | | |
| | | | 262,171 | | | | 269,240 | |
| | | | | | | | | |
| Classification by maturity: | | | | | | | | |
| Current portion | | | 247,114 | | | | 254,000 | |
| Non-current portion | | | 15,057 | | | | 15,240 | |
| | | | | | | | | |
| Total trade and other payables | | | 262,171 | | | | 269,240 | |
| | | | | | | | | |
| Classification by nature: | | | | | | | | |
| Financial payables | | | 250,748 | | | | 253,177 | |
| Non-financial payables | | | 11,423 | | | | 16,063 | |
| | | | | | | | | |
| Total trade and other payables | | | 262,171 | | | | 269,240 | |
| (a) | Trade payables arise mainly from the acquisition of material, supplies and spare parts and services provided by third parties. These obligations are mostly denominated in U.S. dollars, have current maturities, accrue no interest and are not secured. |
Notes to the consolidated financial statements(continued)
| (a) | This caption is made up as follows: |
| | | 2015 | | | 2014 | |
| | | US$(000) | | | US$(000) | |
| | | | | | | |
| Provision for closure of mining units and exploration projects (b) | | | 166,403 | | | | 103,010 | |
| Provision for environmental liabilities | | | 8,373 | | | | 6,708 | |
| Provision for safety contingencies | | | 6,346 | | | | 6,475 | |
| Provision for labor contingencies | | | 3,611 | | | | 4,729 | |
| Provision for obligations with communities | | | 2,883 | | | | 2,851 | |
| Provision for environmental contingencies | | | 1,259 | | | | 1,092 | |
| Board of Directors’ participation | | | 993 | | | | 1,385 | |
| Workers’ profit sharing payable | | | 894 | | | | 3,916 | |
| Stock appreciation rights | | | 330 | | | | 449 | |
| Other provisions | | | 622 | | | | 851 | |
| | | | | | | | | |
| | | | 191,714 | | | | 131,466 | |
| Classification by maturity: | | | | | | | | |
| Current portion | | | 49,829 | | | | 67,895 | |
| Non-current portion | | | 141,885 | | | | 63,571 | |
| | | | | | | | | |
| | | | 191,714 | | | | 131,466 | |
| (b) | Provision for closure of mining units and exploration projects-projects - |
The table below presents the movement of the provision for closure of mining units and exploration projects:
| | | 2015 | | | 2014 | |
| | | US$(000) | | | US$(000) | |
| | | | | | | |
| Beginning balance | | | 103,010 | | | | 112,042 | |
| Changes in estimates (property, plant and equipment and development costs) | | | 74,907 | | | | 398 | |
| Accretion expense, Note 27 | | | 3,343 | | | | 1,695 | |
| Disbursements | | | (14,857 | ) | | | (11,125 | ) |
| | | | | | | | | |
| Final balance | | | 166,403 | | | | 103,010 | |
| | | | | | | | | |
| Classification by maturity: | | | | | | | | |
| Current portion | | | 31,196 | | | | 44,936 | |
| Non-current portion | | | 135,207 | | | | 58,074 | |
| | | | | | | | | |
| | | | 166,403 | | | | 103,010 | |
| | | US$(000)F-56 | |
| | | |
Balance as of January 1, 2011 | | | 77,427 | |
| | | | |
Disbursements | | | (13,108 | ) |
Changes in estimates (property, plant and equipment and development costs) | | | 1,571 | |
Changes in estimates (expenses) | | | 6,924 | |
Increase for accretion expense of the present value of the provision | | | 9,100 | |
Balance as of December 31, 2011 | | | 81,914 | |
| | | | |
Disbursements | | | (22,485 | ) |
Notes to the consolidated financial statements(continued)
| | US$(000) | |
| | | |
Changes in estimates (property, plant and equipment and development costs) | | | 24,812 | |
New mine closure plans (property, plant, equipment and development costs) | | | 8,897 | |
Changes in estimates (income) | | | (512 | ) |
Increase for accretion expense of the present value of the provision | | | 6,812 | |
| | | | |
Balance as of December 31, 2012 | | | 99,438 | |
The provision for closure of mining units and exploration projects represents the present value of the closure costs that are expected to be incurred between the years 20132016 and 2027. Estimates of the costs for closure of mining units2040. These estimates are based on studies prepared by independent advisers that meet the environmental regulations in effect.
The provision for closure of mining units and exploration projects corresponds mostly to activities that must be carried out for restoring the mining units and areas affected by operation and production activities. The principal works to be performed correspond to earthworks, re-vegetation efforts and dismantling of the plants. Closure budgets are reviewed regularly to take into account any significant change in the studies conducted. Nevertheless, the closure costs of mining units will depend on the market prices for the closure works required, which would reflect future economic conditions. Also, the time when the disbursements will be made depends on the useful life of the mine, which will be based on future metals prices.
As of December 31, 2012,2015, the future value of the provision for closure of mining units and exploration projects wasUS$181,250,000, 212,362,000,which has been discounted using the annual risk-free rate 4.07 percent,rates ranging from 0.72%to5.21% in periods of 1 to24years, resulting in an updated liability ofUS$99,438,000166,403,000 (US$127,492,000 which has been discounted using the annual risk-free rate 4.87 percent, resulting in an updated liability of US$81,914,000 103,010,000as of December 31, 2011)2014). The CompanyGroup believes that this liability is sufficient to meet the current environmental protection laws approved by the Ministry of Energy and Mines.
During 2012 and 2011As of December 31, 2015, the Group has constituted letters of credit in favor of the Ministry of Energy and Mines has approved the followingforUS$110,403,000(US$76,808,000 as of December 31, 2014) to secure mine closure plans:plans of its mining units.
Project name | | Resolution Number | | Approval date |
| | | | |
Julcani mining unit (*) | | R.D. N°046-2011-MEM-AAM | | February 11, 2011 |
Administrative Economic Unit Esperanza 2001 (*) | | R.D. N°027-2011-MEM-AAM /
R.D. N°264-2011-MEM-AAM
| | January 27, 2011 /
August 19, 2011
|
Notes to the consolidated financial statements(continued)
Project name | Resolution Number | Approval date |
Orcopampa mining unit (*) | R.D. N°283-2011-MEM- AAM | September 9, 2011 |
Poracota mining unit (*) | R.D.N°104-2011-MEM-AAM | April 8, 2011 |
Angelica Rubio Chico Project | R.D.N°371-2011-MEM-AAM | April 6, 2011 |
Angelica Rulo project | R.D.N°111-2011-MEM-AAM | April 12, 2011 |
Trocancha Anchaca project | R.D.N °168-2011-MEM-AAM | June 2, 2011 |
Pucarumi project | R.D.N°297-2011-MEM-AAM | September 26, 2011 |
Breapampa mining unit | R.D.N°237-2012-MEM-AAM | July 17, 2012 |
Colquijirca mining unit (*) | R.D.N°243-2012-MEM | August 17, 2012 |
(*) Change to the initial plan.
The Company has constituted letters of credit to Ministry of Energy and Mines for US$46,608,000 (US$39,511,000 as of December 31, 2011) to secure mine closure plans for the above-mentioned units.
| (b) | Workers´profit sharing - |
Legislative Decree N° 892 (L.D. 892), issued in 1996 and which regulates the right of workers to participate in the company’s profits that performs activities generating third categories income, requires companies domiciled in Peru to compute and pay to employees, a share of the profits generated by the companies for which they work.
The worker’ profit sharing is recognized as labor costs in the “Cost of sales, without considering depreciation and amortization” or “Administrative expense” of the consolidated financial statement according to the duties or function of the workers.
According to indicated to note 2.3.(v), the workers’ profit sharing is paid until a limit of 18 wages. The excess is retained by the Company and this is paid to Peruvian Government entities (FONDOEMPLEO and regional government). During the year 2012, the excess between the total amounts of workers’ profit sharing calculated in accordance to L.D. 892 and the limit to pay to employees amounts to US$2,164,000 as of December 31, 2012 (US$6,221,000 as of December 31, 2011), which will be transferred to FONDOEMPLEO within the period established by law. Based on the Company’s accounting policy, such excess is show as operating expenses in the consolidated statement of comprehensive income.
The following table presents the movement of the workers´profit sharing:
| | US$(000) | |
| | | |
Balance as of January 1, 2011 | | | 21,442 | |
| | | | |
Payments | | | (21,329 | ) |
Changes in estimates | | | 39,044 | |
Notes to the consolidated financial statements (continued)
| | US$(000) | |
| | | |
Balance as of December 31, 2011 | | | 39,157 | |
Payments | | | (34,014 | ) |
Changes in estimates | | | 23,284 | |
| | | | |
Balance as of December 31, 2012 | | | 28,427 | |
| (c) | Stock Appreciation Rights - |
Senior executives of the Company are granted share appreciation rights, which can only be settled in cash, if the executive is working for the Company at each program’s settlement date. These programs are mainly structured in a ten-year term, allocated in several programs with progressive maturities. The settlement of each program is determined based on the variation of the market prices at the maturity date as compared to the price at the date of the grant, over the corresponding number of shares.
The table below presents the principal assumptions used by the Company to estimate the fair value:
| | | 2012 | | | 2011 | |
| | | | | | | |
| Historical volatility | | | 48.38 | % | | | 49.50 | % |
| Risk-free interest rate for the remaining period until vesting | | | 0.16 | % | | | 0.00 | % |
| Dividend yield | | | 1.25 | % | | | 1.21 | % |
| Period covered by the program | | | 10 years | | | | 10 years | |
| Market value of the shares at closing | | US$ | 35.95 | | | US$ | 38.34 | |
The expected life of the options is based on historical and recent expectations, and does not necessarily represent patterns that indicate the executions of options that could occur. The expected volatility reflects the assumption that the historical volatility for a period similar life of the options indicates the trend in the future, which may not necessarily be the end result.
The valuation model used by the Company as of December 31, 2012 and 2011 was Turnbull & Wakeman.
Notes to the consolidated financial statements (continued)
The table below presents the movement of the shares subject to the compensation program for the years 2012 and 2011:
| | | Number of shares | |
| | | 2012 | | | 2011 | |
| | | | | | | |
| Opening balance | | | 3,593,733 | | | | 3,133,250 | |
| Granted during the year | | | 790,000 | | | | 775,000 | |
| Retired during the year | | | (82,000 | ) | | | (30,000 | ) |
| Expired during the year | | | (332,069 | ) | | | (284,517 | ) |
| | | | | | | | | |
| Ending balance | | | 3,969,664 | | | | 3,593,733 | |
The payment obligations of shares subject to the compensation program per year are: 454,686 in 2013; 602,532 in 2014; 728,031 in 2015; 611,115 in 2016 and 1,573,300 thereafter.
The average real prices for the programs granted and expiring in the months of January 2013 and 2012 were US$34.86 and US$40.04 per share, respectively.
The table below presents the movement of the stock appreciation rights for the years 2012, 2011 and 2010:
| | | 2012 | | | 2011 | | | 2010 | |
| | | US$(000) | | | US$(000) | | | US$(000) | |
| | | | | | | | | | |
| Opening balance | | | 43,188 | | | | 69,380 | | | | 41,131 | |
| Valuation (reverse) of the year | | | 1,799 | | | | (5,693 | ) | | | 42,425 | |
| Payments made during the year | | | (16,729 | ) | | | (20,499 | ) | | | (14,176 | ) |
| | | | 28,258 | | | | 43,188 | | | | 69,380 | |
| | | | | | | | | | | | | |
| Less - non-current portion | | | (22,203 | ) | | | (26,457 | ) | | | (49,170 | ) |
| | | | | | | | | | | | | |
| Current portion | | | 6,055 | | | | 16,731 | | | | 20,210 | |
Notes to the consolidated financial statements (continued)
| 15.17. | Financial obligations |
| (a) | The table below presents the detail of financial obligations:This caption is made up as of December 31, 2012 and 2011.follow: |
| | | Original
amount | | | Period | | Guarantee | | Annual interest rate | | Maturities | | 2012 | | | 2011 | |
| | | US$(000) | | | | | | | | | | | US$(000) | | | US$(000) | |
| | | | | | | | | | | | | | | | | | |
| Empresa de Generación Huanza S.A. | | | | | | | | | | | | | | | | | | | | |
| Banco de Credito del Peru - Leasing (c) | | | 119,000 | | | 10 years | | Leased equipment | | Three-month Libor plus 4.00% (4.306% as of December 31, 2012 and 4.581% as of December 31, 2011) | | Quarterly maturities to during seven years from capitalization | | | 119,000 | | | | 105,042 | |
| Sociedad Minera El Brocal S.A.A. | | | | | | | | | | | | | | | | | | | | |
| Banco de Credito del Peru - Loan (b) | | | 120,000 | | | 4 years | | None | | Three-month Libor plus 3% (3.32% as of December 31, 2012) | | Quarterly maturities US$2,812 and a payment of US$45,000 at the end of the loan | | | 60,000 | | | | - | |
| | | | | | | | | | | | | | | | | | | | | |
| Leasing | | | 329 | | | 2 years | | Leased equipment | | 4.60% | | Monthly maturities of US$13,569 from August 2012 to July 2014 | | | 257 | | | | - | |
| | | | | | | | | | | | | | | | | | | | | |
| Consorcio Energético de Huancavelica S.A. | | | | | | | | | | | | | | | | | | | | |
| BBVA Banco Continental - Working Capital Loan | | | 10,000 | | | 4 years | | None | | Three-month Libor plus 1.25% | | Quarterly maturities of US$500,000 from September 2007 to June 2012 | | | - | | | | 1,000 | |
| | | | | | | | | | | | | | | | | | | | | |
| Other minor | | | | | | | | | | | | | | | 47 | | | | 72 | |
| | | | | | | | | | | | | | | | 179,304 | | | | 106,114 | |
| | | | | | | | | | | | | | | | | | | | | |
| Non-current portion | | | | | | | | | | | | | | | (173,489 | ) | | | (105,072 | ) |
| | | | | | | | | | | | | | | | | | | | | |
| Current portion | | | | | | | | | | | | | | | 5,815 | | | | 1,042 | |
| | | 2015 | | | 2014 | |
| | | US$(000) | | | US$(000) | |
| | | | | | | |
| Empresa de Generación Huanza S.A. | | | | | | | | |
| Banco de Crédito del Perú – Finance lease (b) | | | 188,138 | | | | 199,170 | |
| | | | | | | | | |
| Sociedad Minera El Brocal S.A.A. | | | | | | | | |
| Banco de Crédito del Perú – Leaseback (c) | | | 156,328 | | | | 165,039 | |
| Other obligations | | | - | | | | 5,000 | |
| | | | | | | | | |
| Buenaventura Ingenieros S.A. | | | | | | | | |
| Banco de Crédito del Perú – Finance lease (d) | | | 9,082 | | | | 13,988 | |
| Other obligations | | | 69 | | | | - | |
| | | | | | | | | |
| Contacto Corredores de Seguros S.A. | | | | | | | | |
| BBVA Banco Continental S.A. – Finance lease | | | 93 | | | | 108 | |
| | | | | | | | | |
| Total financial obligations | | | 353,710 | | | | 383,305 | |
| | | | | | | | | |
| Classification by maturity: | | | | | | | | |
| Current portion | | | 33,394 | | | | 69,950 | |
| Non-current portion | | | 320,316 | | | | 313,355 | |
| | | | | | | | | |
| Total financial obligations | | | 353,710 | | | | 383,305 | |
| (b) | On September 28, 2012, El Brocal subscribedDecember 2, 2009, Empresa de Generación Huanza S.A. entered into a medium-term loanfinance lease contract with Banco de CreditoCrédito del Peru amounted to US$120,000,000; which was approved by El Brocal ´s Board of Directors on April 23, 2012,Perú, with the following terms and conditions: |
F-71 | - | Principal: US$119,000,000. |
| - | Annual interest rate: Three-month Libor plus 4.00%. |
| - | Term: 6 years since August 2014, with final maturity in November 2020. |
| - | Guarantee: Leased equipment. |
| - | Amortization: Through 26 quarterly variable installments and a final installment of US$44,191,000. |
On June 30, 2014, Banco de Credito del Perú extended the finance lease contract above mentioned, through the addition of a new tranche with the following terms and conditions:
| - | Principal: US$108,780,000. |
| - | Annual interest rate: Three-month Libor plus 4.20%. |
| - | Term: 6 years since August 2014, with final maturity in November 2020. |
| - | Guarantee: Leased equipment. |
| - | Amortization: Through an initial installment of US$23,780,000, 26 quarterly variable installments and a final installment of US$68,905,000. |
Notes to the consolidated financial statements(continued)
| (c) | On June 9, 2015, the Board of Directors of El Brocal approved the modification of the sale and finance leaseback contract, with the following terms and conditions: |
| - | Capital:Principal: US$120,000,000.166,500,000. |
| - | Term and annualAnnual interest rate: 4 years with a variable rate (Three-monthThree-month Libor plus 3 points)4.75%. |
| - | Term: 5.5 years since June 23, 2015, with final maturity in year 2020. |
| - | Amortization: Through 22 quarterly variable installments. |
The financing is secured by the fixed assets leased (equipment, machinery and processing plant located in the Colquijirca mining unit) and by a trust agreement on receivables, sales contracts and cash inflows on commercial contracts.
In connection with the above financing, El Brocal complied with the following financial ratios since the third quarter of 2015:
| (i) | Debt service coverage ratio: Higher than 1.3. |
| (ii) | Leverage ratio: Less than 1.0. |
| (a) | Less than 3.00 times as of December 31, 2015; |
| (b) | Less than 2.75 times from January 1, 2016 to September 30, 2016; |
| (c) | Less than 2.50 times as of December 31, 2016; |
| (d) | Less than 2.50 times from January 1, 2017 to September 30, 2017; |
| (e) | Less than 2.25 times as of December 31, 2017; |
| (f) | Less than 2.00 times since January 1, 2018. |
The compliance with the financial ratios described above is monitored by El Brocal’s management. In 2015, Management obtained a waiver for any possible breach of the financial ratios until December 31, 2016.
| (d) | On March 28, 2014, Buenaventura Ingenieros S.A. entered into a finance lease contract with Banco de Credito del Perú, for the construction of administrative offices, with the following terms and conditions: |
| - | Principal: US$14,944,000. |
| - | Annual interest rate: 4.60%. |
| - | Term: 5 years and 4 months since April 2014, with final maturity in July 2019. |
| - | Guarantee: Pledge of 2 contract of sale of concentrate, one of copper and another of lead.Leased property. |
| - | Amortization: Quarterly constant maturities and a final paymentThrough 64 monthly installments of 25 percent of capital.US$208,000 each. |
| - | Availability of the loan period: Until May 2013. |
At the same time to obtain the loan described above, El Brocal Management obtained 3 bridge loans amounted to US$44,000,000 in the form of simple notes, which were disbursed on July 18, September 19, and November 14, 2012. The rate for these loans was signed by the same initial loan of US$120,000,000 (three-month Libor + 3 percent, equivalent to 3.32 percent at December 31, 2012). These notes were cancelled in November of 2012 with the first disbursement of US$60,000,000.
The interest expenses related to this loan as of December 31, 2012 amounted to US$334,000, which have been capitalized in “Mining concessions, development costs and property, plant and equipment, net” caption.
Notes to the consolidated financial statements(continued)
| (c) | On December 2, 2010 Banco de Credito (hereinafter “the Bank”) executed a financial lease agreement with Consorcio Energético Huancavelica S.A., Empresa de Generación Huanza S.A. and Compañía de Minas Buenaventura S.A.A. for construction of a hydroelectric power station. This financial lease for US$119,000,000 is in favor of Empresa de Generación Huanza S.A. (hereinafter “the Lessee”). This agreement stipulates that Buenaventura commits itself as a joint surety of the Lessee, guaranteeing fulfillment of the pecuniary obligations in favor of the bank. As of December 31, 2012, the total disbursement made by the bank amounted to US$119,000,000 (US$105,042,000 as of December 31, 2011). |
| (d)(e) | The financial obligations held by Buenaventura and its subsidiariesthe Group mature as follows: |
| Year | | 2012 | | | 2011 | |
| | | US$(000) | | | US$(000) | |
| | | | | | | | | |
| 2012 | | | - | | | | 1,042 | |
| 2013 | | | 5,815 | | | | 15,025 | |
| 2014 | | | 28,364 | | | | 15,017 | |
| 2015 thereafter | | | 145,125 | | | | 75,030 | |
| | | | 179,304 | | | | 106,114 | |
| | | | | | | | | |
| Current portion | | | (5,815 | ) | | | (1,042 | ) |
| | | | | | | | | |
| Non-current portion | | | 173,489 | | | | 105,072 | |
| Year | | 2015 | | | 2014 | |
| | | US$(000) | | | US$(000) | |
| | | | | | | |
| 2016 | | | - | | | | 47,673 | |
| 2017 | | | 40,104 | | | | 58,406 | |
| 2018 | | | 41,708 | | | | 60,113 | |
| 2019 | | | 44,956 | | | | 16,659 | |
| 2020 | | | 193,548 | | | | 130,504 | |
| | | | | | | | | |
| | | | 320,316 | | | | 313,355 | |
| 16.18. | Shareholders’ equity, net |
The Company’sGroup’s share capital is stated in Nuevos Soles (S/.) and consists of common shares with voting rights, that represent 100 percentwith a nominal amount of the Company’s issued capital.S/10.00 per share. The table below presents the componentscomposition of the capital stock:stock as of December 31, 2015 and 2014:
| | | As of December 31, 2012 and 2011 | |
| | | Number of
shares | | | Capital
stock | | | Capital
stock | |
| | | | | | S/.(000) | | | US$(000) | |
| | | | | | | | | | | | | |
| Common shares | | | 274,889,924 | | | | 2,748,899 | | | | 813,162 | |
| Treasury shares | | | (21,130,260 | ) | | | (211,303 | ) | | | (62,622 | ) |
| | | | 253,759,664 | | | | 2,537,596 | | | | 750,540 | |
Notes to the consolidated financial statements (continued)
| | | Number of shares | | | Capital
stock | | | Capital
stock | |
| | | | | | S/(000) | | | US$(000) | |
| | | | | | | | | | |
| Common shares | | | 274,889,924 | | | | 2,748,899 | | | | 813,162 | |
| Treasury shares | | | (21,174,734 | ) | | | (211,747 | ) | | | (62,665 | ) |
| | | | | | | | | | | | | |
| | | | 253,715,190 | | | | 2,537,152 | | | | 750,497 | |
The market value of the common shares amounted to US$36.064.28 per share as of December 31, 20122015 (US$37.7810.58 per share as of December 31, 2011) and it2014). These shares presented a trading frequency of 97.61 percent (98.41 percent as of December 31, 2011)100% in the year 2015 (100% in the year 2014).
Investment shares do not have a nominal value of S/10.00 per share. Holders of investment shares are neither entitled neither to exercise voting rights ornor to participate in shareholders’ meetings but domeetings; however, they confer upon the holders thereof the right to participate in the dividends distribution of dividends.in the same manner as common shares. The table below presents the componentscomposition of the investment shares:shares as of December 31, 2015 and 2014:
| | | As of December 31, 2012 | |
| | | Number of
shares | | | Investment
shares | | | Investment
shares | |
| | | | | | S/.(000) | | | US$(000) | |
| | | | | | | | | | | | | |
| Investment shares | | | 744,640 | | | | 6,827 | | | | 2,019 | |
| Treasury investment shares | | | (271,733 | ) | | | (1,640 | ) | | | (620 | ) |
| | | | 472,907 | | | | 5,187 | | | | 1,399 | |
| | | As of December 31, 2011 | | |
| | | Number of
shares | | Investment
shares | | Investment
shares | | | Number of shares | | Investment shares | | Investment shares | |
| | | | | S/.(000) | | US$(000) | | | | | | S/(000) | | | US$(000) | |
| | | | | | | | | | | | | | | | | | | | | | |
| Investment shares | | | 744,640 | | | | 7,446 | | | | 2,161 | | | | 744,640 | | | | 7,447 | | | | 2,161 | |
| Treasury investment shares | | | (61,976 | ) | | | (619 | ) | | | (142 | ) | | | (272,963 | ) | | | (2,730 | ) | | | (765 | ) |
| | | | 682,664 | | | | 6,827 | | | | 2,019 | | | | | | | | | | | | | |
| | | | | 471,677 | | | | 4,717 | | | | 1,396 | |
The market value of the investment shares amounted to US$29.414.15 per share as of December 31, 20122015 (US$37.708.72 per share as of December 31, 2011) and it presented2014). These shares did not present a trading frequency of 7.57 percent (12 percent as of December 31, 2011).in 2015 and 2014.
Notes to the consolidated financial statements(continued)
The Peruvian Corporations Law (Ley General de Sociedades)requires that a minimum of ten percent10% of the distributable earnings for each period, after deducting the income tax, be transferred to a legal reserve until the latter is equal to 20 percent20% of the capital stock. This legal reserve can be used to offset losses or may be capitalized, with the obligation, in both cases, to replenish it.
ForAlthough, the years ending December 31, 2012, 2011 and 2010,balance of the legal reserve exceeded the limit mentioned above, the Company had not increased its legal reserve due to its legal reserve reached the limit mentioned before.by US$47,000 in 2014.
| (d) | Dividends declared and paid - |
The table below presents the dividends declared and paid in 2012, 20112014 and 2010:2013:
| Meetings | | Date | | Dividends
paid | | | Dividend
per share | |
| | | | | US$(000) | | | US$ | |
| 2014 Dividends | | | | | | | | | | |
| Mandatory Annual Shareholders’ Meeting | | March 27 | | | 3,032 | | | | 0.01 | |
| Board of Directors’ Meeting | | October 30 | | | 6,339 | | | | 0.02 | |
| Less - Dividends of treasury shares | | | | | (729 | ) | | | | |
| | | | | | | | | | | |
| | | | | | 8,642 | | | | | |
| | | | | | | | | | | |
| 2013 Dividends | | | | | | | | | | |
| Mandatory Annual Shareholders’ Meeting | | March 26 | | | 82,690 | | | | 0.30 | |
| Board of Directors’ Meeting | | October 30 | | | 2,757 | | | | 0.01 | |
| Less - Dividends of treasury shares | | | | | (6,568 | ) | | | | |
| | | | | | | | | | | |
| | | | | | 78,879 | | | | | |
During 2015, no dividends have been declared or paid. According to the current Law, there are no restrictions for the remittance of dividends or repatriation of capital by foreign investors.
| (e) | Basic and diluted loss per share - |
Loss per share is calculated by dividing net profit for the period by the weighted average number of shares outstanding during the year.
Notes to the consolidated financial statements(continued)
| Meeting | | Date | | Dividends
declared and
paid | | | Dividend
per share | |
| | | | | US$ | | | US$ | |
| 2012 Dividends | | | | | | | | | | |
| Mandatory Annual Shareholders’ Meeting | | March 26 | | | 110,254,000 | | | | 0.40 | |
| Board of Directors’ Meeting | | October 30 | | | 55,126,000 | | | | 0.20 | |
| Less – Dividends of treasury shares | | | | | (12,714,000 | ) | | | | |
| | | | | | 152,666,000 | | | | | |
| 2011 Dividends | | | | | | | | | | |
| Mandatory Annual Shareholders’ Meeting | | March 25 | | | 90,959,000 | | | | 0.33 | |
| Board of Directors’ Meeting | | October 27 | | | 63,396,000 | | | | 0.23 | |
| Less – Dividends of treasury shares | | | | | (11,867,000 | ) | | | | |
| | | | | | 142,488,000 | | | | | |
| 2010 Dividends | | | | | | | | | | |
| Mandatory Annual Shareholders’ Meeting | | March 26 | | | 82,690,000 | | | | 0.30 | |
| Board of Directors’ Meeting | | October 28 | | | 44,101,000 | | | | 0.16 | |
| Less – Dividends of treasury shares | | | | | (9,748,000 | ) | | | | |
| | | | | | 117,043,000 | | | | | |
The effectcalculation of declared and paid dividends by subsidiariesloss per share attributable to non-controlling interestthe equity holders of the parent is made up as follows:presented below:
| | | 2012 | | | 2011 | | | 2010 | |
| | | US$(000) | | | US$(000) | | | US$(000) | |
| | | | | | | | | | | | | |
| Sociedad Minera El Brocal S.A.A. | | | 19,266 | | | | 17,263 | | | | 19,383 | |
| S.M.R.L. Chaupiloma Dos de Cajamarca | | | 14,820 | | | | 14,280 | | | | 3,688 | |
| Minera La Zanja S.R.L. | | | 10,795 | | | | 31,919 | | | | - | |
| Inversiones Colquijirca S.A. | | | - | | | | 3,274 | | | | 16,105 | |
| | | | 44,881 | | | | 66,736 | | | | 39,176 | |
| | | 2015 | | | 2014 | | | 2013 | |
| | | | | | | | | | |
| Loss net (numerator) - US$ | | | (317,210,000 | ) | | | (76,065,000 | ) | | | (107,257,000 | ) |
| Total common and investment shares (denominator) | | | 254,186,867 | | | | 254,186,867 | | | | 254,186,867 | |
| | | | | | | | | | | | | |
| Loss net per basic share and diluted - US$ | | | (1.25 | ) | | | (0.30 | ) | | | (0.42 | ) |
The calculation of loss per share from continuing operations attributable to the equity holders of the Parent is presented below:
| | | 2015 | | | 2014 | | | 2013 | |
| | | | | | | | | | |
| Loss net (numerator) - US$ | | | (307,687,000 | ) | | | (44,951,000 | ) | | | (23,372,000 | ) |
| Total common and investment shares (denominator) | | | 254,186,867 | | | | 254,186,867 | | | | 254,186,867 | |
| | | | | | | | | | | | | |
| Loss net per basic share and diluted - US$ | | | (1.21 | ) | | | (0.18 | ) | | | (0.09 | ) |
Loss per basic and diluted share is the same in both cases, because there are no diluting effects on loss for the years 2015, 2014 and 2013.
There have been no transactions involving ordinary shares or investment between December 31, 2015 and the date of issuance of these consolidated financial statements.
| 17.19. | Tax SituationSubsidiaries with material non-controlling interest |
| (a) | The Company and itsFinancial information of subsidiaries are subject to the Peruvian tax system. As of December 31, 2012, the income tax rate was 30 percent on taxable income.that have material non-controlling interest is provided below: |
Legal entities and individuals not domiciled in Peru are subject to an additional tax of 4.1 percent on the dividends received.
Through Law N°29666, published on February 20, 2011, it is restored the 16 percent of Value Added Tax being applicable from March 1, 2011.
Additionally, through Law N°29667, published in the same date, the Financial Transactions Tax is reduced to 0.005 percent, being applicable from April 1, 2011.
| | | Country of
incorporation and
operation | | 2015 | | | 2014 | | | 2013 | |
| | | | | % | | | % | | | % | |
| | | | | | | | | | | | |
| Equity interest held by non-controlling interests: | | | | | | | | | | | | | | |
| Sociedad Minera El Brocal S.A.A. | | Peru | | | 45.93 | | | | 45.93 | | | | 45.93 | |
| S.M.R.L. Chaupiloma Dos de Cajamarca | | Peru | | | 40.00 | | | | 40.00 | | | | 40.00 | |
| Minera La Zanja S.R.L. | | Peru | | | 46.94 | | | | 46.94 | | | | 46.94 | |
Notes to the consolidated financial statements(continued)
| | | | | 2015 | | | 2014 | | | 2013 | |
| | | | | US$(000) | | | US$(000) | | | US$(000) | |
| Accumulated balances of material non-controlling interest: | | | | | | | | | | | | | | |
| Sociedad Minera El Brocal S.A.A. | | Peru | | | 172,542 | | | | 208,664 | | | | 190,050 | |
| S.M.R.L. Chaupiloma Dos de Cajamarca | | Peru | | | 2,357 | | | | 3,600 | | | | 2,228 | |
| Minera La Zanja S.R.L. | | Peru | | | 53,271 | | | | 85,756 | | | | 85,029 | |
| | | | | | | | | | | | | | | |
| | | | | | 228,170 | | | | 298,020 | | | | 277,307 | |
| Profit (loss) allocated to material non-controlling interest: | | | | | | | | | | | | | | |
| Sociedad Minera El Brocal S.A.A. | | Peru | | | (34,991 | ) | | | 3,450 | | | | (3,541 | ) |
| S.M.R.L. Chaupiloma Dos de Cajamarca | | Peru | | | 9,244 | | | | 10,250 | | | | 12,302 | |
| Minera La Zanja S.R.L. | | Peru | | | (32,486 | ) | | | 725 | | | | 18,760 | |
| Apu Coropuna S.R.L. | | Peru | | | (102 | ) | | | - | | | | - | |
| | | | | | | | | | | | | | | |
| | | | | | (58,335 | ) | | | 14,425 | | | | 27,521 | |
| (b) | DuringThe summarized financial information of these subsidiaries, before inter-company eliminations, is presented below: |
Statements of financial position as of December 31, 2015:
| | | Sociedad Minera
El Brocal S.A.A. | | | S.M.R.L.
Chaupiloma Dos
de Cajamarca | | | Minera
La Zanja
S.R.L. | | | Total | |
| | | US$(000) | | | US$(000) | | | US$(000) | | | US$(000) | |
| | | | | | | | | | | | | |
| Current assets | | | 87,676 | | | | 9,381 | | | | 103,540 | | | | 200,597 | |
| Non-current assets | | | 652,197 | | | | 16 | | | | 116,792 | | | | 769,005 | |
| Current liabilities | | | (166,424 | ) | | | (3,508 | ) | | | (37,030 | ) | | | (206,962 | ) |
| Non-current liabilities | | | (197,763 | ) | | | - | | | | (69,816 | ) | | | (267,579 | ) |
| | | | | | | | | | | | | | | | | |
| Total shareholders’ equity, net | | | 375,686 | | | | 5,889 | | | | 113,486 | | | | 495,061 | |
| Attributable to: | | | | | | | | | | | | | | | | |
| Shareholders of the parent | | | 203,144 | | | | 3,532 | | | | 60,215 | | | | 266,891 | |
| Non-controlling interests | | | 172,542 | | | | 2,357 | | | | 53,271 | | | | 228,170 | |
| | | | | | | | | | | | | | | | | |
| | | | 375,686 | | | | 5,889 | | | | 113,486 | | | | 495,061 | |
Notes to the consolidated financial statements(continued)
Statements of financial position as of December 31, 2014:
| | | Sociedad Minera
El Brocal S.A.A. | | | S.M.R.L.
Chaupiloma Dos
de Cajamarca | | | Minera
La Zanja
S.R.L. | | | Total | |
| | | US$(000) | | | US$(000) | | | US$(000) | | | US$(000) | |
| | | | | | | | | | | | | |
| Current assets | | | 110,244 | | | | 14,657 | | | | 119,591 | | | | 244,492 | |
| Non-current assets | | | 654,819 | | | | 70 | | | | 159,245 | | | | 814,134 | |
| Current liabilities | | | (152,721 | ) | | | (5,727 | ) | | | (42,405 | ) | | | (200,853 | ) |
| Non-current liabilities | | | (157,996 | ) | | | - | | | | (53,742 | ) | | | (211,738 | ) |
| | | | | | | | | | | | | | | | | |
| Total shareholders’ equity, net | | | 454,346 | | | | 9,000 | | | | 182,689 | | | | 646,035 | |
| Attributable to: | | | | | | | | | | | | | | | | |
| Shareholders of the parent | | | 245,682 | | | | 5,400 | | | | 96,933 | | | | 348,015 | |
| Non-controlling interests | | | 208,664 | | | | 3,600 | | | | 85,756 | | | | 298,020 | |
| | | | | | | | | | | | | | | | | |
| | | | 454,346 | | | | 9,000 | | | | 182,689 | | | | 646,035 | |
Statements of profit or loss for the year ended December 31, 2015:
| | | Sociedad
Minera El
Brocal S.A.A. | | | S.M.R.L. Chaupiloma
Dos
de Cajamarca | | | Minera
La Zanja
S.R.L. | | | Total | |
| | | US$(000) | | | US$(000) | | | US$(000) | | | US$(000) | |
| | | | | | | | | | | | | |
| Revenues | | | 171,294 | | | | 32,414 | | | | 161,007 | | | | 364,715 | |
| Cost of sales | | | (204,556 | ) | | | (54 | ) | | | (213,372 | ) | | | (417,982 | ) |
| Administrative expenses | | | (19,168 | ) | | | (106 | ) | | | (2,251 | ) | | | (21,525 | ) |
| Sales expenses | | | (9,056 | ) | | | - | | | | (1,207 | ) | | | (10,263 | ) |
| Exploration in non-operating areas | | | (2,366 | ) | | | - | | | | (8,954 | ) | | | (11,320 | ) |
| Impairment loss of long-lived assets | | | - | | | | - | | | | (3,803 | ) | | | (3,803 | ) |
| Other operating expense, net | | | (2,657 | ) | | | - | | | | (687 | ) | | | (3,344 | ) |
| Finance income | | | 154 | | | | - | | | | 16 | | | | 170 | |
| Finance costs | | | (10,096 | ) | | | (4 | ) | | | (3,684 | ) | | | (13,784 | ) |
| Net gain (loss) for exchange difference | | | (3,847 | ) | | | 45 | | | | (1,973 | ) | | | (5,775 | ) |
| Profit (loss) before income tax | | | (80,298 | ) | | | 32,295 | | | | (74,908 | ) | | | (122,911 | ) |
| Income tax | | | 4,109 | | | | (9,186 | ) | | | 5,702 | | | | 625 | |
| | | | | | | | | | | | | | | | | |
| Net profit (loss) | | | (76,189 | ) | | | 23,109 | | | | (69,206 | ) | | | (122,286 | ) |
| | | | | | | | | | | | | | | | | |
| Attributable to non-controlling interests | | | (34,991 | ) | | | 9,244 | | | | (32,486 | ) | | | (58,233 | ) |
| | | | | | | | | | | | | | | | | |
| Dividends paid to non-controlling interests | | | - | | | | 10,488 | | | | - | | | | 10,488 | |
Notes to the consolidated financial statements(continued)
Statements of profit or loss for the year ended December 31, 2014:
| | | Sociedad Minera El
Brocal S.A.A. | | | S.M.R.L.
Chaupiloma Dos
de Cajamarca | | | Minera
La Zanja
S.R.L. | | | Total | |
| | | US$(000) | | | US$(000) | | | US$(000) | | | US$(000) | |
| | | | | | | | | | | | | |
| Revenues | | | 210,002 | | | | 36,867 | | | | 185,286 | | | | 432,155 | |
| Cost of sales | | | (149,969 | ) | | | (74 | ) | | | (137,659 | ) | | | (287,702 | ) |
| Administrative expenses | | | (17,617 | ) | | | (113 | ) | | | (5,920 | ) | | | (23,650 | ) |
| Sales expenses | | | (7,103 | ) | | | - | | | | (1,441 | ) | | | (8,544 | ) |
| Exploration in non-operating areas | | | (5,085 | ) | | | - | | | | (19,689 | ) | | | (24,774 | ) |
| Other operating income (expense), net | | | (50 | ) | | | (1 | ) | | | (3,389 | ) | | | (3,440 | ) |
| Finance income | | | - | | | | - | | | | 1 | | | | 1 | |
| Finance costs | | | (4 | ) | | | (3 | ) | | | (1,728 | ) | | | (1,735 | ) |
| Net loss for exchange difference | | | (1,039 | ) | | | (50 | ) | | | (1,525 | ) | | | (2,614 | ) |
| Profit before income tax | | | 29,135 | | | | 36,626 | | | | 13,936 | | | | 79,697 | |
| Income tax | | | (21,621 | ) | | | (10,996 | ) | | | (12,388 | ) | | | (45,005 | ) |
| | | | | | | | | | | | | | | | | |
| Net profit | | | 7,514 | | | | 25,630 | | | | 1,548 | | | | 34,692 | |
| | | | | | | | | | | | | | | | | |
| Attributable to non-controlling interests | | | 3,450 | | | | 10,250 | | | | 725 | | | | 14,425 | |
| | | | | | | | | | | | | | | | | |
| Dividends paid to non-controlling interests | | | - | | | | 8,880 | | | | - | | | | 8,880 | |
Statements of profit or loss for the year ended December 31, 2013:
| | | Sociedad Minera
El Brocal S.A.A. | | | S.M.R.L.
Chaupiloma Dos
de Cajamarca | | | Minera La Zanja
S.R.L. | | | Total | |
| | | US$(000) | | | US$(000) | | | US$(000) | | | US$(000) | |
| | | | | | | | | | | | | |
| Revenues | | | 187,769 | | | | 44,185 | | | | 193,298 | | | | 425,252 | |
| Cost of sales | | | (155,613 | ) | | | (112 | ) | | | (115,577 | ) | | | (271,302 | ) |
| Administrative expenses | | | (15,620 | ) | | | (96 | ) | | | (2,475 | ) | | | (18,191 | ) |
| Sales expenses | | | (8,763 | ) | | | - | | | | (528 | ) | | | (9,291 | ) |
| Exploration in non-operating areas | | | (5,220 | ) | | | - | | | | (3,446 | ) | | | (8,666 | ) |
| Other operating expense, net | | | (656 | ) | | | (3 | ) | | | (55 | ) | | | (714 | ) |
| Finance income | | | 136 | | | | 3 | | | | 37 | | | | 176 | |
| Finance costs | | | (1,912 | ) | | | (5 | ) | | | (1,301 | ) | | | (3,218 | ) |
| Net loss for exchange difference | | | (2,827 | ) | | | (66 | ) | | | (777 | ) | | | (3,670 | ) |
| Profit (loss) before income tax | | | (2,706 | ) | | | 43,906 | | | | 69,176 | | | | 110,376 | |
| Income tax | | | (5,003 | ) | | | (13,151 | ) | | | (29,211 | ) | | | (47,365 | ) |
| | | | | | | | | | | | | | | | | |
| Net profit (loss) | | | (7,709 | ) | | | 30,755 | | | | 39,965 | | | | 63,011 | |
| | | | | | | | | | | | | | | | | |
| Attributable to non-controlling interests | | | (3,541 | ) | | | 12,302 | | | | 18,760 | | | | 27,521 | |
| | | | | | | | | | | | | | | | | |
| Dividends paid to non-controlling interests | | | 2,713 | | | | 10,820 | | | | - | | | | 13,533 | |
Notes to the consolidated financial statements(continued)
Statements of cash flow for the year ended December 31, 2015:
| | | Sociedad Minera
El Brocal S.A.A. | | | S.M.R.L.
Chaupiloma
Dos de
Cajamarca | | | Minera La
Zanja S.R.L. | | | Total | |
| | | US$(000) | | | US$(000) | | | US$(000) | | | US$(000) | |
| | | | | | | | | | | | | |
| Operating activities | | | (1,523 | ) | | | 26,474 | | | | 30,743 | | | | 55,694 | |
| Investing activities | | | (28,375 | ) | | | - | | | | (26,761 | ) | | | (55,136 | ) |
| Financing activities | | | 31,867 | | | | (26,220 | ) | | | - | | | | 5,647 | |
| Increase in cash and cash equivalents in the year | | | 1,969 | | | | 254 | | | | 3,982 | | | | 6,205 | |
Statements of cash flow for the year ended December 31, 2014:
| | | Sociedad Minera
El Brocal S.A.A. | | | S.M.R.L.
Chaupiloma Dos
de Cajamarca | | | Minera La
Zanja S.R.L. | | | Total | |
| | | US$(000) | | | US$(000) | | | US$(000) | | | US$(000) | |
| | | | | | | | | | | | | |
| Operating activities | | | 71,682 | | | | 22,375 | | | | 17,075 | | | | 111,132 | |
| Investing activities | | | (131,045 | ) | | | - | | | | (20,452 | ) | | | (151,497 | ) |
| Financing activities | | | 54,642 | | | | (22,200 | ) | | | 7,000 | | | | 39,442 | |
| Increase (decrease) in cash and cash equivalents in the year | | | (4,721 | ) | | | 175 | | | | 3,623 | | | | (923 | ) |
Statements of cash flow for the year ended December 31, 2013:
| | | Sociedad Minera
El Brocal S.A.A. | | | S.M.R.L.
Chaupiloma
Dos de
Cajamarca | | | Minera La
Zanja S.R.L. | | | Total | |
| | | US$(000) | | | US$(000) | | | US$(000) | | | US$(000) | |
| | | | | | | | | | | | | |
| Operating activities | | | 80,197 | | | | 34,864 | | | | 71,621 | | | | 186,682 | |
| Investing activities | | | (215,758 | ) | | | 7 | | | | 15,079 | | | | (200,672 | ) |
| Financing activities | | | 121,202 | | | | (34,450 | ) | | | (90,100 | ) | | | (3,348 | ) |
| Increase (decrease) in cash and cash equivalents in the year | | | (14,359 | ) | | | 421 | | | | (3,400 | ) | | | (17,338 | ) |
Notes to the consolidated financial statements(continued)
The Company and its Peruvian subsidiaries are subject to the Peruvian tax regime. In 2015, the income tax rate for enterprises is 28% over the taxable income. Non-domiciled companies in Peru or natural persons are affected to a withholding income tax of 4.1% over the dividends received.
By means of Law No. 30296 enacted on December 31, 2014, the Peruvian government introduced certain amendments to the Income Tax Law, effective January 1, 2015. The most relevant are listed below:
| - | There will be a gradual reduction of the four years following the year of filing tax returns the tax authorities have the power to review and, as applicable, correct thecorporate income tax computed by the Company. The Income Taxfrom 30% to 28% in 2015 and Value Added Tax (“IGV” by its Spanish acronym) returns for the following years are open2016; to review by Tax Authorities:27% in 2017 and 2018; and to 26% in 2019 and thereafter; |
| - | There will be a gradual increase of the withholding income tax to dividends from 4.1% to 6.8% in 2015 and 2016; to 8.0% in 2017 and 2018; and to 9.3% in 2019 and thereafter. These rates will be applicable to the distributed or approved dividends, whichever first occurs, effective January 1, 2015; |
| - | The retained earnings or other items that can generate taxable dividends, obtained until December 31, 2014, will be subject to a rate of 4.1%. |
| (b) | Years open to tax review - |
During the four years following the year of filing the tax return, the tax authorities have the power to review and, as applicable, correct the income tax computed by the Group. The Income Tax and Value Added Tax returns for the following years are open to review by the Tax Authorities:
| Entity | Years open to review byband Tax
Authorities |
| | |
| Compañía de Minas Buenaventura S.A.A. | 2008, 2009, 2010, 2011 and 2012– 2015 |
| Bisa Construcción S.A. | 2011 – 2015 |
| Buenaventura Ingenieros S.A. | 2008, 2009, 2010, 2011 and 2012 |
Compañía de Exploraciones, Desarrollo e Inversiones Mineras S.A.C.2013 – CEDIMIN | 2010, 2011 and 20122015 |
| Compañía Minera Condesa S.A. | 2008, 2009, 2010, 2011 and 2012– 2015 |
| Compañía Minera Colquirrumi S.A. | 2008, 2009, 2010, 2011 and 2012– 2015 |
| Consorcio Energético de Huancavelica S.A. | 2008, 2009, 2011 and 2012– 2015 |
| Contacto Corredores de Seguros S.A. | 2008, 2009, 2010, 2011 and 2012 |
Inversiones Colquijirca S.A. | 2008, 2009, 2010, 2011 and 2012 |
Sociedad Minera El Brocal S.A.A. | 2008, 2009, 2010, 2011 and 2012 |
S.M.R.L. Chaupiloma Dos de Cajamarca | 2008, 2010, 2011 and 2012 |
Minera La Zanja S.R.L. | 2008, 2009, 2010, 2011 and 2012– 2015 |
| El Molle Verde S.A.C. | 2011 and 2012– 2015 |
| Empresa de Generación Huanza S.A. | 2008, 2009, 2010, 2011 and – 2015 |
| Inversiones Colquijirca S.A. | 2011 – 2015 |
| Minera La Zanja S.R.L. (*) | 2013 – 2015 |
| Sociedad Minera El Brocal S.A.A. (**) | 2013 – 2015 |
| S.M.R.L. Chaupiloma Dos de Cajamarca | 2012 – 2015 |
Procesadora Industrial RioRío Seco S.A.S. A. | 2010, 2011 and 2012– 2015 |
| Apu Coropuna S.R.L. | 2013 – 2015 |
| Cerro Hablador S. A. C. | 2013 – 2015 |
| Minera Azola S. R. L. | 2014 – 2015 |
Due to the possible interpretations that the Tax Authorities may give to legislation in effect, it is not possible to determine whether or not any of the tax audits that will perform will result in increased liabilities for the Company. For that reason any tax or surcharge that could arise from future tax audits would be applied to the income of the period in which it is determined. In Management’s opinion and its legal advisors, any possible additional payment of taxes in the entities mentioned before would not have a material effect on the consolidated financial statements as of December 31, 2012 and 2011.
Buenaventura -
Buenaventura’s Income Tax Returns for the 2000 and 2003 periods have been audited by Tax Authorities. As a result of the aforesaid, the Tax Administration has issued assessments denying recognition of Buenaventura’s tax-loss carryforwards reported as of December 31, 2000 and 2003 amounting to S/.71,160,000 (equivalent to US$27,895,000) and S/.18,224,000 (equivalent to US$7,144,000), respectively. In October and November of 2012, the Fiscal Court resolve in favor to the Company the appeal process for the year 2000 and 2003, determining that the dividends should not be considered as taxable for purposes of determining the tax-loss carryforward.
Notes to the consolidated financial statements(continued)
During the year 2007, the Tax Administration audited Buenaventura’s Income Tax Returns for the 2004 and 2005 periods. As a consequence of the aforementioned, the Tax Administration issued assessments denying recognition of some tax deductions by S/.77,921,000 (equivalent to US$30,545,000) in 2004 and S/.119,785,000 (equivalent to US$46,956,000) in 2005. The main objection considered as taxable income the reversal of the provision related to commercial contracts, which in that time were not deducted to calculate Income Tax. To date, the Tax Administration has issued a resolution, on the claim petition filed by the Company, to ratify the assessment made in the audit.
In July 2012, the Fiscal Court resolved the appeal process of the year 2005 determining null the resolution related to the reversal of the provision related to commercial contracts. As of the date of the consolidated financial statement, Tax Administration, through resolution, annulled the main objection of considered as taxable income the reversal of the provision related to commercial contracts, calculating a tax debt for S/.9,384,000 (equivalent to US$3,679,000), including fiscal penalty which were appealed. In Management´s opinion and its legal advisors, the Company should obtain a favorable result in the appeal process that the Company has started against the resolution.
In October 2012, the Fiscal Court resolved the appeal process of the year 2004, determining null the resolution related to the reversal of the provision related to commercial contracts. As of the date of the consolidated financial statement, Tax Administration, through resolution, annulled the main objection of considered as taxable income the reversal of the provision related to commercial contracts, calculating a tax debt for S/.246,000 (equivalent to US$96,000). As of the date of the consolidated financial statement, the debt has been paid.
During the year 2010, the Tax Administration audited Buenaventura’s Income Tax and Value Added Tax for the 2006 period. As a consequence of the aforementioned, the Tax Administration does not recognize some tax deductions made by the Company amounting to S/.184,339,000 (equivalent to US$72,261,000). The main objection considered as taxable income the reversal of the provision related to commercial contracts. Also, the Tax Administration considered the explosive delivery to mining contractors as a transaction subject to Income Tax and Value Added Tax amounting to S/.12,275,000 (equivalent to US$4,812,000). To date, the Tax Administration has issued a resolution, on the claim petition filed by the Company, to ratify the assessment made in the audit.
In July 2012, the Fiscal Court resolved the appeal process of the year 2006, determining null the resolution related to the reversal of the provision related to commercial contracts and annulled the explosive delivery to mining contractors. As of the date of the consolidated financial statement, Tax Administration, through resolution, annulled the main objection of considered as taxable income the reversal of the provision related to commercial contracts, calculating a tax debt for S/.3,314,000 (equivalent to US$1,299,000). As of the date of the consolidated financial statement, the debt has been paid.
Notes to the consolidated financial statements (continued)
The Income Tax declared by the Company for the years 2008 to 2011 and Value Added Tax by the periods from December 2008 and December 2012, are subject to be audited by tax authorities. It is important to mention that currently the Tax Administration is auditing 2007 Income Tax. Furthermore, the Company has been notified by Tax Administration the beginning of the audit of the income tax declare by the Company for the year 2008 and Value Added Tax for the period between January and December 2008, the audit will begin in March 2013.
Due to the possible interpretations that the Tax Authorities may give to legislation in effect, it is not possible to determine whether or not any of the tax audits that will perform will result in increased liabilities for the Company.Group. For that reason, any tax or surcharge that could arise from future tax audits would be applied to the income of the period in which it is determined. However, in Management’sIn management's opinion and its legal advisors, any possible additional payment of taxes in the entities mentioned before would not have a material effect on the consolidated financial statements as of December 31, 20122015 and 2011.
Cedimin -
Cedimin´s Income Tax Return for the 2002 period has been audited by the Tax Administration. As a result, the Tax Administration has issued assessments modifying the tax-loss carryforward declared by Cedimin. In those periods the principal objection is against having considered Cedimin´s loss of S/.22,041,000 (US$8,640,000) on the sale of Minera Huallanca S.A.C. and Minera Yanaquihua S.A. shares as non-deductible. In the opinion of Cedimin´s Management and its legal advisors, this interpretation has no legal basis, for which reason Cedimin would obtain a favorable result in the tax claim procedure initiated against the above-indicated assessment.
Condesa -
Condesa´s Income Tax Returns for the 2000, 2001 and 2003 periods have been audited by the Tax Administration. As a result of the aforesaid, the Tax Administration has issued assessments reducing the tax-loss carryforwards from previous years, which Condesa had reported in those periods, by S/.31,338,000 (US$12,285,000). For these periods, the principal objection is against having considered non-taxable income (dividends) as taxable for purposes of determining the tax-loss carryforward.
Notes to the consolidated financial statements (continued)
In October 2011, the Fiscal Court issued the resolutions with favourable result to Condesa. Therefore, tax-loss carryforward reported by Condesa is correctly recognized for 2000, 2001 and 2003.
Sociedad Minera El Brocal S.A.A. -
In 2006 the Tax Administration audited El Brocal Income tax return for the 2003 period, determining objections of S/.2,292,018 (equivalent to US$898,478) to net income for the period for under-reporting sales by the improper deduction of freight and insurance on mineral exports, which results in a reduction of the tax-loss carryforwards for the mentioned amount. The penalty resolution issued for this objection amounts to S/.343,803 (equivalent to US$134,772, without penalty interest) and was not accepted by El Brocal, therefore a claim was filed against the penalty. On November 30, 2010, the Tax Administration has issued a resolution No. 0150140009380, which rejected Brocal´s claim. Brocal do not agree with the scope of the resolution and a claim was presented to Fiscal Court on January 10, 2011, in accordance with the deadlines established by the Tax Code.2014.
The Income Tax declared byopen tax process of the Company for the years 2008 to 2012Group and Value Added Tax by the periods from December 2008, January 2010 to December 2012,its associates are subject to be audited by tax authorities.presented in Note 29 (g).
| (c) | As of December 31, 2012 and 2011, the tax-loss carryforward determined by Buenaventura amounts to approximately S/.278,391,000 and S/.595,924,000 respectively (equivalent to US$109,130,000 and US$220,958,000). In November 2010, a restated income tax return was submitted for 2009 which increased the tax-loss carryforward. As allowed by the Income Tax Law, Buenaventura has chosen a system for offsetting this loss with an annual cap equivalent to 50 percent of net future taxable income, until exhausting this amount. The amount of the tax-loss carryforward is subject to the results of the audits mentioned in the previous paragraph (b).Tax-loss carryforwards - |
The tax-loss carryforward determined by the Group amounts to approximately S/688,178,000 and S/622,419,000 as of December 31, 2015 and 2014, respectively (equivalent to US$201,634,000 and US$208,237,000 respectively). As permitted by the Income Tax Law, the Group has chosen a system that permits to offset these losses with an annual cap equivalent to 50% of net future taxable income.
Buenaventura
The Group has decided to recognizea deferred income tax asset insofar asrelated to the tax-loss carryforward,due to there it is more likely than not that the tax-loss carryforward can be used to offsetcompensate future taxable net income. See note 24.
| (d) | For purposes of determining the Income Tax, the transfer prices for transactions with related companies and companies domiciled in territories with little or no taxation must be substantiated with documentation and information on the valuation methods used and the criteria considered for their determination. Tax Administration can request this information based on analysis of the Company’s operations, the Company’s Management and its legal advisers believe that, as a result of the application of these standards, no material contingencies will arise for the Company as of December 31, 2012 and 2011. In accordance with the Legislative Decree 1116, effective since August 1, 2012, those standards are not applicable to the determination of Value Added Tax.Transfer pricing - |
For purposes of determining the Income Tax, the transfer prices for transactions with related companies and companies domiciled in territories with little or no taxation must be supported with documentation and information on the valuation methods used and the criteria considered for their determination. Tax Administration can request this information based on analysis of the Group's operations. The Group’s Management and its legal advisers believe that, as a result of the application of these standards, no material contingencies will arise for the Group as of December 31, 2015 and 2014.
Notes to the consolidated financial statements(continued)
| (e) | As mentioned in the note 2.3.(r) payments to the Government for mining royalties and special mining tax are under the scope of IAS 12, therefore, they are managed as were income tax, see detail in note 24(d). |
| (f) | On July 9, 2011, Law No. 29741 was enacted, which created the Supplemental Retirement Mining, Metallurgy and Steel Fund as a social security fund for workers of undertakings included in such sectors. Subsequently, dated May 11, 2012, Supreme Decree No. 006-2012-TR was issued, through which approved the regulations of the Law mentioned above. |
According to Article 1 of the Law, the Fund is constituted by the following contributions: (i) 0.5 percent of the annual pre-tax income of mining metallurgical and steel, and (ii) 0.5 percent monthly of gross monthly salary of each worker mining, metallurgical and steel.
The Company’s revenues are mostly from sales of gold and precious metals in the form of concentrates, including silver-lead, silver-gold, zinc and lead-gold-copper concentrates and ounces of gold. The table below presents the net sales to customers by geographic region and product type:
| (a) | The Group’s revenues are mostly from sales of gold and precious metals in the form of concentrates, including silver-lead, silver-gold, zinc and lead-gold-copper concentrates and ounces of gold. The table below presents the net sales to customers by geographic region and product type: |
| | | 2012 | | 2011 | | 2010 | | | 2015 | | 2014 | | 2013 | |
| | | US$(000) | | US$(000) | | US$(000) | | | US$(000) | | US$(000) | | US$(000) | |
| | | | | | | | | | | | | | | |
| Sales by geographic region | | | | | | | | | | | | | |
| Sales and services by geographic region: | | | | | | | | | | | | | |
| Metal and concentrates sales | | | | | | | | | | | | | |
| America | | | 742,103 | | | | 710,729 | | | | 504,648 | | | | 434,675 | | | | 531,460 | | | | 690,224 | |
| Peru | | | 556,407 | | | | 600,147 | | | | 479,126 | | | | 348,523 | | | | 434,958 | | | | 306,693 | |
| Europe | | | 98,085 | | | | 132,662 | | | | 35,937 | | | | 60,549 | | | | 46,585 | | | | 70,020 | |
| Asia | | | 53,090 | | | | 8,321 | | | | 7,944 | | | | 21,215 | | | | 54,268 | | | | 67,978 | |
| Africa | | | | - | | | | - | | | | 921 | |
| | | | | | | | | | | | | | |
| | | | 1,449,685 | | | | 1,451,859 | | | | 1,027,655 | | | | 864,962 | | | | 1,067,271 | | | | 1,135,836 | |
| Services rendered | | | | | | | | | | | | | | | | | | | | | | | | |
| Peru | | | 46,656 | | | | 41,225 | | | | 20,230 | | | | 50,944 | | | | 71,642 | | | | 79,344 | |
| America | | | 8 | | | | 82 | | | | - | | | | 3,544 | | | | - | | | | - | |
| Asia | | | - | | | | 710 | | | | - | | | | - | | | | - | | | | 241 | |
| Europe | | | - | | | | 6 | | | | - | | |
| | | | | | | | | | | | | | | | 54,488 | | | | 71,642 | | | | 79,585 | |
| | | | 1,496,349 | | | | 1,493,882 | | | | 1,047,885 | | | | | | | | | | | | | |
| | | | | 919,450 | | | | 1,138,913 | | | | 1,215,421 | |
| | | | | | | | | | | | | | |
| Sales by product: | | | | | | | | | | | | | |
| Gold | | | | 438,585 | | | | 551,132 | | | | 637,032 | |
| Silver | | | | 316,692 | | | | 355,239 | | | | 362,805 | |
| Copper | | | | 131,356 | | | | 271,282 | | | | 182,399 | |
| Zinc | | | | 102,110 | | | | 46,903 | | | | 71,187 | |
| Lead | | | | 55,445 | | | | 39,185 | | | | 55,951 | |
| | | | | 1,044,188 | | | | 1,263,741 | | | | 1,309,374 | |
| | | | | | | | | | | | | | |
| Commercial deductions | | | | (196,211 | ) | | | (184,483 | ) | | | (178,903 | ) |
| Adjustments to prior period liquidations | | | | 7,506 | | | | (6,073 | ) | | | (1,437 | ) |
| Embedded derivatives from sale of concentrate | | | | (337 | ) | | | (9,800 | ) | | | 6,140 | |
| Hedge operations | | | | 9,816 | | | | 3,886 | | | | 662 | |
| | | | | 864,962 | | | | 1,067,271 | | | | 1,135,836 | |
| Services rendered | | | | 54,488 | | | | 71,642 | | | | 79,585 | |
| | | | | | | | | | | | | | |
| | | | | 919,450 | | | | 1,138,913 | | | | 1,215,421 | |
Notes to the consolidated financial statements(continued)
| | | 2012 | | | 2011 | | | 2010 | |
| | | US$(000) | | | US$(000) | | | US$(000) | |
| | | | | | | | | | |
| Sales by product | | | | | | | | | | | | |
| Gold | | | 738,477 | | | | 791,387 | | | | 578,582 | |
| Silver | | | 544,947 | | | | 526,380 | | | | 274,624 | |
| Copper | | | 177,573 | | | | 193,215 | | | | 129,444 | |
| Zinc | | | 82,873 | | | | 72,095 | | | | 92,884 | |
| Lead | | | 52,834 | | | | 36,880 | | | | 46,913 | |
| | | | 1,596,704 | | | | 1,619,957 | | | | 1,122,447 | |
| Deductions | | | (147,930 | ) | | | (127,957 | ) | | | (112,254 | ) |
| Prior-period settlements | | | (15,609 | ) | | | 2,429 | | | | (4,922 | ) |
| | | | 1,433,165 | | | | 1,494,429 | | | | 1,005,271 | |
| Adjustment to open provisional liquidations | | | 14,816 | | | | (22,679 | ) | | | 6,630 | |
| Embedded derivatives from sale of concentrate (a) | | | 1,776 | | | | (11,210 | ) | | | 13,870 | |
| Hedging operations | | | (72 | ) | | | (8,681 | ) | | | 1,884 | |
| | | | 1,449,685 | | | | 1,451,859 | | | | 1,027,655 | |
| Sale of services, power and other minor items | | | 46,664 | | | | 42,023 | | | | 20,230 | |
| | | | | | | | | | | | | |
| | | | 1,496,349 | | | | 1,493,882 | | | | 1,047,885 | |
| (a) | Embedded derivative for sales of concentrate - |
Concentrates sales are based on commercial contracts, from which a provisional value based on forward quotation. The sales adjustments are considered an embedded derivative, which is required to be separated from the host commercial contract. Commercial contract are related to the quotation prices (London Metal Exchange). The embedded derivative, which does not qualify for hedge accounting, therefore, changes in the fair value are charge to profit and loss. Final quotations are settled in different months, according to the commercial contracts.
The adjustments to the provisional sale value are recorded as an adjustment in the current net sales. These adjustments resulted in higher sales by US$1,776,000, lower sales by US$11,210,000; and higher sales by US$13,870,000 in 2012, 2011 and 2010, respectively, as a result of the future behavior of metal prices trade by the Company at the cutoff date.
| (b) | Concentration of sales - |
In 2012,2015, the three most importanttwo customers represented 48, 15 and 8 percentwith sales of more than 10% of total net sales (58, 21represented 66% and 6 percent22% from the total net sales of total sales in 2011)the Group (62% and 17% during the year 2014, 65% and 13% during the year 2013). As of December 31, 2012, 68 percent2015, 85% of the accounts receivable is related to these customers (86 percent(80% as of December 31, 2011)2014). These clients are related to the mining business.
The Company’sGroup's sales of gold and concentrates are delivered to investment banks and national and international well knownwell-known companies. See note 28(b). Some of these clients have sales contracts that guarantee supplying them the production from the Company’sGroup’s mines at prices that are based on market quotations.
Notes to the consolidated financial statements (continued)
| 19.22. | CostsCost of sales, without considering depreciation and amortization |
The table below presents the components of this caption:
| (a) | The cost of sales of goods is made up as follows: |
| | | 2012 | | 2011 | | 2010 | | | 2015 | | 2014 | | 2013 | |
| | | US$(000) | | US$(000) | | US$(000) | | | US$(000) | | US$(000) | | US$(000) | |
| | | | | | | | | | | | | | | |
| Opening balance of products in process, note 8(a) | | | 140,775 | | | | 77,441 | | | | 15,650 | | |
| Opening balance of finished goods, note 8(a) | | | 19,026 | | | | 6,750 | | | | 7,578 | | |
| | | | 159,801 | | | | 84,191 | | | | 23,228 | | |
| | | | | | | | | | | | | | |
| Beginning balance of finished goods and products in process, net of depreciation and amortization | | | | 124,810 | | | | 114,475 | | | | 129,699 | |
| Cost of production | | | | | | | | | | | | | |
| Services provided by third parties | | | 274,100 | | | | 173,162 | | | | 167,510 | | | | 232,043 | | | | 264,051 | | | | 241,024 | |
| Consumption of materials and supplies | | | 133,983 | | | | 101,700 | | | | 86,946 | | | | 105,144 | | | | 102,270 | | | | 107,073 | |
| Direct labor | | | 103,828 | | | | 103,313 | | | | 76,666 | | | | 69,710 | | | | 77,931 | | | | 75,768 | |
| Electricity and water | | | 29,966 | | | | 35,083 | | | | 20,890 | | | | 35,799 | | | | 33,369 | | | | 14,454 | |
| Cost of concentrate purchase to third parties | | | 18,563 | | | | 16,917 | | | | 12,741 | | |
| Transport | | | 16,389 | | | | 13,445 | | | | 10,538 | | | | 10,261 | | | | 14,189 | | | | 7,207 | |
| Insurance | | | 11,973 | | | | 9,658 | | | | 7,281 | | |
| Maintenance and repair | | | | 9,334 | | | | 6,572 | | | | 6,037 | |
| Rentals | | | 9,835 | | | | 24,542 | | | | 6,697 | | | | 6,768 | | | | 6,241 | | | | 26,516 | |
| Maintenance and repair | | | 7,016 | | | | 5,256 | | | | 4,441 | | |
| Provision for impairment of finished goods, note 8(f) | | | 212 | | | | 383 | | | | 1,648 | | |
| Insurances | | | | 5,907 | | | | 7,429 | | | | 8,303 | |
| Cost of concentrate purchased to third parties | | | | - | | | | - | | | | (175 | ) |
| Provision for impairment of finished goods and product in progress, Note 9(b) | | | | 11,621 | | | | 1,152 | | | | 3,931 | |
| Other production expenses | | | 43,522 | | | | 38,314 | | | | 12,734 | | | | 7,496 | | | | 17,529 | | | | 15,456 | |
| | | | 649,387 | | | | 521,773 | | | | 408,092 | | |
| | | | | | | | | | | | | | |
| Final balance of products in process, note 8(a) | | | (148,533 | ) | | | (140,775 | ) | | | (77,441 | ) | |
| Final balance of finished goods, note 8(a) | | | (31,163 | ) | | | (19,026 | ) | | | (6,750 | ) | |
| | | | (179,696 | ) | | | (159,801 | ) | | | (84,191 | ) | |
| | | | | | | | | | | | | | |
| | | | 629,492 | | | | 446,163 | | | | 347,129 | | |
| Total cost of production of the period | | | | 494,083 | | | | 530,733 | | | | 505,594 | |
| Final balance of products in process and finished goods, net of depreciation and amortization | | | | (81,180 | ) | | | (112,156 | ) | | | (122,128 | ) |
| Cost of sales of goods, without considering depreciation and amortization | | | | 537,713 | | | | 533,052 | | | | 513,165 | |
Notes to the consolidated financial statements(continued)
| 20.(b) | Exploration in operating unitsThe cost of services is made up as follows: |
The table below presents the components of this caption:
| | | 2012 | | | 2011 | | | 2010 | |
| | | US$(000) | | | US$(000) | | | US$(000) | |
| | | | | | | | | | |
| Exploration expenses | | | | | | | | | | | | |
| Orcopampa | | | 49,079 | | | | 33,391 | | | | 28,719 | |
| Poracota | | | 30,105 | | | | 18,244 | | | | 18,390 | |
| Uchucchacua | | | 29,306 | | | | 20,223 | | | | 16,683 | |
| Antapite | | | 12,222 | | | | 7,271 | | | | 6,346 | |
| Mallay | | | 8,018 | | | | - | | | | - | |
| Recuperada | | | 7,476 | | | | 5,847 | | | | 5,246 | |
| Julcani | | | 7,327 | | | | 6,563 | | | | 5,105 | |
| Shila - Paula | | | 6,371 | | | | 15,482 | | | | 10,688 | |
| La Zanja | | | 2,517 | | | | 2,334 | | | | 264 | |
| Breapampa | | | 308 | | | | - | | | | - | |
| Caraveli | | | 236 | | | | - | | | | - | |
| Other | | | 53 | | | | - | | | | - | |
| | | | | | | | | | | | | |
| | | | 153,018 | | | | 109,355 | | | | 91,441 | |
The table below presents the components of this caption:
| | | 2012 | | | 2011 | | | 2010 | |
| | | US$(000) | | | US$(000) | | | US$(000) | |
| | | | | | | | | | |
| Sindicato Minero de Orcopampa S.A., note 30(b) | | | 34,863 | | | | 31,882 | | | | 27,572 | |
| Peruvian Goverment | | | 2,489 | | | | 28,222 | | | | 24,613 | |
| Minera El Futuro de Ica S.R.L., note 30(b) | | | 315 | | | | 158 | | | | 85 | |
| | | | | | | | | | | | | |
| | | | 37,667 | | | | 60,262 | | | | 52,270 | |
| 22. | Administrative expense |
The table below presents the components of this caption:
| | | 2012 | | | 2011 | | | 2010 | |
| | | US$(000) | | | US$(000) | | | US$(000) | |
| | | | | | | | | | |
| Personnel expense | | | 40,665 | | | | 38,466 | | | | 37,184 | |
| Other management expenses | | | 28,796 | | | | 17,969 | | | | 8,815 | |
| Professional fees | | | 12,307 | | | | 12,116 | | | | 6,490 | |
| Insurance | | | 2,901 | | | | 726 | | | | 856 | |
| Board of Directors’ participation | | | 2,522 | | | | 2,591 | | | | 2,384 | |
| Donations | | | 2,181 | | | | 1,878 | | | | 1,691 | |
| Rent | | | 2,058 | | | | 2,653 | | | | 1,248 | |
| Travel and mobility | | | 1,846 | | | | 731 | | | | 608 | |
| Valuation (reversed) of stock appreciation right | | | 1,720 | | | | (5,982 | ) | | | 42,425 | |
| Supplies | | | 1,669 | | | | 1,162 | | | | 665 | |
| Communications | | | 989 | | | | 783 | | | | 903 | |
| Subscription and quote | | | 768 | | | | 976 | | | | 848 | |
| Maintenance | | | 457 | | | | 729 | | | | 534 | |
| Canon | | | 377 | | | | 83 | | | | 83 | |
| Amortization of other assets | | | 39 | | | | 239 | | | | 503 | |
| Allowance for doubtful accounts | | | - | | | | 50 | | | | 2,000 | |
| | | | | | | | | | | | | |
| | | | 99,295 | | | | 75,170 | | | | 107,237 | |
Notes to the consolidated financial statements (continued)
| | | 2015 | | | 2014 | | | 2013 | |
| | | US$(000) | | | US$(000) | | | US$(000) | |
| | | | | | | | | | |
| Direct labor | | | 17,278 | | | | 38,186 | | | | 42,922 | |
| Services provided by third parties | | | 13,665 | | | | 12,142 | | | | 16,840 | |
| Electricity and water | | | 6,485 | | | | 5,827 | | | | 13,801 | |
| Consumption of materials and supplies | | | 5,506 | | | | 5,958 | | | | 1,678 | |
| Transport | | | 3,876 | | | | 7,209 | | | | 95 | |
| Rentals | | | 2,550 | | | | 7,312 | | | | 21,035 | |
| Insurances | | | 1,235 | | | | 1,231 | | | | 644 | |
| Maintenance and repair | | | 639 | | | | 472 | | | | 691 | |
| Other expenses | | | 1,458 | | | | 3,150 | | | | 16,414 | |
| Cost of sales of services, without considering depreciation and amortization | | | 52,692 | | | | 81,487 | | | | 114,120 | |
| 23. | Exploration in non-operating areasoperating units |
The expenses by exploration area are presented below:This caption is made up as follows:
| | | 2012 | | | 2011 | | | 2010 | |
| | | US$(000) | | | US$(000) | | | US$(000) | |
| | | | | | | | | | |
| Projects outside of mining units | | | | | | | | | | | | |
| Trapiche | | | 16,145 | | | | 4,731 | | | | 1,321 | |
| San Gregorio | | | 11,292 | | | | 3,015 | | | | 2,837 | |
| Focus - Chancas | | | 6,381 | | | | 1,957 | | | | 104 | |
| Consolidado de Hualgayoc | | | 5,704 | | | | 1,937 | | | | 2,126 | |
| Breapampa | | | 5,571 | | | | 5,565 | | | | 1,486 | |
| Chiptaj - Chancas | | | 4,360 | | | | 1,813 | | | | 784 | |
| Colquemayo | | | 3,973 | | | | 4,042 | | | | 2,759 | |
| San Pedro Sur | | | 2,477 | | | | - | | | | 1,940 | |
| Chacua (San Francisco) | | | 2,209 | | | | 1,612 | | | | 105 | |
| Mallay | | | 1,959 | | | | 10,536 | | | | 9,251 | |
| Surichata | | | 1,088 | | | | - | | | | - | |
| El Faique | | | 916 | | | | 590 | | | | 477 | |
| Vacas Heladas | | | 453 | | | | 736 | | | | - | |
| La Joya | | | 324 | | | | 1,577 | | | | 177 | |
| Anamaray | | | 159 | | | | 99 | | | | 828 | |
| Chaje | | | 24 | | | | 206 | | | | 1,042 | |
| Terciopelo | | | 23 | | | | 133 | | | | 1,230 | |
| Pachuca Norte - Mexico | | | - | | | | 3,264 | | | | 203 | |
| Other minor projects less than US$500,000 | | | 10,524 | | | | 991 | | | | 6,018 | |
| | | | 73,582 | | | | 42,804 | | | | 32,688 | |
| Projects in mining units | | | | | | | | | | | | |
| Shila | | | 16,191 | | | | - | | | | - | |
| Marcapunta | | | 3,119 | | | | 6,789 | | | | 3,417 | |
| Santa Barbara | | | 2,599 | | | | - | | | | - | |
| | | | | | | | | | | | | |
| | | | 95,491 | | | | 49,593 | | | | 36,105 | |
| | | 2015 | | | 2014 | | | 2013 | |
| | | US$(000) | | | US$(000) | | | US$(000) | |
| | | | | | | | | | |
| Services provided by third parties | | | 73,764 | | | | 80,281 | | | | 81,491 | |
| Consumption of materials and supplies | | | 10,314 | | | | 10,087 | | | | 13,267 | |
| Direct labor | | | 2,512 | | | | 2,756 | | | | 3,263 | |
| Rentals | | | 872 | | | | 896 | | | | 1,785 | |
| Transport | | | 275 | | | | 1,201 | | | | 2,180 | |
| Insurance | | | 235 | | | | 159 | | | | 228 | |
| Other minor expenses | | | 3,548 | | | | 2,472 | | | | (301 | ) |
| | | | 91,520 | | | | 97,852 | | | | 101,913 | |
This caption is made up as follows:
| | | 2015 | | | 2014 | | | 2013 | |
| | | US$(000) | | | US$(000) | | | US$(000) | |
| | | | | | | | | | |
| Sindicato Minero de Orcopampa S.A., Note 29(b) | | | 21,942 | | | | 21,688 | | | | 23,843 | |
| Royalties paid to the Peruvian State | | | 5,465 | | | | 6,737 | | | | 6,057 | |
| Others | | | - | | | | 15 | | | | 502 | |
| | | | | | | | | | | | | |
| | | | 27,407 | | | | 28,440 | | | | 30,402 | |
Notes to the consolidated financial statements(continued)
| 24.25. | Administrative expenses |
This caption is made up as follows:
| | | 2015 | | | 2014 | | | 2013 | |
| | | US$(000) | | | US$(000) | | | US$(000) | |
| | | | | | | | | | |
| Personnel expenses | | | 39,597 | | | | 37,983 | | | | 40,133 | |
| Sundry expenses | | | 15,175 | | | | 27,235 | | | | 18,574 | |
| Professional fees | | | 10,364 | | | | 13,956 | | | | 7,109 | |
| Insurance | | | 5,105 | | | | 3,726 | | | | 5,443 | |
| Rentals | | | 4,009 | | | | 3,217 | | | | 1,635 | |
| Donations | | | 3,336 | | | | 5,034 | | | | 2,884 | |
| Communications | | | 1,281 | | | | 1,276 | | | | 1,618 | |
| Board of Directors’ participation | | | 1,055 | | | | 1,163 | | | | 1,575 | |
| Consumption of materials and supplies | | | 1,032 | | | | 1,688 | | | | 1,701 | |
| Maintenance and repairs | | | 973 | | | | 2,720 | | | | 473 | |
| Other mining taxes | | | 824 | | | | 1,207 | | | | 1,532 | |
| Travel and mobility | | | 787 | | | | 908 | | | | 7,890 | |
| Subscriptions | | | 540 | | | | 779 | | | | 802 | |
| Valuation (reversal) of stock appreciation’s rights | | | (121 | ) | | | 89 | | | | (20,207 | ) |
| Amortization of other assets | | | 2,575 | | | | 121 | | | | 3,956 | |
| | | | | | | | | | | | | |
| | | | 86,532 | | | | 101,102 | | | | 75,118 | |
| 26. | Exploration in non-operating areas |
This caption is made up as follows:
| | | 2015 | | | 2014 | | | 2013 | |
| | | US$(000) | | | US$(000) | | | US$(000) | |
| | | | | | | | | | |
| Services provided by third parties | | | 18,852 | | | | 34,582 | | | | 17,801 | |
| Personnel expenses | | | 4,713 | | | | 6,053 | | | | 6,359 | |
| Consumption of materials and supplies | | | 1,436 | | | | 3,213 | | | | 2,490 | |
| Rentals | | | 376 | | | | 1,142 | | | | 707 | |
| Maintenance and repairs | | | 87 | | | | 139 | | | | 122 | |
| Insurance | | | 84 | | | | 75 | | | | 60 | |
| Transport | | | 20 | | | | 168 | | | | 162 | |
| Other expenses | | | 5,042 | | | | 4,635 | | | | 5,104 | |
| | | | | | | | | | | | | |
| | | | 30,610 | | | | 50,007 | | | | 32,805 | |
Notes to the consolidated financial statements(continued)
| 27. | Finance costs and finance revenues |
These captions are made up as follows:
| | | 2015 | | | 2014 | | | 2013 | |
| | | US$(000) | | | US$(000) | | | US$(000) | |
| | | | | | | | | | |
| Finance revenues: | | | | | | | | | | | | |
| Interests on loans to associates | | | 2,286 | | | | 2,887 | | | | 3,322 | |
| Interests on tax claims | | | 1,297 | | | | - | | | | - | |
| Dividends income | | | 500 | | | | 2 | | | | 181 | |
| Interests over third parties | | | 492 | | | | 5,380 | | | | 2,260 | |
| Interest on time deposits | | | 419 | | | | 139 | | | | 858 | |
| | | | 4,994 | | | | 8,408 | | | | 6,621 | |
| Unrealized variation of the fair value related to contingent consideration liability, Note 5 | | | 6,032 | | | | - | | | | - | |
| | | | | | | | | | | | | |
| | | | 11,026 | | | | 8,408 | | | | 6,621 | |
| | | | | | | | | | | | | |
| Finance costs: | | | | | | | | | | | | |
| Interest on borrowings | | | 19,182 | | | | 28,058 | | | | 12,706 | |
| Interest on loans | | | 5,565 | | | | 729 | | | | 389 | |
| Banking expenses | | | 366 | | | | 673 | | | | 355 | |
| Tax on financial transaction | | | 312 | | | | 148 | | | | 271 | |
| Interest on commercial obligations | | | 120 | | | | - | | | | - | |
| Variation of fair value of financial assets | | | - | | | | - | | | | 1,565 | |
| Other finance costs | | | 41 | | | | 94 | | | | 1,680 | |
| | | | | | | | | | | | | |
| | | | 25,586 | | | | 29,702 | | | | 16,966 | |
| Capitalized finance cost of qualify assets | | | (1,307 | ) | | | (20,079 | ) | | | (12,706 | ) |
| | | | | | | | | | | | | |
| Total finance interest | | | 24,279 | | | | 9,623 | | | | 4,260 | |
| Accrual of the present value for mine and exploration project closure | | | 3,343 | | | | 1,695 | | | | 5,636 | |
| | | | | | | | | | | | | |
| Total finance costs | | | 27,622 | | | | 11,318 | | | | 9,896 | |
Notes to the consolidated financial statements(continued)
| (a) | The Company and its subsidiaries recognizeGroup recognizes the effects of timing differences between the accounting basis and the tax basis. The table below presents the components of thisThis caption according to the items that give rise to them:is made up as follows: |
| | | As of
January 1,
2011 | | | Credit (debit) to
the consolidated
Income statement | | Credit (debit) to the
consolidated
changes in
shareholders´equity | | | As of
December 31,
2011 | | | Credit (debit)
to the
consolidated
Income
statement | | Credit (debit)
to the
consolidated
changes in
shareholders´
equity | | As of
December 31,
2012 | | | As of January 1,
2014 | | Credit (debit) to the
Consolidated
statement of
profit or loss | | Credit (debit) to
consolidated
statements of other
comprehensive
income | | Debit to mining
concessions
resulting from
the merger
with Canteras del
Hallazgo S.A.C. | | As of December 31,
2014 | | Credit (debit) to the
Consolidated
statement of
profit or loss | | Credit (debit) to
consolidated
statements of other
comprehensive
income | | As of December 31,
2015 | |
| | | US$(000) | | US$(000) | | US$(000) | | US$(000) | | US$(000) | | US$(000) | | US$(000) | | | US$(000) | | US$(000) | | US$(000) | | US$(000) | | US$(000) | | US$(000) | | US$(000) | | US$(000) | |
| Deferred asset for income tax included in results | | | | | | | | | | | | | | | | | | | | | | | | | | | | | | | | | | | | | | | | | | | | | | | | | | | | | | | | | | | | |
| Tax - loss carryforward | | | | 24,275 | | | | 8,211 | | | | - | | | | - | | | | 32,486 | | | | 45,923 | | | | - | | | | 78,409 | |
| Difference in depreciation and amortization rates | | | 19,208 | | | | 8,831 | | | | - | | | | 28,039 | | | | 12,172 | | | | - | | | | 40,211 | | | | 57,645 | | | | 816 | | | | - | | | | - | | | | 58,461 | | | | (6,084 | ) | | | - | | | | 52,377 | |
| Tax – loss carryforward | | | 125,363 | | | | (59,053 | ) | | | - | | | | 66,310 | | | | (33,522 | ) | | | - | | | | 32,788 | | |
| Effect of translation to U.S. dollars | | | 5,930 | | | | 3,130 | | | | - | | | | 9,060 | | | | 7,746 | | | | - | | | | 16,806 | | |
| Provision for closure of mining units, net | | | 13,774 | | | | 1,132 | | | | - | | | | 14,906 | | | | 469 | | | | - | | | | 15,375 | | | | 20,084 | | | | (288 | ) | | | - | | | | - | | | | 19,796 | | | | 12,848 | | | | - | | | | 32,644 | |
| Stock appreciation rights provision | | | 20,862 | | | | (7,545 | ) | | | - | | | | 13,317 | | | | (4,864 | ) | | | - | | | | 8,453 | | |
| Environmental liability for Mina Santa Barbara | | | 1,494 | | | | - | | | | - | | | | 1,494 | | | | 127 | | | | - | | | | 1,621 | | |
| Embedded derivative from sale of concentrates | | | 1,327 | | | | 929 | | | | - | | | | 2,256 | | | | (853 | ) | | | - | | | | 1,403 | | |
| Environmental liability for Santa Barbara mine | | | | 1,429 | | | | (190 | ) | | | - | | | | - | | | | 1,239 | | | | 317 | | | | - | | | | 1,556 | |
| Other minor | | | 7,784 | | | | 2,053 | | | | - | | | | 9,837 | | | | 5,693 | | | | - | | | | 15,530 | | | | 20,273 | | | | (2,529 | ) | | | - | | | | - | | | | 17,744 | | | | 1,954 | | | | 2,565 | | | | 22,263 | |
| | | | 195,742 | | | | (50,523 | ) | | | - | | | | 145,219 | | | | (13,032 | ) | | | - | | | | 132,187 | | | | 123,706 | | | | 6,020 | | | | - | | | | - | | | | 129,726 | | | | 54,958 | | | | 2,565 | | | | 187,249 | |
| Less – Allowance for deferred asset recoverability | | | (2,622 | ) | | | (1,177 | ) | | | - | | | | (3,799 | ) | | | (1,518 | ) | | | - | | | | (5,317 | ) | |
| | | | | | | | | | | | | | | | | | | | | | | | | | | | | | | | | | |
| Less - Allowance for deferred asset | | | | (6,404 | ) | | | 2,167 | | | | - | | | | - | | | | (4,237 | ) | | | (13,929 | ) | | | - | | | | (18,166 | ) |
| | | | 193,120 | | | | (51,700 | ) | | | - | | | | 141,420 | | | | (14,550 | ) | | | - | | | | 126,870 | | | | 117,302 | | | | 8,187 | | | | - | | | | - | | | | 125,489 | | | | 41,029 | | | | 2,565 | | | | 169,083 | |
| | | | | | | | | | | | | | | | | | | | | | | | | | | | | | | | | | | | | | | | | | | | | | | | | | | | | | | | | | | | | |
| Deferred asset included in retained earnings | | | | | | | | | | | | | | | | | | | | | | | | | | | | | | | | | | | | | | | | | | | | | | | | | | | | | | | | | | | | |
| Derivative financial instruments | | | 6,957 | | | | - | | | | (6,468 | ) | | | 489 | | | | - | | | | (489 | ) | | | - | | | | 328 | | | | 2,212 | | | | - | | | | - | | | | 2,540 | | | | (2,311 | ) | | | - | | | | 229 | |
| | | | 200,077 | | | | (51,700 | ) | | | (6,468 | ) | | | 141,909 | | | | (14,550 | ) | | | (489 | ) | | | 126,870 | | | | 117,630 | | | | 10,399 | | | | - | | | | - | | | | 128,029 | | | | 38,718 | | | | 2,565 | | | | 169,312 | |
| Deferred assets for mining royalties and special mining tax included in results | | | | | | | | | | | | | | | | | | | | | | | | | | | | | | | | | | | | | | | | | | | | | | | | | | | | | | | | | | | | |
| Exploration expenses | | | - | | | | 2,157 | | | | - | | | | 2,157 | | | | 1,319 | | | | - | | | | 3,476 | | | | 1,957 | | | | (1,509 | ) | | | - | | | | - | | | | 448 | | | | (774 | ) | | | - | | | | (326 | ) |
| Embedded derivatives from sale of concentrate | | | - | | | | 335 | | | | - | | | | 335 | | | | (144 | ) | | | - | | | | 191 | | |
| Final price adjustment of open provisional liquidations | | | - | | | | 828 | | | | - | | | | 828 | | | | (804 | ) | | | - | | | | 24 | | |
| Other minors | | | | 180 | | | | 186 | | | | - | | | | - | | | | 366 | | | | (181 | ) | | | - | | | | 185 | |
| | | | - | | | | 3,320 | | | | - | | | | 3,320 | | | | 371 | | | | - | | | | 3,691 | | | | 2,137 | | | | (1,323 | ) | | | - | | | | - | | | | 814 | | | | (955 | ) | | | - | | | | (141 | ) |
| Total deferred asset | | | 200,077 | | | | (48,380 | ) | | | (6,468 | ) | | | 145,229 | | | | (14,179 | ) | | | (489 | ) | | | 130,561 | | | | 119,767 | | | | 9,076 | | | | - | | | | - | | | | 128,843 | | | | 37,763 | | | | 2,565 | | | | 169,171 | |
| | | | | | | | | | | | | | | | | | | | | | | | | | | | | | | | | | |
| Deferred liability for income tax included in results | | | | | | | | | | | | | | | | | | | | | | | | | | | | | | | | | |
| Effect of translation into U.S. dollars | | | | (8,076 | ) | | | (23,417 | ) | | | - | | | | - | | | | (31,493 | ) | | | (42,044 | ) | | | - | | | | (73,537 | ) |
| Differences in amortization rates for development costs | | | | (18,504 | ) | | | (19,345 | ) | | | - | | | | - | | | | (37,849 | ) | | | 5,545 | | | | | | | | (32,304 | ) |
| Other minors | | | | (9,277 | ) | | | (13,886 | ) | | | (1,033 | ) | | | (9,235 | ) | | | (33,431 | ) | | | (1,958 | ) | | | 807 | | | | (34,582 | ) |
| | | | | (35,857 | ) | | | (56,648 | ) | | | (1,033 | ) | | | (9,235 | ) | | | (102,773 | ) | | | (38,457 | ) | | | 807 | | | | (140,423 | ) |
| Deferred liability for mining royalties and special mining tax | | | | | | | | | | | | | | | | | | | | | | | | | | | | | | | | | |
| Deemed cost of property, plant and equipment | | | | (203 | ) | | | 38 | | | | - | | | | - | | | | (165 | ) | | | 153 | | | | - | | | | (12 | ) |
| Other minors | | | | (182 | ) | | | 528 | | | | (170 | ) | | | - | | | | 176 | | | | - | | | | - | | | | 176 | |
| | | | | (385 | ) | | | 566 | | | | (170 | ) | | | - | | | | 11 | | | | 153 | | | | - | | | | 164 | |
| Total deferred liability | | | | (36,242 | ) | | | (56,082 | ) | | | (1,203 | ) | | | (9,235 | ) | | | (102,762 | ) | | | (38,304 | ) | | | 807 | | | | (140,259 | ) |
| | | | | | | | | | | | | | | | | | | | | | | | | | | | | | | | | | |
| Deferred income tax asset, net | | | | 83,525 | | | | | | | | | | | | | | | | 26,081 | | | | | | | | | | | | 28,912 | |
Notes to the consolidated financial statements(continued)
| | | As of
January 1,
2011 | | | Credit (debit) to
the consolidated
Income statement | | | Credit (debit) to the
consolidated
changes in
shareholders´equity | | | As of
December 31,
2011 | | | Credit (debit)
to the
consolidated
Income
statement | | | Credit (debit)
to the
consolidated
changes in
shareholders´
equity | | | As of
December 31,
2012 | |
| | | US$(000) | | | US$(000) | | | US$(000) | | | US$(000) | | | US$(000) | | | US$(000) | | | US$(000) | |
| Deferred liability for income tax included in results | | | | | | | | | | | | | | | | | | | | | | | | | | | | |
| Differences in amortization rates for development costs | | | (18,163 | ) | | | 3,278 | | | | - | | | | (14,885 | ) | | | 1,792 | | | | - | | | | (13,093 | ) |
| Deemed cost of fixed assets | | | (4,848 | ) | | | 1,469 | | | | - | | | | (3,379 | ) | | | 1,094 | | | | - | | | | (2,285 | ) |
| Unrealized loss on financial instruments | | | - | | | | (384 | ) | | | - | | | | (384 | ) | | | - | | | | 384 | | | | - | |
| Other minor | | | (251 | ) | | | 6 | | | | - | | | | (245 | ) | | | (1,131 | ) | | | - | | | | (1,376 | ) |
| Embedded derivatives from sale of concentrate | | | (2,765 | ) | | | 2,565 | | | | - | | | | (200 | ) | | | 171 | | | | - | | | | (29 | ) |
| | | | (26,027 | ) | | | 6,934 | | | | - | | | | (19,093 | ) | | | 1,926 | | | | 384 | | | | (16,783 | ) |
| Deferred liability for mining royalties and special mining tax | | | | | | | | | | | | | | | | | | | | | | | | | | | | |
| Deemed cost of fixed assets | | | - | | | | (501 | ) | | | - | | | | (501 | ) | | | 217 | | | | - | | | | (284 | ) |
| Adjustment to open provisional liquidations | | | - | | | | - | | | | - | | | | - | | | | (151 | ) | | | - | | | | (151 | ) |
| Derivative financial instruments | | | - | | | | (54 | ) | | | - | | | | (54 | ) | | | - | | | | 54 | | | | - | |
| Embedded derivatives from sale of concentrate | | | - | | | | (43 | ) | | | - | | | | (43 | ) | | | 43 | | | | - | | | | - | |
| | | | - | | | | (598 | ) | | | - | | | | (598 | ) | | | 109 | | | | 54 | | | | (435 | ) |
| Total deferred liability | | | (26,027 | ) | | | 6,336 | | | | - | | | | (19,691 | ) | | | 2,035 | | | | 438 | | | | (17,218 | ) |
| Deferred asset, net | | | 174,050 | | | | | | | | | | | | 125,538 | | | | | | | | | | | | 113,343 | |
F-86 | (b) | The deferred tax asset is presented in the consolidated statement of financial position: |
| | | 2015 | | | 2014 | |
| | | US$(000) | | | US$(000) | |
| | | | | | | |
| Deferred income tax asset, net | | | 41,574 | | | | 47,675 | |
| Deferred income tax liability, net | | | (12,662 | ) | | | (21,594 | ) |
| | | | | | | | | |
| | | | 28,912 | | | | 26,081 | |
| (c) | The following is the composition of the provision for income taxes shown in the consolidated statement of income for the years 2015, 2014 and 2013: |
| | | 2015 | | | 2014 | | | 2013 | |
| | | US$(000) | | | US$(000) | | | US$(000) | |
| | | | | | | | | | |
| Income tax | | | | | | | | | | | | |
| Current | | | (14,225 | ) | | | (19,006 | ) | | | (57,328 | ) |
| Deferred | | | (541 | ) | | | (47,006 | ) | | | (29,154 | ) |
| | | | | | | | | | | | | |
| | | | (14,766 | ) | | | (66,012 | ) | | | (86,482 | ) |
| (d) | Below is a reconciliation of tax expense and the accounting profit multiplied by the statutory tax rate for the years 2015, 2014 and 2013: |
| | | 2015 | | | 2014 | | | 2013 | |
| | | US$(000) | | | US$(000) | | | US$(000) | |
| | | | | | | | | | |
| Profit (loss) before income tax | | | (351,256 | ) | | | 35,486 | | | | 90,631 | |
| Loss before income tax for discontinued operations | | | (9,523 | ) | | | (31,114 | ) | | | (83,885 | ) |
| Profit (loss) before income tax | | | (360,779 | ) | | | 4,372 | | | | 6,746 | |
| Theoretical loss (gain) for income tax | | | (101,018 | ) | | | 1,312 | | | | 2,024 | |
| Permanent items and others: | | | | | | | | | | | | |
| Share in the results of associates | | | 48,545 | | | | 22,380 | | | | 34,244 | |
| Effect of translation into U.S. dollars | | | 42,044 | | | | 30,520 | | | | 22,644 | |
| Impairment of deferred tax asset | | | 13,929 | | | | - | | | | - | |
| Effect of change in income tax rate net | | | 2,347 | | | | 327 | | | | - | |
| Mining royalties and special mining tax | | | 663 | | | | 413 | | | | (1,650 | ) |
| Permanent items | | | 4,450 | | | | 3,824 | | | | 18,545 | |
| | | | | | | | | | | | | |
| Income tax expense | | | 10,960 | | | | 58,776 | | | | 75,807 | |
| Mining Royalties and Special Mining Tax | | | 3,806 | | | | 7,236 | | | | 10,675 | |
| | | | | | | | | | | | | |
| Total income tax | | | 14,766 | | | | 66,012 | | | | 86,482 | |
Notes to the consolidated financial statements(continued)
Buenaventura has not recognized deferred income tax liability in relation to the excess of the accounting basis over the tax basis of investments in shares due to the following:
| -(e) | InRelated to the case ofinvestment in associates, the Cerro Verde associate, BuenaventuraGroup has not recognized a deferred income tax asset forby US$369,206,00094,528,000 as of December 31, 2012 (deferred asset2015 originated by the difference between the financial and taxable basis of US$363,097,000these investments (US$47,623,000 as of December 31, 2011), given that Buenaventura’s Management, even though only exercising significant influence over this associate, has the intention and capacity to hold this investment until its copper reserves are depleted; in this sense,2014). Management believes that the timing differences will be reversed by means of dividends to be received in the future that, are not subject to the income tax paid by the Company.without taxable effects. There is no legal or contractual obligation that would require the Company’s Management to sell its investment in this associateits associates (which event would result in a taxable capital gain based on current tax law). |
| 29. | Commitments and contingencies |
Commitments
The Group’s exploration and exploitation activities are subject to environmental protection standards.
Law No. 28090 regulates the obligations and procedures that must be met by the holders of mining activities for the preparation, filing and implementation of Mine Closure Plans, as well as the establishment of the corresponding environmental guarantees to secure fulfillment of the investments, subject to the principles of protection, preservation and recovery of the environment.
Law No. 28271 regulates environmental liabilities in mining activities. This Law has the objective of ruling the identification of mining activity’s environmental liabilities and financing the remediation of the affected areas. According to this law, environmental liabilities refer to the impact caused to the environment by abandoned or inactive mining operations.
The Group considers that the recorded liability is sufficient to meet the current regulatory environment in Peru.
The Group pays 10% on the valued production of mineral obtained from the concessions leased by Sindicato Minero Orcopampa S.A. This concession is in force until the year 2043. See Note 24.
| (c) | Letter of guarantee granted by Buenaventura - |
Letter of guarantee - Huanza
On December 2, 2009, Banco de Credito del Perú signed a finance lease contract for US$119 million with Consorcio Energético de Huancavelica S.A., Empresa de Generación Huanza S.A. and Buenaventura. This financing is in favor of Empresa de Generación Huanza S.A., and is guaranteed by Buenaventura. On February 8, 2016, the bank released the guarantee granted by Buenaventura.
Notes to the consolidated financial statements(continued)
| (d) | Operating lease commitments (the Group as a lessee) - |
The Group has entered into operating leases on its administrative offices in Lima located in Las Begonias Street N°415, San Isidro, Lima, Peru, with a lease term of 10 years. The Group has the option to lease the assets for two additional terms of 5 years each.
Future minimum rentals payable as of December 31, 2015 and 2014 are the following:
| | | 2015 | | | 2014 | |
| | | US$(000) | | | US$(000) | |
| | | | | | | |
| Within one year | | | 1,543 | | | | 1,543 | |
| After one year but not more than five years | | | 6,173 | | | | 6,173 | |
| More than five years | | | 4,244 | | | | 5,787 | |
| | | | | | | | | |
| | | | 11,960 | | | | 13,503 | |
| (e) | Operating lease commitments (the Group as a lessor) - |
The Group leases for several of its assets. These leases have purchase options. Below is a table showing future minimum lease payments and the present value of these payments:
| | | 2015 | | | 2014 | |
| | | Minimum
payments | | | Present
value of
payments | | | Minimum
payments | | | Present
value of
payments | |
| | | US$(000) | | | US$(000) | | | US$(000) | | | US$(000) | |
| | | | | | | | | | | | | |
| Within a year | | | 47,957 | | | | 31,956 | | | | 79,248 | | | | 64,087 | |
| After one year but not more than five years | | | 366,637 | | | | 321,685 | | | | 360,132 | | | | 314,218 | |
| | | | | | | | | | | | | | | | | |
| Total minimum lease payments | | | 414,594 | | | | 353,641 | | | | 439,380 | | | | 378,305 | |
| | | | | | | | | | | | | | | | | |
| Less - amounts representing finance charges | | | (60,953 | ) | | | - | | | | (61,075 | ) | | | - | |
| | | | | | | | | | | | | | | | | |
| Present value of minimum lease payments | | | 353,641 | | | | 353,641 | | | | 378,305 | | | | 378,305 | |
Contingencies
Buenaventura -
Buenaventura is a party in legal procedures that have arisen in the normal course of its activities. Nevertheless, in the opinion of Buenaventura’s Management, none of these procedures, individually or as a whole, could result in material contingencies for the consolidated financial statements.
Notes to the consolidated financial statements(continued)
The possible contingencies amount to US$2,031,000 and US$1,573,000 as of December 31, 2015 and 2014, respectively.
Yanacocha -
Mercury spill in Choropampa
In June 2000, a carrier hired by Yanacocha spilled approximately 151 kilograms of mercury in the vicinity of the town of Choropampa, Peru, located 85 kilometers (53 miles) southeast of the mine. To date, Yanacocha has held court settlements with people affected by the incident. At December 31, 2015, there are 6 applicants with pending process. Yanacocha cannot reasonably predict the outcome of any of these claims; however, it is estimated that the maximum additional expense related to these demands will be US$1.5 million.
Action for Constitutional Relief against Conga Project Exploitation
On October 19, 2012, Marco Antonio Arana Zegarra ("Marco Arana") initiated an action for constitutional relief against the Mines and Energy Ministry and Yanacocha requesting that the Court orders to cease any threats of violation to life in an adequate and balanced environment; so that Court declare the suspension of the exploitation of the Conga Project and avoid Directorial Resolution No.351-2010-MEM/AM dated on October 27, 2010 that approved the Conga Environmental Impact Assessment.
By Court resolution No.1 dated October 23, 2012, the action was dismissed. On November 5, 2012, resolution No.1 was appealed by plaintiff and the hearing at Superior Court was held on March 4, 2013. The Cajamarca Superior Court confirmed the ruling of the judge that dismissed the claim.
On May 23, 2013, Marco Arana filed for a Constitutional remedy against the Cajamarca Superior Court decision and on June 3, 2013, the Cajamarca Superior Court accepted the Constitutional remedy filed by Marco Arana and the file has been sent to the Constitutional Court. On September 25, 2013, the Constitutional Court heard oral arguments from the parties and we are waiting their decision. To date the case maintains the same status.
(g)Open tax procedures–
Buenaventura -
| - | During 2012 and 2014, the tax authority (SUNAT) reviewed the income tax for 2007 and 2008. As a result, SUNAT do not recognize tax declared deductions by S/1,056,310,000 (equivalent to US$309,493,000) in 2007 and S/1,530,985,000 (equivalent to US$448,575,000) in 2008. The main unrecognized deduction is the payment made for the removal of the price component of its commercial contracts of gold. In the caseopinion of management and its legal counsel, the Yanacocha associate,objections are unfounded so Buenaventura has not recognizedshould get a deferredfavorable result in the initiated claim process. |
| - | During 2015, the tax authorities reviewed the income tax liabilityof 2009 and 2010. As a result, they did not recognize Buenaventura declared tax deductions by S/76,023,000 (equivalent to US$22,275,000). The main unrecognized deductions by Buenaventura are: the non-deductibility of bonuses paid to contractors, a provision of doubtful accounts not accepted as an expense and income unduly deducted. The possible contingencies for the years 2009 and 2010 amount to S/525,921,000 (equivalent to US$236,463,000154,093,000) as of December 31, 2015. In the opinion of Management and its legal counsel, the Company should get a favorable result in the initiated claim process (by 2009) and will start (by 2010). |
Notes to the consolidated financial statements(continued)
Subsidiaries -
| - | During 2015, the tax authorities reviewed the income tax of the subsidiary Buenaventura Ingenieros S.A (BISA) for the fiscal years 2011 and 2012. The main unrecognized deductions are related to the deduction of bonuses paid to staff as well as the omission of income from transfer of fuel to suppliers, amounting to S/21,034,000 (equivalent to US$6,163,000). In addition, the tax authority requires the payment of the value added tax related to allegedly omitted revenues in the transfer of fuel to suppliers. The possible contingencies for income tax for the years 2011 and 2012 (deferred liability ofamount to S/9,471,000 (equivalent to US$159,320,0002,775,000) and for the value added tax amount to S/3,467,000 (US$1,016,000) as of December 31, 2011), given that Buenaventura’s2015. In the opinion of Management even though only exercising significant influence overof this associate, hassubsidiary and its legal advisors, BISA should get a favorable result in the intentioninitiated claim process (for income tax of 2011 and capacity to hold this investment until its goldvalue added tax for the years 2011 and silver reserves are depleted;2012) and in this sense, Management believes that the timing differences will be reversed by means of dividendsclaim to be received in the future that, are not subject to theinitiated (for income tax paid by the Company. There is no legal or contractual obligation that would require the Company’s Management to sell its investment in this associate (which event would result in a taxable capital gain based on current tax law)of 2012). |
| (b)- | The table below presentsDuring the currentyears 2014 and deferred portions2015, the tax authority issued tax assessments for the income tax of the provisions for Income Tax shown in the consolidated income statementsubsidiary Sociedad Minera El Brocal S.A.A. (El Brocal) for the years 2012, 2011 and 2010:2012. The main objections are related to the deduction of the derivative financial instruments loss and the tax treatment of the mining royalties and amount to S/11,586,000 (equivalent to US$3,395,000). With respect to the objections of 2011, El Brocal decided to pay under protest the income tax assessment by S/8,333,000 (equivalent to US$2,442,000) so it can have access to a discount benefit of the fine and appealed to the Tax Court. In connection with the possible tax debt of 2012 by S/3,576,000 (equivalent to US$1,048,000), El Brocal has appealed to the Tax Court. In the opinion of Management of the subsidiary and its legal advisors, El Brocal should get a favorable result in the initiated claim process. |
| | | 2012 | | | 2011 | | | 2010 | |
| | | US$(000) | | | US$(000) | | | US$(000) | |
| | | | | | | | | | |
| Income tax - | | | | | | | | | | | | |
| Current | | | | | | | | | | | | |
| Compañía de Minas Buenaventura S.A.A. | | | (37,343 | ) | | | (60,091 | ) | | | (38,003 | ) |
| Minera La Zanja S.A. | | | (30,493 | ) | | | (37,180 | ) | | | (3,793 | ) |
| S.M.R.L. Chaupiloma Dos de Cajamarca | | | (20,560 | ) | | | (18,976 | ) | | | (16,411 | ) |
| Sociedad Minera El Brocal S.A.A. | | | (10,400 | ) | | | (35,944 | ) | | | (27,765 | ) |
| Consorcio Energético de Huancavelica S.A. | | | (3,029 | ) | | | (1,404 | ) | | | (1,364 | ) |
| - | In addition, the tax authority has issued tax assessments as a result of the audit of other subsidiaries of the Group by S/12,096,000 (equivalent to US$3,544,000). In the opinion of Management and its legal counsel, the assessments are of possible occurrence; however, management of the subsidiaries expects to get a favorable result in the initiated claim process. |
Associates -
Cerro Verde –
SUNAT, the Peruvian tax authority, has assessed mining royalties on materials processed by Cerro Verde´s concentrator, which commenced operations in late 2006. These assessments cover the period December 2006 to December 2007 and the years 2008 and 2009. In July 2013, the Peruvian Tax Tribunal issued two decisions affirming assessments for the period December 2006 through December 2008. Decisions by the Tax Tribunal ended the administrative stage of the appeal procedures for these assessments.
In September 2013, Cerro Verde filed judiciary appeals related to the assessments because Cerro Verde believes that its 1998 stability agreement exempted all minerals extracted from its mining concessions from royalties, irrespective of the method used for processing those minerals. With respect to the judiciary appeal related to the assessment for the year 2008, on December 17, 2014, the Eighteenth Contentious Administrative Court rendered its decision upholding Cerro Verde’s position and nullifying SUNAT’s assessment and the Tax Tribunal´s resolution (S/.106.4 million). In December 2014, SUNAT and the Tax Court appealed this decision. The court’s position also invalidates all penalties and interest assessed by SUNAT for that period (S/.139.7 million). On January 29, 2016, the 6th Superior Justice Court nullified the decision of the Eighteenth Contentious Administrative Court. Cerro Verde will appeal the decision to the Supreme Court.
Notes to the consolidated financial statements(continued)
On October 1, 2013, SUNAT served Cerro Verde a demand for payment totaling S/.492 million (approximately US$144 million based on December 31, 2015 exchange rates, including interest and penalties of US$85 million) based on the Tax Tribunal’s decisions for the period December 2006 to December 2008. As permitted by law, Cerro Verde requested, and was granted, an installment payment program that deferred payment for six months and thereafter satisfies the amount via 66 equal monthly payments. As of December 31, 2015, Cerro Verde has made payments totaling S/219 million (equivalent to US$64 million) under the installment program. Based on the results rendered by the Eighteenth Contentious Administrative Court as is described in the previous paragraph, Cerro Verde requested an injunction that was accepted by the Judiciary and implied a modification of the installment program excluding the 2008 portion through SUNAT’s resolution notified to Cerro Verde on October 29, 2015.
In July 2013, a hearing on SUNAT's assessment for 2009 was held, but no decision has been issued by the Tax Tribunal for that year. As of December 31, 2015, the amount of the assessment, including interest and penalties, for the year 2009 was S/247 million (approximately US$72 million based on December 31, 2015, exchange rates). As of December 31, 2015, Cerro Verde estimates that the total exposure associated with mining royalties for the period from December 2006 to December 2013, including accumulated interest and penalties, amounted to approximately US$500 million at December 31, 2015 exchange rates.
As of December 31, 2015, no amounts were accrued for these assessments or for the amounts paid under the installment payment program because management and its external legal advisors believe Cerro Verde’s 1998 stability agreement exempted it from these royalties and believes that the resolution will be favorable to Cerro Verde and any payments should be recoverable.
Cerro Verde has also received assessments from SUNAT for additional taxes (other than the mining royalty explained above), including penalties and interest. Cerro Verde has filed or will file objections to the assessments because it believes it has properly determined and paid its taxes. A summary of these assessments follows:
| Fiscal Year | | Taxes | | | Interest and fines | | | Total | |
| | | US$(000) | | | US$(000) | | | US$(000) | |
| | | | | | | | | | |
| 2002 – 2005 | | | 16,037 | | | | 52,800 | | | | 68,837 | |
| 2006 | | | 6,545 | | | | 47,662 | | | | 54,207 | |
| 2007 | | | 12,376 | | | | 17,809 | | | | 30,185 | |
| 2008 | | | 20,797 | | | | 12,968 | | | | 33,765 | |
| 2009 | | | 56,198 | | | | 47,719 | | | | 103,917 | |
| 2010 | | | 65,997 | | | | 89,404 | | | | 155,401 | |
| 2014 | | | 5,512 | | | | - | | | | 5,512 | |
| 2015 | | | 3,753 | | | | - | | | | 3,753 | |
| | | | | | | | | | | | | |
| | | | 187,215 | | | | 268,362 | | | | 455,577 | |
As of December 31, 2015, Cerro Verde has paid US$180,741,000 on these disputed tax assessments, which it believes is collectible.
Yanacocha -
| - | SUNAT challenged the withholding tax rate applied on the technical assistance services provided by non-resident supplier. The services were executed in Peru and also abroad; however, Yanacocha was not able to prove it during the tax audit. Based on that, SUNAT considers that the services were wholly executed in Peru; hence, the withholding tax rate must be 30% instead of 12%. The amount of the contingency involved is S/ 12.4 million (US$ 3.6 million). In Management's and its legal counsel’s opinion, that interpretation has no support so Yanacocha should get a favorable outcome in the appeal initiated. |
Notes to the consolidated financial statements(continued)
| - | SUNAT considers that the bonus for closing the collective agreement and the collateral benefits granted to the unionized and non-unionized employees qualify as remunerative concepts; hence, taxed with the contribution to ESSALUD. The contingency amounts to S/ 6.5 million (US$ 2 million). |
In Management's and its legal counsel’s opinion, that interpretation has no support so Yanacocha should get a favorable outcome in the appeal initiated against the tax authorities.
30. Transactions with associates companies
| (a) | The Group has carried out the following transactions with its associates in the years 2015, 2014 and 2013: |
| | | 2015 | | | 2014 | | | 2013 | |
| | | US$(000) | | | US$(000) | | | US$(000) | |
| | | | | | | | | | |
| Royalties collected to Minera Yanacocha S.R.L.: | | | | | | | | | | | | |
| S.M.R.L. Chaupiloma Dos de Cajamarca (c) | | | 32,414 | | | | 36,867 | | | | 44,185 | |
| | | | | | | | | | | | | |
| Services provided to Minera Yanacocha S.R.L. by: | | | | | | | | | | | | |
| Consorcio Energético de Huancavelica S.A. (electric power transmission) | | | 1,694 | | | | 915 | | | | 915 | |
| Buenaventura Ingenieros S.A (execution of specific work orders) | | | 845 | | | | 699 | | | | 699 | |
| | | | | | | | | | | | | |
| Dividends received by: | | | | | | | | | | | | |
| Compañía Minera Coimolache S.A. | | | 6,691 | | | | 12,938 | | | | 9,803 | |
| | | | | | | | | | | | | |
| Loans granted to: | | | | | | | | | | | | |
| Sociedad Minera Cerro Verde S.A.A. | | | 124,800 | | | | - | | | | - | |
| | | | | | | | | | | | | |
| Sales of supplies to Compañía Minera Coimolache S.A. by: | | | | | | | | | | | | |
| Minera La Zanja S.R.L. | | | 74 | | | | 10 | | | | - | |
| Compañía de Minas Buenaventura S.A.A. | | | 56 | | | | 913 | | | | 32 | |
Notes to the consolidated financial statements(continued)
| | | 2015 | | | 2014 | | | 2013 | |
| | | US$(000) | | | US$(000) | | | US$(000) | |
| | | | | | | | | | |
| Sales of mineral to Minera Yanacocha S.R.L. by: | | | | | | | | | | | | |
| Compañía de Minas Buenaventura S.A.A. | | | 2,114 | | | | 3,258 | | | | 7,146 | |
| | | | | | | | | | | | | |
| Energy sales to Compañía Minera Coimolache S.A. by: | | | | | | | | | | | | |
| Empresa de Generación Huanza S.A. | | | 1,676 | | | | 233 | | | | - | |
| | | | | | | | | | | | | |
| Interest income over loans granted by Compañía Minera Coimolache S.A. to: | | | | | | | | | | | | |
| Consorcio Energético de Huancavelica S.A.A. | | | 19 | | | | 35 | | | | 51 | |
| | | | | | | | | | | | | |
| Supplies purchase to Compañía Minera Coimolache S.A. by: | | | | | | | | | | | | |
| Compañía de Minas Buenaventura S.A.A. | | | 29 | | | | 6 | | | | 59 | |
| Minera La Zanja S.R.L. | | | 6 | | | | 24 | | | | 12 | |
| | | | | | | | | | | | | |
| Contributions and investments made to: | | | | | | | | | | | | |
| Canteras del Hallazgo S.A.C. | | | - | | | | 2,012 | | | | 6,988 | |
| (b) | As a result of the transactions indicated in the paragraph (a), the Group had the following accounts receivable and payable from/to associates: |
| | | 2015 | | | 2014 | |
| | | US$(000) | | | US$(000) | |
| | | | | | | |
| Trade receivables - | | | | | | | | |
| Minera Yanacocha S.R.L. (c) | | | 8,760 | | | | 14,566 | |
| Compañía Minera Coimolache S.A. | | | 666 | | | | 515 | |
| | | | 9,426 | | | | 15,081 | |
| Other receivables | | | | | | | | |
| Sociedad Minera Cerro Verde S.A.A. (d) | | | 124,988 | | | | - | |
| Compañía Minera Coimolache S.A. | | | 499 | | | | 334 | |
| | | | 125,487 | | | | 334 | |
| | | | | | | | | |
| Total trade and other receivables | | | 134,913 | | | | 15,415 | |
| | | | | | | | | |
| Classification by maturity: | | | | | | | | |
| Current portion | | | 9,925 | | | | 15,415 | |
| Non-current portion | | | 124,988 | | | | - | |
| | | | | | | | | |
| Total trade and other receivables | | | 134,913 | | | | 15,415 | |
Notes to the consolidated financial statements(continued)
| | | 2015 | | | 2014 | |
| | | US$(000) | | | US$(000) | |
| | | | | | | | | |
| Trade payables - | | | | | | | | |
| Compañía Minera Coimolache S.A. | | | 892 | | | | 1,384 | |
| Minera Yanacocha S.R.L. | | | 283 | | | | 410 | |
| | | | | | | |
| Total trade and other payables | | | 1,175 | | | | 1,794 | |
| | | | | | | | | |
| Classification by maturity: | | | | | | | | |
| Current portion | | | 1,175 | | | | 1,611 | |
| Non-current portion | | | - | | | | 183 | |
| | | | | | | | | |
| Total trade and other payables | | | 1,175 | | | | 1,794 | |
| (c) | S.M.R.L. Chaupiloma Dos de Cajamarca - |
In accordance with mining lease, amended and effective on January 1, 1994, Minera Yanacocha S.R.L. pays the Group a 3% royalty based on quarterly production sold at current market prices, after deducting refinery and transportation costs. The royalty agreement expires in 2032.
| (d) | Sociedad Minera Cerro Verde S.A. - |
In December 2014, Cerro Verde entered into shareholder loan agreements with, or affiliates of, Freeport Minerals Corporation, Compañía de Minas Buenaventura S.A.A. and SMM Cerro Verde Netherlands B.V., for up to US$800 million. As of December 31, 2015, Cerro Verde had borrowed US$600.9 million under these loan agreements (US$125 million with Buenaventura as of December 31, 2015). The loans mature on December 22, 2019, unless at that time there is senior financing associated with the expansion project that is senior to the loans, in which case the loans mature two years following the maturity of the senior financing.
As of December 31, 2015 and 2014, directors, officers and employees of the Group have been involved, directly and indirectly, in financial transactions with certain subsidiaries. As of December 31, 2015 and 2014, loans to employees, directors and key personnel amounts to US$61,000 and US$27,000, respectively, are paid monthly and earn interest at market rates.
There are no loans to the Group’s directors and key personnel guaranteed with Buenaventura or any of its Subsidiaries’ shares.
The Group’s key executives’ compensation (including the related income taxes assumed by the Group) as of December 31, 2015 and 2014 are presented below:
| | | 2015 | | | 2014 | |
| | | US$(000) | | | US$(000) | |
| Accounts payable: | | | | | | | | |
| Salaries | | | 3,381 | | | | 1,225 | |
| Directors’ compensations | | | 1,047 | | | | 1,090 | |
| Share-based compensation plans | | | 330 | | | | 461 | |
| | | | | | | | | |
| Total | | | 4,758 | | | | 2,776 | |
| Disbursements: | | | | | | | | |
| Salaries | | | 7,864 | | | | 8,423 | |
| Share-based compensation plans | | | - | | | | 1,599 | |
| | | | | | | | | |
| Total | | | 7,864 | | | | 10,022 | |
Notes to the consolidated financial statements(continued)
| 31. | Disclosure of information on segments |
Management has determined its operating segments based on reports that the Group’s Chief Operating Decision Maker (CODM) uses for making decisions. The Group is organized into business units based on its products and services, activities and geographic locations. The broad categories of the Group’s business units are:
| - | Production and sale of minerals; |
| - | Exploration and development activities; |
| - | Construction and engineering services; |
| - | Energy generation and transmission services; |
| - | Rental of mining concessions; |
| - | Holding of investment in shares (mainly in the associate company Minera Yanacocha S.R.L. and the Group’s subsidiary; S.M.R.L. Chaupiloma Dos de Cajamarca); |
The CODM monitors the operating results of the business units separately for the purpose of making decisions about resource allocation and performance assessment. Segment performance is evaluated based on operating profit or loss and is measured consistently with operating profit or loss in the Group’s consolidated financial statements. Also, the Group’s financing and income taxes are managed at the corporate level and are not allocated to the operating segments, except for those entities which are managed independently.
Corporate information mainly includes the following:
In segment information of profit and loss –
| - | Sales to third parties of gold purchased by the Parent company from La Zanja mining unit and the corresponding cost of sale as well as other intercompany sales; |
| - | Administrative expenses, other income (expenses), exchange gain (loss), finance costs and income and income tax that cannot be directly allocated to the operational mining units owned by the Parent company (Uchucchacua, Orcopampa, Julcani, Mallay and Breapampa); |
| - | Exploration activities in non-operating areas, carried out directly by the Parent company and not by the consolidated separate legal entities; |
| - | Participation in subsidiaries and associate companies of the Parent company, which are accounted for using the equity method; |
| - | Gain on business combination occurred in 2014, see Note 5 to the consolidated financial statements. |
In the segment information of assets and liabilities –
| - | Investments in Sociedad Minera Cerro Verde S.A.A. and Compañía Minera Coimolache S.A., associate companies which are directly owned by the Parent company and are accounted for using the equity method; see Note 11 to the consolidated financial statements; |
Notes to the consolidated financial statements(continued)
| - | Assets and liabilities of the operational mining units owned directly by the Parent company since this is the way the CODM analyzes the business. Assets and liabilities of other operating segments are allocated based on the assets and liabilities of the legal entities included in those segments. |
Adjustments and eliminations mainly include the following:
In segment information of consolidated statements of profit and loss –
| - | The elimination of any profit or loss of investments accounted for under the equity method and not consolidated by the Group corresponding to the associate companies: Minera Yanacocha S.R.L., Sociedad Minera Cerro Verde S.A.A. and Compañía Minera Coimolache S.A.; |
| - | The elimination of intercompany sales and cost of sales; |
| - | The elimination of any equity pickup profit or loss of the subsidiaries of the Parent company. |
Notes to the consolidated financial statements(continued)
In the segment information of assets and liabilities –
| - | The elimination of the assets and liabilities of the investments accounted for under the equity method and not consolidated, corresponding to the associate companies: Minera Yanacocha S.R.L., Sociedad Minera Cerro Verde S.A.A. and Compañía Minera Coimolache S.A.; |
| - | The elimination of any equity pickup investments of the subsidiaries of the Parent company; |
| - | The elimination of intercompany receivables and payables. |
Refer to Note 21 (a) to the consolidated financial statements where the Group reports revenues from external customers for each product and service, and revenues from external customers attributed to Peru and foreign countries. The revenue information is based on the locations of customers.
Refer to Note 21 (b) to the consolidated financial statements for information about major customers (clients representing more than 10% of the Group’s revenues).
All non-current assets are located in Peru.
Notes to the consolidated financial statements(continued)
| | | | | | | | | | | | | | | | | | | | | | | | | | | | | | | | | | | | | | | | | | | | | | | | Equity accounted investees | | | | | | | | | | |
| | | Ucchuchacua
(Operation) | | | Orcopampa
(Operation) | | | Julcani
(Operation) | | | Mallay
(Operation) | | | Breapampa
(Operation) | | | Colquijirca
(Operation) | | | La Zanja
(Operation) | | | Exploration and
development
mining projects | | | Construction
and engineering | | | Energy
generation and
transmission | | | Insurance
brokerage | | | Rental of mining
concessions | | | Holding of
investment in
shares | | | Industrial
activities | | | Corporate | | | Minera
Yanacocha
S.R.L. | | | Sociedad
Minera Cerro
Verde S.A.A | | | Compañía
Minera
Coimolache
S.A. | | | Total operating
segments | | | Adjustments
and
eliminations | | | Total | |
| | | US$(000) | | | US$(000) | | | US$(000) | | | US$(000) | | | US$(000) | | | US$(000) | | | US$(000) | | | US$(000) | | | US$(000) | | | US$(000) | | | US$(000) | | | US$(000) | | | US$(000) | | | US$(000) | | | US$(000) | | | US$(000) | | | US$(000) | | | US$(000) | | | US$(000) | | | US$(000) | | | US$(000) | |
| Year 2015 | | | | | | | | | | | | | | | | | | | | | | | | | | | | | | | | | | | | | | | | | | | | | | | | | | | | | | | | | | | | | | | | | | | | | | | | | | | | | | | | | | | | |
| Results: | | | | | | | | | | | | | | | | | | | | | | | | | | | | | | | | | | | | | | | | | | | | | | | | | | | | | | | | | | | | | | | | | | | | | | | | | | | | | | | | | | | | |
| Continuing operations | | | | | | | | | | | | | | | | | | | | | | | | | | | | | | | | | | | | | | | | | | | | | | | | | | | | | | | | | | | | | | | | | | | | | | | | | | | | | | | | | | | | |
| Operating income | | | | | | | | | | | | | | | | | | | | | | | | | | | | | | | | | | | | | | | | | | | | | | | | | | | | | | | | | | | | | | | | | | | | | | | | | | | | | | | | | | | | |
| Net sale of goods | | | 166,055 | | | | 254,118 | | | | 50,254 | | | | 32,018 | | | | 22,343 | | | | 171,294 | | | | 161,007 | | | | - | | | | - | | | | - | | | | - | | | | - | | | | - | | | | - | | | | 168,667 | | | | 1,031,174 | | | | 1,115,617 | | | | 177,347 | | | | 3,349,894 | | | | (2,484,932 | ) | | | 864,962 | |
| Net sale of services | | | - | | | | - | | | | - | | | | - | | | | - | | | | - | | | | - | | | | - | | | | 48,758 | | | | 48,339 | | | | 11,929 | | | | - | | | | - | | | | 17,048 | | | | - | | | | 10,625 | | | | - | | | | - | | | | 136,699 | | | | (82,211 | ) | | | 54,488 | |
| Royalty income | | | - | | | | - | | | | - | | | | - | | | | - | | | | - | | | | - | | | | - | | | | - | | | | - | | | | - | | | | 32,414 | | | | - | | | | - | | | | - | | | | - | | | | - | | | | - | | | | 32,414 | | | | - | | | | 32,414 | |
| Total operating income | | | 166,055 | | | | 254,118 | | | | 50,254 | | | | 32,018 | | | | 22,343 | | | | 171,294 | | | | 161,007 | | | | - | | | | 48,758 | | | | 48,339 | | | | 11,929 | | | | 32,414 | | | | - | | | | 17,048 | | | | 168,667 | | | | 1,041,799 | | | | 1,115,617 | | | | 177,347 | | | | 3,519,007 | | | | (2,567,143 | ) | | | 951,864 | |
| Operating costs | | | | | | | | | | | | | | | | | | | | | | | | | | | | | | | | | | | | | | | | | | | | | | | | | | | | | | | | | | | | | | | | | | | | | | | | | | | | | | | | | | | | |
| Cost of sales | | | (126,728 | ) | | | (112,707 | ) | | | (26,725 | ) | | | (20,709 | ) | | | (11,529 | ) | | | (158,804 | ) | | | (106,750 | ) | | | - | | | | - | | | | - | | | | - | | | | - | | | | - | | | | - | | | | (169,236 | ) | | | (751,736 | ) | | | (862,004 | ) | | | (104,549 | ) | | | (2,451,477 | ) | | | 1,913,764 | | | | (537,713 | ) |
| Cost of services | | | - | | | | - | | | | - | | | | - | | | | - | | | | - | | | | - | | | | - | | | | (48,544 | ) | | | (20,767 | ) | | | - | | | | - | | | | - | | | | (16,820 | ) | | | - | | | | (2,524 | ) | | | - | | | | - | | | | (88,655 | ) | | | 35,963 | | | | (52,692 | ) |
| Exploration in operating units | | | (27,784 | ) | | | (41,705 | ) | | | (12,699 | ) | | | (7,539 | ) | | | (1,821 | ) | | | - | | | | (41 | ) | | | - | | | | - | | | | - | | | | - | | | | - | | | | - | | | | - | | | | - | | | | - | | | | - | | | | - | | | | (91,589 | ) | | | 69 | | | | (91,520 | ) |
| Depreciation and amortization | | | (15,767 | ) | | | (17,313 | ) | | | (11,349 | ) | | | (15,439 | ) | | | (9,882 | ) | | | (45,752 | ) | | | (104,984 | ) | | | (17 | ) | | | (850 | ) | | | (10,260 | ) | | | - | | | | (54 | ) | | | (226 | ) | | | (9,545 | ) | | | (1,027 | ) | | | - | | | | - | | | | - | | | | (242,465 | ) | | | - | | | | (242,465 | ) |
| Mining royalties | | | (1,142 | ) | | | (23,877 | ) | | | (337 | ) | | | (234 | ) | | | (219 | ) | | | - | | | | (1,597 | ) | | | - | | | | - | | | | - | | | | - | | | | - | | | | - | | | | - | | | | (1 | ) | | | - | | | | - | | | | - | | | | (27,407 | ) | | | - | | | | (27,407 | ) |
| Total operating costs | | | (171,421 | ) | | | (195,602 | ) | | | (51,110 | ) | | | (43,921 | ) | | | (23,451 | ) | | | (204,556 | ) | | | (213,372 | ) | | | (17 | ) | | | (49,394 | ) | | | (31,027 | ) | | | - | | | | (54 | ) | | | (226 | ) | | | (26,365 | ) | | | (170,264 | ) | | | (754,260 | ) | | | (862,004 | ) | | | (104,549 | ) | | | (2,901,593 | ) | | | 1,949,796 | | | | (951,797 | ) |
| Gross profit (loss) | | | (5,366 | ) | | | 58,516 | | | | (856 | ) | | | (11,903 | ) | | | (1,108 | ) | | | (33,262 | ) | | | (52,365 | ) | | | (17 | ) | | | (636 | ) | | | 17,312 | | | | 11,929 | | | | 32,360 | | | | (226 | ) | | | (9,317 | ) | | | (1,597 | ) | | | 287,539 | | | | 253,613 | | | | 72,798 | | | | 617,414 | | | | (617,347 | ) | | | 67 | |
| Operating expenses | | | | | | | | | | | | | | | | | | | | | | | | | | | | | | | | | | | | | | | | | | | | | | | | | | | | | | | | | | | | | | | | | | | | | | | | | | | | | | | | | | | | |
| Administrative expenses | | | (10,739 | ) | | | (16,698 | ) | | | (3,623 | ) | | | (2,080 | ) | | | (2,160 | ) | | | (19,181 | ) | | | (2,251 | ) | | | (1,444 | ) | | | (7,859 | ) | | | (3,422 | ) | | | (11,296 | ) | | | (106 | ) | | | (209 | ) | | | (654 | ) | | | (11,370 | ) | | | (26,325 | ) | | | - | | | | (2,185 | ) | | | (121,602 | ) | | | 35,070 | | | | (86,532 | ) |
| Exploration in non-operating areas | | | - | | | | - | | | | - | | | | - | | | | - | | | | (2,366 | ) | | | (8,954 | ) | | | (15,892 | ) | | | - | | | | - | | | | - | | | | - | | | | - | | | | - | | | | (5,685 | ) | | | - | | | | - | | | | - | | | | (32,897 | ) | | | 2,287 | | | | (30,610 | ) |
| Selling expenses | | | (3,552 | ) | | | (851 | ) | | | (1,055 | ) | | | (1,424 | ) | | | (116 | ) | | | (9,056 | ) | | | (1,207 | ) | | | - | | | | - | | | | (806 | ) | | | - | | | | - | | | | - | | | | (1,411 | ) | | | (3 | ) | | | (3,534 | ) | | | (56,215 | ) | | | (1,111 | ) | | | (80,341 | ) | | | 60,860 | | | | (19,481 | ) |
| Other, net | | | 1,836 | | | | (1,182 | ) | | | (125 | ) | | | (67 | ) | | | 172 | | | | (2,657 | ) | | | (687 | ) | | | (1,095 | ) | | | 7,417 | | | | (305 | ) | | | (4 | ) | | | - | | | | 793 | | | | 98 | | | | 6,329 | | | | (82,846 | ) | | | (26,600 | ) | | | 765 | | | | (98,158 | ) | | | 98,367 | | | | 209 | |
| Impairment loss of long-lived assets | | | | | | | | | | | | | | | | | | | (7,452 | ) | | | - | | | | (3,803 | ) | | | - | | | | - | | | | - | | | | - | | | | - | | | | - | | | | - | | | | - | | | | - | | | | - | | | | (672 | ) | | | (11,927 | ) | | | 672 | | | | (11,255 | ) |
| Total operating expenses, net | | | (12,455 | ) | | | (18,731 | ) | | | (4,803 | ) | | | (3,571 | ) | | | (9,556 | ) | | | (33,260 | ) | | | (16,902 | ) | | | (18,431 | ) | | | (442 | ) | | | (4,533 | ) | | | (11,300 | ) | | | (106 | ) | | | 584 | | | | (1,967 | ) | | | (10,729 | ) | | | (112,705 | ) | | | (82,815 | ) | | | (3,203 | ) | | | (344,925 | ) | | | 197,256 | | | | (147,669 | ) |
| Operating profit (loss) | | | (17,821 | ) | | | 39,785 | | | | (5,659 | ) | | | (15,474 | ) | | | (10,664 | ) | | | (66,522 | ) | | | (69,267 | ) | | | (18,448 | ) | | | (1,078 | ) | | | 12,779 | | | | 629 | | | | 32,254 | | | | 358 | | | | (11,284 | ) | | | (12,326 | ) | | | 174,834 | | | | 170,798 | | | | 69,595 | | | | 272,489 | | | | (420,091 | ) | | | (147,602 | ) |
| Other income (expense),net | | | | | | | | | | | | | | | | | | | | | | | | | | | | | | | | | | | | | | | | | | | | | | | | | | | | | | | | | | | | | | | | | | | | | | | | | | | | | | | | | | | | |
| Share in the results of associates under equity method | | | - | | | | - | | | | - | | | | - | | | | - | | | | - | | | | - | | | | - | | | | 6,561 | | | | 478 | | | | 2 | | | | - | | | | (187,269 | ) | | | - | | | | (268,463 | ) | | | - | | | | - | | | | - | | | | (448,691 | ) | | | 275,316 | | | | (173,375 | ) |
| Finance costs | | | (195 | ) | | | (235 | ) | | | (152 | ) | | | (108 | ) | | | (50 | ) | | | (10,096 | ) | | | (3,684 | ) | | | (215 | ) | | | (1,413 | ) | | | (8,817 | ) | | | (21 | ) | | | (4 | ) | | | (1 | ) | | | (842 | ) | | | (4,043 | ) | | | -22,734 | | | | (16,010 | ) | | | (51 | ) | | | (68,671 | ) | | | 41,049 | | | | (27,622 | ) |
| Net gain (loss) from currency exchange difference | | | 539 | | | | 461 | | | | 378 | | | | 75 | | | | 10 | | | | (3,832 | ) | | | (1,973 | ) | | | (1,797 | ) | | | (1,393 | ) | | | (1,586 | ) | | | (165 | ) | | | 45 | | | | 4 | | | | (2,162 | ) | | | (2,287 | ) | | | (251 | ) | | | (75,770 | ) | | | (1,300 | ) | | | (91,004 | ) | | | 77,321 | | | | (13,683 | ) |
| Finance income | | | 5 | | | | 5 | | | | 2 | | | | - | | | | - | | | | 154 | | | | 16 | | | | - | | | | 182 | | | | 23 | | | | 13 | | | | - | | | | - | | | | - | | | | 10,785 | | | | 673 | | | | 512 | | | | 23 | | | | 12,393 | | | | (1,367 | ) | | | 11,026 | |
| Total other income (expense), net | | | 349 | | | | 231 | | | | 228 | | | | (33 | ) | | | (40 | ) | | | (13,774 | ) | | | (5,641 | ) | | | (2,012 | ) | | | 3,937 | | | | (9,902 | ) | | | (171 | ) | | | 41 | | | | (187,266 | ) | | | (3,004 | ) | | | (264,008 | ) | | | (22,312 | ) | | | (91,268 | ) | | | (1,328 | ) | | | (595,973 | ) | | | 392,319 | | | | (203,654 | ) |
| Profit (loss) before income tax | | | (17,472 | ) | | | 40,016 | | | | (5,431 | ) | | | (15,507 | ) | | | (10,704 | ) | | | (80,296 | ) | | | (74,908 | ) | | | (20,460 | ) | | | 2,859 | | | | 2,877 | | | | 458 | | | | 32,295 | | | | (186,908 | ) | | | (14,288 | ) | | | (276,334 | ) | | | 152,522 | | | | 79,530 | | | | 68,267 | | | | (323,484 | ) | | | (27,772 | ) | | | (351,256 | ) |
| Income tax | | | (518 | ) | | | (602 | ) | | | (140 | ) | | | (78 | ) | | | (3 | ) | | | 4,109 | | | | 5,702 | | | | - | | | | (4,386 | ) | | | (3,887 | ) | | | (299 | ) | | | (9,186 | ) | | | (87 | ) | | | 584 | | | | (5,975 | ) | | | (602,717 | ) | | | (46,246 | ) | | | (29,861 | ) | | | (693,590 | ) | | | 678,824 | | | | (14,766 | ) |
| Profit (loss) from continued operations | | | (17,990 | ) | | | 39,414 | | | | (5,571 | ) | | | (15,585 | ) | | | (10,707 | ) | | | (76,187 | ) | | | (69,206 | ) | | | (20,460 | ) | | | (1,527 | ) | | | (1,010 | ) | | | 159 | | | | 23,109 | | | | (186,995 | ) | | | (13,704 | ) | | | (282,309 | ) | | | (450,195 | ) | | | 33,284 | | | | 38,406 | | | | (1,017,074 | ) | | | 651,052 | | | | (366,022 | ) |
| Loss from discontinued operations, see Note 1(e) | | | | | | | | | | | | | | | | | | | | | | | | | | | | | | | | | | | | | | | | | | | | | | | | | | | | | | | | | | | | | | | | | | | | | | | | | | | | | | | | | | | (9,523 | ) |
| Net loss | | | | | | | | | | | | | | | | | | | | | | | | | | | | | | | | | | | | | | | | | | | | | | | | | | | | | | | | | | | | | | | | | | | | | | | | | | | | | | | | | | | (375,545 | ) |
| | | | | | | | | | | | | | | | | | | | | | | | | | | | | | | | | | | | | | | | | | | | | | | | | | | | | | | | | | | | | | | | | | | | | | | | | | | | | | | | | | | | | |
| Total assets | | | - | | | | - | | | | - | | | | - | | | | - | | | | 739,941 | | | | 220,331 | | | | 53,214 | | | | 31,463 | | | | 393,318 | | | | 5,979 | | | | 9,397 | | | | 997,835 | | | | 118,012 | | | | 3,677,307 | | | | 2,965,430 | | | | 7,852,692 | | | | 238,175 | | | | 17,303,094 | | | | (12,755,913 | ) | | | 4,547,181 | |
| Total liability | | | - | | | | - | | | | - | | | | - | | | | - | | | | 364,455 | | | | 106,846 | | | | 3,514 | | | | 29,599 | | | | 235,695 | | | | 3,457 | | | | 3,508 | | | | 2,831 | | | | 31,479 | | | | 516,241 | | | | 736,605 | | | | 3,354,318 | | | | 63,119 | | | | 5,451,667 | | | | (4,293,722 | ) | | | 1,157,945 | |
| | | | | | | | | | | | | | | | | | | | | | | | | | | | | | | | | | | | | | | | | | | | | | | | | | | | | | | | | | | | | | | | | | | | | | | | | | | | | | | | | | | | | |
| Other segment information | | | | | | | | | | | | | | | | | | | | | | | | | | | | | | | | | | | | | | | | | | | | | | | | | | | | | | | | | | | | | | | | | | | | | | | | | | | | | | | | | | | | |
| Investment in associates | | | - | | | | - | | | | - | | | | - | | | | - | | | | - | | | | - | | | | - | | | | - | | | | - | | | | - | | | | - | | | | - | | | | - | | | | 3,519 | | | | 989,130 | | | | 988,725 | | | | 62,609 | | | | 2,043,983 | | | | - | | | | 2,043,983 | |
| Additions to mining concessions, development costs, property, plant and equipment | | | 22,669 | | | | 3,151 | | | | 4,795 | | | | 3,234 | | | | 1,988 | | | | 55,073 | | | | 62,968 | | | | 57,173 | | | | 527 | | | | 6,159 | | | | 85 | | | | - | | | | 1,205 | | | | 2,140 | | | | 66,918 | | | | - | | | | - | | | | - | | | | 288,085 | | | | - | | | | 288,085 | |
Notes to the consolidated financial statements (continued)
| | | 2012 | | | 2011 | | | 2010 | |
| | | US$(000) | | | US$(000) | | | US$(000) | |
| Other | | | (4,984 | ) | | | (4,867 | ) | | | (1,246 | ) |
| | | | (106,809 | ) | | | (158,462 | ) | | | (88,582 | ) |
| Deferred | | | | | | | | | | | | |
| Compañía de Minas Buenaventura S.A.A. | | | (27,890 | ) | | | (51,544 | ) | | | (29,519 | ) |
| Minera La Zanja S.A. | | | 7,463 | | | | 31 | | | | (5,134 | ) |
| Sociedad Minera El Brocal S.A.A. | | | 2,457 | | | | 6,335 | | | | (55 | ) |
| Other | | | 6,723 | | | | 54 | | | | (36 | ) |
| | | | (11,247 | ) | | | (45,124 | ) | | | (34,744 | ) |
| | | | (118,056 | ) | | | (203,586 | ) | | | (123,326 | ) |
| Mining royalties and Special Mining Tax - | | | | | | | | | | | | |
| Current | | | | | | | | | | | | |
| Compañía de Minas Buenaventura S.A.A. | | | (16,041 | ) | | | (7,371 | ) | | | - | |
| Minera La Zanja S.A. | | | (5,170 | ) | | | (2,176 | ) | | | - | |
| Sociedad Minera El Brocal S.A.A. | | | (3,765 | ) | | | (1,211 | ) | | | - | |
| | | | (24,976 | ) | | | (10,758 | ) | | | - | |
| | | | | | | | | | | | | |
| Deferred | | | | | | | | | | | | |
| Compañía de Minas Buenaventura S.A.A. | | | 1,093 | | | | 1,140 | | | | - | |
| Minera La Zanja S.A. | | | (330 | ) | | | 1,634 | | | | - | |
| Sociedad Minera El Brocal S.A.A. | | | (282 | ) | | | 3 | | | | - | |
| Compañía de Exploraciones, Desarrollo e Inversiones Mineras S.A.C. - CEDIMIN | | | (43 | ) | | | (22 | ) | | | - | |
| | | | 438 | | | | 2,755 | | | | - | |
| | | | (24,538 | ) | | | (8,003 | ) | | | - | |
| | | | | | | | | | | | | |
| Total income tax | | | (142,594 | ) | | | (211,589 | ) | | | (123,326 | ) |
| | | | | | | | | | | | | | | | | | | | | | | | | | | | | | | | | | | | | | | | | | | | | | | | Equity accounted investees | | | | | | | | | | |
| | | Ucchuchacua
(Operation) | | | Orcopampa
(Operation) | | | Julcani
(Operation) | | | Mallay
(Operation) | | | Breapampa
(Operation) | | | Colquijirca
(Operation) | | | La Zanja
(Operation) | | | Exploration and
development
mining projects | | | Construction
and engineering | | | Energy
generation and
transmission | | | Insurance
brokerage | | | Rental of mining
concessions | | | Holding of
investment in
shares | | | Industrial
activities | | | Corporate | | | Minera
Yanacocha
S.R.L. | | | Sociedad
Minera Cerro
Verde S.A.A | | | Compañía
Minera
Coimolache
S.A. | | | Total operating
segments | | | Adjustments
and
eliminations | | | Total | |
| | | US$(000) | | | US$(000) | | | US$(000) | | | US$(000) | | | US$(000) | | | US$(000) | | | US$(000) | | | US$(000) | | | US$(000) | | | US$(000) | | | US$(000) | | | US$(000) | | | US$(000) | | | US$(000 | | | US$(000) | | | US$(000) | | | US$(000) | | | US$(000) | | | US$(000) | | | US$(000) | | | US$(000) | |
| | | | | | | | | | | | | | | | | | | | | | | | | | | | | | | | | | | | | | | | | | | | | | | | | | | | | | | | | | | | | | | | | | | | | | | | | | | | | | | | | | | | | |
| Year 2014 | | | | | | | | | | | | | | | | | | | | | | | | | | | | | | | | | | | | | | | | | | | | | | | | | | | | | | | | | | | | | | | | | | | | | | | | | | | | | | | | | | | | |
| Results: | | | | | | | | | | | | | | | | | | | | | | | | | | | | | | | | �� | | | | | | | | | | | | | | | | | | | | | | | | | | | | | | | | | | | | | | | | | | | | | | | | | | | | |
| Continuing operations | | | | | | | | | | | | | | | | | | | | | | | | | | | | | | | | | | | | | | | | | | | | | | | | | | | | | | | | | | | | | | | | | | | | | | | | | | | | | | | | | | | | |
| Operating income | | | | | | | | | | | | | | | | | | | | | | | | | | | | | | | | | | | | | | | | | | | | | | | | | | | | | | | | | | | | | | | | | | | | | | | | | | | | | | | | | | | | |
| Net sale of goods | | | 202,543 | | | | 264,049 | | | | 49,767 | | | | 42,974 | | | | 108,468 | | | | 210,002 | | | | 185,286 | | | | - | | | | - | | | | - | | | | - | | | | - | | | | - | | | | - | | | | 187,503 | | | | 1,165,299 | | | | 1,467,097 | | | | 192,369 | | | | 4,075,357 | | | | (3,008,086 | ) | | | 1,067,271 | |
| Net sale of services | | | - | | | | - | | | | - | | | | - | | | | - | | | | - | | | | - | | | | - | | | | 66,853 | | | | 38,906 | | | | 10,608 | | | | - | | | | - | | | | 13,976 | | | | - | | | | 20,705 | | | | - | | | | - | | | | 151,048 | | | | (79,406 | ) | | | 71,642 | |
| Royalty income | | | - | | | | - | | | | - | | | | - | | | | - | | | | - | | | | - | | | | - | | | | - | | | | - | | | | - | | | | 36,867 | | | | - | | | | - | | | | - | | | | - | | | | - | | | | - | | | | 36,867 | | | | - | | | | 36,867 | |
| Total operating income | | | 202,543 | | | | 264,049 | | | | 49,767 | | | | 42,974 | | | | 108,468 | | | | 210,002 | | | | 185,286 | | | | - | | | | 66,853 | | | | 38,906 | | | | 10,608 | | | | 36,867 | | | | - | | | | 13,976 | | | | 187,503 | | | | 1,186,004 | | | | 1,467,097 | | | | 192,369 | | | | 4,263,272 | | | | (3,087,492 | ) | | | 1,175,780 | |
| Operating costs | | | | | | | | | | | | | | | | | | | | | | | | | | | | | | | | | | | | | | | | | | | | | | | | | | | | | | | | | | | | | | | | | | | | | | | | | | | | | | | | | | | | |
| Cost of sales | | | (149,251 | ) | | | (113,467 | ) | | | (26,364 | ) | | | (22,583 | ) | | | (37,897 | ) | | | (122,995 | ) | | | (84,381 | ) | | | - | | | | - | | | | - | | | | - | | | | - | | | | - | | | | - | | | | (186,650 | ) | | | (910,705 | ) | | | (797,481 | ) | | | (100,649 | ) | | | (2,552,423 | ) | | | 2,019,371 | | | | (533,052 | ) |
| Cost of services | | | - | | | | - | | | | - | | | | - | | | | - | | | | - | | | | - | | | | - | | | | (68,964 | ) | | | (19,252 | ) | | | - | | | | - | | | | - | | | | (12,703 | ) | | | - | | | | (22,422 | ) | | | - | | | | - | | | | (123,341 | ) | | | 41,854 | | | | (81,487 | ) |
| Exploration in operating units | | | (26,633 | ) | | | (51,814 | ) | | | (10,981 | ) | | | (7,807 | ) | | | (495 | ) | | | - | | | | (120 | ) | | | - | | | | - | | | | - | | | | - | | | | - | | | | - | | | | - | | | | (2 | ) | | | - | | | | - | | | | - | | | | (97,852 | ) | | | - | | | | (97,852 | ) |
| Depreciation and amortization | | | (15,293 | ) | | | -23,266 | | | | (11,769 | ) | | | (24,742 | ) | | | (35,699 | ) | | | (26,974 | ) | | | (53,158 | ) | | | - | | | | (717 | ) | | | (8,683 | ) | | | - | | | | (74 | ) | | | (231 | ) | | | (7,224 | ) | | | (868 | ) | | | - | | | | - | | | | - | | | | (208,698 | ) | | | - | | | | (208,698 | ) |
| Mining royalties | | | (1,893 | ) | | | (24,113 | ) | | | (466 | ) | | | (401 | ) | | | (1,012 | ) | | | - | | | | (555 | ) | | | - | | | | - | | | | - | | | | - | | | | - | | | | - | | | | - | | | | - | | | | - | | | | - | | | | - | | | | (28,440 | ) | | | - | | | | (28,440 | ) |
| Total operating costs | | | (193,070 | ) | | | (212,660 | ) | | | (49,580 | ) | | | (55,533 | ) | | | (75,103 | ) | | | (149,969 | ) | | | (138,214 | ) | | | - | | | | (69,681 | ) | | | (27,935 | ) | | | - | | | | (74 | ) | | | (231 | ) | | | (19,927 | ) | | | (187,520 | ) | | | (933,127 | ) | | | (797,481 | ) | | | (100,649 | ) | | | (3,010,754 | ) | | | 2,061,225 | | | | (949,529 | ) |
| Gross profit (loss) | | | 9,473 | | | | 51,389 | | | | 187 | | | | (12,559 | ) | | | 33,365 | | | | 60,033 | | | | 47,072 | | | | - | | | | (2,828 | ) | | | 10,971 | | | | 10,608 | | | | 36,793 | | | | (231 | ) | | | (5,951 | ) | | | (17 | ) | | | 252,877 | | | | 669,616 | | | | 91,720 | | | | 1,252,518 | | | | (1,026,267 | ) | | | 226,251 | |
| Operating expenses | | | | | | | | | | | | | | | | | | | | | | | | | | | | | | | | | | | | | | | | | | | | | | | | | | | | | | | | | | | | | | | | | | | | | | | | | | | | | | | | | | | | |
| Administrative expenses | | | (12,351 | ) | | | (16,077 | ) | | | (3,289 | ) | | | (2,719 | ) | | | (7,349 | ) | | | (17,634 | ) | | | (5,920 | ) | | | (3,184 | ) | | | (16,135 | ) | | | (4,354 | ) | | | (8,901 | ) | | | (113 | ) | | | (208 | ) | | | (376 | ) | | | (7,828 | ) | | | (38,262 | ) | | | - | | | | (2,073 | ) | | | (146,773 | ) | | | 45,671 | | | | (101,102 | ) |
| Exploration in non-operating areas | | | - | | | | (7,294 | ) | | | - | | | | - | | | | - | | | | (5,085 | ) | | | (19,689 | ) | | | (14,399 | ) | | | - | | | | - | | | | - | | | | - | | | | - | | | | - | | | | (3,540 | ) | | | - | | | | - | | | | - | | | | (50,007 | ) | | | - | | | | (50,007 | ) |
| Selling expenses | | | (3,416 | ) | | | (955 | ) | | | (1,067 | ) | | | (1,755 | ) | | | (393 | ) | | | (7,103 | ) | | | (1,441 | ) | | | - | | | | - | | | | (323 | ) | | | - | | | | - | | | | - | | | | (147 | ) | | | (5 | ) | | | (4,458 | ) | | | (54,210 | ) | | | (1,078 | ) | | | (76,351 | ) | | | 59,746 | | | | (16,605 | ) |
| Other, net | | | 1,338 | | | | 657 | | | | (4,661 | ) | | | 921 | | | | (110 | ) | | | 226 | | | | (2,833 | ) | | | 569 | | | | 8,070 | | | | 7,718 | | | | 109 | | | | (1 | ) | | | 651 | | | | (77 | ) | | | 3,930 | | | | (77,781 | ) | | | (3,629 | ) | | | 929 | | | | (63,974 | ) | | | 67,033 | | | | 3,059 | |
| Impairment loss of long-lived assets | | | - | | | | - | | | | - | | | | - | | | | - | | | | - | | | | - | | | | - | | | | - | | | | - | | | | - | | | | - | | | | - | | | | - | | | | - | | | | (541,141 | ) | | | - | | | | - | | | | (541,141 | ) | | | 541,141 | | | | - | |
| | | | | | | | | | | | | | | | | | | | | | | | | | | | | | | | | | | | | | | | | | | | | | | | | | | | | | | | | | | | | | | | | | | | | | | | | | | | | | | | | | | | | |
| Total operating expenses, net | | | (14,429 | ) | | | (23,669 | ) | | | (9,017 | ) | | | (3,553 | ) | | | (7,852 | ) | | | (29,596 | ) | | | (29,883 | ) | | | (17,014 | ) | | | (8,065 | ) | | | 3,041 | | | | (8,792 | ) | | | (114 | ) | | | 443 | | | | (600 | ) | | | (7,443 | ) | | | (661,642 | ) | | | (57,839 | ) | | | (2,222 | ) | | | (878,246 | ) | | | 713,591 | | | | (164,655 | ) |
| Operating profit (loss) | | | (4,956 | ) | | | 27,720 | | | | (8,830 | ) | | | (16,112 | ) | | | 25,513 | | | | 30,437 | | | | 17,189 | | | | (17,014 | ) | | | (10,893 | ) | | | 14,012 | | | | 1,816 | | | | 36,679 | | | | 212 | | | | (6,551 | ) | | | (7,460 | ) | | | (408,765 | ) | | | 611,777 | | | | 89,498 | | | | 374,272 | | | | (312,676 | ) | | | 61,596 | |
| Other income (expense),net | | | | | | | | | | | | | | | | | | | | | | | | | | | | | | | | | | | | | | | | | | | | | | | | | | | | | | | | | | | | | | | | | | | | | | | | | | | | | | | | | | | | |
| Share in the results of associates under equity method | | | - | | | | - | | | | - | | | | - | | | | - | | | | - | | | | - | | | | - | | | | (6,987 | ) | | | (2,186 | ) | | | - | | | | - | | | | (160,379 | ) | | | - | | | | (91,962 | ) | | | - | | | | - | | | | - | | | | (261,514 | ) | | | 186,914 | | | | (74,600 | ) |
| Finance costs | | | (294 | ) | | | (170 | ) | | | (153 | ) | | | (67 | ) | | | (43 | ) | | | (4 | ) | | | (1,728 | ) | | | (140 | ) | | | (1,223 | ) | | | (8,838 | ) | | | (15 | ) | | | (3 | ) | | | (2 | ) | | | (722 | ) | | | (760 | ) | | | (23,504 | ) | | | (369 | ) | | | (583 | ) | | | (38,618 | ) | | | 27,300 | | | | (11,318 | ) |
| Net gain (loss) from currency exchange difference | | | 354 | | | | 332 | | | | 124 | | | | 66 | | | | 5 | | | | (1,031 | ) | | | (1,525 | ) | | | (446 | ) | | | (757 | ) | | | (1,021 | ) | | | 8 | | | | (50 | ) | | | (4 | ) | | | (1,107 | ) | | | (3,400 | ) | | | 1,142 | | | | 2,284 | | | | (1,465 | ) | | | (6,491 | ) | | | (1,961 | ) | | | (8,452 | ) |
| Gain on business combination | | | - | | | | - | | | | - | | | | - | | | | - | | | | - | | | | - | | | | - | | | | - | | | | - | | | | - | | | | - | | | | - | | | | - | | | | 59,852 | | | | - | | | | - | | | | - | | | | 59,852 | | | | - | | | | 59,852 | |
| Finance income | | | 10 | | | | 13 | | | | 4 | | | | - | | | | - | | | | (278 | ) | | | - | | | | - | | | | - | | | | - | | | | 8 | | | | - | | | | - | | | | - | | | | 3,951 | | | | 298 | | | | 2,443 | | | | 47 | | | | 6,496 | | | | 1,912 | | | | 8,408 | |
| | | | | | | | | | | | | | | | | | | | | | | | | | | | | | | | | | | | | | | | | | | | | | | | | | | | | | | | | | | | | | | | | | | | | | | | | | | | | | | | | | | | | |
| Total other income (expense), net | | | 70 | | | | 175 | | | | (25 | ) | | | (1 | ) | | | (38 | ) | | | (1,313 | ) | | | (3,253 | ) | | | (586 | ) | | | (8,967 | ) | | | (12,045 | ) | | | 1 | | | | (53 | ) | | | (160,385 | ) | | | (1,829 | ) | | | (32,319 | ) | | | (22,064 | ) | | | 4,358 | | | | (2,001 | ) | | | (240,275 | ) | | | 214,165 | | | | (26,110 | ) |
| | | | | | | | | | | | | | | | | | | | | | | | | | | | | | | | | | | | | | | | | | | | | | | | | | | | | | | | | | | | | | | | | | | | | | | | | | | | | | | | | | | | | |
| Profit (loss) before income tax | | | (4,886 | ) | | | 27,895 | | | | (8,855 | ) | | | (16,113 | ) | | | 25,475 | | | | 29,124 | | | | 13,936 | | | | (17,600 | ) | | | (19,860 | ) | | | 1,967 | | | | 1,817 | | | | 36,626 | | | | (160,173 | ) | | | (8,380 | ) | | | (39,779 | ) | | | (430,829 | ) | | | 616,135 | | | | 87,497 | | | | 133,997 | | | | (98,511 | ) | | | 35,486 | |
| Income tax | | | - | | | | - | | | | - | | | | - | | | | - | | | | (21,621 | ) | | | (12,388 | ) | | | - | | | | 567 | | | | (4,835 | ) | | | (368 | ) | | | (10,996 | ) | | | (48 | ) | | | 978 | | | | (17,301 | ) | | | 30,491 | | | | (238,529 | ) | | | (36,089 | ) | | | (310,139 | ) | | | 244,127 | | | | (66,012 | ) |
| Profit (loss) from continued operations | | | (4,886 | ) | | | 27,895 | | | | (8,855 | ) | | | (16,113 | ) | | | 25,475 | | | | 7,503 | | | | 1,548 | | | | (17,600 | ) | | | (19,293 | ) | | | (2,868 | ) | | | 1,449 | | | | 25,630 | | | | (160,221 | ) | | | (7,402 | ) | | | (57,080 | ) | | | (400,338 | ) | | | 377,606 | | | | 51,408 | | | | (176,142 | ) | | | 145,616 | | | | (30,526 | ) |
| | | | | | | | | | | | | | | | | | | | | | | | | | | | | | | | | | | | | | | | | | | | | | | | | | | | | | | | | | | | | | | | | | | | | | | | | | | | | | | | | | | | | |
| Loss from discontinued operations, see Note 1(e) | | | | | | | | | | | | | | | | | | | | | | | | | | | | | | | | | | | | | | | | | | | | | | | | | | | | | | | | | | | | | | | | | | | | | | | | | | | | | | | | | | | (31,114 | ) |
| Net loss | | | | | | | | | | | | | | | | | | | | | | | | | | | | | | | | | | | | | | | | | | | | | | | | | | | | | | | | | | | | | | | | | | | | | | | | | | | | | | | | | | | (61,640 | ) |
| | | | | | | | | | | | | | | | | | | | | | | | | | | | | | | | | | | | | | | | | | | | | | | | | | | | | | | | | | | | | | | | | | | | | | | | | | | | | | | | | | | | | |
| Total assets | | | - | | | | - | | | | - | | | | - | | | | - | | | | 765,143 | | | | 278,836 | | | | 50,370 | | | | 87,546 | | | | 403,660 | | | | 6,265 | | | | 14,727 | | | | 1,208,772 | | | | 130,803 | | | | 3,778,132 | | | | 3,483,169 | | | | 5,771,984 | | | | 205,059 | | | | 16,184,466 | | | | (11,512,192 | ) | | | 4,672,274 | |
| Total liability | | | - | | | | - | | | | - | | | | - | | | | - | | | | 311,001 | | | | 96,147 | | | | 5,726 | | | | 95,466 | | | | 225,409 | | | | 3,109 | | | | 5,727 | | | | 166 | | | | 29,472 | | | | 294,027 | | | | 803,392 | | | | 1,306,894 | | | | 51,720 | | | | 3,228,256 | | | | (2,318,107 | ) | | | 910,149 | |
| | | | | | | | | | | | | | | | | | | | | | | | | | | | | | | | | | | | | | | | | | | | | | | | | | | | | | | | | | | | | | | | | | | | | | | | | | | | | | | | | | | | | |
| Other segment information | | | | | | | | | | | | | | | | | | | | | | | | | | | | | | | | | | | | | | | | | | | | | | | | | | | | | | | | | | | | | | | | | | | | | | | | | | | | | | | | | | | | |
| Investment in associates | | | - | | | | - | | | | - | | | | - | | | | - | | | | - | | | | - | | | | - | | | | - | | | | - | | | | - | | | | - | | | | - | | | | - | | | | 3,519 | | | | 1,185,971 | | | | 982,206 | | | | 52,685 | | | | 2,224,381 | | | | - | | | | 2,224,381 | |
| Additions to mining concessions, development costs, property, plant and equipment | | | 12,668 | | | | 8,963 | | | | 699 | | | | 963 | | | | 3,544 | | | | 105,477 | | | | 29,113 | | | | 83,723 | | | | 7,516 | | | | 17,948 | | | | 227 | | | | - | | | | - | | | | - | | | | 15,081 | | | | - | | | | - | | | | - | | | | 285,922 | | | | - | | | | 285,922 | |
Notes to the consolidated financial statements (continued)
| (c) | During the years 2012, 2011 and 2010 the provisions posted for income tax in the income statement were determined as follows: |
| | | 2012 | | | % | | | 2011 | | | % | | | 2010 | | | % | |
| | | US$(000) | | | | | | US$(000) | | | | | | US$(000) | | | | |
| | | | | | | | | | | | | | | | | | | |
| Income before income tax | | | 885,384 | | | | | | | | 1,172,067 | | | | | | | | 848,215 | | | | | |
| Share in the results of associates | | | (464,239 | ) | | | | | | | (468,363 | ) | | | | | | | (428,885 | ) | | | | |
| | | | 421,145 | | | | 100.0 | | | | 703,704 | | | | 100.0 | | | | 419,330 | | | | 100.0 | |
| | | | | | | | | | | | | | | | | | | | | | | | | |
| Theoretical income tax | | | 126,344 | | | | 30.0 | | | | 211,112 | | | | 30.0 | | | | 125,799 | | | | 30.0 | |
| Expenses not deductible for tax purposes | | | 4,578 | | | | 1.1 | | | | 4,856 | | | | 0.7 | | | | 1,963 | | | | 0.5 | |
| Effect of translation to U.S. dollars | | | (11,716 | ) | | | (2.8 | ) | | | (3,130 | ) | | | (0.4 | ) | | | (941 | ) | | | (0.2 | ) |
| Mining royalties and special mining tax | | | (5,876 | ) | | | (1.4 | ) | | | (3,227 | ) | | | (0.5 | ) | | | - | | | | - | |
| Effect from currency exchange difference | | | (3,794 | ) | | | (0.9 | ) | | | (5,027 | ) | | | (0.7 | ) | | | - | | | | - | |
| Recovery of exploration expenses in Tantahuatay project | | | - | | | | - | | | | - | | | | - | | | | (4,504 | ) | | | (1.1 | ) |
| Reversal of the provision for impairment of long-lived assets | | | - | | | | - | | | | - | | | | - | | | | (4,867 | ) | | | (1.2 | ) |
| Other permanent items | | | 8,520 | | | | 2.0 | | | | (998 | ) | | | (0.1 | ) | | | 5,876 | | | | 1.4 | |
| Expense for income tax purposes | | | 118,056 | | | | 28.0 | | | | 203,586 | | | | 28.9 | | | | 123,326 | | | | 29.4 | |
| Mining royalties and Special Mining Tax | | | 24,538 | | | | 5.8 | | | | 8,003 | | | | 1.1 | | | | - | | | | - | |
| | | | | | | | | | | | | | | | | | | | | | | | | |
| Total | | | 142,594 | | | | 33.9 | | | | 211,589 | | | | 30.1 | | | | 123,326 | | | | 29.4 | |
| | | Ucchuchacua
(Operation) | | | Orcopampa
(Operation) | | | Julcani
(Operation) | | | Mallay
(Operation) | | | Breapampa
(Operation) | | | Colquijirca
(Operation) | | | La Zanja
(Operation) | | | Exploration and
development
mining projects | | | Construction
and engineering | | | Energy
generation and
transmission | | | Insurance
brokerage | | | Rental of mining
concessions | | | Holding of
investment in
shares | | | Corporate | | | Minera
Yanacocha
S.R.L. | | | Sociedad
Minera Cerro
Verde S.A.A | | | Compañía
Minera
Coimolache
S.A. | | | Total operating
segments | | | Adjustments
and
eliminations | | | Total | |
| | | US$(000) | | | US$(000) | | | US$(000) | | | US$(000) | | | US$(000) | | | US$(000) | | | US$(000) | | | US$(000) | | | US$(000) | | | US$(000) | | | US$(000) | | | US$(000) | | | US$(000) | | | US$(000) | | | US$(000) | | | US$(000) | | | US$(000) | | | US$(000) | | | US$(000) | | | US$(000) | |
| Year 2013 | | | | | | | | | | | | | | | | | | | | | | | | | | | | | | | | | | | | | | | | | | | | | | | | | | | | | | | | | | | | | | | | | | | | | | | | | | | | | | | | |
| Results: | | | | | | | | | | | | | | | | | | | | | | | | | | | | | | | | | | | | | | | | | | | | | | | | | | | | | | | | | | | | | | | | | | | | | | | | | | | | | | | | |
| Continuing operations | | | | | | | | | | | | | | | | | | | | | | | | | | | | | | | | | | | | | | | | | | | | | | | | | | | | | | | | | | | | | | | | | | | | | | | | | | | | | | | | |
| Operating income | | | | | | | | | | | | | | | | | | | | | | | | | | | | | | | | | | | | | | | | | | | | | | | | | | | | | | | | | | | | | | | | | | | | | | | | | | | | | | | | |
| Net sale of goods | | | 205,218 | | | | 324,343 | | | | 45,995 | | | | 44,896 | | | | 119,871 | | | | 187,769 | | | | 193,298 | | | | 1,504 | | | | - | | | | - | | | | - | | | | - | | | | - | | | | 206,240 | | | | 1,406,825 | | | | 1,811,488 | | | | 209,636 | | | | 4,757,083 | | | | (3,621,247 | ) | | | 1,135,836 | |
| Net sale of services | | | - | | | | - | | | | - | | | | - | | | | - | | | | - | | | | - | | | | - | | | | 96,523 | | | | 33,809 | | | | 8,455 | | | | - | | | | - | | | | - | | | | 29,181 | | | | - | | | | - | | | | 167,968 | | | | (88,383 | ) | | | 79,585 | |
| Royalty income | | | - | | | | - | | | | - | | | | - | | | | - | | | | - | | | | - | | | | - | | | | - | | | | - | | | | - | | | | 44,185 | | | | - | | | | - | | | | - | | | | - | | | | - | | | | 44,185 | | | | - | | | | 44,185 | |
| Total operating income | | | 205,218 | | | | 324,343 | | | | 45,995 | | | | 44,896 | | | | 119,871 | | | | 187,769 | | | | 193,298 | | | | 1,504 | | | | 96,523 | | | | 33,809 | | | | 8,455 | | | | 44,185 | | | | - | | | | 206,240 | | | | 1,436,006 | | | | 1,811,488 | | | | 209,636 | | | | 4,969,236 | | | | (3,709,630 | ) | | | 1,259,606 | |
| Operating costs | | | | | | | | | | | | | | | | | | | | | | | | | | | | | | | | | | | | | | | | | | | | | | | | | | | | | | | | | | | | | | | | | | | | | | | | | | | | | | | | |
| Cost of sales | | | (113,631 | ) | | | (128,184 | ) | | | (17,585 | ) | | | (24,282 | ) | | | (49,535 | ) | | | (119,969 | ) | | | (85,980 | ) | | | (555 | ) | | | - | | | | - | | | | - | | | | - | | | | - | | | | (208,968 | ) | | | (983,238 | ) | | | (795,064 | ) | | | (124,325 | ) | | | (2,651,316 | ) | | | 2,138,151 | | | | (513,165 | ) |
| Cost of services | | | - | | | | - | | | | - | | | | - | | | | - | | | | - | | | | - | | | | - | | | | (91,804 | ) | | | (25,412 | ) | | | - | | | | - | | | | - | | | | - | | | | (28,672 | ) | | | - | | | | - | | | | (145,888 | ) | | | 31,768 | | | | (114,120 | ) |
| Exploration in operating units | | | (25,311 | ) | | | (57,871 | ) | | | (7,054 | ) | | | (9,342 | ) | | | (2,974 | ) | | | - | | | | (1,236 | ) | | | (2,441 | ) | | | - | | | | - | | | | - | | | | - | | | | - | | | | - | | | | - | | | | - | | | | - | | | | (106,229 | ) | | | 4,316 | | | | (101,913 | ) |
| Depreciation and amortization | | | (10,844 | ) | | | (28,964 | ) | | | (4,586 | ) | | | (20,348 | ) | | | (25,501 | ) | | | (35,644 | ) | | | (27,930 | ) | | | (9 | ) | | | (264 | ) | | | (1,751 | ) | | | - | | | | (112 | ) | | | (1,434 | ) | | | (524 | ) | | | - | | | | - | | | | - | | | | (157,911 | ) | | | (1,229 | ) | | | (159,140 | ) |
| Mining royalties | | | (1,675 | ) | | | (26,448 | ) | | | (405 | ) | | | (365 | ) | | | (968 | ) | | | - | | | | (431 | ) | | | (110 | ) | | | - | | | | - | | | | - | | | | - | | | | - | | | | - | | | | - | | | | - | | | | - | | | | (30,402 | ) | | | - | | | | (30,402 | ) |
| Total operating costs | | | (151,461 | ) | | | (241,467 | ) | | | (29,630 | ) | | | (54,337 | ) | | | (78,978 | ) | | | (155,613 | ) | | | (115,577 | ) | | | (3,115 | ) | | | (92,068 | ) | | | (27,163 | ) | | | - | | | | (112 | ) | | | (1,434 | ) | | | (209,492 | ) | | | (1,011,910 | ) | | | (795,064 | ) | | | (124,325 | ) | | | (3,091,746 | ) | | | 2,173,006 | | | | (918,740 | ) |
| Gross profit (loss) | | | 53,757 | | | | 82,876 | | | | 16,365 | | | | (9,441 | ) | | | 40,893 | | | | 32,156 | | | | 77,721 | | | | (1,611 | ) | | | 4,455 | | | | 6,646 | | | | 8,455 | | | | 44,073 | | | | (1,434 | ) | | | (3,252 | ) | | | 424,096 | | | | 1,016,424 | | | | 85,311 | | | | 1,877,490 | | | | (1,536,624 | ) | | | 340,866 | |
| Operating expenses | | | | | | | | | | | | | | | | | | | | | | | | | | | | | | | | | | | | | | | | | | | | | | | | | | | | | | | | | | | | | | | | | | | | | | | | | | | | | | | | |
| Administrative expenses | | | (11,818 | ) | | | (20,381 | ) | | | (1,949 | ) | | | (2,607 | ) | | | (7,128 | ) | | | (15,637 | ) | | | (2,475 | ) | | | (2,330 | ) | | | (8,282 | ) | | | (2,571 | ) | | | (7,801 | ) | | | (96 | ) | | | (5,916 | ) | | | 13,342 | | | | (67,064 | ) | | | - | | | | (1,843 | ) | | | (144,556 | ) | | | 69,438 | | | | (75,118 | ) |
| Exploration in non-operating areas | | | - | | | | - | | | | - | | | | - | | | | - | | | | (5,220 | ) | | | (6,563 | ) | | | (2,444 | ) | | | - | | | | - | | | | - | | | | - | | | | - | | | | (21,928 | ) | | | - | | | | - | | | | - | | | | (36,155 | ) | | | 3,350 | | | | (32,805 | ) |
| Selling expenses | | | (3,346 | ) | | | (3 | ) | | | (755 | ) | | | (1,423 | ) | | | - | | | | (8,763 | ) | | | (528 | ) | | | (10 | ) | | | - | | | | - | | | | - | | | | - | | | | - | | | | (13 | ) | | | (3,740 | ) | | | (68,448 | ) | | | (522 | ) | | | (87,551 | ) | | | 72,709 | | | | (14,842 | ) |
| Other, net | | | 2,592 | | | | 1,822 | | | | 209 | | | | 108 | | | | (158 | ) | | | (656 | ) | | | (18 | ) | | | 1,910 | | | | 422 | | | | 50 | | | | 94 | | | | (3 | ) | | | 657 | | | | (9,674 | ) | | | (77,534 | ) | | | 147 | | | | 779 | | | | (79,253 | ) | | | 76,395 | | | | (2,858 | ) |
| Impairment loss of long-lived assets | | | - | | | | - | | | | - | | | | - | | | | - | | | | - | | | | - | | | | - | | | | - | | | | - | | | | - | | | | - | | | | - | | | | - | | | | (1,038,548 | ) | | | - | | | | - | | | | (1,038,548 | ) | | | 1,038,548 | | | | - | |
| Total operating expenses, net | | | (12,572 | ) | | | (18,562 | ) | | | (2,495 | ) | | | (3,922 | ) | | | (7,286 | ) | | | (30,276 | ) | | | (9,584 | ) | | | (2,874 | ) | | | (7,860 | ) | | | (2,521 | ) | | | (7,707 | ) | | | (99 | ) | | | (5,259 | ) | | | (18,273 | ) | | | (1,186,886 | ) | | | (68,301 | ) | | | (1,586 | ) | | | (1,386,063 | ) | | | 1,260,440 | | | | (125,623 | ) |
| Operating profit (loss) | | | 41,185 | | | | 64,314 | | | | 13,870 | | | | (13,363 | ) | | | 33,607 | | | | 1,880 | | | | 68,137 | | | | (4,485 | ) | | | (3,405 | ) | | | 4,125 | | | | 748 | | | | 43,974 | | | | (6,693 | ) | | | (21,525 | ) | | | (762,790 | ) | | | 948,123 | | | | 83,725 | | | | 491,427 | | | | (276,184 | ) | | | 215,243 | |
| Other income (expense),net | | | | | | | | | | | | | | | | | | | | | | | | | | | | | | | | | | | | | | | | | | | | | | | | | | | | | | | | | | | | | | | | | | | | | | | | | | | | | | | | |
| Share in the results of associates under equity method | | | - | | | | - | | | | - | | | | - | | | | - | | | | - | | | | - | | | | - | | | | (1,511 | ) | | | (3,140 | ) | | | - | | | | - | | | | (238,810 | ) | | | (104,219 | ) | | | - | | | | - | | | | - | | | | (347,680 | ) | | | 233,535 | | | | (114,145 | ) |
| Finance costs | | | (561 | ) | | | (832 | ) | | | (477 | ) | | | (544 | ) | | | (163 | ) | | | (47 | ) | | | (1,301 | ) | | | (344 | ) | | | (232 | ) | | | (1,992 | ) | | | (96 | ) | | | (5 | ) | | | (3 | ) | | | (3,731 | ) | | | (18,745 | ) | | | (1,843 | ) | | | (2,385 | ) | | | (33,301 | ) | | | 23,405 | | | | (9,896 | ) |
| Net gain (loss) from currency exchange difference | | | 325 | | | | 92 | | | | 63 | | | | 64 | | | | (64 | ) | | | (4,544 | ) | | | (777 | ) | | | 81 | | | | (111 | ) | | | (1,355 | ) | | | 119 | | | | (66 | ) | | | (17 | ) | | | (985 | ) | | | 2,065 | | | | (1,858 | ) | | | (524 | ) | | | (7,492 | ) | | | 300 | | | | (7,192 | ) |
| Finance income | | | 18 | | | | 29 | | | | - | | | | - | | | | - | | | | - | | | | - | | | | 1 | | | | 6 | | | | - | | | | 7 | | | | 3 | | | | - | | | | 4,693 | | | | 720 | | | | 2,178 | | | | 335 | | | | 7,990 | | | | (1,369 | ) | | | 6,621 | |
| Total other income (expense), net | | | (218 | ) | | | (711 | ) | | | (414 | ) | | | (480 | ) | | | (227 | ) | | | (4,591 | ) | | | (2,078 | ) | | | (262 | ) | | | (1,848 | ) | | | (6,487 | ) | | | 30 | | | | (68 | ) | | | (238,830 | ) | | | (104,242 | ) | | | (15,960 | ) | | | (1,523 | ) | | | (2,574 | ) | | | (380,483 | ) | | | 255,871 | | | | (124,612 | ) |
| Profit (loss) before income tax | | | 40,967 | | | | 63,603 | | | | 13,456 | | | | (13,843 | ) | | | 33,380 | | | | (2,711 | ) | | | 66,059 | | | | (4,747 | ) | | | (5,253 | ) | | | (2,362 | ) | | | 778 | | | | 43,906 | | | | (245,523 | ) | | | (125,767 | ) | | | (778,750 | ) | | | 946,600 | | | | 81,151 | | | | 110,944 | | | | (20,313 | ) | | | 90,631 | |
| Income tax | | | - | | | | - | | | | - | | | | - | | | | - | | | | (5,003 | ) | | | (29,211 | ) | | | (17 | ) | | | (72 | ) | | | (3,228 | ) | | | (269 | ) | | | (13,151 | ) | | | (67 | ) | | | (35,464 | ) | | | 203,471 | | | | (333,338 | ) | | | (34,156 | ) | | | (250,505 | ) | | | 164,023 | | | | (86,482 | ) |
| Profit (loss) from continued operations | | | 40,967 | | | | 63,603 | | | | 13,456 | | | | (13,843 | ) | | | 33,380 | | | | (7,714 | ) | | | 36,848 | | | | (4,764 | ) | | | (5,325 | ) | | | (5,590 | ) | | | 509 | | | | 30,755 | | | | (245,590 | ) | | | (161,231 | ) | | | (575,279 | ) | | | 613,262 | | | | 46,995 | | | | (139,561 | ) | | | 143,710 | | | | 4,149 | |
| Loss from discontinued operations, see Note 1(e) | | | | | | | | | | | | | | | | | | | | | | | | | | | | | | | | | | | | | | | | | | | | | | | | | | | | | | | | | | | | | | | | | | | | | | | | | | | | | | | (83,885 | ) |
| Net loss | | | | | | | | | | | | | | | | | | | | | | | | | | | | | | | | | | | | | | | | | | | | | | | | | | | | | | | | | | | | | | | | | | | | | | | | | | | | | | | (79,736 | ) |
| | | | | | | | | | | | | | | | | | | | | | | | | | | | | | | | | | | | | | | | | | | | | | | | | | | | | | | | | | | | | | | | | | | | | | | | | | | | | | | | | |
| Total assets | | | - | | | | - | | | | - | | | | - | | | | - | | | | 687,187 | | | | 270,911 | | | | 37,366 | | | | 54,372 | | | | 430,588 | | | | 5,801 | | | | 9,008 | | | | 1,387,667 | | | | 3,603,191 | | | | 3,754,692 | | | | 4,828,201 | | | | 203,749 | | | | 15,272,733 | | | | (10,720,466 | ) | | | 4,552,267 | |
| Total liability | | | - | | | | - | | | | - | | | | - | | | | - | | | | 243,749 | | | | 89,767 | | | | 9,174 | | | | 39,744 | | | | 269,466 | | | | 2,774 | | | | 3,439 | | | | 137 | | | | 272,832 | | | | 674,642 | | | | 740,717 | | | | 69,542 | | | | 2,415,983 | | | | (1,688,137 | ) | | | 727,846 | |
| | | | | | | | | | | | | | | | | | | | | | | | | | | | | | | | | | | | | | | | | | | | | | | | | | | | | | | | | | | | | | | | | | | | | | | | | | | | | | | | | |
| Other segment information | | | | | | | | | | | | | | | | | | | | | | | | | | | | | | | | | | | | | | | | | | | | | | | | | | | | | | | | | | | | | | | | | | | | | | | | | | | | | | | | |
| Investment in associates | | | - | | | | - | | | | - | | | | - | | | | - | | | | - | | | | - | | | | - | | | | - | | | | - | | | | - | | | | - | | | | - | | | | 41,931 | | | | 1,360,689 | | | | 904,315 | | | | 43,367 | | | | 2,350,302 | | | | - | | | | 2,350,302 | |
| Additions to mining concessions, development costs, property, plant and equipment | | | 16,038 | | | | 11,023 | | | | 8,927 | | | | 16,643 | | | | 16,233 | | | | 216,477 | | | | 89,308 | | | | 89,313 | | | | 12,307 | | | | 48,532 | | | | 126 | | | | - | | | | - | | | | 42,699 | | | | - | | | | - | | | | - | | | | 567,626 | | | | - | | | | 567,626 | |
Notes to the consolidated financial statements (continued)
Reconciliation of segment profit (loss)
The reconciliation of segment profit (loss) to the consolidated profit (loss) from continued operations follows:
| | | 2015 | | | 2014 | | | 2013 | |
| | | US$(000) | | | US$(000) | | | US$(000) | |
| | | | | | | | | | |
| Segments loss | | | (1,017,074 | ) | | | (176,142 | ) | | | (139,561 | ) |
| Elimination of profit of equity accounted investees, not consolidated (owned by third parties) | | | 203,912 | | | | (108,861 | ) | | | (195,573 | ) |
| Elimination of intercompany sales | | | (232,380 | ) | | | (242,022 | ) | | | (252,500 | ) |
| Elimination of intercompany cost of sales | | | 228,914 | | | | 229,968 | | | | 238,620 | |
| Elimination of equity pick up loss of the subsidiaries and associates of the Parent company | | | 448,691 | | | | 261,514 | | | | 347,680 | |
| Others | | | 1,915 | | | | 5,017 | | | | 5,483 | |
| | | | | | | | | | | | | |
| Consolidated profit (loss) from continued operations | | | (366,022 | ) | | | (30,526 | ) | | | 4,149 | |
Reconciliation of segment assets
The reconciliation of segment assets to the consolidated assets follows:
| | | 2015 | | | 2014 | | | 2013 | |
| | | US$(000) | | | US$(000) | | | US$(000) | |
| | | | | | | | | | |
| Segments assets | | | 17,303,094 | | | | 16,184,466 | | | | 15,272,733 | |
| Elimination of assets of equity accounted investees, not consolidated (owned by third parties) | | | (8,128,519 | ) | | | (6,727,205 | ) | | | (6,108,111 | ) |
| Elimination of equity pick up investments of the subsidiaries and associates of the Parent company | | | (4,486,717 | ) | | | (4,615,191 | ) | | | (4,398,677 | ) |
| Elimination of intercompany receivables | | | (138,703 | ) | | | (156,456 | ) | | | (203,236 | ) |
| Others | | | (1,974 | ) | | | (13,340 | ) | | | (10,442 | ) |
| | | | | | | | | | | | | |
| Consolidated assets | | | 4,547,181 | | | | 4,672,274 | | | | 4,552,267 | |
Reconciliation of segment liabilities
The reconciliation of segment liabilities to the consolidated liabilities follows:
| | | 2015 | | | 2014 | | | 2013 | |
| | | US$(000) | | | US$(000) | | | US$(000) | |
| | | | | | | | | | |
| Segments liabilities | | | 5,451,667 | | | | 3,228,256 | | | | 2,415,983 | |
| Elimination of liabilities of equity accounted investees, not consolidated | | | (4,154,042 | ) | | | (2,162,006 | ) | | | (1,484,901 | ) |
| Elimination of intercompany payables | | | (138,703 | ) | | | (156,456 | ) | | | (203,236 | ) |
| Others | | | (977 | ) | | | 355 | | | | - | |
| | | | | | | | | | | | | |
| Consolidated liabilities | | | 1,157,945 | | | | 910,149 | | | | 727,846 | |
Notes to the consolidated financial statements (continued)
| (d) | On September 29, 2011, Laws 29788 and 29789 modified the Mining Royalties, and created the Special Mining Tax, respectively. Both laws establishes that the payments for mining royalties and special mining tax will be calculated using the quarterly operating income. Rates are establishes based on the gross margin, which is calculated dividing the quarterly operating income over the income generated on that period. The higher amount between the mining royalty and 1 per cent of the income generated by the quarterly sales is paid. Also it is required to pre-payments in advance for the months of October, November and December 2011. Laws were effective since October 1, 2011. |
| 25. | Basic and diluted earnings per share |
Basic earnings per share are computed by dividing net earnings for the period by the weighted average number of shares outstanding during the year.
In the table below is the composition of the number of shares outstanding as of December 31, 2012, 2011 and 2010, and the number of shares considered in the calculation of basic and diluted earnings per share:
| | | Shares outstanding as of December 31, 2012, 2011 and 2010 | | | Shares
(denominator in calculating earnings
per share considering treasury shares
acquired in 2012) | |
| | | Common | | | Investment | | | Of treasury | | | Total | | | Common | | | Investment | | | Total | |
| | | | | | | | | Common | | | Investment | | | | | | | | | | | | | |
| | | | | | | | | | | | | | | | | | | | | | | | | |
| Balance at January 1, 2012, 2011 and 2010 | | | 274,889,924 | | | | 744,640 | | | | (21,130,260 | ) | | | (61,976 | ) | | | 254,442,328 | | | | 253,759,664 | | | | 682,664 | | | | 254,442,328 | |
| | | | | | | | | | | | | | | | | | | | | | | | | | | | | | | | | |
| Treasury shares acquired during 2012 | | | - | | | | - | | | | - | | | | (209,757 | ) | | | (209,757 | ) | | | - | | | | (209,757 | ) | | | (209,757 | ) |
| Balance at December 31, 2012, 2011 and 2010 | | | 274,889,924 | | | | 744,640 | | | | (21,130,260 | ) | | | (271,733 | ) | | | 254,232,571 | | | | 253,759,664 | | | | 472,907 | | | | 254,232,571 | |
Computation of the earnings per share as of December 31, 2012, 2011 and 2010 is presented below:
| | | 2012 | | | 2011 | | | 2010 | |
| | | | | | | | | | |
| Attributable net income attributable to owners of the parent (numerator) – US$ | | | 684,685,000 | | | | 858,927,000 | | | | 660,821,000 | |
| Shares (denominator) | | | 254,232,571 | | | | 254,442,328 | | | | 254,442,328 | |
| | | | | | | | | | | | | |
| Basic and diluted earnings per share – US$ | | | 2.69 | | | | 3.38 | | | | 2.60 | |
| 26. | Disclosure of information on segments |
International Financial Reporting Standard (IFRS) 8 – “Operating Segments” requires that corporations present financial information taking into account the information reported that the chief operating decision maker uses internally for evaluating the performance of operating segments and allocating resources to those segments (a “through the eyes of management” approach).
The Company´s only reportable segment that meets the threshold for reporting is mining, these activities are executed through thirteen companies. The Company´s Management considers that these companies could be combined in one segment (mining) considering the financial performance and similar characteristic related to goods nature, production process nature, type of clients and legal environment. The electric segment, mining consulting and insurance are not significant in order to evaluate business development, reason why the Management considers mining the only reportable segment.
The Board of Directors has been identified as the responsible for approving the Company’s operational decisions. The Board of Directors is responsible for allocating resources and assessing performance as a single operating unit.
| 27.32. | Derivative financial instruments |
| (a) | The volatility of copper prices during the last years has caused the management of the subsidiary El Brocal to enter into future contracts. These contracts are intended to reduce the volatility of the cash flows attributable to the fluctuations in the cooper price, according to the risk strategy approved by the Board of Directors of this subsidiary. Based on this strategy, no more than 50% of existing sales commitments of copper concentrate are under future contracts. |
Buenaventura
As of December 31, 2012 and 2011, Buenaventura had no derivative contracts.
El Brocal
2015, El Brocal performed hedge transactions to hedge metals prices using anyonedoes not have open forward contracts (an asset of the derivative instruments existing in the financial market for up to a term of 3 years, for a total of no more than 25 percent of the estimated metal content of its annual production each year. El Brocal Board of Directors meeting of February 23, 2007 named a Hedging Committee to be responsible for approving all hedging transactions, after their contracting and/or execution. El Brocal maintains lines of credit without margin with brokers on the London Metals Exchange (LME).
| (a) | Mineral quotes hedging operations - |
As of December 31, 2012, the agreements related to the price hedge were already settled. These hedging derivatives held force since 2010, with the intention of covering the risk resulting from a fall in metal prices which markets El Brocal, so they signed contracts that qualify as cash flow hedging cash, which were recorded as assets or liabilities in the statement of financial position, and presented at fair value. In the case hedges were effective to offset future cash flows from the sale of the related production, changes in fair value are deferred in an equity account. The deferred amounts were reclassified to sales when the corresponding production was sold.
Cash-flow hedges operationsUS$3,688,000 as of December 31, 2012 were:
| Metal | | Monthly
average
amount
MT | | | Volume
amount
MT | | | Fixed average
Price per
MT | | | Periods | | | Fair value | |
| | | | | | | | | US$ | | | | | | US$(000) | |
| | | | | | | | | | | | | | | | |
| Zero cost collar-option contracts | | | | | | | | | | | | | |
| Copper | | | 250 | | | | 2,750 | | | | 7,500 – 8,415 | | | | February – December 2012 | | | | 638 | |
| Copper | | | 250 | | | | 2,750 | | | | 7,500 – 8,425 | | | | February – December 2012 | | | | 645 | |
| | | | | | | | | | | | | | | | | | | | | |
| Fair value offinancial instruments | | | | | | | | | | | | 1,283 | |
The2014, which balancing entry, net changeof the deferred income tax, amounted to a positive balance of US$2,485,000 and is presented in the equity account “Other equity“other reserves” for the twelve months ended ascaption of December 31, 2012 amounts to a loss of US$844,000 (gain of US$17,076,000 as of December 31, 2011 and a loss of US$11,442,000 as of December 31, 2010)equity).
| (b) | The change in the consolidated statement of comprehensive income related to hedging instruments is as follows: |
| | | Hedge
derivative
financial
instruments | | | Income tax
and mining
taxes | | | Net change in
unrealized gain
(loss) on
hedging
derivative
financial
instruments | |
| | | US$(000) | | | US$(000) | | | US$(000) | |
| | | | | | | | | | |
| Balance as of January 1, 2010 | | | (6,843 | ) | | | 2,053 | | | | (4,790 | ) |
| Loss from hedging transactions settled during the period, note 18(a) | | | (1,884 | ) | | | 565 | | | | (1,319 | ) |
| Unrealized gain on hedge derivative financial instruments | | | (14,461 | ) | | | 4,338 | | | | (10,123 | ) |
| Total change in derivative financial instruments for hedging | | | (16,345 | ) | | | 4,903 | | | | (11,442 | ) |
| | | | | | | | | | | | | |
| Balance as of December 31, 2010 | | | (23,188 | ) | | | 6,956 | | | | (16,232 | ) |
| Gain from hedging transactions settled during the period, note 18(a) | | | 8,681 | | | | (2,604 | ) | | | 6,077 | |
| Unrealized gain on hedge derivative financial instruments | | | 15,790 | | | | (4,791 | ) | | | 10,999 | |
| Total change in derivative financial instruments for hedging | | | 24,471 | | | | (7,395 | ) | | | 17,076 | |
| | | | | | | | | | | | | |
| Balance as of December 31, 2011 | | | 1,283 | | | | (439 | ) | | | 844 | |
| Loss from hedging transactions settled during the period, note 18(a) | | | (72 | ) | | | 20 | | | | (52 | ) |
| Unrealized gain on hedge derivative financial instruments | | | (1,211 | ) | | | 419 | | | | (792 | ) |
| Total change in derivative financial instruments for hedging | | | (1,283 | ) | | | 439 | | | | (844 | ) |
| | | | | | | | | | | | | |
| Balance as of December 31, 2012 | | | - | | | | - | | | | - | |
| (c) | Embedded derivatives from changes in the provisional pricesderivative of commercial settlementscontracts - |
AsThe Group’s sales of December 31, 2012 and 2011concentrates are based on commercial contracts, under which a provisional sales value is determined based on future quotations (forward). The adjustment to sales is considered an embedded derivative, which is required to be separated from the changes inhost contract. Commercial contracts are linked to market prices (London Metal Exchange) at the fair value of embedded derivatives, were present in the “Net sales” captiondates of the consolidated income statement. The futures quotes for the dates on which it is expected to settlesettlements of the open positions as of December 31, 20122015 and 20112014. The embedded derivative does not qualify for hedge accounting; therefore, changes in the fair value are taken from publications of the London Metals Exchange.recorded as an adjustment to net sales.
Embedded derivatives from sales of concentrate held by Buenaventura and El Brocalthe Group as of December 31, 2012:
| | | | | | Maturity | | | Quotations | | | Fair value, | |
| Metal | | Amount | | | 2013 | | | Provisional | | | Future | | | net | |
| | | | | | | | | US$ | | | US$ | | | US$(000) | |
| | | | | | | | | | | | | | | | |
| Sale of concentrates | | | | | | | | | | | | |
| | | | | | | | | | | | | | | | |
| Gold | | | 37,454 DMT | | | | January | | | | 1,651 - 1,750 | | | | 1,652 - 1,740 | | | | 513 | |
| Silver | | | 2,258,731 Oz | | | | January – April | | | | 28.70 – 34.23 | | | | 30.19 – 30.26 | | | | (5,129 | ) |
| Gold | | | 179 DMT | | | | January – March | | | | 1,686 – 1,771 | | | | 1,652 – 1,654 | | | | (9 | ) |
| Copper | | | 36,076 DMT | | | | January – April | | | | 7,491 – 8,193 | | | | 7,912 – 8,067 | | | | (887 | ) |
| Zinc | | | 4,015 DMT | | | | January – February | | | | 1,810 – 2,037 | | | | 1,987 – 2,066 | | | | 68 | |
| Lead | | | 4,926 Oz | | | | January – March | | | | 1,895 – 2,275 | | | | 2,290 - 2,315 | | | | 316 | |
| | | | | | | | | | | | | | | | | | | | (5,128 | ) |
| Purchase of concentrates | | | | | | | | | | | | | | | | |
| Copper | | | 1,136 DMT | | | | January | | | | 7,965 | | | | 7,912 | | | | 189 | |
| Total liability, net | | | | | | | | | | | | | | | | | | | (4,939 | ) |
Embedded derivatives from sales of concentrate held by Buenaventura and El Brocal as of December 31, 2011:2015 are:
| | | | | | Maturity | Quotations | | | Quotations |
| Metal | | Quantity | | Period of quotations 2016 | | Provisional | | Future | | Fair value, net | |
| | | Fair value, | |
Metal | | Amount | | | 2012US$ | | | ProvisionalUS$ | | | Future | | | netUS$(000) | |
| | | | | | | | | US$ | | | US$ |
| Copper | | 41,359 DMT | | January – April | | 4,629.00 – 5,223.05 | | 4,525.50 – 4,796.00 | | | US$(000)(1,549 | ) |
| Gold | | 16,145 OZ | 6,713 DMT | January | | 961.79 – 1,070.10 | | 1,086.65 – 1,109.09 | | | (633 | ) |
| Silver | | 3,215,862 OZ | | January – March | | 12.66 – 15.71 | | 1,605.40 - 1,727.90 | | | | 1,617.10 - 1,624.20 | 14.30 – 14.31 | | | (296244 | ) |
SilverLead | | | 1,451,655 Oz | | 16,990 DMT | | January – April | | 1,641.40 – 1,732.13 | | 29.381,658.00 – 41.021,789.00 | | | 408 | 28.83 - 28.91 |
| Zinc | | 12,329 DMT | | January – March | | 1,510.41 – 1,672.50 | | 1,495.75 – 1,609.00 | | | 316 | (7,713 | ) |
CopperGold | | | 17,898 DMT | | 342 OZ | | January – April | | 1,066.26 – 1,124.53 | | 7,348.001,109.05 – 9,040.341,109.27 | | | | 7,529.00 - 7,603.00 | | | | 5978 | |
Lead | | | 9,273 DMT | | | | January – April | | | | 1,945.00 - 2,457.78 | | | | 1,987.00 - 2,025.00 | | | | (719 | ) |
Zinc | | | 1,581 DMT | | | | January – March | | | | 1,914.97 - 2,011.75 | | | | 1,821.25 - 1,830.25 | | | | (173 | ) |
Gold | | | 60,458 Oz | | | | January | | | | 1,606.50 – 1,785.00 | | | | 1,640.00 - 1,810.00 | | | | 1,517 | |
Other | | | | | | | | | | | | | |
| Total asset, net | | | | | | | | | | | (5191,694 | ) |
Notes to the consolidated financial statements (continued)
Embedded derivatives held by the Group as of December 31, 2014 are:
| | | | | | Quotations | | | |
| Metal | | Quantity | | Period of
quotations 2015 | | Provisional | | Future | | Fair value, net | |
| | | | | | US$ | | US$ | | US$(000) | |
| | | | | | | | | | | |
| Copper | | 67,815 DMT | | January – June | | 6,408.10 – 6,907.73 | | 6,118.00 – 6,186.00 | | | (7,558 | ) |
| Silver | | 2,361,515 OZ | | January – April | | 15.62 – 19.03 | | 16.35 – 16.38 | | | (631 | ) |
| Lead | | 6,975 DMT | | January – April | | 1,869.30 – 2,178.60 | | 1,840.00 – 1,851.88 | | | (628 | ) |
| Zinc | | 13,521 DMT | | January – March | | 2,171.71 – 2,380.00 | | 2,122.50 – 2,129.25 | | | (296 | ) |
| Gold | | 36,442 OZ | | January – February | | 1,194.00 – 1,227.00 | | 1,201.84 – 1,216.45 | | | 41 | |
| | | | | | | | | | | | |
| Total liability, net | | | | | | | | | | | | | | | | | | | (7,3069,072 | ) |
| 28.(c) | Hedge of the risk of fluctuation of foreign exchange rates |
During 2015, the volatility of the foreign exchange rate between the Soles and the U.S. dollars, which is the functional and reporting currency of Buenaventura and El Brocal, has driven the Group’s Management to undertake hedge contracts of foreign currency exposure over their bank loans mentioned in Note 14. Buenaventura and El Brocal have signed forwards hedging contracts, which have been designated as hedging derivative cash flow because they are intended to cover the risk of fluctuations in the exchange rates of the financial obligations in soles.
Key deadlines of the hedging contract have been negotiated to match the terms and amounts of their obligations.
As of December 31, 2015, fair value of these hedge derivate financial instruments over exchange rates of current bank loans is a liability of US$10,643,000 and the effectiveness of these contracts has not been observed since it has not arisen any significant element of ineffectiveness.
| 33. | Financial –- risk management objectives and policies |
The Company’s ManagementGroup’s principal financial liabilities, other than derivatives, comprise of trade accounts payable, bank loans and overdraftsother payables, and debentures.financial obligations. The main purpose of these financial instruments is to manage short-term cash flow and raise finance for the Company’s capital expenditure programme.Group’s operations. The Group has variousGroup’s principal financial assets such asinclude cash and cash equivalents and trade and other receivables and cash and short-term deposits that arisederive directly from its operations.
The Company’s Management manages its exposureGroup is exposed to key financial risks in accordance with the Company’s financialmarket risk, management policy. The objective of the policy is to support the delivery of the Company’s financial targets while protecting future financial security. The main risks that could adversely affect the Group’s financial assets, liabilities or future cash flows are market risks, comprising commodity price risk, cash flow interest rate risk and foreign currencycredit risk and liquidity risk and credit risk. Management reviews and agrees policies for managing each of these risks that are summarized below.
The Company’sGroup’s Management oversees the management of financialthese risks. The Group’s senior managementIt is supported by a Financial Risk Committeecommittee that advises on financial risks and the appropriate financial risk governance framework for the Group. The Financial Risk Committeerisks. This committee provides assurance to the Group’s senior management that the Group’sGroup's financial risk-takingrisk activities are governed by appropriate policies and procedures and that financial risks are identified, measured and managed in accordance with the Group’s policies and risk objectives. All derivative activities for risk management purposespurpose are carried out by specialist teamsinternal specialists that have the appropriate skills, experience and supervision.
Financial instruments that are affected by market risks include accounts receivable, accounts payable, embedded derivativesThere were no changes in the objectives, policies or processes during the years ended December 31, 2015 and hedge derivative financial instruments.2014.
The Board of Directors reviews and approvesagrees policies to managefor managing each of these risks, which are described below:
Market risk is the risk that the fair value of the future cash flows from financial instruments shouldwill fluctuate as a resultbecause of changes in market prices. The marketMarket risks that apply to the Company includeGroup comprise three types of risk: exchange-rateexchange rate risk, commodity risk of changes in the prices of minerals and interest-rateinterest rate risk. Financial instruments affected by market risks include loans,time deposits, financial obligations, embedded derivatives and derivative financial instruments.
Notes to the consolidated financial statements (continued)
The sensitivity analysisanalyses in this section relatesrelate to the positions as of December 31, 20122015, 2014 and 2011,2013, and hashave been prepared considering that the proportion of financial instruments in foreign currency remainsare constant.
| (a.1) | Exchange-rateExchange rate risk |
The Company billsexchange rate risk is the salerisk that the fair value or future cash flows of its products (locally and abroad) mostlya financial instrument will fluctuate because of changes in United States dollars. Exchange-rateforeign exchange rates. The Group’s exposure to the risk arises mainly from deposits and other accounts payableof changes in Nuevosforeign exchange relates primarily to the Group´s operating activities in Soles. The CompanyGroup mitigates the effect of exposure to exchange-rate risk by carrying out almost all of its transactions in its functional currency.
On the other hand, the Group has contracted hedges exchange rate to mitigate this risk on their loans obtained in soles. Excluding loans in soles, Management retainsmaintains smaller amounts in Nuevos Soles in order to cover its needs (taxes and compensation) in this currency.currency (primarily taxes).
As of December 31, 2012, the Company had posted a net loss of US$1,715,000 from exchange differences (a net loss of US$675,000 and US$750,000 as of December 31, 2011 and 2010), from the translation of balances in Nuevos Soles
Notes to the functional currency.consolidated financial statements (continued)
A table showing the effect on results of a reasonable change in foreign-currency exchange rates is presented below, with all other variables kept constant:
| | | Exchange-rate
increase /
decrease | | Effect on
earnings before
income tax | | | Exchange-rate
increase/decrease | | Effect on loss before
income tax | |
| | | | | US$(000) | | | | | US$(000) | |
| 2012 | | | | | | | | | |
| 2015 | | | | | | |
| Exchange rate | | | +10 | % | | | 8,854 | | | | +10 | % | | | 6,233 | |
| Exchange rate | | | -10 | % | | | (10,563 | ) | | | -10 | % | | | (7,618 | ) |
| | | | | | | | | | | | | | | | | |
| 2011 | | | | | | | | | |
| 2014 | | | | | | | | | |
| Exchange rate | | | +10 | % | | | 8,638 | | | | +10 | % | | | 5,950 | |
| Exchange rate | | | -10 | % | | | (10,333 | ) | | | -10 | % | | | (7,271 | ) |
| | | | | | | | | | | | | | | | | |
| 2010 | | | | | | | | | |
| 2013 | | | | | | | | | |
| Exchange rate | | | +10 | % | | | 3,032 | | | | +10 | % | | | 20,989 | |
| Exchange rate | | | -10 | % | | | (3,617 | ) | | | -10 | % | | | (25,225 | ) |
| (a.2) | Risk of pricesCommodity price risk |
Risk in mineral prices
InternationalThe Group is affected by the price of minerals has an important impact on the resultsvolatility of the Company’s operations.commodities. The price of the mineral sold by the CompanyGroup has fluctuated historically and is affected by numerous factors beyond the Company’sits control. The CompanyGroup manages thisits commodity price risk primarily through the use of sales commitments with customers. The Company does notin customer contracts and hedge its exposure to price fluctuation.
Buenaventura -
The Company does not have financial hedging instruments for managing this risk.
Embedded derivatives
The Company allocates a provisional sales value to the sales that are subject to future settlement pursuant to the commercial contracts signed with its customers. Exposure to changes in the price of metals generates an embedded derivative that must be separated from the commercial contract. At each period’s closing, the value of provisional sales is adjusted in accordance with the estimated price for the quotation period stipulated inmetals sold by the contract. Adjustment of the provisional sale value is posted as an increase or decrease in net sales. See note 2.3(p).subsidiary El Brocal.
The estimated changesubsidiary El Brocal entered into derivative contracts that qualified as cash flow hedges, with the intention of covering the risk resulting from the fall in the price for sales pending final settlement, which is disclosed withinprices of the net salesmetals. These derivative contracts are recorded as assets or liabilities in the statements of embedded derivative to December 31, 2012, amounted to US$1,776,000 (note 27(c)).financial position and are stated at fair value. To the extent that these hedges were effective in offsetting future cash flows from the sale of the related production, changes in fair value are deferred in an equity account. The estimate corresponding to such settlements as closed in January 2012deferred amounts were reduced by 10 percent with respectreclassified to the actual value settled. In the case of settlements that still maintain their provisional value as of December 31, 2010; their estimateappropriate sales when production was also reduced by 36 percent due to the drop in metals prices since the month of January (liquidations that were closed in January 2012 were increased (greater loss) at 10 percent).
El Brocal -
As of December 31, 2012, the Company does not hold hedging instruments. Regarding future prices as of December 31, 2011 and the market value at that time of the position of derivative financial instruments contracted by the Brocal presents a sensitivity analysis of the market value of this position on a variation of around 10 percent for the relevant prices, while all other variables held constant:sold.
| | Effect on unrealized
gain (loss) on hedge
derivative financial
instruments, net | |
| | US$(000) | |
| | | | |
2011 | | | | |
Increase of 10 percent in future quotes | | | | |
Hedges in effect for 2012 | | | (2,047 | ) |
| | | | |
Decrease of 10 percent in future quotes | | | | |
Hedges in effect for 2012 | | | 4,661 | |
| (a.3) | Interest-rateInterest rate risk - |
Interest rate risk is the risk that the fair value or future cash flows of a financial instrument will fluctuate because of changes in market interest rates. The Company isGroup’s exposure to interest-ratethe risk change especially by itsof changes’ in market interest rates relates to the Groups’ long-term financial obligations.obligations with floating interest rates.
Notes to the consolidated financial statements (continued)
In the case, the interest-rate subject to the long-term financial obligation changes on the order of 10 percent for LIBOR rate as of December 31, 2012 and 2011 respectively,A table showing the effect on income before income tax had not been significant. The effect is shown below:in profit or loss of the variations of interest rates:
| | | Increase /
decrease in
Libor rate | | | | | increase/decrease of
Libor rate | | Effect on results | |
| | | (percentage
points) | | Assets
US$(000) | | | (percentage rates) | | US$(000) | |
| | | | | | | |
| 2012 | | | | | | | | | |
| 2015 | | | | | | |
| Interest rate | | | +10.0 | | | | 57 | | | | +10 | | | | 294 | |
| Interest rate | | | -10.0 | | | | (57 | ) | | | -10 | | | | (294 | ) |
| | | | | | | | | | | | | | | | | |
| 2011 | | | | | | | | | |
| 2014 | | | | | | | | | |
| Interest rate | | | +10.0 | | | | 1 | | | | +10 | | | | 110 | |
| Interest rate | | | -10.0 | | | | (1 | ) | | | -10 | | | | (110 | ) |
| | | | | | | | | | |
| 2013 | | | | | | | | | |
| Interest rate | | | | +10 | | | | 58 | |
| Interest rate | | | | -10 | | | | (58 | ) |
Credit risk is the risk that counterparty will not meet its obligations under a financial instrument or customer contract, leading to a financial loss. The Company’sGroup is exposed to credit risk arises from its operating activities (primarily trade receivable) and from its financing activities, including deposits with banks and other financial instruments.
The Group invests the inability of debtors to be able to fulfill their obligations, to the extent to which they are overdue. Therefore, the Company deposits its excess fundscash in financial leading financial institutions, establishessets conservative credit policies and constantly evaluates conditions of the market conditions in which it is involved, for which it uses risk-rating reports for commercial and credit transactions.
There is concentration-of-credit risk when there are changes in the economic, industrial or geographic factors that equally affect the counterparts related to the Company. The Company’s gold and concentrate sales are made to companies of recognized national and international prestige. Transactions are executed with various counterparts with credit solvency, which mitigates any significant concentration of credit.operates.
Trade accounts receivable are denominated in U.S. dollars; their due dates are the dates of emission on the proof of payment, which amounts becomes cash in days following their due dates.dollars. The Company’sGroup’s sales of the Company are made to domestic and foreign customers; as of December 31, 2012 it had a portfolio of 19 customers (14 customers as of December 31, 2011).customers. See concentration of spot sales in note 18(b)Note 21(b). The Company performsAn impairment analysis is performed on an assessment on those debts whose collection is estimated as a variable to determine the allowance for doubtful accounts.individual basis.
Credit risk is limited to the book valuecarrying amount of the financial assets asto the date of the consolidated statementstatements of financial position date. These assets consist mainly ofwhich is composed by cash and cash equivalents, trade accounts receivable,and other accounts receivablereceivables and derivative financial instruments.
Collections in January 2013 amounted to US$175,358,000, which represents 68 percent of the balances receivable as of December 31, 2012.
Prudent management of liquidity risk implies maintaining sufficient cash and cash equivalents and the possibility of committing or having financing committed through an adequate number of credit sources. The CompanyGroup maintains suitable levels of cash and cash equivalents; its shareholders also include companies with economic backingequivalents and it has sufficient credit capacity to allow it to haveget access to lines of credit in leading financial entities.
The CompanyGroup continually monitors its liquidity reservesrisk based on cash flow projections.
Notes to the consolidated financial statements (continued)
An analysis of the Company’sGroup’s financial liabilities classified according to their aging is presented below, considering the period from their due date to the consolidated statement of financial position:based on undiscounted contractual payments:
| | | Less than
1 year | | | Between
1 and 2
years | | | Between
2 and 5
years | | | More than
5 years | | | Total | |
| | | US$(000) | | | US$(000) | | | US$(000) | | | US$(000) | | | US$(000) | |
| | | | | | | | | | | | | | | | |
| As of December 31, 2012 | | | | | | | | | | | | | | | | | | | | |
| Trade accounts payable | | | 199,551 | | | | - | | | | - | | | | - | | | | 199,551 | |
| Long-term debt (principal and interest) | | | 6,116 | | | | 29,832 | | | | 29,712 | | | | 122,925 | | | | 188,585 | |
| Other accounts payable | | | 58,603 | | | | - | | | | - | | | | - | | | | 58,603 | |
| | | | | | | | | | | | | | | | | | | | | |
| Total | | | 264,270 | | | | 29,832 | | | | 29,712 | | | | 122,925 | | | | 446,739 | |
| | | | | | | | | | | | | | | | | | | | | |
| As of December 31, 2011 | | | | | | | | | | | | | | | | | | | | |
| Trade accounts payable | | | 142,375 | | | | - | | | | - | | | | - | | | | 142,375 | |
| Long-term debt (principal and interest) | | | 1,085 | | | | 857 | | | | 55,519 | | | | 53,001 | | | | 110,462 | |
| Embedded derivatives for concentrates sales | | | 7,306 | | | | - | | | | - | | | | - | | | | 7,306 | |
| Other accounts payable | | | 41,150 | | | | - | | | | - | | | | - | | | | 41,150 | |
| | | | | | | | | | | | | | | | | | | | | |
| | | | 191,916 | | | | 857 | | | | 55,519 | | | | 53,001 | | | | 301,293 | |
| | | Less than
1 year | | | Between 1
and 2 years | | | Between 2
and 5 years | | | More than 5
years | | | Total | |
| | | US$(000) | | | US$(000) | | | US$(000) | | | US$(000) | | | US$(000) | |
| | | | | | | | | | | | | | | | |
| As of December 31, 2015 - | | | | | | | | | | | | | | | |
| Bank loans | | | 298,984 | | | | - | | | | - | | | | - | | | | 298,984 | |
| Trade and other payables | | | 235,691 | | | | - | | | | - | | | | 15,057 | | | | 250,748 | |
| Derivative financial instruments | | | 10,643 | | | | - | | | | - | | | | - | | | | 10,643 | |
| Embedded derivative for sale of concentrates | | | 1,694 | | | | - | | | | - | | | | - | | | | 1,694 | |
| Financial obligation | | | 62,560 | | | | 92,571 | | | | 238,504 | | | | - | | | | 393,635 | |
| Contingent consideration liability | | | - | | | | - | | | | 8,050 | | | | 29,118 | | | | 37,168 | |
| | | | | | | | | | | | | | | | | | | | | |
| Total | | | 609,572 | | | | 92,571 | | | | 246,554 | | | | 44,175 | | | | 992,872 | |
| As of December 31, 2014 - | | | | | | | | | | | | | | | | | | | | |
| Bank loans | | | 40,600 | | | | - | | | | - | | | | - | | | | 40,600 | |
| Trade and other payables | | | 237,937 | | | | - | | | | - | | | | 15,240 | | | | 253,177 | |
| Embedded derivative for sale of concentrates | | | 9,072 | | | | - | | | | - | | | | - | | | | 9,072 | |
| Financial obligation | | | 71,196 | | | | 47,673 | | | | 135,178 | | | | 130,504 | | | | 384,551 | |
| Contingent consideration liability | | | - | | | | - | | | | 5,463 | | | | 36,156 | | | | 41,619 | |
| | | | | | | | | | | | | | | | | | | | | |
| Total | | | 358,805 | | | | 47,673 | | | | 140,641 | | | | 181,900 | | | | 729,019 | |
For purposes of the Group's capital management, capital is based on all equity accounts. The objective of capital management is to safeguard the Company’s capacity to continue as a going concern for the purpose of providing returns for shareholders, benefits for the stakeholders and maintaining an optimal structure that allows reducing the cost of capital.maximize shareholder value.
The CompanyGroup manages its capital structure and makes adjustments to confront changes inmeet the market’schanging economic market conditions. The Company’sGroup's policy is to financefund all itsprojects of short and long-term projectslong term with itstheir own operating resources. In order toTo maintain or adaptadjust the capital structure, the CompanyGroup may amendchange the policy for dividend paymentsof paying dividends to shareholders, return capital to its shareholders or issue new shares. There were no changes in objectives, policies or procedures during
Notes to the years ending December 31, 2012 and 2011.consolidated financial statements (continued)
| 29.34. | Fair value of financial instrumentsmeasurement |
Fair value is defined asdisclosure of assets and liabilities according to its hierarchy -
The following table provides the amount at whichfair value measurement hierarchy of the Group’s assets would be exchanged or liabilities settled between knowing and willing parties in an arm’s length transaction, under the assumption is a going concern entity.liabilities:
| | | | | | Fair value measurement using | |
| | | Total | | | Quoted prices in
active markets
(Level 1) | | | Significant
observable inputs
(Level 2) | | | Significant
non-observable
inputs
(Level 3) | |
| | | US$(000) | | | US$(000) | | | US$(000) | | | US$(000) | |
| | | | | | | | | | | | | |
| As of December 31, 2015 | | | | | | | | | | | | | | | | |
| Liabilities measured at fair value: | | | | | | | | | | | | | | | | |
| - Embedded derivatives for concentrates sales, net | | | 1,694 | | | | - | | | | 1,694 | | | | - | |
| - Contingent consideration liability | | | 16,994 | | | | - | | | | - | | | | 16,994 | |
| - Hedge instruments | | | 10,282 | | | | - | | | | 10,282 | | | | - | |
| | | | | | | | | | | | | | | | | |
| As of December 31, 2014 | | | | | | | | | | | | | | | | |
| Assets measured at fair value: | | | | | | | | | | | | | | | | |
| Financial assets at fair value with changes in profit or loss | | | 3,688 | | | | - | | | | 3,688 | | | | - | |
| Liabilities measured at fair value: | | | | | | | | | | | | | | | | |
| Derivative financial liabilities: | | | | | | | | | | | | | | | | |
| - Embedded derivatives for concentrates sales, net | | | 9,072 | | | | - | | | | 9,072 | | | | - | |
| - Contingent consideration liability | | | 23,026 | | | | - | | | | - | | | | 23,026 | |
When a financial instrument is traded in a liquid and active market, its price as set in a real market transaction offers the best evidence of its fair value. When no price is set in the market or the latter may not be indicative of the instrument’s fair value, the market value of another substantially similar instrument, the analysis of discounted flows or other applicable techniques may be used to determine this fair value, which is materially affected by the assumptions used. Although Management has used its best judgment in estimating the fair values of its financial instruments, any technique for making these estimates entails a certain level of inherent fragility. As a result, fair value may not be indicative of the net realizable or liquidation value of financial instruments.
Financial instruments whose fair value is similar to their book value –-
For financial assets and liabilities whichsuch as cash and cash equivalents, trade and other receivables, trade and other payables that are liquid or have short-term maturitymaturities (less than three months), such as cash and cash equivalent, accounts receivable, other accounts receivable, accounts receivable from associates, accounts payable and other current liabilities, it is estimated that their book value is similar to their fair value. The derivatives are also recorded at the fair value so that differences do not need to be reported.
The fair value of embedded derivatives is determined using valuation techniques usingwith information directly observable in the market (forward prices of metals)(future metal quotations).
Financial instruments at fixed and variable rates –-
The fair value of financial assets and liabilities at fixed and variableratesvariable rates at amortized cost is determined by comparing the market interest rates at the time of their initial recognition to the current market rates with regard to similar financial instruments. The estimated fair value of deposits that accrue interest is determined by means of cash flows discounted using the prevailing market interest rates in the currency with similar maturities and credit risks.
Based on the foregoing, there are no significant differencesimportant existing difference between bookthe value in books and fairthe reasonable value of the assets and financial instruments (assets and liabilities)liabilities as of December 31, 20122015 and 2011.2014.
Fair value hierarchy -
The
Minera Yanacocha S.R.L. and Subsidiary
Consolidated Financial Statements for the years 2015, 2014 and 2013 together with the Report of Independent Auditors
Minera Yanacocha S.R.L. and Subsidiary
Consolidated Financial Statements for the years 2015, 2014 and 2013, together with the Report of Independent Auditors
Content
Report of Independent Registered Public Accounting Firm
To the Shareholders of Minera Yanacocha S.R.L. and Subsidiary
We have audited the accompanying financial statements of Minera Yanacocha S.R.L. (a Peruvian Company usesand subsidiary of Newmont Mining Corporation), which comprise the following hierarchy for determining and disclosing the fair valueconsolidated statements of financial instruments which are measured at fair value by valuation technique:
| Level 1: | Quoted (unadjusted) prices in active markets for identical assets or liabilities. |
| Level 2: | Other techniques for which all inputs or data different from the quoted price of Level 1 are observable, either directly or indirectly. |
| Level 3: | Techniques which use inputs which have a significant effect on the recorded fair value that are not based on observable market data. |
The financial instruments measured at fair value used by the Company, use level 2 valuation techniques in the periods endedposition as of December 31, 2012 and 2011. This financial instrument is related to the embedded derivative based on the future price of copper on the expected date of settlement. As of December 31, 2012 and 2011, the balance of those items was a liability of US$4,939,000 and of US$7,306,000, respectively.
There has been no transfer between fair value levels during 2012 neither 2011.
| 30. | Commitments and contingencies |
Buenaventura -
The Company’s exploration and exploitation activities are subject to environmental protection standards.
Law No. 28090 regulates the obligations and procedures that must be met by the holders of mining activities for the preparation, filing and implementation of Mine Closure Plans, as well as the establishment of the corresponding environmental guarantees to secure fulfillment of the investments that this includes, subject to the principles of protection, preservation and recovery of the environment.
Law No. 28271 regulates environmental liabilities in mining activities. This Law has the objectives of ruling the identification of mining activity’s environmental liabilities and financing the remediation of the affected areas. According to this law, environmental liabilities refer to the impact caused to the environment by abandoned or inactive mining operations.
In compliance with the above-mentioned laws, the Company presented preliminary environmental studies and Environmental Adaptation and Management Programs (EAMP) for mining units. The Ministry of Energy and Mines has approved the EAMP presented by the Company for its mining units and exploration projects. See detail of plans approved in note 14(a).
El Brocal -
In July 2012, in compliance with current environmental legislation on the closure of the mining units in operation, El Brocal commissioned a company authorized by the Peruvian government to developed a new closure plan for their production unit Colquijirca.
On July 12, 2012, the Company presented the Update Mine Closure Plan Colquijirca where new obligations include closure caused by the expansion of operations. The main changes are related to the closure update clearing deposits and tailings impoundments, decommissioning and dismantling of the concentrator plant expansion to 5,000 DMT/day to 7,000 DMT/day and 10,500 new concentrator DMT/day. The new Mine Closure Plan was approved by a nominal value of US$52,952,000.
Cerro Verde -
On September 2012, according as established by the current legal regulations, Cerro Verde presented to the Ministry of Energy and Mines an updated mine closure plan, in which the remediation and mine closure budget was updated. As a result and pursuant to the accounting policies of Cerro Verde increased the liability for mine closure remediation at US$72,512,000 and the mine closure asset by the same amount.
The increase presented in the mine closure plan in 2012 was due to the update of costs related to the future closure of platform 4B and additional deposits for clearing. Additionally, as a result of the Expansion Project, the useful life of the mine and exploration time has been significantly reduced. The Company considers that this liability is sufficient to meet the current environmental protection laws approved by the MEM. Cerro Verde has issued letters of credit to Ministry of Energy and Mines amounting to US$12,838,000 to secure mine closure plans for its mining unit.
The Company believes that the liability recorded is sufficient to meet the current regulatory environment in Peru.
Sindicato Minero Orcopampa S.A. -
The Company pays 10 percent on the valued production of mineral obtained from the concessions leased by Sindicato Minero Orcopampa S.A. This concession is in force until the year 2043. See note 21.
Minera El Futuro de Ica S.R.L. -
Inminsur entered into a contract with Minera El Futuro de Ica S.R.L. to operate leased mining concessions in the department of Arequipa. The contractual terms establish that the lease is subject to payment of a royalty equivalent to seven percent of the monthly value of the sale of concentrates. As part of the merger with Buenaventura, the contract will be in force until the year 2015. See note 21.
| (c) | Purchase option contracts - |
During the ordinary course of business, the Company executes contracts to undertake exploration works in third-party concessions. Under the terms of these contracts, the Company generally has an option to acquire the concession or to invest in it in order to earn a share in the holding company. In order to exercise these options, the Company must fulfill certain obligations during the contract term. The Company’s failure to perform the obligations established therein is usually grounds for termination of these contracts.
The Company may terminate these contracts at any time during their terms, generally after having performed at least the minimum obligations established. Along this line, the Company constantly analyzes the advisability of whether or not to continue with such contractual relationships.
Buenaventura -
Buenaventura is a party in legal procedures that have arisen in the normal course of its activities; nevertheless, in the opinion of Buenaventura’s Management, none of these procedures, in particular or as a whole, could result in material contingencies.
Yanacocha -
Mercury spill in Choropampa
In June 2000, a transport contractor of Yanacocha spilled approximately 151 kilograms of elemental mercury near the town of Choropampa, Peru, which is located 53 miles (85 kilometers) southwest of the Yanacocha mine. Elemental mercury is not used in Yanacocha’s operations but is a by-product of gold mining and was sold to a Lima firm for use in medical instruments and industrial applications. A comprehensive health and environmental remediation program was undertaken by Yanacocha in response to the incident. In August 2000, Yanacocha paid under protest a fine of S/.1.7 million (approximately US$0.5 million).
Yanacocha has entered into settlement agreements with a number of individuals impacted by the incident. As compensation for the disruption and inconvenience caused by the incident, Yanacocha entered into agreements with and provided a variety of public works in the three communities impacted by this incident. Yanacocha cannot predict the likehood of additional expenditures related to this matter.
Additional lawsuits relating to the Choropampa incident were filed against Yanacocha in the local courts of Cajamarca, Peru, in May 2002 by over 900 Peruvian citizens. A significant number of the plaintiffs in these lawsuits entered into settlement agreements with Yanacocha prior to filing such claims. In April 2008, the Peruvian Supreme Court upheld the validity of these settlement agreements, which should result in the dismissal of all claims brought by previously settled plaintiffs. Yanacocha has also entered into settlement agreements with approximately 350 additional plaintiffs. The claims asserted by approximately 212 plaintiffs remain. In December 2010, Yanacocha resolved 4 additional claims which should result in the dismissal of all claims brought by previously settled plaintiffs. Yanacocha cannot reasonably predict the final outcome or estimate the possible loss relating to such claims. The maximum additional expense related to these judicial claims is estimated at US$1.5 million.
Baños del Inca
In September 2006 the Municipality of Baños del Inca issued a declaration designating an area that includes the Carachugo Expansion and San Jose Projects as reserved and protected areas. Based on previous experience and actions taken by the Constitutional Tribunal (Peru Court of Last instance for Constitutional issues) in respect of Cerro Quilish in which it was ruled that such declaration did not affect Yanacocha’s mining rights, Yanacocha believes that Baños del Inca’s declaration, should not impact the Yanacocha’s legal rights to exploit these concessions. The legal proceeding is currently pending resolution in Lima’s Court of First Instance.
In March 2008, the Lima Court rejected a Baños del Inca Municipality request which did not recognize Lima’s Jurisdiction.
San Pablo
In February 2007 the Municipality of San Pablo issued an ordinance designating an area that includes Las Lagunas and Pozo Seco as reserved and protected areas, where Yanacocha has mining rights. Based on previous experience and actions taken by the Constitutional Tribunal in respect of Cerro Quilish in which it was ruled that such declaration did not affect Yanacocha’s mining rights, Yanacocha believes that San Pablo’s declaration, should not impact Yanacocha’s legal rights to exploit these concessions. Yanacocha has challenged this ordinance on the grounds that, under Peruvian law, local governments lack the authority to create such areas, denying the rights granted by Yanacocha’s mining concessions. The Court in the First Instance rejected the complaint based on formal grounds. The resolution of the Court was appealed before Lima’s Court of Second Instance.
In November 2008, Lima’s Court affirmed the ruling from the First Instance. In December 2011, Constitutional Court accepts the complaint. The process is currently pending resolution.
Clínica Internacional, Addeco, SDC Security
Workers of three contractors companies (Clínica Internacional, Adecco and SDC Security) have initiated judicial proceedings through which they demand their incorporation into Minera Yanacocha´s payroll. The workers deem they are direct employees of Yanacocha with all the rights, arguing that they receive direct orders from Minera Yanacocha and that most of the equipment they use is given by Yanacocha. All proceedings, which involve a total of 85 workers, are pending First Instance resolution.
Cerro Verde –
SUNAT has assessed mining royalties on materials processed by Cerro Verde concentrator which commenced operations in late 2006. These assessments cover the period October 2006 to December 2007 and the years 2008 and 2009. SUNAT has issued rulings denying Cerro Verde’s protest of the assessments. Cerro Verde has appealed these decisions and currently has three cases pending before the Peruvian Tax Tribunal. Cerro Verde is challenging these royalties because it believes its stability agreement provides an exemption for all minerals extracted from its mining concession, irrespective of the method used for processing those minerals. Although we believe our interpretation of the stability agreement is correct, if Cerro Verde is ultimately found responsible for these assessments, the amount of royalty and related interest payable would be significant. SUNAT may continue to assess mining royalties annually until this matter is resolved by the Peruvian Tax Tribunal.
| 31. | Transactions with associates companies |
| (a) | The Company has carried out the following transactions with its associates in the years 2012, 2011 and 2010: |
| | | 2012 | | | 2011 | | | 2010 | |
| | | US$(000) | | | US$(000) | | | US$(000) | |
| | | | | | | | | | |
| Transactions with Minera Yanacocha S.R.L.: | | | | | | | | | | | | |
| Paid royalties to: | | | | | | | | | | | | |
| S.M.R.L. Chaupiloma Dos de Cajamarca | | | 67,178 | | | | 62,742 | | | | 55,883 | |
| | | | | | | | | | | | | |
| Services received by: | | | | | | | | | | | | |
| Buenaventura Ingenieros S.A (Implementation of specific work orders) | | | 4,440 | | | | 11,579 | | | | 1,575 | |
| Consorcio Energético de Huancavelica S.A. (Electric power transmission) | | | 1,681 | | | | 4,279 | | | | 4,788 | |
| | | | | | | | | | | | | |
| Transactions with Compañía Minera Coimolache S.A.: | | | | | | | | | | | | |
| Received dividends | | | 16,467 | | | | - | | | | - | |
| Loan | | | - | | | | 24,232 | | | | - | |
| Expenses recovery of exploration projects | | | - | | | | - | | | | 15,013 | |
| | | | | | | | | | | | | |
| Contributions made to associates: | | | | | | | | | | | | |
| Canteras del Hallazgo S.A.C. | | | 26,410 | | | | 32,208 | | | | 16,358 | |
| Compañía Minera Coimolache S.A. | | | - | | | | 5,221 | | | | - | |
| (b) | Compañía Minera Coimolache S.A. (“Coimolache”) - |
On October 18, 2010, the Shareholders´Meeting of Compañía Minera Coimolache S.A. approved the development program and financial support of Tantahuatay Project; the total budget of the project was estimated in US$110,000,000 and the project financing structure should be: 30 percent shareholders´s equity and 70 percent loans from shareholders. The account receivable to Coimolache has been recovered and generates a calculated interest with a LIBOR interest rate to 6 months plus 3 percent. During the months of June, August and November 2012, the collections made amounted to US$13,423,000.
| (c) | As a result of the transactions indicated before, the Company had the following accounts receivable from associates: |
| | | 2012 | | | 2011 | |
| | | US$(000) | | | US$(000) | |
| Accounts receivable | | | | | | | | |
| Compañía Minera Coimolache S.A. | | | 39,166 | | | | 53,971 | |
| Minera Yanacocha S.R.L. | | | 16,513 | | | | 25,441 | |
| Other | | | 232 | | | | 275 | |
| | | | 55,911 | | | | 79,687 | |
| Less – non-current portion | | | | | | | | |
| Compañía Minera Coimolache S.A. | | | (33,377 | ) | | | (32,262 | ) |
| Non-current portion | | | (33,377 | ) | | | (32,262 | ) |
| | | | | | | | | |
| Current portion | | | 22,534 | | | | 47,425 | |
| | | | | | | | | |
| Accounts payable | | | | | | | | |
| Compañía Minera Coimolache S.A. | | | 1,018 | | | | 1,293 | |
| Minera Yanacocha S.R.L. | | | 603 | | | | 594 | |
| | | | 1,621 | | | | 1,887 | |
| Less – non-current portion | | | | | | | | |
| Compañía Minera Coimolache S.A. | | | (731 | ) | | | (1,004 | ) |
| Current portion | | | 890 | | | | 883 | |
| (d) | As of December 31, 2012 and 2011, directors, officers and employees of the Company have been involved, directly and indirectly, in credit transactions with certain subsidiaries. As of December 31, 2012 and 2011, officers and employees of the Company have been involved, directly and indirectly, in credit transactions with certain subsidiaries. As of December 31, US$1,474,000 and US$1,025,000, respectively; said loans are paid monthly and earn interest at market rates. |
There are no loans to the Company’s directors and key personnel guaranteed with Buenaventura or any of its Subsidiaries’ shares.
| (e) | The Company’s key executives’ compensation (including the related income taxes assumed by the Company) as of December 31, 2012 and 2011: |
| | | 2012 | | | 2011 | |
| | | US$(000) | | | US$(000) | |
| Accounts payable: | | | | | | | | |
| Share-based compensation plans, note 14(c) | | | 28,258 | | | | 43,188 | |
| Directors’ compensations, note 14 | | | 2,721 | | | | 3,567 | |
| Salaries | | | 1,362 | | | | 4,302 | |
| | | | | | | | | |
| Total | | | 32,341 | | | | 51,057 | |
| Disbursements by: | | | | | | |
| | | 2012 | | | 2011 | |
| | | US$(000) | | | US$(000) | |
| | | | | | | |
| Share-based compensation plans, note 14(c) | | 16,729 | | | 20,499 | |
| Salaries | | | 10,824 | | | | 8,461 | |
| | | | | | | | | |
| Total | | | 27,553 | | | | 28,960 | |
MINERA YANACOCHA S.R.L.
CONSOLIDATED FINANCIAL STATEMENTS
DECEMBER 31, 2012
CONTENTS | Page |
| |
Report of the Independent Registered and Certified Public Accounting Firm | F-110 |
| |
Consolidated Statements of Income and Comprehensive Income | F-111 |
| |
Consolidated Statements of Cash Flows | F-112 |
| |
Consolidated Balance Sheets | F-113 |
| |
Consolidated Statements of Changes in Partners’ Equity | F-114 |
| |
Notes to the Consolidated Financial Statements | F-115 |
REPORT OF THE INDEPENDENT REGISTERED AND CERTIFIED PUBLIC
ACCOUNTING FIRM
To the Partners and the Executive Committee of
Minera Yanacocha S.R.L.
March 25, 2013
In our opinion, the accompanying consolidated balance sheets2015, and the related consolidatedconsolidated statements of income and comprehensive income, statements of changes in partners’ equity and cash flows, present fairly, in all material respects, the financial positionstatements ofMinera Yanacocha S.R.L.at December 31, 2012 and 2011, and the results of their operations and its cash flows for each of the three years in the periodyear ended December 31, 2012 in conformity with accounting principles generally accepted in the United States of America.2015. These financial statements are the responsibility of the Company’sCompany's management. Our responsibility is to express an opinion on these consolidated financial statements based on our audits.
We conducted our audits of these financial statements in accordance with the standards of the Public Company Accounting Oversight Board (United States). Those standards require that we plan and perform the auditsaudit to obtain reasonable assurance about whether the financial statements are free of material misstatement. We were not engaged to perform an audit of the Company´s internal control over financial reporting. Our audits included consideration of internal control over financial reporting as a basis of designing audit procedures that are appropriate in the circumstances, but not for the purpose of expressing an opinion on the effectiveness of the Company´s internal control over financial reporting. Accordingly, we express no such opinion. An audit also includes examining, on a test basis, evidence supporting the amounts and disclosures in the financial statements. An audit also includes assessing the accounting principles used and significant estimates made by management, as well as evaluating the overall financial statement presentation. We believe that our audits provide a reasonable basis for our opinion.
Report of Independent Registered Public Accounting Firm (continued)
In our opinion, the consolidated financial statements referred to above present fairly, in all material respects, the consolidated financial position of Minera Yanacocha S.R.L. and subsidiary as of December 31, 2015, and the results of their operations and their cash flows for the year then ended, in accordance with International Financial Reporting Standards as issued by the International Accounting Standards Board (“IASB”) which differ in certain respects from the accounting principles generally accepted in the United States of America (see Note 25 to the financial statements).
Lima, Peru,
February 25, 2016
Countersigned by:
Paredes, Zaldívar, Burga & Asociados S. Civil de R.L.
| /s/ Victor Burga | |
| Víctor Burga | |
| C.P.C.C. Register No.14859 | |
PRICEWATERHOUSECOOPERS
REPORT OF INDEPENDENT REGISTERED PUBLIC ACCOUNTING FIRM
March 30, 2015
To the shareholders of
Minera Yanacocha S.R.L.
In our opinion, the accompanying balance sheet and the related income statements, statements of changes in shareholders’ equity and cash flows statements, present fairly, in all material respects, the financial position of Minera Yanacocha S.R.L at December 31, 2014, and the results of its operations and its cash flows for catch of the two years in the period ended December 31, 2014 in conformity with International Financial Reporting Standards.
These financial statements are the responsibility of the Company’s management. Our responsibility is to express an opinion on these financial statements based on our audits. We conducted our audits of these financial statements in accordance with the International Audit Standards approved for application in Peru by the Board of Deans of the Institute of Chartered Accountants of Peru. Those standards require that we plan and perform the audit to obtain reasonable assurance about whether the financial statements are free of material misstatements. And audit of financial statements includes examining, on a test basis, evidence supporting the amounts and disclosures in the financial statements, assessing the accounting principles used and significant estimates made by management,managements, and evaluating the overall financial statementstatements presentation. We believe that our audits provide a reasonable basis for our opinion.
/s/ Dongo-Soria Gaveglio, Aparicio y Asociados
Countersigned by
/s/ Fernando Gaveglio | (partner) |
/s/ Fernando Gaveglio
Fernando Gaveglio
Peruvian Certified Public Accountant
Registration No.01-19847No. 01-019847
CONSOLIDATED STATEMENTS OF INCOME AND COMPREHENSIVE INCOME
| | | Years Ended December 31, | |
| | | 2012 | | | 2011 | | | 2010 | |
| | | (dollars in thousands) | |
| | | | | | | | | | |
| Revenues | | $ | 2,201,815 | | | $ | 2,002,602 | | | $ | 1,778,260 | |
| | | | | | | | | | | | | |
| Costs and expenses | | | | | | | | | | | | |
| Costs applicable to sales(1) | | | 694,146 | | | | 738,336 | | | | 655,007 | |
| Amortization | | | 252,900 | | | | 231,520 | | | | 160,424 | |
| Reclamation and remediation | | | 20,090 | | | | 19,135 | | | | 14,632 | |
| Exploration | | | 39,975 | | | | 23,913 | | | | 10,924 | |
| Write-down of long-lived assets | | | 17,577 | | | | 1,864 | | | | 312 | |
| Advanced projects | | | 81,749 | | | | 42,359 | | | | 23,625 | |
| Other expense, net (Note 3) | | | 112,995 | | | | 40,474 | | | | 58,002 | |
| | | | 1,219,432 | | | | 1,097,601 | | | | 922,956 | |
| | | | | | | | | | | | | |
| Other income (expense) | | | | | | | | | | | | |
| Other income, net (Note 4) | | | 6,580 | | | | 30,841 | | | | 7,313 | |
| Interest expense, net of capitalized interest of nil, and $4,404, respectively | | | (566 | ) | | | (417 | ) | | | (3,050 | ) |
| | | | 6,014 | | | | 30,424 | | | | 4,263 | |
| | | | | | | | | | | | | |
| Income before income and mining tax | | | 988,397 | | | | 935,425 | | | | 859,567 | |
| Income and mining tax expense (Note 5) | | | (361,857 | ) | | | (293,038 | ) | | | (269,673 | ) |
| Net income | | | 626,540 | | | | 642,387 | | | | 589,894 | |
| | | | | | | | | | | | | |
| Other comprehensive income (loss) | | | 1,129 | | | | (1,511 | ) | | | 1,149 | |
| Comprehensive income | | $ | 627,669 | | | $ | 640,876 | | | $ | 591,043 | |
| F-102 | (1) | Excludes Amortization and Reclamation and remediation |
The accompanying notes are an integral part of theseconsolidated financial statements.
CONSOLIDATED STATEMENTS OF CASH FLOWS
| | | Years Ended December 31, | |
| | | 2012 | | | 2011 | | | 2010 | |
| | | (dollars in thousands) | |
| Operating activities: | | | | | | | | | | | | |
| Net income | | $ | 626,540 | | | $ | 642,387 | | | $ | 589,894 | |
| Adjustments to reconcile net income to net cash provided from operating activities: | | | | | | | | | | | | |
| Amortization | | | 252,900 | | | | 231,520 | | | | 160,424 | |
| Deferred income tax | | | 4,648 | | | | (2,854 | ) | | | 3,932 | |
| Deferred workers’ profit participation | | | 1,347 | | | | (1,170 | ) | | | 985 | |
| Reclamation and remediation | | | 20,090 | | | | 19,135 | | | | 14,632 | |
| Write-down fixed assets | | | 17,550 | | | | - | | | | - | |
| Other operating adjustments | | | 5,279 | | | | (1,280 | ) | | | 762 | |
| Decrease (increase) in operating assets: | | | | | | | | | | | | |
| Inventories, stockpiles and ore on leach pads | | | (15,481 | ) | | | 21,346 | | | | (111,255 | ) |
| Other assets | | | 19,698 | | | | (53,010 | ) | | | 15,757 | |
| Increase (decrease) in operating liabilities: | | | | | | | | | | | | |
| Accounts payable and other accrued liabilities | | | 11,752 | | | | 61,369 | | | | (48,562 | ) |
| Reclamation liabilities | | | (7,661 | ) | | | (5,882 | ) | | | (5,191 | ) |
| Net cash provided from operations | | | 936,662 | | | | 911,561 | | | | 621,378 | |
| | | | | | | | | | | | | |
| Investing activities: | | | | | | | | | | | | |
| Additions to property, plant and mine development | | | (1,147,757 | ) | | | (994,440 | ) | | | (297,257 | ) |
| Investments in marketable debt securities | | | - | | | | (3,240 | ) | | | - | |
| Proceeds from marketable securities | | | - | | | | 3,588 | | | | - | |
| Proceeds from sale of assets | | | 31,155 | | | | 1,593 | | | | 509 | |
| Net cash used in investing activities | | | (1,116,602 | ) | | | (992,499 | ) | | | (296,748 | ) |
| | | | | | | | | | | | | |
| Financing activities: | | | | | | | | | | | | |
| Repayment of debt | | | - | | | | (1,959 | ) | | | (176,377 | ) |
| Net cash used in financing activities | | | - | | | | (1,959 | ) | | | (176,377 | ) |
| | | | | | | | | | | | | |
| Net change in cash and cash equivalents | | | (179,940 | ) | | | (82,897 | ) | | | 148,253 | |
| Cash and cash equivalents at beginning of the year | | | 797,991 | | | | 880,888 | | | | 732,635 | |
| Cash and cash equivalents at end of the year | | $ | 618,051 | | | $ | 797,991 | | | $ | 880,888 | |
See Note 17 for supplemental cash flow information.
The accompanying notes are an integral part of theseconsolidated financial statements.Minera Yanacocha S.R.L. and Subsidiary
Consolidated statements of financial position
CONSOLIDATED BALANCE SHEETSAs of December 31, 2015 and 2014
| | | At December 31, | |
| | | 2012 | | | 2011 | |
| | | (dollars in thousands) | |
| ASSETS | | | | | | | | |
| Cash and cash equivalents | | $ | 618,051 | | | $ | 797,991 | |
| Accounts receivable (Note 7) | | | 100,539 | | | | 74,608 | |
| Due from related parties (Note 12) | | | 17,205 | | | | 1,224 | |
| Inventories (Note 8) | | | 87,413 | | | | 63,501 | |
| Stockpiles and ore on leach pads (Note 9) | | | 145,546 | | | | 159,713 | |
| Deferred income tax assets (Note 5) | | | 4,378 | | | | 8,746 | |
| Other current assets (Note 10) | | | 22,334 | | | | 21,643 | |
| Current assets | | | 995,466 | | | | 1,127,426 | |
| | | | | | | | | |
| Property, plant and mine development, net (Note 11) | | | 3,120,173 | | | | 2,231,212 | |
| Stockpiles and ore on leach pads (Note 9) | | | 352,086 | | | | 351,942 | |
| Other long-term assets (Note 10) | | | 73,810 | | | | 76,654 | |
| Total assets | | $ | 4,541,535 | | | $ | 3,787,234 | |
| | | | | | | | | |
| LIABILITIES | | | | | | | | |
| | | | | | | | | |
| Accounts payable | | $ | 114,803 | | | $ | 114,407 | |
| Due to related parties (Note 12) | | | 49,399 | | | | 35,316 | |
| Workers’ profit participation (Note 13) | | | 45,225 | | | | 42,349 | |
| Income tax payable | | | 13,862 | | | | 19,765 | |
| Other current liabilities (Note 14) | | | 145,078 | | | | 192,742 | |
| Current liabilities | | | 368,367 | | | | 404,579 | |
| | | | | | | | | |
| Reclamation and remediation liabilities (Note 15) | | | 507,943 | | | | 343,277 | |
| Deferred workers’ profit participation (Note 13) | | | 18,327 | | | | 16,980 | |
| Deferred income tax liabilities (Note 5) | | | 74,042 | | | | 68,910 | |
| Other long-term liabilities | | | 2,166 | | | | 10,467 | |
| Total liabilities | | $ | 970,845 | | | $ | 844,213 | |
| | | | | | | | | |
| Commitments and contingencies (Note 19) | | | | | | | | |
| | | | | | | | | |
| PARTNERS’ EQUITY | | | | | | | | |
| Partners’ contributions | | | 398,216 | | | | 398,216 | |
| Additional contributions | | | 226 | | | | 226 | |
| Accumulated other comprehensive income | | | 2,006 | | | | 877 | |
| Retained earnings | | | 3,170,242 | | | | 2,543,702 | |
| Total partners’ equity (Note 16) | | | 3,570,690 | | | | 2,943,021 | |
| Total liabilities and partners’ equity | | $ | 4,541,535 | | | $ | 3,787,234 | |
The accompanying notes are an integral part of theseconsolidated financial statements.
CONSOLIDATED STATEMENTS OF CHANGES IN PARTNERS’ EQUITY
| | | Partners’
Contributions | | | Additional
Contributions | | | Retained Earnings | | | Accumulated Other
Comprehensive
Income | | | Total Partners’
Equity | |
| | | | | | | | | | | | | | | | |
| Balance at January 1, 2010 | | $ | 398,216 | | | $ | 226 | | | $ | 1,311,421 | | | $ | 1,239 | | | $ | 1,711,102 | |
| Unrealized gain on marketable securities, net of income tax | | | - | | | | - | | | | - | | | | 1,149 | | | | 1,149 | |
| Net income | | | - | | | | - | | | | 589,894 | | | | - | | | | 589,894 | |
| Balance at December 31, 2010 | | $ | 398,216 | | | $ | 226 | | | $ | 1,901,315 | | | $ | 2,388 | | | $ | 2,302,145 | |
| Unrealized gain on marketable securities, net of income tax | | | - | | | | - | | | | - | | | | (1,511 | ) | | | (1,511 | ) |
| Net income | | | - | | | | - | | | | 642,387 | | | | - | | | | 642,387 | |
| Balance at December 31, 2011 | | $ | 398,216 | | | $ | 226 | | | $ | 2,543,702 | | | $ | 877 | | | $ | 2,943,021 | |
| Unrealized gain on marketable securities, net of income tax | | | - | | | | - | | | | - | | | | 1,129 | | | | 1,129 | |
| Net income | | | - | | | | - | | | | 626,540 | | | | - | | | | 626,540 | |
| Balance at December 31, 2012 | | $ | 398,216 | | | $ | 226 | | | $ | 3,170,242 | | | $ | 2,006 | | | $ | 3,570,690 | |
| | | Note | | 2015 | | | 2014 | |
| | | | | US$(000) | | | US$(000) | |
| Current assets | | | | | | | | | | |
| Cash and cash equivalents | | 5 | | | 943,761 | | | | 786,624 | |
| Trade and other receivables, net | | 6 | | | 26,389 | | | | 68,231 | |
| Value added tax credit | | | | | 80,641 | | | | 84,342 | |
| Inventories, net | | 7 | | | 56,764 | | | | 64,903 | |
| Stockpiles and ore on leach pads | | 8 | | | 237,610 | | | | 270,511 | |
| Prepaid expenses | | | | | 517 | | | | 677 | |
| Total current assets | | | | | 1,345,682 | | | | 1,275,288 | |
| | | | | | | | | | | |
| Non-current assets | | | | | | | | | | |
| Available-for-sale financial assets | | 9 | | | 15,803 | | | | 16,884 | |
| Stockpiles and ore on leach pads | | 8 | | | 208,483 | | | | 215,809 | |
| Property, plant and equipment, net | | 10 | | | 1,364,610 | | | | 1,455,329 | |
| Intangible assets, net | | | | | 30,852 | | | | 36,380 | |
| Deferred income tax asset | | 14 | | | - | | | | 483,479 | |
| Total non-current assets | | | | | 1,619,748 | | | | 2,207,881 | |
| Total assets | | | | | 2,965,430 | | | | 3,483,169 | |
| | | | | | | | | | | |
| Current liabilities | | | | | | | | | | |
| Trade and other payables | | 11 | | | 78,250 | | | | 138,819 | |
| Income tax payable | | | | | 12,346 | | | | 35,436 | |
| Current provisions | | 12 | | | 41,961 | | | | 55,585 | |
| Total current liabilities | | | | | 132,557 | | | | 229,840 | |
| | | | | | | | | | | |
| Non-current liabilities | | | | | | | | | | |
| Non-current provisions | | 12 | | | 604,048 | | | | 573,552 | |
| Total liabilities | | | | | 736,605 | | | | 803,392 | |
| | | | | | | | | | | |
| Partners’ equity, net | | | | | | | | | | |
| Partners’ contributions | | 13 | | | 398,216 | | | | 398,216 | |
| Additional paid-in-capital | | | | | 226 | | | | 226 | |
| Retained earnings | | | | | 1,830,383 | | | | 2,281,335 | |
| Total equity | | | | | 2,228,825 | | | | 2,679,777 | |
| Total liabilities and partners’ equity, net | | | | | 2,965,430 | | | | 3,483,169 | |
The accompanying notes are an integral part of these consolidated financial statements.
MINERA YANACOCHA
Minera Yanacocha S.R.L. and Subsidiary
NOTES TO THE CONSOLIDATED FINANCIAL STATEMENTSConsolidated statements of comprehensive income
(dollarsFor the years ended December 31, 2015, 2014 and 2013
| | | Note | | 2015 | | | 2014 | | | 2013 | |
| | | | | US$(000) | | | US$(000) | | | US$(000) | |
| | | | | | | | | | | | |
| Operating income | | | | | | | | | | | | | | |
| Revenue from sales | | 15 | | | 1,031,174 | | | | 1,165,299 | | | | 1,406,825 | |
| Other operating income | | | | | 10,625 | | | | 30,300 | | | | 37,207 | |
| Total gross income | | | | | 1,041,799 | | | | 1,195,599 | | | | 1,444,032 | |
| | | | | | | | | | | | | | | |
| Costs applicable to sales | | 16 | | | (751,736 | ) | | | (920,300 | ) | | | (991,264 | ) |
| Other operating costs | | | | | (2,524 | ) | | | (22,422 | ) | | | (28,672 | ) |
| Total operating costs | | | | | (754,260 | ) | | | (942,722 | ) | | | (1,019,936 | ) |
| Gross profit | | | | | 287,539 | | | | 252,877 | | | | 424,096 | |
| | | | | | | | | | | | | | | |
| Operating expenses | | | | | | | | | | | | | | |
| Operating expenses, net | | 17 | | | (82,846 | ) | | | (77,781 | ) | | | (77,534 | ) |
| Administrative expenses | | 18 | | | (26,325 | ) | | | (38,262 | ) | | | (67,064 | ) |
| Selling expenses | | | | | (3,534 | ) | | | (4,458 | ) | | | (3,740 | ) |
| Impairment loss | | 10 | | | - | | | | (541,141 | ) | | | (1,038,548 | ) |
| | | | | | | | | | | | | | | |
| Operating profit | | | | | 174,834 | | | | (408,765 | ) | | | (762,790 | ) |
| Other income (expenses), net | | | | | | | | | | | | | | |
| Finance income | | | | | 673 | | | | 298 | | | | 720 | |
| Finance costs | | 19 | | | (22,734 | ) | | | (23,504 | ) | | | (18,745 | ) |
| Net gain (loss) from currency exchange difference | | | | | (251 | ) | | | 1,142 | | | | 2,065 | |
| Income (loss) before income tax | | | | | 152,522 | | | | (430,829 | ) | | | (778,750 | ) |
| Income tax benefit (expense) | | 14(c) | | | (602,717 | ) | | | 30,491 | | | | 203,471 | |
| | | | | | | | | | | | | | | |
| Loss for the year | | | | | (450,195 | ) | | | (400,338 | ) | | | (575,279 | ) |
| | | | | | | | | | | | | | | |
| Comprehensive income (loss): | | | | | | | | | | | | | | |
| Loss for the year | | | | | (450,195 | ) | | | (400,338 | ) | | | (575,279 | ) |
| Other comprehensive income (loss) to be reclassified as profit or loss in subsequent periods: | | | | | | | | | | | | | | |
| Changes in the fair value of available-for-sale financial asset, net of tax effect | | 9 | | | (757 | ) | | | 65 | | | | (226 | ) |
| | | | | | | | | | | | | | | |
| Total comprehensive loss for the year | | | | | (450,952 | ) | | | (400,273 | ) | | | (575,505 | ) |
The accompanying notes are an integral part of these consolidated financial statements.
Minera Yanacocha S.R.L. and Subsidiary
Consolidated statements of changes in thousands unless otherwise stated)equity, net
For the years ended December 31, 2015, 2014 and 2013
| | | Capital
stock | | | Additional
Paid-in-capital | | | Retained
earnings | | | Total | |
| | | US$(000) | | | US$(000) | | | US$(000) | | | US$(000) | |
| | | | | | | | | | | | | |
| As of January 1, 2013 | | | 398,216 | | | | 226 | | | | 3,257,113 | | | | 3,655,555 | |
| Loss for the year | | | - | | | | - | | | | (575,279 | ) | | | (575,279 | ) |
| Other comprehensive loss for the year | | | - | | | | - | | | | (226 | ) | | | (226 | ) |
| Total comprehensive loss | | | - | | | | - | | | | (575,505 | ) | | | (575,505 | ) |
| | | | | | | | | | | | | | | | | |
| As of December 31, 2013 | | | 398,216 | | | | 226 | | | | 2,681,608 | | | | 3,080,050 | |
| Loss for the year | | | - | | | | - | | | | (400,338 | ) | | | (400,338 | ) |
| Other comprehensive loss for the year | | | - | | | | - | | | | 65 | | | | 65 | |
| Total comprehensive loss | | | - | | | | - | | | | (400,273 | ) | | | (400,273 | ) |
| | | | | | | | | | | | | | | | | |
| As of December 31,2014 | | | 398,216 | | | | 226 | | | | 2,281,335 | | | | 2,679,777 | |
| Loss for the year | | | - | | | | - | | | | (450,195 | ) | | | (450,195 | ) |
| Other comprehensive loss for the year | | | - | | | | - | | | | (757 | ) | | | (757 | ) |
| Total comprehensive loss | | | - | | | | - | | | | (450,952 | ) | | | (450,952 | ) |
| | | | | | | | | | | | | | | | | |
| As of December 31, 2015 | | | 398,216 | | | | 226 | | | | 1,830,383 | | | | 2,228,825 | |
The accompanying notes are an integral part of these consolidated financial statements.
Minera Yanacocha S.R.L. and Subsidiary
Consolidated statement of cash flows
For the years ended December 31, 2015, 2014 and 2013
| | | 2015 | | | 2014 | | | 2013 | |
| | | US$(000) | | | US$(000) | | | US$(000) | |
| Cash flow from operating activities | | | | | | | | | | | | |
| Loss for the year | | | (450,195 | ) | | | (400,338 | ) | | | (575,279 | ) |
| Adjustments to reconcile profit after income tax to net cash flows from operating activities: | | | | | | | | | | | | |
| Impairment loss on assets | | | - | | | | 541,141 | | | | 1,038,548 | |
| Depreciation and amortization | | | 223,142 | | | | 360,334 | | | | 349,760 | |
| Deferred income tax | | | 483,804 | | | | (168,761 | ) | | | (430,624 | ) |
| Unwinding of discount of the provision for reclamation | | | 22,075 | | | | 22,914 | | | | 18,113 | |
| Write-off of fixed assets | | | 2,411 | | | | 3,520 | | | | 584 | |
| Loss (gain) for fixed asset sales | | | 508 | | | | (1,226 | ) | | | (22,526 | ) |
| Write-down of ore on leach pads to realizable value | | | 64,497 | | | | 95,859 | | | | 146,051 | |
| Allowance for obsolescence of materials and supplies | | | 1,049 | | | | (736 | ) | | | 2,271 | |
| Working capital adjustments: | | | | | | | | | | | | |
| Net (increase) decrease in operating assets: | | | | | | | | | | | | |
| Trade and other receivables | | | 41,842 | | | | 28,382 | | | | 20,913 | |
| Value added tax credit | | | 3,701 | | | | 36,606 | | | | 23,762 | |
| Inventories and Stockpiles and ore on leach pads | | | (17,180 | ) | | | (64,855 | ) | | | (121,868 | ) |
| Prepaid expenses | | | 160 | | | | 1,650 | | | | 117 | |
| Available for sale financial assets | | | 1,081 | | | | (93 | ) | | | 336 | |
| Net (increase) decrease in operating liabilities: | | | | | | | | | | | | |
| Trade and other payables | | | (60,569 | ) | | | 6,910 | | | | (31,189 | ) |
| Income tax payable | | | (23,090 | ) | | | (29,264 | ) | | | 13,862 | |
| Provisions | | | (7,779 | ) | | | (46,435 | ) | | | (112,172 | ) |
| Reclamation liabilities paid | | | (11,007 | ) | | | (10,419 | ) | | | (4,387 | ) |
| Net cash and cash equivalents provided by operating activities | | | 274,450 | | | | 375,189 | | | | 316,272 | |
| Cash flow from investing activities | | | | | | | | | | | | |
| Purchase of property, plant and equipment | | | (118,429 | ) | | | (216,181 | ) | | | (393,130 | ) |
| Proceeds from sale of property, plant and equipment | | | 1,116 | | | | 40,651 | | | | 45,772 | |
| Net cash and cash equivalents used in investing activities | | | (117,313 | ) | | | (175,530 | ) | | | (347,358 | ) |
| Net increase (decrease) in cash and cash equivalents | | | 157,137 | | | | 199,659 | | | | (31,086 | ) |
| Cash and cash equivalents at beginning of year | | | 786,624 | | | | 586,965 | | | | 618,051 | |
| Cash and cash equivalents at end of year | | | 943,761 | | | | 786,624 | | | | 586,965 | |
| | | | | | | | | | | | | |
| Transactions with no effects in cash flows: | | | | | | | | | | | | |
| Addition of asset retirement and mine closure | | | 10,434 | | | | 64,520 | | | | 44,604 | |
The accompanying notes are an integral part of these consolidated financial statements.
Minera Yanacocha S.R.L. and Subsidiary
Notes to the consolidated financial statements
For the years 2015, 2014 and 2013
| 1. | BUSINESS ACTIVITIESIdentification and business activities of the Company |
Minera Yanacocha S.R.L. (the “Company”), formerly Minera Yanacocha S.A.hereinafter “the Company”, was incorporated in Peru on January 14, 1992 and commenced operations in 1993. The Company is engaged in the production of gold and exploration and development of gold and copper under the mining concessions it owns or that are owned by S.M.R.L. Chaupiloma Dos de Cajamarca (“Chaupiloma”("Chaupiloma").
The Company is 51.35% owned 51.35% by Newmont Second Capital Corporation, a 100% indirectly owned subsidiary of Newmont Mining Corporation (“Newmont”)("Newmont", the ultimate Parent company), 43.65% owned by Compañíaia Minera Condesa S.A., which is 100% owned by Compañíaia de Minas Buenaventura S.A.A. (“Buenaventura”) and 5% owned by the International Finance Corporation.
The majority Partners of the Company (or their affiliates) also own the majority interest in Chaupiloma. In accordance with a mining lease, amended and effective on January 1, 1994, the Company pays Chaupiloma a 3% royalty based on quarterly production soldsoId at current market prices, after deducting refinery and transportation costs. The royalty agreement expiredexpires in 2012, however this was extended until 2032.
The Company isCompany's operations are located innear Cajamarca, province of Peru and currently has activeinclude the following open pit mines asmines: Chaquicocha, Maqui Maqui, Cerro Yanacocha, La Quinua (which includesComplex (La Quinua, El Tapado, El Tapado Oeste), Chaquicocha, Maqui Maqui, CarachugoCerro Negro Este, Wester Oxide pits (La Quinua Sur and Cerro Negro.Negro Oeste), Eastern Oxide pits (Quecher Norte and Marleny) and Carachugo Alto. The Company has four leach pads, three processing facilities, and one mill. Gold-bearing ores are transported to one of four leach pads for gold recovery using conventional heap-leaching or milling, followed by Merrill - Crowe zinc precipitation and smelting where a final doré product is poured. The doré is then shipped offsite for refining and is sold on the worldwide gold markets.
Gold mining requires the use of specialized facilities and technology. The Company relies heavily on such facilities and technology to maintain production levels. Also, the cash flowflows and profitability of the Company’sCompany's operations are significantly affected by the market price of gold. Gold prices can fluctuate widely and are affected by numerous factors beyond the Company’sCompany's control. During 2012, 20112015, 2014 and 2010,2013, the Company produced 1.350.92 million, 1.290.97 million and 1.461.02 million ounces of gold, respectively.
Conga project
The Conga projectProject consists of two gold-copper porphyry deposits located northeast of the Yanacocha operating area in the provinces of Celendin, Cajamarca and Hualgayoc. The project has provenThere is no exploration and/or development of new reserves as development of the project's development and probable reserves of 12.6 million ounces (unaudited) of contained gold and 3.3 billion pounds (unaudited) of contained copper at December 31, 2012.reserve balances reported for Conga in 2014 were reclassified to mineralized material in 2015.
MINERA YANACOCHA S.R.L.Notes to the consolidated financial statements (continued)
NOTES TO THE CONSOLIDATED FINANCIAL STATEMENTS
(dollars in thousands unless otherwise stated)
ConstructionAs a result of local political and community protests, construction and development activities on ourat the Conga project were largely suspended onin November 30, 2011 at the request of Peru’s central government following increasing protests in Cajamarca by anti-mining activists led by the regional president. At the request2011. The results of the Peruvian central government,Central Government’s initiated Environmental Impact Assessment (“EIA”) independent review were reported on April 20, 2012. The review indicated the environmental impactproject’s EIA met Peruvian and International Standards. The review made recommendations to provide additional water capacity and social funds, which Yanacocha has largely accepted. Yanacocha announced the decision to move the project forward on a “water-first” approach on June 22, 2012. In the first half of 2014, a Conga Restart Study was completed to identify and test alternatives to advancing development of the project. Following this assessment, prepared in connectiona new plan was developed to reduce spending to focus on only the most critical work – protecting people and assets, engaging with communities, and maintaining existing project infrastructure – while maintaining optionality. Newmont will not proceed with the project, which was previously approved by the central government in October 2010, was reviewed by independent experts, in an effort to resolve allegations around the environmental viability of Conga. This review concluded that the environmental impact assessment complied with international standards and provided some recommendations to improve water management. Yanacocha is currently focusing on the construction of water reservoirs prior to the development of other project facilities. Management is committed to thefull development of Conga however, developmentwithout social acceptance, solid project economics and potentially another partner to help defray costs and risk; it is currently difficult to predict when or whether such events may occur. Under the current social and political environment, the Company does not anticipate being able to develop Conga for the foreseeable future. The continued delay and evaluation of Conga is contingent upon generating acceptable project returns and getting local community and government support.
In the second quarter of 2011, Presidential and Congressional elections resultedother alternatives may result in a change in government in Peru. The new administration supported mining as a driver for continued growth and future developmentpotential accounting impairment or further reclassification of Peru in 2012. However, we are unable to predict whether the Central government will continue to take similar positions in the future. The regional government actively opposed the Conga project in 2012 and continues to reject the viability of its development. We are unable to predict the positions that will be taken in the future and whether such positions or changes in law will affect Yanacocha or Conga. Such changes may include increased labor regulations, environmental and other regulatory requirements, and additional taxes and royalties, as well as future protests, community demands and road blockages. For example, during the third quarter of 2011, the new government enacted four new tax laws. The Company cannot predict future positions of either the Central or regional government on foreign investment, mining concessions, land tenure or other regulation. Any change in government positions or laws on these issues could adversely affect the assets and operations of Yanacocha or Conga, which could have a material adverse effect on our results of operations and financial position. Additionally, any inability to continue to develop the Conga project or operate at Yanacocha could have an adverse impact on our growth if we are not able to replace its expected production.
Total proven and probable reserves (unaudited) contained in active open pits, other pits to be developed, stockpiles, ore in process on leach pads and the Conga project are approximately 18.5 million ounces of contained gold, 3.3 billion pounds of contained copper and 37.1 million ounces of silver at December 31, 2012.
MINERA YANACOCHA S.R.L.
NOTES TO THE CONSOLIDATED FINANCIAL STATEMENTS
(dollars in thousands unless otherwise stated)Mineralized Material.
| 2.(c) | SIGNIFICANT ACCOUNTING POLICIESApproval of consolidated financial statements - |
Principles of Consolidation
The Consolidated Financial Statements include the accounts of Minera Yanacocha S.R.L and the San José Reservoir Trust (“Trust”). In November 2008, the Company funded the Trust to ensure continuous operation of the San José Reservoir after 2018. The Company transferred $13,000 to the Trust in 2008. No withdrawals are allowed until 2018 and the Company is committed to a $23,000 fundconsolidated financial statements as of such date. This Trust is irrevocableDecember 31, 2015 were approved by the Company’s Management on February 25, 2016 and, is a separate legal entity. The grantor is the Company, the trustee is the FiduPerú S.A. Sociedad Fiduciaria and the beneficiary is the Company; therefore, the Company consolidates the Trust in its Consolidated Financial Statements.
Use of Estimatesopinion, will be approved without changes at the Partners’ Meeting to be held within the terms established by Law.
The Company’s Consolidated Financial Statementsconsolidated financial statements as of December 31, 2014 and 2013 were issued with the approval of the Partners’ Meeting held on March 26, 2015.
| 2. | Basis for preparation, consolidation and accounting policies |
| 2.1. | Basis of preparation - |
The consolidated financial statements of the Company have been prepared in accordance with accounting principles generally accepted inInternational Financial Reporting Standards (“IFRS”) issued by the United States of America.International Accounting Standard Board (“ASB”) and interpretations issued by the IFRS Interpretations Committee (“IFRIC”). The preparation of the Company’s Consolidated Financial Statements requires the Company to make estimates and assumptions that affect the reported amounts of assets and liabilities and the related disclosure of contingent assets and liabilities at the date of the Consolidated Financial Statements and the reported amounts of revenues and expenses during the reporting period. The more significant areas requiring the use of management estimates and assumptions relate to mineral reserves that are the basis for future cash flow estimates utilized in impairment calculations and units-of-production amortization calculations; environmental, reclamation and closure obligations; estimates of recoverable gold and other minerals in stockpile and leach pad inventories; write-downs of inventory, ore on leach pads and stockpiles to net realizable value; employee benefit liabilities; valuation allowances for deferred tax assets; workers’ profit participation; reserves for contingencies and litigation; and the fair value and accounting treatment ofconsolidated financial instruments. The Company bases its estimates on historical experience and on various other assumptions that are believed to be reasonablestatements have been prepared under the circumstances. Accordingly, actual results may differ significantly from these estimates under different assumptions or conditions.
Currencyhistorical cost basis, except for available-for-sale financial assets which are measured at their fair value.
The Consolidated Financial Statementsconsolidated financial statements are presented in U.S. dollars and all values are rounded to the nearest thousands, except when otherwise indicated.
The preparation of consolidated financial statements requires that Management use judgments, estimates and assumptions, as detailed in Note 3.
These consolidated financial statements provide comparative information in respect of prior periods.
Notes to the consolidated financial statements (continued)
| 2.2. | Basis of consolidation - |
The consolidated financial statements comprise the financial statements of the Company and its subsidiary (San Jose Reservoir Trust, a separate legal entity created to ensure the continuity of the Company’s operations in the San Jose Reservoir after 2018).
Control is achieved when the Company is exposed, or has rights, to variable returns from its involvement with the investee and has the ability to affect those returns through its power over the investee. Specifically, the Company controls an investee if, and only if, the Company has:
| - | Power over the investee (i.e., existing rights that give it the current ability to direct the relevant activities of the investee); |
| - | Exposure, or rights, to variable returns from its involvement with the investee; |
| - | The ability to use its power over the investee to affect its returns. |
Generally, there is a presumption that a majority of voting rights result in control. To support this presumption and when the Company has less than a majority of the voting or similar rights of an investee, the Company considers all relevant facts and circumstances in assessing whether it has power over an investee, including:
| - | The contractual arrangement with the other vote holders of the investee. |
| - | Rights arising from other contractual arrangements. |
| - | The Company’s voting rights and potential voting rights or a combination of rights. |
The Company re-assesses whether or not it controls an investee if facts and circumstances indicate that there are changes to one or more of the three elements of control. Consolidation of a subsidiary begins when the Company obtains control over the subsidiary and ceases when the Company loses control of the subsidiary. Assets, liabilities, income and expenses of a subsidiary acquired or disposed of during the year are included in the consolidated financial statements from the date the Company gains control until the date the Company ceases to control the subsidiary.
When necessary, adjustments are made to the financial statements of the subsidiary to bring its accounting policies into line with the Company’s accounting policies.
All intra-group assets and liabilities, equity, income, expenses and cash flows are eliminated in full on consolidation.
A change in the ownership interest of a subsidiary, without a loss of control, is accounted for as an equity transaction.
Notes to the consolidated financial statements (continued)
| 2.3. | Changes in accounting policies and disclosures - |
Certain standards and amendments are effective for annual periods beginning on or after January 1, 2015. However, they do not impact the annual consolidated financial statements of the Company and, hence, have not been disclosed. The Company has not early adopted any standard, interpretation or amendment that has been issued but is not yet effective.
| 2.4. | Summary of significant accounting policies and practices - |
The consolidated financial statements are stated in U.S. dollars, the Company’sCompany's functional currency, as most of its transactions are traded, collected and paid in such currency. Transactions in other currencies are recorded in U.S. dollars based on exchange rates prevailing at the time of such transactions. Monetary assets and liabilities denominated in other currencies are translated into the U.S. dollar at exchange rates prevailing at the balance sheetstatements of financial position dates, and any resulting gains or losses are reflected in current earnings.
| (b) | Financial instruments - Initial recognition and subsequent measurement - |
CashA financial instrument is any contract that gives rise to a financial asset of one entity and Cash Equivalentsa financial liability or equity instrument of another entity.
Initial recognition and measurement-
Financial assets are classified, at initial recognition, as financial assets at fair value through profit or loss, loans and receivables, held-to-maturity investments, available-for-sale financial assets, or derivatives designated as hedging instruments in an effective hedge, as appropriate. All financial assets are recognized initially at fair value plus, in the case of financial assets not recorded at fair value through profit or loss, transaction costs that are attributable to the acquisition of the financial asset.
Subsequent measurement -
For purposes of subsequent measurement, financial assets are classified in four categories:
| - | Financial assets at fair value through profit or loss. |
| - | Held-to-maturity investments. |
| - | Available-for-sale financial investments. |
Financial assets at fair value through profit or loss-
Financial assets at fair value through profit or loss include financial assets held for trading and financial assets designated upon initial recognition at fair value through profit or loss. Financial assets are classified as held for trading if they are acquired for the purpose of selling or repurchasing in the near term. Derivatives, including separated embedded derivatives, are also classified as held for trading unless they are designated as effective hedging instruments as defined by IAS 39.
Notes to the consolidated financial statements(continued)
Financial assets at fair value through profit or loss are carried in the consolidated statements of financial position at fair value with net changes in fair value presented as finance costs (negative changes) or finance revenue (positive changes) in the consolidated statements of comprehensive income.
Derivatives embedded in host contracts are accounted for as separate derivatives and recorded at fair value if their economic characteristics and risks are not closely related to those of the host contracts and the host contracts are not held for trading or designated at fair value though profit or loss. These embedded derivatives are measured at fair value, with changes in fair value recognized in profit or loss.
Loans and receivables-
Loans and receivables are non-derivative financial assets with fixed or determinable payments that are not quoted in an active market. After initial measurement, such financial assets are subsequently measured at amortized cost using the effective interest rate method, less impairment. The losses arising from impairment are recognized in the consolidated statements of profit or loss.
This category generally applies to trade and other receivables, net.
Held-to-maturity investments -
Non-derivative financial assets with fixed or determinable payments and fixed maturities are classified as held to maturity when the Company has the positive intention and ability to hold them to maturity. The Company did not have any held-to-maturity investments as of December 31, 2015 and 2014.
Available-for-sale financial assets -
The available-for-sale financial assets include equity investments and debt securities. Equity investments classified as available-for-sale are those that are neither classified as held for trading nor designated at fair value through profit or loss. Debt securities in this category are those that are intended to be held for an indefinite period of time and may be sold in response to needs for liquidity, or in response to changes in the market conditions (Note 9).
Derecognition-
A financial asset (or, where applicable a part of a financial asset or part of a group of similar financial assets) is primarily derecognized when:
| - | The rights to receive cash flows from the asset have expired. |
| - | The Company has transferred its rights to receive cash flows from the asset or has assumed an obligation to pay the received cash flows in full without material delay to a third party under a pass-through arrangement; and either (a) the Company has transferred substantially all the risks and rewards of the asset or, (b) the Company has neither transferred nor retained substantially all the risks and rewards of the asset, but has transferred control of the asset. |
When the Company has transferred its rights to receive cash flows from an asset, or has entered into a pass-through arrangement, it evaluates if and to what extent, it has retained the risk and rewards of ownership. When it has neither transferred nor retained substantially all of the risks and rewards of the asset, nor transferred control of the asset, the Company continues to recognize the transferred asset to the extent of the Company’s continuing involvement. In that case, the Company also recognizes an associated liability. The transferred asset and the associated liability are measured on a basis that reflects the rights and obligations that the Company has retained.
Notes to the consolidated financial statements (continued)
Impairment of financial assets -
The Company assesses, at each reporting date, whether there is objective evidence that a financial asset or group of financial assets is impaired. An impairment exists if one or more events that has occurred since the initial recognition of the asset (an incurred "loss event") has an impact on the estimated future cash flows of the financial asset or the group of financial assets that can be reliably estimated.
Evidence of impairment may include indications that the debtors or a group of debtors is experiencing significant financial difficulty, default or delinquency in interest or principal payments, the probability that they will enter bankruptcy or other financial reorganization and observable data indicating that there is a measurable decrease in the estimated future cash flows, such as changes in economic conditions that correlate with defaults.
For financial assets carried at amortized cost, the Company first assesses whether impairment exists for financial assets that are individually significant, or collectively for financial assets that are individually insignificant.
The amount of any impairment loss is measured as the difference between the asset’s carrying amount and the present value of estimated future cash flows. The present value of the estimated future cash flows is discounted at the financial asset’s original effective interest rate.
The carrying amount of the asset is reduced through the use of an allowance account and the loss is recognized in the consolidated statements of comprehensive income. Interest income (recorded as revenue in the statements of comprehensive income) continues to be accrued on the reduced carrying amount and is accrued using the interest rate used to discount the future cash flows for the purpose of measuring the impairment loss. Loans, together with the associated allowance, are written off when there is no realistic prospect of a future recovery and all collateral has been realized or has been transferred to the Company. If, in a subsequent year, the amount of the estimated impairment loss increases or decreases due to an event occurring after the impairment was recognized, the previously recognized impairment loss is increased or reduced by adjusting the allowance account. If a write-off is later recovered, the recovery is credited to finance costs in the consolidated statements of comprehensive income.
| (ii) | Financial liabilities – |
Initial recognition and measurement -
Financial liabilities are classified, at initial recognition, as financial liabilities at fair value through profit or loss, accounts payable, financial obligations, or as derivatives designated as hedging instruments in an effective hedge, as appropriate.
All financial liabilities are recognized initially at fair value and, in the case of interest-bearing loans and borrowings and payables, net of directly attributable transaction costs.
Notes to the consolidated financial statements (continued)
The Company’s financial liabilities include trade and other payables.
Subsequent measurement -
The measurement of financial liabilities depends on their classification. Trade and other payables are subsequently measured at amortized cost.
Derecognition-
A financial liability is derecognized when the obligation under the liability is discharged, cancelled or expires.
When an existing financial liability is replaced by another from the same lender on substantially different terms, or the terms of an existing liability are substantially modified, such an exchange or modification is treated as the derecognition of the original liability and the recognition of a new liability. The difference in the respective carrying amounts is recognized in the consolidated statements of comprehensive income.
| (iii) | Offsetting of financial instruments - |
Financial assets and financial liabilities are offset and the net amount is reported in the consolidated statements of financial position if there is a currently enforceable legal right to offset the recognized amounts and there is an intention to settle on a net basis, to realize the assets and settle the liabilities simultaneously.
| (c) | Cash and cash equivalents - |
Cash and cash equivalents consist of allinclude cash balancesin hand, deposits held at call with banks and other short-term highly liquid investments with an original maturitymaturities of three months or less. Because of the short maturity of these balances, the carrying amounts approximate their fair value. Restricted cash is excluded from cash and cash equivalents and is included in other current assets or long-term assets depending on restrictions.
MINERA YANACOCHA S.R.L.
Notes to the consolidated financial statements (continued)
| (d) | Stockpiles, ore on leach pads and inventories - |
NOTES TO THE CONSOLIDATED FINANCIAL STATEMENTS
(dollars in thousands unless otherwise stated)
Investments
Management determines the appropriate classification of its investments in equity securities at the time of purchase and reevaluates such determinations at each reporting date. The Company accounts for its marketable security investments as available for sale securities in accordance withFASB Accounting Standards Codification (“ASC”) guidance on accounting for certain investments in debt and equity securities. The Company periodically evaluates whether declines in fair values of its investments below the Company’s carrying value are other - than - temporary in accordance with ASC guidance. The Company’s policy is to generally treat a decline in the investment’s quoted market value that has lasted continuously for more than six months as other - than - temporary decline in value. The Company also monitors its investments for events or changes in circumstances that have occurred that may have a significant adverse effect on the fair value of the investment and evaluates qualitative and quantitative factors regarding the severity and duration of the unrealized loss and the Company’s ability to hold the investment until a forecasted recovery occurs to determine if the decline in value of an investment is other - than - temporary. Declines in fair value below the Company’s carrying value deemed to be other - than - temporary are charged to earnings.
Stockpiles, Ore on Leach Pads and Inventories
As described below, costsCosts that are incurred in or benefit the productive process are accumulated as stockpiles, ore on leach pads and inventories. Stockpiles, ore on leach pads and inventories are carried at the lower of average cost or net realizable value. Net realizable value represents the estimated future sales price of the product based on current and long - termlong-term metals prices, less the estimated costs to complete production and bring the product to sale. Write - downsWrite-downs of stockpiles, ore on leach pads and inventories to net realizable value are reported as a component ofCosts costs applicable to sales.sales. The current portion of stockpiles, ore on leach pads and inventories is determined based on the expected amounts to be processed within the next twelve months. Stockpiles, ore on leach pads and inventories not expected to be processed within the next twelve months are classified as long - term.non-current. The major classifications are as follows:
Stockpiles represent ore that has been extracted from the mine and is available for further processing. Stockpiles are measured by estimating the number of tons added and removed from the stockpile, the number of contained ounces (based on assay data) and the estimated metallurgical recovery rates (based on the expected processing method). Stockpile ore tonnages are verified by periodic surveys. Costs are allocated to stockpiles based on relative values of material stockpiled and processed using current mining costs incurred up to the point of stockpiling the ore, including applicable overhead and depreciation and amortization relating to mining operations, and removed at each stockpile's average cost per recoverable unit as material is processed.
The recovery of gold from certain gold oxide ores is achieved through the heap leaching process. Under this method, oxide ore is placed on leach pads where it is treated with a chemical solution, which dissolves the gold contained in the ore. The resulting gold - bearinggold-bearing solution is furtherlater processed in a plant where the gold is recovered. Costs are added to ore on leach pads based on current mining costs, including applicable overhead and depreciation and amortization relating to mining operations. Costs are removed from ore on leach pads as ounces are recovered based on the average cost per estimated recoverable ounce of gold on the leach pad.
MINERA YANACOCHA S.R.L.
NOTES TO THE CONSOLIDATED FINANCIAL STATEMENTS
(dollars in thousands unless otherwise stated)
The estimates of recoverable gold on the leach pads are calculated from the quantities of ore placed on the pads (measured tons added to the leach pads), the grade of ore placed on the leach pads (based on assay data) and a recovery percentage (based on ore type). In general, the leach pads recover approximatelybetween 50% toand 95% of the ultimate recoverable ounces in the first year of leaching, declining each year thereafter until the leaching process is complete.
Notes to the consolidated financial statements (continued)
Although the quantities of recoverable gold placed on the leach pads are reconciled by comparing the grades of ore placed on the pads to the quantities of gold actually recovered (metallurgical balancing), the nature of the leaching process inherently limits the ability to precisely monitor inventory levels. As a result, the metallurgical balancing process is constantly monitored and estimates are refined based on actual results over time. Historically, the Company’sCompany's operating results have not been materially impacted by variations between the estimated and actual recoverable quantities of gold on its leach pads. Variations between actual and estimated quantities resulting from changes in assumptions and estimates that do not result in write - downswrite-downs to net realizable value are accounted for on a prospective basis.
| (iii) | In-processinventory - |
In-process Inventory
In - process inventories represent materials that are currently in the process of being converted to a saleable product. The conversionConversion processes vary depending on the nature of the ore and the specific processing facility, and include mill in-circuit and leach in-circuit. In - processIn-process material is measured based on assays of the material fed into the process and the projected recoveries of the respective plants. In - processIn-process inventories are valued at the average cost of the material fed into the process attributable to the source material coming from the mines, stockpiles and/or leach pads plus the in -in- process conversion costs, including applicable amortization relating to the process facilities incurred to that point in the process.
Precious Metals Inventory
| (iv) | Precious metals inventory - |
Precious metals include gold doreDoré and/or gold bullion. Precious metals that result from the Company’sCompany's mining, processing and refining activities are valued at the average cost of the respective in - processin-process inventories incurred prior to the refining process, plus applicable refining costs.
Concentrate Inventory
Concentrate inventories represent silver, gold and copper concentrate available for shipment. The Company values concentrate inventory at the average cost, including an allocable portion of support costs and amortization. Costs are added and removed to the concentrate inventory based on tons of concentrate and are valued at the lower of average cost or net realizable value.
F-119 | (v) | Materials and supplies - |
MINERA YANACOCHA S.R.L.
NOTES TO THE CONSOLIDATED FINANCIAL STATEMENTS
(dollars in thousands unless otherwise stated)
Materials and Supplies
Materials and supplies are valued at the lower of average cost or net realizablereplacement value. Cost includes applicable taxes and freight.
| (e) | Property, plant and equipment - |
Property, PlantThe cost of an element of property, plant and Mine Developmentequipment comprises the following: the acquisition price or manufacturing cost, including non-reimbursable customs and taxes and any cost necessary to place the asset in operating condition, as anticipated by Management; the initial estimate of the rehabilitation obligation and; in the case of qualified assets, the financing costs.
The purchase price or construction cost corresponds to the total amount paid and fair value of any other consideration provided to acquire the asset. Subsequent costs attributable to property, plant and equipment are capitalized only when it is probable that future economic benefits associated with the item will flow to the Company and the cost of the item can be measured reliably, otherwise the cost is charged to production or expense.
Maintenance and repair expenses are charged to the production cost or expense, as necessary, in the period when incurred.
Notes to the consolidated financial statements (continued)
Expenses incurred to replace a component of an item or element of property, plant and equipment are capitalized separately, writing-off the carrying amount of the component being replaced. In the event the component replaced has not been considered as a separate component of the asset item, the replacement value of the new component is used to estimate the carrying amount of the assets being replaced.
Assets in the construction stage are capitalized as separate components. At their completion, the cost is transferred to the appropriate category. Work in progress is not depreciated.
FacilitiesDepreciation
Land is not depreciated. Other than land, depreciation of property, plant and Equipmentequipment is calculated using the straight-line method to allocate their cost less their residual value over their estimated useful lives and in the case of assets assigned to the production process of Yanacocha, under the lower of that determined under the units of production method or the useful life of the mine, as follows:
| Years |
| |
| Land improvements | 25 years |
| Buildings | Between 5 and 25 years |
| Plant and equipment | Between 3 and 15 years |
| Vehicles | Between 3 and 5 years |
| Furniture and fittings | Between 3 and 10 years |
| Other equipment | Between 3 and 10 years |
| Computer equipment | Between 3 and 8 years |
| Assets retirement cost | Useful life of the mine and/or process facilities |
The assets' useful lives and residual values are reviewed, and adjusted if appropriate, at each date of the consolidated statement of financial position. Any changes in these estimates are prospectively adjusted.
Disposal of assets
Property, plant and equipment items are written-off at the date they are sold or when no economic benefits are expected from their further use or sale. Gains and losses on disposals of assets are determined by comparing the proceeds with their carrying amounts. These gains or losses are included in the consolidated statements of comprehensive income.
Notes to the consolidated financial statements (continued)
Mineral interests include acquired interests in production, development and exploration stage properties. The mineral interests are capitalized at their fair value at the acquisition date.
Expenditures for new facilities or equipment and expenditures that extend the useful lives of existing facilities or equipment are capitalized and recorded at cost. The facilities and equipment are amortized using the straight - line method at rates sufficient to amortize such costs over the estimated productive livesvalue of such facilities. These estimated productive lives do not exceedassets is primarily driven by the related estimated mine lives, which are based onnature and amount of mineralized material believed to be contained in such properties. Production stage mineral interests represent interests in operating properties that contain proven and probable reserves. Development stage mineral interests represent interests in properties under development that contain proven and probable reserves.
Exploration stage mineral interests represent interests in properties that are believed to potentially contain mineralized material consisting of (i) mineralized material such as inferred material within pits; mineralized material with insufficient drill spacing to qualify as proven and probable reserves; and mineralized material in close proximity to proven and probable reserves; (ii) around-mine exploration potential not immediately adjacent to existing reserves and mineralization, but located within the immediate mine area; (iii) other mine-related exploration potential that is not part of current mineralized material and is comprised mainly of material outside of the immediate mine area; (iv) greenfield exploration potential that is not associated with any other production, development or exploration stage property, as described above; or (v) any acquired right to explore or extract a potential mineral deposit.
Mine Development
Exploration costs are capitalized when reserves at the location are declared in the Reserves and Resource information published annually by Newmont in its form 10-K. At this point, exploration costs are capitalized as mine development or as a component of property, plant and equipment, as appropriate.
The Company's mineral rights generally are enforceable regardless of whether proven and probable reserves have been established. The Company has the ability and intent to renew mineral interests where the existing term is not sufficient to recover all identified and valued proven and probable reserves and/or undeveloped mineralized material.
Mineral interests are presented in the caption of property, plant and equipment.
Mine development costs include engineering and metallurgical studies, drilling and other related costs to delineate an ore body, and the removal of overburden to initially expose an ore body at open pit surface mines. Costs incurred before mineralization is classified as proven and probable reserves are expensed and classified asExploration orAdvanced projects, research and development expense. Capitalization of mine development project costs, that meet the definition of an asset, begins once mineralization is classified as proven and probable reserves.
Notes to the consolidated financial statements (continued)
Drilling and related costs are capitalized for an ore body where proven and probable reserves exist; and the activities are directed at obtaining additional information on the ore body or converting non - reserve mineralizationmineralized material to proven and probable reserves. AllAII other drilling and related costs are expensed as incurred. Drilling costs incurred during the production phase for operational ore control are allocated to inventory costs and then included as a component ofCosts applicable to sales.sales.
The cost of removing overburden and waste materials to access the ore body at an open pitopen-pit mine prior to the production phase are referred to as “pre - stripping costs”. Pre - stripping"pre-stripping costs." Pre-stripping costs are capitalized during the development of an open pitopen-pit mine. Where multiple open pits exist at a mining complex utilizing common processing facilities, pre - strippingpre-stripping costs are capitalized at each pit. The removal and production of de minimis saleable materials may occur during development and are recorded asOther income,, net of incremental mining and processing costs.
MINERA YANACOCHA S.R.L.
NOTES TO THE CONSOLIDATED FINANCIAL STATEMENTS
(dollars in thousands unless otherwise stated)
The production phase of an open pit mine commences when saleable minerals, beyond a de minimis amount, are produced. Stripping costs incurred during the production phase of a mine are variable production costs that are included as a component of inventory to be recognized inCosts applicable to sales in the same period as the revenue from the sale of inventory. The Company’s definition of a mine and the mine’s production phase may differ from that of other companies in the mining industry resulting in incomparable allocations of stripping costs to deferred mine development and production costs. Other mining companies may expense pre - stripping costs associated with subsequent pits within a mining complex. Other mining companies may capitalize stripping costs incurred in connection with the production phase. See (h) below.
Mine development costs are amortized using the units - ofunits-of production (“UOP”("UOP") method based on estimated recoverable ounces in proven and probable reserves. To the extent that these costs benefit an entire ore body, they are amortized over the estimated life of the ore body. Costs incurred to access specific ore blocks or areas that only provide benefit over the life of that area are amortized over the estimated life of that specific ore block or area.
Mineral InterestsMine development costs are presented in the caption of Property, plant and equipment, net.
| (h) | Stripping activity asset - |
Mineral interests include acquired interests inThe Company accounts for stripping costs incurred during the production development and exploration stage properties. The mineral interests are capitalized at their fair value at the acquisition date, either as an individual asset purchase or as partphase of a business combination.surface mining in accordance with IFRIC 20 "Stripping costs in the production phase of as surface mine" whereby a stripping asset is recognized if, and only if, all of the following are met:
| - | It is probable that the future economic benefit (improved access to the ore body) associated with the stripping activity will flow to the entity; |
| - | The entity can identify the component of the ore body for which access has been improved; and |
| - | The costs relating to the stripping activity associated with that component can be measured reliably. |
The value of such assets is primarily driven by the nature and amount of mineralized material believed to be contained in such properties. Production stage mineral interests represent interests in operating properties that contain proven and probable reserves. Development stage mineral interests represent interests in properties under development that contain proven and probable reserves. Exploration stage mineral interests represent interests in properties that are believed to potentially contain mineralized material consisting of (i) mineralized material such as inferred material within pits; measured, indicated and inferred material with insufficient drill spacing to qualify as proven and probable reserves; and inferred material in close proximity to proven and probable reserves; (ii) around - mine exploration potential such as inferred material not immediately adjacent to existing reserves and mineralization, but located within the immediate mine area; (iii) other mine - related exploration potential that is not part of measured, indicated or inferred material and is comprised mainly of material outsideprimary components of the immediate mine area; (iv) greenfields exploration potential that is notore body on a pit by pit basis as well as within major pits are identified. Based on these components, stripping activities are analyzed and costs are assigned based on whether they pertained to current inventory production or improved access to future ore bodies (or components of an ore body).
Based on this analysis, the Company allocated the costs associated with any otherimproved access as a production development or exploration stage property, as described above; or (v) any acquired rightstripping asset. This allocation is based on the volume of waste and ore extracted in the period compared to explore or extract a potential mineral deposit. The Company’s mineral rights generally are enforceable regardlessexpected volume life-of-mine per component of whether proven and probable reserves have been established. The Company has the ability and intent to renew mineral interests where the existing term is not sufficient to recover all identified and valued proven and probable reserves and/or undeveloped mineralized material.
MINERA YANACOCHA S.R.L.ore body.
NOTES TO THE CONSOLIDATED FINANCIAL STATEMENTS
(dollars in thousands unless otherwise stated)Costs allocated to the production stripping activity asset are subsequently depreciated. Depreciation of the production stripping asset was calculated on a systematic basis ("waste-to-ore tons ratio") method over the expected useful life of the identified component of the ore body that becomes more accessible as a result of the stripping costs. This depreciation is a production cost.
Notes to the consolidated financial statements (continued)
| (i) | Impairment of non-financial assets - |
The Company reviews and evaluates its long-livedcarrying amounts of non-financial assets are reviewed for impairment whenwhenever events or changes in circumstances indicate that the related carrying amountsvalue may not be recoverable. AnIf there are indicators of impairment, a review is consideredundertaken to exist ifdetermine whether the total estimated futurecarrying values are in excess of the recoverable amount. The recoverable amount is determined as the higher of an asset's fair value, less costs of disposal, and its value in use. Such review is undertaken on an asset by asset basis, except where such assets do not generate cash flows on an undiscounted basis are less thanindependently from other assets, in which case the carrying amount ofreview is undertaken at the assets. An impairment loss is measuredcash generating unit level. The Company identified two separate cash generating units according to its segments; Yanacocha and recorded based on discounted estimated future cash flows. Conga.
Future cash flows are estimated based on quantities of recoverable minerals, expected gold and other commodity prices (considering current and historical prices, trends and related factors), production levels, operating costs, capital requirements and reclamation costs, all based on life-of-mine plans. Existing provenplans and probable reserves and value beyond proven and probable reserves, including mineralization that is not part of the measured, indicated or inferred resource base, are included when determiningappropriate discount rate. These estimates, used in the fair value of mine site reporting units at acquisition and, subsequently, in determining whether the assets are impaired. The term “recoverable minerals” refers to the estimated amount of gold or other commodities that will be obtained after taking into account losses during ore processing and treatment. Estimates of recoverable minerals from such exploration stage mineral interests are risk adjusted based on management’s relative confidence in such materials. In estimating future cash flows, assets are grouped at the lowest level for which there are identifiable cash flows that are largely independent of future cash flows from other asset groups. The Company’s estimatesdetermination of future cash flows, are based on numerous assumptions and it is possible that actual future cash flows will be significantly different than the estimates, as actual future quantities of recoverable minerals, gold and other commodity prices, production levels, and costs and capital and interest rates are each subject to significant risks and uncertainties.
Revenue RecognitionIf the carrying amount of an asset exceeds its recoverable amount, an impairment loss is recorded in the statement of comprehensive income to reflect the asset at the lower amount. In assessing the recoverable amount for assets, the relevant future cash flows expected to arise from the fair value less costs of disposal have been discounted to their present value.
RevenueAn impairment loss is recognized, netreversed in the statement of treatment and refining charges, fromcomprehensive income if there is a sale when persuasive evidence of an arrangement exists,change in estimate used to determine recoverable amount since the price is determinable, the product has been delivered, the title has been transferred to the customer and collection of the sales price is reasonably assured. Revenues from silver and copper sales are credited to Costs applicable to sales as a by-product credit.
Income and Mining Taxes and Profit Sharingprior impairment loss was recognized.
The carrying amount of an asset is increased to the recoverable amount but not beyond the carrying amount net of depreciation or amortization which would have arisen if the prior impairment loss had not been recognized. After such a reversal the depreciation charge is adjusted in future periods to allocate the asset's revised carrying amount, less any residual value, on a systematic basis over its remaining useful life.
General-
Provisions are recognized when the Company accounts for incomehas a present legal or constructive obligation as a result of past events, it is probable that an outflow of resources will be required to settle the obligation, and mining taxes and legally required profit sharingthe amount has been reliably estimated. If the time value of money is significant, provisions are discounted using pre-tax rates, which reflect, when appropriate, the liability method, recognizing certain temporary differences between the financial reporting basisliabilities' specific risks. The reversal of the Company’s liabilitiesdiscount due to the passage of time originates the increase of the obligation which is recognized with a charge to the statement of comprehensive income as a finance cost.
Provisions are reviewed periodically and are adjusted to reflect the best estimate available as of the date of the consolidation statement of financial position. The expenses related to other provisions are presented in the consolidated statement of comprehensive income.
Disclosure of contingent obligations is provided when their existence will only be confirmed by future events or their amount cannot be reliably measured. Contingent assets are not recognized and the related income tax basis for such liabilities and assets. This method generates a net deferred income tax liability and profit sharing liability or net deferred income tax asset and profit sharing asset forare disclosed only if it is probable that the Company as measured bywill generate future economic benefits.
Notes to the statutory tax and profit sharing rates in effect as enacted. The Company derives its deferred income tax charge or benefit and profit sharing charge or benefit by recording the change in the net deferred income tax liability and profit sharing liability or net deferred income tax asset and profit sharing asset balance for the year, based on Peruvian income and mining tax and profit sharing rates.consolidated financial statements(continued)
MINERA YANACOCHA S.R.L.
NOTES TO THE CONSOLIDATED FINANCIAL STATEMENTS
(dollars in thousands unless otherwise stated)
The Company’s deferred income tax assets include certain future tax benefits. The Company records a valuation allowance against any portion of those deferred income tax assets when it believes, based on the weight of available evidence, it is more likely than not that some portion or all of the deferred income tax asset will not be realized.
Asset Retirement Obligation -
Reclamation and Remediation Costs
Asset retirement obligations are recognized when incurred and recorded as liabilities at fair value.the best estimate of the expenditure required to settle the obligation. The liability is accreted over time through periodic charges to earnings. In addition, the asset retirement cost is capitalized as part of the asset’sasset's carrying value and amortized over the life of the related asset. Reclamation costs are periodically adjusted to reflect changes in the estimated present value resulting from the passage of time and revisions to the estimates of either the timing or amount of the reclamation costs. The estimated retirementreclamation obligation is based on when spending for an existing environmental disturbance is expected to occur. The Company reviews, on an annual basis, unless otherwise deemed necessary, the reclamation obligation at each mine site in accordance with ASC guidance for reclamation obligations.site.
Future remediation costs
Notes to the consolidated financial statements (continued)
Revenue from the sale of gold is recognized net of treatment and refining charges, when persuasive evidence of an arrangement exists, the price is determinable, the product has been delivered, risk and title has been transferred to the customer and collection of the sales price is reasonably assured.
Sales contracts for inactive minescopper, silver and carbon incorporate provisional pricing at the date of delivery of the mineral ore. The final price is an average market price for a particular future period. Revenue from provisionally priced sales of copper, silver and carbon fine is recognized when risks and rewards of ownership are accruedtransferred to the customer, generally at the date of delivery, and revenue can be measured reliably. At this date, the amount of revenue to be recognized will be estimated based on management’s best estimatethe forward market price of the commodity being sold.
Revenues from silver and copper sales are credited to Costs applicable to sales as a by-product credit. Royalties paid based on revenue are charged to revenue.
Current income tax -
Current income tax assets and liabilities for the current and prior periods are measured at the end of each period of the costsamount expected to be incurredrecovered from, or paid to, the taxation authorities. The tax rates and tax laws used to compute the amount are those that are enacted or substantively enacted at a site. Such cost estimates include, where applicable, ongoing care, maintenance and monitoring costs. Changesthe reporting date in estimates at inactive mines are reflected in earnings in the period an estimate is revised.Peru.
Comprehensive Income
In additionCurrent income tax relating toNet income, Comprehensive income (loss) includes all changes in equity during a period, such as cumulative unrecognized changes in fair value of marketable securities available - for - sale or other investments, except those resulting from investments by and distributions to owners.
Recently Adopted Accounting Pronouncements
Fair Value Accounting
In May 2011, ASC guidance was issued related to disclosures around fair value accounting. The updated guidance clarifies different components of fair value accounting including the application of the highest and best use and valuation premise concepts, measuring the fair value of an instrument classified in a reporting entity’s shareholders’ equity and disclosing quantitative information about the unobservable inputs used in fair value measurements that are categorized in Level 3 of the fair value hierarchy. The Company’s January 1, 2012 adoption of the updated guidance had no impact on the Company’s consolidated financial position, results of operations or cash flows. Refer to note 6 for further details regarding the Company’s assets and liabilities measured at fair value.
MINERA YANACOCHA S.R.L.
NOTES TO THE CONSOLIDATED FINANCIAL STATEMENTS
(dollars in thousands unless otherwise stated)
Comprehensive Income
In June 2011, theASC guidance was issued related to comprehensive income. Under the updated guidance, an entity will have the option to present the total of comprehensive income either in a single continuous statement of comprehensive income or in two separate but consecutive statements. In addition, the update required certain disclosure requirements when reporting other comprehensive income. The update does not change the items reportedrecognized directly in other comprehensive income or when an item ofequity is recognized in other comprehensive income must be reclassifiedor equity and not in profit or loss. Management periodically evaluates positions taken in the tax returns with respect to income. The Company adopted the new guidancesituations where applicable tax regulations are subject to interpretation and its deferral and opted to present the total of comprehensive income in two separate but consecutive statements effective for its fiscal year beginning January 1, 2011. The early adoption had no impact on the Company’s consolidated financial position, results of operations or cash flows.establishes provisions where appropriate.
Deferred income tax -
The Company accounts for income and mining taxes using the liability method, recognizing certain temporary differences between the financial reporting basis of the Company's liabilities and assets and the related income tax basis for such liabilities and assets. This method generates a net deferred income tax liability or net deferred income tax asset for the Company, as measured by the statutory tax rates in effect as enacted. The Company derives its deferred income tax charge or benefit by recording the change in the net deferred income tax liability or net deferred income tax asset balance for the year, based on Peruvian income and mining tax laws. Royalty taxes are calculated based on operating profit, as such are shown as income tax.
Notes to the consolidated financial statementsRecently Issued Accounting Pronouncements (continued)
ReportingThe Company's deferred income tax assets include certain future tax benefits. The Company determines valuation allowance to any portion of Amounts reclassified outthose deferred income tax assets when it believes, based on the weight of Accumulated Other Comprehensive Incomeavailable evidence, it is more likely than not that some portion or all of the deferred income tax asset will not be realized (Note 14).
In February 2013, ASC guidance was issued related to items reclassified fromAccumulated Other Comprehensive Income. The new standard requires either in a single note or parenthetically on the face of the financial statements:(i) the effect of significant amounts reclassified from each component of accumulated other comprehensiveDeferred income based on its source and (ii) the income statement line items affected by the reclassification. The update is effective for the Company’s fiscal year beginning January 1, 2013 with early adoption permitted. The Company does not expect the updated guidance to have a significant impact on the consolidated financial position, results of operations or cash flows.
Disclosures about Offsetting Assets and Liabilities
In November 2011, ASC guidance was issued related to disclosures about offsettingtax assets and liabilities. The new standard requires disclosures to allow investors to better compare financial statements prepared under U.S. GAAP with financial statements prepared under IFRS. The update is effective for the Company’s fiscal year beginning January 1, 2013, and interim periods within those annual periods. Retrospective application is required.
MINERA YANACOCHA S.R.L.
NOTES TO THE CONSOLIDATED FINANCIAL STATEMENTS
(dollars in thousands unless otherwise stated)
In January 2013, ASC guidance was issued to clarify that the disclosure requirements are limited to derivatives, repurchase agreements, and securities lending transactionsrecognized only to the extent that they are (i) offset init is probable that future taxable profit will be available against which the financial statements or (ii) subject to an enforceable master netting arrangement or similar agreement.The Company does not expect the updated guidance to have an impact on the consolidated financial position, results of operations or cash flows.
| | | Years Ended December 31, | |
| | | 2012 | | | 2011 | | | 2010 | |
| Regional administration | | $ | 35,026 | | | $ | 23,341 | | | $ | 20,725 | |
| Community development and external affairs | | | 30,078 | | | | 17,341 | | | | 16,002 | |
| World Gold Council dues | | | 3,021 | | | | 1,281 | | | | 3,824 | |
| Negotiated payment | | | - | | | | - | | | | 13,346 | |
| Employee Severance Program | | | 40,943 | | | | - | | | | - | |
| Other | | | 3,927 | | | | (1,489 | ) | | | 4,105 | |
| | | $ | 112,995 | | | $ | 40,474 | | | $ | 58,002 | |
Negotiated Paymenttemporary differences can be utilized.
In December 2006, the Peruvian Government approved legislation regulating the conditions in which the negotiated payment was paid by Peruvian mining companies. The payment amounted to 3.75% of Peruvian net income afterDeferred income tax (2.75% paidassets and liabilities are offset when there is a legally enforceable right to a Local Mining Fundoffset current tax assets against current tax liabilities and 1% paidwhen the deferred income tax assets and liabilities relate to a Regional Mining Fund), payable for 2006 through 2010 if certain conditions were met. The funds are managed by an association designatedincome taxes levied by the Company. Mining companies contributed these fundssame taxation authority on either the same taxable entity or different taxable entities where there is an intention to participate insettle the government efforts to eradicate poverty in Peru inbalances on a net basis.
Sales tax -
Expenses and assets are recognized net of the current favorable economic environment.
Employee severance program
During 2012, Yanacocha conducted a restructuring program in order to align the Company’s organization with future business needs. In connection therewith, a groupamount of employees signed mutual agreements to terminate their labor contracts in return for severance payments. This program was mainly executed during the month of September 2012 and no liabilities were outstanding at year-end.
MINERA YANACOCHA S.R.L.
NOTES TO THE CONSOLIDATED FINANCIAL STATEMENTS
(dollars in thousands unless otherwise stated)sales tax, except:
| 4.(i) | OTHER INCOME, NETWhen the sales tax incurred on a purchase of assets or services is not recoverable from the taxation authority, in which case, the sales tax is recognized as part of the cost of acquisition of the asset or as part of the expense item, as applicable; |
| | | Years Ended December 31, | |
| | | 2012 | | | 2011 | | | 2010 | |
| Development projects, net | | $ | 10,785 | | | $ | 24,959 | | | $ | 2,171 | |
| Gain (loss) on sale of assets | | | (3,878 | ) | | | 1,557 | | | | (208 | ) |
| Interest income | | | 1,019 | | | | 1,323 | | | | 2,196 | |
| Gain (loss) on sale of investments | | | - | | | | 348 | | | | - | |
| Foreign currency exchange gain (loss) | | | (1,216 | ) | | | (745 | ) | | | 998 | |
| Other | | | (130 | ) | | | 3,399 | | | | 2,156 | |
| | | | 6,580 | | | $ | 30,841 | | | $ | 7,313 | |
| 5.(ii) | INCOME AND MINING TAXESWhen receivables and payables are stated with the amount of sales tax included. |
Tax Stabilization Agreements
The Company has entered intonet amount of sales tax recoverable from, or payable to, the following tax stability agreements, each with a termtaxation authority is included as part of 15 years:
Mine
| | Effective
| | Date of the Tax
Agreement
| | Tax Regimes in
Force
|
| | | | | | |
Maqui Maqui | | January 1, 1997 | | September 12, 1994 | | May 6, 1994 |
Cerro Yanacocha | | January 1, 2000 | | September 16, 1998 | | May 22, 1997 |
La Quinua | | January 1, 2004 | | August 25, 2003 | | August 25, 2003 |
These agreements guarantee the Company’s use of the tax regimes shownreceivables or payables in the table above and permit maintenanceconsolidated statements of its accounting records in U.S. dollars.
The Maqui - Maqui tax stability agreement expired on January 1, 2012 and is no longer in effect.
The Company determines the taxable income based on its understanding and that of its legal advisors, of applicable tax legislation. Taxable income differs from pre-tax income disclosed within these financial statements by those items that the applicable tax legislation deems to be non-taxable or non-deductible and by certain differences between U.S. and Peruvian generally accepted accounting principles.
For the years ended December 31, 2012, 2011 and 2010 the income tax rate was 30% except for the La Quinua mine for which a 29% income tax rate applied.
MINERA YANACOCHA S.R.L.
NOTES TO THE CONSOLIDATED FINANCIAL STATEMENTS
(dollars in thousands unless otherwise stated)
Other Mining Taxesposition.
| a)(m) | Law N° 29788, Mining RoyaltiesFair value measurement - |
The Company measures its financial instruments, such as, derivatives and embedded derivatives, at fair value as of the date of the consolidated statements of financial position.
During
Fair value is the second quarter of 2004,price that would be received to sell an asset, or paid to transfer a liability, in an orderly transaction between market participants at the Peruvian Government enacted legislation to establish a sliding scale mining royalty of up to 3%measurement date. The fair value measurement is based on the volume of mine production. The royalty is calculated on revenue from sales of product less certain refining and transportation expenses. Whilepresumption that the Peruvian royalty became effective duringtransaction to sell the second quarter of 2004, it does not apply to those projects that had stabilization agreements prior toasset or transfer the adoption of the royalty law. The Company’s current production is derived from projects that were stabilized prior to the enactment of the royalty legislation as well as projects where the stabilization agreements have expired. In September 2011, the law was modified to comprise a new mining tax payable to the Peruvian Government for extracting metallic and non - metallic mineral resources from its mining concessions.
The new mining royalty is payable quarterly, based on sales and operating profit determined in accordance with Peruvian generally accepted accounting principles. The royalty amount due is 1% of sales. An additional mining tax due is calculated based on the level of operating profit up to a maximum applicable rate is 12%. This component of the new mining tax only applies to those projects that are not covered by a tax stabilization agreement. During 2012 and 2011, $5,102 and $1,146, respectively, were included inCosts applicable to salesbased on 1% of revenue and $2,359 and $132 were included inIncome and mining tax expensebased on an average of 3.46% and 3.97% of operating profit, respectively.
| b) | Law N° 29789, Special Mining Tax |
The Special Mining Tax (“IEM”) applies to mines not covered by a tax stabilization agreement. The IEM is payable on a quarterly basis with rates ranging from 2% to 8.4% of operating profit determined, in accordance with Peruviangenerally accepted accounting principles.The rate varies depending on the level of operating profit. During 2012 and 2011, $6,900 and $1,319, respectively, were included inIncome and mining tax expensedue to the IEM based on average of 3.13% and 3.69% of operating profit, respectively.
| c) | Law N° 29790, Special Mining Charge |
The Special Mining Charge (“GEM”) applies to mines covered by a tax stabilization agreement. The GEMis payable on a quarterly basis with rates ranging from 4% to 13.12% of operating profit, determined in accordance with Peruviangenerally accepted accounting principles. The rate varies depending on the level of operating profit margin. The GEM applied to operations at Cerro Yanacocha and La Quinua in 2012 and the fourth quarter of 2011. This resulted in $68,644 and $19,661, respectively, of additionalIncome and mining tax expensebased on a 2012 average rate of 6.55% of operating profit and a 2011 average rate of 5.95% of operating profit.
MINERA YANACOCHA S.R.L.
NOTES TO THE CONSOLIDATED FINANCIAL STATEMENTS
(dollars in thousands unless otherwise stated)
| d) | Law N°29471, Supplementary Fund |
The Supplementary Fund for retirement of mining applies to metallurgical and steel workers, affiliated to the National Pension System - SNP and the Private Pension System – PPS; and is applicable since May 11, 2012. This Fund is formed by contributions of employees andemployer which are distributed according to the following detail:liability takes place either:
| - | Employers will contribute 0.5% ofIn the annual income before taxes.principal market for the asset or liability, or |
| - | Employees will contribute 0.5%In the absence of their monthly gross salary. |
| - | The employer’s contributions are paid before tax; therefore these amounts are deductible expensesa principal market, in the most advantageous market for the year.asset or liability. |
The new pension fund tax is payable quarterly in accordance with Peruvian generally accepted accounting principles. During 2012 this amounts were included inIncome and mining tax expense.
Peruvian Income Tax and Workers’ Profit ParticipationNotes to the consolidated financial statements (continued)
The current income tax and workers’ profit participation expense (Note 13) was determined as follows:
| | | Years Ended December 31, | |
| | | 2012 | | | 2011 | | | 2010 | |
| Income before workers’ profit participation and income tax in accordance with Peruvian GAAP | | $ | 1,074,530 | | | $ | 988,887 | | | $ | 931,414 | |
| Plus: | | | | | | | | | | | | |
| Non-deductible expenses | | | 27,503 | | | | 26,247 | | | | 33,622 | |
| Reclamation (environmental) reserve liability | | | 33,910 | | | | 61,732 | | | | 24,944 | |
| Advanced projects (prior to operations) | | | 49,904 | | | | 26,502 | | | | - | |
| Provision for government mining royalties | | | 12,552 | | | | 9,201 | | | | 1,608 | |
| Capitalized interest amortization | | | 4,357 | | | | 5,363 | | | | 4,879 | |
| Contingencies and commitments’ accruals | | | 909 | | | | 1,134 | | | | 1,777 | |
| Intangible asset road amortization | | | 2,849 | | | | 2,849 | | | | - | |
| Leasing benefit | | | 7,534 | | | | 6,552 | | | | (5,796 | ) |
| Provision for obsolescence of inventories | | | 6,901 | | | | 378 | | | | 1,195 | |
| Conga Non-deductible expenses | | | 45,413 | | | | - | | | | - | |
| Other | | | 10,915 | | | | 4,297 | | | | 16,649 | |
| | | | 202,747 | | | | 144,255 | | | | 78,878 | |
| Less: | | | | | | | | | | | | |
| Amortization and mineral interests | | | (148,995 | ) | | | (86,752 | ) | | | (11,211 | ) |
| Tax amortization rate adjustment | | | (19,332 | ) | | | (24,040 | ) | | | (19,872 | ) |
| Reclamation (environmental) reserve expense | | | (7,661 | ) | | | (5,882 | ) | | | (5,191 | ) |
| Accounts receivable write-off | | | - | | | | (1,293 | ) | | | 112 | |
| Other mining taxes | | | (91,935 | ) | | | (24,134 | ) | | | - | |
MINERA YANACOCHA S.R.L.
NOTES TO THE CONSOLIDATED FINANCIAL STATEMENTS
(dollars in thousands unless otherwise stated)
| | | Years Ended December 31, | |
| | | 2012 | | | 2011 | | | 2010 | |
| Capitalized interest | | | - | | | | - | | | | (4,404 | ) |
| Other | | | - | | | | (2,823 | ) | | | - | |
| | | | (267,923 | ) | | | (144,924 | ) | | | (40,566 | ) |
| Base to calculate workers’ profit participation | | | 1,009,353 | | | | 988,218 | | | | 969,726 | |
| Workers’ profit participation (8%) | | | (80,748 | ) | | | (79,057 | ) | | | (77,578 | ) |
| Taxable income | | $ | 928,605 | | | $ | 909,161 | | | $ | 892,148 | |
| | | | | | | | | | | | | |
| Income tax (30%) | | $ | 278,581 | | | $ | 272,748 | | | $ | 267,645 | |
| Credit for charitable donations | | | | _ | | | (928 | ) | | | (930 | ) |
| Prior year adjustment | | | | _ | | | (11,023 | ) | | | – | |
| Adjustment due to income tax rate applicable to La Quinua | | | (1,149 | ) | | | (1,836 | ) | | | (1,615 | ) |
| Current income tax | | $ | 277,432 | | | $ | 258,961 | | | $ | 265,100 | |
MINERA YANACOCHA S.R.L.
NOTES TO THE CONSOLIDATED FINANCIAL STATEMENTS
(dollars in thousands unless otherwise stated)
Income Tax – Reconciliation from Peru Tax Return to Income Tax Expense and Tax Balance Sheets
The Company’s income tax provision consisted of the following:
| | | Years Ended December 31, | |
| | | 2012 | | | 2011 | | | 2010 | |
| Current Peru tax return | | $ | 277,432 | | | $ | 258,961 | | | $ | 265,100 | |
| Royalties and mining taxes | | | 79,383 | | | | 20,980 | | | | - | |
| Other taxes | | | 1,157 | | | | 3,153 | | | | - | |
| Income tax prior year adjustments | | | (763 | ) | | | 12,934 | | | | 505 | |
| Current | | | 357,209 | | | | 296,028 | | | | 265,605 | |
| Deferred | | | 4,648 | | | | (2,854 | ) | | | 3,932 | |
| Other | | | - | | | | (136 | ) | | | 136 | |
| Income tax expense | | $ | 361,857 | | | $ | 293,038 | | | $ | 269,673 | |
Income tax expense differs from the amount computed by applying the statutory Peruvian corporate income tax rate of 30% to pre-tax income as a result of the following:
| | | Years Ended December 31, | |
| | | 2012 | | | 2011 | | | 2010 | |
| Income before tax provision | | $ | 928,605 | | | $ | 909,830 | | | $ | 853,836 | |
| Peruvian statutory rate | | | 30 | % | | | 30 | % | | | 30 | % |
| Income tax at statutory rate | | | 278,581 | | | | 272,949 | | | | 256,151 | |
| Adjustment due to income tax rate applicable to La Quinua | | | (1,149 | ) | | | (1,836 | ) | | | (1,615 | ) |
| Negotiated payment | | | - | | | | - | | | | 4,004 | |
| Donations | | | - | | | | 5,134 | | | | 4,399 | |
| Other mining taxes | | | 79,383 | | | | 20,980 | | | | - | |
| Other | | | 5,042 | | | | (4,189 | ) | | | 6,734 | |
| Total income tax expense | | $ | 361,857 | | | $ | 293,038 | | | $ | 269,673 | |
Components of deferred income tax assets (liabilities) are as follows:
| | | At December 31, | |
| | | 2012 | | | 2011 | |
| Deferred income tax assets: | | | | | | | | |
| Reclamation and remediation | | $ | 72,584 | | | $ | 64,709 | |
| Accounts payable and accrued expenses | | | 30,132 | | | | 12,905 | |
| Deferred workers’ profit participation | | | 5,498 | | | | 5,094 | |
| Other | | | 9,620 | | | | 4,252 | |
| | | | 117,834 | | | | 86,960 | |
| Deferred income tax liabilities: | | | | | | | | |
| Property, plant and mine development | | | (161,471 | ) | | | (117,778 | ) |
| Inventories | | | (23,796 | ) | | | (27,463 | ) |
| Other | | | (2,231 | ) | | | (1,883 | ) |
| | | | (187,498 | ) | | | (147,124 | ) |
| Net deferred income tax liabilities | | | (69,664 | ) | | $ | (60,164 | ) |
| | | | | | | | | |
| Current deferred income tax assets | | | 4,378 | | | $ | 8,746 | |
MINERA YANACOCHA S.R.L.
NOTES TO THE CONSOLIDATED FINANCIAL STATEMENTS
(dollars in thousands unless otherwise stated)
| | | At December 31, | |
| | | 2012 | | | 2011 | |
| | | | | | | | | |
| Long-term deferred income tax liabilities | | | (74,042 | ) | | | (68,910 | ) |
| Net deferred income tax liabilities | | | (69,664 | ) | | $ | (60,164 | ) |
Unrecognized Tax Benefits
At December 31, 2012 and 2011, the Company had $1,198 and $5,566, respectively, of total gross unrecognized tax benefits that, if recognized, would impact the Company’s effective income tax rate. The Company’s continuing practice is to recognize interest and/or penalties related to unrecognized tax benefits as part of its income tax expense. The Company files income tax returns with Peruvian taxing authorities and is no longer subject to income tax audits by taxing authorities for years before 2008.
Fair value accounting establishes a fair value hierarchy that prioritizes the inputs touses valuation techniques usedthat are appropriate in the circumstances and for which sufficient data are available to measure fair value. The hierarchy givesvalue, maximizing the highest priority to unadjusted quoted pricesuse of relevant observable inputs and minimizing the use of unobservable inputs.
All assets and liabilities for which fair value is measured or disclosed in active markets for identical assets or liabilities (Level 1 measurements) and the lowest priority to unobservable inputs (Level 3 measurements). The three levels ofconsolidated financial statements are categorized within the fair value hierarchy, are described, below:
| Level 1 | Unadjusted quoted prices in active markets that are accessible at the measurement date for identical, unrestricted assets or liabilities; |
| Level 2 | Quoted prices in markets that are not active, or inputs that are observable, either directly or indirectly, for substantially the full term of the asset or liability; and |
| Level 3 | Prices or valuation techniques that require inputs that are both significant to the fair value measurement and unobservable (supported by little or no market activity). |
The following table sets forth the Company’s assets measured at fair value on a recurring basis (at least annually) by level within the fair value hierarchy. As required by accounting guidance, assets and liabilities are classified in their entiretyas follows, based on the lowest level of input that is significant to the fair value measurement.measurement as a whole:
| | | Fair Value at December 31, 2012 | |
| | | Total | | | Level 1 | | | Level 2 | | | Level 3 | |
| Assets: | | | | | | | | | | | | | | | | |
| San José Reservoir Trust assets | | $ | 17,115 | | | $ | 17,115 | | | $ | – | | | $ | – | |
| Provisional priced products sales | | $ | 34 | | | $ | 34 | | | $ | – | | | $ | – | |
| - | Level 1 - Quoted (unadjusted) market prices in active markets for identical assets or liabilities. |
| - | Level 2 - Valuation techniques for which the lowest level input that is significant to the fair value measurement is directly or indirectly observable. |
| - | Level 3 - Valuation techniques for which the lowest level input that is significant to the fair value measurement is unobservable. |
MINERA YANACOCHA S.R.L.
For assets and liabilities that are recognized in the consolidated statements of financial position on a recurring basis, the Company determines whether transfers have occurred between levels in the hierarchy by reassessing categorization (based on the lowest-level input that is significant to the fair value measurement as a whole) at the end of each reporting period.
NOTES TO THE CONSOLIDATED FINANCIAL STATEMENTS
(dollarsThe Company's Management determines the policies and procedures for both recurring fair value measurement and non-recurring measurement. At each reporting date, the Company's Management analyzes the movements in thousands unless otherwise stated)the values of assets and liabilities which are required to be re-measured or re-assessed as per the Company’s accounting policies.
The Company’s SanJosé Reservoir TrustFor the purpose of fair value disclosures, the Company has determined classes of assets are made upand liabilities based on the nature, characteristics and risks of marketable equitythe asset or liability and debt securities that are valued using quoted market prices in active markets and as such are classified within Level 1the level of the fair value hierarchy. hierarchy as explained above.
| 3. | Significant judgments, estimates and assumptions |
The preparation of the Company’s consolidated financial statements requires Management to make judgments, estimates and assumptions that affect the reported amounts of revenues, expenses, assets and liabilities, and the accompanying disclosures, and the disclosure of contingent liabilities. The estimates and assumptions are continuously evaluated and based on Management’s experience and other facts, including the expectations about future events which are reasonable under the current situation. Uncertainty about these estimates and assumptions could result in outcomes that require material adjustment to the carrying amount of assets and liabilities affected in future periods. Further information on each of these areas and how they impact the various accounting policies are described below and also in the relevant notes to the consolidated financial statements.
Notes to the consolidated financial statements (continued)
In the process of applying the Company’s accounting policies, Management has made the following judgments, which have the most significant effect on the amounts recognized in the consolidated financial statements:
By their nature, contingencies will be resolved only when one or more uncertain future events occur or fail to occur. The assessment of the existence and potential quantum of contingencies inherently involves the exercise of significant judgment and the use of estimates regarding the outcome of future events.
| (b) | Development start date - |
The Company assesses the status of each exploration project to determine when the development phase begins. One of the criteria used to evaluate the development start date is when the Company determines that the property can be economically developed.
| (c) | Production start date - |
The Company assesses the stage of each mine under development to determine when a mine moves into the production phase. The determination of the start date is based on the unique nature of each mining project; such as the complexity of the project and its location. The Company considers various relevant criteria to assess when the production phase is considered to have commenced. Some of the criteria used to identify the production start date include, but are not limited to:
| - | Level of capital expenditure incurred compared to the original construction cost estimates. |
| - | Completion of a reasonable period of testing of the mine plant and equipment. |
| - | Ability to produce metal in saleable form (within specifications). |
| - | Ability to sustain ongoing production of metal. |
When a mine development /construction project moves into the production phase, the capitalization of certain mine development costs ceases and costs are either regarded as forming part of the cost of inventory or expensed, except for costs that qualify for capitalization relating to mining asset additions or improvements. It is also at this point that depreciation or amortization commences.
| 3.2. | Estimates and assumptions |
The key assumptions concerning the future and other key sources of estimation uncertainty at the reporting date that have a significant risk of causing a material adjustment to the carrying amounts of assets and liabilities within the next financial year, are described below. The Company based its assumptions and estimates on parameters available when the consolidated financial statements were prepared. Existing circumstances and assumptions about future developments, however, may change due to market change or circumstances arising beyond the control of the Company. Such changes are reflected in the assumptions when they occur.
Notes to the consolidated financial statements (continued)
| (a) | Determination of mineral reserves and resources - |
The Company calculates its reserves using methods generally applied by mining and industry according to international guidelines. All estimated reserves represent estimated quantities of mineral proven and probable that under current conditions can be economically and legally processed.
The process of estimating quantities of reserves is complex and requires making subjective decisions when evaluating all geological, geophysical, engineering and economic information available. Reviews could occur on reserve estimates due to, among others, revisions to the data or geological assumptions, changes in prices, production costs and results of exploration activities. Changes in estimated reserves could affect the carrying value of mining concessions, development costs and property, plant and equipment, the charges in result for depreciation and amortization, and the carrying amount of the provision for closure of mining units.
| (b) | Units of production depreciation - |
Estimated economically recoverable reserves are used in determining the depreciation and/or amortization of mine-specific assets. This results in a depreciation/amortization charge proportional to the depletion of the anticipated remaining life-of-mine production. The life of each item, which is assessed at least annually, has regard to both its physical life limitations and present assessments of economically recoverable reserves of the mine property at which the asset is located. These calculations require the use of estimates and assumptions, including the amount of recoverable reserves. Changes in estimates are accounted for prospectively.
| (c) | Mine rehabilitation provision - |
The Company assesses its mine rehabilitation provision at each reporting date. The ultimate rehabilitation costs are uncertain, and cost estimates can vary in response to many factors, including estimates of the extent and costs of rehabilitation activities, technological changes, regulatory changes, cost increases as compared to the inflation rates, and changes in discount rates. These uncertainties may result in future actual expenditure differing from the amounts currently provided. The provision at reporting date represents Management’s best estimate of the present value of the future rehabilitation costs required.
Net realizable value tests are performed at each reporting date and represent the estimated future sales price of the product the entity expects to realize when the product is processed and sold, less estimated costs to complete production and bring the product to sale.
Stockpiles and ore on leach pads are measured by estimating the number of tons added and removed from the stockpile and leach pads, the number of contained gold ounces, assay data, and the estimated recovery percentage based on the expected processing method. Stockpile and ore on leach pad tonnages are verified by periodic surveys.
Notes to the consolidated financial statements(continued)
| (e) | Impairment of non-financial assets - |
The Company assesses each asset or cash generating unit in each reporting period to determine whether any indication of impairment exists. Where an indicator of impairment exists, a formal estimate of the recoverable amount is made, which is considered to be the higher of the fair value less costs of disposal and value in use. The assessments require the use of estimates and assumptions such as long-term commodity prices, discount rates and operating costs, among others. These estimates and assumptions are subject to risk and uncertainty.
The fair value of the marketable equity securitiesmining assets is calculated by the present value of future cash flows arising from the continued use of the asset, which include some estimates, such as the quotedcost of future expansion plans, using assumptions that a third party might consider. The future cash flows are discounted to their present value using a discount rate that reflects current market priceassessment of the marketable equity security multiplied byvalue of money over time, as well as specific risks of the quantity of shares held by the Company.asset or cash-generating unit under evaluation.
The Company’s net trade receivable from provisional silver, gold, carbon finesCompany has determined the operations of Yanacocha and copper concentrate salesConga as the cash generating units.
Deferred tax assets are recognized for unused tax losses to the extent that it is valued using quoted market pricesprobable that taxable profit will be available against which the losses can be utilized. Significant Management judgment is required to determine the amount of deferred tax assets that can be recognized, based onupon the forward the COMEX Silver Index, the London Bullion Market Association P.M. fix (“London P.M. fix”) (gold),likely timing and the London Metal Exchange (“LME”) (copper),level of future taxable profits together with future tax planning strategies.
| 4. | Standards issued but not effective |
The standards and as such is classified within Level 1interpretations that are issued, but not yet effective, up to the date of issuance of the fair value hierarchy.Company’s financial statements that the Company reasonably expects will have an impact on its disclosures, financial position or performance when applied at a future date are disclosed below. The Company intends to adopt these standards, if applicable, when they become effective. The Company has not listed other standards and interpretations that are issued, but not yet effective, as these are not expected to impact the Company.
IFRS 9 Financial Instruments
In July 2014, the IASB issued the final version of IFRS 9 Financial Instruments that replaces IAS 39 and all previous versions of IFRS 9. IFRS 9 brings together all three aspects of the accounting for financial instruments project: classification and measurement, impairment and hedge accounting. IFRS 9 is effective for annual periods beginning on or after January 1, 2018, with early application permitted. Except for hedge accounting, retrospective application is required, but the provision of comparative information is not compulsory. For hedge accounting, the requirements are generally applied prospectively, with some limited exceptions.
Notes to the consolidated financial statements (continued)
IFRS 15 Revenue from Contracts with Customers
IFRS 15 was issued in May 2014 and establishes a five-step model to account for revenue arising from contracts with customers. Under IFRS 15, revenue is recognized at an amount that reflects the consideration to which an entity expects to be entitled in exchange for transferring goods or services to a customer. The new revenue standard will supersede all current revenue recognition requirements under IFRS. Either a full retrospective application or a modified retrospective application is required for annual periods beginning on or after January 1, 2018. Early adoption is permitted.
Amendments to IFRS 10 and IAS 28: Sale or Contribution of Assets between an Investor and its Associate or Joint Venture
The amendments address the conflict between IFRS 10 Consolidated Financial Statements and IAS 28 in dealing with the loss of control of a subsidiary that is sold or contributed to an associate or joint venture. The amendments clarify that the gain or loss resulting from the sale or contribution of assets that constitute a business, as defined in IFRS 3, between an investor and its associate or joint venture, is recognized in full. Any gain or loss resulting from the sale or contribution of assets that do not constitute a business, however, is recognized only to the extent of unrelated investors’ interests in the associate or joint venture. These amendments must be applied prospectively and are effective for annual periods beginning on or after January 1, 2016, with early adoption permitted. These amendments will impact the Company to the extent that it undertakes future transactions of this nature, as this accounting approach differs to that which it would currently apply.
| 5. | Cash and cash equivalents |
| (a) | This caption is made up as follows: |
| | | 2015 | | | 2014 | |
| | | US$(000) | | | US$(000) | |
| | | | | | | |
| Petty cash | | | 51 | | | | 53 | |
| Bank accounts | | | 142,725 | | | | 287,762 | |
| Term deposits (b) | | | 800,985 | | | | 498,809 | |
| | | | | | | | | |
| | | | 943,761 | | | | 786,624 | |
The term deposits balance is made as follows:
| | | 2015 | | | 2014 | |
| | | US$(000) | | | US$(000) | |
| | | | | | | |
| Citi Bank | | | 620,025 | | | | 318,001 | |
| HSBC | | | 180,960 | | | | 180,808 | |
| | | | | | | | | |
| | | | 800,985 | | | | 498,809 | |
| (b) | The bank accounts and term deposits yield interest at market rates. Because of the short maturity of these balances, less than 90 days, the carrying amounts approximate their fair value. |
Notes to the consolidated financial statements (continued)
| 6. | Trade and other receivables, net |
| (a) | This caption is made up as follows: |
| | | 2015 | | | 2014 | |
| | | US$(000) | | | US$(000) | |
| | | | | | | |
| Trade receivables, net | | | | | | | | |
| Foreign clients | | | 5,181 | | | | 5,352 | |
| | | | | | | | | |
| Other receivables | | | | | | | | |
| Advances to suppliers | | | 13,052 | | | | 14,880 | |
| Tax claims | | | 5,273 | | | | 5,882 | |
| Other minors | | | 4,079 | | | | 7,888 | |
| Related entities, Note 21 | | | 248 | | | | 36,017 | |
| | | | 22,652 | | | | 64,667 | |
| | | | | | | | | |
| Allowance for doubtful accounts (b) | | | (1,444 | ) | | | (1,788 | ) |
| | | | 21,208 | | | | 62,879 | |
| | | | | | | | | |
| Total trade and other receivables, net | | | 26,389 | | | | 68,231 | |
The trade and other receivables have current maturities.
There are no trade receivables that are past at December 31, 2015 and 2014.
| (b) | The allowance for doubtful accounts had the following movement during the years 2015, 2014 and 2013: |
| | | 2015 | | | 2014 | | | 2013 | |
| | | US$(000) | | | US$(000) | | | US$(000) | |
| | | | | | | | | | |
| Opening balance | | | 1,788 | | | | 5,934 | | | | 7,816 | |
| Additions | | | 88 | | | | 812 | | | | 717 | |
| Deductions | | | (432 | ) | | | (4,958 | ) | | | (2,599 | ) |
| | | | | | | | | | | | | |
| Ending balance | | | 1,444 | | | | 1,788 | | | | 5,934 | |
In the opinion of the Company’s Management, the balance of the allowance for doubtful accounts is sufficient to cover adequately the risks of failure to date in the consolidated statement of financial position.
Notes to the consolidated financial statements (continued)
| 7. | ACCOUNTS RECEIVABLEInventories, net |
| (a) | This caption is made up as follows: |
| | | At December 31, | |
| | | 2012 | | | 2011 | |
| Value added tax | | $ | 71,498 | | | $ | 67,765 | |
| Equipment and fuel receivables | | | 19,973 | | | | - | |
| Trade accounts receivable | | | 730 | | | | 1 | |
| Employee receivables | | | 793 | | | | 307 | |
| Other | | | 7,545 | | | | 6,535 | |
| | | $ | 100,539 | | | $ | 74,608 | |
| | | 2015 | | | 2014 | |
| | | US$(000) | | | US$(000) | |
| | | | | | | |
| Precious metals | | | 404 | | | | 3,265 | |
| Leach in-circuit | | | 5,950 | | | | 7,269 | |
| Mill in-circuit | | | 1,580 | | | | 815 | |
| Materials and supplies | | | 54,711 | | | | 58,386 | |
| | | | 62,645 | | | | 69,735 | |
| Allowance for obsolescence of materials and supplies (b) | | | (5,881 | ) | | | (4,832 | ) |
| | | | | | | | | |
| | | | 56,764 | | | | 64,903 | |
| (b) | The allowance for obsolescence of material and supplies had the following movement during the years 2015, 2014 and 2013: |
| | | 2015 | | | 2014 | | | 2013 | |
| | | US$(000) | | | US$(000) | | | US$(000) | |
| | | | | | | | | | |
| Opening balance | | | 4,832 | | | | 5,568 | | | | 3,297 | |
| Provision for impairment of materials and supplies | | | 5,060 | | | | 2,849 | | | | 2,271 | |
| Reversal of provision for impairment of materials and supplies | | | (4,011 | ) | | | (3,585 | ) | | | - | |
| | | | | | | | | | | | | |
| Ending balance | | | 5,881 | | | | 4,832 | | | | 5,568 | |
| 8. | INVENTORIESStockpiles and ore on leach pads |
| (a) | This caption is made up as follows: |
| | | At December 31, | |
| | | 2012 | | | 2011 | |
| Leach in-process | | $ | 4,624 | | | $ | 17,984 | |
| Mill in-circuit | | | 13,620 | | | | 1,092 | |
| Precious metals | | | 7,942 | | | | 2 | |
| Materials and supplies | | | 61,227 | | | | 44,423 | |
| | | $ | 87,413 | | | $ | 63,501 | |
| | | 2015 | | | 2014 | |
| | | US$(000) | | | US$(000) | |
| | | | | | | |
| Current portion - | | | | | | | | |
| Stockpiles | | | 91,920 | | | | 137,852 | |
| Ore on leach pads | | | 210,517 | | | | 204,148 | |
| Provision for net realizable value adjustment (b) | | | (64,827 | ) | | | (71,489 | ) |
| | | | | | | | | |
| | | | 237,610 | | | | 270,511 | |
| Non-current portion - | | | | | | | | |
| Stockpiles | | | 95,484 | | | | 92,217 | |
| Ore on leach pads | | | 138,470 | | | | 215,197 | |
| Provision for net realizable value adjustment (b) | | | (25,471 | ) | | | (91,605 | ) |
| | | | | | | | | |
| | | | 208,483 | | | | 215,809 | |
Notes to the consolidated financial statements (continued)
| (b) | The provision for net realizable value adjustment had the following movement during the years 2015, 2014 and 2013: |
| | | 2015 | | | 2014 | | | 2013 | |
| | | US$(000) | | | US$(000) | | | US$(000) | |
| | | | | | | | | | |
| Opening balance | | | 163,094 | | | | 147,342 | | | | 5,375 | |
| Provision | | | 64,497 | | | | 95,859 | | | | 146,051 | |
| Reversal of provision | | | (137,293 | ) | | | (80,107 | ) | | | (4,084 | ) |
| | | | | | | | | | | | | |
| Ending balance | | | 90,298 | | | | 163,094 | | | | 147,342 | |
| 9. | STOCKPILES AND ORE ON LEACH PADSAvailable-for-Sale Financial Assets |
| | | At December 31, | |
| | | 2012 | | | 2011 | |
| Current: | | | | | | | | |
| Stockpiles | | $ | 30,979 | | | $ | 36,384 | |
| Ore on leach pads | | | 114,567 | | | | 123,329 | |
| | | $ | 145,546 | | | $ | 159,713 | |
| Long-term: | | | | | | | | |
| Stockpiles | | $ | 88,615 | | | $ | 71,474 | |
| Ore on leach pads | | | 263,471 | | | | 280,468 | |
| | | $ | 352,086 | | | $ | 351,942 | |
MINERA YANACOCHA S.R.L.In November 2008, the Company funded the San Jose Reservoir Trust for US$13 million to ensure the continuity of the Company's operations in the San Jose Reservoir after 2018. Such trust is irrevocable and is a separate legal entity of the Company. The grantor is the Company, the trustee is the Banco de Credito del Peru and the beneficiary is the Company; therefore, the Company consolidates the trust. As of December 31, 2015, the trust total balance is US$15,803,000 and is presented as Available-for-sale financial assets (trust total balance of US$16,884,000 as of December 31, 2014).
NOTES TO THE CONSOLIDATED FINANCIAL STATEMENTSDuring 2015, these investments, denominated in U.S. dollars, accrued losses net of taxes of US$757,000 (income of US$65,000 and loss of US$226,000 in 2014 and 2013, respectively) which are included in other comprehensive income.
(dollars in thousands unless otherwise stated)
Notes to the consolidated financial statements (continued)
| 10. | OTHER ASSETSProperty, plant and equipment, net |
| (a) | Below is presented the movement in cost: |
| | | At December 31, | |
| | | 2012 | | | 2011 | |
| Other current assets: | | | | | | | | |
| Prepayments to suppliers and contractors | | | 14,510 | | | $ | 11,084 | |
| Claims for tax refunds | | | 4,335 | | | | 4,335 | |
| Restricted cash | | | 1,045 | | | | 943 | |
| Prepaid expenses and other | | | 2,444 | | | | 5,281 | |
| | | | 22,334 | | | $ | 21,643 | |
| Other long-term assets: | | | | | | | | |
| Intangible assets, net | | | 54,549 | | | $ | 59,748 | |
| San José Reservoir Trust assets | | | 17,127 | | | | 15,502 | |
| Other | | | 2,134 | | | | 1,404 | |
| | | $ | 73,810 | | | $ | 76,654 | |
| | | Opening
balance | | | Additions | | | Sales and
Disposals | | | Transfer/Other changes | | | Final balances | |
| | | US$(000) | | | US$(000) | | | US$(000) | | | US$(000) | | | US$(000) | |
| | | | | | | | | | | | | | | | |
| Year 2015 | | | | | | | | | | | | | | | | | | | | |
| Cost- | | | | | | | | | | | | | | | | | | | | |
| Land | | | 15,335 | | | | - | | | | (272 | ) | | | 233 | | | | 15,296 | |
| Land improvements | | | 22,730 | | | | - | | | | - | | | | - | | | | 22,730 | |
| Building and constructions | | | 622,928 | | | | - | | | | (304 | ) | | | 51,856 | | | | 674,480 | |
| Machinery and equipment | | | 322,441 | | | | - | | | | (25,211 | ) | | | 25,460 | | | | 322,690 | |
| Leach pads | | | 571,388 | | | | - | | | | - | | | | - | | | | 571,388 | |
| Vehicles | | | 9,278 | | | | - | | | | (1,186 | ) | | | 32 | | | | 8,124 | |
| Furniture and fixtures | | | 2,031 | | | | - | | | | - | | | | - | | | | 2,031 | |
| Other equipment | | | 64,137 | | | | 225 | | | | (58 | ) | | | 4,679 | | | | 68,983 | |
| Work in progress | | | 593,906 | | | | 99,336 | | | | - | | | | (92,887 | ) | | | 600,355 | |
| Mining rights | | | 33,800 | | | | - | | | | - | | | | - | | | | 33,800 | |
| Asset retirement and mine closure | | | 245,903 | | | | 10,434 | | | | - | | | | - | | | | 256,337 | |
| Stripping activity asset | | | 157,649 | | | | 18,868 | | | | - | | | | - | | | | 176,517 | |
| Mine development | | | 475,441 | | | | - | | | | - | | | | 10,491 | | | | 485,932 | |
| | | | 3,136,967 | | | | 128,863 | | | | (27,031 | ) | | | (136 | ) | | | 3,238,663 | |
| | | | | | | | | | | | | | | | | | | | | |
| Accumulated depreciation and amortization | | | | | | | | | | | | | | | | | | | | |
| Land improvements | | | 15,812 | | | | - | | | | - | | | | (5,334 | ) | | | 10,478 | |
| Building and constructions | | | 310,906 | | | | 72,899 | | | | (95 | ) | | | - | | | | 383,710 | |
| Machinery and equipment | | | 213,795 | | | | 20,999 | | | | (21,732 | ) | | | - | | | | 213,062 | |
| Leach pads | | | 519,142 | | | | 26,779 | | | | - | | | | - | | | | 545,921 | |
| Vehicles | | | 8,086 | | | | 800 | | | | (1,111 | ) | | | - | | | | 7,775 | |
| Furniture and fixtures | | | 1,991 | | | | 11 | | | | - | | | | - | | | | 2,002 | |
| Other equipment | | | 55,928 | | | | 1,600 | | | | (58 | ) | | | - | | | | 57,470 | |
| Mining rights | | | 19,744 | | | | - | | | | - | | | | - | | | | 19,744 | |
| Asset retirement and mine closure | | | 121,102 | | | | 48,135 | | | | - | | | | - | | | | 169,237 | |
| Stripping activity asset | | | 138,178 | | | | - | | | | - | | | | - | | | | 138,178 | |
| Mine development | | | 276,954 | | | | 44,188 | | | | - | | | | 5,334 | | | | 326,476 | |
| | | | 1,681,638 | | | | 215,411 | | | | (22,996 | ) | | | - | | | | 1,874,053 | |
| | | | | | | | | | | | | | | | | | | | | |
| Net cost | | | 1,455,329 | | | | | | | | | | | | | | | | 1,364,610 | |
Notes to the consolidated financial statements (continued)
| | | Opening
balance | | | Additions | | | Sales and
Disposals | | | Impairment
loss | | | Transfer/Other changes | | | Final balances | |
| | | US$(000) | | | US$(000) | | | US$(000) | | | US$(000) | | | US$(000) | | | US$(000) | |
| | | | | | | | | | | | | | | | | | | |
| Year 2014 | | | | | | | | | | | | | | | | | | | | | | | | |
| Cost- | | | | | | | | | | | | | | | | | | | | | | | | |
| Land | | | 21,142 | | | | - | | | | (243 | ) | | | (5,564 | ) | | | - | | | | 15,335 | |
| Land improvements | | | 30,977 | | | | - | | | | - | | | | (8,247 | ) | | | - | | | | 22,730 | |
| Building and constructions | | | 670,767 | | | | - | | | | (1,250 | ) | | | (225,977 | ) | | | 179,388 | | | | 622,928 | |
| Machinery and equipment | | | 493,703 | | | | - | | | | (80,982 | ) | | | (116,971 | ) | | | 26,691 | | | | 322,441 | |
| Leach pads | | | 691,535 | | | | - | | | | - | | | | (207,279 | ) | | | 87,132 | | | | 571,388 | |
| Vehicles | | | 13,651 | | | | - | | | | (1,011 | ) | | | (3,362 | ) | | | - | | | | 9,278 | |
| Furniture and fixtures | | | 2,742 | | | | - | | | | - | | | | (711 | ) | | | - | | | | 2,031 | |
| Other equipment | | | 87,557 | | | | 96 | | | | (434 | ) | | | (23,262 | ) | | | 180 | | | | 64,137 | |
| Work in progress | | | 985,759 | | | | 111,598 | | | | - | | | | (215,449 | ) | | | (288,002 | ) | | | 593,906 | |
| Mining rights | | | 46,061 | | | | - | | | | - | | | | (12,261 | ) | | | - | | | | 33,800 | |
| Asset retirement and mine closure | | | 270,589 | | | | 64,520 | | | | - | | | | (89,206 | ) | | | - | | | | 245,903 | |
| Stripping activity asset | | | 110,349 | | | | 104,487 | | | | - | | | | (57,187 | ) | | | - | | | | 157,649 | |
| Mine development | | | 644,904 | | | | - | | | | - | | | | (172,476 | ) | | | 3,013 | | | | 475,441 | |
| | | | | | | | | | | | | | | | | | | | | | | | | |
| | | | 4,069,736 | | | | 280,701 | | | | (83,920 | ) | | | (1,137,952 | ) | | | 8,402 | | | | 3,136,967 | |
| | | | | | | | | | | | | | | | | | | | | | | | | |
| Accumulated depreciation and amortization | | | | | | | | | | | | | | | | | | | | | | | | |
| Land improvements | | | 19,080 | | | | | | | | | | | | (5,737 | ) | | | 2,469 | | | | 15,812 | |
| Building and constructions | | | 348,455 | | | | 70,578 | | | | (629 | ) | | | (112,786 | ) | | | 5,288 | | | | 310,906 | |
| Machinery and equipment | | | 302,722 | | | | 28,117 | | | | (39,137 | ) | | | (77,558 | ) | | | (349 | ) | | | 213,795 | |
| Leach pads | | | 674,162 | | | | 32,691 | | | | - | | | | (188,326 | ) | | | 615 | | | | 519,142 | |
| Vehicles | | | 10,708 | | | | 432 | | | | (987 | ) | | | (2,930 | ) | | | 863 | | | | 8,086 | |
| Furniture and fixtures | | | 2,675 | | | | 11 | | | | - | | | | (697 | ) | | | 2 | | | | 1,991 | |
| Other equipment | | | 74,731 | | | | 687 | | | | (230 | ) | | | (20,285 | ) | | | 1,025 | | | | 55,928 | |
| Mining rights | | | 6,208 | | | | - | | | | - | | | | (7,162 | ) | | | 20,698 | | | | 19,744 | |
| Asset retirement and mine closure | | | 126,291 | | | | 39,214 | | | | - | | | | (43,932 | ) | | | (471 | ) | | | 121,102 | |
| Stripping activity asset | | | 66,029 | | | | 96,785 | | | | - | | | | (50,124 | ) | | | 25,488 | | | | 138,178 | |
| Mine development | | | 342,726 | | | | 85,534 | | | | - | | | | (100,471 | ) | | | (50,835 | ) | | | 276,954 | |
| | | | 1,973,787 | | | | 354,049 | | | | (40,983 | ) | | | (610,008 | ) | | | 4,793 | | | | 1,681,638 | |
| | | | | | | | | | | | | | | | | | | | | | | | | |
| Net cost | | | 2,095,949 | | | | | | | | | | | | | | | | | | | | 1,455,329 | |
Additions to work in progress in 2015 are primarily related to the Water treatment project and Yanacocha Laybacks Checkpoint 2A and Asset Componetization project.
The depreciation and amortization expense for the year ended December 31, 2015, was recorded as Cost applicable to sales in the statement of comprehensive income.
Notes to the consolidated financial statements (continued)
| (b) | Impairment of long-lived assets - |
In accordance with its accounting policies and processes, each asset or Cash Generating Unit “CGU” is evaluated annually at year end, to determine whether there are any indications of impairment. If any such indications of impairment exist, a formal estimate of the recoverable amount is performed.
In assessing whether impairment is required, the carrying value of the asset or CGU is compared with its recoverable amount. The recoverable amount is the higher of the CGU’s fair value less costs of disposal (FVLCD) and value in use (VIU). Given the nature of the Company’s activities, information on the fair value of an asset is usually difficult to obtain unless negotiations with potential purchasers or similar transactions are taking place. Consequently, the recoverable amount for each CGU is estimated based on estimated discounted future estimated cash flows expected to be generated from the continued use of the CGUs using market based commodity price and exchange assumptions, estimated quantities of recoverable minerals, production levels, operating costs and capital requirements, and its eventual disposal, based on the latest life of mine (LOM) plans. These cash flows are discounted using a real pre-tax discount rate that reflects current market assessments of the time value of money and the risks specific to the CGU.
Estimates include quantities of recoverable minerals, production levels, operating costs and capital requirements and sourced from out planning process, including the LOM plans, one-year budgets and CGU-specific studies.
As a result of the recoverable amount analysis performed during the year, the Company did not recognize an impairment loss related to mine properties in 2015.In 2014, the Company recorded an impairment loss amounting to US$541 million related to Conga, and no loss was recorded for Yanacocha (US$1,038 million for the year ended December 31, 2013: US$453 million related to Yanacocha and US$585 million related to Conga).
Key assumptions used for the impairment testing as of December 31, 2015:
The determination of value in use is most sensitive to the following key assumptions:
Production volumes: Estimated production volumes are based on detailed life-of-mine plans and take into account development plans for the mines agreed by management as part of planning process. Production volumes are dependent on a number of variables, such as: the recoverable quantities; the production profile; the cost of the development of the infrastructure necessary to extract the reserves; the production costs; the contractual duration of mining rights; and the selling price of the commodities extracted.
Notes to the consolidated financial statements (continued)
As each producing mining unit has specific reserve characteristics and economic circumstances, the cash flows of December 31, 2012,Prepaymentsthe mines are computed using appropriate individual economic models and key assumptions established by management. The production profiles used were consistent with the reserves and resource volumes approved as part of the Company’s process for the estimation of proved and probable reserves and resource estimates.
Commodity prices: Forecasted commodity prices are based on management’s estimates and are derived from forward price curves and long-term views of global supply and demand, building on past experience of the industry and consistent with external sources. These prices were adjusted to suppliersarrive at appropriate consistent price assumptions for the different qualities and contractors is relatedtype of commodities, or, where appropriate, contracted prices were applied. These prices are reviewed at least annually.
Estimated prices for the current and long-term periods that have been used to estimate future revenues are as follows:
| | | Current | | | Long-term | |
| | | US$ | | | US$ | |
| | | | | | | |
| Gold (per ounce) | | | 1,106 | | | | 1,300 | |
| Copper (per pound) | | | 2.50 | | | | 3.00 | |
Discount rate: In calculating the value in use, a pre-tax discount rate of 8.4% was applied to the purchasepre-tax cash flows. This discount rate is derived from the Company’s post-tax weighted average cost of equipment of $3,398, supplies of $91 and other services $11,021.
Intangible assets relatecapital (WACC), with appropriate adjustments made to an alternative roadreflect the risks specific to the coast.CGU.
| 11. | PROPERTY, PLANT AND MINE DEVELOPMENT, NETTrade and other payables |
| (a) | This caption is made up as follows: |
| | | At December 31, 2012 | | | At December 31, 2011 | |
| | | Cost | | | Accumulated
Amortization | | | Net Book
Value | | | Cost | | | Accumulated
Amortization | | | Net Book
Value | |
| Land | | $ | 76,397 | | | $ | - | | | $ | 76,397 | | | $ | 76,300 | | | $ | - | | | $ | 76,300 | |
| Facilities and equipment | | | 2,457,548 | | | | (1,810,348 | ) | | | 647,200 | | | | 2,345,712 | | | | (1,655,887 | ) | | | 689,825 | |
| Mine development | | | 930,709 | | | | (408,700 | ) | | | 522,009 | | | | 673,704 | | | | (323,736 | ) | | | 349,968 | |
| Mineral interests | | | 69,779 | | | | (8,934 | ) | | | 60,845 | | | | 69,408 | | | | (7,898 | ) | | | 61,510 | |
| Asset retirement cost | | | 451,647 | | | | (164,240 | ) | | | 287,407 | | | | 288,597 | | | | (150,420 | ) | | | 138,177 | |
| Construction-in-progress | | | 1,526,315 | | | | - | | | | 1,526,315 | | | | 915,432 | | | | - | | | | 915,432 | |
| | | $ | 5,512,395 | | | $ | (2,392,222 | ) | | $ | 3,120,173 | | | $ | 4,369,153 | | | $ | (2,137,941 | ) | | $ | 2,231,212 | |
| | | 2015 | | | 2014 | |
| | | US$(000) | | | US$(000) | |
| | | | | | | |
| Trade payables (b) | | | | | | | | |
| Domestic suppliers | | | 56,447 | | | | 69,788 | |
| Related entities, Note 21 | | | 10,792 | | | | 51,071 | |
| | | | | | | | | |
| | | | 67,239 | | | | 120,859 | |
| | | | | | | | | |
| Other payables | | | | | | | | |
| Remuneration and similar benefits payable | | | 8,981 | | | | 13,390 | |
| Royalties payable to the Peruvian State | | | 1,541 | | | | 3,758 | |
| Taxes payable | | | 489 | | | | 812 | |
| | | | | | | | | |
| | | | 11,011 | | | | 17,960 | |
| | | | | | | | | |
| | | | 78,250 | | | | 138,819 | |
Construction - in - progress for 2012 of $1,526,315 related primarily to leach pad development, surface development and Conga reservoir engineering and procurement activities.
| (b) | Trade payables arise mainly from the acquisition of materials, supplies and spare parts and services provided by third parties. These obligations, have current maturities, accrue no interest, are not secured and are mostly denominated in U.S. dollars. |
Construction - in - progress for 2011 of $915,432 primarily related to project development costs for Conga and leach pad expansion.
| | | Method | | Depreciable
Life (in
years) | |
Facilities and equipment: | | Straight line | | | 8 to 25 | |
Facilities | | | | | 8 to 25 | |
Leach pads | | | | | 5 | |
Equipment | | | | | 2.5 to 10.5F-134 | |
NOTES TO THE CONSOLIDATED FINANCIAL STATEMENTSNotes to the consolidated financial statements (continued)
(dollars in thousands unless otherwise stated)
| | Method | | Depreciable
Life (in
years) | |
Other | | | | | 5 | |
Mine development | | UOP based on ounces mined | | | 8 to 21 | |
Mineral interests | | UOP for producing property | | | 12 | |
Asset retirement cost | | Related asset | | | 5 to 15 | |
| | | At December 31, 2012 | | | At December 31, 2011 | |
| | | Gross
Carrying
Value | | | Accumulated
Amortization | | | Net Book
Value | | | Gross
Carrying
Value | | | Accumulated
Amortization | | | Net Book
Value | |
| Mineral Interest | | | | | | | | | | | | | | | | | | | | | | | | |
| | | | | | | | | | | | | | | | | | | | | | | | | |
| Production stage | | $ | 32,299 | | | $ | (8,760) | | | $ | 23,539 | | | $ | 31,928 | | | $ | (7,724 | ) | | $ | 24,204 | |
| Development stage | | | 20,298 | | | | (174 | ) | | | 20,124 | | | | 20,298 | | | | (174 | ) | | | 20,124 | |
| Exploration stage | | | 17,182 | | | | - | | | | 17,182 | | | | 17,182 | | | | - | | | | 17,182 | |
| | | $ | 69,779 | | | $ | (8,934) | | | $ | 60,845 | | | $ | 69,408 | | | $ | (7,898 | ) | | $ | 61,510 | |
| 12. | DUE TO/FROM RELATED PARTIESProvisions |
| (a) | This caption is made up as follows: |
The Company has the following amounts due from and to related parties:
| | | At December 31, | |
| | | 2012 | | | 2011 | |
| Due from related parties: | | | | | | | | |
| Newmont Boddington Gold Pty Ltd | | $ | 6,466 | | | $ | - | |
| Newmont USA Limited | | | 4,988 | | | | - | |
| Newmont International Service Limited | | | 2,592 | | | | - | |
| Newmont Insurance Limited | | | 1,000 | | | | 1,000 | |
| Suriname Gold | | | 374 | | | | 132 | |
| Newmont Peru S.R.L. | | | 148 | | | | - | |
| Newmont Santa Fe Pacific Chile | | | 26 | | | | 92 | |
| Newmont (Other) | | | 1,611 | | | | - | |
| | | $ | 17,205 | | | $ | 1,224 | |
| | | At December 31, | |
| | | 2012 | | | 2011 | |
| Due to related parties: | | | | | | | | |
| Newmont USA Limited | | $ | 17,161 | | | $ | 6,392 | |
| S.M.R.L. Chaupiloma Dos de Cajamarca | | | 12,557 | | | | 17,368 | |
| Newmont Technologies Limited | | | 6,687 | | | | 2,199 | |
| Newmont International Service Limited | | | 5,865 | | | | - | |
| Newmont Peru S.R.L. | | | 5,193 | | | | 8,393 | |
| Newmont Santa Fe Pacific Chile | | | 315 | | | | 964 | |
| Newmont (Other) | | | 1,621 | | | | - | |
| | | $ | 49, 399 | | | $ | 35,316 | |
MINERA YANACOCHA S.R.L.
NOTES TO THE CONSOLIDATED FINANCIAL STATEMENTS
(dollars in thousands unless otherwise stated)
Management, exploration, mine development, engineering and employment services are received pursuant to contracts with affiliates. The corresponding charges totaled $88,476 and $66,506 in 2012 and 2011, respectively.
As described in Note 1, the Company pays to Chaupiloma a 3% royalty based on quarterly production sold at current market prices, after deducting refinery and transportation costs. Royalty expense totaled $66,586, $60,816 and $55,765 in 2012, 2011 and 2010, respectively and is included inCosts applicable to sales.
| | | 2015 | | | 2014 | |
| | | US$(000) | | | US$(000) | |
| | | | | | | |
| Provision for closure of mining units and exploration projects (b) | | | 578,959 | | | | 557,457 | |
| Provision of social responsibility | | | 29,083 | �� | | | 28,727 | |
| Workers’ profit sharing payable (c) | | | 19,526 | | | | 31,053 | |
| Accrual of operating costs | | | 13,319 | | | | 10,895 | |
| Other provisions | | | 5,122 | | | | 1,005 | |
| | | | | | | | | |
| | | | 646,009 | | | | 629,137 | |
| | | | | | | | | |
| Classification by maturity: | | | | | | | | |
| Current portion | | | 41,961 | | | | 55,585 | |
| Non-current portion | | | 604,048 | | | | 573,552 | |
| | | | | | | | | |
| | | | 646,009 | | | | 629,137 | |
| 13.(b) | WORKERS’ PROFIT PARTICIPATIONProvision for closure of mining units and explorations projects. |
In accordance with Peruvian legislation, the Company maintains an employee profit sharing plan equal to 8% of annual taxable income. Distributions to employees under the plan are based 50% on the number of days that each employee worked during the preceding year and 50% on proportionate annual salary levels.
In 2012, 2011 and 2010, the current expense portion of workers’ profit participation amounted to $80,748, $79,057 and $77,578, respectively, which was included inCosts applicable to sales.
Peruvian law limits payments of annual profit sharing per employee to eighteen months salary but continues to base total profit sharing on 8% of taxable income, notwithstanding the per employee limitation. Supreme Decree N°009-98-TR, published on August 6, 1998, provides that the excess of total profit sharing for the year over aggregate profit sharing payable to all employees be paid to the Fondo Nacional de Capacitación Laboral y de Promoción del Empleo (“FONDOEMPLEO”).Law 28464 published in January 2005, which modified art.3 of Law Decree 892, provides that the excess of total profit sharing for the year over aggregate profit sharing payable to all employees be applied to training of employees and construction of public facilities. Supreme Decree N° 002-2005-TR, published in May 6, 2005, establishes a limit of 2,200 UIT (inflation measurement unit, of S/.3,650 new Peruvian sol per unit at December 31, 2012) in the contributions to FONDOEMPLEO indicating that the difference goes to the Regional Government.
| 14. | OTHER CURRENT LIABILITIES |
| | | At December 31, | |
| | | 2012 | | | 2011 | |
| Accrued capital expenditures | | $ | 56,296 | | | $ | 111,438 | |
| Contractors fund retention guarantee | | | 32,524 | | | | 23,980 | |
| Accrued operating costs | | | 18,686 | | | | 17,051 | |
| Reclamation and remediation | | | 21,411 | | | | 10,598 | |
| Payroll and other benefits | | | 9,053 | | | | 10,425 | |
| Taxes other than income and mining | | | 2,194 | | | | 8,025 | |
| Income tax withholding | | | 3,222 | | | | 5,832 | |
| Deferred revenues | | | 660 | | | | 4,270 | |
| Other | | | 1,032 | | | | 1,123 | |
| | | $ | 145,078 | | | $ | 192,742 | |
MINERA YANACOCHA S.R.L.
NOTES TO THE CONSOLIDATED FINANCIAL STATEMENTS
(dollars in thousands unless otherwise stated)
Accrued capital projects are mainly related to Conga, Western Oxides, Carachugo Water Treatment and other minor projects.
| 15. | RECLAMATION AND REMEDIATION |
The Company’sCompany's mining and exploration activities are subject to various laws and regulations governing the protection of the environment. These laws and regulations are continually changing and are generally becoming more restrictive. The Company conducts its operations so as to protect the public health and environment and believes its operations are in compliance with all applicable laws and regulations in all material respects. The Company has made, and expects to make in the future, expenditures to comply with such laws and regulations, but cannot predict the amount of such future expenditures. Estimated future reclamation costs are based principally on legal and regulatory requirements.
The liability corresponds primarily tofor reclamation or the Asset retirement obligation (“ARO”) comprises activities to be performedcarried out by the Company in the reclamationrestoration of mines and remediationadjacent areas in the completion stage of mining activities once the gold extraction process has been finished. Theseprocess. Such activities include reclamationthe restoration of the mine sites, operatingmining locations, water treatment plants, revegetationplant operations, as well as reforestation and earthworks.land treatments.
Notes to the consolidated financial statements (continued)
The followingmovement of the ARO for 2015, 2014 and 2013 is a reconciliation of reclamation and remediation liabilities:broken down as follows:
| | | Years Ended December 31, | |
| | | 2012 | | | 2011 | | | 2010 | |
| | | | | | | | | | |
| Balance at beginning of year | | $ | 353,875 | | | $ | 287,890 | | | $ | 191,435 | |
| Addtions change in estimates and other settled | | | 163,050 | | | | 52,732 | | | | 87,182 | |
| Liabilities settled | | | (7,661 | ) | | | (5,882 | ) | | | (5,191 | ) |
| Accretion expense | | | 20,090 | | | | 19,135 | | | | 14,464 | |
| Balance at end of year | | $ | 529,354 | | | $ | 353,875 | | | $ | 287,890 | |
The current portion ofReclamation and remediationof $21,411 and $10,598 at December 31, 2012 and 2011, respectively, are included inOther current liabilities.
| | | 2015 | | | 2014 | | | 2013 | |
| | | US$(000) | | | US$(000) | | | US$(000) | |
| | | | | | | | | | |
| Opening balance | | | 557,457 | | | | 460,127 | | | | 392,217 | |
| Additional provisions | | | 10,434 | | | | 84,835 | | | | 54,184 | |
| Payments | | | (11,007 | ) | | | (10,419 | ) | | | (4,387 | ) |
| Unwinding of discount, Note 19 | | | 22,075 | | | | 22,914 | | | | 18,113 | |
| | | | | | | | | | | | | |
| Final balance | | | 578,959 | | | | 557,457 | | | | 460,127 | |
| | | | | | | | | | | | | |
| Classification by maturity | | | | | | | | | | | | |
| Current portion | | | 6,698 | | | | 15,112 | | | | 34,848 | |
| Non-current portion | | | 572,261 | | | | 542,345 | | | | 425,279 | |
| | | | | | | | | | | | | |
| | | | 578,959 | | | | 557,457 | | | | 460,127 | |
The increase in the asset retirement obligation in 20122015 relates to additional remediation and reclamation requirements caused by the impact of mining activities during 2012,2015, additional costs for waste rock reclamation and new Peruvian regulatory requirements that extended the water treatment and monitoring requirements more than 20 years.
MINERA YANACOCHA S.R.L.
| (c) | Workers' profit sharing - |
NOTES TO THE CONSOLIDATED FINANCIAL STATEMENTS
(dollars in thousands unless otherwise stated)In accordance with Peruvian legislation, the Company maintains an employee profit sharing plan equal to 8% of annual taxable income. Distributions to employees under the plan are based 50% on the number of days that each employee worked during the preceding year and 50% on proportionate annual salary levels.
| 16.13. | PARTNERS’ EQUITYPartners’ equity, net |
| (a) | Partners’ contributions - |
Partners’ Contributions
Partners’ contributions represent comprise1,278,451,304 common partnership interests with aat par value of one Peruvian Nuevo solSol each, fully subscribed and paid.paid-in. Such partnership interest includes 720,407,310 shares that are owned by foreign investors.
Under current Peruvian regulations, there is no restriction on the remittance of dividends or repatriation of foreign investment, except as discussed in sections below.
The legal structure of the Company is that of a Limited Liability Partnership. The main characteristicsPeruvian limited liability partnership. Major features of such legal structure are: (i) the number of Partners cannot exceed 20, (ii) the capital is represented bycomprises the partnership interests, and (iii) there is no obligation to create a legal reserve.
Retained Earnings
Effective January 1, 2003, distributionDistribution of earnings forto Partners other than legal entities domiciled in Peru is subject to a withholding income tax charged to the partners.
Notes to the consolidated financial statements (continued)
For individuals and non-resident legal entities, the applicable tax rate is 6.8% for dividend distributions in cash or non-monetary assets for fiscal years 2015 and 2016; whereas during fiscal years 2017 and 2018 the applicable tax rate will be 8.8%; and 9.3% from 2019, onward.
| (a) | Tax stabilization agreements |
The Company has entered into the following tax stability agreements, each with a term of 4.1%15 years:
| Mine | Effective | Date of the Tax
Agreement | Tax Regimes in Force |
| | | |
| Cerro Yanacocha | January 1, 2000 | September 16, 1998 | May 22, 1997 |
| La Quinua | January 1, 2004 | August 25, 2003 | August 25,2003 |
The Cerro Yanacocha tax stabilization agreement expired on January 1, 2015 and is no longer in effect.
The agreement for La Quinua guarantees the Company's use of the tax regime shown in the table above and permits maintenance of its accounting records in U.S. dollars for tax purposes.
The Company determines taxable income based on its understanding and that of its legal advisors, of applicable tax legislation. Taxable income differs from pre-tax income disclosed within these financial statements by those items that the applicable tax legislation deems to be non-taxable or non-deductible.
For the year 2015, the income tax rate was 28%, except for the La Quinua mine, which was 29%.
Accumulated Other ComprehensiveOn December 31, 2014, the Peruvian Government enacted modifications to Income Tax regulations, effective January 1, 2015. Among the modifications, a progressive income tax rate reduction was approved as follows: 28% for fiscal years 2015 and 2016; 27% for fiscal years 2017 and 2018; and 26% from 2019, onward.
| | | At December 31, | |
| | | 2012 | | | 2011 | |
| | | | | | | | | |
| Unrealized gain on marketable securities, net of taxes | | $ | 2,006 | | | $ | 877 | |
| | | $ | 2,006 | | | $ | 877 | |
| (i) | Law No.29788, Mining Royalties |
On 28 September 2011, the Peruvian Government enacted new legislation to comprise a new mining tax payable to the Peruvian Government for extracting metallic and non-metallic mineral resources from its mining concessions.
Pursuant to this legislation, the mining royalty is payable quarterly based on sales and operating profit determined in accordance with IFRS. The royalty amount due is 1% of revenue. An additional mining tax due is calculated based on the level of operating profit up to a maximum applicable rate of 12%. This component of the new mining tax only applies to those projects that are not covered by a tax stabilization agreement. During 2015, 2014 and 2013, the amounts included in cost of production were US$2,456,000, US$8,291,000 and US$7,247,000, respectively and during 2014 and 2013 the amounts included in mining tax expense were US$ 1,714,000 and US$6,245,000, respectively.
Notes to the consolidated financial statements (continued)
| (ii) | Law No.29789, Special Mining Tax |
The Special Mining Tax ("IEM") applies to mines not covered by a tax stabilization agreement. The IEM is payable on a quarterly basis with rates ranging from 2% to 8.4% of operating profit determined, in accordance with IFRS.
The rate varies depending on the level of operating profit. During 2015, 2014 and 2013 the amounts included in income and mining tax expense were US$1,838,000, US$5,479,000 and US$11,721,000, respectively.
| (iii) | Law No. 29790, Special Mining Burden |
The Special Mining Burden ("GEM") applies to mines covered by a tax stabilization agreement. The GEM is payable on a quarterly basis with rates ranging from 4% to 13.12% of operating profit, determined in accordance with IFRS. The rate varies depending on the level of operating profit margin. The GEM applied to operations at Cerro Yanacocha and La Quinua in 2015, 2014 and 2013. This resulted in US$19,883,000, US$7,156,000 and US$22,707,000, respectively, of additional Income and mining tax expense.
| (iv) | Law No. 29471, Supplementary Fund |
The Supplementary Fund for retirement of mining applies to metallurgical and steel workers, affiliated to the National Pension System (“SNP”) and the Private Pension System (“PPS”); and is applicable since May 11, 2012. This Fund is formed by employee and employer contributions which are distributed according to the following detail:
| - | Employers will contribute 0.5% of the annual income before taxes; |
| - | Employees will contribute 0.5% of their monthly gross salary; |
| - | The employer's contributions are paid before tax; therefore these amounts are deductible expenses for the year. |
The new pension fund tax is calculated based on annual income determined in accordance with Peruvian generally accepted accounting principles and is payable quarterly. During 2015 and 2014, the amounts included in Income and mining tax expense amounted to US$459,000 and US$2,288,000, respectively.
Notes to the consolidated financial statements (continued)
The Company's income tax provision consisted of the following:
| | | 2015 | | | 2014 | | | 2013 | |
| | | US$(000) | | | US$(000) | | | US$(000) | |
| | | | | | | | | | |
| Current Peruvian tax returns | | | 98,319 | | | | 123,007 | | | | 175,542 | |
| Royalties and mining taxes | | | 21,721 | | | | 14,349 | | | | 40,673 | |
| Other taxes | | | 639 | | | | 914 | | | | 590 | |
| Income tax prior year adjustments | | | (1,766 | ) | | | - | | | | 10,348 | |
| Current income tax expense | | | 118,913 | | | | 138,270 | | | | 227,153 | |
| Deferred income tax expense (benefit) | | | 483,804 | | | | (168,761 | ) | | | (430,624 | ) |
| | | | | | | | | | | | | |
| Income tax expense (benefit) | | | 602,717 | | | | (30,491 | ) | | | (203,471 | ) |
| (d) | Deferred income tax asset |
Components of deferred income tax assets (liabilities) are as follows:
| | | 2015 | | | 2014 | |
| | | US$(000) | | | US$(000) | |
| | | | | | | |
| Deferred income tax assets, net | | | | | | | | |
| Property, plant and mine development | | | 303,385 | | | | 326,496 | |
| Reclamation | | | 110,633 | | | | 90,573 | |
| Accounts payable and accrued expenses | | | 66,261 | | | | 46,873 | |
| Inventories | | | 24,887 | | | | 15,903 | |
| Other | | | 4,838 | | | | 3,662 | |
| | | | 510,004 | | | | 483,507 | |
| Deferred income tax liabilities | | | | | | | | |
| Other | | | - | | | | (28 | ) |
| | | | 510,004 | | | | 483,479 | |
| | | | | | | | | |
| Allowance of deferred income tax asset | | | (510,004 | ) | | | - | |
| | | | | | | | | |
| Net deferred income tax asset | | | - | | | | 483,479 | |
In December 2015, the Company recorded a valuation allowance on its deferred income tax asset of US$510 million to the extent that it is not probable that taxable profit will be available against which the deductible temporary differences can be utilized.
Notes to the consolidated financial statements (continued)
| (e) | Reconciliation of income tax expense (benefit) – |
Below is a reconciliation of tax expense and the accounts profit multiplied by the statutory tax rate for the years 2015, 2014 and 2013:
| | | 2015 | | | 2014 | | | 2013 | |
| | | US$(000) | | | US$(000) | | | US$(000) | |
| | | | | | | | | | |
| Income (loss) before income tax | | | 152,522 | | | | (430,829 | ) | | | (778,750 | ) |
| Peruvian statutory tax rate | | | 28% | | | | 30% | | | | 30% | |
| Income tax expense (income) | | | 42,706 | | | | (129,249 | ) | | | (233,625 | ) |
| Valuation allowance on deferred tax asset | | | 510,004 | | | | - | | | | - | |
| Effect of change in income tax rate net | | | 16,576 | | | | 65,020 | | | | - | |
| Mining taxes | | | 15,639 | | | | 10,044 | | | | 40,672 | |
| Non-deductible expenses | | | 15,288 | | | | 24,832 | | | | (8,894 | ) |
| Adjustment due to income tax rate applicable to La Quinua | | | 2,504 | | | | (1,138 | ) | | | (1,624 | ) |
| | | | | | | | | | | | | |
| Total income tax expense (benefit) | | | 602,717 | | | | (30,491 | ) | | | (203,471 | ) |
The Company’s revenues are mainly from sales of gold ounces. The table below presents the net sales to customers by geographic region:
| | | 2015 | | | 2014 | | | 2013 | |
| | | US$(000) | | | US$(000) | | | US$(000) | |
| | | | | | | | | | |
| Sales and services by geographic region: | | | | | | | | | | | | |
| Metal sales | | | | | | | | | | | | |
| Suiza | | | 754,335 | | | | 851,577 | | | | 965,934 | |
| America | | | 315,686 | | | | 358,880 | | | | 492,211 | |
| | | | 1,070,021 | | | | 1,210,457 | | | | 1,458,145 | |
| | | | | | | | | | | | | |
| Royalties (note 1) | | | (32,414 | ) | | | (36,867 | ) | | | (44,185 | ) |
| Mining royalties to the government | | | (6,433 | ) | | | (8,291 | ) | | | (7,135 | ) |
| | | | | | | | | | | | | |
| | | | 1,031,174 | | | | 1,165,299 | | | | 1,406,825 | |
Notes to the consolidated financial statements (continued)
| 16. | Costs applicable to sales |
This caption is made up as follows:
| | | 2015 | | | 2014 | | | 2013 | |
| | | US$(000) | | | US$(000) | | | US$(000) | |
| | | | | | | | | | |
| Beginning balance of inventories | | | 497,669 | | | | 522,596 | | | | 545,183 | |
| Consumption of supplies | | | 210,384 | | | | 246,106 | | | | 300,792 | |
| Personnel expenses | | | 102,867 | | | | 87,290 | | | | 120,568 | |
| Other services | | | 76,490 | | | | 82,805 | | | | 66,670 | |
| Maintenance | | | 38,646 | | | | 38,526 | | | | 52,486 | |
| Power | | | 27,713 | | | | 24,942 | | | | 29,142 | |
| Depreciation and amortization | | | 223,142 | | | | 360,334 | | | | 349,760 | |
| Workers' profit participation | | | 28,852 | | | | 35,055 | | | | 49,259 | |
| Reclamation expenses related to Yanacocha leach pad | | | - | | | | 20,315 | | | | - | |
| Net realizable value adjustment | | | 64,497 | | | | 95,859 | | | | 146,051 | |
| Ending balance of inventories | | | (518,524 | ) | | | (593,528 | ) | | | (668,647 | ) |
| | | | | | | | | | | | | |
| | | | 751,736 | | | | 920,300 | | | | 991,264 | |
| 17. | SUPPLEMENTAL CASH FLOW INFORMATIONOperating expenses, net |
Net cash provided from operations includes the following cash payments:This caption is made up as follows:
| | | Years Ended December 31, | |
| | | 2012 | | | 2011 | | | 2010 | |
| Income and mining taxes paid | | $ | 392,741 | | | $ | 276,740 | | | $ | 332,954 | |
| Interest paid, net of amounts capitalized | | $ | - | | | $ | 24 | | | $ | 1,737 | |
| | | 2015 | | | 2014 | | | 2013 | |
| | | US$(000) | | | US$(000) | | | US$(000) | |
| | | | | | | | | | |
| Exploration and advanced projects | | | 64,230 | | | | 58,880 | | | | 64,510 | |
| Severance program | | | 14,904 | | | | 16,438 | | | | 19,323 | |
| Write-off of fixed assets | | | 2,411 | | | | 3,520 | | | | 584 | |
| Cost of fixed assets sold | | | 1,624 | | | | 39,425 | | | | 23,246 | |
| Income from fixed asset sales | | | (1,116 | ) | | | (40,651 | ) | | | (45,772 | ) |
| Others, net | | | 793 | | | | 169 | | | | 15,643 | |
| | | | | | | | | | | | | |
| | | | 82,846 | | | | 77,781 | | | | 77,534 | |
| 18. | MAJOR CUSTOMERS AND EXPORT SALESAdministrative expenses |
The CompanyThis caption is not economically dependent on a limited number of customers for the sale of its product because gold can be sold through various commodity market traders worldwide. In 2012, sales to one customer accounted for $1,580 which represented 72% of total annual sales. In 2011, sales to one customer accounted for $1,419,109 which represented 71% of total annual sales. In 2010, sales to one customer accounted for $1,326,000 which represented 75% of total annual sales. All gold sales were made outside of Peru.
MINERA YANACOCHA S.R.L.up as follows:
| | | 2015 | | | 2014 | | | 2013 | |
| | | US$(000) | | | US$(000) | | | US$(000) | |
| | | | | | | | | | |
| Management expenses | | | 18,108 | | | | 19,938 | | | | 17,480 | |
| Community development expenses and external affairs | | | 6,297 | | | | 15,653 | | | | 46,482 | |
| Other | | | 1,920 | | | | 2,671 | | | | 3,102 | |
| | | | | | | | | | | | | |
| | | | 26,325 | | | | 38,262 | | | | 67,064 | |
NOTES TO THE CONSOLIDATED FINANCIAL STATEMENTS
(dollars in thousands unless otherwise stated)Notes to the consolidated financial statements (continued)
| 19. | COMMITMENTS AND CONTINGENCIESFinance costs |
IncomeFinancial costs for the years ended December 31, 2015, 2014 and Mining Tax Contingencies
Income2013 are mainly related to the unwinding of the discount of the reclamation and mining tax contingencies are provided for under ASC guidance (see Notes 2mine closure liability amounting to US$22,075,000, US$22,914,000 and 5)US$18,113,000, respectively. See note 12(b).
| 20. | Commitments and contingencies |
Unitization of Properties
properties -
In December 2000, as a result of the unitization plan carried out by the Partners, the Company signed several asset transfer and mining lease agreements with related entities. The main conditions are:
| ·- | The Company must pay to Chaupiloma, 3% of the quarterly net sales, according to the lease agreement. The mining rights subject to this 3% royalty are those identified in the lease agreement as part of the “Area of Influence of Chaupiloma”. Some of these mining rights are in exploitation and the rest of them in exploration. |
| ·- | The Company must pay to S.M.R.L. Coshuro (“Coshuro”) and Buenaventura, 3% of the quarterly net sales, according to the transfer agreement. The mining rights subject to this 3% royalty are those identified in the transfer agreement, and are located out of the “Area of Influence of Chaupiloma” and within the “Area of Influence of the Joint Venture”. These mining rights are currently under exploration. |
| ·- | The Company must pay to Los Tapados S.A., 3% of the quarterly net sales proceeds of mineral extracted from the transferred and leased concessions of Los Tapados S.A. The transferred and leased concessions of Los Tapados S.A. are also subject to a previously existing royalty on the minerals. These mining rights are currently under exploration. |
Legal Proceedings
Choropampa (mercury spill)
In June 2000, a transport contractor of Yanacocha spilled approximately 151 kilograms of elemental mercury near the town of Choropampa, Peru, which is located 53 miles (85 kilometers) southwest of the Yanacocha mine. Elemental mercury is not used in Yanacocha’s operations but is a by-product of gold mining and was sold to a Lima firm for use in medical instruments and industrial applications. A comprehensive health and environmental remediation program was undertaken by Yanacocha in response to the incident. In August 2000, Yanacocha paid under protest a fine of 1,740,000 Peruvian soles (approximately $0.5) to the Peruvian government. Yanacocha has entered into settlement agreements with a number of individuals impacted by the incident. As compensation for the disruption and inconvenience caused by the incident, Yanacocha entered into agreements with and provided a variety of public works in the three communities impacted by this incident. Yanacocha cannot predict the likelihood of additional expenditures related to this matter.
MINERA YANACOCHA S.R.L.
NOTES TO THE CONSOLIDATED FINANCIAL STATEMENTS
(dollars in thousands unless otherwise stated)
Additional lawsuits relating to the Choropampa incident were filed against Yanacocha in the local courts of Cajamarca, Peru, in May 2002 by over 900 Peruvian citizens. A significant number of the plaintiffs in these lawsuits entered into settlement agreements with Yanacocha prior to filing such claims. In April 2008, the Peruvian Supreme Court upheld the validity of these settlement agreements, which the Company expects to result in the dismissal of all claims brought by previously settled plaintiffs. Yanacocha has also entered into settlement agreements with approximately 350 additional plaintiffs. The claims asserted by approximately 200 plaintiffs remain. In 2011, Yanacocha was served with 22 complaints alleging grounds to nullify the settlements entered between Yanacocha and the plaintiffs. Yanacocha has answered the complaints and will continue to vigorously defend its position. Neither the Company nor Yanacocha can reasonably estimate the ultimate loss relating to such claims.
Since December 2010 to date, 23 new claims involving 29 plaintiffs were received by Yanacocha. In this claim, plaintiffs are requesting the Judge to (i) declare void the compensation agreement signed with Yanacocha and to (ii) award them with new compensation amounts. 2 of these new claims involving 2 plaintiffs were dismissed as they did not comply with formal requirements.
In 19 of these cases, the initial presiding judge admitted a motion to dismiss based on prescription of the actions and dismissing the processes. Plaintiffs appealed this decision, and Superior Court confirmed it in 18 cases. In 8 of these cases, plaintiffs have challenged this decision in front of the Supreme Court, but to date one of them has already been dismissed.
In one of the claims, a different presiding judge accepted the Company’s motion to dismiss the claim regarding a new award but it has rejected it regarding the compensation agreement, this decision was confirmed by Superior Court, so this claim continues in first instance.
Both request (i) and (ii) were prescribed according to the terms in Peruvian legislation, so those claims should be dismissed.
MINERA YANACOCHA S.R.L.
NOTES TO THE CONSOLIDATED FINANCIAL STATEMENTS
(dollars in thousands unless otherwise stated)
Baños del Inca
In September 2006, the Municipality of Baños del Inca issued a declaration designating an area that includes the Carachugo Expansion and San José Projects as reserved and protected areas. Based on previous experience and actions taken by the Constitutional Tribunal (Peru Court of Last instance for Constitutional issues) in respect of Cerro Quilish in which it was ruled that such declaration did not affect the Company’s mining rights, the Company believes that Baños del Inca’s declaration, should not impact the Company’s legal rights to exploit these concessions.
In March 2008, the company filed an Action for Constitutional Relief (Amparo) against the Municipality of Baños del Inca seeking that the referred ordinance be declared inapplicable. The Court of first instance of Lima rejected the claim lodged by the Municipality of Baños del Inca regarding the jurisdiction of such court to hear this case. On March 14, 2011 the Court of first instance of Lima served the ruling it had issued declaring the complaint inadmissible. The judgment was appealed by Yanacocha. By a resolution served on August 15, 2011, the first Civil Courtroom of the Superior Court of Lima declared void the judgment of first instance, ordering the Judge to issue a new ruling. On September 07, 2012 Yanacocha request to the Civil Courtroom decides to issue a judgment due to its constitutional rights is seriously threat by the Municipality of Baños del Inca. The action is pending new judgment to be issued by the Court of first instance with no judgment as of date.
San Pablo
In February 2007 the Municipality of San Pablo issued an Ordinance declaring Las Lagunas and Pozo Seco, where the company holds concession rights, as reserved and protected areas. According to past experience and actions taken by the Constitutional Court with regard to Cerro Quilish, where it was ruled that such declaration did not affect the company’s mining rights, the Company believes that it this case, the declaration issued by the Municipality of San Pablo should not impact the legal rights it has to exploit these concessions. The company filed an Action for Constitutional Relief (Amparo) challenging the Ordinance on the grounds that, under Peruvian law, local governments are not empowered to create such areas, denying the rights granted by the Peruvian mining concessions. The Court of first instance rejected the complaint on grounds of form. Thus, the corresponding appeal was lodged.
On November 19, 2008 the second Civil Courtroom of the Superior Court of Lima confirmed the first instance ruling rejecting the action for relief, which led to the filing of an extraordinary appeal with the Constitutional Court.
By a ruling dated December 10, 2010 the Constitutional Court revoked the resolution issued by the second Civil Courtroom of the Superior Court of Lima and ordered that the complaint be admitted for processing.
By resolution served on March 25, 2011, the Court of First Instance admitted the complaint for processing and that it is served to the Provincial Municipality of San Pablo. The Municipality of San Pablo answered the complaint asserting the expiration of the statute of limitations of the action for relief. Yanacocha has requested the rejection of the expiration of the statute of limitations asserted on the grounds that the complaint for constitutional relief was timely filed.
MINERA YANACOCHA S.R.L.
NOTES TO THE CONSOLIDATED FINANCIAL STATEMENTS
(dollars in thousands unless otherwise stated)
On October 31, 2012 the defendant formulates allegation and presents new evidentiary. By resolution served on December 10, 2012, the Courts resolve to confirm the Resolution N°26 which declares unfunded the exception of prescription of the case. The Court ruling on the statute of limitations is pending.
Conga Project
Regional Ordinance No. 036-2011-GR.CAJ-CR dated December 5, 2011 issued by the Regional Government of Cajamarca (hereinafter the Regional Ordinance) was published in the Official Gazette “El Peruano” on December 28, 2011.
The Regional Ordinance, among other things, declares the unworkability of the implementation of the Conga Project in the headwaters of the basin where the following lakes are found: el Perol (District of Sorochuco); Azul and Cortada (District of Huasmín); Mamacocha (District of Bambamarca) and all those located in the area of influence of the Conga Project on the grounds of the existence of technical - legal inconsistencies in the Environmental Impact Assessment approved by Directorial Resolution No.351 - 2010 - MEM/AAM, dated October 27, 2010, and also on the grounds that it contravenes constitutional norms and international treaties. Furthermore, it declares the invalidity of any legal rule that contravenes the referred Regional Ordinance.
There is Constitutional Court jurisprudence establishing that large scale mining projects fall under the exclusive jurisdiction of the Executive Power, not of the Regional Governments or Municipalities. The Attorney General filled an unconstitutionality action with the Constitutional Court seeking that this regional ordinance be declared unconstitutional and void. The complaint has already been admitted for processing by the Constitutional Court.
On April 17, 2012, Constitutional Court granted the action brought by Attorney General and declared unconstitutional the Regional Ordinance. This final ruling was published in the Official Gazette “El Peruano” on April 27, 2012.
At the same time, Yanacocha initiated an action for constitutional relief to declare the inapplicability of Regional Ordinance No. 036-2011-GR.CAJ-CR. As the ruling by Constitutional Court declared unconstitutional the Regional Ordinance, this action is no longer needed.
MINERA YANACOCHA S.R.L.
NOTES TO THE CONSOLIDATED FINANCIAL STATEMENTS
(dollars in thousands unless otherwise stated)
Action for Constitutional Relief against Conga Project Exploitation
On October 19, 2012, Marco Antonio Arana Zegarra initiated an action for constitutional relief against the Mines and Energy Ministry and Yanacocha requesting that Court orders to cease any threats of violation to live in an adequate and balanced environment; so that Court declare the suspension of the exploitation of Conga Project and avoid Directorial Resolution No. 351-2010-MEM/AM dated on October 27, 2010 that approved Conga Environmental Impact Assessment.
By Court resolution No. 1 dated on October 23, 2012 the action was dismissed. On November 5, 2012, resolution No. 1 was appealed by plaintiff and the hearing at Superior Court will be held on March 4, 2013 at 12:15 p.m.
Clínica International, Adecco, SGC Security
Employees belonging to three contractors (Clinica International, Adecco, SCG Seguridad) have filed legal actions claiming to be included in Minera Yanacocha’s payroll. These workers claim that for all practical effects they are employees of the Company and therefore are entitled to all the rights attached thereto, arguing that they receive direct orders from Yanacocha and that most of the infrastructure and equipment used in the performance of their duties is also provided by the Company. All of these proceedings involve a total of 97 workers. The cases are detail as follow:
Regarding to Adecco employees, the complaint included 77 plaintiffs. This complaint was declared groundless in the first instance and confirmed by the Civil Courtroom. Thus, the plaintiffs filed an appeal for reversal. As of February 2013, the records were forwarded to the Standing Constitutional and Social Courtroom of the Supreme Court of Justice of the Republic, but complaint was not accepted. Also during this time some of the plaintiffs desisted from the claim, so to date this complaint is finished, as no plaintiffs is remaining in the process.
Regarding to Clinica International employees, the complaint included 14 plaintiffs. In cases: 254-2008 and 253-2008 are pending the issuance of judgment in the first instance, since the Civil Courtroom declared the previous judgment null, on the grounds that the judge made a mistake by having unduly matched the terms material resources and own equipment, since the former is one of the requirements for the valid existence of outsourcing, and the latter is a contributory element, as provided in Article 4 of Supreme Decree No. 003-2002-TR, amended by Supreme Decree No. 020-2007-TR. Case File No. 255 - 2008 also is pending judgment in the first instance.
In the case of SGC Security workers, the complaint included 6 plaintiffs. The issuance of judgment in the first instance is pending, since the previous judgment was declared null by the Civil Courtroom.
MINERA YANACOCHA S.R.L.
NOTES TO THE CONSOLIDATED FINANCIAL STATEMENTS
(dollars in thousands unless otherwise stated)
Letters of Guarantee
On January 17, 2010, theThe Company has signed a LetterLetters of Guarantee of US$85 million with Banco de Credito del Peru (BCP)various financial institutions in accordance with the Mine Closure Regulation approved by Supreme Decree No.033-2005 of Thethe Ministry of Energy and Mines. This letterThe table below sets out the outstanding signed commitments at year ends by financial institution. In general, these letters of guarantee has a renewal for one more year since January 18, 2012. For the period 2013 the letter has an amount of US$105.9 million and shall have an effective term of one additional year extended to January 18th, 2014.are renewed annually.
On January 13, 2012, the Company signed an additional letter of guarantee for US$45 million with BBVA Continental which have extended to January 18th, 2013 in accordance with the Mine Closure Regulations. This letter of guarantee has a renewal for US$71.7 million for the period 2013 and shall have an effective term of one additional year extended to January 18th, 2014.
On January 18, 2013, the Company signed an additional letter of guarantee for US$30 million with Interbank which have extended to January 18th, 2014, in accordance with the Mine Closure Regulations.
| | | 2015 | | | 2014 | |
| | | US$(000) | | | US$(000) | |
| | | | | | | |
| Banco de Credito del Peru | | | 150,000 | | | | 150,000 | |
| BBVA Continental | | | 100,068 | | | | 100,000 | |
| Scotiabank | | | 100,000 | | | | 19,000 | |
| Interbank | | | - | | | | 15,300 | |
| | | | | | | | | |
| | | | 350,068 | | | | 284,300 | |
These threefour letters of guarantee shall come into force if the Company fails to execute in whole or in part the Mine Closure Plan.mine closure plan.
Dictamen de los auditores independientes (continuación)
Notes to the consolidated financial statements (continued)
Legal proceedings -
Mercury spill in Choropampa
In June 2000, a carrier hired by Yanacocha spilled approximately 151 kilograms of mercury in the vicinity of the town of Choropampa, Peru, located 85 kilometers (53 miles) southeast of the mine. To date, Yanacocha has held court settlements with people affected by the incident. At December 31, 2015, there are 6 applicants with pending process. Yanacocha cannot reasonably predict the outcome of any of these claims; however, it is estimated that the maximum additional expense related to these demands will be US$1.5 million.
Action for Constitutional Relief against Conga Project Exploitation
On October 19, 2012, Marco Antonio Arana Zegarra ("Marco Arana") initiated an action for constitutional relief against the Mines and Energy Ministry and Yanacocha requesting that the Court orders to cease any threats of violation to life in an adequate and balanced environment; so that Court declared the suspension of the exploitation of the Conga Project and avoid Directorial Resolution No.351-2010-MEM/AM dated on October 27, 2010 that approved the Conga Environmental Impact Assessment.
By Court resolution No.1 dated October 23, 2012, the action was dismissed. On November 5, 2012, resolution No.1 was appealed by plaintiff and the hearing at Superior Court was held on March 4, 2013. The Cajamarca Superior Court confirmed the ruling of the judge that dismissed the claim.
On May 23, 2013, Marco Arana filed for a Constitutional remedy against the Cajamarca Superior Court decision and on June 3, 2013, the Cajamarca Superior Court accepted the Constitutional remedy filed by Marco Arana and the file has been sent to the Constitutional Court. On September 25, 2013, the Constitutional Court heard oral arguments from the parties and we are waiting their decision. To date the case maintains the same status.
Environmental
During 2015, the Company received administrative notifications from two national supervisory entities of mining investments (“OSINERGMIN”) and environmental impact (“OEFA”). The notifications are related to administrative infractions of security and environmental standards and others. According to Law N° 30230 approved on July 11th, 2014, OEFA will notimposeadministrative fines for a period of 3 years, unless 3 exceptions: (i) serious infraction; (ii) operate without a license or in forbidden place; and (iii) recidivism. The administrative fines amounted are between a range of 1 tax impositive unit (”UIT”) to 10,000 UIT (equivalent of US$1,000 and US$11,573,000).Management's and its legal counsel’s opinion, the Company should get a favorable outcome.Based on the accounting policy, Management has not recorded a provision for this contingency.
Open tax years -
The Tax Authority has the right to examine, and, if necessary, amend the Company’s income tax provision for the last four years. The Company’s income tax returns for the years 2011 through 2015 are open to examination by the tax authorities. For years 2002 through 2007, the Company is in the claim and appeal process. The tax administration is completing the audit of income tax of the year 2011.
Notes to the consolidated financial statements (continued)
In Management’s and legal advisors’ opinion, there are sound legal grounds to sustain the Company’s tax positions; as a result, Management expects to obtain favorable results on these processes and any additional tax assessment would not be significant to the consolidated financial statements.
For the periods pending of examination, due to the many possible interpretations of current legislation, it is not possible to determine whether or not future reviews will result in tax liabilities for the Company. In the event that additional taxes are payable, including interest and surcharges, as a result of the Tax Authority reviews, they will be charged to expense in the period assessed. However, in Management’s and legal advisors’ opinion, any additional tax assessment would not be significant to the consolidated financial statements.
Tax contingencies -
Withholding income tax for fiscal years 2002 and 2003
The Tax Administration challenged the withholding tax rate applied on the technical assistance services provided by a non-resident supplier. The services were executed in Peru and also abroad; however, the Company was not able to prove that during the tax audit. Based on that, the Tax Administration considers that the services were wholly executed in Peru; therefore, the withholding tax rate should be 30% instead of 12%. The amount of the contingency involved is S/ 12.4 million (US$ 3.6 million). In Management's and its legal counsel’s opinion, that consideration has no support and the Company should obtain a favorable outcome in the appeal initiated against the tax authorities.
Health Contributions - ESSALUD
The Tax Administration considers that the bonus for closing the collective agreement and the collateral benefits granted to the unionized and non-unionized employees qualify as remunerative concepts; hence, taxed with the contribution to ESSALUD. The contingency amounts to S/ 6.5 million (US$ 2 million).In Management's and its legal counsel’s opinion, that interpretation has no support and the Company should obtain a favorable outcome in the appeal initiated against the tax authorities.
Notes to the consolidated financial statements (continued)
| 21. | Transactions with related parties |
| (a) | The main transactions carried out by the Company with its related parties in the years 2015, 2014 and 2013 were: |
| | | 2015 | | | 2014 | | | 2013 | |
| | | US$(000) | | | US$(000) | | | US$(000) | |
| | | | | | | | | | |
| Royalties paid: | | | | | | | | | | | | |
| S.M.R.L. Chaupiloma Dos de Cajamarca, note 1(a) | | | 32,414 | | | | 36,867 | | | | 44,167 | |
| | | | | | | | | | | | | |
| Services rendered by: | | | | | | | | | | | | |
| Newmont Peru S.R.L. (management services) | | | 24,644 | | | | 35,974 | | | | 52,994 | |
| Newmont USA Limited | | | 9,076 | | | | 6,192 | | | | 14,458 | |
| (b) | As a result of the transactions indicated in the paragraph (a), the Company had the following accounts receivable and payable from/to associates: |
��
| | | 2015 | | | 2014 | |
| | | US$(000) | | | US$(000) | |
| | | | | | | |
| Balance receivable from related parties | | | | | | | | |
| Newmont USA Limited | | | 80 | | | | 27,397 | |
| Newmont Mining Services Pty Ltd | | | 77 | | | | 612 | |
| Newmont Peru S.R.L. | | | 68 | | | | 70 | |
| Newmont Technologies Limited | | | 23 | | | | 3,653 | |
| Newmont International Service Limited | | | - | | | | 3,503 | |
| Battle Mountain Gold Company | | | - | | | | 347 | |
| Newmont Global Employ Limited | | | - | | | | 235 | |
| Others | | | - | | | | 200 | |
| | | | | | | | | |
| | | | 248 | | | | 36,017 | |
| | | | | | | | | |
| Balance payable for related parties | | | | | | | | |
| S.M.R Chaupiloma Dos de Cajamarca | | | 7,214 | | | | 11,911 | |
| Newmont USA Limited | | | 1,769 | | | | 28,840 | |
| Newmont Peru S.R.L. | | | 1,183 | | | | 1,696 | |
| Newmont Technologies Limited | | | 715 | | | | 4,013 | |
| Newmont International Service Limited | | | 77 | | | | 3,485 | |
| Newmont Mining Services Pty Ltd | | | - | | | | 589 | |
| Others | | | 14 | | | | 537 | |
| | | | | | | | | |
| | | | 10,972 | | | | 51,071 | |
AII the balances above are of current maturity, have no specific guarantees and are not interest bearing.
Notes to the consolidated financial statements (continued)
| 22. | Financial - risk management objectives and policies |
The Company's operations are exposed to certain financial risks: some market risks (foreign exchange risk, interest rate risk and price risk), credit risk and liquidity risk. The Company's overall risk management program focuses on the unpredictability of financial markets and seeks to minimize potential adverse effects on the Company's financial performance. The most important aspects in risk management are the following:
| (i) | Foreign exchange risk - |
Foreign exchange risk exposure arises from exchange rate fluctuations of balances denominated in different currencies than the U.S. dollar. Since transactions and balances denominated in foreign currency are not significant, the current exchange rate risk exposure is limited. Management has decided to assume the exchange risk exposure with the results of the Company's operations; therefore it has not engaged in hedging activities.
The Company does not maintain significant interest-bearing assets or liabilities; therefore, operating income and cash flows of the Company are substantially independent from the changes in market interest rates. At December 31, 2015, the Company recognized interest income of approximately US$673,000 in connection with time deposits in financial institutions (US$499,000 in 2014 and US$489,000 in 2013).
The Company's financial instruments exposed to price risk are limited to its trade accounts receivable (exposed to gold price) and its available-for-sale financial assets, none of which show a material balance at the end of year, therefore no significant impact on the consolidated financial statements has arisen due to changes in their price that would need to be disclosed.
Credit risk is managed on a group basis by Newmont according to its policies. Financial instruments exposed to credit risk are cash and cash equivalents, investments in debt and equity instruments, trade accounts receivable and other accounts receivable. For banks and financial institutions, only independently rated parties with a minimum "A" rating are accepted. Regarding trade accounts receivable, according to the practice in the latest years, collections have generally been at full. A credit review of the portfolio is performed quarterly to determine any deterioration in credit quality. The Company does not foresee any significant losses that may arise from this risk.
Management administrates its exposure to liquidity risk through financing from internal operations, Company's partners and maintaining good relationships with local and foreign banks in order to maintain adequate levels of credit available. The Company currently has no existing bank lines of credit.
Notes to the consolidated financial statements (continued)
The following table represents the analysis of the Company's financial liabilities, including estimated projected interests relating to financial obligations, considering the remaining period to reach such maturity as of the consolidated statement of financial position date:
| | | 2015 | | | 2014 | |
| | | Less than 1 year | | | Less than 1 year | |
| | | US$(000) | | | US$(000) | |
| | | | | | | |
| Trade accounts payable | | | 56,447 | | | | 69,788 | |
| Accounts payable to related parties | | | 10,792 | | | | 51,071 | |
| Remuneration and similar benefits payable | | | 8,981 | | | | 13,390 | |
| | | | | | | | | |
| | | | 76,220 | | | | 134,249 | |
| (d) | Capital risk management - |
The Company's objectives for managing capital are to safeguard the Company's ability to continue as a going concern in order to provide expected returns for partners and benefits for other stakeholders and to maintain an optimal capital structure to reduce the cost of capital.
In order to maintain or adjust the capital structure, the Company may adjust the amount of dividends paid to its partners. No formal dividend policy exists.
| (e) | Fair value estimation - |
Fair value accounting establishes a fair value hierarchy that prioritizes the inputs to valuation techniques used to measure fair value. The hierarchy gives the highest priority to unadjusted quoted prices in active markets for identical assets or liabilities (Level1 measurements) and the lowest priority to unobservable inputs (Level 3 measurements).
As required by accounting guidance, assets and liabilities are classified in their entirety based on the lowest level of input that is significant to the fair value measurement. The Company's assets that are measured at fair value on a recurring basis (at least annually) correspond to the San José Reservoir Trust assets.
The Company's San José Reservoir Trust assets are made up of marketable equity and debt securities that are valued using quoted market prices in active markets and as such are classified within Level 1 of the fair value hierarchy. The fair value of the marketable equity securities is calculated as the quoted market price of the marketable equity security multiplied by the quantity of shares held by the Company.
The Company's impairment loss is valued using valuation techniques to determine the WACC rate. These valuation techniques maximize the use of observable market data where it is available and rely as little as possible on entity specific estimates as such is classified within Level 2 of the fair value hierarchy.
Notes to the consolidated financial statements (continued)
On February 15, 2016, The Committee agreed unanimously on a distribution of a dividend to the partners in proportion to their social participation US$300,000,000 that corresponds to a part of unrestricted accumulated earnings as of December 31, 2014, which had been generated in the year 2011.
| 24. | Summary of significant differences between accounting principlesfollowed by the Company and U.S. Generally Accepted Accounting Principles |
The Company's financial statements have been prepared in accordance with International Financial Reporting Standards which differs in certain respects from U.S. GAAP. The effects of these differences are reflected in note 25 and are principally related to the items discussed in the following paragraphs:
Under IFRS, the Company estimates the recoverable amount of an asset whenever there is an indication that the asset may be impaired. The recoverable amount is the higher of the fair value less costs of disposal and its value in use. Value in use is the present value of the future cash flows expected to be derived from an asset or cash-generating unit.
In 2015, no impairment loss resulted for Yanacocha and Conga cash-generating units. In 2014, the Company recorded impairment losses amounting to US$541 million related to Conga, and no amount for Yanacocha (US$1,038 million for the year ended December 31, 2013: US$453 million related to Yanacocha and US$585 million related to Conga).
Under US GAAP, the Company used undiscounted cash flows to perform an impairment evaluation. No impairment losses resulted for Yanacocha and Conga cash-generating units in years 2013, 2014 and 2015.
For reconciling the net income/loss and net equity from IFRS to US GAAP, the Company eliminates the impairment loss and records the depreciation corresponding to the impaired assets under IFRS.
| (b) | Deferred workers’ profit participation |
Under IFRS, the workers’ profit participation is calculated based on the Company’s taxable income and is recorded as an employee benefit (cost of production or administrative expense, depending on the function of the workers).
Under US GAAP, the workers’ profit sharing is treated in a similar way as income tax since both are calculated based on the Company’s taxable income. Therefore, the Company calculates a deferred workers’ profit participation resulting from the taxable and deductible temporary differences.
For reconciling the net income/loss and net equity from IFRS to US GAAP, the Company recognizes a deferred workers’ profit participation and the corresponding valuation allowance recorded in the year.
Notes to the consolidated financial statements (continued)
| (c) | Stripping activity asset - |
Under IFRS, the stripping costs in the production phase of a surface mine are accounted for according to the accounting principle disclosed in note 2.
Under U.S. GAAP, the costs of clearing removal (stripping cost of production) incurred during the production stage are recorded as part of the production cost of inventories.
| (d) | Reclamation and mine closure – |
Under IFRS, the liability was measured in accordance with IAS 37 and IFRIC 1. Upward and downward revisions in the amount of undiscounted estimated cash flows are discounted using the current market-based discount rate (this includes changes in the time value of money and the risks specific to the liability), see note 2.4 (j).
Under U.S. GAAP, upward revisions in the amount of undiscounted estimated cash flows are discounted using the current credit-adjusted risk-free rate. Downward revisions in the amount of undiscounted estimated cash flows are discounted using the credit-adjusted risk-free rate that existed when the original liability was recognized.
Under IFRS, the cost of inventory mainly includes less depreciation as a result of the reduced base of property, plant and equipment due to the impairment recorded in prior years.
Under U.S. GAAP, the cost of inventory considers a higher depreciation since the items of property, plant and equipment have not been impaired.
The differences between U.S. GAAP and IFRS are re-measurements that lead to different temporary differences. According to the accounting policies in note 2.4 (l), the Company has to account for such differences.
During 2015, the Company recorded a valuation allowance of the deferred income tax asset recorded under IFRS which was higher by US$321,622,000 compared to the valuation allowance recorded under U.S. GAAP, mainly as a result of the impairment losses of prior years recorded under IFRS.
Notes to the consolidated financial statements (continued)
| 25. | Reconciliation between net income and Partners' Equity determined under IFRS and U.S. GAAP |
The following is a summary of the adjustment to net income for the years ended December 31, 2015, 2014 and 2013 and to partners' equity as of December 31, 2015 and 2014 that would be required if U.S. GAAP had been applied instead of IFRS in the consolidated financial statements:
| | | 2015 | | | 2014 | | | 2013 | |
| | | US$(000) | | | US$(000) | | | US$(000) | |
| | | | | | | | | | |
| (Loss) income under U.S. GAAP | | | (252,159 | ) | | | (31,914 | ) | | | 140,997 | |
| | | | | | | | | | | | | |
| Items increasing (decreasing) reported net profit: | | | | | | | | | | | | |
| Impairment loss, note 24 (a) | | | - | | | | 541,141 | | | | 1,038,548 | |
| Depreciation of assets impaired under IFRS, note 24 (a) | | | (125,943 | ) | | | (79,809 | ) | | | - | |
| Elimination of the valuation allowance of the deferred workers’ profit participation, note 24 (b) | | | (41,909 | ) | | | - | | | | - | |
| Stripping activity asset, note 24 (c) | | | (18,868 | ) | | | (23,212 | ) | | | (33,861 | ) |
| Reclamation and mine closure, note 24 (d) | | | (12,049 | ) | | | 427 | | | | (10,690 | ) |
| Inventories, note 24 (e) | | | 20,903 | | | | (17,428 | ) | | | 12,042 | |
| Deferred workers' profit participation, note 24 (b) | | | 2,790 | | | | 29,003 | | | | 28,443 | |
| Elimination of valuation allowance of deferred income tax, note 24 (f) | | | 321,622 | | | | - | | | | - | |
| Deferred income tax of reconciliation items, note 24 (f) | | | 43,441 | | | | (93,062 | ) | | | (306,994 | ) |
| Others | | | 8,049 | | | | 11,364 | | | | (11,212 | ) |
| | | | | | | | | | | | | |
| Loss under IFRS | | | (450,195 | ) | | | (400,338 | ) | | | (575,279 | ) |
Notes to the consolidated financial statements (continued)
| | | 2015 | | | 2014 | |
| | | US$(000) | | | US$(000) | |
| | | | | | | |
| Partners' equity under IFRS | | | 2,228,825 | | | | 2,679,777 | |
| | | | | | | | | |
| Items increasing (decreasing) reported Partners' equity: | | | | | | | | |
| Impairment loss, note 24 (a) | | | 1,579,689 | | | | 1,579,689 | |
| Depreciation of assets impaired under IFRS, note 24 (a) | | | (278,333 | ) | | | (152,390 | ) |
| Elimination of the valuation allowance of the deferred workers’ profit participation, note 24 (b) | | | (41,909 | ) | | | - | |
| Stripping activity asset, note 24 (c) | | | (18,913 | ) | | | (45 | ) |
| Reclamation and mine closure, note 24 (d) | | | (99,102 | ) | | | (87,053 | ) |
| Inventories, note 24 (e) | | | (5,787 | ) | | | (26,690 | ) |
| Deferred workers' profit participation, note 24 (b) | | | 40,935 | | | | 38,145 | |
| Elimination of valuation allowance of deferred income tax, note 24 (f) | | | 321,622 | | | | - | |
| Deferred income tax related to reconciliation items, note 24 (f) | | | (310,341 | ) | | | (353,782 | ) |
| Others | | | 2,303 | | | | (6,503 | ) |
| | | | | | | | | |
| Partners' equity under U.S. GAAP | | | 3,418,989 | | | | 3,671,148 | |
| 26. | New U.S. GAAP Accounting Pronouncements |
Recently Issued Accounting Pronouncements -
Inventory -
In July 2015, ASU guidance was issued related to inventory simplifying the subsequent measurement of inventories by replacing the lower of cost or market test with a lower of cost and net realizable value test. The update is effective in fiscal years, including interim periods, beginning after December 15, 2016, and early adoption is permitted. The Company is currently evaluating this guidance and the impact it will have on net equity or net results.
Revenue recognition –
In May 2014, ASU guidance was issued related to revenue from contracts with customers. The new standard provides a five-step approach to be applied to all contracts with customers and also requires expanded disclosures about revenue recognition. In August 2015, the effective date was deferred to reporting periods, including interim periods, beginning after December 15, 2017, and will be applied retrospectively. Early adoption is not permitted. The Company is currently evaluating this guidance and the impact it will have on net equity or net results.
Sociedad Minera Cerro Verde S.A.A.
Financial Statements as of December 31, 2012, 2011for the years 2015, 2014 and 2010, 2013
together with the Report of Independent Registered Public Accounting Firm
Sociedad Minera Cerro Verde S.A.A.
Financial Statements for the years 2015, 2014 and 2013
together with the Report of Independent Registered Public
Accounting Firm
| | |
Statements of Changes in Equity | F-148 |
| F-153 | |
Statements of Cash Flows | F-149 |
| |
Notes to the Financial Statements | F-151 |
Report of Independent Registered Public Accounting Firm
ERNST & YOUNG | Medina, Zaldivar, Paredes |
| & Asociados Sociedad Civil |
To the Board of Directors and Shareholders of Sociedad Minera Cerro Verde S.A.A.
We have audited the accompanying financial statements of Sociedad Minera Cerro Verde S.A.A. (a Peruvian company, subsidiary of Freeport-McMoRan Copper & Gold Inc.), which comprise the statementstatements of financial position as of December 31, 20122015 and 2011,2014, and the related statements of comprehensive income, statements of changes in equity and statements of cash flows for each of the three years ended December 31, 2012, 20112015, 2014 and 2010.2013. These financial statements are the responsibility of the Company's management. Our responsibility is to express an opinion on these financial statements based on our audits.
We conducted our audits in accordance with the standards of the Public Company Accounting Oversight Board (United States). Those standards require that we plan and perform the audit to obtain reasonable assurance about whether the financial statements are free of material misstatement. We were not engaged to perform an audit of the Company’sCompany´s internal control over financial reporting. Our audits included consideration of internal control over financial reporting as a basis of designing audit procedures that are appropriate in the circumstances, but not for the purpose of expressing an opinion on the effectiveness of the Company’sCompany´s internal control over financial reporting. Accordingly, we express no such opinion. An audit also includes examining, on a test basis, evidence supporting the amounts and disclosures in the financial statements. An audit also includes assessing the accounting principles used and significant estimates made by management, as well as evaluating the overall financial statement presentation. We believe that our audits provide a reasonable basis for our opinion.
In our opinion, the financial statements referred to above present fairly, in all material respects, the financial position of Sociedad Minera Cerro Verde S.A.A.S.A.A. as of December 31, 20122015 and 2011,2014, and the results of operations and its cash flows for each of the three years ended December 31, 2012, 20112015, 2014 and 2010,2013, in conformityaccordance with International Financial Reporting Standards (IFRS) as issued by the International Accounting Standards Board (“IASB”) which differ in certain respects from the accounting principles generally accepted in the United States of America (see note 29 to the financial statements).
Lima, Peru,
April 30, 2013
February 25, 2016
/s/ Medina, Zaldivar, Paredes & Asociados
Countersigned by:
/s/ Marco Antonio Zaldívar__
Marco Antonio Zaldívar
| Countersigned by: | |
| |
| Paredes, Zaldívar, Burga & Asociados S. Civil de R.L. | |
| |
| /s/ Victor Burga | |
| Víctor Burga | |
C.P.C.C. Register No.12477
No.14859
Sociedad Minera Cerro Verde S.A.A.
StatementStatements of Financial Positionfinancial position
As of December 31, 20122015 and 20112014
| | | Note | | 2012 | | 2011 | | | Note | | 2015 | | 2014 | |
| | | | | US$(000) | | US$(000) | | | | | US$(000) | | US$(000) | |
| Assets | | | | | | | | | | | | | | | | | | | | |
| Current assets | | | | | | | | | | | | | | | | | | | | |
| Cash and cash equivalents | | 3 | | | 1,427,528 | | | | 1,383,636 | | | 5(a) | | | 5,952 | | | | 19,574 | |
| Trade accounts receivable | | 4 | | | 4,054 | | | | 44,053 | | | 6 | | | 13,948 | | | | 2,374 | |
| Trade accounts receivable from related parties | | 17(f) | | | 318,562 | | | | 199,331 | | | 22(g) | | | 199,368 | | | | 187,940 | |
| Embedded derivative | | 19 | | | 11,569 | | | | - | | |
| Other accounts receivable | | | | | 28,408 | | | | 25,959 | | | | | | 10,091 | | | | 10,146 | |
| Inventories, net | | 6 | | | 194,909 | | | | 175,837 | | |
| Non-financial assets | | | 7(a) | | | 432,299 | | | | 225,076 | |
| Inventories | | | 8(a) | | | 394,867 | | | | 232,542 | |
| | | | | | | | | | | | | | | | 1,056,525 | | | | 677,652 | |
| Total current assets | | | | | 1,985,030 | | | | 1,828,816 | | |
| Other long – term accounts receivable | | 5 | | | 63,964 | | | | - | | |
| Non-current assets | | | | | | | | | | | |
| Long-term non-financial assets | | | 7(a) | | | 382,002 | | | | 253,184 | |
| Long-term inventories | | 6 | | | 188,990 | | | | 140,671 | | | 8(a) | | | 319,971 | | | | 287,714 | |
| Property, plant and equipment, net | | 7 | | | 1,799,709 | | | | 1,220,591 | | | 9(a) | | | 6,077,289 | | | | 4,544,406 | |
| Intangible assets, net | | 16(d) | | | 5,078 | | | | 6,519 | | | | | | 16,905 | | | | 9,028 | |
| | | | | | | | | | | | | | | | 6,796,167 | | | | 5,094,332 | |
| Total assets | | | | | 4,042,771 | | | | 3,196,597 | | | | | | 7,852,692 | | | | 5,771,984 | |
| | | | | | | | | | | | |
| Liabilities and equity, net | | | | | | | | | | | | | | | | | | | | |
| Current liabilities | | | | | | | | | | | | | | | | | | | | |
| Trade accounts payable | | 8 | | | 146,354 | | | | 55,950 | | | 10 | | | 432,418 | | | | 398,070 | |
| Trade accounts payable to related parties | | 17(f) | | | 8,081 | | | | 3,415 | | |
| Accounts payable to related parties | | | 22(g) | | | 12,042 | | | | 11,910 | |
| Embedded derivative | | 19 | | | - | | | | 75,257 | | | 24 | | | 18,847 | | | | 26,782 | |
| Income tax liability | | | | | 21,187 | | | | 56,920 | | |
| Workers’ profit sharing payable | | 9 | | | 75,991 | | | | 119,711 | | |
| Income tax payable | | | | | | 4,731 | | | | 15,492 | |
| Employees benefits liability | | | 11(a) | | | 20,536 | | | | 44,412 | |
| Other financial liabilities | | | 12(a) | | | 43,169 | | | | 50,163 | |
| Other provisions | | | 13(a) | | | 14,662 | | | | 2,964 | |
| Other accounts payable | | | | | 20,855 | | | | 24,675 | | | | | | 2,112 | | | | 2,779 | |
| | | | | | | | | | | | | | | | 548,517 | | | | 552,572 | |
| Total current liabilities | | | | | 272,468 | | | | 335,928 | | |
| Non-current portion of other accounts payable | | | | | 540 | | | | 1,298 | | |
| Provision for remediation and mine closure | | 16(a) | | | 79,812 | | | | 7,061 | | |
| Deferred income tax liability | | 10(a) | | | 240,243 | | | | 174,672 | | |
| Non-current liabilities | | | | | | | | | | | |
| Other financial liabilities | | | 12(a) | | | 2,381,995 | | | | 402,686 | |
| Accounts payable to related parties | | | 22(g) | | | 6,850 | | | | 5,643 | |
| Other provisions | | | 13(a) | | | 163,803 | | | | 125,265 | |
| Deferred income tax liability, net | | | 14(a) | | | 253,153 | | | | 220,728 | |
| | | | | | | | | | | | | | | | 2,805,801 | | | | 754,322 | |
| Total liabilities | | | | | 593,063 | | | | 518,959 | | |
| | | | | | | | | | | | |
| Total liability | | | | | | 3,354,318 | | | | 1,306,894 | |
| Equity, net | | 11 | | | | | | | | | | 15 | | | | | | | | |
| Issued capital | | | | | 990,659 | | | | 990,659 | | | | | | 990,659 | | | | 990,659 | |
| Other capital reserves | | | | | 198,132 | | | | 198,132 | | | | | | 198,132 | | | | 198,132 | |
| Retained earnings | | | | | 2,260,917 | | | | 1,488,847 | | | | | | 3,309,583 | | | | 3,276,299 | |
| | | | | | | | | | | | |
| Total equity, net | | | | | 3,449,708 | | | | 2,677,638 | | | | | | 4,498,374 | | | | 4,465,090 | |
| | | | | | | | | | | | |
| Total liabilities and equity, net | | | | | 4,042,771 | | | | 3,196,597 | | | | | | 7,852,692 | | | | 5,771,984 | |
The accompanying notes are an integral part of this financial statement.
Sociedad Minera Cerro Verde S.A.A.
Statements of Comprehensive Incomecomprehensive income
For the years ended December 31, 2012, 20112015, 2014 and 20102013
| | | Note | | 2012 | | 2011 | | 2010 | | | Note | | 2015 | | 2014 | | 2013 | |
| | | | | US$(000) | | US$(000) | | US$(000) | | | | | US$(000) | | US$(000) | | US$(000) | |
| | | | | | | | | | | | | | | | | | | |
| Sales of goods | | 13 | | | 2,127,023 | | | | 2,520,050 | | | | 2,368,988 | | | 17(a) | | | 1,115,617 | | | | 1,467,097 | | | | 1,811,488 | |
| | | | | | | | | | | | | | | | |
| Cost of sales of goods | | 14 | | | (801,571 | ) | | | (824,700 | ) | | | (645,959 | ) | | 18 | | | (862,004 | ) | | | (797,481 | ) | | | (795,064 | ) |
| | | | | | | | | | | | | | | | |
| Gross profit | | | | | 1,325,452 | | | | 1,695,350 | | | | 1,723,029 | | | | | | 253,613 | | | | 669,616 | | | | 1,016,424 | |
| | | | | | | | | | | | | | | | | | | | | | | | | | | | | |
| Operating expenses | | | | | | | | | | | | | | | | | | | | | | | | | | | | |
| Selling expenses | | 15 | | | (78,674 | ) | | | (83,612 | ) | | | (76,638 | ) | | 19 | | | (56,215 | ) | | | (54,210 | ) | | | (68,448 | ) |
| Expense related to water plant | | 16(b) | | | (19,606 | ) | | | (13,670 | ) | | | (4,300 | ) | |
| Excess of workers’ profit sharing | | 9(b) | | | - | | | | (21,923 | ) | | | (34,427 | ) | |
| Voluntary contribution | | 16(e) | | | - | | | | - | | | | (41,081 | ) | |
| Other operating expenses | | | | | (9,898 | ) | | | (16,865 | ) | | | (10,749 | ) | |
| | | | | | | | | | | | | | | | |
| Other operating income (expenses), net | | | 20 | | | (26,600 | ) | | | (3,629 | ) | | | 147 | |
| | | | | | (108,178 | ) | | | (136,070 | ) | | | (167,195 | ) | | | | | | | | | | | | | | |
| | | | | | | | | | | | | | | | | | | | (82,815 | ) | | | (57,839 | ) | | | (68,301 | ) |
| Operating profit | | | | | 1,217,274 | | | | 1,559,280 | | | | 1,555,834 | | | | | | 170,798 | | | | 611,777 | | | | 948,123 | |
| | | | | | | | | | | | | | | | | | | | | | | | | | | | | |
| Other income (expenses) | | | | | | | | | | | | | | | | | | | | | | | | | | | | |
| Financial income | | | | | 1,886 | | | | 1,078 | | | | 1,261 | | |
| Financial expenses | | | | | (6,951 | ) | | | (165 | ) | | | (101 | ) | |
| Gain net from exchange differences | | 20(a) | | | 3,149 | | | | 1,924 | | | | 669 | | |
| Finance income | | | | | | 512 | | | | 2,443 | | | | 2,178 | |
| Finance costs | | | | | | (16,010 | ) | | | (369 | ) | | | (1,843 | ) |
| Net gain (loss) from exchange differences | | | 25(a) | | | (75,770 | ) | | | 2,284 | | | | (1,858 | ) |
| | | | | | | (91,268 | ) | | | 4,358 | | | | (1,523 | ) |
| | | | | | | | | | | | | | | | | | | | | | | | | | | | | |
| Profit before income tax | | | | | 1,215,358 | | | | 1,562,117 | | | | 1,557,663 | | | | | | 79,530 | | | | 616,135 | | | | 946,600 | |
| | | | | | | | | | | | | | | | |
| Income tax expense | | 10(c, d) | | | (443,288 | ) | | | (483,718 | ) | | | (483,270 | ) | | 14(b,c) | | | (46,246 | ) | | | (238,529 | ) | | | (333,338 | ) |
| | | | | | | | | | | | | | | | | | | | | | | | | | | | | |
| Profit for the year | | | | | 772,070 | | | | 1,078,399 | | | | 1,074,393 | | | | | | 33,284 | | | | 377,606 | | | | 613,262 | |
| | | | | | | | | | | | | | | | | | | | | | | | | | | | | |
| Basic and diluted earnings per share (stated in US dollars) | | 18 | | | 2.21 | | | | 3.08 | | | | 3.07 | | | 23 | | | 0.10 | | | | 1.08 | | | | 1.75 | |
| | | | | | | | | | | | | | | | |
| Weighted average number of shares outstanding | | 18 | | | 350,056,012 | | | | 350,056,012 | | | | 350,056,012 | | |
The accompanying notes are an integral part of this financial statement.
Sociedad Minera Cerro Verde S.A.A.
Statements of Changeschanges in Equityequity
For the years ended December 31, 2012, 20112015, 2014 and 20102013
| | | Issued
capital | | | Other capital
reserves | | | Retained
earnings | | | Total | |
| | | US$(000) | | | US$(000) | | | US$(000) | | | US$(000) | |
| | | | | | | | | | | | | |
| Balance as of January 1, 2010 | | | 990,659 | | | | 198,132 | | | | 286,055 | | | | 1,474,846 | |
| | | | | | | | | | | | | | | | | |
| Profit for the year | | | - | | | | - | | | | 1,074,393 | | | | 1,074,393 | |
| Dividend distribution, note 11(d) | | | - | | | | - | | | | (950,000 | ) | | | (950,000 | ) |
| | | | | | | | | | | | | | | | | |
| Balance as of December 31, 2010 | | | 990,659 | | | | 198,132 | | | | 410,448 | | | | 1,599,239 | |
| | | | | | | | | | | | | | | | | |
| Profit for the year | | | - | | | | - | | | | 1,078,399 | | | | 1,078,399 | |
| | | | | | | | | | | | | | | | | |
| Balance as of December 31, 2011 | | | 990,659 | | | | 198,132 | | | | 1,488,847 | | | | 2,677,638 | |
| | | | | | | | | | | | | | | | | |
| Profit for the year | | | - | | | | - | | | | 772,070 | | | | 772,070 | |
| | | | | | | | | | | | | | | | | |
| Balance as of December 31, 2012 | | | 990,659 | | | | 198,132 | | | | 2,260,917 | | | | 3,449,708 | |
| | | Note | | Issued
capital | | | Legal
reserve | | | Retained
earnings | | | Total | |
| | | | | US$(000) | | | US$(000) | | | US$(000) | | | US$(000) | |
| | | | | | | | | | | | | | | |
| Balance as of January 1 , 2013 | | 15 | | | 990,659 | | | | 198,132 | | | | 2,285,431 | | | | 3,474,222 | |
| | | | | | | | | | | | | | | | | | | |
| Profit for the year | | | | | - | | | | - | | | | 613,262 | | | | 613,262 | |
| Balance as of December 31, 2013 | | 15 | | | 990,659 | | | | 198,132 | | | | 2,898,693 | | | | 4,087,484 | |
| | | | | | | | | | | | | | | | | | | |
| Profit for the year | | | | | - | | | | - | | | | 377,606 | | | | 377,606 | |
| Balance as of December 31, 2014 | | 15 | | | 990,659 | | | | 198,132 | | | | 3,276,299 | | | | 4,465,090 | |
| | | | | | | | | | | | | | | | | | | |
| Profit for the year | | | | | - | | | | - | | | | 33,284 | | | | 33,284 | |
| | | | | | | | | | | | | | | | | | | |
| Balance as of December 31, 2015 | | | | | 990,659 | | | | 198,132 | | | | 3,309,583 | | | | 4,498,374 | |
The accompanying notes are an integral part of this financial statement.
Sociedad Minera Cerro Verde S.A.A.
Statements of Cash Flowscash flows
For the years ended December 31, 2012, 20112015, 2014 and 20102013
| | | 2012 | | | 2011 | | | 2010 | |
| | | US$(000) | | | US$(000) | | | US$(000) | |
| | | | | | | | | | |
| Operating activities | | | | | | | | | | | | |
| Profit before income tax | | | 1,215,358 | | | | 1,562,117 | | | | 1,557,663 | |
| Adjustments to profit for the year that do not affect net cash flow from operating activities | | | | | | | | | | | | |
| Depreciation of property, plant and equipment | | | 94,242 | | | | 82,431 | | | | 86,056 | |
| Amortization of intangible assets | | | 1,630 | | | | 1,630 | | | | 1,630 | |
| Unwinding of discount provision for remediation and mine closure | | | 239 | | | | 358 | | | | 180 | |
| Provision (recovery of provision) for inventory obsolescence | | | 778 | | | | 203 | | | | (525 | ) |
| Net loss from disposal/sale of property, plant and equipment | | | 24 | | | | 4,062 | | | | 153 | |
| Other adjustments | | | - | | | | - | | | | (360 | ) |
| | | | | | | | | | | | | |
| Net changes in operating assets and liabilities accounts | | | | | | | | | | | | |
| Net decrease (increase) in operating assets | | | | | | | | | | | | |
| Trade accounts receivable | | | 40,261 | | | | (16,460 | ) | | | (2,801 | ) |
| Trade accounts receivable from related parties | | | (119,231 | ) | | | 91,378 | | | | (74,147 | ) |
| Embedded derivative | | | (11,569 | ) | | | 208,474 | | | | (68,457 | ) |
| Other accounts receivable | | | (2,449 | ) | | | 2,290 | | | | (13,508 | ) |
| Inventories | | | (19,850 | ) | | | (5,612 | ) | | | (13,381 | ) |
| Other long-term accounts receivable | | | (12,119 | ) | | | 19,002 | | | | 30,533 | |
| Long-term inventories | | | (48,319 | ) | | | (20,698 | ) | | | (28,941 | ) |
| Net increase (decrease) in operating liabilities | | | | | | | | | | | | |
| Trade accounts payable | | | 90,404 | | | | (11,426 | ) | | | 27,578 | |
| Accounts payable to related parties | | | 4,666 | | | | (436 | ) | | | 1,132 | |
| Embedded derivative | | | (75,257 | ) | | | - | | | | - | |
| Workers’ profit sharing payable | | | (43,720 | ) | | | 9,646 | | | | 61,811 | |
| Other accounts payable | | | (3,820 | ) | | | (109,289 | ) | | | 56,542 | |
| Non-current portion of other accounts payable | | | (758 | ) | | | - | | | | (37,106 | ) |
| Income tax paid | | | (465,819 | ) | | | (626,925 | ) | | | (327,111 | ) |
| | | | | | | | | | | | | |
| Net cash and cash equivalents provided by operating activities | | | 644,691 | | | | 1,190,745 | | | | 1,256,941 | |
| | | | | 2015 | | | 2014 | | | 2013 | |
| | | | | US$(000) | | | US$(000) | | | US$(000) | |
| | | | | | | | | | | | |
| Operating activities | | | | | | | | | | | | | | |
| Profit before income tax | | | | | 79,530 | | | | 616,135 | | | | 946,600 | |
| Adjustments to reconcile profit before income tax to net cash flows from operating activities: | | | | | | | | | | | | | | |
| Depreciation of property, plant and equipment | | 9(a) | | | 244,477 | | | | 164,985 | | | | 107,620 | |
| Amortization of intangible assets | | | | | - | | | | - | | | | 1,630 | |
| Unwinding of discount on remediation and mine closure obligations | | 13(b) | | | 3,985 | | | | 2,537 | | | | 4,609 | |
| Provision for inventory obsolescence | | | | | - | | | | - | | | | 1,207 | |
| Net loss (gain) from disposal/sale of property, plant and equipment | | | | | 661 | | | | 4,722 | | | | (541 | ) |
| Impairment of property, plant and equipment | | | | | - | | | | 781 | | | | 1,809 | |
| | | | | | | | | | | | | | | |
| Net changes in the accounts balances of assets and liabilities of operation: | | | | | | | | | | | | | | |
| Net decrease (increase) in operating assets: | | | | | | | | | | | | | | |
| Trade accounts receivable | | | | | (11,574 | ) | | | 5,230 | | | | (3,550 | ) |
| Trade accounts receivable from related parties | | | | | (11,428 | ) | | | 120,546 | | | | 8,218 | |
| Other accounts receivable | | | | | 55 | | | | (4,341 | ) | | | (6,314 | ) |
| Short and long-term inventories | | 8(a) | | | (194,582 | ) | | | (86,459 | ) | | | (67,942 | ) |
| Short and long-term non-financial assets | | | | | (239,595 | ) | | | (338,242 | ) | | | (48,808 | ) |
| Net increase (decrease) in operating liabilities: | | | | | | | | | | | | | | |
| Trade accounts payable | | | | | 68,813 | | | | (850 | ) | | | 122,154 | |
| Accounts payable to related parties | | | | | 1,339 | | | | 5,280 | | | | 3,897 | |
| Embedded derivative | | | | | (7,935 | ) | | | 42,805 | | | | (4,454 | ) |
| Employees benefits liability | | | | | (23,876 | ) | | | (13,717 | ) | | | (28,544 | ) |
| Other accounts payable and other provisions | | | | | 16,711 | | | | (17,399 | ) | | | 16,770 | |
| Income tax paid | | | | | (121,027 | ) | | | (315,369 | ) | | | (286,036 | ) |
| | | | | | | | | | | | | | | |
| Net cash and cash equivalents (used in) provided by operating activities | | | | | (194,446 | ) | | | 186,644 | | | | 768,325 | |
Statements of Cash Flowscash flows (continued)
For the years ended December 31, 2015, 2014 and 2013
| | | 2012 | | | 2011 | | | 2010 | |
| | | US$(000) | | | US$(000) | | | US$(000) | |
| | | | | | | | | | |
| Investing activities | | | | | | | | | | | | |
| Collection from the sale of property, plant and equipment | | | 262 | | | | - | | | | | |
| Purchase of property, plant and equipment | | | (600,872 | ) | | | (195,222 | ) | | | (122,256 | ) |
| Purchase of intangibles | | | (189 | ) | | | - | | | | 37 | |
| | | | | | | | | | | | | |
| Net cash and cash equivalents used in investing activities | | | (600,799 | ) | | | (195,222 | ) | | | (122,219 | ) |
| | | | | | | | | | | | | |
| Financing activities | | | | | | | | | | | | |
| Payment of dividends | | | - | | | | - | | | | (950,000 | ) |
| | | | | | | | | | | | | |
| Net cash and cash equivalents used in financing activities | | | - | | | | - | | | | (950,000 | ) |
| | | | | | | | | | | | | |
| Net increase in cash and cash equivalents during the year | | | 43,892 | | | | 995,523 | | | | 184,722 | |
| Cash and cash equivalents at beginning of year | | | 1,383,636 | | | | 388,113 | | | | 203,391 | |
| | | | | | | | | | | | | |
| Cash and cash equivalents at year-end | | | 1,427,528 | | | | 1,383,636 | | | | 388,113 | |
| | | | | | | | | | | | | |
| Transactions with no effects in cash flows: | | | | | | | | | | | | |
| Increase in the provision for remediation and mine closure estimate | | | 72,512 | | | | 3,217 | | | | (360 | ) |
| | | | | 2015 | | | 2014 | | | 2013 | |
| | | | | US$(000) | | | US$(000) | | | US$(000) | |
| | | | | | | | | | | | |
| Investing activities | | | | | | | | | | | | | | |
| Proceeds from sale of property, plant and equipment | | | | | 409 | | | | 356 | | | | 694 | |
| Withdraw of time deposits | | | | | - | | | | 226,772 | | | | (225,000 | ) |
| Purchase of property, plant and equipment | | 9(a) | | | (1,663,738 | ) | | | (1,640,287 | ) | | | (1,066,267 | ) |
| Stripping activity asset | | 9(a) | | | (111,819 | ) | | | (49,122 | ) | | | (49,938 | ) |
| Purchase of intangibles | | | | | (9,509 | ) | | | (7,178 | ) | | | - | |
| Net cash and cash equivalents used in investing activities | | | | | (1,784,657 | ) | | | (1,469,459 | ) | | | (1,340,511 | ) |
| | | | | | | | | | | | | | | |
| Financing activities | | | | | | | | | | | | | | |
| Proceeds from loans | | 12(a) | | | 1,896,000 | | | | 475,000 | | | | - | |
| Proceeds from related parties loans | | 12(d) | | | 600,000 | | | | - | | | | - | |
| Payments of loans | | 12(a) | | | (528,000 | ) | | | - | | | | | |
| Debt issuance costs | | | | | (2,356 | ) | | | (27,024 | ) | | | | |
| Payments of finance lease | | | | | (163 | ) | | | (157 | ) | | | (772 | ) |
| Net cash and cash equivalents provided by financing activities | | | | | 1,965,481 | | | | 447,819 | | | | (772 | ) |
| | | | | | | | | | | | | | | |
| Net decrease in cash and cash equivalents in the year | | | | | (13,622 | ) | | | (834,996 | ) | | | (572,958 | ) |
| | | | | | | | | | | | | | | |
| Cash and cash equivalents at beginning of year | | 5(a) | | | 19,574 | | | | 854,570 | | | | 1,427,528 | |
| | | | | | | | | | | | | | | |
| Cash and cash equivalents at end of year | | | | | 5,952 | | | | 19,574 | | | | 854,570 | |
| | | | | | | | | | | | | | | |
| Transactions with no effects in cash flows: | | | | | | | | | | | | | | |
| Provision for remediation and mine closure | | 9(a) and 13(b) | | | 33,803 | | | | 68,840 | | | | (36,445 | ) |
The accompanying notes are an integral part of this financial statement
Sociedad Minera Cerro Verde S.A.A.
Notes to the Financial Statementsfinancial statements
As of December 31, 2012, 20112015, 2014 and 20102013
| 1. | Identification and business activity of the Company |
Sociedad Minera Cerro Verde S.A.A. (hereinafter “the Company”) was incorporated in Peru on August 20, 1993, as a result of the privatization process of certain mining units carried out by the Peruvian State in that year. The Company has listed its shares on the Lima Stock Exchange since November 14, 2000.
| | Sociedad Minera Cerro Verde S.A.A. (here in after “the Company”) was incorporated in Peru on August 20, 1993, as a result of the privatization process of certain mining units carried out by the Peruvian State in that year. The Company has listed its shares on the Lima Stock Exchange since November 14, 2000. |
Through its subsidiary Cyprus Climax Metals Company, Freeport-McMoRanFreeport-Minerals Corporation (“FMC” – formerly Phelps Dodge Corporation)), a wholly owned subsidiary of Freeport-McMoRan Copper & Gold Inc. (“Freeport”), owns 53.56% of the voting shares of the Company. Additionally, SMM Cerro Verde Netherlands B.V. (a subsidiary of Sumitomo Metal Mining Company Ltd.) owns 21% of the voting share of the Company, Compañía de Minas Buenaventura S.A.A. owns 19.58%, and the minority stakeholders own the remaining 5.86%.
| | The Company’s legal address is AsientoJacinto Ibañez Street No. 315, Parque Industrial, Arequipa City and the ore deposits are located southwest of that city (Asiento Minero Cerro Verde S/N Uchumayo – Arequipa. The ore deposits are located southwest of the city of Arequipa.Arequipa). |
The Company’s activities are regulated by the Peruvian General Mining Law and comprise the extraction, production and sale of copper cathodes and concentrates.
In September 2015, the expansion project commenced operations and is expected to reach full rates in early 2016.
The Company is engaged inproject, with a large-scale expansioncost of Cerro Verde´s production unit. The US$4.44.6 billion, project will expand theexpands processing capacity from 120,000 metric tons per day of ore to 360,000 metric tons per day, targetingand targets incremental annual production of approximately 600 million pounds of copper and 15 million of molybdenum beginning in 2016. In December 2012,molybdenum.
This expansion was financed with senior unsecured loans received by several banks lead by Citibank N.A. and with shareholders’ loans, currently subordinated to the Company received approval ofsenior unsecured loans before mentioned. See Note 12.
Notes to the Environmental Impact Study from the Peruvian Ministry of Energy and Mines. Detailed engineering and procurement of long-lead items are in progress. The Company expects to begin construction in 2013.financial statements (continued)
| (c) | Financial statements approval –-
The financial statements for the year ended December 31, 2015 were approved by Company´s Management on February 25, 2016 and, in Management’s opinion, they will be approved without changes by the Board of Directors and Shareholders’ Meetings to be held in the first quarter of 2016. The financial statements for the year ended December 31, 2014 were approved by the Board of Directors and Shareholders’ Meetings on March 27, 2015. |
The financial statements as of December 31, 2012 and 2011 were approved by Company´s Management on February 8, 2013 and will be presented for the approval of the Board of Directors and the Shareholders within the terms established by law. In Management’s opinion, the accompanying financial statements will be approved without changes by the Board of Directors and Shareholders’ Meetings that will be held in the first quarter of 2013.
Notes to the Financial Statements(continued)
| 2. | Significant accounting principles and policies |
| 2.1 | Basis of preparation - |
The financial statements of the Company have been prepared in accordance with International Financial Reporting Standards (“IFRS”), as issued by the International Accounting Standards Board (“IASB”), and interpretations issued by the IFRS Interpretations Committee (“IFRIC”).
The financial statements have been prepared based on a historical cost basis, except for accounts receivable and/or payable related to embedded derivatives whichthat have been measured at fair value.
The financial statements are presented in United States (“US”dollars (US$) dollars and include the years ended December 31, 2012, 20112015, 2014 and 2010.2013. Unless otherwise indicated, all values have been rounded to the nearest thousand.
| 2.2 | Accounting estimates, judgments and assumptions – |
The preparation of the financial statements according to IFRS requires that Management make judgments, estimates and assumptions that affect the amounts of the assets and liabilities reported, the disclosure of contingent assets and liabilities at the date of the financial statements, and the reported amounts of revenues and expenses for the years ended December 31, 2012, 2011 and 2010.
Estimates and assumptions are continuously evaluated and are based on the experience of Management and other factors, including expectations of future events that are reasonable under current circumstances; however, actual results could differ from these estimates.
Information about estimations and judgements taken into account by Management in the preparation of the financial statements follows:
| (a) | Estimates of ore reserves and resources - |
Ore reserves are estimates of the ore quantity that can be economically and legally extracted from the mine properties. The Company estimates its ore reserves based on information compiled by individuals qualified in reference to geological data about the size, depth and form of the ore body, and requires of geological judgments in order to interpret the data.
The estimation of recoverable reserves is based on factors such as estimated exchange rates, commodity prices, future requirements of capital and production costs, together with geological hypothesis and judgments made when estimating the size and quality of ore. Revisions in reserve or resource estimates may have an impact on the value of mining properties, property, plant and equipment, provisions for cost of mine closure, recognition of assets for deferred taxes and depreciation and amortization of assets.
Notes to the Financial Statements(continued)
| (b) | Units-of-production (“UOP”) depreciation - |
Estimates of recoverable reserves are used in determining the depreciation and amortization of mine assets. This results in a depreciation/amortization charge proportional to the depletion of the anticipated remaining life of mine production. Each item’s life, which is assessed annually, takes into account its physical life limitations and the present assessments of economically recoverable reserves. These calculations require the use of estimates and assumptions, including the amount of recoverable reserves that may be recovered.
The Company has determined that the Cerro Verde operation consists of one cash generating unit, considering the operation as a whole. Therefore, the Cerro Verde operation is evaluated annually in order to determine if there are any impairment indicators. If any such indication exists, the Company makes an estimate of the recoverable amount, which is the greater of the fair value less costs to sell and the value in use. These assessments require the use of estimates and assumptions, such as long-term commodity prices, discount rates, operating costs, and others.
Fair value is defined as the amount that would be obtained from the sale of the asset in an arm’s length transaction between willing and knowledgeable parties. The fair value of assets is generally determined as the current value of future cash flows derived from the continuous use of the asset, which includes estimates, such as the cost of future expansion plans and eventual disposal, while applying assumptions that an independent market participant may take into account. The cash flows are discounted by applying a discount rate that reflects current market, the time value of money and the risks specific to the asset.
| (d) | Mine closure provision- |
The Company assesses its mine closure provision annually. It is necessary to make estimates and assumptions in determining this provision, including cost estimates of activities that are necessary for the rehabilitation of the site, technological and regulatory changes, interest rates and inflation rates. As discussed in note 2.3(h), estimated changes in the fair value of the mine closure provision or the useful life of the related assets are recognized as an increase or decrease in the book value of the provision and related asset retirement cost (ARC) in accordance with IAS 16, “Property, Plant and Equipment”. If any change in the estimate results in an increase to the mine closure and related ARC, the Company shall consider whether or not this is an indicator of impairment of the assets and will apply impairment tests in accordance with IAS 36, “Impairments of Assets”.
Notes to the Financial Statements(continued)
Net realizable value tests are performed at least annually and represent the estimated future sales price of the product based on prevailing spot metals prices, less estimated costs to complete production and bring the inventory to sale. Additionally, in calculating the net realizable value of the Company’s long-term stockpiles, Management also considers the time value of money.
Mill and leach stockpiles generally contain lower grade ores that have been extracted from the ore body and are available for copper recovery. For mill stockpiles, recovery is through milling and concentrating. For leach stockpiles, recovery is through exposure to acidic solutions that dissolve copper and delivery it in solution to extraction processing facilities.
Because it is generally impracticable to determine copper contained in mill and leach stockpiles by physical count, reasonable estimation method are employed. The quantity of material delivered to mill and leach stockpiles is based on surveyed volumes of mined material and daily production records. Sampling and assaying of blasthole cuttings determine the estimated copper grades of material delivered to mill and leach stockpiles.
Expected copper recovery rates for mill stockpiles are determined by metallurgical sampling. The recoverability of copper in mill stockpiles, once entered into the production process, can be produced into copper concentrate almost immediately.
Estimated copper recovery rates are determined using laboratory tests, historical trends and other factors. Ultimate recovery of copper contained in leach stockpiles can vary significantly depending on several variables, including type of copper recovery, mineralogy and the size of the rocks. Processes and recovery rates are monitored continuously, and recovery rates are adjusted periodically as additional information becomes available and as related technology changes.
By their nature, contingencies will only be resolved when one or more future events do or do not occur. Determining contingencies inherently involves the exercise of judgment and calculation of the estimated results of future events.
| 2.3.2.2. | Summary of significant accounting policies and practices - |
The financial statements are presented in US dollars;dollars, which is also the Company’s functional currency.
Notes to the Financial Statements(continued)
Foreign currency transactions are considered to be those which are carried out in a currency that is other than the functionfunctional currency. Foreign currency transactions are translated intoinitially recorded in the functional currency by applyingat the rate of exchange rate in force onruling at the date of the transaction takes place.transaction. Monetary assets and liabilities denominated in foreign currencies are converted usingtranslated to the functional currency spot rate in forceof exchange ruling at the reporting date.
Gains and losses as a result of the difference in the exchange rate when currencymonetary items are liquidated or when converting currencymonetary items at exchange rates that are different from those used for their initial recognition are recognized in the statements of comprehensive income for the year.
The Company uses exchange rates published by the Superintendent of Banks, Insurance and AFP.Pension Fund Administrator. As of December 31, 2012,2015, the published exchange rates were S/.2.5943.408 for US$1 for buying and S/.2.5513.413 for US$1 for selling (S/.2.6952.981 for US$1 for buying and S/. 2.6972.989 for US$1 as of December 31, 2011, respectively)2014). These rates have been applied
Notes to the appropriate asset and liability accounts. As of December 31, 2012 and 2011, the Company did not maintain significant assets or liabilities in Nuevos Soles.financial statements (continued)
| (b) | Financial instruments: Initial recognition and subsequent measurement - |
A financial instrument is any agreement which originates a financial asset of the entity and a financial liability or equity instruments of other entity.
The Company determines the classification of its financial assets at initial recognition in accordance with IAS 39, “Financial Instruments: Recognition and Measurement”.
FinancialAll financial assets are recognized initially at fair value plus the directtransaction costs that are attributable to the transaction.acquisition of the financial asset. The Company’s financial assets include cash and cash equivalents, accounts receivable and embedded derivatives.
Cash and cash equivalents -
Cash and cash equivalents are financial assets that may be liquidated immediately, such as bank accounts, and other liquid investments with original maturities of three months or less.
Receivables -
The Company’s accounts receivables include trade accounts receivables to related parties and third parties and other accounts receivable. These receivables are stated at their transaction value, net of an allowance for doubtful accounts.
ReceivablesAccounts receivables are non-derivative financial assets with fixed or determinable payments that are not quoted in an active market. After initial measurement, the accounts receivables are subsequently carried at amortized cost using the effective interest method less any provision for impairment (i.e. allowance for doubtful accounts).
Notes to the Financial Statements(continued)
The Company assesses whether, as of the date of the financial statements, there is objective evidence of impairment in the value of the receivable. Any resulting impairment is measured as the difference between the book value of the receivable and the present value of the estimated future cash flows, discounted at an original effective interest rate or one applicable to a similar transaction. The carrying amount of the receivable is reduced by means of an allowance account and recognized in the statements of comprehensive income.
Embedded derivatives -
The Company’s copper sales are provisionally priced at the time of shipment. The provisional prices are finalized in a specified future month based on quoted London Metal Exchange (LME) monthly average prices. The Company receives market prices based on prices in the specified future month, which results in price fluctuations recorded through revenues until the date of settlement. The Company records revenues and commercial invoices at the time of shipment based on the current LME prices, which result in an embedded derivative that is required to be separated from the mainhost contract.
The Company’s embedded derivatives from sales are measured at fair value (based on LME spot copper prices) with subsequent changes recognized in the statements of comprehensive income until the month of settlement.maturity.
Notes to the financial statements (continued)
| (ii) | Financial liability - |
All financial liabilities are recognized initially at fair value and, in the case of accounts payable and other financial liabilities, net of directly attributable transaction costs. The Company´s financial liabilities include trade and other payables, other financial liabilities and embedded derivatives.
Loans-
Loans are initially recognized at their fair value, net of directly attributable transaction costs. After initial recognition, loans are subsequently measured at amortized cost using the effective interest rate method. Gains and losses are recognized in the statement of comprehensive income when the liabilities are derecognized as well as through the amortization process.
Amortized cost is calculated taking into account any discount or premium on acquisition and fees or costs that are an integral part of the effective interest rate. Amortization under the effective interest rate method is included as financial costs in the statement of comprehensive income.
| (iii) | Offsetting of financial instruments – |
Financial assets and financial liabilities are offset and the net amount is reported in the statements of financial position if there is a currently enforceable legal right to offset the recognized amounts and there is an intention to settle on a net basis, to realize the assets and settle the liabilities simultaneously.
Inventories are stated at the lower of cost or the net realizable value. Inventory of materials and supplies, as well as in progress and finished products are determined using the weighted-average cost method. The cost of finished goods and in - process inventory (i.e., stockpiles) includes labor and benefits, supplies, energy and other costs related to mining and processing of minerals. Net realizable value is the estimated future sales price based on forward metal prices (at the year that are expected to be processed), less estimated costs to complete production and bring the inventory to sale;sale.
The current portion of work in process is determined based on the expected amounts to be processed with the next twelve months. Inventories not expected to be processed within the next twelve months are classified as long-term.
No write-down of inventories was recorded as of December 31, 2015 and the discount rate.2014.
Provision for obsolescence -
Obsolescence allowances are established based on an item-by-item analysis made by Management. Any amount of obsolescence identified is charged to the statements of comprehensive income in the year it is deemedof occurrence.
Notes to have occurred.the financial statements (continued)
| (d) | Property, plant and equipment - |
Property, plant and equipment are valuedis stated at historical cost, including costs that are directly attributed to the construction or acquisition, net of accumulated depreciation amortization and impairment.
Notes to the Financial Statements(continued)
Repairs and/or improvementsaccumulated impairment losses, if any. The initial cost of an asset comprises its purchase price or construction cost, including customs duties and non-reimbursable taxes, as well as any costs directly attributable to bringing the asset into operation, the initial estimate of the rehabilitation obligation and, in the case of qualifying assets, the cost of borrowing. The capitalized value of a finance lease is also included in this caption.
Major maintenance and repairs -
Expenditure on major maintenance refits or repairs comprises the cost of replacement assets or parts of assets and overhaul costs. Where an asset that iswas separately depreciated separately and is required to be discharged ornow written off is replaced, creating an increase of economic life of property and for which it is probable that there will bethe future economic benefitbenefits associated with the item will flow to the Company are recorded as assets.through an extended life, the expenditure is capitalized. All other day-to-day maintenance and repairs costs are charged to expenseexpensed as incurred.
Where part of the asset was not separately considered as a component and therefore not depreciated separately, the replacement value is used to estimate the carrying amount of the replaced assets which is immediately written off.
Depreciation–
Land is not depreciated. Depreciation of assets directly related to the useful life of the mine is calculated using the UOP method based on the mine’s proven and probable reserves. Other assets are depreciated using the straight-line method based on the following estimated useful lives:
| | | Years |
| | |
| Buildings and other constructions | | Between 1015 and 3035 |
| Machinery and equipment | | Between 3 and 25 |
| Transportation units | | 7 |
| Furniture and fixtures | | 7 |
| Other equipment | | Between 3 and 25 |
Critical spare partsThe asset’s residual values, useful lives and those whichmethods of depreciation are directly identified with machinery or equipment are included in property, plantreviewed, at each reporting period and equipment, and the economic life assigned will be related to the main asset with which they are identified.adjusted prospectively, if appropriate.
Disposals–
An item of property, plant and equipment is retired at the time of itsderecognized upon disposal or when no future economic benefits are expected from its use or subsequent disposition.disposal. Any gain or loss arising at the timeon derecognition of retirement is calculatedtproperty, plant and equipment (calculated as the difference between the net disposal proceeds from the sale and the book valuecarrying amount of the asset andasset) is included in the statements of comprehensive income in the yearwhen the asset is retired.derecognized.
The residual value and useful economic lives of
Notes to the Company’s property, plant and equipment are reviewed, and adjusted if appropriate, at each year end. The Company also assesses, at the end of each period, whether there is an indication that its property, plant and equipment may be impaired.financial statements (continued)
| (e) | Exploration development and strippingdevelopment costs – |
Exploration costs -
Mineral exploration costs, as well as drilling and other costs incurred for the purpose of converting mineral resources toobtaining proven and probable reserves, or identifying new mineral resources at development or production stage properties, are charged to the statements of comprehensive income as incurred.
Development costs -
Development costs are capitalized based on the Management´s judgement,judgment, when the economic and technological feasibility of the project is confirmed, which is generally when the development or expansion project has reached a milestone in accordance with a model established by the Company.
Notes These costs are amortized when production beings, on the units-of-production basis over the proven and probable reserves. Development costs necessary to the Financial Statements(continued)maintain production are expensed as incurred.
Stripping cost -
The Company records the cost of stripping incurred during the mine’s production stage as a variable production cost and includes themIn accordance with IFRIC 20, “Stripping Cost in the costProduction Phase of inventory produced during the period when sucha Surface Mine,” stripping costs were incurred. Stripping costs incurred in the development of a mine (i.e., before production commences)phase are capitalized untilas a component of property, plant and equipment (see Note 9) if the production stagestripping activity improves access to the ore body or enhances an existing asset. The stripping activity asset is initiated and subsequently amortized using the UOP method.
The intangible assets acquired are recorded at cost less accumulated amortization. As indicated in note 16(c), the Company has recorded an intangible asset for the future benefit of electrical energy at a fixed price, which is being amortized over the term of the contract, which expires December 31, 2015. The Company assesses at the end of each period, whether there is an indication that its intangible asset may be impaired.
| (g) | Impairment of non-financial assets - |
At each reporting date, the Company evaluates if there is any indication that an asset couldmay be impaired. If such anany indication exists, the Company estimates the recoverable amount of the asset. The recoverable amount of an asset is the greaterhigher of its fair value less costs to sell orof disposal and its value in use and is determined for the assets of the mine as a whole, since there are no assets that generate cash revenues independently.
When the book valuecarrying amount of an asset exceeds its recoverable amount, the asset is considered impaired and is reducedwritten down to its recoverable amount. When evaluating theIn assessing value in use, the estimated future estimated cash flows are discounted to their present value using a pre-tax discount rate before taxes that reflects current market evaluationsassessments of the time value of money and the risks specific risks to the asset.
Losses resulting from the impairment of assetsImpairment losses are recognized in the statements of comprehensive income under the categories of expenses consistent with the function of the impaired asset. A previously recognized impairment loss is reversed only if there has been a change in the estimatesassumptions used to determine the asset’s recoverable amount since the last impairment loss was recognized. The revised valuation cannotreversal is limited so that the carrying amount of the asset does not exceed if recoverable amount, nor exceed the book valuecarrying amount that would have been determined, net of depreciation, if anhad no impairment loss been recognized for the asset had not been recognized in a previous period.prior years. Such a reversal is recognized in the statements of comprehensive income.
Notes to the Financial Statementsfinancial statements (continued)
There was no indication of impairment of the Company’s assets as of December 31, 2012 and December 31, 2011.
| | Intangible assets are recognized initially at cost. After the initial recognition, the intangible assets are recorded at its cost less accumulated amortization and any accumulated loss for impairment of use, if applicable. |
General -
A provision isProvisions are recognized when the Company has a present obligation (legal or constructive) as a result of a past event, it is probable that an outflow of resources of the Companyembodying economic benefit will be required to settle the obligation and ana reliable estimate can be made of the amount of the obligation can be calculated.obligation. The expense relating to anya provision is presented in the statements of comprehensive income, net of any reimbursement, in the period the provision is established.reimbursement.
If the effect of the time value of money is significant,material, provisions are discounted by applyingusing a discount rate that reflects, wherewhen applicable, the risks specific to the liability. When discounting is used, the increase in the provision due to the passage of time is recognized as a financial expensefinance costs in the statements of comprehensive income.
MineProvision for remediation and mine closure provision -
The Company records a provision for remediation and mine closure provision when a contractually or legally enforceable obligation arises. The Company estimates the present value of its future obligation for mine closure and increases the carrying amount of the related “Asset Retirement Cost” - ARC, which is included in property, plant and equipment. Subsequently, the mine closure provision is accreted to full value over time and recognized as an interest cost considered in the initial fair value estimate. The related ARC is depreciated using the units-of-production method during the economic life of the mine.
The Company evaluates its provision for remediation and mine closure provision annuallyquarterly and makes adjustments to estimates and assumptions, including scope, future costs and discount rates, as applicable. Changes in the fair value of theprovision for remediation and mine closure provision or the useful life of the related asset are recognized as an increase or decrease in the book value of the provision and the related ARC in accordance with IAS 16. Any decrease in the mine closure provision and related ARC cannotmay not exceed the current book valuecarrying amount of the asset; amountsasset. If it does, any excess over the current bookcarrying value will be recorded inis taken immediately to the statements of comprehensive income.
| (i)(j) | Revenue recognition - |
The Company primarily sells copper cathodes and concentrates in accordance with sales contracts entered into with its customers. Revenues comprise the fair value of the sale of goods, net of related general sales taxes. The Company recognizes revenue when the amount can be reliably measured, it is probable that future economic benefits will flow to the Company and all significant risks (including title and insurance risk) and rewards of ownership have transferred to the customer. Revenue is not considered reliably measured until all contingencies relating to the sale have been resolved.
Notes to the Financial Statementsfinancial statements (continued)
Sales of copper cathodes and concentrates –
LocalDomestic sales of copper cathodes and concentrates are recognized when the Company has delivered the goods to the shipping company designated by the customer. Revenue associated with foreign sales of copper cathodes and copper concentrates is recognized when all significant risks and rewards of ownership have transferred to the customer, which is typically when the inventory has passed over the vessel’s rail at the port of loading.
As described in note 2.3(b)2.2(b), the Company’s copper sales are provisionally priced at the time of shipment. The provisional prices are finalized in a specified future month in accordance with the terms specified in the related sales contract and based on quoted LME monthly average prices. The Company receives market prices in the specified future month, and these sales resultthe effect of the changes in changessuch market prices are recorded toas revenues until the specified future month. The Company records revenues and commercial invoices at the time of shipment based on the current LME prices, which result in an embedded derivative that is bifurcated from the host contract.
Since year 2014, the Company’s revenues are subject to royalties for two governmental entities. These funds will be used for these entities as part of their operational budgets for the supervision of energy and mining investment and the environment. The calculation for the OSINERGMIN contribution is 0.21% of invoiced sales for 2014, 0.19% for 2015, and 0.16% for 2016, and the calculation for the OEFA contribution is 0.15% of invoiced sales for 2014 and 2015, and 0.13% for 2016. These royalties are presented as reduction of revenues (see note 17).
Costs directly attributable to the acquisition, construction or production of a qualifying asset are capitalized as finance part of the cost of an asset. A qualifying asset is one whose value is greater than US$1 million and requires a longer period to 12 months to get ready for its intended use. All other borrowing costs are expensed in the period in which they occur. Borrowing costs consist of interest and other costs that the Company incurs in connection with the borrowing of funds.
| (l) | Income taxes, deferred taxes and other taxes- |
Income taxesCurrent income tax-
IncomeCurrent income tax assets and liabilities are measured at the amounts expected to be paid to or recovered from or paid or the tax authorities.authority. The tax rates and tax laws that are appliedused to compute the amountsamount are those that are enacted or substantially enacted, at the end of the year.reporting period. The Company calculates the provision for current income tax based on the tax stability agreement described in accordance withNote 16(a).
Notes to the Peruvian tax legislation in force. The income tax rate in Peru was 30% as of December 31, 2012 and 2011.financial statements (continued)
Deferred taxesincome tax -
The deferredDeferred income tax is presentedprovided using the liability method foron temporary differences between the tax basesbasis of assets and liabilities and their book valuescarrying amounts for financial reporting purposes.purposes at their reporting date. Deferred tax liabilities are recognized for all taxable temporary differences. Deferred income tax assets are recordedrecognized for all deductible temporary differences, when thereto the extent that is a probabilityprobable that there couldtaxable profit will be future taxable earningsavailable against which the deductible temporary differences, couldand the carry forward of unused tax credits and unused tax losses can be applied.utilized.
The book valuecarrying amount of the deferred tax assetassets is reviewed at the end of each periodreporting date and reduced to an amountthe extent that is more likely than not to be realized against taxable earnings. Deferred tax assets that are not recognized are reassessed at each period and are recognized when it is more likely than notno longer probable that futuresufficient taxable earningsprofit will be available to allow forall or part of the deferred tax asset to be recovered.
Notesutilized. Unrecognized deferred tax assets are re-assessed at each reporting date and are recognized to the Financial Statements(continued)extent that it has become probable that future taxable profits will allow the deferred tax asset to be recovered.
Deferred tax assets and liabilities are measured at the tax rates that are expected to be applicable duringapply in the year when the assets areasset is realized or the liabilities are liquidated,liability is settled, based on the tax rates (andand tax laws)laws that have been enacted or substantively enacted at the end of the period. reporting date.
Deferred tax assets and deferred tax liabilities are offset if there is a legally enforceable right to offsetset off current tax assets against current income tax liabilities and the deferred tax is relatedtaxes relate to the same taxable entity and the same taxtaxation authority.
Mining TaxesPeruvian mining royalties and special mining tax -
On September 29, 2011, Law No. 29788 (which amended Law No. 28528) was enacted creating a new mining tax and royalty regime in Peru.
| - | Stability agreement effective until December 31, 2013 |
Under the new regime, companies that do not have stability agreements will bewere subject to a revised royalty and a special mining tax. Cerro Verde operatesThe Company operated under a stability agreement and therefore iswas not subject to the revised royalty and special mining tax until its stability agreement expiresexpired on December 31, 2013. The Peruvian government has also created a special mining burden that companies with tax stability agreements cancould elect to pay. The special mining burden is based on a sliding scale of 4% to 13%, with a maximum effective tax rate of 8.79%. Cerro Verde will electCompany elected to pay this special mining burden during the remaining term of its stability agreement. See Note 16 (c).
| (k)- | Workers’ profit sharingStability agreement effective since January 1, 2014 |
Beginning January 1, 2014, under the terms of the new stability agreement, the Company will pay mining royalties and special mining tax for all its production based on Law No. 29788.
Notes to the financial statements (continued)
| - | Mining Royalties and Special Mining Tax are in the scope of IAS 12 “Income Tax” and are considered income tax. |
Supplementary Retirement Fund–
Law No. 29741, enacted on July 9, 2011, created a Mining and Metallurgical Retirement Fund, which is applicable to the Company starting 2014. Under the terms of its new 15-year stability agreement, the base of calculation of this contribution is 0.5% of pre-tax income. These funds will be used for the jubilee of the mining and metallurgical workers. The contribution is presented as income tax due to the same basis of calculation.
| (m) | Benefits to employees - |
Salaries and wages, bonuses, post-employment benefits and vacations are calculated in accordance with IAS 19, "Employee Benefits" and are calculated in accordance with current Peruvian legislation based on the accrual basis.
Workers’ profit sharing
The Company recognizes worker’sworkers’ profit sharing Inin accordance with IAS 19, “Employees Benefits”Benefits". Workers’Workers' profit sharing is calculated in accordance with the Peruvian lawslaw (Legislative Decree No. 892), and the Company’s workers’ profit sharingapplicable rate is 8% over the taxable net base of current year. According to Peruvian law, the limit in the workers’workers' profit sharing that an employee couldcan receive is equivalent to 18 months of wages, and any excess above such limit willhas be transferred to the Regional Government and “National FoundFund for Employment’s Promotion and Training” (“FONDOEMPLEO”). The Company’s workers’ profit sharing is recognized as a liability in the statement of financial position and as an operating expense in the statements of comprehensive income.income (See note 18).
| (l)(n) | Basic and dilutedearningsper share - |
Basic and diluted earnings per share have been calculated based on the weighted average number of common shares held during the period. When the number of shares is modified as a result of capitalization of retained earnings, the net income per basic and diluted share is adjusted retroactively for all of the periods reported. For the years ended as of December 31, 2012, 20112015, 2014 and 2010,2013, the Company did not have any financial instrument with dilutive effects; as a result, the basic and diluted shares are the same in all years presented.
Notes to the Financial Statements(continued)
| 2.4.(o) | New IFRS and IFRIC –Fair value measurement - |
Improvements and amendments to IFRS issued, effective in 2012 and also those which are not yet effective, include the following:The Company measures its embedded derivatives, at fair value at each statement of financial position.
EffectiveFair value is the price that would be received to sell an asset or paid to transfer a liability in 2012.-
There are no new or amended standards and interpretations effective in 2012 that impact eitheran orderly transaction between market participants at the financial position, financial results, disclosure or stated accounting policies of the Company.measurement date.
Effective in 2013.-
| - F-169 | IAS 1, Presentation of Financial Statements, effective for annual periods beginning on July 1, 2012. The amendments to IAS 1 change the grouping of items presented in the statement of comprehensive income. |
| - | IAS 27, Separate Financial Statements (revised in 2011), effective for annual periods beginning on January 1, 2013. As a consequence of the new IFRS 10 and IFRS 12, what remains in IAS 27 is limited to accounting for subsidiaries, joint arrangements and associates in separate financial statements. |
| - | IAS 28, Investments in associates and joint ventures (revised in 2011), effective for annual periods beginning on January 1, 2013. As a consequence of the new IFRS 11 and IFRS 12, IAS 28 Investments in Associates and Joint Ventures, describes the application of the equity method to investments in joint ventures in addition to associates. |
| - | IAS 19, “Employee Benefits (Amendment)”, effective January 1, 2013, amends the recognition and disclosure requirements for defined benefit plans. |
| - | IFRS 9, “Financial Instruments”, effective January 1, 2015, modifies the treatment and classification of financial assets established by IAS 39, “Financial Instruments: Recognition and Measurement”. |
| - | IFRS 10, “Consolidated Financial Statements”, effective January 1, 2013, replaces the consolidation requirements in SIC-12, “Consolidation—Special Purpose Entities” and IAS 27, “Consolidated and Separate Financial Statements”. |
| - | IFRS 11, “Joint Arrangement”, effective January 1, 2013, addresses inconsistencies in the reporting of joint arrangements by requiring a single method to account for interests in jointly controlled entities. The guidance focuses on the rights and obligations of the joint arrangement, rather than its legal form (as is currently the case). |
Notes to the Financial Statementsfinancial statements (continued)
The Company uses valuation techniques that are appropriate in the circumstances and for which sufficient data are available to measure fair value, maximizing the use of relevant observable inputs and minimizing the use of unobservable inputs.
All assets and liabilities for which fair value is measured or disclosed in the financial statements are categorized within the fair value hierarchy, described, as follows, based on the lowest level input that is significant to the fair value measurement as a whole:
| - | IFRS 12, “Disclosure of InterestsLevel 1 — Quoted (unadjusted) market prices in Other Entities”, effective January 1, 2013, is a new and comprehensive standard on disclosure requirementsactive markets for all forms of interests in other entities, including subsidiaries, joint arrangements, associates and unconsolidated structured entities.identical assets or liabilities |
| - | IFRS 13, “Fair Value Measurement”, effective January 1, 2013, definesLevel 2 — Valuation techniques for which the lowest-level input that is significant to the fair value sets out a framework for measuring fair value and requires disclosures about fair value measurements.measurement is directly or indirectly observable |
| - | IFRIC 20, “Stripping Costs inLevel 3 — Valuation techniques for which the Production Phase of a Surface Mine”, effective January 1, 2013, clarifies whenlowest level input that is significant to the stripping cost in the production phase should be recognized as an asset andhow that asset should be measured, both initially and in subsequent periods.fair value measurement is unobservable |
Annual improvements to IFRS (issued in May 2012) -For the purpose of fair value disclosures, the Company has determined classes of assets and liabilities based on the nature, characteristics and risks of the asset or liability and the level of the fair value hierarchy as explained above
| -3. | IAS 1, Presentation of Financial Statements, clarifies the difference between voluntary annual comparative informationAccounting estimates, judgments and the minimum required of comparative period is the previous period.assumptions – |
The preparation of the Company’s financial statements according to IFRS requires Management to make judgments, estimates and assumptions to determine the reported amounts of assets and liabilities, the disclosure of contingent assets and liabilities to the date of financial statements, and for the reported amounts of revenues and expenses for the years finished as of December 31, 2015, 2014 and 2013.
Estimates and assumptions are continuously evaluated and are based on the experience of Management and other factors, including expectations of future events that are reasonable under current circumstances; however, actual results could differ from these estimates.
Information about estimations and judgments taken into account by Management in the preparation of the financial statements follows:
| -3.1 | IAS 16, Property, Plant and Equipment, clarifies that major spare parts and servicing equipments that meet the definition of property, plant and equipment are not inventories.Judgments - |
By their nature, contingencies will be resolved only when one or more uncertain future events occur or fail to occur. The assessment of the existence and potential quantum of contingencies inherently involves the exercise of significant judgment and the use of estimates regarding the outcome of future events.
| -(b) | IAS 32, Financial Instruments: Presentation, clarifies that income taxes arising from distributions to equity holders are accounted for in accordance with IAS 12.Stripping cost - |
The Company incurs waste removal costs (stripping costs) during the development and production phases of its surface mining operations. During the production phase, stripping costs (production stripping costs) can be incurred both in relation to the production of inventory in that period and the creation of improved access and mining flexibility in relation to ore to be mined in the future. The former are included as part of the costs of inventory, while the latter are capitalized as a stripping activity asset, where certain criteria are met.
Such
Notes to the financial statements (continued)
Once the Company has identified its production stripping for each surface mining operation, it identifies the separate components of the ore bodies for each of its mining operations. An identifiable component is a specific volume of the ore body that is made more accessible by the stripping activity. Significant judgment is required to identify and define these components, and also to determine the expected volumes (e.g., in tons) of waste to be stripped and ore to be mined in each of these components.
| 3.2 | Estimates and assumptions - |
| (a) | Determination of mineral reserves and resources - |
Ore reserves are estimates of the ore quantity that can be economically and legally extracted from the mine concessions. The Company estimates its ore reserves based on information compiled by individuals qualified in reference to geological data about the size, depth and form of the ore body, and requires of geological judgments in order to interpret the data.
The estimation of recoverable reserves is based on factors such as estimated exchange rates, commodity prices, future requirements of capital and production costs, together with geological hypothesis and judgments made when estimating the size and quality of ore. Revisions in reserve or resource estimates have an impact on the value of mining properties, property, plant and equipment, provisions for cost of mine closure, recognition of assets for deferred taxes and depreciation and amortization of assets.
| (b) | Units of production depreciation - |
Estimated economically recoverable reserves are used in determining the depreciation and/or amortization of mine-specific assets. This results in a depreciation/amortization charge proportional to the depletion of the anticipated remaining life-of-mine production. The life of each item, which is assessed at least annually, has regard to both its physical life limitations and present assessments of economically recoverable reserves of the mine property at which the asset is located. These calculations require the use of estimates and assumptions, including the amount of recoverable reserves.
| (c) | Provision for remediation and mine closure- |
The Company assesses its provision for remediation and mine closure quarterly. It is necessary to make estimates and assumptions in determining this provision, including cost estimates of activities that are necessary for the rehabilitation of the site, technological and regulatory changes, interest rates and inflation rates. As discussed in Note 2.2(i), estimated changes in the fair value of the provision for remediation and mine closure or the useful life of the related assets are recognized as an increase or decrease in the book value of the provision and related asset retirement cost (ARC) in accordance with IAS 16, “Property, Plant and Equipment”.
Notes to the financial statements (continued)
If any change in the estimate results in an increase to the provision for remediation and mine closure and related ARC, the Company shall consider whether or not this is an indicator of impairment of the assets and will apply impairment tests in accordance with IAS 36, “Impairments of Assets”.
Net realizable value tests are performed at least annually and represent the estimated future sales price of the product based on prevailing spot metals prices, less estimated costs to complete production and bring the inventory to sale. Additionally, in calculating the net realizable value of the Company’s long-term stockpiles, Management also considers the time value of money.
Mill and leach stockpiles generally contain lower grade ores that have been extracted from the ore body and are available for copper recovery. For mill stockpiles, recovery is through milling and concentrating. For leach stockpiles, recovery is through exposure to acidic solutions that dissolve copper and delivery it in solution to extraction processing facilities.
Because it is generally impracticable to determine copper contained in mill and leach stockpiles by physical count, a reasonable estimation method is employed. The quantity of material delivered to mill and leach stockpiles is based on surveyed volumes of mined material and daily production records. Sampling and assaying of blasthole cuttings determine the estimated copper grades of material delivered to mill and leach stockpiles.
Expected copper recovery rates for mill stockpiles are determined by metallurgical sampling. The recoverability of copper in mill stockpiles, once entered into the production process, can be produced into copper concentrate rapidly.
Estimated copper recovery rates are determined using laboratory tests, historical trends and other factors. Ultimate recovery of copper contained in leach stockpiles can vary significantly depending on several variables, including type of copper recovery, mineralogy and the size of the rocks. Processes and recovery rates are monitored continuously, and recovery rates are adjusted periodically as additional information becomes available and as related technology changes.
Management has determined that the Company’s operations consist of one cash generating unit. Therefore, the Company’s operations are evaluated annually in order to determine if there are impairment indicators. If any such indication exists, the Company makes an estimate of the recoverable amount, which is the greater of the fair value less costs to sell and the value in use. These assessments require the use of estimates and assumptions, such as long-term commodity prices, discount rates, operating costs, and others.
Notes to the financial statements (continued)
Fair value is defined as the amount that would be obtained from the sale of the asset in an arm’s length transaction between willing and knowledgeable parties. The fair value of assets is generally determined as the current value of future cash flows derived from the continuous use of the asset, which includes estimates, such as the cost of future expansion plans and eventual disposal, while applying assumptions that an independent market participant may take into account. The cash flows are discounted by applying a discount rate that reflects current market, the time value of money and the risks specific to the asset.
As a result of the decline in copper prices, the Company evaluated its long-lived assets for impairment as of December 31, 2015, which did not result in any impairment charges. The determination of value in use is considered to be a Level 3 fair value measurement, as it is derived from valuation techniques that include inputs that are not based on observable market data. The Company considers the inputs and the valuation approach to be consistent with the approach taken by market participants.
The key assumptions/inputs used in the determination of the Company’s fair value included production volumes, copper prices and discount rates. Estimated production volumes are based on detailed life-of-mine plans and are dependent on a number of variables, including recoverable quantities, the production profile, production costs, and the selling price of the commodities extracted. Short-term copper prices used in determining value in use ranged from US$2.13 to US$2.16 per pound, which were based on quoted forward market prices as of December 31, 2015, and the long-term copper price assumption was US$3.00 per pound, which reflects management’s long-term view of global supply and demand. In addition to estimates of production volumes and copper price assumptions, the determination of value in use was based on an post-tax discount rate of 8.5% applied to the future estimated cash flows; which was derived from the weighted average cost of capital, with appropriate adjustments made to reflect the risks specific to the Company.
There was no asset impairment loss for the Company as of December 31, 2015 and 2014.
| 4. | Standard issued but not effective |
Following is a summary of improvements and amendments to IFRS that are not yet effective but will be applicable to the Company.
IFRS 9 Financial Instruments
In July 2014, the IASB issued the final version of IFRS 9 Financial Instruments that replaces IAS 39 and all previous versions of IFRS 9. IFRS 9 brings together all three aspects of the accounting for financial instruments project: classification and measurement, impairment and hedge accounting. IFRS 9 is effective for annual periods beginning on or after January 1, 2013.2018, with early application permitted.The adoption of IFRS 9 is not expected to have a significant effect on the classification and measurement of the Company’s financial assets and liabilities.
Notes to the financial statements (continued)
ManagementIFRS 15 Revenue from Contracts with Customers
IFRS 15 was issued in May 2014 and establishes a five-step model to account for revenue arising from contracts with customers. Under IFRS 15, revenue is recognized at an amount that reflects the consideration to which an entity expects to be entitled in exchange for transferring goods or services to a customer. The new revenue standard will supersede all current revenue recognition requirements under IFRS. Either a full retrospective application or a modified retrospective application is required for annual periods beginning on or after January 1, 2018. Early adoption is permitted. The Company is currently evaluatingassessing the impact of the new pronouncements described abovethis guidance on the Company’sits financial reporting and disclosures, forbut at this time does not expect the year 2013.
Notesadoption of IFRS 15 to the Financial Statements(continued)have a material impact on its financial statements.
| 3.5. | Cash and cash equivalents |
| (a) | This item is made up usas follows: |
| | | 2012 | | 2011 | | | 2015 | | 2014 | |
| | | US$(000) | | US$(000) | | | US$(000) | | US$(000) | |
| | | | | | | | | | | |
| Cash in banks | | | | 5,604 | | | | 7,698 | |
| Cash equivalents (b) | | | 1,421,955 | | | | 1,376,818 | | | | 348 | | | | 11,876 | |
| Cash in banks | | | 5,573 | | | | 6,818 | | |
| | | | | | | | | | | | | | | | | |
| | | | 1,427,528 | | | | 1,383,636 | | | | 5,952 | | | | 19,574 | |
| (b) | Cash equivalents comprises a portfolio of investments in highly marketable liquid investments (investments classified as “AAA” by Standard & Poor’s and Moody’s), which yield variable returns, and are classified as cash equivalents because they are readily convertible to known amounts of cash. During the year 2015, Management plans to use themused the majority of its investments for its short-term cash needs. Because of the short original maturity of these investments, less than 90 days, the carrying amount of these investments corresponds to their fair value at the date of the financial statements. Changes in the fair value of these investments are insignificant. |
| 4.6. | Trade accounts receivable |
Trade accounts receivable are generated primarily from the Company’s cathode and copper concentrate sales, are denominated in US dollars, have current maturities, do not bear interest and have no specific guarantees.
| 5. F-174 | Other long-term accounts receivable |
Correspond to additional disbursements made by the Company related to the monthly pre payments of income tax which might be offset with future tax debts or be recovered by a request of refund to the Tax authority. As of December 31, 2012, these overpayments amounted to US$63,964,000 and are presented as non-current assets in the statement of financial position.
Notes to the Financial Statementsfinancial statements (continued)
| (a) | This item is made up as follows: |
| | | 2015 | | | 2014 | |
| | | US$(000) | | | US$(000) | |
| Short-term | | | | | | | | |
| Value added tax credit (VAT) (b) | | | 408,202 | | | | 222,357 | |
| Income tax prepayments (c) | | | 21,718 | | | | - | |
| Other taxes to be recovered | | | 2,379 | | | | 2,719 | |
| | | | | | | | | |
| | | | 432,299 | | | | 225,076 | |
| Long-term | | | | | | | | |
| Other accounts receivable (d) | | | 180,741 | | | | 182,756 | |
| Income tax prepayments (c) | | | 91,879 | | | | 30,728 | |
| Installment program (mining royalties case) (e) | | | 64,405 | | | | 39,700 | |
| Value added tax credit (VAT) (b) | | | 44,977 | | | | - | |
| | | | | | | | | |
| | | | 382,002 | | | | 253,184 | |
| (b) | Mainly attributable to purchases related to the expansion of the Company´s production unit (See Note 1(b)). The Company expects to recover the VAT credits in short and long-term. |
| (c) | Corresponds to disbursements made by the Company related to prepayment of income tax, which the Company expects to use to offset with future tax obligations or will be refunded to the Company by the Tax Authority. |
| (d) | Corresponds to disbursements made by the Company under protest in connection with disputed tax assessments from years 2004 to 2010. The most significant issues observed are: |
| - | Deductibility of certain management fees rendered by a related entity; |
| - | Application of accelerated depreciation deduction related to the first concentrator plant as it claims the Company is not entitled to this benefit under its 1998 stability agreement; and |
| - | Certain disbursements would qualify as fixed assets. |
These claims are currently under review in the Tax Court. According to current tax procedures and time frame for resolving these types of claims, the Company and its legal advisors expect favorable resolution in all cases due to the strength of their arguments.
| (e) | Corresponds to payments made under protest by the Company in connection to installment program approved by the tax authority associated with mining royalties for the period December 2006 to December 2008, which is described in Note 16(e). Management expects that the resolution of this matter will be favorable to the Company. |
Notes to the financial statements (continued)
| (a) | This item is made up as follows: |
| | | 2012 | | 2011 | | | 2015 | | 2014 | |
| | | US$(000) | | US$(000) | | | US$(000) | | US$(000) | |
| Finished goods: | | | | | | | | | | | | | | | |
| Copper concentrate | | | | 8,948 | | | | 11,942 | |
| Copper cathodes | | | 7,481 | | | | 7,565 | | | | 11,865 | | | | 8,809 | |
| Copper concentrate | | | 12,728 | | | | 6,079 | | |
| Molybdenum concentrate | | | 1,467 | | | | 1,264 | | | | 1,292 | | | | 1,821 | |
| | | | | | | | | | |
| Balance of finished goods, see note 14 | | | 21,676 | | | | 14,908 | | |
| | | | | | | | | | |
| Balance of finished goods | | | | 22,105 | | | | 22,572 | |
| Work-in-process (b) | | | 213,734 | | | | 165,635 | | | | 445,003 | | | | 326,676 | |
| Materials and supplies | | | 149,874 | | | | 137,137 | | | | 247,107 | | | | 170,146 | |
| Materials and supplies in transit | | | 1,326 | | | | 761 | | | | 1,315 | | | | 1,269 | |
| Less - Provision for obsolescence of materials and supplies | | | (2,711 | ) | | | (1,933 | ) | | | (692 | ) | | | (407 | ) |
| | | | | | | | | | |
| Total Inventories | | | 383,899 | | | | 316,508 | | | | 714,838 | | | | 520,256 | |
| Less - Long-term inventories (b) | | | (188,990 | ) | | | (140,671 | ) | | | (319,971 | ) | | | (287,714 | ) |
| | | | | | | | | | |
| Current inventories, net | | | 194,909 | | | | 175,837 | | | | 394,867 | | | | 232,542 | |
| (b) | Work in processWork-in-process inventories represent mill and leach stockpiles which generally contain higher grade ores and medium and lower grade ores that have been extracted from the ore bodyopen pit and are available for copper recovery. Based on the mine future plan production, the Company identifies the portion of inventory that is going to be classified as short or long term. For mill stockpiles, recovery is through milling and concentrating. For leach stockpiles, recovery is through exposure to acidic solutions that dissolve copper and deliverdelivery it in solution to the extraction processing facilities (see note 2.2(e)3.2(d)). |
Notes to the Financial Statementsfinancial statements (continued)
| 7.9. | Property, plant and equipment, net |
| (a) | The movement in cost and accumulated depreciation accounts as of December 31, 20122015 and 20112014 are shown below: |
| | | January 1,
2011 | | | Additions | | | Retirements
and disposals | | | Transfers | | | December 31,
2011 | | | Additions | | | Retirements
and disposals | | | Transfers | | | December 31,
2012 | |
| | | US$(000) | | | US$(000) | | | US$(000) | | | US$(000) | | | US$(000) | | | US$(000) | | | US$(000) | | | US$(000) | | | US$(000) | |
| Land | | | 1,497 | | | | - | | | | - | | | | - | | | | 1,497 | | | | - | | | | - | | | | - | | | | 1,497 | |
| Buildings and other constructions | | | 91,042 | | | | - | | | | - | | | | 13,046 | | | | 104,088 | | | | - | | | | (20 | ) | | | 25,061 | | | | 129,129 | |
| Machinery and equipment | | | 1,447,076 | | | | - | | | | (4,667 | ) | | | 67,916 | | | | 1,510,325 | | | | - | | | | (101 | ) | | | 240,006 | | | | 1,750,230 | |
| Transportation units | | | 8,849 | | | | - | | | | - | | | | 2,433 | | | | 11,282 | | | | - | | | | (767 | ) | | | 1,655 | | | | 12,170 | |
| Furniture and fixtures | | | 786 | | | | - | | | | - | | | | - | | | | 786 | | | | - | | | | - | | | | - | | | | 786 | |
| Other equipment | | | 11,862 | | | | - | | | | (129 | ) | | | 737 | | | | 12,470 | | | | - | | | | (1,046 | ) | | | 10,283 | | | | 21,707 | |
| Work in progress and transit units (b) | | | 69,801 | | | | 195,222 | | | | - | | | | (84,132 | ) | | | 180,891 | | | | 600,872 | | | | - | | | | (277,005 | ) | | | 504,758 | |
| Remediation and mine closure costs, note 16(a) | | | 3,666 | | | | 3,217 | | | | - | | | | - | | | | 6,883 | | | | 72,512 | | | | - | | | | - | | | | 79,395 | |
| | | | | | | | | | | | | | | | | | | | | | | | | | | | | | | | | | | | | |
| | | | 1,634,579 | | | | 198,439 | | | | (4,796 | ) | | | - | | | | 1,828,222 | | | | 673,384 | | | | (1,934 | ) | | | - | | | | 2,499,672 | |
| | | | | | | | | | | | | | | | | | | | | | | | | | | | | | | | | | | | | |
| Accumulated depreciation | | | | | | | | | | | | | | | | | | | | | | | | | | | | | | | | | | | | |
| Buildings and other constructions | | | 26,019 | | | | 2,786 | | | | - | | | | - | | | | 28,805 | | | | 2,675 | | | | (17 | ) | | | - | | | | 31,463 | |
| Machinery and equipment | | | 483,678 | | | | 77,593 | | | | (605 | ) | | | - | | | | 560,666 | | | | 88,346 | | | | (68 | ) | | | - | | | | 648,944 | |
| Transportation units | | | 6,733 | | | | 714 | | | | - | | | | - | | | | 7,447 | | | | 933 | | | | (767 | ) | | | - | | | | 7,613 | |
| Furniture and fixtures | | | 532 | | | | 94 | | | | - | | | | - | | | | 626 | | | | 87 | | | | - | | | | - | | | | 713 | |
| Other equipment | | | 6,428 | | | | 1,055 | | | | (129 | ) | | | - | | | | 7,354 | | | | 1,820 | | | | (1,058 | ) | | | - | | | | 8,116 | |
| Remediation and mine closure costs | | | 2,544 | | | | 189 | | | | - | | | | - | | | | 2,733 | | | | 381 | | | | - | | | | - | | | | 3,114 | |
| | | | | | | | | | | | | | | | | | | | | | | | | | | | | | | | | | | | | |
| | | | 525,934 | | | | 82,431 | | | | (734 | ) | | | - | | | | 607,631 | | | | 94,242 | | | | (1,910 | ) | | | - | | | | 699,963 | |
| | | | | | | | | | | | | | | | | | | | | | | | | | | | | | | | | | | | | |
| Net cost | | | 1,108,645 | | | | | | | | | | | | | | | | 1,220,591 | | | | | | | | | | | | | | | | 1,799,709 | |
| | | January
1, 2014 | | | Additions | | | Retirements
and disposals | | | Adjustments
and reclassifications | | | Transfers | | | December
31, 2014 | | | Additions | | | Retirements
and disposals | | | Adjustments
and reclassifications | | | Transfers | | | December
31, 2015 | |
| | | US$(000) | | | US$(000) | | | US$(000) | | | US$(000) | | | US$(000) | | | US$(000) | | | US$(000) | | | US$(000) | | | US$(000) | | | US$(000) | | | US$(000) | |
| | | | | | | | | | | | | | | | | | | | | | | | | | | | | | | | | | |
| Cost | | | | | | | | | | | | | | | | | | | | | | | | | | | | | | | | | | | | | | | | | | | | |
| Land | | | 1,737 | | | | - | | | | - | | | | - | | | | 13,538 | | | | 15,275 | | | | - | | | | - | | | | - | | | | 5,109 | | | | 20,384 | |
| Buildings and other constructions | | | 145,909 | | | | - | | | | (2,710 | ) | | | 405 | | | | 39,304 | | | | 182,908 | | | | - | | | | (1,099 | ) | | | 7,571 | | | | 2,012,742 | | | | 2,202,122 | |
| Machinery and equipment | | | 1,870,419 | | | | - | | | | (25,974 | ) | | | (7,525 | ) | | | 171,429 | | | | 2,008,349 | | | | - | | | | (19,537 | ) | | | (7,571 | ) | | | 2,222,190 | | | | 4,203,431 | |
| Transportation units | | | 14,981 | | | | - | | | | (389 | ) | | | 35 | | | | 2,575 | | | | 17,202 | | | | - | | | | (284 | ) | | | - | | | | 2,709 | | | | 19,627 | |
| Furniture and fixtures | | | 786 | | | | - | | | | - | | | | 4 | | | | - | | | | 790 | | | | - | | | | (3 | ) | | | - | | | | 163 | | | | 950 | |
| Other equipment | | | 22,219 | | | | - | | | | (228 | ) | | | - | | | | 270 | | | | 22,261 | | | | - | | | | (984 | ) | | | - | | | | 3,451 | | | | 24,728 | |
| Work in progress and transit units (b) | | | 1,434,552 | | | | 1,771,715 | | | | - | | | | - | | | | (227,116 | ) | | | 2,979,151 | | | | 1,629,271 | | | | - | | | | - | | | | (4,246,364 | ) | | | 362,058 | |
| Asset remediation and mine closure, note 13(b) | | | 43,454 | | | | 93 | | | | - | | | | 68,840 | | | | - | | | | 112,387 | | | | 3,534 | | | | - | | | | 33,803 | | | | - | | | | 149,724 | |
| Stripping activity asset | | | 102,557 | | | | 49,122 | | | | - | | | | - | | | | - | | | | 151,679 | | | | 111,819 | | | | - | | | | - | | | | - | | | | 263,498 | |
| | | | 3,636,614 | | | | 1,820,930 | | | | (29,301 | ) | | | 61,759 | | | | - | | | | 5,490,002 | | | | 1,744,624 | | | | (21,907 | ) | | | 33,803 | | | | - | | | | 7,246,522 | |
| | | | | | | | | | | | | | | | | | | | | | | | | | | | | | | | | | | | | | | | | | | | | |
| Accumulated depreciation | | | | | | | | | | | | | | | | | | | | | | | | | | | | | | | | | | | | | | | | | | | | |
| Buildings and other constructions | | | 34,767 | | | | 4,912 | | | | (1,583 | ) | | | - | | | | 220 | | | | 38,316 | | | | 20,510 | | | | (1,059 | ) | | | 3,136 | | | | - | | | | 60,903 | |
| Machinery and equipment | | | 747,161 | | | | 111,823 | | | | (22,030 | ) | | | - | | | | (229 | ) | | | 836,725 | | | | 151,460 | | | | (18,524 | ) | | | (3,136 | ) | | | - | | | | 966,525 | |
| Transportation units | | | 6,903 | | | | 1,719 | | | | (383 | ) | | | - | | | | 9 | | | | 8,248 | | | | 1,741 | | | | (266 | ) | | | - | | | | - | | | | 9,723 | |
| Furniture and fixtures | | | 771 | | | | 5 | | | | - | | | | - | | | | - | | | | 776 | | | | 5 | | | | (4 | ) | | | - | | | | - | | | | 777 | |
| Other equipment | | | 10,675 | | | | 1,065 | | | | (228 | ) | | | - | | | | - | | | | 11,512 | | | | 2,054 | | | | (984 | ) | | | - | | | | - | | | | 12,582 | |
| Asset remediation and mine closure | | | 4,558 | | | | 560 | | | | - | | | | - | | | | - | | | | 5,118 | | | | 2,053 | | | | - | | | | - | | | | - | | | | 7,171 | |
| Stripping activity asset | | | - | | | | 44,901 | | | | - | | | | - | | | | - | | | | 44,901 | | | | 66,651 | | | | - | | | | - | | | | - | | | | 111,552 | |
| | | | 804,835 | | | | 164,985 | | | | (24,224 | ) | | | - | | | | - | | | | 945,596 | | | | 244,474 | | | | (20,837 | ) | | | - | | | | - | | | | 1,169,233 | |
| | | | | | | | | | | | | | | | | | | | | | | | | | | | | | | | | | | | | | | | | | | | | |
| Net Cost | | | 2,831,779 | | | | | | | | | | | | | | | | | | | | 4,544,406 | | | | | | | | | | | | | | | | | | | | 6,077,289 | |
| (b) | As of December 31, 2012, the work in progress and transit units corresponded mainlyBorrowing cost related to the Expansion of Cerro Verde´s production unitforqualifying assets, which have been capitalized in “Work in progress” during the period 2015 amounted to US$439,608,000. See note 1(b)33,719,000 (US$16,305,000 during the year 2014). |
| (c) F-177 | The Company maintains insurance on its principal assets in accordance with Management’s policies. |
Notes to the Financial Statementsfinancial statements (continued)
| 8.10. | Trade accounts payable |
Trade accounts payable are mainly originated by the acquisition of materials, supplies and spare parts for the Company’s mining activities. As of December 31, 2012, payable balances are related to the Mine Expansion Project, see note 1(b). These obligations are mainly in US dollars, have current maturities and do not accrue interest. No guarantees have been granted. As of December 31, 2015, trade accounts payable includes US$279,378,000 related to capital projects mainly associated with Cerro Verde’s production unit expansion (US$318,957,000 as of December 31, 2014).
| 9.11. | Workers’ profit sharingEmployees benefits liability |
| (a) | The Legislative Decree N° 892 (L.D. 892), issued in 1996, regulates the right of workers to participate in the company’s profits that performs activities generating third categories income and requires companies domiciled in Peru to compute and pay to employees a share of the profits generated by the companies for which they work. The Company’s liability for worker’ profit sharing is recognized according to the policy described in note 2.3(k). |
| (b) | As described in note 2.3(k), workers’ profit sharing is recognized as an operating expense in the statements of comprehensive income. The amount of workers’ profit sharing paid to employees for the years 2012 and 2011 are recognized as a cost of sales of goods (see note 14). Additionally, the excess between the Company’s total workers’ profit sharing liability and the amount paid or due to employees for the years 2011 and 2010 amounted to US$21,923,000 and US$34,427,000, respectively (in 2012, no excess of worker´s profit sharing was calculated). The amounts for 2011 and 2010 were included as operating expenses in the statements of comprehensive income and were paid to the Regional Government and FONDOEMPLEO within the periods established by law. |
Notes to the Financial Statements(continued)
| (a) | The Company recognizes the effect of temporary differences between the accounting base for financial reporting purposes and the tax base. The composition of thisThis item is made up as follows: |
| | | January 1, 2011 | | | Debit (credit) to
the statements of
comprehensive
income | | | December 31,
2011 | | | Debit (credit) to
the statements of
comprehensive
income | | | December 31,
2012 | |
| | | US$(000) | | | US$(000) | | | US$(000) | | | US$(000) | | | US$(000) | |
| Income tax | | | | | | | | | | | | | | | | | | | | |
| Asset | | | | | | | | | | | | | | | | | | | | |
| Provision for water plant construction | | | 24,137 | | | | 3,342 | | | | 27,479 | | | | (27,479 | ) | | | - | |
| Price adjustment of cathodes and copper concentrates | | | - | | | | 22,577 | | | | 22,577 | | | | (22,577 | ) | | | - | |
| Difference in valuation of inventories | | | 1,869 | | | | 1,086 | | | | 2,955 | | | | (1,339 | ) | | | 1,616 | |
| Provision for remediation and mine closure | | | 710 | | | | 163 | | | | 873 | | | | 238 | | | | 1,111 | |
| Deferred stripping costs | | | 731 | | | | (76 | ) | | | 655 | | | | (34 | ) | | | 621 | |
| Provision generated by the special mining burden | | | - | | | | - | | | | - | | | | 6,356 | | | | 6,356 | |
| Other provisions | | | 1,174 | | | | (5,355 | ) | | | (4,181 | ) | | | 4,267 | | | | 86 | |
| | | | | | | | | | | | | | | | | | | | | |
| | | | 28,621 | | | | 21,737 | | | | 50,358 | | | | (40,568 | ) | | | 9,790 | |
| | | | | | | | | | | | | | | | | | | | | |
| Liability | | | | | | | | | | | | | | | | | | | | |
| Difference in depreciation method | | | 189,180 | | | | 39,677 | | | | 228,857 | | | | 17,681 | | | | 246,538 | |
| Price adjustment of cathodes and copper concentrates | | | 39,965 | | | | (39,965 | ) | | | - | | | | 3,471 | | | | 3,471 | |
| | | | | | | | | | | | | | | | | | | | | |
| | | | 229,145 | | | | (288 | ) | | | 228,857 | | | | 21,152 | | | | 250,009 | |
| | | | | | | | | | | | | | | | | | | | | |
| Deferred liabilities, net | | | 200,524 | | | | (22,025 | ) | | | 178,499 | | | | 61,720 | | | | 240,219 | |
| | | | | | | | | | | | | | | | | | | | | |
| Mining taxes, note 12(d) | | | | | | | | | | | | | | | | | | | | |
| Deferred asset | | | | | | | | | | | | | | | | | | | | |
| Price adjustment of cathodes and copper concentrates | | | - | | | | (3,637 | ) | | | (3,637 | ) | | | 4,153 | | | | 516 | |
| Exploration expenses | | | - | | | | (190 | ) | | | (190 | ) | | | (302 | ) | | | (492 | ) |
| | | | | | | | | | | | | | | | | | | | | |
| Deferred asset | | | - | | | | (3,827 | ) | | | (3,827 | ) | | | 3,851 | | | | 24 | |
| | | 2015 | | | 2014 | |
| | | US$(000) | | | US$(000) | |
| | | | | | | |
| Wages payable | | | 20,454 | | | | 11,138 | |
| Profit sharing payable | | | 82 | | | | 33,274 | |
| | | | 20,536 | | | | 44,412 | |
Notes
The Legislative Decree No. 892 (L.D. 892), issued in 1996, regulates the right of workers to participate in a company’s profits that performs activities generating third categories income and requires companies domiciled in Peru to compute and pay to employees a share of the profits generated by the companies for which they work. The Company’s liability for workers’ profit sharing is recognized according to the financial statements(continued)policy described in note 2.2(m).
| | | January 1, 2011 | | | Debit (credit) to
the statements of
comprehensive
income | | | December 31,
2011 | | | Debit (credit) to
the statements of
comprehensive
income | | | December 31,
2012 | |
| | | US$(000) | | | US$(000) | | | US$(000) | | | US$(000) | | | US$(000) | |
| | | | | | | | | | | | | | | | |
| Total debited (credited) to the statements of comprehensive income | | | - | | | | (25,852 | ) | | | - | | | | 65,571 | (b) | | | - | |
| | | | | | | | | | | | | | | | | | | | | |
| Total deferred income tax liability | | | 200,524 | | | | | | | | 174,672 | | | | | | | | 240,243 | |
NotesThe workers’ profit sharing is recognized as an operating expense in the statements of comprehensive income. The amount of workers’ profit sharing paid to the financial statements(continued)
| (b) | For the years ended December 31, 2012, 2011 and 2010, the income tax expense recorded differs from the result of apply the legal rate to the income before income tax of the Company, as detailed below: |
| | | 2012 | | | 2011 | | | 2010 | |
| | | US$(000) | | | US$(000) | | | US$(000) | |
| | | | | | | | | | |
| Profit before income tax | | | 1,215,358 | | | | 1,562,117 | | | | 1,557,663 | |
| Income tax rate | | | 30 | % | | | 30 | % | | | 30 | % |
| | | | | | | | | | | | | |
| Income tax expected expense | | | 364,607 | | | | 468,635 | | | | 467,299 | |
| | | | | | | | | | | | | |
| Effect of change in income tax rate to 32% due to Tax Stability Agreement effective since 2014, note 12(a) | | | 11,583 | | | | - | | | | - | |
| Non deductible expenses | | | 11,845 | | | | 5,298 | | | | 3,647 | |
| Special mining burden (current and deferred) | | | (28,823 | ) | | | - | | | | - | |
| Voluntary contribution | | | - | | | | - | | | | 12,324 | |
| Others | | | (2,242 | ) | | | - | | | | - | |
| | | | | | | | | | | | | |
| Current and deferred income tax charges to results | | | 356,970 | | | | 473,933 | | | | 483,270 | |
| Mining taxes charge to results | | | 86,318 | | | | 9,785 | | | | - | |
| | | | | | | | | | | | | |
| | | | 443,288 | | | | 483,718 | | | | 483,270 | |
| | | | | | | | | | | | | |
| Effective income tax | | | 36.47 | % | | | 30.97 | % | | | 31.03 | % |
| (c) | The income tax expenses (benefit) for the years ended December 31, 2012 and 2011 is shown below: |
| | | 2012 | | | 2011 | | | 2010 | |
| | | US$(000) | | | US$(000) | | | US$(000) | |
| Income tax | | | | | | | | | |
| Current | | | 295,250 | | | | 495,958 | | | | 417,594 | |
| Deferred | | | 61,720 | | | | (22,025 | ) | | | 65,676 | |
| | | | | | | | | | | | | |
| | | | 356,970 | | | | 473,933 | | | | 483,270 | |
| Mining taxes | | | | | | | | | | | | |
| Current | | | 82,467 | | | | 13,612 | | | | - | |
| Deferred | | | 3,851 | | | | (3,827 | ) | | | - | |
| | | | | | | | | | | | | |
| | | | 86,318 | | | | 9,785 | | | | - | |
| | | | | | | | | | | | | |
| Income tax expense reported in the statements of comprehensive income | | | 443,288 | | | | 483,718 | | | | 483,270 | |
Notes to the financial statements(continued)
As of December 31, 2012, 2011 and 2010, the authorized, subscribed and paid-up capital in accordance with the Company’s by-laws and its related modifications was 350,056,012 common shares.
According to the shareholders agreement of July 11, 2003, the nominal value of the shares was denominated in US dollars and amount to US$0.54 each. As a consequence of the capitalization of restricted earnings associated with tax benefit (reinvestment credit), in December 2009, the nominal value of the share was increased to US$2.83 each.
As of December 31, 2012 the quoted price of these shares was US$38.00 per share (US$36.00 and US$54.10 per share as of December 31, 2011 and 2010, respectively) and their frequency of trading is daily, as in 2011 and 2010.
As of December 31, 2012, the Company’s capital stock structure is as follows:
| Percentage of individual interest in capital | | Number of
shareholders | | | Total percentage
interest | |
| | | | | | | |
| Up to 1.00 | | | 3,121 | | | | 5.86 | |
| From 1.01 to 20.00 | | | 1 | | | | 19.58 | |
| From 20.01 to 30.00 | | | 1 | | | | 21.00 | |
| From 30.01 to 60.00 | | | 1 | | | | 53.56 | |
| | | | | | | | | |
| | | | 3,124 | | | | 100.00 | |
| (b) | Other capital reserves - |
In accordance with the Peruvian Companies Act, this reserve is created through the transfer of 10% of the earningsemployees for the year up toyears 2015, 2014 and 2013 are recognized as a maximumcost of 20%sales of the paid-in capital. The legal reserve must be used to compensate losses, and must be replaced with future earnings. This reserve may also be used to increase capital stock but the balance must be restored from future earnings.
In accordance with the mining stability agreement entered into with the Peruvian Governmentgoods (see note 12(a)),18). Additionally, during 2015, 2014 and 2013 no excess of workers´ profit sharing was calculated between the Company is authorizedtotal workers’ profit sharing liability and the amount paid or due to distribute, without any restrictions, all capital invested (except for the retained earnings capitalized in 2009 for US$800,030,000). In addition, dividends and any other form of capital distribution to domestic entities are tax exempt. Since 2003, dividends paid to shareholders, other than domiciled legal entities, are subject to a 4.1% income tax which is withheld and paid by the Company.
Notes to the financial statements(continued)
| (d) | Dividend distribution - |
During 2012 and 2011, the Company did not pay dividends.
At the Directors’ meeting held on June 15, 2010, it was agreed to pay a dividend of US$400,000,000 (US$1.1427 per common share). Of this amount, US$257,303 corresponds to the retained earnings as of December 31, 2009, and US$142,697,000 was applied to earnings for the year 2010. This dividend was paid to shareholders on July 19, 2010.
At the Directors’ meeting held on November 8, 2010, it was agreed to approve the payment of dividends amounting to US$550,000,000 (US$1.5712 per common share). The total amount of this dividend was applied to retained earnings as of October 31, 2010, and earnings for the year 2010 related to the dividend related to the 2010 period. This dividend was paid to the shareholders on December 10, 2010.employees.
| 12. | Tax situationOther financial liabilities |
| (a) | On February 13, 1998, the Company signed an Agreement of Guarantees and Measures to Promote Investments with the Government of Peru, under the Peruvian General Mining Law. Upon approval of the agreement, the CompanyThis item is subject to the tax regulations in force at May 6, 1996. In addition, the Company has tax stability for a period of fifteen years beginning January 1, 1999 and with a maturity date of December 31, 2013.made up as follows: |
On July 17, 2012, the Company subscribed a new Agreement of Guarantees and Measures to Promote Investments with the Government of Peru, under the General Mining Law and in connection with the Expansion of Cerro Verde´s production mining unit Project, see note 1(b). According to the management´s option, it will be in force in 2014. According to this agreement, from the time it is in force, the new income tax rate will be 32%.
| | | 2015 | | | 2014 | |
| | | US$(000) | | | US$(000) | |
| | | | | | | |
| Financial obligations with financial institutions: | | | | | | | | |
| Senior unsecured credit facility, (b) | | | 1,780,928 | | | | 402,357 | |
| Promissory notes (c) | | | 43,000 | | | | 50,000 | |
| Leasings | | | 329 | | | | 492 | |
| | | | 1,824,257 | | | | 452,849 | |
| Financial obligations with shareholders (d) | | | 600,907 | | | | - | |
| | | | 2,425,164 | | | | 452,849 | |
| Less – current portion | | | (43,169 | ) | | | (50,163 | ) |
| Non - current portion | | | 2,381,995 | | | | 402,686 | |
| (b) | The income tax rate applicable toIn March 2014, the Company is 30% and 32% beginning in 2014 according to the paragraph above. In addition, the Company is subject toentered into a minimum income tax equivalent to 2% of total assets until 2013, net of accumulated depreciation and amortization. The tax charged against earnings is the higher of the income tax under the tax stability agreements and the minimum income tax. For the years ended December 31, 2012, 2011 and 2010, the taxable income according to the tax law is calculated on the profit before income tax and profit sharing for such years, and the income tax calculations arefive-year US$1.8 billion senior unsecured credit facility with several banks, led by Citibank N.A., as follow: |
Notes to the financial statements(continued)
| | | 2012 | | | 2011 | | | 2010 | |
| | | US$(000) | | | US$(000) | | | US$(000) | |
| | | | | | | | | | |
| Profit before income tax | | | 1,215,358 | | | | 1,562,117 | | | | 1,557,663 | |
| Worker´s profit sharing | | | 81,708 | | | | 143,271 | | | | 109,023 | |
| | | | | | | | | | | | | |
| | | | 1,297,066 | | | | 1,705,388 | | | | 1,666,686 | |
| | | | | | | | | | | | | |
| Less: | | | | | | | | | | | | |
| Reversal of price adjustment of copper cathodes and concentrates | | | (75,257 | ) | | | 133,217 | | | | 64,760 | |
| Water treatment plant and voluntary contribution | | | (91,686 | ) | | | 13,723 | | | | 45,379 | |
| Price adjustment of copper cathodes and concentrates | | | (11,569 | ) | | | 75,257 | | | | (133,217 | ) |
| Non deductible expenses | | | 39,484 | | | | 5,502 | | | | 4,354 | |
| Special mining burden | | | (74,891 | ) | | | - | | | | - | |
| Adjustment of inventory in process and finished goods | | | (15,752 | ) | | | 3,708 | | | | 11,030 | |
| Deduction to recalculate depreciation at an annual rate of 20% | | | (5,564 | ) | | | (147,902 | ) | | | (149,722 | ) |
| Other additions, net | | | (1,478 | ) | | | 2,999 | | | | 2,867 | |
| | | | | | | | | | | | | |
| | | | (236,713 | ) | | | 86,504 | | | | (154,549 | ) |
| | | | | | | | | | | | | |
| Sub-total | | | 1,060,353 | | | | 1,791,892 | | | | 1,512,137 | |
| Workers’ profit sharing (8%) | | | (84,828 | ) | | | (143,351 | ) | | | (120,971 | ) |
| | | | | | | | | | | | | |
| Net profit | | | 975,525 | | | | 1,648,541 | | | | 1,391,166 | |
| | | | | | | | | | | | | |
| Income tax (30%) | | | (292,657 | ) | | | (494,562 | ) | | | (417,350 | ) |
| | | | | | | | | | | | | |
| Prior years income taxes | | | (2,593 | ) | | | (1,396 | ) | | | (244 | ) |
| | | | | | | | | | | | | |
| Total current income taxes charged to results, note 10(c) (does not include Special Mining Burden) | | | 295,250 | | | | 495,958 | | | | 417,594 | |
| (c) | Peruvian Tax Authorities (SUNAT) have the right to examine, and, if necessary, amend the income tax as determined by the Company during the last four years, calculated from the year following that in which the tax returns are filed. The income tax filings for the years 2002 through 2011 and the value added tax filings for the period from January 2009 to December 2011 are open to examination by The Tax Authorities. The fiscal years 2002 through 2007, has been reviewed by SUNAT, by which the Company has been in appeal process. The years 2008, 2009 and 2010 are currently in revision process, these processes are in charged to the legal external advisors of the Company. In Management’s and legal advisors’ opinion, they have enough arguments in accordance to legal standards in force; consequently, they believe they will get results in favor to the Company for those processes and any additional tax assessment would not be significant to the financial statements. |
Notes to the financial statements(continued)
For the periods pending to examine, and due to the many possible interpretations of current legislation, it is not possible to determine whether or not future reviews will result in tax liabilities for the Company. In the event that additional taxes are payable, including interest and surcharges, as a result of the Tax Authority reviews, they will be charged to expense in the period assessed. However, in Management’s and legal advisors’ opinion, any additional tax assessment would not be significant to the financial statements.
As described in note 2.3(j), Law 29788 was enacted creating a new mining tax and royalty regime in Peru. Because the Company operates under a stability agreement, it is not subject to the revised royalty and special mining tax until its stability agreement expires on December 13, 2013. However, the Company elected to pay the special mining tax during the remaining term of its stability agreement. For the years ended December 31, 2012 and 2011, the Company recorded a tax provision of US$82,467,000 and US$13,612,000, respectively,related to the special mining burden. Likewise,the Company has also recognized an expense and income deferred tax amounting to US$3,851,000 and US$3,827,000 during the years 2012 and 2011, respectively.
| (e) | On June 23, 2004, Law No.28258 - Mining Royalty Law was approved, and requires the holder of a mineral concession to pay a royalty in return for the exploitation of metallic and non metallic minerals, which is calculated using rates from one to three percent of the value of concentrate or its equivalent according to the international price of the commodity published by the Ministry of Energy and Mines.administrative agent. |
Based on the stability contract described in the literal (a) above, the payment of the mining royalties is not applicable to the Company, because this Law was approved after the Company signed the stability contract with the Peruvian Government.
SUNAT has assessed mining royalties on materials processed by the Company´s concentrator plant which commenced operations in late 2006. These assessments cover the period October 2006 to December 2007 and the years 2008 and 2009. SUNAT has issued resolutions denying the Company’s claims. The Company has appealed these decisions and currently has three cases pending before the Peruvian Tax Tribunal. The Company is challenging these royalties because it believes its stability agreement provides an exemption for all minerals extracted from its mining concession, irrespective of the method used for processing those minerals. Although we believe our interpretation of the stability agreement is correct, if the Company is ultimately found responsible for these assessments, the amount of royalty and related interest payable would be significant. SUNAT may continue to assess mining royalties annually until this matter is resolved by the Peruvian Tax Tribunal.
Notes to the financial statements(continued)
| (a) | For the years ended December 31, 2012, 2011 and 2010, sales of goods are made up of the following: |
| | | 2012 | | | 2011 | | | 2010 | |
| | | Pounds(000) | | | US$(000) | | | Pounds(000) | | | US$(000) | | | Pounds(000) | | | US$(000) | |
| | | (Unaudited) | | | | | | (Unaudited) | | | | | | (Unaudited) | | | | |
| | | | | | | | | | | | | | | | | | | |
| Copper concentrates (b) | | | 469,644 | | | | 1,544,647 | | | | 489,314 | | | | 1,637,841 | | | | 472,497 | | | | 1,607,815 | |
| Copper cathodes (b) | | | 119,077 | | | | 434,290 | | | | 167,562 | | | | 673,956 | | | | 181,885 | | | | 625,827 | |
| Other (primarily silver and molybdenum concentrates) | | | - | | | | 148,086 | | | | - | | | | 208,253 | | | | | | | | 135,346 | |
| | | | | | | | | | | | | | | | | | | | | | | | | |
| | | | | | | | 2,127,023 | | | | | | | | 2,520,050 | | | | | | | | 2,368,988 | |
Sales to related parties amounted to US$1,631,221,000 for the year ended December 31, 2012 (US$1,876,906,000 and US$1,868,233,000 for the years ended December 31, 2011 and 2010, respectively), which are summarized in note 17(b).
| (b) | As described in note 2.3(b), the Company’s copper sales are provisionally priced at shipment date. As a result, as of December 31, 2012, 2011 and 2010, the Company had embedded derivatives recorded in its statement of financial position (see note 19). Adjustments to the provisional prices are recognized as gains and losses in sales of goods until the month of settlement. Copper concentrate and cathode sales include adjustments to the provisional sale value generated by the changes in the fair value of the embedded derivatives. These adjustments resulted in higher, lower and higher sales for US$86,826,000, US$208,474,000 and US$68,457,000 in years 2012, 2011 and 2010, respectively. |
| (c) | The following table shows sales of goods by geographic region based for the years ended December 31, 2012, 2011 and 2010: |
| | | 2012 | | | 2011 | | | 2010 | |
| | | US$(000) | | | US$(000) | | | US$(000) | |
| | | | | | | | | | |
| Asia | | | 1,267,407 | | | | 1,351,762 | | | | 1,374,467 | |
| South America (mainly Peru) | | | 389,613 | | | | 445,114 | | | | 291,993 | |
| Europe | | | 378,144 | | | | 513,933 | | | | 483,208 | |
Notes to the financial statements(continued)
| | | 2012 | | | 2011 | | | 2010 | |
| | | US$(000) | | | US$(000) | | | US$(000) | |
| North America | | | 91,859 | | | | 209,241 | | | | 219,320 | |
| | | | | | | | | | | | | |
| | | | 2,127,023 | | | | 2,520,050 | | | | 2,368,988 | |
| (d) | Concentration of sales - |
For the year 2012, 77% of the Company’s sales were to related entities (Freeport-McMoRan Corporation (“FMC”), Sumitomo Metal Mining Company and Climax Molybdenum, which is a wholly owned subsidiary of FMC) and the rest, with international third parties. For the years 2011 and 2010, 74% and 79% of the Company’s sales were to these related entities.
Notes to the financial statements(continued)
The credit facility allows for term loan borrowings up to the full amount of the facility, less any amounts issued and outstanding under a $500 million sublimit. Interest on amounts drawn under the term loan is based on London Interbank Offered Rate (LIBOR) plus a spread (currently 2.4 %) based on the Company´s total net debt to earnings before interest, taxes, depreciation and amortization (EBITDA) ratio as defined in the agreement. The disbursements were mainly used to finance a portion of the Company´s expansion project.
The credit facility amortizes in three installments in amounts necessary to comply the commitment of the requested amounts under the loan. The first installment should paid at least 15% (85% of the outstanding balance) as of September 30, 2017, the second installment at least 30% (70% of the outstanding balance) as of March 31, 2018, and the third installment not less than 65% (35% of the outstanding balance) as of September 30, 2018, with the remaining balance due on the maturity date of March 10, 2019.
As of December 31, 2015, the Company has used the total credit line (US$1.8 billion). No letters of credit were issued.
There are no guarantees provided for the credit facility.
| 14. | Cost of sales of goodsCovenants - |
For the years ended December 31, 2012, 2011 and 2010, the cost of sales of goods is made up of the following:
| | | 2012 | | | 2011 | | | 2010 | |
| | | US$(000) | | | US$(000) | | | US$(000) | |
| | | | | | | | | | |
| Opening balance of finished goods (see note 6(a)) | | | 14,908 | | | | 16,505 | | | | 5,856 | |
| | | | | | | | | | | | | |
| Materials and supplies | | | 362,382 | | | | 315,518 | | | | 276,297 | |
| Labor | | | 110,156 | | | | 134,813 | | | | 79,914 | |
| Worker’s profit sharing | | | 81,737 | | | | 121,347 | | | | 86,568 | |
| Depreciation and amortization | | | 95,872 | | | | 84,061 | | | | 87,686 | |
| Energy | | | 73,136 | | | | 69,259 | | | | 53,001 | |
| Third parties services | | | 88,489 | | | | 74,202 | | | | 69,350 | |
| Management fees (see note 17(a)) | | | 18,210 | | | | 20,003 | | | | 17,850 | |
| Other costs | | | 26,456 | | | | 23,021 | | | | 14,182 | |
| Variation of inventories in process | | | (48,099 | ) | | | (19,121 | ) | | | (28,240 | ) |
| Ending balance of finished goods (see note 6(a)) | | | (21,676 | ) | | | (14,908 | ) | | | (16,505 | ) |
| | | | | | | | | | | | | |
| | | | 801,571 | | | | 824,700 | | | | 645,959 | |
For the years ended December 31, 2012, 2011 and 2010, selling expenses are made up of the following:
| | | 2012 | | | 2011 | | | 2010 | |
| | | US$(000) | | | US$(000) | | | US$(000) | |
| | | | | | | | | | |
| Concentrate’s freight | | | 74,816 | | | | 79,097 | | | | 69,631 | |
| Commissions | | | 2,759 | | | | 3,035 | | | | 3,996 | |
| Cathode’s freight | | | 1,099 | | | | 1,480 | | | | 3,011 | |
| | | | | | | | | | | | | |
| | | | 78,674 | | | | 83,612 | | | | 76,638 | |
| 16. | Commitments and contingenciesAs part of the commitments made in relation to the above debt, the Company must comply with the following financial ratios listed below: |
| (a)i. | Environmental matters -Total Net Debt to EBITDA Ratio: The Company shall not permit the Total Net Debt to EBITDA Ratio on the last day of any fiscal quarter to exceed 4.75 to 1 (3.5 to 1 in 2014). |
| ii. | Interest Coverage Ratio: The Company shall not permit the Interest Coverage Ratio on the last day of any fiscal quarter to be less than 3.0 to 1. |
The Company’s mining and exploration activities are subjectfinancial ratios mentioned above apply to environmental protection standards. In order to comply with these standards,financial statements of the Company, has obtainedwhich should be calculated as of each quarter ending in March, June, September and December of each year since 2014.
As of December 31, 2015, the approval for the Environment Adequacy Program (“PAMA”) andCompany was in compliance with all of the Environmental Impact Studies (EIA), required for the operation of Cerro Verde’s production unit.its covenants, which are monitored by Management each quarter.
| (c) | As of December 31, 2015 corresponds to bank promissory notes with Banco Interbank to finance its working capital needs, with an interest rate of 1.29%. The maturity date of these notes has been renewed through February 2016. |
Notes to the financial statements(continued)
| (d) | In December 2014, the Company entered into shareholder loan agreements with, or affiliates of, Freeport Minerals Corporation, Compañía de Minas Buenaventura S.A.A. and SMM Cerro Verde Netherlands B.V., that are currently subordinated to the senior unsecured credit facility (described in note 12(b)). These agreements allow for borrowings up to an amount of US$800 million in aggregate. As of December 31, 2015, the Company had borrowed US$600.9 million under these loan agreements, including US$0.9 million of interest. The interest rate is currently calculated based on the LIBOR rate plus the average rate of the senior unsecured credit facility, plus 0.5% (currently 3.13%). In the event these loans are no longer subordinated to the senior unsecured credit facility, the rate would be LIBOR plus the current spread on the credit facility. The loans mature on December 22, 2019, unless at that time there is senior financing associated with the expansion project that is senior to the loans, in which case the loans mature two years following the maturity of the senior financing. |
On October 14, 2003, Law N°28090 was enacted, which regulates the commitments and procedures that entities involved in mining activities must follow in order to prepare, file and implement a mine site closing plan, as well as the respective environmental
There are no guarantees that assure compliance with the plan in accordance with protection, conservation and restoration of the environment. On August 15, 2005, the regulations regarding this law were approved. During 2006, in compliance with the mentioned law, the Company completed the closing plansprovided for its mine site. On October 5, 2009 the MEM issued Resolution N°203-2009 MEM – AAA, approving the mine closure plan of the Company.these loans.
On September 2012, the company presented to the Ministry of Energy and Mines an updated mine closure plan. Based on this new closure plan, the Company recalculated its mine closure provision (adjustment of US$ 72,512,000 to the asset and liability of the mine closure provision as of this date). See Note 7.
| (a) | This item is made up as follows: |
The estimate of remediation and mine closing costs is based on studies prepared by independent consultants, who comply with the current environmental regulations. This provision corresponds mainly to the activities to be performed in order to restore the areas affected by mining activities. The main tasks to be performed include ground removal, revegetation labor and dismantling of plant and equipment.
| | | 2015 | | | 2014 | |
| | | US$(000) | | | US$(000) | |
| | | | | | | |
| Provision for remediation and mine closure (b) | | | 161,270 | | | | 119,948 | |
| Provision for unbilled freight and services | | | 12,520 | | | | 2,964 | |
| Other | | | 4,675 | | | | 5,317 | |
| | | | 178,465 | | | | 128,229 | |
| Less – current portion | | | (14,662 | ) | | | (2,964 | ) |
| | | | | | | | | |
| Non - current portion | | | 163,803 | | | | 125,265 | |
| (b) | Provision for remediation and mine closure - |
The table below presents the changes in the provision for remediation and mine closure:
| | | 2015 | | | 2014 | |
| | | US$(000) | | | US$(000) | |
| | | | | | | |
| Beginning balance | | | 119,948 | | | | 48,479 | |
| Accretion expense | | | 3,985 | | | | 2,537 | |
| Changes in estimates | | | 33,803 | | | | 68,840 | |
| Other adjustments | | | 3,534 | | | | 92 | |
| | | | | | | | | |
| Final balance | | | 161,270 | | | | 119,948 | |
| | | | | | | | | |
| Classification by maturity | | | | | | | | |
| Current portion | | | 2,142 | | | | - | |
| Non - current portion | | | 159,128 | | | | 119,948 | |
| | | | | | | | | |
| | | | 161,270 | | | | 119,948 | |
| | | US$(000) | |
| | | |
Balance as of January 1, 2010 | | | 3,667 | |
Accretion expense | | | 180 | |
Other adjustments | | | (360 | ) |
| | | | |
Balance as of December 31, 2010 | | | 3,487 | |
Accretion expense | | | 357 | |
Other adjustments | | | 3,217 | |
| | | | |
Balance as of December 31, 2011 | | | 7,061 | |
Accretion expense | | | 239 | |
Changes in the estimates | | | 72,512 | |
| | | | |
Balance as of December 31, 2012 | | | 79,812F-180 | |
Notes to the financial statements (continued)
According to the Company’s accounting policies, the provision for remediation and mine closure represents the present value of the costs that are expected to be incurred in the closure period of the operating activities of the Company. Closure budgets are reviewed regularly to take into account any significant change in the studies conducted. Nevertheless, the closure costs of mining units will depend on the market prices for the closure works required, which would reflect future economic conditions. Also, the time when the disbursements will be made depends on the useful life of the mine, which will be based on future metals prices.
Notes to the financial statements(continued)
As of December 31, 2012,2015, the future value of the provision for remediation and mine closure of mining units and environmental liabilities was US$145,881,000,368,753,000, which was discounted using the annual risk-free rate of 4.65%2.81%, resulting in an updated liability of US$79,812,000161,270,000 (as of December 31, 2011,2014, the future value of the provision for remediation and mine closure of mining units and environmental liabilities was US$100,481,000 and257,451,000, which was discounted using anthe annual risk-free rate of 6.19%2.59%, which resultedresulting in an updated liability forof US$7,061,000)119,948,000). The increase presented in the mine closure plan in 2012 was due to the update of costs related to the future closure of PAD 4B and additional deposits for clearing. Additionally, as a result of the Expansion Project, the useful life of the mine and exploration time has been significantly reduced. The Company considers that this liability is sufficient to meet the current environmental protection laws approved by the MEM.
TheAs of December 31, 2015 and 2014, the Company has issued letters of credit to Ministry of Energy and Mines amounting to US$12,838,00021,539,000 and US$14,851,000, respectively, to secure mine closure plans for its mining unit.
Notes to the financial statements (continued)
| (a) | The Company recognizes the effect of temporary differences between the accounting base for financial reporting purposes and the tax base. The composition of this item is made up as follows: |
| | | January 1,
2014 | | | Debit (credit) to the
statements of
comprehensive income | | | December 31,
2014 | | | Debit (credit) to the
statements of
comprehensive income | | | December 31,
2015 | |
| | | US$(000) | | | US$(000) | | | US$(000) | | | US$(000) | | | US$(000) | |
| | | | | | | | | | | | | | | | |
| Income tax | | | | | | | | | | | | | | | | | | | | |
| Asset | | | | | | | | | | | | | | | | | | | | |
| Price adjustment of cathodes and copper concentrates | | | - | | | | 12,831 | | | | 12,831 | | | | (4,982 | ) | | | 7,849 | |
| Provision for remediation and mine closure | | | 3,014 | | | | 813 | | | | 3,827 | | | | 1,811 | | | | 5,638 | |
| Provision for mining taxes | | | 6,322 | | | | (3,562 | ) | | | 2,760 | | | | (1,255 | ) | | | 1,505 | |
| Unpaid vacations | | | - | | | | 2,625 | | | | 2,625 | | | | (110 | ) | | | 2,515 | |
| Cost of net asset: rollers and construction of tailing dam | | | 14,258 | | | | (12,101 | ) | | | 2,157 | | | | (475 | ) | | | 1,682 | |
| Development costs | | | 530 | | | | (112 | ) | | | 418 | | | | (86 | ) | | | 332 | |
| Difference in valuation of inventories | | | 8,204 | | | | (8,204 | ) | | | - | | | | - | | | | - | |
| Other provisions | | | 1,573 | | | | 1,437 | | | | 3,010 | | | | 1,740 | | | | 4,750 | |
| | | | 33,901 | | | | (6,273 | ) | | | 27,628 | | | | (3,357 | ) | | | 24,271 | |
| | | | | | | | | | | | | | | | | | | | | |
| Liability | | | | | | | | | | | | | | | | | | | | |
| Difference in depreciation method | | | 264,291 | | | | (50,111 | ) | | | 214,180 | | | | 31,490 | | | | 245,670 | |
| Stripping activity asset | | | 21,778 | | | | (4,460 | ) | | | 17,318 | | | | 502 | | | | 17,820 | |
| Difference in valuation of inventories | | | - | | | | 14,331 | | | | 14,331 | | | | (3,334 | ) | | | 10,997 | |
| Price adjustment of cathodes and copper concentrates | | | 5,891 | | | | (5,891 | ) | | | - | | | | - | | | | - | |
| | | | 291,960 | | | | (46,131 | ) | | | 245,829 | | | | 28,658 | | | | 274,487 | |
| | | | | | | | | | | | | | | | | | | | | |
| Deferred liabilities, net | | | 258,059 | | | | (39,858 | ) | | | 218,201 | | | | 32,015 | | | | 250,216 | |
| | | | | | | | | | | | | | | | | | | | | |
| Supplementary Retirement Fund | | | | | | | | | | | | | | | | | | | | |
| Difference in depreciation method | | | - | | | | 2,452 | | | | 2,452 | | | | 410 | | | | 2,862 | |
| Other minors | | | - | | | | 75 | | | | 75 | | | | - | | | | 75 | |
| Deferred liability | | | - | | | | 2,527 | | | | 2,527 | | | | 410 | | | | 2,937 | |
| Total debited to the statements of comprehensive income | | | | | | | (37,331 | ) | | | | | | | 32,425 | | | | | |
| | | | | | | | | | | | | | | | | | | | | |
| Total deferred income tax liability, net | | | 258,059 | | | | | | | | 220,728 | | | | | | | | 253,153 | |
Notes to the financial statements (continued)
| (b) | Water treatment plantFor the years ended December 31, 2015, 2014 and 2013, the income tax expense recorded differs from the result of apply the legal rate to the income before income tax of the Company, as detailed below: |
| | | 2015 | | | 2014 | | | 2013 | |
| | | US$(000) | | | US$(000) | | | US$(000) | |
| | | | | | | | | | |
| Profit before income tax | | | 79,530 | | | | 616,135 | | | | 946,600 | |
| Income tax rate | | | 32 | % | | | 32 | % | | | 30 | % |
| Expected income tax expense | | | 25,450 | | | | 197,163 | | | | 283,980 | |
| Non-deductible expenses | | | 19,534 | | | | 7,013 | | | | 3,478 | |
| Special mining tax and mining royalties | | | (4,672 | ) | | | (16,677 | ) | | | (19,348 | ) |
| Income tax true-ups | | | (6,082 | ) | | | (6,985 | ) | | | - | |
| Effect of change in income tax rate to 32% due to Tax Stability Agreement effective since 2014, note 16(a) | | | - | | | | - | | | | 398 | |
| Others | | | (3,047 | ) | | | 82 | | | | 1,652 | |
| Current and deferred income tax charges to results | | | 31,183 | | | | 180,596 | | | | 270,160 | |
| Mining taxes charged to results | | | 14,599 | | | | 52,116 | | | | 63,178 | |
| Supplementary retirement fund charged to results | | | 464 | | | | 5,817 | | | | - | |
| | | | | | | | | | | | | |
| | | | 46,246 | | | | 238,529 | | | | 333,338 | |
| | | | | | | | | | | | | |
| Effective income tax | | | 58.15 | % | | | 38.71 | % | | | 35.21 | % |
Notes to the financial statements (continued)
| (c) | Income tax expenses (benefit) for the years ended December 31, 2015, 2014 and 2013 is shown below: |
| | | 2015 | | | 2014 | | | 2013 | |
| | | US$(000) | | | US$(000) | | | US$(000) | |
| | | | | | | | | | |
| Income tax | | | | | | | | | | | | |
| Current | | | (832 | ) | | | 220,454 | | | | 263,588 | |
| Deferred | | | 32,015 | | | | (39,858 | ) | | | 6,572 | |
| | | | 31,183 | | | | 180,596 | | | | 270,160 | |
| Mining taxes | | | | | | | | | | | | |
| Current | | | 14,599 | | | | 52,116 | | | | 63,202 | |
| Deferred | | | - | | | | - | | | | (24 | ) |
| | | | 14,599 | | | | 52,116 | | | | 63,178 | |
| | | | | | | | | | | | | |
| Supplementary retirement fund | | | | | | | | | | | | |
| Current | | | 54 | | | | 3,290 | | | | - | |
| Deferred | | | 410 | | | | 2,527 | | | | - | |
| | | | 464 | | | | 5,817 | | | | - | |
| Income tax expense reported in the statements of comprehensive income | | | 46,246 | | | | 238,529 | | | | 333,338 | |
As of December 31, 2015 and 2014 the authorized, subscribed and paid-up capital in accordance with the Company’s by-laws and its related modifications was 350,056,012 common shares.
According to the shareholders agreement of July 11, 2003, the nominal value of the shares was denominated in US dollars and amounted to US$0.54 each. As a result of the capitalization of restricted earnings associated to the tax benefit (reinvestment credit), the nominal value of the share was increased to US$2.83 each in December 2009.
As of December 31, 2015 the quoted price of these shares was US$14.50 per share (US$24.00 per share as of December 31, 2014) and the daily frequency of trading is 100%, as in 2014.
| (b) | Other capital reserves - |
In accordance with the Peruvian Companies Act, this reserve is created through the transfer of 10% of the annual net profit up to a maximum of 20% of the paid-in capital. The legal reserve must be used to offset losses, and must be replaced with future earnings. This reserve may also be used to increase capital stock but the balance must be restored from future earnings.
| (c) | Dividend distribution - |
During 2015, 2014 and 2013, the Company did not pay dividends.
Notes to the financial statements (continued)
On August 2,February 13, 1998, the Company signed an Agreement of Guarantees and Measures to Promote Investments with the Government of Peru, under the Peruvian General Mining Law. Upon approval of the agreement, the Company had tax stability for a period of 15 years from January 1, 1999 to December 31, 2013 and was subject to the tax regulations in force at May 6, 1996.
| | On July 17, 2012, the Company entered into a new Agreement of Guarantees and Measures to Promote Investments with the Government of Peru, under the General Mining Law and in connection with the Expansion of Cerro Verde´s production mining unit Project. By means of this agreement, the Company is subject to the tax regulations in force at July 17, 2012. The term of this agreement is 15 years from January 1, 2014 to December 31, 2028. |
By means of Law No. 30296 enacted on December 31, 2014, the Peruvian government introduced certain amendments to the Income Tax Law, effective January 1, 2015, which will be applied to the Company since the maturity of the stability agreement (January 1, 2029). The most relevant are listed below:
| - | There will be a gradual reduction of the corporate income tax from 30% to 28% in 2015 and 2016; to 27% in 2017 and 2018; and to 26% in 2019 and thereafter; |
| - | There will be a gradual increase of the withholding income tax to dividends from 4.1% to 6.8% in 2015 and 2016; to 8.0% in 2017 and 2018; and to 9.3% in 2019 and thereafter. These rates will be applicable to the distributed or approved dividends, whichever first occurs, effective January 1, 2015; |
| - | The retained earnings or other items subject to generate taxable dividends, obtained until December 31, 2014 will be subject to a rate of 4.1%. |
Notes to the financial statements (continued)
| (b) | The income tax rate applicable to the Company is 32% beginning 2014 according to the new agreement mentioned above. For the years ended December 31, 2015, 2014 and 2013, the taxable income according to the tax law is calculated from the profit before income tax and profit sharing for these years, and is as follows: |
| | | 2015 | | | 2014 | | | 2013 | |
| | | US$(000) | | | US$(000) | | | US$(000) | |
| | | | | | | | | | |
| Profit before income tax | | | 79,530 | | | | 616,135 | | | | 946,600 | |
| Workers’ profit sharing | | | (1,639 | ) | | | 49,175 | | | | 61,690 | |
| | | | 77,891 | | | | 665,310 | | | | 1,008,290 | |
| Additions: | | | | | | | | | | | | |
| Fully depreciated assets | | | 42,299 | | | | 41,230 | | | | - | |
| Price adjustment of copper cathodes and concentrates | | | 24,529 | | | | 40,097 | | | | (18,408 | ) |
| Non - deductible expenses | | | 23,766 | | | | 19,251 | | | | 11,595 | |
| Expenses qualifying as assets | | | 23,037 | | | | 4,936 | | | | 11,569 | |
| Adjustment of inventory in process and finished goods | | | 9,414 | | | | (41,881 | ) | | | (16,646 | ) |
| Other additions, net | | | 32,041 | | | | 25,130 | | | | 14,550 | |
| | | | | | | | | | | | | |
| Deductions: | | | | | | | | | | | | |
| Deduction to due recalculation of depreciation at an annual rate of 20% and 5% | | | (141,014 | ) | | | (1,204 | ) | | | - | |
| Reversion of price adjustment of copper cathodes and concentrates | | | (40,097 | ) | | | 18,408 | | | | - | |
| Capitalized interests | | | (25,057 | ) | | | (1,175 | ) | | | 6,000 | |
| Special mining tax and mining royalties | | | (18,521 | ) | | | (43,492 | ) | | | (64,608 | ) |
| Effect of stripping cost activation | | | (2,255 | ) | | | 11,881 | | | | (46,784 | ) |
| Special mining burden | | | - | | | | (19,781 | ) | | | - | |
| | | | (71,858 | ) | | | 53,400 | | | | (102,732 | ) |
| Sub-total | | | 6,033 | | | | 718,710 | | | | 905,558 | |
| Workers’ profit sharing (8%) | | | (483 | ) | | | (57,497 | ) | | | (72,445 | ) |
| Taxable income | | | 5,550 | | | | 661,213 | | | | 833,113 | |
| Supplementary retirement fund | | | (28 | ) | | | (3,290 | ) | | | - | |
| Taxable income | | | 5,522 | | | | 657,923 | | | | 833,113 | |
| Income tax | | | (1,767 | ) | | | (210,535 | ) | | | (249,934 | ) |
| Prior years income taxes | | | 2,599 | | | | (9,919 | ) | | | (13,654 | ) |
| Total current income taxes charged to results, note 14(c) (does not include mining taxes and supplementary retirement fund) | | | 832 | | | | (220,454 | ) | | | (263,588 | ) |
Notes to the financial statements (continued)
| (c) | As described in Note 2.2(l), Law No. 29788 was enacted creating a new mining tax and royalty regime in Peru. Because the Company stabilized the tax regime in force at May 6, 1996, it was not subject to the revised royalty and special mining tax until December 31, 2013, date on which the related tax stability expired. However, the Company elected to pay a special mining burden during the remaining term of its tax stability agreement. For the years ended December 31, 2015, 2014 and 2013, the Company recorded a tax provision of US$14,599,000, US$52,116,000 and US$63,178,000 respectively,related to mining taxes. |
| (d) | The Tax Authority has the right to examine, and, if necessary, amend the Company’s income tax provision for the last four years. The Company’s income tax and VAT for the years 2011 through 2015 are open to examination by the tax authorities. To date, SUNAT has concluded its review of the Company’s income tax and VAT exams through the year 2010, and the Company is in the claim and appeal process for the years 2002 through 2010. |
In Management’s and legal advisors’ opinion, there are sound legal grounds to sustain the Company’s tax positions; as a result, Management expects to obtain favorable results on these processes and any additional tax assessment would not be significant to the financial statements.
For the periods pending of examination, and due to the many possible interpretations of current legislation, it is not possible to determine whether or not future reviews will result in tax liabilities for the Company. In the event that additional taxes are payable, including interest and surcharges, as a result of the Tax Authority reviews, they will be charged to expense in the period assessed. However, in Management’s and legal advisors’ opinion, any additional tax assessment would not be significant to the financial statements.
| (e) | SUNAT, the Peruvian tax authority, has assessed mining royalties on materials processed by the Company´s concentrator, which commenced operations in late 2006. These assessments cover the period December 2006 to December 2007 and the years 2008 and 2009. In July 2013, the Peruvian Tax Tribunal issued two decisions affirming assessments for the period December 2006 through December 2008. Decisions by the Tax Tribunal ended the administrative stage of the appeal procedures for these assessments. |
In September 2013, the Company filed judiciary appeals related to the assessments because the Company believes that its 1998 stability agreement exempted all minerals extracted from its mining concessions from royalties, irrespective of the method used for processing those minerals. With respect to the judiciary appeal related to the assessment for the year 2008, on December 17, 2014, the Eighteenth Contentious Administrative Court rendered its decision upholding the Company’s position and nullifying SUNAT’s assessment and the Tax Tribunal´s resolution (S/106.4 million Soles). In December 2014, SUNAT and the Tax Court appealed this decision. The court’s position also invalidates all penalties and interest assessed by SUNAT for that period (S/139.7 million Soles). On January 29, 2016, the 6th Superior Justice Court nullified the decision of the Eighteenth Contentious Administrative Court. Cerro Verde will appeal the decision to the Supreme Court.
Notes to the financial statements (continued)
On October 1, 2013, SUNAT served the Company a demand for payment totaling S/492 million (approximately US$144 million based on December 31, 2015 exchange rates, including interest and penalties of US$85 million) based on the Tax Tribunal’s decisions for the period December 2006 to December 2008. As permitted by law, the Company requested, and was granted, an installment payment program that deferred payment for six months and thereafter satisfies the amount via 66 equal monthly payments. As of December 31, 2015, the Company has made payments totaling S/219 million (US$64 million based on December 31, 2015, exchange rates) under the installment program, which are presented in the long term portion of Other non- financial assets in the statement of financial position (see Note 7). Based on the results rendered by the Eighteenth Contentious Administrative Court as is described in the previous paragraph, the Company requested an injunction that was accepted by the Judiciary and implied a modification of the installment program excluding the 2008 portion through SUNAT´s resolution notified to the Company on October 29, 2015.
In July 2013, a hearing on SUNAT's assessment for 2009 was held, but no decision has been issued by the Tax Tribunal for that year. As of December 31, 2015, the amount of the assessment, including interest and penalties, for the year 2009 was S/247 million (approximately US$72 million based on December 31, 2015, exchange rates). As of December 31, 2015, the Company estimates that the total exposure associated with mining royalties for the period from December 2006 to December 2013, including accumulated interest and penalties amounted to approximately US$500 million at December 31, 2015 exchange rates.
As of December 31, 2015, no amounts were accrued for these assessments or for the amounts paid under the installment payment program because management and its external legal advisors believe the Company’s 1998 stability agreement exempted it from these royalties and believes that the resolution will be favorable to the Company and a committee comprisedany payments should be recoverable.
| (f) | The Company has also received assessments from SUNAT for additional taxes (other than the mining royalty explained in (e) above), including penalties and interest. The Company has filed or will file objections to the assessments because it believes it has properly determined and paid its taxes. A summary of these assessments follows: |
| Year | | Taxes | | | Penalty and
Interest | | | Total | |
| | | US$(000) | | | US$(000) | | | US$(000) | |
| | | | | | | | | | |
| 2002 – 2005 | | | 16,037 | | | | 52,800 | | | | 68,837 | |
| 2006 | | | 6,545 | | | | 47,662 | | | | 54,207 | |
| 2007 | | | 12,376 | | | | 17,809 | | | | 30,185 | |
| 2008 | | | 20,797 | | | | 12,968 | | | | 33,765 | |
| 2009 | | | 56,198 | | | | 47,719 | | | | 103,917 | |
| 2010 | | | 65,997 | | | | 89,404 | | | | 155,401 | |
| 2014 | | | 5,512 | | | | - | | | | 5,512 | |
| 2015 | | | 3,753 | | | | - | | | | 3,753 | |
| | | | | | | | | | | | | |
| | | | 187,215 | | | | 268,362 | | | | 455,577 | |
As of December 31, 2015, the Company has paid US$180,741,000, (included“Non-financial – long term” in the statement of financial position) on these disputed tax assessments, which it believes is collectible. No amounts have been accrued for these assessments.
Notes to the financial statements (continued)
| (g) | As of December 31, 2015 and 2014, the Company has issued letters of credit to secure tax obligations amounting to S/383,792,000 (equivalent to US$112,450,000) and S/556,446,000 (equivalent to US$186,165,000), respectively, of which S/369,281,000 and S/542,747,000 are related to mining royalties for the years 2015 and 2014, respectively. |
| (a) | For the years ended December 31, 2015, 2014 and 2013, sales of goods are made up of the following: |
| | | 2015 | | | 2014 | | | 2013 | |
| | | Pounds
(000) | | | US$(000) | | | Pounds
(000) | | | US$(000) | | | Pounds
(000) | | | US$(000) | |
| | | | | | | | | | | | | | | | | | | | | | | | | |
| Copper concentrates (b) | | | 440,071 | | | | 794,197 | | | | 375,688 | | | | 949,459 | | | | 456,116 | | | | 1,316,690 | |
| Copper cathodes (b) | | | 104,279 | | | | 259,830 | | | | 125,647 | | | | 393,112 | | | | 103,479 | | | | 342,773 | |
| Other (primarily silver and molybdenum concentrates) | | | | | | | 65,343 | | | | | | | | 130,038 | | | | | | | | 152,025 | |
| | | | | | | | 1,119,370 | | | | | | | | 1,472,609 | | | | | | | | 1,811,488 | |
| Less: | | | | | | | | | | | | | | | | | | | | | | | | |
| Contributions OEFA / OSINERGMIN (see note 2.2(i)) | | | | | | | (3,753 | ) | | | | | | | (5,512 | ) | | | | | | | - | |
| | | | | | | | | | | | | | | | | | | | | | | | | |
| | | | | | | | 1,115,617 | | | | | | | | 1,467,097 | | | | | | | | 1,811,488 | |
Sales to related parties amounted to US$894,656,000 for the year ended December 31, 2015 (US$1,135,042,000 and US$1,487,186 for the years ended December 31, 2014 and 2013, respectively), which are summarized in note 22(b).
| (b) | As described in note 2.2(b), the Company’s copper sales are provisionally priced at shipment date. As a result, as of December 31, 2015 and 2014, the Company had embedded derivatives recorded in its statement of financial position (see note 24). Adjustments to the provisional prices are recognized as gains and losses in sales of goods until the month of settlement. Copper concentrate and cathode sales include adjustments to the provisional sale value generated by the changes in the fair value of the embedded derivatives. These adjustments resulted in higher sales for US$7,935,000 in the year 2015 (lower sales for US$42,805,000 and higher sales for US$6,839,000 in the years 2014 and 2013, respectively). |
Notes to the financial statements (continued)
| (c) | The following table shows sales of goods by geographic region based for the years ended December 31, 2015, 2014 and 2013: |
| | | 2015 | | | 2014 | | | 2013 | |
| | | US$(000) | | | US$(000) | | | US$(000) | |
| | | | | | | | | | |
| Asia | | | 770,272 | | | | 883,404 | | | | 1,148,607 | |
| South America (mainly Peru) | | | 204,206 | | | | 304,990 | | | | 275,783 | |
| North America | | | 79,244 | | | | 113,591 | | | | 114,110 | |
| Europe | | | 65,648 | | | | 170,624 | | | | 272,988 | |
| | | | | | | | | | | | | |
| | | | 1,119,370 | | | | 1,472,609 | | | | 1,811,488 | |
| Less: Contributions to OEFA and OSINERGMIN | | | (3,753 | ) | | | (5,512 | ) | | | - | |
| | | | | | | | | | | | | |
| | | | 1,115,617 | | | | 1,467,097 | | | | 1,811,488 | |
| (d) | Concentration of sales – |
For the year 2015, 80% of the civil societyCompany’s sales were to related entities (Freeport-McMoRan Corporation, Sumitomo Metal Mining Company and authoritiesClimax Molybdenum). For the years 2014 and 2013, 77% and 82% of Arequipathe Company’s sales were to these related entities.
| 18. | Cost of sales of goods |
| (a) | For the years ended December 31, 2015, 2014 and 2013, cost of sales of goods is made up of the following: |
| | | 2015 | | | 2014 | | | 2013 | |
| | | US$(000) | | | US$(000) | | | US$(000) | |
| | | | | | | | | | |
| Opening balance of finished goods (see note 8(a)) | | | 22,572 | | | | 15,798 | | | | 20,394 | |
| Raw materials and supplies | | | 364,234 | | | | 333,521 | | | | 324,925 | |
| Depreciation and amortization | | | 244,477 | | | | 164,985 | | | | 109,250 | |
| Labor (b) | | | 148,031 | | | | 125,863 | | | | 157,776 | |
| Energy | | | 118,019 | | | | 91,802 | | | | 73,907 | |
| Third parties services | | | 95,087 | | | | 87,458 | | | | 91,984 | |
| Services provided by related parties | | | 3,565 | | | | 4,904 | | | | 5,169 | |
| Workers’ profit sharing | | | (1,636 | ) | | | 45,783 | | | | 57,691 | |
| Other costs | | | 8,087 | | | | 20,462 | | | | 27,740 | |
| Variance of inventories in process | | | (118,327 | ) | | | (70,523 | ) | | | (57,974 | ) |
| Ending balance of finished goods (see note 8(a)) | | | (22,105 | ) | | | (22,572 | ) | | | (15,798 | ) |
| | | | | | | | | | | | | |
| | | | 862,004 | | | | 797,481 | | | | 795,064 | |
Notes to the financial statements (continued)
| (b) | Includes US$1,636,000 of workers profit sharing credit for the year ended December 31, 2015 associated with income tax true-ups (workers’ profit sharing expense of US$45,783,000 for the year ended December 31, 2014). |
| (c) | In compliance with corporate policies, the Company recognizes administrative costs directly to cost of production (US$19.5 million for the year ended December 31, 2015, and US$20.4 million for the year ended December 31, 2014). The effect of this policy resulted in lower cost of sales of US$3.9 million and US$3.1 million for 2015 and 2014, respectively. The accounting and presentation effects related with the application of corporate policies do not generate significant distortion for the financial statements taken as a whole. |
For the years ended December 31, 2015, 2014 and 2013, selling expenses are made up of the following:
| | | 2015 | | | 2014 | | | 2013 | |
| | | US$(000) | | | US$(000) | | | US$(000) | |
| | | | | | | | | | |
| Concentrate’s freight | | | 51,842 | | | | 50,507 | | | | 64,683 | |
| Commissions | | | 2,729 | | | | 2,271 | | | | 2,727 | |
| Cathode’s freight | | | 1,644 | | | | 1,432 | | | | 1,038 | |
| | | | | | | | | | | | | |
| | | | 56,215 | | | | 54,210 | | | | 68,448 | |
| 20. | Other operating expenses (income), net |
| (a) | For the years ended December 31, 2015, 2014 and 2013, other operating expenses (income) are made up to the following: |
| | | 2015 | | | 2014 | | | 2013 | |
| | | US$(000) | | | US$(000) | | | US$(000) | |
| | | | | | | | | | |
| Other expenses | | | | | | | | | | | | |
| Startup costs of new concentrate plant (b) | | | 19,568 | | | | - | | | | - | |
| Tax contingencies penalties | | | 2,796 | | | | - | | | | 317 | |
| Loss on sale / retirement / impairment of fixed assets | | | 661 | | | | 5,503 | | | | - | |
| Other expenses | | | 3,714 | | | | 370 | | | | 77 | |
| | | | | | | | | | | | | |
| | | | 26,739 | | | | 5,873 | | | | 394 | |
| | | | | | | | | | | | | |
| Other income | | | (139 | ) | | | (2,244 | ) | | | (541 | ) |
| | | | | | | | | | | | | |
| | | | 26,600 | | | | 3,629 | | | | (147 | ) |
| (b) | Corresponds to the start-up costs related to the new concentrator plant (See note 1(b)) in order to reach full production capacity, which is expected in early 2016. |
Notes to the financial statements (continued)
| 21. | Commitments and contingencies |
Commitments
| (a) | Environmental matters - |
The Company’s exploration activities are subject to environmental protection standards. In order to comply with these standards, the Company has obtained the approval for the Environment Adequacy Program (“PAMA”) and of the Committee”) signedEnvironmental Impact Studies (EIA), required for the operation of Cerro Verde’s production unit.
On October 14, 2003, Law No. 28090 was enacted, which regulates the commitments and procedures that entities involved in mining activities must follow in order to prepare, file and implement a mine site closing plan, as well as the respective environmental guarantees that assure compliance with the plan in accordance with protection, conservation and restoration of the environment. On August 15, 2005, the regulations regarding this law were approved. During 2006, in compliance with the mentioned Law, the Company completed the closing plans for its mine site. On October 5, 2009 the MEM issued Resolution No. 302-2009 MEM – AAA, approving the mine closure plan of the Company.
On November 20, 2013 according to what is established by Law, the Company presented to the Ministry of Energy and Mines an agreementupdated mine closure plan, by means of which the Company agreedupdated its mine closure budget.
The estimate of remediation and mine closing costs is based on studies prepared by independent consultants, who comply with the current environmental regulations. This provision corresponds mainly to finance and implement the technical studies and plans necessary to construct a fresh water treatment plant in Alto Cayma and a waste water treatment plant. The agreement established that the costsactivities to be incurredperformed in order to restore the constructionareas affected by mining activities. The main tasks to be performed include ground removal, revegetation labor and dismantling of plant and equipment.
The Company believes that this liability is sufficient to meet the drinking water treatment plant will be assumedcurrent environmental protection laws approved by the CompanyMinistry of Energy and those of the waste water treatment plant by the municipalities of the province of Arequipa.
On September 18, 2009, the Company contracted with Consorcio Alto Cayma (comprised of the following companies: Befesa, Graña y Montero and Aguas de Sevilla) for the design, construction and commissioning of the water treatment plant.
On July 26, 2012, through Municipal Agreement 104-2012, the Company formally transferred the water treatment plant (“PTAP II”) to the Municipality of the province of Arequipa as a public infrastructure project.Mines. See note 13(b).
| (c)(b) | Construction of the Waste Water Treatment Plant |
During 2011, the Company completed the feasibility study for a major expansion of its concentratorProduction Unit Cerro Verde (hereinafter “the Expansion”) which includes, among others, the expansion and improvements of facilities and mining process, flotation and leaching facilities, as well as expanding them to build a concentrator, a tailings dam and an additional leaching platform (see note 1(b)). As a result, the Company determined that the project will require the use of additional water resources apart from those currently used in the concentrator plant. In order tooperations.
To carry out the project,this investment in its production unit, the Company has offered, toagreed with the authorities of Arequipa as partand SEDAPAR (Arequipa Sanitation Service), within the framework of the Expansion Project,expansion, to develop and finance the engineering, construction and operation during the first two years of the Waste Water Treatment Plant (WWTP) and all its components, the same that will be used as a water source for expanded operations, supplementing the existing water resources to support the expansion.
Notes to the financial statements (continued)
The Company is responsible for the operation and maintenance cost of the waste water treatment plant (the plant), the drive line to the plant and the effluent discharge line. The Company will perform the operation and maintenance of the plant until the earlier of:
| (i) | A new legal framework grant commercialization of the residual water treated or for the water treatment service by the companies that provide sanitation services, and both parties agrees on the amount to be paid by the Company to SEDAPAR; |
| (ii) | Establishment of a fee payment, compensation or other right for the water re-use and/or water treatment under the satisfaction of both parties; or |
| (iii) | Expiration of the agreement or its extensions. |
In August 2013, the Ministry of Housing, Construction and Sanitation approved the environmental and social impact assessment of the waste water treatment plant.
As of December 31, 2015, the construction of the waste water treatment plant.plant was completed with a total investment of S/1,300 million Soles (US$382 million based at December 31, 2015 exchange rate).
In addition to allowing for the viability of the Company’s production unit expansion project, the waste water treatment plant will also benefit the population of Arequipa as it will help to decontaminate the waters of the Rio Chili, and improve the quality of the agricultural products and the environment in general. The waste water treatment plant is expected to start full operations in early 2016.
| (c) | Letter of guarantees – |
During years 2015 and 2014, the Company signed letters of guarantee with Banco de Credito de Peru, Scotiabank and BBVA Banco Continental as follows:
| | | 2015 | | | 2014 | |
| | | US$(000) | | | US$(000) | |
| | | | | | | |
| Tax obligations, note 16(g) | | | 112,450 | | | | 186,165 | |
| Mine closure, note 13(b) | | | 21,539 | | | | 14,851 | |
| Third party obligations | | | 23,564 | | | | 20,914 | |
| Custom taxes | | | 12,575 | | | | 9,691 | |
| | | | | | | | | |
| | | | 170,128 | | | | 231,621 | |
Notes to the financial statements(continued)
In September 2011, the Company reached an agreement with the Regional Government and the Service of Potable Water and Serewage of Arequipa S.A. (SEDAPAR), to finance as part of the expansion project, the engineering and construction of the waste water treatment plant of Arequipa, which will be used by the Company to supplement existing water supplies to support the potential concentrator expansion. In December 2012, the Company received approval of the Environmental Impact Study from the Peruvian Ministry of Energy and Mines.
| (d) | Construction of Bamputañe Dam - |
On December 29, 2004, the Company signed an electric power supply agreement with Empresa de Generación Eléctrica de Arequipa S.A. (“EGASA”) for attending part of its mining operations. Under this agreement, EGASA committed to supply electricity at a fixed commodity price for the period January 1, 2007 to December 31, 2015, and the Company committed to construct the Bamputañe Dam located in the Santa Lucía district, in the province of Lampa, in the department of Puno, Peru. At that date, the construction budget related to the project was estimated to be US$5,000,000. On June 11, 2008, EGASA and the Company signed an addendum to the contract for the construction of the Bamputañe Dam, in which the parties recognized and declared that the Bamputañe Dam construction budget would be significantly higher than amount estimated initially. The updated construction budget was estimated at approximately US$14,000,000.
On December 1, 2009, the Company formally transferred the Bamputañe Dam to EGASA, and the final cost of the dam amounted to US$11,390,000. This agreement allows the Company to obtain electrical energy at a fixed rate during a period of nine years. Accordingly, the Company recognized a future economic benefit and disbursements related to the construction of the Bamputañe Dam as an intangible asset in the statement of financial position, which is being amortized over the nine year term of the contract.
As of December 31, 2012, the Company’s intangible asset, net of its amortization, for the future benefit of the supply of electrical energy at fixed prices is US$4,890,000 (US$6,519,000 as of December 31, 2011. During years 2012 and 2011, the Company recognized an amount of US$1,630,000 for each year related to the amortization in the statements of comprehensive income.
| (e) | Voluntary contribution of 3.75% of net income - |
On December 21, 2006, the Peruvian Government released Supreme Decree 071-2006-EM regulating the terms and conditions under which a voluntary contribution would be paid annually by mining companies in Peru. Under this regulation, the Peruvian government established the requirements for the agreements that would be negotiated individually by the mining companies. This regulation established that the contribution:
Notes to the financial statements(continued)
| (i) | Was equivalent to 3.75% of net income, |
| (ii) | Was paid for 2006 and the subsequent four years, dependent on the level of international metal prices, and |
| (iii) | Was not tax deductible. |
The rate of the voluntary contribution was broken down as follows:
| - | 2.75% for the Local Mining Fund |
| - | 1.00% for the Regional Mining Fund |
On November 8, 2007 the Company signed the contract of voluntary contribution with the Peruvian State, which complied with the requirements described previously and covered the five year period from 2006 through 2010. Total voluntary contributions paid by the company under this contract were US$146,859,000 (which included contributions of US$41,081,000 for the year 2010 which has been reflected in operating expenses in the statements of comprehensive income).
Through Supreme Decree 071-2006-ME, this contract expired, and, therefore the Company did not recognize any voluntary contributions expense for the years 2012 and 2011. In Management’s opinion, the Company has met all requirements set in the mentioned Supreme Decree 071-2006-ME and has no further obligations or commitments.
| 17.22. | Transactions with related parties |
| (a) | On June 1, 2005,During this year, the Company andreceived from Minera Freeport–McMoRanFreeport McMoran South America S.A.C. signed an agreement where Minera Freeport–McMoRan South America S.A.C.Ltda. consulting and professional services related to finance, logistics, legal, environmental, corporate affairs , IT and human resources, which are made in Chile. As of December 31, 2015, the amount incurred by the Company for these services was appointed as the general manager of the Company. Charges for management services,US$3,000,462, which arehas been recognized in the statementsstatement of comprehensive income amounted to US$18,210,000 for the year 2012 (US$20,003,0004,489,000 as of December 31, 2014 and US$17,850,000 for the years 2011 and 2010, respectively)5,169,000 as of December 31, 2013). See note 14. |
Notes to the financial statements(continued)
| (b) | During the years ended December 31, 2012, 20112015, 2014 and 2010,2013, the Company recognized the following sales of goods to related parties: |
| | | 2012 | | 2011 | | 2010 | | |
| | | US$(000) | | US$(000) | | US$(000) | | | 2015 | | 2014 | | 2013 | |
| | | | | | | | | | US$(000) | | US$(000) | | US$(000) | |
| Sales of goods to related parties | | | | | | | | | | | | | | | | | | | | | | | | |
| Freeport-McMoRan Corporation (c) | | | 845,417 | | | | 1,004,362 | | | | 1,044,811 | | |
| Parent Company: | | | | | | | | | | | | | |
| FMC (c) | | | | 513,862 | | | | 560,211 | | | | 775,775 | |
| | | | | | | | | | | | | | |
| Other related parties: | | | | | | | | | | | | | |
| Sumitomo Metal Mining Company, Ltd. (d) | | | 693,945 | | | | 729,446 | | | | 716,740 | | | | 344,334 | | | | 475,609 | | | | 598,023 | |
| Climax Molybdenum Marketing Corporation (e) | | | 91,859 | | | | 143,098 | | | | 106,682 | | | | 36,460 | | | | 99,222 | | | | 113,388 | |
| | | | | | | | | | | | | | | | | | | | | | | | | |
| Total revenues | | | 1,631,221 | | | | 1,876,906 | | | | 1,868,233 | | | | 894,656 | | | | 1,135,042 | | | | 1,487,186 | |
| (c) | On October 15, 2006, the Company signed a long-term contract with FMC through in which it committed to sell 20% of its annual copper concentrate production from its primary sulphide processingconcentrator plant. Terms of the contract are reviewed annually. For the year 2012,2015, the sales of concentrate copper to FMC amounted to US$746,721,000394,349,000 (US$689,813,000445,756,000 in 2014 and US$725,863,000687,655,000 in 2011 and 2010, respectively)2013). |
The Company also sells copper cathodes based on availability. According to the terms of the sales of copper cathodes to FMC, agreements are made for each shipment. For the year 2012, sales of copper cathodes to FMC amounted to US$98,696,000 (US$314,549,000 and US$318,948,000 in 2011 and 2010, respectively).
| | The Company also sells copper cathodes based on availability. According to the terms of the sales of copper cathodes to FMC, agreements are made for each shipment. For the year 2015, sales of copper cathodes to FMC amounted to US$119,513,000 (US$114,455,000 in 2014 and US$88,120,000 in 2013). |
| (d) | On June 1, 2005, the Company signed a long-term agreement with Sumitomo Metal Mining Company Ltd., in which it committed to sell 50% of its annual copper concentrate production from its primary sulphide processingconcentrator plant, through December 31, 2016. Contract terms are revised annually. |
| (e) | On October 1, 2006,In November, 2014, the Company signedrenewed a long-term agreement with Climax Molybdenum Marketing Corporation, a wholly owned subsidiary of FMC, in which it committed to sell 100% of its annual molybdenum concentrate production, at a price based ontheMetals Week Dealer Oxide price and under a delivery type known as CIF (cost, insurance and freight). Terms of the contract are reviewed annually. |
| (f) | As a result of sales of goods to related parties, the Company had trade accounts receivable from related parties and also has the following trade payables to related parties as of December 31, 2012 and 2011: |
Notes to the financial statements(continued)
| | | 2012 | | | 2011 | |
| | | US$(000) | | | US$(000) | |
| | | | | | | |
| Accounts receivable from related parties | | | | | | | | |
| Freeport - McMoRan Corporation | | | 203,644 | | | | 91,582 | |
| Sumitomo Metal Mining Company, Ltd. | | | 108,507 | | | | 104,581 | |
| Climax Molybdenum Marketing Corporation | | | 6,411 | | | | 3,168 | |
| | | | | | | | | |
| | | | 318,562 | | | | 199,331 | |
| | | | | | | | | |
| Accounts payable to related parties | | | | | | | | |
| Freeport - McMoRan Corporation | | | 3,844 | | | | 871 | |
| Minera Freeport – McMoRan South America S.A.C. | | | 2,795 | | | | 1,103 | |
| Freeport - McMoRan Sales Company | | | 1,442 | | | | 1,424 | |
| Freeport McMoRan South America Inc. Chilean Agency | | | - | | | | 17 | |
| | | | | | | | | |
| | | | 8,081 | | | | 3,415 | |
| (f) | Short-term and long-term employee benefits are recognized as expenses during the period earned. Benefits received by key management personnel represent 1.76% of total revenues for 2015 (0.66% and 1.37% of total revenues for 2014 and 2013, respectively). As of December 31, 2015 and 2014, the Company had granted stock option and/or restricted stock unit benefits to certain key management personnel, the amounts of which are not significant as of December 31, 2015 and 2014. The Company does not have other long-term benefits. |
| (g) | As a result of transactions with related parties, the Company had accounts receivable and also has the following payables as of December 31, 2015 and 2014: |
| | | 2015 | | | 2014 | |
| | | US$(000) | | | US$(000) | |
| | | | | | | |
| Accounts receivable from related parties | | | | | | | | |
| Parent Company: | | | | | | | | |
| FMC | | | 180,024 | | | | 78,638 | |
| | | | | | | | | |
| Other related parties: | | | | | | | | |
| Sumitomo Metal Mining Company, Ltd. | | | 19,344 | | | | 107,464 | |
| Climax Molybdenum Marketing Corporation | | | - | | | | 1,838 | |
| | | | 199,368 | | | | 187,940 | |
| Accounts payable to related parties | | | | | | | | |
| Parent Company: | | | | | | | | |
| FMC | | | 14,435 | | | | 14,694 | |
| | | | | | | | | |
| Other related parties: | | | | | | | | |
| Freeport - McMoRan Sales Company | | | 1,684 | | | | 1,052 | |
| Climax Molybdenum Marketing Corporation | | | 1,064 | | | | - | |
| Minera Freeport McMoran South America Ltda. | | | 901 | | | | 1,765 | |
| Sociedad Contractual Minera El Abra | | | 535 | | | | 10 | |
| Freeport Cobalt OY | | | 141 | | | | - | |
| Freeport McMoRan South America S.A.C. | | | 132 | | | | 32 | |
| Accounts payable to related parties | | | 18,892 | | | | 17,553 | |
| Less: Long-Term Accounts payable to related parties | | | (6,850 | ) | | | (5,643 | ) |
| Short-Term Accounts payable to related parties | | | 12,042 | | | | 11,910 | |
Terms and transaction with related parties -
Transactions with related parties are made at normal market prices.Outstanding balances at year-end are unsecured, interest free and settlement occurs in cash. There have been no guarantees received or provided for any accounts receivable or payable to related parties.As of December 31, 20122015 and 2011,2014,the Company had not recorded any impairment of accounts receivablesreceivable from related parties.
Notes to the financial statements (continued)
Basic and diluted earnings per share are computed by dividing net earnings for the period by the weighted average number of shares outstanding during the year. Basic and diluted earnings per share have been determinedyear as follows:
| | | 2012 | | 2011 | | 2010 | | | 2015 | | 2014 | | 2013 | |
| | | | | | | | | | | | | | | |
| Net profit for the year | | | US$772,070,000 | | | | US$1,078,399,000 | | | | US$1,074,393,000 | | | US$33,284,000 | | | US$377,606,000 | | | US$613,262,000 | |
| Weighted average number of shares outstanding | | | 350,056,012 | | | | 350,056,012 | | | | 350,056,012 | | | | 350,056,012 | | | | 350,056,012 | | | | 350,056,012 | |
| Basic and diluted earnings per share | | | US$2.21 | | | | US$3.08 | | | | US$3.07 | | | US$0.10 | | | US$1.08 | | | US$1.75 | |
Basic and diluted earnings per share are calculated by dividing the net profit of the period by the weighted-average number of outstanding shares for the year.
Notes to the financial statements(continued)
| 19.24. | Embedded derivative |
As is indicated in note 2.3Note 2.2 (b), the exposure to the risk of changes in the market prices of copper and molybdenum is considered as an embedded derivative and it is related to the commercial contracts. As of December 31, 20122015 and 2011,2014, provisional prices of the estimated future prices (in copper and molybdenum pounds) and their final maturity periods were as follow:follows:
| | | | | | As of December 31, 2012 | | | | | As of December 31, 2015 |
| | | Pounds payable
(000) | | Maturity | | Provisional
pricing | | Forward
pricing | | Fair
value | | | Pounds payable (000) | | Maturity | | Provisional
pricing | | Forward
pricing | | Fair
value | |
| | | | | | | US$ | | US$ | | US$(000) | | | | | | | US$ | | US$ | | US$(000) | |
| | | | | | | | | | | | | | | | | | | |
| Copper: | | | | | | | | | | | | | | | | | | | | | | | | | | |
| Concentrate | | | 218,571 | | | | January – May 2013 | | | Between 3.398 and 3.611 | | Between 3.589 and 3.602 | | | 11,583 | | | | 221,659 | | | January 2016 to May 2016 | | Between 2.076 and 2.433 | | Between 2.134 and 2.138 | | | (19,696 | ) |
| Cathode | | | | 3,970 | | | January 2016 | | 2.08 | | 2.14 | | | 233 | |
| Molybdenum | | | 3,125 | | | | January – February 2013 | | | Between 10.853 and 13.222 | | Between 10.963 and 11.800 | | | (14 | ) | | | 1,425 | | | January 2016 to February 2016 | | Between 3.435 and 3.635 | | 3.950 | | | 616 | |
| | | | | | | | | | | | | | | | | | | | | | | | | | | |
| | | | | | | | | | | | 11,569 | | | | | | | | | | | | | | (18,847 | ) |
| | | | | | As of December 31, 2011 | | | | | As of December 31, 2014 |
| | | Pounds payable
(000) | | Maturity | | Provisional
pricing | | Forward
pricing | | Fair
value | | | Pounds payable (000) | | Maturity | | Provisional
pricing | | Forward
pricing | | Fair
value | |
| | | | | | | US$ | | US$ | | US$(000) | | | | | | | US$ | | US$ | | US$(000) | |
| | | | | | | | | | | | | | | | | | | |
| Copper: | | | | | | | | | | | | | | | | | | | | | | | | | | |
| Concentrate | | | 234,084 | | | | January - April 2012 | | | Between 3.156 and 4.410 | | Between 3.156 and 3.449 | | | (68,638 | ) | | | 137,906 | | | January 2015 to April 2015 | | Between 2.934 and 3.193 | | Between 2.855 and 2.880 | | | (26,522 | ) |
| Cathode | | | 4,247 | | | | January 2012 | | | Between 3.449 and 3.489 | | Between 3.445 and 3.447 | | | 11 | | | | 3,749 | | | January 2015 | | 2.898 | | 2.88 | | | (70 | ) |
| Molybdenum | | | 6,381 | | | | January – February 2012 | | | Between 12.159 and 15.501 | | Between 12.182 and 15.501 | | | (6,630 | ) | | | 870 | | | February 2015 | | 8.498 | | 8.28 | | | (190 | ) |
| | | | | | | | | | | | | | | | | | | | | | | | | | | |
| | | | | | | | | | | | (75,257 | ) | | | | | | | | | | | | | (26,782 | ) |
The final pricing estimated by the Company as of December 31, 20122015 and 2011 were2014 was based on LME information.
Notes to the financial statements(continued)
| 20.25. | Financial risk management |
The Company’s activities are exposed to different financial risks, the main risks that could adversely affect the Company’s financial assets and liabilities or future cash flows are: the risk arising from changes in market prices of minerals, interest rate risk, liquidity risk, credit risk and capital risk. The Company’s financial risk management program focuses on mitigating potential adverse effects on its financial performance.
Management knows the conditions prevailing in the market and based on its knowledge and experience, reviews and manages the risks which are summarized below. Board of Directors reviews and approves the policies to manage each of these risks.
Commodity price risk -
The international pricesprice of copper and molybdenum havehas a significant impact on the Company’s operating results. The price of copper and molybdenum has fluctuated historically and is affected by numerous factors beyond the Company’s control. The Company manages this risk through the use of sales commitments with customers. The Company does not hedge its exposure to price fluctuation.
Embedded derivative –
As described in note 2.32.2 (b), the Company has price risk through its provisionally priced sales contracts, which provide final pricing in a specified future month (generally three months from the arrivalshipment date) based primarily on quoted LME monthly average prices. The Company receives market prices based on prices in the specified future period, which results in price fluctuations recorded through revenues until the date of settlement. The Company records revenues and commercial invoices at the time of shipment, based on the current LME prices, which results in an embedded derivative on the provisionally priced contracts that are adjusted to fair value through revenues each period, using the period-end forward prices, until the date of final pricing. To the extent that final prices are higher or lower than what was recorded on a provisional basis, an increase or decrease in revenues is recorded at each reporting period until the date of final pricing. See note 24.
The table below summarizes the effect on profit before income tax and workers’ profit sharing caused by changes in the copper and molybdenum price. This analysis is based on the assumption that the copper price has increased or decreased by 10% while all other variables are held constant. The 20122015 positive scenario uses prices between US$/pound 3.952.347 to 3.96US$/ pound 2.351 (US$/pound 3.783.140 to US$/pound 3.803.170 in the year 2011)2014 and US$/pound 3.660 to US$/pound 3.680 in the year 2013); whereas the negative scenario uses prices between US$/Lb 3.23 to 3.24 (US$/pound 3.091.920 to US$/pound 3.111.924 (US$/pound 2.570 to 2.590 in the year 2011)2014 and US$/pound 2.990 to US$3.010 in the year 2013).
Notes to the financial statements(continued)
| | | Effect on profit before
before income
tax | |
| | | US$(000) | |
| | | |
December 31, 20122015 | | | | |
Increase in copper and molybdenum international quotesquote | | | 61,63448,187 | |
Decrease in copper and molybdenum international quotesquote | | | (61,63448,187 | ) |
| | | | |
| December 31, 2014 | | | | |
| Increase in copper international quote | | | 40,622 | |
| Decrease in copper international quote | | | (40,622 | ) |
| | | | |
| December 31, 2013 | | | | |
| Increase in copper international quote | | | 63,225 | |
| Decrease in copper international quote | | | (63,225 | ) |
Exchange rate risk –-
As described in note 2.3(a)2.2(a), the Company’s financial statements are presented in US dollars, which is the functional and presentation currency of the Company. The Company exchange-rate risk arises mainly from deposits, taxes, compensationsalaries and other accounts payable in currencies other than the US dollar, mainly Nuevos Soles. The Company mitigates its exposure to exchange-rate risk by carrying out almost all of its transactions in its functional currency and Management maintains only small amounts in Nuevos Soles to cover its needs in this currency (i.e., taxes and compensation).
During 2012,For the year ended December 31, 2015, the Company has recorded net gains netforeign exchange losses totaling US$76 million composed by a loss of US$84 million associated with income tax, VAT credits and payments related to the Company’s royalty installment program, which is offset by income of US$8 million from exchange differencesdifference derived from other items in the statement of US$3,149,000financial position (net gainsincome of US$1,924,0002.3 million in 2014 and US$669,000 during the years 2011 and 2010, respectively), from the translationnet loss of balancesUS$ 1.9 million in Nuevos Soles to the US dollars.2013).
Liquidity risk arises from situations in which cash might not be available to pay obligations when they become due.due at a fair cost. The Company maintains adequate liquidity by properly managing the maturities of assets and liabilities in such way that allows the Company to maintain a structural liquidity position (cash available) enabling it to meet liquidity requirements properly. Cerro VerdeThe Company sells cathode and copper and molybdenum concentrates to recognized companies in the mining sector worldwide. In addition, the Company currently has the possibility to obtain funds from financial institutions and its partners if it is required to meet its contractual obligations.
Notes to the financial statements(continued)
The following tables show the liabilities, excluding taxes and accruals with the expected aging of maturity of the Company’s obligations as of December 31, 20122015 and 2011:2014:
| | | On demand | | Less than 3
months | | 3 to 12 months | | 1 to 5 years | | Total | | | On demand | | Less than 3 months | | 3 to 12 months | | 1 to 5 years | | Total | |
| | | US$(000) | | US$(000) | | US$(000) | | US$(000) | | US$(000) | | | US$(000) | | US$(000) | | US$(000) | | US$(000) | | US$(000) | |
| | | | | | | | | | | | | | | | | | | | | | | |
| As of December 31, 2012 | | | | | | | | | | | | | | | | | | | | | |
| As of December 31, 2015 | | | | | | | | | | | | | | | | | | | | | |
| Trade accounts payable | | | - | | | | 146,354 | | | | - | | | | - | | | | 146,354 | | | | - | | | | 432,418 | | | | - | | | | - | | | | 432,418 | |
| Accounts payable to related parties | | | | - | | | | 12,042 | | | | - | | | | 6,850 | | | | 18,892 | |
| Other financial liabilities | | | | - | | | | - | | | | 43,169 | | | | 2,381,995 | | | | 2,425,164 | |
| Provision related to benefits to employees | | | | - | | | | 14,572 | | | | 5,964 | | | | - | | | | 20,536 | |
| Other accounts payable | | | - | | | | 27,671 | | | | 1,265 | | | | 540 | | | | 29,476 | | | | - | | | | 2,112 | | | | - | | | | - | | | | 2,112 | |
| | | | | | | | | | | | | | | | | | | | | | | | | | | | | | | | | | | | | | | | | |
| Total | | | - | | | | 174,025 | | | | 1,265 | | | | 540 | | | | 175,830 | | | | - | | | | 461,144 | | | | 49,133 | | | | 2,388,845 | | | | 2,899,122 | |
| | | | | | | | | | | | | | | | | | | | | | | | | | | | | | | | | | | | | | | | | |
| As of December 31, 2011 | | | | | | | | | | | | | | | | | | | | | |
| As of December 31, 2014 | | | | | | | | | | | | | | | | | | | | | |
| Trade accounts payable | | | - | | | | 44,177 | | | | 11,773 | | | | - | | | | 55,950 | | | | - | | | | 398,070 | | | | - | | | | - | | | | 398,070 | |
| Embedded derivate | | | - | | | | 74,370 | | | | 887 | | | | - | | | | 75,257 | | |
| Accounts payable to related parties | | | | - | | | | 11,910 | | | | - | | | | 5,643 | | | | 17,553 | |
| Other financial liabilities | | | | - | | | | - | | | | 50,163 | | | | 402,686 | | | | 452,849 | |
| Provision related to benefits to employees | | | | - | | | | 9,706 | | | | 34,706 | | | | - | | | | 44,412 | |
| Other accounts payable | | | - | | | | 18,239 | | | | 9,851 | | | | 1,298 | | | | 29,388 | | | | - | | | | 2,779 | | | | - | | | | - | | | | 2,779 | |
| | | | | | | | | | | | | | | | | | | | | | | | | | | | | | | | | | | | | | | | | |
| Total | | | - | | | | 136,786 | | | | 22,511 | | | | 1,298 | | | | 160,595 | | | | - | | | | 422,465 | | | | 84,869 | | | | 408,329 | | | | 915,663 | |
Notes to the financial statements(continued)
The Company’s exposure to credit risk arises from a customer’s inability to pay amounts in full when they are due and the failure of third parties in transactions of cash and cash equivalent transactions, which is limited to balances deposited in banks and financial institutions and for trade accounts receivable at the date of the statement of financial position. To manage this risk, the Company has an established treasury policy, which only allows the deposit of surplus funds in highly rated institutions, by establishing conservative credit policies and through a constant evaluation of market conditions. Consequently, the Company does not expect to incur in losses on accounts involving potential credit risks.
The concentration of credit risk also exists when economic changes occur, in industry or geography that affects third parties in the same way. The Company’s customer portfolio is primarily concentrated in three customers, which are related companies with solid financial structures.
The credit risk is limited to the book value of financial assets on the statement of financial position date, which consists mainly of cash and cash equivalents, trade accounts receivable from third parties and trade accounts receivable from related parties. The Company does not use derivative instruments to hedge its exposure to credit risk.
| (d) | Capital managementrisk - |
The objective is to safeguard the Company’s ability to continue as a going concern in order to provide returns for shareholders and benefits for stakeholders and maintain an optimal structure that would reduce the cost of capital.
The Company manages its capital structure and makes adjustments to it, in light of changes in economic market conditions. To maintain or adjust the capital structure, the Company controls dividend payments to shareholders, the return of capital to shareholders and the issue of new shares. No changes were made in the objectives, policies or processes during the years ended December 31, 20122015, 2014 and 2011.2013.
Notes to the financial statements (continued)
| 21.26. | Hierarchy and fair value of financial instruments |
Hierarchy:
As of December 31,2015 and 2014,the only financial asset carried at fair value is the embedded derivative, which is generated by the sale of copper and measured at fair value based on copper prices. The value of this embedded derivative as of December 31, 2015 was a liability of US$18,847,000 (liability US$26,782,000 as of December 31, 2014). This embedded derivative is categorized within Level 2 of the hierarchy.The fair value of embedded derivatives is determined using valuation techniques using information directly observable in the market (forward prices of metals).
Fair value:
Financial instruments whose fair value is similar to their book value –
For financial assets and liabilities which are liquid or have short-term maturity (less than three months), such as cash and cash equivalent, accounts receivable, other accounts receivable, accounts payable, other accounts payable, and other current liabilities, it is estimated that their book value is similar to their fair value.
Financial instruments at fixed and variable rates –
Financial assets and liabilities with fixed or variablerates are recorded at amortized cost and fair value is determined by comparing the market interest rates at the time of their initial recognition to the current market rates with regard to similar financial instruments.
Based on the foregoing, there are no significant differences between book value and fair value of financial instruments (assets and liabilities) as of December 31, 2015 and 2014.
| 27. | Mineral reserves (unaudited) |
As of December 31, 20122015 and 2011,2014, the Company’s proven and probable copper mineral reserves were:
| | | MT (000) | | | Grade | |
| | | 2012 | | | 2011 | | | 2012 | | | 2011 | |
| | | | | | | | | | | | | |
| Mineral for leaching | | | 202,153 | | | | 224,541 | | | | 0.34 | | | | 0.40 | |
| Mineral for milling | | | 3,992,384 | | | | 3,752,670 | | | | 0.38 | | | | 0.39 | |
Notes to the financial statements(continued)
| | | MT (000) | | | Grade (percent) | |
| | | 2015 | | | 2014 | | | 2015 | | | 2014 | |
| | | | | | | | | | | | | |
| Mineral for leaching | | | 152,566 | | | | 168,380 | | | | 0.35 | | | | 0.37 | |
| Mineral for milling | | | 3,703,373 | | | | 3,784,854 | | | | 0.38 | | | | 0.38 | |
Copper production in thousands of recoverable pounds for the years ended December 31, 20122015 and 20112014 was as follow:follows:
| | | 2012 | | 2011 | | | 2015 | | 2014 | |
| | | | | | | | | | | |
| Cathodes | | | 118,703 | | | | 166,017 | | | | 105,077 | | | | 124,804 | |
| Concentrates | | | 475,771 | | | | 481,217 | | | | 439,405 | | | | 375,438 | |
Notes to the financial statements (continued)
Average LME price per metric ton of copper for the years ended December 31, 20122015 and 2011,2014, was as follows:
| | | 2012 | | | 2011 | |
| | | US$/MT | | | US$/MT | |
| | | | | | | | | |
| Copper | | | 7,950 | | | | 8,821 | |
| | | 2015 | | | 2014 | |
| | | US$/MT | | | US$/MT | |
| | | | | | | |
| Copper | | | 5,490 | | | | 6,860 | |
| 28. | Summary of significant differences between accounting principles followed by the Company and U.S. generally accepted accounting principles |
The Company’s financial statements have been prepared in accordance with International Financial Reporting Standards which differs in certain respects from U.S. GAAP. The effects of these differences are reflected in Note 29 and are principally related to the items discussed in the following paragraphs:
| (a) | Stripping Cost – IFRIC 20 |
Under IFRS, the stripping cost of production that is necessary to produce the inventory is recorded as cost of production, while the one that allows access to additional amounts of reserves to be exploited in future periods are capitalized and amortized based on proved and probable reserves of each ore body (component) identified in the open pit.
Under U.S. GAAP, the costs of clearing removal (stripping cost of production) incurred during the production stage are recorded as part of the production cost of inventories.
Under IFRS, the cost inventory includes: (i) the depreciation and amortization expense, (ii) the amortization of production-stripping costs and (iii) workers´ profit participation. Under U.S. GAAP the cost inventory excludes these items.
| (c) | Deferred workers’ profit participation |
Under IFRS, the workers’ profit participation is calculated based on the Company’s taxable income and is recorded as an employee benefit (cost of production or administrative expense, depending on the function of the workers).
Under U.S. GAAP, the workers’ profit sharing is treated in a similar way as income tax since both are calculated based on the Company’s taxable income. Therefore, the Company calculates a deferred workers’ profit participation resulting from the taxable and deductible temporary differences.
The differences between U.S. GAAP and IFRS are re-measurements that lead to different temporary differences. According to the accounting policies in Note 2.2 (l), the Company has to account for such differences.
| 29. | Reconciliation between net income and shareholders' equity determined under IFRS and U.S. GAAP |
The following is a summary of the main adjustments to net income for the years ended December 31, 2015, 2014 and 2013 and to shareholders' equity as of December 31, 2015, 2014 and 2013 that would be required if U.S. GAAP had been applied instead of IFRS in the financial statements:
Notes to the financial statements (continued)
| | | 2015 | | | 2014 | | | 2013 | |
| | | US$(000) | | | US$(000) | | | US$(000) | |
| | | | | | | | | | |
| Net profit under IFRS | | | 33,284 | | | | 377,606 | | | | 613,262 | |
| | | | | | | | | | | | | |
| Items increasing (decreasing) reported net profit: | | | | | | | | | | | | |
| Stripping activity asset, net of amortization | | | (45,168 | ) | | | (4,221 | ) | | | (49,937 | ) |
| Inventories valuation | | | 12,573 | | | | (57,744 | ) | | | 25,517 | |
| Asset retirement obligation | | | (428 | ) | | | (654 | ) | | | (41 | ) |
| Deferred workers´ profit participation | | | (6,225 | ) | | | 13,512 | | | | 2,055 | |
| Deferred income tax | | | 9,470 | | | | 13,329 | | | | 8,484 | |
| Other | | | 591 | | | | (211 | ) | | | 31 | |
| | | | | | | | | | | | | |
| Net income under U.S. GAAP | | | 4,097 | | | | 341,617 | | | | 599,371 | |
| Shareholders’ equity under IFRS | | | 4,498,374 | | | | 4,465,090 | | | | 4,087,484 | |
| Items increasing (decreasing) reported shareholder’s equity: | | | | | | | | | | | | |
| Stripping activity asset, net of amortization | | | (99,326 | ) | | | (54,158 | ) | | | (49,937 | ) |
| Inventories valuation | | | (30,698 | ) | | | (43,271 | ) | | | 14,473 | |
| Asset retirement obligation | | | (2,527 | ) | | | (2,099 | ) | | | (1,445 | ) |
| Deferred workers´ profit participation | | | (8,126 | ) | | | (1,901 | ) | | | (15,413 | ) |
| Deferred income tax | | | 38,715 | | | | 29,245 | | | | 15,916 | |
| Other | | | 266 | | | | (325 | ) | | | (114 | ) |
| | | | | | | | | | | | | |
| Shareholders’ equity under U.S. GAAP | | | 4,396,678 | | | | 4,392,581 | | | | 4,050,964 | |
| 30. | New U.S. GAAP Accounting Pronouncements |
Recently Issued Accounting Pronouncements -
Inventory -
In July 2015, ASU guidance was issued related to inventory simplifying the subsequent measurement of inventories by replacing the lower of cost or market test with a lower of cost and net realizable value test. The update is effective in fiscal years, including interim periods, beginning after December 15, 2016, and early adoption is permitted. The Company is currently evaluating this guidance and the impact it will have on net equity or net results.
Revenue recognition –
In May 2014, ASU guidance was issued related to revenue from contracts with customers. The new standard provides a five-step approach to be applied to all contracts with customers and also requires expanded disclosures about revenue recognition. In August 2015, the effective date was deferred to reporting periods, including interim periods, beginning after December 15, 2017, and will be applied retrospectively. Early adoption is not permitted. The Company is currently evaluating this guidance and the impact it will have on net equity or net results.