Table of ContentsTABLE OF CONTENTS (TO BE UPDATED)
| Page | ||||
| C. | Material Contracts |
Table of Contents
(continued)
In this annual report on Form 20-F (“Annual Report”), “GW Pharma,” the “Group,” the “company,“Company,” “we,” “us” and “our” refer to GW Pharmaceuticals plc and its consolidated subsidiaries, except where the context otherwise requires.
Epidiolex®and Sativex® and Epidiolex®are registered trademarks of GW Pharmaceuticals plc.
PRESENTATION OF FINANCIAL AND OTHER DATA
The consolidated financial statement data as at September 30, 20142016 and 20132015 and for the years ended September 30, 2014, 20132016, 2015 and 20122014 have been derived from our consolidated financial statements, as presented elsewhere in this Annual Report, which have been prepared in accordance with International Financial Reporting Standards, or IFRS, as issued by the International Accounting Standards Board, or IASB, and as adopted by the European Union and audited in accordance with the standards of the Public Company Accounting Oversight Board (United States). The consolidated financial statement data as at September 30, 20112014, 2013 and 2012 and for the yearyears ended September 30, 20102013 and 2012 have been derived from our consolidated financial statements, which are not presented herein, which have also been prepared in accordance with IFRS as issued by the IASB, and as adopted by the European Union and audited in accordance with the standards of the Public Company Accounting Oversight Board (United States).
The consolidated financial data as at September 30, 2010 has been derived, after certain reclassifications to conform to the current presentation, from our consolidated financial statements, which have been prepared in accordance with IFRS as adopted by the European Union, or IFRS-EU, and which are not included elsewhere in this Annual Report. These consolidated financial statements have not been audited in accordance with the standards of the Public Company Accounting Oversight Board (United States). There.There are no differences applicable to us between IFRS as issued by the IASB and IFRS-EU and PCAOB for any of the periods presented herein.
All references in this Annual Report to "$" are to U.S. dollars, all references to "£" are to pounds sterling and all references to "€" are to Euros. Solely for the convenience of the reader, unless otherwise indicated, all pounds sterling amounts as at and for the year ended September 30, 20142016 have been translated into U.S. dollars at the rate at September 30, 2014,2016, the last business day of our year ended September 30, 2014,2016, of £0.6166£0.7744 to $1.00 and unless otherwise indicated, all pounds sterling amounts as at and for the year ended September 30, 20132015 have been translated into U.S. dollars at the rate at September 30, 2013,2015, the last business day of our year ended September 30, 2013,2015, of £0.6181£0.6611 to $1.00. These translations should not be considered representations that any such amounts have been, could have been or could be converted into U.S. dollars at that or any other exchange rate as at that or any other date.
INFORMATION REGARDING FORWARD-LOOKING STATEMENTS
This Annual Report contains forward-looking statements that are based on our current expectations, assumptions, estimates and projections about us and our industry. All statements other than statements of historical fact in this Annual Report are forward-looking statements.
These forward-looking statements are subject to known and unknown risks, uncertainties, assumptions and other factors that could cause our actual results of operations, financial condition, liquidity, performance, prospects, opportunities, achievements or industry results, as well as those of the markets we serve or intend to serve, to differ materially from those expressed in, or suggested by, these forward-looking statements. These forward-looking statements are based on assumptions regarding our present and future business strategies and the environment in which we expect to operate in the future. Important factors that could cause those differences include, but are not limited to:
| 1 |
Additional factors that could cause actual results, financial condition, liquidity, performance, prospects, opportunities, achievements or industry results to differ materially include, but are not limited to, those discussed under “Risk Factors” or elsewhere in this Annual Report.Report on Form 20-F. Additional risks that we may currently deem immaterial or that are not presently known to us could also cause the forward-looking events discussed in this Annual Report on Form 20-F not to occur. The words “believe,” “may,” “will,” “estimate,” “continue,” “anticipate,” “intend,” “expect” and similar words are intended to identify estimates and forward-looking statements. Estimates and forward-looking statements speak only at the date they were made, and we undertake no obligation to update or to review any estimate and/or forward-looking statement because of new information, future events or other factors. Estimates and forward-looking statements involve risks and uncertainties and are not guarantees of future performance. Our future results may differ materially from those expressed in these estimates and forward-looking statements. In light of the risks and uncertainties described above, the estimates and forward-looking statements discussed in this Annual Report on Form 20-F might not occur and our future results and our performance may differ materially from those expressed in these forward-looking statements due to, inclusive of, but not limited to, the factors mentioned above. Because of these uncertainties, you should not make any investment decision based on these estimates and forward-looking statements.
| 2 |
NOTE REGARDING EXPANDED ACCESS STUDIES
ExpandedThe expanded access studies we are currently supporting are uncontrolled, carried out by individual physician investigators independent from GW,us, and not typicallyalways conducted in strict compliance with Good Clinical Practices, all of which can lead to aan observed treatment effect whichthat may differ from thatone seen in placebo-controlled trials. Data from these studies provide only anecdotal evidence of efficacy for regulatory review, although they may provide supportive safety information for regulatory review. These studies contain no control or comparator group for reference and are not designed to be aggregated or reported as study results. Moreover, data from such small numbers of patients may be highly variable. Such information, including the statistical principles that the independent investigators have chosen to apply to the data, may not reliably predict data collected viaresults achieved after systematic evaluation of the efficacy in company-sponsored clinical trials or evaluated via other statistical principles that may be applied in these trials. Reliance on such information may lead to Phase 2 andand/or Phase 3 clinical trials that are not adequately designed to demonstrate efficacy and could delay or prevent GW’sour ability to seek approval of Epidiolex. Expanded access programs may provide supportive safety information for regulatory review. Physicians conducting these studies may use Epidiolex in a manner inconsistent with the protocol,GW’s protocols, including in children with conditions different from those being studied in GW-sponsored trials. Any adverse events or reactions experienced by subjects in the expanded access program may be attributed to Epidiolex and may limit GW’sour ability to obtain regulatory approval with labeling that GW considerswe consider desirable, or at all.
| 3 |
| Item 1 | Identity of Directors, Senior Management and Advisers. |
Not Applicable.
| Item 2 | Offer Statistics and Expected Timetable. |
Not Applicable.
| Item 3 | Key Information. |
| A. | Selected Financial Data. |
The following table summarizes our consolidated financial data as at the dates and for the periods indicated. The consolidated financial statement data as at September 30, 20142016 and 20132015 and for the years ended September 30, 2014, 20132016, 2015 and 20122014 have been derived from our consolidated financial statements, as presented elsewhere in this Annual Report, which have been prepared in accordance with IFRS, as issued by the IASB, and as adopted by the European Union and audited in accordance with the standards of the Public Company Accounting Oversight Board (United States). The consolidated financial statement data as at September 30, 20112014, 2013 and 2012, and for the yearyears ended September 30, 2010 have2013 and 2012 has been derived, after certain reclassifications to conform to the current presentation, from our consolidated financial statements, which are not presented herein, which have also been prepared in accordance with IFRS as issued by the IASB, and as adopted by the European Union and audited in accordance with the standards of the Public Company Accounting Oversight Board (United States). The selected consolidated financial data as at September 30, 2010 has been derived, after certain reclassifications to conform to the current presentation, from our consolidated financial statements, which have been prepared in accordance with IFRS-EU, and which are not included elsewhere in this Annual Report. These consolidated financial statements have not been audited in accordance with the standards of the Public Company Accounting Oversight Board (United States). There are no differences applicable to us between IFRS as issued by the IASB and IFRS-EU and PCAOB for any of the periods presented herein.
Our consolidated financial statements are prepared and presented in pounds sterling, our presentation currency. Solely for the convenience of the reader our consolidated financial statements as at and for the year ended September 30, 20142016 have been translated into U.S. dollars at $1.00 = £0.6166£0.7744 based on the certified foreign exchange rates published by Federal Reserve Bank of New York on September 30, 2014.2016. Such convenience translation should not be construed as a representation that the pound sterling amounts have been or could be converted into U.S. dollars at this or at any other rate of exchange, or at all.
Our historical results are not necessarily indicative of the results that may be expected in the future. The following selected consolidated financial data should be read in conjunction with our audited consolidated financial statements included elsewhere in this Annual Report and the related notes and Item 5, “Operating and Financial Review and Prospects” below.
| Year Ended September 30, | Year Ended September 30, | |||||||||||||||||||||||||||||||||||||||||||||||
| 2014 | 2014(1) | 2013(1)(3) | 2012(1)(3) | 2011(1)(3) | 2010(2)(3) | 2016 | 2016(1) | 2015(1) | 2014(1) | 2013(1)(2) | 2012(1)(2) | |||||||||||||||||||||||||||||||||||||
| $ | £ | £ | £ | £ | £ | $ | £ | £ | £ | £ | £ | |||||||||||||||||||||||||||||||||||||
| (in thousands, except per share data) | (in thousands, except per share data) | |||||||||||||||||||||||||||||||||||||||||||||||
| Income Statement Data: | ||||||||||||||||||||||||||||||||||||||||||||||||
| Revenue | 48,730 | 30,045 | 27,295 | 33,120 | 29,627 | 30,676 | 13,320 | 10,315 | 28,540 | 30,045 | 27,295 | 33,120 | ||||||||||||||||||||||||||||||||||||
| Cost of sales | (3,341 | ) | (2,060 | ) | (1,276 | ) | (839 | ) | (1,347 | ) | (752 | ) | (3,511 | ) | (2,719 | ) | (2,618 | ) | (2,060 | ) | (1,276 | ) | (839 | ) | ||||||||||||||||||||||||
| Research and development expenditure | (70,512 | ) | (43,475 | ) | (32,697 | ) | (27,578 | ) | (22,714 | ) | (22,145 | ) | (128,889 | ) | (99,815 | ) | (76,785 | ) | (43,475 | ) | (32,697 | ) | (27,578 | ) | ||||||||||||||||||||||||
| Management and administrative expenses | (11,899 | ) | (7,337 | ) | (3,555 | ) | (3,620 | ) | (3,479 | ) | (3,267 | ) | ||||||||||||||||||||||||||||||||||||
| Sales, general and administrative expenses | (25,747 | ) | (19,939 | ) | (12,569 | ) | (7,337 | ) | (3,555 | ) | (3,620 | ) | ||||||||||||||||||||||||||||||||||||
| Net foreign exchange gains/(losses) | 5,170 | 3,188 | (237 | ) | (40 | ) | 181 | - | 32,993 | 25,551 | 6,202 | 3,188 | (237 | ) | (40 | ) | ||||||||||||||||||||||||||||||||
| Operating (loss)/profit | (31,852 | ) | (19,639 | ) | (10,470 | ) | 1,043 | 2,268 | 4,512 | (111,834 | ) | (86,607 | ) | (57,230 | ) | (19,639 | ) | (10,470 | ) | 1,043 | ||||||||||||||||||||||||||||
| Interest expense | (99 | ) | (61 | ) | (64 | ) | (1 | ) | (3 | ) | (8 | ) | (223 | ) | (173 | ) | (75 | ) | (61 | ) | (64 | ) | (1 | ) | ||||||||||||||||||||||||
| Interest income | 210 | 130 | 178 | 200 | 263 | 100 | ||||||||||||||||||||||||||||||||||||||||||
| Other income | 785 | 608 | 244 | 130 | 178 | 200 | ||||||||||||||||||||||||||||||||||||||||||
| (Loss)/profit before tax | (31,741 | ) | (19,570 | ) | (10,356 | ) | 1,242 | 2,528 | 4,604 | (111,272 | ) | (86,172 | ) | (57,061 | ) | (19,570 | ) | (10,356 | ) | 1,242 | ||||||||||||||||||||||||||||
| Tax | 7,965 | 4,911 | 5,807 | 1,248 | 221 | 37 | ||||||||||||||||||||||||||||||||||||||||||
| Tax benefit | 29,073 | 22,515 | 12,498 | 4,911 | 5,807 | 1,248 | ||||||||||||||||||||||||||||||||||||||||||
| (Loss)/profit for the year | (23,776 | ) | (14,659 | ) | (4,549 | ) | 2,490 | 2,749 | 4,641 | (82,199 | ) | (63,657 | ) | (44,563 | ) | (14,659 | ) | (4,549 | ) | 2,490 | ||||||||||||||||||||||||||||
| (Loss)/earnings per share | ||||||||||||||||||||||||||||||||||||||||||||||||
| Basic | (0.11 | ) | (0.07 | ) | (0.03 | ) | 0.02 | 0.02 | 0.04 | (0.30 | ) | (0.24 | ) | (0.18 | ) | (0.07 | ) | (0.03 | ) | 0.02 | ||||||||||||||||||||||||||||
| Diluted | (0.11 | ) | (0.07 | ) | (0.03 | ) | 0.02 | 0.02 | 0.03 | (0.30 | ) | (0.24 | ) | (0.18 | ) | (0.07 | ) | (0.03 | ) | 0.02 | ||||||||||||||||||||||||||||
| Weighted average number of shares | ||||||||||||||||||||||||||||||||||||||||||||||||
| Basic | 210.4 | 210.4 | 151.5 | 133.0 | 131.7 | 129.7 | 270.4 | 270.4 | 246.4 | 210.4 | 151.5 | 133.0 | ||||||||||||||||||||||||||||||||||||
| Diluted | 219.9 | 219.9 | 158.2 | 137.5 | 135.8 | 133.2 | 277.5 | 277.5 | 254.2 | 219.9 | 158.2 | 137.5 | ||||||||||||||||||||||||||||||||||||
| As at September 30, | ||||||||||||||||||||||||
| 2014 | 2014(1) | 2013(1)(4) | 2012(1) | 2011(1) | 2010(2) | |||||||||||||||||||
| $ | £ | £ | £ | £ | £ | |||||||||||||||||||
| (in thousands) | ||||||||||||||||||||||||
| Balance Sheet Data: | ||||||||||||||||||||||||
| Non-current assets | 27,776 | 17,126 | 11,581 | 7,642 | 7,078 | 6,776 | ||||||||||||||||||
| Current assets | ||||||||||||||||||||||||
| Inventories | 7,748 | 4,777 | 4,661 | 3,537 | 1,424 | 780 | ||||||||||||||||||
| Trade and other receivables | 11,528 | 7,108 | 4,633 | 2,408 | 2,281 | 1,217 | ||||||||||||||||||
| Cash and cash equivalents | 266,788 | 164,491 | 38,069 | 29,335 | 28,319 | 25,219 | ||||||||||||||||||
| Total current assets | 286,065 | 176,376 | 47,363 | 35,280 | 32,024 | 27,216 | ||||||||||||||||||
| Total assets | 313,841 | 193,502 | 58,944 | 42,922 | 39,102 | 33,992 | ||||||||||||||||||
| Current liabilities | ||||||||||||||||||||||||
| Trade and other payables | (20,073 | ) | (12,376 | ) | (9,440 | ) | (9,114 | ) | (6,562 | ) | (4,554 | ) | ||||||||||||
| Deferred revenue | (7,829 | ) | (4,827 | ) | (3,181 | ) | (2,449 | ) | (3,459 | ) | (5,120 | ) | ||||||||||||
| Non-current liabilities | ||||||||||||||||||||||||
| Trade and other payables | (12,857 | ) | (7,927 | ) | — | — | — | — | ||||||||||||||||
| Obligations under finance leases | (2,889 | ) | (1,781 | ) | (1,905 | ) | — | — | (6 | ) | ||||||||||||||
| Deferred revenue | (12,782 | ) | (7,881 | ) | (8,916 | ) | (10,127 | ) | (11,422 | ) | (11,599 | ) | ||||||||||||
| Share capital | 384 | 237 | 178 | 133 | 133 | 131 | ||||||||||||||||||
| Share premium | 357,712 | 220,551 | 84,005 | 65,947 | 65,866 | 64,433 | ||||||||||||||||||
| Net assets/Total equity | 257,207 | 158,584 | 35,402 | 21,232 | 17,652 | 12,673 | ||||||||||||||||||
| 4 |
| Year Ended September 30, | ||||||||||||||||||||||||
| 2014 | 2014(1) | 2013(1) | 2012(1) | 2011(1) | 2010(2) | |||||||||||||||||||
| $ | £ | £ | £ | £ | £ | |||||||||||||||||||
| (in thousands) | ||||||||||||||||||||||||
| Cash Flow Data: | ||||||||||||||||||||||||
| Net cash inflow/(outflow) from operating activities | (20,479 | ) | (12,626 | ) | (7,468 | ) | 1,801 | 2,361 | 4,324 | |||||||||||||||
| Net cash (outflow)/inflow from investing activities | (11,507 | ) | (7,095 | ) | (2,076 | ) | (1,060 | ) | (647 | ) | (334 | ) | ||||||||||||
| Net cash inflow from financing activities | 233,988 | 144,267 | 18,253 | 73 | 1,393 | 620 | ||||||||||||||||||
| As at September 30, | ||||||||||||||||||||||||
| 2016 | 2016(1) | 2015(1) | 2014(1)(3) | 2013(1) | 2012(1) | |||||||||||||||||||
| $ | £ | £ | £ | £ | £ | |||||||||||||||||||
| (in thousands) | ||||||||||||||||||||||||
| Balance Sheet Data: | ||||||||||||||||||||||||
| Non-current assets | 62,832 | 48,659 | 34,606 | 17,126 | 11,581 | 7,642 | ||||||||||||||||||
| Current assets | ||||||||||||||||||||||||
| Inventories | 5,485 | 4,248 | 4,756 | 4,777 | 4,661 | 3,537 | ||||||||||||||||||
| Trade and other receivables | 33,416 | 25,878 | 15,514 | 7,108 | 4,633 | 2,408 | ||||||||||||||||||
| Cash and cash equivalents | 483,445 | 374,392 | 234,872 | 164,491 | 38,069 | 29,335 | ||||||||||||||||||
| Total current assets | 522,346 | 404,518 | 255,142 | 176,376 | 47,363 | 35,280 | ||||||||||||||||||
| Total assets | 585,178 | 453,177 | 289,748 | 193,502 | 58,944 | 42,922 | ||||||||||||||||||
| Current liabilities | ||||||||||||||||||||||||
| Trade and other payables | (40,249 | ) | (31,170 | ) | (24,022 | ) | (12,376 | ) | (9,440 | ) | (9,114 | ) | ||||||||||||
| Current tax liabilities | (1,140 | ) | (883 | ) | (366 | ) | - | - | - | |||||||||||||||
| Obligations under finance leases | (272 | ) | (211 | ) | (111 | ) | (126 | ) | (100 | - | ||||||||||||||
| Deferred revenue | (3,468 | ) | (2,686 | ) | (3,269 | ) | (4,827 | ) | (3,181 | ) | (2,449 | ) | ||||||||||||
| Non-current liabilities | ||||||||||||||||||||||||
| Trade and other payables | (12,168 | ) | (9,423 | ) | (8,445 | ) | (7,927 | ) | - | - | ||||||||||||||
| Obligations under finance leases | (6,403 | ) | (4,959 | ) | (1,540 | ) | (1,781 | ) | (1,905 | ) | - | |||||||||||||
| Deferred revenue | (6,915 | ) | (5,355 | ) | (6,725 | ) | (7,881 | ) | (8,916 | ) | (10,127 | ) | ||||||||||||
| Share capital | 390 | 302 | 261 | 237 | 178 | 133 | ||||||||||||||||||
| Share premium | 718,568 | 556,477 | 349,275 | 220,551 | 84,005 | 65,947 | ||||||||||||||||||
| Net assets/Total equity | 514,563 | 398,490 | 245,270 | 158,584 | 35,402 | 21,232 | ||||||||||||||||||
| Year Ended September 30, | ||||||||||||||||||||||||
| 2016 | 2016(1) | 2015(1) | 2014(1) | 2013(1) | 2012(1) | |||||||||||||||||||
| $ | £ | £ | £ | £ | £ | |||||||||||||||||||
| (in thousands) | ||||||||||||||||||||||||
| Cash Flow Data: | ||||||||||||||||||||||||
| Net cash (outflow)/inflow from operating activities | (109,234 | ) | (84,594 | ) | (46,471 | ) | (12,626 | ) | (7,468 | ) | 1,801 | |||||||||||||
| Net cash outflow from investing activities | (11,307 | ) | (8,756 | ) | (17,791 | ) | (7,095 | ) | (2,076 | ) | (1,060 | ) | ||||||||||||
| Net cash inflow from financing activities | 267,045 | 206,807 | 128,419 | 144,267 | 18,253 | 73 | ||||||||||||||||||
| (1) | The selected historical consolidated financial data as at September 30, |
| 5 |
| (2) | The selected historical consolidated financial data as at September 30, |
| The selected historical consolidated financial data as at September 30, |
Exchange rate information
The table below shows the period end, average, high and low exchange rates of U.S. dollars per pound sterling for the periods shown. Average rates are computed by using the noon buying rate of the Federal Reserve Bank of New York for the U.S. dollar on the last business day of each month during the relevant year indicated or each business day during the relevant month indicated. The rates set forth below are provided solely for your convenience and may differ from the actual rates used in the preparation of our consolidated financial statements included in this Annual Report.
| Noon Buying Rate | ||||||||||||||||
| Period End | Average(1) | High | Low | |||||||||||||
| Year ended September 30: | ||||||||||||||||
| 2010 | 1.5731 | 1.5587 | 1.6795 | 1.4344 | ||||||||||||
| 2011 | 1.5624 | 1.6073 | 1.6691 | 1.5358 | ||||||||||||
| 2012 | 1.6132 | 1.5839 | 1.6263 | 1.5301 | ||||||||||||
| 2013 | 1.6179 | 1.5617 | 1.6275 | 1.4837 | ||||||||||||
| 2014 | 1.6220 | 1.6570 | 1.7165 | 1.5904 | ||||||||||||
| Month: | ||||||||||||||||
| May 2014 | 1.6764 | 1.6824 | 1.6709 | 1.6976 | ||||||||||||
| June 2014 | 1.7105 | 1.6908 | 1.6747 | 1.7105 | ||||||||||||
| July 2014 | 1.6889 | 1.7066 | 1.6889 | 1.7165 | ||||||||||||
| August 2014 | 1.6585 | 1.6700 | 1.6570 | 1.6874 | ||||||||||||
| September 2014 | 1.6220 | 1.6290 | 1.6088 | 1.6502 | ||||||||||||
| October 2014 | 1.5999 | 1.6074 | 1.5930 | 1.6216 | ||||||||||||
| November 2014 | 1.5638 | 1.5771 | 1.5991 | 1.5638 | ||||||||||||
| Noon Buying Rate | ||||||||||||||||
| Period End | Average(1) | High | Low | |||||||||||||
| Year ended September 30: | ||||||||||||||||
| 2011 | 1.5624 | 1.6064 | 1.6691 | 1.5358 | ||||||||||||
| 2012 | 1.6132 | 1.5768 | 1.6263 | 1.5301 | ||||||||||||
| 2013 | 1.6179 | 1.5609 | 1.6275 | 1.4837 | ||||||||||||
| 2014 | 1.6220 | 1.6570 | 1.7165 | 1.5904 | ||||||||||||
| 2015 | 1.5116 | 1.5447 | 1.6216 | 1.4648 | ||||||||||||
| 2016 | 1.3015 | 1.4228 | 1.5475 | 1.2874 | ||||||||||||
| Month: | ||||||||||||||||
| May 2016 | 1.4530 | 1.4524 | 1.4694 | 1.4369 | ||||||||||||
| June 2016 | 1.3242 | 1.4197 | 1.4800 | 1.3217 | ||||||||||||
| July 2016 | 1.3270 | 1.3134 | 1.3332 | 1.2921 | ||||||||||||
| August 2016 | 1.3129 | 1.3101 | 1.3335 | 1.2874 | ||||||||||||
| September 2016 | 1.3015 | 1.3140 | 1.3429 | 1.2959 | ||||||||||||
| October 2016 | 1.2212 | 1.2330 | 1.2840 | 1.2155 | ||||||||||||
| November 2016 (through November 25, 2016) | 1.2462 | 1.2426 | 1.2546 | 1.2218 | ||||||||||||
___________________________
| (1) | The average of the noon buying rate for pounds sterling on the last day of each full month during the relevant year or each business day during the relevant month indicated. |
| B. | Capitalization and Indebtedness. |
Not Applicable.
| C. | Reasons for the Offer and Use of Proceeds. |
Not Applicable.
| 6 |
| D. | Risk Factors. |
Our business has significant risks. You should carefully consider the following risk factors and all other information contained in this Annual Report, including our consolidated financial statements and the related notes. The risks and uncertainties described below are those significant risk factors, currently known and specific to us that we believe are relevant to our business, results of operations and financial condition. Additional risks and uncertainties not currently known to us or that we now deem immaterial may also impair our business, results of operations and financial condition.
Risks Related to Our Business
We are substantially dependent on the success of our only commercial product Sativex.
Our future success will depend heavily on the continued successful commercialization of Sativex, which is now in the early stages of its commercial life. Although Sativex is currently approved in 27 countries outside of the United States for spasticity due to multiple sclerosis, or MS, and is sold in 15 of those countries, it may never be successfully commercialized in all of these jurisdictions. Sativex’s commercial success depends on a number of factors beyond our control, including the willingness of physicians to prescribe Sativex to patients, payers’ willingness and ability to pay for the drug, the level of pricing achieved, patients’ response to Sativex and the ability of our marketing partners to generate sales. Accordingly, we cannot assure you that we will succeed in generating revenue growth through the commercialization of Sativex for MS spasticity. If we are not successful in the continued commercialization of Sativex, our business, results of operations and financial condition will be materially harmed.
We are dependent on the success of our product candidates, including Sativex for cancer pain, none of which may receive regulatory approval or be successfully commercialized.commercialized.
Our success will depend on our ability to successfully commercialize our product pipeline, including commercialization of Sativex for cancer pain, currently in Phase 3 trials,Epidiolex and our other cannabinoid product candidates for type-2 diabetes, ulcerative colitis, cancer, epilepsy and schizophrenia.candidates. We are evaluating Sativex in Phase 3 trialsEpidiolex for the treatment of cancer pain in the United StatesDravet syndrome, LGS and it may never receive U.S. regulatory approval. We have applied for Special Protocol Assessment, or SPA, to the U.S. Food and Drug Administration, or FDA, regarding the proposed pivotal trial for Sativex for MS spasticityTSC in the United States and have opened an Investigational New Drug Application, or IND, with the FDA for this indication. We have not yet reached agreement with the FDA on theinitiated Phase 3 protocol. We may not be able to reach a satisfactory conclusion to the SPA process and wetrials for these indications. Nevertheless, Epidiolex may never receive U.S. regulatory approval for this indication.the treatment of any of these indications. Even if completed Phase 3 clinical trials and/or Phase 3 clinical trials conducted for U.S. approval show positive results, there can be no assurance that the FDA will approve SativexEpidiolex or any other product candidate for any given indication for several potential reasons, including failure to follow Good Clinical Practice, or GCP, negative assessment of risk:risk to benefit, unacceptable risk of abuse or diversion, insufficient product quality control and standardization, non-GMP compliant manufacturing facilities unreliable dose counter, and in the absence of a protocol agreed through the FDA’s Special Protocol Assessment process, refusal by FDA to accept our clinical trial design/or failure to agree on appropriate clinical endpoints. For example, discussions with the FDA about its recommended primary endpoints for a pivotal study in MS spasticity are expected to lead to use of the Modified Ashworth Scale (MAS) and the Physician Global Impression of Change (PGIC) rather than the primary endpoints we used in our previous Phase 3 studies. In those studies, we demonstrated statistical improvements on the PGIC and approached statistical significance on the MAS. The new proposed study is powered to detect a statistical difference on both endpoints.
Our ability to successfully commercialize Epidiolex, if approved, Sativex and our other product candidates will depend on, among other things, our ability to:
Our failure or delay with respect to any of the factors above could have a material adverse effect on our business, results of operations and financial condition.
| 7 |
Our product candidates, if approved, may be unable to achieve the expected market acceptance and, consequently, limit our ability to generate revenue from new products.products.
Even when product development is successful and regulatory approval has been obtained, our ability to generate significant revenue depends on the acceptance of our products by physicians and patients. Although Sativex is already known in certain markets for the treatment of MS spasticity, weWe cannot assure you that itEpidiolex or our other planned productsproduct candidates will achieve the expected market acceptance and revenue if and when they obtain the requisite regulatory approvals. The market acceptance of any product depends on a number of factors, including the indication statement and warnings approved by regulatory authorities in the product label, continued demonstration of efficacy and safety in commercial use, physicians'physicians’ willingness to prescribe the product, reimbursement from third-party payers such as government health care systems and insurance companies, the price of the product, the nature of any post-approval risk management plans mandated by regulatory authorities, competition, and marketing and distribution support. Any factors preventing or limiting the market acceptance of our products could have a material adverse effect on our business, results of operations and financial condition.
In respect of our product candidates targeting orphanrare indications, orphan drug exclusivity may afford limited protection, and if another party obtains orphan drug exclusivity for the drugs and indications we are targeting, we may be precluded from commercializing our product candidates in those indications during that period of exclusivity.exclusivity.
The first New Drug Application, (NDA)or NDA, applicant with an orphan drug designationOrphan Drug Designation for a particular active moiety to treat a specific disease or condition that receives FDA approval is entitled to a seven-year exclusive marketing period in the U.S.United States for that product, for that indication. There is no assurance that we will successfully obtain orphan drug designationOrphan Drug Designation for future rare indications or orphan exclusivity upon approval of any of our product candidates that have already obtained designation.Orphan Drug Designation. Even if we do obtain orphan exclusivity for any product candidate, the exclusive marketing rights may be lost if the FDA later determines that the request for designation was materially defective or if the manufacturer is unable to assure sufficient quantity of the drug. Moreover, a drug product with an active moiety that is a different cannabinoid from that in our drug candidate or, under limited circumstances, the same drug product, may be approved by the FDA for the same indication during the period of marketing exclusivity. The limited circumstances include a showing that the second drug is clinically superior to the drug with marketing exclusivity through a demonstration of superior safety or efficacy or that it makes a major contribution to patient care. In addition, if a competitor obtains approval and marketing exclusivity for a drug product with an active moiety that is the same as that in a product candidate we are pursuing for the same indication, approval of our product candidate would be blocked during the period of marketing exclusivity unless we could demonstrate that our product candidate is clinically superior to the approved product. In addition, if a competitor obtains approval and marketing exclusivity for a drug product with an active moiety that is the same as that in a product candidate we are pursuing for a different orphan indication, this may negatively impact the market opportunity for our product candidate. In responseThere have been legal challenges to a recent court decision regarding the plain meaningaspects of the FDA’s regulations and policies concerning the exclusivity provisionprovisions of the Orphan Drug Act, and future challenges could lead to changes that affect the protections afforded our products in ways that are difficult to predict. In a recent successful legal challenge, a court invalidated the FDA’s denial of orphan exclusivity to a drug on the grounds that the drug was not proven to be clinically superior to a previously approved product containing the same ingredient for the same orphan use. In response to the decision, the FDA may undertakereleased a reevaluationpolicy statement stating that the court’s decision is limited just to the facts of aspectsthat particular case and that the FDA will continue to require the sponsor of a designated drug that is the “same” as a previously approved drug to demonstrate that its drug is clinically superior to that drug upon approval in order to be eligible for orphan drug regulations and policies. We do not know if, when,exclusivity, or howin some cases, to even be eligible for marketing approval. In the FDA may changefuture, there is the potential for additional legal challenges to the FDA’s orphan drug regulations and policies, and it is uncertain how any changessuch challenges might affect our business. Depending on what changes
In the FDA may make to itsEuropean Union, if a marketing authorization is granted for a medicinal product that is designated an orphan drug, regulationsthat product is entitled to ten years of marketing exclusivity. During the period of marketing exclusivity, no similar medicinal product may be granted a marketing authorization for the orphan indication. There is no assurance that we will successfully obtain Orphan Drug Designation for future rare indications or orphan exclusivity upon approval of any of our product candidates that have already obtained designation. Even if we obtain orphan exclusivity for any product candidate, the exclusivity period can be reduced to six years if at the end of the fifth year it is established that the orphan designation criteria are no longer met or if it is demonstrated that the orphan drug is sufficiently profitable that market exclusivity is no longer justified. Further, a similar medicinal product may be granted a marketing authorization for the same indication notwithstanding our marketing exclusivity if we are unable to supply sufficient quantities of our product, or if the second product is safer, more effective or otherwise clinically superior to our orphan drug. In addition, if a competitor such as Insys Therapeutics Inc. obtains marketing authorization and policies,orphan exclusivity for a product that is similar to a product candidate we are pursuing for the same indication, approval of our product candidate would be blocked during the period of orphan marketing exclusivity unless we could demonstrate that our product candidate is safer, more effective or otherwise clinically superior to the approved product.
We have to date commercialized only one product, Sativex.
Our only approved product, Sativex is currently being commercialized for spasticity due to multiple sclerosis, or MS, outside the United States. Even if we obtain regulatory approval for a product other than Sativex, our future success will still depend in part on the continued successful commercialization of Sativex. Although Sativex is currently approved in 30 countries outside of the United States for MS spasticity, and is sold in 16 of those countries, it may never be successfully commercialized in all of these jurisdictions. The commercial success of Sativex for MS spasticity depends on a number of factors beyond our control, including the willingness of physicians to prescribe Sativex to patients, payers’ willingness and ability to pay for the drug, the level of pricing achieved, patients’ response to Sativex, the ability of our marketing partners to generate sales and, given that we generate revenue from the supply of Sativex to our partners at a fixed percentage of partners’ net sales and that any increase in our manufacturing costs will adversely affect our margins and our financial condition, our ability to manufacture Sativex on a cost effective and efficient basis. Accordingly, we cannot assure you that we will succeed in generating revenue growth through the commercialization of Sativex for MS spasticity. If we are not successful in the continued commercialization of Sativex for MS spasticity, our business, couldresults of operations and financial condition may be harmed.
| 8 |
We expect to face intense competition, often from companies with greater resources and experience than we have.have.
The pharmaceutical industry is highly competitive and subject to rapid change. The industry continues to expand and evolve as an increasing number of competitors and potential competitors enter the market. Many of these competitors and potential competitors have substantially greater financial, technological, managerial and research and development resources and experience than we have. Some of these competitors and potential competitors have more experience than we have in the development of pharmaceutical products, including validation procedures and regulatory matters. In addition, Sativex competes with, and our other therapeutics,product candidates, if successfully developed, will compete with, product offerings from large and well-established companies that have greater marketing and sales experience and capabilities than we or our collaboration partners have. In particular, Insys Therapeutics, Inc. has publicly stated its intention to develop cannabidiol (CBD) in Dravet syndrome, Lennox-Gastaut syndrome (LGS),LGS, Infantile Spasms, glioma and potentially other orphan indications,indications. Zogenix, Inc. is developing low dose fenfluramine in Dravet syndrome and has commenced an open-label study with this product in LGS, and other companies with greater resources than us may announce similar plans in the future. In addition, there are non-FDA approved CBD preparations being made available from companies in the medical marijuana industry, which may be competitive to Epidiolex. If we are unable to compete successfully, our commercial opportunities will be reduced and our business, results of operations and financial conditions may be materially harmed.
Product shipment delays could have a material adverse effect on our business, results of operations and financial condition.condition.
The shipment, import and export of Epidiolex, Sativex and our other product candidates require import and export licenses. In the United States, the FDA, U.S. Customs and Border Protection, and the Drug Enforcement Administration, or DEA, and in the United Kingdom, the Home Office, and in other countries, similar regulatory authorities regulate the import and export of pharmaceutical products that contain controlled substances, including Sativex, Epidiolex and our other product candidates. Specifically, the import and export process requires the issuance of import and export licenses by the relevant controlled substance authority in both the importing and exporting country. We may not be granted, or if granted, maintain, such licenses from the authorities in certain countries. Even if we obtain the relevant licenses, shipments of Sativex, Epidiolex and our product candidates may be held up in transit, which could cause significant delays and may lead to product batches being stored outside required temperature ranges. Inappropriate storage may damage the product shipment resulting in a partial or total loss of revenue from one or more shipment of Sativex, Epidiolex or our other product candidates. A partial or total loss of revenue from one or more shipmentshipments of Sativex, Epidiolex or our other product candidates could have a material adverse effect on our business, results of operations and financial condition.
If the price for Sativex or any future approved products decreases or if governmental and other third-party payers do not provide adequate coverage and reimbursement levels, our revenue and prospects for profitability will suffer.suffer.
Reimbursement systems in international markets vary significantly by country and by region, and reimbursement approvals generally must be obtained on a country-by-country basis. Our partnersWhere we have chosen to collaborate with a third party on product candidate development and commercialization, our partner may elect to reduce the price of our products in order to increase the likelihood of obtaining reimbursement approvals. In many countries, products cannot be commercially launched until reimbursement is approved and the negotiation process in some countries can exceed 12 months. In addition, pricing and reimbursement decisions in certain countries can be affected by decisions taken in other countries, which can lead to mandatory price reductions and/or additional reimbursement restrictions across a number of other countries, which may thereby adversely affect our sales and profitability. In the event that countries impose prices whichthat are not sufficient to allow us or our partners to generate a profit, our partners may refuse to launch the product in such countries or withdraw the product from the market, which would adversely affect sales and profitability. For example, in Germany, a revised price has caused us to initiate the renegotiation of supply terms with our partner, Almirall, in order to maintain a level of profitability of our sales of Sativex in Germany. In addition, to date, the Australian reimbursement authorities have not agreed to grant public reimbursement for Sativex in the MS spasticity indication. As a result, our partner, Novartis, has not yet launched commercialization of Sativex in Australia and the other countries in its territory and we have amended our agreement with Novartis in order to permit Novartis not to make a decision about launching Sativex in any country in its territory until final data for the two Phase 3 clinical trials we are conducting for Sativex for cancer pain is available. More recently, whereas the All Wales Medicines Strategy Group has recommended Sativex for use in MS spasticity in Wales, the National Institute for Clinical Excellence published MS treatment guidelines which did not recommend Sativex for use in England. FutureWhile this example refers to the commercialization of Sativex, the same or similar events, such as price decreases, government mandated rebates or unfavorable reimbursement decisions, could affect the pricing and reimbursement of Epidiolex and our other product candidates and could have a material adverse effect on our business, results of operations and financial condition.
| 9 |
Problems in our manufacturing process, failure to comply with manufacturing regulations or unexpected increases in our manufacturing costs could harm our business, results of operations and financial condition.condition.
We are responsible for the manufacture and supply of Sativex to our collaboration partners and for the manufacture and supply of Sativex, Epidiolex and other product candidates for use in clinical trials. The manufacturing of Sativex and our product candidates necessitates compliance with international Good Manufacturing Practice, or GMP, and other international regulatory requirements.requirements in jurisdictions internationally. Our ability to successfully manufacture Sativex, Epidiolex and other product candidates involves cultivation of botanical raw material from specific cannabinoid plants, extraction and purification processes, manufacture of finished products and labeling and packaging, which includes product information, tamper evidence and anti-counterfeit features.features, under tightly controlled processes and procedures. For Sativex and certain of our product candidates, production also requires the cultivation of cannabinoid plants under highly controlled and standardized conditions. Our ability to successfully manufacture Epidiolex and other product candidates requires similar tight controls and processes. In addition, we must ensure therapeuticchemical consistency among our batches, including clinical batches and, if approved, marketing batches. Demonstrating such consistency may require typical manufacturing controls as well as clinical data. We must also ensure that our batches conform to complex release specifications. For each step in the manufacturing process for Sativex, and our product candidates, we are currently reliant on single manufacturing facilities and no backupback-up facilities are yet in place. We have a second site at which we can grow the specific cannabinoid plants which produce the CBD used in Epidiolex, but we are currently reliant on a single manufacturing facility, and no back-up facilities are yet in place, for the later steps in the Epidiolex production process. Because Sativex is a complex mixture manufactured from plant materials, and because the release specifications may not be identical in all countries, certain batches may fail release testing and not be able to be commercialized. A number of our product candidates (excluding Epidiolex) also consist of a complex mixture manufactured from plant materials, and are therefore subject to a similar risk. If we are unable to manufacture Sativex, Epidiolex or other product candidates in accordance with regulatory specifications, including good manufacturing practices or if there are disruptions in our manufacturing process due to damage, loss or otherwise, or failure to pass regulatory inspections of our manufacturing facilities, we may not be able to meet current demand or supply sufficient product for use in clinical trials, and this may also harm our ability to commercialize Sativex, Epidiolex and our product candidates on a timely or cost-competitive basis, if at all. We are in the process of expanding and upgrading parts of our growing and manufacturing facilities and are working with a number of contract manufacturing partners in order to be able to submit an NDA for Epidiolex which includes a sufficient number of growing and manufacturing sites that would provide sufficient quantities to meet futureinitial demand, and FDAto meet FDA’s stringent requirements for demonstrating equivalence of the scaled up manufacturing process, a program which requires significant time and resources.resources and which may not be successful. We are also planning a significant expansion of our growing facilities over the next few years in order to meet potential peak demand for Epidiolex, including working with several new contractors and adopting new methods in order to handle and process bulk quantities of botanical raw material. We are planning to increase the scale in which we manufacture Epidiolex over the next few years in order to meet potential peak demand for Epidiolex, including working with several new contractors and, potentially, adopting new processes. These activities may be unsuccessful, may lead to delays, interruptions to supply, or may prove to be more costly than anticipated. We may fail to expand our growing and manufacturing capability in time to meet market demand for our products and product candidates. Any problems in our growing or manufacturing process could have a material adverse effect on our business, results of operations and financial condition.
In addition, under the Sativex license agreements, we generate revenue from the supply of commercial product to our partners at a fixed percentage of partners’ net sales, and hence any increases in our manufacturing costs will adversely affect our margins and our financial condition.
In addition, before we can begin commercial manufacture of Sativex and any other product candidates for sale in the United States, we must obtain FDA regulatory approval for the product, which requires a successful FDA inspection of our manufacturing facilities and those of our contract manufacturing partners, processes and quality systems in addition to other product-related approvals. Further, pharmaceutical manufacturing facilities are continuously subject to inspection by the FDA and foreign regulatory authorities, before and after product approval. Due to the complexity of the processes used to manufacture Sativex and our product candidates, we may be unable to initially or continue to pass federal, state or international regulatory inspections in a cost effective manner. If we are unable to comply with manufacturing regulations, we may be subject to fines, unanticipated compliance expenses, recall or seizure of any approved products, total or partial suspension of production and/or enforcement actions, including injunctions, and criminal or civil prosecution. These possible sanctions would adversely affect our business, results of operations and financial condition.
Further, the processes we use for cultivation of botanical raw material and the production of product candidates for use in clinical trials may be different fromto the processes we use to produce commercial productsproduct and/or may not be capable of producing sufficient quantities of product for commercial purposes. We may therefore need to undertake additional manufacturing process development and scale-up activities before we can commercialize a product candidate.product. This may include the conduct of bioequivalence studies to demonstrate that product produced by the process used to manufacture on a commercial scale is the same as the material used in clinical trials. If we cannot demonstrate that our commercial scale product is the same as material used in our clinical trials, we may not be permitted to sell that product, which could have a material adverse effectan impact on our business, results of operations and financial condition.
Product recalls or inventory losses caused by unforeseen events, cold chain interruption and testing difficulties may adversely affect our operating results and financial condition.
Sativex and our product candidates are manufactured and distributed using technically complex processes requiring specialized facilities, highly specific raw materials and other production constraints. The complexity of these processes, as well as strict company and government standards for the manufacture of our products, subjects us to production risks. For example, during the manufacturing process we have from time to time experienced defects in components which have caused vial sealing faults, resulting in vial leakage, pump dispenser faults which have resulted in under-filling of vials and misalignment of labels and tamper evident seals, as well as receipt of faulty electronic dose counters from our supplier. While product batches released for use in clinical trials or for commercialization undergo sample testing, some defects may only be identified following product release. In addition, process deviations or unanticipated effects of approved process changes may result in these intermediate products not complying with stability requirements or specifications. MostSome of our products must be stored and transported at temperatures within a certain range, which is known as "strict“strict cold chain"chain” storage and transportation. If these environmental conditions deviate, our products'products’ remaining shelf-lives could be impaired or their efficacy and safety could become adversely affected, making them no longer suitable for use. The occurrence or suspected occurrence of production and distribution difficulties can lead to lost inventories, and in some cases product recalls, with consequential reputational damage and the risk of product liability. The investigation and remediation of any identified problems can cause production delays, substantial expense, lost sales and delays of new product launches.
| 10 |
Sativex and our product candidates contain controlled substances, the use of which may generate public controversy.
Since Sativex, Epidiolex and our other product candidates contain controlled substances, their regulatory approval may generate public controversy. Political and social pressures and adverse publicity could lead to delays in approval of, and increased expenses for, Sativex and our product candidates. These pressures could also limit or restrict the introduction and marketing of Sativex and our product candidates. Adverse publicity from cannabis misuse or adverse side effects from cannabis or other cannabinoid products may adversely affect the commercial success or market penetration achievable by Sativex and our product candidates. The nature of our business attracts a high level of public and media interest, and in the event of any resultant adverse publicity, our reputation may be harmed.
Business interruptions could delay us in the process of developing our product candidates and could disrupt our product sales.
Loss of our manufacturing facilities, our growing plants, stored inventory or laboratory facilities through fire, theft or other causes, or loss of our botanical raw material due to pathogenic infection or other causes, could have an adverse effect on our ability to meet demand for Sativex, to continue product development activities and to conduct our business. Failure to supply our partners with commercial product may lead to adverse consequences, including the right of partners to take over responsibility for product supply. We currently have insurance coverage to compensate us for such business interruptions; however, such coverage may prove insufficient to fully compensate us for the damage to our business resulting from any significant property or casualty loss to our inventory or facilities.
We have significant and increasing liquidity needs and may require additional funding.funding.
Our operations have consumed substantial amounts of cash since inception. Excluding receipts from milestone fees, our cash flow used for operating activities and capital expenditure, forFor the yearsyear ended September 30, 2014 and September 30, 2013 was £19.92015, we reported a net operating cash outflow of £46.5 million and £9.7 million, respectively. In 2015, we expect oura net cash outflow usedfrom investing activities of £17.8 million. For the year ended September 30, 2016, we reported a net operating cash outflow of £84.6 million and a net cash outflow from investing activities of £8.8 million.
Looking forward, for the year ended September 30, 2017 we expect an operating cash outflow in the range of £77-93 million ($100-120 million) and we expect a cash outflow of £23 million ($30 million) from investing activities to increase to £50.0 million as we aim to progress four Epidiolex Dravet and Lennox Gastaut phase 3 trials towards completioninvest in early 2016,further scale up our Epidiolex growing and manufacturing activities to supply near-term demand and increase spend on US commercial operations as we prepare to commercialize Epidiolex. We also expect our capital expenditure to increase to approximately £22.0 million in 2015 as we complete construction of Sativex manufacturing facilities and expand Epidiolexour growing and manufacturing capacity. Although weWe expect clinical trial-related expendituresresearch and development spend to decrease in early 2016continue at current levels as, the four epilepsyalthough spend on Phase 3 clinical trials end,is expected to reduce, we will be investing $30-40 million dollars into pre-launch inventory build, all of which will be expensed via the research and development line in 2017. Sales, general and administrative expenses for 2016 is likely to increase by approximately 30%, mainly in the 2nd half of the year, once our NDA is filed and we are on track towards approval.
Research and development, management and administrative expenses and cash used for operations will continue to be significant and may increase substantially in future connection with new research and development initiatives, continued product commercialization efforts and as we prepare for the potential commercial launch of Epidiolex and continue to grow as a U.S. public company. We may need to raise additional capital to fund our operations, continue to conduct clinical trials to support potential regulatory approval of marketing applications, and to fund commercialization of our products.
The amount and timing of our future funding requirements will depend on many factors, including, but not limited to:
We believe that our cash and cash equivalents as at September 30, 2014 of £164.5 million coupled with future cash flows from operating activities will be sufficient
While we expect to fund our operations, including currently anticipated research and development activities and planned capital expenditures, for the foreseeable future, including for at least the next 12 months. We expect to fund any further future capital requirements from a number of sources including cash flowsflow from operating activities (including milestone and other paymentsoperations, the proceeds from our partners), further securitiespublic offerings, and the proceeds from the exercise of share options, and warrants. Wewe cannot assure you however, that any of these future funding sources will be available to us on favorable terms, or at all. Further, even if we can generate cash flow from operating activities and raise funds from all of the above sources, the amounts generated and raised may not be sufficient to meet our future capital requirements.
| 11 |
The presence
We may identify a material weakness in our internal control over financial reporting for future fiscal years. If we do not remediate material weaknesses or absenceare unable to implement and maintain effective internal control over financial reporting in the future, the accuracy and timeliness of one or more new large orders in a specific quarter, our ability to process orders or the cancellation of previous ordersfinancial reporting may cause our results of operations to fluctuate significantly on a quarterly basis.be adversely affected.
We supply products to our commercial partners in response to their monthly purchase order schedules. Historically, the size of each purchase order has fluctuated. As a result, the presence or absence in a specific quarter of one or more new large orders or delaysmay discover future deficiencies in our abilityinternal controls over financial reporting, including those identified through testing conducted by us or subsequent testing by our independent registered public accounting firm. If we are unable to process large ordersachieve effective internal control over financial reporting, or if our independent registered public accounting firm determines we continue to have a material weakness in our internal control over financial reporting, we could lose investor confidence in the cancellationaccuracy and completeness of previous orders may cause our results of operations to fluctuate on a quarterly basis. These fluctuations may be significant from one quarter to the next. Any demands that require us to quickly increase production may create difficulties for us. In addition, our limited commercial historyfinancial reports and the characteristicmarket price of our orders in any quarterly period make it very difficult to accurately predict or forecast our future operating results.ordinary shares and ADSs could decline.
We are exposed to risks related to currency exchange rates.
We conduct a significant portion of our operations outside the United Kingdom. Because our financial statements are presented in pounds sterling, changes in currency exchange rates have had and could have a significant effect on our operating results. Exchange rate fluctuations between local currencies and the pound sterling create risk in several ways, including the following: weakening of the pound sterling may increase the pound sterling cost of overseas research and development expenses and the cost of sourced product components outside the United Kingdom; strengthening of the pound sterling may decrease the value of our revenues denominated in other currencies; the exchange rates on non-sterling transactions and cash deposits can distort our financial results; and commercial Sativex pricing and profit margins are affected by currency fluctuations.
If product liability lawsuits are successfully brought against us, we will incur substantial liabilities and may be required to limit the commercialization of Sativex and our product candidates.
Although we have never had any product liability claims or lawsuits brought against us, we face potential product liability exposure related to the testing of our product candidates in human clinical trials, and we currently face exposure to claims in jurisdictions where we market and distribute Sativex. We may face exposure to claims by an even greater number of persons if we begin marketing and distributing our products commercially in the United States and elsewhere, including those relating to misuse of Sativex.elsewhere. Now, and in the future, an individual may bring a liability claim against us alleging that Sativex or one of our product candidates caused an injury. While we continue to take what we believe are appropriate precautions, we may be unable to avoid significant liability if any product liability lawsuit is brought against us. Although we have purchased insurance to cover product liability lawsuits, if we cannot successfully defend ourselves against product liability claims, or if such insurance coverage is inadequate, we will incur substantial liabilities. Regardless of merit or eventual outcome, liability claims may result in:
Counterfeit versions of our products could harm our business.
Counterfeiting activities and the presence of counterfeit products in a number of markets and over the Internet continue to be a challenge for maintaining a safe drug supply for the pharmaceutical industry. Counterfeit products are frequently unsafe or ineffective, and can be life-threatening. To distributors and users, counterfeit products may be visually indistinguishable from the authentic version. Reports of adverse reactions to counterfeit drugs along with increased levels of counterfeiting could be mistakenly attributed to the authentic product, affect patient confidence in the authentic product and harm the business of companies such as ours. If our products were to be the subject of counterfeits, we could incur substantial reputational and financial harm.
We have recently grown our business and will need to further increase the size and complexity of our organization in the future, and we may experience difficulties in managing our growth and executing our growth strategy.
Our management and personnel, systems and facilities currently in place may not be adequate to support our business plan and future growth. With the initiation of Phase 3 clinical trials for Epidiolex and the decision to promote and market in the United States the product candidates for with we receive marketing approval from FDA, we have increased our number of full-time employees from 194 on September 30, 2013 to 496 as of September 30, 2016, primarily because we are conducting all of our Phase 2 and 3 clinical trials of Epidiolex and our other product candidates ourselves and establishing a commercial organization and our commercial infrastructure. As a result of these activities the complexity of our business operations has substantially increased. We will need to further expand our scientific, sales and marketing, managerial, compliance, operational, financial and other resources to support our planned research, development and commercialization activities.
| 12 |
Our need to effectively manage our operations, growth and various projects requires that we:
| continue to improve our operational, financial, management and regulatory compliance controls and reporting systems and procedures; |
In addition, historically, we have utilized and continue to utilize the services of part-time outside consultants and contractors to perform a number of tasks for us, including tasks related to compliance programs, clinical trial management, regulatory affairs, formulation development and other drug development functions. Our growth strategy may also entail expanding our use of consultants and contractors to implement these and other tasks going forward. Because we rely on consultants and contractors for certain functions of our business, we will need to be able to effectively manage these consultants and contractors to ensure that they successfully carry out their contractual obligations and meet expected deadlines. There can be no assurance that we will be able to manage our existing consultants and contractors or find other competent outside expertise, as needed, on economically reasonable terms, or at all. If we are not able to effectively expand our organization by hiring new employees and expanding our use of consultants and contractors, we may be unable to successfully implement the tasks necessary to effectively execute on our planned research, development and commercialization activities and, accordingly, may not achieve our research, development and commercialization goals.
We depend upon our key personnel and our ability to attract and retain employees.
Our future growth and success depend on our ability to recruit, retain, manage and motivate our employees. The loss of the services of any member of our senior management, including our Chairman, Dr. Geoffrey Guy, our Chief Executive Officer, Justin Gover and our Research and Development Director, Dr. Stephen Wright, or the inability to hire or retain experienced management personnel could adversely affect our ability to execute our business plan and harm our operating results. Because of the specialized scientific and managerial nature of our business, we rely heavily on our ability to attract and retain qualified scientific, technical and managerial personnel. The competition for qualified personnel in the pharmaceutical field is intense. Due to this intense competition, we may be unable to continue to attract and retain qualified personnel necessary for the development of our business or to recruit suitable replacement personnel.
Our employees may engage in misconduct or other improper activities, including noncompliance with regulatory standards and requirements.
We are exposed to the risk of employee fraud or other misconduct. Misconduct by employees could include intentional failures to comply with FDA regulations, provide accurate information to the FDA, comply with applicable manufacturing standards, comply with other federal and state laws and regulations, report information or data accurately or disclose unauthorized activities to us. Employee misconduct could also involve the improper use of information, including information obtained in the course of clinical trials, or illegal misappropriation of drug product, which could result in government investigations and serious harm to our reputation. We have adopted a Code of Business Conduct and Ethics, but it is not always possible to identify and deter employee misconduct, and the precautions we take to detect and prevent this activity may not be effective in controlling unknown or unmanaged risks or losses or in protecting us from governmental investigations or other actions or lawsuits stemming from a failure to be in compliance with such laws or regulations. If any such actions are instituted against us, and we are not successful in defending ourselves or asserting our rights, those actions could have a significant impact on our business, including the imposition of significant fines or other sanctions.
If we are unable to use net operating loss carry-forwards and certain built-in losses to reduce future tax payments, or benefit from favorable tax legislation, our business, results of operations and financial condition may be adversely affected.
As a U.K. resident trading company, we are predominantly subject to U.K. corporate taxation. At September 30, 2014,2016, we had cumulative carry-forward tax losses of £34.3£102.8 million, available to offset against future profits. The majority of these tax loss attributes have not been recognized on our balance sheet at September 30, 2014.2016. Additionally, as we are a company that carriescarry out extensive research and development activities in the U.K., we benefit from the U.K. research and development tax credit regime for small and medium sized companies, whereby we areour principal research subsidiary, GW Research Ltd, is able to surrender a portion of available losses that arise from research and development activity for a refundable credit that equals 32.6%of up to approximately 33.4% of the eligible research and development expenditure. We may also benefit in the future from the UK’s "patent box"“patent box” regime, which started to come into effect in the U.K. in April 2013.This regime allowswould allow certain profits attributable to revenue from patented products to be taxed at a lower rate than other profits that over time will be reduced to 10%. When taken in combination with our available carry-forward tax losses and the enhanced relief available on our research and development expenditure, we expect that this may result in a long-term low rate of corporation tax. If, however, we are unable to generate sufficient future taxable profits, or implement feasible tax planning strategiesfor any reason to utilize our carry-forward losses, or there are unexpected adverse changes to the U.K. research and development tax credit regime or "patent box"“patent box” regime, or we are unable to qualify for such advantageous tax legislation, our business, results of operations and financial condition may be adversely affected.
| 13 |
We are subject to the U.K. Bribery Act, the U.S. Foreign Corrupt Practices Act and other anti-corruption laws, as well as export control laws, customs laws, sanctions laws and other laws governing our operations. If we fail to comply with these laws, we could be subject to civil or criminal penalties, other remedial measures, and legal expenses, which could adversely affect our business, results of operations and financial condition.
Our operations are subject to anti-corruption laws, including the U.K. Bribery Act 2010, or Bribery Act, the U.S. Foreign Corrupt Practices Act, or FCPA, and other anti-corruption laws that apply in countries where we do business. The Bribery Act, FCPA and these other laws generally prohibit us and our employees and intermediaries from bribing, being bribed or making other prohibited payments to government officials or other persons to obtain or retain business or gain some other business advantage. We and our commercial partners operate in a number of jurisdictions that pose a high risk of potential Bribery Act or FCPA violations, and we participate in collaborations and relationships with third parties whose actions could potentially subject us to liability under the Bribery Act, FCPA or local anti-corruption laws. In addition, we cannot predict the nature, scope or effect of future regulatory requirements to which our international operations might be subject or the manner in which existing laws might be administered or interpreted.interpreted
We are also subject to other laws and regulations governing our international operations, including regulations administered by the governments of the United Kingdom and the United States, and authorities in the European Union, including applicable export control regulations, economic sanctions on countries and persons, customs requirements and currency exchange regulations, collectively referred to as the Trade Control laws.
However, there is no assurance that we will be completely effective in ensuring our compliance with all applicable anti-corruption laws, including the Bribery Act, the FCPA or other legal requirements, including Trade Control laws. If we are not in compliance with the Bribery Act, the FCPA and other anti-corruption laws or Trade Control laws, we may be subject to criminal and civil penalties, disgorgement and other sanctions and remedial measures, and legal expenses, which could have an adverse impact on our business, financial condition, results of operations and liquidity. Likewise, any investigation of any potential violations of the Bribery Act, the FCPA, other anti-corruption laws or Trade Control laws by U.K., U.S.the United Kingdom, the United States or other authorities could also have an adverse impact on our reputation, our business, results of operations and financial condition.
Our proprietary information, or that of our customers, suppliers and business partners, may be lost or we may suffer security breaches.
In the ordinary course of our business, we collect and store sensitive data, including intellectual property, clinical trial data, our proprietary business information and that of our customers, suppliers and business partners, and personally identifiable information of our customers, clinical trial subjects and employees, in our data centers and on our networks. The secure processing, maintenance and transmission of this information is critical to our operations. Despite our security measures, our information technology and infrastructure may be vulnerable to attacks by hackers or breached due to employee error, malfeasance or other disruptions. Although to our knowledge we have not experienced any such material security breach to date, any such breach could compromise our networks and the information stored there could be accessed, publicly disclosed, lost or stolen. Any such access, disclosure or other loss of information could result in legal claims or proceedings, liability under laws that protect the privacy of personal information, regulatory penalties, disrupt our operations, damage our reputation, and cause a loss of confidence in our products and our ability to conduct clinical trials, which could adversely affect our business and reputation and lead to delays in gaining regulatory approvals for Epidiolex. Although we maintain business interruption insurance coverage, our insurance might not cover all losses from any future breaches of our systems.
Failure of our information technology systems could significantly disrupt the operation of our business.
Our business increasingly depends on the use of information technologies, which means that certain key areas such as research and development, production and sales are to a large extent dependent on our information systems or those of third party providers. Our ability to execute our business plan and to comply with regulators requirements with respect to data control and data integrity, depends, in part, on the continued and uninterrupted performance of our information technology systems, or IT systems.systems and the IT systems supplied by third-party service providers. These systems are vulnerable to damage from a variety of sources, including telecommunications or network failures, malicious human acts and natural disasters. Moreover, despite network security and backup measures, some of our servers are potentially vulnerable to physical or electronic break-ins, computer viruses and similar disruptive problems. Despite the precautionary measures we and our third-party service providers have taken to prevent unanticipated problems that could affect our IT systems, sustained or repeated system failures or problems arising during the upgrade of any of our IT systems that interrupt our ability to generate and maintain data, and in particular to operate our proprietary technology platform, could adversely affect our ability to operate our business.
| 14 |
Legislative or regulatory reform of the health care system in the United States and foreign jurisdictions may affect our ability to profitably sell our products, if approved.
Our ability to commercialize our future products successfully, alone or with collaborators, will depend in part on the extent to which coverage and reimbursement for the products will be available from government and health administration authorities, private health insurers and other third-party payors.payers. The continuing efforts of the U.S. and foreign governments, insurance companies, managed care organizations and other payorspayers of health care services to contain or reduce health care costs may adversely affect our ability to set prices for our products which we believe are fair, and our ability to generate revenues and achieve and maintain profitability.
Specifically, in both the United States and some foreign jurisdictions, there have been a number of legislative and regulatory proposals to change the health care system in ways that could affect our ability to sell our products profitably. For example, the Patient Protection and Affordable Care Act, as amended by the Health Care and Education Reconciliation Act, or collectively the PPACA,ACA, enacted in the United States in March 2010, substantially changes the way healthcare is financed by both governmental and private insurers. Proposals have been made to repeal or modify the ACA, but it is not clear at this point whether such proposals will be adopted.
We expect furtheradditional federal and state proposals and health care reforms to continue to be proposed by legislators, which could limit the prices that can be charged for the products we develop and may limit our commercial opportunity.
The continuing efforts of government and other third-party payorspayers to contain or reduce the costs of health care through various means may limit our commercial opportunity. It will be time-consumingtime consuming and expensive for us to go through the process of seeking coverage and reimbursement from Medicare and private payors.payers. Our products may not be considered cost effective, and government and third-party private health insurance coverage and reimbursement may not be available to patients for any of our future products or sufficient to allow us to sell our products on a competitive and profitable basis. Our results of operations could be adversely affected by PPACAACA, changes to the ACA, and by other health care reforms that may be enacted or adopted in the future. In addition, increasing emphasis on managed care in the United States will continue to put pressure on the pricing of pharmaceutical products. Cost control initiatives could decrease the price that we or any potential collaborators could receive for any of our future products and could adversely affect our ability to generate revenue in the U.S. market and maintain profitability.
In some foreign countries, including major markets in the European Union, the pricing of prescription pharmaceuticals is subject to governmental control. In these countries, pricing negotiations with governmental authorities can take 6six to 12 months or longer after the receipt of regulatory marketing approval for a product. To obtain reimbursement or pricing approval in some countries, we may be required to conduct a pharmacoeconomic study that compares the cost-effectiveness of our product candidates to other available therapies. Such pharmacoeconomic studies can be costly and the results uncertain. Our business could be harmed if reimbursement of our products is unavailable or limited in scope or amount or if pricing is set at unsatisfactory levels.
We may acquire other companies which could divert our management'smanagement’s attention, result in additional dilution to our shareholders and otherwise disrupt our operations and harm our operating results.
We may in the future seek to acquire businesses, products or technologies that we believe could complement or expand our product offerings, enhance our technical capabilities or otherwise offer growth opportunities. The pursuit of potential acquisitions may divert the attention of management and cause us to incur various expenses in identifying, investigating and pursuing suitable acquisitions, whether or not they are consummated. If we acquire additional businesses, we may not be able to integrate the acquired personnel, operations and technologies successfully, or effectively manage the combined business following the acquisition. We also may not achieve the anticipated benefits from the acquired business due to a number of factors, including:
In the future, if our acquisitions do not yield expected returns, we may be required to take charges to our operating results arising from the impairment assessment process. Acquisitions may also result in dilutive issuances of equity securities or the incurrence of debt, which could adversely affect our operating results. In addition, if an acquired business fails to meet our expectations, our business, results of operations and financial condition may be adversely affected.
| 15 |
The United Kingdom’s vote in favor of withdrawing from the European Union and the result of the recent U.S. presidential election could lead to increased market volatility which could adversely impact the market price of our ADSs and make it more difficult for us to do business in Europe or have other adverse effects on our business.
On June 23, 2016, the electorate in the United Kingdom voted in favor of leaving the European Union (commonly referred to as “Brexit”). The withdrawal of the United Kingdom from the European Union will take effect either on the effective date of the withdrawal agreement or, in the absence of agreement, two years after the United Kingdom provides a notice of withdrawal pursuant to the EU Treaty. No announcement has been made by the U.K. government as to when it intends to deliver any notice of withdrawal. There are many ways in which our business could be affected by this event, only some of which we can identify at this time. It appears likely that this withdrawal will involve a process of lengthy negotiations between the United Kingdom and European Union member states to determine the future terms of the United Kingdom’s relationship with the European Union. This could lead to a period of considerable uncertainty particularly in relation to United Kingdom financial and banking markets as well as on the regulatory process in Europe. As a result of this uncertainty, financial markets could experience significant volatility which could adversely affect the market price of our ADSs. We may also face new regulatory costs and challenges that could have a material adverse effect on our operations. Depending on the terms of Brexit, the United Kingdom could lose the benefits of global trade agreements negotiated by the European Union on behalf of its members, which may result in increased trade barriers which could make our doing business in Europe more difficult. In addition, currency exchange rates in the pound sterling and the euro with respect to each other and the U.S. dollar have already been adversely affected by Brexit. Should this foreign exchange volatility continue it could cause volatility in our quarterly financial results.
On November 8, 2016, Mr. Donald J. Trump was elected the next president of the United States. As a candidate, President-Elect Trump proposed changes to existing trade policies and agreements, proposed reforming the FDA, repealing the Patient Protection and Affordable Care Act and changing the manner in which drug prices are negotiated by Medicare. Changes in U.S. social, political, regulatory and economic conditions in the U.S. or in laws and policies governing foreign trade, importation, manufacturing, development, registration and approval, commercialization and reimbursement of our products in the U.S. could adversely affect our business.
Risks Related to Development and Regulatory Approval of Sativex and Our Product Candidates
Clinical trials for our product candidates are expensive, time-consuming, uncertain and susceptible to change, delay or termination.
Clinical trials are expensive, time consuming and difficult to design and implement. Even if the results of our clinical trials are favorable, the clinical trials for a number of our product candidates are expected to continue for several years and may take significantly longer to complete. In addition, we, the FDA an Institutional Review Board, or IRB, or other regulatory authorities, including state and local authorities, or an Institutional Review Board, or IRB, with respect to a trial at its institution, may suspend, delay or terminate our clinical trials at any time, require us to conduct additional clinical trials, require a particular clinical trial to continue for a longer duration than originally planned, require a change to our development plans such that we conduct clinical trials for a product candidate in a different order, e.g., in a step-wise fashion rather than running two trials of the same product candidate in parallel, or the DEA could suspend or terminate the registrations and quota allotments we require in order to procure and handle controlled substances, for various reasons, including:
| 16 |
Any of the foregoing could have a material adverse effect on our business, results of operations and financial condition.
Any failure by us to comply with existing regulations could harm our reputation and operating results.
We are subject to extensive regulation by U.S. federal and state and foreign governments in each of the markets where we currently sell Sativex or in markets where we have product candidates progressing through the approval process. We must adhere to all regulatory requirements including the FDA'sFDA’s Good Laboratory Practice, current Good Manufacturing Practice, or cGMP,GMP, and Good Clinical Practice requirements. If we or our suppliers fail to comply with applicable regulations, including FDA pre-or post-approval cGMPGMP requirements, then the FDA or other foreign regulatory authorities could sanction us. Even if a drug is FDA-approved, regulatory authorities may impose significant restrictions on a product'sproduct’s indicated uses or marketing or impose ongoing requirements for potentially costly post-marketing trials.
If Sativex, or any of our other product candidates is approved in the United States, it will be subject to ongoing regulatory requirements for labeling, packaging, storage, distribution, import, export, advertising, promotion, sampling, recordkeeping and submission of safety and other post-market information, including both federal and state requirements in the United States. In addition, manufacturers and manufacturers'manufacturers’ facilities are required to comply with extensive FDA requirements, including ensuring that quality control and manufacturing procedures conform to cGMP.GMP. As such, we and our contract manufacturers (in the event contract manufacturers are appointed in the future) are subject to continual review and periodic inspections to assess compliance with cGMP.GMP. Accordingly, we and others with whom we work must continue to expend time, money and effort in all areas of regulatory compliance, including manufacturing, production, quality control and quality assurance. We will also be required to report certain adverse reactions and production problems, if any, to the FDA, and to comply with requirements concerning advertising and promotion for our products. Promotional communications with respect to prescription drugs are subject to a variety of legal and regulatory restrictions and must be consistent with the information in the product'sproduct’s approved label. As such, we may not promote our products for indications or uses for which they do not have FDA approval.
If a regulatory agency discovers previously unknown problems with a product, such as adverse events of unanticipated severity or frequency, or problems with the facility where the product is manufactured, or disagrees with the promotion, marketing or labeling of the product, it regulatory agency may impose restrictions on that product or us, including requiring withdrawal of the product from the market. If we fail to comply with applicable regulatory requirements, a regulatory agency or enforcement authority may:
| 17 |
Any government investigation of alleged violations of law could require us to expend significant time and resources in response, and could generate negative publicity. Any failure to comply with ongoing regulatory requirements may significantly and adversely affect our ability to commercialize and generate revenue from Sativex and our product candidates. If regulatory sanctions are applied or if regulatory approval is withdrawn, the value of our business and our operating results will be adversely affected. Additionally, if we are unable to generate revenue from sales of Sativex, our potential for achieving profitability will be diminished and the capital necessary to fund our operations will be increased.
Any action against us for violation of these laws, even if we successfully defend against it, could cause us to incur significant legal expenses, divert our management'smanagement’s attention from the operation of our business and damage our reputation. We expend significant resources on compliance efforts and such expenses are unpredictable and might adversely affect our results. Changing laws, regulations and standards might also create uncertainty, higher expenses and increase insurance costs. As a result, we intend to invest all reasonably necessary resources to comply with evolving standards, and this investment might result in increased management and administrative expenses and a diversion of management time and attention from revenue-generating activities to compliance activities.
Information obtained from expanded access studies and other survey results may not reliably predict the efficacy of our product candidates in company-sponsored clinical trials and may lead to adverse events that could limit approval.
ExpandedThe expanded access studies we are currently supporting are uncontrolled, carried out by individual investigators and not typically conducted in strict compliance with GCPs, all of which can lead to a treatment effect which may differ from that in placebo-controlled trials. These studies provide only anecdotal evidence of efficacy for regulatory review. These studies contain no control or comparator group for reference and these patient data are not designed to be aggregated or reported as study results. Moreover, data from such small numbers of patients may be highly variable. Information obtained from these studies, including the statistical principles that we and the independent investigators have chosen to apply to the data, may not reliably predict data collected via systematic evaluation of the efficacy in company-sponsored clinical trials or evaluated via other statistical principles that may be applied in those trials. Reliance on such information to design our clinical trials may lead to Phase 2 and 3 trials that are not adequately designed to demonstrate efficacy and could delay or prevent our ability to seek approval of Epidiolex.
Expanded access programs provide supportive safety information for regulatory review. Physicians conducting these studies may use Epidiolex in a manner inconsistent with the protocol, including in children with conditions beyond those being studied in GW-sponsored trials. Any adverse events or reactions experienced by subjects in the expanded access program may be attributed to Epidiolex and may limit our ability to obtain regulatory approval with labeling that we consider desirable, or at all.
In addition, the children whose parents participated in the survey published in an article published in the December 2013 edition of Epilepsy and Behavior by Jacobson and Porter of Stanford University reported in our 2013 Annual Report on Form 20-F were not treated with our CBD-based drug candidate, Epidiolex. Therefore, the results of this survey may not be indicative of how these children would have responded to treatment with Epidiolex. The results of this survey are also based on a small number of patients outside of a clinical trial and are not necessarily predictive of results in controlled clinical trials with larger and more diverse patient populations.
There is a high rate of failure for drug candidates proceeding through clinical trials.
Generally, there is a high rate of failure for drug candidates proceeding through clinical trials. We may suffer significant setbacks in our clinical trials similar to the experience of a number of other companies in the pharmaceutical and biotechnology industries, even after receiving promising results in earlier trials. Further, even if we view the results of a clinical trial to be positive, the FDA or other regulatory authorities may disagree with our interpretation of the data. For instance, because a large percentage of subjects in our pivotal trials for Sativex in cancer pain are being enrolled at sites outside the United States, differences in efficacy results between U.S. and ex-U.S. sites could cause the FDA to require additional trials. In the event that we obtain negative results from the Sativex cancer pain Phase 3clinical trials or from the planned Phase 3 clinical trial of Sativex for MS spasticity or cannot reach agreement with the FDA on the design of the Phase 3 trial for MS spasticity, or receive poor clinical results for Epidiolex or our other product candidates, or the FDA places a clinical hold on our Phase 3 trials due to potential Chemistry, Manufacturing and Controls issues or other hurdles or does not approve our NDA for Sativex or Epidiolex,our product candidates, we may not be able to generate sufficient revenue or obtain financing to continue our operations, our ability to execute on our current business plan will be materially impaired, our reputation in the industry and in the investment community would likely be significantly damaged and the price of our ADSs would likely decrease significantlysignificantly. In addition, our inability to properly design, commence and complete clinical trials may negatively impact the timing and results of our clinical trials and ability to seek approvals for our drug candidates.
The anticipated development of a Risk Evaluation and Mitigation StrategiesStrategy (REMS) for Sativex and our other product candidates could cause delays in the approval process and would add additional layers of regulatory requirements that could impact our ability to commercialize Sativex and our other product candidates in the United States and reduce their market potential.
As a condition of approval of an NDA, the FDA may require a Risk Evaluation and Mitigation Strategies (REMS) to ensure that the benefits of the drug outweigh the potential risks. REMS elements can include medication guides, communication plans for health care professionals, and elements to assure safe use, or ETASU. ETASU can include, but are not limited to, special training or certification for prescribing or dispensing, dispensing only under certain circumstances, special monitoring and the use of patient registries. Moreover, product approval may require substantial post-approval testing and surveillance to monitor the drug'sdrug’s safety or efficacy. We may be required to adopt a REMS for Sativex and our other product candidates to ensure that the benefits outweigh the risks of abuse, misuse, diversion and other potential safety concerns. Even if abuse, misuse and diversion are not as high as for other cannabinoid products, there can be no assurance that the FDA will approve a manageable REMS for Sativex and our product candidates, which could create material and significant limits on our ability to successfully commercialize Sativex and our product candidates in the United States. Delays in the REMS approval process could result in delays in the NDA approval process. In addition, as part of the REMS, the FDA could require significant restrictions, such as restrictions on the prescription, distribution and patient use of the product, which could significantly impact our ability to effectively commercialize Sativex and our product candidates, and dramatically reduce their market potential thereby adversely impacting our business, financial condition and results of operations. Even if initial REMS are not highly restrictive, if, after launch, Sativex and our product candidates were to be subject to significant abuse/non-medical use or diversion from licit channels, this could lead to negative regulatory consequences, including a more restrictive REMS.
| 18 |
If we are found in violation of federal or state "fraud“fraud and abuse"abuse” laws, we may be required to pay a penalty and/or be suspended from participation in federal or state health care programs, which may adversely affect our business, financial condition and results of operations.
After we obtain marketingregulatory approval for our products in the United States, if any, we will be subject to various federal and state health care "fraud“fraud and abuse"abuse” laws, including anti-kickback laws, false claims laws and other laws intended to reduce fraud and abuse in federal and state health care programs, which could affect us particularly upon successful commercialization of our products in the United States. The Medicare and Medicaid Patient Protection Act of 1987, or federal Anti-Kickback Statute, makes it illegal for any person, including a prescription drug manufacturer (or a party acting on its behalf), to knowingly and willfully solicit, receive, offer or pay any remuneration that is intended to induce the referral of business, including the purchase, order or prescription of a particular drug for which payment may be made under a federal health care program, such as Medicare or Medicaid. Under federal government regulations, some arrangements, known as safe harbors, are deemed not to violate the federal Anti-Kickback Statute. Although we seek to structure our business arrangements in compliance with all applicable requirements, these laws are broadly written, and it is often difficult to determine precisely how the law will be applied in specific circumstances. Accordingly, it is possible that our practices may be challenged under the federal Anti-Kickback Statute. False claims laws prohibit anyone from knowingly and willfully presenting or causing to be presented for payment to third-party payers, including government payers, claims for reimbursed drugs or services that are false or fraudulent, claims for items or services that were not provided as claimed, or claims for medically unnecessary items or services. Cases have been brought under false claims laws alleging that off-label promotion of pharmaceutical products or the provision of kickbacks has resulted in the submission of false claims to governmental health care programs. Under the Health Insurance Portability and Accountability Act of 1996, we are prohibited from knowingly and willfully executing a scheme to defraud any health care benefit program, including private payers, or knowingly and willfully falsifying, concealing or covering up a material fact or making any materially false, fictitious or fraudulent statement in connection with the delivery of or payment for health care benefits, items or services. Violations of fraud and abuse laws may be punishable by criminal and/or civil sanctions, including fines and/or exclusion or suspension from federal and state health care programs such as Medicare and Medicaid and debarment from contracting with the U.S. government. In addition, private individuals have the ability to bring actions on behalf of the government under the federal False Claims Act as well as under the false claims laws of several states.
Many states have adopted laws similar to the federal anti-kickback statute, some of which apply to the referral of patients for health care services reimbursed by any source, not just governmental payers. In addition, California and a few other states have passed laws that require pharmaceutical companies to comply with the April 2003 Office of Inspector General Compliance Program Guidance for Pharmaceutical Manufacturers and/or the Pharmaceutical Research and Manufacturers of America Code on Interactions with Healthcare Professionals. In addition, several states impose other marketing restrictions or require pharmaceutical companies to make marketing or price disclosures to the state. There are ambiguities as to what is required to comply with these state requirements and if we fail to comply with an applicable state law requirement we could be subject to penalties.
Neither the government nor the courts have provided definitive guidance on the application of fraud and abuse laws to our business. Law enforcement authorities are increasingly focused on enforcing these laws, and it is possible that some of our practices may be challenged under these laws. While we believe we have structured our business arrangements to comply with these laws, it is possible that the government could allege violations of, or convict us of violating, these laws. If we are found in violation of one of these laws, we could be required to pay a penalty and could be suspended or excluded from participation in federal or state health care programs, and our business, results of operations and financial condition may be adversely affected.
Our ability to research, develop and commercialize Sativex and our product candidates is dependent on our ability to maintain licenses relating to the cultivation, possession and supply of controlled substances.
Our research and manufacturing facilities are located exclusively in the United Kingdom. In the United Kingdom, licenses to cultivate, possess and supply cannabis for medical research are granted by the Home Office on an annual basis. Although the Home Office has renewed our licenses each year since 1998, it may not do so in the future, in which case we may not be in a position to carry on our research and development program in the United Kingdom. In addition, we are required to maintain our existing commercial licenses to cultivate, produce and supply cannabis. However, if the Home Office were not prepared to renew such licenses, we would be unable to manufacture and distribute our products on a commercial basis in the United Kingdom or beyond. In order to carry out research in countries other than the United Kingdom, similar licenses to those outlined above are required to be issued by the relevant authority in each country. In addition, we will be required to obtain licenses to export from the United Kingdom and to import into the recipient country. To date, we have obtained necessary import and export licenses to 35over 30 countries. Although we have an established track record of successfully obtaining such licenses as required, this may change in the future.
In the United States, the DEA regulates the cultivation, possession and supply of cannabis for medical research and/or commercial development, including the requirement of annual registrations to manufacture or distribute pharmaceutical products derived from cannabis extracts. We do not currently conduct any manufacturing or repackaging/relabeling of either Sativex or its active ingredients, or any product candidates in the United States. In the event that we sought to do so in the future, a decision to manufacture, or supply cannabis extracts for medical research or commercial development in the United States would require that we and/or our contract manufacturers maintain such registrations, and be subject to other regulatory requirements such as manufacturing quotas, and if the DEA failed to issue or renew such registrations, we would be unable to manufacture and distribute any product in the United States on a commercial basis.
| 19 |
Serious adverse events or other safety risks could require us to abandon development and preclude, delay or limit approval of our product candidates, or limit the scope of any approved label or market acceptance.
If Sativex or any of our product candidates, prior to or after any approval for commercial sale, cause serious or unexpected side effects, or are associated with other safety risks such as misuse, abuse or diversion, a number of potentially significant negative consequences could result, including:
We may voluntarily suspend or terminate our clinical trials if at any time we believe that they present an unacceptable risk to participants or if preliminary data demonstrate that our product candidates are unlikely to receive regulatory approval or unlikely to be successfully commercialized. To date, we have only voluntarily suspended clinical trials when recruitment of the target patients has proven to be too difficult.difficult or, temporarily, to properly investigate suspected adverse events. In addition, regulatory agencies, IRBs or data safety monitoring boards may at any time recommend the temporary or permanent discontinuation of our clinical trials or request that we cease using investigators in the clinical trials if they believe that the clinical trials are not being conducted in accordance with applicable regulatory requirements, or that they present an unacceptable safety risk to participants. Although we have never been asked by a regulatory agency, IRB or data safety monitoring board to temporarily or permanently discontinue a clinical trial, if we elect or are forced to suspend or terminate a clinical trial of Sativex or any other of our product candidates, the commercial prospects for that product will be harmed and our ability to generate product revenue from that product may be delayed or eliminated. Furthermore, any of these events may result in labeling statements such as warnings or contraindications. For example, the FDA has stated that Sativex will likely be labeled as carrying a risk of seizures and that further mechanistic studies, although encouraged, are not likely to alter this conclusion. In addition, such events or labeling could prevent us or our partners from achieving or maintaining market acceptance of the affected product and could substantially increase the costs of commercializing our product candidates and impair our ability to generate revenue from the commercialization of these products either by us or by our collaboration partners.
If third parties claim that intellectual property used by us infringes upon their intellectual property, our operating profits could be adversely affected.
There is a substantial amount of litigation, both within and outside the United States, involving patent and other intellectual property rights in the pharmaceutical industry. We may, from time to time, be notified of claims that we are infringing upon patents, trademarks, copyrights or other intellectual property rights owned by third parties, and we cannot provide assurances that other companies will not, in the future, pursue such infringement claims against us or any third-party proprietary technologies we have licensed. If we were found to infringe upon a patent or other intellectual property right, or if we failed to obtain or renew a license under a patent or other intellectual property right from a third party, or if a third party that we were licensing technologies from was found to infringe upon a patent or other intellectual property rights of another third party, we may be required to pay damages, including triple damages if the infringement is found to be willful, suspend the manufacture of certain products or reengineer or rebrand our products, if feasible, or we may be unable to enter certain new product markets. Any such claims could also be expensive and time consuming to defend and divert management’s attention and resources. Our competitive position could suffer as a result. In addition, if we have declined to enter into a valid non-disclosure or assignment agreement for any reason, we may not own the invention or our intellectual property, and our products may not be adequately protected. Although we have reviewed certain third-party patents and patent filings that we believe may be relevant to Sativex, Epidiolex and Epidiolex,our other product candidates, we have not conducted a full freedom-to-operate searchsearches or analysis for Sativex or Epidiolex,analyses, and we may not be aware of patents or pending or future patent applications that, if issued, would block us from commercializing Sativex, Epidiolex or Epidiolex.our other product candidates. Thus, we cannot guarantee that Sativex, and Epidiolex or our other product candidates, or our commercialization thereof, does not and will not infringe any third party’s intellectual property.
| 20 |
Risks Related to Our Reliance Upon Third Parties
We depend substantially on the commercial expertise of our collaboration partners for Sativex.Sativex.
We do not have aAlthough we intend to commercialize Epidiolex using our own sales and marketing operation in the United States and potentially elsewhere, we rely on the expertise and commercial skills of our collaboration partners to sell Sativex. We have entered into agreements for the commercialization of Sativex with Almirall S.A., or Almirall, in Europe (excluding the United Kingdom) and Mexico; Otsuka Pharmaceutical Co., Ltd., or Otsuka, in the United States; Novartis Pharma AG, or Novartis, in Australia and New Zealand, Asia (excluding Japan, China and Hong Kong), the Middle East (excluding Israel) and Africa; Bayer HealthCare AG in the United Kingdom and Canada; Ipsen Biopharm Ltd, or Ipsen, in Latin America (excluding Mexico and the Islands of the Caribbean); and Neopharm Group in Israel. Our ability to successfully market and sell Sativex in each of these markets depends entirely on the expertise and commercial skills of our collaboration partners. Our partners have the right, under certain circumstances, to terminate their agreements with us, and three of our partners, Almirall, Otsuka and Novartis, have the right to terminate their agreements with us without cause. AIn November 2016 we entered into a mutual termination agreement with Novartis, pursuant to which rights in Sativex in Australia and New Zealand, Asia (excluding Japan, China and Hong Kong), the Middle East (excluding Israel) and Africa will be returned to GW over an agreed transition period, and we are in the process of appointing new distributors in the countries in the Novartis territories where Sativex is approved. No other partner has given notice of termination of their agreement with us to date, but given the fact that not one of three Phase 3 cancer pain trials for Sativex showed a statistically significant difference for Sativex compared with placebo, we cannot be certain that not one of these remaining partners will not terminate their agreement with us. Further, a failure by our partners to successfully market Sativex, or the termination of agreements with our partners, willmay have a materialan adverse effect on our business results of operations and financial condition.at least in the near term period following such termination.
We rely heavilyhave relied on Otsuka for funding of our Sativex research and development programs in the United States and overhead,if Otsuka were to terminate its agreement with us we would have to fund any future development of Sativex in the United States ourselves, and come to an agreement with Otsuka is a joint owner of theon jointly-owned intellectual property resulting from our pre-clinical research collaboration.
We rely heavily on our relationship with Otsuka for the funding of our Sativex research and development programs and for overhead expenses. Under the terms of our agreement with Otsuka with respect to Sativex in the United States, Otsuka funds all pre-clinical and clinical trials for the development of Sativex in the treatment of cancer pain. As provided for under the terms of this agreement, we also expect Otsuka to fund pre-clinical and clinical trials required for the development of Sativex in the treatment of MS spasticity in the United States.pain as well as potential additional indications. There is however no assurance that Otsuka will agree to fund MS spasticityfuture development activities, in which caseactivities. As outlined above, Otsuka has the right to terminate their agreement with us without cause. In light of the results of the Phase 3 cancer pain trials for Sativex may neverdiscussed above, we cannot be developed for the treatment of MS spasticity in the United States.certain that Otsuka will not terminate this agreement. If Otsuka were to terminate this agreement, we would be required to find alternative funding for our clinical program for theany future development of Sativex in the treatment of cancer pain and MS spasticity or face substantial delays in, or possible termination of, that program. In addition, under a separate global research collaboration for research of cannabinoids in CNS and oncology, we received funds from Otsuka from 2007 to June 2013. The term of this research collaboration agreement with Otsuka ended in June 2013. Since then our GW-funded research and development expenditure has increased as a result of this change and we expect this trend to continue.United States.
In addition, under the terms of the research collaboration agreement we entered with Otsuka provided thatin 2007 all intellectual property rights (including both patents and non-manufacturing related know-how) that was conceived by either Otsuka or us during the course of the collaboration is to be jointly owned by Otsuka and us. We have 9us unless Otsuka elects to cease funding the prosecution and maintenance costs for these rights. As at September 30, 2016 we had 6 patent families which consist of 25679 jointly owned patent applications and 6487 granted patents relating to our collaboration with Otsuka, including those directed to the use of Sativex in the CNS and/or oncology field or that are otherwise relevant to Sativex.Otsuka. Because Otsuka exercises some control over this jointly owned intellectual property, we may need to seek Otsuka’s consent to pursue, use, licenseout-license and/or enforce some of this collaboration intellectual property in the future. In addition, Otsuka has the right to develop and commercialize a synthetic cannabinoid molecule product (a molecule not based on a phytocannabinoid but which has an effect on the endocannabinoid system) subject to payment of a royalty to us. An unexpected deterioration in our relationship with Otsuka would have a material adverse effect on our business, reputation, results of operations and financial condition.
Our existing collaboration arrangements and any that we may enter into in the future may not be successful, which could adversely affect our ability to develop and commercialize Sativex and our product candidates.
We are a party to, and may seek additional, collaboration arrangements with pharmaceutical or biotechnology companies for the development or commercialization of Sativex and our current and potentialproduct candidates. We may, with respect to our product candidates, including for the commercialization of Sativex. We may enter into new arrangements on a selective basis depending on the merits of retaining commercialization rights for ourselves as compared to entering into selective collaboration arrangements with leading pharmaceutical or biotechnology companies for each product candidate, both in the United States and internationally. To the extent that we decide to enter into collaboration agreements, we will face significant competition in seeking appropriate collaborators. Moreover, collaboration arrangements are complex and time consuming to negotiate, document and implement. We may not be successful in our efforts to establish, implement and maintain collaborations or other alternative arrangements if we choose to enter into such arrangements.arrangements and, as noted above, our selected partners may be given, and may exercise, a right to terminate their agreement with us without cause. The terms of any collaboration or other arrangements that we may establish may not be favorable to us.
Any existing or future collaboration that we enter into may not be successful. The success of our collaboration arrangements will depend heavily on the efforts and activities of our collaborators. Collaborators generally have significant discretion in determining the efforts and resources that they will apply to these collaborations. For example, we have recently amended ourand as explained above, the mutual termination of the Sativex distribution and license agreement with Novartis our collaborator for Sativex in parts of Asia,follows the Middle East and Africa, in order to permitprior amendment agreement with Novartis which permitted Novartis not to make a determination about launching Sativex in any country in its territory until final data iswas available for the two Phase 3 clinical trials we are conducting for Sativex in cancer pain.
Disagreements between parties to a collaboration arrangement regarding development, intellectual property, regulatory or commercialization matters, can lead to delays in the development process or commercialization of the applicable product candidate and, in some cases, termination of the collaboration arrangement. These disagreements can be difficult to resolve if neither of the parties has final decision making authority.
Collaborations with pharmaceutical or biotechnology companies and other third parties often are terminated or allowed to expire by the other party. Any such termination or expiration would adversely affect us financially and could harm our business reputation.
| 21 |
We depend on a limited number of suppliers for materials and components required to manufacture Sativex and our other product candidates. The loss of these suppliers, or their failure to supply us on a timely basis, could cause delays in our current and future capacity and adversely affect our business.
We depend on a limited number of suppliers for the materials and components required to manufacture Sativex and our other product candidates. For example, we rely on single-source suppliers to supply various components of Sativex, including the glass vial and pump actuator, and dose counter. In addition, we rely on a single contractor for commercial supply of botanical raw material.material for Sativex. Although we are actively working on expanding the number of suppliers and facilities for Epidiolex production, at present we have two independent contractors who supply botanical raw material for Epidiolex but are otherwise dependent on single-source suppliers and facilities for producing Epidiolex. As a result, we may not be able to obtain sufficient quantities of critical materials and components in the future. A delay or interruption by our suppliers may also harm our business, results of operations and financial condition. In addition, the lead time needed to establish a relationship with a new supplier can be lengthy, and we may experience delays in meeting demand in the event we must switch to a new supplier. The time and effort to qualify for and, in some cases, obtain regulatory approval for a new supplier could result in additional costs, diversion of resources or reduced manufacturing yields, any of which would negatively impact our operating results. Our dependence on single-source suppliers exposes us to numerous risks, including the following: our suppliers may cease or reduce production or deliveries, raise prices or renegotiate terms; our suppliers may become insolvent or cease trading; we may be unable to locate a suitable replacement supplier on acceptable terms or on a timely basis, or at all; and delays caused by supply issues may harm our reputation, frustrate our customers and cause them to turn to our competitors for future needs.
A significant portion of our cash and cash equivalents are held at a small number of banks.
A significant portion of our cash and cash equivalents is presently held at a small number of banks. Although our board has adopted a treasury policy requiring us to limit the amount of cash held by each banking group taking into account their credit ratings, we are subject to credit risk if any of these banks are unable to repay the balance in the applicable account or deliver our securities or if any bank should become bankrupt or otherwise insolvent. Any of the above events could have a material and adverse effect on our business, results of operations and financial condition.
Risks Related to Our Intellectual Property
We may not be able to adequately protect Sativex, our product candidates or our proprietary technology in the marketplace.marketplace.
Our success will depend, in part, on our ability to obtain patents, protect our trade secrets and operate without infringing on the proprietary rights of others. We rely upon a combination of patents, trade secret protection (i.e., know-how)know how), and confidentiality agreements to protect the intellectual property of Sativex and our product candidates. The strengths of patents in the pharmaceutical field involve complex legal and scientific questions and can be uncertain. Where appropriate, we seek patent protection for certain aspects of our products and technology. Filing, prosecuting and defending patents throughout the world would be prohibitively expensive, so our policy is to patent commercially potential technology in jurisdictions with significant commercial opportunities. However, patent protection may not be available for some of the products or technology we are developing. If we must spend significant time and money protecting, defending or enforcing our patents, designing around patents held by others or licensing, potentially for large fees, patents or other proprietary rights held by others, our business, results of operations and financial condition may be harmed. We may not develop additional proprietary products that are patentable.
The patent positions of pharmaceutical products are complex and uncertain. The scope and extent of patent protection for Sativex and our product candidates are particularly uncertain. To date, our principal product candidates, including Sativex and Epidiolex, have been based on specific formulations of certain previously known cannabinoids found in nature in the cannabis sativa plant. While we have sought patent protection directed to, among other things, composition of matter for our specific formulations, their methods of use, and methods of manufacture, we do not have and will not be able to obtain composition of matter protection on these previously known cannabinoidsper se.se. We anticipate that the products we develop in the future will continue to include or be based on the same or other naturally occurring compounds, as well as synthetic compounds we may discover. Although we have sought and expect to continue to seek patent protection for our product candidates, their methods of use, and methods of manufacture, any or all of them may not be subject to effective patent protection. Publication of information related to Sativex and our product candidates by us or others may prevent us from obtaining or enforcing patents relating to these products and product candidates. Furthermore, others may independently develop similar products, may duplicate our products, or may design around our patent rights. In addition, any of our issued patents may be opposed and/or declared invalid or unenforceable. Indeed, a number of our recently issued European patents, including our European patent claiming the use of CBD in the treatment of partial seizures, have received notices of opposition, which may result in claims in these patents being narrowed or cancelled such that the scope of the opposed patent may not be as broad, or the opposed patent may be revoked in its entirety. In the case of our European patent claiming the use of CBD in the treatment of partial seizures, the granted claims were upheld at first instance, but this decision may be appealed. If we fail to adequately protect our intellectual property, we may face competition from companies who attempt to create a generic product to compete with Sativex.Sativex or Epidiolex. We may also face competition from companies who develop a substantially similar product to Sativex, Epidiolex or one of our other product candidates that is not covered by any of our patents.
Many companies have encountered significant problems in protecting, defending and enforcing intellectual property rights in foreign jurisdictions. The legal systems of certain countries, particularly certain developing countries, do not favor the enforcement of patents and other intellectual property rights, particularly those relating to pharmaceuticals, which could make it difficult for us to stop the infringement of our patents or marketing of competing products in violation of our proprietary rights generally. Proceedings to enforce our patent rights in foreign jurisdictions could result in substantial cost and divert our efforts and attention from other aspects of our business.
| 22 |
Risks Related to Controlled Substances
Controlled substance legislation differs between countries and legislation in certain countries may restrict or limit our ability to sell Sativex and our product candidates.candidates.
Most countries are parties to the Single Convention on Narcotic Drugs 1961, which governs international trade and domestic control of narcotic substances, including cannabis extracts. Countries may interpret and implement their treaty obligations in a way that creates a legal obstacle to our obtaining marketingregulatory approval for Sativex, Epidiolex and our other products in those countries. These countries may not be willing or able to amend or otherwise modify their laws and regulations to permit Sativex, Epidiolex or our other products to be marketed, or achieving such amendments to the laws and regulations may take a prolonged period of time. For example, we are currently unable to file a regulatory application in Mexico or Japan due to a national law which the regulators consider prevents the approval of a cannabis-based medicine. Until recently, France had similar legal obstacles in place preventing the filing of a regulatory application for Sativex, but that legal obstacle was satisfactorily resolved in 2013 and the French regulatory authorities have now approved Sativex. In the case of countries with similar obstacles, we would be unable to market Sativex, Epidiolex and our product candidates in countries in the near future or perhaps at all if the laws and regulations in those countries do not change.
Sativex and the otherThe product candidates we are developing will be subject to U.S. controlled substance laws and regulations and failure to comply with these laws and regulations, or the cost of compliance with these laws and regulations, may adversely affect the results of our business operations, both during clinical development and post approval, and our financial condition.condition.
Sativex and certainThe product candidates we are developing contain controlled substances as defined in the federal Controlled Substances Act of 1970, or CSA. Controlled substances that are pharmaceutical products are subject to a high degree of regulation under the CSA, which establishes, among other things, certain registration, manufacturing quotas, security, recordkeeping, reporting, import, export and other requirements administered by the DEA. The DEA classifies controlled substances into five schedules: Schedule I, II, III, IV or V substances. Schedule I substances by definition have a high potential for abuse, no currently "accepted“accepted medical use"use” in the United States, lack accepted safety for use under medical supervision, and may not be prescribed, marketed or sold in the United States. Pharmaceutical products approved for use in the United States may bewhich contain a controlled substance are listed as Schedule II, III, IV or V, with Schedule II substances considered to present the highest potential for abuse or dependence and Schedule V substances the lowest relative risk of abuse among such substances. Schedule I and II drugs are subject to the strictest controls under the CSA, including manufacturing and procurement quotas, security requirements and criteria for importation. In addition, dispensing of Schedule II drugs is further restricted. For example, they may not be refilled without a new prescription.
While cannabis is a Schedule I controlled substance, products approved for medical use in the United States that contain cannabis or cannabis extracts mustshould be placed in Schedules II-V, since approval by the FDA satisfies the "accepted“accepted medical use"use” requirement. If and when Sativex receivesany of our product candidates receive FDA approval, the DEA will make a scheduling determination and place itthe product in a schedule other than Schedule I in order for it to be prescribed to patients in the United States. If approved by the FDA, we expect the finished dosage form of SativexEpidiolex to be listed bycontrolled in Schedule III or IV. Consequently, the DEA as a Schedule II or III controlled substance. Consequently, its manufacture, importation, exportation, domestic distribution, storage, sale and legitimate use will be subject to aspecific and potentially significant degreelevels of regulation by the DEA. In addition,On November 25, 2015 the scheduling process may take one or more years, thereby delaying the launchPresident of Sativex in the United States.States signed a new law that (i) amends the CSA to require the DEA to issue an interim final scheduling rule within ninety days following FDA approval and the Secretary of Health and Human Services recommending that the Attorney General control the drug in Schedule II, III, IV or V, and (ii) amends the FDCA to ensure that companies do not lose exclusivity on newly approved drugs because of the DEA drug scheduling process. Insys Therapeutics Inc., a competitor who is developing products for the treatment of Dravet Syndrome and LGS (among other indications) which are based on CBD produced by a synthetic process, has already petitioned DEA to reschedule its synthetic CBD. Any DEA rescheduling action on the Insys petition might be limited to CBD produced by a synthetic process and thereby not apply to our product. If Insys succeeds with its petition before its product is approved by FDA, it will avoid the 90-day post-FDA approval rescheduling delay. Furthermore, if the FDA, DEA, or any foreign regulatory authority determines that Sativex or Epidiolex may have potential for abuse, it may require us to generate more clinical or other data than we currently anticipate to establish whether or to what extent the substance has an abuse potential, which could increase the cost and/or delay the launch of Sativex.that product.
DEA registration and inspection of facilities. Facilities conducting research, manufacturing, distributing, importing or exporting, or dispensing controlled substances must be registered (licensed) to perform these activities and have the security, control, recordkeeping, reporting and inventory mechanisms required by the DEA to prevent drug loss and diversion. All these facilities must renew their registrations annually, except dispensing facilities, which must renew every three years. The DEA conducts periodic inspections of certain registered establishments that handle controlled substances. Obtaining the necessary registrations may result in delay of the importation, manufacturing or distribution of Sativex Epidiolex and our other product candidates.and/or Epidiolex. Furthermore, failure to maintain compliance with the CSA, particularly non-compliance resulting in loss or diversion, can result in regulatory action that could have a material adverse effect on our business, financial condition and results of operations. The DEA may seek civil penalties, refuse to renew necessary registrations, or initiate proceedings to restrict, suspend or revoke those registrations. In certain circumstances, violations could lead to criminal proceedings.
State-controlled substances laws. Individual states have also established controlled substance laws and regulations. Though state-controlled substances laws often mirror federal law, because the states are separate jurisdictions, they may separately schedule Sativex, Epidiolex and our other product candidates as well. While some states automatically schedule a drug based on federal action, other states schedule drugs through rulemaking or a legislative action. State scheduling may delay commercial sale of any product for which we obtain federal regulatory approval and adverse scheduling could have a material adverse effect on the commercial attractiveness of such product. We or our partners must also obtain separate state registrations, permits or licenses in order to be able to obtain, handle, and distribute controlled substances for clinical trials or commercial sale, and failure to meet applicable regulatory requirements could lead to enforcement and sanctions by the states in addition to those from the DEA or otherwise arising under federal law.
| 23 |
Clinical trials. Because Sativex Epidiolex and our other product candidatesEpidiolex contain cannabis extracts, which are Schedule I substances, to conduct clinical trials with Sativex Epidiolex and our other product candidatesEpidiolex in the United States prior to approval, each of our research sites must submit a research protocol to the DEA and obtain and maintain a DEA researcher registration that will allow those sites to handle and dispense Sativex and/or Epidiolex and our other product candidates(as applicable) and to obtain the product from our importer. If the DEA delays or denies the grant of a research registration to one or more research sites, the clinical trial could be significantly delayed, and we could lose clinical trial sites. The importer for the clinical trials must also obtain a Schedule I importer registration and an import permit for each import. We do not currently conduct any manufacturing or repackaging/relabeling of either Sativex Epidiolex and our other product candidates or theirits active ingredients (i.e., the cannabis extract) or Epidiolex or its active ingredient (purified CBD) in the United States. Sativex and Epidiolex and our other product candidates are both imported in fully finished,fully-finished, packaged and labeled dosage form.forms.
Importation. If Sativex, Epidiolex andone of our other product candidates areis approved and classified as a Schedule II or III substance, an importer can import for commercial purposes if it obtains an importer registration and files an application for an import permit for each import. The DEA provides annual assessments/estimates to the International Narcotics Control Board which guides the DEA in the amounts of controlled substances that the DEA authorizes to be imported. The failure to identify an importer or obtain the necessary import authority, including specific quantities, could affect theproduct availability of Sativex, Epidiolex and our other product candidates and have a material adverse effect on our business, results of operations and financial condition. In addition, an application for a Schedule II importer registration must be published in the Federal Register, and there is a waiting period for third-partythird party comments to be submitted. It is always possible a competitor could take this opportunity to make adverse comments that delay the grant of an importer registration.
If Sativex, Epidiolex andone of our other product candidates areis approved and classified as a Schedule II controlled substance, federal law may prohibit the import of the substance for commercial purposes. If Sativex, Epidiolex and our othera product candidates areis listed as a Schedule II substance, we will not be allowed to import thethat drug for commercial purposes unless the DEA determines that domestic supplies are inadequate or there is inadequate domestic competition among domestic manufacturers for the substance as defined by the DEA. It is always possible the DEA could find that the active substance in a product, even if it is a plant derived substance, could be manufactured in the US. Moreover, Schedule I controlled substances, including BDSs, have never been registered with the DEA for importation commercial purposes, only for scientific and research needs. Therefore, if neither Sativex nor its BDSs, nor Epidiolex our other product candidates or their BDSsits purified BDS could not be imported, theythat product would have to be wholly manufactured in the United States, and we would need to secure a manufacturer that would be required to obtain and maintain a separate DEA registration for that activity.
Manufacture in the United States. If, because of a Schedule II classification or voluntarily, we were to conduct manufacturing or repackaging/relabeling in the United States, our contract manufacturers would be subject to the DEA’s annual manufacturing and procurement quota requirements. Additionally, regardless of the scheduling of Sativex and Epidiolex, or our other product candidates, cannabis and the BDSs comprising the active ingredient in the final dosage form are currently Schedule I controlled substances and would be subject to such quotas as these substances could remain listed on Schedule I. The annual quota allocated to us or our contract manufacturers for the active ingredientingredients in Sativex, Epidiolex and our other product candidatesproducts may not be sufficient to complete clinical trials or meet commercial demand or complete clinical trials.demand. Consequently, any delay or refusal by the DEA in establishing our, or our contract manufacturers,manufacturers’, procurement and/or production quota for controlled substances could delay or stop our clinical trials or product launches, which could have a material adverse effect on our business, results of operationsfinancial position and financial condition.operations.
Distribution in the United States. If Sativex, Epidiolex orany of our other product candidates areis scheduled as Schedule II or III, we would also need to identify wholesale distributors with the appropriate DEA and state registrations and authority to distribute the product to pharmacies and other health care providers. We would need to identify distributors to distribute the product to pharmacies; these distributors would need to obtain Schedule II or III distribution registrations. The failure to obtain, or delay in obtaining, or the loss any of those registrations could result in increased costs to us. If Sativex, Epidiolex orany of our other product candidates areis a Schedule II drug, pharmacies would have to maintain enhanced security with alarms and monitoring systems and they must adhere to recordkeeping and inventory requirements. This coupled with the fact that Sativex, Epidiolex and our other product candidates must be refrigerated, may discourage some pharmacies from carrying the product.either or both of these products. Furthermore, state and federal enforcement actions, regulatory requirements, and legislation intended to reduce prescription drug abuse, such as the requirement that physicians consult a state prescription drug monitoring program may make physicians less willing to prescribe, and pharmacies to dispense, Schedule II products.
The approval and use of medical and recreational marijuana in various U.S. states may impact our business.
There is a substantial amount of change occurring in various states of the United States regarding the use of medical and recreational marijuana." While marijuana is a Schedule 1I substance as defined under federal law, and its possession and use is not permitted according to federal law, a number of individual states have enacted state laws to enable possession and use of marijuana for medical purposes, and in some states for recreational purposes also. Our business is quite distinct from that of crude herbal marijuana, however, our prospects may be impacted by developments of these laws at the state level in the United States.
Risks Related to Ownership of our American Depositary Shares (ADSs) and Ordinary Shares
The liquidity of our ADSs may have an adverse effect on share price.
As at September 30, 2016, we had 302,093,139 ordinary shares outstanding. Of these ordinary shares, 226,162,356 were held as ADSs and 75,930,783 were held as ordinary shares outside the ADS facility. In connection with our May 2013 initial public offering, or IPO, of ADSs on the NASDAQ Global Market, we issued 3,678,000 ADSs. In January 2014 we issued an additional 2,807,275 ADSs in a public offering on the NASDAQ Global Market. In June 2014 we issued an additional 1,455,000 ADSs and certain selling shareholders sold an additional 500,000 ADSs in a public offering on the NASDAQ Global Market. In May 2015 we issued an additional 1,840,000 ADSs in a public offering on the NASDAQ Global Market. In July 2016 we issued an additional 3,220,000 ADSs in a public offering on the NASDAQ Global Market. There is a risk that there may not be sufficient liquidity in the market to accommodate significant increases in selling activity or the sale of a large block of our securities. Our ADSs have historically had limited trading volume, which may also result in volatility.
| 24 |
Additionally, as at September 30, 2016 our ADSs were traded on NASDAQ and our ordinary shares are traded on AIM. On August 16, 2016, London Stock Exchange plc agreed that we could cancel the admission of our ordinary shares to trading on AIM without needing to seek the consent of shareholders. On October 19, 2016 we published a circular to our shareholders notifying them of our intention to cancel the admission of our ordinary shares to trading on AIM on December 5, 2016, and on December 5, 2016 the admission of the Company’s ordinary shares to trading on AIM was cancelled. The last day of dealing in the Company’s ordinary shares on AIM was December 2, 2016. We cannot predict the effect that such cancellation will have on the market price of the ADSs (if any) and it may have an adverse effect on the market price of the ADSs.
The market price of our ADSs and ordinary shares may be volatile.
Many factors may have a material adverse effect on the market price of the ADSs, including, but not limited to:
| 25 |
In addition, the stock market in general, and Nasdaq Global MarketNASDAQ in particular, have experienced extreme price and volume fluctuations that have often been unrelated or disproportionate to the operating performance of individual companies. Broad market and industry factors may negatively affect the market price of our ADSs, regardless of our actual operating performance.
The liquidityIn the past, following periods of our ADSs and ordinary shares may have an adverse effect on share price.
As at September 30, 2014, we had 236,646,895 ordinary shares outstanding. Of these shares, 142,843,540 of our ordinary shares were held as ADSs and 93,803,355 were held as ordinary shares outside the ADS facility. In connection with our May 2013 initial public offering, or IPO, of ADSs on the Nasdaq Global Market, we issued 3,678,000 ADSs. In January 2014 we issued an additional 2,807,275 ADSsvolatility in a public offering on the Nasdaq Global Market. In June 2014 we issued an additional 1,455,000 ADSs and certain selling shareholders sold an additional 500,000 ADSs in a public offering on the Nasdaq Global Market. There is a risk that there may not be sufficient liquidity in the market to accommodate significant increases in selling activity or the sale of a large block of our securities. Our ADSs have historically had limited trading volume, which may also result in volatility.
Additionally, our ADSs are traded on the Nasdaq Global Market and our ordinary shares are traded on the AIM. We cannot predict the effect of this dual listing on the value of our ordinary shares and ADSs. However, the dual listing of our ordinary shares and ADSs may dilute the liquidity of these securities in one or both markets and may adversely affect the development of an active trading market for the ADSs in the United States. The price of the ADSs could also be adversely affected by trading in our ordinary shares on the AIM. We are actively considering whether to delist our ordinary shares from the AIM in the future. We cannot predict the effect such delisting of our ordinary shares would have on the market price of a company’s securities, securities class-action litigation often has been instituted against that company. In January 2016, a shareholder-initiated class action lawsuit was filed against us. While this lawsuit has been dismissed, similar litigation if initiated against us in the ADSs.future, could cause us to incur substantial costs to defend such claims and divert management’s attention and resources, which could seriously harm our business, financial condition, results of operations and prospects.
Our largest shareholder owns a significant percentage of the share capital and voting rights of GW.
As of September 30, 2016, Capital Research and Management Company held approximately 15.01% of our issued share capital, accounting for approximately 15.01% of the voting rights of the Company. To the extent Capital Research and Management Company continues to hold a large percentage of our share capital and voting rights, it will remain in a position to exert greater influence in the appointment of the directors and officers of GW and in other corporate actions that require shareholders’ approval.
Substantial future sales of our ordinary shares or the ADSs in the public market, or the perception that these sales could occur, could cause the price of the ADSs to decline.
Sales of our ordinary shares or ADSs in the public market, or the perception that these sales could occur, could cause the market price of the ADSs to decline. The ordinary shares held by our directors, including our officers, are available for sale in the form of ADSs and are not subject to contractual and legal restrictions on resale. If any of our large shareholders or members of our management team seek to sell substantial amounts of our ADSs, particularly if these sales are in a rapid or disorderly manner, or other investors perceive that these sales could occur, the market price of our ADSs could decrease significantly.
As a foreign private issuer, we are not subject to certain NasdaqNASDAQ Global Market corporate governance rules applicable to U.S. listed companies and are subject to reporting obligations that are different and less frequent than those of a U.S. listed company. As a result, investors in our securities may not have the same protections afforded to shareholders of companies that are not foreign private issuers.
We rely on a provision in Nasdaq’sNASDAQ’s Global Market Listed Company Manual that allows us to follow English corporate law and the Companies Act 2006 with regard to certain aspects of corporate governance. This allows us to follow certain corporate governance practices that differ in significant respects from the corporate governance requirements applicable to U.S. companies listed on the NasdaqNASDAQ Global Market.
For example, we are exempt from NasdaqNASDAQ Global Market regulations that require a U.S. listed company to:
As a foreign private issuer, we are permitted to, and we will continue to, follow home country practice in lieu of the above requirements.
Because we qualify and report as a foreign private issuer under the Exchange Act of 1934, as amended (the “Exchange Act”), we are exempt from certain provisions of the Exchange Act that are applicable to U.S. public companies, including (i) the sections of the Exchange Act regulating the solicitation of proxies, consents or authorizations in respect of a security registered under the Exchange Act, (ii) the sections of the Exchange Act requiring insiders to file public reports of their stock ownership and trading activities and liability for insiders who profit from trades made in a short period of time, and (iii) the rules under the Exchange Act requiring the filing with the Securities and Exchange Commission of quarterly reports on Form 10-Q containing unaudited financial and other specified information, or current reports on Form 8-K, upon the occurrence of specified significant events. We intend to continue to furnish quarterly reports to the Securities and Exchange Commission on Form 6-K for so long as we are subject to the reporting requirements of Section 13(g) or 15(d) of the Exchange Act, although the information we furnish may not be the same as the information that is required in quarterly reports on Form 10-Q for U.S. domestic issuers. In addition, while U.S. domestic issuers that are large accelerated filers are required to file their annual reports on Form 10-K within 60 days after the end of each fiscal year foreign private issuers are not required to file their annual report on Form 20-F until 120 days after the end of each fiscal year. Foreign private issuers are also exempt from Regulation Fair Disclosure, aimed at preventing issuers from making selective disclosures of material information. Although we intend to make quarterly financial reports available to our shareholders in a timely manner, investors in our securities may not have the same protections afforded to shareholders of companies that are not foreign private issuers.
| 26 |
Because we are listed on the NasdaqNASDAQ Global Market, our Audit Committee is required to comply with the provisions of Section 301 of the Sarbanes-Oxley Act of 2002, or the Sarbanes-Oxley Act, and Rule 10A-3 of the Exchange Act, both of which are also applicable to NasdaqNASDAQ Global Market-listed U.S. companies. Because we are a foreign private issuer, however, our Audit Committee is not subject to additional NasdaqNASDAQ Global Market requirements applicable to U.S. listed companies, including an affirmative determination that all members of the Audit Committee are “independent,” using more stringent criteria than those applicable to us as a foreign private issuer.
We may lose our foreign private issuer status in the future, which could result in significant additional costs and expenses.
We are a “foreign private issuer,” as such term is defined in Rule 405 under the Securities Act of 1933 as amended (the “Securities Act”), and therefore we are not required to comply with all the periodic disclosure and current reporting requirements of the Exchange Act and related rules and regulations. Under Rule 405, the determination of foreign private issuer status is made annually on the last business day of an issuer’s most recently completed second fiscal quarter and, accordingly, the next determination will be made with respect to us on March 31, 2015.2017.
In the future, we would lose our foreign private issuer status if a majority of our ordinary shares (including those represented by ADSs) are owned by U.S. shareholders and a majority of our shareholders, directors or management are U.S. citizens or residents and we fail to meet additional requirements necessary to avoid loss of foreign private issuer status. The regulatory and compliance costs to us under applicable U.S. securities laws as a U.S. domestic issuer may be significantly higher than our current regulatory and compliance costs. If we are not a foreign private issuer, we will be required to file periodic reports and registration statements on U.S. domestic issuer forms with the SEC, which are more detailed and extensive than the forms available to a foreign private issuer. For example, the annual report on Form 10-K requires domestic issuers to disclose executive compensation information on an individual basis with specific disclosure regarding the domestic compensation philosophy, objectives, annual total compensation (base salary, bonus, equity compensation) and potential payments in connection with change in control, retirement, death or disability, while the annual report on Form 20-F permits foreign private issuers to disclose compensation information on an aggregate basis. We will also have to report our results under U.S. Generally Accepted Accounting Principles, rather than under International Financial Reporting Standards, as a domestic registrant. We will have to restate our previously-reported financial statements under U.S. Generally Accepted Accounting Principles. We will also have to mandatorily comply with U.S. federal proxy requirements, and our officers, directors and principal shareholders will become subject to the short-swing profit disclosure and recovery provisions of Section 16 of the Exchange Act. We may also be required to modify certain of our policies to comply with corporate governance practices required for U.S. domestic issuers. Such conversion and modifications will involve additional costs. In addition, we may lose our ability to rely upon exemptions from certain corporate governance requirements of the NasdaqNASDAQ Global Market that are available to foreign private issuers.
We incur significant increased costs as a result of operating as a company whose ADSs are publicly traded in the United States, and our management is required to devote substantial time to new compliance initiatives.
As a company whose ADSs commenced trading in the United States in May 2013, we incur significant legal, accounting, insurance and other expenses that we did not previously incur. In addition, the Sarbanes-Oxley Act, Dodd-Frank Wall Street Reform and Consumer Protection Act and related rules implemented by the SEC and NasdaqNASDAQ Global Market have imposed various requirements on public companies including requiring establishment and maintenance of effective disclosure and financial controls. Because we are no longer an emerging growth company under the Jumpstart Our Business Startups Act of 2012 (JOBS Act), weWe are required to comply with Section 404(b) of the Sarbanes-Oxley Act, which involves considerable management time and expenses. Our management and other personnel need to devote a substantial amount of time to these compliance initiatives. Moreover, these rules and regulations increase our legal and financial compliance costs, relative to companies that are listed solely in the United Kingdom, and make some activities more time-consuming and costly. We estimate that our annual compliance expenses will be approximately £1.2£1.5 million in each of the next two fiscal years. These rules and regulations have also made it more difficult and more expensive for us to obtain director and officer liability insurance, and we may be required to incur substantial costs to maintain the same or similar coverage. These laws and regulations could also make it more difficult and expensive for us to attract and retain qualified persons to serve on our board of directors, our board committees or as our executive officers. Furthermore, if we are unable to satisfy our obligations as a public company, we could be subject to delisting of the ADSs, fines, sanctions and other regulatory action and potentially civil litigation.
We had a material weakness in our internal control over financial reporting for the year ended September 30, 2014, which could result in our financial statements not being prepared properly.
Our management identified a material weakness and concluded that our internal controls over financial reporting were not effective as of September 30, 2014. A material weakness (within the meaning of PCAOB Auditing Standard No. 5) is a deficiency, or a combination of deficiencies, in internal controls over financial reporting, such that there is a reasonable possibility that a material misstatement of our annual or interim financial statements will not be prevented or detected on a timely basis. Our management determined that our oversight of complex transactions is not effective. Specifically, management lacks the expertise to evaluate the accounting requirement of certain non-routine and complex transactions. From time to time we will encounter non-routine accounting transactions that require a high level of technical accounting expertise. Non-routine accounting transactions will likely increase in frequency as we continue to grow and expand our operations. A material weakness makes it a reasonable possibility that a material misstatement of our annual or interim financial statements will not be prevented or detected on a timely basis. In the event that the material weakness described above led to our financial statements not being prepared properly (which we currently do not believe to be the case), we would be required to restate our financial statements, which could result in a loss of investor confidence and a decline in the price of our ADSs.
U.S. investors may have difficulty enforcing civil liabilities against our Company, our directors or members of senior management and the experts named in this Annual Report.Report on Form 20-F.
OurExcept for Justin Gover, Julian Gangolli, and Cabot Brown, our directors and the experts named in this Annual Report on Form 20-F are non-residents of the United States, and all or a substantial portion of the assets of such persons are located outside the United States. As a result, it may not be possible to serve process on such persons or us in the United States or to enforce judgments obtained in U.S. courts against them or us based on civil liability provisions of the securities laws of the United States. Mayer Brown International LLP, our English solicitors, advised us that there is doubt as to whether English courts would enforce certain civil liabilities under U.S. securities laws in original actions or judgments of U.S. courts based upon these civil liability provisions. In addition, awards of punitive damages in actions brought in the United States or elsewhere may be unenforceable in the United Kingdom. An award for monetary damages under the U.S. securities laws would be considered punitive if it does not seek to compensate the claimant for loss or damage suffered and is intended to punish the defendant. The enforceability of any judgment in the United Kingdom will depend on the particular facts of the case as well as the laws and treaties in effect at the time. The United States and the United Kingdom do not currently have a treaty providing for recognition and enforcement of judgments (other than arbitration awards) in civil and commercial matters.
| 27 |
The rights of our shareholders may differ from the rights typically offered to shareholders of a U.S. corporation.
We are incorporated under English law. The rights of holders of ordinary shares, and therefore certain of the rights of holders of ADSs, are governed by English law, including the provisions of the Companies Act 2006, and by our Articles. These rights differ in certain respects from the rights of shareholders in typical U.S. corporations. See “Description of Share Capital — Differences in Corporate Law” in our Registration Statement on Form F-3 (File No. 333-195747), filed with the SEC on May 7, 2014 and which is incorporated by reference into this Annual Reportdocument for a description of the principal differences between the provisions of the Companies Act 2006 applicable to us and, for example, the Delaware General Corporation Law relating to shareholders’ rights and protections.
We believe we aremay be classified as a passive foreign investment company, or a PFIC, in any taxable year and U.S. holders of our ordinary shares could be subject to adverse U.S. federal income tax consequences.
The rules governing passive foreign investment companies, or PFICs, can have adverse effects for U.S. federal income tax purposes. The tests for determining PFIC status for a taxable year depend upon the relative values of certain categories of assets and the relative amounts of certain kinds of income. The determination of whether we are a PFIC depends on the particular facts and circumstances (such as the valuation of our assets, including goodwill and other intangible assets) and may also be affected by the application of the PFIC rules, which could result inare subject to differing interpretations. Based on our estimated gross income, the average value of our assets, including goodwill and the nature of our active business, we do not believe that we were classified as a PFIC for U.S. federal income tax purposes for our taxable year ended September 30, 2016.
If we are a PFIC, U.S. holders of our ordinary shares would be subject to adverse U.S. federal income tax consequences, to U.S. Holders.
Under the U.S. Internal Revenue Code of 1986,such as amended, or Code, we will be a PFICineligibility for any taxable year in which, after the application of certain “look-through” rules with respect to subsidiaries, either (i) 75%preferred tax rates on capital gains or more of our gross income for the taxable year is passive income;on actual or (ii) on average at least 50% of the value of our assets produce passive income or are held for the production of passive income. Passive income for this purpose generally includes, among other things, certaindeemed dividends, interest royalties, rentscharges on certain taxes treated as deferred, and gains from commodities and securities transactions and from the sale or exchange of property that gives rise to passive income. Whether we will be a PFIC in any year depends on the composition of our income and assets, and the relative fair market value of our assets from time to time, which we expect may vary substantially over time. Because we currently own a substantial amount of passive assets, including cash, we believe we are a PFIC as of the end of our fiscal year ended September 30, 2014.
As a result of our PFIC status, if a U.S. Holder (as defined below) holds ADSs during any taxable year beginning with 2014, a U.S. Holder may be subject to adverse tax consequences, including (i) if a mark-to-market election or a qualified electing fund, or QEF, election has not been made with respect to its ADSs, a U.S. Holder may incur significant additional reporting requirements under U.S. federal income taxes on income resulting from distributions on, or any gain from the disposition of, such ADSs, as such income generally would be allocated over the U.S. Holder’s holding period for its ADSstax laws and would be subject to tax at the highest rates of U.S. federal income taxation in effect for such years, with an interest charge then imposed on the resulting taxes in respect of such income, and (ii) dividends paid by us would not be eligible for preferential individual rates of U.S. federal income tax. In addition, U.S. Holders that own an interest in a PFIC are required to comply with certain reporting requirements.
regulations. A U.S. Holderholder of our ordinary shares may in certain circumstancesbe able to mitigate adverse tax consequences of the PFIC rules by filing an election to treat the PFIC as QEF, or, if shares of the PFIC are “marketable stock” for purposes of the PFIC rules, by making a mark-to-market election with respect to the shares of the PFIC. We do not intend to comply with the reporting requirements necessary to permit U.S. Holders to elect to treat us as a QEF. If a U.S. Holder makes a mark-to-market election with respect to its ADSs, the U.S. Holder is required to include annually in its U.S. federal taxable income an amount reflecting any year-end increase in the value of its ADSs. For further discussionsome of the adverse U.S. federal income tax consequences described above with respect to owning the ordinary shares if we are classified as a PFIC, provided that such U.S. investor is eligible to make, and validly makes, a “mark-to-market” election. In certain circumstances a U.S. Holder can make a “qualified electing fund” election to mitigate some of the adverse tax consequences described with respect to an ownership interest in a PFIC by including in income its share of the PFIC’s income on a current basis. However, we do not currently intend to prepare or provide the information that would enable a U.S. Holder to make a qualified electing fund election.
Investors should consult their own tax advisors regarding all aspects of the application of the PFIC rules to our ordinary shares. For more information related to classification as a PFIC, and the elections available to a U.S. Holder, see “Taxation—“Taxation — U.S. Federal Income Taxation –— Passive Foreign Investment Company.”
| 28 |
| Item 4 | Information on the Company. |
| A. | History and Development of the Company |
GW Pharmaceuticals plc was founded in 1998 and is a public limited company incorporated under the laws of England and Wales. Since June 28, 2001, ourOur ordinary shares have been listedwere admitted to trading on the Alternative Investment Market, or AIM, a market operated by London Stock Exchange plc, under the symbol GWP.GWP on June 28, 2001. The admission of our ordinary shares to trading on AIM was cancelled with effect from 7.00am on December 5, 2016. On May 1, 2013, we completed our initial public offering of American Depositary Shares, or ADSs, on the NasdaqNASDAQ Global Market. Our ADSs are traded under the symbol GWPH.
Our registered and principal executive offices are located at Porton Down ScienceSovereign House, Vision Park, Salisbury, Wiltshire, SP4 0JQ,Chivers Way, Histon, Cambridge, CB24 9BZ, United Kingdom, our general telephone number is (+44) 198 055-7000(44) 1223 266-800 and our internet address is http://www.gwpharm.com. Our website and the information contained on or accessible through our website are not part of this document. Our agent for service of process in the United States is CT Corporation, System, 111 Eighth Avenue, 13th Floor, New York, NY 10011.
In the three-year period ended September 30, 2014, we have invested a total of £12.6 million in equipment and facilities. In our year ended September 30, 2014 we entered into contracts for the construction, fitout and 20 year lease of a new 10,000 square feet manufacturing facility and we expect to enter into a lease for a further 8,000 square feet of property within the near term.
| B. | Business |
Overview
We are a biopharmaceutical company focused on discovering, developing and commercializing novel therapeutics from our proprietary cannabinoid product platform in a broad range of disease areas. In our over 1518 years of operations, we have established a world-leadingworld leading position in the development of plant-derived cannabinoid therapeutics through our proven drug discovery and development processes, our intellectual property portfolio and our regulatory and manufacturing expertise. We commercialized the world’s firstOur lead cannabinoid product candidate is Epidiolex, a liquid formulation of pure plant-derived cannabinoid prescription drug, Sativex, which is approved for the treatment of spasticity due to multiple sclerosis,cannabidiol, or MS, in 27 countries outside the United States. We are also evaluating Sativex in a Phase 3 program for the treatment of cancer pain,CBD, for which we haveretain global commercial rights, and which is in development for a number of rare childhood-onset epilepsy disorders. We received Fast TrackOrphan Drug Designation from the U.S. Food and Drug Administration, or FDA. We anticipate that top-line results from at least one of the two ongoing pivotal Phase 3 of Sativex for cancer pain trials will be available in early 2015. Top-line results from the second pivotal Phase 3 trial are expected in the second quarter of 2015. This program is intended to support the submission of a New Drug Application, or NDA, for Sativex in cancer pain with the FDA, and in other markets around the world.
We have a deep pipeline of additional cannabinoid product candidates, including orphan drug opportunities with a particular focus on pediatric epilepsy. We are developing Epidiolex, our proprietary product candidate that contains a liquid formulation of a pure plant-derived CBD as its active ingredient, as a treatment for severe, drug-resistant childhood epilepsy. We have received Orphan Drug Designation from the FDA for Epidiolex for the treatment of both Dravet syndrome and Lennox-Gastaut syndrome, or LGS, each of which are severe infantile-onset, genetic, drug-resistant epilepsy syndromes. We have also received Fast Track Designation from the FDA, for Epidiolex for the treatment of Dravet syndrome. Wesyndrome, Lennox-Gastaut syndrome, or LGS, Tuberous Sclerosis Complex, or TSC, and Infantile Spasms, or IS, each of which are severe infantile-onset, drug-resistant epilepsy syndromes. Additionally, we have also received Fast Track Designation from the FDA and Orphan Designation from the European Medicines Agency, or EMA, for Epidiolex for the treatment of Dravet syndrome. A company-sponsored placebo-controlled Phase 2/3 Dravet syndrome clinical trial has commenced. An additionalIn March 2016, we reported positive results from the first pivotal Phase 3 trial of Epidiolex in Dravet syndrome clinical trial is expected to commence insyndrome. In June 2016, we reported positive results from the first quarterpivotal Phase 3 trial of 2015.Epidiolex in LGS. In July 2016, we held a positive pre-NDA meeting with the FDA to discuss pre-clinical and clinical aspects of the proposed New Drug Application, or NDA, for Epidiolex. In November, we held a positive CMC pre-NDA meeting. We also expect to commence two Phase 3 trialssubmit a NDA to the FDA at the end of the first half of 2017 for Epidiolex in the treatment of LGS in the first quarter of 2015. In parallel with the company’s formal clinical program inboth Dravet syndrome the FDA has granted 20 expanded access Investigational New Drug Applications, or INDs, and 7 individual emergency INDs to independent investigatorsLGS. We are also building an experienced commercial team in the United States to treat a totalin preparation for the potential future launch of approximately 410 children and young adults suffering from intractable epilepsy with Epidiolex. We have obtained initial physician reported treatment data on 58 patients receiving Epidiolex under these INDs, which have shown promising signals of efficacy in reducing seizures.
We expect to advancehave a deep pipeline of additional cannabinoid product candidates with an increasing focus on orphan drug opportunitiespediatric neurologic conditions. Our pipeline includes cannabidivarin, or CBDV, which is in Phase 2 development in the next 12 months. Our product pipelinefield of epilepsy and is also includes compounds inbeing researched within the field of autism spectrum disorders, or ASD. In addition, we have received Orphan Drug Designation and Fast Track Designation from the FDA for intravenous CBD for the treatment of Neonatal Hypoxic Ischemic Encepholapthy, or NHIE, which entered Phase 1 and Phase 2 clinical development for glioma, ulcerative colitis, type-2 diabetes and schizophrenia.in the fourth quarter of 2016.
| 29 |
Our Product and Product Candidates
GW Product Pipeline Summary
Epilepsy and Pediatric Neurology
Product/Product Candidates | Indication | Partner(s) | Status | Expected Next Steps | ||||
| Epidiolex (CBD) | Childhood-onset epilepsy Initial targets: Dravet syndrome and LGS Follow-up target: TSC | We retain global rights. | Positive results in Phase 3 trials in Dravet syndrome and LGS. Pre-NDA meetings held with FDA. NDA submission preparation underway for Dravet syndrome and LGS. | NDA submission expected at the end of the first half of 2017. Data from second Phase 3 Dravet syndrome trial expected in 2017. | ||||
| Phase 3 trial in TSC underway. | Data from Phase 3 TSC trial expected the first half of 2018. | |||||||
IS | Two-part Phase 3 trial in IS commenced in Q4 2016. | |||||||
| GWP42006 (CBDV) | Epilepsy ASD | We retain global rights | Phase 2 trial ongoing in adults with focal seizures. Phase 2 trials planned within field of ASD. FDA orphan designation in Rett syndrome. | Phase 2 data expected mid 2017. Phase 2 trials within field of ASD expected to commence the third quarter of 2017. | ||||
| Intravenous GWP42003 | Neonatal Hypoxic-Ischemic Encephalopathy | We retain global rights | Pre-clinical. FDA orphan and fast track designation. Phase 1 trial commenced in the fourth quarter of 2016. | Phase 1 data expected in 2017. |
Other Orphan Product Candidates
| Product/Product Candidates | Indication | Partner(s) | Status | Expected Next Steps | ||||
| Combination of GWP42002 and GWP42003 | Glioma | We retain global rights | Phase 2a trial complete. FDA orphan designation. | Phase 2a data expected in Q1 2017 |
Other Pipeline Product Candidates
Product/Product Candidates | Indication | Partner(s) | Status | Expected Next Steps | ||||
| GWP42003 | Schizophrenia | We retain global rights | Positive Phase 2 proof-of-concept. | Data under review for next steps. | ||||
| Sativex (nabiximols) | MS spasticity Cerebral Palsy spasticity | Otsuka, Almirall, Novartis, Bayer, Neopharm and Ipsen. | Approved in 30 countries (excluding the United States) Phase 2 trial complete | Phase 2 data expected Q1 2017. |
Epidiolex® for Orphan Childhood-onset Epilepsy
Our most advancedlead cannabinoid product Sativex,candidate is an oromucosal spray consistingEpidiolex, a liquid formulation of a formulated extract of thecannabis sativa plant that contains the principal cannabinoids delta-9-tetrahydrocannabinol, or THC, and CBD. We are evaluating Sativexpure plant-derived CBD, which is in a Phase 3 program to treat persistent pain in people with advanced cancer who experience inadequate pain relief from optimized chronic opioid therapy, the current standard of care. This program represents the lead target indication for Sativex in the United States and is based on positive data from two Phase 2 trials of Sativex involving over 530 patients in this indication. According to Fallon, et al. in the March/April 2006 edition ofClinical Medicine, pain is uncontrolled with opioid treatments in approximately 20% of patients with advanced cancer, or 420,000 people in the United States. There are currently no approved non-opioid treatments for patients who do not respond to, or experience negative side effects with, opioid medications. We believe that Sativex has the potential to address a significant unmet need in this large market by treating patients with a product that employs a differentiated non-opioid mechanism of action, and offers the prospect of pain relief without increasing opioid-related adverse side effects. Our ongoing Phase 3 program is being conducted under an IND and consists of three clinical trials, the first two of which are expected to enroll 760 patients in total and are intended to form the basis of the NDA. These two Phase 3 trial protocols mirror our Phase 2b trial of Sativex with respect to patient population and treatment duration, and employ a primary efficacy endpoint that yielded statistically significant results in favor of Sativex in both Phase 2 trials. We anticipate that top-line results from at least one of the two ongoing pivotal Phase 3 of Sativex for cancer pain trials will be available in early 2015. Top-line results from the second pivotal Phase 3 trial are expected in the second quarter of 2015. This program is intended to support the submission of a New Drug Application, or NDA, for Sativex in cancer pain with the FDA, and in other markets around the world. The costs of the Phase 3 program are fully funded by Otsuka Pharmaceutical Co. Ltd., or Otsuka.
Sativex is commercially availabledevelopment for the treatment of MS spasticity in 15 countries outside the United States. We have also received regulatory approval for Sativex for MS spasticity in 12 additional countries, and we anticipate commercial launches in severala number of these countries in the next 12 months. Regulatory filings are under review in 9 other countries. While we believe that MS spasticity represents an attractive indication for the United States, we also believe that cancer pain is the optimal entry point for Sativex in the United States from a commercial and regulatory perspective since we performed our MS spasticity pre-clinical and clinical program outside of the United States, and will be required to conduct an additional development program prior to the submission of an NDA with the FDA for this indication. We have opened an IND with the FDA and plan to conduct a U.S.-targeted pivotal Phase 3 clinical trial to evaluate Sativex for the treatment of MS spasticity. We have submitted to the FDA a request for Special Protocol Assessment, or SPA, of the Phase 3 study protocol, for which we have not yet reached agreement. Subject to reaching agreement with the FDA, we expect to commence the trial in 2015. If the trial is conducted and is successful, we intend to submit the results, along with the foreign clinical data collected in our clinical development program for MS spasticity to date, in an NDA for MS spasticity. According to the World Health Organization, MS affects 1.3 million people worldwide, of which up to 80% suffer from spasticity, a symptom of MS characterized by muscle stiffness and uncontrollable spasms. There is no cure for spasticity, and it is widely recognized that currently available oral treatments afford only partial relief and have unpleasant side effects. Sativex offers the prospect of treating patients who have failed existing oral therapies and who might otherwise require invasive and costly alternative treatment options.
Epidiolex
We are also developing other cannabinoid product candidates focused onrare childhood-onset epilepsy in particular, pediatric epilepsy.disorders. Several features of the pharmacology of certain cannabinoids suggest that they may be candidates for investigation as anti-epileptic drugs.drugs, or AEDs. We have conductedbeen conducting pre-clinical research of CBD in epilepsy for the last seven yearssince 2007, primarily in collaboration with the University of Reading.Reading in the United Kingdom. This research has shown that CBD has significant anti-epileptiform and anticonvulsant activity using a variety ofin vitro andin vivo models and that it has the ability of CBD to treat seizures in acute animal models of epilepsy with significantly fewer side effects than existing anti-epileptic drugs.AEDs.
| 30 |
Many cases of epilepsy are able to be classified and have clearly defined natural histories providing important information on the likelihood of seizure control and chance of remission. Some of the rarer electroclinical syndromes have very poor responses to treatment and negligible remission rates such as Ohtahara in neonates, Dravet syndrome in infants, LGS in young children and progressive myoclonic epilepsies in adolescence. An electroclinical syndrome is a complex of clinical features, signs and symptoms that together define a distinctive, recognizable clinical disorder,
Our strategy for the development of Epidiolex within the field of childhood-onset epilepsy is to initially concentrate formal development efforts on four orphan indications: Dravet Syndrome, LGS, TSC and IS. We have to date received Orphan Drug Designation from the FDA for Epidiolex for the treatment of Dravet syndrome, LGS, TSC and IS. Additionally, we have received Fast Track Designation from the FDA and Orphan Designation from the EMA for Epidiolex for the treatment of Dravet syndrome. We expect to further expand the potential market opportunity of Epidiolex by targeting additional orphan seizure disorders.
Epilepsy Market Overview
Epilepsy afflicts between 1.3 million to 2.8 million adults and children in the United States according to the Epilepsy Foundation. The Epilepsy Foundation believes its most accurate estimate is 2.2 million people, or 7.1 for every 1,000 people. According to Kwan and Brodie in the February 2000 edition of the New England Journal of Medicine, 36 percent of patients with epilepsy were pharmacoresistant. Of the patients in the study, 47 percent became seizure-free during treatment with their first AED, 13 percent became seizure-free during treatment with a second AED as a monotherapy, and 4 percent became seizure-free with a third AED or treatment with multiple AEDs. The remaining 36 percent of patients were classified by the authors as having pharmacoresistant epilepsy. Furthermore it is recognized that some of those that do find relief often suffer side effects severe enough with their current medication that an alternative or adjunct treatment is often sought. The costs of uncontrolled epilepsy are significant, with direct and indirect costs associated with epilepsy totaling more than $15 billion per year. It is estimated that 50,000 epilepsy related deaths occur each year, more than breast cancer deaths annually.
According to Russ et al. in the February 2012 edition of Pediatrics, there are 466,000 childhood epilepsy patients in the United States and 765,000 patients in Europe, of which 20%,30 percent, or 93,200about 140,000 patients in the United States and 153,000about 230,000 in Europe, are deemed medically intractable.intractable or pharmacoresistant.
Dravet Syndrome
Our mostDravet syndrome is a severe infantile-onset, genetic, drug-resistant epilepsy syndrome with a distinctive but complex electroclinical presentation. Onset of Dravet syndrome occurs during the first year of life with clonic seizures (jerking) and tonic-clonic (convulsive) seizures in previously healthy and developmentally normal infants. Symptoms peak at about five months of age, and the latest onset beginning by 15 months of age. Other seizures develop between one and four years of age such as prolonged focal dyscognitive seizures and brief absence seizures, and duration of these seizures decreases during this period, but their frequency increases. Prognosis is poor and approximately 14 percent of children die during a seizure, because of infection due, for example, to prolonged periods of physical inactivity, the presence of advanced product candidateneurodegenerative disease or a compromised level of consciousness requiring a feeding tube, or suddenly due to uncertain causes, often because of the relentless neurological decline or from Sudden Unexpected Death in Epilepsy. Patients develop intellectual disability and life-long ongoing seizures. Intellectual impairment varies from severe in 50 percent of patients, to moderate and mild intellectual disability each accounting for 25 percent of cases. Patients may rarely return to normal intellect.
According to Forsgren L. et al. in the field2004 edition of Epilepsy in Children, the incidence of epilepsy in the first year of life is Epidiolex,1.5 per 1,000 people, or, by our estimate, 6,450 new epilepsies per year worldwide. According to Dravet et al. in the 2012 edition of Epileptic Syndromes in Infancy, Childhood and Adolescence, up to 5 percent of epilepsies diagnosed in the first year of life are Dravet syndrome, equating to 320 new cases per year in the United States with a liquid formulationmortality rate that studies have shown may be as high as 15 percent in the first 20 years of life. By our estimate, there are approximately 5,440 patients with Dravet syndrome in the United States under the age of 20 years. Applying the same assumptions in Europe, we believe there are an estimated 6,710 Dravet syndrome patients in the European Union under the age of 20 years.
A large percentage of cases of Dravet syndrome have a pure plant-derived CBD.family history for epilepsy or convulsions. Heterozygous de novo mutations of the alpha 1 (α-1) subunit of the SCN1A gene, which encodes a voltage-gated sodium channel, are the major cause of Dravet syndrome and are found in approximately 75 percent – 80 percent of patients and more than 500 SCN1A mutations have been reported to be associated with this disorder. There are currently no FDA-approved treatments specifically indicated for Dravet syndrome. The company has commencedstandard of care usually involves a formal clinical trial programcombination of the following anticonvulsants: clobazam, clonazepam, leviteracetam, topirimate, valproic acid, ethosuximide or zonisamide. Stiripentol is approved in Europe for the treatment of Dravet syndrome in conjunction with clobazam and valproate. In the United States, stiripentol was granted an Orphan Drug Designation for the treatment of Dravet syndrome in 2008; however, the drug is not FDA approved. Potent sodium channel blockers used to treat epilepsy actually increase seizure frequency in patients with Dravet syndrome. The most common are phenytoin, carbamazepine, lamotrigine and rufinamide. Management of this disease may also include a ketogenic diet, and physical and communication therapy. In addition to anti-convulsive drugs, many patients with Dravet syndrome are treated with anti-psychotic drugs, stimulants and drugs to treat insomnia.
Dravet Syndrome Phase 3 Clinical Program
We held a pre-Investigational New Drug, or IND, meeting with the FDA in February 2014 to discuss the investigational plan for Epidiolex in Dravet syndrome, forfollowing which we have received Fast Track Designation. As part of this program, the company has begunopened a commercial IND in May 2014. In October 2014, we commenced a Phase 2/3 trial designed as a two-part randomized double-blind, placebo-controlled parallel group dose escalation, safety, tolerability, pharmacokinetic and expectsefficacy trial of single and multiple doses of Epidiolex to commencetreat Dravet syndrome in children who are being treated with other AEDs. Part One was completed in February 2015, and included pharmacokinetic and dose-finding data elements in a total of 34 patients over a 3 week treatment period.
| 31 |
Following a review of the Part One data by an additionalindependent panel, Part Two (Phase 3) of the trial commenced in March 2015, and was a placebo-controlled safety and efficacy evaluation of Epidiolex (at a dose of 20mg/kg per day) over a 3-month treatment period.
This Phase 3 trial randomized 120 patients into two arms, Epidiolex 20mg/kg/day (n=61) and placebo (n=59). Epidiolex or placebo was added to current AED treatment regimens. On average, patients were taking approximately three AEDs, having previously tried and failed an average of more than four other AEDs. The average age of trial participants was ten years and 30 percent of patients were younger than six years of age. The median baseline convulsive seizure frequency per month was 13.
The primary efficacy endpoint was a comparison between Epidiolex and placebo measuring the percentage change in the monthly frequency of convulsive seizures during the 14-week treatment period compared with the 4-week baseline observation period. In this trial, patients taking Epidiolex achieved a median reduction in monthly convulsive seizures of 39 percent compared with a reduction on placebo of 13 percent, which was highly statistically significant (p=0.012). A series of sensitivity analyses of the primary endpoint confirmed the robustness of this result. The difference between Epidiolex and placebo emerged during the first month of treatment and was sustained during the entire treatment period. Results from secondary efficacy endpoints reinforced the overall effectiveness observed with Epidiolex.
Additional secondary efficacy endpoint data from this Phase 3 pivotal trial in Dravet syndrome clinicalwere presented in a poster at the 70thAnnual Meeting of the American Epilepsy Society in December 2016 which included the following:
Epidiolex was generally well tolerated in this trial. The most common adverse events (occurring in greater than 10 percent of Epidiolex-treated patients) were: somnolence, diarrhea, decreased appetite, fatigue, pyrexia, vomiting, lethargy, upper respiratory tract infection and convulsion. Of those patients on Epidiolex that reported an adverse event, 84 percent reported it to be mild or moderate. Ten patients on Epidiolex experienced a serious adverse event compared with three patients on placebo. There was no difference in episodes of status epilepticus between Epidiolex and placebo. Eight patients on Epidiolex discontinued treatment due to adverse events compared with one patient on placebo. Increases in ALT or AST (levels >3× ULN) occurred in 12 patients on Epidiolex and 1 placebo patient; all patients were on concomitant Valproic Acid. There is a set of accepted criteria for identifying whether these transient elevations of liver enzymes are a signal for serious toxicity. These criteria are known as Hy’s law. No patients met these criteria for drug-induced liver injury. All elevations resolved to lower than 3x ULN.
We are working with the investigators in this trial on a manuscript for peer-review publication. We expect this paper will be published in the first half of 2017.
In addition to this first Phase 3 trial, we are conducting a second Phase 3 trial of Epidiolex in Dravet syndrome which is expected to recruit 180 patients. This placebo-controlled trial differs from the first Phase 3 trial in that it includes two Epidiolex dose arms, at 20mg/kg per day and at 10 mg/kg per day. We continue to work to enroll this trial and expect to report results from the trial in 2017. Each of these trials will be the largest known controlled trials in Dravet syndrome.
Lennox-Gastaut Syndrome
LGS is a type of epilepsy with multiple types of seizures, particularly tonic (stiffening) and atonic (drop) seizures. According to Trevathan et al. in the December 1997 edition of Epilepsia, the estimated prevalence of LGS is between 3 percent and 4 percent of childhood epilepsy with the cause of the disorder unknown in 1 out of 4 children. LGS affects between 14,500 – 18,500 children under the age of 18 years in the United States and over 30,000 children and adults in the United States. Eighty percent of children with LGS continue to experience seizures, psychiatric, and behavioral deficits in adulthood. Seizures due to LGS are hard to control and they generally require life-long treatment as LGS usually persists into the adult years. Historically patients with LGS have had few effective treatment options. Intellectual and behavioral problems associated with LGS are common and add to the complexity of this syndrome and the difficulties in managing life with LGS.
Drug resistance is one of the main features of LGS. Generally, treatment often requires broad spectrum AEDs and/or polypharmacy. Treatment will also depend on the seizure type as some treatments that are effective for one type of seizure may worsen another. The FDA approved treatments for LGS are: Onfi (clobazam); Banzel (rufinamide); Lamictal (lamotrigine); Topamax (topirimate); and Felbatol (felbamate). These medicines are often used as adjunctive therapy with existing medications. When used with other particular AEDs, the FDA approved treatments for LGS show a level of efficacy, however, many also have severe undesirable side effects. Furthermore, several of these medicines are based on the same mechanism of action as traditional AEDs. As patients with LGS generally need to take several treatments to gain any change to their seizure frequency, we believe that there is a need for further pharmacological treatments, particularly those with a different mechanism of action, to give prescribers more options in treating this rare, pharmacoresistant syndrome.
| 32 |
LGS Phase 3 Clinical Program
In April 2015, we commenced a Phase 3, randomized, double-blind placebo-controlled trial to evaluate the safety and efficacy of Epidiolex for the treatment of LGS in patients who are being treated with other AEDs. Patients aged two to 55 years with a confirmed diagnosis of drug-resistant LGS currently uncontrolled on one or more concomitant AEDs were eligible to participate in this trial. The trial randomized 171 patients into two arms, where Epidiolex 20mg/kg/day (n=86) or placebo (n=85) was added to current AED treatment. On average, patients were taking approximately 3 AEDs, having previously tried and failed an average of 6 other AEDs. The average age of trial participants was 15 years (34 percent were 18 years of age or older). The median baseline drop seizure frequency per month was 74.
The primary efficacy endpoint of this trial was a comparison between Epidiolex and placebo in the percentage change in the monthly frequency of drop seizures during the 14 week treatment period (2 week dose escalation period followed by 12 weeks of maintenance) compared to the 4 week baseline period before randomization. Drop seizures were defined as atonic, tonic and tonic-clonic seizures involving the entire body, trunk or head that led or could have led to a fall, injury, slumping in a chair or hitting the patient’s head on a surface. During the treatment period, patients taking Epidiolex achieved a median reduction in monthly drop seizures of 44 percent compared with a reduction of 22 percent in patients receiving placebo, and the difference between treatments was statistically significant (p=0.0135). A series of sensitivity analyses of the primary endpoint confirmed the robustness of this result. The difference between Epidiolex and placebo emerged during the first month of treatment and was sustained during the entire treatment period. The results from secondary efficacy endpoints reinforced the overall effectiveness observed with Epidiolex.
Additional secondary efficacy endpoint data from this Phase 3 pivotal trial in LGS were presented in a poster at the 70th Annual Meeting of the American Epilepsy Society in December 2016 which included the following:
Epidiolex was generally well tolerated in this trial. Overall, 86 percent of all Epidiolex patients experienced an adverse event compared with 69 percent of patients on placebo. The most common adverse events (occurring in greater than 10 percent of Epidiolex-treated patients) were: diarrhea, somnolence, decreased appetite, pyrexia, and vomiting. Of those patients on Epidiolex who reported an adverse event, 78 percent reported it to be mild or moderate. Nine patients on Epidiolex experienced a treatment-related serious adverse event compared with one patient on placebo. There was no difference in episodes of status epilepticus between Epidiolex and placebo. Twelve patients on Epidiolex discontinued treatment due to adverse events compared with one patient on placebo. Increases in ALT or AST (levels >3× ULN) occurred in 19 patients on Epidiolex and 1 placebo patient; 15 of the patients were on concomitant Valproic Acid. There is a set of accepted criteria for identifying whether these transient elevations of liver enzymes are a signal for serious toxicity. These criteria are known as Hy’s law. No patients met these criteria for drug-induced liver injury. All elevations resolved to below 3x ULN. There was one death in the Epidiolex group, which was deemed unrelated to treatment. Of the patients who completed this trial, 100 percent have opted to continue into an open-label extension trial.
In addition to this first Phase 3 trial of Epidiolex in LGS, in June 2015 we commenced a second Phase 3, randomized, double-blind placebo-controlled trial to evaluate the safety and efficacy of Epidiolex for the treatment of LGS in patients who are being treated with other AEDs. Patients aged 2-55 years with a confirmed diagnosis of drug-resistant LGS currently uncontrolled on one or more concomitant AEDs were eligible to participate in this trial. The trial randomized 225 patients into three arms, where Epidiolex 20mg/kg/day (n=76), Epidiolex 10mg/kg/day (n=73) or placebo (n=76) was added to current AED treatment. On average, patients were taking approximately 3 AEDs, having previously tried and discontinued an average of 7 other AEDs. The average age of trial participants was 16 years (30 percent were 18 years or older). The median drop seizure frequency over the 4 week baseline period was 85.
| 33 |
The primary efficacy endpoint of this trial was a comparison between Epidiolex and placebo in the percentage change in the monthly frequency of drop seizures during the 14 week treatment period (two week dose escalation period followed by 12 weeks of maintenance) compared to the 4 week baseline period before randomization. Drop seizures were defined as atonic, tonic or tonic-clonic seizures involving the entire body, trunk or head that led or could have led to a fall, injury, slumping in a chair or hitting the patient's head on a surface. During the treatment period, patients taking Epidiolex 20mg/kg/day achieved a median reduction in monthly drop seizures of 42 percent compared with a reduction of 17 percent in patients taking placebo (p=0.0047), and patients taking Epidiolex 10mg/kg/day achieved a median reduction in monthly drop seizures of 37 percent compared with a reduction of 17 percent in patients taking placebo (p=0.0016). A series of sensitivity analyses of the primary endpoint for both dose groups confirmed the robustness of these results. In both dose groups, the difference between Epidiolex and placebo emerged during the first month of treatment and was sustained during the entire treatment period. Results from secondary efficacy endpoints in both dose groups reinforced the overall effectiveness observed with Epidiolex.
Epidiolex was generally well tolerated in this trial. One patient on 10mg/kg Epidiolex discontinued treatment due to an adverse event compared with six patients on 20mg/kg and one patient on placebo. Of the 84 percent of 10mg/kg patients who experienced an adverse event, 89 percent of them deemed it to be mild or moderate. Of the 94 percent of 20mg/kg patients who experienced an adverse event, 88 percent of them reported it to be mild or moderate. 72 percent of patients on placebo experienced an adverse event. The most common adverse events (occurring in greater than 10 percent of Epidiolex-treated patients) in the 10mg/kg group were: somnolence, decreased appetite, upper respiratory infection, diarrhea, and status epilepticus. None of the cases of status epilepticus in the 10mg/kg group was deemed treatment-related. The most common adverse events (occurring in greater than 10 percent of Epidiolex-treated patients) in the 20mg/kg group were: somnolence, decreased appetite, diarrhea, upper respiratory infection, pyrexia, vomiting, and nasopharyngitis. Thirteen patients on Epidiolex 10mg/kg experienced a serious adverse event (two of which were deemed treatment-related) compared with thirteen patients on 20mg/kg (five of which were deemed treatment-related) and eight patients on placebo (none of which were deemed treatment-related). There were no deaths in this trial. Of the patients who completed this trial, 99 percent have opted to continue into an open-label extension trial.
The detailed analysis of the data from this trial is on-going and we expect data from this trial to be submitted for presentation at a medical meeting in the first half of 2017.
Drug:Drug Interactions
Drug:drug interactions, or DDIs, in epilepsy are commonplace and clinicians routinely monitor blood levels of concomitant AEDs. We now have extensive real world experience of Epidiolex, with approximately 1,000 patients currently on treatment.
At our pre-NDA meeting, we reached agreement with FDA on the scope of our DDI studies. A number of these studies have now been completed and to date the only DDI identified is an interaction with clobazam, which results in increases in the first metabolite, n-desmethylclobazam, and not in raised levels of clobazam itself. There are patients within both the EAP and the GW sponsored Phase 3 studies who achieved meaningful seizure reductions, even becoming seizure free, who are not on concomitant clobazam.
Regulatory Submissions for Dravet syndrome and LGS
Following the success of the first Dravet syndrome Phase 3 trial, we requested a pre-NDA meeting with the FDA to discuss a proposed Dravet syndrome NDA. This meeting took place in July 2016 and included some discussion of the LGS trial data. As a result of this meeting, we believe the guidance received was both positive and supportive of our proposed filing strategy to submit a single NDA that includes Phase 3 data from one Dravet trial and two LGS trials. Subject to satisfactory review, we now anticipate simultaneous approval of both indications and do not expect to wait for results from the second trial in Dravet syndrome prior to this submission.
In November 2016, we held a CMC pre-NDA meeting. At this meeting, agreement was reached on key questions related to the CMC content of our planned NDA submission.
We are on track to submit the NDA to the FDA at the end of the first half of 2017.
In Europe, we expect to hold pre-submission meetings with the EMA in the first quarter of 2015. We also expect2017 and are making plans to commence two phase 3 trials forsubmit a marketing authorization application in Europe in the second half of 2017.
Tuberous Sclerosis Complex (TSC)
TSC is a genetic disorder that causes non-malignant tumors to form in many different organs, primarily in the brain, eyes, heart, kidney, skin and lungs. The brain and skin are the most affected organs. TSC results from a mutation in tumor suppression genes TSC1 or TSC2. According to the Tuberous Sclerosis Alliance, TSC is estimated to affect approximately 50,000 patients in the United States. The most common symptom of TSC is epilepsy, which occurs in 75 – 90 percent of patients, about 70 percent of whom experience seizure onset in their first year of life. Approximately 60 percent of these TSC patients (or approximately 25,000 of patients in the United States) have treatment-resistant seizures. The seizures of TSC are typically focal in onset, meaning that they are localized to one hemisphere of the brain. There are significant co-morbidities associated with TSC including cognitive impairment in 50 percent, autism spectrum disorders in up to 40 percent and neurobehavioral disorders in over 60 percent of individuals with TSC.
A number of patients with TSC have been treated with Epidiolex in the expanded access program (as explained in detail below). At the 69thAnnual Meeting of the American Epilepsy Society in December 2015, safety and efficacy data on 10 patients diagnosed with TSC from the physician-led open-label Epidiolex expanded access program were presented by Massachusetts General Hospital for Children (Geffrey et al 2015). The percent of patients who reported a 50 percent or greater reduction in seizures were 50 percent, 50 percent, 40 percent, 60 percent and 66 percent at 2, 3, 6, 9, and 12 months of treatment with Epidiolex, respectively. Side effects were seen in five patients (50 percent) and most were resolved with AED or CBD dose adjustments.
TSC Phase 3 Clinical Program
In April 2016, we commenced a Phase 3 trial of LGSEpidiolex in patients with TSC. This dose-ranging trial is a 16-week comparison of Epidiolex versus placebo in a total of approximately 200 patients, aged one to 65 years, to assess the safety and efficacy of Epidiolex as an adjunctive anti-epileptic treatment. The primary measure of this trial is the percentage change from baseline in seizure frequency during the treatment period. Primary endpoint seizures include focal motor seizures with or without impairment of consciousness or awareness and generalized convulsive seizures. We expect to report data from this trial in the first half of 2018.
| 34 |
Infantile Spasms (IS)
According to the National Institute of Neurological Disorders and Stroke, an infantile spasm is a specific type of seizure seen in an epilepsy syndrome of infancy and childhood known as West syndrome. West syndrome is characterized by infantile spasms, developmental regression, and a specific pattern on electroencephalography, or EEG, testing called hypsarrhythmia (chaotic brain waves). The onset of infantile spasms is usually in the first year of life, typically between 4 to 8 months of age. The seizures primarily consist of a sudden bending forward of the body with stiffening of the arms and legs; some children arch their backs as they extend their arms and legs. Spasms tend to occur upon awakening or after feeding, and often occur in clusters of up to 100 spasms at a time. Infants may have dozens of clusters and several hundred spasms per day. Many underlying disorders, such as birth injury, metabolic disorders, and genetic disorders can give rise to spasms, making it important to identify the underlying cause. In some children, no cause can be found.
According to data published on Medscape, the condition constitutes 2 percent of childhood epilepsies and 25 percent of epilepsies with onset in the first year of life. There are approximately 2,000 to 4,000 new cases in the United States each year. Cognitive and developmental delay is severe in 70 percent of patients, often with psychiatric problems such as autistic features or hyperactivity. IS usually stops by five years of age, but may be replaced by other seizure types. It has been found that 50 percent to 70 percent of patients develop other seizure types and that 18 to 50 percent will develop LGS or some other form of symptomatic generalized epilepsy. The long-term prognosis is poor and includes increased mortality and severe neurodevelopmental impairment.
The FDA approved treatments for IS are ACTH (Acthar Gel) and vigabitrin (Sabril). These treatment options are successful in 20 percent to 80 percent of patients. Both of these medicines have significant adverse events, including boxed warnings limiting their long-term use.
On December 7, 2015, at the Annual Meeting of the American Epilepsy Society, safety and efficacy data on 9 patients suffering from epileptic spasms from the Epidiolex expanded access program were presented by Massachusetts General Hospital for Children (Abati et al.). Epilepsy spasms often remain refractory to standard AEDs. According to this poster, Epidiolex exerted its effects in a short time course, with a response rate of 67 percent after two weeks and 78 percent after one month. Three of nine patients became spasm-free after two weeks of Epidiolex treatment. By parent report, patients also showed cognitive gains including improvements in alertness, verbal capacity/communication, and cognitive availability.
IS Phase 3 Clinical Program
We commenced a two-part Phase 3 trial of Epidiolex in patients with IS in the fourth quarter of 2015.2016. The first part of the trial will recruit 10 patients and is expected to complete in the first half of 2017. Subject to review by an independent panel, the second pivotal phase of the trial is expected to commence shortly after this review.
Cannabinoid Rationale for Treating Epilepsy
Several features of the pharmacology of certain cannabinoids suggest that they may be candidates for investigation as AEDs. A series of validated laboratory experiments have shown that certain cannabinoids can modulate neurotransmission, can reduce neuro-inflammation and can affect oxidative stress. These cannabinoids may simultaneously modulate a number of endogenous systems to attenuate and/or prevent epileptic neuronal hyperexcitability. These include ion channel control, inflammation, modulation of oxidative stress and inhibition of gene expression of epilepsy-associated genes.
Several different ion channels influence epileptogenesis (the process by which a normal brain develops epilepsy) including both ligand-gated and voltage-gated ion channels. It is the former to which a proportion of the actions of plant cannabinoids can be attributed, for example through agonism and antagonism of G-protein coupled receptors, including orphan receptors as well as modulation of transient receptor potential (TRP) channels (differentially activated, repressed and desensitized by different plant cannabinoids). Additionally it is now recognized that there is a role for inflammation in epilepsy. Some cannabinoids possess anti-inflammatory properties including inhibition of pro-inflammatory cytokine release and modulation of glial cell/neuronal interactions. Furthermore cannabinoids modulate oxidative stress and production of toxic nitric oxide. Research shows that other than THC, most plant cannabinoids have little or no affinity for the cannabinoid receptors, and therefore do not share the unwanted psychoactivity that goes along with stimulation of the CB1 receptor in particular.
Finally, certain cannabinoids may possess disease modifying potential through regulation of epilepsy-related genes, as well as up-regulation of endogenous anti-convulsant neuropeptides and/or compensatory systems.
Based on recent findings in The Journal of Pharmacology and Experimental Therapeutics, CBD is likely to be acting via more than one mechanism of action with the effect of reducing neuronal hyperexcitability. Neuronal hyperexcitability occurs when the nerve keeps firing and can lead to seizures. There are several mechanisms that aim to stop nerves firing once they have stimulated the post-synaptic nerve. Among these mechanisms is the movement of positively charged ions, e.g. sodium and calcium, across the cell membrane in a process called re-polarization. If these mechanisms are faulty, then the continued firing means ‘hyperexcitability’. Importantly, the anti-seizure effects of CBD are not dependent on cannabinoid receptors, nor on sodium channels.
CBD Pharmacology in Epilepsy
The epilepsy-relevant pharmacology of CBD can be summarized as follows: inhibition of neutrophil and microglial migration, anti-inflammatory effects in conventional animal models; inhibition of adenosine uptake and indirect agonism of the neuroprotective and anti-inflammatory A2a receptor; other neuroprotective effects (TNF inhibition and anti-oxidant activity); antipsychotic activity; agonism at the orphan receptor GPR55; desensitizer of TRP channels; anticonvulsant activity in all laboratory models tested; ion channel modulation; reduction of acetylcholine turnover at neuro-muscular junctions; and perturbation of the negative effects of THC (opposes euphoric, cognitive and psychotropic effects) via one or more of the above mechanisms.
| 35 |
There is a significant effort to identify the mechanisms of action that underpin the clinical effectiveness of Epidiolex (and other cannabinoids) in epilepsy, including investigation of the effects of cannabinoids on epilepsy associated gene expression. CBD has negligible binding at the CB1 receptor, and so shares neither the pharmacology of CB1 agonists such as THC nor that of CB1 inverse agonists such as Rimonabant. CBD’s mechanism for treating seizures is not fully understood but is believed to involve a combination of beneficial effects stacking upon one another (polypharmacology).
Preclinical models suggest a broad role for CBD in generalized and partial seizures, and clinical reports of benefit extend into other congenital seizure disorders.
Our CBD Pre-Clinical Research in Pediatric Epilepsy
We have conducted pre-clinical research of CBD in epilepsy for several years and have reported significant anti-epileptiform and anticonvulsant activity using a variety ofin vitro andin vivo models. This research has shown the ability of CBD to treat seizures in acute models of epilepsy with significantly fewer side effects than existing AEDs. Our cannabinoid research compounds were screened in electrically discharging hippocampal brain slices caused by the omission of Mg2+ ions from, or addition of the K+ channel blocker, 4-aminopyridine (4-AP) to the bathing solution. In these models, 100μM of CBD decreased epileptiform amplitude and duration as well as burst frequency; importantly, this compound exerted no effect upon the propagation of epileptiform activity.
Subsequently, the anti-convulsant actions of 1, 10 and 100 mg/kg of CBD were examined in three differentin vivo seizure rodent models. In the Pentylenetetrazol (PTZ) induced acute, generalized seizures model, 100 mg/kg of CBD significantly decreased mortality rate and the incidence of tonic-clonic seizures. In the acute pilocarpine model of temporal lobe seizures all doses of CBD significantly reduced the percentage of animals experiencing the most severe seizures. In this model of partial seizures, 10 and 100 mg/kg of CBD significantly decreased the percentage of animals dying as a result of seizures and all doses of CBD also decreased the percentage of animals experiencing the most severe tonic-clonic seizures.
During 2013, we received increasing interest among U.S. pediatric epilepsy specialists and patient organizations in the potential role of CBD in treating intractable childhood epilepsy, in particular Dravet syndrome. This interest led to a medical conference organized by the New York University School of Medicine on October 4, 2013 titled: “Cannabidiols: Potential Use in Epilepsy and Other Neurological Disorders.” Epilepsy specialists at the meeting viewed CBD as attractive for the treatment of these disorders for a variety of reasons, including:
In addition, specialists at this conference concluded the following:
Epidiolex Expanded Access INDs
In parallel with the company’s formalour commercial clinical trial program,programs, the FDA has been receiving and approving INDs from independent investigators in the United States to allow treatment with Epidiolex in children and young adults with a range of epilepsy syndromes. To date, the FDA has granted 20 intermediate expanded access INDs and 7 individual emergency INDs to independent physician investigators in the United States to treat a total of approximately 410474 children and young adults suffering from intractable epilepsy with Epidiolex. TwelveIn addition, the FDA has granted further INDs to treat 637 additional patients under expanded access programs supported by seven U.S. states and for which we are supplying Epidiolex. The FDA may authorize expanded access programs to facilitate access to investigational drugs for treatment use for patients with a serious or immediately life-threatening disease or condition who lack therapeutic alternatives. The patients in these INDs suffer not only from Dravet syndrome, LGS, TSC and IS but also from other pediatric epilepsy syndromes. The FDA has also authorized to physicians 15 individual emergency INDs and three individual patient non-emergency INDs.
The Lancet Neurology Data
On December 23, 2015, Epidiolex data from the physician-led expanded access program in treatment-resistant epilepsy were published by the treating physicians in The Lancet Neurology (Devinsky et al., Cannabidiol in Patients with Treatment Resistant Epilepsy: an open-label interventional trial, Lancet Neurology December 23, 2015). This paper provides a more expansive description of data previously presented at the American Academy of Neurology Annual Meeting in April 2015. Data in the paper are from 11 independent epilepsy centers in the United States; 162 patients who had at least 12 weeks of follow-up after the first dose of cannabidiol were included in the safety and tolerability analysis, and 137 patients were included in the efficacy analysis. Of these 162 patients, there were 33 patients with Dravet syndrome and 31 patients with LGS. The published paper reported that Epidiolex reduced seizure frequency across multiple drug-resistant epilepsy syndromes and seizure types and was generally well tolerated. In the paper the authors note that the administration of Epidiolex as an add-on treatment led to a clinically meaningful reduction in seizure frequency in many patients and had an adequate safety profile in this patient population with highly treatment-resistant epilepsies. The safety and tolerability profile of Epidiolex was favorable with only 3 percent of patients terminating therapy due to an adverse event. Highlights from the publication of particular relevance to GW’s pivotal trial programs in Dravet syndrome and LGS include:
| 36 |
The authors noted that without a control group, the results regarding efficacy and safety should be interpreted cautiously.
2015 American Epilepsy Data
In addition to the data published in The Lancet Neurology, seven abstracts related to the physician-led expanded access program for Epidiolex in treatment-resistant epilepsy were presented at the 69th Annual Meeting of the American Epilepsy Society including data from the physician-led Epidiolex expanded access program. On December 7, 2015, at the Annual Meeting of the American Epilepsy Society, physician reports of clinical effect and safety data was presented on 58261 children and young adults with treatment-resistant epilepsy who had been treated with Epidiolex for a period of at least 12 weeks (Devinsky et al.). This data is from 16 clinical sites in the United States and was generated under the expanded access program. In addition, physician reports of safety data were presented on 313 patients (261 patients with 12 weeks treatment effect data plus an additional 52 patients still in their first 12 weeks of treatment or who withdrew from treatment).
The patients included in the Epidiolex program had Dravet syndrome (17 percent of the total) and LGS (15 percent of the total), as well as safety14 other types of severe epilepsy, such as TSC, Aicardi syndrome and Doose syndrome. Many of these other types of epilepsy are severe and rare, and several patients with these epilepsies have major congenital structural brain abnormalities.
The 261 patients were predominately children with an average age of 11.8 years. In all cases, Epidiolex was added to current AED treatment regimes. On average, patients were taking approximately three other AEDs. At baseline, the median number of convulsive seizures per month was 31.
Clinical Effect Data — All Patients
Data was presented on all 261 patients who had at least 12 weeks treatment. Treatment was open label. Of these 261 patients, 135 patients had also reached 36 weeks treatment at the time of data from ananalysis. Information collected on all seizures (convulsive and non-convulsive) was reported for each patient. The following data was presented showing the median change in seizure frequency compared to a 4-week baseline period.
| Week 4 | Week 8 | Week 12 | Week 16 | Week 24 | Week 36 | |||||||||||||||||||
| Median change in seizure frequency | -33.5 | % | -42.5 | % | -45.1 | % | -49.5 | % | -45.9 | % | -44.1 | % | ||||||||||||
At the end of 12 weeks, 47 percent of all patients experienced a ≥50 percent reduction in seizures and 9 percent of all patients were seizure-free.
At the end of 12 weeks, the median overall reduction in convulsive seizure frequency was 48.8 percent.
Clinical Effect Data — Dravet syndrome patients only
Data was presented on 44 patients with Dravet syndrome who had at least 12 weeks treatment data. Of these 44 patients, 25 patients had also reached 36 weeks treatment at the time of data analysis. Information collected on all seizures (convulsive and non-convulsive) was reported for each patient. The following data was presented showing the median change in seizure frequency compared to a 4-week baseline period.
| Week 4 | Week 8 | Week 12 | Week 16 | Week 24 | Week 36 | |||||||||||||||||||
| Median change in seizure frequency | -36.8 | % | -56.4 | % | -62.7 | % | -56.2 | % | -55.4 | % | -50.6 | % | ||||||||||||
| 37 |
At the end of 12 weeks, 13 percent of Dravet syndrome patients were seizure-free.
Of the 44 patients with Dravet syndrome, 42 patients had convulsive seizures at baseline. At the end of 12 weeks, the median reduction in convulsive seizures in these patients was 52.3 percent.
Clinical Effect Data — Patients without Dravet syndrome
Data was made available on all 217 patients with diagnoses other than Dravet syndrome who had at least 12 weeks treatment. Of these 217 patients, 110 patients had also reached 36 weeks treatment at the time of data analysis. Information collected on all seizures (convulsive and non-convulsive) was reported for each patient. The following data was presented showing the median change in seizure frequency compared to a 4-week baseline period.
| Week 4 | Week 8 | Week 12 | Week 16 | Week 24 | Week 36 | |||||||||||||||||||
| Median change in seizure frequency | -33.3 | % | -41.2 | % | -41.4 | % | -47.0 | % | -45.5 | % | -44.1 | % | ||||||||||||
Clinical Effect Data — LGS patients only
Data was presented on 40 patients with LGS who had at least 12 weeks treatment data. Of these patients, 14 had atonic seizures at baseline. In these patients, there was a 71.1 percent median reduction in the number of atonic seizures at the end of 12 weeks.
Safety Data
Safety data was made available on 313 patients (261 patients with 12 weeks treatment effect data plus 52 additional 93 patients (forfor whom 12 week treatment effect data wasis not yet available)available or who withdrew from treatment) and represents approximately 180 patient-years of exposure to Epidiolex. The most common adverse events (occurring in 10% or more of patients and resulting from all causes) were somnolence (23 percent), diarrhea (23 percent), fatigue (17 percent), decreased appetite (17 percent), convulsions (17 percent) and vomiting (10 percent). Adverse events led to discontinuation in four percent of patients. Most adverse events were mild or moderate and transient. 14 patients (4 percent) reported an adverse event leading to discontinuation. There were 36 (12 percent) withdrawals from treatment due to lack of clinical effect. Serious adverse events were reported in 106 patients. Of these, serious adverse events in 16 (5 percent) patients were deemed possibly related to treatment, including altered liver enzymes (4 patients), status epilepticus/convulsion (4), diarrhea (4), decreased weight (3), thrombocytopenia (1). Serious adverse events reported under the expanded access program include seven deaths. We are also aware of the death of one patient that received Epidiolex on a compassionate use basis in the United Kingdom. All eight of these deaths have been investigated and were all deemed unrelated to Epidiolex by the independent investigators.
Since the time that this data was collected in September 2015, a further 300 patients have been exposed to Epidiolex in the expanded access program. Over 700 patients have participated in comparative clinical studies, including patients with Dravet Syndrome, LGS or Tuberous Sclerosis. There have been five more deaths reported under the expanded access program. We are also aware of the death of two additional patients who received Epidiolex on a compassionate use basis in the United Kingdom. Outside of these programs, there was one patient death during our recently completed Phase 3 trial of Epidiolex in LGS, and seven patient deaths during the open label extension trial for patients who have completed their treatment under our completed or ongoing Phase 3 trials of Epidiolex in Dravet syndrome and LGS. All fifteen of these deaths have been investigated and all of them have been deemed unrelated to treatment with Epidiolex by the independent investigators
Note Regarding Expanded Access Studies
The expanded access studies we are currently supporting are uncontrolled, carried out by individual physician investigators independent from us, and not always conducted in strict compliance with Good Clinical Practices, all of which can lead to an observed treatment effect that may differ from one seen in placebo-controlled trials. Data from these INDs have been made available to us from the physicians conductingstudies provide only anecdotal evidence of efficacy for regulatory review, although they may provide supportive safety information for regulatory review. The patients treated under these studies and we expect treatment data on additional patients to be made available to us going forward. A summary of our analysis of the data made available to us on or before October 14, 2014 is set out on pages 61 and 62 and we believe it demonstrates promising signals of safety and efficacy in reducing seizures.
Theseexpanded access INDs contain no control or comparator group for reference and these patient data are not designed to be aggregated or reported as study results. Moreover, data from such small numbers of patients may be highly variable. Information obtained from these INDs, including the statistical principles that the independent investigators have chosen to apply to the data, may not reliably predict data collected via systematic evaluation of efficacy in our sponsored clinical trials, or evaluated via other statistical principles that may be applied in these trials. Such studiesWe can offer no assurances that the observations reported by the treating physicians under these expanded access INDs are carried out by individual investigatorsdue solely to Epidiolex and not conducted in strict compliance with Good Clinical Practices.as a result of other factors, such as a beneficial or synergistic drug-drug interaction, as postulated above. Further, due to the non-normal distribution of the data collected from the small sample size, we have chosen to use median data in its analysis. However, other statistical principles may be more appropriate to the analysis of the clinical data generated from our placebo controlled trials of Epidiolex for the treatment of Dravet syndrome, LGS, TSC and LGS.IS.
We believe the data we have received to date under these expanded access INDs support the continued investigation of Epidiolex as a potential treatment for epilepsy, including for Dravet syndrome, LGS, TSC and IS.
| 38 |
Emergency INDs
The FDA has also granted to physicians 12 individual emergency INDs. An emergency IND is an IND for the use of an investigational new drug or biological product for clinical treatment of a patient in an emergency situation. In order to be granted an emergency IND the following five conditions must all be met: (1) the patient or patients to be treated have a serious or immediately life-threatening disease or condition, and there is no comparable or satisfactory alternative therapy to diagnose, monitor, or treat the disease or condition; (2) FDA must determine that the patient cannot obtain the drug under another IND or protocol; (3) the potential benefits to the patient justify the potential risks of the treatment and the risks from this investigational treatment are not unreasonable in the context of the disease or condition treated with this investigational product; (4) providing the investigational drug for the requested use will not interfere with the initiation, conduct, or completion of clinical investigations that could support marketing approval of the expanded access use or otherwise compromise the potential development of the expanded access use; and (5) the physician must determine that the probable risk to the person from the investigational drug is not greater than the probable risk from the disease or condition. In these cases, we have responded to, and the FDA has approved, emergency treatment requests from physicians for children hospitalized as a result of severe and potentially life-threatening seizures. In a poster at the American Epilepsy Society annual meeting in December 2014, Lopez C. et al. presented information on a four year old patient with super refractory status epilepticus due to febrile infection related epilepsy syndrome, or FIRES, treated with Epidiolex under an emergency IND concluding that CBD was very well tolerated and associated with a significant improvement in clinical and electrographic seizure burden. We believe eight of the children treated under emergency INDs remain on Epidiolex treatment. Two children treated under emergency INDs died while receiving treatment with Epidiolex and two withdrew due to lack of efficacy; both deaths were deemed unrelated to Epidiolex by the independent investigators.
Collaborations with State Governments in Australia
In October 2015, we announced that we had signed a Memorandum of Understanding, or MOU, with the Government of New South Wales, or NSW, in Australia to advance a research program for Epidiolex and CBDV in children with severe, drug resistant childhood epilepsy. With respect to Epidiolex, the MOU will facilitate (i) a compassionate access program for Epidiolex, (ii) provision for NSW to host additional Phase 3 clinical trials of Epidiolex and (iii) a Phase 4 clinical trial of Epidiolex (to follow completion of the Phase 3 trials). The first patients received treatment under the compassionate access program for Epidiolex in Q3 2016.
In June 2016, we signed an MOU with the Queensland Government in Australia to advance research into the use of cannabinoid-based pharmaceutical products for the treatment of patients in Queensland with serious illness, including childhood epilepsy. The MOU will facilitate (i) establishing a centre to undertake clinician led observational studies using cannabinoid-based investigational medicinal products across a range of childhood developmental disorders, (ii) an expanded access treatment protocol using Epidiolex for a small number of patients with severe drug-resistant epilepsy and (iii) an observational study for a small number of patients with severe drug-resistant epilepsy using Epidiolex and other cannabinoids.
Epidiolex Manufacturing
We are currently manufacturing Epidiolex through utilization of in-house and external third party facilities for various steps in the production process. We expect to satisfy near-term requirements for Epidiolex from these current facilities but we are also in an ongoing process of scaling-up various parts of the production process both in-house and with external third parties.
We are actively scaling our growing and manufacturing of Epidiolex to meet anticipated commercial demand, if approved. From our extensive experience in growing CBD botanical raw material, we are able to utilize a range of growing methods to generate significant quantities of CBD botanical raw material derived from our proprietary CBD plant chemotypes. In 2015, our production of CBD botanical raw materials increased by a factor of approximately 20 times compared with the previous year and increased significantly again in 2016. The combined inventory created by growing operations over the last 2 years equates to approximately 200 tonnes of CBD raw materials for Epidiolex and when purified and formulated, results in approximately 1.6 million 100mg/ml bottles of Epidiolex. With expectations of significant demand for Epidiolex upon potential approval, we plan to continue expansion of our Epidiolex plant growing capacity well beyond our exit 2016 levels and to this end GW recently signed an agreement with a new third party that enables GW to treble its growing capacity from 2017 onwards. The finished product, Epidiolex, is a liquid formulation of pure CBD and there are several processing steps beyond growing to ensure that the product is pure, meets the required FDA specification, and can be manufactured at scale to current Good Manufacturing Practice Regulations. Each step has already been scaled and a further increase in scale of the processes is anticipated during 2016 and into 2017. We believe we are on track to be ready for FDA pre-approval inspection anticipated in the second half of 2017.
Epidiolex Commercialization
We are planning to commercialize Epidiolex in the United States and elsewhere using our own sales and marketing organization. In June 2015, we appointed Julian Gangolli to the newly created position of President, North America and he has been appointed to our Board of Directors. Mr. Gangolli is leading our commercial organization in the United States. We have also recruited a number of U.S. medical affairs, clinical trials and commercial staff, many of whom have strong epilepsy knowledge and experience. We expect this organization to expand over the next 12 months. The creation of the medical affairs team has allowed us to open scientific and consultative communications with key stakeholders, such as the patient and physician communities in the United States. Our commercial staff have begun actively developing our commercial strategy for the United States.
Our U.S. commercial organization is based in our office at Carlsbad, CA. With the successful results from the first Dravet syndrome and two LGS Phase 3 trials, we are now accelerating plans for our potential U.S. commercialization of Epidiolex. We expect to implement a “high efficiency” commercial deployment model expected to include a dedicated sales force of approximately 50 to 60 sales professionals targeting approximately 4,000 – 5,000 U.S. physicians. This commercial organization will be defined by a “high-touch” patient, payor and physician communication, education and distribution model.
We believe that the U.S. physician awareness and enthusiasm for a new therapeutic alternative for the treatment of pediatric epilepsies is high, and that, if approved, Epidiolex would represent a new class of anti-convulsant with a potentially differentiated side-effect profile and mechanism of action.
| 39 |
We will commercialize our CBD-containing products for the treatment of epilepsy under a different name than Epidiolex in the United States. We will commercialize these products, and any of our other products, in the United States under the name Greenwich Biosciences and have changed the name of our U.S. subsidiary responsible for commercializing these products in the United States from GW Pharmaceuticals Inc. to Greenwich Biosciences Inc.
Epidiolex Intellectual Property
In addition to orphan exclusivity, we have been seeking to protect Epidiolex through our patent portfolio. We have a portfolio of intellectual property relating to the use of CBD in epilepsy. This portfolio includes twelve distinct patent families which are either granted or filed. The latest expiry date of these families runs to July 2036. This portfolio includes patent families with claims directed to the use of CBD in the treatment of epilepsy seizure subtypes, particular childhood epilepsy syndromes, and formulations. To date, this has resulted in 2 patents granted by the USPTO and numerous patent applications being prosecuted at the USPTO. We anticipate filing additional patent applications claiming the use of Epidiolex in 2017 as new data is generated, and expect more of our pending patent applications to be granted by USPTO during 2017. Should the NDA for Epidiolex be approved we expect a number of these granted patent to be listed in the Approved Drug Products with Therapeutic Equivalence Evaluations, or Orange Book. In addition other patent families provide protection for epilepsy related inventions such as extraction techniques, CBD extracts and highly purified CBD.
GWP42006 (CBDV) in Epilepsy and Autism Spectrum Disorders (ASD)
In addition to Epidiolex, our epilepsy product candidates also include GWP42006, which features CBDV as the primary cannabinoid. CBDV is similar in chemical structure to CBD and has also shown anti-epileptic properties across a range ofin vitro andin vivo models of epilepsy. In a paper published in the September 2012 issue of The British Journal of Pharmacology by scientists with whom we collaborate at the University of Reading, United Kingdom, GWP42006 was reported to have the potential to prevent more seizures, with few of the side effects caused by many existing AEDs, such as uncontrollable shaking. In the study, GWP42006 strongly suppressed seizures in six different experimental models commonly used in epilepsy treatment. GWP42006 was also found to provide additional efficacy when combined with drugs currently used to control epilepsy. Genetic biomarkers for response have been identified.
We have also evaluated GWP42006 in both general and syndromic pre-clinical models of ASD yielding promising signals on cognitive and social endpoints as well as repetitive behavior. These animal models include both genetically determined abnormalities of neurobehavioral, and chemically-induced models, and include Rett syndrome and Fragile X among others.
We have completed a Phase 1 trial of GWP42006 in 66 healthy subjects. In this trial, GWP42006 was well tolerated even at the highest tested dose. There were no serious or severe adverse events reported, nor any withdrawals due to adverse events.
We expect to commenceare pursuing multiple development programs for GWP42006 both within adult and childhood epilepsy and in childhood behavioral disorders:
CBDV Intellectual Property Portfolio
We have rights to a portfolio of intellectual property relatedrelating to CBDCBDV for use in various indications including epilepsy and CBDV in epilepsy.autism spectrum disorder. This portfolio includes ten patent families containing onewhich are either granted or more pending and/or issued patent claims related tofiled, protecting the use of CBD and/or CBDV in the treatment of epilepsy as well as compositions, extraction techniques, CBD and CBDV extracts and highly purified CBD.this product candidate. The latest expiry date of these families runs to June 2034. We have recently filed a further four newApril 2036. These patent applications providing protection for use of the product candidates. The latest expiry date of these families runsinclude claims to October 2034. In March 2014, the Intellectual Property Office in the United Kingdom granted a patent for the use of CBDV in the treatment of epilepsy (patent number GB2479153B) which covers the use of CBDV alone or in combination with standard anti-epileptic drugs in the treatment of seizures, the use of CBDV in the treatment of autism spectrum disorders and associated conditions. Other families which provide protection for the use of CBDV in other therapeutic areas such as neuropathic pain, Alzheimer’s disease and Duchenne’s disease, CBDV compositions and CBDV extracts. We anticipate additional patent applications being filed as new data is generated.
Other Orphan Product Candidates
Neonatal Hypoxic-Ischemic Encephalopathy (NHIE)
NHIE is acute or sub-acute brain injury due to asphyxia caused during birth resulting from deprivation of oxygen during birth, referred to as hypoxia, as a result of a sentinel event such as ruptured placenta, parental shock and even increased heart rate. Hypoxic damage can occur to most of the infant’s organs, but brain damage is the most serious and least likely to heal, resulting in combination withencephalopathy. This can later manifest itself as either mental retardation (including developmental delay and/or intellectual disability) or physical disabilities such as spasticity, blindness and deafness. Indeed, spastic diplegia and the other cannabinoids,forms of cerebral palsy almost always feature asphyxiation during the birth process as a contributing factor. The exact timing and provides an exclusivity period until March 30, 2030. This same patentunderlying causes of these outcomes remains unknown but it is currentlywidely recognized that interventions need to be administered within six hours of hypoxic insult.
| 40 |
Market Overview
According to Kurinczuk et al. in prosecution withthe 2010 edition of Early Human Development, the incidence of NHIE is 1.5 to 2.8 per 1,000 births in the United States, Patentor, by our estimate, 6,500 to 12,000 cases per year. Of these, 35 percent are expected to die in early life and Trademark Office.30 percent of cases will result in permanent disability. There are currently no FDA-approved medicines specifically indicated for NHIE. The only FDA-approved treatment is the Olympic Cool-Cap System and treatment guidelines in many European countries also support use of whole body hypothermia. Clinical trials have shown the Cool-Cap to reduce the occurrence of disability due to NHIE but not death, while whole body hypothermia had a more marginal effect on disability but is able to reduce mortality. This treatment is only available in specialized neonatal intensive care units and must be started within 6 hours of birth. Even if a patient is put into induced hypothermia there is still a significant rate of morbidity and mortality, with a meta-analysis of the available data revealing a 27 percent death rate. Among the patients who survive NHIE, 28 percent suffer from major neurodevelopment issues and 26 percent develop cerebral palsy. There are academic initiatives looking to develop treatments in this area. In addition, one intervention being investigated by the pharmaceutical industry is an IV infusion of 2-Iminobiotin. Neurophyxia B.V. attained Orphan Drug Designation for this treatment in both Europe and the United States and is conducting a Phase 2 trial.
Cannabinoid Rationale for Treating NHIE
OtherThe pathophysiology of NHIE includes processes such as apoptosis, oxidative stress, inflammation and excitotoxicity, and may involve not only the brain, but also other organs. Some cannabinoids are able to influence all of these processes, but unlike other therapeutic compounds under development, can combine these neuroprotective strategies within a single molecule. Firstly, cannabinoids can act on nuclear receptors that control neuronal homeostasis and survival. Secondly, not only do cannabinoids have important free radical scavenging actions, but they may also upregulate and activate endogenous antioxidant defenses. Thirdly, cannabinoids influence the immune network and modulate phenomena associated with infection or inflammation, via inhibition of macrophage and neutrophil migration, natural killer cell proliferation, and by their ability to inhibit harmful cytokine production. It has been widely reported that endocannabinoids are able to protect the glial cell, an effect that may be independent of CB receptors. Finally, the endocannabinoid system, or ECS, has been shown to be neuroprotective in animal models — the levels of endogenous cannabinoids become enhanced in the brains of newborn rats after acute injury, acting as a protective response, and it has been proposed that one additional mechanism by which plant cannabinoids work is by preventing the enzymatic degradation of endocannabinoids, thus enhancing endogenous defense mechanisms. Recent research into the neuroprotection that has been shown by cannabinoids in animal models of neonatal hypoxia has also suggested a role for the 5HT1A receptor, since some of the beneficial effects can be blocked by 5HT1A receptor antagonists.
CBD as the Primary Cannabinoid Product Candidate in NHIE
In addition to its other properties, the possible neuroprotective effects of CBD have been examined. These neuroprotective effects are thought to be based mainly on the potent anti-inflammatory and anti-oxidant properties of CBD, although other actions of CBD that might also account for CBD-induced neuroprotection including: inhibition of calcium transport across membranes; inhibition of anandamide uptake and enzymatic hydrolysis; inhibition of iNOS protein expression and NF-|gkB activation; and inhibition of adenosine uptake. In a similar fashion to endocannabinoids, adenosine is thought to be part of a natural neuroprotective system, because adenosine levels rise in response to hypoxic insult in the brain and increasing extracellular adenosine acts as a neuroprotectant. It has been demonstrated that CBD enhances adenosine signaling through the inhibition of adenosine re-uptake and therefore indirectly activates the adenosine A2A receptor. Previously, it was demonstrated that CBD reduces brain damage after ischemic injury in adult animals. In a newborn piglet model of NHIE, CBD improved brain activity as measured by an EEG and reduced the numbers of seizures by half, while histological analysis of brain tissues showed that neuron degeneration was reduced. Neurological exams showed improved neurobehavioral performance up to three days after insult. There were also significant beneficial extra cerebral effects and the dose of dopamine needed by the animals to maintain blood pressure was less than half of what was required in vehicle-treated animals.
Our NHIE Research
In a paper by Castillo et al., published in Neurobiology of Disease in 2010, reporting results from our pre-clinical collaboration, CBD protected newborn mice forebrain slices from oxygen and glucose deprivation. We have further demonstrated that CBD was neuroprotective even when administered 18 hours after the hypoxic insult. A study from our pre-clinical collaboration with Lafuente, published in Paediatric Research in 2011, showed that administration of CBD to newborn piglets at doses much lower than those reported in the literature appears to protect brain cells, preserve brain activity, prevent seizures and improve neurobehavioral performance. These neuroprotective effects were not only free from side effects in the piglets but also associated with some cardiac, hemodynamic and ventilatory benefits unlike other promising compounds with neuroprotective activity. This data supports the view of CBD as a possible therapy for asphyxiated newborns. In a paper by Pazos et al. published in Neuropharmacology in 2012, post hypoxic-ischemic administration of CBD to newborn rats was shown to reduce the volume of brain damage, restore neurobehavioral function long term and reserve myelinization. In a second paper by Pazos et al., published in Neurpharmacology in 2013, reporting results from our pre-clinical collaboration, post hypoxic-ischemic administration of CBD was shown, in a piglet model, to reduce necrotic and apoptotic cell death, recover brain activity, restore neurobehavioral function in the short term and enhance hypothermia protection.
| 41 |
Our NHIE clinical program
We held a pre-IND meeting with the FDA to discuss the development program for an intravenous CBD formulation (GWP42003) in the treatment of NHIE. In April 2015, we received Orphan Product CandidatesDrug Designation from the FDA for CBD for the treatment of NHIE and in July 2015 we received fast track designation. In July 2015 we received Orphan Drug Designation from the EMA for CBD for the treatment of perinatal asphyxia, an alternate term that describes the same condition. We commenced a Phase 1 trial of GWP42003 in healthy volunteers in the fourth quarter of 2016.
Glioma
Beyond epilepsy-related orphan diseases, in October 2013, we commencedare evaluating a Phase 1b study in 20 patients of our combination product containing GWP42002:GWP42003 product, which includes the cannabinoids CBD and THC,(THC:CBD) in the treatment of recurrent glioblastoma multiforme, or GBM, a particularly aggressive brain tumor which is considered a rare disease bytumor. We have received Orphan Drug Designation from the FDA andfor GWP 42002:GWP42003 combination for the European Medicines Agency.treatment of GBM.
Market Overview
Glioma describes any tumor that arises from the glial tissue of the brain. Glioblastoma is a particularly aggressive tumor that forms from abnormal growth of glial tissue. According to the New England Journal of Medicine, GBM accounts for approximately 46%46 percent of the 22,500 new cases of brain cancer diagnosed in the United States each year. We expectTreatment options are limited and expected survival is a little over one year. GBM is considered a rare disease by the FDA and the EMA.
Our Research
In pre-clinical models, we have shown cannabinoids to advance at least one additional orphan drug opportunitybe orally active in the nexttreatment of gliomas and, in addition, have shown tumor response to be positively associated with tissue levels of cannabinoids. We have identified the putative mechanism of action for our cannabinoid product candidates, where autophagy and programmed cell death are stimulated via inhibition of the akt/mTORC1 axis. We have shown inin vivo studies that cannabinoids have a synergistic effect with temozolomide, the standard chemotherapeutic agent used in the treatment of glioma.
A recent study carried out in collaboration with us by specialists at St. George’s University of London, was the first to show a dramatic effect on brain tumors when combining cannabinoids with irradiation. This research, published in Molecular Cancer Therapeutics, showed that tumor growth in mouse brain was significantly slowed when a combination of THC and CBD was used with irradiation and tumor inhibition was higher than observed with irradiation alone.
In light of this promising pre-clinical research, in 2014, we commenced an early proof of concept Phase 1b/2a clinical trial in 20 patients with recurrent GBM evaluating GWP42002:GWP42003 in combination with temozolomide, the current standard of care. This trial is a two-part study with an open-label phase to assess safety and tolerability followed by a double-blind, randomized, placebo-controlled phase with patients randomized to receive active or placebo. The first phase, an open-label safety evaluation of GWP42002:GWP42003 comprising two cohorts of three patients each completing two cycles (months) of treatment is complete. Safety data from these initial patient cohorts has been assessed by the independent safety monitoring board and their approval was given to proceed into the Phase 2a placebo-controlled phase of this trial.
We have now completed the placebo-controlled Phase 2a part of this trial, having enrolled 20 patients. Top-line data is expected in the first quarter of 2017. The primary outcome measure is 12 months.month progression free survival.
The principal cannabinoids we have studied in pre-clinical models of glioma are GWP42002 and GWP42003 in various ratios, and this first trial employs Sativex, which contains an equal ratio of GWP42002 and GWP42003, to establish a proof of principle. It is anticipated that subsequent development may focus on a product candidate with a different ratio of GWP42002 and GWP42003.
Other Pipeline Product Candidates
Ulcerative ColitisSchizophrenia
Market Overview
Ulcerative colitis, or UC,Schizophrenia is a chronic relapsing inflammatory disease affecting the colon which can cause pain, urgent diarrhea, severe tirednessthat manifests through disturbances of perception, thought, cognition, emotion, motivation and loss of weight. In addition, patients with chronic intestinal inflammation have an increased risk of developing bowel cancers. According to the Crohn’s & Colitis Foundation of America, UC may affect as many as 700,000 Americans. The four major classes of medication used today to treat ulcerative colitis are aminosalicylates (5-ASA), steroids, immune modifiers and antibiotics.
GW has now completedmotor activity. Over a 10-week randomized, double-blind, placebo-controlled Phase 2a study of GWP42003 extract, which features CBD as the primary cannabinoid and which also contains other cannabinoid and non-cannabinoid components, in the treatment of ulcerative colitis in patients who had not been able to gain remission from the condition despite first line treatment with salicylates, and in some cases immunosuppressive therapy. This study follows pre-clinical research that has shown GWP42003 to have anti-inflammatory properties in a number of accepted animal models of inflammation, notablylifetime, about 1 percent of the gut andpopulation will develop schizophrenia. All anti-psychotic treatments for schizophrenia rely primarily upon their antagonistic action at the joints. The primary endpoint of this study was the percentage of participants achieving remission quantified by the MAYO score and the study also includeddopamine D2 receptor for their antipsychotic effect. They produce a wide range of secondary endpoints in particular focusing on symptom control. While the study did not meet the primary endpoint, data from this 60-patient study showed promising signals of efficacy across a range of secondary endpoints in patients who completed the course of treatment.There were no serious adverse events, (SAEs) on GWP42003, while there were 4 SAEs on placebo (twoand are often poorly tolerated by patients resulting in poor compliance with treatment. Current antipsychotics also have little or no effect upon the “negative” symptoms (blunted mood and lack of which were exacerbationspleasure, motivation and movement) of the ulcerative colitis). 13 patients withdrew from the study due to adverse events of the drug(most of these withdrawals were due to THC-related adverse events such as dizziness), compared with 7 on placebo.
Type-2 Diabetes
In March 2014, GW commenced a 12-week randomized, double-blind, placebo-controlled Phase 2 study of GWP42004 to treat type-2 diabetes. GWP42004 is an orally administered product which features plant-derived tetrahydrocannabivarin (THCV) as its active ingredient. THCV is distinct from THC and does not share its intoxicating psychoactive effects. The primary objective of this study is to compare the change in glycemic control in participants with type-2 diabetes when treated with one of three doses of GWP42004 or placebo as add-on therapy, to metformin with the primary endpoint being change from baseline to the end of treatment in mean glycosylated haemoglobin A1c (HbA1c) level. The safety and tolerability of GWP42004 compared with placebo will also be assessed. This study is expected to enroll approximately 200 patients with an estimated completion date of the second half of 2015.
This study follows positive findings reported in November 2012 from a Phase 2a exploratory study, showing evidence of anti-diabetic effects and supporting advancement of GWP42004 into further clinical development. These findings were consistent with pre-clinical data demonstrating that GWP42004 protects the insulin-producing cells of the pancreatic islets, a highly desirable feature of a new anti-diabetic medicine, increases insulin sensitivity, and reduces fasting plasma glucose levels.
GW believes that if the Phase 2 study confirms the Phase 2a findings, GWP42004 would have the potential to offer a novel orally-administered treatment option in this large potential market.
Schizophrenia
In March 2014, GW commenced a Phase 2a trial using GWP42003 to treat schizophrenia, featuring purified CBD as its active ingredient. The primary objective of this study is to compare the change in symptom severity in patients with schizophrenia or related psychotic disorder when treated with GWP42003 or placebo, addedthe associated cognitive deficit. Furthermore, the “positive” symptoms (such as hallucinations, delusions and thought disorder) of at least one-third of patients fail to first-line anti-psychotic therapy over a period of six weeks as change from baselinerespond adequately to the end of treatment using the Positive and Negative Symptom Scale (PANSS) total score. Secondary objectives are to evaluate the effect of GWP42003 on quality of life and cognition and to assess the safety and tolerability of GWP42003. This study is expected to enroll approximately 80 patients with an estimated completion date of the second half of 2015.current treatments.
Our Research
GWP42003 has shown notable anti-psychotic effects in accepted pre-clinical models of schizophrenia and importantly has also demonstrated the ability to reduce the characteristic movement disorders induced by currently available anti-psychotic agents. In September 2015, we announced positive top line results from an exploratory Phase 2 placebo-controlled clinical trial of CBD in 88 patients with schizophrenia who had previously failed to respond adequately to first line anti-psychotic medications. Over a series of exploratory endpoints, CBD was consistently superior to placebo, with the most notable differences being in the PANSS positive sub-scale (p=0.018), the Clinical Global Impression of Severity (p=0.04) and Clinical Global Impression of Improvement (p=0.02). The proportion of responders (improvement in PANSS Total score greater than 20 percent) on CBD was higher than that of participants on placebo and the Scale for Assessment of Negative Symptoms showed a trend in favor of CBD which reached statistical significance for patients taking CBD together with one of the leading first line anti-psychotic medications. The safety profile of CBD was reassuring, with no serious adverse events and an overall frequency of adverse events very similar to placebo.
| 42 |
We believe that the signals of efficacy demonstrated in this trial, together with a notably reassuring safety profile, provide us with the prospect of new and distinct cannabinoid neuropsychiatric product pipeline opportunity as the mechanism of GWP42003CBD does not appear to rely on the dopamine D2 receptor augmentation of standard antipsychoticsantipsychotics. We are now analyzing the data to fully understand the appropriate next steps regarding product development in schizophrenia with future research likely focused on pediatric orphan neuropsychiatric indications. Additionally, our pre-clinical research findings suggest that a range of other psychiatric conditions may be promising targets for cannabinoid therapeutics.
Sativex for Cerebral Palsy in Children
We are currently conducting a Phase 2 clinical trial of Sativex to assess the efficacy, safety and tolerability of Sativex as an adjunctive treatment to existing anti-spasticity medications in children aged 8 to 18 years with spasticity due to cerebral palsy or traumatic central nervous system injury who have not responded adequately to existing anti-spasticity medications. This trial is a randomized, double-blind, placebo-controlled trial followed by a 24-week open label extension phase and is now complete, having enrolled 70 patients. We expect to report data from this trial in the first quarter of 2017
Pre-clinical developments
In addition to our extensive in-house research organization, we have established a global network of leading scientists in the cannabinoid field. Our proprietary cannabinoid product platform allows us to discover, develop and commercialize additional novel first-in-class cannabinoid products across a broad range of therapeutic areas. Some of the more advanced programs include:
Our Commercialized Product: Sativex® for MS Spasticity
Sativex is an oromucosal spray of a formulated extract of the cannabis sativa plant that contains the principal cannabinoids THC and CBD as well as specific minor cannabinoids and other non-cannabinoid components. We developed Sativex to be administered as an oral spray, whereby the active ingredients are absorbed in the lining of the mouth, either under the tongue or inside the cheek. The product has been granted the U.S. Adopted Name, or USAN, of nabiximols.
Our Product Pipeline Summarylicensing partners are commercializing Sativex for MS spasticity in 16 countries outside the United States. We have also received regulatory approval in an additional 14 countries, and we anticipate commercial launches in several of these countries in the next 12 months. Regulatory filings are ongoing in a number of additional countries, principally in the Middle East and Latin America where we expect approvals over the next 12 months.
MS Spasticity Indication in the United States
Our commercialized productWe previously opened an IND with the FDA for the MS spasticity indication and key ongoing development programs are shown in the table below.this has now been withdrawn.
|
|
|
|
| |||||
| |||||||||
|
|
|
|
| |||||
| |||||||||
|
|
|
|
| |||||
|
|
|
|
| |||||
Our Strategic Partnerships
To support the development and commercialization of Sativex, we have entered into license and development agreements with the following major pharmaceutical companies: Otsuka in the United States; Almirall S.A., or Almirall, in Europe (excluding the United Kingdom) and Mexico; Novartis Pharma AG, or Novartis, in Australia and New Zealand, Asia (excluding Japan, China and Hong Kong), the Middle East (excluding Israel) and Africa; Bayer HealthCare AG, or Bayer, in the United Kingdom and Canada; Ipsen Biopharm Ltd, or Ipsen, in Latin America (excluding Mexico and the Islands of the Caribbean); and Neopharm Group, or Neopharm, in Israel. These agreements provide our collaborators with the sole right to commercialize Sativex in exclusive territories for all indications. In November 2016 we entered into a mutual termination agreement with Novartis, pursuant to which rights in Sativex in Australia and New Zealand, Asia (excluding Japan, China and Hong Kong), the Middle East (excluding Israel) and Africa will be returned to GW over an agreed transition period, and we are in the process of appointing new distributors in the countries in the Novartis territories where Sativex is approved. From our incorporation through September 30, 20142016, these agreements have yielded cash of £67.6£67.9 million in upfront fees and milestone payments. In addition, weWe are entitled to receive up to an additional £203.0 million in potentiallump sum payments upon the achievement of certain regulatory and commercial milestones.milestones in the future, but are not relying on any of these milestones being achieved. Upon commercialization, we are also entitled to receive revenue from the supply of products as well as royalties on product sales. In addition, under the terms of our agreement with Otsuka, all pre-clinical and clinical costs associated with the development of Sativex in the United States are fully funded by Otsuka.
Our StrengthsFollowing the failure of the Sativex cancer pain trials, GW Pharma and Otsuka expect to meet to discuss whether there are any next steps for Sativex in the United States within the scope of this partnership.
We believe thatWith the exception of Sativex, we offer the following key distinguishing characteristics:retain global commercial rights to all of our other product pipeline candidates.
| 43 |
Our Proprietary Cannabinoid Product Platform
The cannabis plant is the unique source of more than 70 structurally related,structurally-related, plant-derived cannabinoids. Although one cannabinoid, THC, is known to cause psychoactive effects associated with the use of illicit herbal cannabis, none of the other cannabinoids are known to share this property. In recent decades, there have been major scientific advances that have led to the discovery of new plant-derived cannabinoids and a cannabinoid receptor system in the human body, or endocannabinoid system. We are at the forefront of this new area of science, and we believe that our proprietary cannabinoid product platform uniquely positions us to discover and develop cannabinoids as new therapeutics. We are currently evaluating the potential for cannabinoids in the treatment of central nervous system, or CNS, disorders, including epilepsy, multiple sclerosis and schizophrenia, cancer and cancer pain, type-2 diabetes, ulcerative colitis and neurodegenerative disease.
Our proprietary cannabinoid product platform consists of our:
| • | discovery of novel cannabinoid pharmacology through conductingin vitro andin vivo pharmacologic evaluation studies in validated disease models to determine the most promising potential therapeutic areas for each extract; |
We believe that our focus on the development of therapeutics from plant-derived cannabinoids offers the following important advantages:
We believe that the successful development and regulatory approval of Sativex for MS spasticity provide important validation of our proprietary cannabinoid product platform.
The prospect for cannabinoid therapeutics to be approved through the FDA approval pathway has been the subject of statements from the White House, Congress, and the Drug Enforcement Administration, or DEA.DEA, and the FDA. The White House Office of National Drug Control Policy states on its “Facts and Answers to the Frequently Asked Questions about Marijuana” on the White House website that the FDA has recognized and approved the medicinal use of isolated components of the marijuana plant and related synthetic compounds, and it specifically references Sativex as a product that is currently in late-stage clinical trials with the FDA. In its June 2012 report titledentitled “Reducing the U.S. Demand for Illegal Drugs,” the U.S. Senate Caucus on International Narcotics Control expresses the view that the development of marijuana-based therapeutics through an approved FDA process is the best route to explore and references Sativex as a promising product currently in the final phase of the FDA’s trials for approved use in the United States. In that report, the Senate Caucus urged the FDA to complete a careful review of Sativex in a timely manner. In its May 2014 report titledentitled “The Dangers and Consequences of Marijuana Abuse,” the DEA expresses support for ongoing research into potential medicinal uses of marijuana’s active ingredients, and specifically references Sativex and Epidiolex. A presentation in March 2015 by Douglas C. Throckmorton, Deputy Director for Regulatory Programs, Center for Drug Evaluation and Review, FDA, referenced Epidiolex and Sativex as examples of drugs in clinical testing, and concluded that drug development, grounded in rigorous scientific research is essential to determining the appropriate uses of marijuana in the treatment of human disease, and that the FDA is committed to making this process as efficient as possible and looking for ways to speed the availability of new drugs from marijuana for the American public. Further, in his statement before the Subcommittee on Crime and Terrorism, Committee on the Judiciary, U.S. Senate on “Researching the Potential Medical Benefits and Risks of Marijuana” on July 13, 2016, Douglas C. Throckmorton, Deputy Director for Regulatory Programs, Center for Drug Evaluation and Research, FDA, described how development programs for drugs derived from marijuana are eligible for certain FDA expedited review and development programs under appropriate circumstances, and some are being used to aid the development of drugs derived from marijuana, giving the examples of FDA’s grant of Fast Track designation to Sativex for the treatment of pain in patients with advanced cancer, who experience inadequate analgesia during optimized chronic opioid therapy, and Epidiolex, in the treatment of Dravet syndrome. He concluded that there is considerable public interest in developing new therapies from marijuana and its constituents, and FDA will continue to play its role in ensuring that any such new therapies are safe, effective, and manufactured to a high quality, applying the drug development paradigm that continues to provide new medicines that meet these standards for patients.
| 44 |
Our Strengths
We believe that we offer the following key distinguishing characteristics:
| • | A late stage product, Epidiolex, in pediatric epilepsy for which we have generated positive Phase 3 data. We have reported positive Phase 3 data for Epidiolex in both Dravet syndrome and LGS. Each of these conditions is a severe, infantile-onset, genetic, drug-resistant epilepsy syndrome for which we have secured Orphan Drug Designation from the FDA. We expect to submit an NDA to the FDA at the end of the first half of 2017. |
| • | Additional indications for Epidiolex to expand epilepsy market opportunity. We believe that there is potential for the development of Epidiolex in additional rare childhood-onset epilepsy indications. Physician reported data on patients receiving Epidiolex under physician-led INDs includes promising signals of clinical effect in patients with conditions other than Dravet syndrome and LGS. One of these additional indications is TSC, and we commenced Phase 3 development in this indication in April 2016. Another is IS, and we commenced clinical development in the IS indication in the fourth quarter of 2016, and there are additional potential target indications under consideration for future development. |
| • | We retain global commercial rights to Epidiolex and believe it has significant market potential. We are building a U.S. commercial organization led by Julian Gangolli as President, North America, who joined us in June 2015 having previously held the same position at Allergan. We have also recruited U.S. medical affairs, clinical trials and commercial staff, many of whom have strong epilepsy knowledge and experience. There is a significant unmet need within the field of epilepsy and we believe that U.S. physician awareness and enthusiasm for Epidiolex is high. |
| • | Commercialized product validates development and regulatory pathway. We believe that the successful development and regulatory approval of Sativex in MS spasticity outside the United States provides important validation of our proprietary cannabinoid product platform. On this basis, we believe that we can develop a portfolio of additional cannabinoid therapeutics. |
| • | Additional pipeline programs within epilepsy, autism, and pediatric neurology. We are in Phase 2 clinical development for an additional product candidate, GWP42006 (CBDV), in adult epilepsy patients. GWP42006 has also shown promising pre-clinical data within the field of ASDs and we expect to commence Phase 2 development in this therapeutic area in the third quarter of 2017. We have received Orphan Drug Designation from the FDA for CBDV for the treatment of Rett syndrome. In addition, we have received Orphan Drug Designation from the FDA for CBD in the treatment of NHIE and commenced Phase 1 development of an intravenous CBD formulation in the treatment of NHIE in the fourth quarter of 2016. |
| • | A pipeline of additional cannabinoid orphan and non-orphan drug opportunities for which we retain global commercial rights. We have completed a Phase 1b/2a trial of another product, our combination GWP42002:GWP42003, to treat GBM and expect to report top-line data in the first quarter of 2017. We have successfully completed a Phase 2 trial in schizophrenia for our product candidate, GWP42003. |
| • | Opportunity for first-in-class treatments across a large number of therapeutic targets. We are at the forefront of the commercialization of cannabinoid therapeutics using our proprietary product platform to identify, validate and develop innovative first-in-class therapeutics that are designed to meet significant unmet medical needs. |
| • | Strong competitive position in a highly specialized and regulated field. We believe that we are uniquely positioned to benefit from the significant potential within the field of cannabinoid therapeutics in which we have developed a successful track record and expertise, as well as an intellectual property portfolio, during our 18 years of operations. |
| • | In-house manufacturing capabilities and expertise in controlled substances. We operate under Good Manufacturing Practice commercial manufacturing licenses in the United Kingdom, which give us the capability to supply our products to global markets. We have successfully exported cannabinoid commercial or research materials to over 30 countries and have substantial expertise in relevant international and national regulations in relation to the research, distribution and commercialization of cannabinoid therapeutics. |
| • | Highly experienced management team and network of leading scientists. Several members of our leadership team have been in place for over ten years. We have a fully integrated in-house research and development organization, regulatory capabilities and commercial manufacturing expertise. We closely collaborate with a broad network of leading scientists in the cannabinoid field. |
Our Business Strategy
Our goal is to capitalize on our leading position in the field of plant-derived cannabinoid therapeutics by pursuing the following strategies:
| • | Secure regulatory approval |
| • |
| 45 |
| • | Develop additional product candidates within the field of epilepsy and pediatric neurology. We have a second product candidate, GWP42006, for which a Phase 2 clinical trial in epilepsy is underway with data expected mid 2017. We expect to |
| • |
| Leverage our proprietary cannabinoid product platform to discover, develop and commercialize additional novel first-in-class cannabinoid products. We believe our established platform, including our in-house development expertise, allows us to achieve candidate selection and |
| • |
| Further strengthen our competitive position. We will continue to develop our extensive international network of the most prominent scientists in the cannabinoid field and secure additional intellectual property rights. |
Our Proprietary Cannabinoid Product Platform
We believe we have established a world-leading position in cannabinoid therapeutics through our proven proprietary cannabinoid product platform. Our platform consists of a continually evolving library of internally generated novel cannabis plant types that produce selected cannabinoids, discovery of novel cannabinoid pharmacology through our network of world leading scientists, an intellectual property portfolio, in-house formulation, processing and manufacturing capabilities, and development and regulatory expertise. We further believe that we are in a unique position to develop and manufacture plant-derived cannabinoid formulations worldwide at sufficient quality, uniformity, scale and sophistication for the purposes of pharmaceutical development and to meet international regulatory requirements.
| 46 |
Cannabinoid Science Overview
Although one cannabinoid, THC, is known to cause psychoactive effects associated with the use of illicit herbal cannabis, none of the other cannabinoids are known to share these properties. In recent decades, there have been major scientific advances that have led to the discovery of new plant-derived cannabinoids and the endocannabinoid system. We are at the forefront of this new area of science and our research into a large number of these cannabinoids suggests that each has distinct pharmacological effects and potential therapeutic applications.
Our research to date has focused on the following plant-based cannabinoids:
| CBD(Cannabidiol) | CBN(Cannabinol) | |
| CBDV (Cannabidivarin) | CBNV (Cannabinovarin) | |
| CBDA (Cannabidiol—Acid) | D8-THC (Delta-8 Tetrahydrocannabinol) | |
| CBDVA (Cannabidivarin—Acid) | THC (Delta-9 Tetrahydrocannabinol) | |
| CBC (Cannabichromene) | ||
| THCA (Tetrahydrocannabinol—Acid) | ||
| CBG (Cannabigerol) | ||
| THCV (Tetrahydrocannabivarin) | ||
| CBGA (Cannabigerol—Acid) | ||
| THCVA (Tetrahydrocannabivarin—Acid) | ||
| CBGV (Cannabigerovarin) | ||
Initial academic research in the field of cannabinoid science focused almost exclusively on THC. It has been widely published in scientific literature that THC has pain suppression, anti-spasmodic, anti-tremor, anti-inflammatory, appetite stimulant and anti-nausea properties. Our research and development, however, has focused primarily on exploring cannabinoids other than THC and identifying potential therapeutic applications of these other cannabinoids. We have focused particularly on CBD, which has shown in pre-clinical testing conducted by us and supported by publications in scientific literature to have anti-inflammatory, anti-convulsant, anti-psychotic, anti-oxidant, neuroprotective and immunomodulatory effects. In addition, we believe CBD is not intoxicating as evidenced by its distinct pharmacology from THC as well as evidence from clinical trials. In particular, the intoxicating effects of THC result from its activity as a partial agonist at the CB1 receptor; CBD does not have this same pharmacologic activity. There is a significant body of scientific literature on the properties of CBD, which consistently describes CBD as a cannabinoid without psychotropic effects. Furthermore, according to publications in scientific literature, in particular pre-clinical research published by Zuardi, et al. in the Journal of Psychopharmacology 1982 and clinical research published by Karniol, et al. in the European Journal of Pharmacology 1974, research suggests that the presence of CBD may mitigate some of the side-effects of THC. We have also identified important pharmacological effects of other cannabinoids, such as the anti-convulsant effects of CBDV, anti-diabetic effects of THCV, anti-nausea effects of CBDA and anti-cancer effects of CBG.
There are at least two types of cannabinoid receptors, CB1 and CB2, in the human endocannabinoid system. CB1 receptors are considered to be among the most widely expressed G protein-coupled receptors in the brain and are particularly abundant in areas of the brain concerned with movement and postural control, pain and sensory perception, memory, cognition, emotion, and autonomic and endocrine function. CB1 receptors are also found in peripheral tissues including peripheral nerves and non-neuronal tissues such as muscle, liver tissues and fat. CB2 receptors are expressed primarily in tissues in the immune system and are believed to mediate the immunological effects of cannabinoids. In addition, research suggests the endocannabinoid system interacts with other important neurotransmitter and neuromodulatory systems in the human body, including TRP channels, adenosine uptake and serotonin receptors. We believe that the far-reaching and diverse pharmacology of the numerous cannabinoids provides significant potential for development of cannabinoid therapeutics across many indications and disease areas.
Our Product Development Approach
Our approach to early product development of novel cannabinoids consists of the following stages:
Cannabinoid Chemotype Development. Our research activities commence with the generation of novel and proprietary cannabinoid plant types that produce selected cannabinoids. Our plant geneticists breed unique and protected “chemotypes,” or plants characterized by their chemical content, such that we can precisely control the cannabinoid composition of a plant. We employ traditional methods of plant breeding, with no use of genetic modification. We select chemotypes on the basis of their cannabinoid profile, appropriate levels of concentration and botanical characteristics that enable commercial viability. We seek protection for chemotypes in the form of plant variety rights, which protect the plants and the material obtained therefrom in Europe.
| 47 |
Extract Preparation. After we generate the unique and protected chemotypes, we develop and characterize preparations from an extract of the chemotype. In addition to preparing whole plant extracts, we also modify the extract preparations by adding or removing certain components or purifying preparations to produce a purified cannabinoid. Each of these steps may give rise to patentable opportunities.
Pharmacologic Evaluation. We then conductin vitroandin vivo pharmacologic evaluation studies in validated disease models, testing the potential activity, safety and routes of drug metabolism of each cannabinoid preparation as well as combinations of preparations. These studies seek to identify the pharmacology of cannabinoid preparations and allow us to determine the potential therapeutic area in which they might have promise. We then conduct additional pharmacology, toxicology and pre-clinical development on promising preparations.
We conduct most of our pharmacologic evaluations in collaboration with cannabinoid scientists at academic institutions around the world. We enter into research collaboration agreements and other arrangements that enable us to benefit from the expertise of external scientists while retaining intellectual property rights that emerge from the study of our research materials.
Product Composition and Formulation Development. In parallel with the later stages of pharmacological evaluation, we identify optimum extraction and processing methods for the most promising preparations and then develop clinical formulations from the plant extract and analytical methodologies to further study the formulations. We are able to develop formulations of potential product candidates that focus on one or more cannabinoids as key active constituents as well as formulations that focus on a single cannabinoid. Each of these steps may give rise to patentable opportunities.
OurWith respect to complex extracts, our formulation approach is exemplified by Sativex, the first approved cannabinoid therapeutic based on whole plant extracts from the cannabis plant. The main active ingredients of Sativex, THC and CBD, are extracted from two protected chemotypes. In addition to THC and CBD, Sativex contains additional cannabinoid and non-cannabinoid plant components. In order to achieve a fully standardized formulation of these complex extracts, we employ a range of advanced analytical technologies to demonstrate batch-to-batch uniformity. We standardize the formulation across the extracts as a whole, not simply by reference to their key active components.
With respect to pure cannabinoid formulations, our approach is exemplified by Epidiolex. The active ingredient, CBD, is extracted from proprietary CBD containing chemotypes and then undergoes various processing steps to generate the isolated pure compound.
Clinical development. Selected cannabinoid product candidates progress into clinical development. We have an in-house clinical operations team that has the proven capability to execute Phase 1, 2 and 3 trials rapidly and cost-effectively. Since our inception, we have undertaken an extensive program of clinical trials in over 3,0004,000 patients, including over 2040 Phase 2 and Phase 3 trials.trials and have undertaken post-market safety studies involving over 1,000 patients.
Cannabinoid Product Production Process
There are three principal steps in the manufacturing process for Sativex and our cannabinoid product candidates—production of botanical raw material, or BRM, botanical drug substance, or BDS, and botanical drug product, or BDP, in each instance as defined by FDA Guidance for Industry—Botanical Drug Products. We hold inventories of BRM and BDS, both of which have extended shelf lives that enable us to manufacture BDP on demand. We have in-house facilities that can perform all steps in the production process.
BRM Production. Once a cannabinoid plant typeEach of our product candidates is derived from one or more selected to form the basis of a pharmaceutical product candidate,chemotypes. For products such as Sativex that comprise complex extracts, we reproduce the chemotype solely through propagation of plant cuttings, or clones, in order to ensure that all subsequent plant material is genetically uniform. For Sativex, ourThe plants are then grown under highly controlled conditions in indoor glasshouses, in which all key features of the growing climate and growing process are standardized. The cultivation process lasts 11 weeks from plant cutting to harvest. Plant material is grown throughout the year and batches are harvested each week. Following harvest, plant material is dried and milled under standardized conditions. AllFor pure cannabinoid product candidates, such as Epidiolex, selected chemotypes can be grown in a range of conditions to produce plant material that meets the plant-based raw materialsnecessary specifications for further processing. The BRM for Sativex and our other pipeline product candidates are sourced from either our own in-house growing operations or from our growing sub-contractors.
| 48 |
BDS Production. BRM from each chemotype is processed and controlled separately to yield a well-characterized and standardized extract as our BDS for a particular product or product candidate. Conversion from BRM to BDS involves several processing steps as well as employment of extraction technologies. A proprietary liquid carbon dioxide extraction method is employed for Sativex production. For Epidiolex, the BDS undergoes subsequent processing steps to yield pure CBD.
BDP Production. BDP is the finished product manufactured from one or more BDS’sBDSs at our in-house manufacturing facility. We manufacture Sativex and our other product candidates through a controlled series of processes resulting in a reproducible finished product manufactured to GMP standards. We are able to manufacture spray products (such as Sativex), liquids (such as Epidiolex) and capsules.
Advantages of Our Approach
We believe that our focus on the development of therapeutics from plant-derived cannabinoids offers the following important advantages:
Scientific Collaborators
| 49 |
Our research network extends to 29 academic institutions in eight countries. We work closely with the most eminent cannabinoid pharmacologists in the world, including Professor Roger Pertwee, Aberdeen University and Professor Vincenzo di Marzo, the Institute of Biomolecular Chemistry of the National Research Council (ICB-CNR). In target disease areas, we identify lead scientists and institutions with relevant expertise and enter into collaborations to advance our research efforts. In cancer, we collaborate with the research team at Complutense University, Madrid and with Professor Karol Sikora, Dean of Buckingham University and former Global Clinical Expert in Oncology at AstraZeneca. We conduct metabolic and inflammation research in collaboration with Professor Mike Cawthorne, University of Buckingham, Professor Jimmy Bell, Imperial College, London, and Professor Angelo Izzo, University of Naples. We conduct epilepsy research with Dr. Ben Whalley, University of Reading. All research with our collaborators is conducted under collaboration agreements, and any expert advice provided outside of research activity is governed by consulting agreements. The expertise of these collaborators relates principally to the pharmacology of cannabinoids and the early pre-clinical phases of product development.
All results and the accumulated knowledge gained from this work is written up and reported to us on a quarterly basis and is usually shared among the network of collaborators such that no specific individuals have retained knowledge that is critical to any of our development programs. In addition, having completed the early phases of product development for our main product candidates, future developments will largely be focused on human clinical trials which are entirely managed by our in-house clinical management teams. As a result, we do not consider any single collaboration in isolation to be material to our business.
Sativex
Our most advanced product, Sativex, is an oromucosal spray of a formulated extract of the cannabis sativa plant that contains the principal cannabinoids THC and CBD as well as specific minor cannabinoids and other non-cannabinoid components. Because cannabinoids are virtually insoluble in water, we use organic solvents, ethanol and propylene glycol, to formulate the extract. The product has been granted the U.S. Adopted Name, or USAN, of nabiximols.
We developed Sativex to be administered as an oral spray, whereby the active ingredients are absorbed in the lining of the mouth, either under the tongue or inside the cheek. This route of administration is intended to achieve a reliable rate of absorption and high level of bioavailability of THC and CBD. The spray cannot be inhaled due to the particle size. The spray provides patients with the flexibility to self-manage their dosage in order to achieve and maintain an optimal therapeutic response. In the United States, the FDA will require the spray to be incorporated within additional packaging which features a dose counter in order to reduce the potential for diversion. We are developing a dose counter with funding from Otsuka in parallel with our Phase 3 cancer pain program.
Sativex Pharmacokinetics
Although Sativex contains THC, both the composition of its formulation and its route of administration means that the resulting THC blood levels achieved are quite distinct from those associated with smoked cannabis. We have compared the pharmacokinetics of Sativex to data reported in a separate study published by Marilyn Huestis, et al., in the September 1992 issue of Journal of Analytical Toxicology involving smoked cannabis. This comparison illustrates differences in the speed of absorption and maximum concentration, or Cmax, of THC in the blood. Rapid concentration of high levels of THC in the blood, as achieved by smoked cannabis, is known to be associated with intoxication.
Comparison of the Plasma Concentration Time Curves for Smoked Cannabisand Sativex Oromucosal Spray

Sativex for Cancer Pain
We are evaluating Sativex in a Phase 3 program to treat persistent pain in people with advanced cancer who experience inadequate pain relief from optimized chronic opioid therapy. This program represents the lead target indication for Sativex in the United States and is also intended to form the basis for future regulatory applications in the rest of the world. This Phase 3 program follows positive data from two Phase 2 trials of Sativex in this indication involving over 530 patients. We believe that Sativex has the potential to address a significant unmet need in this large market by treating patients with a product that employs a differentiated non-opioid mechanism of action, and offering the prospect of pain relief without increasing opioid-related adverse side effects.
Cancer Pain Opportunity. Chronic, unremitting persistent pain in deep tissues that results from cancer adversely affects a significant patient population.
The primary treatment for cancer pain is analgesic narcotics, also known as opioids. Morphine and oxycodone are the most prescribed opioids, and morphine is the standard regimen for treating cancer pain in palliative care and hospice care programs and facilities. Opioids are often added to non-opioid analgesics and other adjuvant medications to control cancer pain. These agents act on the CNS by binding to various opiate receptors. The use of opioids is frequently met with undesirable side effects such as constipation, sedation, respiratory depression and analgesic tolerance as well as the risk of addiction. Studies in animal models of pain suggest that there may be pharmacodynamic synergy between cannabinoids and opioids.
According to Data Monitor Stakeholder Insight: Cancer Pain, Dec 2009, there were 4.75 million cancer patients in the United States in 2009. Approximately 70% of those patients, or 3.3 million individuals, experience pain. According to market research conducted on behalf of Otsuka as part of our collaboration, approximately 72%, or 2.4 million of these patients, have advanced cancer, of which 89%, or approximately 2.1 million patients, are treated with opioid medications. According to Fallon, et al. in the March/April 2006 edition of Clinical Medicine, pain is uncontrolled with opioid treatments in approximately 20% of patients with advanced cancer, or 420,000 people in the United States.
There are currently no approved non-opioid treatments for patients who do not respond to, or experience negative side effects with, opioid medications.
Pharmacology. We believe there is a strong pharmacologic rationale for the use of Sativex in cancer pain. Cannabinoid receptors have been found in all of the principal pain transmission pathways, including the dorsal horn of the spinal cord, the descending tracts from the peri-aqueductal grey and rostral-ventral medulla and within the cortical structures, the medial thalamus, amygdala and limbic cortex. In animal models, not only does local administration of endogenous cannabinoids produce pain relief, but THC and CBD also produce pain relief in animal models of both nociceptive and neuropathic pain.
In this context, the CB1 receptor, of which THC is a partial agonist, has been identified as being most implicated in cannabinoid-induced pain relief. CBD is a potent inhibitor of adenosine uptake, and it is also known to be an agonist at the TRPV-1 (vanilloid) receptor. Both of these activities may produce pain relief. Furthermore, CBD has anti-inflammatory activity in standard animal models of inflammation and is a potent inhibitor of neutrophil chemotaxis. Finally, CBD also has an anxiolytic effect, is anti-psychotic and is believed to mitigate some of the undesirable side effects of THC.
Cancer Pain Clinical Program
Phase 2 Clinical Data. We have completed two Phase 2 multinational, randomized, placebo-controlled trials for Sativex in patients with advanced cancer who experienced inadequate pain relief from the use of optimized chronic opioid therapy. In each of the two trials, patients received Sativex or placebo as add-on treatment to strong opioid therapy while remaining on stable doses of their background optimized opioid therapy.
In both Phase 2 trials, pain was assessed daily by the patient using a 0 to 10 Numeric Rating Scale, or NRS. The change in pain severity was measured by comparing pain scores at the end of the trial with baseline scores at the beginning of the trial. There are two primary approaches to analyzing these changes in pain, either by assessing the mean numeric change in NRS or by responder analyses which assess percentage improvements.
Historically, application of responder analyses required choosing a specific cut-off point on the NRS, or alternatively a percentage threshold, deemed to be clinically meaningful. More recently, an alternative approach to responder analyses, known as the Cumulative Proportion of Responders Analysis, or CPR Analysis, has been proposed as an improvement to previous approaches. This analysis was first published by John Farrar, et al. in the November 2001 issue of Pain and was proposed to overcome concerns with previous approaches which had required a pre-determined choice of the level of response which would be considered clinically meaningful. The CPR Analysis is one of the key efficacy parameters discussed in the FDA-approved package insert of the analgesic medications pregabalin and duloxetine and analyzes the full range of responses achieved across the entire patient population within a trial. We believe the CPR Analysis offers several advantages over using a single cut-off response rate, including:
The specific method used is to analyze the cumulative proportion of patients who reach each level of response rate, calculated and displayed up to the response rate cut-off point. The CPR Analysis graph displays patient data in order of the calculated level of response for both active treatment and placebo. For each level of response, it shows the proportion of the total number of patients that equaled or exceeded that level of response.
Results of our Phase 2 trials have been analyzed using three methodologies—mean change in NRS scores, analysis of patients with a response of 30% or more, and the CPR Analysis. Following our end of Phase 2 discussions with FDA, we chose to employ the CPR Analysis as the primary efficacy analysis in the first two of our Phase 3 trials.
Phase 2a Data
Results from a Phase 2a trial in 177 patients were published by Jeremy Johnson, et al. in the February 2010 issue of Journal of Pain and Symptom Management, the official journal of the American Academy of Hospice and Palliative Medicine, the National Hospice and Palliative Care Organization and the U.S. Cancer Pain Relief Committee. This three-arm trial compared the efficacy and safety of Sativex to a THC-only extract spray formulation and placebo as add-on treatments to strong opioid therapy administered over a two-week period. A co-primary efficacy endpoint of the trial was the change in mean pain score (on the 0 to 10 NRS) from baseline to end of treatment. The results showed a statistically significant improvement of 0.67 points in the Sativex group compared with the placebo group (p=0.014). Changes in pain scores using responder analyses not specified in the trial protocol showed the following:
Sativex in Cancer Pain—Phase 2a CPR Analysis

During the trial, patients were permitted to administer between 0-48 sprays per day. The median dose in the Sativex treatment group was 8.15 sprays per day.
While Sativex showed a statistically significant improvement over placebo in the trial, it is noteworthy that the THC-only extract spray showed a smaller improvement of 0.32 points over placebo, which was not statistically significant, providing evidence that the combination of THC and CBD, the main ingredients in Sativex, is an improved cannabinoid formulation for this patient population as compared to THC alone.
Phase 2b Data
Results from a Phase 2b dose ranging trial were published by Russell Portenoy, et al. in the May 2012 issue of The Journal of Pain, the official journal of the American Pain Society. This randomized, double-blind, placebo-controlled, parallel-group trial recruited a total of 360 patients in 14 countries in North America, Europe, Latin America and South Africa, and evaluated three dose range groups of Sativex—a low-dose (one to four sprays per day), mid-dose (six to ten sprays per day), and high-dose (11 to 16 sprays per day)—and placebo, over a five-week treatment period. The primary objectives of this trial were to determine the effective dose range and to demonstrate a non-effective dose of Sativex in patients with advanced cancer who experience inadequate pain relief during optimized chronic opioid therapy.
The trial provided data to support entry into a Phase 3 program, showing statistically significant differences in favor of Sativex over placebo in two key analyses of pain scores. The trial also provided information sufficient to select a dose range of Sativex in the patient population and confirmed key features of the trial design of our Phase 3 trials.
The primary efficacy measure of the trial was a patient assessment of pain using a 0 to 10 NRS. This endpoint was analyzed using a primary and two secondary statistical methodologies, including 30% responder analysis (where a response was defined as a 30% or greater reduction in the NRS score during the last three days of treatment versus the three-day baseline period at the beginning of the trial), CPR Analysis and change from baseline analysis in NRS average pain. The 30% responder analysis was specified as the primary analysis in the protocol. Results of these analyses for the low and mid-dose groups are provided below:
Sativex in Cancer Pain—Phase 2bCPR Analysis for Low-Dose Group

Sativex in Cancer Pain—Phase 2bCPR Analysis for Mid-Dose Group

Sativex in Cancer Pain—Phase 2bCPR Analysis for Combined Low and Mid-Dose Groups

The Sativex high-dose level did not show superior efficacy to placebo. While tolerability does not completely account for this lack of efficacy, it is noteworthy that discontinuation due to adverse events was 28% in the high- dose group and was substantially higher than the rates of discontinuation in the placebo group (18% discontinuation), the low-dose group (14% discontinuation) and in the mid-dose group (17% discontinuation). In addition, 34% of patients in the high-dose group took their medication below their target dose at the end of the treatment period.
The trial included several secondary endpoints, including sleep disruption, which is identified in the Phase 3 trials as the key secondary endpoint. In the Phase 2b trial, the Sativex low-dose group showed a statistically significant difference compared to placebo in reducing sleep disruption (treatment difference 0.88 points, p=0.003). While the mid-dose group showed no improvement over placebo, the low-and mid-dose Sativex groups, when combined, did show a statistically significant reduction in sleep disruption compared to placebo (treatment difference 0.61 points, p=0.016).
Phase 2 Safety Profile
The safety profile of Sativex in the two Phase 2 trials was consistent. In the Phase 2a trial, the most common treatment-related adverse events (occurring at a rate greater than or equal to 10% for the Sativex population) reported for the Sativex treatment group were somnolence (13% vs. 10% for placebo), dizziness (12% vs. 5% for placebo) and nausea (10% vs. 7% for placebo). In the Phase 2b trial, the most common treatment-related adverse events (occurring at a rate greater than 10% for the combined Sativex population) reported for the Sativex treatment groups were dizziness (17% vs. 10% for placebo), nausea (11% vs. 8% for placebo) and somnolence (12% vs. 4% for placebo). An analysis of treatment-related severe adverse events showed that such events occurred at a similarly low rate in the mid-dose and low- dose Sativex groups as in the placebo group (3% and 3% vs. 1%). More patients in the high-dose Sativex group experienced treatment-related severe adverse events, with 17% of subjects doing so. The most severe treatment related events observed in the Sativex arm (occurring in more than two patients for the combined Sativex population) were disturbance in attention, dizziness, sedation, anorexia, vomiting, nausea and vertigo.
Phase 2 Key Findings
The Phase 2 trials provided us data sufficient to support entry into Phase 3 trials of Sativex in cancer pain, to determine the optimum dose range to be used in Phase 3 trials, and determine the choice of primary efficacy analysis to be used in the first two Phase 3 trials.
Dose Range
We believe that the Phase 2b trial achieved one of its key objectives in determining the effective dose range for Sativex and demonstrating a non-effective dose range. Efficacy was observed in both the low (one to four sprays per day) and mid-dose (six to ten sprays per day) groups and these groups were also associated with a lower or similar rate of adverse events to placebo, and a low rate of withdrawal from the trial due to adverse events. In contrast, the data suggests that a high-dose range of Sativex reaches a maximum tolerated dose without improved efficacy over placebo. These results are consistent with those seen in the Phase 2a trial where the median daily dose taken by the Sativex treatment group was 8.15 sprays per day.
We have therefore concluded that an appropriate approach to dosing in the Phase 3 trials is to employ a single dose range of three to ten sprays per day.
Primary Efficacy Analysis
The table below summarizes Phase 2 results for three statistical analyses of changes in pain scores:
|
| ||
Following our End of Phase 2 discussions with the FDA, we decided to employ the CPR Analysis as the primary efficacy analysis in the first two of our Phase 3 trials. In the third Phase 3 trial, which employs a different “enriched’ trial design, the primary efficacy analysis is the mean change from baseline in NRS scores. These analyses have provided statistically significant results in favor of Sativex in both Phase 2 trials.
Phase 3 Program. As a result of the positive data seen in our Phase 2 program, we and Otsuka held discussions with the FDA regarding the proposed Phase 3 program for the continued development of Sativex for cancer pain. We are now conducting three multi-national, randomized, placebo- controlled, multi-center Phase 3 trials, two of which will employ an identical trial design and endpoints and are expected to support the NDA submission. These two Phase 3 trials include the following key features:
The ongoing Phase 3 program is being performed with and funded by Otsuka.
Patients are being recruited into these two trials at hospital sites in the United States, Europe and Mexico. Professor Marie Fallon, Professor of Palliative Care, University of Edinburgh, is the principal investigator of the first trial, and Dr. Russell K. Portenoy, Chairman of the Department of Pain Medicine and Palliative Care, Beth Israel Medical Center in New York City, is the principal investigator of the second trial. We anticipate that top-line results from at least one of these Phase 3 trials will be available towards the end of 2014, with top-line results from the second Phase 3 trial following shortly thereafter. This program is intended to support the submission of an NDA with the FDA and in other markets around the world.
We are also in the process of conducting a third Phase 3 trial, which we expect to enroll approximately 540 patients, that is designed to provide additional information on the effects of Sativex in treating opioid resistant cancer pain. The results of this third trial are not intended to be included in the initial regulatory filings if the results of the first two pivotal Phase 3 trials provide a sufficient basis to demonstrate the safety and efficacy of Sativex in the target indication. The third Phase 3 trial differs in design from the first two trials, employing a two-part “enriched trial design” akin to that which was successfully employed in the MS spasticity trials program. The trial involves exposing all enrolled patients to Sativex in a two-week single-blind phase, or Phase A, following which responders will be randomized either to stay on Sativex or switch to placebo in a double- blind phase for a five-week treatment period, or Phase B. The primary efficacy analysis will be the mean change from baseline in Phase B as measured using a 0 to 10 NRS. The trial is designed to enroll 216 patients in Phase B. The protocol provides for a pre-planned interim analysis when half the number of planned patients complete the study.
Long-term Safety and Efficacy. Results from a long-term, open-label, follow-up trial in 43 cancer pain patients who had previously participated in the Phase 2a trial were published by Jeremy Johnson, et al. in the November 2012 issue of Journal of Pain and Symptom Management. These results showed that the long-term use of Sativex was generally well tolerated, with no evidence of a loss of effect for the relief of pain with long-term use. Furthermore, patients who kept using Sativex did not seek to increase their dose of Sativex or other pain-relieving medication over time.
Abuse Liability. A study published in the June 2011 issue of Human Psychopharmacology by Kerri Schoedel, et al. compared the abuse liability of Sativex at three dose levels (four sprays taken consecutively, eight sprays taken consecutively and 16 sprays taken consecutively) with placebo and two doses of dronabinol (synthetic THC) capsules (20mg and 40mg) in a randomized, double-blind, crossover study in 23 healthy subjects with a history of non- dependent but regular recreational cannabis use. The subjective effects of 20 and 40mg dronabinol were consistently and significantly greater than placebo, demonstrating that it has measurable abuse potential. The effects of Sativex were consistently lower than dronabinol. Four sprays of Sativex taken consecutively (containing 10.8mg of THC) was not significantly different from placebo with regard to changes in primary variables, suggesting low abuse potential at this dosage. Eight sprays of Sativex taken consecutively had a mixed profile of effects suggesting modest abuse potential, while 16 sprays of Sativex taken consecutively was significantly different from placebo in most outcome measures suggesting significant abuse potential. In contrast to this abuse liability study in which Sativex doses were administered together, patients in the Phase 3 trials administer between three and ten sprays over a 24-hour period.
If Sativex receives FDA approval, it will be a controlled substance, as is the case with opioids, and the U.S. Drug Enforcement Administration, or DEA, will place it in a schedule under the Controlled Substances Act of 1970, or CSA, in order for it to be able to be prescribed to patients in the United States. The schedule into which a product is placed reflects the DEA’s determination of its potential for abuse or dependence. We expect Sativex to be listed by the DEA as a Schedule II or III controlled substance. As part of the NDA, we will submit information on abuse liability which will be reviewed by the Controlled Substances Staff at the FDA in consultation with the National Institute on Drug Abuse. Ultimately, the Assistant Secretary for Health will transmit the findings and scheduling recommendation to the DEA.
In February 2013, the Advisory Council on the Misuse of Drugs, which is the advisory body to the U.K. government with respect to controlled substances, confirmed its recommendation to the U.K. government that it deems Sativex to have low abuse potential and low risk of diversion, and that Sativex thereafter should be scheduled as a Schedule IV substance. Legislation placing Sativex into Schedule IV came into effect in April 2013.
Potential Expansion of Cancer Pain Market. Following successful completion of the development of Sativex in the treatment of pain in patients with advanced cancer, we may consider, together with Otsuka, expanding the target market of Sativex by conducting Phase 3 trials in the treatment of pain in patients with earlier stage cancer. A future submission of a supplemental NDA in this expanded indication would represent a significant additional market opportunity for Sativex in the United States and the rest of the world. Under the terms of our Otsuka collaboration, such additional development costs would be fully funded by Otsuka.
Sativex for MS Spasticity
The approved label for Sativex is as a “treatment for symptom improvement in patients with moderate to severe MS spasticity who have not responded adequately to other anti-spasticity medication and who demonstrate clinically significant improvement in spasticity related symptoms during an initial trial of therapy.”
We recently initiated the commercialization of Sativex for MS spasticity in 15 countries outside the United States. We have also received regulatory approval in an additional 12 countries, and we anticipate commercial launches in the several of these countries in the next 12 months. Two additional countries have recommended approval for Sativex and regulatory filings are ongoing in 9 other countries, principally in the Middle East where we expect approvals over the next 12 months.
Regulatory Status of Sativex for MS Spasticity
|
|
| ||
| ||||
|
| |||
|
| |||
| ||||
| ||||
|
|
We believe that MS spasticity represents a significant market opportunity for the United States and we intend to commence a required Phase 3 clinical trial of Sativex for MS spasticity in 2015 intended to lead to submission of an NDA to the FDA for this indication. Although Sativex has been approved for the treatment of MS spasticity in 27 countries outside the United States, we believe that from a commercial and regulatory perspective, Sativex for cancer pain represents the optimal entry point into the United States market. This is because we believe the size of the commercial opportunity for the cancer pain indication in the United States is larger than the MS spasticity opportunity. Moreover, because patients with MS spasticity would typically use Sativex for an extended treatment duration, we expect that additional pre-clinical carcinogenicity data will be required as part of the submission of an NDA in this indication. While the carcinogenicity studies are now underway, the timing of the availability of such data is expected to follow the expected timing of the submission of an NDA in the cancer pain indication potentially allowing us to obtain U.S. approvals for this indication before we would be able to obtain U.S. approvals in MS spasticity. The initial development of Sativex focused on the European MS spasticity market, hence pre-clinical carcinogenicity data was originally generated prior to our first interactions with the FDA.
We held our first meeting with the FDA in December 2012 to discuss the MS spasticity indication. This pre-IND meeting led to the submission and acceptance of an IND in mid-2013 with an investigational plan that includes a Phase 3 trial protocol. The FDA provided initial feedback on design features necessary for the study to serve as a pivotal study in our development program. Consistent with the FDA’s recommendations, we have requested a Special Protocol Assessment, or SPA, for the proposed Phase 3 trial. Under the SPA process, a sponsor may reach an agreement with the FDA as to the required design and size of clinical trials intended to form the primary basis of an efficacy claim. Subject to agreement with the FDA on the protocol, we aim to commence this clinical trial in 2015.
MS Spasticity Opportunity. MS is the most common disabling neurological condition affecting young adults. According to the World Health Organization, MS affects more than 1.3 million people worldwide, of which over 400,000 are in the United States and over 600,000 are in Europe. MS affects twice as many women as men and typically develops between the ages of 20 and 40 years. The hallmark pathology of MS is patchy demyelination, leading to nerve damage, which in most cases causes symptoms that adversely affect quality of life. Spasticity is one of the most common, chronic and disabling of these symptoms, affecting up to 80% of MS patients over their lifetimes. Spasticity refers to an abnormal, involuntary tightness of muscles, which increases when the muscles are rapidly stretched, so that the associated joint appears to resist movement. Some of the features of spasticity include muscle stiffness, difficulty straightening joints, reduced mobility, limb weakness, shaking, intermittent spasms and pain. As a result of the increased muscle tone due to spasticity, “simple” everyday movements become difficult or impossible altogether. In addition, painful muscle spasms can lead to difficulty with sleeping, sitting in a chair or lying in bed. Occasionally, spasms may be triggered by fairly minor irritations such as tight clothing, a full bladder or bowel, urinary tract infection or skin irritation, such as from a pressure sore. Moderate to severe spasticity can lead to significant impairment.
There is no cure for spasticity, and it is widely recognized that currently available oral treatments afford only partial relief and have unpleasant side effects. Sativex offers the prospect of treating patients who have failed existing oral therapies and who might otherwise require invasive and costly alternative treatment options such as intrathecal baclofen or surgery.
Pharmacology. Sativex has been investigated for anti-spasticity effects in chronic relapsing experimental allergic encephalomyelitis, or CREAE, the accepted animal model of MS spasticity. In this model, Sativex rapidly reduces spasticity in a dose-dependent way, achieving the same overall reduction in spasticity as baclofen, the standard first line treatment for MS spasticity, without causing as much disability in the animals.
Each of the two principal cannabinoids within Sativex, THC and CBD, possess pharmacological properties that provide a rationale to support the efficacy of Sativex in MS spasticity. In animal models of MS, the CB1 receptor plays a key role in the modulation of spasticity and spasms. While CBD has little activity at cannabinoid receptors, it does have neuroprotective properties, which are most likely mediated by its ability to modulate intra-cellular calcium. The key pharmacology of CBD in MS likely relates to its role as an agonist at TRP channels, critical for maintaining calcium homeostasis and as an inhibitor of adenosine uptake, providing a non-cannabinoid receptor mechanism for its anti-inflammatory properties. In addition, CBD has an anxiolytic effect, is anti-psychotic and is believed to mitigate some of the undesirable side effects of THC.
MS Spasticity Clinical Program. In clinical trials, Sativex has been shown to provide effective relief of spasticity symptoms, including reduced spasms, improved sleep and improved function, in patients for whom existing anti-spasticity treatments have failed. During the course of the development program for Sativex in MS spasticity, we have conducted Phase 2 and Phase 3 double-blind, randomized, placebo-controlled trials involving 1,294 patients. These trials have all been published in peer-reviewed journals. In each trial, patients were permitted to remain on stable doses of their background oral anti-spasticity medication and spasticity was measured using a 0 to 10 NRS. This scale has been validated for use in spasticity clinical trials.
The largest and most recent of the Phase 3 trials, published by A. Novotna, et al. in the April 2011 issue of European Journal of Neurology, was a two-part trial and employed an enriched trial design. During the first four-week period, all patients received Sativex single-blind. This was followed by a 12-week, double-blind period in which patients who had achieved a pre-determined level of response at the end of the prior four-week period were randomized to Sativex or placebo in a conventional parallel group design. We designed this trial to demonstrate the size of clinical benefit achieved from Sativex in patients who had previously shown a capacity to respond to treatment.
The primary efficacy endpoint of the trial was the difference between Sativex and placebo in the mean change in spasticity as measured by the patient using a 0 to 10 NRS in the 12-week period from randomization to the end of treatment. There were a number of functional secondary measures that are important in contributing to an assessment of the clinical relevance of a change in the primary outcome measure. In particular, the objective view of the physician was considered important by regulatory authorities and was therefore included as a secondary endpoint.
After the four-week, single-blind period in 572 patients, Sativex reduced the mean score for spasticity on the NRS scale by 3.01 points from a baseline of 6.91 points, or 44%. In addition, 48% of patients’ NRS score improved by 20% or more during this initial period, the pre-defined level of response required to be included in the randomized phase.
As a result, 241 patients proceeded into the 12-week, randomized, placebo-controlled trial phase. The primary endpoint, the mean difference between treatment groups at the end of the randomized treatment period was statistically significant in favor of Sativex (p=0.0002). Furthermore, 74% of Sativex responders experienced a reduction of 30% or more in their spasticity score from their original pre-treatment baseline, which represents a meaningful clinical improvement in this patient population.
The secondary efficacy measures were in line with the primary outcome of the trial. In particular, the functional measures added to the existing evidence that patients achieve a benefit that is apparent to both their caregiver and their physician. The following secondary efficacy measures showed statistically significant improvements of Sativex over placebo: spasm score (p=0.0046), sleep disturbance (p<0.0001), Subject Global Impression of Change (p=0.023), Physician Global Impression of Change (p=0.005), Carer Global Impression of Function (p=0.005) and Barthel Activities of Daily Living (p=0.007). Of the other secondary efficacy measures, the timed ten-meter walk and Modified Ashworth Scale approached statistical significance (p=0.069 and p=0.094, respectively).
The safety profile of Sativex across placebo-controlled trials conducted in MS patients shows that the drug is generally well tolerated, with the most commonly occurring individual adverse events (occurring at a rate greater than 10%) being dizziness (25% vs. 8% for placebo), fatigue (13% vs. 8% for placebo) and nausea (10% vs. 6% for placebo). Adverse events were typically mild or moderate in severity and the pattern of common adverse events is similar in both short-term and long-term exposure to Sativex. The most common adverse events tend not to be recurrent, occurring in the first four weeks of treatment and much less commonly thereafter.
We have opened an IND with the FDA and plan to conduct a US-targeted pivotal Phase 3 clinical trial to evaluate Sativex for the treatment of MS spasticity. We have submitted to the FDA a request for Special Protocol Assessment, or SPA, of the Phase 3 study protocol, for which we have not yet reached agreement. We expect to respond to the FDA’s feedback on the protocol through an additional SPA submission with a view to commencing the trial in 2015. If the except to respond trial is conducted and is successful, we intend to submit the results, along with the foreign clinical data collected in our clinical development program for MS spasticity to date, in an NDA for MS spasticity. We expect the trial design will be consistent in some respects with the most recent Phase 3 trial conducted in Europe and published by A. Novotna, et al., in 2011. The U.S. Phase 3 trial is expected to employ an enriched study design, but is expected to employ two co-primary endpoints: spasticity as measured on the Modified Ashworth Scale, and the Physician Global Impression of Change to provide evidence that the observed treatment difference is clinically meaningful. We believe FDA will also require that we establish a dose-response using a multiple fixed dose design.
Long-Term Efficacy. We have demonstrated the long-term efficacy of Sativex in a placebo-controlled trial published by William Notcutt, et al. in the February 2011 issue of Multiple Sclerosis. This randomized withdrawal trial recruited 36 patients with MS that had been receiving Sativex on prescription for a mean duration of 3.6 years. Patients were randomized to continue with Sativex or switched to placebo in a double-blind, four-week treatment period. The primary efficacy endpoint of the trial was the time to treatment failure, with treatment failure being defined as cessation of the randomized treatment before the end of the trial, a worsening of spasticity (defined as an increase in the mean spasticity NRS over the last seven days of the treatment period of at least 20% and at least one unit from the treatment baseline), or a clinically relevant increase in or addition to anti-spasticity drugs or disease modifying medications after randomization.
Kaplan-Meier Plot: Time to Treatment Failure
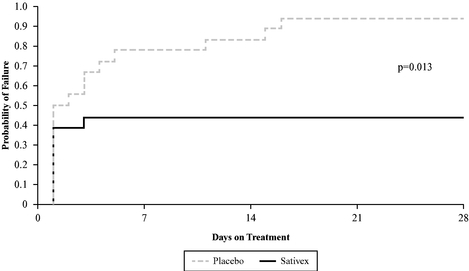
The primary efficacy endpoint was statistically significant in favor of Sativex (p=0.013). Of the key secondary measures, both the Subject Global Impression of Change (p=0.017) and the Carer Global Impression of Functional Ability (p=0.0011) were also statistically significant.
In addition to this controlled trial, there is a significant body of evidence from long-term open-label extension trials to support the evidence of maintenance of efficacy in long-term use of Sativex, many of which have been published in peer-reviewed journals.
The withdrawal rate from open-label, long-term extension trials is low, and withdrawals due to a lack of efficacy are uncommon. For those patients who remained in open-label, long-term extension trials for a year, the symptom score for spasticity remained low, providing supportive evidence that continued use of Sativex is associated with long-term maintenance of efficacy.
The pattern of adverse events seen in long-term use of Sativex is very similar to that seen in the short-term placebo-controlled trials. Since Sativex first became commercially available, there has been an estimated additional 20,000 patient-years of exposure to Sativex outside of clinical trials and no new significant safety issues have been identified.
Post-Approval Evidence of Sativex Clinical Benefits. Since launch, two studies have been completed which support the commercialization efforts of our partners. An independent survey of Sativex prescription use in the United Kingdom has been the subject of a paper published by William Notcutt in the July 2012 issue of the peer-reviewed publication Primary Health Care Research and Development. In this survey of 124 Sativex patients with a mean duration of treatment of 30 months, the majority of respondents and their caregivers reported improvements across a range of daily functional activities, alongside a reduction in the use of concomitant anti-spasticity medication and other health care resources.
A formal prospective trial of prescription use in Germany was presented in October 2012 at the 28th Congress of the European Committee for Treatment and Research in Multiple Sclerosis (ECTRIMS) in Lyon, France. This trial involved 300 patients and showed that the clinical response rate on Sativex is with consistent with, and somewhat better than, that seen in the Phase 3 trials.
Post-Approval Evidence of Sativex Safety Profile. In August 2013, we announced the results from a 12-month multicenter, double-blind, randomized parallel group, placebo-controlled study in 121 patients with MS spasticity. The study was required as a post-approval commitment by the UK regulatory authority, the Medicines and Healthcare products Regulatory Agency, or MHRA, with the primary objective of evaluating whether Sativex may have long-term adverse effects on cognitive function or mood. The primary endpoint was the change in cognitive function as assessed by the total Paced Auditory Serial Addition Test, or PASAT, score from baseline to end of treatment. Mood was assessed by the Beck Depression Inventory-II. There was a slight improvement in the PASAT score from the beginning to the end of the study in both the Sativex and placebo groups, thus confirming that the effects of Sativex on long-term cognitive impairment were the same as the effects of placebo. Similarly, the change in mood over the 12-month period was more or less identical in the Sativex and the placebo group, confirming no untoward effect on mood. Of the efficacy secondary endpoints, each of the global impression of change scores as assessed by the patient, physician and carer was highly significantly in favor of Sativex (p<0.0001, p=0.001 and p=0.004 respectively). Detailed data from this study was presented at the 29th Congress of the European Committee for Treatment and Research in Multiple Sclerosis (ECTRIMS) in October 2013.
Sativex in Neuropathic Pain and Other Indications
Sativex is approved to treat MS neuropathic pain in Israel and Canada (under a Notice of Compliance with conditions, or NOC/c, policy) and also has an NOC/c approval in Canada for cancer pain. The NOC/c policy applies to drugs that show promising Phase 2 evidence of efficacy in a patient population with a high, unmet medical need for which there is currently no approved treatment. NOC/c approvals are granted subject to the completion of subsequent Phase 3 confirmatory trials. Although we are not actively pursuing the following indications, we have generated positive Phase 2 data and believe that there may be potential for the use of Sativex to be expanded into the following areas:
Our Strategic Alliances and CollaborationsCollaboration Agreements
We have entered into six separate collaboration agreements for Sativex with major pharmaceutical companies. Each agreement provides the respective partner with exclusive rights in a defined geographic territory to commercialize Sativex in all indications, while we retain the exclusive right to manufacture and supply Sativex to such partner on commercial supply terms for the duration of the commercial life of the product. These agreements typically carry a 15-15 year initial term, with automatic renewal periods. However, our agreement with Novartis continues on a country-by-country basis for the commercial life of the products. Our partners have the right, under certain circumstances, to terminate their agreements with us, and three of our partners, Almirall, Otsuka and Novartis, have the right to terminate their agreements with us without cause. In November 2016 we entered into a mutual termination agreement with Novartis, pursuant to which rights in Sativex in Australia and New Zealand, Asia (excluding Japan, China and Hong Kong), the Middle East (excluding Israel) and Africa will be returned to GW over an agreed transition period.
Each of our remaining collaboration agreements for Sativex incorporates different supply and royalty terms. With the exception of the Novartis agreement, described below, each of our supply agreements requires us to supply fully labeled Sativex vials at a price that is expressed as a percentage of a partner’s in-market net sales revenue. In some cases, part of this revenue is structured as a combination of product supply price plus a royalty, although both types of revenue are accounted for similarly. Sativex supply revenue is invoiced when product inventory is delivered to or collected by the marketing partner. Royalties will be received in arrears based upon quarterly in- market net sales declarations from partners.
The price charged for Sativex in the market is controlled by our marketing partners. However, our contracts do not anticipate us being obligated to supply Sativex at a loss. In such event, if the in-market supply price would cause us to supply Sativex at a loss we would have the right to renegotiate supply terms to prevent this. For example, following the price reduction in Germany in March 2013, the resultant supply price would have led to us providing Sativex to our partner, Almirall, at a loss. We are now completing discussions oncompleted an amendment to the supply terms with Almirall which providein 2014, and this amendment provides for us to generate a margin on supply of product for countries in which a price reduction would otherwise have led to us supplying product at a loss.
Please see Note 3 to our audited consolidated financial statements included as part of this Annual Report for a breakdown of our revenue by geographic location.
Sativex in the United States
In 2007, we entered into a Sativex U.S. license agreement with Otsuka, the Japanese pharmaceutical company and developer of Abilify® (aripiprazole), one of the world’s highest selling antipsychotic medications.company.
Under the terms of the Sativex U.S. license agreement, we granted Otsuka an exclusive license to develop and market Sativex in the United States. We are responsible for the manufacture and supply of Sativex to Otsuka. Both companies jointly oversee all U.S. clinical development and regulatory activities for the first cancer pain indication. We will be the holder of the IND until the filing of an NDA, which will be in Otsuka’s name. Otsuka will assume development and regulatory responsibility for the second and any subsequent indications. Otsuka will bear the costs of all U.S. development activities for Sativex in the treatment of cancer pain, additional indications and future formulations.
| 50 |
The financial terms of this agreement include total milestone payments and license fees to us of up to $272.0 million, of which approximately $18.0 million relates to license fees, $54.0 million are linked to regulatory milestones, such as initiation of Phase 3 trials, submission of an NDA to the FDA and other regulatory approvals, and $200.0 million are linked to various commercial milestones, as well as revenue from the supply of products and royalties on product sales. Our combined supply price and royalty to Otsuka equates to a percentage in the mid-twenties of Otsuka’s in-market net sales revenue. Otsuka paid us the license fee of $18.0 million upfront and has since paid an additional milestone payment of $4.0 million upon commencing the first Phase 3 clinical trial in cancer pain.
Sativex in Latin America, Asia, the Middle East and Africa
Novartis Pharma AG. In 2011, we entered into an exclusive agreement with Novartis to commercialize Sativex in Australia and New Zealand, Asia (excluding Japan, China and Hong Kong), the Middle East (excluding Israel) and Africa.
Under the terms of this agreement, Novartis hashad exclusive commercialization rights to Sativex in the above-mentioned territories and will act as the marketing authorization holder for Sativex. We will be responsible for the manufacture and supply of Sativex to Novartis.
The financial terms of the agreement included an upfront fee of $5.0 million from Novartis.
In addition,November 2016 we entered into a mutual termination agreement with Novartis, pursuant to which rights in Sativex in these territories. As this agreement has now been terminated we will not receive any further lump sum or other payments from Novartis. However, we are eligible to receive additional payments of up to $28.8 million, of which $12.0 million is linked to achievement of regulatory approvals and $16.8 million is linked to commercial performance targets. We will also receive revenue from the supply of products and royalties on net sales of Sativex. Our supply terms to Novartis are structured differently from those of our other partners. We supply batches of unlabeled Sativex vials and Novartis completes the labeling and packaging process. Our supply price is structured as cost of goods plus a margin plus a further royalty that is expected to grow with volume. Over the long-term, we expect our revenue to average a percentage in the teensprocess of Novartis’identifying and appointing third parties to distribute Sativex in-market net sales revenue.
Australia represents the largest potential marketon GW’s behalf in the territory licensed to Novartis. To date,countries within the Australian reimbursement authorities have not agreed to grant public reimbursement forformer Novartis territories in which Sativex in the MS spasticity indication and therefore the product is not yet launched in that country. We expect the position in Australia to impact Novartis’ commercialization strategy for its licensed territory and this may lead to Novartis waiting for the cancer pain indicationapproved is likely to be approved prior to commencing commercialization ofin the product.near future.
Ipsen Biopharm Ltd.In 2014, we entered into an exclusive agreement with Ipsen. Under the terms of this agreement, Ipsen will promote and distribute Sativex in Latin America (excluding Mexico and the Islands of the Caribbean).
Neopharm Group. Under an agreement signed in 2010, Neopharm, an Israeli pharmaceutical company, holds exclusive commercial rights to Sativex in Israel. The financial terms of this agreement did not include a license fee and we are not entitled to any milestone payments. We will receive revenue from the supply of products to Neopharm, expected to equate to a percentage equal to forty to fifty of Neopharm’s in-market net sales revenue. To date, we have received less than $300,000 under this collaboration agreement.
Under the terms of this agreement, Neopharm acts as market authorization holder in the territory. We are responsible for commercial product supply to Neopharm for which we generate sales revenue.
Sativex in the European Union
Almirall S.A. In 2005, we entered into an exclusive agreement with Almirall, an international pharmaceutical company with headquarters in Spain and 20132015 total revenue of €825.5€769.0 million, to commercialize Sativex in the European Union (excluding the United Kingdom) and E.U. accession countries, as well as Switzerland, Norway and Turkey. In 2012, this agreement was amended to add Mexico to the licensed territory. In countries where Almirall has no direct presence at the time of product launch, we will jointly agree on the appointment of distribution partners. In such countries, we may elect to distribute the product ourselves.
| 51 |
Under the agreement, we are the marketing authorization holder for Sativex in all countries in the territory except where local regulations require a locally registered entity to assume this responsibility. In addition, we are responsible for commercial product supply to Almirall. The financial terms of the agreement included an upfront fee of £12.0 million. In addition, milestone payments are payable to us upon the successful completion of certain development activities, as well as on regulatory approvals and the achievement of specified sales targets. Since its initial execution in 2005, the agreement has been the subject of various amendments, two of which included the provision of new milestone payments. Since 2005, in total, we have received £20.8 million of milestone payments from Almirall. We have the potential to receive a further £19.5£17.0 million in future milestone payments in the event that the relevant milestones are achieved. Of such £19.5£17.0 million in potential future milestone payments, £6.5£4.0 million are linked to regulatory and clinical milestones and £13.0 million are linked to commercial milestones. We also receive revenue from the supply of Sativex, currently equating to a percentage in the low to mid-twenties of Almirall’s in-market net sales revenue, a percentage which following an amendment currently under discussion, is expected to be subject to a floor price equal to cost of goods plus a margin.price. This percentage is expected towould increase to the mid-thirties if Sativex is approved for cancer pain in Europe.
Bayer HealthCare AG. In 2003, we entered into an agreement with Bayer whereby we granted Bayer an exclusive license to market Sativex in the United Kingdom. This agreement was amended later in 2003 to include Canada.
Under the agreement, we are the marketing authorization holder for Sativex in the United Kingdom and Canada. In addition, we are responsible for commercial product supply to Bayer.
The financial terms of the agreement included an upfront fee of £5.0 million. In addition, milestone payments are payable on the successful completion of certain development activities, as well as on regulatory approvals and the achievement of specified sales targets. Since its initial execution in 2003, the agreement has been the subject of various amendments, one of which included the provision of new milestone payments. In total, we have received £14.8£19.8 million in milestone payments from Bayer. We have the potential to receive a further £9.0 million in milestone payments in the event that the relevant milestones are achieved, all of which are related to future regulatory approvals. We also receive revenue from supply of Sativex, equating to a percentage in the mid-thirties to forty of Bayer’s in-market net sales revenue.
Research Collaboration with Otsuka
Under a six-year research collaboration agreement with Otsuka which ended in June 2013, we jointly conducted pre-clinical research on a range of our cannabinoids, both alone and in combination, as potential new drug candidates for the treatment of CNS disorders and oncology. At the end of the agreement, global rights to all product candidates were automatically exclusively licensed back to us from Otsuka.
This collaboration yielded promising data and new intellectual property with particular focus on epilepsy, schizophrenia and various oncology indications, including glioma. These efforts were focused on a few cannabinoid drug candidates, which include CBD, THCV, CBG, CBDV, alone and/or in combination. With global rights now licensed back to us, we are now progressing the development of a number of these product candidates. Otsuka is entitled to a small royalty on sales of product candidates protected by patents filed during the term of the collaboration.
Pipeline Research and Development
There are over 70 cannabinoid compounds, and our research explores their potential therapeutic applications across a broad range of disease areas, including in the treatment of epilepsy, type-2 diabetes, ulcerative colitis, schizophrenia, cancer and neurodegenerative disease.
Pipeline Programs
Our pipeline of orphan drug programs include the following:
Our additional lead pipeline programs comprise distinct product candidates with the following primary cannabinoid components:
In addition to these programs, we are conducting pre-clinical research into the potential application of our cannabinoids in several examples of neuroprotection, nausea and anorexia/cachexia.
Our early clinical development activities are conducted outside of the United States and we generally expect to submit INDs in the United States for our product candidates at a later stage in their development. For orphan product candidates, we generally expect to submit INDs in the United States at an earlier stage of clinical development.
Orphan Pediatric Epilepsy Program
Market Overview
Epilepsy is one of the most common neurological disorders in children. According to Russ in the February 2012 edition of Pediatrics, there is a point prevalence of 6.3 per 1,000 children currently diagnosed with epilepsy. Based on these findings, we estimate that 466,000 childhood patients in the United States and 765,000 patients in Europe are currently diagnosed with epilepsy.
Specialists estimate that up to 20% of these cases show pharmacoresistance to current treatment (i.e., seizures that persist despite accurate diagnosis and carefully monitored treatment with multiple antiepileptic drugs) and are deemed “medically intractable.” Furthermore it is recognized that some of those that do find relief often suffer side effects severe enough with their current medication that an alternative or adjunct is often sought.
In total, therefore, we believe the size of the intractable pediatric epilepsy population is 93,200 patients in the United States and 153,000 in Europe.
Epidiolex Development Strategy in Pediatric Epilepsy
Many cases of epilepsy are able to be classified and have clearly defined natural histories providing important information on the likelihood of seizure control and chance of remission. Some of the rarer electroclinical syndromes have very poor responses to treatment and negligible remission rates such as Ohtahara in neonates, Dravet in infants, Lennox-Gastaut in young children and progressive myoclonic epilepsies in adolescence.
Our strategy for the development of Epidiolex in pediatric epilepsy is to initially concentrate on two orphan indication syndromes—Dravet Syndrome and Lennox-Gastaut Syndrome. We expect to further expand the market opportunity by either targeting additional orphan seizure disorders and/or by seeking approval for a wider indication of pediatric epilepsy refractory to current treatments.
The active ingredient in Epidiolex, CBD, is one of the two principal cannabinoids in Sativex. Sativex has over 30,000 patient years of exposure in real world use, during which a favorable safety profile and positive benefit-risk balance has continued to be established. We believe that this data is supportive of the safety profile for Epidiolex.
We are currently manufacturing Epidiolex in-house using many of the same processes and facilities developed for Sativex. We expect to satisfy near-term requirements for Epidiolex from these current facilities but we are exploring further scale-up options for various parts of the production process both in-house and with external third parties.
Dravet Syndrome
Dravet syndrome is a severe infantile-onset, genetic, drug-resistant epilepsy syndrome with a distinctive but complex electroclinical presentation. Onset of Dravet syndrome occurs during the first year of life with clonic and tonic-clonic seizures in previously healthy and developmentally normal infants. Symptoms peak at about five months of age, and the latest onset beginning by 15 months of use. Other seizures develop between one and four years of age such as prolonged focal dyscognitive seizures and brief absence seizures, and duration of these seizures decreases during this period, but their frequency increases. Prognosis is poor and approximately 14% of children die during a seizure, because of infection, or suddenly due to uncertain causes, often because of the relentless neurological decline. Patients develop intellectual disability and life-long ongoing seizures. Intellectual impairment varies from severe in 50% of patients, to moderate and mild intellectual disability each accounting for 25% of cases. Patients may rarely return to normal intellect.
According to Forsgren L. et al. in the 2004 edition of Epilepsy in Children, the incidence of epilepsy in the first year of life is 1.5 per 1,000 people, or, by our estimate, 6,450 new epilepsies per year. According to Dravet et al. in the 2012 edition of Epileptic Syndromes in Infancy, Childhood and Adolescence, up to 5% of epilepsies diagnosed in the first year of life are Dravet syndrome, equating to 320 new cases per year in the United States with a mortality rate that studies have shown may be as high as 15% in the first 20 years of life, or, by our estimate, 5,440 patients with Dravet in the United States under the age of 20 years. Applying the same assumptions in Europe, we believe there are an estimated 6,710 Dravet patients in the European Union. It is likely that these figures are a low estimate as this syndrome is reportedly underdiagnosed.
A large percentage of cases of Dravet syndrome have a family history for epilepsy or convulsions. Heterozygous de novo mutations of the alpha 1 (α-1) subunit of the SCN1A gene, which encodes a voltage-gated sodium channel, are the major cause of Dravet syndrome and are found in approximately 75% of patients and more than 500 SCN1A mutations have been reported to be associated with this disorder.
There are currently no FDA-approved treatments specifically indicated for Dravet syndrome. The standard of care usually involves a combination of the following anticonvulsants: clobazam, clonazepam, leviteracetam, topirimate, valproic acid, ethosuximide or zonisamide. Stiripentol is approved in Europe for the treatment of Dravet syndrome in conjunction with clobazam and valproate. In the United States, stiripentol was granted an Orphan Drug Designation for the treatment of Dravet syndrome in 2008; however, the drug is not FDA approved.
Potent sodium channel blockers used to treat epilepsy actually increase seizure frequency in patients with Dravet Syndrome. The most common are phenytoin, carbamazepine, lamotrigine and rufinamide.
Management of this disease may also include a ketogenic diet, and physical and communication therapy. In addition to anti-convulsive drugs, many patients with Dravet syndrome are treated with anti-psychotic drugs, stimulants and drugs to treat insomnia.
Lennox-Gastaut Syndrome
Lennox-Gastaut syndrome, or LGS, is a rare disorder characterized by multiple types of seizures with slow spike wave complexes on EEG, such seizures usually beginning before four years of age. The seizure types vary among patients and include: tonic axial, atonic, atypical absence and myoclonic. Tonic axial seizures are the characteristic type of seizure seen in LGS and consist of flexion of the neck and body, extension of the arms and legs and contraction of the facial muscles. Other effects that may be associated include apnea, eye rolling and facial flushing. Although they only last for seconds, they can occur day or night and usually impair consciousness. Atypical absence seizures also occur in a majority of cases and although generally subtle, they are often accompanied by loss of muscle tone, myoclonic jerks and drooling.
According to Trevathan et al. in the December 1997 edition of Epilepsia, the estimated prevalence of Lennox-Gastaut syndrome is between 3 and 4% of childhood epilepsy, or, by our estimate, 14,000 to 18,500 patients in the United States and 23,000 to 31,000 patients in the European Union under the age of eighteen years.
Drug resistance is one of the main features of LGS. Generally, treatment often requires broad spectrum anti-epileptic drugs and/or polypharmacy. Treatment will also depend on the seizure type as some treatments that are effective for one type of seizure may worsen another. The treatments already approved by the FDA for LGS and used as adjunctive therapy with existing medications are: Onfi (clobazam); Banzel (rufinamide); Lamictal (lamotrigine); Topamax (topirimate); and Felbatol (felbamate). Although these medicines, when used with other particular anti-epileptic drugs, show a level of efficacy, many also have severe undesirable side effects. Furthermore, several of these medicines are based on the same mechanism of action of traditional anti-epileptic drugs. As patients with LGS generally need to take several treatments to gain any change to their seizure frequency, we believe there is a need for further pharmacological treatments, particularly those with a different mechanism of action, to give prescribers more options in treating this rare, pharmacoresistant syndrome.
Cannabinoid Rationale for Treating Epilepsy
Several features of the pharmacology of certain cannabinoids suggest that they may be candidates for investigation as anti-epileptic drugs. A series of validated laboratory experiments have shown that certain cannabinoids can modulate neurotransmission, can reduce neuro-inflammation and can affect oxidative stress.
These cannabinoids may simultaneously modulate a number of endogenous systems to attenuate and/or prevent epileptic neuronal hyperexcitability. These include ion channel control, inflammation, modulation of oxidative stress and inhibition of gene expression of epilepsy-associated genes.
Several different ion channels influence epileptogenesis (the process by which a normal brain develops epilepsy) including both ligand-gated and voltage-gated ion channels. It is the former to which a proportion of the actions of plant cannabinoids can be attributed, for example through agonism and antagonism of G-protein coupled receptors, including orphan receptors as well as modulation of transient receptor potential (TRP) channels (differentially activated, repressed and desensitized by different plant cannabinoids). Additionally it is now recognized that there is a role for inflammation in epilepsy. Some cannabinoids possess anti-inflammatory properties including inhibition of pro-inflammatory cytokine release and modulation of glial cell/neuronal interactions. Furthermore they modulate oxidative stress and production of toxic nitric oxide. Research shows that other than THC, plant cannabinoids have little or no affinity for the cannabinoid receptors, and therefore do not share the unwanted psychoactivity that goes along with stimulation of the CB1 receptor in particular.
Finally, certain cannabinoids may possess disease modifying potential through regulation of epilepsy-related genes, as well as up-regulation of endogenous anti-convulsant neuropeptides and/or compensatory systems.
We continue to conduct research into the mechanism of action of the anti-epileptic cannabinoids.
CBD pharmacology in epilepsy
The epilepsy-relevant pharmacology of CBD can be summarized as follows: inhibition of neutrophil and microglial migration, anti-inflammatory effects in conventional animal models; inhibition of adenosine uptake and indirect agonism of the neuroprotective and anti-inflammatory A2a receptor; other neuroprotective effects (TNF inhibition and anti-oxidant activity); antipsychotic activity; agonism at the orphan receptor GPR55; desensitizer of TRP channels; anticonvulsant activity in all laboratory models tested; ion channel modulation; reduction of acetylcholine turnover at neuro-muscular junctions; and perturbation of the negative effects of THC (opposes euphoric, cognitive and psychotropic effects) via one or more of the above mechanisms.
CBD has negligible binding at the CB1 receptor, and so shares neither the pharmacology of CB1 agonists such as THC nor that of CB1 antagonists such as Rimonabant. CBD’s mechanism for treating seizures is not fully understood but is believed to involve a combination of beneficial effects stacking upon one another (polypharmacology).
Preclinical models suggest a broad role for CBD in generalized and absence seizures, and clinical reports of benefit extend into other congenital seizure disorders.
Our CBD Research in Pediatric Epilepsy
We have conducted pre-clinical research of CBD in epilepsy for several years and have reported significant anti-epileptiform and anticonvulsant activity using a variety ofin vitroand in vivo models. This research has shown the ability of CBD to treat seizures in acute models of epilepsy with significantly fewer side effects than existing anti-epileptic drugs.
Our cannabinoid research compounds were screened in electrically discharging hippocampal brain slices caused by the omission of Mg2+ ions from, or addition of the K+ channel blocker, 4-aminopyridine (4-AP) to the bathing solution. In these models, 100µM of CBD decreased epileptiform amplitude and duration as well as burst frequency; importantly, this compound exerted no effect upon the propagation of epileptiform activity.
Subsequently, the anti-convulsant actions of 1, 10 and 100 mg/kg CBD were examined in three differentin vivo seizure rodent models. In the PTZ-induced acute, generalized seizures model, 100 mg/kg CBD significantly decreased mortality rate and the incidence of tonic-clonic seizures. In the acute pilocarpine model of temporal lobe seizures all doses of CBD significantly reduced the percentage of animals experiencing the most severe seizures. In this model of partial seizures, 10 and 100 mg/kg CBD significantly decreased the percentage of animals dying as a result of seizures and all doses of CBD also decreased the percentage of animals experiencing the most severe tonic-clonic seizures.
Our Clinical Research
During 2013, we have received increasing interest among U.S. pediatric epilepsy specialists and patient organizations in the potential role of CBD in treating intractable childhood epilepsy, in particular Dravet syndrome. This interest led to a medical conference organized by the New York University School of Medicine on October 4, 2013 titled: “Cannabidiols: Potential Use in Epilepsy and Other Neurological Disorders.” Epilepsy specialists at the meeting viewed CBD as attractive for the treatment of these disorders for a variety of reasons, including:
In addition, specialists at this conference concluded the following:
Our commercial development in pediatric epilepsy is focused on Epidiolex, a liquid formulation of pure plant-derived CBD. Epidiolex is now being evaluated in both placebo-controlled clinical trials and compassionate care “expanded access” studies. Both of these programs are authorized by the FDA. Our initial focus is on conducting formal development programs for Epidiolex in the treatment of both Dravet syndrome and LGS. The Company has received from the FDA Orphan Drug Designations for Epidiolex for both Dravet syndrome and LGS, as well as Fast Track Designation for Dravet syndrome. We have also received Orphan Drug Designation from the European Medicines Agency for Epidiolex for Dravet syndrome.
According to Dravet et al. in the 2012 edition of Epileptic Syndromes in Infancy, Childhood and Adolescence, up to 5% of epilepsies diagnosed in the first year of life are Dravet syndrome, equating to 5,440 patients in the United States and 6,710 patients in Europe under the age of 20. We believe, however, that this syndrome is under-diagnosed.
We held a pre-IND meeting with the FDA in February 2014 to discuss the investigational plan for Epidiolex in Dravet syndrome, following which we opened a commercial IND in May 2014. In October 2014, we commenced a Phase 2/3 trial designed as a two-part randomized double-blind, placebo-controlled parallel group dose escalation, safety, tolerability, pharmacokinetic and efficacy trial of single and multiple doses of Epidiolex to treat Dravet syndrome in children who are being treated with other anti-epileptic drugs. Part one comprises the pharmacokinetic and dose-finding elements of the trial in a total of 30 patients over a 3 week treatment period. Part two is a placebo-controlled safety and efficacy evaluation of Epidiolex over a 3 month treatment period in a total of 80 patients. We anticipate commencing an additional Phase 3 trial in Dravet syndrome in the first quarter of 2015 in parallel with part two of the first Phase 2/3 trial.
In addition to Dravet syndrome, we expect to commence a clinical program for Epidiolex for the treatment of LGS. GW expects to begin two Phase 3 trials in LGS in the first quarter of 2015.
In parallel with our commercial clinical trials program, the FDA has been receiving and approving INDs from independent investigators in the U.S. to allow treatment with Epidiolex in children with a range of epilepsy syndromes. To date, FDA has approved treatment under expanded access INDs for approximately 410 children at approximately 20 U.S. clinical sites. The patients in these INDs suffer not only from Dravet syndrome and LGS, but also from other pediatric epilepsy syndromes. In total, there are 20 expanded access INDs and 7 individual emergency treatment INDs open with the FDA. In the emergency cases, GW has responded to, and the FDA has approved, emergency treatment requests from physicians for children hospitalized as a result of severe and potentially life-threatening seizures. So far as GW is aware, 6 of the 7 children treated under emergency INDs remain on Epidiolex treatment.
In addition to Company and physician-led activities, two U.S. state governments (Georgia and New York) are collaborating with GW on separate state-based clinical trials in epilepsy.
Physician Reports of Clinical Effect Data
Data has been made available from physician reports of efficacy and safety from the “expanded access” program on 58 children and young adults with treatment-resistant epilepsy who have been treated with Epidiolex for a period of 12 weeks of which 40 patients have been treated for at least 16 weeks. The analysis of the clinical data relating to Epidiolex summarized below was performed on the clinical data made available to the Company for analysis on or before October 14, 2014.
Data were collected at hospital sites by the local medical teams and sent to GW for compiling into a database. It should be noted that expanded access studies (sometimes called “compassionate use”) are uncontrolled, carried out by individual investigators, not conducted in strict compliance with Good Clinical Practices and not intended to be analyzed together as study data. Therefore, the data reported from these programs may not be indicative of results from, or duplicated in, placebo-controlled company-sponsored clinical trials. . Further, due to the non-normal distribution of the data collected from the small sample size, we have chosen to use median data in its analysis. This is consistent with the approach we would expect to take in analyzing data arising from a placebo controlled trial where the data are not normally distributed. However, other statistical principles may be more appropriate to the analysis of the clinical data generated from our placebo controlled trials of Epidiolex for the treatment of Dravet syndrome and LGS.
The treatment-resistant patients suffer from a range of epilepsies in which current anti-epileptic drugs have been unsuccessful in adequately controlling seizures and include severe forms of epilepsy such as Dravet syndrome and LGS. Many of these patients have extreme and rare forms of epilepsy including several patients with major congenital structural brain abnormalities. The 58 patients were predominately children with an average age of 11 years. In all cases, Epidiolex was added to current anti-epileptic drugs (AEDs). On average, patients were taking 3 other AEDs. These data are from three hospital sites in the United States. Median baseline total seizure frequency was 67.5 per month (range 4-2872).
Treatment effect data on all 58 patients with 12 week data and 40 patients with 16 week data showed a median reduction in total seizure frequency of 40% after 12 weeks of treatment and 51% after 16 weeks of treatment. 43% of patients obtained a greater than 50% reduction in total seizure frequency after 12 weeks and 55% of patients obtained a greater than 50% reduction in total seizure frequency after 16 weeks. At both the 12 week and 16 week timepoints, 10% of patients were seizure-free.Data after 20 weeks treatment was also made available on 10 patients and the effect seen at this timepoint is consistent with that seen at the 16 week timepoint.
Dravet Syndrome Patients
Of the 58 patients, the largest single type of epilepsy was Dravet syndrome (n=12). With respect to the 12 patients with Dravet syndrome, the data presented below include only convulsive seizures reported for each patient, the types of seizures considered by FDA in assessing primary efficacy for Dravet syndrome trials. The 12 patients with Dravet syndrome had an average age of 8 years. Data were made available on 12 patients with 12 week data and 9 patients with 16 week data. Median baseline convulsive seizure frequency was 15 per month (range 6-112).
Treatment effect data have been presented to show median percent changes in seizure frequency during the first, second, third and fourth months of treatment compared with seizure frequency during a 4 week baseline observation period. Treatment effect data on all 12 patients with 12 week data and 9 patients with 16 week data showed a median reduction in total seizure frequency of 51% after 12 weeks of treatment and 56% after 16 weeks of treatment. 58% of patients obtained a greater than 50% reduction in total seizure frequency after 12 weeks and 56% of patients obtained a greater than 50% reduction in total seizure frequency after 16 weeks. At the 12 week timepoint 25% of patients were seizure-free. At the 16 week timepoint 22% of patients were seizure-free.
CBD Safety Profile
In addition to data on clinical effect, safety data have been made available on 151 patients (58 patients with 12 weeks treatment plus 93 additional patients for whom 12 week data is not yet available) and represents approximately 50 patient-years of treatment with Epidiolex. The most common adverse events (occurring in 10% or more of patients and resulting from all causes) were somnolence (19%) and fatigue (11%). There were two withdrawals from treatment due to an adverse events and there were four withdrawals from treatment due to lack of clinical effect. Serious adverse events were reported in 26 patients, including one death from SUDEP (sudden unexpected death in epilepsy) and one from respiratory failure due to aspiration. Of these serious adverse events, one case was deemed related to Epidiolex by one of the independent investigators. Neither of the two deaths were deemed related to Epidiolex In some instances, the addition of Epidiolex may be associated with changes in serum concentrations of concomitant AEDs. The adverse event data presented above reflects the information received by the Company in adverse event reports on or before October 14, 2014.
GWP42006 (CBDV) in Epilepsy
In addition to Epidiolex, our epilepsy product candidates also include GWP42006, which features CBDV as the primary cannabinoid. CBDV is similar in chemical structure to CBD and has also shown anti-epileptic properties across a range ofin vitroandin vivomodels of epilepsy. We have completed a Phase 1 trial of GWP42006 in 66 healthy subjects. In this trial, GWP42006 was well tolerated even at the highest tested dose. There were no serious or severe adverse events, nor any withdrawals due to adverse events. We expect to commence a Phase 2 trial of GWP42006 in patients with epilepsy in the first half of 2015. GWP42006 has the potential for development in the field of pediatric epilepsy as well as the broader epilepsy market.
We have rights to a portfolio of intellectual property related to CBD and CBDV in epilepsy. This portfolio, as at 1 November, includes fourteen patent families containing one or more pending and/or issued patents with claims related to the use of CBD and/or CBDV in the treatment of epilepsy as well as compositions, extraction techniques, CBD and CBDV extracts and highly purified CBD.
In a paper published in the September 2012 issue of The British Journal of Pharmacology by scientists with whom we collaborate at the University of Reading, United Kingdom, GWP42006 was reported to have the potential to prevent more seizures, with few of the side effects caused by many existing anti-epileptic drugs, such as uncontrollable shaking. In the study, GWP42006 strongly suppressed seizures in six different experimental models commonly used in epilepsy treatment. GWP42006 was also found to provide additional efficacy when combined with drugs currently used to control epilepsy. Genetic biomarkers for response have been identified.
Epilepsy is estimated to affect 50 million people worldwide including, according to the Centers for Disease Control and Prevention, 2.2 million people in the United States. Drug therapy remains ineffective for seizure control in up to 30% of patients with epilepsy because either the drugs do not control the seizures or the patients cannot tolerate the side effects. Currently available drugs can cause significant side effects to individuals’ movement and cognitive abilities that can adversely affect the quality of life for epileptic patients.
Glioma
Market Overview
Glioma describes any tumor that arises from the glial tissue of the brain. Glioblastoma, or GBM, is a particularly aggressive tumor that forms from abnormal growth of glial tissue. According to the New England Journal of Medicine, GBM accounts for approximately 46% of the 22,500 new cases of brain cancer diagnosed in the United States each year. Treatment options are limited and expected survival is a little over one year. GBM is considered a rare disease by the FDA and the European Medicines Agency, or EMA.
Our Research
In pre-clinical models, we have shown cannabinoids to be orally active in the treatment of gliomas and, in addition, have shown tumor response to be positively associated with tissue levels of cannabinoids. We have identified the putative mechanism of action for our cannabinoid product candidates, where autophagy and programmed cell death are stimulated via inhibition of the akt/mTORC1 axis. We have shown inin vivo studies that cannabinoids have a synergistic effect with temozolomide, the standard chemotherapeutic agent used in the treatment of glioma.
In light of this promising pre-clinical research, In 2014, we commenced an early proof of concept Phase 1b/2a clinical trial in 20 patients with recurrent GBM. The first phase of this trial was an open-label safety evaluation of GWP42002:GWP42003 in combination with temozolomide, the current standard of care. This study is a two part study with an open-label phase to assess safety and tolerability and a double blind, randomized, placebo-controlled phase with patients randomized to receive active or placebo. The first phase, comprising two cohorts of three patients each completing two cycles (months) of treatment is now complete. Safety data from these initial patient cohorts has been assessed by the independent safety monitoring board and their approval has been given to proceed into a Phase 2a placebo-controlled phase which has begun randomization. The primary outcome measure is 6 month progression free survival. The principal cannabinoids we have studied in pre-clinical models of glioma are GWP42002 and GWP42003 in various ratios, and this first trial will employ an equal ratio of GWP42002 and GWP42003 to establish a proof of principle. It is anticipated that subsequent development would focus on a product candidate with a different ratio of GWP42002 and GWP42003.
A recent study carried out in collaboration with us by specialists at St George’s, University of London, was the first to show a dramatic effect on brain tumors when combining cannabinoids with irradiation. This research, published inMolecular Cancer Therapeutics,showed that tumour growth in mouse brain was significantly slowed when a combination of THC and CBD was used with irradiation and tumor inhibition was higher than observed with irradiation alone.
We have also generated promising pre-clinical data to suggest that our cannabinoids could have benefits in other cancers, notably breast cancer, colon cancer and prostate cancer. In particular, in a model of Her2 positive breast cancer, we have shown cannabinoids to have the ability to inhibit not only local metastases, but also the occurrence of distant metastases. Our efforts are now focused on identifying the precise molecular mechanism of action of cannabinoids in breast cancer, and to define the optimum cannabinoid treatment regimen.
Neonatal Hypoxic-Ischemic Encephalopathy
Disease Background
Neonatal hypoxic-ischemic encephalopathy, or NHIE, is acute or sub-acute brain injury due to asphyxia caused during birth resulting from deprivation of oxygen during birth (hypoxia) as a result of a sentinel event such as ruptured placenta, parental shock and even increased heart rate. Hypoxic damage can occur to most of the infant’s organs, but brain damage is the most serious and least likely to heal, resulting in encephalopathy. This can later manifest itself as either mental retardation (including developmental delay and/or intellectual disability) or physical disabilities such as spasticity, blindness and deafness. Indeed, spastic diplegia and the other forms of cerebral palsy almost always feature asphyxiation during the birth process as a contributing factor.
The exact timing and underlying causes of these outcomes remains unknown but it is widely recognized that interventions need to be administered within six hours of hypoxic insult.
Market Overview
According to Kurinczuk et al. in the 2010 edition of Early Human Development, the incidence of NHIE is 1.5 to 2.8 per 1,000 births in the United States, or, by our estimate, 6,500 to 12,000 cases per year. Of these, 35% are expected to die in early life and 30% will end up with permanent disability. However, at time of diagnosis of NHIE, it is unclear what the prognosis may be, even for cases that are mild, and therefore the whole population is presumed to require treatment.
There are currently no FDA-approved medicines specifically indicated for NHIE. The only FDA-approved treatment is the Olympic Cool-Cap System and treatment guidelines in many European countries also support use of whole body hypothermia. Clinical studies have shown the Cool-Cap to reduce the occurrence of disability due to NHIE but not death, while whole body hypothermia had a more marginal effect on disability but is able to reduce mortality.
There are academic initiatives looking to develop treatments in this area. In addition, one intervention being investigated by the pharmaceutical industry is an IV infusion of 2-Iminobiotin. Neurophyxia attained orphan drug designation for this treatment in both Europe and the United States and is conducting a Phase 2 study in Eastern Europe.
Cannabinoid Rationale for Treating NHIE
The pathophysiology of NHIE includes processes such as apoptosis, oxidative stress, inflammation and excitotoxicity, and may involve not only the brain, but also other organs. Some plant cannabinoids are able to influence all of these processes, but unlike other therapeutic compounds under development, can combine these neuroprotective strategies within a single molecule. Firstly they can act on transcription factors and nuclear receptors that control neuronal homeostasis and survival. Secondly, not only do they have important free radical scavenging actions, but may also upregulate and activate endogenous antioxidant defenses. Thirdly, they influence the immune network and modulate phenomena associated with infection or inflammation, via inhibition of macrophage and neutrophil migration, natural killer cell proliferation, and by their ability to inhibit harmful cytokine production. . It has been widely reported that endocannabinoids are able to protect the glial cell, an effect that may be independent of CB receptors. Finally, the endocannabinoid system, or ECS, has been shown to be neuroprotective in animal models—the levels of endogenous cannabinoids become enhanced in the brains of newborn rats after acute injury, acting as a protective response, and it has been proposed that one additional mechanism by which plant cannabinoids work is by preventing the enzymatic degradation of endocannabinoids, thus enhancing endogenous defense mechanisms.
Recent research into the neuroprotection that has been shown by cannabinoids in animal models of neonatal hypoxia has also suggested a role for the 5HT1A receptor, since some of the beneficial effects can be blocked by 5HT1A receptor blockers.
CBD as the Primary Cannabinoid Product Candidate in NHIE
In addition to its other properties, the possible neuroprotective effects of CBD have been examined. These neuroprotective effects are thought to be based mainly on the potent anti-inflammatory and anti-oxidant properties of CBD, although other actions of CBD that might also account for CBD-induced neuroprotection including: inhibition of calcium transport across membranes; inhibition of anandamide uptake and enzymatic hydrolysis; inhibition of iNOS protein expression and NF-κB activation; and inhibition of adenosine uptake. In a similar fashion to endocannabinoids, adenosine is thought to be part of a natural neuroprotective system, because adenosine levels rise in response to hypoxic insult in the brain and increasing extracellular adenosine acts as a neuroprotectant. It has been demonstrated that CBD enhances adenosine signaling through the inhibition of adenosine re-uptake and therefore indirectly activates the A2A receptor.
Previously, it was demonstrated that CBD reduces brain damage after ischemic injury in adult animals. In a piglet model of NHIE, CBD improved brain activity as measured by an EEG and reduced the numbers of seizures by half, while histological analysis of brain tissues showed that neuron degeneration was reduced. Neurological exams showed improved neurobehavioral performance up to three days after insult. There were also significant beneficial extra cerebral effects and the dose of dopamine needed by the animals to maintain blood pressure was less than half of what was required in vehicle-treated animals.
Our NHIE Research
In a paper by Castillo, reporting results from our collaboration, CBD protected newborn mice forebrain slices from oxygen and glucose deprivation. Prevention of necrotic and apoptotic cell death and reductions in excitotoxicity, inflammation and nitrous oxide production was mediated by CB2and adenosine receptors. Another study from our collaboration with Lafuente showed that administration of CBD to newborn piglets at doses much lower than those reported in the literature protects brain cells, preserves brain activity, prevents seizures and improves neurobehavioral performance. These neuroprotective effects were not only free from side effects but also associated with some cardiac, hemodynamic and ventilatory benefits unlike other promising compounds with neuroprotective activity. These data support the view of CBD as a possible therapy for asphyxiated newborns.
We are planning to consult with regulatory authorities on the development program for an intravenous CBD formulation in the treatment of NHIE.
Type-2 Diabetes
Market Overview
According to the American Diabetes Association, 25.8 million individuals in the United States, or 8.3% of the population, have diabetes, of which at least 90% have the type-2 form. According to the World Health Organization, between 2010 and 2030, diabetes rates in developing countries will increase by 70% and by 20% in developed countries.
Type-2 diabetes is associated with two pathological features—insulin resistance in peripheral tissues causing an increase in the insulin requirement and a failure of the insulin-producing cells in the pancreas to meet this increased demand. Insulin resistance is driven by obesity, as well as a genetic predisposition, age and lack of exercise. Insulin resistance causes elevated blood glucose levels, which is associated with various complications of diabetes, including increased risk of cardiovascular disease, kidney damage, nerve damage and eye disease.
There is no cure for diabetes, so treatments are aimed primarily at controlling blood glucose levels. There is recognition that advances in the treatment of type-2 diabetes should focus not merely on glucose control but in protecting the overworked pancreatic islet cells from failure. Thus, there is an unmet need for improved insulin sensitizer drugs and oral treatments that result in a restoration of normal insulin production and glucose-dependent release of insulin from pancreatic islets.
Our Research
We have completed a Phase 2a trial in the treatment of dyslipedemia in patients with type-2 diabetes. This five-arm trial was a 13 week randomized, double-blind, placebo-controlled, parallel group, pilot trial of GWP42004 (5mg), GWP42003 (100mg) and two separate ratios (5mg:5mg and 100mg:5mg) of GWP42003 and GWP42004. Each treatment was delivered in the form of oral capsules and administered twice daily. The trial enrolled a total of 62 type-2 diabetes patients, such that each treatment group had 11 to 14 patients.
Although GWP42004 showed no benefit in lipid control, the trial showed that GWP42004, an oral cannabinoid treatment, produced the following desirable anti-diabetic effects: reduced fasting plasma glucose levels (p=0.04), with an increase in fasting insulin (p=0.289), and improved pancreatic beta-cell function (p=0.0074). Other trends of interest included increased serum adiponectin (p=0.0024), reduced systolic blood pressure (p=0.099), reduced serum IL-6 levels (p=0.076), and reduced serum C-Reactive Protein (CRP) levels (p=0.107). GWP42004 also showed numerical improvement in increased insulin sensitivity (p=0.275), improvements in both glucose and insulin response to glucose load (OGTT) (p=0.889 and p=0.417, respectively), and raised GLP-1 (glucagon-like peptide-1) (p=0.254). In this small study, GWP42004 was numerically better than placebo in reduction of HbA1c, the standard primary endpoint for Phase 3 diabetes studies, but failed to demonstrate significance (p=0.278). Because baseline HbA1c levels were normal, a significant reduction would not be expected. We are designing future studies of GWP42004 to focus on patients with elevated baseline HbA1c levels. The trial did not show meaningful effects in the other treatment arms.
Several of these findings are consistent with pre-clinical data generated in collaboration with Professor Mike Cawthorne at the GW Metabolic Research Laboratory, University of Buckingham. In particular, pre-clinical data suggests that GWP42004 protects the insulin-producing cells of the pancreatic islets, a highly desirable feature of a new anti-diabetic medicine, increases insulin sensitivity and reduces fasting plasma glucose levels.
In March 2014, we commenced a larger placebo-controlled Phase 2 dose ranging trial of GWP42004 with an estimated completion date in 2016.
Ulcerative Colitis
Market Overview
Ulcerative colitis, or UC, is a chronic, relapsing inflammatory disease affecting the colon which can cause pain, urgent diarrhea, severe tiredness and loss of weight. In addition, patients with chronic intestinal inflammation have an increased risk of developing bowel cancers. According to the Crohn’s & Colitis Foundation of America, UC may affect as many as 700,000 Americans.
Medical treatment for UC has two main goals: achieving remission (the near absence of symptoms) and, once that is accomplished, maintaining remission (prevention of flare-ups). To accomplish these goals, treatment is aimed at controlling the ongoing inflammation in the intestine. The four major classes of medication used today to treat ulcerative colitis are aminosalicylates (5-ASA), steroids, immune modifiers and antibiotics. According to the Centers for Disease Control and Prevention, in one-quarter to one-third of patients with ulcerative colitis, medical therapy is not completely successful or complications arise. Under these circumstances, surgical removal of the colon may be considered.
Our Research
We have shown that GWP42003 has anti-inflammatory properties in a number of accepted animal models of inflammation, notably of the gut and the joints. In addition, we have shown the capacity of GWP42003 to inhibit the production in tissues of chemical mediators of inflammation, such as Tumor Necrosis Factor alpha, or TNFα. In particular, we have demonstrated efficacy in the treatment of UC in standard in vivo models.
We have completed a Phase 2a study to investigate the efficacy and safety of GWP42003 compared with placebo for the treatment of 60 adult patients with UC who had not been able to gain remission from the condition despite first line treatment with salicylates, and in some cases immunosuppressive therapy. The trial was a 10-week randomized, double-blind, placebo controlled study of GWP42003 extract, which features CBD as the primary cannabinoid and which also contains THC and other cannabinoid and non-cannabinoid components.
The primary endpoint of this study was the percentage of participants achieving remission quantified by the MAYO score and included a range of secondary measures to determine whether GWP42003 has a positive benefit for subjects on symptom control. GWP42003 was given as a twice daily oral capsule in a dose titration regimen with an upper target dose of 250mg twice daily. Due to the pilot nature of the study, and the small patient population, the significance value was set at p=0.1.
Of the 60 patients, 29 patients were randomised to the active treatment group, and 31 to the placebo group. During the early weeks of the study, more patients withdrew from the active treatment group than from the placebo treatment group so that the per protocol population (those that took the investigational medicine as intended) comprised only 17 patients on GWP42003 and 27 on placebo. Most of these withdrawals were due to THC-related adverse events such as dizziness. For this reason, in this exploratory phase 2 setting, GW believes that the results for the protocol compliant population are most relevant to the assessment of efficacy. The intent to treat population (ITT) includes those patients who were only exposed to GWP42003 for a short period, and therefore had little if any opportunity to benefit. We note that the ITT population is nonetheless the population in whom efficacy must be demonstrated in Phase 3 studies in order to support approval.
The primary endpoint of disease remission, as assessed by a MAYO score of 2 or less at the end of the study was not statistically significant in either protocol-compliant patients or the ITT population.
Among the secondary efficacy endpoints, for the protocol-compliant population, the Inflammatory Bowel Disease Questionnaire was significantly in favor of GWP42003, as was the Physician Assessment of Disease severity and the Patient Global Impression of Change.
For the ITT population, the Patient Global Impression of Change and the total partial MAYO score change from baseline (this includes stool frequency, bleeding and physician global impression) were statistically significantly in favor of GWP42003.
All patients on GWP42003 reported at least 1 adverse event, compared with 77% of patients on placebo. Of the adverse events while on the drug, 90% were mild or moderate. There were no serious adverse events (SAEs) on GWP42003, while there were 4 SAEs on placebo (two of which were exacerbations of the ulcerative colitis). However, as stated above, 13 patients withdrew from the study due to adverse events while on drug, compared with 7 on placebo. There were no deaths in the study.
We believe that these results provide promising evidence for a therapeutic effect in the treatment of ulcerative colitis in patients who had previously failed to respond to first line therapy. While the results support the further investigation of GWP42003 and have provided useful pointers as to how this further investigation should best be done, we have yet to propose next steps in this program.
Schizophrenia
Market Overview
Schizophrenia is a chronic disease that manifests through disturbances of perception, thought, cognition, emotion, motivation and motor activity. Over a lifetime, about 1% of the population will develop schizophrenia.
All antipsychotic treatments for schizophrenia rely primarily upon their antagonistic action at the dopamine D2 receptor for their antipsychotic effect. They produce a wide range of adverse events, and are often poorly tolerated by patients resulting in poor compliance with treatment.
Current antipsychotics also have little or no effect upon the “negative” symptoms (blunted mood and lack of pleasure, motivation and movement) of schizophrenia or the associated cognitive deficit. Furthermore, the “positive” symptoms (such as hallucinations, delusions and thought disorder) of at least one‒third of patients fail to respond adequately to current treatments.
Our Research
GWP42003 has shown notable anti-psychotic effects in accepted pre-clinical models of schizophrenia and importantly has also demonstrated the ability to reduce the characteristic movement disorders induced by currently available anti-psychotic agents. The mechanism of GWP42003 does not appear to rely on the D2 receptor augmentation of standard antipsychotics and therefore has the potential to offer a novel treatment option in this therapeutic area. In March 2014, we commenced a Phase 2a trial of GWP42003 in the treatment for schizophrenia with an expected completion date in the second half of 2015.
Additionally, our pre-clinical research findings suggest that a range of other psychiatric conditions may be promising targets for cannabinoid therapeutics.
Intellectual Property and Technology Licenses
Our success depends in significant part on our ability to protect the proprietary nature of Sativex, Epidiolex, our other product candidates, technology and know- how,know-how, to operate without infringing on the proprietary rights of others, and to defend challenges and oppositions from others and prevent others from infringing on our proprietary rights. We have sought, and plan to continue to seek, patent protection in the United States and other countries for our proprietary technologies. Our intellectual property portfolio at September 30, 2014,2016, includes 4967 patent families with issued and/or pending claims directed to plants, plant extracts, extraction technology, pharmaceutical formulations, drug delivery and the therapeutic uses of cannabinoids, as well as plant variety rights, know-how and trade secrets. From these families, as of September 30, 2014,2016, we own 360242 pending patent applications worldwide. Within the United States, we already have 2635 issued patents with a further 2935 pending patent applications under active prosecution. There are an additional 303478 issued patents outside of the United States. Our policy is to seek patent protection for the technology, inventions and improvements that we consider important to the development of our business, but only in those cases where we believe that the costs of obtaining patent protection is justified by the commercial potential of the technology, and typically only in those jurisdictions that we believe present significant commercial opportunities.
We also rely on trademarks, trade secrets, know-how and continuing innovation to develop and maintain our competitive position.
Our strategy is to seek and obtain patents related to Sativex across all major pharmaceutical markets around the world. In the United States, our patents and/or pending applications (if they were to issue) relating to Sativex would expire on various dates between 2021 and 2026, excluding possible patent term extensions. We have at least seven different patent families containing one or more pending and/or issued patents directed to the Sativex formulation, the extracts from which Sativex is composed, the extraction technique used to produce the extracts and the therapeutic use of Sativex. In the key indication, treatment of cancer pain, we have obtained a patent in the United States, titled “Pharmaceutical Compositions for the Treatment of Pain,” which would expire in September 2026. This patent is specific to the United States, and we will not seek to file, or obtain corresponding rights under, this patent in other countries.
Under the 2007 research collaboration agreement with Otsuka, which expired in June 2013, all intellectual property (including both patents and non-manufacturing related know-how) that was conceived by either Otsuka or us during the course of the collaboration is jointly owned by Otsuka and us, and is referred to as “collaboration IP.” Since no product/product candidate(s) were licensed by Otsuka at the end of the collaboration, we have an exclusive sub-licensable royalty-bearing license to use collaboration IP both outside and within the fields of CNS and oncology.
Under the collaboration agreement, we are responsible for the filing, prosecution, maintenance and defense of any patents filed on the jointly owned collaboration IP, and Otsuka is responsible for all out-of-pocket expenses associated therewith. In the event Otsuka no longer wishes to reimburse us for our out-of-pocket costs associated with any of the jointly owned patents, Otsuka is required to assign its rights to the patents in question back to us. Otsuka has the first right to bring and control any action for infringement of any joint patent rights in the research field, and we have the right to join such action at our own expense. In the event Otsuka fails to bring such an action, we have the right to bring and control any such action at our own expense. Neither party shall have the right to settle any infringement litigation regarding the joint patent rights inside the research field without the prior written consent of the other party.
| 52 |
We have a portfolio of intellectual property relating to the use of CBD and CBDV in epilepsy. This portfolio includes fivetwelve distinct patent families which are either granted or filed, protecting the use of these product candidates and their manufacture and formulation.filed. The latest expiry date of these families runs to June 2034. We have recently filed a further four new patent applications providing protection for use of the product candidates. The latest expiry date of these families runs to October 2034. SeveralJuly 2036. Two of these patent families are collaboration IP derived from the now expired Otsuka research collaboration, and to which we have an exclusive sub-licensable royalty-bearing license. This portfolio includes patent families with claims directed to the use of CBD in the treatment of epilepsy seizure subtypes, particular childhood epilepsy syndromes and formulations. To date we have been successful in defending our granted CBD patents against oppositions and like challenges, with our European patent claiming the use of CBD in the treatment of partial seizures being upheld by the EPO at first instance. We have 2 patents granted by the USPTO and numerous patent applications being prosecuted at the USPTO. We anticipate filing additional patent applications claiming the use of Epidiolex in 2017 as new data is generated, and expect more of our pending patent applications to be granted by USPTO during 2017. Should the NDA for Epidiolex be approved we expect a number of these granted patent to be listed in the Approved Drug Products with Therapeutic Equivalence Evaluations, or Orange Book. In addition other patent families provide protection for epilepsy related inventions such as extraction techniques, CBD extracts and highly purified CBD.
We have a portfolio of intellectual property relating to CBD in schizophrenia. This portfolio includes two distinct patent families which are either granted or filed, protecting the use of this product candidate. One of these patent families is collaboration IP derived from the now expired Otsuka research collaboration, and to which we have an exclusive sub-licensable royalty-bearing license. The latest expiry date of these families runs to September 2035. These patent families include claims to use of CBD and/alone or CBDVin combination with other cannabinoids / anti-psychotics in the treatment of epilepsyschizophrenia as well as other families which provide protection for compositions, extraction techniques, CBD and CBDV extracts and highly purified CBD. We anticipate additional patent applications being filed as new data is generated.
We have a portfolio of intellectual property relating to CBDV for use in various indications including epilepsy and autism spectrum disorder. This portfolio includes patent families which are either granted or filed, protecting the use of this product candidate. One of these patent families is collaboration IP derived from the now expired Otsuka research collaboration, and to which we have an exclusive sub-licensable royalty-bearing license. The trademark Epidiolex is registeredlatest expiry date of these families runs to April 2036. These patent families include claims to use of CBDV alone or in combination with standard anti-epileptic drugs in the United Kingdomtreatment of seizures, the use of CBDV in the treatment of autism spectrum disorders and associated conditions. Other families which provide protection for the United States.use of CBDV in other therapeutic areas such as neuropathic pain, Alzheimer’s disease and Duchenne’s disease, CBDV compositions and CBDV extracts. We anticipate additional patent applications being filed as new data is generated.
We have a portfolio of intellectual property relating to CBD and THC for use in the treatment of glioma. This portfolio includes six distinct patent families which are either granted or filed, protecting the use of these product candidates in glioma. One of these patent families is collaboration IP derived from the now expired Otsuka research collaboration, and to which we have an exclusive sub-licensable royalty-bearing license. The latest expiry date of these families runs to June 2034. These patent families include claims to use of THC and CBD in various ratios either alone or in combination with chemotherapeutic drugs or radiotherapy in the treatment of glioma.
The term of individual patents depends upon the countries in which they are obtained. In most countries in which we have filed, the patent term is 20 years from the earliest date of filing a non-provisional patent application. In the United States, a patent’s term may be lengthened by patent term adjustment, which compensates a patentee for administrative delays by the U.S. Patent and Trademark Office, or PTO, in granting a patent, or may be shortened if a patent is terminally disclaimed over another patent.
The term of a patent that covers an FDA-approved drug may also be eligible for extension, which permits term restoration as compensation for the term lost during the FDA regulatory review process. The Drug Price Competition and Patent Term Restoration Act of 1984, or the Hatch-Waxman Act, permits an extension of up to five years beyond the expiration of the patent. The length of the patent term extension is related to the length of time the drug is under regulatory review. Extensions cannot extend the remaining term of a patent beyond 14 years from the date of product approval and only one patent applicable to an approved drug may be extended. Similar provisions to extend the term of a patent that covers an approved drug are available in Europe and other non-U.S. jurisdictions; indeed Supplementary Protection Certificates have been applied for such that the European formulation patent for Sativex will be extended to 2025 in Europe. In the future, if and when our pharmaceutical product candidates receive FDA approval, we may apply for extensions on patents covering those products.
| 53 |
To protect our rights to any of our issued patents and proprietary information, we may need to litigate against infringing third parties, avail ourselves of the courts or participate in hearings to determine the scope and validity of those patents or other proprietary rights.
We also rely on trade secret protection for our confidential and proprietary information, and it is our policy to require our employees, consultants, outside scientific collaborators, sponsored researchers and other advisors to execute confidentiality agreements upon the commencement of employment or consulting relationships with us.
From time to time, in the normal course of our operations, we will be a party to litigation and other dispute matters and claims relating to intellectual property. Litigation can be expensive and disruptive to normal business operations. Moreover, the results of complex legal proceedings are difficult to predict and our view of these matters may change in the future as the litigation and events related thereto unfold. An unfavorable outcome to any legal matter, if material, could have a materially adverse effect on our operations or our financial position, liquidity or results of operations.
In June 2016 our wholly-owned subsidiary GW Pharma Limited settled a claim of trademark infringement by G&W Laboratories for the use of the GW PHARMACEUTICALS name and logo in the US.
Manufacturing
We are responsible for the manufacture and supply of our products for commercial and clinical trial purposes. We operate under GMP manufacturing licenses issued by the Medicines and Healthcare products Regulatory Agency, or MHRA, in the United Kingdom and our facilities have been audited by the MHRA on several occasions. We have personnel with extensive experience in production of botanical raw material, pharmaceutical production, quality control, quality assurance and supply chain.
For commercial Sativex production, the BRM is currently contracted to an external third party, although our staff is at the contract site to monitor activity and production quality on a weekly basis. All other steps in the commercial production process for Sativex are performed in-house. We routinely hold significant inventories of Sativex BRM and BDS, both of which have extended shelf lives that enable us to manufacture finished product on demand. We believe that these inventories are currently sufficient to enable us to continue to meet anticipated commercial demand for Sativex in the event of an interruption in our supply of BRM.
We are in the process of expanding and upgrading parts of our manufacturing facilities in order to meet future demand and FDA requirements. We are constructing a new BDS production facility at our current site where we expect to install new BDS processing equipment. Construction work for this new facility commenced in September 2013 and is expected to bewas completed in 2015.May 2016. Longer term, depending on volume requirements, we anticipate the need to construct a new BDP facility.
For Epidiolex production, the BRM is currently contracted to the same external third party used for Sativex production.production plus an additional third party. We are planning a significantplan to continue expansion of our Epidiolex plant growing facilities over the next few years in ordercapacity well beyond our exit 2016 levels and to meet potential demand for Epidiolex, including workingthis end GW recently signed an agreement with a new third party that enables GW to treble its growing capacity from 2017 onwards. We will also work with several new third party contractors and adoptingadopt new methods in order to handle and process bulk quantities of BRM. All other steps in the production process for Epidiolex are currently performed in-house and we are working with a number of third party contractors in the scale-up of various steps in the process in order to be in a position to manufacture commercial quantities.
| 54 |
We have successfully exported cannabinoid commercial or research materials to 35over 30 countries and have the necessary in-house expertise to manage the import/export process worldwide. We have substantial expertise in, and experience with, relevant international and national regulations in relation to the research, distribution and commercialization of cannabinoid therapeutics. We have formed relationships with relevant international and national agencies in order to enable licensing of research sites, establishing appropriate product distribution channels and securing licensed storage, obtaining import/export licenses, and facilitating amendments to relevant legislation if required prior to commercialization.
Competition
The biotechnology and pharmaceutical industries are characterized by rapidly advancing technologies, intense competition and a strong emphasis on proprietary products. While we believe that our scientific knowledge, technology and development experience provide us with competitive advantages, we face potential competition from many different sources, including major pharmaceutical, specialty pharmaceutical and biotechnology companies, academic institutions, governmental agencies and public and private research institutions. Any product candidates that we successfully develop and commercialize will compete with existing therapies and new therapies that may become available in the future.
A synthetic THC (dronabinol) oral capsule has been approved and distributed in the United States for anorexia associated with weight loss in patients with AIDS. Dronabinol and nabilone (a synthetic molecule similar to THC) capsules have been approved and distributed in the United States for the treatment of nausea and vomiting associated with cancer chemotherapy in patients who have failed to respond adequately to conventional antiemetic treatments. We are also aware of exploratory research into the effects of THC formulations in other areas.
We are aware of discovery research within the pharmaceutical industry into synthetic agonists and antagonists of CB1 and CB2 receptors. We are also aware of companies that supply synthetic cannabinoids and cannabis extracts to researchers for pre-clinical and clinical investigation. We are also aware of various companies that cultivate cannabis plants with a view to supplying herbal cannabis or non-pharmaceutical cannabis-based formulations to patients. These activities are generally not compliant with national and international legislation and have not been approved by the FDA.
In both MS spasticity and cancer pain, Sativex aims to treat patients who do not respond adequately to standard care. In MS spasticity, such treatments include baclofen and tizanidine, and in cancer pain such treatments include morphine and other opioids. In cancer pain, the principal focus of ongoing clinical research by our potential competitors is in the development of alternative formulations of opioids.
With respect to CBD, a number of non-approved and non-standardized “artisanal” CBD preparations derived from crude herbal cannabis have been made available in limited quantities by producers of “medical marijuana” in the United States. In addition, certain pharmaceutical companies that currently manufacture synthetic THC are likely to have the capability to manufacture synthetic CBD and may already be doing so. Insys Therapeutics, Inc. has publicly stated its intention to develop CBD in Dravet syndrome, LGS, glioma and potentially other orphan indications. Zogenix, Inc. is developing low dose fenfluramine in Dravet syndrome. Zynerba Pharmaceuticals, Inc. is developing a topical formulation of CBD.
We have never endorsed or supported the idea of distributing or legalizing crude herbal cannabis, or preparations derived from crude herbal cannabis, for medical use and do not believe prescription cannabinoids are the same, and therefore competitive, with crude herbal cannabis. We have consistently maintained that only a cannabinoid medication, one that is standardized in composition, formulation and dose, administered by means of an appropriate delivery system, and tested in properly controlled pre-clinical and clinical studies, can meet the standards of regulatory authorities around the world, including those of the FDA. We have also repeatedly stressed that these regulatory processes provide important protections for patients, and we believe that any cannabinoid medication must be subjected to, and satisfy, such rigorous scrutiny.
| 55 |
The prospect for cannabinoid therapeutics to be approved through the FDA approval pathway has been the subject of statements from the White House, Congress and the Drug Enforcement Administration, or DEA. The White House Office of National Drug Control Policy states on its “Facts and Answers to the Frequently Asked Questions about Marijuana” on the White House website that the FDA has recognized and approved the medicinal use of isolated components of the marijuana plant and related synthetic compounds, and it specifically references Sativex as a product that is currently in late-stage clinical trials with the FDA. In its June 2012 report titled “Reducing the U.S. Demand for Illegal Drugs,” the U.S. Senate Caucus on International Narcotics Control expresses the view that the development of marijuana-based therapeutics through an approved FDA process is the best route to explore and references Sativex as a promising product currently in the final phase of the FDA’s trials for approved use in the United States. In that report, the Senate Caucus urged the FDA to complete a careful review of Sativex in a timely manner. In its May 2014 report titled “The Dangers and Consequences of Marijuana Abuse,” the DEA expresses support for ongoing research into potential medicinal uses of marijuana’s active ingredients, and specifically references Sativex and Epidiolex.
Government Regulation and Product Approval
FDA Approval Process
In the United States, pharmaceutical products are subject to extensive regulation by the FDA. The Federal Food, Drug, and Cosmetic Act, or the FDC Act, and other federal and state statutes and regulations, govern, among other things, the research, development, testing, manufacture, storage, recordkeeping, approval, labeling, promotion and marketing, distribution, post-approval monitoring and reporting, sampling, and import and export of pharmaceutical products. Failure to comply with applicable U.S. requirements may subject a company to a variety of administrative or judicial sanctions, such as imposition of clinical holds, FDA refusal to approve pending NDAs, warning letters, product recalls, product seizures, total or partial suspension of production or distribution, injunctions, fines, refusals of government contracts, restitution, disgorgement, civil penalties and criminal prosecution.
Pharmaceutical product development in the United States typically involves pre-clinical laboratory and animal tests and the submission to the FDA of an IND, which must become effective before clinical testing may commence, andcommence. For commercial approval, the sponsor must submit adequate tests by all methods reasonably applicable to show that the drug is safe for use under the conditions prescribed, recommended or suggested in the proposed labeling. The sponsor must also submit substantial evidence, generally consisting of adequate, well-controlled clinical trials to establish the safety and effectiveness ofthat the drug for each indication for whichwill have the effect it purports or is represented to have under the conditions of use prescribed, recommended or suggested in the proposed labeling. In certain cases, FDA approvalmay determine that a drug is sought.effective based on one clinical study plus confirmatory evidence. Satisfaction of FDA pre-market approval requirements typically takes many years and the actual time required may vary substantially based upon the type, complexity and novelty of the product or disease.
Pre-clinical tests include laboratory evaluation of product chemistry, formulation and toxicity, as well as animal trials to assess the characteristics and potential safety and efficacy of the product. The conduct of the pre-clinical tests must comply with federal regulations and requirements, including the FDA’s good laboratory practices.practices regulations and the U.S. Department of Agriculture’s (USDA’s) regulations implementing the Animal Welfare Act. The results of pre- clinical testing are submitted to the FDA as part of an IND along with other information, including information about product chemistry, manufacturing and controls, and a proposed clinical trial protocol. Long term pre-clinical tests, such as animal tests of reproductive toxicity and carcinogenicity, may continue after the IND is submitted.
A 30-day waiting period after the submission of each IND is required prior to the commencement of clinical testing in humans. If the FDA has neithernot imposed a clinical hold on the IND or otherwise commented on noror questioned the IND within this 30-day period, the clinical trial proposed in the IND may begin.
Clinical trials involve the administration of the investigational new drug to healthy volunteers or patients under the supervision of a qualified investigator. Clinical trials must be conducted: (i) in compliance with federal regulations, (ii) in compliance with Good Clinical Practice, or GCP, an international standard meant to protect the rights and health of patients and to define the roles of clinical trial sponsors, administrators and monitors, and (iii) under protocols detailing the objectives of the trial, the parameters to be used in monitoring safety and the effectiveness criteria to be evaluated. Each protocol involving testing on U.S. patients and subsequent protocol amendments must be submitted to the FDA as part of the IND.
The FDA may order the temporary, or permanent, discontinuation of a clinical trial at any time or impose other sanctions if it believes that the clinical trial either is not being conducted in accordance with FDA requirements or presents an unacceptable risk to the clinical trial patients. The trial protocol and informed consent information for patients in clinical trials must also be submitted to an institutional review board, or IRB, for approval. An IRB may also require the clinical trial at the site to be halted, either temporarily or permanently, for failure to comply with the IRB’s requirements or may impose other conditions.
| 56 |
Clinical trials to support NDAs for marketing approval are typically conducted in three sequential phases, but the phases may overlap. In Phase 1, the initial introduction of the drug into healthy human subjects or patients, the drug is tested to assess metabolism, pharmacokinetics, pharmacological actions, side effects associated with increasing doses and, if possible, early evidence on effectiveness. Phase 2 usually involves trials in a limited patient population to determine the effectiveness of the drug for a particular indication, dosage tolerance and optimum dosage, and to identify common adverse effects and safety risks. If a compound demonstrates evidence of effectiveness and an acceptable safety profile in Phase 2 evaluations, Phase 3 trials are undertaken to obtain the additional information about clinical efficacy and safety in a larger number of patients, typically at geographically dispersed clinical trial sites, to permit the FDA to evaluate the overall benefit-risk relationship of the drug and to provide adequate information for the labeling of the drug. In most cases, the FDA requires two adequate and well-controlled Phase 3 clinical trials to demonstrate the efficacy of the drug. A singleFDA may, however, determine that a drug is effective based on one clinical study plus confirmatory evidence. Only a small percentage of investigational drugs complete all three phases and obtain marketing approval. In some cases, FDA may require post-market studies, known as Phase 3 trial4 studies, to be conducted as a condition of approval in order to gather additional information on the drug’s effect in various populations and any side effects associated with long-term use. Depending on the risks posed by the drugs, other confirmatory evidencepost-market requirements may be sufficient in rare instances where the trial is a large multicenter trial demonstrating internal consistency and a statistically very persuasive finding of a clinically meaningful effect on mortality, irreversible morbidity, or prevention of a disease with potentially serious outcome, and confirmation of the result in a second trial would be practically or ethically impossible.imposed.
After completion of the required clinical testing, an NDA is prepared and submitted to the FDA. FDA approval of the NDA is required before marketing of the product may begin in the United States. The NDA must include the results of all pre-clinical, clinical, and other testing and a compilation of data relating to the product’s pharmacology, chemistry, manufacture, and controls. The cost of preparing and submitting an NDA is substantial. Under federal law, the submission of most NDAs is additionally subject to a substantial application user fee, currently exceeding $2,335,000,for Fiscal Year 2017 $2,038,100, and the manufacturer and/or sponsor under an approved NDA are also subject to annual product and establishment user fees, currently exceeding $110,000for Fiscal Year 2017 $97,750 per product and $569,000$512,200 per establishment. These fees are typically increased annually.
The FDA has 60 days from its receipt of an NDA to determine whether the application will be accepted for filing based on the agency’s threshold determination that it is sufficiently complete to permit substantive review. Once the submission is accepted for filing, the FDA begins an in-depth review. TheUnder the statute and implementing regulations, FDA has agreed180 days (the initial review cycle) from the date of filing to certainissue either an approval letter or a complete response letter, unless the review period is adjusted by mutual agreement between FDA and the applicant or as a result of the applicant submitting a major amendment. In practice, the performance goals inestablished pursuant to the Prescription Drug User Fee Act have effectively extended the initial review cycle beyond 180 days. FDA’s current performance goals call for FDA to complete review of NDAs. Most such applications for90 percent of standard review drug products are reviewed(non-priority) NDAs within 10 to 12 months while most applicationsof receipt and within six months for priority review drugsNDAs, but two additional months are reviewed in sixadded to eight months. Priority review can be applied to drugs that the FDA determines offer major advances in treatment, or provide a treatment where no adequate therapy exists. For biologics, priority review is further limited only for drugs intended to treat a serious or life-threatening disease relative to the currently approved products. The review process for both standard and priority review may be extended by FDANDAs for three additional months to consider certain late-submitted information, or information intended to clarify information already provided in the submission.a new molecular entity (NME).
The FDA may also refer applications for novel drug products, or drug products that present difficult questions of safety or efficacy, to an advisory committee, which is typically a panel that includes clinicians and other experts, for review, evaluation and a recommendation as to whether the application should be approved. The FDA is not bound by the recommendation of an advisory committee, but it generally follows such recommendations. Before approving an NDA, the FDA will typically inspect one or more clinical sites to assure compliance with GCP. Additionally, the FDA will inspect the facility or the facilities at which the drug is manufactured. The FDA will not approve the product unless compliance with current good manufacturing practices, or cGMP,GMP, is satisfactory and the NDA contains data that provide substantial evidence that the drug is safe and effective in the indication studied.
After the FDA evaluates the NDA and the manufacturing facilities, it issues either an approval letter or a complete response letter. A complete response letter generally outlines the deficiencies in the submission and may require substantial additional testing, or information, in order for the FDA to reconsider the application. If, or when, those deficiencies have been addressed to the FDA’s satisfaction in a resubmission of the NDA, the FDA will issue an approval letter. The FDA has committed to reviewing such90 per cent of resubmissions inwithin two or six months depending on the type of information included.
| 57 |
An approval letter authorizes commercial marketing of the drug with specific prescribing information for specific indications. As a condition of NDA approval, the FDA may require a risk evaluation and mitigation strategy, or REMS, to help ensure that the benefits of the drug outweigh the potential risks. REMS can include medication guides, communication plans for health care professionals, and elements to assure safe use, or ETASU. ETASU can include, but are not limited to, special training or certification for prescribing or dispensing, dispensing only under certain circumstances, special monitoring, and the use of patient registries. The requirement for a REMS can materially affect the potential market and profitability of the drug. Moreover, product approval may require substantial post-approval testing and surveillance to monitor the drug’s safety or efficacy. Once granted, product approvals may be withdrawn if compliance with regulatory standards is not maintained or problems are identified following initial marketing.
Disclosure of Clinical Trial Information
Sponsors of clinical trials of certain FDA-regulated products, including prescription drugs, are required to register and disclose certain clinical trial information on a public website maintained by the U.S. National Institutes of Health. Information related to the product, patient population, phase of investigation, study sites and investigator, and other aspects of the clinical trial is made public as part of the registration. SponsorsUnder a new rule, effective January 18, 2017, sponsors are also obligated to disclose the results of these trials after completion.completion (prior to the new rule, disclosure of results was only required if the product or new indication was approved by the FDA). Disclosure of the results of these trials can be delayed untilfor up to two years if the sponsor is seeking approval of the product or a new indication being studied has been approved.indication. Competitors may use this publicly available information to gain knowledge regarding the design and progress of our development programs.
Fast Track Designation and Accelerated Approval
FDA is required to facilitate the development, and expedite the review, of drugs that are intended for the treatment of a serious or life-threatening disease or condition for which there is no effective treatment and which demonstrate the potential to address unmet medical needs for the condition. Under the Fast Track Program, the sponsor of a new drug candidate may request that FDA designate the drug candidate for a specific indication as a Fast Track drug concurrent with, or after, the filing of the IND for the drug candidate. FDA must determine if the drug candidate qualifies for Fast Track designation within 60 days of receipt of the sponsor’s request.
Under the Fast Track Program and FDA’s accelerated approval regulations, FDA may approve a drug for a serious or life-threatening illness that provides meaningful therapeutic benefit to patients over existing treatments based upon a surrogate endpoint that is reasonably likely to predict clinical benefit, or on a clinical endpoint that can be measured earlier than irreversible morbidity or mortality, that is reasonably likely to predict an effect on irreversible morbidity or mortality or other clinical benefit, taking into account the severity, rarity or prevalence of the condition and the availability or lack of alternative treatments.
In clinical trials, a surrogate endpoint is a measurement of laboratory or clinical signs of a disease or condition that substitutes for a direct measurement of how a patient feels, functions or survives. Surrogate endpoints can often be measured more easily or more rapidly than clinical endpoints. A drug candidate approved on this basis is subject to rigorous post-marketing compliance requirements, including the completion of Phase 4 or post- approval clinical trials to confirm the effect on the clinical endpoint. Failure to conduct required post-approval studies, or confirm a clinical benefit during post-marketing studies, will allow FDA to withdraw the drug from the market on an expedited basis. AllUnless otherwise informed by the FDA, for an accelerated approval product an applicant must submit to the FDA for consideration during the preapproval review period copies of all promotional materials, including promotional labeling as well as advertisements, intended for drug candidates approved under accelerated regulations are subjectdissemination or publication within 120 days following marketing approval. After 120 days following marketing approval, unless otherwise informed by the FDA, the applicant must submit promotional materials at least 30 days prior to prior review by FDA.the intended time of initial dissemination of the labeling or initial publication of the advertisement
In addition to other benefits such as the ability to use surrogate endpoints and engage in more frequent interactions with FDA, FDA may initiate review of sections of a Fast Track drug’s NDA before the application is complete. This rolling review is available if the applicant provides, and FDA approves, a schedule for the submission of the remaining information and the applicant pays applicable user fees. However, FDA’s time period goal for reviewing an application does not begin until the last section of the NDA is submitted. Additionally, the Fast Track designation may be withdrawn by FDA if FDA believes that the designation is no longer supported by data emerging in the clinical trial process.
| 58 |
The Hatch-Waxman Act
Orange Book Listing
In seeking approval for a drug through an NDA, applicants are required to list with the FDA each patent whose claims cover the applicant’s product. Upon approval of a drug, each of the patents listed in the application for the drug is then published in the FDA’s Approved Drug Products with Therapeutic Equivalence Evaluations, commonly known as the Orange Book. Drugs listed in the Orange Book can, in turn, be cited by potential generic competitors in support of approval of an abbreviated new drug application, or ANDA. An ANDA provides for marketing of a drug product that has the same active ingredients in the same strengths and dosage form as the listed drug and has been shown through bioequivalence testing to be therapeutically equivalent to the listed drug. Other than the requirement for bioequivalence testing, ANDA applicants are not required to conduct, or submit results of, pre-clinical or clinical tests to prove the safety or effectiveness of their drug product. Drugs approved in this way are commonly referred to as “generic equivalents” to the listed drug, and can often be substituted by pharmacists under prescriptions written for the original listed drug.
The ANDA applicant is required to certify to the FDA concerning any patents listed for the approved product in the FDA’s Orange Book. Specifically, the applicant must certify that: (i) the required patent information has not been filed; (ii) the listed patent has expired; (iii) the listed patent has not expired, but will expire on a particular date and approval is sought after patent expiration; or (iv) the listed patent is invalid or will not be infringed by the new product. The ANDA applicant may also elect to submit a section viii statement, certifying that its proposed ANDA label does not contain (or carves out) any language regarding the patented method-of- use, rather than certify to a listed method-of-use patent.
If the applicant does not challenge the listed patents, the ANDA application will not be approved until all the listed patents claiming the referenced product have expired.
A certification that the new product will not infringe the already approved product’s listed patents, or that such patents are invalid, is called a Paragraph IV certification. If the ANDA applicant has provided a Paragraph IV certification to the FDA, the applicant must also send notice of the Paragraph IV certification to the NDA and patent holders once the ANDA has been accepted for filing by the FDA. The NDA and patent holders may then initiate a patent infringement lawsuit in response to the notice of the Paragraph IV certification. The filing of a patent infringement lawsuit within 45 days of the receipt of a Paragraph IV certification automatically prevents the FDA from approving the ANDA until the earlier of 30 months, expiration of the patent, settlement of the lawsuit, or a decision in the infringement case that is favorable to the ANDA applicant.
The ANDA application also will not be approved until any applicable non- patent exclusivity listed in the Orange Book for the referenced product has expired.
Exclusivity
Upon NDA approval of a new chemical entity or NCE, which is a drug that contains no active moiety that has been approved by the FDA in any other NDA, that drug receives five years of marketing exclusivity during which time the FDA cannot receive any ANDA or 505(b)(2) application seeking approval of a genericdrug that references a version of thatthe NCE drug. Certain changes to a drug, such as the addition of a new indication to the package insert, are associated with a three-year period of exclusivity during which the FDA cannot approve an ANDA for a generic drugor 505(b)(2) application that includes the change.
An ANDA or 505(b)(2) application may be submitted one year before NCE exclusivity expires if a Paragraph��Paragraph IV certification is filed. If there is no listed patent in the Orange Book, there may not be a Paragraph IV certification and thus no ANDA or 505(b)(2) application may be filed before the expiration of the exclusivity period.
For a botanical drug, FDA may determine that the active moiety is one or more of the principleprincipal components or the complex mixture as a whole. This determination would affect the utility of any 5-year exclusivity as well as the ability of any potential generic competitor to demonstrate that it is the same drug as the original botanical drug.
Five-year and three-year exclusivities do not preclude FDA approval of a 505(b)(1) application for a duplicate version of the drug during the period of exclusivity, provided that the 505(b)(1) conducts or obtains a right of reference to all of the preclinical studies and adequate and well controlled clinical trials necessary to demonstrate safety and effectiveness.
| 59 |
Patent Term Extension
After NDA approval, owners of relevant drug patents may apply for up to a five-year patent extension. The allowable patent term extension is calculated as half of the drug’s testing phase—the time between IND submission and NDA submission—and all of the review phase—the time between NDA submission and approval up to a maximum of five years. The time can be shortened if FDA determines that the applicant did not pursue approval with due diligence. The total patent term after the extension may not exceed 14 years.
For patents that might expire during the application phase, the patent owner may request an interim patent extension. An interim patent extension increases the patent term by one year and may be renewed up to four times. For each interim patent extension granted, the post-approval patent extension is reduced by one year. The director of the PTO must determine that approval of the drug covered by the patent for which a patent extension is being sought is likely. Interim patent extensions are not available for a drug for which an NDA has not been submitted.
Advertising and Promotion
Once an NDA is approved, a product will be subject to certain post-approval requirements. For instance, FDA closely regulates the post-approval marketing and promotion of drugs, including standards and regulations for direct-to-consumer advertising, off-label promotion, industry- sponsored scientific and educational activities and promotional activities involving the internet.
Drugs may be marketed only for the approved indications and in accordance with the provisions of the approved labeling. Changes to some of the conditions established in an approved application, including changes in indications, labeling, or manufacturing processes or facilities, require submission and FDA approval of a new NDA or NDA supplement before the change can be implemented. An NDA supplement for a new indication typically requires clinical data similar to that in the original application, and the FDA uses the same procedures and actions in reviewing NDA supplements as it does in reviewing NDAs.
Adverse Event Reporting and GMP Compliance
Adverse event reporting and submission of periodic reports is required following FDA approval of an NDA. The FDA also may require post-marketing testing, known as Phase 4 testing, REMS and surveillance to monitor the effects of an approved product, or the FDA may place conditions on an approval that could restrict the distribution or use of the product. In addition, quality-control, drug manufacture, packaging, and labeling procedures must continue to conform to current good manufacturing practices, or cGMPs,GMP, after approval. Drug manufacturers and certain of their subcontractors are required to register their establishments with FDA and certain state agencies. Registration with the FDA subjects entities to periodic unannounced inspections by the FDA, during which the agency inspects manufacturing facilities to assess compliance with cGMPs.GMP. Accordingly, manufacturers must continue to expend time, money and effort in the areas of production and quality control to maintain compliance with cGMPs.GMP. Regulatory authorities may withdraw product approvals or request product recalls if a company fails to comply with regulatory standards, if it encounters problems following initial marketing or if previously unrecognized problems are subsequently discovered.
Pediatric Exclusivity and Pediatric Use
The Best Pharmaceuticals for Children Act, or BPCA, provides NDA holders a six-month extension of any exclusivity—patent or non-patent—for a drug if certain conditions are met. Conditions for exclusivity include a determination by the FDA that information relating to the use of a new drug in the pediatric population may produce health benefits in that population; a written request by the FDA for pediatric studies; and agreement by the applicant to perform the requested studies and the submission to the FDA, and the acceptance by the FDA, of the reports of the requested studies within the statutory timeframe. Applications under the BPCA are treated as priority applications.
In addition, under the Pediatric Research Equity Act, or PREA, NDAs or supplements to NDAs must contain data to assess the safety and effectiveness of the drug for the claimed indications in all relevant pediatric subpopulations and to support dosing and administration for each pediatric subpopulation for which the drug is safe and effective, unless the sponsor has received a deferral or waiver from the FDA. Unless otherwise required by regulation, PREA does not apply to any drug for an indication for which orphan designation has been granted. The required pediatric assessment must assess the safety and effectiveness of the product for the claimed indications in all relevant pediatric subpopulations and support dosing and administration for each pediatric subpopulation for which the product is safe and effective. The sponsor or FDA may request a deferral of pediatric studies for some or all of the pediatric subpopulations. A deferral may be granted for several reasons, including a finding that the drug is ready for approval for use in adults before pediatric studies are complete or that additional safety or effectiveness data need to be collected before the pediatric studies begin. Under PREA, the FDA must send a non-compliance letter requesting a response with 45 days to any sponsor that fails to submit the required assessment, keep a deferral current or fails to submit a request for approval of a pediatric formulation.
| 60 |
Orphan Drugs
Under the Orphan Drug Act, the FDA may grant orphan drug designation to drugs intended to treat a rare disease or condition—generally a disease or condition that affects fewer than 200,000 individuals in the U.S (or affects more than 200,000 in the U.S. and for which there is no reasonable expectation that the cost of developing and making available in the U.S. a drug for such disease or condition will recovered from sales in the U.S. of such drug). Orphan drug designation must be requested before submitting an NDA. After the FDA grants orphan drug designation, the generic identity of the drug and its potential orphan use are disclosed publicly by the FDA. Orphan drug designation does not convey any advantage in, or shorten the duration of, the regulatory review and approval process. The first NDA applicant to receive FDA approval for a particular active ingredient to treat a particular disease with FDA orphan drug designation is entitled to a seven-year exclusive marketing period in the U.S. for that product, for that indication. During the seven-year exclusivity period, the FDA may not approve any other applications to market the same drug for the same disease, except in limited circumstances, such as a showing of clinical superiority to the product with orphan drug exclusivity. Orphan drug exclusivity does not prevent the FDA from approving a different drug for the same disease or condition, or the same drug for a different disease or condition. Among the other benefits of orphan drug designation are tax credits for certain research and a waiver of the NDA application user fee.
Special Protocol Assessment
A company may reach an agreement with the FDA under the Special Protocol Assessment, or SPA, process as to the required design and size of clinical trials intended to form the primary basis of an efficacy claim. According to its performance goals, the FDA is supposed to evaluate the protocol within 45 days of the request to assess whether the proposed trial is adequate, and that evaluation may result in discussions and a request for additional information. An SPA request must be made before the proposed trial begins, and all open issues must be resolved before the trial begins. If a written agreement is reached, it will be documented and made part of the administrative record. Under the FDC Act and FDA guidance implementing the statutory requirement, an SPA is generally binding upon the FDA except in limited circumstances, such as if the FDA identifies a substantial scientific issue essential to determining safety or efficacy after the study begins, public health concerns emerge that were unrecognized at the time of the protocol assessment, the sponsor and FDA agree to the change in writing, or if the study sponsor fails to follow the protocol that was agreed upon with the FDA.
Controlled Substances
The federal Controlled Substances Act of 1970, or CSA, and its implementing regulations establish a “closed system” of regulations for controlled substances. The CSA imposes registration, security, recordkeeping and reporting, storage, manufacturing, distribution, importation and other requirements under the oversight of the U.S. Drug Enforcement Administration, or DEA. The DEA is the federal agency responsible for regulating controlled substances, and requires those individuals or entities that manufacture, import, export, distribute, research, or dispense controlled substances to comply with the regulatory requirements in order to prevent the diversion of controlled substances to illicit channels of commerce.
Facilities that manufacture, distribute, import or export any controlled substance must register annually with the DEA. The DEA registration is specific to the particular location, activity(ies) and controlled substance schedule(s). For example, separate registrations are required for importation and manufacturing activities, and each registration authorizes which schedules of controlled substances the registrant may handle. However, certain coincident activities are permitted without obtaining a separate DEA registration, such as distribution of controlled substances by the manufacturer that produces them.
The DEA categorizes controlled substances into one of five schedules—Schedule I, II, III, IV or V—with varying qualifications for listing in each schedule. Schedule I substances by definition have a high potential for abuse, have no currently accepted medical use in treatment in the United States and lack accepted safety for use under medical supervision. They may be used only in federally approved research programs and may not be marketed or sold for dispensing to patients in the United States. Pharmaceutical products having a currently accepted medical use that are otherwise approved for marketing may be listed as Schedule II, III, IV or V substances, with Schedule II substances presenting the highest potential for abuse and physical or psychological dependence, and Schedule V substances presenting the lowest relative potential for abuse and dependence. The regulatory requirements are more restrictive for Schedule II substances than Schedule III substances. For example, all Schedule II drug prescriptions must be signed by a physician, physically presented to a pharmacist in most situations and cannot be refilled.
| 61 |
Following NDA approval of a drug containing a Schedule I controlled substance, that substance must be rescheduled as a Schedule II, III, IV or V substance before it can be marketed. On November 17, 2015, H.R. 639, Improving Regulatory Transparency for New Medical Therapies Act, passed through both houses of Congress and on November 25, 2015 the Bill was signed into law. The new law removes uncertainty associated with timing of the DEA rescheduling process after NDA approval. Specifically, it requires DEA to issue an “interim final rule,” pursuant to which a manufacturer may market its product no later than 90 days after the later of: (1) the date on which DEA receives from FDA the scientific and medical evaluation and scheduling recommendation; or (2) the date on which DEA receives from FDA notification that FDA has approved the drug. The new law also preserves the period of orphan marketing exclusivity for the full seven years such that this period only begins with the approval of the NDA or DEA scheduling, whichever is later. This contrasts with the previous situation whereby the orphan “clock” began to tick upon FDA approval, even though the product could not be marketed until DEA scheduling was complete.
Facilities that manufacture, distribute, import or export any controlled substance must register annually with the DEA. The DEA registration is specific to the particular location, activity(ies) and controlled substance schedule(s). For example, separate registrations are required for importation and manufacturing activities, and each registration authorizes which schedules of controlled substances the registrant may handle. However, certain coincident activities are permitted without obtaining a separate DEA registration, such as distribution of controlled substances by the manufacturer that produces them.
The DEA inspects all manufacturing facilities to review security, recordkeeping, reporting and handling prior to issuing a controlled substance registration. The specific security requirements vary by the type of business activity and the schedule and quantity of controlled substances handled. The most stringent requirements apply to manufacturers of Schedule I and Schedule II substances. Required security measures commonly include background checks on employees and physical control of controlled substances through storage in approved vaults, safes and cages, and through use of alarm systems and surveillance cameras. An application for a manufacturing registration as a bulk manufacturer (not a dosage form manufacturer or a repacker/relabeler) for a Schedule I or II substance must be published in the Federal Register, and is open for 3060 days to permit interested persons to submit comments, objections or requests for a hearing. A copy of the notice of the Federal Register publication is simultaneously forwarded by DEA to all those registered, or applicants for registration, as bulk manufacturers of that substance. Once registered, manufacturing facilities must maintain records documenting the manufacture, receipt and distribution of all controlled substances. Manufacturers must submit periodic reports to the DEA of the distribution of Schedule I and II controlled substances, Schedule III narcotic substances, and other designated substances. Registrants must also report any controlled substance thefts or significant losses, and must obtain authorization to destroy or dispose of controlled substances. As with applications for registration as a bulk manufacturer, an application for an importer registration for a Schedule I or II substance must also be published in the Federal Register, which remains open for 30 days for comments. Imports of Schedule I and II controlled substances for commercial purposes are generally restricted to substances not already available from domestic supplier or where there is not adequate competition among domestic suppliers. In addition to an importer or exporter registration, importers and exporters must obtain a permit for every import or export of a Schedule I and II substance or Schedule III, IV and V narcotic, and submit import or export declarations for Schedule III, IV and V non-narcotics. In some cases, Schedule III non-narcotic substances may be subject to the import/export permit requirement, if necessary to ensure that the United States complies with its obligations under international drug control treaties.
For drugs manufactured in the United States, the DEA establishes annually an aggregate quota for the amount of substances within Schedules I and II that may be manufactured or produced in the United States based on the DEA’s estimate of the quantity needed to meet legitimate medical, scientific, research and industrial needs. This limited aggregate amount of cannabis that the DEA allows to be produced in the United States each year is allocated among individual companies, which, in turn, must annually apply to the DEA for individual manufacturing and procurement quotas. The quotas apply equally to the manufacturing of the active pharmaceutical ingredient and production of dosage forms. The DEA may adjust aggregate production quotas a few times per year, and individual manufacturing or procurement quotas from time to time during the year, although the DEA has substantial discretion in whether or not to make such adjustments for individual companies.
| 62 |
The states also maintain separate controlled substance laws and regulations, including licensing, recordkeeping, security, distribution, and dispensing requirements. State Authorities, including Boards of Pharmacy, regulate use of controlled substances in each state. Failure to maintain compliance with applicable requirements, particularly as manifested in the loss or diversion of controlled substances, can result in enforcement action that could have a material adverse effect on our business, operations and financial condition. The DEA may seek civil penalties, refuse to renew necessary registrations, or initiate proceedings to revoke those registrations. In certain circumstances, violations could lead to criminal prosecution.
Europe/Rest of World Government Regulation
In addition to regulations in the United States, we are and will be subject, either directly or through our distribution partners, to a variety of regulations in other jurisdictions governing, among other things, clinical trials and any commercial sales and distribution of our products, if approved.
Whether or not we obtain FDA approval for a product, we must obtain the requisite approvals from regulatory authorities in non-U.S. countries prior to the commencement of clinical trials or marketing of the product in those countries.
In the E.U., medicinal products are subject to extensive pre- and post-marketing regulation by regulatory authorities at both the EU and national levels. Additional rules also apply at the national level to the manufacture, import, export, storage, distribution and sale of controlled substances. In many E.U. member states the regulatory authority responsible for medicinal products is also responsible for controlled substances. Responsibility is, however, split in some member states, such as the UK. Generally, any company manufacturing or distributing a medicinal product containing a controlled substance in the E.U. will need to hold a controlled substances licence from the competent national authority and will be subject to specific record-keeping and security obligations. Separate import or export certificates are required for each shipment into or out of the member state.
Clinical Trials and Marketing Approval
Certain countries outside of the United States have a process that requires the submission of a clinical trial application much like an IND prior to the commencement of human clinical trials. In Europe, for example, a clinical trial application, or CTA, must be submitted to the competent national health authority and to independent ethics committees in each country in which a company intends to conduct clinical trials. Once the CTA is approved in accordance with a country’s requirements and a company has received favorable ethics committee approval, clinical trial development may proceed in that country.
The requirements and process governing the conduct of clinical trials, product licensing, pricing and reimbursement vary from country to country, even though there is already some degree of legal harmonization in the European Union member states resulting from the national implementation of underlying E.U. legislation. In all cases, the clinical trials aremust be conducted in accordance with the International Conference on Harmonization, or ICH, guidelines on Good Clinical Practices, or GCP and other applicable regulatory requirements.
To obtain regulatory approval of an investigational drug under E.U. regulatory systems, we must submit a marketing authorization application. This application is similar to the NDA in the United States, with the exception of, among other things, country-specific document requirements. All application procedures require an application in the common technical document, or CTD, format, which includes the submission of detailed information about the manufacturing and quality of the product, and non-clinical and clinical trial information. Drugs can be authorized in the European Union by using (i) the centralized authorization procedure, (ii) the mutual recognition procedure, (iii) the decentralized procedure or (iv) national authorization procedures. The initial Sativex approvals were a consequence of an application under the De-Centralized Procedure, or DCP, to the E.U. member states of the United Kingdom and Spain.
The EMA implementedEuropean Commission created the centralized procedure for the approval of human drugs to facilitate marketing authorizations that are valid throughout the European Union.Union and, by extension (after national implementing decisions) in Iceland, Liechtenstein and Norway, which, together with the E.U. member states, comprise the European Economic Area, or EEA. Applicants file marketing authorization applications with the EMA, where they are reviewed by a relevant scientific committee, in most cases the Committee for Medicinal Products for Human Use, or CHMP. The EMA forwards CHMP opinions to the European Commission, which uses them as the basis for deciding whether to grant a marketing authorization.. This procedure results in a single marketing authorization granted by the European Commission that is valid across the European Union, as well as in Iceland, Liechtenstein and Norway. The centralized procedure is compulsory for human drugs that are: (i) derived from biotechnology processes, such as genetic engineering, (ii) contain a new active substance indicated for the treatment of certain diseases, such as HIV/AIDS, cancer, diabetes, neurodegenerative diseases, autoimmune and other immune dysfunctions and viral diseases, (iii) officially designated “orphan drugs” (drugs used for rare human diseases) and (iv) advanced-therapy medicines, such as gene- therapy, somatic cell-therapy or tissue-engineered medicines. The centralized procedure may at the voluntary request of the applicant also be used for human drugs which do not fall within the above mentioned categories if the CHMP agrees that the human drug (a) contains a new active substance which,not yet approved on the date of entry into force of this Regulation, was not authorized in the Community; or20 November 2005); (b) the applicant shows that the medicinal product constitutes a significant therapeutic, scientific or technical innovation or that the granting of(c) authorization inunder the centralized procedure is in the interests of patients or animal health at the European CommunityE.U. level.
| 63 |
Under the centralized procedure in the European Union, the maximum timeframe for the evaluation of a marketing authorization application by the EMA is 210 days (excluding clock stops, when additional written or oral information is to be provided by the applicant in response to questions asked by the Committee for Medicinal Products for Human Use, or CHMP), with adoption of the actual marketing authorization by the European Commission thereafter. Accelerated evaluation might be granted by the CHMP in exceptional cases, when a medicinal product is expected to be of a major public health interest from the point of view of therapeutic innovation, defined by three cumulative criteria: the seriousness of the disease to be treated; the absence of an appropriate alternative therapeutic approach, and anticipation of exceptional high therapeutic benefit. In this circumstance, EMA ensures that the evaluation for the opinion of the CHMP is completed within 150 days and the opinion issued thereafter.
For those medicinal products for which the centralized procedure is not available, the applicant must submit marketing authorization applications to the national medicines regulators through one of three procedures: (i) the mutual recognition procedure (which must be used if the product has already been authorized in at least one other E.U. member state, and in which the E.U. member states are required to grant an authorization recognizing the existing authorization in the other E.U. member state, unless they identify a serious risk to public health), (ii) the decentralized procedure (in which applications are submitted simultaneously in two or more E.U. member states ) or (iii) national authorization procedures (which results in a marketing authorization in a single E.U. member state).
Mutual Recognition Procedure
The mutual recognition procedure, or MRP, for the approval of human drugs is an alternative approach to facilitate individual national marketing authorizations within the European Union. Basically, the MRP may be applied for all human drugs for which the centralized procedure is not obligatory. The MRP is applicable to the majority of conventional medicinal products, and is based onmust be used if the principle of recognition of anproduct has already existing national marketing authorization bybeen authorized in at least one or more member states. Since the first approvals for Sativex were national approvals in the United Kingdom and Spain (following a DCP), the only route open to us for additional marketing authorizations in the European Union was the MRP.
The characteristic of the MRP is that the procedure builds on an already‒existing marketing authorization in a member state of the E.U. that is used as a reference in order to obtain marketing authorizations in other E.U. member states. In the MRP, a marketing authorization for a drug already exists in one or more member states of the E.U. and subsequently marketing authorization applications are made in other European Union member states by referring to the initial marketing authorization. The member state in which the marketing authorization was first granted will then act as the reference member state. The member states where the marketing authorization is subsequently applied for act as concerned member states. The concerned member states are required to grant an authorization recognizing the existing authorization in the reference member state, unless they identify a serious risk to public health.
The MRP is based on the principle of the mutual recognition by European Union member states of their respective national marketing authorizations. Based on a marketing authorization in the reference member state, the applicant may apply for marketing authorizations in other member states. In such case, the reference member state shall update its existing assessment report about the drug in 90 days. After the assessment is completed, copies of the report are sent to all member states, together with the approved summary of product characteristics, labeling and package leaflet. The concerned member states then have 90 days to recognize the decision of the reference member state and the summary of product characteristics, labeling and package leaflet. National marketing authorizations shall be granted within 30 days after acknowledgement of the agreement.
Should any Member State refuse to recognize the marketing authorization by the reference member state, on the grounds of potential serious risk to public health, the issue will be referred to a coordination group. Within a timeframe of 60 days, member states shall, within the coordination group, make all efforts to reach a consensus. If this fails, the procedure is submitted to an EMA scientific committee for arbitration. The opinion of this EMA Committee is then forwarded to the Commission, for the start of the decision making process. As in the centralized procedure, this process entails consulting various European Commission Directorates General and the Standing Committee on Human Medicinal Products or Veterinary Medicinal Products, as appropriate.Products. Since the initial approvals of Sativex in the United Kingdom and Spain, there have been three “waves” of additional approvals under three separate MRPs. Each of these procedures have been completed without any referral, and therefore without any delay.
For other countries outside
Data Exclusivity
In the E.U., marketing authorization applications for generic medicinal products do not need to include the results of pre-clinical and clinical trials, but instead can refer to the data included in the marketing authorization of a reference product for which regulatory data exclusivity has expired. If a marketing authorization is granted for a medicinal product containing a new active substance, that product benefits from eight years of data exclusivity, during which generic marketing authorization applications referring to the data of that product may not be accepted by the regulatory authorities, and a further two years of market exclusivity, during which such generic products may not be placed on the market. The two-year period may be extended to three years if during the first eight years a new therapeutic indication with significant clinical benefit over existing therapies is approved.
| 64 |
Orphan Medicinal Products
The EMA’s Committee for Orphan Medicinal Products, or COMP, may recommend orphan medicinal product designation to promote the development of products that are intended for the diagnosis, prevention or treatment of life-threatening or chronically debilitating conditions affecting not more than 5 in 10,000 persons in the E.U. Additionally, designation is granted for products intended for the diagnosis, prevention or treatment of a life-threatening, seriously debilitating or serious and chronic condition and when, without incentives, it is unlikely that sales of the product in the E.U. would be sufficient to justify the necessary investment in developing the medicinal product. The COMP may only recommend orphan medicinal product designation when the product in question offers a significant clinical benefit over existing approved products for the relevant indication. Following a positive opinion by the COMP, the European Union,Commission adopts a decision granting orphan status. The COMP will reassess orphan status in parallel with EMA review of a marketing authorization application and orphan status may be withdrawn at that stage if it no longer fulfills the orphan criteria (for instance because in the meantime a new product was approved for the indication and no convincing data are available to demonstrate a significant benefit over that product). Orphan medicinal product designation entitles a party to financial incentives such as countries in Eastern Europe, Latin Americareduction of fees or Asia,fee waivers and 10 years of market exclusivity is granted following marketing authorization. During this period, the requirements governingcompetent authorities may not accept or approve any similar medicinal product, unless it offers a significant clinical benefit. This period may be reduced to 6 years if the orphan medicinal product designation criteria are no longer met, including where it is shown that the product is sufficiently profitable not to justify maintenance of market exclusivity.
Pediatric Development
In the E.U., companies developing a new medicinal product must agree a Paediatric Investigation Plan (“PIP”) with the EMA and must conduct ofpaediatric clinical trials in accordance with that PIP unless a waiver applies, for example because the relevant disease or condition occurs only in adults. The marketing authorization application for the product licensing, pricing and reimbursement vary from country to country. In all cases, again,must include the results of paediatric clinical trials are conducted in accordance with GCPthe PIP, unless a waiver applies, or a deferral has been granted, in which case the paediatric clinical trials must be completed at a later date. Products that are granted a marketing authorization on the basis of the paediatric clinical trials conducted in accordance with the PIP are eligible for a six-month extension of the protection under a supplementary protection certificate (if any is in effect at the time of approval). This paediatric reward is subject to specific conditions and is not automatically available when data in compliance with the other applicable regulatory requirements.PIP are developed and submitted.
If we fail to comply with applicable foreign regulatory requirements, we may be subject to, among other things, fines, suspension of clinical trials, suspension or withdrawal of regulatory approvals, product recalls, seizure of products, operating restrictions and criminal prosecution.
In addition, most countries are parties to the Single Convention on Narcotic Drugs 1961, which governs international trade and domestic control of narcotic substances, including cannabis extracts. Countries may interpret and implement their treaty obligations in a way that creates a legal obstacle to our obtaining marketing approval for Sativex and our other products in those countries. These countries may not be willing or able to amend or otherwise modify their laws and regulations to permit Sativex or our other products to be marketed, or achieving such amendments to the laws and regulations may take a prolonged period of time. In that case, we would be unable to market our products in those countries in the near future or perhaps at all.
| 65 |
Reimbursement
Sales of pharmaceutical products in the United States will depend, in part, on the extent to which the costs of the products will be covered by third-party payers, such as government health programs, commercial insurance and managed health care organizations. These third-party payers are increasingly challenging the prices charged for medical products and services. Additionally, the containment of health care costs has become a priority of federal and state governments, and the prices of drugs have been a focus in this effort. The United States government, state legislatures and foreign governments have shown significant interest in implementing cost-containment programs, including price controls, restrictions on reimbursement and requirements for substitution of generic products. Adoption of price controls and cost-containment measures, and adoption of more restrictive policies in jurisdictions with existing controls and measures, could further limit our net revenue and results. If these third-party payers do not consider our products to be cost-effective compared to other available therapies, they may not cover our products after approval as a benefit under their plans or, if they do, the level of payment may not be sufficient to allow us to sell our products on a profitable basis.
The Medicare Prescription Drug, Improvement, and Modernization Act of 2003, or the MMA, imposed new requirements for the distribution and pricing of prescription drugs for Medicare beneficiaries and included a major expansion of the prescription drug benefit under Medicare Part D. Under Part D, Medicare beneficiaries may enroll in prescription drug plans offered by private entities which will provide coverage of outpatient prescription drugs. Part D plans includeis available through both stand-alone prescription drug benefit plans and prescription drug coverage as a supplement to Medicare Advantage plans. Unlike Medicare PartParts A and B, Part D coverage is not standardized. Part D prescription drug plan sponsors are not required to pay for all covered Part D drugs, and each drug plan can develop its own drug formulary that identifies which drugs it will cover and at what tier or level. However, Part D prescription drug formularies must include drugs within each therapeutic category and class of covered Part D drugs, though not necessarily all the drugs in each category or class. Any formulary used by a Part D prescription drug plan must be developed and reviewed by a pharmacy and therapeutic committee. Government payment for some of the costs of prescription drugs may increase demand for products for which we receive marketing approval. However, any negotiated prices for our products covered by a Part D prescription drug plan will likely be lower than the prices we might otherwise obtain. Moreover, while the MMA applies only to drug benefits for Medicare beneficiaries, private payers often follow Medicare coverage policy and payment limitations in setting their own payment rates. Any reduction in payment that results from the MMA may result in a similar reduction in payments from non-governmental payers.
On February 17, 2009, President Obama signed into law The American Recovery and Reinvestment Act of 2009. This law provides funding for the federal government to compare the effectiveness of different treatments for the same illness. A plan for theThis research will be developedis overseen by the Department of Health and Human Services, the Agency for Healthcare Research and Quality and the National Institutes for Health, and periodic reports on the status of the research and related expenditures willmust be made to Congress. Although the results of the comparative effectiveness studies are not intended to mandate coverage policies for public or private payers, it is not clear how such a result could be avoided and what if any effect the research will have on the sales of our product candidates, if any such product or the condition that it is intended to treat is the subject of a study. It is also possible that comparative effectiveness research demonstrating benefits in a competitor’s product could adversely affect the sales of our product candidates. Decreases in third-party reimbursement for our product candidates or a decision by a third-party payer to not cover our product candidates could reduce physician usage of the product candidate and have a material adverse effect on our sales, results of operations and financial condition.
The Patient Protection and Affordable Care Act, as amended by the Health Care and Education Affordability Reconciliation Act of 2010 (collectively, the ACA) enacted in March 2010, is expected to have a significant impact on the health care industry. The ACA is expected to expand coverage for the uninsured while at the same time contain overall health care costs. With regard to pharmaceutical products, among other things, the ACA is expected to expand and increase industry rebates for drugs covered under Medicaid programs and makemade changes to the coverage requirements under the Medicare D program. We cannot predict the impact of the ACA on pharmaceutical companies as many of the ACA reforms require the promulgation of detailed regulations implementing the statutory provisions which has not yet occurred.been completed. In addition, although the United States Supreme Court has upheld the constitutionality of most of the ACA, some states have stated their intentions to not implement certain sections of the ACA and some members of Congress are still working to repeal the ACA. These challenges add to the uncertainty of the changes enacted as part of ACA. In addition, the current legal challenges to the ACA, as well as Congressional efforts to repeal the ACA, add to the uncertainty of the legislative changes enacted as part of the ACA.
| 66 |
In addition, in some foreign countries, the proposed pricing for a drug must be approved before it may be lawfully marketed. The requirements governing drug pricing vary widely from country to country. For example, some E.U. jurisdictions operate positive and negative list systems under which products may only be marketed once a reimbursement price has been agreed. To obtain reimbursement or pricing approval, some of these countries may require the European Union provides options for itscompletion of clinical trials that compare the cost-effectiveness of a particular product candidate to currently available therapies. Other member states allow companies to restrict the range of medicinal productsfix their own prices for which theirmedicines but monitor and control company profits. Such differences in national health insurance systems provide reimbursement and to control the prices of medicinal products for human use. Apricing regimes may create price differntials between E.U. member state may approve a specific price for the medicinal product or it may instead adopt a system of direct or indirect controls on the profitability of the company placing the medicinal product on the market.states. There can be no assurance that any country that has price controls or reimbursement limitations for pharmaceutical products will allow favorable reimbursement and pricing arrangements for any of our products. Historically, products launched in the European Union do not follow price structures of the United StatesStates. In the E.U., the downward pressure on healthcare costs in general, particularly prescription medicines, has become intense. As a result, barriers to entry of new products are becoming increasingly high and generally tendpatients are unlikely to be significantly lower.use a drug product that is not reimbursed by their government.
Other Health Care Laws and Compliance Requirements
In the United States, our activities are potentially subject to regulation by various federal, state and local authorities in addition to the FDA, including the Centers for Medicare and Medicaid Services (formerly the Health Care Financing Administration), or CMS, other divisions of the U.S. Department of Health and Human Services (e.g., the Office of Inspector General), the U.S. Department of Justice and individual U.S. Attorney offices within the Department of Justice, and state and local governments. For example, sales, marketing and scientific/educational grant programs must comply with the anti-fraud and abuse provisions of the Social Security Act, the False Claims Act, the privacy provisions of the Health Insurance Portability and Accountability Act, or HIPAA, and similar state laws, each as amended. Pricing and rebate programs must comply with the Medicaid rebate requirements of the Omnibus Budget Reconciliation Act of 1990 and the Veterans Health Care Act of 1992, or VHCA, each as amended. If products are made available to authorized users of the Federal Supply Schedule, of the General Services Administration, additional laws and requirements apply. Under the VHCA, drug companies are required to offer certain drugs at a reduced price to a number of federal agencies including the U.S. Department of Veteran Affairs and U.S. Department of Defense, the Public Health Service and certain private Public Health Service‒designated entities in order to participate in other federal funding programs including Medicare and Medicaid. Recent legislative changes purport to require thatIn addition discounted prices must be offered for certain U.S. Department of Defense purchases for its TRICARE program via a rebate system. Participation under the VHCA requires submission of pricing data and calculation of discounts and rebates pursuant to complex statutory formulas, as well as the entry into government procurement contracts governed by the Federal Acquisition Regulations.
In order to distribute products commercially, we must comply with state laws that require the registration of manufacturers and wholesale distributors of pharmaceutical products in a state, including, in certain states, manufacturers and distributors who ship products into the state, even if such manufacturers or distributors have no place of business within the state. Some states also impose requirements on manufacturers and distributors to establish the pedigree of product in the chain of distribution, including some states that require manufacturers and others to adopt new technology capable of tracking and tracing product as it moves through the distribution chain. Several states have enacted legislation requiring pharmaceutical companies to establish marketing compliance programs, file periodic reports with the state, make periodic public disclosures on sales marketing, pricing, clinical trials and othermarketing, activities or register their sales representatives. Other legislation has been enacted in certain states prohibiting pharmacies and other health care entities from providing certain physician prescribing data to pharmaceutical companies for use in sales and marketing, and prohibiting certain other sales and marketing practices. All of our activities are potentially subject to federal and state consumer protection and unfair competition laws.
| 67 |
Expanded Access to Investigational Drugs
An investigational drug may be eligible for clinical use outside the context of a manufacturer’smanufacturer-sponsored clinical trial of the drug. “Expanded access,” sometimes also referred to as “treatment use,”access” refers to the use of an investigational drug where the primary purpose is to diagnose, monitor, or treat a patient’s disease or condition rather than to collect information about the safety or effectiveness of a drug. Expanded access INDs are oftentypically sponsored by individual physicians to treat patients. FDA regulations provide forpatients who fall into one of three FDA-recognized categories of expanded access: expanded access for individual patients, including for emergency use; expanded access for intermediate-size patient populations; and expanded access for large patient populations under a treatment IND or treatment protocol. For all types of expanded access, FDA must determine prior to grantingauthorizing expanded access that: (1) the patient or patients to be treated have a serious or life‒life threatening disease or condition and there is no comparable or satisfactory alternative therapy; (2) the potential patient benefit justifies the potential risks of use and that the potential risks are not unreasonable in the context of the disease or condition to be treated; and (3) granting the expanded access will not interfere with the initiation, conduct, or completion of clinical studies in support of the drug’s approval. In addition, the sponsor of an expanded access IND must submit IND safety reports and, in the cases of protocols continuing for one year or longer, annual reports to the FDA. Expanded access programs are not intended to yield information relevant to evaluating a drug’s effectiveness.effectiveness for regulatory purposes.
Legal Proceedings and Related Matters
From time to time, we may be party to litigation that arises in the ordinary course of our business. We do not have any pending litigation that, separately or in the aggregate, would, in the opinion of management, have a material adverse effect on our results of operations, financial condition or cash flows.
| C. | Organizational Structure |
The following is a list of our significant subsidiaries:
| Name of undertaking | Country of registration | Activity | % holding | |||||
| GW Pharma Limited | England and Wales | Research and Development | 100 | |||||
| GW Research Limited | England and Wales | Research and Development | 100 | |||||
| United States | Pharmaceutical development services | 100 | ||||||
| GWP Trustee Company Limited | England and Wales | Employee Share Ownership | 100 | |||||
| Cannabinoid Research Institute Limited | England and Wales | Dormant | 100 | |||||
| Guernsey Pharmaceuticals Limited | Guernsey | Dormant | 100 | |||||
| G-Pharm | ||||||||
| England and Wales | Dormant | 100 | ||||||
| D. | Property, |
| Type | Location | Size (sq ft) | Expiry | |||||
| Executive office | ||||||||
| Executive office | London, United Kingdom | 2,680 | September | |||||
| Executive office | Cambridge, United Kingdom | 12,120 | May 2021 | |||||
| Executive office | Carlsbad, United States | 4,911 | January 2019 | |||||
| Executive office | Durham, United States | 782 | October 2016 | |||||
| Executive office | Southern United Kingdom | 17,222 | December 2025 | |||||
| Research and manufacturing | Southern United Kingdom | January 2019 | ||||||
| Research and manufacturing | Southern United Kingdom | |||||||
| Research and manufacturing | Southern United Kingdom | September 2029 | ||||||
| Research and manufacturing | Southern United Kingdom | 20,172 | May 2036 | |||||
| Research and manufacturing | Southern United Kingdom | 7,050 | December 2019 | |||||
| Growing facility | Eastern United Kingdom | 1,960,000 | August 2021 | |||||
| Growing facility | Southern United Kingdom | 163,350 | January | |||||
| Growing facility | Northern United Kingdom | 914,760 | December 2016 | |||||
| Growing facility | Tenerife, Spain | 11,679 | December 2016 | |||||
| Growing facility | Eastern United Kingdom | 815,022 | February 2020 | |||||
All of our property is leased. On November 9, 2016, we signed a six-year lease for 21,895 square feet in Carlsbad, California to meet our future US commercialization requirements. We believe that our office, research and manufacturing facilities are sufficient to meet our current needs. However, in anticipation of future commercial and research demand, construction and fit-out is continuing for a new bespoke 10,000 square feet manufacturing facility. The lease for this facility will be signed upon completion of construction. Additionally, in October 2014 we entered into a short-term contract for 526 square feet of executive office space in North Carolina, United States of America and we are in the process of agreeing lease terms for an additional 8,000 square feet of office space in the south of the United Kingdom.
We are not aware of any environmental issues that may affect our utilization of our property.
| 68 |
Further details of our Property, Plant and Equipment are given in Note 1314 to our consolidated financial statements set out on page F-22.
Item 4A. Unresolved Staff Comments.
There are no written comments from the staff of the U.S. Securities and Exchange Commission which remain unresolved before the end of the fiscal year to which the annual report relates.
Item 5. Operating and Financial Review and Prospects.
The following discussion of our financial condition and results of operations should be read in conjunction with “Selected Financial Data,” and our consolidated financial statements included elsewhere in this Annual Report. We present our consolidated financial statements in pounds sterling and in accordance with International Financial Reporting Standards, or IFRS, as issued by the International Accounting Standards Board, or IASB, and as adopted by the European Union, or E.U.
The statements in this discussion regarding industry outlook, our expectations regarding our future performance, liquidity and capital resources and other non-historical statements are forward-looking statements. These forward-looking statements are subject to numerous risks and uncertainties, including, but not limited to, the risks and uncertainties described in “Risk Factors” and “Forward-Looking Statements” in this Annual Report. Our actual results may differ materially from those contained in or implied by any forward-looking statements.
Solely for the convenience of the reader, unless otherwise indicated, all pound sterling amounts as at and for the year ended September 30, 20142016 have been translated into U.S. dollars at the rate at September 30, 2014,2016, of £0.6166£0.7744 to $1.00 and unless otherwise indicated, all pounds sterling amounts as at and for the year ended September 30, 20132015 have been translated into U.S. dollars at the rate at September 30, 2013,2015, the last business day of our year ended September 30, 2013,2015, of £0.6181£0.6611 to $1.00. These translations should not be considered representations that any such amounts have been, could have been or could be converted into U.S. dollars at that or any other exchange rate as at that or any other date.
| A. | Operating Results. |
Important Financial and Operating Terms and Concepts
Revenue
We generate revenue from product sales, license fees, collaboration fees, technical access fees, development and approval milestone fees, research and development fees and royalties. Agreements with our commercial partners generally include a non-refundable upfront fee (attributed to separately identifiable components including license fees, collaboration fees and technical access fees), milestone payments, the receipt of which is dependent upon the achievement of certain clinical, regulatory or commercial milestones, royalties on product sales of licensed products if and when such product sales occur and revenue from the supply of products. For these agreements, total arrangement consideration is attributed to separately identifiable components on a reliable basis that reasonably reflects the selling prices that might be achieved in stand-alone transactions. The allocated consideration is recognized as revenue in accordance with our accounting policies for each revenue stream.
Product sales
We recognize revenue from the sale of products when we have transferred the significant risks and rewards of ownership of the goods to the buyer, when we no longer have effective control over the goods sold, when the amount of revenue and costs associated with the transaction can be measured reliably, and when it is probable that we will receive future economic benefits associated with the transaction. Product sales have no rights of return. Provisions for rebates are established in the same period that the related sales are recorded.
We maintain a rebate provision for expected reimbursements to our commercial partners in circumstances in which actual net revenue per vial differs from expected net revenue per vial as a consequence of, as an example, ongoing pricing negotiations with local health authorities. The amount of our rebate provision is based on, among other things, monthly unit sales and in-market sales data received from commercial partners, and represents management’s best estimate of the rebate expected to be required to settle the present obligation at the end of the reporting period. Provisions for rebates are established in the same period that the related sales are recorded.
| 69 |
Licensing fees
Licensing fees are upfront payments received under our product out-licensing agreements from our commercial partners for the right to commercialize products. Such fees are generally received upfront, are non-refundable and are deferred and recognized over the period of the expected license term.
Collaboration fees
Collaboration fees are amounts received from our commercial partners for our participation in joint development activities. Such fees are generally received upfront, are non-refundable and are deferred and recognized as services are rendered based on the percentage of completion method.
Technical access fees
Technical access fees represent amounts charged to licensing partners to provide access to, and allow them to commercially exploit, data that we possess or that can be expected to result from our research programs that are in progress. Non-refundable technical access fees that involve the delivery of data that we possess and that permit our licensing partners to use the data freely and where we have no remaining obligations to perform are recognized as revenue upon delivery of the data. Non-refundable technical access fees relating to data where the research program is ongoing are recognized based on the percentage of completion method.
Development and approval milestone fees
Development and approval milestones represent amounts received from our commercial partners, the receipt of which is dependent upon the achievement of certain clinical, regulatory or commercial milestones. We recognize development and approval milestone fees as revenue based on the percentage of completion method on the assumption that all stages will be completed successfully, but with cumulative revenue recognized limited to non-refundable amounts already received or reasonably certain to be received.
Research and development fees
Research and development fees represent amounts chargeable to our development partners relating to the conduct of our joint research plans. Revenue from development partner-funded contract research and development agreements is recognized as research and development services are rendered. Where services are in-progress at period end, we recognize revenue proportionately, in line with the percentage of completion of the service. Where such in-progress services include the conduct of clinical trials, we recognize revenue in line with the stage of completion of each trial so that revenue is recognized in line with the expenditures.
Royalties
Royalty revenue arises from our contractual entitlement to receive a fixed percentage of our commercial partner’s in-market net product sales revenue. Royalty revenue is recognized on an accrual basis in accordance with the substance of the relevant agreement provided that it is probable that the economic benefits will flow to us and the amount of revenue can be measured reliably.
Costs of sales
Costs of sales principally includes the cost of materials, direct labor, depreciation of manufacturing assets and overhead associated with our manufacturing facilities.
| 70 |
Research and development expenditure
Expenses on research and development activities are recognized as an expense in the period in which the expense is incurred.
An internally generated intangible asset arising from our development activities is recognized only when an asset is created that can be identified, it is probable that the asset created will generate future economic benefits and the development cost of the asset can be measured reliably.
We have determined that regulatory approval is the earliest point at which the probable threshold for the creation of an internally generated intangible asset can be achieved. All research and development expenditure incurred prior to achieving regulatory approval is therefore expensed as incurred.
GW-funded research and development expenditure
GW-funded research and development expenditure consists of costs associated with our research activities. These costs include costs of conducting our pre-clinical studies or clinical trials, payroll costs associated with employing our team of research and development staff, share-based payment expenses, property costs associated with leasing laboratory and office space to accommodate our research teams, costs of growing botanical raw material, costs of consumables used in the conduct of our in-house research programs, payments for research work conducted by sub-contractors and sponsorship of work by our network of academic collaborative research scientists, costs associated with safety studies and costs associated with the development of further Epidiolex, Sativex or our other pipeline product data.
We expect to increase our investment in GW-funded research and development in the future as we seek to advance our most promising pipeline product candidates through further clinical development.
Development partner-funded research and development expenditure
Development partner-funded research and development expenditure represent costs incurred by us in conducting the joint research plans under our collaborations. These costs include (i) costs incurred under our Phase 3 cancer pain program and other Sativex related U.S. market development activities that are chargeable to Otsuka under the terms of the 2007 Sativex U.S. development license (ii) costs incurred in carrying out our pre-clinical toxicology, pharmacology and bothin vitroandin vivo pre-clinical models in the fields of CNS disease and oncology, which were chargeable to our partner Otsuka under the terms of the research collaboration agreement until its conclusion on June 30, 2013 and (iii)(ii) costs that we incur in providing support to the regulatory and research activities of our other Sativex development partners, which are recoverable under the terms of our agreements.
ManagementSales, general and administrative expenses
ManagementSales, general and administrative expenses consist primarily of salaries and benefits related to our executive, finance, commercial, business development and support functions. Other managementsales, general and administrative expenses include costs associated with managing our commercial activities and the costs of compliance with the day-to-day requirements of being a listed public company in both the United Kingdom and the United States, including insurance, general administration overhead, legal and professional fees, audit fees and fees for taxation services.
We expect that managementsales, general and administrative expenses will increase in the future as we expand our operating activities.activities and start to build our commercial team in preparation for commercialization of Epidiolex.
Net foreign exchange gains/losses
Net foreign exchange gains/losses consist primarily of gains or losses recorded on our foreign currency cash and cash equivalents translated to Pounds Sterling at the balance sheet date.
Interest expense and other income
Interest expense consists primarily of interest expense incurred on twothree finance leases. One lease was settled in the year ended September 30, 2015, and the remaining leases whichwill expire in 20182027 and 2027,2031, respectively. One of these leases commenced in the year ended September 30, 2016.
InterestOther income consists primarily of interest earned by investing our cash reserves in short-term interest-bearing deposit accounts.accounts and an ‘above the line’ credit associated with the United Kingdom large company R&D tax credit scheme.
| 71 |
Taxation
As a U.K. resident trading company, we are predominantly subject to U.K. corporate taxation. Our tax recognized represents the sum of the tax currently payable or recoverable, and deferred tax. Deferred tax liabilities are generally recognized for all taxable temporary differences and deferred tax assets are recognized only to the extent that it is probable that taxable profits will be available against which deductible temporary differences can be utilized.
As a company that carries out extensive research and development activities, we benefit from the U.K. research and development tax credit regime for small and medium sized companies, whereby our principal research subsidiary company, GW Research Ltd.,Limited, is able to surrender a portion of trading losses that arise from its research and development activities for a refundable credit of up to 32.6%33.35% of eligible research and development expenditures. Qualifying expenditures largely comprise employment costs for research staff, consumables and certain internal overhead costs incurred as part of research projects. Subcontracted research expenditures are eligible for a cash rebate of up to 21.2%21.68%. The majority of our pipeline research, clinical trials management and the Epidiolex and Sativex chemistry and manufacturing controls development activities, all of which are being carried out by GW Research Ltd.,Limited, are eligible for inclusion within these tax credit claims.
The Sativex Phase 3 cancer pain clinical trials program, which is fully funded by Otsuka, and certain other Sativex safety studies are being carried out by GW Pharma Ltd.,Limited, our principal commercial trading subsidiary. As GW Pharma Ltd.Limited is currently profitable, it is currently unable to surrender trading losses to seek a research and development tax credit.
We may also benefit from the U.K.’s “patent box” regime in the future. This would allow certain profits attributable to revenues from patented products to be taxed at a lower rate than other revenue that over time will be reduced to 10%. As we have many different patents covering our products, we expect that future upfront fees, milestone fees, product revenues and royalties could be taxed at this favorably low tax rate. When taken in combination with the enhanced relief available on our research and development expenditure, this could result in a long-term low rate of corporation tax. As such, we consider that the U.K. is a favorable location for us to continue to conduct our business for the long-term.
Our U.S. subsidiary, Greenwich Biosciences Inc. (formerly GW Pharmaceuticals Inc.), is currently profitable and incurs a U.S. tax liability on taxable profits earned in the United States.
Critical Judgments in Applying our Accounting Policies
In the application of our accounting policies, we are required to make judgments, estimates and assumptions about the carrying amounts of assets and liabilities that are not readily apparent from other sources. The estimates and associated assumptions are based on historical experience and other factors that are considered to be relevant. Actual results may differ from these estimates.
Our estimates and assumptions are reviewed on an ongoing basis. Revisions to accounting estimates are recognized in the period in which the estimate is revised if the revision affects only that period or in the period of the revisions and future periods if the revision affects both current and future periods.
The following are our critical judgments, except those involving estimation uncertainty, that we have made in the process of applying our accounting policies and that have the most significant effect on the amounts recognized in our consolidated financial statements included elsewhere in this Annual Report.
Recognition of clinical trials expenses and liabilities
We recognize expenses incurred in carrying out clinical trials during the course of conduct of each clinical trial in line with the state of completion of each trial. This involves the calculation of clinical trial accruals at each period end to account for incurred expenses. This requires estimation of the expected full cost to complete the trial as well as the current stage of trial completion.
| 72 |
Clinical trials usually take place over extended time periods and typically involve a set-up phase, a recruitment phase and a completion phase which ends upon the receipt of a final report containing full statistical analysis of trial results. Accruals are prepared separately for each in-process clinical trial and take into consideration the stage of completion of each trial including the number of patients that have entered the trial, the number of patients that have completed treatment and whether we have received the final report. In all cases, the full cost of each trial is expensed by the time we have received the final report.
Revenue recognition
We recognize revenue from product sales, license fees, collaboration fees, technical access fees, development and approval milestone fees, research and development fees and royalties. Agreements with our commercial partners generally include a non-refundable upfront fee (attributed to separately identifiable components including license fees, collaboration fees and technical access fees), milestone payments the(the receipt of which is dependent upon the achievement of certain clinical, regulatory or commercial milestones,milestones), and royalties on product sales of licensed products if and when such product sales occur and revenue from the supply of products to our commercial partners. For these agreements, we are required to apply judgment in the allocation of total agreement consideration to the separately identifiable components on a reliable basis that reasonably reflects the selling prices that might be expected to be achieved in stand-alone transactions.
Product revenue received is based on a contractually agreed percentage of our commercial partner’s in-market net sales revenue. The commercial partner’s in-market net sales revenue is the price per vial charged to end customers, less set defined deductible overheads incurred in distributing the product. In developing estimates, we use monthly unit sales and in-market sales data received from commercial partners during the course of the year. For certain markets, where negotiations are ongoing with local reimbursement authorities, an estimated in-market sales price is used, which requires the application of judgement in assessing whether an estimated in-market sales price is reliably measurable. In our assessment, we consider, inter alia, identical products sold in similar markets and whether the agreed prices for those identical products support the estimated in-market sales price. In the event that we consider there to be significant uncertainty with regards to the in-market sales price to be charged by the commercial partner as a result of, as an example, ongoing pricing negotiations with local health authorities, such that it is not possible to reliably measure the amount of revenue that will flow to us, we would not recognize revenue until that uncertainty has been resolved.
We apply the percentage of completion revenue recognition method to certain classes of revenue. The application of this approach requires our judgment with regards to the total costs incurred and total estimated costs expected to be incurred over the length of the agreement.
Key Sources of Estimation Uncertainty
The key assumptions concerning the future, and other key sources of estimation uncertainty at the balance sheet date, that have a significant risk of causing a material adjustment to the carrying amounts of assets and liabilities within the next year are discussed below.
| 73 |
Provision for inventories
We maintain inventories which, based upon current sales levels and the current regulatory status of the product in each indication, are in excess of the amount that is expected to be utilized in the manufacture of finished product for future commercial sales. Provision is therefore made to reduce the carrying value of the excess inventories to their expected net realizable value.
Our provision for inventories, and adjustments thereto, are estimated based on evaluation of the status of the regulatory approval, projected sales volumes and growth rates. The timing and extent of future provision adjustments will be contingent upon the timing and extent of future regulatory approvals and post-approval in-market sales demand, which remain uncertain at this time.
Deferred taxation
Our policy is to recognize deferred tax assets only to the extent that it is probable that future taxable profits, feasible tax-planning strategies and deferred tax liabilities will be available against which the deferred tax assets can be utilized. At September 30, 2014,2016, we have accumulated tax losses of £34.3£102.8 million and other deductible temporary differences of £11.6£33.9 million, which are available to offset against future profits. If the value of these losses and other deductible temporary differences were recognized within the Group’s balance sheet at September 30, 2014,2016, the Group would be carrying a deferred tax asset of £9.2£23.2 million compared to £6.1£18.9 million at September 30, 2013.2015. Due to cumulative losses in recent years and uncertainties with respect to achieving certain future milestones, our ability to rely on estimated future taxable profits for purposes of recognizing deferred tax assets is limited to short term profit projections of Greenwich Biosciences Inc. (formerly GW Pharma Ltd.Pharmaceuticals Inc.), our U.S. subsidiary. We recognized a deferred tax asset of £0.3£3.9 million on our balance sheet at September 30, 2014.
Rebate provision2016, compared to £0.4 million at September 30, 2015.
We maintain a rebate provision for expected reimbursements to our commercial partners in circumstances in which actual net revenue per vial differs from the invoiced net revenue per vial as a consequence of, as an example, ongoing pricing negotiations with local health authorities.Research and Development Tax Credit
The amountGroup's research and development tax credit claim is complex and requires management to interpret and apply UK research and development tax legislation to the Group's specific circumstances and requires the use of our rebate provision is based on, among other things, monthly unit sales and in-market sales data received from commercial partners and represents our best estimatecertain assumptions in estimating the portion of current year research costs that are eligible for the rebate expected to be required to settle the present obligation at the end of the reporting period.
Pricing decisions made by local health authorities, including revisions and clarifications that have retroactive application, can result in changes to management’s estimates of the rebates reported in prior periods.
Aggregate rebate provision accruals at September 30, 2014 were £1.4 million.claim.
Segments
We operate through three reportable segments, Commercial, (formerly Sativex Commercial), Sativex Research and Development and Pipeline Research and Development.
Commercial.The Commercial segment (formerlydistributes and sells the Group’s commercial products. Currently Sativex Commercial) promotes Sativexis promoted through strategic collaborations with major pharmaceutical companies for the currently approved indication of spasticity due to MS. The commercial segment will include revenues from the direct marketing of other future approved commercial products. The Group has licensing agreements for the commercialization of Sativex with Almirall S.A. outside the United States in Europe (excluding the United Kingdom) and Mexico, Otsuka Pharmaceutical Co. Ltd. (“Otsuka”) in the United States, Novartis in Australia, New Zealand, Asia (excluding Japan, China and Hong Kong)U.S., the Middle East and Africa, Bayer HealthCare AG in the United Kingdom and Canada, Neopharm Group in Israel and Ipsen Biopharm Ltd. in Latin America (excluding Mexico and the Islands of the Caribbean). Commercial segment revenues include product sales, royalties, license, collaboration, and technical access fees, and development and approval milestone fees.
Sativex Research and Development.The Sativex Research and Development (“Sativex R&D”) segment seeks to maximize the potential of Sativex through the development of new indications. The current focus during the period for this segment iswas the Phase 3 clinical development program of Sativex for use in the treatment of cancer pain. The Group also believes that MS spasticity represents an attractive indication for the U.S. and we intend to pursue an additional clinical development program for this significant market opportunity. In addition, Sativex has shown promising efficacy in Phase 2 trials in other indications such as neuropathic pain, but these areas are not currently the subject of full development programs. Sativex Research and DevelopmentR&D segment revenues consist of research and development fees charged to Sativex licensees.
| 74 |
Pipeline Research and Development.The Pipeline Research and Development (“Pipeline R&D”) segment seeks to develop cannabinoid medications other than Sativex across a range of therapeutic areas using our proprietary cannabinoid technology platform. The Group’s product pipeline includes Epidiolex,Epidiolex®, in development as a treatment for Dravet syndrome, and Lennox-Gastaut syndrome, a second epilepsy product candidateTuberous Sclerosis and Infantile Spasms, as well as other product candidates in Phase 1 and Phase 2 clinical development for glioma, ulcerative colitis, type 2 diabetesadult epilepsy and schizophrenia. Pipeline Research and DevelopmentR&D segment revenues consist of research and development fees charged to Otsuka under the terms of our pipeline research collaboration agreement.
Results of Operations
Comparison of Years Ended September 30, 20142016 and 20132015
The following table summarizes the results of our operations for the years ended September 30, 20142016 and 2013,2015, together with the changes to those items.
| Year Ended September 30, | Change 2014 vs. 2013 | |||||||||||||||||||
| 2014 | 2014 | 2013 (1) | Increase/(Decrease) | |||||||||||||||||
| $ | £ | £ | £ | % | ||||||||||||||||
| (in thousands, except for percentages) | ||||||||||||||||||||
| Revenue | 48,730 | 30,045 | 27,295 | 2,750 | 10 | % | ||||||||||||||
| Cost of sales | (3,341 | ) | (2,060 | ) | (1,276 | ) | (784 | ) | (61 | )% | ||||||||||
| Research and development expenditure | (70,512 | ) | (43,475 | ) | (32,697 | ) | (10,778 | ) | (33 | )% | ||||||||||
| Management and administrative expenses | (11,899 | ) | (7,337 | ) | (3,555 | ) | (3,782 | ) | (106 | )% | ||||||||||
| Net foreign exchange gains/(losses) | 5,170 | 3,188 | (237 | ) | 3,425 | 1445 | % | |||||||||||||
| Operating (loss)/profit | (31,852 | ) | (19,639 | ) | (10,470 | ) | (9,169 | ) | (88 | )% | ||||||||||
| Interest expense | (99 | ) | (61 | ) | (64 | ) | 3 | 5 | % | |||||||||||
| Interest income | 210 | 130 | 178 | (48 | ) | (27 | )% | |||||||||||||
| (Loss)/profit before tax | (31,741 | ) | (19,570 | ) | (10,356 | ) | (9,214 | ) | (89 | )% | ||||||||||
| Tax | 7,965 | 4,911 | 5,807 | (896 | ) | (15 | )% | |||||||||||||
| (Loss)/profit for the year | (23,776 | ) | (14,659 | ) | (4,549 | ) | (10,110 | ) | (222 | )% | ||||||||||
| Year Ended September 30, | Change 2016 vs. 2015 | |||||||||||||||||||
| 2016 | 2016 | 2015 | Increase/(Decrease) | |||||||||||||||||
| $ | £ | £ | £ | % | ||||||||||||||||
| (in thousands, except for percentages) | ||||||||||||||||||||
| Revenue | 13,320 | 10,315 | 28,540 | (18,225 | ) | (64 | )% | |||||||||||||
| Cost of sales | (3,511 | ) | (2,719 | ) | (2,618 | ) | (101 | ) | 4 | % | ||||||||||
| Research and development expenditure | (128,889 | ) | (99,815 | ) | (76,785 | ) | (23,030 | ) | 30 | % | ||||||||||
| Sales, general and administrative expenses | (25,747 | ) | (19,939 | ) | (12,569 | ) | (7,370 | ) | 59 | % | ||||||||||
| Net foreign exchange gains | 32,993 | 25,551 | 6,202 | 19,349 | 312 | % | ||||||||||||||
| Operating loss | (111,834 | ) | (86,607 | ) | (57,230 | ) | (29,377 | ) | 51 | % | ||||||||||
| Interest expense | (223 | ) | (173 | ) | (75 | ) | (98 | ) | 131 | % | ||||||||||
| Other income | 785 | 608 | 244 | 364 | 149 | % | ||||||||||||||
| Loss before tax | (111,272 | ) | (86,172 | ) | (57,061 | ) | (29,111 | ) | 51 | % | ||||||||||
| Tax benefit | 29,073 | 22,515 | 12,498 | 10,017 | 80 | % | ||||||||||||||
| Loss for the year | (82,199 | ) | (63,657 | ) | (44,563 | ) | (19,094 | ) | 43 | % | ||||||||||
Revenue
The following table summarizes our revenue for the years ended September 30, 20142016 and 2013,2015, together with the changes to those items.
| Year Ended September 30, | Change 2014 vs. 2013 | Year Ended September 30, | Change 2016 vs. 2015 | |||||||||||||||||||||||||||||||||||||
| 2014 | 2014 | 2013 | Increase/ (Decrease) | 2016 | 2016 | 2015 | Increase/ (Decrease) | |||||||||||||||||||||||||||||||||
| $ | £ | £ | £ | % | $ | £ | £ | £ | % | |||||||||||||||||||||||||||||||
| (in thousands, except for percentages) | (in thousands, except for percentages) | |||||||||||||||||||||||||||||||||||||||
| Product sales | 7,107 | 4,382 | 2,157 | 2,225 | 103 | % | 6,725 | 5,208 | 4,255 | 953 | 22 | % | ||||||||||||||||||||||||||||
| Research and development fees | 39,388 | 24,285 | 23,594 | 691 | 3 | % | 4,955 | 3,837 | 22,810 | (18,973 | ) | (83 | )% | |||||||||||||||||||||||||||
| License, collaboration and technical access fees | 2,235 | 1,378 | 1,294 | 84 | 6 | % | 1,513 | 1,172 | 1,287 | (115 | ) | (9 | )% | |||||||||||||||||||||||||||
| Development and approval milestone fees | - | - | 250 | (250 | ) | (100 | )% | 127 | 98 | 188 | (90 | ) | (48 | )% | ||||||||||||||||||||||||||
| Total revenue | 48,730 | 30,045 | 27,295 | 2,750 | 10 | % | 13,320 | 10,315 | 28,540 | (18,225 | ) | (64 | )% | |||||||||||||||||||||||||||
| 75 |
Total revenue increased by 10%for the year ended September 30, 2016 was £10.3 million, compared to £30.0£28.5 million for the year ended September 30, 2014, compared2015. The decrease of £18.2 million comprises:
Sativex product sales revenue increased by £2.2 million, or 103%, to £4.4 million for the year ended September 30, 2014 compared to £2.2 million for the year ended September 30, 2013. This increase was primarily due to the combined effects of a 65% increase in the sales volumes of Sativex shipped to partners, primarily in Italy and Germany, and the inclusion in the year ended September 30, 2013 of a £1.1 million rebate provision for amounts expected to be paid to Almirall following an adverse German pricing decision in March 2013, which was effective for all sales recognized from March 2012.
Research and development fees increased by £0.7 million, or 3%, to £24.3 million for the year ended September 30, 2014 compared to £23.6 million for the year ended September 30, 2013. This increase was due to increased partner-funded research and development, linked to the Otsuka-funded Phase 3 cancer pain clinical program.
License, collaboration and technical access fees increased by £0.1 million, or 6%, to £1.4 million for the year ended September 30, 20142016 compared to £1.3 million for the year ended September 30, 2013.2015. This increase wasdecrease is due to the recognition period of certain signature fees recorded from Ipsen pursuanthaving come to an end in the Ipsen Sativex distribution agreement which was signedprior year.
Developmentdevelopment and approval milestones as a result of having earned one milestone fees decreased by £0.3 million, or 100%, to £nilfrom our parter Ipsen for the year ended September 30, 20142016, compared to £0.3 millionthe receipt of two milestones for the year ended September 30, 2013. Development and approval milestone fees consist2015.
Cost of milestone payments due to us from Sativex partners under the terms of our agreements. Development and approval milestone payments of £0.3 million during the year ended September 30, 2013 resulted from a single milestone payment received from Almirall upon agreement of Italian pricing and reimbursement approval for Sativex. We had no such payment during the year ended September 30, 2014.sales
Cost of sales
Cost of sales increased by £0.8 million, or 61%, to £2.1 million for the year ended September 30, 20142016 of £2.7 million represents an increase of £0.1 million compared to £1.3the £2.6 million forrecorded in the year ended September 30, 2013.2015. This increase was due to a 65% increaseprimarily reflects the growth in the volume of Sativex vialsinventory shipped to commercial partners duringin the year ended September 30, 2014 compared to the year ended September 30, 2013. Costs of sales per unit shipped remained consistent across periods.2016.
Research and development expenditure
The following table summarizes our research and development expenditure for the years ended September 30, 20142016 and 2013,2015, together with the changes to those items.
| Year Ended September 30, | Change 2014 vs. 2013 | Year Ended September 30, | Change 2016 vs. 2015 | |||||||||||||||||||||||||||||||||||||
| 2014 | 2014 | 2013 | Increase/ (Decrease) | 2016 | 2016 | 2015 | Increase/ (Decrease) | |||||||||||||||||||||||||||||||||
| $ | £ | £ | £ | % | $ | £ | £ | £ | % | |||||||||||||||||||||||||||||||
| (in thousands, except for percentages) | (in thousands, except for percentages) | |||||||||||||||||||||||||||||||||||||||
| GW-funded research and development | 31,124 | 19,190 | 9,103 | 10,087 | 111 | % | 123,935 | 95,978 | 53,975 | 42,003 | 78 | % | ||||||||||||||||||||||||||||
| Development partner-funded research and development | 39,388 | 24,285 | 23,594 | 691 | 3 | % | 4,954 | 3,837 | 22,810 | (18,973 | ) | (83 | )% | |||||||||||||||||||||||||||
| Total research and development expenditure | 70,512 | 43,475 | 32,697 | 10,778 | 33 | % | 128,889 | 99,815 | 76,785 | 23,030 | 30 | % | ||||||||||||||||||||||||||||
Total research and development expenditure for the year ended September 30, 2016 of £99.8 million increased by £10.8£23.0 million or 33%,compared to £43.5the £76.8 million incurred in the year ended September 30, 2015.
| 76 |
GW-funded research and development expenditure increased by £42.0 million to £96.0 million for the year ended September 30, 2014,2016 from £32.7£54.0 million for the year ended September 30, 2013. As shown in the table above, research and development expenditure consists of two elements, GW- funded research and development expenditure and development partner-funded research and development expenditure.
2015. The £10.1 million increase in GW-funded research and development expenditure wasis due principally to:
We track all research and development expenditures against detailed budgets but do not seek to allocate and monitor all research and development costs by individual project. As noted in the segmental analysis below, we do analyze GW-funded research and development into Sativex related expenditures and pipeline related expenditures. External third-party costs of running clinical trials totaling £2.6£28.1 million for the year ended September 30, 20142016 and £1.4£13.4 million for the year ended September 30, 20132015 were tracked by individual project while the remaining £16.5£67.9 million for the year ended September 30, 20142016 and £7.7£40.6 million for the year ended September 30, 20132015 consisting largely of internal overhead costs were not allocated to individual projects. We believe that our existing liquidity is sufficient to complete our currently ongoing GW-funded research and development projects.
Development partner-funded research and development projects are funded in advance by our development partners, which involves the receipt of advanced funds every three months, sufficient to cover projected expenditure for the next three months. For further information on the risks our research and development program face, see “Risk Factors—Risks Related to Development and Regulatory Approval of Sativex and Our Product Candidates.”
Development partner-funded research and development expenditure was made up of two principal elements, as follows:
| Year Ended September 30, | Change 2014 vs. 2013 | Year Ended September 30, | Change 2016 vs. 2015 | |||||||||||||||||||||||||||||||||||||
| 2014 | 2014 | 2013 | Increase/ (Decrease) | 2016 | 2016 | 2015 | Increase/ (Decrease) | |||||||||||||||||||||||||||||||||
| $ | £ | £ | £ | % | $ | £ | £ | £ | % | |||||||||||||||||||||||||||||||
| (in thousands, except for percentages) | (in thousands, except for percentages) | |||||||||||||||||||||||||||||||||||||||
| Sativex U.S. development program | 38,306 | 23,618 | 19,333 | 4,285 | 22 | % | 4,519 | 3,500 | 22,275 | (18,775 | ) | (84 | )% | |||||||||||||||||||||||||||
| Otsuka research collaboration expenses | 1,082 | 667 | 4,261 | (3,594 | ) | (84 | )% | 435 | 337 | 535 | (198 | ) | (37 | )% | ||||||||||||||||||||||||||
| Total development partner-funded research and development | 38,388 | 24,285 | 23,594 | 691 | 3 | % | 4,954 | 3,837 | 22,810 | (18,973 | ) | (83 | )% | |||||||||||||||||||||||||||
Sativex U.S. development expenses increaseddecreased by £4.3£18.8 million, or 22%84%, to £23.6£3.5 million during the year ended September 30, 20142016 as compared to £22.3 million for the year ended September 30, 2013.2015. This reflects increased patient recruitment intodecreased expenditure following the completion of the three Sativex Phase 3 cancer pain trials and set-up costs for a Sativex Phase 3 MS trial .trials.
Otsuka research collaboration expenses decreased by £3.6£0.2 million, or 84%37%, to £0.7£0.3 million during the year ended September 30, 20142016 as compared to £4.3£0.5 million for the year ended September 30, 2013.2015. The decrease reflects the fact that the Otsuka research collaboration term ended on June 30, 2013. Most2013 and the remaining revenue relates to income recognized to offset the depreciation expense of property, plant and equipment purchased under the pre-clinical programs that Otsuka was fundingcollaboration agreement, which are now proceeding into Phase 1/2 clinical trials as part of the GW-funded clinical programs.all fully depreciated.
| 77 |
ManagementSales, general and administrative expenses
ManagementSales, general and administrative expenses for the year ended September 30, 2016 of £19.9 million increased by £3.7£7.3 million compared to the £12.6 million incurred in the year ended September 30, 2015. This net increase is due to:
Net foreign exchange gains
Net foreign exchange gains increased by £19.4 million, or 106%312%, to £7.3£25.6 million for the year ended September 30, 20142016 compared to £3.6£6.2 million for the year ended September 30, 2013. The increase reflects a £3.0 million increase in respect of employee-related expenses, a £0.5 million increase in respect of additional accountancy, audit and investor relations costs arising from our listing and related regulatory compliance, and a £0.2 million increase in respect of property and increased travel costs for our U.S. operations.
Net foreign exchange gains/losses
Net foreign exchange gains/losses increased by £3.4 million, or 1445%, to a gain of £3.2 million for the year ended September 30, 2014 compared to a loss of £0.2 million for the year ended September 30, 2013.2015. This represents foreign exchange gains, due to an unrealized gaingains on our U.S.-dollarU.S. dollar denominated cash deposits at the closing balance sheet exchange rate.
Interest expense
Interest expense of £0.1£0.2 million for the year ended September 30, 2014 was consistent with2016 increased by £0.1 million, or 131%, compared to the £0.1 million recorded for the year ended September 30, 2013.2015. This increase reflects an increase in interest paid on leases for manufacturing facilities.
Other income
InterestOther income
Interest income decreased increased by £0.1£0.4 million, or 27%149%, to £0.1£0.6 million for the year ended September 30, 20142016 compared to £0.2 million for the year ended September 30, 2013.2015. The increase reflects the increase in the Group’s cash and cash equivalents balance and additional tax credit recognized in the UK.
Tax
Our tax benefit decreasedincreased by £0.9£10.0 million, or 15%80%, to £4.9£22.5 million for the year ended September 30, 20142016 compared to £5.8£12.5 million for the year ended September 30, 2013.2015. This benefit consists of:
Research and development tax credits recognized vary depending on our available tax losses, the eligibility of our research and development expenditure and the level of certainty relating to the recoverability of the claim.
Segmental review
Commercial segment
The following table summarizes the results of our operations for our Commercial segment (formerly Sativex Commercial) for the years ended September 30, 20142016 and 2013,2015, together with the changes to those items.
| Year Ended September 30, | Change 2014 vs. 2013 | |||||||||||||||||||
| 2014 | 2014 | 2013 | Increase/ Decrease | |||||||||||||||||
| $ | £ | £ | £ | % | ||||||||||||||||
| (in thousands, except for percentages) | ||||||||||||||||||||
| Product sales | 7,107 | 4,382 | 2,157 | 2,225 | 103 | % | ||||||||||||||
| License, collaboration and technical access fees | 2,235 | 1,378 | 1,294 | 84 | 6 | % | ||||||||||||||
| Development and approval milestone fees | - | - | 250 | (250 | ) | (100 | )% | |||||||||||||
| Total revenue | 9,342 | 5,760 | 3,701 | 2,059 | 56 | % | ||||||||||||||
| Cost of sales | (3,341 | ) | (2,060 | ) | (1,276 | ) | (784 | ) | (61 | )% | ||||||||||
| Research and development credit | 1,374 | 847 | 597 | 250 | (42 | )% | ||||||||||||||
| Segmental result | 7,375 | 4,547 | 3,022 | 1,525 | 50 | % | ||||||||||||||
| 78 |
| Year Ended September 30, | Change 2016 vs. 2015 | |||||||||||||||||||
| 2016 | 2016 | 2015 | Increase/ Decrease | |||||||||||||||||
| $ | £ | £ | £ | % | ||||||||||||||||
| (in thousands, except for percentages) | ||||||||||||||||||||
| Product sales | 6,725 | 5,208 | 4,255 | 953 | 22 | % | ||||||||||||||
| License, collaboration and technical access fees | 1,513 | 1,172 | 1,287 | (115 | ) | (9 | )% | |||||||||||||
| Development and approval milestone fees | 127 | 98 | 188 | (90 | ) | (48 | )% | |||||||||||||
| Total revenue | 8,365 | 6,478 | 5,730 | 748 | 13 | % | ||||||||||||||
| Cost of sales | (3,511 | ) | (2,719 | ) | (2,618 | ) | (101 | ) | 4 | % | ||||||||||
| Segmental result | 4,854 | 3,759 | 3,112 | 647 | 21 | % | ||||||||||||||
We classify all revenue from Sativex collaboration partners, with the exception of research and development fees, as Commercial segment revenue. The principal variances in these revenue streams are summarized in the table above. An explanation of the principal movements in the revenue streams is provided in the revenue section above.
Cost of sales for the year ended September 30, 2016 of £2.7 million represents an increase of £0.1 million compared to the £2.6 million recorded in the year ended September 30, 2015. This increase reflects the growth in the volume of Sativex vials shipped to commercial partners in the year ended September 30, 2016.
Sativex Research and Development segment
The following table summarizes the results of our operations for our Sativex R&D segment for the years ended September 30, 2016 and 2015, together with the changes to those items.
| Year Ended September 30, | Change 2016 vs. 2015 | |||||||||||||||||||
| 2016 | 2016 | 2015 | Increase/ (Decrease) | |||||||||||||||||
| $ | £ | £ | £ | % | ||||||||||||||||
| (in thousands, except for percentages) | ||||||||||||||||||||
| Research and development fees | 4,519 | 3,500 | 22,275 | (18,775 | ) | (84 | )% | |||||||||||||
| Research and development expenditure: | ||||||||||||||||||||
| GW-funded research and development | (807 | ) | (625 | ) | (4,123 | ) | 3,498 | (85 | )% | |||||||||||
| Development partner-funded research and development | (4,519 | ) | (3,500 | ) | (22,275 | ) | 18,775 | (84 | )% | |||||||||||
| Total research and development expenditure | (5,326 | ) | (4,125 | ) | (26,398 | ) | 22,273 | (84 | )% | |||||||||||
| Segmental result | (807 | ) | (625 | ) | (4,123 | ) | 3,498 | (85 | )% | |||||||||||
Total research and development expenditure related to Sativex of £4.1 million for the year ended September 30, 2016 decreased by £22.3 million, or 84%, compared with the £26.4 million recorded for the year ended September 30, 2015. This decrease reflects the conclusion and close out of the Sativex Phase 3 cancer pain clinical trials.
| 79 |
As all of the development partner-funded research and development expenditure is reimbursed to us under the terms of our license agreements, the net result for this segment equals the GW-funded research and development expenditure on Sativex related projects.
Pipeline Research and Development segment
The following table summarizes the results of our operations for our Pipeline R&D segment for the years ended September 30, 2016 and 2015, together with the changes to those items.
Year Ended September 30, | Change 2016 vs. 2015 | |||||||||||||||||||
| 2016 | 2016 | 2015 | Increase/ (Decrease) | |||||||||||||||||
| $ | £ | £ | £ | % | ||||||||||||||||
| (in thousands, except for percentages) | ||||||||||||||||||||
| Research and development fees | 435 | 337 | 535 | (198 | ) | (37 | )% | |||||||||||||
| Research and development expenditure | ||||||||||||||||||||
| GW-funded research and development | (117,809 | ) | (91,234 | ) | (48,327 | ) | (42,907 | ) | 89 | % | ||||||||||
| Development partner-funded research and development | (435 | ) | (337 | ) | (535 | ) | 198 | (37 | )% | |||||||||||
| Total research and development expenditure | (118,244 | ) | (91,571 | ) | (48,862 | ) | (42,709 | ) | 87 | % | ||||||||||
| Segmental result | (117,809 | ) | (91,234 | ) | (48,327 | ) | (42,907 | ) | 89 | % | ||||||||||
GW-funded pipeline research and development expenditure increased by £42.7 million, or 87%, to £91.6 million for the year ended September 30, 2016 as compared to £48.9 million for the year ended September 30, 2015. This reflects the impact of carrying out GW-funded clinical trials and research and development, including the costs associated with GW’s ongoing Phase 3 Dravet syndrome and Tuberous Sclerosis studies, plus the costs of the completed Phase 3 Dravet and Lennox-Gastaut syndrome Epidiolex studies, preclinical and scale up work associated with our epilepsy program. Additionally, we have various pipeline activities including cannabidivarin, or CBDV, which is in Phase 2 development in the field of epilepsy and is also being researched within the field of autism spectrum disorders, or ASD.
Pipeline research and development fees are equal to the development partner-funded research and development expenditure incurred by us in conducting our joint pipeline research program and recharged to Otsuka under the terms of our 2007 research collaboration agreement. The 20% year-on-year decrease in pipeline research and development fees reflects the ending, effective June 30, 2013, of our pre-clinical research collaboration with Otsuka in the field of CNS disorders and unwinding of remaining revenue associated with this collaboration. GW has a worldwide license to all data and product candidates generated under the collaboration.
As the development partner-funded research and development expenditure was fully offset by the associated research and development fees, the segmental result equals the GW-funded pipeline research and development expenditure.
Comparison of Years Ended September 30, 2015 and 2014
The following table summarizes the results of our operations for the years ended September 30, 2015 and 2014, together with the changes to those items.
| Year Ended September 30, | Change 2015 vs. 2014 | |||||||||||||||||||
| 2015 | 2015 | 2014 | Increase/(Decrease) | |||||||||||||||||
| $ | £ | £ | £ | % | ||||||||||||||||
| (in thousands, except for percentages) | ||||||||||||||||||||
| Revenue | 43,172 | 28,540 | 30,045 | (1,505 | ) | (5 | )% | |||||||||||||
| Cost of sales | (3,960 | ) | (2,618 | ) | (2,060 | ) | (558 | ) | 27 | % | ||||||||||
| Research and development expenditure | (116,153 | ) | (76,785 | ) | (43,475 | ) | (33,310 | ) | (77 | )% | ||||||||||
| Sales, general and administrative expenses | (19,013 | ) | (12,569 | ) | (7,337 | ) | (5,232 | ) | (71 | )% | ||||||||||
| Net foreign exchange gains | 9,382 | 6,202 | 3,188 | 3,014 | 95 | % | ||||||||||||||
| Operating loss | (86,572 | ) | (57,230 | ) | (19,639 | ) | (37,591 | ) | (191 | )% | ||||||||||
| Interest expense | (113 | ) | (75 | ) | (61 | ) | (14 | ) | (23 | )% | ||||||||||
| Other income | 369 | 244 | 130 | 114 | 88 | % | ||||||||||||||
| Loss before tax | (86,316 | ) | (57,061 | ) | (19,570 | ) | (37,491 | ) | (192 | )% | ||||||||||
| Tax benefit | 18,906 | 12,498 | 4,911 | 7,587 | 154 | % | ||||||||||||||
| Loss for the year | (67,410 | ) | (44,563 | ) | (14,659 | ) | (29,904 | ) | (204 | )% | ||||||||||
| 80 |
Revenue
The following table summarizes our revenue for the years ended September 30, 2015 and 2014, together with the changes to those items.
| Year Ended September 30, | Change 2015 vs. 2014 | |||||||||||||||||||
| 2015 | 2015 | 2014 | Increase/ (Decrease) | |||||||||||||||||
| $ | £ | £ | £ | % | ||||||||||||||||
| (in thousands, except for percentages) | ||||||||||||||||||||
| Product sales | 6,437 | 4,255 | 4,382 | (127 | ) | (3 | )% | |||||||||||||
| Research and development fees | 34,504 | 22,810 | 24,285 | (1,475 | ) | (6 | )% | |||||||||||||
| License, collaboration and technical access fees | 1,947 | 1,287 | 1,378 | (91 | ) | (7 | )% | |||||||||||||
| Development and approval milestone fees | 284 | 188 | - | 188 | - | |||||||||||||||
| Total revenue | 43,172 | 28,540 | 30,045 | (1,505 | ) | (5 | )% | |||||||||||||
| 81 |
Total revenue decreased by 5% to £28.5 million for the year ended September 30, 2015, compared to £30.0 million for the year ended September 30, 2014. This decrease was driven by a variety of factors, as explained below.
Sativex product sales revenue decreased by £0.1 million, or 3%, to £4.3 million for the year ended September 30, 2015 compared to £4.4 million for the year ended September 30, 2014. This decrease was primarily due to inclusion in the year ended September 30, 2015 of a £0.2 million rebate provision for amounts expected to be paid to Almirall following the decision of the Italian Medicines Agency to impose a maximum budget for Sativex sales in Italy for 2013 and 2014.
Research and development fees decreased by £1.5 million, or 6%, to £22.8 million for the year ended September 30, 2015 compared to £24.3 million for the year ended September 30, 2014. This decrease was due to decreased research and development costs, linked to the Otsuka-funded Phase 3 cancer pain clinical program.
License, collaboration and technical access fees decreased by £0.1 million, or 7%, to £1.3 million for the year ended September 30, 2015 compared to £1.4 million for the year ended September 30, 2014. This decrease was due to the completion of the recognition of a Novartis cancer pain technical access fee during 2015.
Development and approval milestone fees increased by £0.2 million, to £0.2 million for the year ended September 30, 2015 compared to £nil for the year ended September 30, 2014. Development and approval milestone fees consist of milestone payments due to us from Sativex partners under the terms of our agreements. Development and approval milestone payments of £0.2 million during the year ended September 30, 2015 resulted from two milestone payments received from Ipsen upon submission of regulatory dossiers in two South American territories for Sativex. We had no such payment during the year ended September 30, 2014.
Cost of sales
Cost of sales increased by £0.5 million, or 27%, to £2.6 million for the year ended September 30, 2015 compared to £2.1 million for the year ended September 30, 2014. This increase was due to a 22% increase in the volume of Sativex vials shipped to partners during the year ended September 30, 2015 compared to the year ended September 30, 2014. Costs of sales per unit shipped remained consistent across periods.
Research and development expenditure
The following table summarizes our research and development expenditure for the years ended September 30, 2015 and 2014, together with the changes to those items.
| Year Ended September 30, | Change 2015 vs. 2014 | |||||||||||||||||||
| 2015 | 2015 | 2014 | Increase/ (Decrease) | |||||||||||||||||
| $ | £ | £ | £ | % | ||||||||||||||||
| (in thousands, except for percentages) | ||||||||||||||||||||
| GW-funded research and development | 81,649 | 53,975 | 19,190 | 34,785 | 181 | % | ||||||||||||||
| Development partner-funded research and development | 34,504 | 22,810 | 24,285 | (1,475 | ) | (6 | )% | |||||||||||||
| Total research and development expenditure | 116,153 | 76,785 | 43,475 | 33,310 | 77 | % | ||||||||||||||
Total research and development expenditure increased by £33.3 million, or 77%, to £76.8 million for the year ended September 30, 2015, from £43.5 million for year ended September 30, 2014. As shown in the table above, research and development expenditure consists of two elements, GW-funded research and development expenditure and development partner-funded research and development expenditure.
| 82 |
The £34.8 million increase in GW-funded research and development expenditure was due principally to:
We track all research and development expenditures against detailed budgets but do not seek to allocate and monitor all research and development costs by individual project. As noted in the segmental analysis below, we do analyze GW-funded research and development into Sativex related expenditures and pipeline related expenditures. External third-party costs of running clinical trials totaling £13.4 million for the year ended September 30, 2015 and £2.6 million for the year ended September 30, 2014 were tracked by individual project while the remaining £40.6 million for the year ended September 30, 2015 and £16.5 million for the year ended September 30, 2014 consisting largely of internal overhead costs were not allocated to individual projects. We believe that our existing liquidity is sufficient to complete our currently ongoing GW-funded research and development projects.
Development partner-funded research and development projects are funded in advance by our development partners, which involves the receipt of advanced funds every three months, sufficient to cover projected expenditure for the next three months. For further information on the risks our research and development program face, see “Risk Factors—Risks Related to Development and Regulatory Approval of Sativex and Our Product Candidates.”
Development partner-funded research and development expenditure was made up of two principal elements, as follows:
| Year Ended September 30, | Change 2015 vs. 2014 | |||||||||||||||||||
| 2015 | 2015 | 2014 | Increase/ (Decrease) | |||||||||||||||||
| $ | £ | £ | £ | % | ||||||||||||||||
| (in thousands, except for percentages) | ||||||||||||||||||||
| Sativex U.S. development program | 33,695 | 22,275 | 23,618 | (1,343 | ) | (6 | )% | |||||||||||||
| Otsuka research collaboration expenses | 809 | 535 | 667 | (132 | ) | (20 | )% | |||||||||||||
| Total development partner-funded research and development | 34,504 | 22,810 | 24,285 | (1,475 | ) | (6 | )% | |||||||||||||
Sativex U.S. development expenses decreased by £1.3 million, or 6%, to £22.3 million during the year ended September 30, 2015 as compared to £23.6 million for the year ended September 30, 2014. This reflects decreased expenditure following the completion of the three Sativex Phase 3 cancer pain trials.
Otsuka research collaboration expenses decreased by £0.2 million, or 20%, to £0.5 million during the year ended September 30, 2015 as compared to £0.7 million for the year ended September 30, 2014. The decrease reflects the fact that the Otsuka research collaboration term ended on June 30, 2013 and the remaining revenue relates to income recognized to offset the depreciation expense of property, plant and equipment purchased under the collaboration agreement, which will shortly all be fully depreciated. Most of the pre-clinical programs that Otsuka was funding are now proceeding into Phase 1/2 clinical trials as part of the GW-funded clinical programs.
| 83 |
Sales, general and administrative expenses (formerly management and administrative expenses)
Sales, general and administrative expenses (formerly Management and administrative expenses) increased by £5.3 million, or 71%, to £12.6 million for the year ended September 30, 2015 compared to £7.3 million for the year ended September 30, 2014. The increase reflects a £4.4 million increase in respect of pre-launch commercialization costs in the U.S., £0.8 million increase in respect of property and travel costs, primarily to the U.S. by staff involved in the establishment of U.S. based operations, £0.7 million increase in respect of increased accountancy, audit and investor relation costs arising from GW's U.S. listing and Sarbanes-Oxley compliance, £0.6 million decrease in respect of employee-related expenses, comprising a £2.0 million decrease in the charge in respect of the provision for payroll taxes on unrealized staff share option gains; and offset by a £1.4 million increase in payroll costs driven by increased headcount.
Net foreign exchange gains
Net foreign exchange gains increased by £3.0 million, or 61%95%, to £6.2 million for the year ended September 30, 2015 compared to £3.2 million for the year ended September 30, 2014. This represents foreign exchange gains, due to unrealized gains on our U.S.-dollar denominated cash deposits at the closing balance sheet exchange rate.
Interest expense
Interest expense of £0.1 million for the year ended September 30, 2015 was consistent with the £0.1 million recorded for the year ended September 30, 2014.
Other income
Other income increased by £0.1 million, or 88%, to £0.2 million for the year ended September 30, 2015 compared to £0.1 million for the year ended September 30, 2014. The increase reflects the increase in interest earned on the Group’s cash and cash equivalents balance.
Tax
Our tax benefit increased by £7.6 million, or 154%, to £12.5 million for the year ended September 30, 2015 compared to £4.9 million for the year ended September 30, 2014. This benefit consists of:
Research and development tax credits recognized vary depending on our available tax losses, the eligibility of our research and development expenditure and the level of certainty relating to the recoverability of the claim.
Segmental review
Commercial segment
The following table summarizes the results of our operations for our Commercial segment for the years ended September 30, 2015 and 2014, together with the changes to those items.
| 84 |
| Year Ended September 30, | Change 2015 vs. 2014 | |||||||||||||||||||
| 2015 | 2015 | 2014 | Increase/ Decrease | |||||||||||||||||
| $ | £ | £ | £ | % | ||||||||||||||||
| (in thousands, except for percentages) | ||||||||||||||||||||
| Product sales | 6,437 | 4,255 | 4,382 | (127 | ) | (3 | )% | |||||||||||||
| License, collaboration and technical access fees | 1,947 | 1,287 | 1,378 | (91 | ) | (7 | )% | |||||||||||||
| Development and approval milestone fees | 284 | 188 | - | 188 | - | |||||||||||||||
| Total revenue | 8,668 | 5,730 | 5,760 | (30 | ) | (1 | )% | |||||||||||||
| Cost of sales | (3,960 | ) | (2,618 | ) | (2,060 | ) | (558 | ) | (27 | )% | ||||||||||
| Research and development credit | - | - | 847 | (847 | ) | (100 | )% | |||||||||||||
| Segmental result | 4,708 | 3,112 | 4,547 | (1,435 | ) | (32 | )% | |||||||||||||
We classify all revenue from Sativex collaboration partners, with the exception of research and development fees, as Commercial segment revenue. The principal variances in these revenue streams are summarized in the table above. An explanation of the principal movements in the revenue streams is provided in the revenue section above.
Cost of sales increased by £0.5 million, or 27%, to £2.6 million for the year ended September 30, 2015 compared to £2.1 million for the year ended September 30, 2014 compared to £1.3 million for the year ended September 30, 2013 driven by a 65%22% year‒on‒year increase in the volume of Sativex vials shipped to partners as previously discussed.
For the Commercial segment, the research and development credit represents the movement in the provision against inventories manufactured prior to the regulatory approval of Sativex (such inventories were capitalized as an asset but provided for, with the charge recognized in the research and development expenditure line, until there was a high probability of regulatory approval). When we determined that there was a high probability of regulatory approval of Sativex, the provision was revised to adjust the carrying value of Sativex inventories to the expected net realizable value, which may not exceed original cost. The provision for inventories release of £nil for the year ended September 30, 2015 was lower than the release of £0.8 million for the year ended September 30, 2014 was higher than the £0.6 million for the year ended September 30, 2013.2014. The higher provision release in the year ended September 30, 20132014 was due to us having reassessed and increased our estimated future sales of Sativex, resulting in release of provision.
The higher provision release in the year ended September 30, 2014 reflects increased projected sales of Sativex relative to the year ended September 30, 2013 estimate of forward sales and a consequential decrease in the volume of inventory expected to expire prior to use.
Sativex Research and Development segment
The following table summarizes the results of our operations for our Sativex R&D segment for the years ended September 30, 20142015 and 2013,2014, together with the changes to those items.
| Year Ended September 30, | Change 2014 vs. 2013 | Year Ended September 30, | Change 2015 vs. 2014 | |||||||||||||||||||||||||||||||||||||
| 2014 | 2014 | 2013 | Increase/ Decrease | 2015 | 2015 | 2014 | Increase/ (Decrease) | |||||||||||||||||||||||||||||||||
| $ | £ | £ | £ | % | $ | £ | £ | £ | % | |||||||||||||||||||||||||||||||
| (in thousands, except for percentages) | (in thousands, except for percentages) | |||||||||||||||||||||||||||||||||||||||
| Research and development fees | 38,306 | 23,618 | 19,333 | 4,285 | 22 | % | 33,695 | 22,275 | 23,618 | (1,343 | ) | (6 | )% | |||||||||||||||||||||||||||
| Research and development expenditure: | ||||||||||||||||||||||||||||||||||||||||
| GW-funded research and development | (4,583 | ) | (2,826 | ) | (4,404 | ) | 1,578 | 36 | % | (6,237 | ) | (4,123 | ) | (2,826 | ) | (1,297 | ) | (46 | )% | |||||||||||||||||||||
| Development partner-funded research and development | (38,306 | ) | (23,618 | ) | (19,333 | ) | (4,285 | ) | 22 | % | (33,695 | ) | (22,275 | ) | (23,618 | ) | 1,343 | 6 | % | |||||||||||||||||||||
| Total research and development expenditure | (42,889 | ) | (26,444 | ) | (23,737 | ) | (2,709 | ) | (11 | )% | (39,932 | ) | (26,398 | ) | (26,444 | ) | 46 | 0 | % | |||||||||||||||||||||
| Segmental result | (4,583 | ) | (2,826 | ) | (4,404 | ) | 1,578 | 36 | % | (6,237 | ) | (4,123 | ) | (2,826 | ) | (1,297 | ) | 46 | % | |||||||||||||||||||||
Total research and development expenditure related to Sativex during the year ended September 30, 2014 increased by £2.7 million, or 11%, toof £26.4 million compared to £23.7 million for the year ended September 30, 2013.2015 was consistent with the £26.4 million recorded for the year ended September 30, 2014. This growthmovement consisted of a £4.3£1.3 million increasedecrease due to the expansionconclusion of the three Phase 3 cancer pain clinical programtrials offset by a £1.6£1.3 million decreaseincrease in Phase 1 trials, pre-clinical, regulatory and abuse liability planning activities that are being carried out to support the cancer pain development program and are funded by Otsuka under the terms of the Sativex license and development agreement.
As all of the development partner-funded research and development expenditure is reimbursed to us under the terms of our license agreements, the net result for this segment equals the GW-funded research and development expenditure on Sativex related projects.
| 85 |
Pipeline Research and Development segment
The following table summarizes the results of our operations for our Pipeline R&D segment for the years ended September 30, 20142015 and 2013,2014, together with the changes to those items.
| Year Ended September 30, | Change 2014 vs. 2013 | |||||||||||||||||||
| 2014 | 2014 | 2013 | Increase/ Decrease | |||||||||||||||||
| $ | £ | £ | £ | % | ||||||||||||||||
| (in thousands, except for percentages) | ||||||||||||||||||||
| Research and development fees | 1,082 | 667 | 4,261 | (3,594 | ) | (84 | )% | |||||||||||||
| Research and development expenditure | ||||||||||||||||||||
| GW-funded research and development | (26,658 | ) | (16,436 | ) | (4,979 | ) | (11,457 | ) | (230 | )% | ||||||||||
| Development partner-funded research and development | (1,082 | ) | (667 | ) | (4,261 | ) | 3,594 | 84 | % | |||||||||||
| Total research and development expenditure | (27,740 | ) | (17,103 | ) | (9,240 | ) | (7,863 | ) | (85 | )% | ||||||||||
| Segmental result | (26,658 | ) | (16,436 | ) | (4,979 | ) | (11,457 | ) | (230 | )% | ||||||||||
Year Ended September 30, | Change 2015 vs. 2014 | |||||||||||||||||||
| 2015 | 2015 | 2014 | Increase/ (Decrease) | |||||||||||||||||
| $ | £ | £ | £ | % | ||||||||||||||||
| (in thousands, except for percentages) | ||||||||||||||||||||
| Research and development fees | 809 | 535 | 667 | (132 | ) | (20 | )% | |||||||||||||
| Research and development expenditure | ||||||||||||||||||||
| GW-funded research and development | (73,105 | ) | (48,327 | ) | (16,436 | ) | (31,891 | ) | (194 | )% | ||||||||||
| Development partner-funded research and development | (809 | ) | (535 | ) | (667 | ) | 132 | 20 | % | |||||||||||
| Total research and development expenditure | (73,914 | ) | (48,862 | ) | (17,103 | ) | (31,759 | ) | (186 | )% | ||||||||||
| Segmental result | (73,105 | ) | (48,327 | ) | (16,436 | ) | (31,891 | ) | (194 | )% | ||||||||||
GW-funded pipeline research and development expenditure increased by £11.4£31.9 million, or 230%194%, to £48.3 million for the year ended September 30, 2015 as compared to £16.4 million for the year ended September 30, 2014 as compared to £5.0 million for the year ended September 30, 2013.2014. This reflects the impact of carrying out GW-funded clinical trials and research and development, including the costs associated with GW’s ongoing Phase 3 Dravet and Lennox-Gastaut syndrome Epidiolex studies, preclinical and scale up work associated with our epilepsy program. Additionally, we have completed a Phase 12 clinical trial with GWP42006GWP42003 and have ongoing Phase 2 trials in glioma with a THC:CBD product candidate, in the field of schizophrenia with GWP42003, and in diabetes with GWP42004.
Pipeline research and development fees are equal to the development partner-funded research and development expenditure incurred by us in conducting our joint pipeline research program and recharged to Otsuka under the terms of our 2007 research collaboration agreement. The 85%20% year-on-year decrease in pipeline research and development fees reflects the ending, effective June 30, 2013, of our pre-clinical research collaboration with Otsuka in the field of CNS disorders.disorders and unwinding of remaining revenue associated with this collaboration. GW has a worldwide license to all data and product candidates generated under the collaboration.
As the development partner-funded research and development expenditure was fully offset by the associated research and development fees, the segmental result equals the GW-funded pipeline research and development expenditure.
Comparison of Years Ended September 30, 2013 and 2012
The following table summarizes the results of our operations for the years ended September 30, 2013 and 2012, together with the changes to those items.
| Year Ended September 30, | Change 2013 vs. 2012 | |||||||||||||||||||
| 2013 | 2013 (1) | 2012 (1) | Increase/(Decrease) | |||||||||||||||||
| $ | £ | £ | £ | % | ||||||||||||||||
| (in thousands, except for percentages) | ||||||||||||||||||||
| Revenue | 44,158 | 27,295 | 33,120 | (5,825 | ) | (18 | )% | |||||||||||||
| Cost of sales | (2,064 | ) | (1,276 | ) | (839 | ) | 437 | 52 | % | |||||||||||
| Research and development expenditure | (52,897 | ) | (32,697 | ) | (27,578 | ) | 5,119 | 19 | % | |||||||||||
| Management and administrative expenses | (5,751 | ) | (3,555 | ) | (3,620 | ) | (65 | ) | (2 | )% | ||||||||||
| Net foreign exchange gains/(losses) | (384 | ) | (237 | ) | (40 | ) | 197 | 493 | % | |||||||||||
| Operating (loss)/profit | (16,938 | ) | (10,470 | ) | 1,043 | (11,513 | ) | (1,104 | )% | |||||||||||
| Interest expense | (104 | ) | (64 | ) | (1 | ) | 63 | — | ||||||||||||
| Interest income | 288 | 178 | 200 | (22 | ) | (11 | )% | |||||||||||||
| (Loss)/profit before tax | (16,754 | ) | (10,356 | ) | 1,242 | (11,598 | ) | (934 | )% | |||||||||||
| Tax | 9,395 | 5,807 | 1,248 | 4,559 | 365 | % | ||||||||||||||
| (Loss)/profit for the year | (7,359 | ) | (4,549 | ) | 2,490 | (7,039 | ) | (283 | )% | |||||||||||
Revenue
The following table summarizes our revenue for the years ended September 30, 2013 and 2012, together with the changes to those items.
| Year Ended September 30, | Change 2013 vs. 2012 | |||||||||||||||||||
| 2013 | 2013 | 2012 | Increase/ (Decrease) | |||||||||||||||||
| $ | £ | £ | £ | % | ||||||||||||||||
| (in thousands, except for percentages) | ||||||||||||||||||||
| Product sales | 3,490 | 2,157 | 2,514 | (357 | ) | (14 | )% | |||||||||||||
| Research and development fees | 38,172 | 23,594 | 19,500 | 4,094 | 21 | % | ||||||||||||||
| License, collaboration and technical access fees | 2,094 | 1,294 | 1,294 | — | — | |||||||||||||||
| Development and approval milestone fees | 402 | 250 | 9,812 | (9,562 | ) | (97 | )% | |||||||||||||
| Total revenue | 44,158 | 27,295 | 33,120 | (5,825 | ) | (18 | )% | |||||||||||||
Total revenue decreased by 18% to £27.3 million for the year ended September 30, 2013, compared to £33.1 million for the year ended September 30, 2012. This reduction was driven by a variety of factors, as explained below.
Sativex product sales revenue declined by £0.4 million, or 14%, to £2.2 million for the year ended September 30, 2013 compared to £2.5 million for the year ended September 30, 2012. This decline was primarily due to the recognition of a £1.1 million rebate provision in 2013 for amounts expected to be paid to Almirall following an adverse German pricing decision in March 2013, coupled with a decline in the supply price charged to Almirall as a result of the amended supply agreement, which was effective from March 2012. These declines were partially offset by a 51% increase in the sales volumes of Sativex shipped to partners.
Research and development fees increased by £4.1 million, or 21%, to £23.6 million for the year ended September 30, 2013 compared to £19.5 million for the year ended September 30, 2012. This increase was due to increased charges to our partners, principally Otsuka, for fees we have incurred in conducting our joint research plans, for which our partners reimburse us under the terms of our license and collaboration agreements. Further discussion regarding the joint research plan activities is included within the “research and development expenditure” section below.
License, collaboration and technical access fees of £1.3 million were consistent with the £1.3 million recorded in the year ended September 30, 2012.
Development and approval milestone fees decreased by £9.5 million, or 97%, to £0.3 million for the year ended September 30, 2013 compared to £9.8 million for the year ended September 30, 2012. Development and approval milestone fees consist of milestone payments due to us from Sativex partners under the terms of our agreements. Development and approval milestone payments of £0.3 million during the year ended September 30, 2013 resulted from a single milestone payment received from Almirall upon agreement of Italian pricing and reimbursement approval for Sativex.
During the year ended September 30, 2012, development and approval milestone fees of £9.8 million resulted from a milestone payment received from Almirall upon achievement of an agreed Phase 3 cancer pain trial patient recruitment target.
Cost of sales
Cost of sales increased by £0.4 million, or 52%, to £1.2 million for the year ended September 30, 2013 compared to £0.8 million for the year ended September 30, 2012. This increase was due to a 51% increase in the volume of Sativex vials shipped to partners during the year ended September 30, 2013 compared to 2012 as previously discussed. Costs of sales per unit shipped remained consistent across periods.
Research and development expenditure
The following table summarizes our research and development expenditure for the years ended September 30, 2013 and 2012, together with the changes to those items.
| Year Ended September 30, | Change 2013 vs. 2012 | |||||||||||||||||||
| 2013 | 2013 | 2012 | Increase/ (Decrease) | |||||||||||||||||
| $ | £ | £ | £ | % | ||||||||||||||||
| (in thousands, except for percentages) | ||||||||||||||||||||
| GW-funded research and development | 14,725 | 9,103 | 8,078 | 1,025 | 13 | % | ||||||||||||||
| Development partner-funded research and development | 38,172 | 23,594 | 19,500 | 4,094 | 21 | % | ||||||||||||||
| Total research and development expenditure | 52,897 | 32,697 | 27,578 | 5,119 | 19 | % | ||||||||||||||
Research and development expenditure increased by £5.1 million, or 19%, to £32.7 million for the year ended September 30, 2013, from £27.6 million for the year ended September 30, 2012. As shown in the table above, research and development expenditure consists of two elements, GW- funded research and development expenditure and development partner-funded research and development expenditure.
The £1.0 million increase in GW-funded research and development expenditure was due principally to:
We track all research and development expenditures against detailed budgets but do not seek to allocate and monitor all research and development costs by individual project. As noted in the segmental analysis below, we analyze GW-funded research and development into Sativex‒related expenditures and pipeline related expenditures. External third-party costs of running clinical trials totaling £1.4 million for the year ended September 30, 2013 and £1.5 million for the year ended September 30, 2012 were tracked by individual project, while the remaining £7.7 million for the year ended September 30, 2013 and £6.6 million for the year ended September 30, 2012 consisting largely of internal overhead costs were not allocated to individual projects. We believe that our existing liquidity is sufficient to complete our currently ongoing GW-funded research and development projects.
Development partner-funded research and development projects are funded in advance by our development partners, which involves the receipt of advanced funds every three months, sufficient to cover projected expenditure for the next three months. For further information on the risks our research and development program face, see “Risk Factors—Risks Related to Development and Regulatory Approval of Sativex and Our Product Candidates.”
Development partner-funded research and development expenditure was made up of two principal elements, as follows:
| Year Ended September 30, | Change 2013 vs. 2012 | |||||||||||||||||||
| 2013 | 2013 | 2012 | Increase/ (Decrease) | |||||||||||||||||
| $ | £ | £ | £ | % | ||||||||||||||||
| (in thousands, except for percentages) | ||||||||||||||||||||
| Sativex U.S. development program | 31,278 | 19,333 | 14,080 | 5,253 | 37 | % | ||||||||||||||
| Otsuka research collaboration expenses | 6,894 | 4,261 | 5,420 | (1,161 | ) | (21 | )% | |||||||||||||
| Total development partner-funded research and development | 38,172 | 23,594 | 19,500 | 4,094 | 21 | % | ||||||||||||||
Sativex U.S. development expenses increased by £5.3 million, or 37%, to £19.3 million during the year ended September 30, 2013 compared to the year ended September 30, 2012. This reflects increased patient recruitment into the first two Sativex Phase 3 trials, geographic expansion of the trials into new territories and commencement of the third Phase 3 cancer pain trial.
Otsuka research collaboration expenses decreased by £1.2 million, or 21%, to £4.3 million during the year ended September 30, 2013 compared to £5.4 million for the year ended September 30, 2012. These charges to Otsuka included charges for the cost of employing staff to work on our joint research plan, plus the cost of subcontracted pre-clinical studies and sponsorship of our network of academic scientists. The decrease reflects the fact that the Otsuka research collaboration term ended on June 30, 2013. Most of the pre-clinical programs that Otsuka were funding are now proceeding into Phase 1/2 clinical trials as part of the GW-funded clinical programs.
Management and administrative expenses
Management and administrative expenses of £3.6 million for the year ended September 30, 2013 were consistent with the £3.6 million for the year ended September 30, 2012.
Net foreign exchange gains/losses
Net foreign exchange gains/losses of £0.2 million for year ended September 30, 2013 represents a £0.2 million increase compared to the year ended September 30, 2012. This expense represents realized losses on foreign exchange.
Interest expense
Interest expense of £0.1 million for the year ended September 30, 2013 represents a £0.1 million increase compared to the year ended September 30, 2012. This expense relates to a finance lease arrangement we entered into in June 2013 to fund the fit-out of new research and development laboratory space.
Interest income
Interest income of £0.2 million for the year ended September 30, 2013 was consistent with the £0.2 million for the year ended September 30, 2012.
Tax
Our tax credit increased by £4.6 million, or 365%, to £5.8 million for the year ended September 30, 2013 compared to £1.2 million for the year ended September 30, 2012. This credit consists of:
Research and development tax credits recognized vary depending on our available tax losses, the eligibility of our research and development expenditure and the level of certainty relating to the recoverability of the claim.
Segmental review
Sativex Commercial segment
The following table summarizes the results of our operations for our Sativex Commercial segment for the years ended September 30, 2013 and 2012, together with the changes to those items.
| Year Ended September 30, | Change 2013 vs. 2012 | |||||||||||||||||||
| 2013 | 2013 | 2012 | Increase/ Decrease | |||||||||||||||||
| $ | £ | £ | £ | % | ||||||||||||||||
| (in thousands, except for percentages) | ||||||||||||||||||||
| Product sales | 3,490 | 2,157 | 2,514 | (357 | ) | (14 | )% | |||||||||||||
| License, collaboration and technical access fees | 2,094 | 1,294 | 1,294 | — | — | |||||||||||||||
| Development and approval milestone fees | 402 | 250 | 9,812 | (9,562 | ) | 97 | % | |||||||||||||
| Total revenue | 5,986 | 3,701 | 13,620 | (9,919 | ) | 73 | % | |||||||||||||
| Cost of sales | (2,064 | ) | (1,276 | ) | (839 | ) | 437 | 52 | % | |||||||||||
| Research and development credit | 966 | 597 | 1,300 | (703 | ) | (54 | )% | |||||||||||||
| Segmental result | 4,888 | 3,022 | 14,081 | (11,059 | ) | (79 | )% | |||||||||||||
We classify all revenue from Sativex collaboration partners, with the exception of research and development fees, as Sativex Commercial segment revenue. The principal variances in these revenue streams are summarized in the table above. An explanation of the principal movements in the revenue streams is provided in the revenue section above.
Cost of sales increased by £0.5 million, or 52%, to £1.3 million for the year ended September 30, 2013 compared to £0.8 million for the year ended September 30, 2012, driven by a 51% year‒on‒year increase in the volume of Sativex vials shipped to partners as previously discussed.
For the Sativex Commercial segment, the research and development credit represents the movement in the provision against inventories manufactured prior to the regulatory approval of Sativex. All inventories manufactured prior to regulatory approval were capitalized as an asset but provided for, with the charge recognized in the research and development expenditure line, until there was a high probability of regulatory approval. When we determined that there was a high probability of regulatory approval of Sativex, the provision was revised to adjust the carrying value of Sativex inventories to the expected net realizable value, which may not exceed original cost. The provision for inventories release of £0.6 million for the year ended September 30, 2013 was lower than the £1.3 million for the year ended September 30, 2012. The higher provision release in the year ended September 30, 2012 was due to us having reassessed and increased our estimated future sales of Sativex, resulting in release of the provision.
The provision release in the year ended September 30, 2013 reflects increased sales of Sativex and a decrease in the volume of inventory expected to expire prior to use.
Sativex Research and Development segment
The following table summarizes the results of our operations for our Sativex R&D segment for the years ended September 30, 2013 and 2012, together with the changes to those items.
| Year Ended September 30, | Change 2013 vs. 2012 | |||||||||||||||||||
| 2013 | 2013 | 2012 | Increase/ Decrease | |||||||||||||||||
| $ | £ | £ | £ | % | ||||||||||||||||
| (in thousands, except for percentages) | ||||||||||||||||||||
| Research and development fees | 31,278 | 19,333 | 14,080 | 5,253 | 37 | % | ||||||||||||||
| Research and development expenditure | ||||||||||||||||||||
| GW-funded research and development | (7,125 | ) | (4,404 | ) | (4,335 | ) | 69 | 2 | % | |||||||||||
| Development partner-funded research and development | (31,278 | ) | (19,333 | ) | (14,080 | ) | 5,253 | 37 | % | |||||||||||
| Total research and development expenditure | (38,403 | ) | (23,737 | ) | (18,415 | ) | 5,322 | 29 | % | |||||||||||
| Segmental result | (7,125 | ) | (4,404 | ) | (4,335 | ) | 69 | 2 | % | |||||||||||
Total research and development expenditure related to Sativex during the year ended September 30, 2013 increased by £5.3 million, or 29%, to £23.8 million as compared to £18.4 million for the year ended September 30, 2012. This growth consisted of a £3.9 million increase due to the expansion of the Phase 3 cancer pain clinical program plus £1.4 million of Phase 1 trials, pre-clinical, regulatory and abuse liability planning activities that are being carried out to support the cancer pain development program and are funded by Otsuka under the terms of the Sativex license and development agreement.
As all of the development partner-funded research and development expenditure is reimbursed to us under the terms of our license agreements, the net result for this segment equals the GW-funded research and development expenditure on Sativex related projects.
Pipeline Research and Development segment
The following table summarizes the results of our operations for our Pipeline R&D segment for the years ended September 30, 2013 and 2012, together with the changes to those items.
| Year Ended September 30, | Change 2013 vs. 2012 | |||||||||||||||||||
| 2013 | 2013 | 2012 | Increase/ Decrease | |||||||||||||||||
| $ | £ | £ | £ | % | ||||||||||||||||
| (in thousands, except for percentages) | ||||||||||||||||||||
| Research and development fees | 6,894 | 4,261 | 5,420 | (1,159 | ) | (21 | )% | |||||||||||||
| Research and development expenditure | ||||||||||||||||||||
| GW-funded research and development | (8,055 | ) | (4,979 | ) | (4,484 | ) | 495 | 11 | % | |||||||||||
| Development partner-funded research and development | (6,894 | ) | (4,261 | ) | (5,420 | ) | (1,159 | ) | (21 | )% | ||||||||||
| Total research and development expenditure | (14,949 | ) | (9,240 | ) | (9,904 | ) | (664 | ) | (7 | )% | ||||||||||
| Segmental result | (8,055 | ) | (4,979 | ) | (4,484 | ) | 495 | 11 | % | |||||||||||
Pipeline research and development fees are equal to the development partner-funded research and development expenditure incurred by us in conducting our joint pipeline research program and recharged to Otsuka under the terms of our 2007 research collaboration agreement. The 21% year-on-year decrease in pipeline research and development fees reflects the fact that our pre-clinical research collaboration with Otsuka in the field of CNS disorders and oncology ended on June 30, 2013. GW has a worldwide license to all data and product candidates generated under the collaboration.
GW-funded pipeline research and development expenditure increased by £0.5 million, or 11%, to £5.0 million for the year ended September 30, 2013 compared to £4.5 million for the year ended September 30, 2012. This reflects the fact that most of the product candidates that have been developed under the pre-clinical collaboration with Otsuka are now starting to enter Phase 1/Phase 2 clinical trials and are being wholly funded internally. Since July 1, 2013 we have initiated a Phase 1 clinical trial with GWP42006, a glioma Phase 2 trial with a THC:CBD product candidate and is in the process of setting up Phase 2 trials in the field of schizophrenia with GWP42003 and in diabetes with GWP42004.
As the development partner-funded research and development expenditure was fully offset by the associated research and development fees, the segmental result equals the GW-funded pipeline research and development expenditure.
| B. | Liquidity and Capital Resources. |
In recent years, we have largely funded our operations and growth from issuances of equity securities, research and development fees and tax credits and milestone payments from our development partners. We have also funded our operations and growth with cash flows from operating activities, including Sativex revenue researchcredits and development tax credits, interest income and issuances of equity securities.income. Our cash flows may fluctuate, are difficult to forecast and will depend on many factors, including:
| 86 |
We believe that, our cash and cash equivalents as at September 30, 20142016 of £164.5£374.4 million, coupled with cash flows from operating activities will be sufficient to fund our operations, including currently anticipated research and development activities and planned capital expenditures, for the foreseeable future, including for at least the next 12 months.
Cash Flows
The following table summarizes the results of our cash flows for the years ended September 30, 2014, 20132016, 2015 and 2012.2014.
| Year Ended September 30, | Year Ended September 30, | |||||||||||||||||||||||||||||||
| 2014 | 2014 | 2013 | 2012 | 2016 | 2016 | 2015 | 2014 | |||||||||||||||||||||||||
| $ | £ | £ | £ | $ | £ | £ | £ | |||||||||||||||||||||||||
| (in thousands) | (in thousands) | |||||||||||||||||||||||||||||||
| Net cash (outflow)/inflow from operating activities | (20,479 | ) | (12,626 | ) | (7,468 | ) | 1,801 | |||||||||||||||||||||||||
| Net cash outflow from operating activities | (109,234 | ) | (84,594 | ) | (46,471 | ) | (12,626 | ) | ||||||||||||||||||||||||
| Net cash outflow from investing activities | (11,507 | ) | (7,095 | ) | (2,076 | ) | (1,060 | ) | (11,307 | ) | (8,756 | ) | (17,791 | ) | (7,095 | ) | ||||||||||||||||
| Net cash inflow from financing activities | 233,988 | 144,267 | 18,253 | 73 | 267,045 | 206,807 | 128,419 | 144,267 | ||||||||||||||||||||||||
| Cash and cash equivalents at end of the year | 266,788 | 164,491 | 38,069 | 29,335 | 483,445 | 374,392 | 234,872 | 164,491 | ||||||||||||||||||||||||
Operating activities
Net cash outflow from operating activities for the year ended September 30, 2016 of £84.6 million was £38.1 million higher than the £46.5 million outflow from operating activities for the year ended September 30, 2015, principally reflecting the increase in investment in Epidiolex and other pipeline research and development activities offset by additional tax benefit.
Net cash flow from operating activities decreasedincreased by £5.1£33.9 million to a £46.5 million outflow for the year ended September 30, 2015 compared to a £12.6 million outflow for the year ended September 30, 2014 compared to a £7.5 million outflow for the year ended September 30, 2013.2014. This decreaseincrease was primarily driven by a £10.2£34.8 million increase in GW-funded research and development expenditure, partially offset by a £4.5 million reduction in cash used for working capital.expenditure.
| 87 |
Net cash flow from operating activities decreased by £9.3 million to a £7.5 million outflow for the year ended September 30, 2013 compared to a £1.8 million inflow for the year ended September 30, 2012. This decrease was primarily driven by a £9.5 million reduction in development milestone receipts, a £0.3 million reduction in Sativex product sales, a £1.1 million increase in GW-funded research and development expenditure and a £0.9 million increase in cash used for working capital partially offset by a £0.3 million increase in research and development tax receipts.
Investing activities
The net cash outflow from investing activities increaseddecreased by £5.0£9.0 million to £7.1£8.8 million for the year ended September 30, 20142016 from £2.1£17.8 million for the year ended September 30, 2013,2015, reflecting an increasea decrease in capital expenditure to £7.3of £9.2 million during the year ended September 30, 2014 as we invested in expanding and upgrading2016 due to the conclusion of a significant phase of construction of our new manufacturing and growing facilities.
The net cash outflow from investing activities increased by £1.0£10.7 million to £2.1£17.8 million for the year ended September 30, 20132015 from £1.1£7.1 million for the year ended September 30, 2012,2014, reflecting an increase in capital expenditure of £0.9£10.7 million during the year ended September 30, 20132015 as we investedaccelerated our investment in expanding and upgrading our cannabinoid extraction and Epidiolex manufacturing and research laboratorygrowing facilities.
Financing activities
Net cash flow from financing activities increased by £78.4 million to a £206.8 million inflow in the year ended September 30, 2016 compared to a £128.4 million inflow for the year ended September 30, 2015 due to a £79.1 million increase in net new equity funding inflows, a £0.6 million reduction in proceeds from the exercise of employee share options, a £0.2 million increase in fit out funding repayments and a £0.1 million decrease in finance lease repayments.
Net cash inflow from financing activities increaseddecreased by £126.0£15.9 million to £128.4 million for the year ended September 30, 2015 from £144.3 million for the year ended September 30, 2014 from £18.3 million for the year ended September 30, 2013 primarily as a result of an increasea decrease of £108.2£7.8 million in the receipt of net proceeds from new equity issuancesfit-out funding receipts, a decrease of ADSs. £126.3£5.3 million of net proceeds was received from new equity issuances of ADSs in our follow-on U.S. public offerings in January and June 2014 compared tothe receipt of £18.1warrant exercise proceeds, a decrease of £3.8 million of netin proceeds from the U.S. initial public offering in May 2013. In addition, proceeds received on the exercise of employee share options and warrants amounted to £10.3offset by a £1.2 million for the year ended September 30, 2014.
Net cash inflow from financing activities increased by £18.2 million for the year ended September 30, 2013 primarily as a result of the receipt of £18.1 million of net proceeds from theincrease in new equity issuancefunding, net of ADSs in our U.S. initial public offering in May 2013. In addition, proceeds received on the inception of a new finance lease amounted to £0.2 million for the year ended September 30, 2013.expenses.
| C. | Research and Development,Patents and Licenses, etc. |
Full details of our research and development activities and expenditures are given in the Business section and Operating and Financial Review and Prospects sections of this Annual Report above.
| D. | Trend information |
The following charts illustrate the key financial trends in our business:

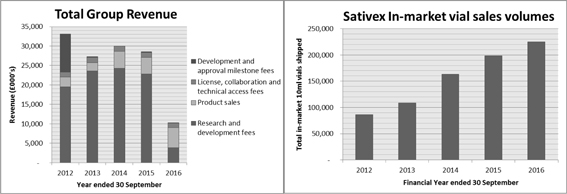
| 88 |
Our revenues consist of R&D fees, product sales revenues, royalties, licenselicence collaboration and technical access fees and development and approval milestone fees.
For the year ended September 30, 2014,2016, we recognizedrecorded revenues of £4.4£5.2 million for Sativex product sales, an increase of £2.2£0.9 million from the £2.2£4.3 million recorded for the year ended September 30, 2013.2015. This increase was due primarily to the combined effects of an increase in the volume of shipments to partners of 65%, and the inclusion, in the prior year, of a £1.1 million provision in respect of an adverse pricing decision in Germany in March 2013, which was effective for sales recognized from July 1, 2012 onward.9%.
In the year to September 30, 2016 we have seen a decline in our research and development fee income, as the level of rechargeable activity associated with our recently completed cancer pain trials programme has significantly reduced during the course of the year. We consider our licence, collaboration and technical access fees and our product sales revenues to be recurring revenues. The milestone revenues recognized in each of the financial years from 2010–above tend to be individual items linked to specific development milestones achieved in a particular financial year.
In 2012 we received substantial development and approval milestones from our Sativex licensees. In 2013, we received only one £250,000 development and approval milestone. In 2014, we received no development and approval milestones.
We consider our R&D fees, license, collaboration In 2015, we received two €125,000 development and technical access fees and our product sales revenues to be recurring revenues. As illustrated above, over the last five years there has been a consistent growth trend in these revenues. The milestone revenues recognized in each of the financial years above tend to be individual itemsapproval milestones linked to specificregulatory filings by Ipsen, our commercial partner in Latin America. In 2016, we received one €125,000 development milestones achievedand approval milestone linked to a regulatory submission filing by Ipsen in a particular financial year. These are items which tend to have a significant impact upon the profitability and cash flow of our business in each financial year in which they are received and earned.Venezuela.
The Sativex In-market Vial Salesvial sales volumes graph above illustrates the trend in in-market commercial sales volumes of Sativex by our commercial marketing partners Bayer in the U.K./UK/Canada, Almirall in Europe and Neopharm in Israel. In-market sales volumes grew by 50%14% from 20132015 to 2014.2016.
In 2010, vial sales consisted entirely of vials sold by Bayer in Canada and the United Kingdom. In 2011, Almirall launched Sativex in Spain, Germany and Denmark. In 2012 commercial sales to private patients started in Sweden and in 2013 commercial sales by Almirall commenced in Norway, Austria, Italy, Poland and by Neopharm in Israel. In 2014, Almirall launched Sativex in Switzerland and FinlandFinland. 2015 and 2016 saw volume growth was driven primarily by increased prescribing in Germany and Italy. We expect new launches and further growthItaly, as well as launch in existing markets to continue to drive further growth in 2015.Belgium.


As illustrated in the Total Group R&D SpendExpenditure graph above, our R&D expenditures have shown a consistent growth trend over the last five financial years from £22.1£27.6 million for the year ended September 30, 2010in 2012 to £43.5£99.8 million for the year ended September 30, 2014.in 2016. The growth reflects bothduring 2016 of £23.0 million from the £76.8 million of research and development incurred in 2015 demonstrates the execution of our epilepsy Phase 3 clinical research with Epidiolex as well as progress with the Sativex development program and the expansiona number of the scope of our research to involve a broad range ofother pipeline product candidates, including Epidiolex and CBDV, our epilepsy product candidates. In addition, SG&A expenditure has increased from £12.6 million in 2015 to £19.9 million in 2016, reflecting the increased activity in respect of pre-launch commercialization in the U.S.
In the last five years, a significant proportion of the growth of the partner-funded R&D expendituresexpenditure has been driven by our expanding US Phase 3 cancer pain clinical trials program,programme, which has evolvedincluded three pivotal Phase 3 cancer pain trials plus a series of supporting Phase 1 clinical trials and regulatory activities in 2014.activities. All of this clinical activity iswas funded by our development partner Otsuka. These activities came to an end during 2016, explaining the significant decrease in partner funded R&D.
From 2010 toIn 2012 and 2013, Otsuka also funded a significant amount of pre-clinical activity as part of our six‒yearsix-year pre-clinical research collaboration. This pre-clinical collaboration ended on 30 June 30, 2013. GW now has a worldwide licenselicence to all data and product candidates generated under this collaboration.
From 20102012 to 20132016 GW-funded R&D fluctuated between £7.3increased from £8.1 million for the year ended September 30, 2010 and £9.1in 2012 to £96.0 million for the year ended September 30, 2013. For the year ended September 30,in 2016. In 2014 GW-funded R&D increased significantly to £19.2 million, reflecting our investment in the development of Epidiolex, CBDVcannabidivarin (“CBDV”) and other pipeline candidates. We currently haveIn 2015 GW-funded R&D increased further to £54.0 million, as we initiated five Phase 3 clinical trials in several forms of refractory childhood epilepsy, including Dravet syndrome and Lennox-Gastaut syndrome. In 2016 GW-funded R&D increased to £96.4 million as we completed three Phase 3 clinical trials, and continued to invest in our wider epilepsy program to support the forthcoming NDA filing in the United States. In addition we commenced a Phase 3 clinical trial in Tuberous Sclerosis Complex as well as continuing to progress multiple active Phase 1/2 clinical trials in multipleother disease areas includingsuch as epilepsy glioma, diabetespartial seizures and schizophrenia.Glioma.
| 89 |
The Total Group Cash graph above illustrates the trend in our financial year-end closing cash position for each of the last five years.
In the year ended September 30, 2014 we received total financing inflows of £144.3 million arising primarily from the combination of two follow-on issues of equity on the Nasdaq Global Market in January and June 2014 raising £126.3 million, £10.3 million of proceeds from the exercise of share options and warrants and a £7.8 million fit-out funding inflow from the landlord of the new manufacturing facility that we have under construction. In 2013, we recorded a positive cash inflow of £8.7 million following our receipt of £18.3 million of financing inflows, including £18.1 million from issue of equity as part of our U.S. initial public offering on the Nasdaq Global Market on May 1, 2013. From 2010 to 2012 we recorded a positive net operating cash inflow in each financial year, largely as a result of the substantial milestone receipts from our Sativex development partners. Since 2013, having taken the decision to invest in the development of Epidiolex to treat a number of refractory forms of childhood onset epilepsy we have consistently recorded operating cash outflows, offset by the proceeds of a series of fundraisings, each financial year.of which have been conducted following the achievement of key product development milestones. Our aim has been to ensure that the Group remains well funded with sufficient working capital to successfully execute our Epidiolex and other pipeline product development plans. These equity fundraisings, together with proceeds from share options and warrants, have generated net financing cash inflows as follows:
As a result of this series of successful equity fundraisings the Group has made excellent progress with the execution of our Epidiolex development strategy and with £374.4 million of cash reserves held at September 30, 2016 the Group has the funds necessary to execute our plans to file an NDA with FDA, to scale up our growing and manufacturing facilities and to expand our commercial team in preparation for Epidiolex commercialisation.
| E. | Off Balance Sheet Arrangements. |
We do not have any off-balance sheet arrangements.
| 90 |
| F. | Tabular Disclosure of Contractual Obligations. |
The following table summarizes our contractual commitments and obligations as at September 30, 2014.2016.
| Payments Due by Period | Payments Due by Period | |||||||||||||||||||||||||||||||||||||||
| Total | Less than 1 year | 1 - 3 years | 3 - 5 years | More than 5 years | Total | Less than 1 year | 1 - 3 years | 3 - 5 years | More than 5 years | |||||||||||||||||||||||||||||||
| £ | £ | £ | £ | £ | £ | £ | £ | £ | £ | |||||||||||||||||||||||||||||||
| (in thousands) | (in thousands) | |||||||||||||||||||||||||||||||||||||||
| Operating lease obligations(1) | 3,930 | 1,307 | 1,074 | 535 | 1,014 | |||||||||||||||||||||||||||||||||||
| Finance lease obligations(2) | 1,907 | 126 | 320 | 283 | 1,178 | |||||||||||||||||||||||||||||||||||
| Purchase obligations(3) | 5,403 | 5,403 | — | — | — | |||||||||||||||||||||||||||||||||||
| Operating lease obligations(1) | 13,038 | 2,723 | 4,816 | 3,301 | 2,198 | |||||||||||||||||||||||||||||||||||
| Finance lease obligations(2) | 9,306 | 571 | 1,112 | 1,112 | 6,511 | |||||||||||||||||||||||||||||||||||
| Purchase obligations(3) | 5,130 | 5,130 | - | - | - | |||||||||||||||||||||||||||||||||||
| Borrowings(4) | 14,399 | 1,448 | 1,930 | 1,930 | 9,091 | |||||||||||||||||||||||||||||||||||
| Growing operations(5) | 45,670 | 6,755 | 18,069 | 18,598 | 2,248 | |||||||||||||||||||||||||||||||||||
| Total contractual obligations | 11,240 | 6,836 | 1,394 | 818 | 2,192 | 87,543 | 16,627 | 25,927 | 24,941 | 20,048 | ||||||||||||||||||||||||||||||
| (1) | We enter into operating leases in the normal course of business. Most lease arrangements provide us with the option to renew the leases on defined terms. The future operating lease obligations would change if we exercise our renewal options or if we were to enter into additional new operating leases. See Note |
| (2) | We enter into finance leases when beneficial to the Group. See Note |
| (3) | Purchase obligations include signed orders for capital equipment, which have been committed but not yet received at the balance sheet date totaling |
| (4) | We enter into borrowings when beneficial to the Group. See Note 18 to our consolidated financial statements included elsewhere in this Annual Report. |
| (5) | During the year ended September 30, 2016, the Group signed a commercial growing agreement with an external supplier to produce plant material for use in the Epidiolex development programmes and commercial release. This agreement is expected to commence during the second quarter of the year ended September 30, 2017 and includes multiple fee-elements designed to incentivise cost efficient, reliable production volumes. As part of the accounting treatment for this agreement a component operating lease has been identified under the requirements of IFRIC 4 Determining Whether an Arrangement Contains a Lease. Rental payments commence during the second quarter of the year ended 30 September 2017 and continue over a five-year non-cancellable period. Future minimum lease payments associated with this operating lease are included in the table shown above and (1). |
| G. | Safe Harbor. |
See the section titled “Information Regarding Forward-Looking Statements” at the beginning of this Annual Report.
| Item 6 | Directors, Senior Management and Employees. |
| A. | Directors and Senior Management. |
The following table sets forth the names, ages and positions of our executive officers and non-employee directors:
Name | Age | Position | ||
| Executive Officers | ||||
| Dr. Geoffrey | Chairman of the Board of Directors and member of Board of Directors | |||
| Justin Gover | Chief Executive Officer and member of Board of Directors | |||
| Dr. Stephen Wright | ||||
| Adam George | Chief Financial Officer and member of Board of Directors | |||
| Chris Tovey | Chief Operating Officer and | |||
| Julian Gangolli | 58 | President, North America and member of Board of Directors | ||
| Non-Employee Directors | ||||
| James | Deputy Chairman | |||
| Cabot | Non-Executive Director | |||
| Thomas | Non-Executive Director |
| (1) | Member of the Audit Committee. |
| (2) | Member of the Remuneration Committee. |
| (3) | Member of the Nomination Committee. |
| (4) | An “independent director” as such term is defined in Rule 10A-3 under the Exchange Act. |
| 91 |
Executive Officers
Dr.Geoffrey Guy is our founder and has served as our Chairman since 1998. Dr. Guy has over 30 years of experience in medical research and global drug development, most recentlypreviously as Chairman and Chief Executive of Ethical Holdings plc, a Nasdaq Global Market-quotedNASDAQ-quoted drug delivery company (now Amarin Corporation plc, or Amarin), which he founded in 1985 and led to its Nasdaq Global MarketNASDAQ listing in 1993. He also founded Phytopharm plc in 1989, of which he was Chairman until 1997. Dr. Guy has been the physician in charge of over 200300 clinical studies including first dose in man, pharmacokinetics, pharmacodynamics, dose-ranging, controlled clinical trials and large scale multi-centeredmulti-centred studies and clinical surveys. He is also an author ofon numerous scientific publications and has contributed to six books. Dr. Guy was appointed as Visiting Professor in the School of Science and Medicine at the University of Buckingham in July 2011. He also received the “Deloitte Director of the Year Award in Pharmaceuticals and Healthcare” in 2011. Dr. Guy was appointed Visiting Professor at Westminster University, and awarded Honorary DSc at Reading University in 2016. Dr. Guy holds a BSc.BSc in pharmacology from the University of London, an MBBS at St.St Bartholomew’s Hospital, an MRCS Eng. and LRCP London, an LMSSA Society of Apothecaries and a Diploma of Pharmaceutical Medicine from the Royal Colleges of Physicians.
Justin Gover has served as ourbeen Chief Executive Officer of GW Pharmaceuticals since January 1999, shortly after the companyCompany was founded. He has approximately 20 years of experience in the pharmaceutical industry. As Chief Executive Officer, heIn this time, Mr. Gover has been the lead executive responsible for the running of ourthe company’s operations, as well as in leading equity financings and business development activities as both aactivities. He raised initial rounds of private capital, following which led the company’s initial public offering on the AIM stock exchange in London in 2001, and amore recently led GW’s initial public company.offering on Nasdaq in 2013. In total, he has led equity financing rounds which have raised approx. $900m. In 2015, Mr. Gover relocated to the U.S. to open the company’s U.S. headquarters in California. Prior to joining our company,GW, Mr. Gover was Head of Corporate Affairs at Ethical Holdings plc, (now Amarin) from 1995 to 1997,a UK-based Nasdaq listed company, where he was responsible for the company’s strategic corporate activities, including mergers and acquisitions, strategic investments, equity financings and investor relations. Mr. Gover holds an M.B.A. from the INSEAD and a BSc. (Hons) from Bristol University.business school in France.
Dr. Stephen Wright has served as our Research and Development Director and Chief Medical Officer since January 2004 and as a Director since March 2005. Dr. Wright, now GW’s Chief Medical Officer, will retire and step down from his position on 1 May 2017. Dr. Wright has more than 2025 years of experience in drugmedicines development. Prior to joining our company, Dr. WrightHe joined GW from Ipsen, where he was Senior Vice President of Clinical Research & Development and a member of the U.K.UK Board of Directors at Ipsen Limited, whereDirectors. Prior to this, he led teams responsible for regulatory success in both the United States and the European Union. Dr. Wright also has direct U.S. drug development experience, first as Medical Director of Immunosciences, then aswas Venture Head of Neuroscience at Abbott Laboratories. Dr. Wright is a Fellow of the Royal College of Physicians of Edinburgh and the Faculty of Pharmaceutical Medicine. Dr. Wright is also a Visiting ProfessorLaboratories, based in the SchoolUS, and was also formerly Associate Medical Director at Glaxo in the UK. In each of Chemistry, Foodthese roles he has been closely associated with at least eight successful NDAs for new drug products, both small molecules, peptides and Pharmacy at The University of Reading and is the author of more than 100 publications, and several book chapters. Dr. Wright received an M.D. and an M.A. in Social and Political Science from the University of Cambridge and qualified in Medicine (MBBS) at The Royal London Hospital.botanicals.
Adam George has servedjoined GW in 2007 and was Group Financial Controller until June 1, 2012, at which time he joined the Board as our Chief Financial Officer since June 2012.Officer. Mr. George also acts as our company Secretary.Company Secretary, a role he has held since he first joined the Company. Prior to taking on his current role,joining GW, Mr. George served as our Financial Controller since 2007. Mr. George has previously occupied several senior finance roles within both publiclisted and privately-owned companies, most recently as Finance Director fromprivately owned high growth businesses. From 2004 to 2007, and as Group Financial Controller from 2001 to 2004Mr. George was Finance Director of Believe It Group Limited (now 4Com plc), a telecommunications service provider. Mr. George holds a BSc. in Biologyprovider, having been Group Financial Controller from Bristol University and is qualified as a chartered accountant.2001 to 2004.
Chris Tovey has served as our Chief Operating Officer since October 2012. Mr. Tovey has over 25 years of experience in the pharmaceutical industry. Prior to joining our Company, Mr. Tovey was at UCB Pharmaceuticals from 2006 to 2012. Most recently,In his last role there, Mr. Tovey was the Vice President of Global Marketing Operations where he was responsible for worldwide marketing activities on a portfolio of UCB products including Keppra® (Anti-epileptic) generating over €2.0 billion in annual sales. Previous experience and roles at UCB included a number of multi-country product launches including Vimpat® (Anti-epileptic), Managing Director Greece and Cyprus, and leader of all UCB activities on the orphan narcotic medication Xyrem®Xyrem®, used in the treatment of narcolepsy. Mr. Tovey previously spent 18 years at GlaxoSmithKline plc in senior commercial roles in both the European and U.K. organizations.UK organisations. These roles included Director Commercial Strategy Distribution Europe, Director European Vaccine Therapy, Director Commercial Development U.K.,UK, Director Vaccines Business Unit U.K.UK and Business Unit Manager Oncology U.K.UK While at GSK, Mr. Tovey worked across a wide range of therapeutic areas including neurology, infectious diseases, neurology, oncology, diabetes, respiratory, gastroenterology and immunology.
| 92 |
Julian Gangolli has served as our President, North America since his appointment in June 2015. Mr. Tovey holdsGangolli has more than two decades of senior management experience with large pharmaceutical, specialty pharmaceutical, and start-up biotechnology companies. Since July 2016, Mr. Gangolli has served on the board and Audit Committee of Revance Therapeutics, Inc. Prior to joining GW, Mr. Gangolli was, from 2004 until April 2015, President of the North American Pharmaceutical division of Allergan Inc., with responsibility for a BSc. degree1,400-person integrated commercial operation with sales exceeding $3.8 billion in Marine Biology2014. As a Corporate Vice President and member of the Executive Committee, Allergan’s most senior leadership team overseeing worldwide operations, Mr. Gangolli was an integral part of the executive management team that transformed Allergan into one of the leading specialty pharmaceutical companies in the US. Prior to Allergan, Mr. Gangolli was Vice President, Sales and Marketing at VIVUS, Inc. where he established from inception a fully functioning commercial operation. Prior to VIVUS, Mr. Gangolli held roles at Syntex Pharmaceuticals, Inc. and Ortho-Cilag Pharmaceuticals Ltd. in the United Kingdom. Mr. Gangolli was raised in the UK and received a BSc (Honours) in Applied Chemistry from Kingston University of Liverpool.in England.
Non-Employee Directors
James Noble has served as a Non-Executivenon-executive Director since January 2007. Mr. Noble has 20 years ofextensive experience in the biotech industry. Mr. Nobleindustry and currently serves as Chief Executive Officer of Adaptimmune Limited,Therapeutics plc, a privateNASDAQ-listed company (ADAP) involved in T cell therapeutics. Mr. Noble was previously Chief Executive Officer of Avidex Limited, a private biotech company and, until March 2014, was Chief Executive Officer of Immunocore Limited, where he still serves as a non-executive director.Limited. Mr. Noble has previously held numerous non-executive director positions, including at CuraGen Corporation, PowderJect Pharmaceuticals plc, Oxford GlycoSciences plc, MediGene AG and Advanced Medical Solutions plc. Mr. Noble is qualified as a chartered accountant with Price WaterhousePriceWaterhouse in 1983 and then spent seven years at the investment bank Kleinwort Benson Limited, where he became a directorDirector in 1990. He then joined British Biotech plc as Chief Financial Officer and secured the company’s IPO on the Nasdaq Global MarketNASDAQ and London stock exchanges in 1992. From 1997 to 2001, he held numerous non-executive Director positions, including at PowderJect Pharmaceuticals plc, Oxford GlycoSciences plc, MediGene AG, and Advanced Medical Solutions plc. Mr. Noble was previously Chief Executive Officer of Avidex Limited, a privately held biotechnology company. Mr. Noble holds an M.A.graduated from the University of Oxford. Our board of directors believes Mr. Noble’s qualifications to serve as a member of our board include his financial expertise, his extensive experienceOxford in the pharmaceutical industry and his years of experience in his leadership roles as a director and executive officer.1980.
Cabot Brown has served as a Non-Executive Director sincejoined the GW Board in February 2013. Mr. Brown has over 25 years of experience in the financial industry. Mr. Brown is the Founder and Chief Executive Officer of Carabiner LLC, ana strategic and financial advisory and private equity firm based in San Francisco and London that specializes in health carehealthcare and education. Previously, Mr. Brown served as a Managing Director and Head of the Healthcare Group at GCA Savvian, Group Corp., an international financial advisory firm, from 2011 to 2012 where he directed the firm’s efforts in the health care industry.2012. Before joining GCA Savvian, Mr. Brown worked for ten10 years at Seven Hills Group, an investment banking group he co-founded where he also directed the firm’s health carehealthcare activities. He also was Managing Director of Brown, McMillan & Co.,Co, an investment firm he co-founded that sponsored buy-outs and venture capital investments. From 1987 until 1995, Mr. Brown worked at Volpe, Welty & Company, a boutique investment bank where he co-founded and ran the health carehealthcare practice and served as a member of its Executive Committee. Mr. Brown started his finance career in New York, working in the investment banking departments of The First Boston Corporation and Lehman Brothers. Mr. Brown holds an M.B.A.MBA from Harvard Business School with high distinction as a George F.F Baker Scholar and an A.B.AB cum laude in Government from Harvard College. Our board of directors believes Mr. Brown’s qualifications to serve as a member of our board include his financial expertise, his extensive experience in the health care industry and his years of experience in his leadership roles as a director and executive officer.
Thomas Lynch has served as a Non-Executivenon-executive Director since July 2010. Mr. Lynch has over 19 years of experience in the biotechnology industry. Mr. Lynch currently serves as Chairman and non-executive Director of ICON plc, a clinical research company, and Profectus BioSciencesEvofem Biosciences Inc., a company conducting research into immunological diseasesexecutive Director of Profectus Biosciences, Inc. and is Chairman of Chrontech AB,the Ireland East Healthcare Group. Mr. Lynch serves on the board of a Swedish company conducting research in infectious diseases. Previously,number of other privately held biotechnology companies. Mr. Lynch previously served as Chairman and Chief Executive Officer of Amarin from 2000 and 2007, respectively, until December 2009. During his tenure as Chief Executive Officer,Icon plc, having served on its board for 22 years. Mr. Lynch led the repositioning of Amarin as a cardiovascular company, over $100 million in equity financings and the de-listing of Amarin’s shares from the AIM while maintaining the company’s primary listing on Nasdaq. Mr. Lynch continues as Chairman of Amarin Pharmaceuticals (Ireland) Limited, having stepped down from its parent board of directors in October 2010. From 1993 to 2004, Mr. Lynchhas also worked in a variety of capacities in Amarin Corporation plc, Elan Corporation plc including Chief Financial Officer, Executive Vice-President, Vice-Chairman and senior adviser.Warner Chilcott plc from 2001 to 2010. Mr. Lynch holds an economics degree from Queen’s University Belfast. Our board of directors believes Mr. Lynch’s qualifications to serve aswas a member of our board include his extensive experience in the pharmaceutical industry and his yearsBoard of experience in his leadership roles as a director and executive officer.IDA Ireland (an Irish government investment agency).
| 93 |
| B. | Compensation. |
The following discussion provides the amount of compensation paid, and benefits in‒kind granted, by us and our subsidiaries to our directors and members of the executive management board for services in all capacities to us and our subsidiaries for the year ended September 30, 2014,2016, as well as the amount contributed by us or our subsidiaries into money purchase plans for the year ended September 30, 20142016 to provide pension, retirement or similar benefits to, our directors and members of the executive management board.
Directors and Executive Management Board Compensation
Directors Compensation
For the year ended September 30, 2014,2016, the table below sets forth the compensation paid to our directors, and, in the case of Messrs. Guy, Gover, Wright and George, reflects the compensation paid for their services as our executives.
Year Ended September 30, 20142016 Directors Compensation(1)
Compensation(1)
| Name | Salary/Fees | Annual Bonus | Benefit(3) Excluding Pension | Pension Benefit | Total | Salary/Fees | Annual Bonus | Benefit Excluding Pension(2) | Pension Benefit(3) | Total | ||||||||||||||||||||||||||||||
| £ | £ | £ | £ | £ | £ | £ | £ | £ | £ | |||||||||||||||||||||||||||||||
| Dr. Geoffrey Guy | 364,265 | 331,839 | 4,584 | 53,248 | 753,936 | |||||||||||||||||||||||||||||||||||
| Executive Director Chairman | 353,860 | 167,342 | 28,475 | 54,416 | 604,093 | |||||||||||||||||||||||||||||||||||
| Justin Gover | 294,896 | 272,875 | 3,014 | 44,868 | 615,653 | |||||||||||||||||||||||||||||||||||
| Executive Director Chief Executive Officer | 311,921 | 146,720 | 32,854 | 52,993 | 544,488 | |||||||||||||||||||||||||||||||||||
| Adam George | 204,763 | 185,000 | 2,839 | 28,535 | 421,137 | |||||||||||||||||||||||||||||||||||
| Executive Director Chief Financial Officer | 197,276 | 93,293 | 17,699 | 30,337 | 338,605 | |||||||||||||||||||||||||||||||||||
| Dr. Stephen Wright | 248,001 | 227,287 | 6,827 | 40,670 | 522,785 | |||||||||||||||||||||||||||||||||||
| Executive Director Research and Development Director | ||||||||||||||||||||||||||||||||||||||||
| Executive Director Chief Medical Officer | 242,370 | 114,618 | 20,180 | 39,830 | 416,998 | |||||||||||||||||||||||||||||||||||
| Chris Tovey | 220,970 | 200,850 | 2,975 | 35,940 | 460,735 | |||||||||||||||||||||||||||||||||||
| Executive Director Chief Operating Officer | 214,179 | 101,287 | 17,817 | 35,198 | 368,481 | |||||||||||||||||||||||||||||||||||
| Julian Gangolli | ||||||||||||||||||||||||||||||||||||||||
| Executive Director President, North America | 274,997 | 72,658 | 1,159 | 1,664 | 350,478 | |||||||||||||||||||||||||||||||||||
| James Noble | 61,984 | — | — | — | 61,984 | |||||||||||||||||||||||||||||||||||
| Non-Executive Director Deputy Chairman | 63,500 | - | - | - | 63,500 | |||||||||||||||||||||||||||||||||||
| Cabot Brown | 55,250 | — | — | — | 55,250 | |||||||||||||||||||||||||||||||||||
| Non-Executive Director | 51,294 | - | - | - | 51,294 | |||||||||||||||||||||||||||||||||||
| Thomas Lynch(4) | — | — | — | — | — | |||||||||||||||||||||||||||||||||||
| Thomas Lynch(5) | ||||||||||||||||||||||||||||||||||||||||
| Non-Executive Director | - | - | - | - | - | |||||||||||||||||||||||||||||||||||
| (1) | For the year ended September 30, |
| (2) | For our Executive Directors, these amounts represent the value of the personal benefits granted to our senior management for the year ended September 30, |
| 94 |
| (3) | These amounts represent our contribution into money purchase plans. |
| (4) | The Remuneration Committee has agreed to indemnify the incremental US tax suffered by Mr. Gover that he is likely to suffer in respect of the gain on exercising options arising from the September 2013 LTIP award. Further details are provided in Note 27 to our consolidated financial statements. |
| (5) | Mr. Lynch has waived his right to receive |
Executive Management Compensation
The compensation for each member of our executive management board is comprised of the following elements: base salary, annual bonus, personal benefits and long-term incentives. The total amount of compensation paid and benefits in kind granted to the members of our executive management board, whether or not a director, for the year ended September 30, 20142016 was £2.9£2.7 million.
Bonus Plans
The discussion set forth below describes each bonus plan pursuant to which compensation was paid to our directors and members of our executive management board for our last full year.
Executive Directors are eligible for an annual bonus at the discretion of the Remuneration Committee. Bonus awards are reviewed at the end of each calendar year and any such awards are determined by the performance of the individual and the Group as a whole based upon the achievement of strategic objectives set at the beginning of the year. The awards are normally limited to a maximum of 50% of basic salary, however in exceptional circumstances the annual maximum may increase up to 100%150% of base salary.
Outstanding Equity Awards, Grants and Option Exercise
During the year ended September 30, 2014, 303,4182016 3,063,893 options to purchase ordinary shares were awarded to the directors under our Long Term Incentive Plan.
| Name of Director | Type of Plan | Granted | Nominal value | Exercise price | Date of exercise | Date of expiry | ||||||||||||
| Dr. Geoffrey W. Guy | LTIP | 182,171 | 0.1 | p | 257.0 | p | February 15, 2019 | February 15, 2026 | ||||||||||
| LTIP | 25,914 | 0.1 | p | 0.1 | p | February 15, 2017 | February 15, 2026 | |||||||||||
| LTIP | 25,914 | 0.1 | p | 0.1 | p | February 15, 2018 | February 15, 2026 | |||||||||||
| LTIP | 345,517 | 0.1 | p | 0.1 | p | February 15, 2019 | February 15, 2026 | |||||||||||
| LTIP | 25,914 | 0.1 | p | 0.1 | p | February 15, 2019 | February 15, 2026 | |||||||||||
| LTIP | 25,913 | 0.1 | p | 0.1 | p | February 15, 2020 | February 15, 2026 | |||||||||||
| Justin Gover | LTIP | 213,245 | 0.1 | p | 257.0 | p | February 15, 2019 | February 15, 2026 | ||||||||||
| LTIP | 30,334 | 0.1 | p | 0.1 | p | February 15, 2017 | August 15, 2017 | |||||||||||
| LTIP | 30,334 | 0.1 | p | 0.1 | p | February 15, 2018 | August 15, 2018 | |||||||||||
| LTIP | 404,455 | 0.1 | p | 0.1 | p | February 15, 2019 | August 15, 2019 | |||||||||||
| LTIP | 30,334 | 0.1 | p | 0.1 | p | February 15, 2019 | August 15, 2019 | |||||||||||
| LTIP | 30,334 | 0.1 | p | 0.1 | p | February 15, 2020 | August 15, 2020 | |||||||||||
| Adam George | LTIP | 67,707 | 0.1 | p | 257.0 | p | February 15, 2019 | February 15, 2026 | ||||||||||
| LTIP | 9,631 | 0.1 | p | 0.1 | p | February 15, 2017 | February 15, 2026 | |||||||||||
| LTIP | 9,631 | 0.1 | p | 0.1 | p | February 15, 2018 | February 15, 2026 | |||||||||||
| LTIP | 128,417 | 0.1 | p | 0.1 | p | February 15, 2019 | February 15, 2026 | |||||||||||
| LTIP | 9,631 | 0.1 | p | 0.1 | p | February 15, 2019 | February 15, 2026 | |||||||||||
| LTIP | 9,632 | 0.1 | p | 0.1 | p | February 15, 2020 | February 15, 2026 | |||||||||||
| Dr. Stephen Wright | LTIP | 83,183 | 0.1 | p | 257.0 | p | February 15, 2019 | February 15, 2026 | ||||||||||
| LTIP | 11,833 | 0.1 | p | 0.1 | p | February 15, 2017 | February 15, 2026 | |||||||||||
| LTIP | 11,833 | 0.1 | p | 0.1 | p | February 15, 2018 | February 15, 2026 | |||||||||||
| LTIP | 157,771 | 0.1 | p | 0.1 | p | February 15, 2019 | February 15, 2026 | |||||||||||
| LTIP | 11,833 | 0.1 | p | 0.1 | p | February 15, 2019 | February 15, 2026 | |||||||||||
| LTIP | 11,832 | 0.1 | p | 0.1 | p | February 15, 2020 | February 15, 2026 | |||||||||||
| Chris Tovey | LTIP | 73,508 | 0.1 | p | 257.0 | p | February 15, 2019 | February 15, 2026 | ||||||||||
| LTIP | 10,456 | 0.1 | p | 0.1 | p | February 15, 2017 | February 15, 2026 | |||||||||||
| LTIP | 10,456 | 0.1 | p | 0.1 | p | February 15, 2018 | February 15, 2026 | |||||||||||
| LTIP | 139,420 | 0.1 | p | 0.1 | p | February 15, 2019 | February 15, 2026 | |||||||||||
| LTIP | 10,457 | 0.1 | p | 0.1 | p | February 15, 2019 | February 15, 2026 | |||||||||||
| LTIP | 10,457 | 0.1 | p | 0.1 | p | February 15, 2020 | February 15, 2026 | |||||||||||
| Julian Gangolli | LTIP | 192,755 | 0.1 | p | 257.0 | p | February 15, 2019 | February 15, 2026 | ||||||||||
| LTIP | 27,419 | 0.1 | p | 0.1 | p | February 15, 2017 | August 15, 2017 | |||||||||||
| LTIP | 27,419 | 0.1 | p | 0.1 | p | February 15, 2018 | August 15, 2018 | |||||||||||
| LTIP | 365,591 | 0.1 | p | 0.1 | p | February 15, 2019 | August 15, 2019 | |||||||||||
| LTIP | 27,419 | 0.1 | p | 0.1 | p | February 15, 2019 | August 15, 2019 | |||||||||||
| LTIP | 27,420 | 0.1 | p | 0.1 | p | February 15, 2020 | August 15, 2020 | |||||||||||
| James Noble | LTIP | 68,122 | 0.1 | p | 383.0 | p | December 29, 2018 | December 29, 2025 | ||||||||||
| LTIP | 14,479 | 0.1 | p | 0.1 | p | December 29, 2018 | December 29, 2025 | |||||||||||
| Cabot Brown | LTIP | 68,122 | 0.1 | p | 383.0 | p | December 29, 2018 | June 29, 2019 | ||||||||||
| LTIP | 14,479 | 0.1 | p | 0.1 | p | December 29, 2018 | June 29, 2019 | |||||||||||
| Thomas Lynch | LTIP | 68,122 | 0.1 | p | 383.0 | p | December 29, 2018 | December 29, 2025 | ||||||||||
| LTIP | 14,479 | 0.1 | p | 0.1 | p | December 29, 2018 | December 29, 2025 | |||||||||||
| 95 | |||||||||||||||||||
As of September 30, 2014,2016, directors held options to purchase 5,942,1986,528,449 ordinary shares. During the year ended September 30, 2014,2016, directors exercised and sold options over 1,885,9111,729,792 ordinary shares.
We periodically grant share options to employees, including executive officers,directors and consultants to enable them to share in our successes and to reinforce a corporate culture that aligns employee interests with that of our shareholders. Since September 30, 2011, we have granted a number of additional options to purchase ordinary shares to 215 employees who are not members of our executive management board.
Options issued under our Long Term Incentive Plan generally have an exercise price of £0.001 per share and a three-year vesting period (although this could be shorter) and expire ten years from the date of grant.grant (save in relation to options granted to a participant subject to the federal income tax laws of the United States, which may only be exercised for a short period following vesting). Generally, these options are also subject to a number of different performance conditions. If the relevant performance conditions are not achieved by the three-year vesting date, the options lapse. In addition, generally, an option holder must remain an employee, director or consultant throughout the relevant vesting period, or the options will lapse. Options issued under the other share option schemes were all issued with an exercise price equal to the closing market price on the day prior to grant, a three-year vesting period and an expiration ten years from date of grant. The only condition linked to these awards was continued employment throughout the vesting period.
Pension, Retirement and Similar Benefits
For the year ended September 30, 2014,2016, we and our subsidiaries contributed a total of £0.2 million into money purchase plans to provide pension, retirement or similar benefits to our directors and members of the executive management board. The Group does not operate any pension plans directly.
Employment Agreements
Dr. Geoffrey Guy
On March 14, 2013, GW Research Limited entered into a service agreement with Dr. Guy, our Chairman and Founder. Dr. Guy’s service agreement provides that his service will continue until either party provides no less than 12 months’ written notice. Upon notice of termination, GW Research Limited may require Dr. Guy not to attend work for all or any part of the period of notice, during which time he will continue to receive his salary and other contractual entitlements. GW Research Limited may terminate Dr. Guy’s employment with immediate effect at any time by notice in writing for certain circumstances as described in his service agreement, including bankruptcy, criminal convictions, gross misconduct or serious or repeated breaches of obligations of his service.
Dr. Guy’s service agreement provides for a base salary of £341,794 per annum (to be reviewed annually), a car allowance of £24,960 per annum, plus a monthly pension contribution of 17.5% of salary, permanent health insurance coverage, life assurance coverage and private health insurance, and a bonus on such terms and of such amount as approved from time to time by the Remuneration Committee in its sole discretion. Dr. Guy’s service agreement provides that for 12 months following termination of his employment with GW Research Limited, he will not entice, induce or encourage any customer or employee to end their relationship with GW Research Limited or any other member of the Group, solicit or accept business from customers or engage in competitive acts more fully described in his service agreement.
| 96 |
Justin Gover
On February 26, 2013, GW Research Limited entered into a service agreement with Mr. Gover, our Chief Executive Officer. Mr. Gover’s service agreement provides that his service will continue until either party provides no less than 12 months’ written notice. Upon notice of termination, GW Research Limited may require Mr. Gover not to attend work for all or any part of the period of notice, during which time he will continue to receive his salary and other contractual entitlements. GW Research Limited may terminate Mr. Gover’s employment with immediate effect at any time by notice in writing for certain circumstances as described in his service agreement, including bankruptcy, criminal convictions, gross misconduct or serious or repeated breaches of obligations of his service.
Mr. Gover’s service agreement provides for a base salary of £281,061 per annum (to be reviewed annually), plus a monthly pension contribution of 17.5% of salary, car allowance of £15,600 per annum, permanent health insurance coverage, life assurance coverage and private health insurance, and a bonus on such terms and of such amount as approved from time to time by the Remuneration Committee in its sole discretion.
Mr. Gover’s service agreement provides that, for 12 months following termination of his employment with GW Research Limited, he will not entice, induce or encourage any customer or employee to end their relationship with GW Research Limited or any other member of the Group, solicit or accept business from customers or engage in competitive acts more fully described in his service agreement.
On July 21, 2015, (i) this service agreement was novated to GW Pharmaceuticals plc by GW Research Limited and at the same time Mr. Gover’s commitment to GW Pharmaceutical plc was reduced to no more than 30 days per annum, to be worked outside the United States, and his base salary was reduced pro rata to £33,079 ($51,482) per annum (to be reviewed annually) and his entitlement to a car allowance and private health insurance from GW Pharmaceuticals plc were removed, and (ii) Greenwich Biosciences Inc. (formerly GW Pharmaceuticals Inc.), entered into a service agreement with Mr. Gover, which provides that his service will continue until either party provides no less than 12 months’ written notice. Upon notice of termination, Greenwich Biosciences Inc. may require Mr. Gover not to attend work for all or any part of the period of notice, during which time he will continue to receive his salary and other contractual entitlements. GW Research Limited may terminate Mr. Gover’s employment with immediate effect at any time by notice in writing for certain circumstances as described in his service agreement, including bankruptcy, criminal convictions, gross misconduct or serious or repeated breaches of obligations of his service.
Mr. Gover’s service agreement with Greenwich Biosciences Inc. provides for a base salary of $446,177 per annum less the amount to be paid to Mr. Gover by GW Pharmaceuticals plc in the UK in respect of his role as its Chief Executive Officer (initially $51,482 per annum), plus a monthly pension contribution of 17.5% of salary once Greenwich Biosciences Inc. has established its 401(k) Plan, car allowance of $24,279 per annum, permanent health insurance coverage, life assurance coverage and private health insurance, and a bonus on such terms and of such amount as approved from time to time by the Remuneration Committee in its sole discretion.
Dr. Stephen Wright
On January 18, 2013, GW Research Limited entered into a service agreement with Dr. Stephen Wright, our Research and Development Director.Chief Medical Officer. The service agreement provides that his service will continue until either party provides no less than 12 months written notice. Upon notice of termination, GW Research Limited may require Dr. Wright not to attend work for all or any part of the period of notice, during which time he will continue to receive his salary and other contractual entitlements. GW Research Limited may terminate Dr. Wright’s employment with immediate effect at any time by notice in writing for certain circumstances as described in his service agreement, including bankruptcy, criminal convictions, gross misconduct or serious or repeated breaches of obligations of his service.
Dr. Wright’s service agreement provideprovides for a base salary of £234,106 per annum (to be reviewed annually), plus a monthly pension contribution of 17.5% of salary, a car allowance of £15,600 per annum, life assurance coverage, the cost of membership for Dr. Wright, his spouse and children in a private patients medical plan, access to a permanent health insurance plan, and a bonus on such terms and of such amount as approved from time to time by the Remuneration Committee in its sole discretion.
| 97 |
Dr. Wright’s service agreement provides that for 12 months following termination of his employment with GW Research Limited, he will not entice, induce or encourage any customer or employee to end their relationship with GW Research Limited or any other member of the Group, solicit or accept business from customers or engage in competitive acts more fully described in his service agreement.
On 9 August 2016 we announced that Dr. Stephen Wright will step down from his position as Chief Medical Officer and a member of the Board of Directors on 1 May 2017. Dr. Wright will remain in post full-time until May 2017 and will thereafter stay on as a part time employee of the Company throughout the NDA process for Epidiolex, in which he will continue to take a leading and active role.
Adam George
On June 1, 2012, GW Pharma Limited entered into a service agreement with Mr. George, our Chief Financial Officer. The service agreement provides for a base salary of £190,550 per annum (to be reviewed annually), plus a monthly pension contribution of 17.5% of salary, a car allowance of £15,600 per annum, life assurance coverage, the cost of membership for Mr. George, his spouse and children in a private patients medical plan, access to a permanent health insurance plan, and a discretionary bonus on such terms and of such amount as decided from time to time by the Remuneration Committee in its sole discretion.
Mr. George’s service agreement provides that, his service will continue until either party provides no less than 12 monthsmonths’ written notice. Upon notice of termination, GW Pharma Limited may require Mr. George not to attend work for all or any part of the period of notice, during which time he will continue to receive his salary and other contractual entitlements. GW Pharma Limited may terminate Mr. George’s employment with immediate effect at any time by notice in writing for certain circumstances as described in his service agreement, including bankruptcy, criminal convictions, gross misconduct or serious or repeated breaches of obligations of his service.
Mr. George’s service agreement provides that for a period of 12 months following termination of his employment with GW Pharma Limited, he will not entice, induce or encourage any customer or employee to end their relationship with GW Pharma Limited or any member of the Group, solicit or accept business from customers or engage in competitive acts more fully described in his service agreement.
Chris Tovey
On July 11, 2012, GW Pharma Limited entered into a service agreement with Mr. Tovey, our Chief Operating Officer. The service agreement provides for a base salary of £206,876 per annum (to be reviewed annually), plus a monthly pension contribution of 17.5% of salary, a car allowance of £15,600 per annum, life assurance coverage, the cost of membership for Mr. Tovey, his spouse and children in a private patients medical plan, access to a permanent health insurance plan, and a discretionary bonus on such terms and of such amount as decided from time to time by the Remuneration Committee in its sole discretion.
Mr. Tovey’s service agreement provides that his service will continue until either party provides no less than 12 months’ written notice. Upon notice of termination, GW Pharma Limited may require Mr. Tovey not to attend work for all or any part of the period of notice, during which time he will continue to receive his salary and other contractual entitlements. GW Pharma Limited may terminate Mr. Tovey’s employment with immediate effect at any time by notice in writing for certain circumstances as described in his employment agreement, including bankruptcy, criminal convictions, gross misconduct, or serious or repeated breaches of obligations to his service.
Mr. Tovey’s service agreement provides that for a period of 12 months following termination of his employment with GW Pharma Limited, he will not entice, induce or encourage any customer or employee to end their relationship with GW Pharma Limited or any other member of the Group, solicit or accept business from customers or engage in competitive acts more fully described in his service agreement.
Julian Gangolli
On May 6, 2015, Greenwich Biosciences Inc. (formerly GW Pharmaceuticals Inc.) entered into a service agreement with Mr. Gangolli, our President, North America. Mr. Gangolli’s service agreement provides that his service will continue until either party provides no less than one month’s written notice. Upon notice of termination, Greenwich Biosciences Inc. may pay Mr. Gangolli his salary in lieu of giving a month’s written notice.
| 98 |
Mr. Gangolli’s service agreement with Greenwich Biosciences Inc. provides for a base salary of $400,000 per annum (to be reviewed annually), less any amounts paid under his service agreement with GW Pharmaceuticals plc (described below), a bonus on such terms and of such amount as approved from time to time by the Remuneration Committee in its sole discretion, plus life assurance coverage, matching contributions to a 401(k) plan and private health insurance once Greenwich Biosciences Inc. has established these benefit programs.
On July 21, 2015, GW Pharmaceuticals plc entered into a service agreement with Mr. Gangolli for Mr. Gangolli to provide GW Pharmaceuticals plc with no fewer than 12 days of work per annum, to be worked outside the United States. The Service Agreement provides for a base salary of $1,550 per day (to be reviewed annually).
Mr. Gangolli’s service agreement with GW Pharmaceuticals plc provides that his service will continue until either party provides no less than 6 months’ written notice. Upon notice of termination, GW Pharmaceuticals plc may require Mr. Gangolli not to attend work for all or any part of the period of notice. GW Pharmaceuticals plc may terminate Mr. Gangolli’s employment with immediate effect at any time by notice in writing for certain circumstances as described in his service agreement, including bankruptcy, criminal convictions, gross misconduct serious or repeated breaches of obligations of his service.
Mr. Gangolli’s service agreement with GW Pharmaceuticals plc provides that, for 12 months following termination of his employment with GW Pharmaceuticals plc, he will not entice, induce or encourage any customer or employee to end their relationship with GW Pharmaceuticals plc or any other member of the Group, solicit or accept business from customers or engage in competitive acts more fully described in his service agreement.
James Noble
On January 19, 2007, GW Pharmaceuticals plc appointed Mr. Noble Deputy Chairman and Non-Executive Director with effect from January 26, 2007. On February 26, 2013,1, 2016, GW Pharmaceuticals plc entered into an appointment letter with Mr. Noble, which continues for no specific duration. The appointment letter provides for Director’s fees of £65,000£63,000 per annum, plus reimbursement for all reasonable out-of-pocket expenses incurred on GW Pharmaceutical plc business and director’s and officer’s liability insurance, subject to the provisions governing such insurance and on such terms as our board of directors may from time to time decide. Mr. Noble’s agreement provides that he is not entitled to participate in any pension or employee share schemesscheme and is not eligible for any other employee benefits. Mr. Noble is eligible to participate in the Company’s Long Term Incentive Plan under its rules.
Mr. Noble’s appointment letter provides that his appointment will continue until either party provides no less than three months’ written notice and that he should be prepared to spend at least 12 days per year on company business. Mr. Noble’s appointment may be automatically terminated if he is removed from office by a resolution of the shareholders, is not re-elected to office, vacates his office, commits any act that would justify summary termination of an employment contract, or is unable to perform his duties under his appointment for six months consecutively or in aggregate in any period of one year. Mr. Noble’s agreementappointment letter provides that GW Pharmaceuticals plc may, during any period of notice, ask Mr. Noble not to attend any board or general meetings or to perform any other services on its behalf. The agreementappointment letter includes a non-compete clause, to take effect on termination, for 12 months following termination of his office.
Cabot Brown
We originally appointed Mr. Brown as a Non-Executive Director on February 19, 2013. Mr. Brown serves as a member of the Audit Committee, the Remuneration Committee and Nominations Committee.
On November 7, 2013,January 1, 2016, GW Pharmaceuticals plc entered into an appointment letter with Mr. Brown, entered into a new employment contract with GW Pharmaceuticals Inc., the termswhich continues for no specific duration. The appointment letter provides for Director’s fees of which provide for an agreed salary of £58,000$70,000 plus reimbursement for all reasonable out‒of‒pocket expenses incurred on GW Pharmaceuticals Inc.’splc’s business and director’s and officer’s liability insurance, subject to the provisions governing such insurance and on such terms as GW Pharmaceuticals Inc.’sour board of directors may from time to time decide. The contractMr. Brown’s appointment letter provides that he is not entitled to participate in any pension and will not be eligible for other employee benefits. Mr. Brown is eligible to participate in the Company’s Long Term Incentive Plan under its rules.
| 99 |
Mr. Brown’s contractappointment letter also provides that his employmentappointment will continue until either party provides no less than three months’ written notice and that he should be prepared to spend at least 12 days per year attending board and general meetings of GW Pharmaceuticals plc representing GW Pharmaceuticals Inc.’s business interests.plc. Mr. Brown’s appointment may be automatically terminated if he is removed from office as a director of GW Pharmaceuticals plc by a resolution of the shareholders, is not re-elected to office, vacates his office, commits any act that would justify summary termination of an employment contract or if he is unable to perform his duties under his appointment for six months consecutively or in aggregate in any period of one year. Mr. Brown’s employment contractappointment letter provides that GW Pharmaceuticals Inc.plc may, during any period of notice, ask Mr. Brown not to attend any board or general meetings or to perform any other services on its behalf. The contractappointment letter includes a non-compete clause, to take effect on termination, for one year.
Thomas Lynch
On July 22, 2010, GW Pharmaceuticals plc appointed Mr. Lynch a Non-Executive Director. On February 26, 2013, Mr. Lynch entered into an updated appointment letter with GW Pharmaceuticals plc, which continues for no specific duration. Mr. Lynch has waived his right to receive remunerationfees for this role. Mr. Lynch’s agreement provides for reimbursement for all reasonable out-of-pocket expenses incurred on GW Pharmaceutical plc business and director’s and officer’s liability insurance, subject to the provisions governing such insurance and on such terms as our Board of Directors may from time to time decide. Mr. Lynch’s agreement provides that he is not entitled to participate in any pension or employee share schemes and is not eligible for any other employee benefits. Mr. Lynch is eligible to participate in the Company’s Long Term Incentive Plan under its rules.
Mr. Lynch’s agreementappointment letter provides that his appointment will continue until either party provides no less than three months’ written notice and that he should be prepared to spend at least 12 days per year on company business. Mr. Lynch’s appointment may be automatically terminated if he is removed from office by a resolution of the shareholders, is not re-elected to office, vacates his office, commits any act that would justify summary termination of an employment contract or if he is unable to perform his duties under his appointment for six months consecutively or in aggregate in any period of one year.
Mr. Lynch’s agreementappointment letter provides that GW Pharmaceuticals plc may, during any period of notice, ask Mr. Lynch not to attend any board or general meetings or to perform any other services on its behalf. The agreement includes a non-compete clause, to take effect on termination, for 12 months following termination of his office.
Equity Compensation Plans
GW Pharmaceuticals plc Long-Term Incentive Plan
Our board of directors adopted and our shareholders approved the GW Pharmaceuticals plc Long-Term Incentive Plan, or the Long-Term Incentive Plan, on March 18, 2008.2008, and it has subsequently been amended in accordance with its terms.. The Long-Term Incentive Plan permits participating employees to purchase Investment Shares and provides for the grant of Matching Awardsawards over our ordinary shares to be granted to our employees, directors and Performance Awards, or, collectively,consultants, referred to in this annual report as Awards, all summarized below.
Investment Shares. The Remuneration Committee may invite any eligible employee to participate in the Long-Term Incentive Plan by purchasing ordinary shares, which are referred to as Investment Shares in this Annual Report. The invitation will specify the maximum amountTypes of Investment Shares which can be purchased, the procedure for purchasing the Investment Shares, the maximum number of ordinary shares which may be received as a Matching Award and other terms of the award. A “Return Date” will also be specified which is the date by which the invitation to participate must be accepted. As soon as practicable after the Return Date, we procure the Investment Shares. The participant will have full rights with respect to the Investment Shares. Any ordinary shares subject to a Matching Award with respect to Investment Shares will be transferred to the participant when the Matching Award vests.
Matching Awards and Performance Awards.Award. Under the Long-Term Incentive Plan, the Remuneration Committee may grant Matching Awards (which are granted in connection with invitations to participants to acquire Investment Shares, see the following paragraph) or Performance Awards and will designate(awards other than Matching Awards). Awards are in the typeform of award prior to the date on which the award is granted. The Remuneration Committee will also specify whether an Award is a Conditional Award oreither an option to purchase our ordinary shares, referred to in this Annual Report as an Option; provided, however, that if the Remuneration Committee does not specify the typeOption or a conditional right to acquire a number of Award, the Award will beour ordinary shares for no payment upon vesting, referred to in the form of an Option.this Annual Report as a Conditional Award. Awards may be granted only within the six weeks beginning with the dealing date after the date on which we announce our results for any period or at any other time that the Committee determines that the circumstances justify the grant. The Remuneration Committee may determine that any Conditional Award or Option may be settled in cash rather than ordinary shares unless it would be unlawful to do so or if it would cause adverse tax or social security contribution consequences for the participant or us or our affiliates.
| 100 |
Matching Awards and Investment Shares.The Remuneration Committee may invite any eligible employee to participate in the Long-Term Incentive Plan by purchasing ordinary shares, which are referred to as Investment Shares in this Annual Report. The invitation will specify the maximum amount of Investment Shares which can be purchased, the procedure for purchasing the Investment Shares, the maximum number of ordinary shares which may be received as a Matching Award and other terms of the Award. A “Return Date” will also be specified which is the date by which the invitation to participate must be accepted. As soon as practicable after the Return Date, we procure the acquisition of the Investment Shares and the participant is granted a Matching Award. The participant will have full rights with respect to the Investment Shares. Any ordinary shares subject to a Matching Award with respect to Investment Shares will be transferred to the participant when the Matching Award vests.
Vesting of Awards. Awards generally vest on the later of the date on which the Remuneration Committee determines whether any applicable performance conditions or other vesting condition have been met or the third anniversary of the grant date (or such other date as the Remuneration Committee may determine prior to the grant of the applicable Award)Award, which may be before the third anniversary of the grant date). In addition, a Matching Award will lapse on the date on which the participant does any act in breach of the terms relating to Investment Shares or loses his entitlement to, transfers, charges or otherwise disposes of the Investment Shares to which the Matching Award relates and the lapse shall be pro rata to the number of the affected Investment Shares. Options, once vested, will generally remain exercisable until the tenth anniversary of the grant date (subject to earlier lapse in accordance with the rules), however Options granted to a participant who is subject to the federal income tax laws of the United States may only be exercised for a short period following vesting.
If a participant ceases to be a director or employee of, or a consultant to, us or our affiliates before the normal vesting date of an Award by reason of (i) death, (ii) retirement with the agreement of the Remuneration Committee (in the case of our executive directors or senior management) or the employer or company to whom the participant provides services (in the case of other participants), (iii) ill health, injury or disability, (iv) redundancy, (v) his office, employment or employmentconsultancy contract is with a company that ceases to be one of our affiliates or relating to a business or part of a business which is transferred to an unrelated third party or (vi) for any other reason that the Remuneration Committee determines, then the Award will vest on the normal vesting date unless the Remuneration Committee decides that the Award will vest on the date specified in paragraphs (i) through (vi) aboveof cessation (and an Option could generally be exercised for six months thereafter). If a participant ceases to be a director, employee or employeeconsultant in other circumstances, the Award will lapse immediately upon cessation of service. Special rules apply to determine the number of ordinary shares that will vest in any specified circumstances, including application of any performance conditions.
Limits on Ordinary Shares and Awards.No Award may be made under the Long-Term Incentive Plan in any calendar year if, at the time of the proposed grant date, it would cause the number of our ordinary shares allocated on or after June 28, 2001 and in the period of ten calendar years ending with that calendar year under the Long-Term Incentive Plan, any other employee share plan operated by us or any other share incentive arrangement operated by us for the benefit of directors or consultants to any participating company to exceed ten percent of our ordinary share capital in issue at that time. Ordinary shares are generally considered to be allocated if they are subject to outstanding options to acquire unissued shares or treasury shares, if they are issued or transferred from treasury otherwise than pursuant to an option or other right to acquire the ordinary shares, or, in certain circumstances, if they are issued or may be issued to any trustees to satisfy the grant of an option or other contractual right. Existing shares other than treasury shares that are transferred or over which options or other contractual rights are granted are not treated as allocated. Special rules apply to the determination of whether shares are allocated in the case of awards that expire or are settled in cash or where institutional investor guidelines cease to require the shares to be counted as allocated. In addition, the aggregate number of shares in relation to which Awards may be made pursuant to the Long-Term Incentive Plan after March 14, 2013 shall not exceed 15 million.
Except as otherwise determined by the Committee for exceptional circumstances (such as recruitment or retention),As approved at our Annual General Meeting on February 5, 2015, the maximum total market value of our ordinary shares over which Award may be granted to any director, employee or consultant during any year is 100%600% of such person’s base salary or fees. These Awards can now include restricted stock options which have service but no other performance conditions. The expected value of an Award shall be calculated as at the employee’s base salary.date of grant in accordance with generally accepted methodologies based on Black Scholes or binomial stochastic models.
| 101 |
Takeovers and Corporate Events. If a person or group obtains control of us pursuant to a general offer to acquire our ordinary shares or has obtained control of us and then makes such an offer or such an offer becomes unconditional in all respects, then the Remuneration Committee will notify all participants and all Awards will vest on the date determined by the Remuneration Committee (but no later than the date of the change in control or offer becoming unconditional) and any Option can be exercised within one month after such early vesting date. Special vesting rules apply in the context of a winding up of us or in the event of a demerger, special dividends or other events which, in the opinion of the Remuneration Committee would affect the market price of our ordinary shares to a material extent. In certain cases,exceptional circumstances, the Remuneration Committee, with the consent of an acquiring company if applicable, may decide before the change of control that an Award will not vest under the special vesting provisions but shall instead be surrendered in consideration for the grant of a new award which the Remuneration Committee determines is equivalent in value to the Award that it replaces. Absent such exceptional circumstances, the Remuneration Committee’s intention is that all Awards will vest. Special rules apply to determine the numbers of ordinary shares that will vest in any specified circumstances, including application of any performance conditions.
Adjustment of Awards. In the event that there is any variation in our share capital or any demerger, special dividend or other similar event which affects the market price of our ordinary shares to a material extent, the Remuneration Committee may make such adjustments as it considers appropriate, taking into account where relevant, any adjustment to the related holding of Investment Shares. Any such adjustments may be made to one or more of the number of ordinary shares subject to an Award, the option price or the number of ordinary shares that may be transferred pursuant to a vested Award which has not yet been settled. Limitations apply to the extent that any such adjustments may reduce the price at which ordinary shares may be purchased pursuant to the exercise of an Option.
Transferability. No award under the Long-Term Incentive Plan may be transferred, assigned, charged or otherwise disposed of (except on death to the recipient’s personal representatives) and will lapse immediately upon an attempt to do so. In addition, an award under the Long-Term Incentive Plan will lapse immediately if the recipient of an Award is declared bankrupt.
Amendment and Termination. The Long-Term Incentive Plan will expire ten years after the date that it was approved by our shareholders and no awards may be granted thereunder after the expiration date. The Committee may, at any time, alter the Long-Term Incentive Plan or the terms of any Award; provided, however, that no alteration to the benefit of a participant or potential participants will be made to the provisions relating to the individual limits on participation, the overall limits on the issue of ordinary shares or transfer of treasury shares, the overall limit on the number of ordinary shares which may be subject to Awards or the foregoing restrictions without approval of our ordinary shareholders. Minor alterations to benefit the administration of the Long-Term Incentive Plan, to take into account changes in law or obtain or maintain favorable tax treatment, exchange control or regulatory treatment for participants or us and our affiliates or alterations to performance conditions are not subject to shareholder approval. Alterations to the disadvantage of participants (other than changes to performance conditions) may not be made unless all participants have the opportunity to approve the change and the change is approved by a majority of the participants. Although performance conditions can generally be altered by the Committee, we have undertaken to consult with our major shareholders prior to altering any performance conditions existing as of January 18, 2008.
GW Pharmaceuticals All Employee Share Scheme
GW Pharma Ltd. (thenLimited (formerly GW Pharmaceuticals Ltd.)Ltd) adopted the GW Pharmaceuticals All Employee Share Scheme, or the Share Scheme, on August 16, 2000 and it was approved by the U.K.’s Inland Revenue on August 25, 2000 as what is now known as an approved share incentive plan. The Share Scheme provides for the grant of awards of our ordinary shares, which may be Free Shares, Matching Shares or Partnership Shares, or, collectively, Share Scheme Awards, all summarized below, in a tax advantageous manner. Dividends payable in relation to Share Scheme Awards may be reinvested as Dividend Shares subject to the scheme. Shares awarded are held by the trustees of the scheme, or the Trustees, in a specially established trust on behalf of the participants. The scheme originally operated over ordinary shares in GW Pharma Ltd,Limited, but following our acquisition of GW Pharma LtdLimited the scheme was amended so that it operated over our ordinary shares.
Eligibility. Generally, employees of GW Pharma or certain of its subsidiaries are eligible to receive Share Scheme Awards under the Plan. In order to satisfy certain U.K. tax rules, certain participants, referred to in this Annual Report as Qualifying Employees, must be invited to participate in the Share Scheme if they are otherwise eligible.
| 102 |
Generally, all Qualifying Employees who are required to be invited (or who have been invited) to participate in ana Share Scheme Award under the Share Scheme will participate on the same terms. We may, however, make awards of Free Shares to Qualifying Employees which vary by reference to their remuneration, length of service or hours worked or by reference to their performance.
Free Shares. The Trustees, with the prior consent of GW Pharma Ltd.Limited., may award Free Shares. The number of Free Shares to be awarded to each Qualifying Employee will be determined by GW Pharma Ltd.Limited. and the initial market value of any such Share Scheme Award in any tax year will not exceed £3,000. The number of Free Shares granted to a Qualifying Employee on any date may be determined by reference to performance allowances. If such performance allowances are used, they will apply to all Qualifying Employees. The Share Scheme sets forth methodologies for determining how to calculate the number of Free Shares that are awarded to a Qualifying Employee by reference to performance allowances. With respect to the grant of Free Shares, a holding period is specified through which a participant who has been granted Free Shares must be bound by the terms of a Free Share agreement. The length of the holding period will not be less than three nor more than five years beginning on the award date and will be the same for all participants who receive a grant at the same time.
Partnership Shares. GW Pharma Ltd.Limited. may invite every Qualifying Employee to enter into an agreement with respect to the grant of Partnership Shares. Partnership Shares are subject to the terms and conditions of the Share Scheme and are not subject to any forfeiture provisions. Participants are required to have amounts deducted from their compensation to pay for Partnership Shares, such amounts referred to in this Annual Report as Partnership Share Money; provided, however, that the maximum amount of Partnership Share Money for any month cannot exceed £125 or such lower figure that may be specified and the total Partnership Share Money for any period during which contributions are accumulated to purchase Partnership Shares such period referred to in this Annual Report as the Accumulation Period, cannot exceed 10% of the payments of salary made to the participant over the Accumulation Period. There may also be a minimum amount of Partnership Share Money for any month (applied uniformly to all participants), which minimum cannot exceed £10. Any Partnership Share Money that is deducted in excess of the limitations, less applicable taxes, will be paid to the participant as soon as practicable.
If there is an Accumulation Period, the maximum number of Partnership Shares that may be acquired for that Accumulation Period will be determined by reference to the lower of the value of our shares at the beginning of the Accumulation Period or the value of ordinary shares on the acquisition date. Any excess Partnership Share Money remaining after purchase of the ordinary shares may, with the agreement of the participant, be carried over to the next Accumulation Period or in other cases be paid to the participant less applicable taxes. The number of Partnership Shares that may be purchased as of any date may be reduced if the applications to purchase exceed the permitted limits.
An employee may withdraw from purchasing Partnership Shares at any time. Unless otherwise specified by the employee, the withdrawal will take effect 30 days after we receive the notice. In the event of a withdrawal, any Partnership Purchase Money held on behalf of the withdrawing employee, less applicable taxes, will be returned to the employee as soon as practicable.
If approval of the Share Scheme is withdrawn or if the Share Scheme is terminated, all Partnership Share Money, less applicable taxes, will be repaid to employees as soon as practicable.
Matching Shares. Matching Shares are granted on the basis set forth in the Partnership Agreement relating to the grant of Partnership Shares. No payment is made by the participants in relation to Matching Shares. Generally, Matching Shares are awarded to all participants on the same basis. In no event will the ratio of Matching Shares to Partnership Shares exceed 2:1.
Dividend Shares. If any dividends are paid in relation to ordinary shares held pursuant to the Share Scheme for participants, GW Pharma LtdLimited may specify that some or all of those dividends shall be applied to purchase Dividend Shares or they may give the participants the choice between such dividends being applied to purchase Dividend Shares or being paid in cash. Special rules apply to reinvestment of dividends. Dividend Shares are subject to a three year holding period.
| 103 |
Limits on Shares and Awards. No ordinary shares will be issued under the Share Scheme if the issue would result in the aggregate number of our ordinary shares which have been allocated under the Share Scheme, any other employees’ share plan adopted by us or any other share incentive arrangements for employees, directors, officers and consultants of our affiliates during the period of ten years ending on the date of the issue to exceed 10% of our ordinary shares then in issue. “Allocated” for these purposes means the grant of options or other rights to acquire ordinary shares which may be satisfied by the issue of new shares, or, where no such rights are granted, the issue of ordinary shares. Rights which have lapsed are no longer taken into account.
Amendment. GW Pharma Ltd.Limited. may, with the Trustees’ written consent, amend the Share Scheme, provided that no amendment which may increase the limits described in the preceding paragraph may be made without the approval of our shareholders. In addition, no amendment may be made which would adversely prejudice to a material extent the rights attached to any ordinary shares awarded, and certain amendments would require the approval of the UK tax authorities.
Reconstructions and Rights Issues. The Share Scheme sets forth special rules that apply in the case of reconstructions and rights issues.
GW Pharmaceuticals Unapproved Share Option Scheme 2001
Our shareholders approved and adopted the GW Pharmaceuticals Unapproved Share Option Scheme 2001, or the Executive Option Scheme, on May 31, 2001. In the United Kingdom, generally, an “unapproved” share option scheme means that it does not qualify for certain tax breaks since it has not been “approved” by the U.K. tax authority, although these terms are now less common for new share schemes, as the approval system has been replaced by a self-certification system for tax advantaged schemes. It was typical for U.K. companies to have both “approved” and “unapproved” share options schemes due, in part, to the individual participation limits found in “approved” schemes. Under the Executive Option Scheme, Options were granted to our employees, such employees referred to in this Annual Report as eligible employees. The scheme terminated on May 31, 2011, and no further options will be granted under the scheme. Termination of the scheme did not affect the rights of existing participants.
Options granted under the Executive Option Scheme may be designated as “EMI Options” which are intended to qualify for advantageous tax treatment as enterprise management incentives under applicable UK tax law. Generally, EMI Options are subject to the same terms and conditions as those that apply to Options. Other terms and conditions may also apply to EMI Options, particularly where the Committee determines that such alternative treatment is appropriate to obtain, protect or maximize beneficial tax or national insurance treatment of the participant, us or our affiliates.
Exercise of Options. Options generally may not be exercised prior to the third anniversary of the grant, however all outstanding options are currently exercisable. If applicable, any performance targets and other conditions on exercise must also be satisfied. Vesting provisions and performance targets may be waived only to the extent provided in the grant terms or, in the case of a performance target, an event occurs which makes the condition more onerous to achieve.
Generally, Options must be exercised while the participant is an eligible employee. In the event, however, that a participant ceases to be an eligible employee as the result of injury, illness or disability, redundancy or retirement on or after attaining his normal retirement age (age 60 or such other date on which he is required to retire pursuant to his employment contract) or at the specific request of his employer, the Option may be exercised during the period of six months (or such longer period as the Committee may specify) commencing on the date he ceases to be an eligible employee. If a participant dies while he is an eligible employee or during the extended exercise period described in the preceding sentence, the participant’s personal representatives may exercise the Option for 12 months after the participant’s death. In all other cases, the Remuneration Committee may permit post-cessation exercise during such period from the date of cessation as they may notify to the participant. All Options lapse upon the tenth anniversary of the date of grant although the Committee has discretion to extend this date by up to 12 months.
| 104 |
Takeovers and Corporate Events. If any person obtaining control of us (as determined in accordance with specified U.K. tax law) as the result of making an offer to acquire all of our issued share capital that is either unconditional or which is made on a condition which, if satisfied will cause the person making the offer to have control of us or a general offer to acquire all of our ordinary shares, any such offer referred to in this document as a Takeover Offer, Options may be exercised within the relevant period after the time the person has obtained control and any conditions subject to which the Takeover Offer have been satisfied. Options may also be exercisable for the relevant period in the event of certain court sanctioned restructurings or amalgamations of us or if another company becomes bound or entitled to acquire our ordinary shares pursuant to certain provisions of U.K. corporate law. If the Remuneration Committee determines that it is likely that we will come under the control of another company such that our ordinary shares will cease to satisfy specified conditions of U.K. tax law, the Remuneration Committee may permit exercise of the Options prior to the change of control.
In the event of a Takeover Offer or court sanctioned restructuring or amalgamation, the participant may, by agreement with the other company, release Options in consideration for the grant of a new option with respect to the acquiring company’s shares and subject to certain other terms and conditions. The Remuneration Committee may also permit exercise of the Options within a relevant period following the date on which we pass a resolution for voluntary winding up or certain other transactions involving a change in control of us.
With respect to any event, the “relevant period” is generally the period of three months or such different period not less than 30 days and not more than six months that the Remuneration Committee may determine in connection with a relevant particular event which may allow Options to be exercised. Options not exercised by the end of that period will lapse.
Adjustment of Awards. In the event that there is any variation in our share capital the Remuneration Committee may make adjustments as it considers fair and reasonable to preserve the participant’s position to the number of ordinary shares subject to an Option and/or the acquisition price and/or the aggregate maximum number of ordinary shares. Limitations apply to the extent to which any such adjustments may reduce the price at which ordinary shares may be purchased pursuant to the exercise of an Option.
Transferability. No Option under the Executive Option Scheme may be transferred, assigned, charged or otherwise disposed of (except on death to the recipient’s personal representatives) and will lapse immediately upon an attempt to do so. In addition, an award under the Executive Option Scheme will lapse immediately if the recipient of an Award is declared bankrupt or if there is a compulsory winding up of us.
Amendment. The Committee may, at any time, alter the Executive Option Scheme.
GW Pharmaceuticals Approved Share Option Scheme 2001
Our shareholders approved and adopted the GW Pharmaceuticals Approved Share Option Scheme 2001, or the “Company Option Scheme”, on May 31, 2001 and it was approved by the U.K.’s Inland Revenue on July 3, 2001. Under the Company Option Scheme, Options were granted to our employees who were not ineligible to participate in the Company Option Scheme under applicable U.K. tax law and who, in the case of a director, is required to work not less than 25 hours per week, such individuals referred to in this Annual Report as Option Scheme eligible employees. The scheme terminated on May 31, 2011, and no further options will be granted under the scheme. Termination of the scheme did not affect the rights of existing participants.
Exercise of Options. Options generally may not be exercised prior to the third anniversary of the grant. All outstanding options, however, are currently exercisable. If applicable, any performance targets and other conditions on exercise must also be satisfied. Vesting provisions and performance targets may be waived only to the extent provided in the grant terms or, in the case of a performance target, an event occurs which makes the condition more onerous to achieve.
Generally, Options must be exercised while the participant is an Option Scheme eligible employee. In the event, however, that a participant ceases to be an Option Scheme eligible employee as the result of injury, illness or disability, redundancy or retirement on or after attaining his normal retirement age (age 60 or such other date on which he is required to retire pursuant to his employment contract) or at the specific request of his employer, the Option may be exercised during the period commencing on the date he ceases to be an Option Scheme eligible employee and ending on the later of six months thereafter or three years and six months after the date of grant. If a participant dies while he is an Option Scheme eligible employee or during the extended exercise period described in the preceding sentence, the participant’s personal representatives may exercise the Option for 12 months after the participant’s death (unless the participant would have been precluded from exercising the option during that period under applicable U.K. tax law). In all other cases, the Remuneration Committee may permit post-cessation exercise for up to six months from the date of cessation or, if later three years and six months after the date of grant. All Options lapse upon the tenth anniversary of the date of grant.
| 105 |
Takeovers and Corporate Events. If any person obtains control of us (as determined in accordance with specified U.K. tax law) as a result of making a Takeover Offer, any Options may be exercised within the relevant period after the time the person has obtained control and any conditions subject to which the Takeover Offer have been satisfied. Options may also be exercisable for the relevant period in the event of certain court sanctioned restructurings or amalgamations of us or if another company becomes bound or entitled to acquire our ordinary shares pursuant to certain provisions of U.K. corporate law. If the Remuneration Committee determines that it is likely that we will come under the control of another company such that our ordinary shares will cease to satisfy the conditions of applicable U.K. tax law, the Remuneration Committee may permit exercise of the Options prior to the change of control.
In the event of a Takeover Offer or court sanctioned restructuring or amalgamation, the participant may, by agreement with the other company, release Options in consideration for the grant of a new option with respect to the acquiring company’s shares and subject to certain other terms and conditions, in such a manner as to preserve the tax advantages applicable to the Options.
The Remuneration Committee may also permit exercise of the Options within a relevant period following the date on which we pass a resolution for voluntary winding up or certain other transactions involving a change in control of us.
With respect to any event, the “relevant period” is generally the period of three months or such different period not less than 30 days and not more than six months that the Remuneration Committee may determine in connection with a relevant particular event which may allow Options to be exercised. Options not exercised by the end of that period will lapse.
Adjustment of Awards. In the event that there is any variation in our share capital the Remuneration Committee may make adjustments as it considers fair and reasonable to preserve the participant’s position to the number of ordinary shares subject to an Option and/or the acquisition price and/or the aggregate maximum number of ordinary shares. Limitations apply to the extent to which any such adjustments may reduce the price at which ordinary shares may be purchased pursuant to the exercise of an Option and no adjustment will take effect until it has been approved by the United Kingdom tax authorities in accordance with applicable U.K. tax law.
Transferability. No Option under the Company Option Scheme may be transferred, assigned, charged or otherwise disposed of (except on death to the recipient’s personal representatives) and will lapse immediately upon an attempt to do so. In addition, an award under the Company Option Scheme will lapse immediately if the recipient of an award is declared bankrupt or if there is a compulsory winding up of us.
Amendment. The Remuneration Committee may, at any time, alter the Company Option Scheme provided that no alterations shall be effective unless approved by the U.K. tax authorities in accordance with applicable U.K. tax law.
Options granted to non-employees
Our consultants and non-executive directors, who are not employees of companies in the Group, are not eligible to participate in our equity compensation plans described above. Certain of these consultants and non-executive directors have been granted options to acquire our shares pursuant to separate option agreements. These options are generally on comparable terms to options granted under the Executive Option Scheme.
| 106 |
Limitations on Liability and Indemnification Matters
To the extent permitted by the Companies Act 2006, we shall indemnify our directors against any liability. We maintain directors and officers insurance to insure such persons against certain liabilities.
Insofar as indemnification for liabilities arising under the Securities Act may be permitted to directors, officers or persons controlling us under the foregoing provisions, we have been advised that in the opinion of the SEC, such indemnification is against public policy as expressed in the Securities Act and therefore is unenforceable.
| C. | Board Practices. |
Board Composition
Our business affairs are managed under the direction of our board of directors, which is currently composed of eight members. As a foreign private issuer, we have elected to follow home country practices in lieu of NasdaqNASDAQ Global Market requirement that a majority of our board qualify as independent directors. Three of our directors qualify as independent directors under Rule 5605(a)(2) of the NasdaqNASDAQ Stock Market, Marketplace Rules.
Terms of Directors and Executive Officers
Our executive officers are selected by and serve at the discretion of our board of directors. A director may be removed by an ordinary resolution passed by a majority of our shareholders.
Committees of the Board of Directors and Corporate Governance
We have established an Audit Committee, a Remuneration Committee and a Nominations Committee. Each of these committees has the responsibilities described below. Our board of directors may also establish other committees from time to time to assist in the discharge of its responsibilities.
Audit Committee
Our Audit Committee is comprised of our three non-executive directors, Mr. James Noble, Mr. Cabot Brown and Mr. Thomas Lynch, and each of these members satisfies the independence requirements of Rule 5605(a)(2) of the NasdaqNASDAQ Stock Market, Marketplace Rules and the independence requirements of Rule 10A-3(b)(1) under the Exchange Act. Mr. Noble serves as chair of the Audit Committee. Our board of directors has determined that Mr. Noble is a financial expert as contemplated by applicable SEC rules. Our Audit Committee oversees the monitoring of our internal control over financial reporting, our accounting and financial reporting processes and the audits of the financial statements of our company. Our Audit Committee is responsible for, among other things:
Remuneration Committee
Our Remuneration Committee is comprised of our three non-executive directors, Mr. James Noble, Mr. Cabot Brown and Mr. Thomas Lynch, and each of the members satisfies the independence requirements of Rule 5605(a)(2) of the NasdaqNASDAQ Stock Market, Marketplace Rules and the independence requirements of Rule 10A-3(b)(1) under the Exchange Act. Mr. Lynch serves as chair of this committee. Under NasdaqNASDAQ Stock Market, Marketplace Rules, there are heightened independence standards for members of the Remuneration Committee, including a prohibition against the receipt of any compensation from us other than standard director compensation. All of our compensation committee members meet this heightened standard.
Our Remuneration Committee assists our board of directors in reviewing and approving the compensation structure of our directors and executive officers, including all forms of compensation to be provided to our directors and executive officers. Members of the Remuneration Committee are prohibited from direct involvement in determining their own compensation, including participation in meetings about their individual compensation. It is a policy of the Remuneration Committee that no individual, including our chief executive officer and other executive directors, participates in discussions or decisions concerning his own Remuneration and such persons may not be present at any Remuneration Committee meeting during which their compensation is deliberated.
The Remuneration Committee is responsible for, among other things:
Nominations Committee
As permitted for foreign private issuers, we have elected to follow our home country’s practice in lieu of the NasdaqNASDAQ Global Market requirement for U.S. listed companies to have a nominating committee comprised of independent directors. The members of the Nominations Committee comprise Dr. Geoffrey Guy, Mr. James Noble and Mr. Cabot Brown, with Mr. Noble and Mr. Brown being independent directors. Dr. Guy serves as Chair of the Nominations Committee and oversees the evaluation of the board’s performance. Dr. Guy’s performance as Chairman is reviewed by Mr. Noble, in his capacity as senior independent director, taking into account feedback from other members of the board of directors. The Nominations Committee meets at least twice a year and reviews the structure, size and composition of the board of directors, supervising the selection and appointment process of directors, making recommendations to the board of directors with regard to any changes and using an external search consultancy if considered appropriate. For new appointments, the Nominations Committee makes a final recommendation to the board of directors, and the board has the opportunity to meet the candidate prior to approving the appointment. Once appointed, the Nominations Committee oversees the induction of new directors and provides the appropriate training to the board during the course of the year in order to ensure that each member has the knowledge and skills necessary to operate effectively. The Nominations Committee is also responsible for annually evaluating the performance of the board, both on an individual basis and for the board as a whole, taking into account such factors as attendance record, contribution during board meetings and the amount of time that has been dedicated to board matters during the course of the year.
Code of Business Conduct and Ethics
Our Code of Business Conduct and Ethics is applicable to all of our employees, officers and directors and is available on our website at http://www.gwpharm.com. Our Code of Business Conduct and Ethics provides that our directors and officers are expected to avoid any action, position or interest that conflicts with the interests of our company or gives the appearance of a conflict. Our directors and officers have an obligation under our Code of Business Conduct and Ethics to advance our company’s interests when the opportunity to do so arises. We expect that any amendment to this code, or any waivers of its requirements, will be disclosed on our website. Information contained on, or that can be accessed through, our website is not incorporated by reference into this document, and you should not consider information on our website to be part of this document.
| 108 |
| D. | Employees. |
The number of employees by function and geographic location as of the end of the period for our fiscal years ended September 30, 2014, 20132016, 2015 and 20122014 was as follows:
| 2014 | 2013 | 2012 | 2016 | 2015 | 2014 | |||||||||||||||||||
| By Function: | ||||||||||||||||||||||||
| Research and development | 165 | 108 | 109 | 268 | 207 | 165 | ||||||||||||||||||
| Manufacturing and operations | 44 | 43 | 39 | 80 | 56 | 44 | ||||||||||||||||||
| Quality control and assurance | 29 | 23 | 20 | 61 | 51 | 29 | ||||||||||||||||||
| Commercial | 15 | 7 | - | |||||||||||||||||||||
| Management and administrative | 27 | 20 | 16 | 72 | 48 | 27 | ||||||||||||||||||
| Total | 265 | 194 | 184 | 496 | 369 | 265 | ||||||||||||||||||
| By Geography: | ||||||||||||||||||||||||
| United Kingdom | 258 | 194 | 184 | 425 | 342 | 263 | ||||||||||||||||||
| North America | 2 | — | — | 71 | 27 | 2 | ||||||||||||||||||
| Rest of the World | — | — | — | |||||||||||||||||||||
| Total | 265 | 194 | 184 | 496 | 369 | 265 | ||||||||||||||||||
We have never had a work stoppage and none of our employees are covered by collective bargaining agreements or represented by a labor union. We believe our relationships with our employees around the world are good.
| E. | Share Ownership. |
See Item 7, below.
| Item 7 | Major Shareholders and Related Party Transactions. |
| A. | Major Shareholders. |
The following table and related footnotes set forth information with respect to the beneficial ownership of our ordinary shares, as of September 30, 2014,2016, by:
Beneficial ownership is determined in accordance with the rules and regulations of the SEC. In computing the number of ordinary shares owned by a person and the percentage ownership of that person, we have included shares that the person has the right to acquire within 60 days, including through the exercise of any option, warrant or other right or the conversion of any other security. These ordinary shares, however, are not included in the computation of the percentage ownership of any other person. Ownership of our ordinary shares by the “principal shareholders” identified above has been determined by reference to our share register, which provides us with information regarding the registered holders of our ordinary shares but generally provides limited, or no, information regarding the ultimate beneficial owners of such ordinary shares. As a result, we may not be aware of each person or group of affiliated persons who beneficially owns more than 5% of our ordinary shares.
Unless otherwise indicated, the address for each of the shareholders in the table below is c/o GW Pharmaceuticals plc, Porton Down ScienceSovereign House, Vision Park, Salisbury, Wiltshire, SP4 0JQ,Chivers Way, Histon, Cambridge CB24 9BZ, United Kingdom.
| Ordinary Shares Beneficially Owned(2) | ||||||||
| Name of Beneficial Owner(1) | Number | Percent | ||||||
| Greater than 5% Shareholders | ||||||||
| Prudential plc group of companies(3) | 31,524,017 | 13.3 | % | |||||
| Capital Research and Management Company(4) | 24,585,840 | 10.4 | % | |||||
| Named Executive Officers and Directors | ||||||||
| Dr. Geoffrey Guy(5) | 15,791,688 | 6.7 | % | |||||
| Mr. Justin Gover(6) | 3,289,893 | 1.4 | % | |||||
| Mr. Thomas Lynch | 56,344 | * | ||||||
| Mr. James Noble | 47,500 | * | ||||||
| Mr. Adam George(7) | 159,354 | * | ||||||
| Dr. Stephen Wright(8) | 701,072 | * | ||||||
| Mr. Chris Tovey | 12,500 | * | ||||||
| Mr. Cabot Brown | — | * | ||||||
| All Named Executive Officers and Directors as a Group (8 persons) | 20,058,351 | 8.5 | % | |||||
| 109 |
Ordinary Shares Beneficially Owned(2) | ||||||||
| Name of Beneficial Owner(1) | Number | Percent | ||||||
| Greater than 5% Shareholders | ||||||||
| Capital Research and Management Company(3) | 45,340,848 | 15.0 | ||||||
| Prudential plc group of companies(4) | 24,602,551 | 8.1 | ||||||
| Scopia Capital Management LP(5) | 22,622,004 | 7.5 | ||||||
| Fidelity Management & Research Co.(6) | 21,058,296 | 7.1 | ||||||
| Named Executive Officers and Directors | ||||||||
| Dr. Geoffrey Guy(7) | 14,248,000 | 4.6 | ||||||
| Mr. Justin Gover(8) | - | * | ||||||
| Mr. Thomas Lynch | - | * | ||||||
| Mr. James Noble | - | * | ||||||
| Mr. Adam George(9) | - | * | ||||||
| Dr. Stephen Wright(10) | - | * | ||||||
| Mr. Julian Gangolli | - | * | ||||||
| Mr. Chris Tovey | - | * | ||||||
| Mr. Cabot Brown | - | * | ||||||
| All Named Executive Officers and Directors as a Group (9 persons) | * | |||||||
| * | Indicates beneficial ownership of less than one percent of our ordinary shares. |
| (1) | The business addresses for the listed beneficial owners are as follows: Prudential plc group of companies—Laurence Pountney Hill, London, EC4R |
| (2) | Number of shares owned as shown both in this table and the accompanying footnotes and percentage ownership is based on |
| (3) |
| Capital Research and Management Company, or CRMC, a U.S.–based investment management company, holds these shares in the form of ADSs. The Capital Group Companies, Inc. is the parent company of CRMC. The business address for CRMC is 333 South Hope Street, Los Angeles, CA 90071. |
| Includes |
| (5) | Scopia Capital Management LP , a U.S.-based investment management company, holds these shares in the form of ADSs. |
| (6) | Fidelity Management & Research Co., or FMRC, a U.S.-based investment management company, holds these shares in the form of ADSs |
| (7) | Includes 225,000 ordinary shares beneficially owned by Dr. Guy’s immediate family, |
| (8) | Includes 2,143,314 ordinary shares beneficially owned by The Gover Family Investment LLP, of which Mr. Gover owns 99% and the remaining 1% is held by his spouse. |
| (9) | Includes 21,696 shares held by his personal pension plan, 5,912 shares owned personally and options to purchase 407,106 ordinary shares that have vested. |
| (10) | Includes 5,000 ordinary shares beneficially owned by Dr. Wright’s spouse, 915 shares owned personally and options to purchase |
Our major shareholders do not have different voting rights. We are not aware of any arrangement that may, at a subsequent date, result in a change of control of our company.
| 110 |
Citibank, N.A. is the holder of record for our ADS program, whereby each ADS represents twelve ordinary shares. As of September 30, 2014,2016, Citibank, N.A. held 142,843,540226,162,356 ordinary shares representing 60%75% of our issued share capital held at that date. As of September 30, 2014,2016, we had a further 473,517473,317 ordinary shares held by 119 U.S. resident shareholders of record, representing less than one percent of total voting power. Certain of these ordinary shares and ADSs were held by brokers or other nominees. As a result, the number of holders of record or registered holders in the U.S. is not representative of the number of beneficial holders or of the residence of beneficial holders.
To our knowledge,Due to the de-listing from the AIM market in the United Kingdom, there has been noa significant changeincrease in the percentage ownershipnumber of shares held in ADS form by Citibank. As at December 5, 2016, 267,889,376 ordinary shares were held by the principal shareholders listed above since September 30, 2014.Citibank, representing 89% of share capital.
| B. | Related Party Transactions. |
During the three year period ended September 30, 2014,2016, there has not been, nor is there currently proposed, any material transaction or series of similar material transactions to which we were or are a party in which any of our directors, members of our executive management board, associates, holders of more than 10% of any class of our voting securities, or any affiliates or member of the immediate families of any of the foregoing persons, had or will have a direct or indirect material interest, other than the compensation and shareholding arrangements we describe where required in the section of this Annual Report titled “Management.”
We have adopted a related person transaction policy which sets forth our procedures for the identification, review, consideration and approval or ratification of related person transactions. For purposes of our policy only, a related person transaction is a transaction, arrangement or relationship, or any series of similar transactions, arrangements or relationships, in which we and any related person are, were or will be participants. Transactions involving compensation for services provided to us as an employee or director are not covered by this policy. A related person is any employee, director or beneficial owner of more than 3% of any class of our voting securities, including any of their immediate family members and any entity owned or controlled by such persons.
Under the policy, if a transaction has been identified as a related person transaction, including any transaction that was not a related person transaction when originally consummated or any transaction that was not initially identified as a related person transaction prior to consummation, our management must present information regarding the related person transaction to our Audit Committee, or, if Audit Committee approval would be inappropriate, to another independent body of our board of directors, for review, consideration and approval or ratification. The presentation must include a description of, among other things, the material facts, the interests, direct and indirect, of the related persons, the benefits to us of the transaction and whether the transaction is on terms that are comparable to the terms available to or from, as the case may be, an unrelated third-party or to or from employees generally. Under the policy, we will collect information that we deem reasonably necessary from each director, executive officer and, to the extent feasible, significant shareholder to enable us to identify any existing or potential related person transactions and to effectuate the terms of the policy. In addition, under our Code of Business Conduct and Ethics, our employees and directors have an affirmative responsibility to disclose any transaction or relationship that reasonably could be expected to give rise to a conflict of interest.
| C. | Interests of Experts and Counsel. |
Not Applicable.
| Item 8 | Financial Information. |
| A. | Consolidated Statements and Other Financial Information. |
See “Item 18. Financial Statements.”
| B. | Significant Changes. |
There have been no significant changes since September 30, 2014.2016.
| 111 |
| Item 9 | The Offer and Listing. |
| A. | Offer and Listing Details. |
Price History of Stock
The following table sets forth, for the periods indicated, the reported high and low closing sale prices of our ADSs on the NASDAQ Global Market in U.S. dollars.
| Price Per ADS | ||||||||
| High | Low | |||||||
| Annual (Year Ended September 30): | ||||||||
| 2013 (May 1, 2013 through September 30, 2013) | $ | 17.75 | $ | 8.51 | ||||
| 2014 | $ | 107.35 | $ | 17.01 | ||||
| 2015 | $ | 129.69 | $ | 61.55 | ||||
| 2016 | $ | 132.73 | $ | 36.64 | ||||
| 2017 (through December 2, 2016) | $ | 134.02 | $ | 109.28 | ||||
| Quarterly: | ||||||||
| First Quarter 2014 | $ | 41.54 | $ | 17.01 | ||||
| Second Quarter 2014 | $ | 83.05 | $ | 38.06 | ||||
| Third Quarter 2014 | $ | 107.29 | $ | 44.00 | ||||
| Fourth Quarter 2014 | $ | 107.35 | $ | 80.70 | ||||
| First Quarter 2015 | $ | 82.33 | $ | 61.55 | ||||
| Second Quarter 2015 | $ | 100.48 | $ | 69.61 | ||||
| Third Quarter 2015 | $ | 129.69 | $ | 90.58 | ||||
| Fourth Quarter 2015 | $ | 129.01 | $ | 88.78 | ||||
| First Quarter 2016 | $ | 92.27 | $ | 64.96 | ||||
| Second Quarter 2016 | $ | 85.24 | $ | 36.64 | ||||
| Third Quarter 2016 | $ | 94.19 | $ | 73.64 | ||||
| Fourth Quarter 2016 | $ | 132.73 | $ | 80.65 | ||||
| First Quarter 2017 (through December 2, 2016) | $ | 134.02 | $ | 109.28 | ||||
| Most Recent Six Months: | ||||||||
| June 2016 | $ | 94.19 | $ | 83.31 | ||||
| July 2016 | $ | 97.10 | $ | 90.39 | ||||
| August 2016 | $ | 96.11 | $ | 80.65 | ||||
| September 2016 | $ | 132.73 | $ | 82.28 | ||||
| October 2016 | $ | 133.45 | $ | 116.23 | ||||
| November 2016 | $ | 134.02 | $ | 111.45 | ||||
| December 2016 (through December 2, 2016) | $ | 112.32 | $ | 109.28 | ||||
On September 30, 2016, and December 5, 2016, the last reported sale prices of our ADSs on the NASDAQ Global Market were $132.73 per ADS and $112.32 per ADS, respectively.
| 112 |
The following table sets forth, for the periods indicated, the reported high and low closing sale prices of our ordinary shares on the AIM in pounds sterling and U.S. dollars. U.S. dollar per ordinary share amounts have been translated into U.S. dollars at $1.00 = £0.6165£0.7683 based on the certified foreign exchange rates published by Federal Reserve Bank of New York on September 30, 2014.2016.
| Price Per Ordinary Share | Price Per Ordinary Share | |||||||||||||||
| £ | $ | |||||||||||||||
| High | Low | High | Low | |||||||||||||
| Annual (Year Ended September 30): | ||||||||||||||||
| 2010 | 1.41 | 0.81 | 2.29 | 1.31 | ||||||||||||
| 2011 | 1.30 | 0.83 | 2.11 | 1.35 | ||||||||||||
| 2012 | 1.00 | 0.68 | 1.62 | 1.10 | ||||||||||||
| 2013 | 0.87 | 0.40 | 1.41 | 0.65 | ||||||||||||
| 2014 | 5.24 | 0.85 | 8.50 | 1.38 | ||||||||||||
| Quarterly: | ||||||||||||||||
| First Quarter 2013 | 0.74 | 0.55 | 1.20 | 0.89 | ||||||||||||
| Second Quarter 2013 | 0.63 | 0.40 | 1.02 | 0.65 | ||||||||||||
| Third Quarter 2013 | 0.70 | 0.45 | 1.14 | 0.73 | ||||||||||||
| Fourth Quarter 2013 | 0.87 | 0.47 | 1.41 | 0.76 | ||||||||||||
| First Quarter 2014 | 1.99 | 0.85 | 3.23 | 1.38 | ||||||||||||
| Second Quarter 2014 | 4.11 | 1.90 | 6.67 | 3.08 | ||||||||||||
| Third Quarter 2014 | 5.10 | 2.19 | 8.27 | 3.55 | ||||||||||||
| Fourth Quarter 2014 | 5.24 | 4.00 | 8.50 | 6.49 | ||||||||||||
| First Quarter 2015 (through November 28, 2014) | 4.30 | 3.20 | 6.97 | 5.19 | ||||||||||||
| Most Recent Six Months: | ||||||||||||||||
| June 2014 | 5.10 | 3.33 | 8.27 | 5.40 | ||||||||||||
| July 2014 | 5.24 | 4.00 | 8.50 | 6.49 | ||||||||||||
| August 2014 | 4.80 | 4.05 | 7.79 | 6.57 | ||||||||||||
| September 2014 | 4.65 | 4.31 | 7.54 | 6.99 | ||||||||||||
| October 2014 | 4.27 | 3.20 | 6.93 | 5.19 | ||||||||||||
| November 2014 | 4.30 | 3.80 | 6.97 | 6.16 | ||||||||||||
| Price Per Ordinary Share | Price Per Ordinary Share | |||||||||||||||
| High | Low | High | Low | |||||||||||||
| Annual (Year Ended September 30): | ||||||||||||||||
| 2011 | £ | 1.33 | £ | 0.83 | $ | 1.73 | $ | 1.08 | ||||||||
| 2012 | £ | 1.03 | £ | 0.66 | $ | 1.34 | $ | 0.86 | ||||||||
| 2013 | £ | 0.90 | £ | 0.40 | $ | 1.17 | $ | 0.52 | ||||||||
| 2014 | £ | 5.24 | £ | 0.85 | $ | 6.82 | $ | 1.11 | ||||||||
| 2015 | £ | 6.96 | £ | 3.20 | $ | 9.06 | $ | 4.17 | ||||||||
| 2016 | £ | 8.39 | £ | 2.12 | $ | 10.92 | $ | 2.76 | ||||||||
| 2017 (through December 2, 2016) | £ | 8.90 | £ | 7.10 | $ | 11.58 | $ | 9.24 | ||||||||
| Quarterly: | ||||||||||||||||
| First Quarter 2014 | £ | 1.99 | £ | 0.85 | $ | 2.59 | $ | 1.11 | ||||||||
| Second Quarter 2014 | £ | 4.11 | £ | 1.90 | $ | 5.35 | $ | 2.47 | ||||||||
| Third Quarter 2014 | £ | 5.10 | £ | 2.19 | $ | 6.64 | $ | 2.85 | ||||||||
| Fourth Quarter 2014 | £ | 5.24 | £ | 4.00 | $ | 6.82 | $ | 5.21 | ||||||||
| First Quarter 2015 | £ | 4.30 | £ | 3.21 | $ | 5.60 | $ | 4.18 | ||||||||
| Second Quarter 2015 | £ | 5.60 | £ | 3.69 | $ | 7.29 | $ | 4.80 | ||||||||
| Third Quarter 2015 | £ | 6.96 | £ | 5.06 | $ | 9.06 | $ | 6.59 | ||||||||
| Fourth Quarter 2015 | £ | 6.93 | £ | 4.90 | $ | 9.02 | $ | 6.38 | ||||||||
| First Quarter 2016 | £ | 5.16 | £ | 3.69 | $ | 6.72 | $ | 4.80 | ||||||||
| Second Quarter 2016 | £ | 5.10 | £ | 2.12 | $ | 6.64 | $ | 2.76 | ||||||||
| Third Quarter 2016 | £ | 5.80 | £ | 4.29 | $ | 7.55 | $ | 5.58 | ||||||||
| Fourth Quarter 2016 | £ | 8.39 | £ | 5.15 | $ | 10.92 | $ | 6.70 | ||||||||
| First Quarter 2017 (through December 2, 2016) | £ | 8.90 | £ | 7.10 | $ | 11.58 | $ | 9.24 | ||||||||
| Most Recent Six Months: | ||||||||||||||||
| June 2016 | £ | 5.80 | £ | 4.94 | $ | 7.55 | $ | 6.43 | ||||||||
| July 2016 | £ | 6.23 | £ | 5.71 | $ | 8.11 | $ | 7.43 | ||||||||
| August 2016 | £ | 6.11 | £ | 5.15 | $ | 7.95 | $ | 6.70 | ||||||||
| September 2016 | £ | 8.39 | £ | 5.15 | $ | 10.92 | $ | 6.70 | ||||||||
| October 2016 | £ | 8.88 | £ | 7.93 | $ | 11.56 | $ | 10.32 | ||||||||
| November 2016 | £ | 8.90 | £ | 7.26 | $ | 11.58 | $ | 9.45 | ||||||||
| December 2016 (through December 2, 2016) | £ | 7.19 | £ | 7.10 | $ | 11.58 | $ | 9.24 | ||||||||
On September 30, 2014,2016, and November 28, 2014,December 2, 2016, the last reported sale prices of our ordinary shares on AIM were £4.36£8.39 per share ($7.0710.92 per share) and £4.22£7.10 per share ($6.849.24 per share), respectively.
The following table sets forth, for the periods indicated, the reported high and low closing sale prices of our ADSs on the Nasdaq Global Market in U.S. dollars.
| Price Per Ordinary Share | ||||||||
| $ | ||||||||
| High | Low | |||||||
| Annual (Year Ended September 30): | ||||||||
| 2013 | 17.75 | 8.51 | ||||||
| 2014 | 107.35 | 17.01 | ||||||
| Quarterly: | ||||||||
| Third Quarter 2013 | 9.09 | 8.51 | ||||||
| Fourth Quarter 2013 | 17.75 | 8.76 | ||||||
| First Quarter 2014 | 41.54 | 17.01 | ||||||
| Second Quarter 2014 | 83.05 | 38.06 | ||||||
| Third Quarter 2014 | 107.29 | 44.00 | ||||||
| Fourth Quarter 2014 | 107.35 | 80.70 | ||||||
| First Quarter 2015 (through November 28, 2014) | 82.33 | 61.55 | ||||||
| Most Recent Six Months: | ||||||||
| June 2014 | 107.29 | 67.08 | ||||||
| July 2014 | 107.35 | 80.70 | ||||||
| August 2014 | 95.35 | 82.12 | ||||||
| September 2014 | 91.69 | 80.85 | ||||||
| October 2014 | 82.33 | 61.55 | ||||||
| November 2014 | 80.50 | 71.34 | ||||||
On September 30, 2014, and November 28, 2014, the last reported sale prices of our ADSs on the Nasdaq Global Market were $80.85 per ADS and $77.43 per ADS, respectively.
| B. | Plan of Distribution. |
Not Applicable.
| C. | Markets. |
142,843,540226,162,356 of our ordinary shares underlie ADSs listed on the NasdaqNASDAQ Global Market under the symbol “GWPH.” The depositary for the ADSs holds twelve ordinary shares for every ADS. 93,803,35575,930,783 of our ordinary shares are listedadmitted to trading on the AIM outside the ADS facility. Our ordinary shares have been trading on the AIM under the symbol “GWP” since June 28, 2001. Trading on AIM ceased on December 5, 2016.
| D. | Selling Shareholders. |
Not Applicable.
| E. | Dilution. |
Not Applicable.
| F. | Expenses of the Issue. |
Not Applicable.
| Item 10 | Additional Information. |
| A. | Share Capital. |
Not Applicable.
| B. | Memorandum and Articles of Association. |
The information called for by this item has been reported previously in our Registration Statement on form F-3 (File No. 333-195747), filed with the SEC May 7, 2014 under the heading “Description of Share Capital” and is incorporated by reference into this Annual Report.
| C. | Material Contracts. |
Except as otherwise disclosed in this Annual Report (including the exhibits thereto), we are not currently, and have not been in the last two years, party to any material contract, other than contracts entered into in the ordinary course of our business.
| 113 |
| D. | Exchange Controls. |
There are no governmental laws, decrees, regulations or other legislation in the United Kingdom that may affect the import or export of capital, including the availability of cash and cash equivalents for use by us, or that may affect the remittance of dividends, interest, or other payments by us to non-resident holders of our ordinary shares or ADSs, other than withholding tax requirements. There is no limitation imposed by English law or our articles of association on the right of non-residents to hold or vote shares.
| E. | Taxation |
U.S. Federal Income Taxation
The following discussion describes the material U.S. federal income tax consequences to U.S. Holders (as defined below) under present law of the purchase, ownership and disposition of the ADSs by a holder thatADSs. This discussion is a citizen or residentbased on the U.S. Internal Revenue Code of 1986, as amended, in effect as of the United States, adate of this Annual Report on Form 20-F and on U.S. domestic corporationTreasury regulations in effect or, a personin some cases, proposed, as of the date of this Annual Report on Form 20-F, as well as judicial and administrative interpretations thereof available on or entitybefore such date. All of the foregoing authorities are subject to change, which change could apply retroactively and could affect the tax consequences described below.
This discussion applies only to U.S. Holders that otherwise will be subject tohold the ADSs as capital assets for U.S. federal income tax on a net income basis in respect of our ADSs (a “U.S. Holder”). This discussionpurposes. It does not purport to be a comprehensive description of all tax considerations that may be relevant to a decision to purchase hold or dispose of the ADSs.ADSs by any particular investor. In particular, this discussion does not address tax considerations applicable to a U.S. Holder that may be subject to special tax rules, including, without limitation, a dealer in securities or currencies, a trader in securities that elects to use a mark-to-market method of accounting for securities holdings, banks, thrifts, or other financial institutions, an insurance company, a tax-exempt organization, a person that holds the ADSs as part of a hedge, straddle or conversion transaction for tax purposes, a person whose functional currency for tax purposes is not the U.S. dollar, certain former citizens or residents of the United States, a person subject to the U.S. alternative minimum tax, or a person that owns or is deemed to own 10% or more of the company’s voting stock (including ADSs).stock. In addition, the discussion does not address tax consequences to an entity treated as a partnership for U.S. federal income tax purposes that holds the ADSs, or a partner in such partnership. This summary applies only to U.S. Holders that hold the ADSs as capital assets forThe U.S. federal income tax purposes.
This discussion is based ontreatment of each partner of such partnership generally will depend upon the Code in effect asstatus of the date of this Annual Reportpartner and on U.S. Treasury regulations in effect or, in some cases, proposed, asthe activities of the date of this Annual Report, as well as judicial and administrative interpretations thereof available on or before such date. All ofpartnership. Prospective purchasers that are partners in a partnership holding the foregoing authorities are subject to change, which change could apply retroactively and could affect theADSs should consult their own tax consequences described below. This summary does not address any tax consequences under the laws of any state or locality of the United States.advisers.
YOU ARE URGED TO CONSULT YOUR TAX ADVISORS ABOUT THE APPLICATION OF THE U.S. FEDERAL INCOME TAX RULES TO YOUR PARTICULAR CIRCUMSTANCES AS WELL AS THE STATE, LOCAL, NON-U.S. AND OTHER TAX CONSEQUENCES OF THE PURCHASE, OWNERSHIP AND DISPOSITION OF THE ADSs.
The discussion below assumesof the U.S. federal income tax consequences to “U.S. Holders” will apply to you if you are a beneficial owner of ADSs and you are, for U.S. federal income tax purposes,
If you hold ADSs, you should be treated as the holder of the underlying ordinary shares represented by those ADSs for U.S. federal income tax purposes.
| 114 |
Taxation of Dividends and Other Distributions on the ADSs
Subject to the PFIC rules discussed below, the gross amount of cash distributions made by us to you with respect to the ADSs will generally be includable in your gross income as dividend income on the date of receipt by the depositary bank, but only to the extent that the distribution is paid out of our current or accumulated earnings and profits (as determined under U.S. federal income tax principles). To the extent, if any, that the amount of the distribution exceeds our current and accumulated earnings and profits, it will be treated first as a tax-free return of your tax basis in your ADSs, and to the extent the amount of the distribution exceeds your tax basis, the excess will be taxed as capital gain. We do not intend to calculate our earnings and profits under U.S. federal income tax principles. Therefore, a U.S. Holder should expect that a distribution will generally be treated as a dividend even if that distribution would otherwise be treated as a non-taxable return of capital or as capital gain under the rules described above. U.S. Holders should consult their own tax advisors regarding the tax consequences to them if we pay dividends in any non-U.S. currency. A dividend in respect of the ADSs will not be eligible for the dividends-received deduction allowed to corporations in respect of dividends received from other U.S. corporations.
With respect to non-corporate U.S. Holders, including individual U.S. Holders, dividends will generally be taxed at the preferential rate applicable to qualified dividend income, provided that (i) the ADSs are readily tradable on an established securities market in the United States, or we are eligible for the benefits of an approved qualifying income tax treaty with the United States that includes an exchange of information program, (ii) we are not a PFIC (as discussed below) for either our taxable year in which the dividend is paid or the preceding taxable year, (iii) certain holding period requirements are met and (iv) you are not under any obligation to make related payments with respect to positions in substantially similar or related property. Under U.S. Internal Revenue Service authority, common or ordinary shares, or ADSs representing such shares, are considered for purpose of clause (i) above to be readily tradable on an established securities market in the United States if they are listed on Nasdaq. You should consult your tax advisors regarding the availability of the preferential rate for dividends paid with respect to the ADSs.
Dividends generally will constitute income from sources outside the United States for U.S. foreign tax credit purposes. However, if 50% or more of our stock is treated as held by U.S. persons, we will be treated as a “U.S.-owned foreign corporation.” In that case, dividends may be treated for U.S. foreign tax credit purposes as income from sources outside the United States to the extent paid out of our non-U.S. source earnings and profits, and as income from sources within the United States to the extent paid out of our U.S. source earnings and profits. We cannot assure you that we will not be treated as a U.S.-owned foreign corporation. If the dividends are taxed as qualified dividend income (as discussed above), the amount of the dividend taken into account for purposes of calculating the U.S. foreign tax credit limitation will generally be limited to the gross amount of the dividend, multiplied by the preferential rate divided by the highest rate of tax normally applicable to dividends. The limitation on foreign taxes eligible for credit is calculated separately with respect to specific classes of income. For this purpose, dividends distributed by us with respect to the ADSs will generally constitute “passive category income.”
Taxation of Dispositions of ADSs
Subject to the PFIC rules discussed below, you will recognize taxable gain or loss on any sale, exchange or other taxable disposition of an ADS equal to the difference between the amount realized (in U.S. dollars) for the ADS and your tax basis (in U.S. dollars) in the ADS. The gain or loss will generally be capital gain or loss. If you are a non-corporate U.S. Holder, including an individual U.S. Holder, who has held the ADS for more than one year, you willmay be eligible for preferential tax rates. The deductibility of capital losses is subject to limitations. Any such gain or loss that you recognize will generally be treated as U.S. source income or loss for U.S. foreign tax credit purposes.
Medicare Tax
Certain U.S. Holders that are individuals, estates or trusts and whose income exceeds certain thresholds will be subject to an additional 3.8% Medicare tax on some or all of such U.S. Holder’s “net investment income.” Net investment income generally includes interest on, and gainincome from the disposition of, the ADSs unless such interest income or gain is derived in the ordinary course of the conduct of a trade or business (other than a trade or business that consists of certain passive or trading activities). You should consult your tax advisors regarding the effect this Medicare tax may have, if any, on your acquisition, ownership or disposition of the ADSs.
| 115 |
Disposition of Foreign Currency
U.S. Holders are urged to consult their tax advisors regarding the tax consequences of receiving, converting or disposing of any non-U.S. currency received as dividends on the ADSs or on the sale or retirement of an ADS.
Passive Foreign Investment Company
Special U.S. tax rules apply to companies that are considered to be passive foreign investment companies or PFICs. We will be classified as a PFIC in a particular taxable year if either (i) 75% or more of our gross income for the taxable year is passive income; or (ii) on average at least 50% of the value of our assets produce passive income or are held for the production of passive income. Passive income for this purpose generally includes, among other things, certain dividends, interest, royalties, rents and gains from commodities and securities transactions and from the sale or exchange of property that gives rise to passive income.
In making this determination, we will be treated as earning our proportionate share of any income and owning our proportionate share of any assets of any corporation in which we hold a 25% or greater interest (by value). Because we currently own a substantial amount
Based on our estimated gross income, the average value of passiveour assets, including cash,goodwill, and the nature of our active business, we do not believe that we arewere classified as a PFIC as of the end offor U.S. federal income tax purposes for our fiscaltaxable year ended September 30, 2014.2016. Our status for any taxable year will depend on our assets and activities in each year, and because this is a factual determination made annually after the end of each taxable year, there can be no assurance that we will not be considered a PFIC for any future taxable year. The market value of our assets may be determined in large part by reference to the market price of the ADSs and our ordinary shares, which is likely to fluctuate (and may fluctuate considerably given that market prices of life sciences companies can be especially volatile). Furthermore, because the value of our gross assets is likely to be determined in large part by reference to our market capitalization and the value of our goodwill, a decline in the value of our shares could affect the determination of whether we are a PFIC. We do not intend to make a determination of our or any of our future subsidiaries’ PFIC status in the future.
SinceA U.S. Holder may be able to mitigate some of the adverse U.S. federal income tax consequences described below with respect to owning the ADSs if we believeare classified as a PFIC for any taxable year, provided that such U.S. Holder is eligible to make, and validly makes a mark-to-market election, described below. In certain circumstances a U.S. Holder can make a qualified electing fund election, or QEF election, to mitigate some of the adverse tax consequences described with respect to an ownership interest in a PFIC by including in income its share of the PFIC’s income on a current basis. However, we do not currently intend to prepare or provide the information that would enable a U.S. Holder to make a qualified electing fund election.
In the event we are classified as a PFIC, in any year in which you hold the ADSs, and you do not make one of the electionselection described in the following paragraph,paragraphs, any gain recognized by you on a sale or other disposition (including a pledge) of the ADSs would be allocated ratably over your holding period for the ADSs. The amounts allocated to the taxable year of the sale or other disposition and to any year before we became a PFIC would be taxed as ordinary income. The amount allocated to each other taxable year would be subject to tax at the highest rate in effect for individuals or corporations, as appropriate, for that taxable year, and an interest charge would be imposed. Further, to the extent that any distribution received by you on your ADSs were to exceed 125% of the average of the annual distributions on the ADSs received during the preceding three years or your holding period, whichever is shorter, that distribution would be subject to taxation in the same manner as gain on the sale or other disposition of shares, described above. Classification as a PFIC may also have other adverse tax consequences, including, in the case of individuals, the denial of a step-up in the basis of your ADSs at death.
You can avoidIf we are a PFIC for any taxable year during which you holds the unfavorableADSs, then in lieu of being subject to the special tax regime and interest charge rules described indiscussed above, you may make an election to include gain on the preceding paragraph by electing to mark your ADSs to market, but only ifas ordinary income under a mark-to-market method, provided that such the ADSs are treated as “marketable stock.“regularly traded” on a “qualified exchange.” In general, the ADSs will be treated as “regularly traded” for a given calendar year if more than a de minimis quantity of the ADSs are traded on a qualified exchange on at least 15 days during each calendar quarter of such calendar year. Although the U.S. Internal Revenue Service (“IRS”) has not published any authority identifying specific exchanges that may constitute “qualified exchanges,” Treasury Regulations provide that a qualified exchange is (a) a U.S. securities exchange that is registered with the Securities and Exchange Commission, (b) the U.S. market system established pursuant to section 11A of the Securities and Exchange Act of 1934, or (c) a non-U.S. securities exchange that is regulated or supervised by a governmental authority of the country in which the market is located, provided that (i) such non-U.S. exchange has trading volume, listing, financial disclosure, surveillance and other requirements designed to prevent fraudulent and manipulative acts and practices, to remove impediments to and perfect the mechanism of a free and open, fair and orderly, market, and to protect investors; and the laws of the country in which such non-U.S. exchange is located and the rules of such non-U.S. exchange ensure that such requirements are actually enforced and (ii) the rules of such non-U.S. exchange effectively promote active trading of listed shares. No assurance can be given that the ADSs will meet the requirements to be treated as “regularly traded” for purposes of the mark-to-market election. In addition, because a mark-to-market election cannot be made for any lower-tier PFICs that we may own, you may continue to be subject to the special tax regime with respect to your indirect interest in any investments held by us that are treated as an equity interest in a PFIC for U.S. federal income tax purposes, including shares in any future subsidiary of ours that is treated as a PFIC.
| 116 |
If you make this mark-to-market election, you will be required in any year in which we are a PFIC to include as ordinary income the excess of the fair market value of your ADSs at year-end over your basis in those ADSs. In addition, the excess, if any, of your basis in the ADSs over the fair market value of your ADSs at year-end is deductible as an ordinary loss in an amount equal to the lesser of (i) the amount of the excess or (ii) the amount of the net mark-to-market gains that you have been included in income in prior years. Any gain you recognizerecognized upon the sale of yourthe ADSs will be taxed as ordinary income in the year of sale. Amounts treated as ordinary income will not be eligible for the preferential tax rate applicable to qualified dividend income or long-term capital gains.
A timely Your adjusted tax basis in the ADSs will be increased by the amount of any income inclusion and decreased by the amount of any deductions under the mark-to-market rules. If you make a mark-to market election, it will be effective for the taxable year for which the election is made and all subsequent taxable years unless the ADSs are no longer regularly traded on a qualified exchange or the IRS consents to treat a PFIC as a QEF under Section 1295the revocation of the Code would result in alternative treatment. U.S. Holders should be aware, however, that we do not intend to satisfy the recordkeeping and other requirements that would permit U.S. Holders to make QEF elections.election.
In addition, due to our PFIC status, the preferential rates discussed above with respect to dividends paid to certain non-corporate U.S. Holders do not apply.
The U.S. federal income tax rules relating to PFICs are complex. You are urged to consult your tax advisors with respect to the purchase, ownership and disposition of the ADSs, any elections available with respect to such ADSs and the U.S. Internal Revenue Service information reporting obligations with respect to the purchase, ownership and disposition of the ADSs.
Information Reporting and Backup Withholding
Distributions with respect to ADSs and proceeds from the sale, exchange or disposition of ADSs may be subject to information reporting to the U.S. Internal Revenue Service and possible U.S. backup withholding. Backup withholding will not apply, however, to a U.S. Holder who furnishes a correct taxpayer identification number and makes any other required certification or who is otherwise exempt from backup withholding. U.S. Holders who are required to establish their exempt status generally must provide such certification on U.S. Internal Revenue Service Form W-9. YouU.S. Holders should consult yourtheir tax advisors regarding the application of the U.S. information reporting and backup withholding rules. If a U.S. Holder owns ADSs during any year in which we are a PFIC, such U.S. Holder (including, potentially, indirect holders) generally must file a U.S. Internal Revenue Service Form 8621 with such holder's federal income tax return for that year.
| 117 |
Backup withholding is not an additional tax. Amounts withheld as backup withholding may be credited against your U.S. federal income tax liability, and you may obtain a refund of any excess amounts withheld under the backup withholding rules by filing the appropriate claim for refund with the U.S. Internal Revenue Service and furnishing any required information. If a U.S. Holder owns ADS during any year in which we are a PFIC, such U.S. Holder (including, potentially, indirect holders) generally must file a U.S. Internal Revenue Service Form 8621 with such holder’s federal income tax return for that year.
Specified Foreign Financial Assets
Tax reporting obligations are imposed on certain U.S. persons that own “specified foreign financial assets,” including securities issued by any foreign person, either directly or indirectly or through certain foreign financial institutions, if the aggregate value of all of those assets exceeds $50,000 on the last day of the taxable year (and in some circumstances, a higher threshold). This reporting requirement applies to individuals and certain U.S. entities. The ADSs may be treated as specified foreign financial assets, and investors may be subject to this information reporting regime. Significant penalties and an extended statute of limitations may apply to a U.S. Holder subject to this reporting requirement that fails to file information reports. Each prospective investor that is a U.S. person should consult its own tax advisor regarding this information reporting obligation.
United Kingdom Tax Considerations
The following is a general summary of certain U.K. tax considerations relating to the ownership and disposal of the ordinary shares or the ADSs and does not address all possible tax consequences relating to an investment in the ordinary shares or the ADSs. It is based on current U.K. tax law and generally published HM Revenue & Customs, (“HMRC”(or “HMRC”), practice as at the date of this Annual Report on Form 20-F, both of which are subject to change, possibly with retrospective effect.
Save as provided otherwise, this summary applies only to persons who are resident (and, in the case of individuals, domiciled) in the United Kingdom for tax purposes and who are not resident for tax purposes in any other jurisdiction and do not have a permanent establishment or fixed base in any other jurisdiction with which the holding of the ordinary shares or ADSs is connected (“U.K. Holders”). Persons (a) who are not resident (or, if resident are not domiciled) in the United Kingdom for tax purposes, including those individuals and companies who trade in the United Kingdom through a branch, agency or permanent establishment in the United Kingdom to which the ordinary shares or the ADSs are attributable, or (b) who are resident or otherwise subject to tax in a jurisdiction outside the United Kingdom, are recommended to seek the advice of professional advisors in relation to their taxation obligations.
This summary is for general information only and is not intended to be, nor should it be considered to be, legal or tax advice to any particular investor. It does not address all of the tax considerations that may be relevant to specific investors in light of their particular circumstances or to investors subject to special treatment under U.K. tax law. In particular:
This summary further assumes that a holder of ADSs iswill be treated as the beneficial owner of the underlying ordinary shares for U.K. direct tax purposes.
POTENTIAL INVESTORS IN THE ADSs SHOULD SATISFY THEMSELVES PRIOR TO INVESTING AS TO THE OVERALL TAX CONSEQUENCES, INCLUDING, SPECIFICALLY, THE CONSEQUENCES UNDER U.K. TAX LAW AND HMRC PRACTICE OF THE ACQUISITION, OWNERSHIP AND DISPOSAL OF THE ORDINARY SHARES OR ADSs, IN THEIR OWN PARTICULAR CIRCUMSTANCES BY CONSULTING THEIR OWN TAX ADVISERS.
| 118 |
Taxation of dividends
Withholding Tax
Dividend payments in respect of the ordinary shares orrepresented by the ADSs may be made without withholding or deduction for or on account of U.K. tax.
Income Tax
Dividends received by individual U.K. Holders will be subject to U.K. income tax on the gross amount of the dividend paid (includingpaid.
An individual U.K. Holder will be exempt from U.K. income tax (by applying a nil rate of tax) on the first £5,000 of dividend income received by such individual U.K. Holder in a tax year, regardless of the amount of the non- refundableindividual’s other taxable income.
Dividend income in excess of the £5,000 allowance will be taxed at the rate of 7.5% to the extent that the dividend, when treated as the top slice of the relevant U.K. Holder’s income, does not exceed the basic rate income tax limit, at the rate of 32.5% to the extent that the dividend, when treated as the top slice of the relevant U.K. Holder’s income, exceeds the basic rate income tax credit referredlimit but does not exceed the higher rate income tax limit, and at the rate of 38.1% to below).the extent that the dividend, when treated as the top slice of the relevant U.K. Holder’s income, exceeds the higher rate income tax limit.
An individual holder of ordinary shares or ADSs who is not a U.K. Holder will not be chargeable to U.K. income tax on dividends paid by the company,Company, unless such holder carries on (whether solely or in partnership) a trade, profession or vocation in the United Kingdom through a branch or agency in the United Kingdom to which the ordinary shares or ADSs are attributable. In these circumstances, such holder may, depending on his or her individual circumstances, be chargeable to U.K. income tax on dividends received from the company.Company.
The rate of U.K. income tax that is chargeable on dividends received in the tax year 2014/2015 by (i) additional rate taxpayers is 37.5%, (ii) higher rate taxpayers is 32.5%, and (iii) basic rate taxpayers is 10%. Individual U.K. Holders will be entitled to a non-refundable tax credit equal to one-ninth of the full amount of the dividend received from the company, which will be taken into account in computing the gross amount of the dividend that is chargeable to U.K. income tax. The tax credit will be credited against such holder’s liability (if any) to U.K. income tax on the gross amount of the dividend. After taking into account the tax credit, the effective rate of tax for the 2014/2015 tax year (i) for additional rate taxpayers will be 30.6% of the dividend paid (ii) for higher rate taxpayers will be 25% of the dividend paid, and (iii) for basic rate taxpayers will be nil. An individual holder who is not subject to U.K. income tax on dividends received from the company will not generally be entitled to claim repayment of the tax credit in respect of such dividends. An individual’s dividend income is treated as the top slice of their total income that is chargeable to U.K. income tax.
Corporation Tax
A U.K. Holder within the charge to U.K. corporation tax may be entitled to exemption from U.K. corporation tax in respect of dividend payments. If the conditions for the exemption are not satisfied, or such U.K. Holder elects for an otherwise exempt dividend to be taxable, U.K. corporation tax will be chargeable on the gross amount of any dividends. If potential investors are in any doubt as to their position, they should consult their own professional advisers.
A corporate holder of ordinary shares or ADSs that is not a U.K. Holder will not be subject to U.K. corporation tax on dividends received from the company,Company, unless it carries on a trade in the United Kingdom through a permanent establishment to which the ordinary shares or ADSs are attributable. In these circumstances, such holder may, depending on its individual circumstances and if the exemption from U.K. corporation tax discussed above does not apply, be chargeable to U.K. corporation tax on dividends received from the company.Company.
| 119 |
Taxation of disposals
U.K. Holders
A disposal or deemed disposal of ordinary shares or ADSs by an individual U.K. Holder may, depending on his or her individual circumstances, give rise to a chargeable gain or to an allowable loss for the purpose of U.K. capital gains tax. The principal factors that will determine the capital gains tax position on a disposal of ordinary shares or ADSs are the extent to which the holder realizes any other capital gains in the tax year in which the disposal is made, the extent to which the holder has incurred capital losses in that or any earlier tax year and the level of the annual allowance of tax-free gains in that tax year (the “annual exemption”). The annual exemption for the 2014/20152016/2017 tax year is £11,000.£11,100. If, after all allowable deductions, an individual U.K. Holder’s total taxable income (which, for the avoidance of doubt, includes any dividend income within the £5,000 nil rate band described above) for the year exceeds the basic rate income tax limit, a taxable capital gain accruing on a disposal of ordinary shares or ADSs will be taxed at 28%20%. InIf, after all allowable deductions, an individual U.K. Holder’s total taxable income for the year does not exceed the basic rate income tax limit, and assuming the individual does not have any other cases,taxable capital gains in the tax year that would use up the remaining basic rate allowance, a taxable capital gain accruing on a disposal of ordinary shares or ADSs maywill be taxed at 18% or 28% or10% on an amount that, when treated as the top slice of the relevant U.K. Holder’s income/gains, does not exceed the basic rate income tax and at a combination of both rates.20% on the remainder.
A disposal of ordinary shares or ADSs by a corporate U.K. Holder may give rise to a chargeable gain or an allowable loss for the purpose of U.K. corporation tax. Such a holder should be entitled to an indexation allowance, which applies to reduce capital gains to the extent that such gains arise due totake account of inflation. The allowance may reduce a chargeable gain but will not create or increase an allowable loss.
Any gains or losses in respect of currency fluctuations over the period of holding the ADSs would also be brought into account on the disposal.
Non-U.K. Holders
An individual holder who is not a U.K. Holder will not be liable to U.K. capital gains tax on capital gains realized on the disposal of his or her ordinary shares or ADSs unless such holder carries on (whether solely or in partnership) a trade, profession or vocation in the United Kingdom through a branch or agency in the United Kingdom to which the ordinary shares or ADSs are attributable. In these circumstances, such holder may, depending on his or her individual circumstances, be chargeable to U.K. capital gains tax on chargeable gains arising from a disposal of his or her ordinary shares or ADSs.
A corporate holder of ordinary shares or ADSs that is not a U.K. Holder will not be liable for U.K. corporation tax on chargeable gains realized on the disposal of its ordinary shares or ADSs unless it carries on a trade in the United Kingdom through a permanent establishment to which the ordinary shares or ADSs are attributable. In these circumstances, a disposal of ordinary shares or ADSs by such holder may give rise to a chargeable gain or an allowable loss for the purposes of U.K. corporation tax.
Inheritance Tax
If for the purposes of the Taxes on Estates of Deceased Persons and on Gifts Treaty 1978 between the United States and the United Kingdom an individual holder of ordinary shares or ADSs is domiciled in the United States and is not a national of the United Kingdom, any ordinary shares or ADSs beneficially owned by that holder will not generally be subject to U.K. inheritance tax on that holder’s death or on a gift made by that holder during his/her lifetime, provided that any applicable United States federal gift or estate tax liability is paid, except where (i) the ordinary shares or ADSs are part of the business property of a U.K. permanent establishment or pertain to a U.K. fixed base used for the performance of independent personal services; or (ii) the ordinary shares or ADSs are comprised in a settlement unless, at the time the settlement was made, the settlor was domiciled in the United States and not a national of the U.K. (in which case no charge to U.K. inheritance tax should apply).
Stamp Duty and Stamp Duty Reserve Tax
Issue and transferTransfer of ordinary sharesOrdinary Shares
No U.K. stamp duty or stamp duty reserve tax (“SDRT”), is payable on the issue of the ordinary shares.
The Finance Act 2014 introduced provisions that exempt securities admitted to tradingBased on a “recognized growth market” (currently including AIM) fromcurrent published HMRC practice and recent case law, there should be no U.K. stamp duty and SDRT with effect from April 28, 2014, provided that those securities are not “listed”reserve tax ("SDRT") payable on any market. As such, the transferissue of ordinary shares to a depositary receipt system or a clearance service (for example DTC).
Transfers of ordinary shares to, or to a nominee or agent for, a person whose business is or includes issuing depositary receipts or to, or to a nominee or agent for, a person whose business is or includes the provision of clearance services, will generally be regarded by HMRC as subject to stamp duty or SDRT at 1.5% of the amount or value should notof the consideration or, in certain circumstances, the value of the ordinary shares transferred. In practice, this liability for stamp duty or SDRT is in general borne by such person depositing the relevant shares in the depositary receipt system or clearance service. Transfers of ordinary shares between depositary receipt systems and clearance services will generally be exempt from stamp duty and SDRT.
The transfer on sale of ordinary shares by a written instrument of transfer will generally be liable to U.K. stamp duty at the rate of 0.5% of the amount or value of the consideration for the transfer. The purchaser normally pays the stamp duty.
An agreement to transfer ordinary shares outside a depositary receipt system or a clearance service will generally give rise to eithera liability on the purchaser to SDRT at the rate of 0.5% of the amount or value of the consideration. Such SDRT is payable on the seventh day of the month following the month in which the charge arises, but where an instrument of transfer is executed and duly stamped before the expiry of a period of six years beginning with the date of that agreement, (i) any SDRT that has not been paid ceases to be payable, and (ii) any SDRT that has been paid may be recovered from HMRC, generally with interest.
| 120 |
Transfer of ADSs
Based on current HMRC published practice, no U.K. stamp duty or SDRT.
Transfer of ADSs
No U.K. stamp duty willshould be payable on a written instrument transferring an ADS or on a written agreement to transfer an ADS, providedon the basis that the instrument of transfer or the agreement to transfer is executed and remains at all times outside the United Kingdom. Where these conditions are not met, the transfer of, or agreement to transfer, an ADS could, depending on the circumstances, attractis not regarded as “stock” or a charge to“marketable security” for U.K. stamp duty at the rate of 0.5% of the value of the consideration given in connection with the transfer.purposes.
No SDRT will be payable in respect ofon an agreement to transfer an ADS.ADS, as an ADS is not considered a “chargeable security” for the purposes of SDRT.
| F. | Dividends and Paying Agents. |
Not Applicable.
| G. | Statement by Experts. |
Not Applicable.
| H. | Documents on Display. |
We are subject to the informational requirements of the Exchange Act. Accordingly, we are required to file reports and other information with the SEC, including annual reports on Form 20-F and reports on Form 6-K. You may inspect and copy reports and other information filed with the SEC at the Public Reference Room at 100 F Street, N.E., Washington, D.C. 20549. Information on the operation of the Public Reference Room may be obtained by calling the SEC at 1-800-SEC-0330. In addition, the SEC maintains an Internet website that contains reports and other information about issuers, like us, that file electronically with the SEC. The address of that website is www.sec.gov.
We also make available on our website, free of charge, our Annual Report and the text of our reports on Form 6-K, including any amendments to these reports, as well as certain other SEC filings, as soon as reasonably practicable after they are electronically filed with or furnished to the SEC. Our website address is “www.gwpharm.com.” The information contained on our website is not incorporated by reference in this Annual Report.
| I. | Subsidiary Information |
Not Applicable.
| Item 11 | Quantitative and Qualitative Disclosures About Market Risk. |
Market risk arises from our exposure to fluctuation in interest rates and currency exchange rates. These risks are managed by maintaining an appropriate mix of cash deposits in various currencies, placed with a variety of financial institutions for varying periods according to expected liquidity requirements.
Interest Rate Risk
We are exposed to interest rate risk as we place surplus cash funds on deposit to earn interest income. We seek to ensure that we consistently earn commercially competitive interest rates by using the services of an independent broker to identify and secure the best commercially available interest rates from those banks that meet our stringent counterparty credit rating criteria. In doing so, we manage the term of cash deposits, up to 365 days, in order to maximize interest earnings while also ensuring that we maintain sufficient readily available cash in order to meet short-term liquidity needs.
At September 30, 2014,2016, our cash and cash equivalents consisted of very short-term cash deposits with maturities of less than 90 days, in order to maximize the liquidity of our funds during a period of economic uncertainty and increased concern about counterparty credit risk.
We do not have any balance sheet exposure to assets or liabilities that would increase or decrease in fair value with changes to interest rates.
| 121 |
Currency Risk
Our functional currency is pounds sterling and the majority of our transactions are denominated in that currency. However, we receive revenue and incur expenses in other currencies and are exposed to the effects of exchange rates. We seek to minimize this exposure by passively maintaining other currency cash balances at levels appropriate to meet foreseeable expenses in these other currencies, converting surplus currency balances of these other currencies into pounds sterling as soon as they arise. We do not use forward exchange contracts to manage exchange rate exposure.
For additional information about our quantitative and qualitative risks, see [Note 19]Note 21 to the consolidated financial statements.
| Item 12 | Description of Securities Other than Equity Securities. |
| A. | Debt Securities. |
Not Applicable.
| B. | Warrants and Rights. |
Not Applicable.
| C. | Other Securities. |
Not Applicable.
| D. | American Depositary Shares. |
Fees and Charges
The following table shows the fees and charges that a holder of our ADSs may have to pay, either directly or indirectly. The majority of these costs are set by the Depositary and are subject to change:
Service | Fees | |
| Issuance of ADSs | Up to U.S. 5¢ per ADS issued | |
| Cancellation of ADSs | Up to U.S. 5¢ per ADS canceled | |
| Distribution of cash dividends or other cash distributions | Up to U.S. 5¢ per ADS held | |
| Distribution of ADSs pursuant to stock dividends, free stock distributions or exercise of rights | Up to U.S. 5¢ per ADS held | |
| Distribution of securities other than ADSs or rights to purchase additional ADSs | Up to U.S. 5¢ per ADS held | |
| Depositary Services | Up to U.S. 5¢ per ADS held on the applicable record date(s) established by the depositary bank |
ADS holders may also be responsible to pay certain fees and expenses incurred by the depositary bank and certain taxes and governmental charges such as:
| 122 |
| Item 13. | Defaults, Dividend Arrearages and Delinquencies. |
None
| Item 14. | Material Modifications To The Rights of Security Holders and Use of Proceeds. |
Not Applicable.
| Item 15. | Controls and Procedures. |
| A. | Disclosure Controls and Procedures. |
As required by RulesRule 13a-15 and 15d-15 under the Exchange Act, management, including our chief executive officer and our chief financial officer, has evaluated the effectiveness of our disclosure controls and procedures as of the end of the period covered by this report. Disclosure controls and procedures refer to controls and other procedures designed to ensure that information required to be disclosed in the reports we file or submit under the Exchange Act is recorded, processed, summarized and reported within the time periods specified in the rules and forms of the SEC. Disclosure controls and procedures include, without limitation, controls and procedures designed to ensure that information required to be disclosed by us in our reports that we file or submit under the Exchange Act is accumulated and communicated to management, including our principal executive and principal financial officers, or persons performing similar functions, as appropriate to allow timely decisions regarding our required disclosure.
Based on the foregoing, our chief executive officer and our chief financial officer have concluded that, as of September 30, 2014,2016, our disclosure controls and procedures were not effective due to the material weakness in internal control over financial reporting described below.were effective.
| B. | Management’s Annual Report on Internal Control over Financial Reporting. |
Management is responsible for establishing and maintaining adequate internal control over financial reporting as defined in RulesRule 13a-15(f) and 15d-15(f) under the Exchange Act. Our internal control over financial reporting is a process to provide reasonable assurance regarding the reliability of financial reporting and the preparation of financial statements for external purposes in accordance with International Financial Reporting Standards, or IFRS, as endorsed by the European Union and as issued by the International Accounting Standards Board, or IASB. We have a program for the review of our internal control over financial reporting to ensure compliance with the requirements of the Exchange Act and Section 404 of the Sarbanes-Oxley Act. Our internal control over financial reporting includes those policies and procedures that:
Because of its inherent limitations, internal control over financial reporting may not prevent or detect all misstatements. Also, projections of any evaluation of effectiveness to future periods are subject to the risk that controls may become inadequate because of changes in conditions, or that the degree of compliance with the policies or procedures may deteriorate.
Our management, with the participation of our chief executive officer and our chief financial officer, assessed the effectiveness of our internal control over financial reporting as of September 30, 2014.2016. In conducting its assessment of internal control over financial reporting, management based its evaluation on theInternal Control – Integrated Framework(2013) issued by the COSO as at September 30, 2014.2016. Based on its evaluation, our management has concluded that due to the material weakness described below, our internal control over financial reporting was not effective as at September 30, 2014.
A material weakness is a deficiency, or a combination of deficiencies, in internal control over financial reporting such that there is a reasonable possibility that a material misstatement of the company’s annual or interim financial statements will not be prevented or detected on a timely basis.
The material weakness as at September 30, 2014, the date on which we have assessed our internal controls, relates to the accounting for non-routine transactions. Due to the increasing technical complexity of our business, in addition to the rapidly evolving nature of the accounting and regulatory rules with which we have to comply, we have not yet fully established a sufficiently precise internal control related to the accounting for non-routine transactions under IFRS. For such an internal control to be effective, the Group needs to engage an outside professional accounting advisor with sufficient technical accounting expertise to provide technical IFRS accounting and disclosure advice in respect of future complex accounting matters. Although there were no material misstatements as at September 30, 2014 as a result of this deficiency in the design of internal controls over financial reporting, there is a reasonable possibility that the deficiency in our controls related to non-routine transactions could have resulted in a material misstatement.2016.
The Group’s internal control over financial reporting at September 30, 20142016 has been audited by Deloitte LLP, an independent registered public accounting firm who also audit the Group’s consolidated financial statements. Their audit report on internal control over financial reporting is included in Item 15C. Deloitte LLP has also audited the consolidated financial statements as at and for the year ended September 30, 20142016 and their report expressed an unqualified opinion on those financial statements.
Remedial Actions
As a result of our conclusion that we need to strengthen our controls over technical IFRS accounting matters, specifically in relation to non-routine transactions, we have identified the following steps to remediate this identified weakness, many of which have been implemented as at the date of this report:
Under the direction of the Audit Committee of our Board of Directors, we will continue to develop and implement policies and procedures to improve the overall effectiveness of our internal control over financial reporting. Management believes that the foregoing efforts will effectively remediate the material weakness that we identified as having existed as at September 30, 2014. As we continue to evaluate and work to improve our internal control over financial reporting, management may determine to take additional measures to address control deficiencies or determine to modify the remediation plan described above.
| C. | Attestation Report of the Registered Public Accounting Firm. |
To the Board of Directors and Shareholders of GW Pharmaceuticals plc
We have audited GW Pharmaceuticals plc (the "Group’s")the internal control over financial reporting of GW Pharmaceuticals plc and subsidiaries (the “Company”) as at September 30, September 2014,2016, based on criteria established inInternal Control — Integrated Framework (2013) issued by the Committee of Sponsoring Organizations of the Treadway Commission. The Group'sCompany’s management is responsible for maintaining effective internal control over financial reporting and for its assessment of the effectiveness of internal control over financial reporting, included in the accompanying Management’s Report on Internal Control over Financial Reporting. Our responsibility is to express an opinion on the Group'sCompany’s internal control over financial reporting based on our audit.
We conducted our audit in accordance with the standards of the Public Company Accounting Oversight Board (United States). Those standards require that we plan and perform the audit to obtain reasonable assurance about whether effective internal control over financial reporting was maintained in all material respects. Our audit included obtaining an understanding of internal control over financial reporting, assessing the risk that a material weakness exists, testing and evaluating the design and operating effectiveness of internal control based on that risk, and performing such other procedures as we considered necessary in the circumstances. We believe that our audit provides a reasonable basis for our opinion.
A company's internal control over financial reporting is a process designed by, or under the supervision of, the company's principal executive and principal financial officers, or persons performing similar functions, and effected by the company's board of directors, management, and other personnel to provide reasonable assurance regarding the reliability of financial reporting and the preparation of financial statements for external purposes in accordance with generally accepted accounting principles. A company's internal control over financial reporting includes those policies and procedures that (1) pertain to the maintenance of records that, in reasonable detail, accurately and fairly reflect the transactions and dispositions of the assets of the company; (2) provide reasonable assurance that transactions are recorded as necessary to permit preparation of financial statements in accordance with generally accepted accounting principles, and that receipts and expenditures of the company are being made only in accordance with authorizations of management and directors of the company; and (3) provide reasonable assurance regarding prevention or timely detection of unauthorized acquisition, use, or disposition of the company's assets that could have a material effect on the financial statements.
Because of the inherent limitations of internal control over financial reporting, including the possibility of collusion or improper management override of controls, material misstatements due to error or fraud may not be prevented or detected on a timely basis. Also, projections of any evaluation of the effectiveness of the internal control over financial reporting to future periods are subject to the risk that the controls may become inadequate because of changes in conditions, or that the degree of compliance with the policies or procedures may deteriorate.
| 124 |
A material weakness is a deficiency, or a combination of deficiencies, in internal control over financial reporting, such that there is a reasonable possibility that a material misstatement of the company’s annual or interim financial statements will not be prevented or detected on a timely basis. The following material weakness has been identified and included in management's assessment: a design deficiency related to the accounting for non-routine transactions that resulted in a reasonable possibility that the controls would not detect or prevent a material misstatement arising in relation to non-routine transactions in the consolidated financial statements or the related disclosures. This material weakness was considered in determining the nature, timing, and extent of audit tests applied in our audit of the financial statements as at and for the year ended 30 September 2014 of the Group and this report does not affect our report on such financial statements.
In our opinion, because of the effect of theCompany maintained, in all material weakness identified above on the achievement of the objectives of the control criteria, the Group has not maintainedrespects, effective internal control over financial reporting as atof September 30, September 20142016, based on the criteria established inInternal Control —Control— Integrated Framework (2013) issued by the Committee of Sponsoring Organizations of the Treadway Commission.
We have also audited, in accordance with the standards of the Public Company Accounting Oversight Board (United States), the consolidated financial statements of the GroupCompany as atof and for the year ended September 30, September 20142016 and our report dated 2 December 20145, 2016 expressed an unqualified opinion on those financial statements.
/s/ Deloitte LLP
Reading, United Kingdom
2 December 2014
| /s/ Deloitte LLP | |
| London, United Kingdom | |
| December 5, 2016 |
| D. | Changes in Internal Control Over Financial Reporting. |
There were noDuring fiscal 2016, we implemented changes in our internal control over financial reporting that occurred during(as defined in Rule 13a-15(f) under the period covered by this Annual ReportExchange Act) that have materially affected, or areis reasonably likely to materially affect, ourthe Group’s internal control over financial reporting. As disclosed in our Annual Report on Form 20-F for the year ended September 30, 2015, we concluded that we did not have adequate internal controls over the accounting for the completeness and valuation of clinical trial accruals.
With the oversight of our management and the Audit Committee, we have implemented additional measures to remediate the underlying causes of the material weakness related to the accounting for the completeness and valuation of clinical trial accruals described above. Our remediation actions included:
We believe the previously identified material weakness for over accounting for the completeness and valuation of clinical trial accruals has been remediated.
| Item 16A. | Audit Committee Financial Expert. |
Our Audit Committee consists of James Noble, Cabot Brown and Thomas Lynch and is chaired by Mr. James Noble. Each of our Audit Committee members satisfies the independence requirements of Rule 5605(a)(2) of the NasdaqNASDAQ Stock Market, Marketplace Rules, and the independence requirements of Rule 10A-3(b)(1) under the Exchange Act. Our board of directors has determined that Mr. Noble qualifies as an Audit Committee financial expert within the meaning of the applicable SEC rules.
| 125 |
| Item 16B. | Code of Ethics. |
Our Code of Business Conduct and Ethics is applicable to all of our employees, officers and directors and is available on our website at http://www.gwpharm.com. Our Code of Business Conduct and Ethics provides that our directors and officers are expected to avoid any action, position or interest that conflicts with the interests of our company or gives the appearance of a conflict. Our directors and officers have an obligation under our Code of Business Conduct and Ethics to advance our company’s interests when the opportunity to do so arises. We expect that any amendment to this code, or any waivers of its requirements, will be disclosed on our website. Information contained on, or that can be accessed through, our website is not incorporated by reference into this document, and you should not consider information on our website to be part of this document.
| Item 16C. | Principal Accountant Fees and Services. |
Our financial statements have been prepared in accordance with IFRS and are audited by Deloitte LLP, a firm registered with the Public Company Accounting Oversight Board in the United States.
Deloitte LLP has served as our independent registered public accountant for each of the years ended September 30, 2012,2016, September 30, 20132015 and September 30, 2014 for which audited statements appear in this Annual Report.
The following table shows the aggregate fees for services rendered by Deloitte LLP to us, including some of our subsidiaries, in fiscal years ended September 30, 20132016 and 2014.2015.
| 2014 £000’s | 2013 £000’s | 2016 £000’s | 2015 £000’s | |||||||||||||
| Audit fees: | ||||||||||||||||
| – Audit of the Company’s annual accounts1 | 243 | 70 | 400 | 400 | ||||||||||||
| – Audit of the Company’s subsidiaries pursuant to legislation | 41 | 40 | 50 | 50 | ||||||||||||
| Total audit fees | 284 | 110 | 450 | 450 | ||||||||||||
| Other services | ||||||||||||||||
| – Audit-related assurance2 | 46 | 40 | 75 | 53 | ||||||||||||
| – Other assurance services3 | 193 | 306 | 109 | 92 | ||||||||||||
| – All other services4 | – | – | ||||||||||||||
| Total non-audit fees | 239 | 346 | 184 | 145 | ||||||||||||
| 1 | For the years ended September 30, |
| 2 | Audit related assurance fees relate to fees for the performance of interim reviews, and other procedures on our interim results. |
| 3 | Other assurance services represents assurance reporting on historical financial information included in the Company’s |
Audit Committee Pre-Approval policies and procedures
Our Audit Committee reviews and pre-approves the scope and the cost of audit services related to us and permissible non-audit services performed by the independent auditors, other than those forde minimis services which are approved by the Audit Committee prior to the completion of the audit. All of the services related to our company provided by Deloitte LLP during the last fiscal year have been approved by the Audit Committee.
| Item 16D. | Exemptions From the Listing Standards For Audit Committees. |
Not Applicable.
| Item 16E. | Purchases of Equity Securities by the Issuer and Affiliated Purchasers. |
Not Applicable.
| Item 16F. | Change in the Registrant’s Certifying Accountant. |
Not Applicable.
| 126 |
| Item 16G. | Corporate Governance. |
We rely on a provision in Nasdaq’sNASDAQ’s Listed Company Manual that allows us to follow English corporate law and the Companies Act 2006 with regard to certain aspects of corporate governance. This allows us to follow certain corporate governance practices that differ in significant respects from the corporate governance requirements applicable to U.S. companies listed on the NasdaqNASDAQ Global Market.
For example, we are exempt from regulations that require a listed company to:
As a foreign private issuer, we are permitted to, and we will continue to, follow home country practice in lieu of the above requirements.
In accordance with our NasdaqNASDAQ Global Market listing, our Audit Committee is required to comply with the provisions of Section 301 of the Sarbanes-Oxley Act of 2002, or the Sarbanes-Oxley Act, and Rule 10A-3 of the Exchange Act, both of which are also applicable to NasdaqNASDAQ Global Market-listed U.S. companies. Because we are a foreign private issuer, however, our Audit Committee is not subject to additional NasdaqNASDAQ Global Market requirements applicable to listed U.S. companies, including an affirmative determination that all members of the Audit Committee are “independent,” using more stringent criteria than those applicable to us as a foreign private issuer.
| Item 16H. | Mine Safety Disclosure. |
Not Applicable.
| 127 |
| Item 17 | Financial Statements. |
We have elected to provide financial statements pursuant to Item 18.
| Item 18 | Financial Statements. |
The financial statements are filed as part of this Annual Report beginning on page F-1.
| Item 19 | Exhibits |
Exhibit Number | Description of Exhibit | |
| 1.1* | Memorandum & Articles of Association of GW Pharmaceuticals plc. (incorporated by reference to Exhibit 3.1 to our Registration Statement on Form F-1 (file no. 333-187356), as amended, initially filed with the SEC on March 19, 2013). | |
| 2.1* | Form of specimen certificate evidencing ordinary shares (incorporated by reference to Exhibit 4.1 to our Registration Statement on Form F-1 (file no. 333-187356), as amended, initially filed with the SEC on March 19, 2013). | |
| 2.2(1)* | Form of Deposit Agreement among GW Pharmaceuticals plc, Citibank, N.A., as the depositary bank and all Holders and Beneficial Owners of ADSs issued thereunder (incorporated by reference to Exhibit 4.2 to our Registration Statement on Form F-1 (file no. 333-187356), as amended, initially filed with the SEC on March 19, 2013). | |
| 2.3(1)* | Form of American Depositary Receipt (included in Exhibit 2.2) (incorporated by reference to Exhibit 4.3 to our Registration Statement on Form F-1 (file no. 333-187356), as amended, initially filed with the SEC on March 19, 2013). | |
| 4.1†* | Licence and Distribution Agreement between Bayer AG Division Pharma and GW Pharma | |
| 4.2†* | Amendment Number 1 to the Licence and Distribution Agreement, dated November 4, 2003 (incorporated by reference to Exhibit 10.2 to our Registration Statement on Form F-1 (file no. 333-187356), as amended, initially filed with the SEC on March 19, 2013). | |
| 4.3* | Amendment Number 2 to the Licence and Distribution Agreement between GW Pharma | |
| 4.4†* | Amendment Number 3 to the Licence and Distribution Agreement between GW Pharma | |
| 4.5†* | Amendment Number 4 to the Licence and Distribution Agreement between GW Pharma | |
| 4.6* | Amendment Number 5 to the Licence and Distribution Agreement between GW Pharma |
| 128 |
| 4.7†* | Supply Agreement between Bayer AG and GW Pharma | |
| 4.8†* | Amendment Number 1 to the Supply Agreement between GW Pharma | |
| 4.9†* | Amendment Number 2 to the Supply Agreement between GW Pharma | |
| 4.10†* | Amendment Number 3 to the Supply Agreement between GW Pharma | |
| 4.11†* | Product Commercialisation and Supply Consolidated Agreement between GW Pharma Limited and Almirall Prodesfarma, S.A., dated June 6, 2006 (incorporated by reference to Exhibit 10.11 to our Registration Statement on Form F-1 (file no. 333-187356), as amended, initially filed with the SEC on March 19, 2013). | |
| 4.12†* | Amendment No. 1 to the Product Commercialisation and Supply Consolidated Agreement between GW Pharma | |
| 4.13†* | Amendment to the Product Commercialisation and Supply Consolidated Agreement, dated June 6, 2006 between GW Pharma | |
| 4.14†* | Supplementary Agreement to the Product Commercialisation and Supply Consolidated Agreement, dated June 6, 2006 between GW Pharma | |
| 4.15†* | Amendment and Supplementary Agreement to the Product Commercialisation and Supply Consolidated Agreement, dated June 6, 2006 between GW Pharma | |
| 4.16†* | Research Collaboration and Licence Agreement between GW Pharma | |
| 4.17†* | Amendment No. 1 to Research Collaboration and Licence Agreement, dated March 14, 2008 (incorporated by reference to Exhibit 10.17 to our Registration Statement on Form F-1 (file no. 333-187356), as amended, initially filed with the SEC on March 19, 2013). | |
| 4.18†* | Amendment No. 2 to Research Collaboration and Licence Agreement, dated June 29, 2010 (incorporated by reference to Exhibit 10.18 to our Registration Statement on Form F-1 (file no. 333-187356), as amended, initially filed with the SEC on March 19, 2013). |
| 129 |
| 4.19†* | Development and Licence Agreement between GW Pharma | |
| 4.20†* | Amendment No. 1 to Development and Licence Agreement, dated November 1, 2008 (incorporated by reference to Exhibit 10.20 to our Registration Statement on Form F-1 (file no. 333-187356), as amended, initially filed with the SEC on March 19, 2013). | |
| 4.21†* | Letter amending Development and Licence Agreement, dated October 21, 2010 (incorporated by reference to Exhibit 10.21 to our Registration Statement on Form F-1 (file no. 333-187356), as amended, initially filed with the SEC on March 19, 2013). | |
| 4.22†* | Distribution and Licence Agreement, dated April 8, 2011, by and between GW Pharma | |
| 4.23†* | Manufacturing and Supply Agreement, dated November 9, 2011, by and between Novartis Pharma AG and GW Pharma | |
| 4.24†* | Production Supply Agreement, dated March 7, 2007 (incorporated by reference to Exhibit 10.24 to our Registration Statement on Form F-1 (file no. 333-187356), as amended, initially filed with the SEC on March 19, 2013). | |
| 4.25†* | Lease, dated July 6, 2009 (incorporated by reference to Exhibit 10.25 to our Registration Statement on Form F-1 (file no. 333-187356), as amended, initially filed with the SEC on March 19, 2013). | |
| 4.26†* | Lease, dated October 9, 2009 (incorporated by reference to Exhibit 10.26 to our Registration Statement on Form F-1 (file no. 333-187356), as amended, initially filed with the SEC on March 19, 2013). | |
| 4.27†* | Lease, dated April 6, 2011 (incorporated by reference to Exhibit 10.27 to our Registration Statement on Form F-1 (file no. 333-187356), as amended, initially filed with the SEC on March 19, 2013). | |
| 4.28†* | Lease, dated October 12, 2011 (incorporated by reference to Exhibit 10.28 to our Registration Statement on Form F-1 (file no. 333-187356), as amended, initially filed with the SEC on March 19, 2013). | |
| 4.29†* | Lease, dated January 6, 2012 (incorporated by reference to Exhibit 10.29 to our Registration Statement on Form F-1 (file no. 333-187356), as amended, initially filed with the SEC on March 19, 2013). | |
| 4.30†* | Agreement for Lease, dated April 4, 2012 (incorporated by reference to Exhibit 10.30 to our Registration Statement on Form F-1 (file no. 333-187356), as amended, initially filed with the SEC on March 19, 2013). | |
| 4.31* | Occupational Underlease, dated August 11, 2010 (incorporated by reference to Exhibit 10.31 to our Registration Statement on Form F-1 (file no. 333-187356), as amended, initially filed with the SEC on March 19, 2013). | |
| 4.32* | Lease, dated May 24, 2011 (incorporated by reference to Exhibit 10.32 to our Registration Statement on Form F-1 (file no. 333-187356), as amended, initially filed with the SEC on March 19, 2013). |
| 130 |
| 4.33* | Tenancy Agreement, dated November 19, 2012 (incorporated by reference to Exhibit 10.33 to our Registration Statement on Form F-1 (file no. 333-187356), as amended, initially filed with the SEC on March 19, 2013). |
| 4.34* | Service Agreement by and between GW Pharma | |
| 4.35†* | Service Agreement by and between GW Pharma | |
| 4.36* | Service Agreement by and between GW Research | |
| 4.37* | Service Agreement by and between GW Research | |
| 4.38* | Service Agreement by and between GW Research | |
| 4.39* | Letter of Appointment by and between GW Pharmaceuticals plc and James Noble, dated February 26, 2013 (incorporated by reference to Exhibit 10.39 to our Registration Statement on Form F-1 (file no. 333-187356), as amended, initially filed with the SEC on March 19, 2013). | |
| 4.40* | Letter of Appointment by and between GW Pharmaceuticals plc and Thomas Lynch, dated February 26, 2013 (incorporated by reference to Exhibit 10.40 to our Registration Statement on Form F-1 (file no. 333-187356), as amended, initially filed with the SEC on March 19, 2013). | |
| 4.41* | Service Agreement by and between Greenwich Biosciences Inc. (formerly GW Pharmaceuticals Inc.) and Cabot Brown, dated November 7, 2013 (incorporated by reference to Exhibit 10.41 to our Annual Report (file no. 001-35892), filed with the SEC on November 25, 2013). | |
| 4.42* | Long Term Incentive Plan (incorporated by reference to Exhibit | |
| 4.43* | GW Pharmaceuticals All Employee Share Scheme (incorporated by reference to Exhibit 10.43 to our Registration Statement on Form F-1 (file no. 333-187356), as amended, initially filed with the SEC on March 19, 2013). | |
| 4.44* | GW Pharmaceuticals Approved Share Option Scheme 2001, as amended. | |
| GW Pharmaceuticals Unapproved Share Option Scheme 2001, as amended. | ||
| 4.46†* | Lease, dated May 24, 2013 (incorporated by reference to Exhibit 4.46 to our Annual Report (file no. 001-35892), as amended, originally filed with the SEC on November 25, 2013). | |
| 4.47†* | Lease, dated May 24, 2013 (incorporated by reference to Exhibit 4.47 to our Annual Report (file no. 001-35892), as amended, originally filed with the SEC on November 25, 2013). | |
| 4.48†* | Lease, dated May 24, 2013 (incorporated by reference to Exhibit 4.48 to our Annual Report (file no. 001-35892), as amended, originally filed with the SEC on November 25, 2013). |
| 131 |
| 4.49* | Lease, dated August 1, 2013 (incorporated by reference to Exhibit 4.49 to our Annual Report (file no. 001-35892), as amended, originally filed with the SEC on November 25, 2013). |
| 4.50* | Lease, dated July 16, 2013 (incorporated by reference to Exhibit 4.50 to our Annual Report (file no. 001-35892), as amended, originally filed with the SEC on November 25, 2013). | |
| 4.51* | Amendment to the Distribution and Licence Agreement, dated May 5, 2014 between Novartis Pharma AG and GW Pharma | |
| 4.52* | Amendment and Supplementary Agreement to the Product Commercialisation and Supply Consolidated Agreement dated June 6, 2006, between GW Pharma | |
| Transfer of Contract, dated July 20, 2015 among GW Pharmaceuticals plc, GW Research Limited and Justin Gover. | ||
| 4.54* | Offer Letter, dated July 17, 2015 between Greenwich Biosciences Inc. (formerly GW Pharmaceuticals Inc.) and Justin Gover. | |
| 4.55* | Offer Letter, dated May 5, 2015 between Greenwich Biosciences Inc. (formerly GW Pharmaceuticals Inc.) and Julian Gangolli. | |
| 4.56* | Discretionary Benefits Letter, dated May 5, 2015 between Greenwich Biosciences Inc. (formerly GW Pharmaceuticals Inc.) and Julian Gangolli. | |
| 4.57* | Service Agreement by and between GW Pharmaceuticals plc and Julian Gangolli, effective July 21, 2015. | |
| 4.58**†† | Lease, dated May 27, 2016. | |
| 4.59**†† | Amended and Restated Production and Supply Agreement, dated August 31, 2016, among GW Pharma Limited, GW Pharmaceuticals plc and British Sugar plc. | |
| 4.60** | Mutual Termination Agreement, dated November 24, 2016 between Novartis Pharma AG and GW Pharma Ltd. | |
| 4.61** | Letter of Appointment by and between GW Pharmaceuticals plc and Cabot Brown, effective January 1, 2016. | |
| 4.62** | Letter of Appointment by and between GW Pharmaceuticals plc and James Noble, effective February 1, 2016. | |
| 8.1** | List of | |
| 12.1** | Certificate of Chief Executive Officer pursuant to Securities Exchange Act Rules 13a-14(a) and 15d-14(a) as adopted pursuant to §302 of the Sarbanes-Oxley Act of 2002. | |
| 12.2** | Certificate of Chief Financial Officer pursuant to Securities Exchange Act Rules 13a-14(a) and 15d-14(a) as adopted pursuant to §302 of the Sarbanes-Oxley Act of 2002. | |
| 13.1** | Certificate of Chief Executive Officer pursuant to 18 U.S.C. §1350, as adopted pursuant to §906 of the Sarbanes-Oxley Act of 2002. | |
| 13.2** | Certificate of Chief Financial Officer pursuant to 18 U.S.C. §1350, as adopted pursuant to §906 of the Sarbanes-Oxley Act of 2002. | |
| 15.1** | Consent of Deloitte LLP. |
| * | Previously filed. |
| ** | Filed herewith. |
| † | Confidential treatment previously requested and granted as to portions of the exhibit. Confidential materials omitted and filed separately with the Securities and Exchange Commission. |
| †† | Confidential treatment requested as to portions of the exhibit. Confidential materials omitted and filed separately with the Securities and Exchange Commission. |
| (1) | Incorporated by reference to the Registration Statement on Form F-6 (File No. 333-187978), filed with the Securities and Exchange Commission with respect to ADSs representing ordinary shares. |
| 132 |
The registrant hereby certifies that it meets all of the requirements for filing on Form 20-F and that it has duly caused and authorized the undersigned to sign this Annual Report on its behalf.
| GW PHARMACEUTICALS PLC | |||
| By: | /s/Justin Gover | ||
| Name: | Justin Gover | ||
| Title: | Chief Executive Officer | ||
| Date: December | |||
| 133 |
INDEX TO CONSOLIDATED FINANCIAL STATEMENTS
| F-1 |
REPORT OF INDEPENDENT REGISTERED PUBLIC ACCOUNTING FIRM
To the Board of Directors and Shareholders of GW Pharmaceuticals plc
We have audited the accompanying consolidated balance sheets of GW Pharmaceuticals plc and subsidiaries (the "Group""Company") as at September 30, September 20142016 and 2013,2015, and the related consolidated income statements, consolidated statements of comprehensive income,loss, consolidated statements of changes in equity, and consolidated cash flow statements for each of the three years in the period ended September 30, September 2014.2016. These financial statements are the responsibility of the Group'sCompany’s management. Our responsibility is to express an opinion on thethese financial statements based on our audits.
We conducted our audits in accordance with the standards of the Public Company Accounting Oversight Board (United States). Those standards require that we plan and perform the audit to obtain reasonable assurance about whether the financial statements are free of material misstatement. An audit also includes examining, on a test basis, evidence supporting the amounts and disclosures in the financial statements. An audit also includes assessing the accounting principles used and significant estimates made by management, as well as evaluating the overall financial statement presentation. We believe that our audits provide a reasonable basis for our opinion.
In our opinion, such consolidated financial statements present fairly, in all material respects, the financial position of GW Pharmaceuticals plc and subsidiaries as at September 30, September 20142016 and 2013,2015, and the results of their operations and their cash flows for each of the three years in the period ended September 30, September 2014,2016, in conformity with International Financial Reporting Standards (“IFRS”) as issued by the International Accounting Standards Board.Board (“IASB”).
We have also audited, in accordance with the standards of the Public Company Accounting Oversight Board (United States), the Group'sCompany's internal control over financial reporting as at September 30, September 2014,2016, based on the criteria established inInternal Control — Integrated Framework(2013)issued by the Committee of Sponsoring Organizations of the Treadway Commission and our report dated 2 December 20145, 2016 expressed an adverseunqualified opinion on the Group'sCompany's internal control over financial reporting.
| /s/ | |
| F-2 |
Consolidated Income Statements
For the year ended 30 September
| Notes | 2014 £000’s | 2013 £000’s | 2012 £000’s | |||||||||||||
| Revenue | 3 | 30,045 | 27,295 | 33,120 | ||||||||||||
| Cost of sales | (2,060 | ) | (1,276 | ) | (839 | ) | ||||||||||
| Research and development expenditure | 4 | (43,475 | ) | (32,697 | ) | (27,578 | ) | |||||||||
| Management and administrative expenses | (7,337 | ) | (3,555 | ) | (3,620 | ) | ||||||||||
| Net foreign exchange gain/(loss) | 3,188 | (237 | ) | (40 | ) | |||||||||||
| Operating (loss)/profit | (19,639 | ) | (10,470 | ) | 1,043 | |||||||||||
| Interest expense | 9 | (61 | ) | (64 | ) | (1 | ) | |||||||||
| Interest income | 9 | 130 | 178 | 200 | ||||||||||||
| (Loss)/profit before tax | 5 | (19,570 | ) | (10,356 | ) | 1,242 | ||||||||||
| Tax benefit | 10 | 4,911 | 5,807 | 1,248 | ||||||||||||
| (Loss)/profit for the year | (14,659 | ) | (4,549 | ) | 2,490 | |||||||||||
| (Loss)/earnings per share – basic | 11 | (7.0 | )p | (3.0 | )p | 1.9 | p | |||||||||
| (Loss)/earnings per share – diluted | 11 | (7.0 | )p | (3.0 | )p | 1.8 | p | |||||||||
| Notes | 2016 £000s | 2015 £000s | 2014 £000s | |||||||||||||
| Revenue | 3 | 10,315 | 28,540 | 30,045 | ||||||||||||
| Cost of sales | (2,719 | ) | (2,618 | ) | (2,060 | ) | ||||||||||
| Research and development expenditure | 4 | (99,815 | ) | (76,785 | ) | (43,475 | ) | |||||||||
| Sales, general and administrative expenses | (19,939 | ) | (12,569 | ) | (7,337 | ) | ||||||||||
| Net foreign exchange gain | 25,551 | 6,202 | 3,188 | |||||||||||||
| Operating loss | (86,607 | ) | (57,230 | ) | (19,639 | ) | ||||||||||
| Interest expense | 9 | (173 | ) | (75 | ) | (61 | ) | |||||||||
| Other income | 9 | 608 | 244 | 130 | ||||||||||||
| Loss before tax | 5 | (86,172 | ) | (57,061 | ) | (19,570 | ) | |||||||||
| Tax benefit | 10 | 22,515 | 12,498 | 4,911 | ||||||||||||
| Loss for the year | (63,657 | ) | (44,563 | ) | (14,659 | ) | ||||||||||
| Loss per share – basic | 11 | (23.5 | )p | (18.1 | )p | (7.0 | )p | |||||||||
| Loss per share – diluted | 11 | (23.5 | )p | (18.1 | )p | (7.0 | )p | |||||||||
The accompanying notes are an integral part of these consolidated income statements.
All activities relate to continuing operations.
| F-3 |
Consolidated Statements of Comprehensive (Loss)/IncomeLoss
For the year ended 30 September
| Notes | 2014 £000’s | 2013 £000’s | 2012 £000’s | |||||||||||||
| (Loss)/profit for the year | (14,659 | ) | (4,549 | ) | 2,490 | |||||||||||
| Items that may be reclassified subsequently to profit or loss | ||||||||||||||||
| Exchange differences on retranslation of foreign operations | (2 | ) | - | - | ||||||||||||
| Other comprehensive loss for the year | (2 | ) | - | - | ||||||||||||
| Total comprehensive (loss)/income for the year | (14,661 | ) | (4,549 | ) | 2,490 | |||||||||||
2016 £000s | 2015 £000s | 2014 £000s | ||||||||||
| Loss for the year | (63,657 | ) | (44,563 | ) | (14,659 | ) | ||||||
| Items that may be reclassified subsequently to profit or loss | ||||||||||||
| Exchange differences on translation of foreign operations | 349 | (71 | ) | (2 | ) | |||||||
| Other comprehensive gain/(loss) for the year | 349 | (71 | ) | (2 | ) | |||||||
| Total comprehensive loss for the year | (63,308 | ) | (44,634 | ) | (14,661 | ) | ||||||
The accompanying notes are an integral part of these consolidated statements of comprehensive (loss)/income.loss.
| F-4 |
Consolidated StatementsStatement of Changes in Equity
For the year ended 30 September
| Group | Share Capital £000’s | Share Premium Account £000’s | Other Reserves £000’s | Accumulated Deficit £000’s | Total £000’s | Share Capital £000s | Share Premium Account £000s | Other Reserves £000s | Accumulated Deficit £000s | Total Equity £000s | ||||||||||||||||||||||||||||||
| At 1 October 2011 | 133 | 65,866 | 20,184 | (68,531 | ) | 17,652 | ||||||||||||||||||||||||||||||||||
| Exercise of share options | – | 81 | – | – | 81 | |||||||||||||||||||||||||||||||||||
| Share-based payment transactions | – | – | – | 1,009 | 1,009 | |||||||||||||||||||||||||||||||||||
| Profit for the year | – | – | – | 2,490 | 2,490 | |||||||||||||||||||||||||||||||||||
| Balance at 30 September 2012 | 133 | 65,947 | 20,184 | (65,032 | ) | 21,232 | ||||||||||||||||||||||||||||||||||
| At 1 October 2013 | 178 | 84,005 | 20,184 | (68,965 | ) | 35,402 | ||||||||||||||||||||||||||||||||||
| Issue of share capital | 45 | 19,725 | – | – | 19,770 | 51 | 127,315 | – | – | 127,366 | ||||||||||||||||||||||||||||||
| Expenses associated with new equity issue | – | (1,670 | ) | – | – | (1,670 | ) | |||||||||||||||||||||||||||||||||
| Exercise of share options | – | 3 | – | – | 3 | |||||||||||||||||||||||||||||||||||
| Share-based payment transactions | – | – | – | 616 | 616 | |||||||||||||||||||||||||||||||||||
| Loss for the year | – | – | – | (4,549 | ) | (4,549 | ) | |||||||||||||||||||||||||||||||||
| Balance at 30 September 2013 | 178 | 84,005 | 20,184 | (68,965 | ) | 35,402 | ||||||||||||||||||||||||||||||||||
| Issue of share capital | 51 | 127,315 | – | – | 127,366 | |||||||||||||||||||||||||||||||||||
| Expenses associated with new equity issue | – | (1,067 | ) | – | – | (1,067 | ) | |||||||||||||||||||||||||||||||||
| Expenses of new equity issue | – | (1,067 | ) | – | – | (1,067 | ) | |||||||||||||||||||||||||||||||||
| Exercise of share options | 4 | 5,014 | – | – | 5,018 | 4 | 5,014 | – | – | 5,018 | ||||||||||||||||||||||||||||||
| Exercise of warrants | 4 | 5,284 | (922 | ) | 922 | 5,288 | 4 | 5,284 | (922 | ) | 922 | 5,288 | ||||||||||||||||||||||||||||
| Share-based payment transactions | – | – | – | 1,238 | 1,238 | – | – | – | 1,238 | 1,238 | ||||||||||||||||||||||||||||||
| Loss for the year | – | – | – | (14,659 | ) | (14,659 | ) | – | – | – | (14,659 | ) | (14,659 | ) | ||||||||||||||||||||||||||
| Other comprehensive expense | – | – | (2 | ) | – | (2 | ) | |||||||||||||||||||||||||||||||||
| Other comprehensive loss | – | – | (2 | ) | – | (2 | ) | |||||||||||||||||||||||||||||||||
| Balance at 30 September 2014 | 237 | 220,551 | 19,260 | (81,464 | ) | 158,584 | 237 | 220,551 | 19,260 | (81,464 | ) | 158,584 | ||||||||||||||||||||||||||||
| Issue of share capital | 22 | 127,812 | – | – | 127,834 | |||||||||||||||||||||||||||||||||||
| Expenses of new equity issue | – | (271 | ) | – | – | (271 | ) | |||||||||||||||||||||||||||||||||
| Exercise of share options | 2 | 1,183 | – | – | 1,185 | |||||||||||||||||||||||||||||||||||
| Share-based payment transactions | – | – | – | 2,488 | 2,488 | |||||||||||||||||||||||||||||||||||
| Loss for the year | – | – | – | (44,563 | ) | (44,563 | ) | |||||||||||||||||||||||||||||||||
| Deferred tax attributable to unrealised share option gains | – | – | – | 84 | 84 | |||||||||||||||||||||||||||||||||||
| Other comprehensive loss | – | – | (71 | ) | – | (71 | ) | |||||||||||||||||||||||||||||||||
| Balance at 30 September 2015 | 261 | 349,275 | 19,189 | (123,455 | ) | 245,270 | ||||||||||||||||||||||||||||||||||
| Issue of share capital (note 22) | 39 | 206,512 | – | – | 206,551 | |||||||||||||||||||||||||||||||||||
| Expenses of new equity issue | – | (472 | ) | – | – | (472 | ) | |||||||||||||||||||||||||||||||||
| Underwriters’ contribution towards expenses of new equity issue | – | 472 | – | – | 472 | |||||||||||||||||||||||||||||||||||
| Exercise of share options (note 22) | 2 | 690 | – | – | 692 | |||||||||||||||||||||||||||||||||||
| Share-based payment transactions | – | – | – | 8,152 | 8,152 | |||||||||||||||||||||||||||||||||||
| Loss for the year | – | – | – | (63,657 | ) | (63,657 | ) | |||||||||||||||||||||||||||||||||
| Deferred tax attributable to unrealised share option gains | – | – | – | 1,133 | 1,133 | |||||||||||||||||||||||||||||||||||
| Other comprehensive gain | – | – | 349 | – | 349 | |||||||||||||||||||||||||||||||||||
| Balance at 30 September 2016 | 302 | 556,477 | 19,538 | (177,827 | ) | 398,490 | ||||||||||||||||||||||||||||||||||
| F-5 |
The accompanying notes are an integral part of these consolidated statements of changes in equity.
As at 30 September
| Group | Group | |||||||||||||||||||||||
| Notes | 2014 £000’s | 2013 £000’s | Notes | 2016 £000s | 2015 £000s | |||||||||||||||||||
| Non-current assets | ||||||||||||||||||||||||
| Intangible assets – goodwill | 12 | 5,210 | 5,210 | 12 | 5,210 | 5,210 | ||||||||||||||||||
| Investments | 27 | – | – | |||||||||||||||||||||
| Other intangible assets | 13 | 629 | 245 | |||||||||||||||||||||
| Property, plant and equipment | 13 | 11,639 | 5,476 | 14 | 38,947 | 28,733 | ||||||||||||||||||
| Deferred tax asset1 | 10 | 277 | 895 | |||||||||||||||||||||
| Deferred tax asset | 10 | 3,873 | 418 | |||||||||||||||||||||
| 17,126 | 11,581 | 48,659 | 34,606 | |||||||||||||||||||||
| Current assets | ||||||||||||||||||||||||
| Inventories | 14 | 4,777 | 4,661 | 15 | 4,248 | 4,756 | ||||||||||||||||||
| Taxation recoverable | 10 | 5,251 | 2,900 | 10 | 21,322 | 12,641 | ||||||||||||||||||
| Trade receivables and other current assets | 15 | 1,857 | 1,733 | 16 | 4,556 | 2,873 | ||||||||||||||||||
| Cash and cash equivalents | 19 | 164,491 | 38,069 | 21 | 374,392 | 234,872 | ||||||||||||||||||
| 176,376 | 47,363 | 404,518 | 255,142 | |||||||||||||||||||||
| Total assets | 193,502 | 58,944 | 453,177 | 289,748 | ||||||||||||||||||||
| Current liabilities | ||||||||||||||||||||||||
| Trade and other payables | 16 | (12,376 | ) | (9,440 | ) | 17 | (31,170 | ) | (24,022 | ) | ||||||||||||||
| Current tax liabilities | 10 | (883 | ) | (366 | ) | |||||||||||||||||||
| Obligations under finance leases | 17 | (126 | ) | (100 | ) | 19 | (211 | ) | (111 | ) | ||||||||||||||
| Deferred revenue | 18 | (4,827 | ) | (3,181 | ) | 20 | (2,686 | ) | (3,269 | ) | ||||||||||||||
| (17,329 | ) | (12,721 | ) | (34,950 | ) | (27,768 | ) | |||||||||||||||||
| Non-current liabilities | ||||||||||||||||||||||||
| Trade and other payables | 16 | (7,927 | ) | – | 17 | (9,423 | ) | (8,445 | ) | |||||||||||||||
| Obligations under finance leases | 17 | (1,781 | ) | (1,905 | ) | 19 | (4,959 | ) | (1,540 | ) | ||||||||||||||
| Deferred revenue | 18 | (7,881 | ) | (8,916 | ) | 20 | (5,355 | ) | (6,725 | ) | ||||||||||||||
| Total liabilities | (34,918 | ) | (23,542 | ) | (54,687 | ) | (44,478 | ) | ||||||||||||||||
| Net assets | 158,584 | 35,402 | 398,490 | 245,270 | ||||||||||||||||||||
| Equity | ||||||||||||||||||||||||
| Share capital | 20 | 237 | 178 | 22 | 302 | 261 | ||||||||||||||||||
| Share premium account | 220,551 | 84,005 | 556,477 | 349,275 | ||||||||||||||||||||
| Other reserves | 23 | 19,260 | 20,184 | 24 | 19,538 | 19,189 | ||||||||||||||||||
| Accumulated deficit | (81,464 | ) | (68,965 | ) | ||||||||||||||||||||
| Accumulated (deficit)/profit | (177,827 | ) | (123,455 | ) | ||||||||||||||||||||
| Total equity | 158,584 | 35,402 | 398,490 | 245,270 | ||||||||||||||||||||
1Deferred tax asset as at 30 September 2013 has been reclassified from current assets to non-current assets.
The financial statements of GW Pharmaceuticals plc, registered number 04160917, were authorised by the Board and approved for issue on 25 December 2014.2016.
The accompanying notes are an integral part of these consolidated balance sheets.
| F-6 |
Consolidated Cash Flow Statements
For the year ended 30 September
| Group | Group | |||||||||||||||||||||||
| 2014 £000’s | 2013 £000’s | 2012 £000’s | 2016 £000s | 2015 £000s | 2014 £000s | |||||||||||||||||||
| (Loss)/profit for the year | (14,659 | ) | (4,549 | ) | 2,490 | (63,657 | ) | (44,563 | ) | (14,659 | ) | |||||||||||||
| Adjustments for: | ||||||||||||||||||||||||
| Interest expense | 61 | 64 | 1 | 173 | 75 | 61 | ||||||||||||||||||
| Interest income | (130 | ) | (178 | ) | (200 | ) | ||||||||||||||||||
| Other income | (608 | ) | (244 | ) | (130 | ) | ||||||||||||||||||
| Tax | (4,911 | ) | (5,807 | ) | (1,248 | ) | (22,515 | ) | (12,498 | ) | (4,911 | ) | ||||||||||||
| Depreciation of property, plant and equipment | 1,398 | 989 | 754 | 3,605 | 2,250 | 1,398 | ||||||||||||||||||
| Impairment of property, plant and equipment | – | 606 | – | |||||||||||||||||||||
| Amortisation of intangible assets | 62 | 52 | – | |||||||||||||||||||||
| Net foreign exchange gains | (1,876 | ) | (25 | ) | (202 | ) | (25,551 | ) | (6,282 | ) | (1,876 | ) | ||||||||||||
| (Decrease)/increase in allowance for doubtful debts | – | (26 | ) | 26 | ||||||||||||||||||||
| Decrease in provision for inventories | (408 | ) | (530 | ) | (1,300 | ) | ||||||||||||||||||
| Increase/(decrease) in provision for inventories | 72 | 33 | (408 | ) | ||||||||||||||||||||
| Decrease in deferred signature fees | (1,170 | ) | (1,250 | ) | (1,065 | ) | ||||||||||||||||||
| Share-based payment charge | 1,238 | 616 | 1,009 | 8,152 | 2,478 | 1,238 | ||||||||||||||||||
| Loss on disposal of property, plant and equipment | 2 | – | – | 1 | 1 | 2 | ||||||||||||||||||
| (19,285 | ) | (9,446 | ) | 1,330 | (101,436 | ) | (59,342 | ) | (20,350 | ) | ||||||||||||||
| Decrease/(increase) in inventories | 292 | (594 | ) | (813 | ) | 436 | (12 | ) | 292 | |||||||||||||||
| (Increase)/decrease in trade receivables and other current assets | (142 | ) | (108 | ) | 609 | (753 | ) | (1,010 | ) | (142 | ) | |||||||||||||
| Increase/(decrease) in trade and other payables and deferred revenue | 3,328 | (152 | ) | 247 | 4,761 | 8,478 | 4,393 | |||||||||||||||||
| Cash (used in)/generated by operations | (15,807 | ) | (10,300 | ) | 1,373 | |||||||||||||||||||
| Cash (used in)operations | (96,992 | ) | (51,886 | ) | (15,807 | ) | ||||||||||||||||||
| Income taxes paid | (883 | ) | – | – | ||||||||||||||||||||
| Research and development tax credits received | 3,181 | 2,832 | 428 | 13,281 | 5,415 | 3,181 | ||||||||||||||||||
| Net cash (outflow)/inflow from operating activities | (12,626 | ) | (7,468 | ) | 1,801 | |||||||||||||||||||
| Net cash (outflow)from operating activities | (84,594 | ) | (46,471 | ) | (12,626 | ) | ||||||||||||||||||
| Investing activities | ||||||||||||||||||||||||
| Interest received | 145 | 167 | 258 | 434 | 236 | 145 | ||||||||||||||||||
| Increase in loan to subsidiary | – | – | – | |||||||||||||||||||||
| Dividend received from subsidiary | – | – | – | |||||||||||||||||||||
| Purchase of property, plant and equipment | (7,254 | ) | (2,243 | ) | (1,318 | ) | (8,678 | ) | (17,915 | ) | (7,254 | ) | ||||||||||||
| Purchase of intangible assets | (512 | ) | (114 | ) | – | |||||||||||||||||||
| Proceeds from sale of property, plant and equipment | 14 | – | – | – | 2 | 14 | ||||||||||||||||||
| Net cash outflow from investing activities | (7,095 | ) | (2,076 | ) | (1,060 | ) | (8,756 | ) | (17,791 | ) | (7,095 | ) | ||||||||||||
| Financing activities | ||||||||||||||||||||||||
| Proceeds on exercise of share options | 5,018 | 3 | 81 | 540 | 1,185 | 5,018 | ||||||||||||||||||
| Proceeds of new equity issue | 127,367 | 19,770 | – | 206,550 | 127,834 | 127,367 | ||||||||||||||||||
| Expenses of new equity issue | (1,067 | ) | (1,670 | ) | – | (319 | ) | (271 | ) | (1,067 | ) | |||||||||||||
| Underwriters’ contribution towards expenses of new equity issue | 472 | – | – | |||||||||||||||||||||
| Proceeds of warrant exercise | 5,288 | – | – | – | – | 5,288 | ||||||||||||||||||
| Interest paid | (61 | ) | (64 | ) | (1 | ) | (69 | ) | (74 | ) | (61 | ) | ||||||||||||
| Proceeds from fit out funding | 7,822 | – | – | – | – | 7,822 | ||||||||||||||||||
| Proceeds from finance leases | – | 225 | – | |||||||||||||||||||||
| Capital element of finance leases | (100 | ) | (11 | ) | (7 | ) | ||||||||||||||||||
| Repayments of fit out funding | (240 | ) | – | – | ||||||||||||||||||||
| Repayments of obligations under finance leases | (127 | ) | (255 | ) | (100 | ) | ||||||||||||||||||
| Net cash inflow from financing activities | 144,267 | 18,253 | 73 | 206,807 | 128,419 | 144,267 | ||||||||||||||||||
| Effect of foreign exchange rate changes | 1,876 | 25 | 202 | 26,063 | 6,224 | 1,876 | ||||||||||||||||||
| Net increase in cash and cash equivalents | 126,422 | 8,734 | 1,016 | 139,520 | 70,381 | 126,422 | ||||||||||||||||||
| Cash and cash equivalents at the beginning of the year | 38,069 | 29,335 | 28,319 | 234,872 | 164,491 | 38,069 | ||||||||||||||||||
| Cash and cash equivalents at end of the year | 164,491 | 38,069 | 29,335 | 374,392 | 234,872 | 164,491 | ||||||||||||||||||
The accompanying notes are an integral part of these consolidated cash flow statements.
| F-7 |
Notes to the Consolidated Financial Statements
1. General Information
GW Pharmaceuticals plc (the “Company”) and its subsidiaries (the “Group”) are primarily involved in the development of cannabinoid prescription medicines using botanical extracts derived from the Cannabis Sativa plant. The Group are developing a portfolio of cannabinoid medicines, of which the lead product is SativexEpidiolex®, an oromucosal sprayoral medicine for the treatment of multiple sclerosis (“MS”) symptoms, cancer pain and neuropathic pain.refractory childhood epilepsies.
The Company is a public limited company, which has beenhad American Depository Receipts (“ADRs”) registered with the US Securities and Exchange Commission (“SEC”) and is listed on NASDAQ since 1 May 2013. Until 5 December 2016, the Company was also listed on the Alternative Investment Market (“AIM”), which is a sub-market of the London Stock Exchange, since 28 June 2001.Exchange. The Company is incorporated and domiciled in the United Kingdom. The address of the Company’s registered office and principal place of business is Porton Down ScienceSovereign House, Vision Park, Salisbury, Wiltshire.
In addition, since 1May 2013, the Company has American Depository Receipts (“ADRs”) registered with the US Securities and Exchange Commission (“SEC”) and is listed on NASDAQ .Histon, Cambridgeshire.
2. Significant Accounting Policies
The principal Group accounting policies are summarised below.
Basis of Accounting
The financial statements have been prepared in accordance with International Financial Reporting Standards (“IFRS”) as endorsed by the European Union and as issued by the International Accounting Standards Board (“IASB”). The Group financial statements also comply with Article 4 of the European Union IAS regulation.
The financial statements have been prepared under the historical cost convention, except for the revaluation of financial instruments. Historical cost is generally based on the fair value of the consideration given in exchange for the assets and received for the liabilities. The principal accounting policies are set out below.
The historical consolidated financial data for the years ended September 30, 2013 and 2012, reflects a a reclassification to report foreign exchange gains and losses, primarily from balance sheet revaluation, previously reported within “Management and administrative expenses” reported in a new income statement line item, ‘Net foreign exchange gains/(losses)’. Such reclassification had no impact on operating profit, profit before tax or profit for the year.
Going Concern
At 30 September 2016 the Group had cash and cash equivalents of £374.4 million (2015: £234.9 million). The Directors have considered the financial position of the Group, its cash position and forecast cash flows for the 12-month period from the date of signing these financial statementsthis report when considering going concern. They have also considered the Group’s business activities, theGroup's key policies for managing financial risks and the key factorsuncertainties affecting the likely development of the business in 2015.business. In the light of this review, the Directors have a reasonable expectation that the Company and the Group have adequate resources to continue in operational existence for at least a 12-month period from the foreseeable future.date of this report. Accordingly, they continue to adopt the going concern basis in preparing these financial statements.
Basis of Consolidation
The consolidated financial statements incorporate the financial statements of the Company and entities controlled by the Company (its subsidiaries) made up to 30 September each year. Subsidiaries are all entities over which the Group has the power to govern the financial and operating policies of the entity concerned, generally accompanying a shareholding of more than one half of the voting rights.
The results of subsidiaries acquired or disposed of during the year are included in the consolidated income statement from the effective date of acquisition or up to the effective date of disposal, as appropriate. Where necessary, adjustments are made to the financial statements of subsidiaries to bring the accounting policies used into line with those used by the Group. All intra-groupintra-Group transactions, balances, income and expenses are eliminated on consolidation. Acquisitions are accounted for under the acquisition method.
In future business combinations, if a non-controlling interest in a subsidiary arises, such non-controlling interest will be identified separately from the Group’s equity therein. The interests of non-controlling shareholders that are present ownership interests entitling their holders to a proportionate share of net assets upon liquidation may initially be measured at fair value or at the non-controlling interests’ proportionate share of the fair value of the acquiree’s identifiable net assets. The choice of measurement is made on an acquisition-by-acquisition basis. Other non-controlling interests are initially measured at fair value. Subsequent to acquisition, the carrying amount of non-controlling interests is the amount of those interests at initial recognition plus the non-controlling interests’ share of subsequent changes in equity. Total comprehensive income is attributed to non-controlling interests even if this results in the non-controlling interests having a deficit balance.
Changes in the Group’s interests in subsidiaries that do not result in a loss of control are accounted for as equity transactions. The carrying amount of the Group’s interests and the non-controlling interests are adjusted to reflect the changes in their relative interests in the subsidiaries. Any difference between the amount by which the non-controlling interests are adjusted and the fair value of the consideration paid or received is recognised directly in equity and attributed to the owners of the Company.
When the Group loses control of a subsidiary, the profit or loss on disposal is calculated as the difference between (i) the aggregate of the fair value of the consideration received and the fair value of any retained interest and (ii) the previous carrying amount of the assets (including goodwill), less liabilities of the subsidiary and any non-controlling interests. Amounts previously recognised in other comprehensive income in relation to the subsidiary are accounted for (i.e. reclassified to profit or loss or transferred directly to accumulated deficit) in the same manner as would be required if the relevant assets or liabilities are disposed of. The fair value of any investment retained in the former subsidiary at the date when control is lost is regarded as the fair value on initial recognition for subsequent accounting under IAS 39 Financial Instruments: Recognition and Measurement or, when applicable, the costs on initial recognition of an investment in an associate or jointly controlled entity.
No income statement is presented for GW Pharmaceuticals plc as permitted by Section 408 of the Companies Act 2006. The Company’s profit for the financial year was £30,480,000 (2015: £8,046,000; 2014: £4,267,000).
| F-8 |
Intangible Assets – Goodwill
Goodwill arising in a business combination is recognised as an asset at the date that control is acquired. Goodwill is measured as the excess of the sum of consideration transferred, the amount of any non-controlling interest in the acquiree and the fair value of the acquirer’s previously held equity interest (if any) in the entity over the net of the acquisition date amounts of the identifiable assets and liabilities assumed.
Goodwill is not amortised but is tested for impairment at least annually. For the purpose of impairment testing, goodwill is allocated to each of the Group’s cash-generating units expected to benefit from the synergies of the combination. Cash-generating units to which goodwill has been allocated are tested for impairment annually, or more frequently when there is an indication that the unit may be impaired. If the recoverable amount of the cash-generating unit is less than the carrying amount of the unit, the impairment loss is allocated first to reduce the carrying amount of any goodwill allocated to the unit and then to the other assets of the unit pro rata on the basis of the carrying amount of each asset in the unit. An impairment loss recognised for goodwill is not reversed in a subsequent period.
On disposal of a subsidiary, the attributable amount of goodwill is included in the determination of the profit or loss on disposal.
Intangible Assets – Other
Other intangible assets are stated at cost less provisions for amortisation and impairments. Licences, patents, know-how, software and marketing rights separately acquired or acquired as part of a business combination are amortised over their estimated useful lives using the straight-line basis from the time they are available for use. The estimated useful lives for determining the amortisation take into account patent lives and related product application, but do not exceed their lifetime. Asset lives are reviewed annually and adjusted where necessary. Contingent milestone payments are recognised at the point that the contingent event becomes certain. Any subsequent development costs incurred by the Group and associated with acquired licences, patents, know-how or marketing rights are written off to the income statement when incurred, unless the criteria for recognition of an internally generated intangible asset are met, usually when a regulatory filing has been made in a major market and approval is considered highly probable.
Revenue
Revenue is measured at the fair value of the consideration received or receivable and represents amounts receivable for goods and services provided in the normal course of business net of value added tax and other sales-related taxes. The Group recognises revenue when the amount can be reliably measured; when it is probable that future economic benefits will flow to the Group; and when specific criteria have been met for each of the Group’s activities, as described below.
The Group’s revenue arises from product sales, licensing fees, collaboration fees, technical access fees, development and approval milestone fees, research and development fees and royalties. Agreements with commercial partners generally include non-refundable up-front licenselicence and collaboration fees, milestone payments, the receipt of which is dependent upon the achievement of certain clinical, regulatory or commercial milestones, as well as royalties on product sales of licensedlicenced products, if and when such product sales occur, and revenue from the supply of products. For these agreements, total arrangement consideration is attributed to separately identifiable components on a reliable basis that reasonably reflects the selling prices that might be expected to be achieved in stand-alone transactions. The then allocated consideration is recognised as revenue in accordance with the principles described below.
The percentage of completion method is used for a number of revenue streams of the Group. For each of the three years ended 30 September 2014,2016, there were no discrete events or adjustments which caused the Group to revise its previous estimates of completion associated with those revenue arrangements accounted for under the percentage of completion method.
Product Sales
Revenue from the sale of products is recognised when the Group has transferred to the buyer the significant risks and rewards of ownership of the goods, the Group no longer has effective control over the goods sold, the amount of revenue and costs associated with the transaction can be measured reliably, and it is probable that the Group will receive future economic benefits associated with the transaction. Product sales have no rights of return other than where products are damaged or defective.
The Group maintains a rebate provision for expected reimbursements to our commercial partners in circumstances in which actual net revenue per vial differs from expected net revenue per vial as a consequence of, as an example, ongoing pricing negotiations with local health authorities. The amount of our rebate provision is based on, amongst other things, monthly unit sales and in-market sales data received from commercial partners and represents management’s best estimate of the rebate expected to be required to settle the present obligation at the end of the reporting period. Provisions for rebates are established in the same period that the related sales are recorded.
Licensing Fees
Licensing fees received in connection with product out-licensing agreements, even where such fees are non-refundable, are deferred and recognised over the period of the licenselicence term.
Collaboration Fees
Collaboration fees are deferred and recognised as services are rendered based on the percentage of completion method.
| F-9 |
Technical Access Fees
Technical access fees represent amounts charged to licensing partners to provide access to, and to commercially exploit, data that the Group possesses or which can be expected to result from Group research programmes that are in progress. Non-refundable technical access fees that involve the delivery of data that the Group possesses and that permit the licensing partner to use the data freely and where the Group has no remaining obligations to perform are recognised as revenue upon delivery of the data. Non-refundable technical access fees relating to data where the research programme is ongoing are recognised based on the percentage of completion method.
Development and Approval Milestone Fees
Development and approval milestone fees are recognised as revenue based on the percentage of completion method on the assumption that all stages will be completed successfully, but with cumulative revenue recognised limited to non-refundable amounts already received or reasonably certain to be received.
Research and Development Fees
Revenue from partner-funded contract research and development agreements is recognised as research and development services are rendered. Where services are in-progress at period end, the Group recognises revenues proportionately, in line with the percentage of completion of the service. Where such in-progress services include the conduct of clinical trials, the Group recognises revenue in line with the stage of completion of each trial so that revenues are recognised in line with the expenditures.
Royalties
Royalty revenue is recognised on an accrual basis in accordance with the substance of the relevant agreement, provided that it is probable that the economic benefits will flow to the Group and the amount of revenue can be measured reliably.
Research and Development
Expenditure on research and development activities is recognised as an expense in the period in which it is incurred prior to achieving regulatory approval.
An internally generated intangible asset arising from the Group’s development activities is recognised only if the following conditions are met:can be demonstrated:
| · |
| · |
| · | the ability to use or sell the intangible asset; |
| · | how the intangible asset will generate probable future economic benefits; |
| · | the availability of adequate technical, financial and other resources to complete the development and to use or sell the intangible asset; and |
| · | the |
The Group has determined that regulatory approval is the earliest point at which the probable threshold can be achieved. All research and development expenditure incurred prior to achieving regulatory approval is therefore expensed as incurred.
Government Grants
Government grants are not recognised until there is reasonable assurance that the Group will comply with the conditions attaching to them and that the grants will be received. Government grants for research programmes are recognised as revenue over the periods necessary to match them with the related costs incurred, and in the consolidated income statement are deducted from the related costs. Government grants related to property, plant and equipment are treated as deferred income and released to the consolidated income statement over the expected useful lives of the assets concerned.
Borrowing costsCosts
Borrowing costs directly attributable to the acquisition, construction or production of qualifying assets, which are assets that necessarily take a substantial period of time to get ready for their intended use or sale, are added to the cost of those assets, until such time as the assets are substantially ready for their intended use or sale. All other borrowing costs are recognised in the income statement using the effective interest method.
Property, Plant and Equipment
Property, plant and equipment are stated at cost, net of accumulated depreciation and any recognised impairment loss. Depreciation is provided so as to write off the cost of assets, less their estimated residual values, over their useful lives using the straight-line method, as follows:
| Leasehold buildings | 20 years or term of lease if shorter |
| Plant, machinery and lab equipment | |
| Office and IT equipment | |
| Leasehold improvements |
Assets under finance leases are depreciated over their expected useful lives on the same basis as owned assets or, where shorter, over the term of the relevant lease.
No depreciation is provided on assets under the course of construction. Cost includes professional fees and, for qualifying assets, borrowing costs capitalised in accordance with the Group’s accounting policy. Depreciation on these assets commences when the assets are available for use.
The gain or loss arising on disposal or scrappage of an asset is determined as the difference between the sales proceeds and the carrying amount of the asset and is recognised in operating profit.
| F-10 |
Inventories
Inventories are stated at the lower of cost and net realisable value. Cost is calculated using the weighted average cost method. Cost includes materials, direct labour, depreciation of manufacturing assets and an attributable proportion of manufacturing overheads based on normal levels of activity. Net realisable value is the estimated selling price, less all estimated costs of completion and costs to be incurred in marketing, selling and distribution.
If net realisable value is lower than the carrying amount, a write down provision is recognised for the amount by which the carrying amount exceeds its net realisable value.
Inventories manufactured prior to regulatory approval are capitalised as an asset but provided for until there is a high probability of regulatory approval of the product. At the point when a high probability of regulatory approval is obtained, the provision is adjusted appropriately to increase the carrying value to expected net realisable value, which may not exceed original cost.
Adjustments to the provision for inventories manufactured prior to regulatory approval are recorded as a component of research and development expenditure. Adjustments to the provision against commercial product related inventories manufactured following achievement of regulatory approval are recorded as a component of cost of goods.
Taxation
The tax expense represents the sum of the tax currently payable or recoverable and deferred tax. Current and deferred taxes are recognised in profit or loss, except when they relate to items that are recognised in other comprehensive income or directly in equity, in which case, the current and deferred tax are also recognised in other comprehensive income or directly in equity, respectively. Where current or deferred tax arises from the initial accounting for a business combination, the tax effect is included in the accounting for the business combination.
The tax payable or recoverable is based on taxable profit for the year. Taxable profit differs from profit before tax as reported in the consolidated income statement because it excludes items of income or expense that are taxable or deductible in other years and it further excludes items that are never taxable or deductible. The Group’s liability for current tax is calculated using tax rates and laws that have been enacted or substantively enacted by the balance sheet date.
Deferred tax is the tax expected to be payable or recoverable on differences between carrying amounts of assets and liabilities in the financial statements and the corresponding tax bases used in the computation of taxable profit, and is accounted for using the balance sheet liability method. Deferred tax liabilities are generally recognised for all taxable temporary differences and deferred tax assets are recognised only to the extent that it is probable that taxable profits will be available against which deductible temporary differences can be utilised. Such assets and liabilities are not recognised if the temporary difference arises from the initial recognition of goodwill or from the initial recognition (other than in a business combination) of assets and liabilities in a transaction that affects neither the taxable profit nor the accounting profit.
Deferred tax liabilities are recognised for taxable temporary differences arising on investments in subsidiaries and associates, and interests in joint ventures, except where the Group is able to control the reversal of the temporary difference and it is probable that the temporary difference will not reverse in the foreseeable future.
The carrying amount of deferred tax assets is reviewed at each balance sheet date and reduced to the extent that it is no longer probable that sufficient future taxable profits will be available to allow all or part of the asset to be recovered.
Deferred tax is calculated at the tax rates that are expected to apply in the period when the liability is settled or the asset is realised based on tax laws and rates that have been enacted or substantively enacted at the balance sheet date. Deferred tax is charged or credited in the consolidated income statement, except when it relates to items charged or credited in other comprehensive income, in which case the deferred tax is also dealt with in other comprehensive income.
Deferred tax assets and liabilities are offset when there is a legally enforceable right to set off current tax assets against current tax liabilities and when they relate to income taxes levied by the same taxation authority and the Group intends to settle its current tax assets and liabilities on a net basis.
(Loss)/Earnings per Share
Basic earnings or loss per share represents the profit or loss for the year, divided by the weighted average number of ordinary shares in issue during the year, excluding the weighted average number of ordinary shares held in the GW Pharmaceuticals All Employee Share Scheme (the “ESOP”) during the year to satisfy employee share awards.
Diluted earnings or loss per share represents the profit or loss for the year, divided by the weighted average number of ordinary shares in issue during the year, excluding the weighted average number of shares held in the ESOP during the year to satisfy employee share awards, plus the weighted average number of dilutive shares resulting from share options or warrants where the inclusion of these would not be antidilutive.anti-dilutive.
| F-11 |
Retirement Benefit Costs
The Group does not operate any pension plans, but makes contributions to personal pension arrangements of its Executive Directors and employees. The amounts charged to the consolidated income statement in respect of pension costs are the contributions payable in the year. Differences between contributions payable in the year and contributions paid are shown as either accruals or prepayments in the consolidated balance sheet.
Foreign Currency
The individual financial statements of each Group company are presented in the currency of the primary economic environment in which it operates (its functional currency). For the purpose of the consolidated financial statements, the results and financial position of each Group company are expressed in Pounds Sterling.
In preparing the financial statements of the individual companies, transactions in currencies other than the entity’s functional currency (foreign currencies) are recorded at the rate of exchange at the date of the transaction. Monetary assets and liabilities denominated in foreign currencies at the balance sheet date are retranslated at the rates of exchange prevailing at that date. Non-monetary items carried at fair value that are denominated in foreign currencies are translated at the rates prevailing at the date when the fair value was determined. Non-monetary items that are measured in terms of historical cost in a foreign currency are not retranslated.
For the purpose of presenting consolidated financial statements, the assets and liabilities of the Group'sGroup’s foreign operations are translated at exchange rates prevailing on the balance sheet date. Income and expense items are translated at the average exchange rate for the period, unless exchange rates fluctuate significantly during the period, in which case the exchange rates at the date of transactions are used. Exchange differences arising, if any, are recognised in other comprehensive income and accumulated in equity.
Share-based Paymentspayments
The Group operates a number of equity-settled share-based compensation plans under which the Company receives services from employees as consideration for equity instruments (options) of the Company. The fair value of the employee services received in exchange for the grant of the awards is recognised as an expense. The total amount to be expensed is determined by reference to the fair value of the options granted (excluding the effect of any non-market-based performance and service vesting conditions) at the date of grant.
The fair value determined at the grant date of the equity-settled share-based payments is expensed on a straight-line basis over the vesting period, based on the Group’s estimate of shares that will eventually vest. At each balance sheet date, the Group revises its estimate of the number of equity instruments expected to vest as a result of the effect of non-market-based performance and service vesting conditions. The impact of the revision of the original estimates, if any, is recognised in profit or loss such that the cumulative expense reflects the revised estimate, with a corresponding adjustment to equity reserves.
Equity-settled share-based payment transactions with parties other than employees are measured at the fair value of the goods or services received, except where that fair value cannot be estimated reliably, in which case they are measured at the fair value of the equity instruments granted, measured at the date of grant.
Warrants
Warrants issued by the Group are recognised and classified as equity when upon exercise, the Company would issue a fixed amount of its own equity instruments (ordinary shares) in exchange for a fixed amount of cash or another financial asset.
Consideration received, net of incremental costs directly attributable to the issue of such new warrants, is shown in equity. Changes in fair value of such warrants are not recognised in the consolidated financial statements.
When warrants are exercised, the Company issues new shares. The proceeds received net of any directly attributable transaction costs are credited to share capital (nominal value) and share premium.
Leases
Leases are classified as finance leases whenever the terms of the lease transfer substantially all the risks and rewards of ownership to the lessee. All other leases are classified as operating leases.
Rentals under operating leases are charged on a straight-line basis over the term of the relevant lease except where another more systematic basis is more representative of the time pattern in which economic benefits from the lease are consumed. Contingent rentals arising under operating leases are recognised as an expense in the period in which they are incurred.
In the event that lease incentives are received to enter into operating leases, such incentives are recognised as a liability. The aggregate benefit of incentives is recognised as a reduction of rental expense on a straight-line basis, except where another systematic basis is more representative of the time pattern in which economic benefits from the leased asset are consumed.
Assets held under finance leases are recognised as assets of the Group at their fair value or, if lower, the present value of the minimum lease payments, each determined at the inception of the lease. The corresponding liability to the lessor is included in the balance sheet as a finance lease obligation. Lease payments are apportioned between finance charges and reduction of the finance lease obligation so as to achieve a constant rate of interest on the remaining balance of the liability. Finance expenses are recognised immediately in profit or loss, unless they are directly attributable to qualifying assets, in which case they are capitalised in accordance with the Group’s general policy on borrowing costs. Contingent rentals are recognised as an expense in the periods in which they are incurred.
Financial Instruments
Financial assets and liabilities are recognised in the Group’s balance sheet when the Group becomes party to the contractual provisions of the instrument.
All financial assets are recognised and derecognised on a trade date where the purchase or sale of a financial asset is under a contract whose terms require delivery of the financial asset within the timeframe established by the market concerned, and are initially measured at fair value, plus transaction costs, except for those financial assets classified as at fair value through profit or loss, which are initially measured at fair value.
Financial assets are classified into the following specified categories: financial assets “at fair value through profit or loss”, “held-to-maturity” investments, “available-for-sale” financial assets and “loans and receivables”. The classification depends on the nature and purpose of the financial assets and is determined at the time of initial recognition.
For each reporting period covered herein, the Group’s financial assets were restricted to “loans and receivables”.
| F-12 |
Loans and Receivables
Trade receivables that have fixed or determinable payments that are not quoted in an active market are classified as “loans and receivables”. Loans and receivables are measured at amortised cost, less any impairment. Interest income is recognised by applying the effective interest rate, except for short-term receivables when the recognition of interest would be immaterial.
Trade receivables are assessed for indicators of impairment at each balance sheet date. Trade receivables are impaired where there is objective evidence that, as a result of one or more events that occurred after initial recognition, the estimated future cash flows of the receivables have been affected. Appropriate allowances for estimated irrecoverable amounts are recognised in the consolidated income statement. The allowance recognised is measured as the difference between the asset’s carrying amount and the present value of estimated future cash flows discounted at the effective interest rate computed at initial recognition.
Cash and Cash Equivalents
Cash and cash equivalents comprise cash in hand and on-call deposits held with banks and other short-term highly liquid investments with a maturity of three months or less.
Financial Liabilities
Financial liabilities are classified as either financial liabilities “at fair value through profit and loss” or “other financial liabilities”. For each reporting period covered herein, the Group’s financial liabilities were restricted to “other financial liabilities”.
Other Financial Liabilities
Trade payables are initially measuredrecognised at fair value and then held at amortised cost which equates to nominal value. Long-term payables are discounted where the effect is material.
All borrowings are initially recorded at the amount of proceeds received, net of transaction costs, andcosts. Borrowings are subsequently measuredcarried at amortised cost, using the effective interest rate method. The difference between the proceeds, net of transaction costs, and the amount due on redemption is recognised as a charge to the income statement over the period of the relevant borrowing.
The effective interest method is a method of calculating the amortised cost of a financial liability and of allocating interest expense over the relevant period. The effective interest rate is the rate that exactly discounts estimated future cash payments through the expected life of the financial liability or, where appropriate, a shorter period, to the net carrying amount on initial recognition.
Critical Judgements in Applying the Group’s Accounting Policies
In the application of the Group’s accounting policies, which are described above, the Board of Directors are required to make judgements, estimates and assumptions about the carrying amounts of assets and liabilities that are not readily apparent from other sources. The estimates and associated assumptions are based on historical experience and other factors that are considered to be relevant. Actual results may differ from these estimates.
The estimates and assumptions are reviewed on an ongoing basis. Revisions to accounting estimates are recognised in the period in which the estimate is revised if the revision affects only that period, or in the period of the revisions and future periods if the revision affects both current and future periods.
The following are the critical judgements, apart from those involving estimations (which are dealt with separately below), that the Directors have made in the process of applying the Group’s accounting policies and that have the most significant effect on the amounts recognised in the financial statements.
Recognition of Clinical Trials Expenditure
The Group recognises expenditure incurred in carrying out clinical trials during the course of conduct of each clinical trial in line with the state of completion of each trial. This involves the calculation of clinical trial accruals at each period end to account for expenditure which has been incurred. This requires estimation of the expected full cost to complete the trial and also estimation of the current stage of trial completion.
Clinical trials usually take place over extended time periods and typically involve a set-up phase, a recruitment phase and a completion phase which ends upon the receipt of a final report containing full statistical analysis of trial results. Accruals are prepared separately for each in-process clinical trial and take into consideration the stage of completion of each trial including the number of patients that have entered the trial, the number of patients that have completed treatment and whether the final report has been received. In all cases, the full cost of each trial is expensed by the time the final report has been received.
Revenue Recognition
The Group recognises revenue from product sales, licensing fees, collaboration fees, technical access fees, development and approval milestone fees, research and development fees and royalties. Agreements with commercial partners generally include a non-refundable up-front fee, milestone payments, the receipt of which is dependent upon the achievement of certain clinical, regulatory or commercial milestones, as well as royalties on product sales of licensedlicenced products, if and when such product sales occur. For these agreements, the Group is required to apply judgement in the allocation of total agreement consideration to the separately identifiable components on a reliable basis that reasonably reflects the selling prices that might be expected to be achieved in stand-alone transactions.
| F-13 |
Product revenue received is based on a contractually agreed percentage of our commercial partner’s in-market net sales revenue. The commercial partner’s in-market net sales revenue is the price per vial charged to end customers, less set defined deductible overheads incurred in distributing the product. In developing estimates, the Group uses monthly unit sales and in-market sales data received from commercial partners during the course of the year. For certain markets, where negotiations are ongoing with local reimbursement authorities, an estimated in-market sales price is used, which requires the application of judgement in assessing whether an estimated in-market sales price is reliably measurable. In the Group’s assessment, the Group considers, inter alia, identical products sold in similar markets and whether the agreed prices for those identical products support the estimated in-market sales price. In the event that the Group considers there to be significant uncertainty with regardsregard to the in-market sales price to be charged by the commercial partner as a result of, as an example, ongoing pricing negotiations with local health authorities, such that it is not possible to reliably measure the amount of revenue that will flow to the Group, the Group would not recognise revenue until that uncertainty has been resolved.
The Group applies the percentage of completion revenue recognition method to certain classes of revenue. The application of this approach requires the judgement of the Group with regardsregard to the total costs incurred and total estimated costs expected to be incurred over the length of the agreement.
Key Sources of Estimation Uncertainty
The key assumptions concerning the future, and other key sources of estimation uncertainty at the balance sheet date, that have a significant risk of causing a material adjustment to the carrying amounts of assets and liabilities within the next financial year, are discussed below.
Rebate Provision
The Group maintains a rebate provision for expected reimbursements to our commercial partners in circumstances in which actual net revenue per vial differs from the invoiced net revenue per vial as a consequence of, as an example, ongoing pricing negotiations with local health authorities.
The amount of the rebate provision is based on, amongst other things, monthly unit sales and in-markets sales data received from commercial partners and represents management’s best estimate of the rebate expected to be required to settle this present obligation at the end of the reporting period.
Pricing decisions made by local health authorities, including revisions and clarifications that have retroactive application can result in changes to management’s estimates of the rebates reported in prior periods.
Aggregate rebate provision accruals as at 30 September 2014 and 2013 were £1.4 million and £1.2 million, respectively.
Provision for Inventories
The Group maintains inventories which, based upon current sales levels and the current regulatory status of the product in each indication, is in-excess of the amount that is expected to be utilised in the manufacture of finished product for future commercial sales.
Provision is therefore made to reduce the carrying value of the excess inventories to their expected net realisable value.
The provision for inventories and adjustments thereto, are estimated based on evaluation of the status of the regulatory approval, projected sales volumes and growth rates. The timing and extent of future provision adjustments will be contingent upon timing and extent of future regulatory approvals and post-approval in-market sales demand, which remain uncertain at this time.
Deferred Taxation
At the balance sheet date, the Group has accumulated tax losses of £34.3£102.8 million (2013: £33.6(2015: £74.0 million) and other temporary differences of £11.6£33.9 million (2015: £20.7 million) available to offset against future profits. If the value of these losses and other temporary differences were recognised within the Group’s balance sheet at the balance sheet date, the Group would be carrying aan additional deferred tax asset of £9.2£23.2 million (2013: £6.1(2015: £18.9 million). However, as explained in the tax accounting policy note, the Group’s policy is to recognise deferred tax assets only to the extent that it is probable that future taxable profits, feasible tax-planning strategies, and deferred tax liabilities will be available against which the brought forwardbrought-forward trading losses can be utilised. Estimation of the level of future taxable profits is therefore required in order to determine the appropriate carrying value of the deferred tax asset at each balance sheet date. However, considering As such, a deferred tax asset of £3.9 million has been recognised at 30 September 2016 (2015: £0.4 million) in respect of temporary timings differences relating to the Group’s current assessmentUS subsidiary that are expected to be fully recoverable.
Research and Development and Orphan Tax Credits
The Group’s research and development tax credit claim is complex and requires management to interpret and apply UK and US research and development and orphan credit tax legislation to the Group’s specific circumstances and requires the use of certain assumptions in estimating the probability of earning future milestones under its partner agreements, there is a reasonable possibility that, within the next year, sufficient positive evidence may become available to reach a conclusion that a significant portion of the currently unrecognised deferred tax assets will be recognised. This recognition would result in an increase in the Group’s deferred tax assets and a decrease to income tax expensescurrent year research costs that are eligible for the period such release is recorded.claim.
Adoption of New and Revised Standards
In the current year the following revised standards have been adopted in these financial statements. Adoption has not had a significant impact on the amounts reported in these financial statements but may impact the accounting for future transactions and arrangements.transactions.
Amendments to IAS 36 (May 2013) Recoverable Amount Disclosures for Non-Financial Assets
Amendments to IAS 39 (Jun 2013) Novation of Derivatives and Continuation of Hedge Accounting
Amendments to IFRS 10, IFRS 12 and IAS 27 (Oct 2012) Investment Entities
Amendments to IAS1919: Defined Benefit Plans: Employee Contributions (Nov 2013)
Annual Improvements to IFRSs 2011–2013 Cycle (Dec 2013)
Annual Improvements to IFRSs 2010–2012 Cycle (Dec 2013)
IFRIC 21 Levies (May 2013)
At the date of authorisation of these financial statements, the following Standards and Interpretations which have not been applied in these financial statements were issued by the IASB but not yet effective:
IFRS 9 Financial Instruments (Jul 2014)
IFRS 14 Regulatory Deferral Accounts (Jan 2014)
IFRS 15 Revenue from Contracts with Customers (May 2014)
IFRS 16 Leases (January 2016)
Annual Improvements to IFRSs 2012–2014 Cycle (Sep 2014)
Amendments to IFRS 2: Classification and Measurement of Share-Based Payment Transactions (June 2016)
Amendments to IFRS 4: Applying IFRS 9 Financial Instruments with IFRS 4 Insurance Contracts (September 2016)
Amendments to IFRS 10, IFRS 12 and IAS 28: Investment Entities – Applying the Consolidation Exception (Dec 2014)
Amendments to IFRS 10 and IAS 28: Sale or Contribution of Assets between an Investor and its Associate or Joint Venture (Sep 2014)
Amendments to IFRS 11: Accounting for Acquisitions of Interests in Joint Operations (May 2014)
Clarifications to IFRS 15: Revenue from Contracts with Customers (April 2016)
Amendments to IAS 27: Equity Method in Separate Financial Statements (Aug1: Disclosure Initiative (Dec 2014)
Amendments to IAS 16 and7: Disclosure Initiative (January 2016)
Amendments to IAS 41: Bearer Plants (Jun 2014)12: Recognition of Deferred Tax Assets for Unrealised Losses (January 2016)
Amendments to IAS 16 and IAS 38: Clarification of Acceptable Methods of Depreciation and Amortisation (May 2014)
Amendments to IFRS 11: Accounting for Acquisitions of InterestsIAS 16 and IAS 41: Bearer Plants (Jun 2014)
Amendments to IAS 27: Equity Method in Joint Operations (MaySeparate Financial Statements (Aug 2014)
IFRS 15 is effective for financial years beginning on or after 1 January 2017 and15: establishescomprehensive guidelines for determining when to recognise revenue and how much revenue to recognise. The core principle in that framework is that a company should recognise revenue to depict the transfer of promised goods or services to the customer in an amount that reflects the consideration to which the company expects to be entitled in exchange for those goods or services. The standard was published in May 2014 andis effective for reporting periods beginning on or after 1 January 2018. The Group continues to assess the impact of its introduction has yetIFRS 15 on the results of the Group, and expects to finalise this assessment following final endorsement by the EU, which occurred on 31 October 2016. The impact is expected to be assessed bylimited to historic revenue-generative partner agreements.
| F-14 |
IFRS 16:Leaseswill replace IAS 17 for accounting periods beginning on or after 1 January 2019. In so doing it will eliminate the group. distinction between classification of leases as finance or operating leases. The adoption of IFRS 16 is not expected to have a significant impact on the Group’s net results or net assets, although the full impact will be subject to further assessment following the conclusion of the ongoing consultations.
The Directors do not expect that the adoption of the remaining standardsStandards and Interpretations in future periods will have a material impact on the financial statements of the Group.
3. Segmental Information
Information reported to the Company’s Board of Directors, the chief operating decision maker for the Group, for the purposes of resource allocation and assessment of segment performance is focused on the stage of product development. The Group’s reportable segments are as follows:
| · | Commercial:The Commercial segment |
| · | Sativex |
| · | Pipeline Research and Development:The Pipeline Research and Development (“Pipeline R&D”) segment seeks to develop cannabinoid medications other than Sativex across a range of therapeutic areas using our proprietary cannabinoid technology platform. The Group’s product pipeline includes |
The accounting policies of the reportable segments are consistent with the Group’s accounting policies described in note 2. Segment result represents the result of each segment without allocation of share-based payment expenses, and before managementsales, general and administrative expenses, interest expense, interest income and tax.
No measures of segment assets and segment liabilities are reported to the Company’sGroup’s Board of Directors in order to assess performance and allocate resources. There is no intersegment activity and all revenue is generated from external customers.
| F-15 |
Segment Results
For the Year Ended 30 September 2016
| Commercial £000s | Sativex R&D £000s | Pipeline R&D £000s | Total Reportable Segments £000s | Unallocated Costs1 £000s | Consolidated £000s | |||||||||||||||||||
| Revenue: | ||||||||||||||||||||||||
| Product sales | 5,208 | – | – | 5,208 | – | 5,208 | ||||||||||||||||||
| Research and development fees | – | 3,500 | 337 | 3,837 | – | 3,837 | ||||||||||||||||||
| Licence, collaboration and technical access fees | 1,172 | – | – | 1,172 | – | 1,172 | ||||||||||||||||||
| Development and approval milestones | 98 | – | – | 98 | – | 98 | ||||||||||||||||||
| Total revenue | 6,478 | 3,500 | 337 | 10,315 | – | 10,315 | ||||||||||||||||||
| Cost of sales | (2,719 | ) | – | – | (2,719 | ) | – | (2,719 | ) | |||||||||||||||
| Research and development expenditure | – | (4,125 | ) | (91,571 | ) | (95,696 | ) | (4,119 | ) | (99,815 | ) | |||||||||||||
| Segmental result | 3,759 | (625 | ) | (91,234 | ) | (88,100 | ) | (4,119 | ) | (92,219 | ) | |||||||||||||
| Sales, general and administrative expenses | (19,939 | ) | ||||||||||||||||||||||
| Net foreign exchange gain | 25,551 | |||||||||||||||||||||||
| Operating loss | (86,607 | ) | ||||||||||||||||||||||
| Interest expense | (173 | ) | ||||||||||||||||||||||
| Other income | 608 | |||||||||||||||||||||||
| Loss before tax | (86,172 | ) | ||||||||||||||||||||||
| Tax benefit | 22,515 | |||||||||||||||||||||||
| Loss for the year | (63,657 | ) | ||||||||||||||||||||||
| 1 | Unallocated costs represent the portion of share-based payment expenditures which is included in research and development expenditure, but which is not allocated to segments. The remaining share-based payment expenditure is included within sales, general and administrative expenses, which is similarly excluded from segmental result. |
| F-16 |
Segment Results
For the Year Ended 30 September 2015
| Commercial £000s | Sativex R&D £000s | Pipeline R&D £000s | Total Reportable Segments £000s | Unallocated Costs1 £000s | Consolidated £000s | |||||||||||||||||||
| Revenue: | ||||||||||||||||||||||||
| Product sales | 4,255 | – | – | 4,255 | – | 4,255 | ||||||||||||||||||
| Research and development fees | – | 22,275 | 535 | 22,810 | – | 22,810 | ||||||||||||||||||
| Licence, collaboration and technical access fees | 1,287 | – | – | 1,287 | – | 1,287 | ||||||||||||||||||
| Development and approval milestones | 188 | – | – | 188 | – | 188 | ||||||||||||||||||
| Total revenue | 5,730 | 22,275 | 535 | 28,540 | – | 28,540 | ||||||||||||||||||
| Cost of sales | (2,618 | ) | – | – | (2,618 | ) | – | (2,618 | ) | |||||||||||||||
| Research and development expenditure | – | (26,398 | ) | (48,862 | ) | (75,260 | ) | (1,525 | ) | (76,785 | ) | |||||||||||||
| Segmental result | 3,112 | (4,123 | ) | (48,327 | ) | (49,338 | ) | (1,525 | ) | (50,863 | ) | |||||||||||||
| Sales, general and administrative expenses | (12,569 | ) | ||||||||||||||||||||||
| Net foreign exchange gain | 6,202 | |||||||||||||||||||||||
| Operating loss | (57,230 | ) | ||||||||||||||||||||||
| Interest expense | (75 | ) | ||||||||||||||||||||||
| Other income | 244 | |||||||||||||||||||||||
| Loss before tax | (57,061 | ) | ||||||||||||||||||||||
| Tax benefit | 12,498 | |||||||||||||||||||||||
| Loss for the year | (44,563 | ) | ||||||||||||||||||||||
| 1 | Unallocated costs represent the portion of share-based payment expenditures which is included in research and development expenditure, but which is not allocated to segments. The remaining share-based payment expenditure is included within sales, general and administrative expenses, which is similarly excluded from segmental result. |
| F-17 |
Segment Results
For the Year Ended 30 September 2014
| Commercial1 £000’s | Sativex R&D £000’s | Pipeline R&D £000’s | Total Reportable Segments £000’s | Unallocated Costs2 £000’s | Consolidated £000’s | |||||||||||||||||||
| Revenue: | ||||||||||||||||||||||||
| Product sales | 4,382 | - | - | 4,382 | - | 4,382 | ||||||||||||||||||
| Research and development fees | - | 23,618 | 667 | 24,285 | - | 24,285 | ||||||||||||||||||
| License, collaboration and technical access fees | 1,378 | - | - | 1,378 | - | 1,378 | ||||||||||||||||||
| Total revenue | 5,760 | 23,618 | 667 | 30,045 | - | 30,045 | ||||||||||||||||||
| Cost of sales | (2,060 | ) | - | - | (2,060 | ) | - | (2,060 | ) | |||||||||||||||
| Research and development credit/(expenditure) | 847 | (26,444 | ) | (17,103 | ) | (42,700 | ) | (775 | ) | (43,475 | ) | |||||||||||||
| Segmental result | 4,547 | (2,826 | ) | (16,436 | ) | (14,715 | ) | (775 | ) | (15,490 | ) | |||||||||||||
| Management and administrative expenses | (7,337 | ) | ||||||||||||||||||||||
| Net foreign exchange gain/(loss) | 3,188 | |||||||||||||||||||||||
| Operating loss | (19,639 | ) | ||||||||||||||||||||||
| Interest expense | (61 | ) | ||||||||||||||||||||||
| Interest income | 130 | |||||||||||||||||||||||
| Loss before tax | (19,570 | ) | ||||||||||||||||||||||
| Tax benefit | 4,911 | |||||||||||||||||||||||
| Loss for the year | (14,659 | ) | ||||||||||||||||||||||
The following is an analysis of depreciation and the movement in the provision for inventories by segment for the year ended 30 September 2014:
| Commercial £000’s | Sativex R&D £000’s | Pipeline R&D £000’s | Total Reportable Segments £000’s | Unallocated Costs £000’s | Consolidated £000’s | |||||||||||||||||||
| Depreciation | (111 | ) | (662 | ) | (566 | ) | (1,339 | ) | (59 | ) | (1,398 | ) | ||||||||||||
| Decrease/(increase) in provision for inventories | 847 | (261 | ) | (178 | ) | 408 | - | 408 | ||||||||||||||||
Commercial1 £000s | Sativex R&D £000s | Pipeline R&D £000s | Total Reportable Segments £000s | Unallocated Costs2 £000s | Consolidated £000s | |||||||||||||||||||
| Revenue: | ||||||||||||||||||||||||
| Product sales | 4,382 | – | – | 4,382 | – | 4,382 | ||||||||||||||||||
| Research and development fees | – | 23,618 | 667 | 24,285 | – | 24,285 | ||||||||||||||||||
| Licence, collaboration and technical access fees | 1,378 | – | – | 1,378 | – | 1,378 | ||||||||||||||||||
| Total revenue | 5,760 | 23,618 | 667 | 30,045 | – | 30,045 | ||||||||||||||||||
| Cost of sales | (2,060 | ) | – | – | (2,060 | ) | – | (2,060 | ) | |||||||||||||||
| Research and development credit/(expenditure) | 847 | (26,444 | ) | (17,103 | ) | (42,700 | ) | (775 | ) | (43,475 | ) | |||||||||||||
| Segmental result | 4,547 | (2,826 | ) | (16,436 | ) | (14,715 | ) | (775 | ) | (15,490 | ) | |||||||||||||
| Sales, general and administrative expenses | (7,337 | ) | ||||||||||||||||||||||
| Net foreign exchange gain | 3,188 | |||||||||||||||||||||||
| Operating loss | (19,639 | ) | ||||||||||||||||||||||
| Interest expense | (61 | ) | ||||||||||||||||||||||
| Other income | 130 | |||||||||||||||||||||||
| Loss before tax | (19,570 | ) | ||||||||||||||||||||||
| Tax benefit | 4,911 | |||||||||||||||||||||||
| Loss for the year | (14,659 | ) | ||||||||||||||||||||||
| 1 | The research and development |
| 2 | Unallocated costs represent the portion of share-based payment expenditures which is included in research and development expenditure, but which is not allocated to segments. The remaining share-based payment expenditure is included within |
Segment Results
For the Year Ended 30 September 2013
| Commercial1 £000’s | Sativex R&D £000’s | Pipeline R&D £000’s | Total Reportable Segments £000’s | Unallocated Costs2 £000’s | Consolidated £000’s | |||||||||||||||||||
| Revenue: | ||||||||||||||||||||||||
| Product sales | 2,157 | – | – | 2,157 | – | 2,157 | ||||||||||||||||||
| Research and development fees | – | 19,333 | 4,261 | 23,594 | – | 23,594 | ||||||||||||||||||
| License, collaboration and technical access fees | 1,294 | – | – | 1,294 | – | 1,294 | ||||||||||||||||||
| Development and approval milestone fees | 250 | – | – | 250 | – | 250 | ||||||||||||||||||
| Total revenue | 3,701 | 19,333 | 4,261 | 27,295 | – | 27,295 | ||||||||||||||||||
| Cost of sales | (1,276 | ) | – | – | (1,276 | ) | – | (1,276 | ) | |||||||||||||||
| Research and development credit/(expenditure) | 597 | (23,737 | ) | (9,240 | ) | (32,380 | ) | (317 | ) | (32,697 | ) | |||||||||||||
| Segmental result | 3,022 | (4,404 | ) | (4,979 | ) | (6,361 | ) | (317 | ) | (6,678 | ) | |||||||||||||
| Management and administrative expenses | (3,555 | ) | ||||||||||||||||||||||
| Net foreign exchange gain/(loss) | (237 | ) | ||||||||||||||||||||||
| Operating loss | (10,470 | ) | ||||||||||||||||||||||
| Interest expense | (64 | ) | ||||||||||||||||||||||
| Interest income | 178 | |||||||||||||||||||||||
| Loss before tax | (10,356 | ) | ||||||||||||||||||||||
| Tax benefit | 5,807 | |||||||||||||||||||||||
| Loss for the year | (4,549 | ) | ||||||||||||||||||||||
The following is an analysis of depreciation and the movement in the provision for inventories by segment for the year ended 30 September 2013:
| Commercial £000’s | Sativex R&D £000’s | Pipeline R&D £000’s | Total Reportable Segments £000’s | Unallocated Costs £000’s | Consolidated £000’s | |||||||||||||||||||
| Depreciation | – | (560 | ) | (429 | ) | (989 | ) | – | (989 | ) | ||||||||||||||
| Decrease/(increase) in provision for inventories | 597 | (67 | ) | – | 530 | – | 530 | |||||||||||||||||
Segment Results
For the Year Ended 30 September 2012
| Commercial1 £000’s | Sativex R&D £000’s | Pipeline R&D £000’s | Total Reportable Segments £000’s | Unallocated Costs2 £000’s | Consolidated £000’s | |||||||||||||||||||
| Revenue: | ||||||||||||||||||||||||
| Product sales | 2,514 | – | – | 2,514 | – | 2,514 | ||||||||||||||||||
| Research and development fees | – | 14,080 | 5,420 | 19,500 | – | 19,500 | ||||||||||||||||||
| License, collaboration and technical access fees | 1,294 | – | – | 1,294 | – | 1,294 | ||||||||||||||||||
| Development and approval milestone fees | 9,812 | – | – | 9,812 | – | 9,812 | ||||||||||||||||||
| Total revenue | 13,620 | 14,080 | 5,420 | 33,120 | – | 33,120 | ||||||||||||||||||
| Cost of sales | (839 | ) | – | – | (839 | ) | – | (839 | ) | |||||||||||||||
| Research and development credit/(expenditure) | 1,300 | (18,415 | ) | (9,904 | ) | (27,019 | ) | (559 | ) | (27,578 | ) | |||||||||||||
| Segmental result | 14,081 | (4,335 | ) | (4,484 | ) | 5,262 | (559 | ) | 4,703 | |||||||||||||||
| Management and administrative expenses | (3,620 | ) | ||||||||||||||||||||||
| Net foreign exchange gain/(loss) | (40 | ) | ||||||||||||||||||||||
| Operating profit | 1,043 | |||||||||||||||||||||||
| Interest expense | (1 | ) | ||||||||||||||||||||||
| Interest income | 200 | |||||||||||||||||||||||
| Profit before tax | 1,242 | |||||||||||||||||||||||
| Tax benefit | 1,248 | |||||||||||||||||||||||
| Profit for the year | 2,490 | |||||||||||||||||||||||
The following is an analysis of depreciation and the movement in the provision for inventories by segment for the year ended 30 September 2012:
| Commercial £000’s | Sativex R&D £000’s | Pipeline R&D £000’s | Total Reportable Segments £000’s | Unallocated Costs £000’s | Consolidated £000’s | |||||||||||||||||||
| Depreciation | – | (394 | ) | (360 | ) | (754 | ) | – | (754 | ) | ||||||||||||||
| Decrease in provision for inventories | 1,300 | – | – | 1,300 | – | 1,300 | ||||||||||||||||||
Segment Results
Revenues from the Group’s largest customer are included within the above segments as follows:
| Commercial £000s | Sativex R&D £000s | Pipeline R&D £000s | Total £000s | |||||||||||||
| Year ended 30 September 2016 | 4,310 | – | – | 4,310 | ||||||||||||
| Year ended 30 September 2015 | 3,385 | – | – | 3,385 | ||||||||||||
| Year ended 30 September 2014 | 3,494 | – | – | 3,494 | ||||||||||||
Revenues from the Group’s second largest customer, the only other customer where revenues amountaccount for more than 10% of the Group’s revenues, are included within the above segments as follows:
| Commercial £000s | Sativex R&D £000s | Pipeline R&D £000s | Total £000s | |||||||||||||
| Year ended 30 September 2016 | 280 | 3,500 | 337 | 4,117 | ||||||||||||
| Year ended 30 September 2015 | 280 | 22,275 | 535 | 23,090 | ||||||||||||
| Year ended 30 September 2014 | 280 | 23,618 | 667 | 24,565 | ||||||||||||
| Sativex Commercial £000’s | Sativex R&D £000’s | Pipeline R&D £000’s | Total £000’s | |||||||||||||
| Year ended 30 September 2014 | – | 23,618 | 667 | 24,285 | ||||||||||||
| Year ended 30 September 2013 | – | 19,333 | 4,261 | 23,594 | ||||||||||||
| Year ended 30 September 2012 | – | 13,994 | 5,420 | 19,414 | ||||||||||||
Geographical Analysis of Revenue by Destination of Customer:
2016 £000s | 2015 £000s | 2014 £000s | ||||||||||
| UK | 1,082 | 1,158 | 1,099 | |||||||||
| Europe (excluding UK) | 4,435 | 3,592 | 3,864 | |||||||||
| United States | 3,780 | 22,555 | 23,904 | |||||||||
| Canada | 680 | 700 | 518 | |||||||||
| Asia/Other | 338 | 535 | 660 | |||||||||
| 10,315 | 28,540 | 30,045 | ||||||||||
| 2014 £000’s | 2013 £000’s | 2012 £000’s | ||||||||||
| UK | 1,099 | 577 | 248 | |||||||||
| Europe (excluding UK) | 3,864 | 2,290 | 12,712 | |||||||||
| United States | 23,904 | 19,508 | 14,274 | |||||||||
| Canada | 518 | 587 | 436 | |||||||||
| Asia | 660 | 4,333 | 5,450 | |||||||||
| 30,045 | 27,295 | 33,120 | ||||||||||
| F-18 |
4. Research and Development Expenditure
| 2014 £000’s | 2013 £000’s | 2012 £000’s | 2016 £000s | 2015 £000s | 2014 £000s | |||||||||||||||||||
| GW-funded research and development | 19,190 | 9,103 | 8,078 | 95,978 | 53,975 | 19,190 | ||||||||||||||||||
| Development partner-funded research and development | 24,285 | 23,594 | 19,500 | 3,837 | 22,810 | 24,285 | ||||||||||||||||||
| 43,475 | 32,697 | 27,578 | 99,815 | 76,785 | 43,475 | |||||||||||||||||||
GW-funded research and development expenditure consists of costs associated with the Group’s research activities. These costs include costs of conducting pre-clinical studies or clinical trials, payroll costs forassociated with employing a team of research and development staff, share-based payment expenses, property costs associated with leasing laboratory and associated overhead, costoffice space to accommodate research teams, costs of growing botanical raw material, costs of consumables used in the conduct of in-house research programmes, payments for research work conducted by sub-contractors by a network of academic collaborative research scientists, costs associated with safety studies and sponsorshipcosts associated with the development of collaborative scientists, and external third-party costs incurred in conducting GW's own clinical trials.further Epidiolex, Sativex or other pipeline product data.
Development partner-funded research and development expenditures include the costs of employing staff to work on joint research and development plans, plus the costs of subcontractedsub-contracted pre-clinical studies and sponsorships of academic scientists who collaborate with the Group. These expenditures are charged to the Group’s commercial partners, principally Otsuka. The Group is the primary obligor for these activities and under the terms of the Sativex development agreements, the Group uses both its internal resources and third-party contractors to provide contract research and development services to its commercial partners.
5. (Loss)/profitLoss Before Tax
(Loss)/profitLoss before tax is stated after charging/(crediting):
| 2014 £000’s | 2013 £000’s | 2012 £000’s | ||||||||||
| Operating lease rentals – land and buildings | 1,301 | 1,186 | 1,036 | |||||||||
| Depreciation of property, plant and equipment – owned | 1,187 | 947 | 744 | |||||||||
| Depreciation of property, plant and equipment – leased | 211 | 42 | 10 | |||||||||
| Provision for inventories | (408 | ) | (530 | ) | (1,300 | ) | ||||||
| Allowance for doubtful debts – trade receivables | – | (26 | ) | 26 | ||||||||
| Foreign exchange (gain)/loss | (3,188 | ) | 237 | 40 | ||||||||
| Staff costs (see note 7) | 17,725 | 10,686 | 10,098 | |||||||||
2016 £000s | 2015 £000s | 2014 £000s | ||||||||||
| Operating lease rentals – land and buildings | 2,341 | 1,473 | 1,301 | |||||||||
| Operating lease rentals – equipment | 20 | – | – | |||||||||
| Depreciation of property, plant and equipment | 3,605 | 2,250 | 1,398 | |||||||||
| Impairment of property, plant and equipment | – | 606 | – | |||||||||
| Amortisation of intangible assets | 62 | 52 | – | |||||||||
| Increase/(decrease) provision for inventories | 72 | 33 | (408 | ) | ||||||||
| Foreign exchange gain | (25,551 | ) | (6,202 | ) | (3,188 | ) | ||||||
| Staff costs (see note 7) | 40,463 | 23,083 | 17,725 | |||||||||
| F-19 |
6. Auditor’s Remuneration
| 2014 £000’s | 2013 £000’s | 2012 £000’s | 2016 | 2015 | 2014 | |||||||||||||||||||
| The auditor for the years ended 30 September 2014, 2013 and 2012 were Deloitte LLP | ||||||||||||||||||||||||
| £000s | £000s | £000s | ||||||||||||||||||||||
| The auditor for the years ended 30 September 2016, 2015 and 2014 was Deloitte LLP | ||||||||||||||||||||||||
| Audit fees: | ||||||||||||||||||||||||
| – Audit of the Company’s annual accounts1 | 243 | 70 | 51 | |||||||||||||||||||||
| – Audit of the Company’s subsidiaries pursuant to legislation | 41 | 40 | 42 | |||||||||||||||||||||
| – Audit of the Group’s annual accounts1 | 400 | 400 | 243 | |||||||||||||||||||||
| – Audit of the Company and subsidiaries pursuant to legislation | 50 | 50 | 41 | |||||||||||||||||||||
| Total audit fees | 284 | 110 | 93 | 450 | 450 | 284 | ||||||||||||||||||
| Other services | ||||||||||||||||||||||||
| – Audit-related assurance2 | 46 | 40 | 5 | 75 | 53 | 46 | ||||||||||||||||||
| – Other assurance services3 | 193 | 306 | – | 109 | 92 | 193 | ||||||||||||||||||
| – All other services4 | – | – | 13 | |||||||||||||||||||||
| Total non-audit fees | 239 | 346 | 18 | 184 | 145 | 239 | ||||||||||||||||||
| 1 | For the years ended 30 September |
| 2 |
| 3 | Other assurance services represents assurance reporting on historical financial information included in the Company’s initial, shelf and follow-on US registration statements. |
Audit-related fees included audit-related assurance and other assurance services. Other fees include all other services.An additional £40,000 was billed in respect of the 2015 audit during the year ended 30 September 2016.
An additional £156,000 was billed in respect of the 2014 audit during the year ended 30 September 2015.
The audit committee’sAudit Committee’s policy is to pre-approve all audit, audit-related and other services performed by the auditor. All such services were pre-approved during the years ended 30 September 2014, 20132016, 2015 and 20122014 under the audit committee’sAudit Committee’s policy.
7. Staff Costs
The average number of Group employees (including Executive Directors) for the year ended 30 September was:
| 2014 Number | 2013 Number | 2012 Number | ||||||||||
| Research and development | 202 | 170 | 162 | |||||||||
| Management and administration | 21 | 18 | 15 | |||||||||
| 223 | 188 | 177 | ||||||||||
| 2014 £000’s | 2013 £000’s | 2012 £000’s | ||||||||||
| Their aggregate remuneration comprised: | ||||||||||||
| Wages and salaries | 11,470 | 8,442 | 7,700 | |||||||||
| Social security costs | 4,484 | 1,103 | 926 | |||||||||
| Other pension costs | 533 | 525 | 463 | |||||||||
| Share-based payment | 1,238 | 616 | 1,009 | |||||||||
| 17,725 | 10,686 | 10,098 | ||||||||||
| 2016 | 2015 | 2014 | ||||||||||
| Number | Number | Number | ||||||||||
| Research and development | 391 | 288 | 202 | |||||||||
| Management and administration | 53 | 34 | 21 | |||||||||
| 444 | 322 | 223 | ||||||||||
| 2016 | 2015 | 2014 | ||||||||||
| £000s | £000s | £000s | ||||||||||
| Group aggregate remuneration comprised: | ||||||||||||
| Wages and salaries | 25,823 | 17,092 | 11,470 | |||||||||
| Social security costs | 5,132 | 2,748 | 4,484 | |||||||||
| Other pension costs | 1,356 | 765 | 533 | |||||||||
| Share-based payment | 8,152 | 2,478 | 1,238 | |||||||||
| 40,463 | 23,083 | 17,725 | ||||||||||
Included in social security costs are local tax obligations on unrealised share option gains.
| F-20 |
8. Directors’ Remuneration
Directors’ remuneration and other benefits for the year ended 30 September were as follows:
| 2016 | 2015 | 2014 | ||||||||||||||||||||||
| 2014 £000’s | 2013 £000’s | 2012 £000’s | £000s | £000s | £000s | |||||||||||||||||||
| Emoluments | 2,688 | 1,733 | 1,692 | 2,523 | 2,395 | 2,688 | ||||||||||||||||||
| Money purchase contributions to Directors’ pension arrangements | 203 | 200 | 158 | 215 | 211 | 203 | ||||||||||||||||||
| Gain on exercise of share options | 5,526 | – | 122 | 6,453 | 7,910 | 5,526 | ||||||||||||||||||
| 8,417 | 1,933 | 1,972 | 9,191 | 10,516 | 8,417 | |||||||||||||||||||
During 2014, five2016, six Directors were members of defined contribution pension schemes (2013: five(2015 and 2012: four)2014: five).
9. InterestOther income and expense
| 2014 £000’s | 2013 £000’s | 2012 £000’s | 2016 | 2015 | 2014 | |||||||||||||||||||
| £000s | £000s | £000s | ||||||||||||||||||||||
| Interest income – bank interest | 435 | 244 | 130 | |||||||||||||||||||||
| Other income | 173 | – | – | |||||||||||||||||||||
| Interest expense – finance lease interest | (61 | ) | (64 | ) | (1 | ) | (173 | ) | (75 | ) | (61 | ) | ||||||||||||
| Interest income – bank interest | 130 | 178 | 200 | |||||||||||||||||||||
Other income relates to an “Above the line” credit associated with the UK large company R&D tax scheme. This represents an amount that is expected to be claimable from UK tax authorities in relation to qualifying expenditure incurred in the year ended 30 September 2016.
10. Tax
a) Analysis of Tax Credit for the Year
| 2014 £000’s | 2013 £000’s | 2012 £000’s | ||||||||||
| Current year research and development tax credit | (5,251 | ) | (2,900 | ) | (820 | ) | ||||||
| Adjustment in respect of prior year tax credit | (278 | ) | (2,012 | ) | (428 | ) | ||||||
| Recognition of previously unrecognised deferred tax asset | (829 | ) | (2,872 | ) | – | |||||||
| Current year utilisation of deferred tax assets | 1,447 | 1,977 | – | |||||||||
| Tax (benefit) | (4,911 | ) | (5,807 | ) | (1,248 | ) | ||||||
| 2016 | 2015 | 2014 | ||||||||||
| £000s | £000s | £000s | ||||||||||
| Current year research and development tax credit | (21,150 | ) | (12,641 | ) | (5,251 | ) | ||||||
| Current period tax (credit)/charge | 1,175 | 366 | – | |||||||||
| Adjustment in respect of prior year tax credit | (546 | ) | (165 | ) | (278 | ) | ||||||
| Deferred tax credit | (2,037 | ) | (335 | ) | (829 | ) | ||||||
| Movements on deferred tax assets | 43 | 277 | 1,447 | |||||||||
| Tax benefit | (22,515 | ) | (12,498 | ) | (4,911 | ) | ||||||
Tax credits relate to UK research and development tax credits claimed under the Corporation TaxFinance Act 2009.2000. The current period tax charge relates to US taxation on the taxable profit for the Group’s US subsidiary.
Prior to 2013, theThe Group recognised uncertain benefits of enhanced research and development deductions and the resulting tax credits when acceptance of the claim was reached with Her Majesty’s Revenue and Customs (UK) (“HMRC”), resulting in prior year adjustments to the tax credit as shown above. Given that there is now a sustained history of agreeing such claims with HMRC, in the year ended 30 September 2014 the Group recognisedrecognises in full the estimated benefit for qualifying current year UK research and development expenditures.expenditures and resulting tax credits. Any difference in the credit ultimately received is recorded as an adjustment in respect of prior year.
The Group recognises the likely recoverable estimated benefit for qualifying current year US research and development expenditures and resulting tax credits. Any difference in the credit ultimately received is recorded as an adjustment in respect of prior year.
At 30 September 20142016 the Group had tax losses available for carry forward of approximately £34.3£102.8 million (2013: £33.6 million; 2012: £40.9(2015: £74.0 million). TheOf such carried-forward losses, the Group has recognised a deferred tax asset of £1.8 million (2015: £1.9 million) up to the level of deferred tax liabilities arising in the same jurisdiction and additionally an asset supportable by taxable income projections of £nil (2015: £nil). The Group has also recognised a deferred tax asset of £3.9 million (2015: £0.4 million) in respect of £1.4 million (2013: £4.1 million; 2012: £nil) of such losses. The Group has not recognised deferred tax assetstaxable temporary timing differences relating to the remaining carried forward losses, of approximately £32.9 million (2013: £29.5 million; 2012: £40.9 million).timing differences in another jurisdiction supportable by taxable income projections. In addition, the Group has not recognised deferred tax assets relating to other gross temporary differences of £11.6£33.9 million (2013: £1.7 million; 2012: £1.3(2015: £20.7 million). These deferred tax assets have not been recognised as the Group’s management considers that there is insufficient future taxable income, taxable temporary differences and feasible tax-planning strategies to utilise all of the deferred tax assetscumulative losses and therefore it is probable that the deferred tax assets will not be realised in full. If future income differs from current projections, and we are able to recognise a greater portion of the deferred tax assets, this could significantly impact the tax charge or benefit in future periods.
In addition to the amount charged to the income statement and other comprehensive income, the following amounts relating to tax have been recognised directly in equity:
| 2016 | 2015 | 2014 | ||||||||||
| £000s | £000s | £000s | ||||||||||
| Change in estimate of excess tax deductions related to share-based payments | 1,133 | 84 | – | |||||||||
| Total income tax recognised directly in equity | 1,133 | 84 | – | |||||||||
| F-21 |
b) Factors Affecting the Tax Benefit for the Year
The tax benefit for the year can be reconciled to the tax (benefit)/chargebenefit on the Group’s (loss)/profitloss for the year at the effectivestandard UK corporation tax rate as follows:
| 2014 £000’s | 2013 £000’s | 2012 £000’s | 2016 | 2015 | 2014 | |||||||||||||||||||
| (Loss)/profit before tax | (19,570 | ) | (10,356 | ) | 1,242 | |||||||||||||||||||
| Tax (credit)/charge on Group (loss)/profit before tax at the effective UK corporation tax rate of 22.0% (2013: 23.5%; 2012: 25%) | (4,305 | ) | (2,434 | ) | 311 | |||||||||||||||||||
| £000s | £000s | £000s | ||||||||||||||||||||||
| Loss before tax | (86,172 | ) | (57,061 | ) | (19,570 | ) | ||||||||||||||||||
| Tax credit on Group loss before tax at the standard UK corporation tax rate of 20.0% (2015: 20.5%; 2014: 22.0%) | (17,234 | ) | (11,698 | ) | (4,305 | ) | ||||||||||||||||||
| Effects of: | ||||||||||||||||||||||||
| Expenses not deductible in determining taxable profit | 17 | 44 | – | 588 | 233 | 1,070 | ||||||||||||||||||
| Impact of employee share acquisition relief | (1,842 | ) | (2,519 | ) | (1,053 | ) | ||||||||||||||||||
| Income not taxable in determining taxable profit | (1 | ) | (8 | ) | (4 | ) | – | – | (1 | ) | ||||||||||||||
| Current year research and development tax credit | (5,251 | ) | (2,900 | ) | (820 | ) | ||||||||||||||||||
| Current year UK research and development tax credit | (21,150 | ) | (12,641 | ) | (5,251 | ) | ||||||||||||||||||
| Current year US tax credits | (1,766 | ) | – | – | ||||||||||||||||||||
| R&D enhanced tax relief and surrender of losses | 3,875 | 2,225 | 88 | 12,679 | 7,756 | 3,875 | ||||||||||||||||||
| Effect of unrecognised losses and temporary differences | 1,861 | 2,150 | (395 | ) | 6,634 | 6,536 | 1,861 | |||||||||||||||||
| Overseas profits taxed at different rates | 122 | – | – | |||||||||||||||||||||
| Recognition of previously unrecognised deferred tax asset | (829 | ) | (2,872 | ) | – | – | – | (829 | ) | |||||||||||||||
| Adjustment in respect of prior year tax credit | (278 | ) | (2,012 | ) | (428 | ) | (546 | ) | (165 | ) | (278 | ) | ||||||||||||
| Tax | (4,911 | ) | (5,807 | ) | (1,248 | ) | (22,515 | ) | (12,498 | ) | (4,911 | ) | ||||||||||||
The following are the major deferred tax liabilities and assets recognised by the Group and movements thereon during the current and prior reporting periods:
| Accelerated Tax Depreciation £000’s | Other Temporary Differences £000’s | Tax Losses £000’s | Total £000’s | Accelerated Tax | Tax | Share-Based Payment and | ||||||||||||||||||||||||||
| At 1 October 2011 | (202 | ) | 202 | – | – | |||||||||||||||||||||||||||
| (Charged)/credited to profit or loss | (75 | ) | 75 | – | – | |||||||||||||||||||||||||||
| At 1 October 2012 | (277 | ) | 277 | – | – | |||||||||||||||||||||||||||
| (Charged)/credited to profit or loss | (463 | ) | (277 | ) | 1,635 | 895 | ||||||||||||||||||||||||||
| Depreciation | Losses | Other Compensation | Total | |||||||||||||||||||||||||||||
| £000s | £000s | £000s | £000s | |||||||||||||||||||||||||||||
| At 1 October 2013 | (740 | ) | – | 1,635 | 895 | (740 | ) | 1,635 | – | 895 | ||||||||||||||||||||||
| (Charged)/credited to profit or loss | 135 | – | (753 | ) | (618 | ) | 135 | (753 | ) | – | (618 | ) | ||||||||||||||||||||
| At 30 September 2014 | (605 | ) | – | 882 | 277 | |||||||||||||||||||||||||||
| At 1 October 2014 | (605 | ) | 882 | – | 277 | |||||||||||||||||||||||||||
| Credited/(charged) to profit or loss | (1,290 | ) | 1,002 | 345 | 57 | |||||||||||||||||||||||||||
| Credited/(charged) to equity | – | – | 84 | 84 | ||||||||||||||||||||||||||||
| At 1 October 2015 | (1,895 | ) | 1,884 | 429 | 418 | |||||||||||||||||||||||||||
| Credited/(charged) to profit or loss | (23 | ) | (48 | ) | 2,072 | 2,001 | ||||||||||||||||||||||||||
| Credited/(charged) to equity | – | – | 1,454 | 1,454 | ||||||||||||||||||||||||||||
| At 30 September 2016 | (1,918 | ) | 1,836 | 3,955 | 3,873 | |||||||||||||||||||||||||||
Deferred tax assets and liabilities have been offset where the Group has a legally enforceable right to do so, and intends to settle on a net basis. All significant entities in the Group operate in the same taxation jurisdiction and theThe taxing authority permits the Group to make or receive a single net payment.payment for all UK subsidiaries. The Group’s US subsidiary operates in a different jurisdiction with no legally enforceable right to offset against UK tax charges or credits.
On 2 July 2013,6 September 2016, the UK Government substantively enacted a reduction in the main rate of corporation tax from 21%20% to 20%19% with effect from 1 April 2015.2017. The main rate of corporation tax will be reduced by a further 2% to 17% with effect from 1 April 2020. The enacted UK tax rate until 31 March 20141 April 2015 was 23%, and is reduced to 21% until 31 March 2015..
| F-22 |
11. (Loss)/EarningsLoss Per Share
The calculations of (loss)/earningsloss per share are based on the following data:
| 2014 £000’s | 2013 £000’s | 2012 £000’s | ||||||||||
| (Loss)/profit for the year – basic and diluted | (14,659 | ) | (4,549 | ) | 2,490 | |||||||
| 2016 | 2015 | 2014 | ||||||||||
| £000s | £000s | £000s | ||||||||||
| Loss for the year – basic and diluted | (63,657 | ) | (44,563 | ) | (14,659 | ) | ||||||
| Number of Shares | ||||||||||||||||||||||||
| Number of Shares | 2016 | 2015 | 2014 | |||||||||||||||||||||
| 2014 Million | 2013 Million | 2012 Million | Million | Million | Million | |||||||||||||||||||
| Weighted average number of ordinary shares | 210.4 | 151.5 | 133.2 | 270.4 | 246.4 | 210.4 | ||||||||||||||||||
| Less ESOP trust ordinary shares1 | – | – | (0.2 | ) | – | – | – | |||||||||||||||||
| Weighted average number of ordinary shares for purposes of basic earnings per share | 210.4 | 151.5 | 133.0 | 270.4 | 246.4 | 210.4 | ||||||||||||||||||
| Effect of potentially dilutive shares arising from share options and warrants2 | – | – | 4.5 | |||||||||||||||||||||
| Effect of potentially dilutive shares arising from share options2 | – | – | – | |||||||||||||||||||||
| Weighted average number of ordinary shares for purposes of diluted earnings per share | 210.4 | 151.5 | 137.5 | 270.4 | 246.4 | 210.4 | ||||||||||||||||||
| (Loss)/earnings per share – basic | (7.0 | )p | (3.0 | )p | 1.9 | p | ||||||||||||||||||
| (Loss)/earnings per share – diluted | (7.0 | )p | (3.0 | )p | 1.8 | p | ||||||||||||||||||
| Loss per share – basic | (23.5 | )p | (18.1 | )p | (7.0 | )p | ||||||||||||||||||
| Loss per share – diluted | (23.5 | )p | (18.1 | )p | (7.0 | )p | ||||||||||||||||||
| 1 | As at 30 September |
| 2 | The Group incurred a loss in each of the financial years above. As a result, the inclusion of potentially dilutive share options |
12. Intangible Assets – Goodwill
| Group | 2014 £000’s | 2013 £000’s | ||||||
| Cost– As at 1 October | 5,210 | 5,210 | ||||||
| Net book value – As at 30 September | 5,210 | 5,210 | ||||||
| 2016 | 2015 | |||||||
| Group | £000s | £000s | ||||||
| Cost – as at 1 October | 5,210 | 5,210 | ||||||
| Net book value – as at 30 September | 5,210 | 5,210 | ||||||
Goodwill arose upon the acquisition of GW Research Limited (formerly G-Pharm Limited) by GW Pharma Limited in 2001. For impairment testing purposes, all goodwill has been allocated to the commercialCommercial segment as a separate cash-generating unit. Goodwill has an indefinite useful life and is tested annually for impairment or more frequently if there are indications of impairment.
The Company has determined the recoverable amount of the commercialCommercial segment based on a value-in-use calculation. Thiscalculation uses pre-tax cash flow projections based on financial budgets approved by management covering a five-yeartwo-year period. Cash flows beyond the five-yeartwo-year period are based upon detailed internal and external third party analysis of the Company’s product opportunity, of which Epidiolex is a significant contributor, or are extrapolated using the estimated growth rates stated below. The projections include assumptions about the timing and likelihood of product launches and pricing policy.
Management has determined the following assumptions to be the key assumptions in the calculation of value-in-use for the Commercial segment:
Growth rate –Sales sales volume in each period is the main driver for revenue and costs. The same growth rates have been used in financial budgets and are consistent with in-market run rates guidance from our marketing partners and market expectations of Sativex revenues for the next five years.internal commercial forecasts based on a 10-year period.
Long-termLong-term growth rate –No terminal A 0% growth rate has been applied after the first five10 years (2013:(2015: 0%), after ten years). This approach has been adopted for impairment purposes givenby management as it is representative of the existence of substantial headroomlong development and product lifecycle in the goodwill impairment computation.pharmaceutical sector. In future periods, depending on the performance of the Commercial segment, thereit may the necessitybe necessary to revise the terminal growth rate.
Discount rate –a 12.6% (2015: 14.3% and 2014: 13.2% (2013: 12%) pre-tax rate has been used. This is considered appropriate for the purpose of impairment reviews as it reflects the current market assessment of the time value of money and the risks specific to the cash-generating unit.
Any reasonably possible change in the key assumptions on which value-in-use is based would not cause the carrying amount to exceed the recoverable amount of the commercialCommercial segment.
| F-23 |
13. Other Intangible Assets
| Intangible | ||||||||||||||||
| Assets Under | ||||||||||||||||
| the Course of | ||||||||||||||||
| Construction | Software | Licences | Total | |||||||||||||
| Group | £000s | £000s | £000s | £000s | ||||||||||||
| Cost | ||||||||||||||||
| At 1 October 2014 | – | – | – | – | ||||||||||||
| Additions | 55 | 76 | 59 | 190 | ||||||||||||
| Reclassifications from property, plant and equipment (note 14) | 11 | 144 | – | 155 | ||||||||||||
| At 1 October 2015 | 66 | 220 | 59 | 345 | ||||||||||||
| Additions | 387 | 35 | 24 | 446 | ||||||||||||
| Transfers of completed assets | (38 | ) | 38 | – | – | |||||||||||
| At 30 September 2016 | 415 | 293 | 83 | 791 | ||||||||||||
| Accumulated amortisation | ||||||||||||||||
| At 1 October 2014 | – | – | – | – | ||||||||||||
| Charge for the year | – | 48 | 4 | 52 | ||||||||||||
| Reclassifications | – | 48 | – | 48 | ||||||||||||
| At 1 October 2015 | – | 96 | 4 | 100 | ||||||||||||
| Charge for the year | – | 57 | 5 | 62 | ||||||||||||
| At 30 September 2016 | – | 153 | 9 | 162 | ||||||||||||
| Net book value | ||||||||||||||||
| At 30 September 2016 | 415 | 140 | 74 | 629 | ||||||||||||
| At 30 September 2015 | 66 | 124 | 55 | 245 | ||||||||||||
Included in additions are £nil of other intangible assets which are unpaid at the balance sheet date and are included in trade and other payables (2015: £0.1 million).
| F-24 |
14. Property, Plant and Equipment
| Group | Assets Under the Course of Construction £000’s | Plant, Machinery and Lab Equipment £000’s | Office and IT Equipment £000’s | Leasehold Improvements £000’s | Total £000’s | Assets Under the Course of Construction £000s | Leasehold Buildings £000s | Plant, Machinery and Lab Equipment £000s | Office and IT Equipment £000s | Leasehold Improvements £000s | Total £000s | |||||||||||||||||||||||||||||||||
| Cost | ||||||||||||||||||||||||||||||||||||||||||||
| At 1 October 2012 | – | 3,642 | 867 | 1,189 | 5,698 | |||||||||||||||||||||||||||||||||||||||
| At 1 October 2014 | 6,490 | – | 4,655 | 1,478 | 4,657 | 17,280 | ||||||||||||||||||||||||||||||||||||||
| Additions | 1,164 | 630 | 225 | 2,014 | 4,033 | 12,374 | – | 3,056 | 2,054 | 2,574 | 20,058 | |||||||||||||||||||||||||||||||||
| At 1 October 2013 | 1,164 | 4,272 | 1,092 | 3,203 | 9,731 | |||||||||||||||||||||||||||||||||||||||
| Additions | 5,617 | 383 | 256 | 1,321 | 7,577 | |||||||||||||||||||||||||||||||||||||||
| Reclassifications to other intangible assets (note 13) | (11 | ) | – | – | (144 | ) | – | (155 | ) | |||||||||||||||||||||||||||||||||||
| Transfers of completed assets | (291 | ) | – | 130 | 161 | – | (1,570 | ) | – | 570 | – | 1,000 | – | |||||||||||||||||||||||||||||||
| Disposals | – | – | – | (28 | ) | (28 | ) | – | – | (366 | ) | (41 | ) | (67 | ) | (474 | ) | |||||||||||||||||||||||||||
| At 30 September 2014 | 6,490 | 4,655 | 1,478 | 4,657 | 17,280 | |||||||||||||||||||||||||||||||||||||||
| Accumulated depreciation | ||||||||||||||||||||||||||||||||||||||||||||
| At 1 October 2012 | – | 2,385 | 374 | 507 | 3,266 | |||||||||||||||||||||||||||||||||||||||
| Charge for the year | – | 477 | 237 | 275 | 989 | |||||||||||||||||||||||||||||||||||||||
| At 1 October 2013 | – | 2,862 | 611 | 782 | 4,255 | |||||||||||||||||||||||||||||||||||||||
| At 1 October 2015 | 17,283 | – | 7,915 | 3,347 | 8,164 | 36,709 | ||||||||||||||||||||||||||||||||||||||
| Additions | 7,698 | 3,603 | 1,754 | 273 | 473 | 13,801 | ||||||||||||||||||||||||||||||||||||||
| Reclassifications | – | – | 1,463 | (1,463 | ) | – | – | |||||||||||||||||||||||||||||||||||||
| Transfers of completed assets | (3,623 | ) | – | 1,809 | 29 | 1,785 | – | |||||||||||||||||||||||||||||||||||||
| Disposals | – | – | (112 | ) | (789 | ) | (122 | ) | (1,023 | ) | ||||||||||||||||||||||||||||||||||
| Exchange differences | – | – | – | 20 | 1 | 21 | ||||||||||||||||||||||||||||||||||||||
| At 30 September 2016 | 21,358 | 3,603 | 12,829 | 1,417 | 10,301 | 49,508 | ||||||||||||||||||||||||||||||||||||||
| Accumulated depreciation and impairment | ||||||||||||||||||||||||||||||||||||||||||||
| At 1 October 2014 | – | – | 3,384 | 918 | 1,339 | 5,641 | ||||||||||||||||||||||||||||||||||||||
| Disposals | – | – | – | (12 | ) | (12 | ) | – | – | (365 | ) | (41 | ) | (67 | ) | (473 | ) | |||||||||||||||||||||||||||
| Charge for the year | – | 522 | 307 | 569 | 1,398 | – | – | 746 | 510 | 994 | 2,250 | |||||||||||||||||||||||||||||||||
| At 30 September 2014 | – | 3,384 | 918 | 1,339 | 5,641 | |||||||||||||||||||||||||||||||||||||||
| Impairment of assets | 606 | – | – | – | – | 606 | ||||||||||||||||||||||||||||||||||||||
| Reclassifications | – | – | – | (48 | ) | – | (48 | ) | ||||||||||||||||||||||||||||||||||||
| At 1 October 2015 | 606 | – | 3,765 | 1,339 | 2,266 | 7,976 | ||||||||||||||||||||||||||||||||||||||
| Disposals | – | – | (112 | ) | (788 | ) | (122 | ) | (1,022 | ) | ||||||||||||||||||||||||||||||||||
| Charge for the year | – | 63 | 1,654 | 338 | 1,550 | 3,605 | ||||||||||||||||||||||||||||||||||||||
| Reclassifications | – | – | 216 | (216 | ) | – | – | |||||||||||||||||||||||||||||||||||||
| Exchange differences | – | – | – | 1 | 1 | 2 | ||||||||||||||||||||||||||||||||||||||
| At 30 September 2016 | 606 | 63 | 5,523 | 674 | 3,695 | 10,561 | ||||||||||||||||||||||||||||||||||||||
| Net book value | ||||||||||||||||||||||||||||||||||||||||||||
| At 30 September 2014 | 6,490 | 1,271 | 560 | 3,318 | 11,639 | |||||||||||||||||||||||||||||||||||||||
| At 30 September 2013 | 1,164 | 1,410 | 481 | 2,421 | 5,476 | |||||||||||||||||||||||||||||||||||||||
| At 30 September 2016 | 20,752 | 3,540 | 7,306 | 743 | 6,606 | 38,947 | ||||||||||||||||||||||||||||||||||||||
| At 30 September 2015 | 16,677 | – | 4,150 | 2,008 | 5,898 | 28,733 | ||||||||||||||||||||||||||||||||||||||
The impairment loss for the year ended 30 September 2015 on assets under the course of construction arose in connection with a change in use of manufacturing assets whereby the recoverable value of the assets did not exceed their carrying value.
The net book value of property, plant and equipment at 30 September 20142016 includes £1.7£4.9 million in respect of assets held under finance leases (2013: £1.9(2015: £1.5 million). In addition, assets under the course of construction include £4.6£1.6 million of manufacturing facilities which are expected to be held under a finance lease upon completion, £0.3capitalised interest (2015: £1.0 million). Included in additions is £3.2 million of property, plant and equipment which is capitalised interest.unpaid and is included in trade and other payables (2015: £1.4 million).
14.
| F-25 |
15. Inventories
| 2016 | 2015 | |||||||||||||||
| 2014 £000’s | 2013 £000’s | £000s | £000s | |||||||||||||
| Raw materials | 210 | 180 | 252 | 317 | ||||||||||||
| Work in progress | 3,885 | 4,101 | 3,226 | 3,686 | ||||||||||||
| Finished goods | 682 | 380 | 770 | 753 | ||||||||||||
| 4,777 | 4,661 | |||||||||||||||
| Total inventories, net of provision | 4,248 | 4,756 | ||||||||||||||
Inventories with a carrying value of £3.2£2.2 million are considered to be recoverable after more than one year from the balance sheet date, but within the Group’s normal operating cycle (2013: £3.5(2015: £2.7 million).
The provision for inventories relates to inventories expected to expire before beingbe utilised byin the Group.Group’s R&D activities. The movement in the provision for inventories is as follows:
| 2014 £000’s | 2013 £000’s | 2016 | 2015 | |||||||||||||
| Opening balance – as at 1 October | 1,601 | 2,131 | ||||||||||||||
| £000s | £000s | |||||||||||||||
| Opening balance as at 1 October | 66 | 351 | ||||||||||||||
| Write down of inventories | 625 | – | 129 | 98 | ||||||||||||
| Write off of inventories included in the provision | (842 | ) | – | (20 | ) | (318 | ) | |||||||||
| Reversal of write down of inventories | (1,033 | ) | (530 | ) | (57 | ) | (65 | ) | ||||||||
| Closing balance as at 30 September | 351 | 1,601 | 118 | 66 | ||||||||||||
The reversal of write down is as a result of an increased level of production, reducing the level of work in progress expected to expire before use.
Inventory that was written Write off butof inventories previously provided for has no net impact on the income statement and so does not form part of the movement in the provision for inventories in theimpact cash flow.
15.16. Trade and Other Receivables
| Group | ||||||||||||||||
| 2016 | 2015 | |||||||||||||||
| 2014 £000’s | 2013 £000’s | £000s | £000s | |||||||||||||
| Amounts falling due within one year | ||||||||||||||||
| Trade receivables | 612 | 621 | 778 | 373 | ||||||||||||
| 612 | 621 | |||||||||||||||
| Prepayments and accrued income | 436 | 763 | 2,637 | 1,544 | ||||||||||||
| Other receivables | 809 | 349 | 1,141 | 956 | ||||||||||||
| 1,857 | 1,733 | 4,556 | 2,873 | |||||||||||||
Trade receivables disclosed above are classified as loans and receivables and are therefore measured at amortised cost.
Trade receivables at 30 September 20142016 represent seven27 days of sales (2013: eight(2015: 5 days). The average trade receivable days during the year ended 30 September 20142016 was 3719 days (2013: 34(2015: 22 days). The credit period extended to customers is 30 to 60 days.
The provision for impairment – trade receivables is £nil at 30 September 2014. £26,000 was considered to be impaired at 30 September 2012. This was subsequently reversed during the year ended 30 September 2013 following recovery in full of the related receivable. All trade receivables were current at the balance sheet date as at 30 September 2014 and 2013.
| 2014 £000’s | 2013 £000’s | |||||||
| Movement in the allowance for doubtful debts | ||||||||
| Balance at the beginning of the period | – | 26 | ||||||
| Amounts recovered during the year | – | (26 | ) | |||||
| Balance at the end of the period | – | – | ||||||
The trade receivables balance at 30 September 20142016 consisted of balances due from sevenfour customers (2013: seven(2015: four customers) with the largest single customer representing 45% (2013: 35%70% (2015: 46%) of the total amount due. Given that theThe Group’s customers consist of a small number of large pharmaceutical companies, counterparty creditwhere the risk attributable to each customer is considered to be low. The Group seeks to mitigate credit risk by seeking payments in advance from pharmaceutical partners for expenditure to be incurred on their behalf.
No interest is charged on trade receivables. No impairment losses were recognised during the year ended 30September 2014 (2013:2016 (2015: £nil).
The Directors consider that the carrying value of trade receivables approximates to their fair value due to the short maturity thereof.
| F-26 |
16.
17. Trade and Other Payables
| Group | ||||||||||||||||
| 2016 | 2015 | |||||||||||||||
| 2014 £000’s | 2013 £000’s | £000s | £000s | |||||||||||||
| Amounts falling due within one year | ||||||||||||||||
| Other creditors and accruals | 9,114 | 5,302 | 15,899 | 10,714 | ||||||||||||
| Clinical trial accruals | 9,503 | 8,374 | ||||||||||||||
| Trade payables | 2,342 | 3,393 | 3,433 | 3,795 | ||||||||||||
| Fit out funding | 218 | – | ||||||||||||||
| Fit out funding (see note 18) | 845 | 348 | ||||||||||||||
| Other taxation and social security | 702 | 745 | 1,490 | 791 | ||||||||||||
| 12,376 | 9,440 | 31,170 | 24,022 | |||||||||||||
| Amounts falling due after one year | ||||||||||||||||
| Fit out funding | 7,927 | – | ||||||||||||||
| Other creditors and accruals | 1,081 | - | ||||||||||||||
| Fit out funding (see note 18) | 8,342 | 8,445 | ||||||||||||||
| 20,303 | – | 9,423 | 8,445 | |||||||||||||
| 40,593 | 32,467 | |||||||||||||||
Trade payables principally comprise amounts outstanding for trade purchases and ongoing costs.
Trade payables at 30 September 20142016 represent the equivalent of 23 days14 days’ purchases (2013: 36(2015: 17 days).
The average credit period taken for trade purchases during the year ended 30 September 20142016 was 2014 days (2013: 39(2015: 17 days).
For most suppliers, no interest is charged on invoices that are paid within a pre-agreed trade credit period. The Group has procedures in place to ensure that invoices are paid within agreed credit terms so as to ensure that interest charges by suppliers are minimised.
The Directors consider that the carrying value of trade payables approximates to their fair value.value due to the short maturity thereof.
Non-current other creditors and accruals relates entirely to the expected employer’s payroll taxes payable on employee share options vesting more than one year after the financial year end.
18. Fit out funding represents £8.1 million owed
On 19 November 2013 the Group entered into an agreement with its landlord to the Group’s landlord reflecting the recognition of the liability to repay the £7.8 million ofreceive fit out funding receivedof £7.8 million to fund the expansion and upgrades to manufacturing facilities andfacilities. The funds were received in tranches, with the final amount received on 1 July 2014. The repayment of the borrowing takes the form of quarterly rental payments over a period of 15 years which commenced on 27 May 2016 when the Group entered into the associated lease of the building. As at 30 September 2016 associated interest of £0.3 million. This is expected to be repaid in the form of lease rentals commencing upon the completion of construction, currently expected to be during the third quarter of the year ending£1.6 million has been incurred (30 September 2015: £1.0 million). The total liability at 30 September 2015, over a 15-year term.2016 is £9.2 million (30 September 2015: £8.8 million). The Group has estimated that £0.2£0.9 million of the total liability will be due within one year and the remaining £7.9£8.3 million is due after one year.
The liability in respect of the funding was initially recognised at the amount of proceeds received, net of transaction costs, and has been subsequently carried at amortised cost using the effective interest method and a rate of 7.0% (30 September 2015: 7.2%).
| F-27 |
17.The following table details the Group’s remaining contractual maturity for its borrowings and the related interest payments. The tables are based on the undiscounted cash flows of financial liabilities based on the earliest date on which the Group could be required to pay. The table includes cash flows for both interest, based on the rate applicable as at 30 September 2016, and principal amounts:
| Forward projection of cash flows as at 30 September 2016 | <1 year £000s | 1-2 years £000s | 2-3 years £000s | 3-4 years £000s | 4-5 years £000s | 5+ years £000s | Total £000s | |||||||||||||||||||||
| Principal | 845 | 389 | 417 | 446 | 479 | 6,611 | 9,187 | |||||||||||||||||||||
| Interest | 603 | 576 | 548 | 519 | 486 | 2,480 | 5,212 | |||||||||||||||||||||
| Total | 1,448 | 965 | 965 | 965 | 965 | 9,091 | 14,399 | |||||||||||||||||||||
| Forward projection of cash flows as at 30 September 2015 | <1 year £000s | 1-2 years £000s | 2-3 years £000s | 3-4 years £000s | 4-5 years £000s | 5+ years £000s | Total £000s | |||||||||||||||||||||
| Principal | 348 | 369 | 397 | 426 | 456 | 7,011 | 9,007 | |||||||||||||||||||||
| Interest | 516 | 596 | 568 | 539 | 509 | 2,740 | 5,468 | |||||||||||||||||||||
| Total | 864 | 965 | 965 | 965 | 965 | 9,751 | 14,475 | |||||||||||||||||||||
19. Obligations Under Finance Leases
| Minimum Lease Payments | Minimum Lease Payments | |||||||||||||||
| 2014 £000’s | 2013 £000’s | 2016 | 2015 | |||||||||||||
| Group | £000s | £000s | ||||||||||||||
| Amounts payable under finance leases: | ||||||||||||||||
| Within one year | 200 | 177 | 571 | 176 | ||||||||||||
| In the second to fifth years inclusive | 838 | 861 | 2,223 | 703 | ||||||||||||
| After five years | 1,382 | 1,559 | 6,511 | 1,206 | ||||||||||||
| 2,420 | 2,597 | 9,305 | 2,085 | |||||||||||||
| Less: future finance charges | 513 | 592 | (4,135 | ) | (434 | ) | ||||||||||
| Present value of lease obligations | 1,907 | 2,005 | 5,170 | 1,651 | ||||||||||||
| Present Value of Lease Payments | ||||||||||||||||
| Present Value of Lease Payments | 2016 | 2015 | ||||||||||||||
| 2014 £000’s | 2013 £000’s | £000s | £000s | |||||||||||||
| Amounts payable under finance leases: | ||||||||||||||||
| Amounts due for settlement within 12 months | 126 | 100 | 211 | 111 | ||||||||||||
| Amounts due for settlement after 12 months | 1,781 | 1,905 | 4,959 | 1,540 | ||||||||||||
| 1,907 | 2,005 | 5,170 | 1,651 | |||||||||||||
It is the Group’s policy to lease certain of its property, plant and equipment under finance leases. The weighted average lease term remaining is 12.317.1 years (2013: 13.1(2015: 12.1 years). For the year ended 30 September 2014,2016, the average effective borrowing rate was 4% (2013: 4%7.5% (2015: 4.0%). Interest rates are fixed at the contract date. All leases to date have been on a fixed repayment basis and no arrangements have been entered into for contingent rental payments.
All lease obligations are denominated in Pounds Sterling.
The carrying value of the Group’s lease obligations as at 30 September 20142016 approximates to their fair value.
The Group’s obligations under finance leases are generally secured by the lessors’ rights over the leased assets.
| F-28 |
18.
20. Deferred Revenue
| Group | ||||||||||||||||
| 2016 | 2015 | |||||||||||||||
| 2014 £000’s | 2013 £000’s | £000s | £000s | |||||||||||||
| Amounts falling due within one year | ||||||||||||||||
| Deferred license, collaboration, and technical access fee income1 | 1,366 | 1,294 | ||||||||||||||
| Deferred licence, collaboration and technical access fee income1 | 1,451 | 1,260 | ||||||||||||||
| Advance research and development fees2 | 3,461 | 1,887 | 1,236 | 2,009 | ||||||||||||
| 4,827 | 3,181 | 2,687 | 3,269 | |||||||||||||
| Amounts falling due after one year | ||||||||||||||||
| Deferred license, collaboration and technical access fee income1 | 7,881 | 8,916 | ||||||||||||||
| Deferred licence, collaboration and technical access fee income1 | 5,355 | 6,725 | ||||||||||||||
| 1 | Deferred |
| 2 | Advance payments received represent payments for research and development activities to be |
19.21. Financial Instruments
The Group manages its capital to ensure that entities in the Group will be able to continue operating as a going concern while maximising shareholder returns. The Group’s overall strategy remains unchanged from 2013.2015.
Group senior management are responsible for monitoring and managing the financial risks relating to the operations of the Group, which include credit risk, market risks arising from interest rate risk and currency risk, and liquidity risk. The Board of Directors and the Audit Committee review and approve the internal policies for managing each of these risks, as summarised below. The Group is not subject to any externally imposed capital requirements.
The Group’s financial instruments, as at 30 September, are summarised below:
Categories of Financial Instruments
| 2014 £000’s | 2013 £000’s | |||||||
| Financial assets - loans and receivables | ||||||||
| Cash and cash equivalents | 164,491 | 38,069 | ||||||
| Trade receivables – at amortised cost | 612 | 621 | ||||||
| Other receivables | 277 | 349 | ||||||
| Total financial assets | 165,380 | 39,039 | ||||||
| Financial liabilities - amortised cost | ||||||||
| Trade payables | 2,342 | 3,393 | ||||||
| Fit out funding | 8,145 | 745 | ||||||
| Obligations under finance leases | 1,907 | 2,005 | ||||||
| Total financial liabilities | 12,394 | 6,143 | ||||||
| 2016 | 2015 | |||||||
| £000s | £000s | |||||||
| Financial assets – loans and receivables | ||||||||
| Cash and cash equivalents | 374,392 | 234,872 | ||||||
| Trade receivables – at amortised cost | 778 | 373 | ||||||
| Other receivables | 385 | 248 | ||||||
| Total financial assets | 375,555 | 235,493 | ||||||
| Financial liabilities – amortised cost | ||||||||
| Other creditors and accruals | 12,401 | 10,426 | ||||||
| Clinical trial accruals | 9,503 | 8,374 | ||||||
| Trade payables | 3,433 | 3,795 | ||||||
| Fit out funding | 9,187 | 8,793 | ||||||
| Obligations under finance leases | 5,170 | 1,651 | ||||||
| Total financial liabilities | 39,694 | 33,039 | ||||||
All financial assets and financial liabilities, other than the non-current element of £1.8£5.0 million in respect of the obligations under finance leases (2013: £1.9(2015: £1.5 million) and £7.9£8.3 million (2013: £nil)(2015: £8.4 million) of fit out funding received from the Group’s landlord, are current in nature. In all instances, the fairDirectors consider that the carrying value of financial assets and financial liabilities approximates to the carrying value due to the short-term nature of these instruments.their fair value.
It is, and has been throughout the period under review, the Group’s policy that no speculative trading in financial instruments shall be undertaken.
Credit Risk
Credit risk refers to the risk that a counterparty will default on its contractual obligations resulting in financial loss to the Group. The Group has a policy of only dealing with creditworthy counterparties, principally involving the major UK clearing banks and their wholly owned subsidiaries, when placing cash on deposit. In addition the Group operates a treasury policy that dictates the maximum cash balance that may be placed on deposit with any single institution or group. This policy is reviewed and approved from time to time by the Audit Committee and the Board of Directors.
| F-29 |
Trade receivables represent amounts due from customers for the sale of commercial product and research funding from development partners, consisting primarily of a small number of major pharmaceutical companies where the credit risk is considered to be low. The Group seeks to minimise credit risk by offering only 30 days credit to new commercial customers and by requesting payment in advance from its development partners for the majority of its research activities.
At the balance sheet date the maximum credit risk attributable to any individual counterparty was £80.8£244.0 million (2013: £11.2(2015: £113.2 million). which is held by HSBC Holdings plc.
The carrying amount of the financial assets recorded in the financial statements represents the Group’s maximum exposure to credit risk as no collateral or other credit enhancements are held.
Market Risk
The Group’s activities expose it primarily to financial risks of changes in interest rates and foreign currency exchange rates. These risks are managed by maintaining an appropriate mix of cash deposits in various currencies, placed with a variety of financial institutions for varying periods according to the Group’s expected liquidity requirements. There has been no material change to the Group’s exposure to market risks or the manner in which it manages and measures risk.
i) Interest Rate Risk
The Group is exposed to interest rate risk as it places surplus cash funds on deposit to earn interest income. The Group seeks to ensure that it secures the best commercially available interest rates from those banks that meet the Group’s stringent counterparty credit rating criteria. In doing so, the Group manages the term of cash deposits, up to a maximum of 36590 days, in order to maximise interest earnings while also ensuring that it maintains sufficient readily available cash in order to meet short-term liquidity needs.
Interest income of £0.1£0.4 million (2013:(2015: £0.2 million; 2012: £0.22014: £0.1 million) during the year ended 30 September 20142016 was earned from deposits with a weighted average interest rate of 0.54% (2013: 0.97%0.36% (2015: 0.24%; 2012: 1.00%2014: 0.54%). Therefore, a 100 basis point increase in interest rates would have increased interest income, and reduced the loss for the year, by £0.5£1.2 million (2013:(2015: reduced loss by £0.2£1.0 million; 2012: increased profit2014: reduced loss by £0.2£0.5 million), although the majority of the Group’s cash funds were not present until the end of the third quarter of the year ended 30 September 2014..
The Group does not have any balance sheet exposure to assets or liabilities which would increase or decrease in fair value with changes to interest rates.
ii) Currency Risk
The functional currency of the Company, and each of its subsidiaries apart from Greenwich Biosciences, Inc. (formerly GW Pharmaceuticals Inc.), is Pounds Sterling and the majority of transactions in the Group are denominated in that currency. The functional currency of GW PharmaceuticalsGreenwich Biosciences, Inc. is USD.US Dollars ($). The Group receives revenues and incurs expenditures in foreign currencies and is exposed to the risks of foreign exchange rate movements, with the impactedimpact recognised which are recorded in the consolidated income statement. The Group seeks to minimise this exposure by passively maintaining foreign currency cash balances at levels appropriate to meet foreseeable foreign currency expenditures, converting surplus foreign currency balances into Pounds as soon as they arise. The Group does not use derivative contracts to manage exchange rate exposure.
The table below shows an analysis of the Pounds Sterling equivalent of the year endyear-end cash and cash equivalentsequivalent balances by currency:
| 2016 | 2015 | |||||||||||||||
| 2014 £000’s | 2013 £000’s | £000s | £000s | |||||||||||||
| Cash at bank and in hand: | ||||||||||||||||
| Pounds Sterling | 16,115 | 4,312 | 73,277 | 18,756 | ||||||||||||
| Euro | 1,877 | 776 | 1,582 | 2,070 | ||||||||||||
| US Dollar | 62,676 | 5,201 | 169,738 | 98,417 | ||||||||||||
| Canadian Dollar | 412 | 227 | 448 | 804 | ||||||||||||
| Total | 81,080 | 10,516 | 245,045 | 120,047 | ||||||||||||
| Short-term deposits (less than 30 days): | ||||||||||||||||
| Pounds Sterling | 42,102 | 27,553 | 31,564 | 31,516 | ||||||||||||
| US Dollar | 41,309 | – | 97,783 | 83,309 | ||||||||||||
| Total cash and cash equivalents | 164,491 | 38,069 | 374,392 | 234,872 | ||||||||||||
| F-30 |
The table below shows those transactional exposures that give rise to net currency gains and losses recognised in the consolidated income statement. Such exposures comprise the net monetary assets and monetary liabilities of the Group that are not denominated in the functional currency of the relevant Group entity. As at 30 September these exposures were as follows:
Net Foreign Currency Assets/(Liabilities)
| 2014 £000’s | 2013 £000’s | |||||||
| US Dollar | 100,950 | 2,424 | ||||||
| Euro | 1,415 | 710 | ||||||
| Canadian Dollar | 307 | 432 | ||||||
| Other | (35 | ) | (51 | ) | ||||
| 102,637 | 3,515 | |||||||
| 2016 | 2015 | |||||||
| £000s | £000s | |||||||
| US Dollar | 263,094 | 177,797 | ||||||
| Euro | 1,665 | 768 | ||||||
| Canadian Dollar | 649 | 953 | ||||||
| Other | (38 | ) | (55 | ) | ||||
| 265,370 | 179,463 | |||||||
Foreign Currency Sensitivity Analysis
The most significant currencies in which the Group transacts, other than Pounds Sterling, are the US Dollar, the Euro and the Euro.Canadian Dollar. The Group also trades in other currencies in small amounts as necessary. The Group’s sensitivity to foreign currency has increased during the Canadian Dollar;current period primarily due to the Czech Crown and the Polish Zloty. issuance of 38.6 million new shares on NASDAQ (see note 22).
The following table details the Group’s sensitivity to a 10% change in the year-end rate, which the Group feels is the maximum likely change in rate based upon recent currency movements, in the key foreign currency exchange rates against Pounds Sterling:
| Year Ended 30 September 2014 | Euro £000’s | US Dollar £000’s | Can Dollar £000’s | Other £000’s | ||||||||||||
| Profit before tax | 141 | 10,095 | 31 | (3 | ) | |||||||||||
| Equity | 141 | 10,095 | 31 | (3 | ) | |||||||||||
| Year Ended 30 September 2016 | Euro £000s | US Dollar £000s | Can Dollar £000s | Other £000s | ||||||||||||
| Loss before tax | 167 | 26,309 | 65 | (4 | ) | |||||||||||
| Equity | 167 | 26,309 | 65 | (4 | ) | |||||||||||
| Year Ended 30 September 2013 | Euro £000’s | US Dollar £000’s | Can Dollar £000’s | Other £000’s | ||||||||||||
| Profit before tax | 71 | 242 | 43 | (5 | ) | |||||||||||
| Equity | 71 | 242 | 43 | (5 | ) | |||||||||||
| Year Ended 30 September 2015 | Euro £000s | US Dollar £000s | Can Dollar £000s | Other £000s | ||||||||||||
| Loss before tax | 77 | 17,780 | 95 | (6 | ) | |||||||||||
| Equity | 77 | 17,780 | 95 | (6 | ) | |||||||||||
| Year Ended 30 September 2012 | Euro £000’s | US Dollar £000’s | Can Dollar £000’s | Other £000’s | ||||||||||||
| Profit before tax | 40 | 36 | 46 | (2 | ) | |||||||||||
| Equity | 40 | 36 | 46 | (2 | ) | |||||||||||
| Year Ended 30 September 2014 | Euro £000s | US Dollar £000s | Can Dollar £000s | Other £000s | ||||||||||||
| Loss before tax | 141 | 10,095 | 31 | (3 | ) | |||||||||||
| Equity | 141 | 10,095 | 31 | (3 | ) | |||||||||||
In management’s opinion, the sensitivity analysis is unrepresentative of the inherent foreign exchange risk as the year-end exposure does not reflect the exposure during the year.
Liquidity Risk
Responsibility for liquidity risk management rests with the Board of Directors, which has built a liquidity risk management framework to enable the monitoring and management of short, medium and long-term cash requirements of the business.
The Board of Directors actively monitormonitors Group cash flows and regularly reviewreviews projections of future cash requirements to ensure that appropriate levels of liquidity are maintained. The Group manages its short-term liquidity primarily by planning the maturity dates of cash deposits in order to time the availability of funds as liabilities fall due for payment. The Group does not maintain any borrowing facilities.
Cash deposits, classified as cash and cash equivalents on the balance sheet, comprise deposits placed on money markets for periods of up to three months and on call. The weighted average time for which the rate was fixed was 4032 days (2013: 38(2015: 32 days).
All of the Group’s financial liabilities at each balance sheet date have maturity dates of less than 12 months from the balance sheet date, other than the £1.7£5.0 million in respect of the obligations under finance leases (2013: £1.9(2015: £1.5 million) and £7.9£8.3 million (2013: £nil)(2015: £8.4 million) of fit out funding received from the Group’s landlord. The obligations under finance leases will be repaid over a weighted average 12.3-year17.1 year term (2015: 12.1 year term) and the fit out funding received will beis being repaid underover a 15-year finance leaseterm of which will commencerepayments commenced during 2015.the year. There have been no material changes to the Group’s exposure to liquidity risks or the manner in which it manages and measures liquidity risk.
| F-31 |
20.
22. Share Capital
As at 30 September 20142016 the share capital of the CompanyCompany’s allotted, called-up and fully paid amounts were as follows:
| 2014 £000’s | 2013 £000’s | |||||||
| Allotted, called-up and fully paid | 237 | 178 | ||||||
| 2016 | 2015 | |||||||
| £000s | £000s | |||||||
| Allotted, called-up and fully paid | 302 | 261 | ||||||
Changes to the number of ordinary shares in issue have been as follows:
| Number of Shares | Total Nominal Value £000’s | Total Share Premium £000’s | Total Consideration £000’s | |||||||||||||
| As at 1 October 2012 | 133,370,354 | 133 | 65,947 | 66,080 | ||||||||||||
| Issue of new shares | 44,136,000 | 45 | 18,055 | 18,100 | ||||||||||||
| Exercise of share options | 14,933 | – | 3 | 3 | ||||||||||||
| As at 30 September 2013 | 177,521,287 | 178 | 84,005 | 84,183 | ||||||||||||
| Issue of new shares | 51,147,300 | 51 | 126,248 | 126,299 | ||||||||||||
| Exercise of share options | 4,201,348 | 4 | 5,014 | 5,018 | ||||||||||||
| Exercise of warrants | 3,776,960 | 4 | 5,284 | 5,288 | ||||||||||||
| As at 30 September 2014 | 236,646,895 | 237 | 220,551 | 220,788 | ||||||||||||
On 14 January 2014,
| Number of Shares | Total Nominal Value £000s | Total Share Premium £000s | Total Consideration £000s | |||||||||||||
| As at 1 October 2014 | 236,646,895 | 237 | 220,551 | 220,788 | ||||||||||||
| Issue of new shares (net of issuance costs) | 22,093,601 | 22 | 127,541 | 127,563 | ||||||||||||
| Exercise of share options | 2,439,677 | 2 | 1,183 | 1,185 | ||||||||||||
| As at 1 October 2015 | 261,180,173 | 261 | 349,275 | 349,536 | ||||||||||||
| Issue of new shares (net of issuance costs) | 38,640,000 | 39 | 206,512 | 206,551 | ||||||||||||
| Exercise of share options | 2,272,966 | 2 | 690 | 692 | ||||||||||||
| As at 30 September 2016 | 302,093,139 | 302 | 556,477 | 556,779 | ||||||||||||
In July 2016, the Company successfullyGroup completed an equity financing, issuing 33,687,30038,640,000 ordinary shares in the form of American Depositary Shares (“ADSs”) listed on the NASDAQ Global market, raising net proceeds after expenses of US$94.1$273.1 million (£56.8206.6 million). This took the form of 2,807,2753,220,000 ADSs at a price to the public of US$36.00$90.00 per ADS. Each ADS represents 12 ordinary shares of 0.1p each in the capital of the Company.
On 14 June 2014,In May 2015, the Company successfullyGroup completed an equity financing, issuing 17,460,00022,080,000 ordinary shares in the form of ADSsAmerican Depositary Shares (“ADSs”) listed on the NASDAQ Global market, raising net proceeds after expenses of US$118.0$193.3 million (£69.5127.5 million). This took the form of 1,455,0001,840,000 ADSs at a price to the public of US$86.83 per ADS. Each ADS represents 12 ordinary shares of 0.1p each in the capital of the Company.
During the year ended 30 September 2013 the Group completed an Initial Public Offering on the NASDAQ Global Market, issuing 44,136,000 shares for net consideration of £18.1 million. This took the form of 3,678,000 ADSs at a price to the public of US$8.90$112.00 per ADS. Each ADS represents 12 ordinary shares of 0.1p each in the capital of the Company.
The Company has one class of ordinary shares which carry no right to fixed income.
21.23. Share-based paymentsPayments
Equity-settled Share Option Schemes
The Company operates various equity-settled share option schemes for employees of the Group. All options granted under these schemes are exercisable at the share price on the date of the grant, with the exception of certain options issued under the GW Pharmaceuticals Long Term Incentive Plan (“LTIP”) which are issued with an exercise price equivalent to the par value of the shares under option. The vesting period for all options granted is threerange between one and four years from the date of grant and options lapse after 10 years.six months to seven years from the vesting date. Options generally also lapse if the employee leaves the Group before the options vest. However, at the discretion of the Remuneration Committee, under the “Good Leaver” provisions of the various share option scheme rules, employees may be allowed to retain some or all of the share options upon ceasing employment by the Group. Vested options usually need to be exercised within six months of leaving.
In the year ended 30 September 2014, no employee2016, two employees designated as a “Good Leaver” wasLeavers” were permitted to retain some or all of his/her options over 4,807 shares upon ceasing employmentemployment. Also during the year ended 30 September 2016, 90,000 non-director LTIP share options were replaced and accounted for as a modification of terms per the provisions of IFRS 2Share Based Payment. This led to the recognition of an incremental fair value charge of £0.4 million, calculated using the Black-Scholes share option pricing model, which arises due to increases in the underlying share price since the initial options were granted.
LTIP awards granted to employees (excluding Executive Directors) are subject to service and non-market-based performance conditions which must be achieved before the options vest and become exercisable. LTIP awards granted to Executive Directors are subject to service and performance conditions which are determined by the Remuneration Committee. These are usually a mixture of market-based and non-market-based performance conditions which are intended to link executive compensation to the key value drivers for the business whilst aligning the interests of the Executive Directors with those of shareholders and employees. In the event that the performance conditions (non-market and market) are not achieved within the required three-year vesting period, the options lapse.
2011 Awards
In the year ended 30 September 2011, all awards granted were LTIP awards.
The 2011 LTIP awards were subject to a performance condition whereby the number of options vesting on the third anniversary of the date of grant was determined according to the performance of the Company share price relative to a comparator group consisting of the constituents of the FTSE SmallCap index. Such awards vested if the Company is ranked at median or above in relation to the Group. This performance condition was met with the Company achieving an upper quartile ranking. 100% of the options vested.
2012 Awards
In the year ended 30 September 2012, all awards granted were LTIP awards.
The 2012 LTIP awards are subdivided into four equal tranches, each of which vests on 6 June 2015 upon achievement of the following performance conditions:
2013 Awards
In the year ended 30 September 2013, all awards granted were LTIP awards.
The 2013 LTIP awards are subject to performance conditions whereby 100% of the awards vest on the third anniversary of the date of the grant if the ADS price has increased by 75% or more during the three-year vesting period ended 24 September 2016. 25% of the awards vests if 25% growth is achieved, with a straight-line basis of calculation being used to calculate the number of options vesting between these two extremes. No options vest if the share price growth is below 25% over the three-year vesting period.
The 2013 LTIP awards are subject to a service condition whereby the awards vest on the third anniversary of the date of the grant if the holders remain in employment, subject to the performance conditions above.
| F-32 |
2014 Awards
In the year ended 30 September 2014, all awards granted were LTIP awards.
The 2014 LTIP awards are subject to a service condition whereby 100% of the awards vest on the third anniversary of the date of the grant if the holders remain in employment.
Consultant Share Options2015 Awards
In additionthe year ended 30 September 2015, all awards granted were LTIP awards.
The 2015 LTIP awards are subject to performance conditions, whereby:
| · | 25% of the awards are in the form of market-priced options, whereby the options have an exercise price equivalent to the market price at market close on the day prior to grant ($127.26 per ADS, equivalent to 671p per ordinary share). These options become exercisable on the third anniversary of the date of grant. Future gains upon exercise of these options will be linked to the extent of share price growth over the vesting period. |
| · | 50% of the awards are in the form of performance stock options, whereby the options will vest upon the third anniversary of the date of grant subject to certain corporate performance conditions having been achieved. In this case, vesting of half of the performance stock options will occur upon receipt from FDA of their confirmation of acceptance of an Epidiolex NDA filing and half will vest upon FDA grant of Epidiolex regulatory approval. |
| · | 25% of the awards are in the form of restricted stock options whereby these options are subject to a four-year service condition and vesting period. 25% of the options will vest on each anniversary of the date of grant over the next four years. |
2016 Awards
In the above, prioryear ended 30 September 2016, all awards granted were LTIP awards.
The 2016 LTIP awards are subject to 1 October 2011, options were issued to a small number of expert consultants in return for services provided to the Group. Such share-based payment transactions were measured at the fair value of the goods or services received, except where that fair value could not be estimated reliably, in which case they were measured at the fair value of the equity instruments granted, measured at the date of grant.performance conditions, whereby:
| · | 25% of the awards are in the form of market-priced options, whereby the options have an exercise price equivalent to the market price at market close on the day prior to grant ($44.64 per ADS, equivalent to 257p per ordinary share). These options become exercisable on the third anniversary of the date of grant. Future gains upon exercise of these options will be linked to the extent of share price growth over the vesting period. |
| · | 50% of the awards are in the form of performance stock options, whereby the options will vest upon the third anniversary of the date of grant subject to certain corporate performance conditions having been achieved. In this case, vesting of half of the performance stock options will occur upon receipt from FDA of their confirmation of acceptance of an Epidiolex NDA filing and half will vest upon FDA grant of Epidiolex regulatory approval. |
| · | 25% of the awards are in the form of restricted stock options whereby these options are subject to a four-year service condition and vesting period. 25% of the options will vest on each anniversary of the date of grant over the next four years. |
The number of outstanding options under each scheme can be summarised as follows:
| 30 Sept 2016 | 30 Sept 2015 | |||||||||||||||
| Number of | Number of | |||||||||||||||
| 30 Sept 2014 Number of Share Options | 30 Sept 2013 Number of Share Options | Share Options | Share Options | |||||||||||||
| Employee share option schemes | 1,868,699 | 5,535,581 | 107,542 | 770,936 | ||||||||||||
| Employee LTIP awards | 7,471,320 | 6,778,743 | 10,525,630 | 7,660,564 | ||||||||||||
| Consultant share options | 104,806 | 425,856 | ||||||||||||||
| Options outstanding | 9,444,825 | 12,740,180 | 10,633,172 | 8,431,500 | ||||||||||||
| F-33 |
The movement in share options in each scheme during the year can be summarised as follows:
| Employee Options | Employee LTIP | Consultant Options | Total Options | Employee Options | Employee LTIP | Consultant Options | Total Options | |||||||||||||||||||||||||||||||||||||||||||||||||||||||||
| Number of Share Options | Weighted Average Exercise Price £ | Number of Share Options | Weighted Average Exercise Price £ | Number of Share Options | Weighted Average Exercise Price £ | Number of Share Options | Weighted Average Exercise Price £ | Number of Share Options | Weighted Average Exercise Price £ | Number of Share Options | Weighted Average Exercise Price £ | Number of Share Options | Weighted Average Exercise Price £ | Number of Share Options | Weighted Average Exercise Price £ | |||||||||||||||||||||||||||||||||||||||||||||||||
| Outstanding at 1 October 2012 | 6,462,379 | 1.24 | 4,591,765 | 0.001 | 612,456 | 0.76 | 11,666,600 | 0.76 | ||||||||||||||||||||||||||||||||||||||||||||||||||||||||
| Outstanding at 1 October 2014 | 1,868,699 | 0.98 | 7,471,320 | 0.001 | 104,806 | 1.27 | 9,444,825 | 0.21 | ||||||||||||||||||||||||||||||||||||||||||||||||||||||||
| Granted during the year | – | – | 2,679,374 | 0.001 | – | – | 2,679,374 | 0.001 | – | – | 2,009,231 | 1.09 | – | – | 2,009,231 | 1.09 | ||||||||||||||||||||||||||||||||||||||||||||||||
| Exercised during the year | (5,800 | ) | 0.54 | (9,133 | ) | 0.001 | – | – | (14,933 | ) | 0.21 | (1,097,763 | ) | 0.96 | (1,237,108 | ) | 0.001 | (104,806 | ) | 1.27 | (2,439,677 | ) | 0.49 | |||||||||||||||||||||||||||||||||||||||||
| Lapsed during the year | (920,998 | ) | 1.71 | (483,263 | ) | 0.001 | (186,600 | ) | 1.61 | (1,590,861 | ) | 1.34 | – | – | (582,879 | ) | 0.001 | – | – | (582,879 | ) | 0.001 | ||||||||||||||||||||||||||||||||||||||||||
| Outstanding at 1 October 2013 | 5,535,581 | 1.16 | 6,778,743 | 0.001 | 425,856 | 1.28 | 12,740,180 | 0.57 | ||||||||||||||||||||||||||||||||||||||||||||||||||||||||
| Outstanding at 1 October 2015 | 770,936 | 1.02 | 7,660,564 | 0.29 | – | – | 8,431,500 | 0.35 | ||||||||||||||||||||||||||||||||||||||||||||||||||||||||
| Granted during the year | - | - | 1,061,743 | 0.001 | - | - | 1,061,743 | 0.001 | – | – | 4,767,106 | 0.60 | – | – | 4,767,106 | 0.60 | ||||||||||||||||||||||||||||||||||||||||||||||||
| Exercised during the year | (3,666,882 | ) | 1.26 | (213,416 | ) | 0.001 | (321,050 | ) | 1.29 | (4,201,348 | ) | 1.19 | (663,394 | ) | 1.04 | (1,609,572 | ) | 0.001 | – | – | (2,272,966 | ) | 0.305 | |||||||||||||||||||||||||||||||||||||||||
| Lapsed during the year | - | - | (155,750 | ) | 0.001 | - | - | (155,750 | ) | 0.001 | – | – | (292,468 | ) | 0.001 | – | – | (292,468 | ) | 0.001 | ||||||||||||||||||||||||||||||||||||||||||||
| Outstanding at 30 September 2014 | 1,868,699 | 0.98 | 7,471,320 | 0.001 | 104,806 | 1.27 | 9,444,825 | 0.21 | ||||||||||||||||||||||||||||||||||||||||||||||||||||||||
| Outstanding at 30 September 2016 | 107,542 | 0.868 | 10,525,630 | 0.482 | – | – | 10,633,172 | 0.61 | ||||||||||||||||||||||||||||||||||||||||||||||||||||||||
Share options outstanding at 30 September 20142016 can be summarised as follows:
| Employee Options | Employee LTIP | Consultant Options | Total Options | |||||||||||||||||||||||||||||
| Range of exercise prices | Number of Share Options | Weighted Average Remaining Contractual Life/Years | Number of Share Options | Weighted Average Remaining Contractual Life/Years | Number of Share Options | Weighted Average Remaining Contractual Life/Years | Number of Share Options | Weighted Average Remaining Contractual Life/Years | ||||||||||||||||||||||||
| £0.00–£0.50 | 4,000 | 3.97 | 7,471,320 | 7.45 | - | - | 7,475,320 | 7.45 | ||||||||||||||||||||||||
| £0.51–£1.00 | 1,410,679 | 2.21 | - | - | - | - | 1,410,679 | 2.21 | ||||||||||||||||||||||||
| £1.01–£1.50 | 454,020 | 1.16 | - | - | 104,806 | 0.82 | 558,826 | 1.09 | ||||||||||||||||||||||||
| Outstanding at 30 September 2014 | 1,868,699 | 1.96 | 7,471,320 | 7.45 | 104,806 | 0.82 | 9,444,825 | 6.29 | ||||||||||||||||||||||||
| Exercisable at 30 September 2014 | 1,868,699 | 1.96 | 2,621,596 | 5.30 | 104,806 | 0.82 | 4,595,101 | 3.84 | ||||||||||||||||||||||||
| Employee Options | Employee LTIP | Consultant Options | Total Options | |||||||||||||||||||||||||||||
| Number of Share Options | Weighted Average Remaining Contractual Life/Years | Number of Share Options | Weighted Average Remaining Contractual Life/Years | Number of Share Options | Weighted Average Remaining Contractual Life/Years | Number of Share Options | Weighted Average Remaining Contractual Life/Years | |||||||||||||||||||||||||
| £0.00–£0.50 | 4,000 | 1.97 | 9,182,071 | 6.26 | – | – | 9,186,071 | 6.25 | ||||||||||||||||||||||||
| £0.51–£1.00 | 103,542 | 0.59 | – | – | – | – | 103,542 | 0.59 | ||||||||||||||||||||||||
| £1.00+ | – | – | 1,343,559 | 7.24 | – | – | 1,343,559 | 7.24 | ||||||||||||||||||||||||
| Outstanding at 30 September 2016 | 107,542 | 0.64 | 10,525,630 | 6.38 | – | – | 10,633,172 | 6.32 | ||||||||||||||||||||||||
| Exercisable at 30 September 2016 | 107,542 | 0.64 | 3,057,821 | 6.12 | – | – | 3,165,363 | 5.93 | ||||||||||||||||||||||||
Share options outstanding at 30 September 20132015 can be summarised as follows:
| Employee Options | Employee LTIP | Consultant Options | Total Options | |||||||||||||||||||||||||||||
| Range of exercise prices | Number of Share Options | Weighted Average Remaining Contractual Life/Years | Number of Share Options | Weighted Average Remaining Contractual Life/Years | Number of Share Options | Weighted Average Remaining Contractual Life/Years | Number of Share Options | Weighted Average Remaining Contractual Life/Years | ||||||||||||||||||||||||
| £0.00–£0.50 | 10,000 | 5.0 | 6,778,743 | 8.5 | 30,000 | 6.2 | 6,818,743 | 8.5 | ||||||||||||||||||||||||
| £0.51–£1.00 | 3,016,817 | 2.5 | – | – | 35,000 | 0.9 | 3,051,817 | 2.5 | ||||||||||||||||||||||||
| £1.01–£1.50 | 1,656,372 | 1.7 | – | – | 288,496 | 1.5 | 1,944,868 | 1.7 | ||||||||||||||||||||||||
| £1.51–£2.00 | 852,392 | 0.3 | – | – | 72,360 | 0.3 | 924,752 | 0.3 | ||||||||||||||||||||||||
| Outstanding at 30 September 2013 | 5,535,581 | 1.9 | 6,778,743 | 8.5 | 425,856 | 1.6 | 12,740,180 | 5.4 | ||||||||||||||||||||||||
| Exercisable at 30 September 2013 | 5,535,581 | 1.9 | 2,342,099 | 5.8 | 425,856 | 1.6 | 8,303,536 | 3.0 | ||||||||||||||||||||||||
| Employee Options | Employee LTIP | Consultant Options | Total Options | |||||||||||||||||||||||||||||
| Number of Share Options | Weighted Average Remaining Contractual Life/Years | Number of Share Options | Weighted Average Remaining Contractual Life/Years | Number of Share Options | Weighted Average Remaining Contractual Life/Years | Number of Share Options | Weighted Average Remaining Contractual Life/Years | |||||||||||||||||||||||||
| £0.00–£0.50 | 4,000 | 2.97 | 7,333,940 | 6.95 | – | – | 7,337,940 | 6.95 | ||||||||||||||||||||||||
| £0.51–£1.00 | 547,812 | 1.52 | – | – | – | – | 547,812 | 1.52 | ||||||||||||||||||||||||
| £1.01–£1.50 | 219,124 | 0.36 | – | – | – | – | 219,124 | 0.36 | ||||||||||||||||||||||||
| £1.51+ | – | – | 326,624 | 9.74 | – | – | 326,624 | 9.74 | ||||||||||||||||||||||||
| Outstanding at 30 September 2015 | 770,936 | 1.20 | 7,660,564 | 7.07 | – | – | 8,431,500 | 6.53 | ||||||||||||||||||||||||
| Exercisable at 30 September 2015 | 770,936 | 1.20 | 2,207,875 | 4.98 | – | – | 2,978,811 | 4.00 | ||||||||||||||||||||||||
Charges for share-based payments have been allocated to the research and development expenditure and managementSales, general and administrative expenses in the consolidated income statements as follows:
| 2014 £000’s | 2013 £000’s | 2012 £000’s | ||||||||||
| Research and development expenditure | 774 | 317 | 559 | |||||||||
| Management and administrative expenses | 464 | 299 | 450 | |||||||||
| 1,238 | 616 | 1,009 | ||||||||||
2016 £000s | 2015 £000s | 2014 £000s | ||||||||||
| Research and development expenditure | 4,119 | 1,525 | 775 | |||||||||
| Sales, general and administrative expenses | 4,033 | 953 | 463 | |||||||||
| 8,152 | 2,478 | 1,238 | ||||||||||
| F-34 |
In the year ended 30 September 2014,2016, options were granted on 1729 December 2015, 15 January 2014,2016, 15 February 2016, 18 March 2016, 14 April 2016, 12 May 2016, 9 May 2014, 31 May 2014, 11June 2016 and 26 August 2014, 12 August 2014 and 21 August 2014.2016. The aggregate of the estimated fair values of the options granted on those dates is £3.2£12.7 million and the weighted average fair value of the awards made during 20142016 was £3.03£2.66 per option.
In the year ended 30 September 2013,2015, options were granted on 30 November 2012,24 December 2014, 9 January 2015, 25 February 2015, 20 February 2013, 28 March 20132015, 9 April 2015, 6 May 2015, 24 June 2015 and 2422 September 2013.2015. The aggregate of the estimated fair values of the options granted on those dates is £1.5£10.6 million and the weighted average fair value of the awards made during 20132015 was £0.57£5.30 per option.
Fair values were calculated using the Black-Scholes share option pricing model for grants with non-market-based performance conditions. The Monte Carlo share option pricing model has been used for grants with market-based performance conditions. The following weighted average assumptions were used in calculating these fair values:
| 2014 | 2013 | 2012 | 2016 | 2015 | 2014 | |||||||||||||||||||
| Weighted average share price | 303 | p | 55 | p | 83 | p | 298 | p | 579 | p | 303 | p | ||||||||||||
| Weighted average exercise price | 0.1 | p | 0.1 | p | 0.1 | p | 60 | p | 109 | p | 0.1 | p | ||||||||||||
| Expected volatility | 58 | % | 44 | % | 52 | % | 58 | % | 59 | % | 58 | % | ||||||||||||
| Expected life | 5.0 years | 5.0 years | 5.0 years | 3.3 years | 3.6 years | 5.0 years | ||||||||||||||||||
| Risk-free rate | 0.5 | % | 0.5 | % | 0.5 | % | 1.09 | % | 1.32 | % | 0.5 | % | ||||||||||||
| Expected dividend yield | Nil | Nil | Nil | Nil | Nil | Nil | ||||||||||||||||||
Expected volatility was determined by calculating the historical volatility of the Group’s share price over the previous three years. The expected life used in the model has been adjusted, based on management’s best estimate, for the effects of non-transferability, exercise restrictions, performance conditions and behavioural considerations.
22. Warrants
Warrants to subscribe for ordinary shares in the Company are as shown below:24. Other Reserves
| At 1 Oct 2013 Number | Warrants Granted Number | Warrants Exercised Number | Warrants Lapsed Number | At 30 Sept 2014 Number | Date of Issue | Exercise Price | Date of Expiry | ||||||||||||||||||||||
| Warrant holder | |||||||||||||||||||||||||||||
| Great Point Partners | 1,888,480 | – | (1,888,480 | ) | – | – | 13/08/09 | 105.0 | p | 13/08/14 | |||||||||||||||||||
| Great Point Partners | 1,888,480 | – | (1,888,480 | ) | – | – | 13/08/09 | 175.0 | p | 13/08/14 | |||||||||||||||||||
| Total | 3,776,960 | – | (3,776,960 | ) | – | – | |||||||||||||||||||||||
The above warrants were issued to Great Point Partners on 13 August 2009 at a time when the mid-market price for ordinary shares of the Company was 78.0p. The warrant issue was concurrent with the issue of 7,553,920 new ordinary shares to Great Point Partners at 78.0p per share.
On 16 January 2014, Great Point Partners elected to exercise 1,888,480 warrants with an exercise price of 105.0p each. This became effective on 22 January 2014.
On 12 February 2014, Great Point Partners elected to exercise 1,888,480 warrants with an exercise price of 175.0p each. This became effective on 19 February 2014.
There are no remaining warrants in issue.
23. Other Reserves
Other reserves of £19.3£19.5 million (30 September 2013: £20.22015: £19.2 million) relate to a warrant reserve (30 September 2014: Nil; 30 September 2013: £0.9 million) and a £19.3 million merger reserve (30 September 2013:2015: £19.3 million). In the year ended 30 and a £0.2 million credit relating to exchange difference on translation of foreign operations (30 September 2014, the £0.9 million warrants reserve, as discussed in note 22, was eliminated following the exercise of all outstanding warrants.2015: debit £0.1 million). The merger reserve was created as a result of the acquisition by the Company of the entire issued share capital of GW Pharma Limited in 2001. This acquisition was effected by a share for shareshare-for-share exchange which was merger accounted under UK Generally Accepted Accounting Practice (“UK GAAP”), in accordance with the merger relief provisions of Section 131 of the Companies Act 1985 (as amended) relating to the accounting for business combinations involving the issue of shares at a premium. In preparing consolidated financial statements, the amount by which the fair value of the shares issued exceeded their nominal value was recorded in a merger reserve on consolidation, rather than in a share premium account. The merger reserve was retained upon transition to IFRSs, as allowed under UK law. This reserve is not considered to be distributable.
ESOP Reserve
The Group’s “ESOP” is an Inland Revenue approvedRevenue-approved all employee share scheme constituted under a trust deed. The trust holds shares in the Company for the benefit of and as an incentive for the employees of the Group. The trustee of the ESOP is GWP Trustee Company Limited, a wholly owned subsidiary of the Company. Costs incurred by the trust are expensed in the Group’s financial statements as incurred. Distributions from the trust are made in accordance with the scheme rules and on the recommendation of the Board of Directors of the Company.
Shares held in trust represent issued and fully paid up 0.1p ordinary shares and remain eligible to receive dividends. The shares held by the ESOP were originally acquired in 2000 for nil consideration by way of a gift from a shareholder and hence the balance on the ESOP reserve is nil (2013:(2015: nil).
As at 30 September the ESOP held the following shares:
| 2014 Number | 2013 Number | |||||||
| Unconditionally vested in employees | 207,545 | 374,408 | ||||||
| Shares available for future distribution to employees | 34,706 | 34,706 | ||||||
| Total | 242,251 | 409,114 | ||||||
2016 Number | 2015 Number | |||||||
| Unconditionally vested in employees | 90,043 | 115,352 | ||||||
| Shares available for future distribution to employees | 33,054 | 33,054 | ||||||
| Total | 123,097 | 148,406 | ||||||
The valuation methodology used to compute the share-based payment charge related to the ESOP is based on fair value at the grant date, which is determined by the application of a Black-Scholes share option pricing model. The assumptions underlying the Black-Scholes model for the ESOP shares are as detailed in note 2123 relating to the LTIP awards. The exercise price for shares granted under the ESOP is nil, and the vesting conditions include employment by the Group over thea three-year vesting period from the date of grant. The share-based payment charge for shares granted under the ESOP plan amounted to £nil in the year ended 30 September 2014 (2013:2016 (2015: £nil).
As at 30 September 20142016 the number and market value of shares held by the trust which have not yet unconditionally vested in employees is 34,706 (2013: 34,706)33,054 (2015: 33,054) and £nil (2013: £nil)£0.3 million (2015: £0.2 million) respectively.
| F-35 |
24.
25. Financial Commitments
The Group had capital commitments for property, plant and equipment contracted but not provided for at 30 September 20142016 of £5.4£5.1 million (2013: £0.1(2015: £0.7 million). Included within the commitment for the year ended 30 September 2016 is £4.0 million of property, plant and equipment associated with the commercial growing agreement explained further below.
At the balance sheet date the Group and Company had outstanding commitments for future minimum lease payments under non-cancellable operating leases, which fall due as follows:
| 2014 £000’s | 2013 £000’s | |||||||
| Within one year | 1,307 | 1,136 | ||||||
| Between two and five years | 1,609 | 2,028 | ||||||
| After five years | 1,014 | 807 | ||||||
| 3,930 | 3,971 | |||||||
In addition to the commitments disclosed in the table above, in November 2013 the Group commenced the construction, fit-out and 20 year lease of a new 10,000 square feet manufacturing facility. At present, the facility is undergoing substantial internal fit-out as a consequence of which the associated lease is yet to commence. See Note 16. The lease is expected to commence during the third quarter of the year ended September 30, 2015. Upon commencement, the annual rental charge is expected to be £366,674 per annum.
| Group | ||||||||
2016 £000s | 2015 £000s | |||||||
| Within one year | 2,723 | 1,642 | ||||||
| Between two and five years | 8,117 | 4,600 | ||||||
| After five years | 2,198 | 1,982 | ||||||
| 13,038 | 8,224 | |||||||
The minimum lease payments payable under operating leases recognised as an expense in the year were £1.3£2.4 million (2013: £1.2(2015: £1.5 million).
Operating lease payments represent rentals payable by the Group for certain of its leased properties. Manufacturing and laboratory facilities are subject to 5 to 15 year15-year leases, some of which have a lease break three years prior to the conclusion of the lease at the Group’s option. Office properties are usually leasedsubject to 1 to 10-year leases.
During the year ended 30 September 2016, the Group signed a commercial growing agreement with an external supplier to produce plant material for one year or less withuse in the exceptionEpidiolex development programmes and commercial release. This agreement commences during the second quarter of the London property, which is onyear ended 30 September 2017 and includes multiple fee-elements designed to incentivise cost efficient, reliable production volumes of raw materials for use in research, development and commercial activities.
As part of the accounting treatment for this agreement a component operating lease has been identified under the requirements of IFRIC 4Determining Whether an Arrangement Contains a Lease. Rental payments commence during the second quarter of the year ended 30 September 2017 and continue over a five-year non-cancellable period. Future minimum lease andpayments associated with this operating lease are included in the Cambridge property which is on a 10-year lease with a five-year break.table shown above.
25. Contingent LiabilitiesOther gross payments associated with this agreement, excluding operating lease rentals and capital commitments outlined above, fall due as follows
The Group may, from time to time, be involved in legal proceedings that are incidental to the Group operations. The Group is not currently involved in any legal or arbitration proceedings which may have, or have had in the 12 months preceding the date of this report, a material effect on the consolidated financial position, results of operations or liquidity of the Group.
| Group | ||||||||
2016 £000s | 2015 £000s | |||||||
| Within one year | 6,755 | – | ||||||
| Between two and five years | 36,667 | – | ||||||
| After five years | 2,248 | – | ||||||
| 45,670 | – | |||||||
26. Contingent Liabilities
As at 30 September 2016 certain fees associated with capital expenditure have been estimated. The final fees payable are to be agreed and paid once agreement is reached, which is expected during the second quarter of the year ending 30 September 2017. The Group estimates that there is a possible contingent liability for incremental fees of up to £0.4 million of capital expenditure.
27. Related Party Transactions
Remuneration of Key Management Personnel
The remuneration of the Directors, who are the key management personnel of the Group, is set out below in aggregate for each of the categories specified in IAS 24Related Party Disclosures.party disclosures.
| 2014 £000’s | 2013 £000’s | 2012 £000’s | ||||||||||
| Short-term employee benefits | 2,688 | 1,733 | 1,664 | |||||||||
| Post-employment benefits | 203 | 200 | 158 | |||||||||
| Share-based payments | 666 | 539 | 831 | |||||||||
| 3,557 | 2,472 | 2,653 | ||||||||||
2016 £000s | 2015 £000s | 2014 £000s | ||||||||||
| Short-term employee benefits | 2,523 | 2,395 | 2,688 | |||||||||
| Post-employment benefits | 215 | 211 | 203 | |||||||||
| Share-based payments | 4,556 | 1,164 | 666 | |||||||||
| 7,294 | 3,770 | 3,557 | ||||||||||
| F-36 |
Other Related Party Transactions
Group
The Group purchased various regulatory support services from Icon Clinical Research Limited and Icon Clinical Research (UK) Limited, which are part of Icon plc. Tom Lynch, a non-executive Director of the group, actsGroup, acted as Chairman for Icon plc.plc up to 29 March 2016. These services were at a cost of £12,166 (2013: £nil; 2012: £nil)£2,044 (2015: £12,762; 2014: £12,166). As at 30 September 20142016 there was £2,799£nil due (2013: £nil)in relation to these amounts (2015: £nil; 2014: £2,799).
The Group paid £3,441 (2013: £nil; 2012: £nil)£138 (2015: £263; 2014: £3,441) under a consultancy agreement for medical writing services to Kathryn Wright, wife of the Group's Research and Development DirectorGroup’s Chief Medical Officer Stephen Wright. The fees paid were in line with fees paid to other GW medical writers. As at 30 September 20142016 there was no amount due to Kathryn Wright (2013:(2015 and 2014: £nil).
27. Investments
PrincipalThe Group Investments
The Company has investmentspaid £47 (2015 and 2014: £nil) to Adaptimmune Ltd in relation to travel expenses incurred by James Noble, a non-executive Director of the following significant subsidiary undertakings:Group, who also acts as Chief Executive Officer for Adaptimmune Ltd. As at 30 September 2016 there was no amount due to Adaptimmune Ltd (2015 and 2014: £nil).
All fees outlined above were paid on an arms-length basis and were carried out in accordance with the subsidiary undertakings are includedGroup’s policy regarding related party transactions.
As part of the consideration of the vesting of the September 2013 LTIP award, the Remuneration Committee has agreed to indemnify Justin Gover for the incremental US taxation that he is likely to suffer on the gain arising from these LTIP options as a result of having relocated to the US at the Company’s request during the vesting period for this award. As at 30 September 2016 this liability is estimated as $1.2 million, and is expected to payable when the option gain is crystallised by sale of the resulting shares, expected in the consolidated accounts.late 2016/early 2017.
| F-37 |