As filed with the Securities and Exchange Commission on April 28, 2015May 30, 2017
UNITED STATES
SECURITIES AND EXCHANGE COMMISSION
Washington, D.C. 20549
FORM 20-F
ANNUAL REPORT PURSUANT TO
SECTION 13 OR 15(d) OF
THE SECURITIES EXCHANGE ACT OF 1934
For the fiscal year ended December 31, 20142016
Commission file number: 001-34175
ECOPETROL S.A.
(Exact name of Registrant as specified in its charter)
N/A
(Translation of Registrant’s name into English)
REPUBLIC OF COLOMBIA
(Jurisdiction of incorporation or organization)
Carrera 13 No. 36 – 24
BOGOTA – COLOMBIA
(Address of principal executive offices)
Tel. (571) 234 4000
Claudia Trujillo
Andrés Felipe Sánchez
Investor Relations Officer
investors@ecopetrol.com.co
Tel. (571) 234 5190
Carrera 13 N.36-24 Piso 75
Bogota, Colombia
(Name, Telephone, E-Mail and/or Facsimile number and Address of Company Contact Person)
Securities registered or to be registered pursuant to Section 12(b) of the Act.
| Title of each class | Name of each exchange on which registered: | |
| American Depository Shares (as evidenced by American Depository Receipts), each representing 20 common shares par value | New York Stock Exchange | |
| Ecopetrol common shares par value | New York Stock Exchange (for listing purposes only) | |
| 7.625% Notes due 2019 | New York Stock Exchange | |
| 4.250% Notes due 2018 | New York Stock Exchange | |
| 5.875% Notes due 2023 | New York Stock Exchange |
| Title of each class | Name of each exchange on which registered: | |
| 4.125% Notes due 2025 | New York Stock Exchange | |
| 5.375% Notes due 2026 | New York Stock Exchange | |
| 7.375% Notes due 2043 | New York Stock Exchange | |
| 5.875% Notes due 2045 | New York Stock Exchange | |
Securities registered or to be registered pursuant to Section 12(g) of the Act: None
Securities for which there is a reporting obligation pursuant to Section 15(d) of the Act: None
Indicate the number of outstanding shares of each of the issuer’s classes of capital or common stock as of the close of the period covered by the annual report.
41,116,698,45641,116,694,690 Ecopetrol common shares, par value Ps$250COP$609 per share
Indicate by check mark if the registrant is a well-known seasoned issuer, as defined in Rule 405 of the Securities Act.
x Yes¨ No
If this report is an annual or transition report, indicate by check mark if the registrant is not required to file reports pursuant to Section 13 or 15(d) of the Securities Exchange Act of 1934.
¨ Yesx No
Indicate by check mark whether the registrant (1) has filed all reports required to be filed by Section 13 or 15(d) of the Securities Exchange Act of 1934 during the preceding 12 months (or for such shorter period that the registrant was required to file such reports), and (2) has been subject to such filing requirements for the past 90 days.
x Yes¨ No
Indicate by check mark whether the registrant has submitted electronically and posted on its corporate Web site, if any, every Interactive Data File required to be submitted and posted pursuant to Rule 405 of Regulation S-T (§232.405 of this chapter) during the preceding 12 months (or for such shorter period that the registrant was required to submit and post such files).
N/A
Indicate by check mark whether the registrant is a large accelerated filer, an accelerated filer, or a non-accelerated filer. See definition of “accelerated filer and large accelerated filer” in Rule 12b-2 of the Exchange Act. (Check one):
| Large accelerated filerx | Accelerated filer¨ | Non-accelerated filer¨ | Emerging growth company¨ |
��
If an emerging growth company that prepares its financial statements in accordance with U.S. GAAP, indicate by check mark if the registrant has elected not to use the extended transition period for complying with any new or revised financial accounting standards† provided pursuant to Section 13(a) of the Exchange Act. ☐
† The term “new or revised financial accounting standard” refers to any update issued by the Financial Accounting Standards Board to its Accounting Standards Codification after April 5, 2012.
Indicate by check mark which basis of accounting the registrant has used to prepare the financial statements included in this filing:
| ¨ U.S. GAAP | xInternational Financial Reporting Standards as issued by the International Accounting Standards Board |
If “Other” has been checked in response to the previous question, indicate by check mark which financial statement item the registrant has elected to follow:
¨ Item 17x¨ Item 18
If this is an annual report, indicate by check mark whether the registrant is a shell company (as
(as defined in Rule 12b-2 of the Exchange Act).
¨ Yesx No
Annual Report on Form 20-F 20142016
| 6.5.1 | Colombian Tax Considerations | 131 | ||
| 6.5.2 | U.S. Federal Income Tax Consequences | 134 | ||
| 6.6. | Exchange Controls and Limitations | 137 | ||
| 6.7. | Exchange Rates | 138 | ||
| 6.8. | Major Shareholders | 139 | ||
| 6.9. | Enforcement of Civil Liabilities | 139 | ||
| 7. | Corporate Governance | 140 | ||
| 7.1. | Bylaws | 141 | ||
| 7.2. | Code of Ethics | 145 | ||
| 7.3. | Board of Directors | 145 | ||
| 7.3.1 | Board Practices | 147 | ||
| 7.3.2 | Board Committees | 148 | ||
| 7.4. | Compliance with NYSE Listing Rules | 150 | ||
| 7.5. | Management | 152 | ||
| 7.6. | Compensation of Directors and Management | 155 | ||
| 7.7. | Share Ownership of Directors and Executive Officers | 155 | ||
| 7.8. | Controls and Procedures | 155 | ||
| 8. | Financial Statements | 159 | ||
| 9. | Signature Page | 160 | ||
| 10. | Exhibits | 161 | ||
| 11. | Cross-reference to Form 20-F | 162 | ||
| 1. | Introduction | 1 | ||||
| 1.1 | About This Report | 1 | ||||
| 1.2 | Forward-looking Statements | 1 | ||||
| 1.3 | Selected Financial and Operating Data | 2 | ||||
| 2. | Strategy and Market Overview | 4 | ||||
| 2.1 | Our Corporate Strategy | 5 | ||||
| 3. | Business Overview | 6 | ||||
| 3.1 | Our History | 6 | ||||
| 3.2 | Our Corporate Structure | 7 | ||||
| 3.3 | Our Business | 9 | ||||
| 3.4 | Exploration and Production | 9 | ||||
| 3.4.1 | Exploration Activities | 9 | ||||
| 3.4.1.1 | Exploration Activities in Colombia | 9 | ||||
| 3.4.1.2 | Exploration Activities Outside of Colombia | 12 | ||||
| 3.4.2 | Production Activities | 13 | ||||
| 3.4.2.1 | Production Activities in Colombia | 14 | ||||
| 3.4.2.1.1. | Ecopetrol S.A.’s Production Activities in Colombia | 14 | ||||
| 3.4.2.1.2. | Ecopetrol S.A.’s Affiliates and Subsidiaries’ Production Activities in Colombia | 19 | ||||
| 3.4.2.2 | Production Activities Outside Colombia | 22 | ||||
| 3.4.2.3 | Marketing of Crude Oil, Natural Gas and Refined Products | 23 | ||||
| 3.4.3 | Reserves | 25 | ||||
| 3.4.4 | Joint Venture and Other Contractual Arrangements | 30 | ||||
| 3.5 | Transportation and Logistics | 34 | ||||
| 3.5.1.1 | Transportation Activities | 34 | ||||
| 3.5.1.2 | Pipelines | 37 | ||||
| 3.5.1.3 | Export and Import Facilities | 39 | ||||
| 3.5.2 | Other Transportation Facilities | 39 | ||||
iii
iv
v
vi
| 6.6 | Exchange Controls and Limitations | 130 | ||
| 6.7 | Exchange Rates | 131 | ||
| 6.8 | Major Shareholders | 132 | ||
| 6.9 | Enforcement of Civil Liabilities | 132 | ||
| 7. | Corporate Governance | 134 | ||
| 7.1 | Bylaws | 134 | ||
| 7.2 | Code of Ethics | 137 | ||
| 7.3 | Board of Directors | 138 | ||
| 7.3.1 | Board Practices | 140 | ||
| 7.3.2 | Board Committees | 141 | ||
| 7.4 | Compliance with NYSE Listing Rules | 142 | ||
| 7.5 | Management | 143 | ||
| 7.6 | Compensation of Directors and Management | 147 | ||
| 7.7 | Share Ownership of Directors and Executive Officers | 147 | ||
| 7.8 | Controls and Procedures | 147 | ||
| 8. | Financial Statements | 151 | ||
| 9. | Signature Page | 152 | ||
| 10. | Exhibits | 153 | ||
| 11. | Cross-reference to Form 20-F | 154 | ||
vii
| 1. | Introduction |
| About This Report |
We file our Annual Report on Form 20-F and other information with the U.S. Securities and Exchange Commission.
We file reports, including annual reports on Form 20-F, and other information with the SEC pursuant to the rules and regulations of the SEC that apply to foreign private issuers. You may read and copy any materials filed with the SEC in the SEC’s public reference room at 100 F Street, NE, Washington, D.C. 20549. Please call the SEC at 1-800-SEC-0330 for further information on the operation of the public reference room. Any filings we make are also available to the public over the Internet at the SEC’s website at www.sec.gov and at our website at www.ecopetrol.com.co. (This URL is intended to be an inactive textual reference only. It is not intended to be an active hyperlink to our website. The information on our website, which might be accessible through a hyperlink resulting from this URL, is not and shall not be deemed to be incorporated into this annual report.)
Unless the context otherwise requires, the terms “Ecopetrol,” “we,” “us,”“Ecopetrol”, “we”, “us”, “our” or the “Company” are used in this annual report to refer to Ecopetrol S.A. and its subsidiaries on a consolidated basis.
References to the Nation in this annual report relate to the Republic of Colombia (“Colombia”), our controlling shareholder. References made to the Government of ColombiaColombian government or the Government correspond to the executive branch including the President of Colombia, the ministries and other governmental agencies responsible for regulating our business.
| Forward-looking Statements |
This annual report on Form 20-F contains forward-looking statements within the meaning of the safe harbor provisions of the U.S. Private Securities Litigation Reform Act of 1995. These statements are not based on historical facts and reflect our expectations for future events and results. Most facts are uncertain because of their nature. Words such as “anticipate,” “believe,” “could,” “estimate,” “expect,” “should,” “plan,” “potential,” “predicts,” “prognosticate,” “project,” “target,”“anticipate”, “believe”, “could”, “estimate”, “expect”, “should”, “plan”, “potential”, “predicts”, “prognosticate”, “project”, “target”, “achieve” and “intend,”“intend”, among other similar expressions, are understood as forward-looking statements. We have made forward-looking statements that address, among other things:
| · | our exploration and production activities, including drilling; |
| · | import and export activities; |
| · | our liquidity, cash flow, and sources of funding; |
| · | our projected and targeted capital expenditures and other cost commitments and revenues; and |
| · | dates by which certain areas will be developed or will come on-stream. |
Our forward-looking statements are not guarantees of future performance and are subject to assumptions that may prove incorrect and to risks and uncertainties that are difficult to predict. Actual results could differ materially from those expressed or forecast in any forward-looking statements as a result of a variety of factors. These factors may include, but are not limited to, the following:
| · | general economic and business conditions, including crude oil and other commodity prices, refining margins and prevailing exchange rates; |
| · | competition; |
| · | our ability to obtain financing; |
| · | our ability to find, acquire or gain access to additional reserves and our ability to develop existing reserves; |
| 1 |
| · | uncertainties inherent in making estimates of our reserves; |
| · | significant political, economic and social developments in Colombia and other countries where we do business; |
| · | natural disasters, military operations, terrorist acts, wars or embargoes; |
| · | regulatory developments, including regulations related to climate change; |
| · | receipt of government approvals and licenses; |
| · | technical difficulties; and |
| · | other factors discussed in Section 5.1 of this document as “Risk Factors.” |
All forward-looking statements attributed to us are qualified in their entirety by this cautionary statement. We undertake no obligation to publicly update or revise any forward-looking statements, whether as a result of new information or for any other reason. Accordingly, readers should not place undue reliance on the forward-looking statements contained in this annual report.
| Selected Financial and Operating Data |
The following table sets forth, for the periods and at the dates indicated, our selected historical financial and certain key operating data. The selected financial data has been derived from and should be read in conjunction with, and is qualified in its entirety by reference to, our consolidated audited financial statements, presented in Colombian Pesos. PricewaterhouseCoopers Ltda. audited our consolidated financial statements for the years ended December 31, 2014 and 2013. KPMG Ltda. audited our consolidated financial statements for the years ended December 31, 2012 and 2011. PricewaterhouseCoopers Ltda. also audited our consolidated financial statements for the year ended December 31, 2010.
Table 1 – Selected Operating Data
| 2014 | 2013 | 2012 | 2011 | 2010 | ||||||||||||||||
| Operating Information | ||||||||||||||||||||
| Oil and gas production (mboed) | 755.4 | 788.2 | 754.0 | 724.1 | 615.8 | |||||||||||||||
| Proved oil and gas reserves (Mmboe) (1) | 2,084 | 1,972 | 1,877 | 1,857 | 1,714 | |||||||||||||||
| Exploratory Wells(2) | 28 | 22 | 23 | 39 | 28 | |||||||||||||||
| Refinery Through-put (bpd)(3) | 240,484 | 283,362 | 296,340 | 305,631 | 296,044 | |||||||||||||||
| 1P Reserves replacement ratio | 146 | % | 139 | % | 108 | % | 164 | % | 193 | % | ||||||||||
| Financial Information | ||||||||||||||||||||
| COLOMBIAN GAAP | ||||||||||||||||||||
| (Expressed in millions of Colombian pesos, except for the net income per share and net operating income per share, which is expressed in Colombian pesos) | ||||||||||||||||||||
| Total revenue | 68,925,338 | 70,428,715 | 68,852,002 | 65,967,514 | 42,089,745 | |||||||||||||||
| Operating profit | 16,601,989 | 21,834,729 | 23,342,904 | 25,044,016 | 12,747,448 | |||||||||||||||
| Net income | 7,510,270 | 13,106,503 | 14,778,947 | 15,452,334 | 8,146,471 | |||||||||||||||
| Net operating income per share | 404 | 531 | 568 | 616 | 315 | |||||||||||||||
| Weighted average number of shares outstanding(4) | 41,116,698,456 | 41,116,698,456 | 41,116,698,456 | 40,634,882,725 | 40,472,512,588 | |||||||||||||||
| Net income per share(5) | 183 | 319 | 359 | 380 | 201 | |||||||||||||||
| Total assets | 142,181,291 | 132,427,994 | 113,879,578 | 92,277,386 | 68,769,356 | |||||||||||||||
| Shareholders’ Equity | 68,545,972 | 71,119,203 | 64,740,881 | 54,688,855 | 41,328,181 | |||||||||||||||
| Subscribed capital | 10,279,175 | 10,279,175 | 10,279,175 | 10,279,175 | 10,118,128 | |||||||||||||||
| Number of common shares(6) | 41,116,698,456 | 41,116,698,456 | 41,116,698,456 | 41,116,698,456 | 40,472,512,588 | |||||||||||||||
| Dividends declared per share | 133 | 260 | 300 | 145 | 91 | |||||||||||||||
| Total Liabilities | 69,439,384 | 56,735,043 | 46,536,530 | 35,335,900 | 26,955,224 | |||||||||||||||
| U.S. GAAP | ||||||||||||||||||||
| (Expressed in millions of Colombian pesos, except net income per share and net operating income per share, which is expressed in Colombian pesos) | ||||||||||||||||||||
| Total revenue | 66,117,500 | 68,432,645 | 66,867,137 | 62,715,815 | 40,879,324 | |||||||||||||||
| Operating profit | 16,461,798 | 23,319,936 | 23,556,963 | 23,673,787 | 13,878,515 | |||||||||||||||
| Net income attributable to Ecopetrol | 6,819,550 | 13,946,855 | 14,695,649 | 14,817,207 | 8,211,035 | |||||||||||||||
| Net operating income per share | 400 | 567 | 573 | 583 | 343 | |||||||||||||||
| Weighted average number of shares outstanding(4) | 41,116,698,456 | 41,116,698,456 | 41,116,698,456 | 40,634,882,725 | 40,472,512,588 | |||||||||||||||
| Net income per share | 166 | 339 | 357 | 365 | 203 | |||||||||||||||
| Total Assets | 102,310,815 | 91,687,916 | 81,519,332 | 70,909,079 | 52,332,148 | |||||||||||||||
| Shareholders’ Equity | 42,072,910 | 41,875,226 | 37,648,352 | 36,055,173 | 27,175,285 | |||||||||||||||
| Number of common shares(6) | 41,116,698,456 | 41,116,698,456 | 41,116,698,456 | 41,116,698,456 | 40,472,512,588 | |||||||||||||||
| Dividends declared per share | 133 | 260 | 300 | 145 | �� | 91 | ||||||||||||||
| Total Liabilities | 57,589,537 | 46,997,359 | 41,436,532 | 32,565,787 | 24,847,512 | |||||||||||||||
| Operating Information | 2016 | 2015 | 2014 | 2013 | 2012 | |||||||||||||||
| Oil and gas production (mboed) | 717.9 | 760.7 | 755.4 | 788.2 | 754.0 | |||||||||||||||
| Proved oil and gas reserves (Mmboe)(1) | 1,598 | 1,849 | 2,084 | 1,972 | 1,877 | |||||||||||||||
| Exploratory Wells(2) | 6 | 5 | 28 | 22 | 23 | |||||||||||||||
| Refinery Through-put (bpd)(3) | 332,751 | 234,861 | 240,484 | 283,362 | 296,340 | |||||||||||||||
| 1P Reserves replacement ratio | (7 | %) | 6 | % | 146 | % | 139 | % | 108 | % | ||||||||||
| (1) | For 2016, 2015 and 2014, proved reserves |
| (2) | Gross exploratory wells. |
| (3) | Refinery through-put includes Barrancabermeja, Reficar, Apiay and Orito. |
Financial Information
International Financial Reporting Standards (“IFRS”)
(Expressed in millions of Colombian Pesos, except for the net income per share and net operating income per share, which are expressed in Colombian Pesos)
Table 2 – Selected Financial Data
| Financial Information | 2016 | 2015 | ||||||
| Revenue | 48,485,561 | 52,347,271 | ||||||
| Operating income | 8,904,548 | 2,131,165 | ||||||
| Net income (loss) attributable to Ecopetrol’s shareholders | 2,447,881 | (7,193,859 | ) | |||||
| Net operating income per share | 217 | 52 | ||||||
| Weighted average number of shares outstanding | 41,116,694,690 | 41,116,694,690 | ||||||
| Earnings(loss) per share (basic and diluted) | 59.5 | (175.0 | ) | |||||
| Total assets | 120,437,924 | 123,588,190 | ||||||
| Financial Information | 2016 | 2015 | ||||||
| Total equity | 43,560,501 | 43,100,963 | ||||||
| Subscribed and paid-in capital | 25,040,067 | 25,040,068 | ||||||
| Number of common shares | 41,116,694,690 | 41,116,694,690 | ||||||
| Dividends declared per share | 23 | - | ||||||
| Total liabilities | 76,877,423 | 80,487,227 | ||||||
Our consolidated financial statements have beenfor the years ended December 31, 2014, 2015 and 2016 were prepared under the Public Accounting Regime (Régimen de Contabilidad Pública), or RCP,in accordance with IFRS as adoptedissued by IASB. References in this annual report to IFRS mean IFRS as issued by the Colombian National Accounting Office (Contaduría General de la Nación), or CGN in September, 2007 and applicableIASB. Our date of transition to Ecopetrol beginning withIFRS was January 1, 2014. Our consolidated financial statements for the fiscal year ended December 31, 2008. See Note 1—Economic Entity2015 were our first set of consolidated financial statements prepared in accordance with IFRS.
IFRS differs in certain significant aspects from the current reporting standards as in effect in Colombia (“Colombian IFRS”)), which is the accounting standard we use for local reporting purposes. As a result, our financial information presented under IFRS is not directly comparable to our financial information presented under Colombian IFRS. For a description of the differences between Colombian IFRS and Principal AccountingIFRS see sectionFinancial Review—Summary of Differences between Internal Reporting Policies and PracticesIFRS,.
Our consolidated financial statements were consolidated line by line and all transactions and balances between subsidiaries have been eliminated. These financial statements include the financial results of all subsidiary companies controlled, directly or indirectly, by Ecopetrol S.A. See Exhibit 1 – Consolidated companies, associates and joint ventures, to theour consolidated financial statements included in this Annual Report.annual report.
As indicated in paragraphs 9 and 18 of the International Accounting Standard 27 “Consolidated and Separated Financial Statements” we must present our financial information on a consolidated basis as if we were a single entity, combining the financial statements of Ecopetrol S.A. and its subsidiaries line by line, adding assets, liabilities, shareholder’s equity, revenues and expenses of similar nature, removing the reciprocal items among members of the Ecopetrol Group and recognizing non-controlling interest. We referpresent our operating information on a consolidated basis.
The regulations of the SEC do not require foreign private issuers that prepare their financial statements on the basis of IFRS to RCP as Colombian Government Entityreconcile such financial statements to U.S. GAAP. Accordingly, while we have in the past reconciled our consolidated financial statements prepared in accordance with Colombian Government Entity GAAP differsto U.S. GAAP, those reconciliations are no longer presented in certain significant respects from generally accepted accounting principles inour filings before the United States, orSEC. We do continue to provide the disclosure required under the U.S. GAAP. Note 33Financial Accounting Standards Board (FASB) Accounting Standards Codification (ASC) Topic 932 “Extractive Activities—Oil and Gas” (which we refer to the consolidated financial statements included inas ASC Topic 932), as this Annual Report provides a descriptionis required regardless of the principal differences betweenbasis of accounting on which we prepare our financial statements. Other than as required under ASC Topic 932, any references to accounting treatments under Colombian Government Entity GAAP andor U.S. GAAP as they relate solely to the application of Colombian Government Entity GAAP or U.S. GAAP to our auditedhistorical consolidated financial statements and provides a reconciliation of net income and shareholders’ equity for the years and as of the dates indicated therein. As a state-owned company, our consolidated financial statements are periodically reviewed by the CGN. However, the review of our accounts by the CGN does not constitute an audit.statements.
In this annual report, references to “US$” or “U.S. dollars” are to United States dollars and references to “Ps$“COP$,” “Peso”“Colombian Peso” or “Pesos”“Colombian Pesos” are to Colombian Pesos, the Ecopetrol Group’s functional and presentation currency under which we prepare our consolidated financial statements. This annual report translates certain Colombian Peso amounts into U.S. dollars at specified rates solely for the convenience of the reader. Unless otherwise indicated, such Colombian Peso amounts have been translated at the rate of Ps$2,392.46COP$3,053.42 per US$1.00, which corresponds to theTasa Representativa Promedio del Mercado(TRM), or Average Representative Market Exchange Rate, for December 31, 2014.2016. Such conversion should not be construed as a representation that the Colombian Peso amounts correspond to, or have been or could be converted into, U.S. dollars at that rate or any other rate. On April 28, 2015,May 26, 2017, the Representative Market Exchange Rate was Ps$2,419.81COP$2,911.66 per US$1.00.
Certain figures shown in this annual report have been subject to rounding adjustments and, accordingly, certain totals may therefore not precisely equal the sum of the numbers presented. In this annual report a billion is equal to one with nine zeros.
| 3 |
| 2. | Strategy and Market Overview |
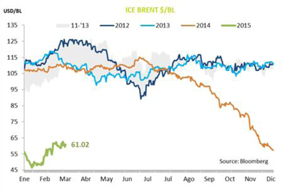
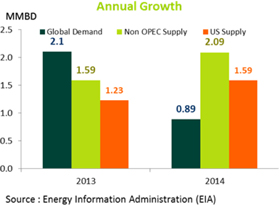
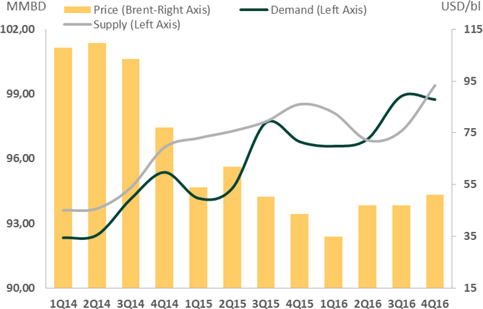
In the second half of 2014, internationalDue to market imbalances, there was a sharp contraction in crude oil benchmarkprice, particularly in the first quarter of 2016. As demand proved to sustain itself while producers implemented previously announced capital expenditure reduction decisions that encompassed the adjustments necessary under the new price environment, the market began its path towards tighter balances (see Graph 1 – Supply/Demand vs ICE Brent price evolution). Although oil prices declined dramatically. From its peak in June 2014,have recovered from the Brent monthly contract price fell by more than 50% by year-end, directly impactinglowest prices during the revenueoil crisis, high levels of oil producing companies. It is believed that the main reason behind the drop in prices is an imbalance between global supply and demand. According to some estimates, 2014 global oil demand growth was 1,500 mboepduncertainty persist indicating a less than supply growth. Non-OPEC supply grew 2,090 mboepdsmooth recovery. Nonetheless, the change in 2014 with mostOPEC’s stance, announced at the end of September 2016 and later ratified in early December 2016, towards coordinated production cuts provided a lift that allowed the growth coming fromICE Brent price to end the United States (+1,590 mboepd). Thanks to the shale revolution, for the past three years, the United States has been the world’s fastest-growing hydrocarbon producer. U.S. crude oil production rose by 40% over that period, while natural gas production has grown by 29% since 2008, transforming this country into the main supplier of natural gas and the third largest supplier of crude oil worldwide. On the other hand, global demand grew 0.890 mboepd, mainly due to weak global economic growth of the Euro zone and Japan, along with lower expectations for China´s growth.year above US$55 per barrel.
| |
Graph 1 – Supply/Demand Balance vs ICE Brent Price Evolution
Source: Energy Information Administration (EIA), “Annual Energy Outlook”.
PIRA Energy Group, “WorldWorld Oil Market Forecast”
Forecast (February 28, 2017)
Those imbalances caused a significant rise in global oil inventories during the first half of 2014, from 739 to 776 million barrels. As of December 31, 2014 global inventories were an estimated 770 million barrels, and since then they have increased further to 858 million barrels as of March 31, 2015. Historically such an excess of supply would have been offset through a cut in production from OPEC states. Nevertheless, OPEC members at their November 27, 2014 meeting decided to maintain their production levels. Given the fact that both the supply and demand of oil are relatively inelastic, particularly in the short term, Ecopetrol believes it will take some time for end consumers to see a reduction in gasoline prices significant enough to stimulate demand and for higher-cost production to decrease in reaction to lower crude prices. Thus, overall business sentiment points to an environment of short term weakness in crude oil prices.
Although international oil prices and global demand and supply dynamics are significant factors affecting our business and financial condition, Colombia’s local economic dynamics in Colombiafactors have also influenced and could continue to influence our performance given that we conduct substantially allmost of our business in Colombia. In 2014
The performance of Colombia’s gross domestic product (GDP) is one of the main drivers of fuel consumption in Colombia. According to the National Administrative Department of Statistics (DANE for its acronym in Spanish), during 2016 Colombia’s GDP grew by 4.6%,2% in real terms, as compared to 4.9%2015. The industries with the greatest growth rates were financial institutions, insurance, real estate and business services, construction and manufacturing. On the other hand, the industry with the largest drop in 2013, driven mainly by the performancegrowth was mining. Local sales of the construction, services and financial sectors. This economic performance resulted in higher local demand for liquid fuels which(diesel, gasoline, jet fuel and LPG) increased by 3.5%.2% mainly due to the increase in sales of gasoline. Gasoline domestic sales were more competitive than its substitutes due to its price decrease and fewer than expected conversions to natural gas for vehicles (NGV) in Colombia.
Recently,In 2016, there were no major changes in natural gas regulation. With respect to natural gas supply, in November 2016, a new regasification plant located in Cartagena became available, meaning that Colombia is now connected to the Colombian Government reduced its forecasted economic growthinternational LNG market and LNG prices will be a reference for 2015 from 4%-4.5% to 3.5%-4%, reflecting the impact of lower commodity prices, especially crude oilnational gas prices. Growth in 2015 is expected to be driven by the building construction and infrastructure sectors, mainly as a result of two ongoing programs: 4G (Cuarta Generacion) highway concessions, an ambitious program to build and operate under concession contracts more than 8,000 km of roads and 159 tunnels, and Mi Casa, a housing subsidy program aimed at Colombia’s low-income population that seeks to deliver 100,000 new houses at no cost plus other initiatives based on a reduction of the mortgage interest rate and direct subsidies.
| 4 |
Despite these positive events, Colombia’s economy faces significant challenges as a result of the lower crude oil lower prices, given that the country is a net oil exporter, and the slow recovery of its main business and trading partners. These factors have resulted in an increased current account deficit in Colombia and placed pressure on the exchange rate of the Colombian Peso against the U.S. dollar.
| Our Corporate Strategy |
The low oil price environment present at the end of 2015 and the beginning of 2016 led to a revision of our business plan 2015-2020, originally launched in May 2015, with a price scenario of US$80 per barrel. Our new 2017-2020 business plan is focused on value generation, profitability and financial sustainability under a price scenario of US$50 per barrel, and allows for considerable upsides in case of potential price increases. For example, if prices were to increase to an average price of US$70 per barrel, production by 2020 could reach 830 thousand barrels equivalent per day, or 16% over the current production.
The three pillars of the plan are: (i) cash flow focus and cost efficiency, (ii) strict capital discipline and (iii) profitable reserves and production growth.
Cash flow focus and cost efficiency: In 2015, we launched the 2015-2020 Transformation Program (the “Transformation Program”) with a goal of increasing our efficiency and decreasing cost. The Transformation Program has allowed us to decrease structural costs by US$1.5 billion compared to 2014. Such reduction has been accomplished due to the implementation of initiatives through our different business segments and corporate areas. The new business plan entails a second phase of the Transformation Program, with activities aimed to achieve excellence in project planning and execution as well as in our production, transportation, refining and marketing operations.
Capital discipline: We have preserved a rigorous level of capital discipline through the adjustment of investments and the adoption of strict controls to ensure that projects are delivered efficiently and within the expected time frame and budget. The plan calls for investments of approximately US$13 billion between 2017 and 2020. By 2020, approximately 90% of this investment will be allocated to the development of exploration and production projects, while investments in transportation and refining will seek to improve operational integrity and reliability.
As part of capital discipline, Ecopetrol is currently engaged in the approval phasedivestment of its strategy fornon-strategic assets and the period 2015-2030. This new strategy aims at generating sustainable value for Ecopetrol, reaffirming the Group’s strength aftersale of minor fields, and has also defined a decade of consistent growth that led Ecopetrol to consolidate its positiondividend policy as the largest Colombian company and one of the 35 largest oil companiesdescribed in the world.Section 6.2 Dividend Policy.
Ecopetrol has launchedProfitable growth in production and exploration: One of the pillars of the revised business plan is the view that a strong production portfolio and a greater exploratory success will bring about profitable growth. Under a price scenario of US$50 per barrel, production should average 760 thousand barrels of oil equivalent per day by 2020, an ambitious corporate transformation program in response to recent business dynamics and changesapproximately 6% growth from 2016. Approximately 94% of this production will come from the current producing assets.
In exploration, the plan estimates the incorporation of approximately 1,000 million barrels of contingent resources. In respect of adding reserves, we highlight the results of the exploratory campaigns in the global energy market, with two main objectives: (i) streamline processesColombian Caribbean offshore and improve the efficiencyGulf of the company to protect its financial and operational strength, and (ii) strengthen the capacities of Ecopetrol, to ensure a path for creating sustainable valueMexico in the medium and long term. In January 2015,United States. During the corporate transformation program was structured around eight key topics: Efficiency, Exploration, Recovery Factor, Culture and Leadership, Community Relationship, Projects, Technology and Capital Discipline.
Efficiency is the first axisperiod 2017 – 2020, Ecopetrol expects to add 600 million barrels of the transformation program. Ecopetrol is determined to achieve cumulative structural savings through the implementation of best practices in processes and focus on high-value activities. In addition, the program includes a thorough review of the project execution area and a more dynamic investment portfolio management, with the aim of optimizing capital allocation and ensuring that projects meet their budgets in terms of costs, time and profitability.
Strengthening the capacities of the company is also a key objective of the transformation program. For this reason, Ecopetrol is already structuring a comprehensive program for the improvement of its oil recovery factor, which will maximize cash generationproven reserves from current productive fields. In addition, Ecopetrol will reinforce its technical capabilities in explorationfields and will launch a capacity-building technology program, fundamental to the creation of sustainable value in the oil and gas industry. Finally, the transformation program aims at designing a new model for successfully relating Ecopetrol with its environment, and includes actions intended to reinforce the corporate culture of Ecopetrol and enhance its human talent and leadership.
This transformation program is the first piece of a new strategy for Ecopetrol for the period 2015-2030, which will be presented in detail once approved definitively by the Boardexploration.
Consistent with the new corporate strategybusiness plan update, in November 2016, the long term, and after a thorough reviewboard of the project portfolio to prioritize investments that maximize shareholder value, the directors of Ecopetrol (“Board of Directors of EcopetrolDirectors”) approved a $7.860US$3.5 billion investment plan for the year 2015.2017. The plan aims at achievingEcopetrol Group will continue to produce an annual average production of 760about 715 thousand barrels of oil and gas equivalent per day during 2017. This production level lays the foundation for the corporate group, of which 710 thousand correspond to Ecopetrol S.A.Ecopetrol’s expected increase in production by 2020.
OutMost of the total $7.86 billioninvestment will be in exploration and production. In refining, petrochemicals and biofuels, and transportation and logistics, investments will be made to comply with integrity and operational requirements as well as project completion. The table below sets forth the details of the investment plan approved for the Corporate group, $4.11 billion will be invested directly by Ecopetrol S.A. and $3.75 billion by subsidiaries, including $1.93 billion to be contributed by Ecopetrol S.A to its subsidiaries. Out of these investments, 92% will be held in Colombia and the remaining 8% abroad through subsidiaries. The highest percentage of resources will be directed toward production, the culmination of the modernization of the Cartagena refinery and the strengthening of the transportation capacity. The detail of the investments approved per segment is as follows:business segment.
Table 3 – 2017 Investment Plan
| Business Segment | Millions of US$(1) | % Percentage | ||||||
| Exploration | 650 | 18.6 | % | |||||
| Production | 2,200 | 62.9 | % | |||||
| Transportation and Logistics | 265 | 7.6 | % | |||||
| Refining, Petrochemicals, and Biofuels | 360 | 10.3 | % | |||||
| Others | 25 | 0.6 | % | |||||
| TOTAL | 3,500 | 100 | % | |||||
| (1) | Rounded figures. |
The resources requiredExploration
In the exploration segment, US$650 million will be allocated mainly to the evaluation and appraisal of discoveries and ongoing exploration efforts of Ecopetrol S.A. (approximately US$460 million), Hocol S.A. (“Hocol”) (approximately US$114 million), Ecopetrol America Inc. (approximately US$11 million), Ecopetrol Costa Afuera (approximately US$44 million) and Ecopetrol Brazil (approximately US$21 million).
Production
In the production segment, US$1,977 million will be allocated mainly to the execution of development and incremental production projects in the Castilla, Rubiales, Yarigui-Cantagallo, La Cira - Infantas, Tibú, Piedemonte, Chichimene, Quifa, Provincia and Cusiana-Cupiagua fields (approximately US$1,147 million). We have also allocated funds for our affiliates and subsidiaries as follows: US$64 million for the investmentoperation and maintenance of fields of Ecopetrol America Inc. in the U.S. Gulf of Mexico, US$88 million to Hocol, US$63 million to Equion and US$8 million to Savia.
Transportation and logistics
In the transportation and logistics segment, US$138 million will be allocated to investments focused on the completion of projects such as San Fernando-Monterrey and transportation of heavy crude oils as well as crude oil dilution projects. The segment is seeking a higher efficiency in operations and maintenance practices.
Refining, petrochemicals, and biofuels
In the refining, petrochemicals, and biofuels segment, US$105 million will be allocated to Reficar, US$150 million to programs to improve operations at the Barrancabermeja Refinery through initiatives aimed to increase revenues, improve efficiency and reduce operational costs and US$82 million to Bioenergy. The segment is seeking a higher efficiency in operations and maintenance practices. It is important to highlight that the Barrancabermeja Refinery modernization plan will come from internal cash generation, divestmentscontinue to be delayed until the oil price environment allows investments to be made in non-strategic assetssuch a major project. The mode of execution will be defined in this context, after analyzing alternatives which include a modular option in time and financing, consistent with preserving business and financial metrics that will ensure maintenance of Ecopetrol’s investment grade credit rating.investment.
| 3. | Business Overview |
| Our History |
We were formed in 1951 by the Colombian government as Empresa Colombiana de Petróleos and began operating the crude oil fields at La Cira-Infantas, the oldest Colombian oil field whose production started in 1918, and the pipeline that connected that field with the Barrancabermeja refineryRefinery and the port of Cartagena. In 1961, we assumed the direct operation of the Barrancabermeja refineryRefinery and continued its transformation into an industrial complex. In 1974, we acquired the Cartagena refinery,Refinery, which had been in operation since 1957.
In Pursuant to Decree 0062 of 1970, we adopted our first bylaws thatwere transformed us into a governmental industrial and commercial company administered by the Ministry of Mines and Energy. In 2003, we were transformed from an industrial and commercial company into a state-owned corporation, and renamed Ecopetrol S.A.company.
PursuantIn 2003 pursuant to Decree Law 1760, the Agencia Nacional de Hidrocarburos - National Hydrocarbons Agency (the “ANH”) was created and Ecopetrol´s public role as administrator and regulator of 2003, we were granted greaterthe national hydrocarbons resources was transferred to the ANH. Ecopetrol modified its organic structure and became Ecopetrol S.A., a public stock-holding corporation, one hundred percent state-owned, and continued the development of exploration and production activities in a competitive basis with autonomy over our business decisions and we accelerated our exploration activities.decisions. Since 2003,2006, according to Law 1118, we have been evolving from a wholly state-owned entity to a mixed-economy company with private capital. This process has resulted in a substantial change in the legal framework to which we are subject and in the nature of our relationship with the Nation. We carried out our initial public offering in November 2007 when our common shares became listed on the Colombian SecuritiesStock Exchange. Our American Depository Shares (“ADSs”) were listed on the New York Stock Exchange in 2008.
The following table sets forth a list of Starting in August 2010, our material acquisitions since January 1, 2009 andADSs began trading on the effective date as of which each acquisition has been reflected inToronto Stock Exchange (“TSX”) under the symbol “ECP.” On February 17, 2016, we announced our operating results.application for voluntary delisting from the TSX. On March 2, 2016, our ADR´s were officially delisted from the TSX.
We are in the process of selling some of our non-core shareholdings:
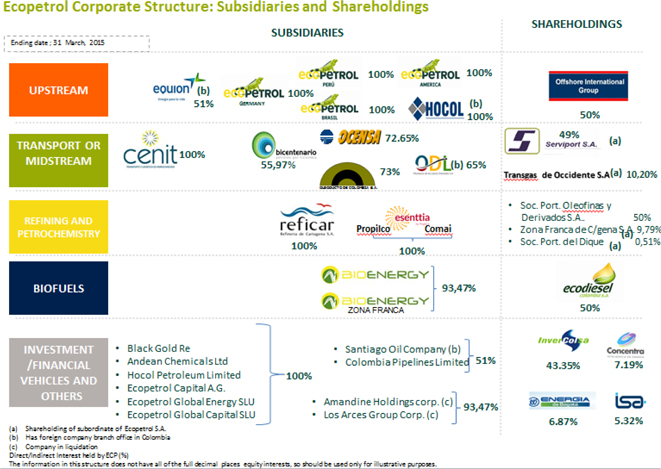
| Our Corporate Structure |
We operate in the following business segments: 1)i) Exploration and Production; 2)ii) Transportation and Logistics; 3)iii) Refining, Petrochemicals, and Biofuels.
Our subsidiaries Refinería de Cartagena (Reficar), Cenit and Ocensa are significant subsidiaries as such term is defined under SEC Regulation S-X.
We have a number of directly and indirectly held subsidiaries both in Colombia and abroad. Our subsidiaries are either directly owned by us or indirectly owned by us through one or more of our other subsidiaries. As of March 31, 2015,2017, we have eight directly owned and 1620 indirectly owned subsidiaries.
In June 2014 we organized a new wholly owned German subsidiary,During 2016, the following changes were made to the Ecopetrol Germany GmbH, to manage the 10% exploration and productions rights acquired from Statoil in Blocks 38 and 39 in Angola.Group’s structure:
| · | In January 2016, we organized a new wholly-owned subsidiary, Ecopetrol Costa Afuera Colombia S.A.S., which will be responsible for offshore exploration and production activities in Colombia. The new subsidiary seeks to develop offshore activities in Colombia, which the Company currently carries out as operator and non-operator, and take advantage of the benefits of Decree 2682/14, pursuant to which the conditions and requirements are established for declaring the existence of permanent offshore free trade zones. |
Our subsidiaries Refinería de Cartagena (Reficar), Cenit Transporte y Logística de Hidrocarburos S.A.S. (Cenit) and Oleoducto Central S.A. (Ocensa) are significant subsidiaries as such term is defined under SEC Regulation S-X.
| · | Polipropileno del Caribe S.A. (Propilco), a wholly owned subsidiary, incorporated Esenttia Resinas del Peru S.A.C in Peru. This new company is wholly indirectly owned by Ecopetrol S.A. For Propilco, the creation of this new company represents an opportunity to strengthen the company’s commercial strategy in Peru. |
| · | The process of reorganizing Ecopetrol S.A.’s indirect participation in Oleoducto de Colombia S.A. (“ODC”) (held through Equion Energia Limited) was successfully completed. As a result of this reorganization, Equion transferred 100% of the shares issued by Sento S.A.S. (“Sento”) to Cenit S.A.S.(“Cenit”), and consequently Sento S.A.S. became the holder of 7.43% of the outstanding capital stock in ODC. However, this restructuring had no impact on our consolidated financial statements. |
| · | In January 2017, the merger by absorption between Sento and Cenit was completed, with the latter being the absorbing company as of January 6, 2017. As a result, Cenit is now the direct holder of a 51.28% equity interest in the outstanding capital stock of ODC.However, this restructuring had no impact on our consolidated financial statements. |
The following tableExhibit 8.1 to this annual report identifies our principal operating subsidiaries, their respective countries of incorporation, and our percentage ownership in each (both directly and indirectly through other subsidiaries), in each case as of March 31, 2015. See Exhibit 8.1 to this annual report for a complete list of our subsidiaries, their respective countries of incorporation, and our percentage of ownership in each.2017.
Graph 2 – Ecopetrol Corporate Structure

The following organization chart illustrates the relationships betweenstock ownership percentage listed refers to Ecopetrol S.A. and its’s direct and indirect subsidiariesparticipation. The data in this structure shows neither the whole ownership nor its decimal figures, so they will be used only for information purposes.
The so-called shareholding (Ecopetrol S.A.’s direct participation), affiliated, subsidiary companies are listed, as well as the stock interest of March 31, 2015.Ecopetrol S.A.’s subordinate companies.
We are in the process of selling some of our non-core shareholdings:
| · | We currently own 0.31% of the total outstanding shares of Empresa de Energía de Bogotá. As approved by Decrees 2305 of November 13, 2014 and 2110 of December 22, 2016, we are authorized to offer our remaining 0.31% of total outstanding shares of Empresa de Energía de Bogotá to the general public using the most appropriate mechanism for the volume and value of the remaining shares. The first stage of the divestment plan took place during the second quarter of 2015, in which we placed 352,872,414 shares at COP$1,740 per share. In 2016, Ecopetrol placed 249,760,551 ordinary shares of Empresa de Energía de Bogotá at COP$1,815 per share. The operation was executed in accordance with the procedures defined by the Law 226 of 1995 and the Decree 2305 of November 13, 2014. On December 22, 2016, the Colombian Government issued Decree 2110 extending the duration of the divestment program until December 31, 2017. |
| · | In 2016, Ecopetrol completed the divestment of its stake in Interconexión Eléctrica S.A. E.S.P. ISA for a total of COP$513 billion. The operation was carried out in accordance with the procedures defined by the Law 226 of 1995 and the Decree 1800 of September 9, 2015. |
| · | We currently own 100% of the total outstanding shares of Propilco. On January 27, 2016, the Board of Directors of Ecopetrol approved the commencement of a divestment plan to sell Ecopetrol’s shares in Propilco. On June 13, 2016, the divestment program was approved by the Council of Ministers of Colombia. The next step in the process is the issuance of a Decree with the final approval to begin the divestiture process under Law 226 of 1995, which has not yet been provided and therefore we are not yet accounting this as a discontinued operation. |
| · | On November 25 of 2016, Ecopetrol conducted an auction to divest 20 non-core producing and non-producing assets. As a result of the bidding process, Ecopetrol received offers for US$53.4 million in six non-core assets, out of which three are currently producing 1.8 mbod and the rest are not in operation. |
| 8 |
| Our Business |
We are a vertically integrated oil company with a presence primarily in Colombia and with activities in Peru, Brazil Angola and the U.S. Gulf Coast. The Nation currently controls 88.49% of our voting capital stock. We are among the top 5036 oil and gas companies in the world based on the Petroleum Intelligence Weekly Top 50 Ranking and in the top 5 in Latin America based on production volume.- 2016. We are the largest corporation in Colombia as measured by revenues, Ebitda, shareholders’ equity, net income and net worth, and we play a key role in the local hydrocarbon market.
| Exploration and Production |
Our Explorationexploration and Productionproduction business segment includes exploration, development and production activities in Colombia and abroad. We began local exploration in 1955 and international exploration in 2006. We conduct exploration and production activities directly in Ecopetrol S.A., through some of our subsidiaries, and through joint ventures with third parties. As of December 31, 2014,2016, we were the largest operator and the largest producer of crude oil and natural gas in Colombia, and we maintainedmaintaining the largest acreage under exploration position in Colombia.
| 3.4.1 | Exploration Activities |
OurEcopetrol is planning to incorporate about 1 billion barrels of contingent resources by 2020, through exploration planactivities in the following areas: (i) offshore Colombia, (ii) near field exploration in Colombia, is focused on(iii) consolidation of exploration of: (1) production sites in close proximity to existing ones and (2) currently producing basins and exploration of frontier areas including off-shore areas primarily operated by our business partners, which we believe have the potential for large discoveries. Our exploration strategy outside of Colombia, such as the Gulf of Mexico, Brazil and other areas in America.
During 2016 our exploration activities focused in three work fronts: onshore Colombia, Colombia and the US Gulf of Mexico offshore and near field exploration in Colombia.
On January15, 2016 Hocol Petroleum Limited - HPL, subsidiary of Ecopetrol S.A. and owned 100% by Ecopetrol, constituted and registered before the Chamber of Commerce in Colombia the company Ecopetrol Offshore (“Ecopetrol Costa Afuera”or “ECAS”). ECAS and Hocol S.A. are subsidiaries of HPL.
ECAS´ purpose is focused on locating prospectsto develop oil and establishing joint venturesgas activities in offshore Colombia by taking advantage of offshore free trade zones regime. These activities include exploration, exploitation, production, transport, distribution, export, sales and commercialization of oil and gas and any other hydrocarbon products or derivatives.
During 2016 bidding rounds were not launched by the National Hydrocarbons Agency to offer licenses for exploratory activities in Colombia.
Ecopetrol signed farmout agreements with experienced operators.the following companies: Parex Resouces Colombia Ltd (acquired 50% of the working interest in Convenio Playón and 50% of the working interest in Convenio de Mares), Talisman Colombia Oil & Gas Ltd (acquired 49% of the working interest in Convenio Upar) and Hupecol Operating Co LLC (acquired 100% of the working interest in CPO-11 E&P Contract).
Additionally, Ecopetrol carried out its Onshore Round 1-2016 offering working interest in the onshore blocks LLA-38, LLA-39, LLA-52, PUT 13 and VMM-32 located in Colombia.
For purposes of this exploration section, “we” refers to Ecopetrol S.A., its subsidiaries and partnerships in which Ecopetrol has an interest. Unless otherwise stated, all figures are given before deductions for royalties.
| 3.4.1.1 | Exploration Activities in Colombia |
WeCurrently we have exploration activities in allmost of the sedimentary basins in Colombia, in which active oil and gas operations are found.
| 9 |
The following map shows the basins where we conductEcopetrol has been conducting its main exploration activities.
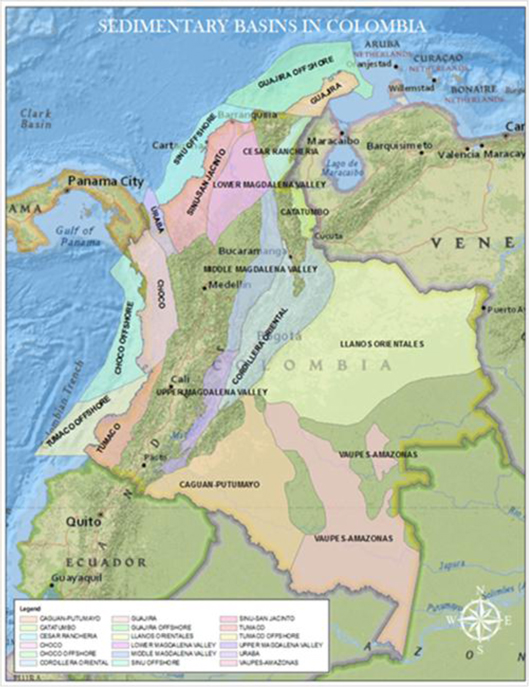

Source: ANH
We conduct exploration activities in Colombia on our own and through joint ventures with regional and global oil and gas companies. In 2014 Ecopetrol S.A. acquired 6,607 equivalent kilometers of seismic data, both directly and through business partners.
Seismic
During 2016, two 2D seismic programs were acquired in Colombia: Cardon (106.5 Km) and Nogal (44 Km).These seismic programs are intended to increase the knowledge of the Caguan-Putumayo basin.
Additionally, our subsidiary Hocol S.A. successfully completed the acquisition of 294.9 km2 of 3D seismic in the exploratory blocks GUA2 (213.5 km2) and YDSN1 (81.4 km2) in Middle Magdalena Basin and Llanos Basin, respectively.
Exploratory Wells
During 2016, onshore drilling operations were started in five wells by Ecopetrol and its subsidiary Hocol S.A. in the Lower Magdalena Basin and Llanos Basin. Additionally Hocol finalized drilling operations in the Payero well (Piedemonte basin), which started in December 2015 and was operated by Equion. In terms of offshore Colombia, drilling operations started at the Purple-Angel 1 well (following the discovery announced at the Kronos-1 well in July 2015) and at the Gorgon-1 prospect. Our joint venture partner Anadarko operates both wells. On March 8, 2017, we announced the discovery of a gas presence at Purple-Angel 1.
| 10 |
The following table sets forth for the periods indicated, the number of gross and net productive and dry exploratory wells drilled by us and our joint venture partners and the exploratory wells drilled by third parties pursuant to sole risk contracts with us.
| For the year ended December 31, | ||||||||||||
| 2014 | 2013 | 2012 | ||||||||||
| COLOMBIA | ||||||||||||
| Ecopetrol S.A. | ||||||||||||
| Gross Exploratory Wells | ||||||||||||
| Owned and operated by Ecopetrol | ||||||||||||
| Productive(1) | 3 | 4 | 4 | |||||||||
| Dry(2) | 9 | 2 | 2 | |||||||||
| Total | 12 | 6 | 6 | |||||||||
| Operated by Partner in Joint Venture | ||||||||||||
| Productive(3) | 1 | 3 | - | |||||||||
| Dry | 2 | 2 | - | |||||||||
| Total | 3 | 5 | - | |||||||||
| Operated by Ecopetrol in Joint Venture | ||||||||||||
| Productive | 1 | - | - | |||||||||
| Dry | - | - | - | |||||||||
| Total | 1 | - | - | |||||||||
| Net Exploratory Wells(4) | ||||||||||||
| Productive | 4.1 | 5.5 | 3.3 | |||||||||
| Dry | 10.7 | 3.0 | 2.0 | |||||||||
| Total | 14.8 | 8.5 | 5.3 | |||||||||
| Sole Risk | ||||||||||||
| Productive | - | - | - | |||||||||
| Dry | - | - | 1 | |||||||||
| Total | - | - | 1 | |||||||||
| Equion | ||||||||||||
| Gross Exploratory Wells | ||||||||||||
| Productive | - | - | - | |||||||||
| Dry | - | - | 1 | |||||||||
| Total | - | - | 1 | |||||||||
| Hocol | ||||||||||||
| Gross Exploratory Wells | ||||||||||||
| Productive | - | 1 | 4 | |||||||||
| Dry | 4 | 6 | 4 | |||||||||
| Total | 4 | 7 | 8 | |||||||||
| Net Exploratory Wells(4) | ||||||||||||
| Productive | - | 0.5 | 3 | |||||||||
| Dry | 3 | 5.0 | 4 | |||||||||
| Total | 3 | 5.5 | 7 | |||||||||
Table 4 – Exploratory Drilling in Colombia
| For the year ended December 31, | ||||||||||||
| 2016 | 2015 | 2014 | ||||||||||
| (number of wells) | ||||||||||||
| COLOMBIA | ||||||||||||
| Ecopetrol S.A. | ||||||||||||
| Gross Exploratory Wells | ||||||||||||
| Owned and operated by Ecopetrol | ||||||||||||
| Productive(1) | – | – | 3.0 | |||||||||
| Dry(2) | 1.0 | 1.0 | 9.0 | |||||||||
| Total | 1.0 | 1.0 | 12.0 | |||||||||
| Operated by Partner in Joint Venture | ||||||||||||
| Productive | – | 1.0 | 1.0 | |||||||||
| Dry | – | 1.0 | 2.0 | |||||||||
| Total | – | 2.0 | 3.0 | |||||||||
| Operated by Ecopetrol in Joint Venture | ||||||||||||
| Productive | – | – | 1.0 | |||||||||
| Dry | – | – | – | |||||||||
| Total | – | – | 1.0 | |||||||||
| Net Exploratory Wells(3) | ||||||||||||
| Productive | – | 0.5 | 4.1 | |||||||||
| Dry | 1.0 | 1.5 | 10.7 | |||||||||
| Total | 1.0 | 2.0 | 14.8 | |||||||||
| Sole Risk | ||||||||||||
| Productive | – | – | – | |||||||||
| Dry | – | – | – | |||||||||
| Total | – | – | – | |||||||||
| Equion | ||||||||||||
| Gross Exploratory Wells | ||||||||||||
| Productive | – | – | – | |||||||||
| Dry | – | – | – | |||||||||
| Total | – | – | – | |||||||||
| Hocol | ||||||||||||
| Gross Exploratory Wells | ||||||||||||
| Productive | 1.0 | 1.0 | – | |||||||||
| Dry | – | – | 4.0 | |||||||||
| Total | 1.0 | 1.0 | 4.0 | |||||||||
| Net Exploratory Wells | ||||||||||||
| Productive | 0.5 | 0.5 | – | |||||||||
| Dry | – | – | 3.0 | |||||||||
| Total | 0.5 | 0.5 | 3.0 | |||||||||
| (1) | A productive well is an exploratory well that has evidence of hydrocarbons. |
| (2) | A dry well or hole is an exploratory well found to be incapable of producing either crude oil or natural gas in sufficient quantities to justify completion as a crude oil or natural gas well. |
| (3) |
| Net exploratory wells are calculated according to our percentage of ownership in these wells. |
| 11 |
Ecopetrol S.A. drilled two wells in 2016: (i) Chimú-1 St-1 well, where Ecopetrol holds a total of 17 wildcat exploratory wells (A3-A2) in 2014, including the QFN-CS1100% working interest at Caño Sur Block, which was a dry well, and (ii) Boranda well, in which Ecopetrol holds a 40%50% working interest and Parex holds the remaining 50% working interest, as block operator. As of March 30, 2017 we announced that the presence of crude was discovered at this well.
Our subsidiary Hocol S.A. drilled three wells in partnership with Metrapetroleum (operator)2016: (i) Payero E1 well, located at Niscota Block and whichoperated by Equión. Total holds a 50% working interest, Repsol holds a 30% working interest and Hocol S.A. holds a 20% working interest, this well was declared temporarily suspended; (ii) Bullerengue Sur-1 well, located at SSJN1 Block. Hocol S.A. holds a 50% working interest and Lewis Energy holds the remaining 50%, this one is a productive well, and (iii) Pegaso well, located at CPO 16 Block where Hocol S.A. holds a 100% working interest, this well was under evaluation as of December 31, 2014. There was evidence of hydrocarbons in five wells: Orca-1 the first discovery in deep waters of the Colombian Caribbean, in which Ecopetrol holds a 30% working interest, in partnership with Petrobras (operator, 40%) and Repsol (30%); Nueva Esperanza in block CPO09, operated by Ecopetrol (55%) in partnership with Talisman Colombia Oil & Gas Ltd. (45%) and in Tibirita-1A, Cacica-1 and Golosa, each of which are 100% owned by Ecopetrol. Eleven wells were dry. Hocol drilled four A3 wells, all of which were dry.
During 2014, Ecopetrol S.A. participated in the bidding round launched by the National Hydrocarbons Agency to offer licenses for exploratory activities in Colombia, and was awarded one exploration block located in the Colombian Caribbean (Sin Off-7) with an extension area of approximately 173 thousand hectares. Ecopetrol S.A. has a 35% stake in this contract. Hocol S.A. submitted the best offer for four blocks in the Sinu San Jacinto Basin: Blocks SN-8, SN-15, SN-18 and YDSN1.2016.
| 3.4.1.2 | Exploration Activities Outside of Colombia |
Our international exploration strategy is focused on participating in bidding rounds to secure blocks available for exploration and entering into joint ventures with international and regional oil companies. We believe exploring outside Colombia allows us to diversify our risks and improve the possibilities of increasing our crude oil and natural gas reserves.
In association withWith respect to our business partners,seismic data outside of Colombia, during 2016, our subsidiary Ecopetrol Brasil bought 854 Km2 of seismic data on the Potiguar basin, POT-M-567, in which Ecopetrol Brasil holds a 100% working interest.
With respect to our exploratory drilling outside of Colombia, during 2016, we have undertaken deep water exploratory drilling in the U.S. Gulf Coast Angolain association with our business partners. The following table sets forth information on our exploratory drilling in the years 2016, 2015 and in Brazil.2014.
| For the year ended December 31, | ||||||||||||
| 2014 | 2013 | 2012 | ||||||||||
| INTERNATIONAL | ||||||||||||
| Ecopetrol America Inc. | ||||||||||||
| Gross Exploratory Wells | ||||||||||||
| Productive(1) | 2 | - | 2 | |||||||||
| Dry(2) | 3 | 2 | 1 | |||||||||
| Total | 5 | 2 | 3 | |||||||||
| Net Exploratory Wells(3)(4) | ||||||||||||
| Productive | 0.7 | - | 0.3 | |||||||||
| Dry | 0.5 | 0.5 | 0.6 | |||||||||
| Total | 1.2 | 0.5 | 0.9 | |||||||||
| Ecopetrol Óleo e Gás do Brasil Ltda. | ||||||||||||
| Gross Exploratory Wells | ||||||||||||
| Productive | - | - | - | |||||||||
| Dry | - | 1 | 3 | |||||||||
| Total | - | 1 | 3 | |||||||||
| Net Exploratory Wells(3) | ||||||||||||
| Productive | - | - | - | |||||||||
| Dry | - | 0.3 | 1 | |||||||||
| Total | - | 0.3 | 1 | |||||||||
| Ecopetrol Germany(5) | ||||||||||||
| Gross Exploratory Wells | ||||||||||||
| Productive | - | - | - | |||||||||
| Dry | 2 | - | - | |||||||||
| Total | 2 | - | - | |||||||||
| For the year ended December 31, | ||||||||||||
| 2014 | 2013 | 2012 | ||||||||||
| Net Exploratory Wells(3) | ||||||||||||
| Productive | - | - | - | |||||||||
| Dry | 0.2 | - | - | |||||||||
| Total | 0.2 | - | - | |||||||||
| Savía Perú(6) | ||||||||||||
| Gross Exploratory Wells | ||||||||||||
| Productive | - | 1 | - | |||||||||
| Dry | - | - | 3 | |||||||||
| Total | - | 1 | 3 | |||||||||
| Net Exploratory Wells(3) | ||||||||||||
| Productive | - | 0.5 | - | |||||||||
| Dry | - | - | 1.5 | |||||||||
| Total | - | 0.5 | 1.5 | |||||||||
| 12 |
Table 5 – Exploratory Drilling Outside Colombia
| For the year ended December 31, | ||||||||||||
| 2016 | 2015 | 2014 | ||||||||||
| (number of wells) | ||||||||||||
| INTERNATIONAL | ||||||||||||
| Ecopetrol America Inc. | ||||||||||||
| Gross Exploratory Wells | ||||||||||||
| Productive(1) | 1.0 | – | 2.0 | |||||||||
| Dry(2) | – | 1.0 | 3.0 | |||||||||
| Total | 1.0 | 1.0 | 5.0 | |||||||||
| Net Exploratory Wells(3)(4) | ||||||||||||
| Productive | 0.2 | – | 0.7 | |||||||||
| Dry | – | 0.5 | 0.5 | |||||||||
| Total | 0.2 | 0.5 | 1.2 | |||||||||
| Ecopetrol Óleo e Gás do Brasil Ltda. | ||||||||||||
| Gross Exploratory Wells | ||||||||||||
| Productive | – | – | – | |||||||||
| Dry | – | – | – | |||||||||
| Total | – | – | – | |||||||||
| Net Exploratory Wells | ||||||||||||
| Productive | – | – | – | |||||||||
| Dry | – | – | – | |||||||||
| Total | – | – | – | |||||||||
| Ecopetrol Germany | ||||||||||||
| Gross Exploratory Wells | ||||||||||||
| Productive | – | – | – | |||||||||
| Dry | – | – | 2.0 | |||||||||
| Total | – | – | 2.0 | |||||||||
| Net Exploratory Wells | ||||||||||||
| Productive | – | – | – | |||||||||
| Dry | – | – | 0.2 | |||||||||
| Total | – | – | 0.2 | |||||||||
| Savia Perú | ||||||||||||
| Gross Exploratory Wells | ||||||||||||
| Productive | – | – | – | |||||||||
| Dry | – | – | – | |||||||||
| Total | – | – | – | |||||||||
| Net Exploratory Wells | ||||||||||||
| Productive | – | – | – | |||||||||
| Dry | – | – | – | |||||||||
| Total | – | – | – | |||||||||
| (1) | A productive well is an exploratory well that has evidence of hydrocarbons. |
(2) | A dry well or hole is an exploratory well found to be incapable of producing either crude oil or natural gas in sufficient quantities to justify completion as a crude oil or natural gas well. |
| (3) | Net exploratory wells are calculated according to our percentage of ownership in these wells. |
| (4) | None of our international wells were dug pursuant to a sole risk contract. |
In 2014, weAs set forth in the table above, in 2016, our subsidiary Ecopetrol America Inc. drilled seven international grossin the United States Gulf of Mexico the Warrior exploratory wells through our subsidiaries and partners as follows:
Three wells were declared dry holes: the Deep Nansen well, in which Ecopetrol America hadInc. holds a 20% working interest and our partners Anadarko (operator) holds a 65% working interest and MCX Gulf of Mexico LLC holds the remaining 15% working interest,interest. The well was declared productive. This oil discovery is the result of our new exploratory strategy, which wasincludes partnerships with leading companies to diversify risk, undertake further exploration activities and increase contingent resources. The Warrior well is the fifth oil discovery of the Ecopetrol Group in this prosperous oil region and contributes with increasing our contingent resources.
Ecopetrol America Inc. also drilled a successful appraisal well in Leon discovery (León 2 BP4), operated by Repsol, which holds a 60% working interest. Ecopetrol America Inc. holds the remaining 40% working interest.The result of this well adds contingent resources to those initially discovered with the León 1 exploratory well in 2014.
During 2016, Ecopetrol S.A. did not participate in bidding rounds in the Gulf of Mexico.
With regards to ECP Oil and Gas Germany GmbH´s operations in Angola, we reached an agreement with our partners Anadarko Petroleum Corporation (operator), Conoco Phillips, Marubeni Oil & Gas (USA) Inc.on the terms upon which we will withdraw from Block 38/11 and Venari Resources;Block 39/11. This agreement was sent for approval of the Titan well, in which Ecopetrol America hasNational Concessionaire, Sonangol EP, followed by the issuance of a 30% working interest, which was drilled with our partners Murphy Oil Corporation (operator) and Venari Resources; anddecree from the K2 Exploration Tail well in which Ecopetrol America has a 9.21% working interest, which was drilled with our partners Anadarko Petroleum Corporation (operator), Eni Petroleum, ConocoPhillips, Nippon Oil Expl. and MCX GOM.Ministry of Petroleum. We expect the withdrawal process to be concluded by mid-year of 2017.
| 3.4.2 | Production Activities |
Our consolidated average production was 755.4717.9 thousand bpdboepd in 2014, 332016, a decrease of approximately 43 thousand bpd below thatboepd as compared to 2015. This decrease is mainly the result of the previous year. The main factors affecting this result were: 1) the operational difficulties associated with our community relations, including blockades which delayed the start-up of new facilities and new wells in several fields (approximately 22 thousand bpd), 2) the water disposal limitations, essentially in the Rubiales field (9.5 thousand bpd), 3) attacks on our infrastructure, which forced the temporary closure of somenatural production decline of our fields (5 thousand bpd), and 4) the temporarya reduction in productionthe upstream investments during 2016, as a consequence of the drop in the Guajira gas fields due to the start of GACE IV recovery factor improvement project, which required a temporary stop in production. These factors were partially offset by the increase in production by Ecopetrol S.A.’s affiliates and subsidiaries (3.5 thousand bpd).oil prices.
| 13 |
Despite these difficulties, we managed to reverse the trend of decreasing production experienced at the beginning of the year such that we were on a path of production growth in the last two quarters of 2014. This reversal was driven mainly by the results of our direct operations in fields like Chichimene, where we reached production records, and the increase in production of the Castilla field. In addition we made progress on the Akacias field project located in the Llanos Region, where production increased to 10.5 mbpoed by year-end.
The following table summarizes the results of our oil and gas production activities for the periods indicated:
| For the year ended December 31, | ||||||||||||||||||||||||||||||||||||
| 2014 | 2013 | 2012 | ||||||||||||||||||||||||||||||||||
| (thousand bpoed) | ||||||||||||||||||||||||||||||||||||
| Oil(2) | Gas(1) | Total | Oil(2) | Gas(1) | Total | Oil(2) | Gas(1) | Total | ||||||||||||||||||||||||||||
| Total production in Colombia | 610.9 | 133.3 | 744.2 | 643.9 | 136.6 | 780.5 | 626.5 | 118.5 | 745 | |||||||||||||||||||||||||||
| Total International production | 8.6 | 2.6 | 11.2 | 7.2 | 0.5 | 7.7 | 8.2 | 0.9 | 9.1 | |||||||||||||||||||||||||||
| Total production of Ecopetrol Group | 619.5 | 135.9 | 755.4 | 651.1 | 137.1 | 788.2 | 634.7 | 119.4 | 754.1 | |||||||||||||||||||||||||||
Table 6 – Ecopetrol Group’s Oil and Gas Production
| For the year ended December 31, | ||||||||||||||||||||||||||||||||||||
| 2016 | 2015 | 2014 | ||||||||||||||||||||||||||||||||||
| Oil | Gas(1) | Total | Oil | Gas(1) | Total | Oil | Gas(1) | Total | ||||||||||||||||||||||||||||
| (thousand boepd) | ||||||||||||||||||||||||||||||||||||
| Total production in Colombia(2) | 582.5 | 123.3 | 705.8 | 619.2 | 130.4 | 749.6 | 610.9 | 133.3 | 744.2 | |||||||||||||||||||||||||||
| Total International production(3) | 9.6 | 2.5 | 12.1 | 7.3 | 3.8 | 11.1 | 8.6 | 2.6 | 11.2 | |||||||||||||||||||||||||||
| Total production of Ecopetrol Group | 592.1 | 125.8 | 717.9 | 626.5 | 134.2 | 760.7 | 619.5 | 135.9 | 755.4 | |||||||||||||||||||||||||||
| (1) |
| Conversion between mcfpd and boepd is performed at 5,700 mcfpd to 1 boepd. |
| (2) | Total production in Colombia corresponds to Ecopetrol S.A., Hocol and Equion. |
| (3) | Total International production corresponds to Savia Perú and Ecopetrol America Inc. |
| 3.4.2.1 | Production Activities in Colombia |
| 3.4.2.1.1. | Ecopetrol S.A.’s Production Activities in Colombia |
For the year ended December 31, 2014,2016, Ecopetrol S.AS.A. was the largest participant in the Colombian hydrocarbons industry, accounting for approximately 58%62% of crude oil production (according to calculations made by Ecopetrol based on information from the Ministry of Mines and Energy) and approximately 63%61% of natural gas production.
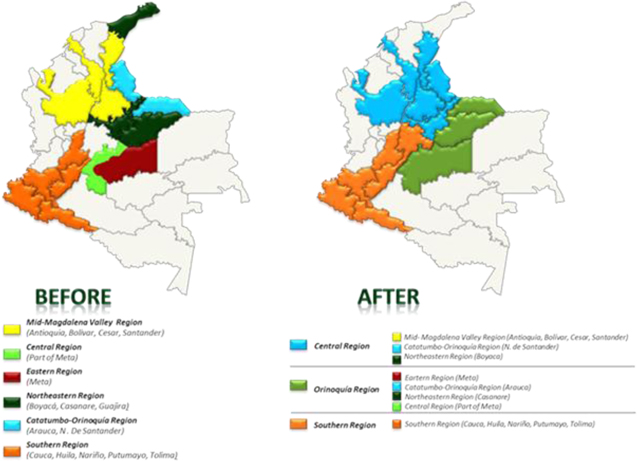
In 2014, weproduction (according to calculations made by Ecopetrol based on information from the Ministry of Mines and Energy). Also during 2016, Ecopetrol S.A. carried out development drilling mainly in all our producingthe Oriente and Orinoquia regions, in Colombia, drilling 761133 development wells; 17783 of those through our direct operations and 58450 through our joint ventures. As part
In terms of an internal administrative restructuring process we recently reorganized the management of theoperational structure, Ecopetrol S.A. manages its production activities of Ecopetrol S.A., which will allow us to improve our control on operations while at the same time giving usthrough a closer and more effective interaction with communities and partners. Beginning onregional organization. Since July 1, 2014, our fully owned fieldsthree regional Vice-Presidencies were divided into three main Vice-presidencies or administrativecreated: Central, Orinoquia and Southern. After the company took over the operations of the Rubiales field in July of 2016, a new Vice-Presidency, the Eastern Region, was incorporated to this scheme. Our operating assets are distributed in the following regions:
| · | Central Region: comprising |
| · |
| · | Southern Region: comprising |
| · | Eastern Region: comprising 4 fields with active production in 2016. |
A fourth Vice-presidency,fifth Vice-Presidency, the Vice-presidencyVice-Presidency of Associated Assets, will beOperations, is responsible for all of the production activities in which a partner is involved, regardless of the location of such activities in Colombia. This Vice- Presidency is comprised of 137 fields with active production in 2016.
The map below indicates the locations of ourEcopetrol S.A´s operations in Colombia. Productionwith production information for each of the newour administrative regions is includedfollowing in the discussion following the maps.subsequent paragraphs.
| 14 |
Graph 4 – Ecopetrol S.A. Operations in Colombia
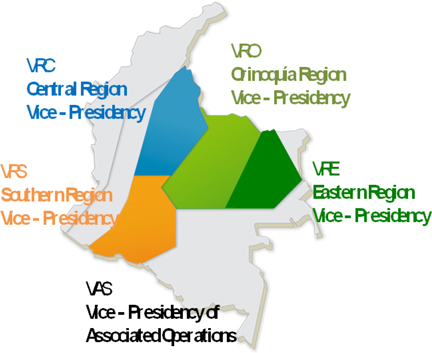
Note: VAS is the countrywide Vice-presidency.
Crude Oil Production
The average daily production of crude oil in Colombia by Ecopetrol S.A. (excluding its subsidiaries), was 579.7 thousand bpd552.1 mbod in 2014, 33 thousand bpd less2016, 34.1 mbod lower than in 2013,2015, which represents a year-to-year decrease of 5.4%6%. The drop
However, it is important to highlight that since July of 2016 we took over the operations of the Rubiales and Cusiana fields. A plan was set up with more than two years in advance, which allowed us to successfully transition between operators, without technical, operational or communities’ issues in any of the two fields. In the case of the Rubiales field, it is important to highlight that we restarted investments in the average dailyasset with new development drilling during the last quarter of the year 2016, which helped us mitigate the production is mainly due to a 10.5% reduction in production in at our associated operations, and the above-described restrictions in our direct operations, mainly in the Orinoquía region where our production dropped by 2.2% as compared to 2013.decline observed during 2015.
The following chart summarizes Ecopetrol S.A.’s average daily crude oil production in Colombia by Region, prior to deducting royalties, for the periods indicated.
| For the year ended December 31, | ||||||||||||
| 2014 | 2013 | 2012 | ||||||||||
| (thousand bpd) | ||||||||||||
| Central Region | ||||||||||||
| 1) La Cira – Infantas | 24.6 | 23.5 | 21.7 | |||||||||
| 2) Casabe | 22.0 | 22.8 | 23.1 | |||||||||
| 3) Yarigui | 16.7 | 14.9 | 14.3 | |||||||||
| 4) Other | 21.0 | 20.3 | 22.4 | |||||||||
| Total Central Region | 84.3 | 81.4 | 81.5 | |||||||||
| Orinoquía Region | ||||||||||||
| 1) Castilla | 104.4 | 112.9 | 111.4 | |||||||||
| 2) Chichimene | 56.2 | 53.1 | 44.1 | |||||||||
| 3) Cupiagua | 16.4 | 18.5 | 20.8 | |||||||||
| 4) Other | 26.0 | 23.8 | 22.8 | |||||||||
| Total Orinoquia Region | 203.0 | 208.3 | 199.2 | |||||||||
| Southern Region | ||||||||||||
| 1) San Francisco | 9.2 | 10.0 | 6.9 | |||||||||
| 2) Huila Area | 8.2 | 7.9 | 9.4 | |||||||||
| 3) Tello | 4.3 | 4.4 | 4.7 | |||||||||
| 4) Other | 11.8 | 11.8 | 12.1 | |||||||||
| Total Southern Region | 33.6 | 34.2 | 33.1 | |||||||||
| Associated Operations | ||||||||||||
| 1) Rubiales | 104.3 | 120.0 | 102.0 | |||||||||
| 3) Quifa | 33.0 | 33.5 | 22.1 | |||||||||
| 4) Caño Limon | 30.0 | 36.4 | 39.2 | |||||||||
| 5) Cusiana | 7.0 | 8.8 | 10.0 | |||||||||
| 6) Other | 83.9 | 89.8 | 101.8 | |||||||||
| Total Associated Operations | 258.2 | 288.5 | 275.1 | |||||||||
| Production tests* | 0.7 | 0.2 | 2.06 | |||||||||
| Total average daily crude oil production Ecopetrol S.A. (Colombia) | 579.7 | 612.6 | 591.0 | |||||||||
| 15 |
Table 7 – Ecopetrol S.A.’s Average Daily Crude Oil Production in Colombia by Region Vice-Presidency
| For the year ended December 31, | ||||||||||||
| 2016 | 2015 | 2014 | ||||||||||
| (thousand bpd) | ||||||||||||
| Central Region | ||||||||||||
| 1) La Cira – Infantas | 19.1 | 22.9 | 24.6 | |||||||||
| 2) Casabe | 17.8 | 21.9 | 22.0 | |||||||||
| 3) Yarigui | 16.6 | 17.8 | 16.7 | |||||||||
| 4) Other | 21.3 | 23.7 | 21.0 | |||||||||
| Total Central Region | 74.8 | 86.3 | 84.3 | |||||||||
| Orinoquía Region | ||||||||||||
| 1) Castilla | 121.3 | 122.5 | 104.4 | |||||||||
| 2) Chichimene | 74.0 | 78.0 | 56.2 | |||||||||
| 3) Cupiagua | 11.3 | 14.0 | 16.4 | |||||||||
| 4) Other | 18.3 | 21.1 | 26.0 | |||||||||
| Total Orinoquía Region | 224.9 | 235.6 | 203.0 | |||||||||
| Eastern Region | ||||||||||||
| 1) Rubiales(1) | 61.5 | 0 | 0 | |||||||||
| 2) Caño Sur(2) | 0.4 | 0 | 0 | |||||||||
| Total Eastern Region | 61.9 | 0 | 0 | |||||||||
| Southern Region | ||||||||||||
| 1) San Francisco | 6.5 | 8.1 | 9.2 | |||||||||
| 2) Huila Area | 7.4 | 7.8 | 8.2 | |||||||||
| 3) Tello | 4.4 | 4.5 | 4.3 | |||||||||
| 4) Other | 9.4 | 11.0 | 11.8 | |||||||||
| Total Southern Region | 27.7 | 31.4 | 33.5 | |||||||||
| Associated Operations | ||||||||||||
| 1) Rubiales(1) | 41.4 | 94.3 | 104.3 | |||||||||
| 2) Quifa | 19.6 | 24.2 | 33.0 | |||||||||
| 3) Caño Limon | 23.3 | 25.6 | 30.0 | |||||||||
| 4) Cusiana(3) | 2.6 | 5.2 | 7.0 | |||||||||
| 5) Other | 75.9 | 83.6 | 84.6 | |||||||||
| Total Associated Operations | 162.8 | 232.9 | 258.9 | |||||||||
| Total average daily crude oil production Ecopetrol S.A. (Colombia) | 552.1 | 586.2 | 579.7 | |||||||||
| (2) | In the first half of 2016, the Caño Sur field was part of the Orinoquia Region. Since July 1, 2016, it became a part of the Eastern Region. |
| (3) | In the first half of 2016, the Cusiana field was part of the Vice-Presidency of Associated Operations. Since July 3, 2016, it became a part of the Orinoquia Region. |
ECOPETROLTable 8 – Ecopetrol S.A. PRODUCTION PER TYPE OF CRUDE (IN MBOD):Production per Type of Crude
| 2014 | 2013 | Year-on-Year ∆ (%) | 2012 | Year-on-Year ∆ (%) | 2016 (mbod) | Year-on-Year ∆ (%) | 2015 (mbod) | Year-on-Year ∆ (%) | 2014 (mbod) | |||||||||||||||||||||||||||||||
| Light | 44.51 | 49.12 | (9.4 | )% | 59.58 | (17.5 | )% | 44.6 | (0.0 | )% | 44.6 | 0.2 | % | 44.5 | ||||||||||||||||||||||||||
| Medium | 198.54 | 215.78 | (8.0 | )% | 227.85 | (5.3 | )% | 161.5 | (13.7 | )% | 187.1 | (5.8 | )% | 198.6 | ||||||||||||||||||||||||||
| Heavy | 336.61 | 347.73 | (3.2 | )% | 303.55 | 14.6 | % | 346.0 | (2.4 | )% | 354.5 | 5.3 | % | 336.6 | ||||||||||||||||||||||||||
| Total | 579.66 | 612.63 | (5.4 | )% | 590.98 | 3.7 | % | 552.1 | (5.8 | )% | 586.2 | 1.1 | % | 579.7 | ||||||||||||||||||||||||||
Ecopetrol S.A.’s crude oil production during 20142016 consisted of approximately 42%37% light and medium crudes and 58%63% heavy crudes, confirming our shift to heavy crude production.crudes. In 2013,2015, approximately 43%40% of the crude oil production corresponded to light and medium crudes while the remaining 57%and 60% to heavy crudes. During 2012,2014, production distribution was approximately 49%42% of light and medium crudes and 51%58% of heavy crudes.
Our most important heavy crude oil assets are:
Ecopetrol and Pacific Rubiales Energy announced in 2015 that they have agreed not to extend the Rubiales risk participation and Piriri joint venture contracts that expire in 2016. Ecopetrol will be examining different options for the operation of the Rubiales field. Both Ecopetrol and Pacific Rubiales Energy have expressed interest in continuing to develop business opportunities for the benefit of both parties and that of the country.
Natural Gas Production
In 2014,2016, the average daily production of natural gas by Ecopetrol S.A. reached 125.4 thousand boepd,116.0 mboed, including natural gas liquids (“NGLs”), corresponding to a 2.7% reduction when compared with 20134% decrease in comparison to 2015 production.
| 16 |
We have three main natural gas production fields, Guajira, Cusiana and Cupiagua. The majority of our production of natural gas in Colombia is undertaken by joint ventures. In the Guajira field, we have partnered with Chevron. InChevron who operates the field. The development of Cusiana field our partners are Equiónhad a change in participation, because Tauramena joint venture expired on July 3, 2016. The Tauramena block is part of the Cusiana unified exploitation plan. As a consequence of the termination of the Tauramena joint venture, Ecopetrol´s participation increased from 63.4% to 97.8%, and Sinochem Petroleum Exploration and Production.Ecopetrol assumed the operation of the Cusiana unified exploitation plan. Ecopetrol S.A. directly operatesis the operator of the Cupiagua field, including the Cupiagua gas plant, which is connected with the Cusiana field through the Cupiagua-Cusiana gas pipeline.field.
Of our total natural gas production as ofduring the year ended December 31, 2014, 40%2016, approximately 29% was supplied from the Guajira field, 21%25% from the Cusiana field, 18%25% from the Cupiagua field and the remaining 21% from fields located in other regions.fields.
The following table sets forth Ecopetrol S.A.’s average daily natural gas production in Colombia, including NGLs, prior to deducting royalties, for the years ended on December 31, 2014, 2013,2016, 2015 and 2012.2014.
| For the year ended December 31, | ||||||||||||
| 2014 | 2013 | 2012 | ||||||||||
| (thousand boepd) | ||||||||||||
| COLOMBIA | ||||||||||||
| Central Region | ||||||||||||
| 1) La Cira – Infantas | 0.16 | 0.14 | 0.18 | |||||||||
| 2) Casabe | 0.00 | 0.04 | 0.08 | |||||||||
| 3) Yarigui | 0.50 | 0.60 | 0.61 | |||||||||
| 4) Other | 10.60 | 10.32 | 9.89 | |||||||||
| Total Central Region | 11.26 | 11.10 | 10.76 | |||||||||
| Orinoquía Region | ||||||||||||
| 1) Cupiagua | 22.80 | 20.08 | 0.69 | |||||||||
| 2) Other | 1.37 | 1.48 | 1.55 | |||||||||
| Total Orinoquia Region | 24.17 | 21.55 | 2.24 | |||||||||
| Southern Region | ||||||||||||
| 1) Huila Area | 1.14 | 1.09 | 1.05 | |||||||||
| 2) Tello | 0.26 | 0.20 | 0.20 | |||||||||
| 3) Other | 0.04 | 0.02 | 0.03 | |||||||||
| Total Southern Region | 1.43 | 1.31 | 1.28 | |||||||||
| Associated Operations | ||||||||||||
| 1) Guajira | 50.11 | 58.97 | 59.47 | |||||||||
| 2) Cusiana | 26.53 | 23.93 | 26.42 | |||||||||
| 3) Other | 11.87 | 12.04 | 10.82 | |||||||||
| 4) Direct Operation | ||||||||||||
| 5)Associated Operation | ||||||||||||
| Total Associated Operations | 88.52 | 94.94 | 96.72 | |||||||||
| Production tests | 0.00 | 0.00 | 0.01 | |||||||||
| Total Natural Gas Production (Colombia) | 125.38 | 128.90 | 111.01 | |||||||||
Table 9 – Ecopetrol S.A.’s Average Daily Natural Gas Production in Colombia
| For the year ended December 31, | ||||||||||||
| 2016 | 2015 | 2014 | ||||||||||
| (thousand boepd) | ||||||||||||
| COLOMBIA | ||||||||||||
| Central Region | ||||||||||||
| 1) La Cira – Infantas | 0.17 | 0.12 | 0.16 | |||||||||
| 2) Provincia | 3.09 | 3.75 | 4.00 | |||||||||
| 3) Yarigui | 0.56 | 0.56 | 0.50 | |||||||||
| 4) Gibraltar | 6.32 | 5.52 | 5.57 | |||||||||
| 4) Other | 1.60 | 1.51 | 1.02 | |||||||||
| Total Central Region | 11.74 | 11.46 | 11.25 | |||||||||
| Orinoquía Region | ||||||||||||
| 1) Cupiagua | 28.72 | 24.09 | 22.80 | |||||||||
| 2) Cusiana(1) | 15.98 | 0.00 | 0.00 | |||||||||
| 2) Other | 1.44 | 1.18 | 1.37 | |||||||||
| Total Orinoquía Region | 46.14 | 25.27 | 24.17 | |||||||||
| Southern Region | ||||||||||||
| 1) Huila Area | 0.64 | 0.85 | 1.14 | |||||||||
| 2) Tello | 0.35 | 0.35 | 0.26 | |||||||||
| 3) Other | 0.03 | 0.03 | 0.04 | |||||||||
| Total Southern Region | 1.02 | 1.23 | 1.44 | |||||||||
| Associated Operations | ||||||||||||
| 1) Guajira | 33.34 | 42.71 | 50.11 | |||||||||
| 2) Cusiana(1) | 12.65 | 27.03 | 26.53 | |||||||||
| 3) Other | 11.10 | 13.47 | 11.87 | |||||||||
| Total Associated Operations | 57.09 | 83.21 | 88.51 | |||||||||
| Total Natural Gas Production (Colombia) | 115.99 | 121.17 | 125.37 | |||||||||
| Note: | Conversion between mcfpd and boepd is performed at 5,700 mcfpd to 1 boepd. |
| (1) | In the first half of 2016, the Cusiana field was part of the Vice-Presidency of Associated Operations. Since July 3, 2016, it became a part of the Orinoquia Region. |
Projects to Increase Recovery Factor:
During 2016 Ecopetrol prioritized opportunities within its recovery factor increase program, keeping 18 active pilots in operation and developing a new additional one. From the current pilots, 12 have already presented an increase in production within the area impacted by the pilot.
| 17 |
Among the main results of the pilots in 2016, it is important to highlight the positive results of the water flooding pilots in the heavy crude fields of Castilla and Chichimene. These fields reported a growth in the recovery factor of 5.2% in the pilot area of Chichimene field and 2.5% in the pilot area of Castilla field. Also in 2016, we continued the evaluation of steam injection pilots in the Jazmin and Teca projects, with participation from partners, located in the Middle Magdalena Valley, where we also obtained positive responses in terms of production.
In the air injection pilot at Chichimene field, a detailed revision of the scope and of the works required was carried out due to the drop in global oil prices. During 2017, additional works will be completed and it is expected that the start of the injection will take place in the last quarter of 2017.
Since the beginning of the recovery factor increase program, we have started 34 recovery pilots, of which 24 have shown positive results in terms of pressure increase and 19 in incremental crude production.
Development Wells
The following table sets forth the number of gross and net development wells drilled exclusivelyin Colombia, both solely by Ecopetrol S.A. and bywith its joint ventures in Colombiathat reached total depth for the years ended December 31, 2014, 20132016, 2015 and 2012.2014.
DEVELOPMENT WELLSTable 10 – Ecopetrol S.A.’s Gross and Net Development Wells in Colombia
| For the year ended December 31, | ||||||||||||||||||||||||
| For the year ended December 31, | 2016 | 2015 | 2014 | |||||||||||||||||||||
| 2014 | 2013 | 2012 | (number of wells) | |||||||||||||||||||||
| COLOMBIA | ||||||||||||||||||||||||
| Central Region | ||||||||||||||||||||||||
| Gross wells owned and operated by Ecopetrol | 104 | 67 | 47 | - | 79 | 104 | ||||||||||||||||||
| Orinoquía Region | ||||||||||||||||||||||||
| Gross wells owned and operated by Ecopetrol | 65 | 77 | 134 | 47 | 109 | 65 | ||||||||||||||||||
| Southern Region | ||||||||||||||||||||||||
| Gross wells owned and operated by Ecopetrol | 8 | 2 | 1 | - | 21 | 8 | ||||||||||||||||||
| Eastern Region | ||||||||||||||||||||||||
| Gross wells owned and operated by Ecopetrol | 36 | - | - | |||||||||||||||||||||
| Total gross wells owned and operated by Ecopetrol S.A. in Colombia | 83 | 209 | 177 | |||||||||||||||||||||
| Associated Operations | ||||||||||||||||||||||||
| Gross wells in joint ventures | 584 | 628 | 541 | 50 | 330 | 584 | ||||||||||||||||||
| Net wells(1) | 374 | 404 | 412 | 19 | 146 | 374 | ||||||||||||||||||
| Total Ecopetrol S.A. | ||||||||||||||||||||||||
| Total gross wells owned and operated by Ecopetrol S.A in Colombia | 177 | 146 | 182 | |||||||||||||||||||||
| Total gross wells in joint ventures Ecopetrol S.A in Colombia | 584 | 628 | 541 | |||||||||||||||||||||
| Total net wells Ecopetrol S.A. in Colombia | 374 | 404 | 412 | |||||||||||||||||||||
| Total gross wells in joint ventures Ecopetrol S.A. in Colombia | 50 | 330 | 584 | |||||||||||||||||||||
| Total net wells in joint ventures Ecopetrol S.A. in Colombia(1) | 19 | 146 | 374 | |||||||||||||||||||||
| Total gross wells Ecopetrol S.A. in Colombia | 133 | 539 | 761 | |||||||||||||||||||||
| Total net wells Ecopetrol S.A. in Colombia(1) | 102 | 355 | 551 | |||||||||||||||||||||
(1) | Net wells correspond to the sum of wells |
| 18 |
Production Acreage
The following table sets forth Ecopetrol S.A.’s developed and undeveloped gross and net acreage of crude oil and natural gas production in Colombia for the year ended December 31, 2014.2016.
| Production Acreage as of December 31, 2014 (in acres) | ||||||||||||||||
| Developed | Undeveloped | |||||||||||||||
| Gross | Net | Gross | Net | |||||||||||||
| Ecopetrol S.A. | 411,114 | 309,127 | 4,994,487 | 3,563,224 | ||||||||||||
Table 11 – Ecopetrol S.A.’s Developed and Undeveloped Gross
and Net Acreage of Crude Oil and Natural Gas Production in Colombia
| Production Acreage as of December 31, 2016 ( acres) | ||||||||||||||||
| Developed | Undeveloped | |||||||||||||||
| Gross | Net | Gross | Net | |||||||||||||
| Ecopetrol S.A. | 448,782 | 343,233 | 5,040,681 | 3,679,116 | ||||||||||||
Gross and Net Productive Wells
The following table sets forth Ecopetrol S.A.’s total gross and net productive wells by region as of December 31, 2014.2016.
| As of December 31, 2014 | ||||||||||||||||
Crude Oil(1) | Natural Gas(2) | |||||||||||||||
| Gross | Net | Gross | Net | |||||||||||||
| COLOMBIA | ||||||||||||||||
| Ecopetrol S.A. | ||||||||||||||||
| Central region | 2,122 | 2038 | 3 | 3 | ||||||||||||
| Orinoquía region | 763 | 759 | 0 | 0 | ||||||||||||
| Southern region | 663 | 529 | 1 | 1 | ||||||||||||
| Region of Associated Operations | 3,441 | 1,837 | 37 | 21 | ||||||||||||
| Total (Ecopetrol S.A.) | 6,989 | 5,163 | 41 | 25 | ||||||||||||
Table 12 – Ecopetrol S.A.’s Gross and Net Productive Wells by Region
| As of December 31, 2016 (number of wells) | ||||||||||||||||
| Crude Oil(1) | Natural Gas(2) | |||||||||||||||
| Gross | Net | Gross | Net | |||||||||||||
| COLOMBIA | ||||||||||||||||
| Ecopetrol S.A. | ||||||||||||||||
| Central region | 2,286 | 1,807 | 9 | 9 | ||||||||||||
| Orinoquía region | 952 | 946 | 17 | 17 | ||||||||||||
| Southern region | 583 | 520 | 6 | 6 | ||||||||||||
| Eastern Region | 780 | 780 | 0 | 0 | ||||||||||||
| Region of Associated Operations | 2,829 | 1,425 | 27 | 10 | ||||||||||||
| Total (Ecopetrol S.A.) | 7,430 | 5,478 | 59 | 42 | ||||||||||||
Note: The above table reflects the productive wells that directly contribute to hydrocarbon production and therefore excludes wells used for injection, disposal, water abstraction, or other similar activities.
| Note: | The above table reflects the productive wells that directly contribute to hydrocarbon production and therefore excludes wells used for injection, disposal, water abstraction, or other similar activities. |
| (1) | We consider crude oil wells to be those in which the main operation is oil production, although many of these wells produce gas associated with oil production that, in some cases, have a commercial purpose. |
| (2) | Natural gas wells are those in which operations are directed only toward the production of commercial gas. |
| 3.4.2.1.2. | Ecopetrol S.A.’s Affiliates and Subsidiaries’ Production Activities in Colombia |
Crude Oil Production
The following table sets forth our average daily crude oil production from Hocol and Equión,Equion, prior to deducting royalties, for the periods indicated.
| For the year ended December 31, | ||||||||||||
| 2014 | 2013 | 2012 | ||||||||||
| (thousand bpd) | ||||||||||||
| COLOMBIA | ||||||||||||
| Hocol | - | |||||||||||
| Joint venture operation | 2.5 | 2.6 | 2.8 | |||||||||
| Direct operation | 18.8 | 18.6 | 22.0 | |||||||||
| Total Hocol | 21.3 | 21.2 | 24.8 | |||||||||
| Equión | ||||||||||||
| Joint venture operation | - | - | - | |||||||||
| Direct operation | 10.0 | 10.1 | 10.6 | |||||||||
| Total Equión | 10.0 | 10.1 | 10.6 | |||||||||
| Production tests | - | - | 2.1 | |||||||||
| Total average daily crude oil production (Subsidiaries in Colombia) | 31.3 | 31.3 | 37.5 | |||||||||
Table 13 – Ecopetrol S.A.’s Subsidiaries in Colombia Average Daily Crude Oil Production
| For the year ended December 31, | ||||||||||||
| 2016 | 2015 | 2014 | ||||||||||
| (thousand bpd) | ||||||||||||
| Hocol | ||||||||||||
| Joint venture operation | 2.6 | 2.1 | 2.5 | |||||||||
| Direct operation | 15.4 | 19.3 | 18.8 | |||||||||
| Total Hocol | 18.0 | 21.4 | 21.3 | |||||||||
| Equion | ||||||||||||
| Joint venture operation | 0.1 | – | – | |||||||||
| Direct operation | 12.3 | 11.6 | 10.0 | |||||||||
| Total Equion | 12.4 | 11.6 | 10.0 | |||||||||
| Production Tests | – | – | – | |||||||||
| Total Average Daily Crude Oil Production (Subsidiaries in Colombia) | 30.4 | 33 | 31.3 | |||||||||
| 19 |
The 15.4% decrease in Hocol’s production decrease in 2013 was mainly the result of (1) the end of the term of the contract relating to the Palermo field; the production of that field is now a 100% owned by the Group through Ecopetrol S.A. and (2) the natural decline in Ocelote’s production (Hocol’s main production contract).
Equión’s 0.1% production decrease in 20142016 as compared to 20132015 was mainly due to lower base peoductionthe temporary closure of the fields Guarrojo, Ortega, Toldado, Toy, Quimbaya and Puli as a result of community blockages and governmental resolutions (Constitutional Court) which were lifted afterwards.
The 7% increase in Equion’s production in 2016 as compared to 2015 was mainly due to the Cusianastart of production of a new well and Recetor fields.the increase of three wells previously drilled as a result of specific interventions.
Natural Gas Production
The following table sets forth our subsidiaries’ average daily natural gas production, prior to deducting royalties, for the periods indicated.
| For the year ended December 31, | ||||||||||||
| 2014 | 2013 | 2012 | ||||||||||
| (Thousand boepd )(1) | ||||||||||||
| Hocol | ||||||||||||
| Joint venture operation | - | - | 0 | |||||||||
| Direct operation | 0.1 | 0.2 | 1.3 | |||||||||
| Total Hocol | 0.1 | 0.2 | 1.3 | |||||||||
| Equión | ||||||||||||
| Joint venture operation | - | - | - | |||||||||
| Direct operation | 7.8 | 7.5 | 7.3 | |||||||||
| Total Equión | 7.8 | 7.5 | 7.3 | |||||||||
| Production Tests | - | - | - | |||||||||
| Total Natural Gas Production (Subsidiaries in Colombia) | 7.9 | 7.7 | 8.6 | |||||||||
Table 14 – Ecopetrol S.A.’s Subsidiaries in Colombia Average Daily Natural Gas Production
| For the year ended December 31, | ||||||||||||
| 2016 | 2015 | 2014 | ||||||||||
| (thousand boepd)(1) | ||||||||||||
| Hocol | ||||||||||||
| Joint venture operation | 0.2 | – | – | |||||||||
| Direct operation | 0.6 | 0.2 | 0.1 | |||||||||
| Total Hocol | 0.8 | 0.2 | 0.1 | |||||||||
| Equion | ||||||||||||
| Joint venture operation | 0.1 | – | – | |||||||||
| Direct operation | 6.4 | 9 | 7.8 | |||||||||
| Total Equion | 6.5 | 9 | 7.8 | |||||||||
| Production Tests | – | – | – | |||||||||
| Total Natural Gas Production (Subsidiaries in Colombia) | 7.3 | 9.2 | 7.9 | |||||||||
Note: Conversion between mcfpd and boepd is performed at 5,700 mcfpd to 1 boepd.
| (1) | Conversion between mcfpd and boepd is performed at 5,700 mcfpd to 1 boepd. |
Development Wells
The following table sets forth the number of gross and net productive and dry development wells drilled exclusively by our subsidiaries and in their joint ventures in Colombia for the periods indicated.
| For the year ended December 31, | ||||||||||||
| 2014 | 2013 | 2012 | ||||||||||
| Hocol | ||||||||||||
| Gross wells owned and operated by Hocol | 16 | 18 | 25 | |||||||||
| Gross wells in joint ventures | 6 | 4 | 5 | |||||||||
| Net wells(1) | 17 | 18 | 24 | |||||||||
| Equión | ||||||||||||
| Gross wells owned and operated by Equión | 2 | 6 | 3 | |||||||||
| Gross wells in joint ventures | - | - | - | |||||||||
| Net wells(1) | 1 | 2 | 2 | |||||||||
| Total gross wells owned and operated in Colombia | 18 | 24 | 28 | |||||||||
| Total gross wells in joint ventures in Colombia | 6 | 4 | 5 | |||||||||
| Total net wells (Subsidiaries in Colombia) | 18 | 20 | 26 | |||||||||
Table 15 – Ecopetrol S.A.’s Subsidiaries in Colombia Gross and Net Development Wells
| For the year ended December 31, | ||||||||||||
| 2016 | 2015 | 2014 | ||||||||||
| (number of wells) | ||||||||||||
| Hocol | ||||||||||||
| Gross wells owned and operated by Hocol | 9 | 13 | 16 | |||||||||
| Gross wells in joint ventures | – | 1 | 6 | |||||||||
| Net wells(1) | 9 | 13 | 17 | |||||||||
| Equion | ||||||||||||
| Gross wells owned and operated by Equion(2) | – | – | – | |||||||||
| Gross wells in joint ventures | 1 | 5 | 2 | |||||||||
| Net wells(1) | – | 1 | 1 | |||||||||
| Total gross wells owned and operated in Colombia | 9 | 13 | 16 | |||||||||
| Total gross wells in joint ventures in Colombia | 1 | 6 | 8 | |||||||||
| Total net wells (Subsidiaries in Colombia) | 9 | 14 | 18 | |||||||||
| (1) | Net wells correspond to the sum of wells owned and operated by our subsidiaries and their ownership percentage of wells owned in joint ventures with their partners. | |
| (2) | Even though for the last three years Equion has operated every well, Equion has not owned any well 100%; rather Equion has drilled wells in joint venture with Ecopetrol. Therefore, after a careful review of the categories, all Equion data was moved from gross wells owned and operated by Equion to gross wells in joint ventures. However, the number of wells remains the same. |
| 20 |
Production Acreage
The following table sets forth our subsidiaries’ developed and undeveloped gross and net acreage of crude oil and natural gas production in Colombia by region for the year ended December 31, 2014.2016.
| Production acreage as of December 31, 2014 | ||||||||||||||||
| Developed | Undeveloped | |||||||||||||||
| Gross | Net | Gross | Net | |||||||||||||
| (in acres) | ||||||||||||||||
| Hocol | 4,391 | 4,021 | 933 | 912 | ||||||||||||
| Equión | 21,757 | 8,590 | 119,651 | 48,445 | ||||||||||||
| Total (Subsidiaries in Colombia) | 26,148 | 12,611 | 120,584 | 49,357 | ||||||||||||
Table 16 – Ecopetrol S.A.’s Subsidiaries in Colombia Developed and Undeveloped Gross and Net Acreage of Crude Oil and Natural Gas Production
| Production acreage as of December 31, 2016 | ||||||||||||||||
| Developed | Undeveloped | |||||||||||||||
| Gross | Net | Gross | Net | |||||||||||||
| (in acres) | ||||||||||||||||
| Hocol | 18,787.4 | 8,547.0 | 346.8 | 329.6 | ||||||||||||
| Equion | 20,867.4 | 5,269.0 | 84,826.9 | 19,853.0 | ||||||||||||
| Total (Subsidiaries in Colombia) | 39,654.8 | 13,816.0 | 85,173.7 | 20,182.6 | ||||||||||||
Gross and Net Productive Wells
The following table sets forth our subsidiaries’ total gross and net productive wells in Colombia for the year ended December 31, 2014.2016. We consider crude oil wells to be those in which the main operation is oil production, although many of these wells produce gas associated with oil production that, in some cases, have a commercial purpose. Natural gas wells are those in which operations are directed only towards production of commercial gas. Information in the table below reflects productive wells that directly contribute to hydrocarbons production and therefore excludes wells used for injection, disposal, water abstraction, or other similar activities.
| As of December 31, 2014 | ||||||||||||||||
| Crude Oil | Natural Gas | |||||||||||||||
| Gross | Net | Gross | Net | |||||||||||||
| Hocol | 213 | 139 | 1 | 1 | ||||||||||||
| Equión | 43 | 13 | - | - | ||||||||||||
| Total Subsidiaries in Colombia | 256 | 152 | 1 | 1 | ||||||||||||
Table 17 – Ecopetrol S.A.’s Subsidiaries in Colombia Gross and Net Productive Wells
| For the year ended December 31, 2016 | ||||||||||||||||
| Crude Oil | Natural Gas | |||||||||||||||
| Gross | Net | Gross | Net | |||||||||||||
| (number of wells) | ||||||||||||||||
| Hocol | 231 | 163.9 | 5 | 4.5 | ||||||||||||
| Equion | 22 | 11 | 22 | 11 | ||||||||||||
| Total (Subsidiaries in Colombia) | 253 | 174.9 | 27 | 15.5 | ||||||||||||
| 21 |
| 3.4.2.2 | Production Activities Outside Colombia |
Crude Oil Production
The following table sets forth our average daily crude oil production outside Colombia, prior to deducting royalties, for the periods indicated.
| For the year ended December 31, | ||||||||||||
| 2014 | 2013 | 2012 | ||||||||||
| (thousand bpd) | ||||||||||||
| Savía Perú | 5.9 | 5 | 6 | |||||||||
| Ecopetrol America Inc. | 2.6 | 1.4 | 2 | |||||||||
| Total average daily crude oil production (International) | 8.5 | 6.4 | 8 | |||||||||
Table 18 – Ecopetrol S.A.’s Subsidiaries Outside Colombia Average Daily Crude Oil Production
| For the year ended December 31, | ||||||||||||
| 2016 | 2015 | 2014 | ||||||||||
| (thousand bpd) | ||||||||||||
| Savia Perú | 4.1 | 4.8 | 5.9 | |||||||||
| Ecopetrol America Inc. | 5.5 | 2.5 | 2.6 | |||||||||
| Total average daily crude oil production (International) | 9.6 | 7.3 | 8.5 | |||||||||
Natural Gas Production
The following table sets forth our average daily natural gas production outside Colombia, prior to deducting royalties, for the periods indicated.
| For the year ended December 31, | ||||||||||||
| 2014 | 2013 | 2012 | ||||||||||
| (Thousand boepd )(1) | ||||||||||||
| Savía Perú | 0.5 | 0.3 | 1 | |||||||||
| Ecopetrol America Inc. | 2.1 | 0.2 | 0.2 | |||||||||
| Total average daily crude oil production (International) | 2.6 | 0.5 | 1.2 | |||||||||
Table 19 – Ecopetrol S.A.’s Subsidiaries Outside Colombia Average Daily Natural Gas Production
| For the year ended December 31, | ||||||||||||
| 2016 | 2015 | 2014 | ||||||||||
| (thousand boepd) | ||||||||||||
| Savia Perú | 1.3 | 1.2 | 0.5 | |||||||||
| Ecopetrol America Inc. | 1.2 | 2.6 | 2.1 | |||||||||
| Total average daily natural gas production (International) | 2.5 | 3.8 | 2.6 | |||||||||
Development Wells
The following table sets forth the number of gross and net productive and dry development wells outside Colombia, drilled exclusively by us and in joint ventures for the periods indicated. Information in the table below reflects productive wells that directly contribute to hydrocarbons production and therefore excludes wells used for injection, disposal, water abstraction, or other similar activities.
| For the year ended December 31, | ||||||||||||
| 2014 | 2013 | 2012 | ||||||||||
| Savía Perú | - | |||||||||||
| Gross wells | 13 | 20 | 18 | |||||||||
| Net wells(1) | 6.5 | 10 | 9 | |||||||||
| Ecopetrol America Inc. | - | |||||||||||
| Gross wells | - | - | - | |||||||||
| Net wells(1) | - | - | - | |||||||||
| Total gross wells (International) | 13 | 20 | 18 | |||||||||
| Total net wells (International) | 6.5 | 10 | 9 | |||||||||
Table 20 – Ecopetrol S.A.’s Subsidiaries Outside Colombia Gross and Net Development Wells
| For the year ended December 31, | ||||||||||||
| 2016 | 2015 | 2014 | ||||||||||
| (number of wells) | ||||||||||||
| Savia Perú | ||||||||||||
| Gross wells | - | - | 13 | |||||||||
| Net wells(1) | - | - | 6.5 | |||||||||
| Ecopetrol America Inc. | ||||||||||||
| Gross wells | 3 | 2 | - | |||||||||
| Net wells(1) | 0.7 | 0.4 | - | |||||||||
| Total gross wells (International) | 3 | 2 | 13 | |||||||||
| Total net wells (International) | 0.7 | 0.4 | 6.5 | |||||||||
| (1) | Net wells correspond to the sum of wells entirely owned by us or our subsidiaries and our ownership percentage of wells owned in joint ventures with our partners. |
| 22 |
Production Acreage
The following table sets forth our developed and undeveloped gross and net acreage of crude oil and natural gas production outside Colombia by region for the year ended December 31, 2014.2016.
| Production acreage as of December 31, 2014 | ||||||||||||||||
| Developed | Undeveloped | |||||||||||||||
| Gross | Net | Gross | Net | |||||||||||||
| (in acres) | ||||||||||||||||
| Savía Perú | 81,180 | 40,590 | 3,935 | 3,935 | ||||||||||||
| Ecopetrol America Inc.(1) | 43,920 | 8,835 | 41,300 | 10,340 | ||||||||||||
| Total (International) | 12,5100 | 49,425 | 45,235 | 14,275 | ||||||||||||
Table 21 – Ecopetrol S.A.’s Subsidiaries Outside Colombia Developed and Undeveloped Gross and Net Acreage of Crude Oil and Natural Gas Production
| Production acreage as of December 31, 2016 | ||||||||||||||||
| Developed | Undeveloped | |||||||||||||||
| Gross | Net | Gross | Net | |||||||||||||
| (in acres) | ||||||||||||||||
| Savia Perú | 137,246 | 79,575 | 57,671 | 0 | ||||||||||||
| Ecopetrol America Inc.(1) | 49,680 | 10,645 | 18,261 | 5,736 | ||||||||||||
| Total (International) | 186,926 | 90,220 | 75,932 | 5,736 | ||||||||||||
(1) | Production and acreage from Ecopetrol America Inc. is related to the K2, Dalmatian and Gunflint field blocks in the Gulf of Mexico. For K2, there are |
Gross and Net Productive Wells
The following table sets forth our total gross and net productive wells outside Colombia for the year ended December 31, 2014.2016.
| As of December 31, 2014 | ||||||||
| Crude Oil | ||||||||
| Gross | Net | |||||||
| INTERNATIONAL | ||||||||
| Savía Perú | 650 | 325 | ||||||
| Ecopetrol America Inc. | 9 | 1.2 | ||||||
| Total (International) | 659 | 326.2 | ||||||
Table 22 – Ecopetrol S.A.’s Subsidiaries Outside Colombia Gross and Net Productive Wells
| As of December 31, 2016 | ||||||||
| Crude Oil | ||||||||
| Gross | Net | |||||||
| (number of wells) | ||||||||
| INTERNATIONAL | ||||||||
| Savia Perú | 639 | 320 | ||||||
| Ecopetrol America Inc. | 14 | 2.4 | ||||||
| Total (International) | 653 | 322.4 | ||||||
| 3.4.2.3 | Marketing of Crude Oil, |
In 2014, 96% of2016, Ecopetrol S.A.’s income was based on sales of crude oil, gas and products (including fuels and petrochemicals). Total sales revenue amounted to $58 trillion Pesos, representing a decrease of 7.1% as compared to 2013. In 2014, Ecopetrol S.A. sold 913962.5 mboepd, out of which 521 mboepd449.7 mbopd represented sales of crude oil 291 mboepd products and the remaining 101(46.7%), 77.8 mboepd natural gas (equivalent to 730.4 gbtud out(8.1%) and 435.0 mboepd of which 666.4 correspond to domestic salesfuels and 64 to exports)petrochemicals (45.2%).
Ecopetrol S.A.’s natural gas sales grew 11% (10 mboepd) compared with 2013. Export sales of crude (excluding sales to the free trade zone) increased about 1.4% (6.6 mboepd), as compared with 2013. Domestic crude sales rose 42.5% (14.5 mboepd) due to synergies with companies such as Hocol and Equion in order to improve transportation volumes and the cost of transportation.
Products sales in 2014 were 291.3 mboepd, an increase of 5.2% compared with 2013. Domestic sales of products increased 9.3 mboepd (an increase of 4.3%) mainly due to growth in demand for gasoline and diesel. Exports (excluding sales to the free trade zone) increased 4 mboepd, an increase of 6.8% as compared to 2013, due to higher fuel oil production.
Crude Oil Export Sales
OurExport sales of crude oil in 2016 decreased by 101 mbopd as compared to 2015 primarily due to the crude Castilla blend and the Vasconia Norte blend being used as part of the slate for Reficar and therefore not available for exporting activities. Ecopetrol’s crude oil export sales are madetraded both in the spot market and through long term contracts,contract markets, primarily to refiners in the United States, Asia, the U.S. Gulf Coast, Europe, LatinCentral America and the U.S. West Coast.Caribbean.
The Castilla blend is the principal sourcetype of crude oil for foreign sales, of crude, with 337 mboepd330.8 mbopd sold during 20142016 (a 73%74% share of our crude oil basket) representing a 1.6 mboepd decrease as compared with 2013), followed by the Vasconia Norte with 70 mboepd (a 15%32.3 mbopd (an 7% share in our crude oil basket), representing a 63 mboepd increase as compared to 2013. These sales offset lower exports of Vasconia crude, which totaled 4 mboepd, and the Magdalena Blend, which totaled 22 mboepd during 2014.
The priceblend with 24 mbopd (a 5% share of our crude export basket decreased by $12.8/BL, as compared to 2013, due to a general decline in international prices.oil basket).
A strategy of market diversification strategy has allowed Ecopetrol S.A. to continue switching sales of oil from the Gulf Coast ofshift towards markets where it captures a better value for its crudes. The United States, decreasing,Europe, Central America and Caribbean were destinations that showed an increase in terms ofour crude oil export volume, from 40%67% of total export sales in 20132015 to 27% in 2014. Importantly, the growth in crude sales to the Far East increased from 37% to 41%81% of total export sales in 2016. In contrast, other destinations, such as Asia, experienced a resultdecrease in volume mainly due to: (i) larger supply coming into this market from the Middle East and (ii) more opportunities for Ecopetrol S.A. to sell in the United States because of term contracts signed with companiesthe interest of refiners in China and India and other new Asian customers. Europe maintained its position as the third largest export destination with 15% of our total export sales.imported crude.
| 23 |
Crude Oil Purchase Contracts
Ecopetrol S.A. has signed a number ofseveral crude oil purchase contracts with certain of ourthird parties and business partners and third parties. Wepartners. Ecopetrol also purchasepurchases crude oil received by the ANH as royalties from us and other producers in Colombia. CrudeThis oil purchased from the ANH and our business partners is either processed in ourEcopetrol’s refineries or exported. The purchase price is calculatedcorresponds to export parity based on international market prices.prices, plus a commercial fee.
The term of some of our purchase contracts is linked to the term of the exploration and production contracts signed with our business partners. Other clauses of the contracts such as price and place of delivery vary and may be subject to renegotiation during the term of the contract. Certain purchase contracts not linked to joint venture agreements may be extended and renegotiated by the parties.
The table below sets forth the volumes of crude oil purchased from our business partners and third parties and volumes of crude oil purchased from the ANH corresponding to royalties for the years ended December 31, 2014, 20132016, 2015 and 2012.2014.
| For the year ended December 31, | ||||||||||||
| 2014 | 2013 | 2012 | ||||||||||
| (million barrels) | ||||||||||||
| Ecopetrol S.A.(1) | ||||||||||||
| Crude oil purchased from the ANH | 45.4 | 49.5 | 48.0 | |||||||||
| Crude oil purchased from our business partners and third parties | 20.3 | 18.9 | 25.4 | |||||||||
Table 23 – Ecopetrol Consolidated Crude Oil Purchases
| For the year ended December 31, | ||||||||||||
| 2016 | 2015 | 2014 | ||||||||||
| (million barrels) | ||||||||||||
| Ecopetrol Corporate Group | ||||||||||||
| Crude oil purchased from the ANH | 42.9 | 45.6 | 45.4 | |||||||||
| Crude oil purchased from third parties | 15.5 | 15.6 | 20.9 | |||||||||
| Crude oil imported from third parties | 22 | 1.8 | - | |||||||||
Import of Diluents
In 2014 we increased2016, Ecopetrol decreased by 15.7% (812.3% (7.9 mboepd) the imports of diluents (principally naphtha) used to allow our heavy crudes to be pumped through pipelines.
Natural Gas Sales
In 2014, Ecopetrol supplied 666.4 gbtud of the total natural gas demand in Colombia (excluding exports), representing a market share of 63.1% in 2014pipelines, as compared to 51.4%2015, due to an increase in 2013, with production used for our own consumption by refineries and for sale to natural gas distributors, for compressed natural gas for vehicles, to power plants, to the industrial sector and for export. Our market shareviscosity specifications in 2014, including foreign sales, was 63.3% and 54.4% in 2013.the transport of heavy crude oil.
Natural Gas Sales
Demand for natural gas in 2014 registered a decrease of 6.1% compared to the previous year, resulting in demand of 1,153 gbtud in 2014. For 2013 and 2012, demand for natural gas was 1,228 gbtud and 1,090 gbtud, respectively. The decrease in demand in 2014 was resulted from a decrease of approximately 52% in the quantities of natural gas exported to Venezuela as a result of less availability from the Guajira field.
We sellEcopetrol sells natural gas to distribution companies through firm, interruptible and conditional contracts. Today there are more than 30 natural gas distribution companies with operations in Colombia. ThoseThese distributors supply natural gas to the residential market, for compressed natural gas for vehicles and to industries in Colombia. We also market and sell natural gas to the industrial sector and to gas-fired and combined cycle power plants.
We also export natural gas. In 2007, we and our partner Chevron entered into a long-termDespite higher demand by thermal power plants due to “El Niño” climate phenomenon, Ecopetrol’s natural gas supply contract with PDVSA. This contract was amended in June 2014 so that it expiressales decreased 15.9% (14.7 mboepd) as compared to 2015 due to the decline of production at the Guajira field, restrictions on June 30, 2015. In 2014, we and Chevron delivered 98 gbtud to PDVSA, exceeding the quantity oftransporting natural gas we agreedby pipeline to supplydispatch natural gas from fields found in our gas export contract. Of the total volumeinner part of gas deliveredColombia and the decrease in 2014 to PDVSA, 66% came from us and 34% came from Chevron. In 2013 and 2012, we and Chevron delivered 204 gbtud and 186 gbtud respectively. Pursuant to the termsconsumption of the agreement, Chevron assumes 43%,industrial and Ecopetrol 57%, of the responsibilityvehicular sectors. Our market share in 2016 was 64% as compared to deliver natural gas to PDVSA.63% in 2015.
Natural Gas Delivery Commitments
In August 2013 CREG issued natural gas sale guidelines through Resolution 089 of 2013. In accordance with those guidelines, a marketing process for natural gas was held during 2014, in which 63 contracts were signed with 16 different companies. Through that process, we sold 100% of Ecopetrol’s Guajira gas (97.2 gbtud available for commitments of one year or less and 26.7 gbtud available for commitments of five years) and 65% of the Ecopetrol’s Cusiana and Cupiagua gas available for one year (17.1 gbtud) and 100% of gas available for five or more years (62.3 gbtud). Those commitments are in addition to the existing agreements (52.6 gbtud from Guajira and 233.8 gbtud from Cusiana/Cupiagua) due to expire in 2018.
The table below sets forth the commitments Ecopetrol S.A. haswe have in Colombia under firm contracts with local natural gas distribution companies, local industries, gas fired power generators, international companies, including PDVSA in Venezuela, and internal agreements with our refineries and fields.
| For the year ended December 31, | ||||||||||||||||
| 2015 | 2016 | 2017 | 2018 | |||||||||||||
| (gbtud) | ||||||||||||||||
| Volume for sales third parties | 374 | 374 | 374 | 374 | ||||||||||||
| Volume for self-consumption | 209 | 225 | 228 | 334 | ||||||||||||
| Total Commitments | 583 | 599 | 602 | 708 | ||||||||||||
| 24 |
The following
Table 24 – Ecopetrol Consolidated Natural Gas Delivery Commitments
| For the year ended December 31, | ||||||||||||||||
| 2017 | 2018 | 2019 | 2020 | |||||||||||||
| (gbtud) | ||||||||||||||||
| Volume for sales third parties | 475.2 | 464.2 | 246.2 | 190.2 | ||||||||||||
| Volume for self-consumption | 224.4 | 231.4 | 225.4 | 265.4 | ||||||||||||
| Total Commitments | 699.6 | 695.6 | 471.6 | 455.6 | ||||||||||||
Neither Ecopetrol America, Equion nor Savia Peru are included in the table sets forthabove since they do not consolidate within Ecopetrol Group. In respect of Ecopetrol America Inc., it does not have any natural gas delivery or supply commitments.
Refined Products
Domestic sales of refined products increased by 3.6 mboepd, an increase of 1.2% compared with 2015. This increase is primarily the result of: (i) a 10%, or 10.2 mboepd, increase in gasoline sales mainly due to a 13% decrease in gasoline prices as compared to 2015 and less production of ethanol for blending, (ii) a 5%, or 1.3 mboepd increase, in fuel sales mainly due to a 5% increase in the number of passengers transported as compared to 2015 and a 2% increase in air freight as compared to 2015, (iii) a 28%, or 1.3 mboepd, increase in fuel oil sales mainly as a result of new contracts and higher domestic deliveriesfuel sales at Reficar, and (iv) a 1.9%, or 0.3 mboepd, increase in LPG sales mainly due to an increase in production at Reficar. These increases were partially offset by a 6%, or 7.5 mboepd, decrease in diesel sales mainly due to the freight land transportation strike in June and July 2016 and lower than expected economic growth.
Exports of products increased by 93.7% as compared to 2015, due to 74 mboepd increase by Reficar mainly due to: (i) the finalization of the entire expansion and modernization project, followed by the startup process completed in July 2016, thereby advancing to the stabilization phase, and (ii) an increase in Propilco’s exports of close to 0.6 mboepd in 2016 (9.9 mboepd vs. 9.3 mboepd of 2015). This increase was partially offset by a decrease in fuel oil exports by 6 mboepd, or 10%, due to lower fuel oil production in the Barrancabermeja Refinery.
In addition, local sales of petrochemicals (included in domestic sales of products) decreased as compared to the previous year (19.2 mboepd in 2016 compared with 21.7 mboepd in 2015), due to a decrease in asphalt and aromatic solvents sales by Ecopetrol S.A. of natural gas, including deliveries to our refineries, for the periods indicated. and a decrease in Propilco’s sales.
| For the year ended December 31, | ||||||||||||
| 2014 | 2013 | 2012 | ||||||||||
| (gbtud) | ||||||||||||
| Gas-fired power plants | 131.0 | 103.1 | 86.1 | |||||||||
| Refineries | 123.1 | 119.1 | 116.8 | |||||||||
| Petrochemical | 2.7 | 3.2 | 1.6 | |||||||||
| Industrial | 255.2 | 152.7 | 157.0 | |||||||||
| Distributors(1) | 85.3 | 102.8 | 78.1 | |||||||||
| Compressed Natural Gas for vehicles | 69.0 | 40.5 | 39.2 | |||||||||
| Producers | - | 5.3 | 5.4 | |||||||||
| Total Deliveries | 666.4 | 526.8 | 484.2 | |||||||||
| 3.4.3 | Reserves |
The reserves audit process was conducted in accordance with SEC definitions and rules set forth in Rule 4-10(a) of Regulation S-X and the disclosure guidelines contained in the SEC’s Modernization of Oil and Gas Reporting final rule dated December 31, 2008 and effective as of January 1, 2010.
The estimated reserve amounts presented in this report, as of December 31, 2014,2016, are based on the average prices during the 12-month period prior to the ending date of the period covered in this report, determined as the unweighted arithmetic averages of the prices in effect on the first-day-of-the-monthfirst day of the month for each month within such period, unless prices were defined by contractual arrangements, as required by the SEC regulations. See Note 22—Memorandum accounts,to the consolidated financial statements.
Our crude oil and natural gas net proved reserves include reserves from our subsidiaries located in the United States (Gulf of Mexico) and Peru, and EquiónEquion and Hocol’s assets in Colombia.
| 25 |
Estimated Net Proved Reserves
The following table sets forth our estimated net proved developed reserves (developed and undeveloped) of crude oil and gas by region for the years ended December 31, 2014, 20132016, 2015 and 2012.2014.
| Net Proved Developed Reserves | Colombia | North America | South America excluding Colombia | Total | ||||||||||||
| Net Proved Developed oil and NGL reserves in million barrels oil equivalent | ||||||||||||||||
| At December 31, 2012 | 922 | 1 | 10 | 933 | ||||||||||||
| At December 31, 2013 | 921 | 1 | 10 | 933 | ||||||||||||
| At December 31, 2014 | 1,030 | 2 | 10 | 1,042 | ||||||||||||
| Net Proved Developed gas reserves in billion standard cubic feet | ||||||||||||||||
| At December 31, 2012 | 2,524 | 2 | 10 | 2,536 | ||||||||||||
| At December 31, 2013 | 2,654 | 2 | 7 | 2,663 | ||||||||||||
| At December 31, 2014 | 3,260 | 14 | 9 | 3,284 | ||||||||||||
| Net Proved Developed oil, NGL and gas reserves in million barrels oil equivalent | ||||||||||||||||
| At December 31, 2012 | 1,365 | 1 | 12 | 1,378 | ||||||||||||
| At December 31, 2013 | 1,387 | 2 | 11 | 1,400 | ||||||||||||
| At December 31, 2014 | 1,602 | 5 | 12 | 1,618 | ||||||||||||
Table 25 – Net Proved Developed Reserves
| Net Proved Developed Reserves | Colombia | North America | South America excluding Colombia | Total | ||||||||||||
| Net Proved Developed oil reserves in million barrels oil equivalent | ||||||||||||||||
| At December 31, 2014 | 967 | 2 | 10 | 979 | ||||||||||||
| At December 31, 2015 | 849 | 3 | 6 | 858 | ||||||||||||
| At December 31, 2016 | 710 | 6 | 7 | 723 | ||||||||||||
| Net Proved Developed NGL reserves in million barrels oil equivalent | ||||||||||||||||
| At December 31, 2014 | 62 | 0 | 1 | 63 | ||||||||||||
| At December 31, 2015 | 54 | 0 | 1 | 55 | ||||||||||||
| At December 31, 2016 | 55 | 0 | 1 | 56 | ||||||||||||
| Net Proved Developed gas reserves in billion standard cubic feet | ||||||||||||||||
| At December 31, 2014 | 3,260 | 14 | 9 | 3,284 | ||||||||||||
| At December 31, 2015 | 3,156 | 16 | 5 | 3,176 | ||||||||||||
| At December 31, 2016 | 3,114 | 9 | 8 | 3,131 | ||||||||||||
| Net Proved Developed oil, NGL and gas reserves in million barrels oil equivalent | ||||||||||||||||
| At December 31, 2014 | 1,602 | 5 | 12 | 1,618 | ||||||||||||
| At December 31, 2015 | 1,457 | 5 | 7 | 1,470 | ||||||||||||
| At December 31, 2016 | 1,311 | 8 | 10 | 1,329 | ||||||||||||
The conversion rate used is 5,700 standard cubic feet = 1 barrel of oil equivalent.
We are required, as are all oil companies undertaking exploratory and production activities in Colombia, to pay a percentage of our production to the Government as royalties. However, the ANH’s Resolution 877 of 2013, Resolution 351 of 2014 and Resolution 640 of 2014 require natural gas royalties to be paid in cash, which means that the determination of the property rights to the quantities of natural gas we produce is based on the total volume produced without deductions on account of royalties. As a result, reported reserves increased by 148 million boe in 2014. The main producing gas fields are Cusiana, Cupiagua, Pauto, Chuchupa, Gibraltar, and Chuchupa, which represent 90%Ballena.
The Ministry of Mines and Energy is responsible for reviewing and approving the increasedesign of and tracks for crude oil pipelines in Colombia. The Ministry of Mines and Energy establishes transportation rates based on information provided by the service suppliers, with the tariffs based on the principle of cost recovery plus a reasonable rate of return.
In prior filings, Ecopetrol has used the tariffs set by the Ministry of Mines and Energy as transportation cost to be deducted from the crude benchmark price for the purpose of evaluating the economic production, economic life and reserves dueof Colombian assets.
Ecopetrol S.A. owns 100% of Cenit, a subsidiary that operates in Colombia and is dedicated to the changestorage and transportation of hydrocarbons through pipelines. Cenit provides transportation services for the entire Ecopetrol Group and we fully consolidate Cenit into our consolidated results of operations. Therefore, the difference between the tariffs set by the Ministry of Mines and Energy and the real transportation costs (fixed and variable operating expenses) does not affect our consolidated income statement. Thus, in presenting our reserves information in this annual report, we have used our real transportation costs, rather than the formregular tariffs set by the Ministry of royalty payments. For further information on the effect of this regulation on reserves, see the sectionBusiness Overview—ExplorationMines and Production—Reserves.Energy.
| 26 |
The following table summarizes our proved oil, NGL and natural gas reserves, which includes 234 billion standard cubic feet of fuel gas within our natural gas results and 671 billion cubic feet of royalties, as of December 31, 2014.2016.
| Reserves Category | Oil and NGL (million barrels) | Natural Gas (bcf) | Total Oil and Gas (Mmboe) | |||||||||
| PROVED DEVELOPED RESERVES | ||||||||||||
| Total (Colombia) | 1,030 | 3,260 | 1,602 | |||||||||
| Total (International) | 13 | 24 | 17 | |||||||||
| North America | 2 | 14 | 5 | |||||||||
| South America | 10 | 9 | 12 | |||||||||
| TOTAL PROVED DEVELOPED RESERVES | 1,042 | 3,284 | 1,618 | |||||||||
| PROVED UNDEVELOPED RESERVES | ||||||||||||
| Total (Colombia) | 401 | 230 | 442 | |||||||||
| Total (International) | 22 | 15 | 24 | |||||||||
| North America | 11 | 14 | 13 | |||||||||
| South America | 11 | 1 | 11 | |||||||||
| TOTAL PROVED UNDEVELOPED RESERVES | 423 | 245 | 466 | |||||||||
| TOTAL PROVED RESERVES | 1,465 | 3,529 | 2,084 | |||||||||
Table 26 – Proved Oil, NGL and Natural Gas Reserves
| Reserves Category | Oil (million barrels) | NGL (million barrels) | Natural Gas (bcf) | Total Oil and Gas (Mmboe) | ||||||||||||
| PROVED DEVELOPED RESERVES | ||||||||||||||||
| Total (Colombia) | 710 | 55 | 3,114 | 1,311 | ||||||||||||
| International: | ||||||||||||||||
| North America | 6 | 0 | 9 | 8 | ||||||||||||
| South America | 7 | 1 | 8 | 10 | ||||||||||||
| TOTAL PROVED DEVELOPED RESERVES | 723 | 56 | 3,131 | 1,329 | ||||||||||||
| PROVED UNDEVELOPED RESERVES | ||||||||||||||||
| Total (Colombia) | 238 | 13 | 85 | 266 | ||||||||||||
| International: | ||||||||||||||||
| North America | 3 | 0 | 2 | 3 | ||||||||||||
| South America | 0 | 0 | 0 | 0 | ||||||||||||
| TOTAL PROVED UNDEVELOPED RESERVES | 241 | 13 | 87 | 269 | ||||||||||||
| TOTAL PROVED RESERVES | 964 | 69 | 3,218 | 1,598 | ||||||||||||
Note: The conversion rate used is 5,700 cfstandard cubic feet = 1 boe.barrel of oil equivalent.
Reserves Replacement
The reserves replacement ratio is defined as the sum of additions and revisions of proved reserves divided by produced volumes in any given period. The following table presents the changes in reserves in each category relating to the reserve replacement ratio for the years 2014, 20132016, 2015 and 2012.2014.
Changes in Proved Reserves
| As of December 31 | ||||||||||||
| Consolidated Company (million barrels oil equivalent) | 2014 | 2013 | 2012 | |||||||||
| Revisions of previous estimates | 270 | 232 | 44 | |||||||||
| Purchase of Minerals | 0 | 9 | 0 | |||||||||
| Improved Recovery | 34 | 27 | 65 | |||||||||
| Extensions and discoveries | 51 | 75 | 143 | |||||||||
| Sales | 0 | (3 | ) | 0 | ||||||||
| Total reserves additions | 355 | 340 | 252 | |||||||||
| Production | (243 | ) | (245 | ) | (232 | ) | ||||||
| Net change in proved reserves | 112 | 95 | 20 | |||||||||
Table 27 – Changes in Proved Reserves
| As of December 31, | ||||||||||||
| 2016 | 2015 | 2014 | ||||||||||
| Consolidated Company (million barrels oil equivalent) | ||||||||||||
| Revisions of previous estimates | (54 | ) | (25 | ) | 270 | |||||||
| Improved Recovery | 11 | 16 | 34 | |||||||||
| Extensions and discoveries | 27 | 24 | 51 | |||||||||
| Total reserves additions | (16 | ) | 16 | 355 | ||||||||
| Production | (235 | ) | (251 | ) | (243 | ) | ||||||
| Net change in proved reserves | (251 | ) | (235 | ) | 112 | |||||||
The reserves replacement ratio for 20142016 was 1.46(0.07) compared to 1.390.06 in 2013.2015. The average replacement ratio for the last three years was 1.31.0.48.
| As of December 31 | ||||||||||||
| 2014 | 2013 | 2012 | ||||||||||
| Reserves replacement ratio (including purchase and sales) | ||||||||||||
| Annual | 1.46 | 1.39 | 1.08 | |||||||||
| Three year average | 1.31 | 1.37 | 1.55 | |||||||||
Table 28 – Reserves Replacement Ratio (including purchase and sales)
| As of December 31, | ||||||||||||
| 2016 | 2015 | 2014 | ||||||||||
| Annual | (0.07 | ) | 0.06 | 1.46 | ||||||||
| Three year average | 0.48 | 0.97 | 1.31 | |||||||||
| 27 |
Revisions of Previous Estimates
In 2014, net2016, revisions increasedreduced reserves by 27054 million boe. As discussed above, beginning on January 1, 2014, the royalties associated with natural gas and NGL are required to be paid to the ANH in cash, and are therefore considered a financial obligation and are no longer deducted from net reserves. Asboe, mainly as a result reported reserves increased by 148 million boe in 2014. New development projects in Caño Sur, Moriche, Quifa, Rubiales, Provincia and Palagua fields resulted in a 91 million boe increase in reserves.of:
| (i) | A decrease of 157 million boe, due to: (i) economic factors, primarily the decrease in oil prices, leading to a 114 million boe decrease in reserves (the ICE Brent crude price was 20% lower in 2016 as compared to 2015, which resulted in the lowering of economic limits in some of our fields) and (ii) our portfolio of projects decreased by 43 million boe. |
The revisions described above accounted for 88% of the increase in reserves due to revisions in 2014. The remaining 12% were due to varying increases and decreases from other fields.
| (ii) | An increase of 27 million boe due to: (i) 19 million boe increase at the Palagua-Caipal fields, given the execution of the Company´s plan to perform additional drilling activities in order to cover new proved area, and (ii) the development projects in the Guatiquia, Ocelote, Provincia, Quifa and Dalmatian fields that increased reserves by 8 million boe. |
| (iii) | An increase of 25 million boe, as a result of change in the percent of royalties collected from the drilling project at the Rubiales field. |
| (iv) | An estimated 53 million boe increase given that Ecopetrol is using real transportation costs in this annual report as opposed to the tariff established by the Ministry of Mines and Energy. |
Improved Recovery
In 2014,2016, improved recovery increased reserves by 3411 million boe. The additions were associated with the continued development of waterfloodwater flood projects through existing wells, thoughalthough additional drilling may be required to fully optimize the development configuration. The main additions were in La Cira, InfantasCira-Infantas, Chichimene, Casabe and Yarigui Cantagallo fields, which collectively accounted for a 25an 8 million boe increase.
Extensions and Discoveries
Extensions and discoveries during 20142016 amounted to 5127 million boe, which is comprised of 4725 million boe of extensions of proved acreage and 42 million boe from newly discovered fields and reservoirs. The newly discovered fields in Colombia corresponded to the Guando South WestBayonero and RexOripaya fields, and in the southern Gulf of Mexico, the Dalmatian South field. Newnew reservoirs were discovered in the La Cañada NorteCoren, Corocora Sur and Chipiron fields.
Cravo Este. The extensions of proved acreage resulted mainly from activities in new proved areas in the Castilla, Chichimene, Gibraltar, Provincia,Pauto and Rubiales fields, which accounted for 3320 million boe of the total of 4725 million boe from extensions of proved acreage. The remaining 145 million boe corresponds to smaller changes in several other fields.
Purchases & Sales
In 2014, we neither purchased nor sold any participation in producing oil or gas properties.
Development of reserves
As of December 31, 2014,2016, our total proved undeveloped oil and gas reserves amounted to 466269 million boe, 30%27% of which are related to the drilling activities in Area Castilla and 25% to the development activities in Rubiales fields in Colombia which have continuous development activities.field. The Caño Sureste,Cupiagua, Palagua, Pauto, Quifa, and TibúYarigui fields collectively account 21%accounted for 27% of total proved undeveloped oil and gas reserves.reserves with the remaining 21% from several other fields.
Our proved undeveloped reserves represent 22%17% of our total proved reserves.
The company’sEcopetrol’s year-end development plans are consistent with SEC guidelines for the development of proved undeveloped reserves within five years.
The following table reflects the developed and undeveloped proved reserves estimates through the past three fiscal years.
| Proved Reserves as of December 31, | Oil | Gas | Total | |||||||||
| Mmbls | Bcf | Mmboe | ||||||||||
| 2014 proved reserves | ||||||||||||
| Developed | 1,042 | 3,284 | 1,618 | |||||||||
| Undeveloped | 423 | 245 | 466 | |||||||||
| 2013 proved reserves | ||||||||||||
| Developed | 933 | 2,663 | 1,400 | |||||||||
| Undeveloped | 501 | 405 | 572 | |||||||||
| 2012 proved reserves | ||||||||||||
| Developed | 933 | 2,536 | 1,378 | |||||||||
| Undeveloped | 437 | 351 | 498 | |||||||||
Table 29 – Developed and Undeveloped Proved Reserves
| Proved Reserves as of December 31, | Oil | NGL | Gas | Total | ||||||||||||
| Mmbls | Mmbls | Bcf | Mmboe | |||||||||||||
| 2016 proved reserves | ||||||||||||||||
| Developed | 723 | 56 | 3,131 | 1,329 | ||||||||||||
| Undeveloped | 241 | 13 | 87 | 269 | ||||||||||||
| 2015 proved reserves | ||||||||||||||||
| Developed | 858 | 55 | 3,176 | 1,470 | ||||||||||||
| Undeveloped | 308 | 18 | 303 | 379 | ||||||||||||
| 2014 proved reserves | ||||||||||||||||
| Developed | 979 | 63 | 3,284 | 1,618 | ||||||||||||
| Undeveloped | 405 | 18 | 245 | 466 | ||||||||||||
| 28 |
Of the total amount of proved undeveloped reserves that Ecopetrol had at the end of 2013 (5722015 (379 million boe), we converted approximately 16668 million boe, or 29%18%, to proved developed reserves during 2014,2016, primarily associated with the development of crude oil and gas projects through drillingin the Castilla, Pauto, Mamey, Bonga and workovers in Castilla, Rubiales, Pidemonte, La Cira Infantas, Quifa Suroeste, and CasabeGunflint fields. These projects accounted for approximately 77%84% of the total conversion. The conversion ofwhile the remaining 23%16% is associated with development execution in other fields such as the Ballena, Peñas Blancas, Yarigui-CantagalloQuifa and ProvinciaRubiales fields, among others.
The amount of investments made during 20142016 to convert proved undeveloped reserves to proved developed reserves was US$2,459709 million.
Changes in Undeveloped Proved Reserves
The following table reflects the main changes in undeveloped proved reserves during 2016.
Table 30 – Changes in Undeveloped Proved Reserves in 2016
| Consolidated Companies (million barrels oil equivalent) | ||||
| Revisions of previous estimates | (60.4 | ) | ||
| Improved recovery | 7.1 | |||
| Extensions and discoveries | 11.8 | |||
| Proved Undeveloped converted to Proved Developed | (68.4 | ) | ||
| Net change in unproved reserves | (109.9 | ) | ||
The conversion rate used is 5,700 standard cubic feet = 1 barrel of oil equivalent.
Reserve Estimation Process
Ecopetrol’s reserves process is supervised and coordinated by the Corporate Reserves Director, a highly experienced petroleumgeologist and engineer, who reports to the Chief Financial Officer. The reserves audit group is comprised of reserves coordinators who are geologist and petroleum engineers, each with more than 10 years of experience in reservoir characterization, field development, estimation and reporting of reserves and who have supervision and supporting responsibilities over the professionals involved in the estimation and reporting process.
Reserves are first estimated internally, supervised and coordinated by the Corporate Manager of Reservoirs, a geologist who holds a Master’s degree in geology and has more than 20 years of experience in projects associated with reservoir characterization and development, estimation, and reporting of reserves. The employees involved in the reserves process meet the Society of Petroleum Engineers qualifications for reserves estimators. Internally estimated reserves are submitted to an external audit process, which was conducted by the external engineers (Ryder Scott and DeGolyer and MacNaughton). According to our corporate policy, we report the reserves values obtained from the external engineers, even if they are lower than our internal estimated reserves.
The reserves estimation process ends when the Corporate Reserves Director consolidates the results and presents them to the Reserves Committee, whose members arewhich is composed of the Chief Financial Officer and the Vice-President of Development and Production, and the Chief Strategy and Development Officer.Production. Results are presented to the Audit Committee of the Board of Directors and finally approved by the Board of Directors.
Petroleum engineering consultants DeGolyer and MacNaughton and Ryder Scott have audited Ecopetrol’s proved reserves as of December 31, 2014.2016. These external engineers audited 99% of our estimated net proved reserves. The reserves reports of the external engineers are included as exhibits to this annual report. The external engineers DeGolyer and MacNaughton and Ryder Scott and Gaffney and Cline audited 99% of our estimated net proved reserves for each of the yearsyear ended December 31, 2013,2015 and 2012.2014.
| 29 |
Ecopetrol uses deterministic methods that are commonly used internationally to estimate reserves. These methods have some uncertainty with respect to degradation, and thus, the estimates should not be interpreted as being exact amounts. However, the technology used to estimate reserves is considered reliable. The majority of the producing proved reserves were estimated by applying appropriate decline curves or other performance relationships. In analyzing decline curves, reserves were estimated by calculating economic limits that are based on current economic conditions. In certain cases, where the methods previously employed could not be used, reserves were estimated by analogy with similar reserves for which more complete data was available.
Estimates of reserves were prepared by geological and engineering standard methods commonly used in the oil and gas industry. The method or combination of methods used in the analysis of each reserve was adopted from experience analogy reserves, including information on the stage of development, quality and completeness of basic data and production history.
The following table reflects the estimated proved reserves of oil and gas as of December 31, 20122014 through 2014,2016, and the changes therein.
| Consolidated companies | Colombia | North America | South America excluding Colombia | Total | ||||||||||||
| Net proved oil, NGL and gas reserves in mboe | ||||||||||||||||
| At December 31, 2012 | 1,856 | 6 | 14 | 1,877 | ||||||||||||
| Revisions | 221.5 | 2.0 | 8.4 | 231.9 | ||||||||||||
| Purchase of Minerals | 0 | 9.4 | 0.0 | 9.4 | ||||||||||||
| Improved Recovery | 26.4 | 0.0 | 0.3 | 26.7 | ||||||||||||
| Extensions and discoveries | 74.7 | 0.0 | 0.2 | 74.9 | ||||||||||||
| Sales | (2.8 | ) | 0.0 | 0.0 | (2.8 | ) | ||||||||||
| Production | (242.6 | ) | (0.5 | ) | (1.9 | ) | (244.9 | ) | ||||||||
| At December 31, 2013 | 1,934 | 17 | 21 | 1,972 | ||||||||||||
| Revisions | 264.7 | 1.7 | 4.0 | 270.4 | ||||||||||||
| Purchase of Minerals | 0.0 | 0.0 | 0.0 | 0.0 | ||||||||||||
| Improved Recovery | 34.1 | 0.0 | 0.0 | 34.1 | ||||||||||||
| Extensions and discoveries | 50.1 | 0.8 | 0.0 | 50.9 | ||||||||||||
| Sales | 0.0 | 0.0 | 0.0 | 0.0 | ||||||||||||
| Production | (239.6 | ) | (1.5 | ) | (2.0 | ) | (243.0 | ) | ||||||||
| At December 31, 2014 | 2,043 | 18 | 23 | 2,084 | ||||||||||||
Table 31 – Estimated Proved Reserves of Oil and Gas
| Consolidated companies | Colombia | North America | South America excluding Colombia | Total | ||||||||||||
| Net proved oil, NGL and gas reserves in Mmboe | ||||||||||||||||
| Revisions | 264.7 | 1.7 | 4.0 | 270.4 | ||||||||||||
| Purchase of Minerals | 0.0 | 0.0 | 0.0 | 0.0 | ||||||||||||
| Improved Recovery | 34.1 | 0.0 | 0.0 | 34.1 | ||||||||||||
| Extensions and discoveries | 50.1 | 0.8 | 0.0 | 50.9 | ||||||||||||
| Sales | 0.0 | 0.0 | 0.0 | 0.0 | ||||||||||||
| Production | (239.6 | ) | (1.5 | ) | (2.0 | ) | (243 | ) | ||||||||
| At December 31, 2014 | 2,043 | 18 | 23 | 2,084 | ||||||||||||
| Revisions | (14.8 | ) | (2.8 | ) | (7.1 | ) | (24.7 | ) | ||||||||
| Purchase of Minerals | 0.0 | 0.0 | 0.0 | 0.0 | ||||||||||||
| Improved Recovery | 15.8 | 0.0 | 0.0 | 15.8 | ||||||||||||
| Extensions and discoveries | 24.4 | 0.0 | 0.0 | 24.4 | ||||||||||||
| Sales | 0.0 | 0.0 | 0.0 | 0.0 | ||||||||||||
| Production | (247.5 | ) | (1.4 | ) | (1.8 | ) | (250.7 | ) | ||||||||
| At December 31, 2015 | 1,821 | 14 | 14 | 1,849 | ||||||||||||
| Revisions | (51 | ) | (0.7 | ) | (2.5 | ) | (54 | ) | ||||||||
| Improved Recovery | 11 | 0 | 0 | 11 | ||||||||||||
| Extensions and discoveries | 27 | 0 | 0 | 27 | ||||||||||||
| Production | (231 | ) | (2.3 | ) | (1.7 | ) | (235 | ) | ||||||||
| At December 31, 2016 | 1,577 | 11 | 10 | 1,598 | ||||||||||||
For more information regarding the potential impacts of lowoil prices on our reserve estimates, see the sectionsFinancial Review—Trend Analysis and Sensitivity Analysis andRisk Review—Risk Factors.
| 3.4.4 | Joint Venture and Other Contractual Arrangements |
We conduct our exploration and production business through a variety of types of contractual arrangements with the Colombian government or with third parties. Below is a general description of each type of contractual arrangement to which we were a party as of December 31, 2014:2016:
| 30 |
Association Contract
Association Contract
The Association Contract was createdCreated by the Decree 2310 of 1974. Its1974, the purpose of this contract is the exploration of the areaareas covered by the contract, and the exploitation of hydrocarbons found in that area. This type of contract, together with E&P contracts and Special Contracts (Casabe and La Cira) which are described below, are the most significant in terms of our production and proved reserves.
Under Association Contracts,association contracts, the exploratory risk is assumed entirely by Ecopetrol S.A.’s contractual partner, the associate. If there is a discovery and Ecopetrol S.A. agrees that the relevant field is commercially viable, Ecopetrol S.A. will participate in the field’s development. A joint account will be created and Ecopetrol S.A. and the partner will participate in the expenses and investments in the proportions established in the corresponding contract. Ecopetrol S.A. will reimburse the direct exploratory expenses incurred by the contractual partner in the proportions established by the contract.
If Ecopetrol S.A. does not believe that the relevant field is commercially viable, the partner has the right to execute on its own all activities considered necessary for the field’s exploitation as a “sole risk operation”, and to be reimbursed for a defined percentage of all investments for such sole risk operation in accordance with the corresponding contract.
Every Association Contractassociation contract provides for an executive committee that makes all technical, financial and operational decisions if Ecopetrol S.A. has agreed that a field is economically viable. All major decisions of this committee must be made unanimously by the parties.
The maximum term of an Association Contractassociation contract is 28 years. The first six years of the contract isare for the exploratory phase, and isare extendible for 1 or 2 more years at the partner’s request. The remaining time is for the exploitation phase.
Incremental Production Contract
We enter into Incremental Production Contractsincremental production contracts to obtain incremental hydrocarbon production beyond a base production curve that is established based on the proven reserves of a specific field or well. Under this type of arrangement, Ecopetrol S.A. owns 100% of the hydrocarbons defined by the base production curve. The incremental production (i.e. the hydrocarbon volume obtained beyond the basic production as a result of investment activities), will be owned by the parties to the Incremental Production Contractsuch incremental production contract in the proportions established by thesuch contract.
The initial phase of an Incremental Production Contractincremental production contract has a term of up to 3 years, in which the contractual partner executes an initial work program approved by Ecopetrol S.A. in order to gain the right (but not the obligation) to continue with the second phase. If Ecopetrol’s partner decides to continue with the project for the second phase (the complementary phase), it must inform Ecopetrol S.A. in writing no later than 90 days prior to the termination date of the initial phase and deliver a proposed development plan for each covered field. The second phase is the production phase and has a maximum term of 22 years minus the length of the initial phase.
Incremental Production Contractsproduction contracts provide for an executive committee that is responsible for taking all decisions in order to approve, control, and supervise all operations that take place during the duration of the contract. These contracts also provide for a steering committee, which is responsible for the supervision of the execution of the work programs, the annual budget, and other items.
Risk Production Contract for Discovered Undeveloped and Inactive Fields (First Round 2003)
We have entered into risk production contracts for discovered undeveloped fields to promote exploration by private companies of both undeveloped and inactive fields. Under these contracts, the contracting party assumes all costs and expenses for the development and operation of a field in exchange for a percentage interest in the fields’ production as specified in the contract. This type of contract has a ten-year term calculated as from its date of execution; one year for the evaluation period and a maximum of nine years for the development period. Some of these contracts have subsequently been extended beyond their original term.
| 31 |
Operation for Risk Production Contracts for Discovered Undeveloped and Inactive Fields (Second Round 2005)
The contracts awarded in the second round of undeveloped and inactive discovered fields are service contracts wherein services rendered are payable with a percentage of the production. Ecopetrol S.A. keeps all rights to explore and exploit hydrocarbons found in the area.
These contracts have a 10 year term, including an evaluation period of 8 months, within which the Operatoroperator has to comply with a minimum commitment to conduct a technical evaluation of the field at its own risk.
The facilities built during the term of the contract, other than facilities associated with drilled wells, will be owned by Operator,the operator, who will remain responsible for it,them, even after contract ends. Only drilled wells become property of Ecopetrol S.A. upon the contract’s termination.
Risk Participation Contract
The purpose of this contract is the exploration of the contracted area, and the exploitation of the oil found in the contracted area. Unlike in the Association Contract,association contract, Ecopetrol S.A., shares exploratory risks and costs with the contractual partner, the associate, together with the oil produced, in the proportions established by the contract.
Risk Participation Contractsparticipation contracts provide for an executive committee which is created upon the execution of the contract.
These contracts have a 28 year terms,term, including an exploratory period of six years (which period is extendible under certain contracts for one or two years), after which the exploitation period commences.
Special Contracts
We are party to a Joint Venture Contract for Exploration and Exploitation of “La Cira-Infantas” Area; and a Services and Technical Collaboration Contract for the “Casabe” field.
Joint Venture ContractContracts for Exploration and Exploitation of “La Cira-Infantas” Area and of “Teca-Cocorná” Area
The contractThese contracts between Ecopetrol S.A. and Occidental Andina LLC, executed on September 6,th, 2005 hasand June 24, 2014, respectively, have as purpose a joint collaboration between the parties with the goal of increasing the economic value of the La Cira InfantasCira-Infantas field and the Teca-Corcorná field, by means of hydrocarbon exploration and production activities including, among others, an incremental production project to improve the recovery factor, process optimization, and exploratory activities.
Ecopetrol S.AS.A. partially assigned its exploratory and production rights in the Contracted AreaAreas to Occidental Andina LLC. Ecopetrol S.A. provides financial resources and the preferential rights of use for the existing infrastructure in that zone and Occidental Andina LLC provides financial resources and the technical and operative experience in mature fields redevelopment projects and enhanced recovery technologies.
Ecopetrol S.A. is the Operator,operator under both Joint Venture Contracts, and on behalf of the parties is responsible for the conduction, execution and control, directly or via contractors, of the operational activities.
The La Cira-Infantas contract’s term is divided in three phases. The first phase lasts 180 days, the second 730 days and the third up to the economical limit.
The incremental production, after deduction of the royalties, is owned 52% by Ecopetrol S.A. and 48% by Occidental Andina LLC. These same percentages apply to the participation in the operational and direct expenses. Adjustments to the participations for the benefit of Ecopetrol S.A. will occur if there are high production levels or high prices.
| 32 |
The Teca-Cocorná contract’s term is divided in two phases. The first phase lasts three years, extendable for up to an additional year, the second 20 years counted as from the initiation for the second phase and will be reduced by the term of any extensions of the first phase.
The incremental production, after deduction of the royalties, is owned 60% by Ecopetrol S.A. and 40% by Occidental Andina LLC. These same percentages apply to the participation in the operational and direct expenses. Adjustments to the participations for the benefit of Ecopetrol S.A. will occur if there are high production levels and high prices.
Services and Technical Collaboration Contract “Casabe”
The purpose of the contract executed between Ecopetrol S.AS.A. and Schlumberger Surenco S.A. on April 26, 2004, is the evaluation, design and execution of work programs specifically with the purpose of increasing the value in the Casabe field, by means of development of activities to obtain incremental production, application of new technologies, application of techniques for deposits management and operational costs reduction. Ecopetrol S.A. is the operator and Schlumberger Surenco S.A. keeps the right of first option regarding the activities to be executed in the area of interest.
Both parties can invest in all the activities seeking to evaluate, obtain and incorporate incremental value in the area of interest. Such activities are developed directly by the parties or via contractors (Ecopetrol) or subcontractors (Schlumberger). Amounts expended pursuant to the contract are reimbursed depending on the incremental value (monthly valuation in USDUS$ of the results obtained from the execution of the work programs) created through the contract and the activities executed thereunder.
Both Ecopetrol S.A. and Schlumberger Surenco S.A. commit to assume full responsibility for damages and/or losses suffered by their respective personnel and goods in development of the contract, regardless of the cause. The maximum authority is the Management Committee.
The contract had an initial term of 10 years, and was amended several times to include an additional term of six years for which a new business was structured.
The National Hydrocarbons Agency (ANH) and its Contracts
The National Hydrocarbon Agency (“ANH”) was created by Decree Law 1760 of 2003 and was given the authority to administer all national hydrocarbon reserves under contracts executed beginning on January 1, 2004 (Decree Law 1760 of 2003 states, “The Empresa Colombiana de Petróleos, Ecopetrol, is split, its organic structure is modified, and the Agencia Nacional de Hidrocarburos and the Sociedad Promotora de Energía de Colombia S.A. are created”). Prior to January 1, 2004, Ecopetrol S.A. had the authority to contract with third parties for the exploration and production of new areas. The creation of the ANH did not modify the rights or obligations of Ecopetrol or other parties with respect to contracts in existence at the time when ANH was created and Ecopetrol retains the authority to execute agreements with respect to all areas that it held as of January 1, 2004 when the ANH was created.
Below, we include a brief description of each type of contract that we have entered into with the ANH:
Technical Evaluation Contract (TEA)Agreement
This type of contract grants to the contractor the right to develop technical evaluation operations with operational autonomy at its own cost and risk, seeking to appraise the hydrocarbon potential, with the purpose of identifying the zones of prospective interest in the area by means of the execution of an exploratory program. The contractor has the option to request the conversion of a TEAtechnical evaluation agreement (“Technical Evaluation Agreement” or “TEA”) into one or more E&P Contracts that cover the area of the TEA (or a portion thereof).
The contractor can conduct evaluation activities for terms that vary between 18, 24 and 36 months, depending on the terms of reference of the ANH’s bidding round.
| 33 |
E&P Contract
The ANH enters into concession contracts pursuant to which the Nation grants exploration and production rights, and receives royalties and taxes. In turn, the contractor provides 100% of the investment and expenses resources, and receives 100% of the production after royalties and taxes. The ANH has named this contract an “Exploration and Production Contract” (E&P Contract).
Pursuant to the first stage of this contractual model, the ANH only received a percentage of oil revenues in two cases: (i) when the international oil prices rose beyond a specified price, above which the ANH has a right to participate in a share of the increased revenues generated, or (ii) in the case of recognition of production rights in an extended contractual phase.
Under all E&P contracts executed since ANH’s 2008 bidding round, the ANH receives a percentage of the production from the beginning of the contract, and not only in the extension phase of the contract as mentioned in the previous paragraph, in addition to economic rights when the price of oil exceeds a reference price set in the contract (high price fee) and the superficiary canon.
E&P contracts have two phases: (i) an exploration period, which term is six6 years counted from the Effective Date,effective date, renewable for two additional years, and (ii) a production period, which is, with respect to each production field, 24 years plus any extensions, which are counted from the date of Declarationdeclaration of Commercialitycommerciality of the corresponding field. The above-mentioned terms have been modified during ANH´sANH’s 2014 bidding round for unconventional and offshore reservoirs to an exploration period of nine years and a 30 years explorationproduction period.
ANH and Ecopetrol Agreements (Convenios)
At the time of termination or extension of any association contract (executed by Ecopetrol S.A. before December 31, 2003), the rights over the production area and over the movable and immovable assets therein will continue to belong to Ecopetrol S.A. Pursuant to article 2 of Decree 2288 of 2004, which regulates Decree Law 1760 of 2003, Ecopetrol S.A. must execute an agreement with the ANH to regulate the exploration and exploitation terms and conditions of the relevant area, which was previously subject to an association contract.
Decree 2288 of 2004 also established that Ecopetrol S.A. would have to execute agreements with ANH covering fields directly operated by Ecopetrol S.A. Under these agreements ANH recognizes the exclusive right of Ecopetrol S.AS.A. to explore and exploit the hydrocarbons property of the Nation that are obtained in the areas they cover, until resource depletion or until Ecopetrol S.A. returns the area to the Nation through the ANH.
These agreements also provide the conditions under which Ecopetrol S.A. is able to assign, partially or completely, its rights and duties thereunder to third parties.
| Transportation and Logistics |
In October 2012, Ecopetrol transferred its direct interests in Ocensa, ODC, Oleoducto Bicentenario, ODL and Serviport to Cenit. On April 1, 2013, Ecopetrol S.A. transferred its hydrocarbon transport and logistics assets (crude oil and multiproduct pipelines and loading and unloading facilities) to Cenit, and Cenit started its operations as owner of the transportation and logistics infrastructure. On January 1, 2014 Ecopetrol transferred is port concessions and assets to Cenit.
The purpose of Cenit is to serve the strategic transportation and logistical needs of the country’s oil and refined products industry. Furthermore, it is designed to strengthen and expand the network with high standards of industrial safety, reliability and contribute to the environmental preservation.
This decision is a step forward in the growth of the industry, as well as a signal of clear rules to the market, by separating Ecopetrol’s role as owner, planner, operator and user of transport systems. Cenit operates with an open model in which all interested parties have the possibility of accessing crude oil transportation capacity in Colombia.
Cenit contracts capacity for its pipelines to third parties and oversees and manages transportation infrastructure projects. Cenit also takes the lead in finding and exploiting profitable transportation and logistics opportunities. Cenit’s responsibilities will focus on commercial management, system planning and development, new businesses, and third-party liability.
On April 1, 2013, Ecopetrol S.A. entered into a number of contracts with Cenit establishing their ongoing relationship. Pursuant to transportation and service agreements, Cenit provides Ecopetrol S.A. for a term of 30 years with hydrocarbon and refined products transportation, storage, loading and unloading and logistics services through the transportation assets transferred to it as an in-kind capitalization. Ecopetrol S.A. also entered into an operation and maintenance agreement with Cenit pursuant to which Ecopetrol S.A. is in charge of the operation and maintenance of the transportation assets for a term of 15 years. In return, Cenit will pay Ecopetrol S.A. a variable monthly payment for the services rendered. The companies also entered into a project management agreement, pursuant to which Ecopetrol S.A. provides project management services on market terms to Cenit for a term of 15 years.
In December 2014, Ecopetrol S.A. received authorization from the superintendence of ports to merge its wholly owned subsidiary EPI into Cenit. This merger action was completed on December 19, 2014, adding Ps$1 billion in assets to Cenit. As a result, Cenit is now a direct wholly owned subsidiary of Ecopetrol S.A.
| 3.5.1.1 | Transportation Activities |
The transportation and logistics segment includes the transportation of crude oil, motor fuels, fuel oil and other refined products including diesel and biofuels. We conduct most of these activities through our wholly-owned subsidiary Cenit and Cenit’sits subsidiaries.
| 34 |
The map below shows the locations of the main transportation networks owned by our business partners and us.
Transportation Infrastructure
Graph 5 – Map of Oil Pipelines
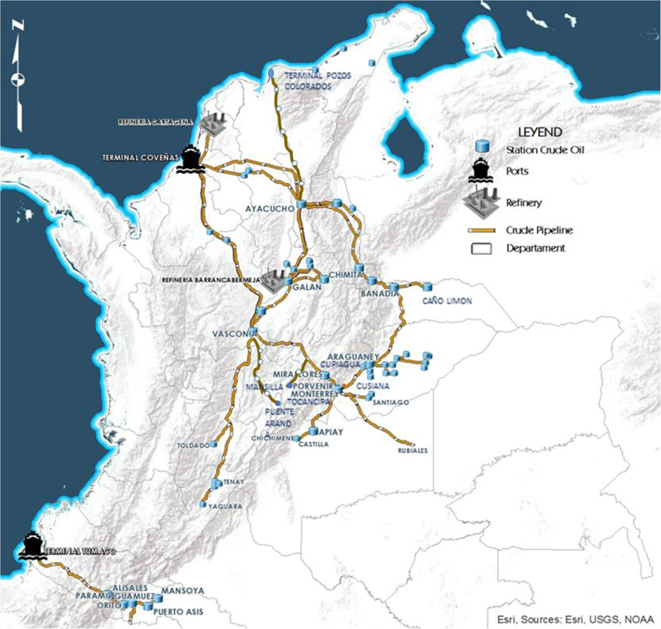

| 35 |
Graph 6 – Map of MultiproductMultipurpose Pipeline
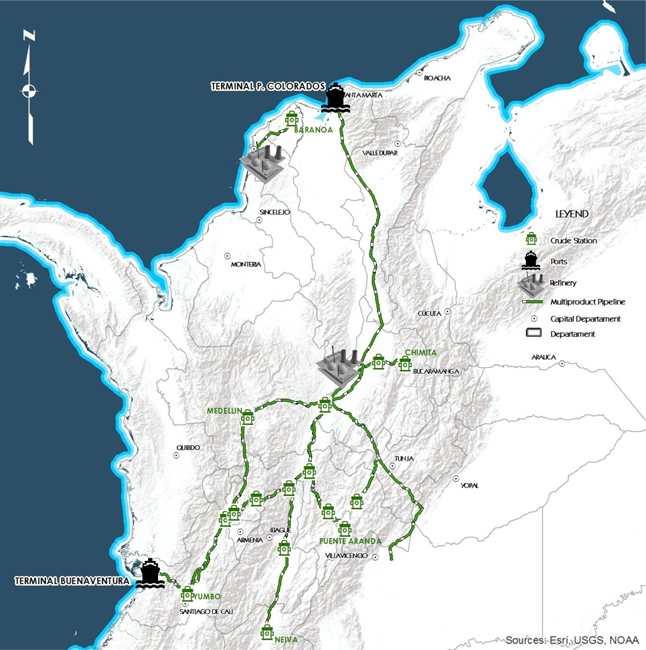
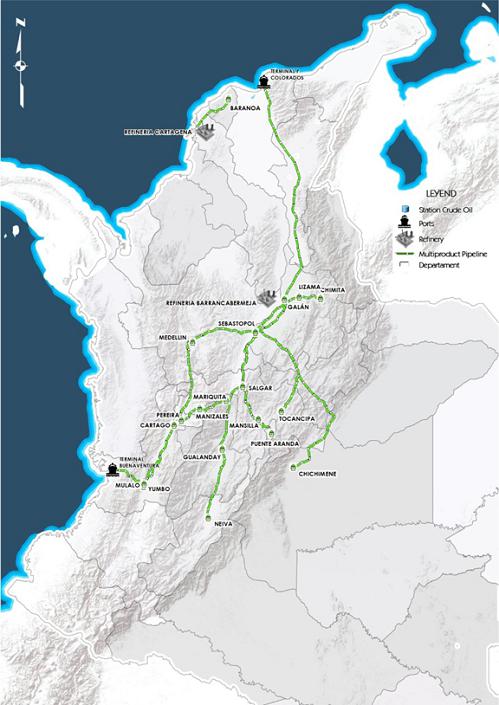
The table below sets forth the volumes of crude oil and refined products transported through the crude oil pipelines and multipurpose pipelines owned by us.
| For the year ended December 31, | ||||||||||||
| 2014 | 2013 | 2012 | ||||||||||
| (thousand bpd) | ||||||||||||
| Crude oil transport(1) | 954 | 950 | 918 | |||||||||
| Refined products transport(2) | 251 | 237 | 234 | |||||||||
| Total | 1,205 | 1,188 | 1,152 | |||||||||
| 36 |
Table 32 – Volumes of Crude Oil and Refined Products Transported
| For the year ended December 31, | ||||||||||||
| 2016 | 2015 | 2014 | ||||||||||
| (thousand bpd) | ||||||||||||
| Crude oil transport(1) | 867 | 978 | 954 | |||||||||
| Refined products transport(2) | 263 | 254 | 251 | |||||||||
| Total | 1,130 | 1,232 | 1,205 | |||||||||
| (1) | The crude oil transported volumes correspond to the following systems: Ocensa Segment 3, ODC, Vasconia-Galan, Ayacucho-Galan, Ayacucho-Coveñas and Trasandino Pipeline. |
| (2) | The pipelines transporting refined products include the following: Galan-Sebastopol, Galan-Salgar, Galan-Bucaramanga, Buenaventura-Yumbo and Cartagena-Baranoa. |
The volume of crude oil transported by theCenit´s main Cenit systems and those of affiliates increaseddecreased in 20142016 by 0.41%11% compared to the previous year. This decrease was mainly the result of higherlower production volumes transported in the Caño Limón - CoveñasColombia and Oleoducto Transandino systems due to the decline in the numberimpacted most of attacks.our crude oil pipelines. Of the total volume of crude transported by oil pipeline, approximately 85% was68% belonged to Ecopetrol’s own product. corporate group.
The volume of refined products transported by Cenit increased by 5.81%4% in 20142016 mainly due to the largera higher volume of naphtha (heavy crude diluent)products transported through the Galan – Sebastopol system to fulfill the demand in the Pozos Colorados – Galán and Galán – Apiay systems.central region. Of the total volume of refined products transported in multi-purpose pipelines during the year, 49.6%20% belonged to Ecopetrol.Ecopetrol’s corporate group.
Transportation Capacity
During 2014,2016, we increased the capacity inof our primary and secondary oil pipelines and loading facilities due to severalthe reversion of the Ayacucho-Galan 14” system. Meanwhile, our main expansion projects carried out by Cenit and its subsidiaries.are under way with our main focus being to perform the adjustments to our infrastructure to allow the transportation of heavier crude oil. Our main crude oil pipeline systems’ operating capacity increased from 1,268,0001,336,000 bpd in 20132015 to 1,328,0001,369,000 bpd in 2014.2016.
Our main refined products pipeline systems increasedtransportation capacity decreased from 322,500529 thousand bpd in 20132015 to 351,700515 thousand bpd in 2014.2016. This increase corresponds to an increase in the transportation capacity of the pipelines that belong to Cenit and its subsidiaries which transport crude oil volumes to the ports or the Barrancabermeja refinery. Besides those main transportation systems, we have other feeder systems that transport volumes from producing facilities or other pumping stations to those main pipelines. The refined products transportation capacity refers to those pipelines that initiate in the Galan station of the Barrancabermeja and Cartagena Refinery.
The foregoing increasedecrease in capacity was primarily the result of a reduction in the completionutilization of drag reducer agent (DRA) in 2014our Galan – Sebastopol 12” system and the transportation of three refined products (naphtha, gasoline and diesel) in our Pozos Colorados – Galan system instead of the Ocensa Delta 35 expansion project and the progress in the Vasconia-Galan project. Regardingtwo refined products the higher capacity is explained by the expansion(naphtha and diesel) transported in the Galan-Sebastopol system.2015.
References to our crude oil transportation capacity in this Annual Reportannual report refer to the capacity of the pipelines that belong to Cenit and its subsidiaries thatto transport crude oil volumes either to the Barrancabermeja refineryRefinery or to our export facilities. (InIn addition, to those main transportation systems, we have other feeder systems that transport oil volumes from producing facilities or other pumping stations to these main pipelines.) References to our refined products transportation capacity refer to the capacity of pipelines that begin in the Galanour Galan-Sebastopol, Galan-Bucaramanga, Cartagena-Baranoa, Pozos Colorados-Galan and Cartagena station (Barrancabermeja and Cartagena Refineries).Buenaventura-Yumbo systems.
| 3.5.1.2 | Pipelines |
As of December 31, 2014,2016, we, directly or indirectly with private sector participants, owned, operatedpartners, own, operate and maintainedmaintain an extensive network of crude oil and refined products pipelines. These pipelines connectingconnect our own and third-party production centers, import facilities and terminals to refineries, major distribution points and export facilities in Colombia. Cenit directly owns 46%49% of the total crude oil pipeline shipping capacity in Colombia. When aggregated with the crude oil pipelines in which Cenit owns an interest, Cenit owns 79%81% of the oil pipeline shipping capacity in Colombia. By December 31, 2014,2016, our network of crude oil and multi-purposemultipurpose pipelines was approximately 8,9868,860 kilometers in length. The transportation network consists of approximately 5,2695,146 kilometers of main crude terminals and oil pipeline networks connecting various fields to the Barrancabermeja refineryRefinery and Reficar, as well as to export facilities. We also own 3,7173,714 kilometers of multi-purposemultipurpose pipelines for transportation of refined products from the Barrancabermeja refineryRefinery and from Reficar to wholesalemajor distribution points.
Out of the 5,2695,146 kilometers of crude oil pipelines, owned by us, 3,0292,985 kilometers of crude oil pipeline are wholly owned and 2,2402,161 kilometers of crude oil pipeline isare owned through non-wholly owned subsidiaries.
| 37 |
The following table sets forth our main pipelines in which we own an indirect interest as of December 31, 2014.2016.
| Pipeline | Kilometers | Capacity (kbpd) | Product Transported | Origin | Destination | Indirect Ownership Percentage | ||||||||||||
| Caño Limón-Coveñas | 771 | 250 | Crude Oil | Caño Limón | Coveñas | 100.00 | % | |||||||||||
| Oleoducto de Alto Magdalena (OAM) | 397 | 110 | Crude Oil | Tenay | Vasconia | 87.29 | % | |||||||||||
| Oleoducto de Colombia (ODC) | 480 | 236 | Crude Oil | Vasconia | Coveñas | 73.00 | % | |||||||||||
| Oleoducto Central (Ocensa Segment 2) | 836 | 616 | Crude Oil | Cupiagua | Coveñas | 72.65 | % | |||||||||||
| Oleoducto de los Llanos (ODL) | 262 | 340 | Crude Oil | East fields | Monterrey Cusiana | 65.00 | % | |||||||||||
| Oleoducto Bicentenario de Colombia S.A.S | 230 | 110 | (1) | Crude Oil | Araguaney | Banadia | 55.97 | % | ||||||||||
Table 33 – Our Main Pipelines
| Pipeline | Kilometers | Capacity (mbd) | Product Transported | Origin | Destination | Indirect Ownership Percentage | ||||||||||||
| Caño Limón-Coveñas | 771 | 250 | Crude Oil | Caño Limón | Coveñas | 100.00 | % | |||||||||||
| Oleoducto de Alto Magdalena (OAM) | 391 | 110 | Crude Oil | Tenay | Vasconia | 87.29 | % | |||||||||||
| Oleoducto de Colombia (ODC) | 483 | 236 | Crude Oil | Vasconia | Coveñas | 73.00 | % | |||||||||||
| Oleoducto Central –Ocensa (*Segment 2) | 836 | 616 | * | Crude Oil | Cupiagua | Coveñas | 72.65 | % | ||||||||||
| Oleoducto de los Llanos (ODL) | 260 | 340 | Crude Oil | East fields | Monterrey Cusiana | 65.00 | % | |||||||||||
| Oleoducto Bicentenario de Colombia | 230 | 110 | (1) | Crude Oil | Araguaney | Banadia | 55.97 | % | ||||||||||
| (1) | Represents the contractual crude oil transportation capacity for the |
As of December 31, 2014,2016 we owned 72 stations—3268 stations, 34 located in crude oil pipelines, 30 in refined products pipelines, six in supply plants, two2 in crude oil ports and two2 in refined product ports.
As of December 31, 2014,2016, we had a nominal storage capacity associated with the transportation network of 16 million barrels of crude oil and 4 million barrels of refined products. We also sell storage capacity to third parties in our Pozos Colorados, Tocancipa and Mansilla facilities and in the Coveñas port. We do not own any tankers.
Pipeline Projects
SAN FERNANDO – MONTERREY
The San Fernando – Monterrey project’s objectives include ensuring the ability to transport 390,000300,000 bpd of diluted crude oil from the Chichimene and Castilla fields to the Monterrey pumping station the reversion of the Monterrey – Araguaney pipeline to transport 53,000 bpd of crude oil and the transportation of 85,00045,000 bpd of diluent (naptha)(naphtha) between the Apiay station and the Castilla and Chichimene fields.
The scope of the project includes the construction of a new 30” 171 km crude oil pipeline, a receipt, storage and pumping station, and the reversion/conversion of the existing pipeline of 16” between the Castilla II –plant and the Apiay station in order to transport diluent (naptha)(naphtha) from the Apiay station to the Castilla II plant.
In 2014, we finishedAs a loop increasing the capacity between Apiay and Monterrey by 40,000 bpd and signed the construction contract for the remaining activitiesresult of the project.
COSTA NORTE COLOMBIANA – GALÁN
The Costa Norte – Galán project’s objective isevaluations we made and due to increase the transportation capacity to 160,000 bpdreduction in production forecasts, the Pozos – Galán system for the transportation of imported naptha of up to 100,000 bpd and refined products (motor fuels and oils and gasoline) of up to 60,000 bpd.
The scope of the first module of the project designed to increase capacity by 130,000 bpd, involves the construction of new infrastructure and optimization of the existing infrastructure from Pozos Colorados to Galán; the main effort is the installation of new pumping units in the Pozos Colorados and Copey stations. The second module, designed to increase capacity by 30,000 bpd, includes the construction of two storage tanks in Pozos Colorados. During 2014, we completed our detailed engineering work and began construction of the first module.
MAGDALENA MEDIO 100
The Magdalena Medio 100 project’s main objectives include increasing the storage capacity in the Coveñas – CENIT terminal to 610,000 barrelswas modified and the transportation capacity was reduced from 390,000 bpd to 300,000 bpd from the San Fernando station to the Monterrey station.
During 2016 progress was achieved on construction of crude oil in the Ayacucho – Coveñas 16”San Fernando station, especially with regards to the assembly of the pumping system pipeline to 100,000 bpd. During 2014, weunits. We completed our detailed engineering workthe construction of the lines between San Fernando and additional activities required to finalizeApiay, and the project by 2016.branch lines between San Fernando and the Castilla and Chichimene stations. By the end of the first quarter of 2017 the filling of tanks and lines and the testing of main pumping units had been completed.
OCENSA (P135)
The OCENSA P135 project has as itsproject’s main objective increasingis to increase the pipeline transportation capacity by 135,000 bpd starting in the first semester of 2016.bpd. The project involves improving the pumping system and increasing the storage capacity. During 2014, we beganThe main project activities were completed at the project’s construction.end of December 2016 and the shippers were notified of such completion by Ocensa. Before commencing operations, Ocensa is expecting the ruling required by the Colombian Ministry of Mines and Energy.
| 38 |
OLEODUCTO AL PACIFICO SAS
Cenit is participating in the Oleoducto al Pacífico SAS, led by Enbridge, which willintends to transport heavy crude oil to the eastern market.Colombian Pacific coast. In 2014,2015, the scope of work was focused on reviewing the business case for the development of the project, conducting advance prior consultations with communities along the rights of way, negotiating project governance matters and reviewing regulatory, commercial and technical issues.
Due to the environment of the oil industry and uncertainty about future volume of oil production in Colombia, the project continuity is under review and it was put on hold.
TRANSPORTATION OF HIGHER VISCOSITY CRUDES
In 2016 crude was transported at viscosities greater than 405 cSt on the principal systems, particularly at Ocensa, where since the last quarter of 2016 there has been the ability to transport crudes at viscosities of up to 600 cSt.
Adaptations were also made to one of the single buoy moorings of the Coveñas terminal to permit the importation of naphtha for dilution at this terminal. Integral capacity tests are scheduled to be executed in 2017 for the transport of crude with this viscosity, and transport is expected to begin in the second quarter of 2017.
The main modifications are on: the ODL pipeline (Oleoducto de los Llanos; Rubiales – Cusiana), on Ocensa Segment 1 (Cusiana – Porvenir), Segments 2 & 3 (El Porvenir – Vasconia – Coveñas) and on the Oleoducto de Colombia Pipeline (ODC – Oleoducto de Colombia). This project, combined with the expansion of capacity on Ocensa (P-135), will make it possible to transport higher viscosity crudes.
| 3.5.1.3 | Export and Import Facilities |
We currently have concessions granted by the Nation for four export/import docks for crude oil and refined products: Coveñas, Tumaco, Pozos Colorados and Buenaventura.Cartagena. Our export capacity reached 1.141.24 million bpd for crude oil. Our import capacity of refined products reached 0.130.18 million bpd.
Our crude oil loading facilities can load tankers of up to 350,000350 thousand deadweight tonnage or DWT.(DWT). Adjacent to these loading facilities we also have crude oil storage facilities that are capable of storing 7.79 million barrels. Our docks used for import and export of refined products can load tankers of 8570 thousand DWT. Additionally, these facilities have storage capacity of up to 1.2 million barrels.
| 3.5.2 | Other Transportation Facilities |
We have entered into transportation agreements with tanker-truck and barge companies in order to transport crude oil from locations that do not have pipeline connections to refineries and export facilities. The volume of refined products that cannot be transported in pipelines or in tanker trucks because of capacity limitation is transported by barges. During 2014, 33.52016, 22.9 million barrels of crude oil and refined products were transported by tanker trucks and 7.9 million barrels of crude oil and refined products were transported by barges.barges, particularly using the Rio Magdalena, connecting Barrancabermeja with Barranquilla and Cartagena.
| 3.5.3 |
Ecopetrol S.A., through its Vice-Presidency of Transportation and Logistics, operates Cenit’s pipelines pursuant to a contract with Cenit. The Vice-Presidency focuses on maintaining the integrity of the transportation infrastructure by improving our operational risk model for transportation infrastructure with respect to weather conditions and damage caused by third parties, as well as deploying new technologies to monitor transportation infrastructure and its environment and to permit intervention in portions of the infrastructure where it is susceptible to incidents that could have severe consequences.
The Vice-Presidency now comprises four main areas: Operations and Maintenance, Comprehensive Transportation and Logistics Solutions, Asset Management, and Commercial and Customer Service. All of these areas aim to accomplish their obligations to their customers: Cenit, ODL, ODC, Ocensa and Oleoducto Bicentenario de Colombia.
During 2014, we met our customer satisfaction index goal, and we maintained our ISO 9001:2008, ISO 14001 and OHSAS 18001 certifications for all of our transportation processes. We also attained the certification by the Oil Companies International Marine Forum (OCIMF), which provides standards for hydrocarbons reception, storage, dispatch by pipes and pipelines and the import and export facilities of our ports.
| Marketing of Transportation Services |
Cenit’sCenit and its subsidiaries’ main line of business areis the crude oil pipeline transport (39%(73% of Cenit’s revenues), followed by the refined products pipeline transport (50%(17% of Cenit’s revenues) and ports and related services (10%(8% of Cenit’s revenues).
Transportation contracts of crude oil may take several forms: ship or pay (payment for the availability of a fixed capacity in the system), ship and pay (payment for volumes actually transported) or spot. The main clientsusers for the crude oil transportation business are Ecopetrol S.A., Pacific Rubiales Energy,Metapetroleum Corp., Petrominerales, Occidental de Colombia, Mansarovar and Grantierra,Gran Tierra, who collectively represented 95%92% of this business segment’s revenues in 2014.2016. Transportation services for crude oil provided to Ecopetrol S.A. represented 75%60% of Cenit’sthis business segment’s crude oil transport revenues.
| 39 |
Cenit also transports refined products. TheIts main client for this service includeis Ecopetrol S.A., which accounted for 36%41% of refined products pipeline transport revenues in 2014,2016, principally due to the transport of naphtha. Cenit also has 15 other fuel wholesalerwholesalers’ customers for whom it transports other refined products. Wholesalers representingThe most significant of the volumethese customers are Organizacion Terpel, ExxonMobil, Chevron Petroleum Company, Biocombustibles and Petrobras Colombia. We currently have no written contracts in place with these wholesalers, though the CREG is currently defining the framework for the implementation of such contracts. Contract types for naphtha transportation are ship or pay and ship and pay.
Cenit transports LPG for 13 clients, under written contracts. LPG transport represents 1% of Cenit´s revenue.
Deregulated businesses such as ports and crude loading facilities represent a smaller portion of Cenit’s revenue (10%(8% in 2014)2016). Clients for these businesses include some of the same parties for which Cenit provides crude oil and refined products transportation services.
Cenit was launched in April 2013 with a commitment to introduce transparency, equal and open access as well as to increase the focus on customer service in the hydrocarbon transportation business. In line with this commitment, Cenit undertook initiatives to better understand customer needs, including personal interviews, quarterly client meetings and an annual satisfaction tracker. The findings of these approaches are the basis of Cenit’s customer service model currently being implemented.
| Refining and Petrochemicals |
| 3.6.1 | Refining |
Our main refineries areare: (i) the Barrancabermeja refinery,Refinery, which Ecopetrol S.A. directly owns and operates, and a refinery(ii) Reficar Refinery, located in the Free Trade Zonefree trade zone in Cartagena, thatwhich is operated by Reficar S.A., a wholly owned subsidiary of Ecopetrol S.A. Ecopetrol S.A. also owns and operates two other minor refineries—refineries – Orito and Apiay. OurApiay, but these are considered part of the upstream segment since the majority of the products are for local on-site consumption.
These refineries produce a full range of refined products, including gasoline, diesel, jet fuel, liquefied petroleum gas (LPG), and heavy fuel oils, among others.
The following table sets forth our daily average installed and actual refinery capacity for each of the last three years:
| For the year ended December 31, | ||||||||||||||||||||||||||||||||||||
| 2014 | 2013 | 2012 | ||||||||||||||||||||||||||||||||||
| Capacity | Through -put | % Use | Capacity | Through -put | % Use | Capacity | Through -put | % Use | ||||||||||||||||||||||||||||
| (bpd) | (bpd) | (bpd) | (bpd) | (bpd) | (bpd) | |||||||||||||||||||||||||||||||
| Barrancabermeja | 250,000 | 226,900 | 91 | % | 250,000 | 214,845 | 86 | % | 250,000 | 219,385 | 88 | % | ||||||||||||||||||||||||
| Reficar* | 80,000 | 10,420 | 13 | % | 80,000 | 66,314 | 83 | % | 80,000 | 74,545 | 93 | % | ||||||||||||||||||||||||
| Apiay | 2,500 | 1,380 | 55 | % | 2,500 | 1,303 | 52 | % | 2,500 | 1,617 | 65 | % | ||||||||||||||||||||||||
| Orito | 2,500 | 1,784 | 71 | % | 2,500 | 900 | 36 | % | 2,500 | 793 | 32 | % | ||||||||||||||||||||||||
| Total | 335,000 | 240,484 | 72 | % | 335,000 | 283,362 | 85 | % | 335,000 | 296,340 | 88 | % | ||||||||||||||||||||||||
Note: ApiayTable 34 – Daily Average Installed and Orito are considered to be part of the exploration and production segment, not the refining segment, and the majority of products produced by them are used by us (self-consumption).Actual Refinery Capacity
| For the year ended December 31, | ||||||||||||||||||||||||||||||||||||
| 2016 | 2015 | 2014 | ||||||||||||||||||||||||||||||||||
| Capacity | Through- put | % Use | Capacity | Through- put | % Use | Capacity | Through- put | % Use | ||||||||||||||||||||||||||||
| (bpd) | (bpd) | (bpd) | (bpd) | (bpd) | (bpd) | |||||||||||||||||||||||||||||||
| Barrancabermeja | 250,000 | 213,091 | 85 | % | 250,000 | 221,900 | 89 | % | 250,000 | 226,900 | 91 | % | ||||||||||||||||||||||||
| Reficar(1) | 150,000 | 117,188 | 78 | % | 165,000 | (3) | 10,428 | 6 | % | 80,000 | 10,420 | 13 | % | |||||||||||||||||||||||
| Apiay(2) | 2,500 | 1,382 | 55 | % | 2,500 | 1,604 | 64 | % | 2,500 | 1,380 | 55 | % | ||||||||||||||||||||||||
| Orito(2) | 2,500 | 1,090 | 44 | % | 2,500 | 929 | 37 | % | 2,500 | 1,784 | 71 | % | ||||||||||||||||||||||||
| Total | 405,000 | 332,751 | 82 | % | 420,000 | 234,861 | 56 | % | 335,000 | 240,484 | 72 | % | ||||||||||||||||||||||||
*Reficar operations were shut down starting in March 2014 and are scheduled to resume upon the completion of the expansion and modernization plan at the Cartagena refinery.
| (1) | Reficar operations were shut down in March 2014 to enable the completion of the expansion and modernization project. The new crude unit began start-up process in October 2015. During 2016, Reficar was under stabilization, with full operation in July 2016. The refinery’s design capacity, tested in 2016, is 150 thousand barrels per day. |
| (2) | Apiay and Orito are considered to be part of the upstream segment, not the refining segment, and the majority of products are for local on-site consumption. |
| (3) | The capacity indicated in 2015 was 165 thousand barrels per day which includes a design safety factor of 10%. |
| 3.6.1.1 | Barrancabermeja Refinery |
At Barrancabermeja, we produce a variety of fuels, such as regular and premium unleaded gasoline, diesel fuel, kerosene, jet fuel, aviation fuel, LPG, fuel oil and sulfur. We also produce petrochemicals and industrial products, including paraffin waxes, lube base oils, low-density polyethylene, aromatics, asphalts, alkylates, cyclohexane and aliphatic solvents, as well as refinery grade propylene. The Barrancabermeja refineryRefinery supplies approximately 72.5%73.8% of the fuels consumed in Colombia.Colombia according to internal calculations made by the Barrancabermeja Refinery and Colombia´s fuels consumption reported by the Ministry of Finance.
The following table sets forth the production of refined products of Barrancabermeja for the periods indicated.
| For the year ended December 31, | ||||||||||||
| 2014 | 2013 | 2012 | ||||||||||
| (bpd) | ||||||||||||
| LPG, Propylene and Butane | 13,834 | 13,572 | 14,546 | |||||||||
| Gasoline Fuels and Naphtha | 68,914 | 67,592 | 71,552 | |||||||||
| Diesel | 44,273 | 45,179 | 52,486 | |||||||||
| Jet Fuel and Kerosene | 23,227 | 19,546 | 19,043 | |||||||||
| Fuel Oil | 66,928 | 58,852 | 51,618 | |||||||||
| Lube Base Oils and Waxes | 1,103 | 1,468 | 2,011 | |||||||||
| Aromatics and Solvents | 2,640 | 2,632 | 2,953 | |||||||||
| Asphalts and Aromatic Tar | 7,501 | 6,174 | 5,892 | |||||||||
| Polyethylene, Sulfur and Sulfuric Acid | 1,094 | 1,118 | 1,149 | |||||||||
| Total | 229,515 | 216,133 | 221,250 | (1) | ||||||||
| Difference between Inventory of Intermediate Products | -640 | 538 | 208 | (1) | ||||||||
| Total Production | 228,875 | 216,671 | 221,458 | (1) | ||||||||
Table 35 – Production of Refined Products from Barrancabermeja Refinery
| For the year ended December 31, | ||||||||||||
| 2016 | 2015 | 2014 | ||||||||||
| (bpd) | ||||||||||||
| LPG, Propylene and Butane | 11,956 | 13,623 | 13,834 | |||||||||
| Gasoline Fuels and Naphtha | 59,305 | 59,487 | 68,914 | |||||||||
| Diesel | 48,233 | 46,212 | 44,273 | |||||||||
| Jet Fuel and Kerosene | 20,435 | 22,388 | 23,227 | |||||||||
| Fuel Oil | 55,730 | 64,306 | 66,928 | |||||||||
| Lube Base Oils and Waxes | 668 | 521 | 1,103 | |||||||||
| Aromatics and Solvents | 2,879 | 3,197 | 2,640 | |||||||||
| Asphalts and Aromatic Tar | 14,092 | 9,519 | 7,501 | |||||||||
| Polyethylene, Sulfur and Sulfuric Acid | 1,541 | 1,318 | 1,094 | |||||||||
| Total | 214,839 | 220,571 | 229,514 | |||||||||
| Difference between Inventory of Intermediate Products | (661 | ) | 142 | (640 | ) | |||||||
| Total Production | 214,178 | 220,713 | 228,874 | |||||||||
In 2016, total production from the Barrancabermeja Refinery decreased 3.0% from 220,713 bpd in 2015 to 214,178 bpd in 2016 primarily due to the processing of a heavier crude slate which lowered throughput, and the scheduled maintenance of two of its crude units in March and October 2016.
We own and operate four petrochemical plants and one paraffin and lube plant located within the Barrancabermeja Refinery. In 2016, we produced 55,642 tons of low-density polyethylene, an increase of 26% compared to the production of 44,161 tons in 2015. This increase was due primarily to the recovery of the Turbo expander unit, which resumed operations in August 2015 and supplied a greater amount of feedstock (ethylene) to polyethylene plants. We produced 1,994 mboepd of aromatics (benzene, toluene, xylene, orthoxylene, heavy aromatics and cyclohexane), a 12% decrease as compared with the production of 2,259 mboepd of aromatics in 2015. The decline was mainly the result of lower demand.
The gross refining margin increaseddecreased from $10.9US$16.8 per barrel in 20132015 to $14.6US$14 per barrel in 2014, mainly2016, primarily due to the decrease on the average price differentials of the crude purchased in the Barrancabermeja Refinery of $12.2 per barrel from 2013 to 2014, while the price of the refined products only decreased $8.6 per barrel.as compared to crude oil, in line with international market trends.
The average conversion ratio for Barrancabermeja Refinery was 71.4%74.6% in 20142016 and 72.5%73.5% in 2013.2015. This decreaseincrease in the conversion ratio was primarily caused by less feeddue to visbreaking units, and as a consequence, a higher yield of fuel oil and a lower conversion to diesel.
We are currently evaluating the potential implementationupgrading of a modernization process to convert Barrancabermeja into a deep-conversion refinery, which would allow it to process more extra-heavy and heavy crudes produced at local fields and increase production of mid-distillates for the local market. After the completion of the Reficar project, described below, and, if the Barrancabermeja project is undertaken, we would expect to be able to supply the entire Colombian market without the need for imports of refined products.
During 2014, Barrancabermeja Refinery delivered 70.8 mboepd of low sulfur gasoline (less than 300 parts per million sulfur content) and 84.3 mboepd of low sulfur diesel (less than 50 parts per million sulfur content) to meet existing fuel quality standards while satisfying rising domestic demand. In order to achieve this, in 2014 we increased imports of ultra-low sulfur diesel by 1.8 mboepd over the 2013 level.
Natural gas from the Ballena terminal located in the La Guajira fields is transported to Barrancabermeja pursuantgasoil hydro-treating unit to a natural gas transportation agreement entered into on October 1, 2008, between Ecopetrol and TGI for the transportation of 116,500 thousand cfpd from December 1, 2012 to December 31, 2020. Pursuant to the terms of the agreement, we pay to TGI a regulated transportation tariff composed of a fixed fee, variable fee depending on transported volumes and an administration, operation and maintenance fee. Payments for transported volume are quoted in US dollars and settled in Pesos. During 2014, we paid Ps$119 billion to TGI under the agreement.mild hydrocracker unit allowing higher middle distillate yields.
| 3.6.1.2 | Reficar |
The following table sets forth the production of refined products offrom Reficar for the periods indicated.
For the year ended December 31,(1) | ||||||||||||
| 2014 | 2013 | 2012 | ||||||||||
| (bpd) | ||||||||||||
| LPG, Propylene and Butane | 0 | 3,264 | 3,447 | |||||||||
| Motor Fuels | 1,997 | 19,679 | 21,602 | |||||||||
| Diesel | 2,254 | 15,669 | 17,982 | |||||||||
| Jet Fuel and Kerosene | 812 | 6,090 | 6,776 | |||||||||
| Fuel Oil | 3,352 | 15,468 | 18,110 | |||||||||
| Aromatic Tar | 0 | 691 | 729 | |||||||||
| Other Products | 0 | 27 | 29 | |||||||||
| Total | 8,415 | 60,888 | 68,676 | |||||||||
| Difference between Inventory of Intermediate Products | 1,896 | 6,613 | 6,521 | |||||||||
| Total Production | 10,311 | 67,502 | 75,197 | |||||||||
Table 36 – Production of Refined Products from Reficar
For the year ended December 31,(1) | ||||||||||||
| 2016 | 2015 | 2014 | ||||||||||
| (bpd) | ||||||||||||
| LPG, Propylene and Butane | 6,080 | 0 | 0 | |||||||||
| Motor Fuels | 35,012 | 1,558 | 1,997 | |||||||||
| Diesel | 40,950 | 2,282 | 2,254 | |||||||||
| Jet Fuel and Kerosene | 5,768 | 1,202 | 812 | |||||||||
| Fuel Oil | 24,602 | 2,826 | 3,352 | |||||||||
| Sulfur | 241 | 0 | 0 | |||||||||
| Total | 112,653 | 7,868 | 8,415 | |||||||||
| Difference between Inventory of Intermediate Products | 911 | 2,476 | 1,896 | |||||||||
| Total Production(2) | 113,564 | 10,344 | 10,311 | |||||||||
| Petcoke (Metric tons) | 601,163 | 0 | 0 | |||||||||
(1) | The table shows the entire production of Reficar. |
| (2) | Does not include petcoke. |
During 2014, Reficar’s production decreased to 10.3 thousand bpd, from 67.5 thousand bpd in 2013, primarily due to its scheduled shutdown in March 2014. The shutdown was necessary in order to move forward with the expansion project requirements and to allow completion of the expansion project. The refinery remained shut down for the rest of 2014 and is expected to resume operations during the second half of 2015. Reficar is currently evaluating2016, the viability of integrating former assets along with the new refinery.refinery initiated its stabilization period.
| 41 |
The following tables set forth the imports and sales of refined products offrom Reficar for the periods indicated.
| Imports | For the year ended December 31, | |||||||||||
| 2014 | 2013 | 2012 | ||||||||||
| (bpd) | ||||||||||||
| Motor Fuels | 11.460 | 5,742 | 6.323 | |||||||||
| Diesel | 18,334 | 17,490 | 16,764 | |||||||||
| Jet Fuel and Kerosene | 3.419 | 0 | 0 | |||||||||
| Total Imports | 33,212 | 23,232 | 23,087 | |||||||||
| Sales | For the year ended December 31, | |||||||||||
| 2014 | 2013 | 2012 | ||||||||||
| (bpd) | ||||||||||||
| Motor Fuels | 14,154 | 21,561 | 24,020 | |||||||||
| Diesel | 21,942 | 34,548 | 35,651 | |||||||||
| Jet Fuel and Kerosene | 3,681 | 5,468 | 6,079 | |||||||||
| Fuel Oil | 4,335 | 15,014 | 18,181 | |||||||||
| Other Products | 2,194 | 11,448 | 10,170 | |||||||||
| Total Sales | 46,305 | 88,039 | 94,101 | |||||||||
Table 37 – Imports and Sales of Refined Products from Reficar
| For the year ended December 31, | ||||||||||||
| 2016 | 2015 | 2014 | ||||||||||
| (bpd) | ||||||||||||
| Imports | ||||||||||||
| Motor Fuels | 3,641 | 15,112 | 11,460 | |||||||||
| Diesel | 6,155 | 21,979 | 18,334 | |||||||||
| Jet Fuel and Kerosene | 2,211 | 4,384 | 3,419 | |||||||||
| Alkylate | 83 | - | - | |||||||||
| LPG and Butane | 355 | - | - | |||||||||
| Total Imports | 12,445 | 41,475 | 33,213 | |||||||||
During 20142016, Reficar increased imports due to the Crude Distillation Unit (CDU) shutdown; the imports made wereimported products to cover the North Coast sales demand. Due
| For the year ended December 31, | ||||||||||||
| 2016 | 2015 | 2014 | ||||||||||
| (bpd) | ||||||||||||
| Sales | ||||||||||||
| Motor Fuels | 38,534 | 16,101 | 14,154 | |||||||||
| Diesel | 46,060 | 22,692 | 21,942 | |||||||||
| Jet Fuel and Kerosene | 7,479 | 5,012 | 3,681 | |||||||||
| Fuel Oil | 16,593 | 2,066 | 4,335 | |||||||||
| Other Products | 22,990 | 2,281 | 2,194 | |||||||||
| Total Sales | 131,656 | 48,152 | 46,306 | |||||||||
After seven years of construction work, Reficar reached its most important historical milestone to date by entering 34 operating units into operation in July 2016. Reficar´s new and expanded processing capacity may exceed 150 thousand barrels of crude oil per day with a high value product conversion factor of 97.5%. A number of critical milestones were reached during the first semester of 2016, including finishing project construction activities and developing successful sequential start-up of the units up to July 2016. Reficar is now the most modern refinery in Latin America, introducing new technology to the CDU , VisbreakingColombian refinery industry with delayed coking and Cracking units’ shutdown, lower sales were made during 2014; onlyhydrocracking facilities; and it now has the North Coast local demand was fulfilledability to process heavier crudes and therefore lower exports were made during the year.produce gasolines and diesel fuels with ultra-low sulphur contents.
As partIn September 2016, the operation of our expansionthe new refinery was formally transferred to Ecopetrol under an Operation and modernization plan, we expect to increaseMaintenance Agreement that leverages on Ecopetrol´s existing refining capabilities while keeping Reficar as independent manager and owner of the competitiveness and profitabilityassets.
Following full start-up, the focus areas of Reficar through the modernizationoperation have been the stabilization of its facilities and processes,the production process and the improvementexecution of its reliability. We currently expectindividual unit’s performance tests, (62%, or 21 of 34, have been performed to completedate). The reliability test of the modernization process and resume operations duringrefinery as a whole is expected to be performed in the second half of 2017.
In terms of gross refining margin, the refinery advanced from an average of approximately US$ 3 per barrel between January and July 2016, to around US$ 9 per barrel between August and December 2016 (stabilization and performance testing period), with expectations that in 2017 the margin will be in line with the market trend for highly complex refineries.
Reficar´s 2016 financials already reflect the operation of the new units, thus total sales have increased 85% as compared to 2015, from US$ 1,155 million in 2015 to US$ 2,142 million in 2016. A total of 42.9 million barrels of crude were processed in 2016 compared to 3.8 million barrels processed in 2015. Once completed, theExports to international markets represented 54% of total sales (US$ 1,158 million). The refinery’s nominal production capacity is expected to be 165 thousand bpd. We expect to improve refining margins by processing lower cost heavy crude oils, raising the conversion ratio, and producing a higher quality slatehas substituted 10 million barrels of products. We also expect to reduce the sulfur content in gasoline and diesel fuel, thus complying with current nationalimports, which previously had to be imported in order to supply the domestic demand. As per information provided by the Colombian Government (specifically by the National Statistics Department –DANE-), Reficar’s entrance into operation contributed 3.8% to the National Industrial GDP, and international fuel standards without0.4% to the need to blend imported Ultra Low Sulfur Diesel.National GDP during 2016.
| 42 |
Financing
On December 30, 2011, with the previous approval from the Colombian Ministry of Finance and Public Credit, Reficar executed a US$3.5 billion project finance to partially fund the expansion and modernization of the refinery in Cartagena, loans with tenors of 14 and 16 years forfrom Commercial Banks and Export Credit Agency Facilities, respectively. The aggregate amount drawn under these finance agreements totaled US$3,496.6 million. As of December 2014, Reficar had drawn US$3,497 million31, 2016, the principal amount owed to the senior lenders under thethese finance agreements was US$2,796.3 million. Interest payments during 2015 and paid2016 were US$ 24192 million in debt service.and US$87 million, respectively.
As part of the project finance structure, Ecopetrol S.A. entered into a Construction Support Agreement (the “Construction Support Agreement”) and a Debt Service Guarantee Agreement (the “Debt Service Guarantee Agreement”) to support certain obligations of Reficar. Pursuant to the terms of the Construction Support Agreement, Ecopetrol S.A. agrees to support up to the completion date, any additional costs, expenses or delays incurred during the construction phase of the expansion and modernization of the refinery in Cartagena.
During 2014, the requested amount by Reficar under the Construction Support Agreement was US$1,354 million. The requested amount for 2014 was contributed by means of capital injections and by a subordinated loan from Ecopetrol Capital AG. Any increase in the project’s capital expenditures is expected to be funded under the Construction Support Agreement between Reficar and Ecopetrol S.A.
The funds requested under the Construction Support Agreement for the project during 2014, were funded as follows: (i) US$590 million from a share capitalization process carried out by its main shareholders Ecopetrol S.A. and Andean Chemicals Ltda. and (ii) US$764 million by means of a subordinated loan from Ecopetrol Capital AG.
By means of the Debt Service Guarantee Agreement, Ecopetrol S.A. provides a liquidity mechanism, allowing Reficar to pay its debt service in the situations in which there are liquidity shortfalls, as well as beingshortfalls.
During 2016, Reficar received capitalizations for US$615 million to cover project capital expenditures, start-up costs, one-off stabilization costs of the new refinery and a portion its debt service payments. The amount requested by Reficar under the Construction Support Agreement was US$425 million. The amount requested by Reficar under the Debt Service Guarantee Agreement was US$170 million. There was no need to request additional contributions under the Debt Service Guarantee to cover the debt service payment due on December 2016. Total debt service payments during 2016 totaled US$356 million.
The current credit agreements include a mechanism to exit the project finance by transferring itsthe debt toat the level of Ecopetrol S.A., either by (i) the occurrence of a Mandatory Debt Assumption Event or (ii) a Voluntary Debt Assumption; as defined in said agreements.
During 2014,In total, the requested amount by Reficar under the Debt Service Guarantee Agreement wasmodernization project has had capital expenditure needs of US$ 241 million. This was contributed by means7,867 million of a subordinated loan from Ecopetrol Capital AG for a maximum amounttotal capital expenditures approval of USD 249US$8,016 million.
We own and operate four petrochemical plants and one paraffin and lube plant located within Barrancabermeja. In 2014, we produced 31,051 tons per year of low-density polyethylene, a decrease of 11.7% compared to the production of 35,184 tons per year in 2013. This decrease was due primarily to a main turnaround in the cracking and Ethylene units and as a consequence, less feed to the petrochemical and paraffin units. We produced 676.7 mboepd of aromatics (benzene, toluene, xylene, orthoxylene, heavy aromatics and cyclohexane), a 2.6% increase as compared with the production of 659.7 thousand barrels of aromatics in 2013. The growth was mainly caused by an increase in toluene production instead of cyclohexane.
During 2014, Propilco’s2016, Propilco production totaled 390445 thousand tons of petrochemical products, a 1.5% decrease2.5% increase compared to the 396434 thousand tons produced in 2013.2015, due to higher sales volumes explained by greater competitiveness in the local market. The total contribution margin in 20142016 (including the contribution of polypropylene, polyethylene and masterbatches) was 11%9% higher than in 2013,2015, an increase from US$215293 per ton in 20132015 to US$239318 per ton in 2014.2016. The increase in contribution margin was primarily due to the execution of a new commercial strategy focused on differentiation and value-added products and services.
For the year ended December 31,(2) | ||||||||||||
| 2014 | 2013 | 2012 | ||||||||||
| (Metric Tons) | ||||||||||||
| Average capacity | 475,000 | 475,000 | 475,000 | |||||||||
| Throughput | 389,604 | 395,869 | 408,933 | |||||||||
| % Use | 82 | % | 83 | % | 86 | % | ||||||
Table 38 – Operating Capacity of Propilco
| For the year ended December 31, | ||||||||||||
| 2016 | 2015 | 2014 | ||||||||||
| (Metric Tons) | ||||||||||||
| Average capacity | 470,000 | 470,000 | 475,000 | |||||||||
| Throughput | 444,812 | 434,484 | 389,604 | |||||||||
| % Use | 95 | % | 92 | % | 82 | % | ||||||
| 3.6.1.4 | Biofuels |
We have investments in two biofuels companies: (i) Bioenergy S.A., in which we own 98.6% of the shares, currently advancing on the construction of an ethanol plant with theoretical capacity of 480,000 liters / day, and (ii) Ecodiesel S.A., in which we own 50% of the shares, currently in operations with a theoretical capacity of 100,000 tons per year of biodiesel.
| 43 |
| Marketing and Supply of Refined Products |
We are the main producer and supplier of refined products in Colombia. We market a full range of refined and feed-stockfeedstock products locally including regular and high octanehigh-octane gasoline, diesel fuel, jet fuel, natural gas and petrochemical products, among others.
Local sales of regular gasoline, LPG, jet fuel and diesel fuel are subject to government price regulation with reference to international benchmarks. We are the main producer and supplier of refined products in Colombia.
The CREG (Energy and Gas Regulatory Commission, for its acronym in Spanish), has the responsibility of setting forth regulation related to chain liquid fuels. This function was performed by the Ministry of Mines and Energy.
The responsibilities assigned to the CREG are:
| Research and Development; Intellectual Property |
Our Vice-PresidencyThe Colombian Petroleum Institute, the innovation and technology center of Technology and InnovationEcopetrol, was created in June 1985 to add value to our business chainsegments through innovation technology, knowledge and the development of technologies and competitive advantage. The Vice-Presidency of Technology oversees three directorates: The Colombian Petroleum Institute, the Directorate of Information Technology and the new Strategic Directorate of Knowledge, Innovation and Technology.advantages.
Our researchThe focus of technology development is on designing high added-value products and development activities are conducted by the Colombian Petroleum Institute. Its activities are focused on developing technology solutions for usEcopetrol and the Colombian oil industry. ItsThe scope of the Colombian Petroleum Institute activities covers all of our entire value chain:chain segments: exploration, production, refining, transportation supply and marketing,commercialization, as well as environmental issues,sustainability, asset integrity and automatization.automation. Each year we presentEcopetrol presents to the Colombian Institute for the Development of Science and Technology (Instituto(Instituto Colombiano para el Desarrollo de la Ciencia y la Tecnología, or COLCIENCIAS) ourits research, andtechnology development projects and innovation initiatives, in order to get a certificationobtain certifications for our investment inits science and technology.technology investments. COLCIENCIAS certifies science and technology investments, which are deductible from income tax upon execution; and Ecopetrol takes advantage of that tax benefit. In 2014, COLCIENCIAS recognized investments of2016, we obtained US$1115.6 million in science and technology projects. Our total investment in innovation and technology during 2014 was approximately US$156 million.technology-related tax benefits certified by COLCIENCIAS.
Our intellectual capital is preserved through a technological value-generation process and an intellectual property protection process, which includesinclude the consolidation of trade secrets, patents, copyrights, trademarks, industrial designs, and publications in specialized journals. InEcopetrol has filed 194 patent applications in the last eightten years, we have filed 162 new12 of them in 2016. Our most recent patent applications including 13include innovative technologies such as (i) a catalyst to efficiently upgrade heavy oil residues in 2014 for technologies related to equipment and processesa slurry-type hydrocracking reactor; (ii) a system for the preparationearly prediction of production events that are likely to trigger artificial lift system failures that may be avoidable; (iii) an intelligent tool to locate restrictions in pipelines; and (iv) two methods to obtain nanotechnology-based fluids, to prevent the flocculation of asphaltenes around the wellbore, and to break down emulsions, respectively. In 2016, Ecopetrol declared three industrial secrets that strengthen its competitive advantages in oil fields, surfactant formulations for enhanced oil recovery, performance analysisexploration of artificial lifting systems, virtual method of flow measuring and water cuts in oil wells with electric submersible pumps, portable modular anchorages underground and decanting valves, among others.Colombian basins.
In 2016, Colombian and international authorities granted us 10 new patents. We currently hold 6479 patents in Colombia, the United States, China, Mexico, Russia, Peru, Venezuela, Ecuador, Brazil, Nigeria, KoreaIndonesia, and Indonesia. In 2014, we were granted 13 new patents. In 2014, we were granted 180 copyrights. We also keep 33 trademarks, including our first slogan, “Clean Barrels.”Malaysia.
In 2014 eleven technological products developed by2016, Ecopetrol wereS.A. licensed twelve (12) of its technologies to ten national and internationalprivate companies for manufacturing, marketing commercialization, and after-sales support. TechnologicalTo date, we have licensed 28 technologies to Colombian and multi-national companies. These licensed technological products have been tested and successfully used successfully in theour organization andto solve problems related to refining, production and transportation of hydrocarbons, and some have potential uses in other industriesindustries.
| Applicable Laws and Regulations |
| 3.8.1 |
The main authorities that regulate our activities in Colombia are: the Ministry of Mines and Energy, the National Hydrocarbons Agency (ANH), the Energy and Gas Regulatory Commission (CREG), the Ministry of Environment and Sustainable Development, and the National Authority on Environmental Licensing (ANLA).
Ministry of Mines and Energy
The Ministry of Mines and Energy is responsible for managing and regulating Colombia’s non-renewable natural resources, ensuring their optimal use by defining and adopting national policies regarding exploration, production, transportation, refining, distribution and export of minerals and hydrocarbons.
National Hydrocarbons Agency – ANH
The ANH’s purpose is to manage the hydrocarbon reserves owned by the Nation through the design, promotion and negotiation of the exploration and production agreements in areas where hydrocarbons may be found that are not subject to joint ventures executed before December 31, 2003 and still in force, that are directly operated by Ecopetrol S.A.
The ANH is also responsible for creating and maintaining attractive conditions for investments in the hydrocarbon sector and for designing bidding rounds for exploration blocks. Furthermore, the ANH is responsible for managing all the royalties paid by oil and gas producers in Colombia.
The role of the ANH as administrator of the Nation’s hydrocarbon resources was assigned to Ecopetrol since 1974 until 2003. As part of this public function, Ecopetrol had the authority to assign areas for exploration and to execute various types of contracts with third parties, with the exception of concession contracts. As from 2003, and with the issuance of Decree Law 1760 of 2003, the public function of administration of the Nation’s hydrocarbon resources was assigned to the ANH, and Ecopetrol transferred all exploratory areas to the ANH, with certain exceptions as indicated below.
The aforementioned Decree Law provided that Ecopetrol would continue administrating Association Contracts executed by Ecopetrol with third parties before the date of entry into force of Decree Law 1760. It also provided that Ecopetrol would keep the exploration and productions rights to all areas that it was operating directly and/or subject to other service contracts or incremental production agreements different to Association Contracts. Therefore, the reform enacted in 2003 created a transitional regime by virtue of which Ecopetrol kept the administration of Association Contracts. This administration authority was confirmed by Decrees 4137 of 2011, and 714 of 2012 wherein it is clearly stated that ANH does not administrate Association Contracts.
Energy and Gas Regulatory Commission – CREG
CREG, a special administrative unit of the Ministry of Mines and Energy, is responsible for establishing the standards for the exploitation and use of energy and regulating the domestic utilities of electricity and fuel gas (liquefied petroleum gas and natural gas). CREG is also responsible for fostering the development of the energy services industry, promoting competition and responding to consumer and industry needs. It sets prices of petroleum products, except for regular motor gasoline, diesel and biofuels, along the entire chain of production and distribution; determines criteria and methodology for calculating the price of fuel; carries out the studies required for the determination and pricing of natural gas destined for use as automotive fuel and other purposes inherent in the commercialization of the same; regulates the rates in Pesos per kilometer/gallon for transportation through the pipeline system; and regulates the activities of refining, import, storage, distribution and transportation of liquid fuels derived from petroleum.
Ministry of Environment and Sustainable Development
The Ministry of Environment and Sustainable Development has among its main functions the issuance of public policies regarding the use and exploitation of natural resources and the regulation of national environmental laws.
The Ministry of Environment and Sustainable Development defines the procedures and guidelines that regulate the issuance of environmental licenses and permits necessary for the development of the following activities: production, exploration, extraction, transportation and refining.
National Authority on Environmental Licensing (ANLA)
The National Authority on Environmental Licensing issues environmental licenses and permits required for hydrocarbon-related activities. The ANLA is an administrative unit of the Environment Ministry, which is in charge of granting environmental licenses. Additionally, the National Authority on Environmental Licensing constantly monitors license compliance, handles complaints and grievances presented by local communities, and, has overall responsibility for regulating the procedures by which the environmental permits needed for Ecopetrol’s operation are issued and enforced. The ANLA also has power to impose preventive measures and/or sanctions to offenders of environmental laws and regulations.
ANLA has enacted regulations regarding environmental licenses as a complement to Resolution 90341 of 2014, the Ministry of Environment and Sustainable Development issued Resolution 0421 of 2014, which contains the terms of reference for the preparation of the environmental impact assessment (EIA) for oil exploration and exploitation projects. As of the first quarter of 2015, the terms of reference for the preparation of such EIAs are open for public comment and their enactment is expected by the first semester of 2015.
Other Authorities Related to Environmental Matters
Regional Autonomous Corporations
The Regional Autonomous Corporations are responsible for the administration of natural resources located within their jurisdiction and, although they do not have legal jurisdiction over issues related to the oil industry, they are responsible for granting permits for the use of certain natural resources, such as water, air and soil necessary for the development of our activities.
Ministry of Internal Affairs
The Ministry of Internal Affairs is responsible for certifying the existence of ethnic communities, such as Aboriginal, Afro Colombian and “Raizales”, a Colombian legal term that refers to the people born in the San Andrés Island archipelago. Such certification is intended to establish the presence of ethnic communities in areas in which seismic, exploration, extraction, transportation and refining activities are intended to take place. In addition, the Ministry has the ability to issue general guidelines that must be fulfilled through consultation with the relevant communities and which are necessary for the viability of any work, project or activity intended to be done in the territories of those communities.
| Regulation of Exploration and Production Activities |
| Business Regulation |
Pursuant to the Colombian Constitution, the Nation is the exclusive owner of all hydrocarbon resources located in Colombia and has full authority to determine the rights to be held and royalties or compensation to be paid by investors for the exploration or production of any hydrocarbon reserves. The Ministry of Mines and Energy and the ANH are the authorities responsible for regulating all activities related to the exploration and production of hydrocarbons in Colombia.
| 44 |
Decree Law 1056 of 1953 (the Petroleum Code—Code, orCódigo de Petróleos) declares that the hydrocarbon industry and its activities of exploration, exploitation, refinement, transportation and distribution are of public interest.interest, which means that, in the interest of the hydrocarbon industry, the Colombian government may order necessary expropriations in order to develop such industry. The hydrocarbon industry is under governmental supervision and control, regulated mainly by the Ministry of Mines and Energy and the ANH.
Ministry of Mines and Energy Resolution 18 1495181495 of 2009, as amended by Resolution 40048 of 2015, establishes a series of regulations regarding hydrocarbon exploration and production.
Ministry of Mines and Energy Resolution 18 0742180742 of 2012, as amendedpartially repealed by Resolution 90341 of 2014, included a series of technical regulations for unconventional hydrocarbon resources, including the procedures for advancing the exploration and exploitation of unconventional reserves. It also providesestablishes the types of wells and their classification as well as the fulfillment of those minimum (drilling and abandoning) conditions, necessary to initiate or perform E&P activities. Furthermore, it contemplates the applicable procedure to resolve disputes between mining sector and the oil and gas sector, regarding the coexistence of their rights in some specific projects.
On May 26, 2015, the Ministry of Mines and Energy issued Decree 1073 which compiles the majority of Colombian decrees and regulations in force regarding the administrative sector of mines and energy.
Agreement (Acuerdo,a type of regulation) 004 of 2012, as issued by the ANH, amends Agreement 008 of 2004 and sets forth the rules governing the award of exploration and production rights, the award of hydrocarbon exploration and exploitation areas and the execution of E&P Contracts, which can be accomplished through the following methods: open competitive process, closed competitive process and direct assignment.contracts.
Agreement 003 of 2014, as issued by the ANH, complements Agreement 004 of 2012 by setting forth the contractual framework for the carrying out of activities in unconventional reservoirs, the procurement regulations for the exploration and exploitation of unconventional fields in Colombia and the procurement process for the awarding of hydrocarbon exploration and exploitation areas.
Agreement 002 of 2015, as issued by the ANH, partially amends Agreement 004 of 2012 and sets forth the initial rules and measures the Government can take to mitigate the adverse effects of the decline of international oil prices. The main measures established by this agreement are the following:
| The extension of terms and deadlines for the execution of activities related to investments in exploration and evaluation phases and for the declaration of commercial discoveries; |
| (ii) | The establishment of procedures to transfer investments in exploration programs between allocated areas: and |
| (iii) | The levelling of the contractual terms of offshore contracts entered before 2014 to the ones included in the contracts executed as a result of the 2014 Colombian Round. |
Agreement 003 of 2015, as issued by the ANH, modifies and also partially amends Agreement 004 of 2012, and provides certain rules and measures the Government can take to mitigate the adverse effects of the decline of international oil prices. This agreement permits performance guarantees required under E&P contracts to be reduced in the same amount as the works actually performed during the term of the respective phase.
Agreement 004 of 2015, as issued by the ANH, also partially amends Agreement 004 of 2012, and provides certain rules and measures for the Government to mitigate the adverse effects of the decline of international oil prices. This agreement allows contractors to attribute additional activities carried out under a TEA to commitments under the first phase of an E&P contract.
| 3.8.1.1.1. | Environmental Licensing and Prior Consultation |
Law 99 of 1993 and other environmental regulations, such as particularly Decree 20411076 of 2014,2015, impose on companies, including oil and gas companies, the obligation to obtain an environmental license prior to undertaking any activity that may result in the serious deterioration of renewable natural resources, or that may have the capacity of materially modifying the physical environment.
| 45 |
The National Authority on Environmental Licensing (ANLA), created by means of Decree 3573 of 2011, is the entity responsible for evaluating the applications and issuing the environmental licenses for oil & gas-related activities, as well as surveilling and overseeing all hydrocarbons projects and monitoring the environmental compliance of such activities.
If the projects or activities could have a direct impact over the territories or the interests of indigenous, Afro-Colombian or Raizal communities, the Colombian Constitution provides that the companies developing such projects or activities must undertake a consultancypublic consultation process with those communities before initiating such projects or activities. This consultation procedureprocess is a pre-requisite for obtaining the required environmental licenses.
In addition, the Colombian Constitution and laws establish that, as part of the public participation mechanisms, Colombian individuals may demandrequest information regarding the activities of the project and their potential impacts. They may also request to undertake an environmental hearing so as to obtain information of the project.project subject to environmental licensing.
On May 26, 2015, the Ministry of Environment and Sustainable Development issued Decree 1076, which compiles the majority of Colombian regulations in force regarding environment and sustainable development.
The environmental licensing processlicense encompasses all of the necessary permits, authorizations, concessions and other control instruments necessary under Colombian environmental law to undertake a project or activity that may result in the serious deterioration of renewable natural resources, or that have the capacity of materially modifying the physical environment. The licensing process establisheslicense shall define specific conditions under which the beneficiary of the license may undertake such project or activity. This processThe procedure to obtain an environmental license begins when the company files an Environmental Impact Study (EIA) relatingrelated to the project withbefore the ANLA. The licensing process includes an application for the use of natural renewable resources (water, soil and air), the filing of an EIA and a plan to prevent, mitigate, correct and compensate for any activity that may harm the environment, known as the Environmental Management Plan (PMA).
According to recently issued regulations, obtaining a license may take between 165 and 265 business days, depending on whether the authority requires the applicant to file additional information and whether it is necessary to establish a governmental committee to determine the viability of the project.
On January 1, 2015, aA new environmental licensing processprocedure came into force in Colombia on January 1, 2015 as a result of the enactment of Decree 2041 of 2014, which now is compiled by Decree 1076 of May 26, 2015, repealing the licensing process defined in decree 2820 of 2010. According to the new regulation currently in effect, the procedure to obtain an environmental license shall not take more than 90 business days but, depending on the complexity of the information requested by the ANLA and some administrative delays, including an oral hearing to determine the viability of the project, the procedure may take longer.between 165 and 265 business days, depending on whether the applicant is required to file additional information. The new procedure incorporates an oral hearing between the ANLA and the applicant in order to evaluate the information provided in the license application and whether it is necessary to request additional information about the proposed project. The ANLA will have no other opportunities to request additional information after this hearing.
The Ministry of Environment and Sustainable Development is also responsible for establishing guidelines regarding climate change policies for the hydrocarbon sector in Colombia. We are in compliance with those guidelines. At present, the Ministry of Environment and Sustainable Development has not proposed any specific steps for the implementation of the Kyoto Protocol or the Paris Agreement, as it relatesthey relate to our operations. We are continuously monitoring climate change requirements that could be applicable to us.
A company that does not comply with the applicable environmental laws and regulations, does not execute the Environmental Management Plan (PMA) approved by the environmental authority or ignores the requirements imposed by an environmental license may be subject to an administrative proceeding initiated by the National Authority on Environmental LicensingANLA or the regional environmental authorities established by Law 1333 of 2009. The proceeding may result in oral or written warnings, monetary penalties, fines, license revocation or the temporary or permanent suspension of the activity being undertaken. Apart from administrative sanctions, the Colombian judiciary or other law enforcement authorities may also impose civil and even criminal sanctions if environmental damages are verified as a consequence of having breached the environmental laws and regulations applicable to the project.
| Royalties |
In Colombia, the Nation is the owner of minerals and non-renewable resources located in the subsoil, including hydrocarbons. Thus, companies engaged in exploration and production of hydrocarbons, such as Ecopetrol, must pay to the ANH,National Hydrocarbons Agency (ANH), as representative of the National Government of Colombia, a royalty on the production volume of each production field, as determined by the Ministry of Mines and Energy.ANH.
| 46 |
Royalties may be paid in kind or in cash. Each production contract has its applicable royalty arrangement in accordance with applicable law. In 1999, a modification to the royalty regime established a sliding scale for royalty payments for crude oil and natural gas production fields discovered after July 29, 1999 and depending on the quality of the crude oil produced. Since 2002, as a result of the enactment of Law 756 of 2002, the royalty rate was fixed as a sliding scale depending on the produced volume from 8% for fields producing up to 5,000five thousand bpd to 25% for fields producing in excess of 600,000600 thousand bpd. Changes in the royalty regime only apply to new discoveries and do not apply to fields already in the production stage as of July 29, 1999. Producing fields pay royalties in accordance with the royalty law in force at the time of the discovery.
Regarding natural gas, in accordance with Resolution 877 of 2013, as amended by Resolution 640 of 2014, starting on January 1, 2014, the ANH has received royalties in cash rather than in kind. Thus, the producer may dispose of its gas production volumes corresponding to royalties paid in cash.
| Regulation of Transportation Activities |
Hydrocarbon transportation activity is considered a public interest activity in Colombia and a public service. As such, it is under governmental supervision and control, regulated mainly by the Ministry of Mines and Energy and the CREG.
Transportation and distribution of crude oil, liquifiedliquefied petroleum gas and refined products must comply with the Petroleum Code, the Code of Commerce and all governmental decrees and resolutionsresolutions. According to Law 681 of 2001, multipurpose pipelines owned by Ecopetrol (through Cenit) must be open to third-party use on the basis of equal access to all.
Notwithstanding the general rules for hydrocarbon transportation in Colombia, natural gas transportation is subject to regulations specific to the natural gas industry as issued by CREG, due to the categorization of natural gas distribution as a public interest activity under Colombian laws.
Transportation systems, classified as crude oil pipelines and refined product pipelines, may be owned by private parties. Pipeline construction, operation and maintenance must comply with environmental, social, technical and economic requirements under national guidelines and international standards for the oil and gas industry.
Construction of transportation systems requires licenses and local permits awarded by the Ministry of Mines and Energy, the Ministry of Environment and Sustainable Development and regional environmental authorities, respectively.
Crude oil transport
The Colombian regulatory framework relating to crude oil transportation accounts for both private use and public use pipelines. Private use pipelines are those built by the operating or refining entity for its own exclusive right and that of its affiliates. Public access pipelines are defined as pipelines built and operated by a public or private legal entity, for the purpose of publicly providing crude oil transportation services. The Colombian Governmentgovernment, through the ANH, has thea preferential right to use up to 20% of the total capacity of any public or private access pipeline to transport its share of production. However, for both private and public access pipelines, the ANH must cover anypay the tariff expensesfor the pipeline use to transport thisits percentage of production.
The Ministry of Mines and Energy is responsible for reviewing and approving the design of and blueprints oftracks for crude oil pipelines. The Ministry establishespipelines, by establishing transport rates based on information provided by the service providers. It also oversees the calculation and payment of hydrocarbon transport-related taxes and manages the information system for the oil product distribution chain.
| 47 |
In 2014, the Ministry updated the transport regulation and the rate calculation method for this line of business. It introduced a framework for the secondary market and incentives for new pipeline construction and current pipeline capacity expansions. According to the Petroleum Code, rates are to be revised every four yearsyears. During the scheduled revision of 2015 and due to the dramatic changes in international crude oil prices, the Ministry of Mines and Energy allowed, by means of Resolution 31 325 of 2015, transportation companies and oil production companies to engage in direct negotiations in order to agree on a tariff suitable for both parties. The negotiation period was extended until June 2016. Notwithstanding the fact that tariff agreements were reached with certain companies, the results of the negotiations were not positive. Thus, tariffs were set by the Ministry of Mines and Energy in accordance with the next revision taking place incriteria previously established by Resolution 72146 of 2014, latterly amended by Resolution 31325 of 2015.
The Port Superintendence is the authority that oversees the port business for crude oil and refined products. Although this business is not highly regulated, market participants are required to report certain information to the Port Superintendence.
As a result of the enactment of Decree 119 of 2015, operators of private use hydrocarbon ports are currently able to provide hydrocarbon transport services to third parties pursuant to a mechanism established under that decree.
Refined products transport
In 2014 the CREG assumed responsibility for regulating product pipeline transportation from the Ministry of Mines and Energy, in addition to its pre-existing regulatory responsibility for Liquefied Petroleum Gas, Natural Gasliquefied petroleum gas, natural gas and Electric Energyelectric energy transportation.
CREG is in the process of defining and introducing the transportation regulation and the rate calculation method for refined products. TheseOn September 25, 2015, CREG published a draft resolution that established the proposed regulations are expectedfor transport of liquid fuels and liquefied petroleum gas. The primary goals and components of the proposed regulation are: a) to beensure access to the transport systems for liquid fuels and the LPG pipeline systems without discrimination; b) to promote the timely expansion of the transport system in place in 2015line with the needs of the market; c) to promote competition and 2016, respectively.
The Domestic Public Service Superintendence also overseesprevent restrictive practices; d) to separate the Liquefied Petroleum Gas transportation business. Cenit reports key operationaloperations of refining and financial indicatorstransport; and e) to it on a monthly basis.ensure the efficient and continuous operation of transport systems. Currently, CREG continues with the task of drafting this regulation.
| Regulation of Refining and Petrochemical Activities |
Article 58 of the Petroleum Code establishes that oil refining activities can be developed throughout the Colombian territory and are not reserved to the State. However, Article 4 establishes that such activities are considered of public interest subject to governmental regulation, and the development of those activities must comply with technical requirements established by regulation.
In 2008, Law 1205 was issued with the main purpose of contributing to a healthiercleaner environment. It established the minimum quality specifications for fuels in Colombia. Since August 2010, Ecopetrol has been selling diesel and gasoline at its refinery in Barrancabermeja in order to produce diesel and gasoline that complies with the requirements of the aforementioned law.
The Ministry of Mines and Energy establishes the safety standards for LPG, storage equipment, maintenance and distribution of LPG. Regulations issued in 1992 established that every local, commercial and industrial facility with a storage capacity of LPG greater than 420 pounds must receive an authorization for operations from the Ministry of Mines and Energy.
| Regulation of Liquefied Petroleum Gas (LPG) and Liquid Fuels |
Wholesale marketing, transport, distribution and retail marketing of LPG are mainly regulated by CREG Resolution 74 of 1996, and subsequent resolutions. LPG in Colombia is primarily obtained through Ecopetrol’s refineries, field production and imports. The LPG must meet minimum quality standards to be marketed. Our wholesale marketing and transport activities are regulated by ResolutionsResolution 53 of 2011 (as amended by Resolutions 108 of 2011, 154 of 2014, 019 of 2015, and 92034, 063 and 064 of 2009.2016). The LPG price is regulated by CREG Resolutions 66 of 2007 and(as amended by Resolutions 59 of 2008.2008, 002 of 2009, 123 of 2010, 095 of 2011, 65 and 129 of 2016).
According to Article 212 of the Petroleum Code and Law 39 of 1987 (added by Law 26 of 1989), the distribution of liquid fuels and their derivatives is considered a public utility. Consequently, individuals or entities engaged in these activities are subject to regulations issued by the Colombian government. The Government has the power to determine quality standards, measurement and control of liquid fuels, and establish penalties that may apply to dealers who do not operate in compliance therewith.
| 48 |
The Ministry of Mines and Energy is the entity that controls and exercises technical supervision over the distribution of liquid fuels derived from petroleum, including the refining, import, storage, transportation and distribution in the country. Law 812 of 2003 identified the agents of the supply chain of petroleum-derivatedpetroleum-based liquid fuels.
The distribution of liquid fuels, except LPG, is governed by Decree 42991073 of 2005, as modified by Decrees 1333 and 1717 of 2007 and 2008, respectively,2015, which establishes the requirements, obligations and penalties applicable to supply agents in the distribution, refining, import, storage, wholesale, transportation, retail sale and consumption of liquid fuels.
Decrees 283
Decree 1073 of 1990 and 1521 of 1998, and their modifications, establish2015 establishes the minimum technical requirements for the construction of storage plants and service stations. The DecreesThis Decree also regulateregulates the distribution of liquid fuels, establishing the minimum requirements for distributors and the activities and types of agreements permitted for these agents. The Ministry of Mines and Energy also regulates the types of liquid fuels that can be sold and purchased and the penalties for noncompliance with governmental regulations.
ThePursuant to Law 1430 of 2010, the distribution of fuels in areas near Colombian borders is the responsibility of the Ministry of Mines and Energy and is subject to specific regulations that impose strong control procedures and requirements. Ecopetrol is not responsibleThe Ministry of Mines and Energy establishes the safety standards for fuelLPG, storage equipment, maintenance and distribution in these areas. That responsibility was transferred toof LPG. Resolution 31514 of 1992 established that any LPG household, commercial and industrial facility with a storage capacity of LPG greater than 420 pounds must receive an authorization from the Ministry of Mines and Energy pursuantprior to Law 1430 of 2010.commencing operations.
The Domestic Public Service Superintendence also oversees the liquefied petroleum gas transportation business. Cenit reports key operational and financial indicators to it on a monthly basis.
| Regulation Concerning Production and Prices |
SinceAccording to the Decree - Law 4130 of 2011, CREG is in charge of setting the prices of petroleum by-products throughout the entire chain of production and distribution except for current gasoline engine, diesel and biofuels. On the other hand, by Decree 381 of 2012, as amended by Decree 1617 of 2013, the Ministry of Mines and Energy is in charge of setting the methodology to determine the reference price of gasoline, diesel (ACPM), biofuels and mixtures thereof.
Then, since May 2012, CREG regulatesfixes the prices for most crude oil by-products. In the case ofby-products, but for gasoline, diesel, ACPM and biofuels,biofuels. CREG determines the methodology for calculating theto calculate their price of those by-products, andwhile the Ministry of Mines and Energy establishesfixes the relevant prices in accordance with the methodology established by CREG.said methodology. The ANH determinesdoes not intervene in the formula that is used to calculate royalty payments corresponding to the productiondefinition of crude oilprices of gasoline and the crude oil price reference for local refining. diesel fuel.
The methodology for calculating jet fuel prices is set out in Law 1450 of 2011, and jet fuel prices themselves are set by the Ministry of Mines and Energy.
The ANH determines the formula that is used to calculate royalty payments corresponding to the production of crude oil and the crude oil price reference for local refining.
Decree 381 of 2012 and 1617 of 2013, as amended by Decree 2881 of 2013, restructured the Ministry of Mines and Energy and gave it the responsibility to study industry problems and implement short- and long-term refining planning policies. The Ministry is also responsible for establishing the governmental policies and goals to ensure the reliability, stability and continuity for the production of liquid fuels, biofuels and others.
Pursuant to Article 58 of the Petroleum Code, any refining company operating in Colombia must provide a portion or, if needed, the total of its production to supply local demand prior to exporting any production. If local demand increases, and imported crudes are needed, the refining company may charge the State additional transportation costs in proportion to the imported crudes delivered to the refinery.
The Fuel Price Stabilization Fund (FEPC) was created by means of Law 1151 of 2007 with the aim to mitigate, in the domestic market, the impact of fluctuations in fuel prices (gasoline and motor fuel oil) in international markets. As per article 1012.3.4.1.3 of the Law 1450Decree 1068 of 2011,2015, the funding for the operation of the FEPC comecomes from the following sources: (a)(i) financial returns on the funds of the FEPC; (b)(ii) extraordinary contributions from the National Treasury; and (c) revenues obtained(iii) resources from the negative difference between the international parity price and the reference price established by the MinistryGeneral Budget of Mines and Energy.Colombia.
Notwithstanding the above, the Constitutional Court, by means of decision C-621 of September 10, 2013 declared unconstitutional section c) of article 101 of Law 1450 of 2011. As a consequence thereof, Law 1739 of 2014 created the Participation Differential as a so-called parafiscal contribution to the FEPC, which control, management, supervision, liquidation, determination and collection is entrusted to the Ministry of Energy and Mines. The Participation Differential arises when the international parity price is lower than the reference price established by the Ministry of Mines and Energy.
| 49 |
The FEPC is currently regulated by Decree 1068 of 2015, which compiles Decree 1880 of 2014, whichand sets forth the calculation method of the Differential as the product of the volume reported by the refiner and/or importer to the Ministry of EnergyMines and MinesEnergy times the difference between the international parity price and the reference price. It also provides that refiners andand/or importers shall submit monthly reports to the Ministry of EnergyMines and MinesEnergy on the volume, origin and origintype of the fuel (gasoline and motor fuel oil) sold in the domestic market for said period.
Based on those reports, the Ministry of EnergyMines and MinesEnergy shall calculate and liquidate the Differential between the regulated price set and the import parity price (the “Net Position”)Net Position every six months by issuing a resolution provided, however, that such Net Position results from the sum of the Differentialsdifferentials for the relevant semester.six-month period. Decree 18801068 of 20142015 also provides that the FEPC shall pay in pesosColombian Pesos the value corresponding to the semestralsix-month Net Position of each refiner and/or importer within the term that the Ministry of Mines and Energy establishes and based on availability of resources of the FEPC. For more information regarding the FEPC and Ecopetrol, see the section 5.1.2.
The
By Resolution 31356 of 2016, the Ministry of Mines and Energy liquidated the net positions for Ecopetrol corresponding to December 23 to 31, 2014 and the first and second quarters of 2015, establishing that Ecopetrol must pay to FEPC COP$114,172,749,145.09 as a contribution differential; Ecopetrol appealed but the Ministry of Mines and Energy confirmed its decision by Resolution 31121 of 2017.
By Resolution 31127 of 2017, the Ministry of Mines and Energy liquidated the net position for the third quarter of 2015 and October 1 to November 25, 2015, establishing that FEPC must pay to Ecopetrol COP$318,638,400,647.33.
By Resolution 31128 the Ministry of Mines and Energy liquidated the net position for Ecopetrol corresponding to November 26 to December 31, 2015 and the first half of 2016 establishing that FEPC must pay to Ecopetrol COP$338,252,758,969.68.
As of the date of this annual report, the Ministry of Mines and Energy has not calculated or settledliquidated the Net Positions corresponding to the last quarter of 2013 (taking into account that the regulations in force at that time stated that the calculationPosition for each fuel (gasoline and settlement took place on a quarterly basis), nor those corresponding to the two semesters of the year 2014. Applicable regulations do not provide for the payment of interest on the Net Positionsmotor fuel oil) to be paid by the FEPC.FEPC to Ecopetrol for its sales during the second half of 2016.
Ecopetrol estimates thatRecently, Law 1819 of December 29, 2016, created a contribution to finance the valueFEPC which will come from the sales in Colombia of gasoline or ACPM by the refiner or importer to be recognized in favorthe wholesale distributor, on the basis of Ecopetrol for this concept is approximately the sum of Ps$828 billion.differential between the international parity price and the reference price.
OnThe Ministry of Mines and Energy will exercise the other hand,functions of control, management, settlement, determination, discussion and pursuant to Resolutions 181384 of 2010 and 124600 of 2010, the actual costscollection of the volumes imported by Ecopetrolcontribution. In particular, it will calculate the contribution to cover the deficit of internal demand that have yet not been recognized, will be paid with resources obtained from the FEPC providedthrough the liquidation of the quarterly Net Position of each refiner or importer with respect to the FEPC based on the reporting of information that said amounts have not been offset against the projects developed in the Barrancabermeja Refinery. We estimate that the amount to be recognized as a Compensation Differential in respect of this matter is of Ps$78 billion (this figure is included in the figure mentioned in the paragraph above).refiners and/or importers present.
| Regulation of Biofuel and Related Activities |
The sale and distribution of biofuels is regulated by the Ministry of Mines and Energy. Regulations establish the quality and pricing standards for biofuels and impose minimum requirements for mixing ethanol with gasoline and biodiesel with diesel.
The sale and distribution of biofuels is provided under CREG Resolution 240 of 2016, which particularly regulates: a) sorts of market that will be served with biogas and biomethane; b) quality and safety conditions; and c) tariff regime (article 2). Pursuant to article 4 of the before mentioned Resolution, biogas supply through isolated networks to serve non-regulated users and natural gas vehicles (“GNV” as per its Spanish acronym), shall be incorporated as a public utility company. Furthermore, article 5 provides that biomethane supply through isolated networks or interconnected networks to the National Transportation System shall also be incorporated as a public utility company. Finally, article 12 states that biogas suppliers may develop the production, transportation, distribution and commercialization activities through integrated structures, provided that they keep separate accounts for each activity and grant free access to the networks to both regulated and non-regulated users. In the same way, production, distribution and commercialization of biomethane through interconnected networks to the National Transportation System may be developed through integrated structures as long as the supplier keeps separate accounts for each activity and grants free access to the networks to both regulated and non-regulated users.
| 50 |
| Regulation of the Natural Gas Market |
Decree 21001073 of 2011,2015, issued by the Ministry of EnergyMines and Mines,Energy, established that all producers have to issue a production statement that includes the volumes of natural gas available for sale for a period of ten years. This decree also introduced a newestablished the regime for the selling and marketing of natural gas in Colombia, including specific procedures that regulate the Colombian market in order to manage the remaining natural gas reserves owned by the Nation, and to protect domestic consumers, especially residential consumers, by prioritizing delivery of gas to residential consumers, regulating the export of natural gas and setting forth the export restrictions applicable during an internal shortage of natural gas.
Currently in Colombia, other than with respect to the Opón field, the price of natural gas is determined by the market.
CREG issued Resolutions 088 of 2013 and 089 of 2013 (amended by CREG Resolutions 204 of 2013, 089 and 122 of 2014, 022, 032, 088, 105, 139, 143, and 218 of 2015, 137 and 070 of 2016 and 001 of 2017) that established the procedures for marketing natural gas in Colombia. PursuantHowever, pursuant to Decree 21001073 of 2011, however,2015, such procedures do not apply to the following activities: a) natural gas exports; b) natural gas as raw material in petrochemical production; c) natural gas commercialization from minor fields (production capacity under 30 million cfpd); d) natural gas commercialization from hydrocarbon fields under testing phase or which have not yet been declared commercially viable; e) natural gas commercialization from unconventional reservoirsreservoirs; and f) internal consumption from natural gas producers.
CREG determines which agents can participate in the primary and secondary markets. Ecopetrol is authorized to participate as a seller in the primary market as a natural gas producer and as a buyer in the secondary market when Ecopetrol requires natural gas from other producers for its own needs. CREG regulations provide that a natural gas producer cannot participate as a merchant of natural gas in the secondary market except that it may purchase gas to meet its existing contractual obligations. Ecopetrol is also able to re-sell available natural gas transportation capacity into the secondary market.
Priorities
Priority for Deliverythe Supply of Natural Gas
The export of natural gas, in contrast, is not considered a public utility activity under Colombian law and therefore is not subject to Law 142 of 1994. Nevertheless, the internal supply of natural gas is a priority for the Colombian government and is considered to be a public utility complementary activity, and therefore public utility regulations apply to the internal supply of natural gas. Decrees 880
Decree 1073 of 2007, 45002015 (amended by Decree 2345 of 2009 and 2100 of 2011 provide2015) provides that in the event the supply of natural gas is reduced or halted as a result of a shortage, the Colombian government has the right to suspend the supply of natural gas for exportation. If such export contracts are suspended by the Colombian government, the export agents are entitled to receive compensation in accordance to article 42.2.2.2.15 and 272.2.2.2.38 of Decree 2100, 2011.1073, 2015. Notwithstanding the foregoing, Decree 21001073 of 20112015 establishes freedom to export natural gas under normal gas-reserve conditions. Producers of natural gas may enter into natural gas export contracts if the ratio of proved reserves to consumption exceeds seven years, as determined by the Colombian Energy Planning Authority (or UPME for its Colombian acronym).
Decree 1073 of 2015 (amended by Decree 2345 of 2015) establishes an order of supply when restrictions are placed on the supply of natural gas or serious emergency situations arise that preclude the continued provision of certain services, as follows: (i) essential demand, as established in Decree 1073 of 2015, (ii) non-essential demand under an existing agreement with a warranty of uninterrupted provision, and (iii) fair exports delivery.
The Ministryorder of Minespriority for the supply of natural gas is as follows: (i) the operation of the compressor stations of the National Transportation System, (ii) residential users and Energy establishes distribution prioritiessmall business users engaged in the event of a shortfall of reserves or production of natural gas. Residential consumers with existing supply contracts, small businesses and distributors ofdistribution network, (iii) vehicular compressed natural gas have theand (iv) gas refineries, excluding those destined for self-generation of electricity that can be replaced with energy from National Transportation System, which has first priority for delivery.
priority. The Ministry of Mines and Energy also establishes distribution priorities in the event of a natural gas shortfall derived from supply or infrastructure issues. This order of priority is based on the type of contract, with firm supply contracts having priority over interruptible supply contracts.
| 51 |
Decree 21001073 of 20112015 and CREG Resolutions 089 of 2013 and 204 of 2013 provide specific procedures and forms of supply agreements determined by CREG pursuant to which an agent may sell and buy natural gas in the Colombian primary and secondary market produced from large fields (capacity of more than 30 million cfpd). Decree 21001073 of 20112015 and CREG Resolution 089 of 2013 permits the sale of natural gas from small fields (capacity under 30 million cfpd) pursuant to contracts that fulfill certain regulatory requirements but whose form is not prescribed by law.
| Sustainability Initiatives |
| 3.9.1 | HSE |
The followingThis section describes the health, safety and environmental (HSE) practices of Ecopetrol S.A. Currently, subsidiaries of Ecopetrol S.A. establish their own HSE models, provided that these models must be consistent with guidelines established by Ecopetrol S.A.
| 3.9.1.1 | Ecopetrol S.A. |
One of the principles that guide Ecopetrol is our commitment to our peopleemployees and the development of those communities in which we operate. For that reason, Ecopetrol S.A. is devoted to improving our health, safety and environmental (HSE) practices.
HSE management is essential for us because it promotes policies designed to recognize and understand process risks and prevent occupational accidents and other major incidents.
We have several programs in place aimed at increasing the safety of our industrial processes and minimizing the number of occupational accidents and other major incidents. Our HSE management model is based on key focus areas that are aligned with our integrated management system:system.
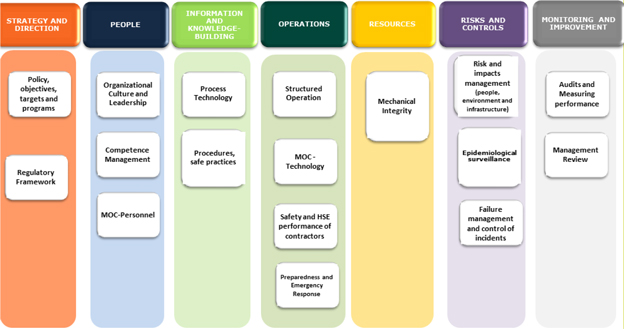

Applying these policies, we have made the following improvements in our key focus areas:
(2)PEOPLE
The results of thesethe HSE strategies in 2014,2016, compared with the prior year, were:
| · |
| · |
| · |
| · |
| · | A reduction in the severity of occupational incidents. |
| · |
| · | Improvement in reporting of minor oil spills and identification of their causes. |
Contingency Plans and Environmental Remediation
All of our operational areas have preparedness and emergency response plans, each in accordance with Colombian legal requirements and our new internal guidelines for emergency management.
| 52 |
Our preparedness and emergency response plans have been developed based on our analysis of risk scenarios, the estimated consequences of these events and the implementation of strategies to be followed in response to each scenario.
The objectives of our contingency plans are to:
| · | Protect the health and safety of our workers, contractors and the communities in which we operate. |
| · | Prevent oil spills and leaks of harmful substances in offshore and onshore areas, fires and explosions and mitigating environmental impacts. |
Our contingency plans include:plan includes:
| · | Procedures for the containment of oil and other harmful substances, as well as procedures to safeguard the safety of affected communities and the personnel involved in such containment actions. |
| · | Strategies for responding to emergencies located outside of our facilities and mutual aid emergency plans, including actions developed with local environmental authorities, stakeholders, the local community and other organizations for containment and recovery of spilled product, and cleaning and recovery of affected areas, monitoring of the environmental effects and compensation for local communities and other affected persons. |
Further, we are upgrading the skills of our fire brigade, ensuring the reliability of firefighting and emergency equipment and working on improving our performance during drills.
In offshore operations, our operator has the responsibility of designing and implementing plans and strategies aligned with international best practices that cover various emergency response scenarios.
Total Recordable Incident Rate – Employees and Contractors
Ecopetrol S.A. places an important emphasis on understanding, monitoring and controlling our impacts on workers and contractors.
Ecopetrol S.A. monitors a standard measure of occupational safety known as the Total Recordable Incidents Frequency Index (TRIF), which represents the number of employee or contractor injuries that require medical treatment or time off for every million hours worked.
TRIF has improved from 4.28 incidents per million hours worked in 2010 to 2.161.09 in 2014.2016. In 2014,2016, 28% of occupational accidents affecting our employees and contractors resulted in a disabilitymedical treatment, restricted work or time away from work that lasted for three days or less. This representsAdditionally, we had a significant decline38% reduction in occupational incidents compared to 2015 as a result of the seriousnesssustained implementation of injuries resulting from such occupational accidents.the HSE management system.
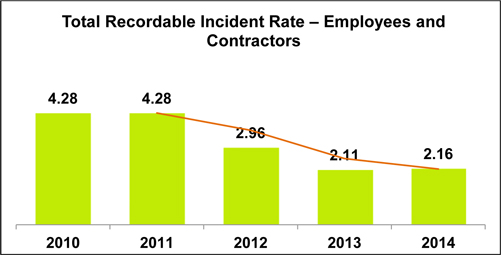
Contractors (*) (**)

| * | Number of employee or contractor injuries requiring medical treatment or time off for every million hours worked |
| ** | Includes data for Ecopetrol S.A. and the Vice-Presidency of Transport and |
| 53 |
Frequency of process safety incidents
Since 2009, we have been working on aOur “Process Safety Management” (PSM) system aimed at minimizing operational incidents, such as fire, explosion, loss of primary containment and multiple fatalities. Our PSM Strategystrategy is to: first, define high-risk processes; second, prioritize intervention in high-risk processes; and third, apply all PSM elements in the prioritized high-risk processes.
Loss of primary containment (LOPC) is the number of unplanned or uncontrolled releases of oil, gas or other hazardous materials.
Our indicator includesWe report Tier 1 process safety incidentsevents per million hours worked, has improved andwhich are the costs associated with these incidents have declined by 50% in 2014 as comparedlosses of primary containment of greatest consequence causing harm to 2013. In 2014, there were 20a member of the workforce, costly damage to equipment or exceeding defined quantities according to API-754. We reduced our Tier 1 process safety incidents.
indicator by 33% compared to 2015 (2016: 0.06 and 2015: 0.09). The reporting thresholds for API-754 Tier 1 is an unplanned or uncontrolled release of any material, including non-toxic and non-flammable materials, from a process that results in one or more health, safety or environmental consequences set forth under those guidelines. In 2016, there were 0.06 Tier 1 process safety incidents per million hours worked.
Frequency of Tier 1 process safety incidents per hours worked (per million hours worked):
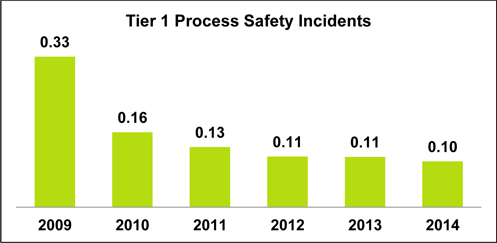

| * | Tier 1 process safety incidents per million hours worked (API-754) |
| ** | Includes data for Ecopetrol S.A. and the Vice-Presidency of Transport and |
Environmental Incidents
In 2014,2016, Ecopetrol S.A. recorded 298 environmental incidents compared with; 34with 11 in 20132015 and 2729 in 2012.2014. The volume of oil spills was 202 barrels in 2016, a decrease from 207 barrels in 2015 and 885 barrels in 2014, a substantial decrease from 6,843 barrels in 2013 and 4,059 barrels in 2012.2014. The decrease in the numbers of environmental incidents and oil spills was the result of the identification of critical equipment operating in high or very high risk conditions, and the implementation of asset integrity plans designed to mitigate those risk conditions.
| 3.9.1.2 | Cenit |
Until 2013, Ecopetrol maintained responsibility for Cenit’s HSE guidelines. In 2014, however, we delegated responsibility over Cenit’sWhile Cenit had previously followed Ecopetrol’s HSE guidelines, to Cenit’s internal staff.in 2015, Cenit has continued to follow Ecopetrol’s HSE practices through 2014, but is currently undergoing a transition process to establishestablished its own HSE governance.practice and set and defined its own HSE Key Performance Indicators (KPIs) and targets in respect of its non-operative facilities and offices. This resulted in significant cost reductions with no change in risk levels in 2015 and 2016. Local and field operations, however, are still conducted under Ecopetrol’s HSE model and guidelines.
Cenit intends to implement its own HSE Management System based on Decree 1072 of 2015 during the first half of 2017. Cenit is also leading the definition of HSE KPIs with all of the midstream subsidiaries to be able to measure the transportation business as a whole and share the lessons learned and best practices within the industry.
| 54 |
| 3.9.1.3 | Refinería de Cartagena |
In 2014,2016, around 3610.4 million man-hours were employed conducting Reficar’s business activities. Our HSE performance indicators for Total Accident Frequency Rate (AFR)Recordable Cases (TRIF), Total Accident Severity Rate (ASR)Process Safety Incident (ISP) and Environmental Incident Index (EI) were well-within our established guidelines, as shown in the table below:guidelines.
| INDICATOR | GOAL | OUTCOME 2014 | ||||
| AFR | 1.69 or less | 1.03 | ||||
| ASR | 1.5 or less | 0 | ||||
| EI | 0 | 0 | ||||
The following table covers Reficar´s Total Recordable Cases (TRIF) for 2015 and 2016, which includes Ecopetrol Operation and Maintenance (O&M), Reficar and subcontractors. The table presents statistics related to construction, pre-commissioning, start-up and operating activities. Reficar reported more than 145 million man-hours without fatalities (accidents that caused deaths) during the period 2010-2016.
OtherTable 39 – Performance Indicators
| METRIC | 2016 | 2015(1) | ||||||
| Man-hours | 10,351,896 | 32,944,698 | ||||||
| Recordable accidents | 29 | 57 | ||||||
| Total recordable cases (TRIF)* | 2.80 | 1.73 | ||||||
| Environmental Incidents (EI) | 0 | 0 | ||||||
| Process Safety Incidents (ISP)* | 0.19 | 0.03 | ||||||
(1) In our annual report on Form 20-F for 2015, man hours and accidents corresponding to Reficar’s construction stage were reported. This report registers man hours and accidents of 2015 corresponding to the entire operation of the Refinery.
* In the second half of 2016, these risks were associated with the new stage of operation of the units while in 2015 they were associated with the construction, commissioning, precomissioning and start-up of the new refinery.
The results of other related performance indicators were outstanding during the current year. The results2016 were:
| · | Lost Time Injury |
| · | Medical Treatment |
| · |
| · | Environmental Incidents: |
| · |
In addition, in 2014 some of Reficar’s accomplishments include:
Historical Performance
Over the last three years, our HSE performance has continuously improved. The following table and chart cover our Total Accident Frequency Rate (AFR) and Total Accident Severity Rate (ASR) from 2012 to 2014.
| For the year ended December 31, | ||||||||||||
| 2014 | 2013 | 2012 | ||||||||||
| Man-Hours | 36,065,413 | 26,106,164 | 17,641,197 | |||||||||
| Recordable Accidents | 37 | 49 | 36 | |||||||||
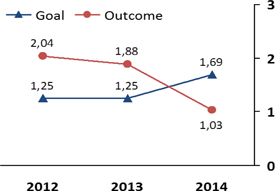 | 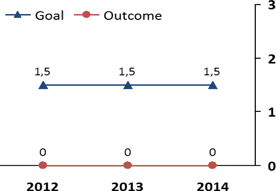 |
(*) Year-on-year figures are shown from November to November of each year.
| 3.9.2 | Human |
In 2013, Ecopetrol updated itshas a Human Rights Policy and adoptedwith an integrated and systemic management approach to human rights based on the due diligence principle. In 2014, Ecopetrol focused its efforts on strengthening its approachprinciple, which we continued to human rights.strengthen in 2016.
Ecopetrol maintains corporate mechanisms to ensure its compliance with national and international human rights laws and certain non-binding international standards, as well as to generate value to the company and to society through the promotion of human rights. These mechanisms are:
In view of our commitment to respect and promote human rights, we have begun a process of promoting these values in all of our controlled subsidiaries. In 2014, Ecopetrol released a Human Rights Guideline which establishes the key considerations that our subsidiaries must take into account with regard to Human Rights in terms of planning, risks analysis, monitoring, and best practices.
Regarding human rights risks analysis, our monitoring process has been strengthened in order to prevent and mitigate negative impacts on human rights. Sources of information-gathering have been amplified, internal monitoring systems have begun to integrate human rights aspects and the areas involved in the monitoring process have increased, according to the type of risk.
Additionally, Ecopetrol S.A. has continuedupdated its work in promoting human rights in the several territories where it has operations by promoting initiatives that support:
Ecopetrol S.A. has carried out a human rights risk assessment in order to evaluate and mitigate human rights impacts. As a result of this assessment, Ecopetrol S.A. has focused its efforts on the following principles:
| · | Right to life, liberty and personal security, |
| · | Right of association and collective bargaining, |
| 55 |
| · | Abolition of forced or compulsory labor, |
| · | Abolition of child labor, |
| · | Equality and non-discrimination at work, |
| · | Just, equitable, and satisfactory conditions of work, |
| · | Rights of ethnic groups, and |
| · | Collective rights and the environment. |
An important tool in our promotion of human rights is the Human Rights Monitoring System, which was implemented in 2013 and monitors human rights risks in order to identify potential impacts that can be prevented or mitigated.
In 2014, Ecopetrol increased the number of locations covered by the Mine Risk Education Project implemented jointly with the Presidential Program on Integral Action against Landmines. Ecopetrol reached various high risk municipalities such Orito, Saravena, Tumaco, Puerto Leguizamo, Inzá, Jambaló, Popayán, Doncello, Cubará, Cumaribo and Cantagallo. 622 people, including indigenous community members, Afro-Colombian people, rural teachers, children and teenagers participated in the workshops executed under the program, twice the number of participants involved in 2013.
| 3.9.3 |
For the fourth consecutive year, Ecopetrol was listed in the Dow Jones Sustainability Index-World (DJSI). The DJSI is a global indicator that monitors the financial performance of leading companies committed to corporate sustainability. Ecopetrol remained within the top 10% (20 companies) of oil & gas companies around the world, among the 2,500 companies listed and included in the Dow Jones Index.
| Environmental Sustainability |
| Environmental Practices |
Ecopetrol S.A.
During 2014,2016, the environmental management strategy of Ecopetrol included the following components:
| 1. | Environmental Viability: this strategy concentrates on obtaining environmental licenses and permits as well as adequate land management that ensures the sustainability of operations through timely prevention efforts and management of environmental impacts, constant and systematic relationships with stakeholders and participation in the sustainable development of the territories in which we operate. |
| 2. | Climate Change: this strategy aims to decrease our carbon emissions and reduce the vulnerability of our operations and our facilities to the effects of climate change through the implementation of four strategic action lines: |
| · | Mitigation: reducing our carbon dioxide emissions and creating carbon offset alternatives; |
| · | Vulnerability and Adaptation: reducing the risks and impacts to our operations posed by climate variability and change; |
| · | Research and Technology: reducing our greenhouse gas emissions through action on research and development, process optimization, implementation of energy efficient strategies, carbon capture and sequestration and diversification into low carbon energy |
| · | Involvement in Policymaking: informing and influencing government policies on climate change. |
| 3. | Biodiversity: this strategy aims to reduce Ecopetrol’s impacts on the ecosystems in areas where we operate. This strategy mainly focuses on knowledge building and conservation efforts in areas where we operate. |
| 4. | Eco-efficiency: this strategy aims to maximize our efficient use of resources and mitigate our environmental impacts. Through this strategy, which extends to our supply chain, we seek to utilize energy, materials, and in general all natural resources as efficiently as we can, thereby reducing the environmental impacts from our operations and projects and minimizing emissions, effluents and waste disposal from our operations and projects while taking into account our production benchmarks. |
| 5. | Integrated Management of Water Resources: this strategy aims to ensure compliance with water resources laws and reduce conflicts over water use in the areas near our projects and operations. Our core focus areas under this strategy are aligned with the objectives defined by the 2010 National Water Policy for the Management of Water Resources in Colombia which focuses on water supply, demand, quality, risk governance and institutional strengthening. |
Since 2009, Ecopetrol has reported its achievements in the sphere of environmental management to various relevant organizations focused on promoting sustainable business practices, such as the Dow Jones Sustainability Index, the Carbon Disclosure Project (CDP) and the CDP Water Information Request; Environmental Benchmarking of ARPEL.
Refinería de Cartagena
Environmental Investments
To fulfill commitments regarding EIA and Colombian ruling, during 2014 the following investments were executed:
| Energy Projects |
Ecopetrol S.A. hasRefining
Ecopetrol’s refining companies have been undertaking significant efforts to make efficient and rational use of energy resources in ourits production processes and reduce energy consumption and costs and carbon dioxide emissions. We focus on efficiency, reliability and optimization, and energy diversification. During 2014, Ecopetrol S.A.’s2016, the refinery segment’s average monthly energy consumption was 678 MW61.42 MWhm (megawatts per hour per month) equivalents, from which 90%99.9% was provided through self-generation and the remaining 10%0.01% with non-regulated energy purchased from the National Transmission System.
Corporate Efficiency Energy PlanProduction
Our Corporate Efficiency Plan accomplishedFurther, during 2016, Ecopetrol S.A.’s production sector had an average a monthly energy consumption of 272,839 MWhm (megawatts per hour per month) for its direct operation, from which 76% was provided through self-generation and the following during 2014:remaining 24% with non-regulated energy purchased from the National Transmission System.
Energy Surplus Sales
According to CREG and Public Services Superintedency regulations, a company that has energy self-generation capacity, such as Ecopetrol, can sell its energy surplus to related companies, that is, companies from the same economic group.
In 2014, Ecopetrol, as a marginal producer, which is a generator whose production is higher than their own consumption of self-generated energy, sold energy that was self-generated from the operations in Galán (Barrancabermeja) and Apiay pumping station to Cenit for Ps$3.7 billion. In addition, Ecopetrol is also looking to supply demand from other related companies. This contributes to decreased energy costs and increased energy efficiency within our economic group.
| Related Party and Intercompany Transactions |
Set forth below is a description of material related party transactions. For additional information about transactions with related parties, see clause xxviNote 32 – Related Parties to Note 33—Differences between Colombian Governmental Entity accounting principles and U.S. GAAP to theour consolidated financial statements.
Ocensa
Ecopetrol S.A. has entered into a number of agreements with its 72.65%-owned subsidiary Ocensa, of which the following are the most significant:
| · | In March 1995, Ecopetrol S.A. entered into an agreement for the transportation of crude oil through the Ocensa pipeline. Pursuant to the terms of this agreement, Ecopetrol S.A. was required to make monthly payments that varied depending on both the volume of crude oil |
| · | In December |
| · | On July 10, 2012, Ecopetrol entered into a ship or pay agreement for the |
| 57 |
| · | On January 17, 2013, Ocensa and its |
The Ocensa shareholders’ agreement establishes the basis for Ocensa’s corporate governance model. It provides for a board of directors composed of five members, two of which must be independent. Cenit may nominate three members of the board of directors, including the two independent members, while minority shareholders may together nominate the remaining two members.
The Ocensa shareholders’ agreement provides the minority shareholders with certain rights, including the right to nominate two members of the five-member board of directors. Significant decisions must be approved by a qualified majority of at least four Ocensa shareholders, and by supermajorities of the outstanding Ocensa shares. These actions include, among others:others (i) issuing additional shares or publicly listing shares, declarations of dividends in amounts other than all distributable income and certain amendments to Ocensa’s bylaws and (ii) asset sales in excess of US$50 million;
| · | On October 28, 2013, Ecopetrol entered into a natural gas supply contract in force until November 30, 2018, pursuant to which Ecopetrol S.A. supplies gas to Ocensa and receives a fixed price per MBTU (million British Thermal Units). This agreement replaced the contract for natural gas supply in Cusiana entered into on December of 2004, under which Ocensa paid a variable rate to Ecopetrol. In |
Ocensa has entered into the following agreements, among others, with some of our other subsidiaries:
| · | In March 1995, |
| · | On July 9, 2012, Ocensa and ODL entered into a strategic alliance for the dilution of crude oil in the Cusiana station. |
Oleoducto de Colombia S.A. (ODC)
Ecopetrol S.A. entered into the following agreements with its 73%-owned subsidiary ODC:
| · | In July 1992, a take-and-pay agreement was signed for the transportation of hydrocarbons. Pursuant to this agreement, Ecopetrol S.A. must pay a previously agreed tariff |
| · | In August 1992, an operation and maintenance agreement was signed for the Vasconia and Coveñas terminals both property of ODC. |
| · | In March 1998, a joint operation agreement was signed for the TLU-1 Coveñas buoy. |
| · | In September 1999, a joint operation agreement was signed for the TLU-3 Coveñas buoy |
| · | In July 2006, an operation and maintenance agreement was signed for the Caucasia |
ODC has entered into the following agreements with some of our other subsidiaries:
| · | Between March 1992 and January 1993, Hocol, |
| 59 |
Oleoducto de los Llanos Orientales (ODL)
Ecopetrol S.A. has entered into the following agreements, among others, with its 65%-owned subsidiary ODL:
| · | In March 2009, Ecopetrol S.A. entered into a ship-or-pay agreement with ODL that establishes a financing tariff used to pay ODL’s indebtedness to Grupo Aval for five years. This agreement was superseded by a new contract executed in May 2010, with a seven-year term, to reflect new conditions agreed with Grupo Aval. In August 2013, this contract was amended, providing a new term of seven years, including |
| · | In September 2009, Ecopetrol S.A. entered into a second ship-or-pay agreement with ODL that establishes a financing tariff collected through a trust fund that in turn is responsible for making debt service payments to security holders. Under this agreement, ODL committed to transport 19,500 bpd during the first phase of the ODL project (which began in September 2009 and ended in the first quarter of 2010) and 39,000 bpd upon commencement of the second phase of the ODL project which occurred in the first quarter of 2010 and |
| · | In December 2009, Ecopetrol S.A. entered into a service agreement with ODL to transport crude oil. This agreement was replaced in January 2014 by a new agreement that expires in December 2020. This is a |
| · | In March 2010, Ecopetrol S.A. entered into a pipeline operating and maintenance agreement with ODL. This agreement |
| · | In July 2013, Ecopetrol S.A. entered into a service agreement with ODL to dilute, in the facilities of the Cusiana |
| · | In August 1, 2015, ODL entered into an indefinite management agreement with Oleoducto Bicentenario by means of which ODL receives legal representation and provides management services to Oleoducto Bicentenario. Pursuant to the terms of this agreement, Bicentenario paid to ODL COP$13 billion plus applicable taxes in 2016. |
Oleoducto Bicentenario de Colombia S.A.S.
Ecopetrol S.A. has entered into the following agreements, among others, with its 55.97% owned subsidiary Oleoducto Bicentenario de Colombia S.A.S.:Bicentenario:
| · | In June 2012, Ecopetrol S.A. entered into ship-or-pay and ship-and-pay crude oil transportation agreements with Oleoducto Bicentenario that |
| 60 |
| · | In June 2012, Ecopetrol S.A. and Hocol entered into |
| · | In August 2012, Ecopetrol S.A. entered into an Operation and Maintenance agreement for the |
Ecodiesel
| · | Ecopetrol S.A. entered into a supply agreement with Ecodiesel Colombia S.A. (“Ecodiesel”), a company in which Ecopetrol S.A. has a 50% equity interest. This agreement has been operative since August 1, 2010. Pursuant to the terms of this agreement, Ecodiesel must deliver to Ecopetrol S.A. |
Savia Peru S.A.
| · | On February 19, 2016, Ecopetrol S.A., as lender and shareholder of 50%, and Savia Perú, as borrower, entered into a five-year loan agreement for an aggregate principal amount not to exceed US$70 million. The proceeds of the facility will be used to (i) repay short term loans and (ii) pay shortfalls related to final judgments (in case they materialize). The loan agreement accrues interest at an annual rate of 4.99%, which can be adjusted on an annual basis, with semi-annual interest payments and principal payments beginning on the 21st month following the disbursement date. As of April 2017, Ecopetrol disbursed US$56.5 million under the loan agreement. Korea National Oil Corporation (KNOC), as shareholder of the other 50% of Savia Perú, signed a facility under the same terms and conditions as described above. |
Transactions with Other State-Controlled Entities
Other than the agreements that we have entered into with the ANH, and described in the sectionBusiness overview – Joint Venture and Other Contracts, in the ordinary course of business we enter into transactions with other state-owned entities that include but are not limited to the following:
| · | Selling and purchasing goods, including crude oil purchases of ANH royalties (see below); |
| · | Properties and other assets; |
| · | Rendering and receiving services; |
| · | Leasing assets; |
| · | Depositing and borrowing money; and |
| · | Using public utilities. |
| 61 |
For the years ended December 31, 2014, 2013,2016, 2015 and 2012,2014, we purchased the following volumes of crude oil from the ANH (National Hydrocarbon Agency) corresponding to royalties paid in kind by oil producers in Colombia: 44.042.9 million barrels, 49.545.6 million barrels and 48.045.4 million barrels, respectively. See the sectionBusiness overview–Overview—Applicable lawsLaws and regulations–Regulations—Regulation of explorationExploration and production activities–Production Activities—Business regulation–Regulation—Royaltiesfor a description of the current royalty scheme.
| Insurance |
We have a clear and defined corporate policy based on risk financing guidelines that summarizes the Company’s risk transferencetransfer and retention alternatives and provides support and guidance for all the insurance-related issues of all of our affiliated and subsidiary companies.
There are twothree corporate insurance programs covering Ecopetrol S.A. and its subsidiaries. In the text and tables below, we set forth our insurance programs and the companies covered, along with limits and coverage details.
World-Wide UmbrellaGroup 1- Downstream Program:This insurance program provides coverage for downstream (assets and operations) of Ecopetrol S.A. and all of its subsidiaries in excess of their local insurance programs, and also in excess of the “Global Energy Package” program, when applicable. Coverage includes all physical damage and sabotage and terrorism, general liability, directors and officers, crime and marine cargo. Physical damage, sabotage and terrorism coverageswhich were designed to cover downstream operations, while general liability, directors and officers, crime and marine cargo coverages were designed to cover down-, mid- and upstream operations.
| Limit (eel/agg(1)) | Deductible | |||||||||||||||||||||||||||||
| Policies | Onshore | Offshore | Onshore | Offshore | Ecopetrol Downstream | Reficar | Proplico | Ecopetrol Upstream | Equión | Hocol | Ecopetrol America | Ecopetrol Brazil(2) | ODL | Cenit | ||||||||||||||||
| (US$ in million) | ||||||||||||||||||||||||||||||
| Property all risk | 2,000 | NA | 5 - 10 | N/A | X | X | X | NA | NA | NA | NA | NA | NA | NA | ||||||||||||||||
| Sabotage and terrorism | 600 | NA | 0.5 | N/A | X | X | X | NA | NA | NA | NA | NA | NA | NA | ||||||||||||||||
| Third-party Liability | 500 | NA | 1 – 5(3) | NA | X | X | X | X | X | X | NA | NA | X | X | ||||||||||||||||
| Crime | 50 | NA | Various | NA | X | X | X | X | X | X | NA | NA | NA | X | ||||||||||||||||
| Directors and Officers | 250 | NA | Various | NA | X | X | X | X | X | X | X | X | NA | X | ||||||||||||||||
| Cargo | 250 | NA | 3% Dispatch | NA | X | X | NA | X | NA | X | NA | NA | NA | NA | ||||||||||||||||
Table 40 – Group 1 Downstream Program
| Limit (eel/agg*) | Deductible | Ecopetrol | ||||||||||||||||||
| Onshore | Offshore | On shore | Off shore | Downstream | Reficar | Propilco | ||||||||||||||
| (figures in USD in millions) | ||||||||||||||||||||
| Policies | ||||||||||||||||||||
| Property all risk | 2,744 | 0 | 5 | N/A | X | X | X | |||||||||||||
| Sabotage and terrorism | 600 | 0 | 0.5 | N/A | X | X | X | |||||||||||||
(*) Eel: each and every loss. Agg: Aggregate
Global Energy Package.Group 2 – Up and Midstream Program:This program provides coverage for upstream and midstream (assets and operations) of Ecopetrol’s interests and all of its upstream subsidiaries, includingsubsidiaries. Coverage includes all physical damage, sabotage and terrorism general liability and control of wells.
| Limit (eel/agg(1)) | Deductible | |||||||||||||||||||||||||||||
| Policies | Onshore | Offshore | Onshore | Offshore | Ecopetrol Upstream | Equión | Hocol | Ecopetrol America | Ecopetrol Brazil | ODL | Cenit | |||||||||||||||||||
| (US$ in million) | ||||||||||||||||||||||||||||||
| Property All Risk | 400 | 400 | 0.025 | 0.5 | X | X | X | X | NA | X | X | |||||||||||||||||||
| Sabotage and terrorism | 50 | 50 | 0.5 | N/A | X | X | X | NA | NA | X | X | |||||||||||||||||||
| Third-party Liability | NA | 500 | N/A | 0.15 | X | NA | NA | X | X | NA | NA | |||||||||||||||||||
| Control of wells | 25-250 | (2) | 400 | 0.25 | 5 | X | X | X | X | X | NA | NA | ||||||||||||||||||
Table 41 – Group 2 Upstream and Midstream Program
| Limit (eel/agg*) | Deductible | Ecopetrol | ||||||||||||||||||||||||||||
| Onshore | Offshore | Onshore | Offshore | Upstream | Equion | Hocol | América | Brazil | ODL | Cenit | ||||||||||||||||||||
| (figures in USD in millions) | ||||||||||||||||||||||||||||||
| Policies | ||||||||||||||||||||||||||||||
| Property all risk | 400 | 400 | 0.25 | 0.5 | X | X | X | X | NA | X | X | |||||||||||||||||||
| Sabotage and terrorism | 55 | 0 | 0.5 | N/A | X | X | X | NA | NA | X | X | |||||||||||||||||||
| Control of Wells | 250/50** | 400 | 0.25-0.5 | 5 | X | X | X | X | X | NA | NA | |||||||||||||||||||
(*) Eel: each and every loss. Agg: Aggregate
(**) Drilling USD250M / Production USD50M
| 62 |
Group 3 – Transversal Program:This program provides coverage for downstream, upstream and midstream operations of Ecopetrol and its subsidiaries and all of its subsidiaries in excess of their local insurance programs. Coverage includes general liability, directors and officers, cargo, crime and charterers’ liability.
Table 42 – Group 3 Transversal Program
| Limit (eel/agg*) | Deductible | Ecopetrol | Ecopetrol | |||||||||||||||||||||||||||||||||||||||||||||||
| On shore | Off shore | On shore | Off shore | Down stream | Reficar | Propilco | Up stream | Equion | Hocol | América | Brazil | ODL | Cenit | |||||||||||||||||||||||||||||||||||||
| (figures in USD in millions) | ||||||||||||||||||||||||||||||||||||||||||||||||||
| Policies | ||||||||||||||||||||||||||||||||||||||||||||||||||
| Third Party Liability | 500 | 500 | 1 | 1 | X | X | X | X | X | X | X | X | X | X | ||||||||||||||||||||||||||||||||||||
| Crime | 75/150 | Various | Various | X | X | X | X | X | X | NA | NA | NA | X | |||||||||||||||||||||||||||||||||||||
| Directors& Officers | 250 | Various | Various | X | X | X | X | X | X | X | X | NA | X | |||||||||||||||||||||||||||||||||||||
| Cargo | 120 | 3% dispatch | NA | X | X | NA | X | NA | X | NA | NA | NA | NA | |||||||||||||||||||||||||||||||||||||
| Charterers | 750 | 0.02 | NA | NA | NA | X | NA | NA | NA | NA | NA | NA | ||||||||||||||||||||||||||||||||||||||
(*) Eel: each and every loss. Agg: Aggregate
Our third-party liability insurance policies cover Ecopetrol S.A., our subsidiaries and affiliates in excess of local underlying policy limits for claims made against them by third parties. Our commercial general liability umbrella liability, and excess liability coveragescoverage will pay on behalf of or indemnify amounts for which an insured becomes legally obligated to pay, including damages in respect of bodily injury, property, pollution and product liability. Coverage of bodily injury and property damage is subject to coverage territory during the policy period.
With respect to offshore operations in the U.S. Gulf Coast, Ecopetrol America Inc. is party to Operating Agreements, or OAS, that include customary conditions and which contain similar terms and provisions to those in the Model Form of Offshore Deepwater Operating Agreement of the American Association of Professional Landmen (AAPL).Landmen. In general, pursuant to these OAs, the obligations, duties, and liabilities of the contract parties are several, and not joint or collective, for all operations covered by the OAs.
Ecopetrol Óleo e Gás do Brasil Ltda. and Ecopetrol del Perú are parties to Joint Operating Agreements (JOA) based on the Association of International Petroleum Negotiators (AIPN) model. Liability is generally the same as described for the OAS above, with the following variations: if claims arise from third parties as part of a claim not involving an operator’s gross negligence or willful misconduct, and the operator pays such claims, all parties must concur and reimburse such claim amounts. In certain contracts, all environmental damages are distributed according to the parties’ participation interest, regardless of whether the damages were caused by an operator’s gross negligence or willful misconduct. In certain cases, non-operators may intervene and directly verify compliance of the operator’s HSE programs. Ecopetrol uses the same liability clauses in JOAs for offshore operations in Colombia, when Colombian laws do not govern such agreements.
| Human Resources/Labor Relations |
| 3.12.1 | Employees |
As of December 31, 2014,2016, the Ecopetrol S.A.Corporate Group had 9,15010,920 employees, an increase of 4%1.48% from 2013.2015. Most of our employees are located in Colombia. The table below presents the breakdown of Ecopetrol employees according to the business segments where they work, and the personnel of our subsidiaries for the years ended December 31, 2014, 2013,2016, 2015 and 2012.
| As of December 31, | ||||||||||||
2014(2) | 2013(1) | 2012 | ||||||||||
| Ecopetrol S.A. | ||||||||||||
| Exploration and Production | ||||||||||||
| Exploration | 187 | 188 | 174 | |||||||||
| Production | 2,022 | 1,867 | 1,725 | |||||||||
| Others | 429 | 437 | 386 | |||||||||
| Total Exploration and Production | 2,638 | 2,492 | 2,285 | |||||||||
| Downstream | ||||||||||||
| Refining | 2,771 | 2,716 | 2,425 | |||||||||
| Marketing | 199 | 187 | 181 | |||||||||
| Others | 19 | 18 | 16 | |||||||||
| Total Downstream | 2,989 | 2,921 | 2,622 | |||||||||
| Transport | 1,251 | 1,184 | 1,097 | |||||||||
| Others | 3 | |||||||||||
| Total Operations | 6,881 | 6,597 | 6,004 | |||||||||
| Corporate | 2,269 | 2,203 | 2,083 | |||||||||
| TOTAL ECOPETROL S.A. | 9,150 | 8,800 | 8,087 | |||||||||
| Ecopetrol America Inc. | 57 | 47 | 28 | |||||||||
| Bioenergy S.A. | 96 | 106 | 143 | |||||||||
| Bioenergy Zona Franca S.A.S. | 94 | 92 | 35 | |||||||||
| Hocol S.A. | 185 | 197 | 194 | |||||||||
| Equión Energía Limited | 462 | 486 | 493 | |||||||||
| Oleoducto Central S.A. | 249 | 245 | 133 | |||||||||
| Oleoducto de Colombia S.A. | 1 | 1 | 1 | |||||||||
| Oleoducto de los Llanos S.A. | 33 | 16 | 17 | |||||||||
| Oleoducto Bicentenario de Colombia S.A.S. | 39 | 28 | 27 | |||||||||
| Ecopetrol del Perú S.A. | 0 | 2 | 12 | |||||||||
| Refinería de Cartagena S.A. | 247 | 234 | 158 | |||||||||
| Ecopetrol Óleo e Gás do Brasil Ltda. | 14 | 14 | 14 | |||||||||
| Propilco S.A. (Esenttia S.A.) | 367 | 353 | 339 | |||||||||
| Cenit | 75 | 65 | 20 | |||||||||
| TOTAL | 11,069 | 10,686 | 9,701 | |||||||||
2014.
Table 43 – Corporate Group’s Employees
| As of December 31, | ||||||||||||
| 2016 | 2015(1) | 2014(2) | ||||||||||
| (number of employees) | ||||||||||||
| Ecopetrol S.A. | ||||||||||||
| Exploration and Production | ||||||||||||
| Exploration | 225 | 218 | 187 | |||||||||
| Production | 2,095 | 1,880 | 2,022 | |||||||||
| Others | 452 | 457 | 429 | |||||||||
| Total Exploration and Production | 2,772 | 2,555 | 2,638 | |||||||||
| Downstream | ||||||||||||
| Refining | 2,685 | 2,700 | 2,771 | |||||||||
| Marketing | 133 | 136 | 199 | |||||||||
| Others | 72 | 6 | 19 | |||||||||
| Total Downstream | 2,890 | 2,842 | 2,989 | |||||||||
| Transport | 949 | 1,158 | 1,251 | |||||||||
| Others | 244 | 61 | 3 | |||||||||
| Total Operations | 6,855 | 6,616 | 6,881 | |||||||||
| Corporate | 1,993 | 2,115 | 2,269 | |||||||||
| TOTAL ECOPETROL S.A. | 8,848 | 8,731 | 9,150 | |||||||||
| Ecopetrol America Inc. | 71 | 75 | 57 | |||||||||
| Bioenergy S.A. | 145 | 122 | 96 | |||||||||
| Bioenergy Zona Franca S.A.S. | 258 | 126 | 94 | |||||||||
| Hocol S.A. | 179 | 172 | 185 | |||||||||
| Equion Energía Limited | 321 | 458 | 462 | |||||||||
| Oleoducto Central S.A. | 290 | 271 | 249 | |||||||||
| Oleoducto de Colombia S.A. | 2 | 2 | 1 | |||||||||
| Oleoducto de los Llanos S.A. | 55 | 56 | 33 | |||||||||
| Oleoducto Bicentenario de Colombia S.A.S. | 0 | 0 | 39 | |||||||||
| Ecopetrol del Perú S.A. | 0 | 0 | 0 | |||||||||
| Ecopetrol Costa Afuera de Colombia S.A.S. | 0 | |||||||||||
| Refinería de Cartagena S.A. | 170 | 270 | 247 | |||||||||
| Ecopetrol Óleo e Gás do Brasil Ltda. | 16 | 17 | 14 | |||||||||
| Polipropileno del Caribe S.A. (Esenttia S.A.) | 409 | 388 | 374 | |||||||||
| Cenit Transporte y Logistica de Hidrocarburos S.A.S. | 156 | 73 | 72 | |||||||||
| TOTAL | 10,920 | 10,761 | 11,073 | |||||||||
| (1) |
| (2) | 79 persons employed by us during 2014 were not included in our 2014 employee statistics as they were independent contractors involved in non-regular activities and cannot be classified as temporary employees. |
| 63 |
Loans and investment on training and development for our employees
To improve the quality of life of our employees, Ecopetrol S.A. extends various types of loans to them,its employees, including housing loans and general-purpose loans. The principal amount of the loan depends on the applicant’s tenure and cannot exceed 59 times the applicant’s monthly salary. Ecopetrol S.A. does not guarantee any loans made by third parties. In 2014,2016, Ecopetrol S.A. extended 856999 housing loans for a total of Ps$ 33,565COP$173 billion and 1,4621,742 general-purpose loans for a total of Ps$10,807COP$13 billion. Ecopetrol S.A. also provided on-site and external training and development, courseswhich total to our employees. As of December 31, 2014, Ecopetrol S.A.’s investments in employees’ development amounted to Ps$28,920COP$5.7 billion, and it extended a total of Ps$103,487COP$165 billion in subsidies for education.
Other than maintainingWe have not provided loans (including housing loans to some executive officers as described in the table below, neither Ecopetrol S.A. nor any of its subsidiaries, have provided loans,loans), extended or maintained credit lines, arranged for the extension of credit by third parties, materially modified or renewed an extension of credit lines, in the form of a personal loan to or for any of our executive officers since our ADSs were registered under the Exchange Act. Certain
There are no executive officers receivedwith housing loans from Ecopetrol S.A. prior to becoming executive officers; these loans have not been discontinued upon such persons’ appointment to executive office, nor have they been amended. The balance of our outstanding loans to executive officers was made prior to Ecopetrol S.A. becoming a public company.Ecopetrol.
The following table sets forth a description of the loans outstanding to our executive officers as of December 31, 2014 (figures in millions of Colombian Pesos).
| Executive Officer | Date of Approval | Nature of the Loan and Date of Disbursement | Principal Amount of the Loan | Amount Outstanding at December 31, 2014 | Largest Amount Outstanding during period | Termination Date | Applicable Interest Rate | |||||||||||||
| Pedro A. Rosales | April 30, 1997 | Housing, August 16,1997 | 47.3 | 0 | 247.5 | - | - | |||||||||||||
| September 16, 2003 | Housing, December 11,2003 | 231.9 | 97 | December 2018 | UVR | |||||||||||||||
| Nestor Saavedra(2) | August 10,2007 | Housing, October 25,2007 | 134.1 | 80 | 134.1 | April 2018 | UVR | |||||||||||||
| Jaime Bocanegra Bernal(3) | November 12, 2010 | December 15, 2011 | 271.4 | 237 | 271.4 | June 2027 | UVR | |||||||||||||
Magda Manosalva(4)
| October 10, 2007 | November 27, 2007 | 133.4 | 215 | 318 | - | - | |||||||||||||
| March 30, 2009 | May 26, 2009 | 184.6 | July 2024 | UVR | ||||||||||||||||
| Ingrid Lorena Dumez Montero(5) | July 21, 2005 | Housing, August 8, 2005 | 126 | 81 | 279 | August 2020 | UVR | |||||||||||||
| November 12, 2010 | Housing, November 11, 2011 | 153 | 133 | UVR | ||||||||||||||||
Labor Regulation
In accordance with article 123 of the Colombian Constitution and the article 7th of the Law 1118 of 2006, our employees are considered “public servants”; even though they are subject to the common labor law. As such, their behavior is subject to the rules to those who handle public interests and goods and could be held liable for their illegal actions and omissions pursuant to the following regimes (1)regimes: (i) disciplinary (Law 734 of 2002), (2)(ii) criminal or (3)(iii) civil.
| 3.12.2 | Collective Bargaining Arrangements |
Ecopetrol S.A.
A collective bargaining agreement between us and our main labor unions governs the labor relations we have with our unionized employees, which amounted to 2,9414,180 employees as of December 31, 2014.January 1, 2017. The agreement also governs theour labor relations with the 1,0202,818 non-unionized employees that agreedwho, according to abide by it after requesting a waivercurrent labor legislation, have been beneficiaries of Agreement 01 of 1977. the collective bargaining agreement.
We currently have threefive industry-wide labor unions and oneseven company labor union:unions:
| · | Unión Sindical Obrera de la Industria del Petróleo — USO (industry labor union); |
| 64 |
| · | Asociación de Directivos Profesionales, Técnicos y Trabajadores de las Empresas de la Rama de Actividad Económica del Recurso Natural del Petróleo y sus Derivados de Colombia — ADECO (industry labor union); |
| · | Sindicato Nacional de Trabajadores de Empresas Operadoras, Contratistas, Subcontratistas de Servicios y Actividades de la Industria del Petróleo y Similares — SINDISPETROL (industry labor union); |
| · | Unión de Trabajadores de la Industria Energética Nacional y de Servicios Públicos – UTEN (industry labor union); |
| · | Asociación Sindical de Trabajadores de la Industria del Petróleo – ASTIP (industry labor union); |
| · | Asociación de Profesionales de Ecopetrol — ASPEC (company labor union); |
| · | Sindicato Nacional de Trabajadores de Ecopetrol — SINCOPETROL (company labor union); |
| · | Asociación Sindical de Empleados de Ecopetrol – ASOPETROL (company labor union); |
| · | Asociación Sindical de Trabajadores de Ecopetrol – TRASINE (company labor union); |
| · | Asociación Sindical de Trabajadores de Ecopetrol – ASTECO (company labor union); |
| · | Sindicato de Trabajadores Petroleros de Ecopetrol – SINPECO (company labor union): and |
| · | Sindicato |
Currently Ecopetrol S.A. does not have any workers in the SINCOPETROL union. This union does not participate in the negotiation process.
Our employees and anyAny employee working for any company in the oil and gas industry may join the USO, ADECO SINDISPETROL, UTEN or Sindispetrol. SincopetrolASTIP. Only our employees may join the company labor unions.
Ecopetrol S.A. relations with unions are based on a permanent dialogue and ASPEC may only be joined by our employees.communication sessions where different matters are discussed in order to solve and prevent any labor conflict.
The following are the relevant terms of the five-year collective bargaining agreement with USO, ADECO and Sindispetrolhas been in effect since 2014 and expiringexpires on June 30, 2018. These agreements coverIn 2016, the agreement was reviewed on application matters, except for monetary expenses (including wages and benefits). This review ended with a mutual arrangement document, signed on December 10, 2016.
This agreement currently covers all workers benefiting from the Collective Labor Convention, regardless of whether they are part of any labor union:union.
| 4. | Financial Review |
The following discussion considers our financial results and the factors affecting those results under Colombian Government Entity GAAP, unless otherwise indicated.
Certain line items from ourOur consolidated financial statements as offor the years ended December 31, 20122014, 2015 and 2013 related2016 were prepared in accordance with IFRS. Our date of transition from our previous GAAP to IFRS was January 1, 2014.
IFRS differs in certain significant respects from the presentation ofcurrent Colombian IFRS (which is the consolidated Balance Sheet and the Consolidated Statement of Financial, Economic, Social and Environmental Activities have been reclassified in order to make the presentation of suchaccounting standard we use for local statutory reporting purposes). As a result, our financial statementsinformation presented under IFRS is not directly comparable to thatcertain of our financial statements asinformation presented under Colombian IFRS. A description of December 31, 2014.the differences between Colombian IFRS and IFRS is presented underSummary of Differences between Internal Reporting (Colombian IFRS and IFRS) below.
Our consolidated financial statements were consolidated line by line and all transactions and significant balances between affiliates have been eliminated. These financial statements include the financial results of all subsidiarysubsidiaries companies controlled, directly or indirectly, by Ecopetrol S.A. See NoteExhibit 1—Economic entityConsolidated companies, associates and principal accounting policies and practices,joint ventures, to theour consolidated financial statements included in this Annual Report.annual report.
| 65 |
| Factors Affecting Our Operating Results |
Our operating results arewere affected mainly by international prices of crude oil and, to a somewhat lesser extent, international prices for refined products and local prices for natural gas, as well as sales volumes, product mix, exchange rate and our operational environment.performance. Crude oil prices and volumes are particularly important to the results of our exploration and production segment. This is because as export volumes or export prices of crude oil and products decrease or export prices decrease, so do revenues.increase, thus revenues too. Results from our refining activities are also affected by the price of crude oil used as raw material, changes in product prices in the international market, change in environmental regulations, conversion ratios and utilization rates and refining capacity, all of which affect our refining margins. Changes in the value of foreign currencies, particularly the U.S. dollar against the Colombian Peso, can also have a significant effect on our financial statements. Finally, terrorist attacks by guerillas against our pipelines and other facilities can lead to loss of revenues by restricting the availability of transport systems for exports or sales of crude oil and products in addition to the direct costs of repair.repairing and cleaning them.
Sales volumes and prices
TheOur results from the exploration and production segment dependdepends mainly on our sales volumes and average local and international prices for crude oil, petrochemicals and natural gas that we bring to market.gas. Additionally, sales volumes are affected by the purchase of crude oil and natural gas that we make from our business partners, third parties and the ANH.
We sell crude oil mainly in the international market as exports.market. We also both process crude oil at the Barrancabermeja and Reficar refineries and sell refined and other petrochemical products in the local and international markets.
Local sales and prices
We have a number of crude oil short-term commercial agreements with local customers, and natural gas short and long-term supply contracts with local customers, including gas-fired power plants and local natural gas distribution companies. Local sale prices are determined in accordance with existing regulations, contractual arrangements and the spot market linked to international benchmarks. Local sales represent 48% of our total revenues, on average, for the past three years.
International Sales and Prices
We export surpluses of crude oil and refined products only after our supply commitments with our refineries and local customers have been fulfilled. InternationalOur foreign sales have accounted for 63%represented 52% of our total revenues, on average, for the past three years.
Our commercial
International sale prices are determined in accordance with contractual arrangements and the spot market linked to international benchmarks primarily ICE Brent benchmark.
A market diversification strategy focuses on market diversification.has allowed us to focus towards markets where we have been able to capture better value for our crudes and refined products. We sell our crudes and refined products in various regions, such as Asia, Europe, Latinthe U.S., Central America and the U.S. Gulf Coast.Caribbean, Asia and Europe. In our negotiations with potential customers, we seek to use the most liquid benchmark reference prices in each region.
Exploration costs
We account for exploratory drilling costs using the successful efforts method, whereby all costs associated with the exploration and drilling of productive wells are initially capitalized. Costs incurred in exploring and drilling of dry or unsuccessful wells are expensed in the period in which the well is determined to be a dry or unsuccessful well and are accounted for under “operating expenses—studies“Exploration and projects.Project expenses.” Consequently, an increase in the number of exploratory wells we declare as dry or unsuccessful will negatively affect our results and may cause volatility in our operating expenses.
Royalties
Each of our production contracts has its own royalty arrangement.arrangement in accordance with applicable law. Law 141 of 1994 established a royalty fixed rate equivalent to 20% of total production. In 1999, a modification to the royalty system established a sliding scale for royalty paymentspercentage linked to the production level of crude oil and natural gas to fields discovered after July 29, 1999, depending on whether the production is crude oil or natural gas, and on the quality of the crude oil produced. Since 2002, as a result of the enactment of Law 756 of 2002, the royalty percentage has ranged from 8% for fields producing up to 5,000five thousand bpd to 25% for fields producing inan excess of 600 thousand bpd. Producing fields pay royalties in accordance with the applicable royalty rate at the time of the discovery. Also, Law 756 of 2002 establishes that in the fields of the association contracts that finalize or revert back, an additional royalty rate of 12% of the basic production applies. Therefore, pursuant to this law, in 2016, as a result of the return of the Rubiales field to Ecopetrol in July 2016, the royalty rate went from 20% to 32%.
From July 2012 until December 2013, pursuant to an agreement with the ANH, we commercialized, on behalf of the ANH, the natural gas received in-kind by the ANH when the producer did not decide to directly commercialize the royalties.
| 66 |
Since January 2014, the ANH has collected natural gas production royalties from producers settled in cash based on a formula, linked to the applicable royalty rate, regardless of whether thea producer has sold the gas. As a result, we no longer marketcommercialize this gas on behalf of the ANH. In addition, because the royalties are now payable to the ANH in cash, all of the gas we produce is counted asconsidered part of our production, without any deduction for royalties. The cost of natural gas royalties totaled COP$ 478,332 million in 2016.
Purchases of hydrocarbons
We continue purchasing all crude oil delivered to the ANH as royalties by us and by third parties. The purchase price is calculated according to a formula set forth in a contract between us and the ANH that reflects our export sales prices (crudes and products), a quality adjustment for API gravity and sulfur content, transportation rates from the wellhead to the Coveñas and Tumaco ports the cost of the refining process and a marketing fee. We sell the physical product purchased from the ANH as part of our ordinary business. On December 31, 2014, thisIn June 2016, the contract between the ANH and us was extended until June 30, 2015.2018.
Our purchases of hydrocarbons from the ANH are made in the ordinary course of business, and on terms comparable to those offered to private parties. We have established procurement policies and approval processes for purchases of products and services, which do not depend on whether the counterparties are state-owned entities.
Since 2016, we import crude oil for Reficar feedstock when such imports are to result in a better operational or economic performance of the Ecopetrol Group.
| Effect of Taxes, Exchange Rate Variation, Inflation and the Price of Oil on our Results |
| 4.2.1 | Taxes |
In December 2014,2016, the Colombian Congress adopted Law 1739 of 2014, a new tax reform1819, which introduced significantmore changes to the Colombian tax system, applicable beginning in 2017, including the following:following aspects:
| · |
| · |
As a result of these CREE tax changes, the overall corporate income tax rate from 2015 to 2018 will be as follows: 39% in 2015, 40% in 2016, 42% in 2017 and 43% in 2018.
Effect on other taxes
The tax reform has also included other provisions which are relevant to and may impact our results of operations:
| · |
| · | A |
| · | 2017 and future loss carryforwards are subject to a time-limit of 12 years. |
| 67 |
| · | Depreciation and amortization methods and annual percentages are limited to the established in the fiscal rule and depends on the type of asset. For example, machinery and equipment depreciate at 10%, infrastructure (including pipelines) at 2.22% and vehicles and computers at 20%, among others. |
| · | The income tax |
| · | The presumptive income rate will increase from 3% to |
| · | Tax rate for VAT |
| · |
| · | A new national carbon tax is established which will be triggered on the carbon content of |
For the oil and gas industry the tax reform includes two tax benefits that are expected to improve the operations of the oil and gas industry:
| · |
For exploration activities, the “CERT” (for its acronym in Spanish) incentive was approved, consisting of the reimbursement of part of the investment made in the exploration phase. The reimbursement will depend on certain percentages that should be established and further regulated by Colombian Government.
The CERT will be granted when the income tax return is filed, subject to the procedure to be established by the Colombian Government.
The CERT can only be redeemed to pay taxes and is effective up to two years after it is issued. However, the CERT can also be sold and traded in fixed income market.
For production activities, the CERT will be granted exclusively to investments that increase the recovery factor, i.e. investments that increase the reserves that are currently proved in certain wells.
The effect of this regulation is still uncertain and will depend on how and when the government issues the detailed regulations.
| · |
See Note 16—Taxes, contributionsTaxpayers in the oil and duties payable,gas industry are entitled to refund VAT paid in the consolidated financial statement.exploration phase for offshore projects. Taxpayers can request for this VAT as of the next fiscal year in which the investment was made. VAT that is reimbursed cannot be used as a higher cost or expense for income tax purposes.
| 4.2.2 | Exchange Rate Variation |
In compliance with Colombian regulations,The functional currency of each Ecopetrol Group company is determined in relation to the main economic environment where each company operates; however our consolidated financial results are reported in Colombian Pesos, which is the Ecopetrol Group’s functional and we maintain our financial books and records in Pesos. However, apresentation currency. A substantial majoritypart of our consolidated revenues, forcoming from Ecopetrol Group companies whose functional currency is the Colombian Peso is derived from local sales and exports of crude oil, natural gas and refined products are sold at prices referenced to benchmarks quoted in U.S. dollars. Therefore, they are exposed to foreign currency exchange risk on revenues, capital expenditures and financial instruments that are denominated in a currency other than its functional currency.
An appreciation of the Colombian Peso has a negative impact on our results of operations because our revenues from exports of crude oil, natural gas and refined products are primarily expressed in Colombian Pesos. Costs of imported goods and contracted services expressed in U.S. dollars will also be lower when expressed in Colombian Pesos, but on balance, our operating income in Colombian Pesos tends to decline when the Colombian Peso appreciates, other factors being equal. Conversely, when the Colombian Peso depreciates against the U.S. dollar, our reported revenues, costs related to imported goods and services, interest costs, and operating income, all tend to increase. As crude oil is priced in U.S. dollars, fluctuations in the exchange rate of the Colombian Peso against the U.S. dollar may have a significant impact on revenues, cost, assets and liabilities held in foreign currency.
| 68 |
During 2016, 2015 and 2014, and 2013, the Colombian Peso depreciated on average 7.05%11.18%, 37.28% and 3.93%7.05%, respectively, against the U.S. dollar. During 2012, in contrast, the Peso appreciated against the U.S. dollar on average by 2.7%. Additionally, as of December 31, 2014 and December 31, 2013,2016 the peso depreciated 24.17% and 8.97%, respectively,Colombian Peso appreciated 4.72% from the rate a year earlier. As of the December 31, 2012,2015 and 2014, in contrast, the peso appreciated 8.98% against the U.S. dollarColombian Peso depreciated 31.64% and 24.17%, respectively, from the rate a year earlier. The year-end exchange rate affects our reported net financial expenses because of our U.S. dollar net monetary liability position, which increases in terms of Pesos when the Peso depreciates against the dollar from one balance sheet date to the next.
In 2014 and 2013,2016, our consolidated debt in foreign currency increased by a total of US$975 million as Ecopetrol S.A. raised US$3,200475 million and US$2,500 million, respectively, through international bond issuancesloans and US$288 million through US Eximbank facilities In 2014, Ocensa raised US$500 million through an international bond issuance, whileissuance. In 2015, our consolidated debt in 2013 Reficarforeign currency increased by a total of US$3,425 million as Ecopetrol S.A. raised US$6161,925 million through an international loan and US$1,500 million through an international bond issuance. In 2014, our consolidated debt in foreign currency increased through international bond issuances by Ecopetrol S.A. and Ocensa for a total of US$3,700 million.
As of December 31, 2016 our U.S. dollar-denominated total debt was US$15.2 billion, which we recognize in our financial statements at its amortized cost, which corresponds to the present value of cash flows, discounted at the effective interest rate. Out of this total, US$12 billion relates to Ecopetrol S.A., whose functional currency is the Colombian Peso. Therefore, when the Colombian Peso depreciates against the U.S. dollar, Ecopetrol S.A. is exposed to an exchange rate loss. In contrast, when the Colombian Peso appreciates against the U.S. dollar, Ecopetrol S.A. has an exchange rate gain. Some of the Ecopetrol Group companies have the U.S. dollar as functional currency and are not exposed to a material exchange rate risk resulting from fluctuations in the Colombian Peso against the U.S. dollar. On the asset side, when the financial statements of the Group are consolidated, the exchange rate differential of the subsidiaries’ assets and liabilities whose functional currency is the U.S. dollar is recognized directly in equity, as part of the other comprehensive income.
The Company adopted hedge accounting as part of its risk management strategy, using two types of natural hedges with its U.S. dollar debt as a financial instrument: i) a cash flow hedge for exports of crude oil and ii) a hedge of a net investment in a foreign operation. As a result of the implementation of both hedges 88% ($10.5 billion) of Ecopetrol S.A.’s debt in U.S. dollars was designated as a hedge. With the adoption of hedge accounting, the effect of the volatility of the foreign exchange rate on the hedged portion of the debt is recognized directly in equity, as part of the other comprehensive income.
The remaining portion of Ecopetrol S.A.’s U.S. dollar-denominated debt, transactions through various export credit agency facilities. In 2012, we did not incur anyas well as the financial assets and liabilities denominated in foreign currency, continues to be exposed to the fluctuation in the exchange rate, which means that an appreciation of the Colombian peso against the U.S dollar could generate a loss if companies whose functional currency is the Colombian peso have an active net position in U.S. dollar-denominated debt.dollars or a gain if they have a net liability position in U.S. dollars. Conversely, a depreciation of the Colombian peso against the U.S. dollar could generate a gain if companies whose functional currency is the Colombian peso have a net active position in U.S. dollars or a loss if they have a net liability position in U.S. dollars. As of December 31, 2016, Ecopetrol Group companies with the U.S. dollar as functional currency have a net active U.S. dollar position after the instruments of natural hedging previously mentioned.
| 4.2.3 | Effects of Inflation |
Inflation in Colombia has remained relatively stablenot exceeded an average annual rate of 8% for the past ten years. It decreased in 2016 as compared to 2015. As measured by the general consumer price index, average annual inflation in Colombia for the year endingyears ended December 31, 2014 was 3.66%. For the years 20132016, 2015 and 2012,2014; inflation was 1.94%5.75%, 6.77% and 2.44%3.66%, respectively. The decrease in inflation in 2016 is mainly explained by the normalization of prices as a consequence of the ending of “El Niño” weather phenomenon and the slight appreciation of the Colombian Peso against the U.S. dollar in the second half of 2016. Cost inflation in the prices of goods, raw materials, interest cost of debt in local currency indexed to inflation and services that are necessary for the development and operation of oil and gas producing assets can vary over time and between each market segment.
The effect of inflation on non-monetary balance sheet accounts was required to be recognized until December 31, 2006. The accumulated inflation adjustments were eliminated in the process of reconciling our financial statements to U.S. GAAP.
| 69 |
| 4.2.4 | Effects of the Price of Oil |
The average price of ICE Brent crude was approximately $99.3 USD/blUS$45.1 per barrel in 2014, $108.7 USD/bl2016 as compared to US$53.6 per barrel in 20132015 and $111.7 USD/blUS$99.3 per barrel in 2012.2014. As a consequence, theour average price of Ecopetrol S.A.’s crude oil basket decreased by $12.3 USD/bl in 2014 compared to 2013, with most of the decline occurring in the fourth quarter of 2014. The average price of our crude oil basket was 87.55 USD/blUS$35.7 per barrel in 2016 as compared to US$43.9 per barrel in 2015 and US$87.3 per barrel in 2014, which represents a decrease of US$8.2 per barrel in 2016 compared with 98.85 USD/bl in 2013.to 2015. This declinedecrease is mainly explained by a continuing imbalance between supply and demand in the global crude market surplus led primarily by an increase in North Americandue to higher OPEC production as well as a resilient North American production. Nevertheless, the higher availabilityEcopetrol’s average crude oil basket price relative to ICE Brent reported a discount of Canadian crudeUS$9.4 in 2016, stronger than the US$9.7 and US$12 observed in 2015 and 2014, respectively, due to an active commercial strategy.
In theOperating Results section below, we present the impact of the price decline in our revenue and cost of sales.
Additionally, fluctuations in the price of oil have had an impact on the value of our oil and gas reserves. The valuation of these reserves was made using a price in accordance with SEC regulations. A decline in hydrocarbon prices and reserves, as well as changes in environmental regulations may lead to the recognition of impairment of assets. In 2015, in connection with the current adverse economic context faced by the hydrocarbons sector, which resulted in a reduction in forecasted oil prices and an increase in market and country risk that is reflected in the discount rate, as well as a resultreduction in the recoverable reserves amount and refining margin, among other factors, Ecopetrol recognized an impairment of higher transport capacity. OPEC electednon-current assets of COP$7,864,875 million before taxes. In 2016, in November 2014 notconnection with our evaluation of the recoverable amount of the assets value, which includes the variation in estimations of future prices under the current scenarios of OPEC’s oil quota agreements and the impact resulting from changes on specifications issued by the International Marine Organization agreement regarding marine pollution, Marpol on crude and fuels with high sulfur content, Ecopetrol recognized an impairment of non-current assets of COP$928,747 million before taxes. For additional information about this impairment charges,see Notes 14, 17 and 28 to cut its output in response to these developments. In addition to this, global demand was only slightly up in 2014 owing to the decreased economic momentum of Asian and European countries.our consolidated financial statements.
| Accounting Policies |
We prepare our consolidated financial statements in accordance with the Colombian Government Entity GAAP. The accounting principles and policies that are summarized in ―Note 1. Economic Entity and Principal Accounting Policies and Practices of our consolidated financial statements included in this Annual Report.
In 2014, Ecopetrol and its subsidiaries began their transition to International Financial Reporting Standards (IFRS) as issued by the International Accounting Standards Board. In accordance with Colombian regulations, Ecopetrol's financial statements will be reported in accordance with IFRS as from January 1, 2015. For more information, please see Note 1—Economic entity and principal accounting policies and practices, to the consolidated financial statements included in this Annual Report.
As required by SEC rules, we have prepared a reconciliation of our net income and shareholders’ equity to U.S. GAAP. The accounting principles and regulations under Colombian Government Entity GAAP differ in certain significant respects from U.S. GAAP. See Note 33—Differences between Colombian Governmental Entity accounting principles and U.S. GAAP, to theOur consolidated financial statements for a descriptionthe years ended December 31, 2014, 2015 and 2016 were prepared in accordance with IFRS. Our date of transition to IFRS was January 1, 2014. The detail of the most significant differences.
Recently Adopted U.S. Accounting Standards
The Company did not adopt authoritative guidanceaccounting policies is described in 2014 that had a material impact on the Company´sNote 4 to our consolidated financial statements.
With regard to the ASUs issued in 2013, as of the reporting date, Ecopetrol had no operations within the scope of those ASUs. See Note 33—Differences between Colombian Governmental Entity accounting principles and U.S. GAAP—Recently adopted U.S. Accounting Standards,to the consolidated financial statements for a description of recently U.S. GAAP pronouncements.
| Critical Accounting Judgments and Estimates |
Critical accounting policies are those policies that require us to exercise judgment or involve a higher degree of complexity in the application of the accounting policies that currently affect our financial condition and results of operations. The accounting judgments and estimates we make in these contexts require us to calculate variables and make assumptions about matters that are highly uncertain. In each case, if we had made other estimates, or if changes in the estimates occur from period to period, our financial condition and results of operations could be materially affected.
This information should be read together withSee Note 1 —Economic entity and principal accounting policies and practices,3 to our consolidated financial statements for a summary of the principalcritical accounting policiesjudgments and practicesestimates applicable to us. There are many other areas in which we use estimates about uncertain matters, but we believe the reasonably likely effect of changed or different estimates would not be material to our financial presentation.
| 4.5 | Operating Results |
Oil
The following discussion is based on information contained in our audited consolidated financial statements and Gas Reserves Estimatesshould be read in conjunction therewith.
| 4.5.1 | Consolidated Results of Operations |
The following table sets forth components of our income statement for the years ended December 31, 2016, 2015 and Impact on Our Financial Statements2014.
| 70 |
Table 44 – Consolidated Income Statement
| Income Statement | For the Years ended December 31, | % Change | ||||||||||||||||||
| (Colombian Pesos in millions) | 2016 | 2015 | 2014 | 2016/2015 | 2015/2014 | |||||||||||||||
| Revenue | 48,485,561 | 52,347,271 | 65,971,888 | (7.4 | ) | (20.7 | ) | |||||||||||||
| Cost of Sales | 34,251,423 | 36,994,516 | 42,975,128 | (7.4 | ) | (13.9 | ) | |||||||||||||
| Gross Profit | 14,234,138 | 15,352,755 | 22,996,760 | (7.3 | ) | (33.2 | ) | |||||||||||||
| Operating Expenses | 4,400,843 | 5,356,715 | 6,243,166 | (17.8 | ) | (14.2 | ) | |||||||||||||
| Impairment of non-current assets | 928,747 | 7,864,875 | 2,304,567 | (88.2 | ) | 241.3 | ||||||||||||||
| Operating Income | 8,904,548 | 2,131,165 | 14,449,027 | 317.8 | (85.3 | ) | ||||||||||||||
| Finance results, net | (1,175,367 | ) | (7,663,104 | ) | (3,510,669 | ) | (84.7 | ) | 118.3 | |||||||||||
| Share of profit of companies | 61,345 | (46,687 | ) | 166,070 | (231.4 | ) | (128.1 | ) | ||||||||||||
| Income before income tax | 7,790,526 | (5,578,626 | ) | 11,104,428 | (239.6 | ) | (150.2 | ) | ||||||||||||
| Income tax | (4,543,046 | ) | (710,353 | ) | (5,434,855 | ) | 539.5 | (86.9 | ) | |||||||||||
| Net Income (loss) | 3,247,480 | (6,288,979 | ) | 5,669,573 | (151.6 | ) | (210.9 | ) | ||||||||||||
| Net Income (loss) attributable to: | ||||||||||||||||||||
| Company’s shareholders | 2,447,881 | (7,193,859 | ) | 5,046,517 | (134.0 | ) | (242.6 | ) | ||||||||||||
| Non-controlling interest | 799,599 | 904,880 | 623,056 | (11.6 | ) | 45.2 | ||||||||||||||
| Net Income (loss) | 3,247,480 | (6,288,979 | ) | 5,669,573 | (151.6 | ) | (210.9 | ) | ||||||||||||
| 71 |
| 4.5.1.1 | Total Revenues |
Table 45 – Third-Party Revenues by Business Segment
The estimationfollowing table sets forth our principal sources of third-party revenues by business segment for the years ended December 31, 2016, 2015 and 2014. An explanation of how we classify our operations into business segments is included in Section 4.5.2 below.
| 2016 | 2015 | 2014 | % Change Sales Revenues | |||||||||||||||||||||||||||||||||||||||||
Revenue by segment | Volume (barrels equivalent) | Average price U.S. dollars/ barrels | Sales revenues (Colombian Pesos in millions) | Volume (barrels equivalent) | Average price U.S. dollars/ barrels | Sales revenues (Colombian Pesos in millions) | Volume (barrels equivalent) | Average price U.S. dollars/ barrels | Sales revenues (Colombian Pesos in millions) | 2016/2015 | 2015/2014 | |||||||||||||||||||||||||||||||||
| Local crude oil | 5,288,631 | 35.0 | 553,666 | 4,904,765 | 38.5 | 491,279 | 8,202,886 | 74.7 | 1,213,718 | 12.7 | (59.5 | ) | ||||||||||||||||||||||||||||||||
| Foreign crude oil | 159,311,257 | 35.7 | 17,278,579 | 178,581,520 | 44.0 | 21,181,265 | 176,233,111 | 87.9 | 30,835,510 | (18.4 | ) | (31.3 | ) | |||||||||||||||||||||||||||||||
| Trading of crude oil | - | - | - | 17,526,239 | – | 1,309,196 | 17,977,861 | – | 1,486,060 | (100.0 | ) | (11.9 | ) | |||||||||||||||||||||||||||||||
| Natural gas local | 27,543,046 | 23.6 | 1,988,336 | 30,831,442 | 21.8 | 1,845,345 | 30,218,758 | 22.3 | 1,346,625 | 7.7 | 37.0 | |||||||||||||||||||||||||||||||||
| Foreign natural gas | 931,754 | 20.9 | 58,809 | 2,906,034 | 23.6 | 182,950 | 6,726,072 | 31.0 | 423,461 | (67.9 | ) | (56.8 | ) | |||||||||||||||||||||||||||||||
| Other income(1) | 1,288,736 | 647,942 | 3,558,621 | – | 659,178 | 2,925,769 | – | 597,671 | (1.7 | ) | 10.3 | |||||||||||||||||||||||||||||||||
| Exploration and production sales | 194,363,424 | 20,527,332 | 238,308,621 | 25,669,213 | 242,284,457 | 35,903,045 | (20.0 | ) | (28.5 | ) | ||||||||||||||||||||||||||||||||||
| Local refined products | 106,047,637 | 54.9 | 17,771,166 | 102,475,029 | 67.1 | 18,806,063 | 94,736,264 | 111.2 | 20,952,495 | (5.5 | ) | (10.2 | ) | |||||||||||||||||||||||||||||||
| Foreign refined products | 51,843,743 | 40.4 | 6,330,648 | 26,357,160 | 48.8 | 3,535,666 | 29,762,138 | 92.5 | 5,431,828 | 79.1 | (34.9 | ) | ||||||||||||||||||||||||||||||||
| Other income(1) | - | - | 92,210 | – | – | 115,137 | – | – | 227,881 | (19.9 | ) | (49.5 | ) | |||||||||||||||||||||||||||||||
| Refining and petrochemicals | 157,891,380 | 24,194,024 | 128,832,189 | 22,456,866 | 124,498,402 | 26,612,204 | 7.7 | (15.6 | ) | |||||||||||||||||||||||||||||||||||
| Transportation services | - | - | 3,764,205 | – | 4,221,192 | - | 3,456,639 | (10.8 | ) | 22.1 | ||||||||||||||||||||||||||||||||||
| Transportation and logistics | - | - | 3,764,205 | – | 4,221,192 | - | 3,456,639 | (10.8 | ) | 22.1 | ||||||||||||||||||||||||||||||||||
| Total sales | 352,254,804 | 48,485,561 | 367,140,810 | 52,347,271 | 366,782,859 | 65,971,888 | (7.4 | ) | (20.7 | ) | ||||||||||||||||||||||||||||||||||
| Crude oil | 164,599,888 | 35.7 | 17,832,245 | 201,012,524 | 43.9 | 22,981,740 | 202,413,858 | 87.3 | 33,535,288 | (22.4 | ) | (31.5 | ) | |||||||||||||||||||||||||||||||
| Natural gas | 28,474,800 | 23.5 | 2,047,145 | 33,737,476 | 22.0 | 2,028,295 | 36,944,830 | 23.9 | 1,770,086 | 0.9 | 14.6 | |||||||||||||||||||||||||||||||||
| Refined products | 159,180,116 | 50.1 | 24,101,814 | 132,390,810 | 63.4 | 22,341,729 | 127,424,171 | 106.8 | 26,384,323 | 7.9 | (15.3 | ) | ||||||||||||||||||||||||||||||||
| Other | - | 4,504,357 | – | – | 4,995,507 | – | – | 4,282,191 | (9.8 | ) | 16.7 | |||||||||||||||||||||||||||||||||
| Total sales | 352,254,804 | 48,485,561 | 367,140,810 | 52,347,271 | 366,782,859 | 65,971,888 | (7.4 | ) | (20.7 | ) | ||||||||||||||||||||||||||||||||||
| Note: | All intercompany sales transactions have been eliminated in full in order to show our sales to third parties. As a result of the evaluation of control over companies under IFRS, Ecopetrol does not consolidate Equion. As a consequence, the volume information for 2014 included in this annual report (which has been prepared under IFRS) differs from the information we previously published for 2014 under Colombian Government Entity GAAP (where we did consolidate Equion). |
| (1) | In the case of the exploration and production segment, corresponds to services and sales of refined products (mainly LPG and asphalt) allocated to our exploration and production segment. In the case of the refining and petrochemicals segment, corresponds to industrial services. |
| 72 |
In 2016, total revenues decreased by 7.4% as compared to 2015, primarily as a result of: (i) a COP$6,456,917 million decrease in revenues mainly due to the 18.6%, or US$8.2 per barrel reduction of our average crude oil basket price, (ii) a COP$1,572,854 million decrease in revenues attributable to the decrease in our sales volume and lower services provided by our transportations and logistics segment. This decrease was partially offset by the 11.2% devaluation of the Colombian Peso against the U.S. dollar, from an average exchange rate of COP$2,746.47/US$1.00 in 2015 to an average exchange rate of COP$3,053.42/US$1.00 in 2016, resulting in an increase in sales revenue from exports, which represented an increase of COP$4,168,061 million.
The decrease of our sales volume in 2016 as compared to 2015 was the result of (a) the 18.1%, or 36.4 mbe, decrease in our crude sales volume caused mainly by lower crude exports due to production decline, reduced purchases by third parties and lower availability of crude due to its use for feedstock at Reficar, and (b) the 15.6%, or 5.3 mbe, decrease in natural gas sales volume due to lower thermal demand as a result of the end of the “El Niño” weather phenomenon and the termination of our sales contract to Venezuela on June 30, 2015. This decrease in sales volume was partially offset by the 20.2%, or 26.8 mbe, increase in sales of refined products given the increase of operations at Reficar and higher demand due to the growth in the number of motor vehicles in Colombia.
In 2015, total revenues decreased by 20.7% as compared to 2014, primarily as a result of: (i) a COP$27,847,772 million, decrease in revenues mainly due to the 49.7%, or US$43.4 per barrel reduction of our average crude oil basket price. This decrease was partially offset by (i) the 37.28% devaluation of the Colombian Peso against the U.S. dollar, from an average exchange rate of COP$2,000.68/US$1 in 2014 to an average exchange rate of COP$2,746.47/US$1 in 2015, resulting in an increase in sales revenue from exports as well as in services provided by our transportation and logistics segment, which combined represented an upturn of COP$13,312,094 million and (ii) COP$882,873 million increase in revenues which was attributable to increase our sales volume.
The increase of our sales volume in 2015 as compared to 2014 was mainly the result of the 3.9%, or 4.97 mbe, increase in our refined products sales volume, which in turn was primarily the result of the 8.2% increase in local sales of refined products given higher demand caused mainly by the increase in the number of vehicles in Colombia, the higher consumption of diesel for energy generation at thermal power plants due to warmer weather caused by the El Niño climate phenomenon and supplying the border area with Venezuela due to that country’s decision to temporarily close its border with Colombia; partially offset by lower exports of fuel oil, as a result of the difficulties in transporting these products to port by means of the Rio Magdalena due to the reduced flow from this river. This increase in sales volume was partially offset by the 56.8%, or 3.8 mbe, decrease in natural gas exports due to the termination of our Venezuela sales contract on June 30, 2015 and the natural decline in production at the Guajira field.
| 4.5.1.2 | Cost of Sales |
Our cost of sales was principally affected by the factors described below. See Note 26 Cost of sales to our consolidated financial statements for more detail.
Cost of sales in 2016 was COP$34,251,423 million, representing a COP$2,743,093 million (7.4%) decrease as compared to 2015, primarily as a result of the following factors:
| · | A COP$2,043,600 million decrease in the purchase costs of crude oil, natural gas and refined products, which were purchased for sales and in the case of raw materials for refining, which was primarily the result of (i) a lower average purchase prices due to the COP$3,571,691 million decrease in international benchmark prices for crude oil, natural gas and refined products, and (ii) a COP$142,758 decrease in volumes purchased due to the positive effect of a decrease in imports by Reficar and lower products imports by the Refinery of Cartagena given its beginning of operation partially offset by greater purchases of crude oil in the international market for its supply. This decrease was partially offset by a COP$1,670,849 increase in the average exchange rate of the Colombian Peso against the U.S. dollar (which led to increased costs in Colombian Peso terms). |
| 73 |
| · | A COP$966,578 million increase in maintenance and contracted services cost, which was primarily the result of (i) a COP$630,576 million decrease in contracted services, mainly due to cost savings achieved through the implementation of our business transformation plan and the transfer of the direct operation of the Rubiales field to Ecopetrol in July 2016, ; and (ii) a COP$336,002 million decrease in maintenance costs, mainly due to savings achieved from our 2016 maintenance plan which included the renegotiation of fees and the optimization of time without affecting operations. |
| · | A COP$587,696 million decrease in transportation costs, which was the result of an optimization of the use of tanker trucks. This optimization included improvements in the pipeline transportation system for the transportation of heavy crude oil and consequently less use of tanker trucks, use of shorter transportation routes and renegotiation of fees for contracts. |
The factors mentioned above were partially offset by a a) COP$784,266 million increase in the amortization, depletion and depreciation of property, plant and equipment in connection with the start-up of the Reficar units and capitalization of major maintenance costs at the Barrancabermeja refinery and b) a COP$70,515 million decrease in other minor items.
Cost of sales in 2015 was COP$36,994,516 million, representing a COP$5,980,612 million (13.9%) decrease as compared to 2014, primarily as a result of the following factors:
| · | COP$4,900,941 million decrease in the purchase costs of crude oil, natural gas and refined products (primarily diluents, diesel and gasoline), which were purchased for sales and in the case of raw materials for refining, which was primarily the result of lower average purchase prices due to the COP$12,068,310 million decrease in international benchmark prices for crude oil, natural gas and refined products. This decrease was partially offset by (i) a COP$5,156,625 increase in the average exchange rate of the Colombian Peso against the U.S. dollar (which led to increased costs in Colombian Peso terms) and (ii) a COP$2,010,744 million increase in volumes purchased from third parties, primarily consisting of increased purchases of gasoline volumes due to the closing of the Cartagena refinery for most of the year and increased local demand in Colombia caused by an increased number of automobiles and the closure of Colombia’s border with Venezuela. |
| · | A COP$898,407 million decrease in maintenance and contracted services cost, which was primarily the result of (i) a COP$585,705 million decrease in contracted services, mainly due to cost savings achieved through the implementation of our business transformation plan, operating cost optimizations contained in our partnership contracts for the Rubiales, Nare and Quifa fields, and lower costs related to the Cravo Norte field, in which our participation in 2015 was lower than in 2014; and (ii) a COP$312,702 million decrease in maintenance costs, mainly due to savings achieved from our 2015 maintenance plan, which included the restructuring of maintenance services and quantities and the renegotiation of fees for field maintenance contracts. |
| · | A COP$357,835 million decrease in cost of sales, which was primarily the result from the accumulation of inventories due to the start-up of Reficar’s operations. |
| · | A COP$94,625 million decrease in transportation costs, which was primarily the result of decreased use of tanker trucks as a result of the increased availability of pipelines due to greater operating stability and improved security conditions during 2015, which led to a decrease in attacks on our infrastructure. |
| · | A COP$70,032 million decrease in other minor items. |
The factors mentioned above were partially offset by a COP$341,228 million increase in the amortization, depletion and depreciation of property, plant and equipment, primarily as a result of higher investments in the Castilla, Chichimene, and Rubiales fields.
| 74 |
| 4.5.1.3 | Operating Expenses before impairment of non-current assets effects |
Operating expenses and selling, general and administrative expenses before taking into account the impairment of non-current assets, amounted to COP$4,400,843 million in 2016, a COP$ 955,872 million (17.8%) decrease as compared to 2015, mainly as a result of the following factors (see Notes 27 and 29 to our consolidated financial statements for more detail).
| · | A COP$855,659 million decrease in exploratory expenses as a result of decreased seismic activity and fewer dry wells reported in the period; |
| · | A COP$309,746 million decrease in commissions, fees, freights and services due to optimization achieved through the implementation of the transformation program. |
This decrease was partially offset by:
| · | A COP$134,665 million increase in labor expenses mainly due to the implementation of a voluntary retirement plan. This plan includes benefits such as monthly income, education and health until the date on which the employees are granted their legal retirement pension. |
| · | A COP$74,868 million increase in other minor items. |
Operating expenses and selling, general and administrative expenses before taking into account the impairment of our non-current assets amounted to COP$5,356,715 million in 2015, a COP$886,451 million (14.2%) decrease as compared to 2014, mainly as a result of the following factors:
| · | A COP$992,045 million decrease in exploratory expenses as a result of decreased seismic activity and fewer dry wells reported in the period; |
| · | A COP$365,786 million decrease in general expenses due to optimization in commissions fees, services and agreements achieved through the implementation of the transformation program; and |
| · | A COP$157,433 million decrease in other minor items. |
This decrease was partially offset by a COP$628,813 million increase in taxes mainly due to the wealth tax applicable for year 2015, as no accrual was made for wealth tax expenses in 2014.
Each of our operating segments bears the costs and expenses incurred for product use and marketing and each segment assumes administrative expenses and all non-operational transactions related to its activity. Discussion of operating expenses by business segment is included in the sectionFinancial Review—Operating Results—Consolidated Results of Operations—Segment Performance and Analysis.
| 4.5.1.4 | Impairment of non-current assets |
The impairment of our non-current assets includes expenses (recovery) of impairment of property, plant and equipment and natural resources, investments in companies and goodwill. The Company is exposed to certain future risks derived from variations in: a) oil prices, b) refining margins and profitability, c) cost profile, d) investment and maintenance, e) amount of recoverable reserves, f) market and country risk reflected on the discount rate, g) changes in domestic and international regulations, among others. Any change in the foregoing variables to calculate the recoverable amount can have a material effect on the recognition or recovery of impairment charges. For example, the exploration and production segment is highly sensitive to variation of hydrocarbon prices, while the refining segment is highly sensitive to changes in product prices and raw materials in the international market, the discount rate given the leveraging, the refining margins, changes in environmental regulations and the cost structure and the level of capital expenditures. (See Notes 3.2, 4.12, 17 and 28 to our consolidated financial statements for more detail). Impairment of non-current assets amounted to COP$928,747 million in 2016, COP$7,864,875 in 2015 and COP$2,304,567 in 2014. These impairments are an accounting effect that does not involve any disbursement of resources and they are susceptible to reversion when the fair value of the asset exceeds its book value.
| 75 |
We recognized a smaller impairment in 2016 as compared to 2015 mainly by the variation in estimations of future prices which include the current scenarios of oil quota agreements of OPEC and the impact of changes in specifications issued by the Marpol (abbreviation of marine pollution) agreement on crude and fuels with high sulfur content. Additionally, the impairment recognized in 2016 included the effect of operational adjustments to the variables observed during Reficar’s stabilization period and new ethanol prices affecting Bioenergy.
The impairments recognized in 2015 and 2014 were mainly due to the existing low oil price environment, which resulted in a reduction in forecasted crude oil prices and an increase in market and country risk, which had been reflected in the discount rate, as well as a reduction in the amount of recoverable reserves.
| 4.5.1.5 | Finance Results, Net |
Financial results, net, mainly includes the exchange rate gains or losses and interest expense, yields and interest from our investments, non-current liabilities financial costs (asset retirement obligation and post-benefits plan) and results from our hedging operations.
Finance results, net, amounted to a loss of COP$1,175,367 million in 2016 as compared to a loss of COP$7,663,104 million in 2015. This decrease in loss was mainly due to:
| · | The positive impact (COP$6,543,044 million) resulting from the depreciation of the Colombian Peso against the U.S. dollar on our U.S. dollar net asset position. Our 2016 exchange rate gain was COP$976,430 million, as compared to a loss of COP$5,566,614 million in 2015. |
The adoption of cash flow hedge accounting in October 2015 and the hedging of our net investment in June 2016 has allowed us to neutralize, overall, the effect of the exchange rate fluctuation over 88% of the U.S. dollar debt of Ecopetrol S.A., since exchange rate changes are recognized under other comprehensive income within equity.
| · | A COP$688,664 million increase in financial income corresponding to the reversal of a provision we had set aside relating to a litigation concerning Santiago de las Atalayas (the “Comuneros”). In November 2016, the Ministry of Mines and Energy concluded that the amounts being held were not royalties and therefore not due to the Comuneros. The amounts belonged to Ecopetrol and therefore Ecopetrol recovered the provision it had been recognizing in its financial statements relating to this dispute. See Note 23.3 to our consolidated financial statement for more detail. |
| · | A COP$107,244 million increase in the valuation of our forward hedging operations used to mitigate the volatility of the exchange rate in the cash flow required for the operations of our subsidiary Ocensa, whose functional currency is the U.S. dollar. |
| · | A COP$145,191 million increase in other minor financial items. |
This decrease in our financial loss was partially offset by a COP$996,406 million increase in interest expenses as a result of (i) the recognition of Reficar’s interest expenses which, up to 2015, had been capitalized (ii) the aggregate US$475 million international loans we entered into in February and May 2016 and the US$500 million international bond we issued in June 2016, and (iii) the negative effect the Colombian Peso had on our exchange rate on interest due on our foreign debt.
Finance results, net, amounted to a loss of COP$7,663,104 million in 2015 as compared to a loss of COP$3,510,669 million in 2014. This increase in loss was mainly due to:
| · | The negative impact (COP$3,296,421 million) resulting from the depreciation of the Colombian Peso against the U.S. dollar on our U.S. dollar net liability position. Our 2015 exchange rate loss was COP$5,566,614 million, as compared to a loss of COP$2,270,193 million in 2014. |
| 76 |
| · | A COP$1,007,362 million increase in financial expenses due to higher interest expenses as a result of the US$1,925 million international loan we entered into in February 2015 and the US$1,500 million international bond we issued in June 2015 as well as the negative effect the Colombian Peso had on our exchange rate on interest due on our foreign debt. |
This increase in our financial loss was partially offset by (i) a COP$110,600 million gain resulting from the sale of shares in Empresa de Energía de Bogotá and dividends received from equity instruments and (ii) a COP$40,748 million decrease in other minor financial expenditures.
For more details on our financial income and expenses see Note 30 – Finance results, net to our consolidated financial statements.
| 4.5.1.6 | Income Tax |
Income taxes amounted to COP$4,543,046 million in 2016, COP$710,353 million in 2015 and COP$5,434,855 in 2014. The above is equivalent to an effective tax rate of 58.3%, 12.7% and 48.9% in 2016, 2015 and 2014, respectively.
The increase in the effective tax rate from 2015 to 2016 was mainly due to: i) lower recovery of deferred tax asset, ii) the effect of the adjustment in deferred tax resulting from the application of the Colombian tax reform described above, and iii) the recognition of the presumptive tax on subsidiaries reporting tax losses.
The decrease in the effective tax rate from 2014 to 2015 was mainly due to: (i) foreign exchange losses and a related adjustment for foreign currency translation, (ii) an adjustment to the tax rate of entities whose tax rate differed from that of Ecopetrol S.A. and (iii) the implementation of a nondeductible wealth tax in 2015.
See Note 10 –Taxes to our consolidated financial statements.
| 4.5.1.7 | Net Income (Loss) Attributable to Owners of Ecopetrol |
As a result of the foregoing, in 2016, net income attributable to owners of Ecopetrol was COP$2,447,881 million whereas, in 2015, net loss attributable to owners of Ecopetrol was COP$7,193,859 million and, in 2014, net income attributable to owners of Ecopetrol was COP$5,046,517 million.
| 4.5.1.8 | Segment Performance and Analysis |
In this section, including the tables below, we present our financial information by segment: Exploration and Production, Refining and Petrochemicals and Transportation and Logistics. See the sectionBusiness Overview for a description of each segment.
The following tables present our revenues and net income by business segment for the years ended December 31, 2016, 2015 and 2014:
Table 46 – Revenues by Business Segment
| Year ended December 31, | % Change | |||||||||||||||||||
| 2016 | 2015 | 2014 | 2016/2015 | 2015/2014 | ||||||||||||||||
| (Colombian Pesos in millions) | ||||||||||||||||||||
| Exploration and Production | 28,221,210 | 31,732,611 | 45,155,191 | (11.1 | ) | (29.7 | ) | |||||||||||||
| Third parties | 20,527,332 | 25,669,213 | 35,903,045 | (20.0 | ) | (28.5 | ) | |||||||||||||
| Local crude oil | 553,666 | 491,279 | 1,213,718 | 12.7 | (59.5 | ) | ||||||||||||||
| Foreign crude oil | 17,278,579 | 21,181,265 | 30,835,510 | (18.4 | ) | (31.3 | ) | |||||||||||||
| Trading of crude oil | - | 1,309,196 | 1,486,060 | (100.0 | ) | (11.9 | ) | |||||||||||||
| Natural gas local | 1,988,336 | 1,845,345 | 1,346,625 | 7.7 | 37.0 | |||||||||||||||
| Foreign natural gas | 58,809 | 182,950 | 423,461 | (67.9 | ) | (56.8 | ) | |||||||||||||
| Other income | 647,942 | 659,178 | 597,671 | (1.7 | ) | 10.3 | ||||||||||||||
| Inter-segment net operating revenues | 7,693,878 | 6,063,398 | 9,252,146 | 26.9 | (34.5 | ) | ||||||||||||||
| Refining and Petrochemicals | 24,823,714 | 23,245,676 | 27,172,300 | 6.8 | (14.5 | ) | ||||||||||||||
| Third parties | 24,194,024 | 22,456,866 | 26,612,204 | 7.7 | (15.6 | ) | ||||||||||||||
| Local refined products | 17,771,166 | 18,806,063 | 20,952,495 | (5.5 | ) | (10.2 | ) | |||||||||||||
| Foreign refined products | 6,330,648 | 3,535,666 | 5,431,828 | 79.1 | (34.9 | ) | ||||||||||||||
| Other income | 92,210 | 115,137 | 227,881 | (19.9 | ) | (49.5 | ) | |||||||||||||
| Inter-segment net operating revenues | 629,690 | 788,810 | 560,096 | (20.2 | ) | 40.8 | ||||||||||||||
| Transportation and Logistics | 10,648,776 | 10,844,550 | 8,343,934 | (1.8 | ) | 30.0 | ||||||||||||||
| Third parties | 3,764,205 | 4,221,192 | 3,456,639 | (10.8 | ) | 22.1 | ||||||||||||||
| Inter-segment net operating revenues | 6,884,571 | 6,623,358 | 4,887,295 | 3.9 | 35.5 | |||||||||||||||
| Eliminations of consolidations | (15,208,139 | ) | (13,475,566 | ) | (14,699,537 | ) | 12.9 | (8.3 | ) | |||||||||||
| Total revenues | 48,485,561 | 52,347,271 | 65,971,888 | (7.4 | ) | (20.7 | ) | |||||||||||||
Total revenues by segment include exports and local sales to third-parties and inter-segment sales. See the sectionFinancial Review—Operating Results—Consolidated Results of Operations—Total Revenues for prices and volumes to third parties.
| 77 |
Table 47 – Net Income by Business Segment
| Year ended December 31, | % Change | |||||||||||||||||||
| Net income by segment | 2016 | 2015 | 2014 | 2016/2015 | 2015/2014 | |||||||||||||||
| (Colombian Pesos in millions) | ||||||||||||||||||||
| Exploration and Production | 1,322,370 | (5,851,619 | ) | 5,089,841 | (123 | ) | (215 | ) | ||||||||||||
| Refining and Petrochemicals | (1,823,020 | ) | (4,016,050 | ) | (1,627,705 | ) | (55 | ) | 147 | |||||||||||
| Transportation and Logistics | 2,960,449 | 2,819,759 | 1,758,777 | 5 | 60 | |||||||||||||||
| Eliminations of consolidations | (11,918 | ) | (145,949 | ) | (174,396 | ) | (92 | ) | (16 | ) | ||||||||||
| Net Income attributable to owners of Ecopetrol S.A. | 2,447,881 | (7,193,859 | ) | 5,046,517 | (134 | ) | (243 | ) | ||||||||||||
| 4.5.1.9 | Exploration and Production Segment Results |
In 2016,exploration and production segment sales were COP$28,221,210 million, compared to COP$31,732,611 million in 2015. In 2016, our segment sales decreased by 11.1% as compared with 2015 mainly as a result of:
| · | Lower sales of crude oil to third parties, which decreased by 20% in 2016 as compared to 2015 primarily due to: (i) a decline of 36.8 mmbls in crude oil exports and volumes available for commercialization mainly due to the decrease in the Ecopetrol Group’s production and delivery of crude oil destined for exports to Reficar for its own operations (ii) a decrease in the price of our crude oil basket of US$8.2 per barrel, (iii) a decrease of 2.0 mmboe in sales of foreign natural gas mainly due to the termination of our Venezuela sales contract on June 30, 2015. Notwithstanding, the decrease in sales to third parties was partially offset by an increase in the devaluation of the Colombian Peso against the U.S. dollar and higher sales of crude oil and local natural gas, the latter resulting from an increase in the prices of the natural gas basket of US $2/barrel, which was indexed to 2015 prices and impacted by the “El Niño” weather phenomenon; and |
| · | Higher inter-segment revenues, which increased by 26.9% in 2016 as compared to 2015 mainly due sales of crude oil in order to supply the Cartagena refinery. |
In 2015, exploration and production segment sales were COP$31,732,611 million, compared to COP$45,155,191 million in 2014. In 2015, our segment sales decreased by 29.7 % as compared with 2014 mainly as a result of:
| · | Lower sales of crude oil to third parties, which decreased by 28.5% in 2015 as compared to 2014 primarily due to: (i) a decline in crude oil exports mainly due to a decrease in the price of our crude oil basket of US$43.9 per barrel, (ii) decreased local sales of crude oil mainly due to lower prices of crude oil and (iii) increased availability of our transport systems for foreign crude oil. The decrease in sales of crude oil to third parties was offset by an increase in our sales volume, particularly in respect of natural gas sales mainly due to increased demand from domestic thermal power plants as a result of the El Niño climate phenomenon, which resulted in lack of water for the hydroelectric generating plants; and |
| 78 |
| · | Lower inter-segment sales, which decreased by 34.5% mainly due to: (i) lower prices of oil and gas sold to our refining and petrochemical segment and (ii) a greater percentage of oil purchased from third parties in the mix used in the Barrancabermeja Refinery. |
Cost of sales affecting our exploration and production segment is mainly related to: (i) the amortization and depletion of our production assets, (ii) contracted services in partnership contracts and (iii) the costs related to maintenance, operational services, electric power, projects and labor in the exploration and production segment. In addition, this segment’s costs are impacted by the purchases of crude oil from ANH and third parties, naphtha for dilution and by transportation services.
In 2016, the cost of sales for this segment decreased by 10.6% as compared with 2015, due to the net effect of:
| · | Fixed costs decreasing by 3.7%, or COP$268,558 million, in 2016 as compared to 2015, mainly due to (i) a decrease in contracted services, maintenance and operating materials as a result of the cost efficiencies achieved by the transformation plan, which involved reduction of contract fees and optimization of maintenance timing without affecting operations, and (ii) a decrease in services contracted in association with partners as a result of the return of the Rubiales and Cusiana contracts to Ecopetrol in July 2016, showing the operational capacity and efficiency of the segment. This decrease was partially offset by an increase in the costs of hydrocarbon transportation services as a result of a ship or pay contract, indexed to the U.S. dollar, between the exploration, production, transportation and logistics segments. |
| · | Variable costs decreasing by 13.3%, or COP$2,467,666 million, in 2016 as compared to 2015, as a result of (i) reduction in purchases of diluent as part of our cost efficiencies, strategy and lower production of heavy crude oil, (ii) lower volumes of crude oil purchases from the ANH, third parties and other products due to the fall in international prices and lower availability of crude oil due to lower production, (iii) lower transportation costs due to the optimization of the use of tanker trucks and savings due to the increase in viscosity for the transportation of heavy crude oil through pipelines, (iv) a decrease in services contracted in association with partners as a result of the return of the Rubiales and Cusiana contracts to Ecopetrol in July 2016, and (v) capitalization of inventories as a result of higher prices on purchases of crude oil, diluent in December 2016 compared to December 2015. This decrease was partially offset by an increase of electric power costs and process materials as chemicals and catalysts used in our direct operation of the Rubiales field and the increase in the average exchange rate of the Colombian Peso against the U.S. dollar (which led to increased costs in Colombian Peso terms). |
In 2015, the cost of sales for this segment decreased by 8% as compared with 2014, due to the net effect of:
| · | Fixed costs increasing by 6.2%, or COP$420,083 million, in 2015 as compared to 2014, mainly due to a COP$860,539 million increase in the costs of hydrocarbon transportation services as a result of a ship or pay contract, indexed to the U.S. dollar, between the exploration and production and transportation and logistics segments of the Bicentenario pipeline, offset by COP$440,456 million decrease in maintenance and contracted services cost as a result of the implementation of our business transformation plan. |
| · | Variable costs decreasing by 12.5%, or COP$2,638,994 million, in 2015 as compared to 2014, as a result of (i) lower costs related to our purchases of crude oil from the ANH and third parties as well as our purchases of refined products, in each case due to a decrease in international prices, and (ii) cost savings from our renegotiation of rates in some of our contracts. |
In 2016,operating expenses before impairment of non-current assets decreased by 70.1% in 2016 as compared to 2015, primarily as a result of (i) lower expenses related to our exploratory activity as we engaged in less seismic activity and exploratory drilling, (ii) minor commissions, fees, freight and services as a result of the savings obtained in the implementation of our transformation plan, and (iii) a lower wealth tax. This decrease was partially offset by an increase in labor expenses due to the implementation of the voluntary retirement plan.
| 79 |
In 2015, operating expenses before impairment of non-current assets decreased by 23.9% in 2015 as compared to 2014, primarily as a result of (i) lower expenses related to our exploratory activity as we engaged in less seismic activity and exploratory drilling, (ii) a decrease in commissions, fees, freight and services as a result of cost savings related to our transformation program, and (iii) the recovery of provisions for litigation related to the payment of an electric-power-generation contribution by Ecopetrol S.A. and compensation to third parties for infringement of the free competition clause in the Garcero association contract. This increase was partially offset by an increase in the Colombian wealth tax.
Theimpairment of non-current assetsrecognized in the exploration and production segment in 2016, which totaled COP$196,448 million in 2016 as compared to COP$4,504,497 million in 2015, decreased by 95.6% as compared to 2015 mainly due to variation in estimations of future prices which include the current scenarios of oil quota agreements of OPEC and the impact of changes on specifications issued by the Marpol (abbreviation of marine pollution) agreement on crude and fuels with high sulfur content (See Note 17.1 to our consolidated financial statements for more detail).
The increased impairment charges for non-current assets in 2015, which totaled COP$4,504,496 million as compared to COP$965,607 million in 2014, was primarily due to the existing low oil price environment, which resulted in a reduction in forecasted crude oil prices and an increase in market and country risk, which was reflected in the discount rate, as well as a reduction in the amount of recoverable reserves. The most significant cash generation units impacted by the impairments were the following fields: in Colombia, Chichimene, Tibú, CP09, Apiay, Llanito and La Hocha and in the Gulf of Mexico, K2 and Dalmatian (see Note 17.1 to our consolidated financial statements for more details).
The segment recorded net income attributable to owners of Ecopetrol of COP$1,322,370 million in 2016 as compared to net loss attributable to owners of Ecopetrol of COP$5,851,619 million in 2015 and net income attributable to owners of Ecopetrol of COP$5,089,841 million in 2014.
Lifting and Production Costs
The aggregate average production cost, on a Colombian Peso basis, has decreased to COP$20,993 per boe during 2016 from COP$21,732 per boe during 2015, primarily due to:
| · | Extension of our program for reducing operating costs as well as the implementation of our transformation program. The key optimization strategies contributing to decreased production costs are: |
| (i) | Reduction in number of services due to equipment failure, equipment reuse for electric submersible pump (ESP), less maintenance and well monitoring, renegotiation of tariffs and decrease in time to well interventions. |
| (ii) | Less tariffs on surface maintenance, reduction of costs by adjustment in integrity strategy, change in equipment inspection periods according to condition, decrease of tariffs of administrative items and prioritization of interventions. |
| (iii) | Decrease in energy tariffs, reduction of generation with liquid fuels (Diesel - Fuel Oil No.4), increase in efficiency through the entry of our own generation centers and increase in electrical reliability. |
| (iv) | Lower levels of chemical applied in the process of treatment of fluids, biological treatment insurance, reduction in production, transportation and disposal of oily waste and reduction of contracting, inspection and repair through renegotiation of contracts. |
| 80 |
| (v) | A decrease in production volumes in direct and associated contracts (excluding production tests and discovery of undeveloped fields), mainly due to smaller production in the Yarigui-Cantagallo and Pauto fields of direct operation and a decrease in production volumes from fields held as part of a partnership, such as Rubiales (first half of 2016), La Cira Infantas and Chuchupa, which in turn was primarily due to the prioritization of investments for assets of fast cash return and our policy of profitable fields. |
As a result of the above-mentioned factors, our aggregate average production cost, on a Colombian Peso basis, decreased in 2016 as compared to 2015. On a dollar basis, it decreased to US$6.88 per boe in 2016 from US$7.92 per boe in 2015 also due to an 11.21% depreciation of the average exchange rate of the Colombian Peso against the U.S. dollar in 2016.
The aggregate average lifting cost, on a Colombian Peso basis, has decreased to COP$19,799 per boe during 2016 from COP$20,308 per boe during 2015, primarily due to:
| · | Continuation of our program for reducing operating costs as well as the implementation of our transformation program. The key optimization strategies contributing to decreased production costs are: |
| (i) | Reduction in number of services due to equipment failure, equipment reuse for electric submersible pump (ESP), less maintenance and well monitoring, renegotiation of tariffs and decrease in time to well interventions. |
| (ii) | Less tariffs on surface maintenance, reduction of costs by adjustment in integrity strategy, change in equipment inspection periods according to condition, decrease of tariffs of administrative items and prioritization of interventions. |
| (iii) | Decrease in energy tariffs, reduction of generation with liquid fuels (Diesel - Fuel Oil No.4), increase in efficiency through the entry of our own generation centers and increase in electrical reliability. |
| (iv) | Lower levels of chemical applied in the process of treatment of fluids, biological treatment insurance, reduction in production, transportation and disposal of oily waste and reduction of contracting, inspection and repair through renegotiation of contracts. |
| · | A decrease in production volumes in direct and associated contracts (excluding production tests and discovery of undeveloped fields), mainly due to smaller production in the Yarigui-Cantagallo and Pauto fields of direct operation and a decrease in production volumes from fields held as part of a partnership, such as Rubiales (first half of 2016), La Cira-Infantas and Chuchupa, which in turn was primarily due to the prioritization of investments for assets of fast cash return and our policy of profitable fields. |
As a result of the above-mentioned factors, our aggregate average lifting cost, on a Colombian Peso basis, decreased in 2016 as compared to 2015. On a dollar basis, it decreased to US$6.49 per boe in 2016 from US$7.40 per boe in 2015 also due to an 11.21% depreciation of the average exchange rate of the Colombian Peso against the U.S. dollar in 2016.
The difference between the aggregate average lifting cost and aggregate average production cost is that lifting costs do not include the costs related to consumption of hydrocarbons by us in our production process or that Ecopetrol sold to our refineries and natural gas liquid plants.
The following table sets forth crude oil and natural gas average sales prices, the aggregate average lifting costs and aggregate average unit production cost for the years ended December 31, 2016, 2015 and 2014.
| 81 |
Table 48 – Crude Oil and Natural Gas Average Prices and Costs
| 2016 | 2015 | 2014 | ||||||||||
| Crude Oil Average Sales Price (U.S. dollars per barrel)(1) | 35.7 | 43.9 | 87.3 | |||||||||
| Crude Oil Average Sales Price (COP$ per barrel)(1) | 108,337 | 118,115 | 173,769 | |||||||||
| Natural Gas Average Sales Price (U.S. dollars per barrel equivalent) | 23.5 | 22.0 | 23.9 | |||||||||
| Natural Gas Average Sales Price (COP$ per barrel equivalent) | 71,893 | 60,120 | 47,912 | |||||||||
| Aggregate Average Unit Production Costs (U.S. dollars per boe)(2) | 6.88 | 7.92 | 12.43 | |||||||||
| Aggregate Average Unit Production Cost (COP$ per boe)(2) | 20,993 | 21,732 | 24,872 | |||||||||
| Aggregate Average Lifting Costs (U.S. dollars per boe)(3)(4)(5) | 6.49 | 7.40 | 11.29 | |||||||||
| Aggregate Average Lifting Costs (COP$ per boe)(3)(4) (5) | 19,799 | 20,308 | 22,581 | |||||||||
| (1) | Corresponds to our average sales price on a consolidated basis. |
| (2) | Unit production costs correspond to consolidated average costs on total production volumes net of royalties. Production costs do not include costs related to transport, commercialization and administrative expenses. |
| (3) | Lifting costs per barrel are calculated based on total production (excluding production tests and discovered undeveloped fields), which are net of royalties, and correspond to our lifting costs on a consolidated basis. |
| (4) | The cost indicator is calculated by using the cost of production (does not include costs related to hydrocarbons consumption by Ecopetrol in the production process, such as by our refineries and natural gas liquid plants) and dividing by the net produced volume (excluding royalties) as the denominator. |
| (5) | As a result of the evaluation of control over companies under IFRS, Ecopetrol does not consolidate Savia Perú and Equion. As a consequence, the information in the table above for this annual report (which has been prepared under IFRS) differs from the information we previously published for 2014 under Colombian Government Entity GAAP (where we did consolidate Savia Perú and Equion). |
| 4.5.1.10 | Transportation and Logistics Segment Results |
In 2016, ourtransportation and logistics segment sales were COP$10,648,776 million compared to COP$10,844,550 million in 2015. The 1.8% decrease in 2016 as compared with 2015 was mainly due to an 11.3% decrease in the volume of crude oil transported by our pipelines, which was primarily due to the production decrease at the national level, in spite of (i) the positive effect on our U.S. dollar-indexed transportation fees resulting from the devaluation of the Colombian Peso against the U.S. dollar and (ii) a 3.7% increase in the volume of refined products transported in the Galán-Sebastopol system to meet the demand for fuel in the country’s interior and the start-up of Reficar. Sales to third parties decreased in 2016 as compared to 2015 primarily due to the segment received income from the transportation services to Pacific Rubiales for its participation in the Rubiales field, and once the field returned to us in July 2016, these services were recognized as inter-segment sales.
In 2015, our transportation and logistics segment sales were COP$10,844,550 million compared to COP$8,343,934 million in 2014. This 30% increase in 2015 as compared with 2014 was mainly due to higher volume of crude oil transported by the Ocensa, Caño Limón Coveñas and Oleoducto Transandino pipelines due to the decline in the number of attacks on our infrastructure and the positive effect on our U.S. dollar-indexed transportation fees resulting from the devaluation of the Colombian Peso against the U.S. dollar.
Thecost of sales for our transportation and logistics segment is mainly related to: (i) project costs associated with the maintenance of transportation networks and (ii) operating costs related to these systems, including the costs of labor, energy, fuels and lubricants and others.
The cost of sales amounted to COP$3,349,791 million in 2016 as compared to COP$3,744,422 million in 2015. The cost of sales for this segment decreased by 10.5% in 2016 as compared with 2015 mainly due a decrease in costs associated with maintenance, operating supplies and materials due to the continuity of our program to optimize our operating costs. This decrease was partially offset by an increase in material processing costs needed for power generation in pumping stations and an increase in depreciation due to a higher level of investments in the segment.
The cost of sales amounted to COP$3,744,422 million in 2015 and COP$3,941,052 million in 2014. The cost of sales for this segment decreased by 5% in 2015 as compared with 2014 mainly due to a decrease in costs associated with maintenance and operating supplies and materials. This decrease was partially offset by an increase in depreciation and amortization due to our increased investments in this segment.
| 82 |
In 2016,operating expenses before the impairment of non-current assets increased by 30.7% as compared to 2015 due to a recovery of environmental provisions in 2015, no similar recoveries in 2016 and an increase in labor costs as a result of the implementation of the voluntary retirement plan. This increase was partially offset by lower wealth and industry taxes.
In 2015, operating expenses before the impairment of non-current assets decreased by 16.2% as compared to 2014 due to decreased expenses related to social investment and security agreements, and more stable operations due to a decrease in repairs of our transportation systems. This decrease was partially offset by (i) the Colombian wealth tax implemented in 2015 and, (ii) increased depreciation and amortization.
Theimpairment of non-current assets recognized in the segment in 2016 which totaled COP$41,062 million recovery in 2016 as compared to COP$81,388 million expense in 2015, decreased by 150.5% as compared to 2015 mainly by the incorporation, in the assessment of the recovery amount of this segment’s assets, of flows associated to the San Fernando - Apiay system project that affects the recoverable amount of the Llanos transportation line, partially offset by an increase in impairment of assets related to the southern transportation line. (See Note 17.3 to our consolidated financial statements for more detail).
The increased impairment charges for non-current assets in 2015, which totaled COP$81,388 million as compared to a COP$1,121 million recovery of impairment in 2014 was primarily due to Colombia’s hydrocarbon production curves, based on the crude oil price environment and pipeline transportation rates (see Note 17.3 to our consolidated financial statements).
The segment recorded net income attributable to owners of Ecopetrol of COP$2,960,449 million in 2016 as compared to net income of COP$2,819,759 million in 2015 and COP$1,758,777 million in 2014.
| 4.5.1.11 | Refining and Petrochemicals Segment Results |
In 2016, therefining and petrochemical segment sales were COP$24,823,714 million compared to COP$23,245,676 million in 2015. In 2016, sales of refined products and petrochemicals increased by 6.8% as compared with 2015, mainly due to an increase in the volume of domestic and export sales mainly in mid-distillates due to the startup of operations at Reficar. This increase was partially offset by a decrease or our average products basket price due to the decrease in the international price of crude oil.
In 2015, the refining and petrochemical segment sales were COP$23,245,676 million compared to COP$27,172,300 million in 2014. In 2015, sales of refined products and petrochemicals decreased by 14.5% as compared with 2014, mainly due to: (i) a decrease in the international price of fuels and (ii) a decrease in foreign sales volumes of fuel oil due to the low water level in the Rio Magdalena. This decrease was partially offset by (i) an increase in the volume of domestic sales due to increased local demand for fuel resulting from an increased number of vehicles and the closure of Colombia’s border with Venezuela that led to higher diesel demand and (ii) an increase in intercompany sales due to higher volumes of diluent sold to our exploration and production segment.
Thecost of sales for our refined products and petrochemicals segment is mainly related to the purchase of crude oil and natural gas for our refineries, imported products to substitute for the loss of production due to the closure of Reficar as the new refinery was being built for most of 2014 and 2015, feedstock transportation services, services contracted for maintenance of the refinery and the amortization and depreciation of refining assets. Cost of sales amounted COP$22,843,987 million in 2016, compared to COP$20,758,808 million in 2015 and COP$25,537,228 million in 2014.
In 2016, the cost of sales for this segment increased 10% as compared with 2015, principally due to the operation of Reficar’s units in 2016 which led to (i) an increase in crude oil purchases through import and inter-segment transactions as Reficar required a special raw material or ‘diet’ during the stabilization and performance testing period which increased production cost, (ii) an increase in the depreciation of Reficar’s units (iii) inventory consumption that had been in stock in December 2015, and (iv) higher costs for services contracted, materials of process, maintenance and electrical power. This increase was partially offset by lower imports of products and the excellent operational performance of the Barrancabermeja Refinery.
| 83 |
In 2015, the cost of sales for this segment decreased 18.7% as compared with 2014, principally due to lower raw material costs, which corresponded to the decrease in international oil prices and lower operating costs as a result of cost optimization at the Barrancabermeja Refinery. This decrease was partially offset by higher imports of gasoline due to increased local demand for fuel resulting from an increased number of vehicles and the closure of Colombia’s border with Venezuela.
In 2016,operating expenses before the impairment of non-current assets increased by 27.3% as compared to 2015, due to an increase in labor expenses related to our voluntary retirement plan in 2016 and other expenses related to the start-up of operations at Reficar.
In 2015, operating expenses before the impairment of non-current assets increased by 23% as compared to 2014, due to higher levels of investment for the Reficar modernization project, the Colombian wealth tax implemented in 2015 and the increase in other expenses related to the start-up of operations at Reficar.
Theimpairment of non-current assets recognized in the segment in 2016, which totaled COP$773,361 million in 2016 as compared to COP$3,278,993 million in 2015, decreased by 76.4% as compared to 2015. The 2016 scenario incorporated the refining margins that include the effect of Marpol in 2016 compared to 2015, partially offset by the effect of adjustment of operational variables based on that observed during Reficar’s stabilization period and new ethanol prices on Bioenergy’s impairment (see Note 17.2 to our consolidated financial statements). As mentioned earlier, the refining segment is highly sensitive to changes in product prices and raw materials in the international market, the discount rate given the leveraging, the refining margins, changes in environmental regulations and cost structure and the level of capital expenditures.
The increased impairment charges for non-current assets in 2015, which totaled COP$3,278,993 million in 2015 as compared to COP$1,340,086 million in 2014 was recorded by the Cartagena Refinery due to the current low oil price environment, which resulted in a reduction in expected refining margins in the coming years, and an increase in market and country risk, which has been reflected in the discount rate (see Note 17.2 to our consolidated financial statements).
The gross margin in 2016 was 8%, compared to 10.7% in 2015. The decrease in the gross margin was explained principally by decreased operational activity during the period of stabilization and testing of Reficar.
The gross margin in 2015 was 10.7%, compared to 6% in 2014. The increase in the gross margin was explained principally by decrease in the oil price (feedstock) compared to the decrease in fuel prices (output).
The refining and petrochemicals segment recorded net loss attributable to owners of Ecopetrol of COP$1,823,020 million in 2016 as compared to a net loss attributable to owners of Ecopetrol of COP$4,016,050 million in 2015 and COP$1,627,705 million in 2014.
| 4.6 | Liquidity and Capital Resources |
Our principal sources of liquidity in 2016 were cash flows from our operations amounting to COP$14,232,940 million, and cash flows from financing activities, mainly from the proceeds of our net movement of indebtedness, which totaled COP$ 1,444,723 million.
Our principal uses of cash in 2016 were (i) COP$5,837,477 million in capital expenditures, which included investments in property, plant and equipment and natural and environmental resources and (ii) COP$5,446,507 in investment of liquidity surpluses in portfolios, (iii) dividend payments for the fiscal year 2015 amounting to COP$1,712,298 million, which included the last installment of dividends to the majority shareholder relating to fiscal year 2014 for COP$690,177 million and the payment of dividends to non-controlling interest in 2016 for COP$1,022,121 million.
On January 29, 2016, we entered into an international credit agreement for an aggregate amount of US$175 million with The Bank of Tokyo-Mitsubishi UFJ, Ltd. The credit agreement has a term of five years, repayable with a 2.5 year grace period on principal and interest, payable semi-annually at a rate of Libor plus 145 basis points.
| 84 |
On February 23, 2016, we entered into a bilateral commercial loan agreement with Bancolombia S.A. for COP$990 billion (approximately US$330 million at the representative exchange rate of as of December 31, 2016). This loan agreement had a term of 8 years and a 2-year grace period on principal, with interest payable semiannually at a rate of DTF TA plus 560 basis points. Ecopetrol prepaid this loan in full with excess liquidity in October 2016.
On May 16, 2016, we entered into a bilateral commercial loan agreement with Export Development Canada, an export promotion agency of the Canadian Government for US$ 300 million. This loan agreement has a term of five years, with interest payable semi-annually at rate of six-month Libor + 140 basis points.
On June, 2016, we issued US$500 million (COP$1,500 billion according to the COP$/US$ exchange rate as of December 31, 2016) aggregate principal amount of our SEC-registered 5.875% notes due 2023. The notes were listed on the NYSE.
| 4.6.1 | Review of Cash Flows |
Cash from operating activities
Net cash provided by operating activities increased by 21.9% in 2016 as compared to 2015, mainly as a result of (i) lower working capital needs mainly due to the higher oil prices observed at the end of 2016 versus the end of 2015, (ii) a 4% increase in our operational income before depreciation, depletion and amortization (DD&A) and impairment of non-current assets resulting from a decrease in our costs and operational expenses (before DD&A and impairment) due to our savings generated by the transformation plan. This increase was partially offset by (i) the decrease in international prices of crude oil during 2016, and (ii) an increase in income tax paid by the transportation and logistics segment due to the better results in 2015.
Net cash provided by operating activities decreased by 35.6% in 2015 as compared to 2014, mainly as a result of: (i) a 33.2% decrease in our gross income resulting from the decrease in international prices of crude oil during 2015 and (ii) higher operating expenses due to the Colombian wealth tax implemented and paid in 2015. This decrease was partially offset by a decrease in income tax paid due to the decrease in our income before tax for the year and lower working capital needs due to a decrease in inventories, trade receivables and accounts payable.
Cash used in investing activities
In 2016, net cash used in investing activities decreased by 26.8% as compared to 2015, mainly as a result of: (i) a 62.4% decreased investments in capital expenditures due to the effect of decreasing oil prices and the end of the Reficar modernization project, and (ii) additional cash proceeds from the sale of our investments in Empresa de Energía de Bogotá and Interconexion Electrica S.A, which totaled COP$966,715 million in the aggregate. This decrease was partially offset by increased investments of our excess liquidity in our investment portfolios, which in turn resulted from the savings we achieved and the recovery of the price of oil during the second half of 2016.
In 2015, net cash used in investing activities decreased by 2.4% as compared to 2014, mainly as a result of: (i) a decrease in the amount of dividends we received from associates and joint ventures companies (ii) slightly larger investments in capital expenditures, mainly relating to the Reficar modernization project and our drilling campaigns, primarily in the Castilla, Chichimene and Rubiales fields, and (iii) a lower net cash contribution from purchase and sale of fixed income investments. This decrease was partially offset by cash proceeds from the sale of our investment in Empresa de Energia de Bogotá, which totaled COP$613,998 million.
| 85 |
Cash used in financing activities
Net cash used in financing activities increased by 98.5% in 2016, as compared to 2015, due to a decrease in cash from borrowings of COP$5,151,937 million which was partially offset by a decrease in dividends payments of COP$3,781,099 million in 2016 as compared to 2015.
Net cash used in financing activities decreased by 81% in 2015, as compared to 2014, due to a COP$7,023,166 million decrease in dividend payments, which was partially offset by an increase in borrowing and interest payments of COP$1,069,146 million in 2015 as compared to 2014, which in turn was due to the US$1,925 million international loan we entered into in February 2015 and the US$1,500 million international bond we issued in June 2015.
| 4.6.2 | Capital Expenditures |
Our consolidated capital expenditures in 2016, 2015 and 2014 were COP$5.8 trillion, COP$15.5 trillion and COP$15.6 trillion, respectively. These investments were distributed by business segment on average, for the past three years as follows: 61.2% for the exploration and production segment, 22.1% for refining and petrochemicals and 16.7% for the transportation and logistics segment. See Note 34.1.2 to our consolidated financial statements for more detail about capital expenditures by segment.
Our investment plan approved for 2017 totals US$3,500 million. The investments will be distributed as follows: 81% for exploration and production, 10% for refining and petrochemicals, 8% for transportation and logistics, and 1% for other investments.
The resources required for the investment plan will be funded through internal cash generation with no need to raise additional net financing.
| 4.6.3 | Dividends |
In 2016, we paid the last installment of dividends relating to our net income to the Nation of COP$690,177 million and our transportation and logistics’ subsidiaries paid dividends to their non-controlling shareholder for COP$1,022,121 million. Given the net loss we reported in 2015, our shareholders at the ordinary general shareholder’s meeting did not approve distribution of dividends for 2015.
On March 31, 2017, our shareholders at the ordinary general shareholders’ meeting approved dividends for the fiscal year ended December 31, 2016 amounting to COP$945,684 million, or COP$23 per share, based on the number of outstanding shares as of December 31, 2016. The dividend was paid in one installment on April 28, 2017.
| 4.7 | Summary of Differences between Internal Reporting (Colombian IFRS and IFRS) |
We prepare our interim and annual statutory financial information in accordance with our internal reporting policies, which follow Colombian IFRS and differ in certain significant aspects from IFRS. The following table sets forth our consolidated net income and equity for years ended December 31, 2016, 2015 and 2014, in accordance with Colombian IFRS and IFRS:
Table 49 – Consolidated Net Income and Equity
| For the year ended December 31, | ||||||||||||||||||||
| (Colombian Pesos in millions) | % Change | |||||||||||||||||||
| 2016 | 2015 | 2014 | 2016/2015 | 2015/2014 | ||||||||||||||||
| Net income attributable to owners of Ecopetrol (IFRS) | 2,447,881 | (7,193,859 | ) | 5,046,517 | (134.0 | ) | (242.6 | ) | ||||||||||||
| Cash flow hedge for future company exports | (494,604 | ) | 2,140,553 | – | (123.1 | ) | N/A | |||||||||||||
| Exchange rate effects on tax bases – Deferred tax | (388,568 | ) | 1,065,580 | 678,983 | (136.5 | ) | 56.9 | |||||||||||||
| Net income Attributable to owners of Ecopetrol (Colombian IFRS) | 1,564,709 | (3,987,726 | ) | 5,725,500 | (139.2 | ) | (169.6 | ) | ||||||||||||
| Net Equity (IFRS) | 43,560,501 | 43,100,963 | 48,534,228 | 1.1 | (11.2 | ) | ||||||||||||||
| Cash flow hedge for future company exports | (39,803 | ) | (74,259 | ) | – | (46.4 | ) | N/A | ||||||||||||
| Exchange rate effects on tax bases – Deferred tax | 1,799,020 | 2,205,064 | 998,440 | (18.4 | ) | 120.9 | ||||||||||||||
| Net Equity (Colombian IFRS) | 45,319,718 | 45,231,768 | 49,532,668 | 0.2 | (8.7 | ) | ||||||||||||||
| 86 |
As noted above, certain differences exist between our net income and equity as determined in accordance with our internal reporting policies, which follow Colombian IFRS, which are used for management reporting purposes, as presented in the business segment information, and our net income and equity as determined under IFRS, as presented in our consolidated financial statements.
The primary differences between Colombian IFRS and IFRS as they apply to our results of operations are summarized below:
| · | Cash flow hedge for future company exports. In September 2015, in order to hedge the effect of exchange rate volatility on Ecopetrol’s foreign currency debt, Ecopetrol’s Board of Directors approved a cash flow hedge for future crude oil exports. According to IAS 39 – Financial Instruments, Ecopetrol implemented this hedge beginning on October 1, 2015, the date on which it formally completed the related hedging documentation. |
Under Colombian IFRS, theContaduria General de la Nación (CGN for its acronym in Spanish) issued Resolution 509, which allows companies to apply hedge accounting for non-derivative financial instruments from any date within the transition period or the first period of application of International Accounting Standards in Colombia, even if such company has not yet formally documented the hedging relationship, the objective or the risk management strategy. Under these rules, Ecopetrol applied cash flow hedge accounting from January 1, 2015 in its financial statements under Colombian IFRS.
As a result of this accounting policy differences, for the year ended December 31, 2016, our net income as reported under IFRS was COP$494,604 million higher than our net income as reported under Colombian IFRS.
| · | Exchange rate effects on tax bases – Deferred tax. According to IAS 12.41, companies with a U.S. dollar functional currency and profit or tax loss in Colombian Pesos are required to recognize deferred taxes attributable to the difference between the carrying amounts of non-monetary assets in their financial statements and their respective tax bases converted from Colombian Pesos to U.S. dollars using the exchange rate on the closing date. The effect of the temporary difference is charged to profit and losses without a cash outflow expected in the future. Under local accounting principles, the result attributable to the aforementioned difference in accounting policies does not generate deferred taxes at December 31, 2016. |
Ecopetrol’s functional currency is the Colombian Peso and it consolidates some subsidiaries whose functional currency is the U.S. dollar but who settled their taxes in Colombian Pesos. As a result of the application of paragraph 41 – IAS 12, such subsidiaries are required to calculate deferred taxes under IFRS.
As a result of this accounting policy difference, for the year ended December 31, 2016, our net income attributable to owners of Ecopetrol as reported under IFRS was COP$388,568 million higher than our net income attributable to owners of Ecopetrol as reported under Colombian IFRS.
| 87 |
The application of IAS12.41 also generated adjustments to our goodwill and investments in companies impairments of COP$86,781 million in 2016 and COP$418,872 million in 2015 in connection with our purchase of subsidiaries whose functional currency is the U.S. dollar as well as adjustments to our revenue from the equity method of COP$71,056 million in 2016 and COP$81,808 million in 2015 in connection with our associates and joint ventures whose functional currency is the U.S. dollar.
As a result of these accounting policy differences described above, for the year ended December 31, 2016, we reported net income attributable to the owners of Ecopetrol under IFRS of COP$2,447,881 million as opposed to a net income attributable to the owners of Ecopetrol of COP$1,564,709 million reported under Colombian IFRS for the same period. For the year ended December 31, 2015, these same accounting differences led us to report a net loss under IFRS of COP$7,193,859 million as opposed to a net loss of a COP$3,987,726 million reported under Colombian IFRS for the same period.
| 4.8 | Financial Indebtedness and Other Contractual Obligations |
As of December 31, 2016, we had outstanding consolidated indebtedness of COP$52.2 trillion, which corresponded primarily to the following long-term transactions:
Table 50 – Consolidated Financial Indebtedness
| Company | Type | Initial Date | Original Amount | Maturity | Interest Rate | Amortization | ||||||||
| Ecopetrol S.A. | Bonds | July 23, 2009 | US$1,500 million | July 23, 2019 | 7.625 | % | Bullet | |||||||
| September 18, 2013 | US$350 million | September 18, 2018 | 4.250 | % | Bullet | |||||||||
| September 18, 2013 | US$1,300 million | September 18, 2023 | 5.875 | % | Bullet | |||||||||
| September 18, 2013 | US$850 million | September 18, 2043 | 7.375 | % | Bullet | |||||||||
| May 28, 2014 | US$2,000 million | May 28, 2045 | 5.875 | % | Bullet | |||||||||
| September 16, 2014 | US$1,200 million | January 16, 2025 | 4.125 | % | Bullet | |||||||||
| June 26, 2015 | US$1,500 million | June 26, 2026 | 5.375 | % | Bullet | |||||||||
| June 15, 2016 | US$500 million* | September 18, 2023 | 5.875 | % | Bullet | |||||||||
| December 1, 2010 | COP$138,700 million | December 1, 2017 | Floating | Bullet | ||||||||||
| December 1, 2010 | COP$479,900 million | December 1, 2020 | Floating | Bullet | ||||||||||
| December 1, 2010 | COP$284,300 million | December 1, 2040 | Floating | Bullet | ||||||||||
| August 27, 2013 | COP$120,950 million | August 27, 2018 | Floating | Bullet | ||||||||||
| August 27, 2013 | COP$168,600 million | August 27, 2023 | Floating | Bullet | ||||||||||
| August 27, 2013 | COP$347,500 million | August 27, 2028 | Floating | Bullet | ||||||||||
| August 27, 2013 | COP$262,950 million | August 27, 2043 | Floating | Bullet | ||||||||||
| Bank Loans* | May 27, 2013 | COP$1,839 billion** | May 24, 2025 | Floating | Semi-annual | |||||||||
| February 12, 2015 | US$1,925 million | February 12, 2020 | Floating | Bullet | ||||||||||
| January 29, 2016 | US$175 million | February 11, 2021 | Floating | Semi-annual | ||||||||||
| ECAs | March 22, 2013 | US$245 million | July 25, 2023 | Floating | Semi-annual | |||||||||
| March 22, 2013 | US$151 million | July 6, 2019 | Floating | Semi-annual | ||||||||||
| May 16, 2016 | US$300 million | May 24, 2021 | Floating | Bullet | ||||||||||
| Reficar | Project Finance | December 30, 2011 | US$3,497 million | December 20, 2027 | Floating / Fixed | Semi-annual | ||||||||
| Ocensa | Bond | May 7, 2014 | US$500 million | May 7, 2021 | 4.000 | % | Bullet | |||||||
| Oleoducto Bicentenario | Bank Loan | July 5, 2012 | COP$2,100 billion** | July 5, 2024 | Floating | Quarterly | ||||||||
| ODL | Bank Loan* | August 1, 2013 | COP$800,000 million** | August 1, 2020 | Floating | Quarterly | ||||||||
* Reopening of bond due to 2023.
** Bank loans refinanced from their original conditions.
The long term debt transactions executed in 2016 were as follows:
| · | On January 29, 2016, Ecopetrol S.A. entered into an international credit agreement in an aggregate amount of US$175 million with The Bank of Tokyo-Mitsubishi UFJ, Ltd. The credit agreement has a term of five years and a 2.5 year grace period on principal, with interest payable semi-annually at a rate of Libor plus 145 basis points. |
| · | On February 23, 2016, Ecopetrol S.A. entered into a bilateral commercial loan agreement with Bancolombia S.A. in an aggregate amount of COP$990 billion (approximately US$330 million at the representative exchange rate as of December 31, 2016). This loan agreement had a term of 8 years and a 2-year grace period on principal, with interest payable semiannually at a rate of DTF TA plus 560 basis points. As of the date of this annual report, this loan has been prepaid in full. |
| 88 |
| · | On May 16, 2016, Ecopetrol S.A. entered into a bilateral loan agreement with Export Development Canada (EDC), an agency for the promotion of exports of the Government of Canada, in an aggregate amount of US$300 million. This loan agreement has a term of 5 years with principal due at maturity and interest payable semiannually at a rate of LIBOR plus 140 basis points. |
| · | On June 15, 2016, Ecopetrol S.A reopened its SEC-registered 5.875% Notes due 2023 in an aggregate amount of US$500 million (COP$1,500 billion according to the COP$/US$ exchange rate as of December 31, 2016). The notes were listed on the NYSE. |
| · | On November 16, 2016, the Financial Superintendence of Colombia authorized Ecopetrol’s Bond Issuance and Allocation Programme renewal for three additional years, up until November 10, 2019. Thus far, Ecopetrol has issued under the Programme COP$ 900 billion. The Programme has a remaining amount of up to COP$2,100 billion and no modifications were made during the renewal process. |
Contractual Obligations
We enter into various commitments and contractual obligations that may require future cash payments. The following table summarizes our contractual obligations as of December 31, 2016.
Table 51 – Our Contractual Obligations
| COP$ in millions | Payments due by period | |||||||||||||||||||
| Contractual obligations | Total | Less than 1 year | 1 to 3 years | 3 to 5 years | More than 5 years | |||||||||||||||
| Employee Benefit Plan | 26,365,279.0 | 1,125,105.0 | 2,322,451.0 | 2,420,570.0 | 20,497,153.0 | |||||||||||||||
| Contract Service Obligations | 5,991,167.1 | 2,378,785.4 | 2,407,447.8 | 429,061.3 | 775,872.7 | |||||||||||||||
| Operating Lease Obligations | 652,681.2 | 190,875.0 | 157,100.1 | 118,815.1 | 185,891.0 | |||||||||||||||
| Natural Gas Supply Agreements | 2,107,163.5 | 229,202.5 | 495,130.2 | 395,420.0 | 987,410.9 | |||||||||||||||
| Purchase Obligations | 1,318,087.2 | 624,323.3 | 571,858.9 | 74,385.0 | 47,520.0 | |||||||||||||||
| Energy Supply Agreements | 795,408.8 | 97,418.0 | 155,820.8 | 121,267.0 | 420,902.9 | |||||||||||||||
| Capital Expenditures | 621,571.7 | 423,021.94 | 169,321.7 | 29,228.1 | - | |||||||||||||||
| Build, Operate, Maintain and Transfer Contracts (BOMT) | 576,758.8 | 65,155.9 | 114,724.0 | 113,351.5 | 283,527.4 | |||||||||||||||
| Capital (Finance) Lease Obligations | 381,838.6 | 254.1 | 23,649.2 | 40,011.2 | 317,924.1 | |||||||||||||||
| Financial Sector Debt | 20,162,033.8 | 1,333,129.9 | 3,181,732.0 | 9,712,744.3 | 5,934,427.7 | |||||||||||||||
| Bonds | 30,909,787.0 | 138,700.0 | 5,672,263.5 | 1,980,255.0 | 23,118,568.5 | |||||||||||||||
| Total | 89,881,776.78 | 6,605,971.01 | 15,271,499.17 | 15,435,108.32 | 52,569,198.28 | |||||||||||||||
The table does not include the contractual obligations of Equion, Savia and Ecodiesel, which do not consolidate within the Ecopetrol’s Group.
| 4.9 | Off Balance Sheet Arrangements |
As of December 31, 2016, we did not have off-balance sheet arrangements of the type that is required to be disclosed under Item 5.E of Form 20-F.
| 4.10 | Trend Analysis and Sensitivity Analysis |
Trend Analysis
Ongoing Trends
Ecopetrol updated its 2020 Business Plan on September 29, 2016. This Plan is based on three fundamental pillars: i) protection of cash and cost efficiency; ii) strict capital discipline; and iii) growth in reserves and production; these pillars will strengthen the Company’s financial sustainability and afford it opportunities for both organic and inorganic growth, generating value and profitability for its shareholders.
| 89 |
According to this business plan, during 2017 the Company will continue to pursue its transformation to ensure operational and financial sustainability. Ecopetrol has named Phase 3.0 of the business Transformation plan “Ecopetrol’s New Frontier”. It will focus on opening up new markets; multi-year fields development plans; improved return on assets; attracting and retaining the best human talent; committing ourselves to integrity, safe operations, environment consciousness and joint prosperity with communities in which we operate and execute projects.
We believe that our strategy of diversifying our export destinations and sales under term contracts with fixed discounts to reference prices will help to mitigate the impact of the current crude oversupply over the spread of our export basket. We forecast a discount between US$9 and US$10 per barrel compared to ICE Brent crude in 2017.
Furthermore, with the full operation of all units of Reficar since 2016 and shifting from stabilization to optimization, Ecopetrol’s trade balance is subjectexpected to continue improving due to the reduction of gasoline imports and incremental exports of fuels. Reficar’s fuels production is expected to continue being allocated primarily in the domestic market, with a surplus to be exported.
Adding reserves and maintaining the pace of production are the Company’s focus. The exploration campaign will be focused in regions of high prospectivity. Investment in exploration will rise from US$ 282 million to US$ 650 million, thus increasing offshore wells from one to six and onshore wells from five to 11 from 2016 to 2017. Enhanced recovery will continue to leverage additional reserves in mature fields.
We stress that a strong cash position allows us to assess opportunities for inorganic growth of Ecopetrol ‘s reserves.
The Company expects to continue the divestment program and expects to receive during 2017 between US$500 and US$1,000 million. The Company is in the process of carrying out the sale of non-strategic assets and shareholdings, such as Propilco, its remaining shares in Empresa de Energía de Bogota and minor production fields.
In order to preserve its investment grade ratings, the Company seeks to maintain financial sustainability and adequate levels of indebtedness. In 2016 international bonds were issued totaling US$ 500 million and commercial loans were entered into totaling US$ 475 million. Going forward, and according with the assumptions of the business plan, the Company does not foresee the issuance of new debt or short-term financing.
The Company will continue monitoring oil price scenarios to make the proper decisions and take preventive actions to ensure financial sustainability in 2017 such as: prioritization of investments associated with regulatory commitments and project completion, temporary closing of producing assets with negative margins, redefining and prioritizing maintenance activities and additional austerity measures related to administrative expenses, sponsorships and labor recruitment.
Sensitivity Analysis
Sensitivity Analysis of Reserves
The following table provides information about the sensitivity analysis conducted on our oil and gas reserves as of December 31, 2016, taking into account ICE Brent crude oil prices that reasonably reflect management’s view of crude oil prices given prevailing market conditions.
Table 52 – Sensitivity Analysis of Reserves
Oil and NGL (million barrels) | Natural Gas (bcf) | Total Oil and Gas (Mmboe) | ||||||||||
| Reserves as of December 31, 2016 | 1,033 | 3,218 | 1,598 | |||||||||
| Sensitivity Scenario | 1,182 | 3,252 | 1,752 | |||||||||
| Difference (million barrels) | 149 | 34 | 154 | |||||||||
| Difference (%) | 14.4 | 1 | 9.6 | |||||||||
The conversion rate used is 5,700 cf = 1 boe.
| 90 |
Assumptions for the Sensitivity Analysis of Reserves
| · | The sensitivity of the ICE Brent price index is forecasted to average US$55 per barrel in 2017, US$60 per barrel in 2018, US$65 per barrel in 2019, US$70 per barrel in 2020 and US$75 per barrel onwards. |
| · | The base scenario on which our sensitivity analysis is made corresponds to our oil, NGL and natural gas reserves, as of December 31, 2016, as presented elsewhere in this annual report. |
| · | Other variables such as the operating costs, capital costs and portfolio price were not varied for purposes of the analysis. |
Sensitivity Analysis of our Results
The following table provides information about the sensitivity of our results as of December 31, 2016, due to variations of US$1 in the price of ICE Brent crude and of 1% in the COP$/US$ exchange rate.
Table 53 – Results of Reserves’ Sensitivity Analysis
| Income Statement 2016 | Income Statement Case ICE Brent(1) | Difference Between Real 2016 and Case ICE Brent | Income Statement Case TRM(2) | Difference Between Real 2016 and | ||||||||||||||||
| (COP$ in billions) | ||||||||||||||||||||
| Revenue | 48,485,56 | 49,398,37 | 912,81 | 48,931,98 | 446,42 | |||||||||||||||
| Cost of sales | 34,251,42 | 34,606,79 | 355,37 | 34,472,25 | 220,83 | |||||||||||||||
| Gross Income | 14,234,14 | 14,791,58 | 557,44 | 14,459,73 | 225,60 | |||||||||||||||
| Operating expenses | 4,400,84 | 4,400,84 | - | 4,400,84 | - | |||||||||||||||
| Impairment of non-current assets | 928,75 | 928,75 | - | 928,75 | - | |||||||||||||||
| Operating income | 8,904,55 | 9,461,99 | 557,44 | 9,130,14 | 225,60 | |||||||||||||||
| Finance results, net | (1,175,37 | ) | (1,175,37 | ) | - | (1,175,37 | ) | - | ||||||||||||
| Share of profit of associates and joint ventures | 61,35 | 61,35 | - | 61,35 | - | |||||||||||||||
| Income before income tax | 7,790,53 | 8,347,97 | 557,44 | 8,016,12 | 225,60 | |||||||||||||||
| Income Tax | (4,543,05 | ) | (4,868,12 | ) | (325,07 | ) | (4,674,60 | ) | (131,56 | ) | ||||||||||
| Net Income | 3,247,48 | 3,479,85 | 232,37 | 3,341,52 | 94,04 | |||||||||||||||
| (1) | ICE Brent = US$45 per barrel |
| (2) | Exchange rate (TRM) = COP$3,051/US$1.00 |
Assumptions for the Sensitivity Analysis of our Results
| · | Our sensitivity analysis is based on the Consolidated Statement of Profit or Loss for 2016, as presented elsewhere in this annual report. |
| · | The sensitivity of the ICE Brent price index is in reference to an increase of US$1 per barrel of crude oil in the average ICE Brent reference price based on a 365-day year for 2016. Prices assumed correspond to realized prices for crude oil, natural gas and refined products for 2016, adjusted to account for the differences between such realized prices and the ICE Brent reference price. |
| 91 |
| · | The sensitivity of our results to changes in the exchange rate is in reference to a 1% average depreciation of the Colombian Peso against the U.S. dollar during 2016. Prices assumed correspond to realized prices of crude oil, natural gas and refined products in 2016 and are expressed for the sensitivity using the adjusted exchange rate (i.e. a 1% average depreciation of the Colombian Peso against the U.S. dollar during 2016). |
| · | The income tax for each of our sensitivity analyses (price of ICE Brent and COP$/US$ exchange rate) is estimated using the effective corporate tax rate of 58% for 2016. |
The table below sets forth the line items that are being affected by the variation on the reference prices or the average exchange rate.
Table 54
| VARIATION ON ICE BRENT REFERENCE PRICE | VARIATION ON AVERAGE EXCHANGE RATE |
REVENUE | |
| Sales of crude oil | Sales of crude oil |
| Sales of refined products | Sales of refined products |
| Sales of natural gas | Sales of natural gas |
| COST OF SALES | |
| Local purchases from business partners | Local purchases from business partners |
| Local purchases of hydrocarbons from the ANH | Local purchases of hydrocarbons from the ANH |
| Local purchases of natural gas | Local purchases of natural gas |
| Imports of products | Imports of products |
| 5. | Risk Review |
| 5.1 | Risk Factors |
The risks discussed below could have a material adverse effect, separately or in combination, on our business’s operating results, cash flows, liquidity and financial condition. Investors should carefully consider these risks.
| 5.1.1 | Risks Related to Our Business |
This section describes the most significant potential risks to our business.
Our crude oil and natural gas reserve estimates involve some degree of uncertainty and may prove to be incorrect over time, which could adversely affect our ability to generate revenue.
Reserves estimates are prepared using generally accepted geological and engineering evaluation methods and procedures. Estimates are based on geological, topographical and engineering facts. Actual reserves and production may vary materially from estimates shown in this annual report, and downward revisions in our reserve estimates could lead to lower future production which could affect our results of operations and financial condition.
Hydrocarbon reserves presented in this annual report were calculated in accordance with SEC regulations. As required by those regulations, reserves were valued based on the unweighted average of closing prices for the first day of each month in the 12-month periods ended December 31, 2016, 2015 and 2014, as well as other conditions in existence at those dates. The average of closing prices of ICE Brent crude oil for the first day of each month in the 12-month period was US$101.80 per barrel in 2014, US$55.57 per barrel in 2015 and US$44.49 per barrel in 2016. Mainly as a result of the pronounced fall in hydrocarbon prices between 2014 and 2015, the Company recognized a reduction in oil and gas proven reserves of 11% in 2015 as compared to 2014, to 1,849 mmboe in 2015 from 2,084 mmboe in 2014. In 2016, the Company recognized a reduction in oil and gas proven reserves of 14% in 2016 as compared to 2015, to 1,598 mmboe in 2016 from 1,849 mmboe in 2015 For more information, see the sectionBusiness Overview—Exploration and Production—Reserves.
| 92 |
Furthermore, at least once a year, or more frequently if the circumstances require, the Company ascertains whether there are signs of impairment to its assets or cash-generating units (CGUs) due to the difference between the carrying amount of such assets or CGUs as opposed to their recoverable amounts, using reasonable assumptions, based on internal and external factors, which reflect market conditions. The recoverable amount is calculated based on the free cash flow method, discounted at the weighted average capital cost (WACC). Whenever the recoverable amount of an asset or CGU is lower than its net carrying amount, such amount is reduced to its recovery amount, recognizing a loss for impairment as an expense in the consolidated statement of profit or loss.
Impairment charges for non-current assets in 2016 amounted to COP$928,747 million before taxes as a result of the evaluation of the recoverable amount of the assets value which includes the variation in estimations of future prices under the current scenarios of OPEC’s oil quota agreements and the impact resulting from changes on specifications issued by the International Marine Organization agreement regarding marine pollution, Marpol, on crude and fuels with high sulfur content. For additional information about this impairment charges,see Notes 14, 17 and 28 to our consolidated financial statements.
Any significant change in estimates and judgments could have a material effect on the quantity and present value of our proved reserves and subsequently on the recognition or recovery of impairment charges. Changes to estimations of reserves are applied prospectively to the amounts of depreciation, depletion and amortization charged and, consequently, the carrying amounts of exploration and production assets.
In order to assess the possible impact of current expected oil price scenarios and market conditions, as well as of further developments driven by the economic environment for the oil and gas industry, the Company has performed a sensitivity analysis over its proved reserve balance as of December 31, 2016. Based on these calculations, assuming an average price per barrel of ICE Brent crude oil of US$55 per barrel in 2017, US$60 per barrel in 2018, US$65 per barrel in 2019, US$70 in 2020 and US$75 per barrel for later years, Ecopetrol could recognize an increase in oil and gas proved reserves of approximately 9.6%. This analysis takes into account Ecopetrol’s estimates and expectations regarding the main assumptions used in its proven reserve calculation, which final actual result may fluctuate and differ substantially from those provided herein due to several uncertainties inherent tofactors outside of the determinationcontrol of the Company. For additional information see the sectionFinancial Review—Trend Analysis and Sensitivity Analysis.
Moreover, any downward revision in our estimated quantities of proved reserves would indicate lower future production volumes, which could result in higher expenses for depreciation, depletion and amortization for properties to which we apply the units of production method for calculating these expenses. These higher expenses, and any lower revenues as a result of actual production volumes and realized prices, could adversely impact our results of operations and financial condition.
Achieving our long-term growth depends on our ability to execute our strategic plan — specifically, the discovery and successful development of additional reserves.
Our long-term growth objectives depend largely on our ability to discover and/or acquire new reserves, and in turn developing them successfully and improving the recovery rates,factor in our mature oil fields. Our exploration activities expose us to the timelines with which investments are made to developinherent geological and drilling risks including the reservoirsrisk of not discovering commercially viable crude oil or natural gas reserves; and the degreerisk that some exploratory wells initially budgeted for may be drilled at a later stage or not be drilled at all. Despite the effort we make to control costs associated with drilling, these are often uncertain, and numerous factors beyond our control may cause drilling operations to be curtailed, delayed or cancelled.
Our ability to add and develop reserves also depends on our capacity to structurally reduce costs to maintain the profitability of maturityoil fields already being exploited.
If we are unable to successfully discover and develop additional reserves, or if we do not acquire properties having proved reserves, our reserves portfolio will decline. Failure to secure additional reserves may impede us from achieving or maintaining production targets, and may have a negative impact on our results of operations and financial condition.
| 93 |
See the sectionStrategy and Market Overview—Our Corporate Strategy for a discussion of our strategic plan.
Our business depends substantially on international prices for crude oil and refined products. The prices for these products are volatile; a sharp decrease could adversely affect our business prospects and results of operations.
In 2016, in Ecopetrol, approximately 91.7% of the fields.revenues came from sales of crude oil, natural gas and refined products and 91% of the total volume sold of these products is indexed to international reference prices or benchmarks such as ICE Brent. Consequently, fluctuations in those international indexes have a direct effect on our financial condition and results of operations.
CrudePrices of crude oil, pricesnatural gas and refined products have traditionally fluctuated as a result of a variety of factors such as changes inincluding, among others, competition within the international prices,oil and natural gas industry; long-term changes in the demand for crude oil (as further explained below), natural gas and refined products,products; the economic policies in the United States, China and the European Union; regulatory changes; changes in global supply, such as the current oversupply of crude oil; inventory levels, increaselevels; changes in the cost of capital,capital; adverse economic conditions,conditions; global financial crises; development of substitute sources of energy, development of new technologies,technologies; global and regional economic and political events,developments in the Organization of the Petroleum Exporting Countries, (OPEC); the willingness and ability of the OPEC and its members to set production levels; local and global demand and supply. Revisions to estimated proved reserves ofsupply for crude oil, refined products and gas and the effect of such price variations are presentednatural gas; trading activity in Note 33—Differences between Colombian Governmental Entity accounting principles and U.S. GAAP,to our consolidated financial statements.
Changes in the crude oil and natural gas, price may affect the calculation of our estimated proved reserves in the future as well as our estimate of the recoverability of our investment in ourwhich thereby affects their respective margins; derivative financial instruments related to oil and gas properties. A decrease in our estimated proved reservesgas; development or availability of alternative fuels; weather conditions; natural events or disasters; and terrorism and global conflict. In 2016 the impact of an oversupplied market was put to test, as OPEC changed its traditional controlling role and let the market find its own balance. The price of crude oil may also fluctuate due to pricing may resultchanges in demand. For example, Brexit’s impact on crude oil demand for 2017 is expected to be moderate, the impairmentPetroleum Industry Research (PIRA Energy Group) estimates a short-term impact of US$2 per barrel on crude oil due to a reduction between 100-200 KBD in demand for gasoline, middle distillates and gas properties.other products.
The calculation of units-of-production depreciation and depletion is a critical accounting estimate that measures the depreciation and depletion of upstream assets. The units of production are equal to the ratio of actual volumes produced to total proved developed reserves (those proved reserves recoverable through existing wells with existing equipment and operating methods) and applied to our asset cost. A decrease in our estimated proved reserves due to lower prices could result in higher depreciation, depletion and amortization expenses.
ProvedWhen crude oil, and gas properties held and used by us are reviewed for impairment whenever events or circumstances indicate that the carrying amounts may not be recoverable. Impairments are measured by the amount by which the carrying value exceeds its fair value. Any impairment tests that we perform make use of our long-term price assumptions for the crude oilrefined products and natural gas marketsprices are low, we earn less revenue and petroleumwe generate lower cash flow and less income. Conversely, when crude oil, refined product and natural gas prices are high, we earn more and generate a larger amount of cash and net income. During 2016, our crude oil basket price was US$35.7 per barrel versus US$43.9 per barrel in 2015; the refined product basket price was US$50.1 per barrel versus US$63.4 per barrel in 2015; and the natural gas price was US$23.5 per barrel equivalent in 2016 versus US$22.0 per barrel equivalent in 2015. However, it is important to consider that the margin on refined products which are different fromcan result either in higher or lower margins due to a change in price of crude the unweighted averagesame way gas prices can be impacted by local conditions, such as local demand and weather conditions.
Impairment charges for non-current assets in 2016 amounted to COP$928,747 million before taxes as a result of the month-end prices during the year which we use in accordance with SEC regulations to calculate our proved reseves. The resultsevaluation of the impairment tests are sensitive to the long-term price assumptions.
Volumes produced and asset costs are known, while proved reserves have a reasonable certainty of recoverability and are based on estimates that are subject to some variability. The impact of changes in estimated proved reserves is treated prospectively by depreciating the remaining book valuerecoverable amount of the assets overassets’ value which includes the variation in estimations of future expected production, affectingprices under the following year’s net income.
Suspended Exploratory Well Costs
We capitalize exploratory well costs when the well has found a sufficient quantitycurrent scenarios of reserves to justify its completion as a producing wellOPEC’s oil quota agreements and the Company is making sufficient progress assessingimpact resulting from changes on specifications issued by the reservesInternational Marine Organization agreement regarding marine pollution, Marpol, on crude and the economicfuels with high sulfur content. For additional information about this impairment charges,see Notes 14, 17 and operating viability of the project. Exploratory well costs that do not meet these criteria are charged as an expense. The facts and circumstances that support continued capitalization of suspended wells as of year-end 2014 are disclosed in Note 33—Differences between Colombian Governmental Entity accounting principles and U.S. GAAP,28 to our consolidated financial statements.
ImpairmentA reduction of Long-lived Assetsinternational crude oil prices could also result in a delay or a change in our capital expenditure plan, in particular delaying exploration and development activities, thereby delaying the development of reserves and affecting future cash flows. In order to maintain a profitable operation and preserve the cash flow of the Company at certain oil price levels, some of our producing fields may have to be closed or their operations temporarily suspended which would affect our production levels and expected revenues.
| 94 |
Changes in the Colombian Peso/U.S. dollar exchange rate could have an adverse effect on our financial condition and results of operations given the amount of U.S. dollar denominated debt held by the company and the fact that most of our revenues is derived from sales of products quoted in or with reference to U.S. dollars.
Most of our revenues are derived from sales of products quoted in or with reference to U.S. dollars. Therefore when the Colombian Peso depreciates against the U.S. dollar, our revenues converted into Colombian Pesos, increase. Conversely, when the Colombian Peso appreciates against the U.S. dollar, our revenues decrease.
On the other hand, imported goods, oil services and the debt, which is mainly denominated in U.S. dollars, become less expensive when the Colombian Peso appreciates against the U.S. dollar and more expensive when the Colombian Peso depreciates against the U.S. dollar.
As of December 31, 2016 our U.S. dollar-denominated total debt was US$15.2 billion, which we recognize in our consolidated financial statements at its amortized cost, which corresponds to the present value of cash flows, discounted at the effective interest rate. Out of this total, US$12 billion relate to Ecopetrol S.A., whose functional currency is the Colombian Peso. Therefore, when the Colombian Peso depreciates against the U.S. dollar, Ecopetrol S.A. is exposed to an exchange rate loss. In contrast, when the Colombian Peso appreciates against the U.S. dollar, Ecopetrol S.A.is exposed to an exchange rate gain. Some of the Group’s affiliates have the U.S. dollar as functional currency and are not exposed to a material exchange rate risk resulting from fluctuations in the Colombian Peso against the U.S. dollar. On the asset side, when the financial statements of the Group are consolidated, the exchange rate differential of the affiliates’ assets and liabilities whose functional currency is the U.S. dollar is recognized directly in the equity, as part of the other comprehensive income.
The Company adopted hedge accounting as part of its risk management strategy, using two types of natural hedges with its U.S. dollar debt as a financial instrument: i) cash flow hedge for exports of crude oil and ii) hedge of a net investment in a foreign operation. As a result of the implementation of both hedges, 88%, or $10.5 billion, of Ecopetrol S.A.’s debt in U.S. dollars was designated as a hedge. With the adoption of hedge accounting, the effect of the volatility of the foreign exchange rate on the hedged portion of the debt is recognized directly in equity, as part of other comprehensive income. The remaining portion of Ecopetrol S.A.’s U.S. dollar-denominated debt as well as the financial assets and liabilities denominated in foreign currency continues to be exposed to the fluctuation in the exchange rate.
The U.S. dollar/Colombian Peso exchange rate has fluctuated during the last several years. On average, the Colombian Peso depreciated 7.05% against the U.S. dollar in 2014, 37.28% in 2015 and 11.18% in 2016. Additionally, as of December 31, 2016, the Colombian Peso appreciated 4.72%, but depreciated as of December 31, 2015 and 2014, 31.64% and 24.17%, respectively, from year-end exchange in the previous year. In addition, given the political uncertainty surrounding the United States of America following the recent presidential election and the unpredictability in the economic performance of some developed countries, there is no clear view of how the U.S. dollar will behave in the medium to long-term. Given that markets are dealing with a great deal of uncertainty, it is expected that U.S. dollar movements will remain difficult to forecast, as the U.S. currency will respond immediately to any new opportunities for or challenges to the U.S. economy.
A future depreciation in the exchange rate of the Colombian Peso against the U.S. dollar may affect our financial results when converted into Colombian Pesos, given the portion of our U.S. dollar debt that is not designated as hedge instrument and the future debt we may acquire. Please see our sensitivity analysis on our results of operation to exchange rate fluctuations in the sectionFinancial Review—Effect of Taxes, Exchange Rate Variation, Inflation and the Price of Oil on our Results—Exchange Rate Variationand in Note 31.2 to our consolidated financial statements.
Increased competition from local and foreign oil companies may have a negative impact on our ability to gain access to additional crude oil and natural gas reserves in Colombia and abroad.
We must bid for exploration blocks offered by the ANH in Colombia and similar authorities in other countries, which means we compete under the same conditions as other domestic and foreign oil and gas companies, and receive no special treatment. Our ability to obtain access to potential fields also depends on our ability for evaluating and selecting potential opportunities and to adequately bid for such opportunities.
| 95 |
We are also exposed to international competition as a result of our international exploratory activities. Currently, we are exploring in Brazil and the US Gulf of Mexico, where we both partner and compete with other oil and gas companies operating in those locations.
If we are unable to adequately compete with local and foreign oil companies, or if we cannot enter into joint ventures with market players having high potential exploration projects, our exploration activities may be limited. This could reduce our market share and, in turn, adversely affect our financial condition.
If operational risks to which we are exposed in Colombia or overseas materialize, the health and safety of our workforce, the local community and the environment may be affected. In addition, we may suffer a disruption or shutdown of our operational activities.
Our exploration, production, refining and transportation activities in Colombia and in the foreign countries in which we operate are subject to industry-specific operating risks, some of which, despite our internal procedures and adherence to industry best practices, are beyond our control. Our operations may be curtailed, delayed or cancelled due to adverse or abnormal weather conditions, natural disasters, blockages in the communities in which we operate, equipment failures or accidents, oil or natural gas spills or leaks, shortages or delays in the availability or in the delivery of equipment, delays or cancellation of environmental licenses or other government authorizations or judicial decisions, fires, explosions, blow-outs, surface cratering, pipeline failures, theft and damage to our transportation infrastructure, sabotage, terrorist attacks and criminal activities.
Some of our operations in Colombia and abroad could be conducted in remote and uninhabited locations which involve health and safety risks that could affect our workforce. By our own Company policy and practices, as well as under Colombian law and international industrial safety regulations, we are required to have health and safety practices that minimize risks and health issues faced by our workforce. Failure to comply with health and safety regulations in the jurisdictions where we operate may lead to investigations by health officials that could result in lawsuits or fines.
We may be required to incur in additional costs and expenses to allocate funds to industrial safety and health compliance under Colombian law and international industrial safety regulations. Additionally, if any operational incident occurs that affects local communities and ethnic communities in nearby areas, we will need to incur in additional costs and expenses in order to return affected areas to normality and to compensate for any damages we may cause. These additional costs may have a negative impact on the profitability of the projects we may decide to undertake.
The occurrence of any of these operating risks could result in substantial losses or slowdowns to our operations, including injury to our employees, malfunction or destruction of property, equipment and infrastructure, clean-up responsibilities, third-party liability claims, government investigations and imposition of fines, withdrawal of environmental licenses and other government permits, suspension or shutdown of our activities and loss of revenue. The occurrence of any of these events may have a material adverse effect on our financial condition and results of operations.
Our involvement in deep-water drilling either as direct operator or in conjunction with our business partners involves risks and costs, which may be out of our control.
Our deep-water drilling activities present severe risks, such as the risk of spills, explosions on platforms and drilling operations, and natural disasters. The occurrence of any of these events or other incidents could result in personal injuries, loss of life, severe environmental damage with the resulting containment, clean-up and repair expenses, equipment damage and liability in civil and administrative proceedings. Heightened risks and costs associated with deep-water drilling may have a negative effect on our results of operations and financial condition and in our reputation.
| 96 |
See the sectionBusiness Overview—Exploration and Production—Exploration Activities—Exploration Activities Outside of Colombia for a summary of our current deep-water drilling activities.
As a result of the oil spill in the Macondo field operated by British Petroleum in the U.S. Gulf Coast in April 2010, significant concerns regarding the safety of deep-water drilling have been raised and, as a result, applicable regulations in various countries have changed. More stringent government regulation may result in increased costs and longer exploration and development timeframes for our deep-water drilling operations and consequently could adversely affect our results of operations and financial condition.
We are exposed to the credit, political and regulatory risks of our customers and any material nonpayment or nonperformance by our key customers could adversely affect our cash flow and results of operations.
Some of our customers may experience financial problems that could have a significant negative effect on their creditworthiness. Severe financial problems encountered by our customers could limit our ability to collect amounts owed to us, or to enforce the performance of obligations owed to us under contractual arrangements. In addition, many of our customers finance their activities through their cash flows from operations, short and long term debt or equity.
The combination of decreasing cash flows as a result of declines in commodity prices, a reduction in borrowing bases under reserve-based credit facilities and the lack of availability of debt or equity may result in a significant reduction of our customers’ liquidity and limit their ability to make payments or perform their obligations to us.
Furthermore, some of our customers may be highly leveraged and subject to their own operating expenses. Therefore, the risk we face in doing business with these customers may increase. Other customers may also be subject to regulatory changes, which could increase the risk of defaulting on their obligations to us. Financial problems experienced by our customers could result in the impairment of our assets, a decrease in our operating cash flows and may also reduce or curtail our customers’ future use of our products and services, which may have an adverse effect on our revenues and our ability to make payments under our existing debt obligations.
Our ability to access the credit and capital markets on favorable terms to obtain funding to refinance our debt maturities may be limited due to the deterioration of these markets, any change to our credit ratings and the authorizations we need before incurring any financial indebtedness.
In recent years, particularly during the last quarter of 2015 and the first quarter of 2016, due to significant decrease in oil prices, domestic and global financial markets and economic conditions have been weak and volatile and have contributed significantly to a substantial deterioration in the credit markets. A new financial crisis, remaining volatility in prices in the oil and gas sector, the spread in protectionist policies in the United Statess and Europe, the lack of consensus among OPEC members and further geopolitical disruptions in the Middle East which could involve developed countries, which in turn could worsen risk perception with respect to the emerging markets, or the occurrence of any of the risks described in the sectionRisk Review—Risk Factors—Risks Related to Colombia’s Political and Regional Environment could also make it more difficult for us and our subsidiaries to access international and local capital markets and finance our operations and potentially refinance our debt maturities on terms acceptable to us. These conditions, along with significant write-offs in the financial services sector and the re-pricing of credit risk, can make it difficult for us to obtain funding for our capital needs on favorable terms. Access to credit and capital markets is also dependent on our credit ratings, which are mainly determined by our financial and operational strength, oil and gas market conditions and the support that could be provided by the Colombian government. On January 18, 2016, our senior unsecured debt ratings were downgraded to Baa3 from Baa2 by Moody’s Investors Service, and Standard & Poor’s (S&P) and Fitch Ratings revised our outlook from stable to negative on January 29 and July 26, 2016, respectively. We cannot assure that our credit ratings will continue for any given period of time or that the ratings will not be further lowered or withdrawn. An assigned rating may be raised or lowered depending, among other things, on the respective rating agency’s assessment of our financial strength. In addition, a downgrade in the rating of the Republic of Colombia could also trigger a downgrade on our ratings as our rating is capped by the rating of the Republic of Colombia and the implicit support that can potentially be provided to the Company. On February 16, 2016, S&P revised the outlook of the Republic of Colombia to negative. While on March 14, 2017, Fitch Ratings upgraded our outlook from negative to stable following the upgrade from the Republic of Colombia from negative to stable also in March 2017, we cannot offer any assurance that our credit rating will continue.
| 97 |
As a result of these factors, we may be forced to revise the timing and scope of our capital projects as necessary to adapt to existing market and economic conditions, downgrades to our credit ratings or to access the financial markets on terms less favorable, therefore negatively affecting our results of operations and financial condition.
In addition, under applicable regulation, the Government, through the Ministry of Finance and Public Credit and the favorable opinion of the National Planning Department, must authorize all indebtedness of state-owned entities and government-controlled companies through a majority equity stake. Consequently, excluding our foreign subsidiaries or those subsidiaries in which we hold minority interest, most of our indebtedness must be previously authorized by the Colombian Ministry of Finance and Public Credit and the National Planning Department. As such, our indebtedness is subject to the Government’s time frames and policies, and we cannot guarantee that such authorizations would be granted in a timely fashion or granted at all.
We may be exposed to increases in interest rates, thereby increasing our financial costs.
We may incur debt locally and in the international capital markets and, consequently, may be affected by changes in prevailing interest rates. If market interest rates increase, our financing expenses may increase, which could have an adverse effect on our results of operations and financial condition. Interest rates in the United States may continue rising due to Federal Reserve’s monetary policy, which is looking for economic activity expansion at a moderate pace, labor market conditions strengthening and inflation stability to 2% over the medium term.
As of December 31, 2016, approximately 31%, or US$5.4 billion (COP$16.2 trillion), of our total indebtedness consisted of floating rate debt. If market interest rates rise, our financing expenses will increase, which could have an adverse effect on our results of operations and financial condition. In addition, as we refinance our existing debt in the coming years, the mix of our indebtedness may change, specifically as it relates to the ratio of fixed to floating interest rates, the ratio of short-term to long-term debt, and the currencies in which our debt is denominated in or indexed to. We cannot assure you that such changes will not result in increased financing expenses borne by us. Finally, as we incur new debt in the future to fund our capital projects, the prevailing interest rates and spreads at any specific time could be less favorable in terms of cost when compared to our previous financing transactions, which could adversely affect our financial condition and results of operations.
Our current and planned investments and exploration activities outside Colombia are exposed to political and economic risks.
As part of our strategic plan, we operate through business partners, subsidiaries or affiliates outside of Colombia. We currently have investments, joint ventures and subsidiaries incorporated in Peru, Brazil, Bermuda, Panama, the Cayman Islands, Switzerland, Germany, Spain, the United Kingdom and the United States, and we are analyzing investments in other countries. In connection with making investments, we are and will be subject to risks related to economic and political conditions and governmental economic actions. We cannot predict the positions of foreign governments relating to the oil and gas industry, land tenure, protection of private property, environmental standards, regulation or taxation; nor can we assure you that future governments will maintain policies favorable to foreign investment or repatriation of capital.
We began exploration activities outside Colombia in 2006 through our Brazilian subsidiary, Ecopetrol Óleo e Gás do Brasil Ltda. Our foreign subsidiaries have subsequently entered into a number of joint venture exploration agreements with regional and international oil companies to explore acreage in Brazil and the U.S. Gulf Coast. We have limited experience exploring outside Colombia. We may face new and unexpected risks involving environmental and other legal requirements beyond those we currently experience.
| 98 |
The results of operations and financial condition of our subsidiaries in these countries also may be adversely affected not only by risks associated with hydrocarbon exploration and production, but also by fluctuations in their local economies, political instability and government actions, including: the imposition of price controls, the imposition of restrictions on hydrocarbon exports, fluctuation of local currencies against the Colombian Peso, the nationalization of oil and gas reserves, increases in export and income tax rates for crude oil and oil products, and unilateral (governmental) institutional and contractual changes, including controls on investments and limitations on new projects.
Any of these conditions occurring could disrupt or terminate our operations, causing our development activities to be curtailed or terminated in these areas, or our production to decline; limit our ability to pursue new opportunities; affect the recoverability of our assets; or cause us to incur additional costs or delay the timeline of our projects.
Our future performance depends on the successful development and deployment of new technologies and the knowledge to apply and improve them.
Technology, knowledge and innovation are essential to our business, especially for improvements in the production and transportation of heavy crude oil, the exploitation of mature fields, and reductions in our operating cost. If we do not develop the right technology or do not obtain the expertise to operate new technology or to improve our processes, do not have access to, or do not deploy the knowledge necessary to apply and improve such technology effectively, the execution of our corporate goals, our profitability and our earnings may be adversely affected. In the case of our recovery program, we not only depend on the successful development and deployment of new technologies but also in the response of the reservoir to the application of this recovery technology.
Our performance could be negatively affected by a deficiency in leadership capacity and lack of key skilled employees.
As the oil and gas industry faces an increasing number of challenges, the ability to react quickly to these challenges has become a key factor in achieving efficiency, profitability and sustainability. Our ability to achieve these goals can be negatively affected by a deficiency in leadership capacity and a lack of key skilled employees that can execute our business strategy with creativity and determination.
Our operations may not be able to keep pace with the increasing domestic demand for natural gas.
According to the Colombian Energy and Gas Regulatory Commission (CREG) Resolution 089 of 2013, a supplier of natural gas must possess sufficient economically viable natural gas reserves before executing a natural gas delivery contract with a customer. In the long term, we may not be able to keep up with increasing local demand for natural gas if demand outpaces the rate of growth of our natural gas supply, especially because of the decline of our main fields. As a result, we may lose market share, which may negatively impact our financial condition and results of operations.
Additionally, we are currently party to a number of national gas supply contracts that have firm gas commitments. If we are unable to deliver natural gas to these clients as a result of cuts in operations, delays in the completion of projects relating to our production facilities or the acceleration of the decline in our gas production, among other reasons, we may be required to compensate our customers for our failure to supply natural gas. In 2016, we paid a penalty due to a cut in operations that occurred on October 12, 2016. This cut was caused by an operational failure in the ignition system of the Guajira B compression train, which caused an unavailability of gas supply, which in turn affected gas demand in a portion of the industrial and thermal sectors.
Delays in the start of new projects could result in penalties imposed on us by our clients. Although we did not pay penalties due to delays in the start of new projects in 2016, we cannot assure you that in the future we will not be subject to additional monetary fines which can in turn affect our financial condition and results of operations.
| 99 |
We depend on others for the construction and availability of natural gas transportation infrastructure for the transport of our gas, which may limit our ability to develop new or existing fields or lead to the deterioration of related assets and may not allow us to recover the cost of capital invested in natural gas discoveries.
We are prohibited by law from holding more than 25% of the equity of any natural gas transportation company. Therefore, there can be no assurance that the transportation infrastructure necessary to transport natural gas from the fields to distribution points and our customers will be built by third parties or that if built there will be sufficient capacity available to us for the exploitation of new natural gas discoveries or the development of existing fields. The failure to commercially exploit new or existing discoveries may result in impairment of the related assets and our inability to recover the capital expenditures invested to make these natural gas discoveries. As a result, we may be required to enter into agreements with natural gas transportation companies on terms that are not favorable to us.
For example, we have developed natural gas reserves in the Cusiana and Cupiagua fields, but transportation capacity to deliver gas from these fields is currently limited. Although there are projects under development that will eliminate this limitation in 2018, we can offer no assurance that they prove successful.
Our operations have and may continue to be affected by reactions of labor unions, social organizations and contractors to organizational changes and other management decisions.
Due to the volatility of the markets and the existing low oil price environment, we have and will continue to undertake measures to enhance operating cost efficiency. Such measures involve changes in cost structure, downsizing our staff (including direct and indirect employees), and budget cuts, among others. Unions, contractors and social organizations in the communities where we have operations have in the past and may continue to oppose such measures causing work stoppages or decreasing productivity, which could have an adverse effect on our operations and financial condition.
In addition, our current collective bargaining agreement has been in effect since 2014 and has a term of five years, expiring June 30, 2018. There will be no changes to these terms until 2018; therefore, we do not expect any adverse reactions from our labor unions relating to this matter. However, we cannot assure you we will not experience strikes or labor unrest in the future.
Our activities may be interrupted or affected by external factors, such as abnormal weather conditions and natural disasters.
We are exposed to several risks that may partially interrupt our activities. They include fires or explosions, natural disasters, criminal acts and acts of terror, malfunction of pipelines and emission of toxic substances.
Also, the effects of climate change could create impacts and losses in any part of our business operations, for instance, as the result of increase in the intensity of the “La Niña” and “El Niño” climate phenomena, causing floods and drought periods, increased temperature and rising sea levels.
The “El Niño” climate phenomenon is characterized by (i) a lack of rainfall, which limits the amount of water necessary for the development of various activities of the company, and (ii) increased temperatures, which could have a direct impact on our workers’ health given an increased occurrence of heat waves and the increased occurrence of epidemics and diseases. The “La Niña” climate phenomenon is characterized by increased rainfall, which can generate (i) landslides that threaten pipeline infrastructure and limit road transportation and (ii) flooding, which could limit operations in our production fields and facilities.
As a result, our activities could be significantly affected or even paralyzed. These risks could result in property damage, loss of revenue, loss of life, pollution and harm to the environment, among others. If any of these occur, we may be exposed to economic sanctions, damages, fines or penalties in addition to the costs required to repair or remediate the related damage. These costs, fines and penalties may adversely affect our financial condition and results of operations.
| 100 |
Our operations, including our activities in areas classified as indigenous reserves and Afro-Colombian lands, are subject to opposition from members of various communities.
We currently carry out and plan to carry out activities in areas classified by the Government as indigenous reserves (resguardos) and Afro-Colombian lands (territorios colectivos). In order to undertake these activities, we must first comply with the previous consultation process, set forth by Colombian law. These consultation processes are part of the administrative procedures for obtaining environmental licenses to start our projects, works or activities in areas belonging to ethnic communities. In addition, consultations can be seen as a potential instrument to involve communities in the decision of developing extracting industry and infrastructure projects in their territories. Generally, these consultation processes last between six months to one year depending on the community expectations, but may be significantly delayed if we cannot reach an agreement with the communities. We strive to be respectful of the Constitution and laws and the autonomy of indigenous and Afro-descendant communities, and we therefore do not enter their territories until we have reached an agreement with them.
Our activities are subject to opposition, including protests by various communities, and even in areas in which the previous consultation process does not apply. Recently, through popular consultation, some communities have voted against the development of extractive industry projects. Any such similar situation may affect our future projects.
In recent years, indigenous communities have been claiming their ancestral territories and requesting recognition on previously closed consultation processes. We may be exposed to operational restrictions as a result of the opposition of these communities.
No certainty can be given that we will be able to reach an agreement with the different communities opposed to our operations or that such communities will participate in consultation processes if available. We may be exposed to similar delays due to opposition from local communities in other countries where we carry out our activities.
We have made significant investments in acquisitions and we may not realize the expected value.
We have acquired interests in several companies in Colombia and abroad. See the sectionBusiness Overview—Our Corporate Structure. Obtaining the expected benefits of the acquisitions will depend, in part, on our ability to (i) obtain the expected results of operations and financial condition from these acquisitions, (ii) manage disparate operations and integrate distinct corporate cultures, (iii) manage our objectives as a corporate group, and (iv) institute our corporate governance rules as well as other factors beyond our control such as (v) the economic and regulatory environment in countries in which we have made acquisitions and (vi) crude oil prices. These efforts may not succeed. Our failure to successfully obtain the expected results from our acquisitions could adversely affect our financial condition and results of operations.
We might be required to provide additional financial support to Bioenergy and Reficar in spite of the recent completion of their projects
Reficar raised US$3.5 billion through a limited-recourse project financing in which Ecopetrol S.A. provided both construction support and debt service guarantee and was also the sponsor of the financing. If Reficar experiences any situation that might affect the fulfillment of its financial obligations, Ecopetrol S.A. must provide financial support to Reficar, through capitalizations, subordinated loans or even the assumption of the debt. These situations might be related, but are not limited to, labor productivity, failure of the upgraded refinery to reach the expected performance level in terms of the quality of products and/or volumes produced. See the sectionBusiness Overview—Refining and Petrochemicals—Refining—Reficar.
Also, Bioenergy’s ethanol plant, that was financed with COP$123 billion through bilateral loans for its agricultural component and COP$382 billion through an infrastructure leasing for its industrial component, may also meet situations such as social unrest, strikes or other operational difficulties that could negatively impact its operation and financial results. Although Ecopetrol is not the sponsor and has not provided financing guarantees to Bioenergy, some additional financial support might be needed to assure the stabilization of the project.
| 101 |
Any situation that could affect the operations of these subsidiaries may have a negative impact on their profitability as well as their ability to pay their debt, which in turn could adversely affect our financial condition and results of operations.
Ongoing Colombian Statecontrol entities investigations regarding our subsidiaries Reficar and Bioenergy could adversely affect us.
Ecopetrol is a corporation majority owned by the Colombian Government that administers public resources and Reficar and Bioenergy are subsidiaries of Ecopetrol. Ecopetrol’s employees have a statutory responsibility to ensure the proper use of public resources. Reficar and Bioenergy’s employees also have a duty for proper management of public resources. The conduct of Ecopetrol, Bioenergy and Reficar’s employees are generally subject to the control and supervision of the Colombian State control entities. See the sectionRisk Review—Legal Proceedings and Related Matters for additional information.
The investigations concerning Reficar and Bioenergy that are described in the sectionRisk Review—Legal Proceedings and Related Mattersremain ongoing. Because these actions are in their early stages, it is still not possible to estimate the duration, scope or results of these investigations or related inquiries and requests for information by Colombian State control entities. While we are cooperating fully with both cases, adverse developments in connection with these investigations, including any expansion of the scope of the investigations, could negatively impact us and could divert the efforts and attention of our management team from our ordinary business operations.
As described in the sectionRisk Review—Legal Proceedings and Related Matters, the Prosecutor’s Office is conducting a confidential investigation regarding Reficar’s expansion and modernization project. On April 27, 2017, the Prosecutor’s Office announced its intention to pursue charges against eight individuals, including five past officers of Reficar or Ecopetrol, for the alleged crimes of document forgery, illegal interest in the execution of agreements, misappropriation of public funds and unjust enrichment. The Prosecutor’s Office has not yet made public the factual basis for such charges, and accordingly we are not in a position to predict the outcome of the Prosecutor’s Office’s investigation or the disposition of any charges that the Prosecutor’s Office may bring.
In connection with this investigation or any other investigation carried out by any other authority, there can be no assurance that we will not be required to pay penalties, or incur in additional costs and expenses, and expose us or our employees to sanctions and lawsuits, any of which could adversely impact our reputation and, in turn, could have adverse effects on our financial condition and results of operations.SeeRisk Review- Legal and Regulatory Risk - We may incur losses and spend time and money defending pending lawsuits and arbitrations and responding to administrative investigations.
Our results may be affected by the performance of our business partners or their third-party service providers, as many of our operations are executed under joint venture agreements.
Many of our operations are performed through joint ventures with our business partners. Consequently, we depend on the performance of our business partners. The poor performance of any of them, especially in those projects in which we do not act as operator, could negatively impact oil and natural gas production, which in turn could have a negative impact on our results of operations and financial condition. We are exposed to the risk of not finding business partners with the appropriate skills and performance we require for our projects. We are also indirectly exposed to supply agreements and other third-party services contracted by our business partners acting as operators under joint venture agreements.
Our insurance policies do not cover all liabilities and may not be available for all risks.
Our insurance policies do not cover all liabilities, and insurance may not be available for all risks. There can be no assurance that incidents will not occur in the future, that insurance will adequately cover the entire scope or extent of our losses or that we will not be found liable in connection with claims arising from these and other events, which could adversely affect our financial condition and results of operations.
A failure in our information technology systems or cyber security attacks may adversely affect our financial results.
We depend on the reliability and security of our information technology systems to conduct certain exploration, development and production activities, process financial records and operating data, communication with our employees and business partners, and for many other activities related to our business. Our information technology systems may fail or have other significant shortcomings due to operational system flaws or employee misuse, tampering or manipulation. In addition, we may become the target of cyber-attacks or information security breaches that could result in the unauthorized release, gathering, monitoring, misuse, loss or destruction of proprietary and other information. Any of these occurrences could disrupt our business, result in potential liability or reputational damage or otherwise have an adverse effect on our financial results.
| 102 |
During 2016, our internal cyber security systems identified several cyber security attacks such as brute force login attacks designed to identify valid credential in IT infrastructure and seventeen ransomware attacks-only one of them with data loss (low level confidentiality) at Ecopetrol S.A.-Our platforms also identified and controlled certain malware events and SQL injection attacks.
Although we have not experienced any material losses relating to failure of our information technology systems or cyber incidents, there can be no assurance that we will not suffer such losses in the future.
We are exposed to behaviors incompatible with our ethics and compliance standards.
Given the large number of contracts that we are a party to in Colombia and abroad with local and foreign suppliers, the geographic distribution of our operations and the great variety of actors that we interact within the course of business, we are subject to the risk that our employees, contractors, or any person having relations with us may misappropriate our assets, manipulate our assets or information or engage in money laundering or the financing of terrorism, for such person’s personal or business advantage. Our systems for identifying and monitoring these risks may not be effective to fully mitigate them in all situations. Such acts may result in material financial losses or reputational harm to the Company.
The reliability and capacity of national power supply systems may affect or limit the continuity of our operations or limit growth.
Our average energy consumption in 2016 was 6,948 GWh/year, of which 65% was supplied through self-generation, and the remaining 35% through power grid. Our demand is 10.5% of the total energy demand in Colombia.
Several producing fields are connected to the national transmission system and depend on its expansion and reliability to keep steady production levels and to accommodate future growth. The national electricity market is volatile due to changes in hydrology and availability of fuels (natural gas, diesel etc.); and the grid expansion projects which are executed by power distribution contractors have experienced delays due to licenses and limited execution capability. To mitigate these risk the Ecopetrol Group decided to centralize the management of power sources and uses in order to optimize the energy availability, quality and cost, for the short, medium and long term. While the intention is to enhance system reliability by timely execution of electrical projects and to launch energy efficiency programs in all of our segments, we cannot offer any assurance that we will prove successful.
Rising water production levels may affect or constrain our crude oil production.
During impairment testing2016, we produced approximately 9.36 million barrels of water per day. Taking into account the nature of our reservoirs, the water production levels to be managed by the Company may increase in the future. In order to achieve our oil and gas production goals and to avoid any production restrictions going forward, we will need to secure the required capacity to manage water levels. Factors that may trigger a possible constraint in our crude oil production due to the rising water production levels are: (i) ineffective project management of the required facilities, (ii) the Company’s and its partners’ ability to timely obtain the environmental permits related to water management, (iii) social and community interactions that could affect the development and operation of these projects, and (iv) the availability of capital to execute the required projects.
| 5.1.2 | Risks Related to Colombia’s Political and Regional Environment |
This section discusses potential risks related to our extensive operations in Colombia.
| 103 |
The Colombian government could seize or expropriate Ecopetrol’s assets under certain circumstances.
Pursuant to Articles 58 and 59 of the Colombian constitution, the Government can exercise its eminent domain powers in respect of Ecopetrol’s assets in the event such action is deemed by the Government to be required in order to protect public interests. According to Law 388 of 1997, eminent domain powers may be exercised through: (i) an ordinary expropriation proceeding (expropiación ordinaria o judicial), or (ii) an administrative expropriation (expropiación administrativa). In all cases we would be entitled to a fair compensation for the expropriated assets. Also, as a general rule, compensation must be paid before the asset is effectively expropriated. However, the compensation may be lower than the price for which the expropriated asset could be sold in a free-market sale or the value of the asset as part of an ongoing business. The aforementioned Article 59 of the Colombian constitution establishes an expropriation for war reasons (expropiación en caso de guerra), which does not that compensation be paid before expropriation but can only be executed on a temporary basis.
Colombia has experienced internal security issues that have had or could have a negative effect on the Colombian economy and on us.
Colombia has experienced internal security issues, primarily due to the activities of guerrillas, paramilitary groups, drug cartels and criminal bands known asBacrim. From time to time, guerrillas target crude oil and multi-purpose pipelines, including the Oleoducto Transandino, Caño Limón-Coveñas and Oleoducto Bicentenario pipelines, and other related infrastructure disrupting our activities and those of our business partners. During 2016, the attacks against our pipeline infrastructure decreased by 35% in relation to 2015 (80 attacks in 2015 compared with 52 attacks in 2016), however they were strategically targeted and more severe. This situation especially affected the infrastructure located in Nariño, Arauca and Norte de Santander and the following pipelines: Caño Limón Coveñas and Transandino. During the first quarter of 2017, 29 attacks against the infrastructure of the Caño Limon – Coveñas system have taken place, impacting our operations in this pipeline and resulting in deferred crude oil production of 603 thousand barrels. On several occasions, guerilla attacks have resulted in unscheduled shutdowns of transportation systems in order to repair or replace sections of pipelines or production facilities that have been damaged and deferral of production in certain fields, as well as caused us to undertake environmental remediation. For the pipeline infrastructure managed by Ecopetrol S.A., the direct cost of repair pipeline infrastructure due to terrorist attacks in 2016 was approximately COP$41.7 billion (US$13.9 million, with a 3,000.71 Colombian Peso/U.S. GAAP,dollar exchange rate as of December 31, 2016). Also, our management must make reasonableproduction was impacted by approximately 3,215 bpd due to events related to attacks on our infrastructure that limited our production. Guerrilla groups and supportable assumptionsother illegal armed groups also attacked natural gas transportation infrastructure that have affected our natural gas production in the past. These activities, their possible escalation and estimatesthe effects associated with respectthem have had, and may have in the future, a negative impact on the Colombian economy or on us, which may affect our customers, employees, assets or the environment, with resulting containment, clean-up and repair expenses.
Likewise, theft of refined products and crude oil, resulting from security issues, may impact our results in the future. Theft of refined products, which reached a peak of approximately 7,270 bpd in 2002, was reduced to approximately 28.5 bpd in 2016. The theft of crude oil increased from approximately 646 bpd in 2015 to approximately 1,830 bpd in 2016.
Despite the peace agreement between the Colombian government and the FARC and the ongoing peace negotiation process with the National Liberation Army (the ELN), some illegal and terrorist activities of guerrilla groups or their members may continue
On November 30, 2016, the Colombian Congress approved a peace agreement between the Colombian government and the Revolutionary Armed Forces of Colombia, or FARC. Currently, the Colombian government is in the process of gradually integrating FARC members into civilian life.
On the other hand, the National Liberation Army, or ELN, an insurgency guerrilla group, has increased its actions against the Colombian security forces and the critical infrastructure of the Nation in recent months, which we believe is an attempt to show its presence and influence in some regions and put pressure on the ongoing peace negotiations which formally began in February 2016.
| 104 |
Despite the progress made with the FARC and the ongoing negotiations with the ELN, some guerrilla groups may continue their illegal and terrorist activities, resulting in a deterioration of Colombia’s national security and, consequently, negatively impacting our operating results.
There have been certain events in Colombia and abroad, which have resulted in political tensions between Colombia and some of its neighboring countries.
Diplomatic relations between Colombia and some of its neighboring countries, in particular Venezuela, have been tense in the past. Although relations with Venezuela have stabilized and improved with Colombia’s current administration, economic differences between Colombia and Venezuela, mainly due to Venezuela’s current public disorder and internal political tension, could affect our diplomatic relations, impact border cities and therefore have a negative impact on Colombia’s economy and general security situation.
Companies operating in Colombia, including us, are subject to the prevailing economic conditions and the investment climate in Colombia, which may be less stable than the prevailing economic conditions and investment climate in developed countries.
Market prices of securities issued by Colombian companies, including us, are subject to the prevailing economic conditions in Colombia. A large portion of our assets and operations are located in Colombia and most of our sales are currently derived from our crude oil and natural gas production and the production of our refineries located in Colombia. Accordingly, our financial condition and results of operations depend to a significant extent on macroeconomic and political conditions prevailing from time to time in Colombia and on the exchange rates between the Colombian Peso and the U.S. dollar.
If the perception of improved overall security in Colombia deteriorates or if the investment climate worsens, the Colombian economy may face lower growth rates than the ones posted recently, which could negatively affect our financial condition and results of operations. Furthermore, the market price of our shares and American Depositary Shares, or ADSs, may be adversely affected by changes in governmental policies, particularly those affecting economic growth, exchange rates, interest rates, inflation and taxes. The Government has changed monetary, fiscal, taxation, labor and other policies over time and has thus influenced the performance of the Colombian economy. We have no control over the extent and timing of government intervention and policies.
Colombian political and economic conditions have a direct impact on our business and may have a material adverse effect on us.
Colombia’s economic policies may have direct impact on our company as well as market conditions, the prices of securities and our ability to access national and international capital markets. Our financial condition and results of operations may be adversely affected by the following factors, among others, and the Government’s response to such factors: exchange rate movements; inflation; exchange control policies; price instability; interest rates; liquidity of domestic capital and lending markets; tax policy; regulatory policy for the oil and gas industry, including pricing policy; and other political, diplomatic, social and economic developments in or affecting Colombia.
Uncertainty over whether the Government will implement changes in policy or regulations that may affect any of the factors mentioned above or other factors (1)in the future may lead to economic uncertainty in Colombia and increase the volatility of the Colombian securities market and securities issued abroad by Colombian companies.
Developments and the perception of risk in other countries, especially emerging market countries, may adversely affect the market price of Colombian securities, including our ADSs.
Securities issued by Colombian companies may be affected by economic and market conditions in other countries, including other Latin American and emerging market countries. Although economic conditions in Latin American countries and in other emerging market countries may differ significantly from economic conditions in Colombia, investors’ reactions to developments in these other countries may have an adverse effect on the market value of reserves, (2) oil fields’ production profilessecurities of Colombian issuers and our ability to access capital markets.
| 105 |
Due to past financial crises in several emerging market countries (such as the Asian financial crisis of 1997, the Russian financial crisis of 1998 and the Argentine financial crisis of 2001), the world financial crisis of 2008 and the recent sovereign debt crises in certain European countries, investors may view investments in emerging markets with heightened caution. In the past, as a result of crises in other countries, flows of investments into Colombia have been reduced. Crises in other countries, especially in emerging market countries, may hamper investor enthusiasm for securities of Colombian issuers. If Latin America experiences a new slow-down or if the price for securities of Latin American issuers falls, the price for our ADSs could follow this trend and could be adversely affected as could our ability to access domestic or international capital markets.
The Ministry of Mines and Energy has not calculated or liquidated the corresponding Net Positions for Ecopetrol as refiner and/or importer and for each fuel (gasoline and motor fuel oil) to be recognized by the FEPC to Ecopetrol for the second half of 2016
Under current Colombian regulations, the Ministry of Mines and Energy is required to periodically (initially by quarters, now twice a year) calculate and liquidate each refiner and/or importer of fuel’s Participation Differential (i.e. this arise when the international parity price is lower than the reference price established by the Ministry of Mines and Energy), leading to a “Net Position”. However due to changes in law and the Ministry methodologies we have still not received the calculations or liquidations for the second semester of 2016.
We do not know and we cannot anticipate the terms and conditions that will be established by the Ministry of Mines and Energy for future liquidations. For more information regarding the FEPC, see the sectionBusiness Overview—Applicable Laws and Regulations—Regulation of Refining and Petrochemical Activities—Regulation Concerning Production and Prices.
New or higher taxes resulting from changes in tax regulations or the interpretation thereof in Colombia could adversely affect our results of operations and financial condition.
New tax laws and regulations, and uncertainties in the interpretation with respect to existing and future tax policies pose risks to us. In recent years, the Colombian Congress and tax authorities have imposed additional taxes such as theImpuesto sobre la Renta para la Equidad (“CREE surtax”), and enacted modifications to taxes related to financial transactions, income, value added tax (“VAT”), and taxes on net worth. In addition, in December 2016, pursuant to Law 1819, the Colombian Congress enacted a new tax reform, which became effective in 2017. For a description of taxes affecting our results of operations and financial condition in 2016, see the sectionFinancial Review—Effect of Taxes, Exchange Rate Variation, Inflation and the Price of Oil on Our Results—Taxes. Changes in tax-related laws and regulations, and interpretations thereof, can affect tax burdens by increasing tax rates and fees, creating new taxes, limiting tax deductions, and eliminating tax-based incentives and non-taxed income. In addition, tax authorities and tax courts may interpret tax regulations differently than we do, which could result in tax litigation and associated costs and penalties.
Until recently, for Colombian income tax purposes, dividends that were distributed from profits taxed at the corporate level were not taxed or subject to withholding tax at the shareholder level. However, beginning in 2017, dividends paid to non-resident shareholders are subject to a withholding tax. The withholding tax rates applicable to dividends paid to non-resident shareholders are: (i) a 5% dividend tax on dividends distributed from profits taxed at the corporate level; (ii) a 35% withholding tax rate on dividends distributed from profits not taxed at the corporate level; and (iii) an additional 5% dividend tax rate after applying the initial 35% withholding tax rate. Tax treaty rules might also apply on dividend distributions when a shareholder is a resident in a country that has executed a tax treaty with Colombia.
| 5.1.3 | Legal and Regulatory Risks |
This section discusses potential legal and regulatory risks to Ecopetrol, including the risk of having to comply with new laws and regulations.
| 106 |
Our operations are subject to extensive regulation.
The Colombian hydrocarbons industry is subject to extensive regulation and supervision by the Government and regulatory agencies in matters including the award of exploration and production blocks by the ANH, the imposition of refinedspecific drilling and chemical products, (3) future investments, taxes and costs, (4) futureexploration obligations, restrictions on production, price controls, capital expenditures and useful liferequired divestments. Existing regulation applies to virtually all aspects of our operations in Colombia and abroad. The commercialization activities of some of our products also face extensive regulation. Such regulation is subject to change by the applicable regulator affecting our ability to commercialize our products. See the sectionBusiness Overview—Applicable Laws and Regulations.
The terms and conditions of the agreements with the ANH under which we explore and produce crude oil and natural gas generally reflect negotiations with the ANH and other governmental authorities and may vary by fields, basins and hydrocarbons discovered.
We are required, as are all oil companies undertaking exploratory and production activities in Colombia, to pay a percentage of our production to the Government as royalties. The Colombian Congress has modified the royalty program for properties, (5) future pricescrude oil and (6) discount rates. Any changenatural gas production several times in the variables usedlast 20 years, as it has modified the regime regulating new contracts entered into with the Government. In the future, the Colombian Congress may once again amend royalty payment levels for new contracts and such changes could have an adverse effect on our future exploration and production in Colombia. See the sectionBusiness Overview—Applicable Laws and Regulations—Regulation of Exploration and Production Activities—Business Regulation—Royaltiesfor a description of the current royalty scheme.
Our operations in Colombia are subject to prepareextensive national, state and local environmental regulations. Environmental rules and regulations are applicable to our exploration, production, refining, transportation, supply and marketing activities, as well as the biofuels we produce. These regulations establish, among other things, quality standards for hydrocarbon products, air emissions and greenhouse gases, water discharges and waste disposal, soil remediation, water pollution and the general storage, handling, transportation and treatment of hydrocarbons in Colombia. Currently, all exploratory projects drilling in areas that do not yet have a license must undergo an environmental impact assessment and must receive an environmental license from the governmental agency responsible for awarding environmental licenses, the Environmental License National Agency or ANLA. Environmental authorities with jurisdiction over our activities routinely inspect our crude oil fields, refineries and other production sites, and they may decide to open investigations or sanction proceedings, which may result in the imposition of fines, restrictions on operations or other sanctions in connection with potential non-compliance with environmental laws.
We are also subject to control and monitoring by the regional autonomous corporations (CAR), which are regional environmental authorities that grant permits for the use and exploitation of natural resources, establish compensation measures for the use of these resources, and perform monitoring, control and sanctions function.
If we fail to comply with any of these national or regional environmental regulations or authorities, we could be subject to administrative and criminal penalties, including warnings, fines or closure orders of our facilities. Any such assumptionscriminal penalty would be imposed on the legal representatives of the Company, including any legal representative, director or worker who participated or failed to take action related to the activities that lead to environmental damage. See the sectionBusiness Overview—Applicable Laws and estimatesRegulations—Regulation of Exploration and Production Activities—Business Regulation—Environmental Licensing and Prior Consultation.
Environmental regulation has become more stringent in Colombia in recent years. As a result, our operating costs have increased in order to comply with these new technical environmental requirements as well as the need to strengthen our specialized team in charge of environmental compliance in project and operations. If environmental laws continue to impose additional costs on us, we may need to reduce our investments on strategic projects in order to allocate funds to environmental compliance. We are also exposed to delays in obtaining environmental licenses from ANLA, which can lead to cost overruns or to changes in our investment plans. These additional costs may have a significant effectnegative impact on the impairment tests.profitability of the projects we intend to undertake or may make them economically unattractive, in turn having a negative impact on our results of operations and financial condition.
Financial Derivative Instruments
| 107 |
We are subject to foreign environmental regulations for the exploratory activities conducted by us outside Colombia. Failure to comply with foreign environmental regulations may result in investigations by foreign regulators, which could lead to fines, warnings or temporary suspensions of our operations, which could have a negative impact on our financial condition and results of operations.
Under certain of our credit agreements, we are under an obligation to comply with international environmental standards established by our lenders or by multilateral institutions. Failure to comply with such environmental standards could result in an event of default under the relevant credit agreements that we, or our subsidiaries, have entered into, which would affect our financial condition. For instance, the credit facility executed by Reficar for the financing of its expansion and modernization project includes an obligation to comply with the U.S.-Exim Environmental Procedures and Guidelines and the Organization for Economic Co-operation and Development (OECD) Common Approaches on Environment and Officially Supported Export Credits, and a credit agreement executed by Ecopetrol S.A. to finance purchases of U.S. goods and services requires Ecopetrol S.A. to comply with the U.S.-Exim Environmental Procedures and Guidelines.
In addition, we may be subject to foreign health and safety and environmental regulations for our upstream activities conducted outside Colombia. Foreign health and safety regulations may be more severe than those established under Colombian law and, therefore, we may be required to make additional investments to comply with those regulations.
We may enter into hedging agreementsincur losses and spend time and money defending pending lawsuits and arbitrations and responding to reduce our exposure to the fluctuations of international crude oil and products prices. Under Colombian Government Entity GAAP, amounts paid and income received under hedging operations is recognized as financial income/expense. We are not permitted to enter into hedging contracts for speculative purposes according to the internal hedging guidelines issued by our Board of Directors.administrative investigations.
UnderWe are currently a party to several legal proceedings filed against us. We are also subject to labor-related lawsuits filed by current and former employees in connection with pension plans and retirement benefits. For example, as of December 31, 2016, Ecopetrol S.A. was a party to 2,774 legal proceedings relating to civil, administrative, environmental, tax, and labor claims filed against us of which 341 met the accounting threshold for an accrual provision. Additionally, Ecopetrol S.A.’s subsidiaries were a party to 1,136 legal proceedings relating to civil, administrative, environmental, tax, and labor claims filed against them of which 86 met the accounting threshold for an accrual provision. We allocate substantial amounts of money and time to defend against these claims, in which the claimants often seek substantial sums of money as well as other remedies. See Note 23– Accrued liabilities and provisions to our consolidated financial statements and see the sectionRisk Review—Legal Proceedings and Related Matters. In addition, in accordance with Colombian Government Entity GAAP,law, we are subject to surveillance and investigations by certain administrative control entities in Colombia, which are intended to determine whether public funds have been misappropriated or whether they have been used in compliance with applicable law. Such investigations may divert the attention of management and subject the Company to reputational risk and increase difficulties in retaining talent. See the sectionRisk Review—Legal Proceedings and Related Matters.
| 5.1.4 | Risks Related to our ADSs |
This section discusses potential risks associated with an investment in our estimatesAmerican Depository Shares (as opposed to our common shares) by investors outside Colombia.
Holders of our ADSs may encounter difficulties in protecting their interests.
Holders of our ADSs do not have the same voting rights as holders of our shares. As set forth in the deposit agreement, dated September 16, 2008, among Ecopetrol S.A., JP Morgan Chase Bank, N.A., as depositary, and all holders from time to time of our American Depositary Receipts (the “Deposit Agreement”), ADSs may instruct our current depositary, JP Morgan Chase Bank, N.A., to vote on shareholder matters prior to a shareholders’ meeting. Colombia law does not, however, require Ecopetrol to request proxies from existing shareholders. Thus, shareholders may not become aware of some matters in time to instruct the depositary to vote their shares.
| 108 |
The Deposit Agreement provides ADSs with the right to instruct the depositary to vote common shares separately. The viability of this contractual provision is unclear. This is because regulatory agencies have advanced inconsistent positions regarding whether a depository must vote common shares as a single block or may vote them separately. Going forward, the Colombian regulatory authorities may change their interpretation as to how the voting rights should be exercised by ADS holders, and such possible interpretation could adversely affect the value of hedges made throughout the year are based on the spot prices for the date the hedge was entered into,common shares and ADSs.
Our ADSs holders may be subject to restrictions on foreign investment in Colombia.
Colombia’s International Investment Statute (the set of rules and regulations which govern the foreign exchange market variations according toand the regulationtransactions thereto, which include Resolution 8 of 2000 and methodology establishedExternal Circular No. DCIN 83 issued by the SuperintendencyColombian Central Bank among others) regulates the manner in which non-Colombian residents can invest in Colombia and participate in the Colombian securities market. Among other requirements, Colombian law requires foreign investors to register certain foreign exchange transactions with the Colombian Central Bank and outlines the necessary procedures to authorize certain types of foreign investments. Colombian law requires that certain foreign exchange transactions, including international investment in foreign currency between Colombian residents and non-Colombian residents, must be made through authorized foreign exchange market intermediaries. Any income or expenses under our American Depositary Receipt, or ADR, program must be made through the foreign exchange market.
Investors acquiring our ADRs are not required to register with the Colombian Central Bank directly, as they will benefit from the registration to be obtained by the custodian for our common shares underlying the ADRs in Colombia. If investors in ADRs choose to surrender their ADRs and withdraw common shares, they must register their investment in the common shares as a portfolio investment through their local representative, which may be a brokerage firm, trust company or investment management companies supervised by the Superintendence of Finance –(Superintendencia Financiera de Colombia.
See Note 1—Economic entityLifting and principal accounting policies and practices, to the consolidated financial statements for more information.
Pension Plans and Other BenefitsProduction Costs
The determination of the expense, liability and adjustments in memorandum accounts relatingaggregate average production cost, on a Colombian Peso basis, has decreased to our pension and other retirement benefits requires us to use judgment in the determination of actuarial assumptions. These include the number of active employees with indefinite term contracts, retirees and their heirs, pension benefits, healthcare and education expenses, the number of temporary employees who will remain with us until retirement, voluntary retirement plans and pension bonuses.
These actuarial assumptions include estimates of future mortality, withdrawal, changes in compensation and discount rate to reflect the time value of money as well as the rate of return on pension bonds and other plan assets. These assumptions are reviewed annually and may differ materiallyCOP$20,993 per boe during 2016 from actual results. See Note 33—Differences between Colombian Governmental Entity accounting principles and U.S. GAAP,to the consolidated financial statements for a sensitivity analysis relating to certain of these assumptions.
Litigation and Tax Assessments
We are subject to claims for substantial amounts, regulatory and arbitration proceedings, tax assessments and other claims arising in the normal course of business. Management and legal counsel evaluate these situations based on their nature, the likelihood that they materialize, and the amounts involved, to decide on any changes to the amounts accrued and/or disclosed. This analysis, which may require considerable judgment, includes assessment of current legal proceedings brought against us and claims not yet initiated. In accordance with management’s evaluation and guidance provided by Colombian Government Entity GAAP, we created provisions to meet these costs when the liability is probable and reasonable estimates of the liability can be made.
Estimates are based on legal counsel’s evaluation of the cases and management’s judgment. For a discussion of differences between Colombian Government Entity GAAP and U.S. GAAP with respect to the accounting for litigation and tax contingencies see Note 33—Differences between Colombian Governmental Entity accounting principles and U.S. GAAP, to our consolidated financial statements.
Income taxes are accounted for under the assets and liability method. Deferred tax assets and liabilities are recognized for the future tax consequences attributable to differences between the carrying amounts of existing assets and liabilities in our financial statements and their respective tax bases. Deferred taxes on assets and liabilities are calculated based on statutory tax rates that we believe will be applied to our taxable incomeCOP$21,732 per boe during the years in which temporary differences between the carrying amounts are expected to be recovered. Changes to deferred tax assets and liabilities require technical judgments to interpret and apply complicated tax laws and regulations, and the valuation of deferred tax assets requires management to project future earnings from operations to determine whether the deferred tax assets will be realized. The determination of deferred tax assets and liabilities therefore involves considerable judgment and estimates that could vary materially from actual results.
Abandonment of Fields
Upon completion of our work at a production site, we are required by law to remove equipment and restore disturbed land or seabeds. To estimate the cost of abandoning fields, we include estimated plugging costs and the costs of abandonment of wells, dismantling of facilities and environmental recovery of the areas and wells. Changes resulting from new estimates of the liability for abandonment can occur as a result of changes in economic conditions. We accrue the estimated discounted costs of dismantling and removing these facilities at the time of installation of the assets. We use economic factors from different sources and develop our own internal estimates of future inflation rates and discount rates. The determination of obligation relating to abandonment of fields requires considerable judgment. We believe that the assumptions used in recording our asset retirement costs and obligations are reasonable based on our experience and market conditions. In the past there have not been significant disparities between estimates and asset retirement costs paid, although no assurance can be given that such costs will not exceed the related estimates in the future.
Differences between Colombian Government Entity GAAP and U.S. GAAP in the accounting for costs of abandoning fields are disclosed in Note 33—Differences between Colombian Governmental Entity accounting principles and U.S. GAAP, to our consolidated financial statements.
The following discussion is based on information contained in our audited consolidated financial statements and should be read in conjunction therewith.
The following table sets forth components of our income statement for the years ended December 31, 2014, 2013, and 2012.
| Income Statement (Pesos in millions) | For the Year ended December 31, | % Change | ||||||||||||||||||
| 2014 | 2013 | 2012 | 2014/2013 | 2013/2012 | ||||||||||||||||
| Revenue | 68,925,338 | 70,428,715 | 68,852,002 | (2 | )% | 2 | % | |||||||||||||
| Cost of Sales | 45,054,016 | 42,554,282 | 40,535,508 | 6 | % | 5 | % | |||||||||||||
| Gross Profit | 23,871,322 | 27,874,433 | 28,316,494 | (14 | )% | (2 | )% | |||||||||||||
| Operating Expenses | 7,269,333 | 6,039,703 | 4,973,590 | 20 | % | 21 | % | |||||||||||||
| Operating Income | 16,601,989 | 21,834,730 | 23,342,904 | (24 | )% | (6 | )% | |||||||||||||
| Non-operating income (expenses) | (1,181,242 | ) | 47,478 | (1,011,203 | ) | n.m | (105 | )% | ||||||||||||
| Income before income tax | 15,420,747 | 21,882,208 | 22,331,701 | (30 | )% | (2 | )% | |||||||||||||
| Income tax | 7,135,068 | 8,088,839 | 7,133,395 | (12 | )% | 13 | % | |||||||||||||
| Non-controlling interest | (775,409 | ) | (686,866 | ) | (419,359 | ) | 13 | % | 64 | % | ||||||||||
| Net Income | 7,510,270 | 13,106,503 | 14,778,947 | (43 | )% | (11 | )% | |||||||||||||
The following table sets forth our principal sources of third-party revenues by business segment for the years ended December 31, 2014, 2013, and 2012. An explanation of how we classify our operations into business segments is included in Section 4.5.2 below.
| 2014 | 2013 | 2012 | % change sales revenues | |||||||||||||||||||||||||||||||||||||||||
| Revenue by segment | Volume (barrels equivalent) | Average price US dollars/barrels | Sales revenues(Pesos in millions) | Volume (barrels equivalent) | Average price US dollars/barrels | Sales revenues (Pesos in millions) | Volume (barrels equivalent) | Average price US dollars/barrels | Sales revenues(Pesos in millions) | 2014-2013 | 2013-2012 | |||||||||||||||||||||||||||||||||
| Local Crude oil | 3,573,076 | 68.5 | 442,173 | 9,925,751 | 61.7 | 1,145,278 | 4,621,107 | 69.0 | 823,191 | (61.4 | ) | 39.1 | ||||||||||||||||||||||||||||||||
| Export Crude oil | 207,321,538 | 87.9 | 36,311,352 | 190,106,364 | 100.8 | 35,820,182 | 192,216,579 | 103.9 | 35,886,860 | 1.4 | (0.2 | ) | ||||||||||||||||||||||||||||||||
| Natural gas local | 36,071,793 | 22.4 | 1,615,471 | 27,277,037 | 24.6 | 1,527,691 | 24,702,562 | 25.0 | 1,382,396 | 5.7 | 10.5 | |||||||||||||||||||||||||||||||||
| Export natural gas | 6,706,483 | 31.1 | 423,461 | 9,976,846 | 33.6 | 586,687 | 9,924,841 | 34.5 | 563,411 | (27.8 | ) | 4.1 | ||||||||||||||||||||||||||||||||
| Other income(1) | 584,018 | - | - | 514,567 | - | - | 414,448 | 13.5 | 24.2 | |||||||||||||||||||||||||||||||||||
| Exploration and production sales | 253,672,890 | 39,376,475 | 237,285,998 | 39,594,405 | 231,465,089 | 39,070,306 | (0.6 | ) | 1.3 | |||||||||||||||||||||||||||||||||||
| Local refined products | 97,427,268 | 109.1 | 20,956,935 | 94,683,145 | 116.9 | 20,463,151 | 92,890,866 | 118.9 | 20,068,579 | 2.4 | 2.0 | |||||||||||||||||||||||||||||||||
| Export refined products | 30,034,448 | 91.1 | 5,431,618 | 41,997,257 | 99.1 | 7,854,089 | 41,880,845 | 107.9 | 8,016,228 | (30.8 | ) | (2.0 | ) | |||||||||||||||||||||||||||||||
| Other income (1) | - | 12,951 | - | - | 4,935 | - | (226,488 | ) | 162.4 | (102.2 | ) | |||||||||||||||||||||||||||||||||
| Refining and petrochemicals | 127,461,716 | 26,401,504 | 136,680,402 | 28,322,175 | 134,771,711 | 27,858,319 | (6.8 | ) | 1.7 | |||||||||||||||||||||||||||||||||||
| Transportation services | - | - | 3,147,359 | - | - | 2,512,135 | - | 1,923,377 | 25.3 | 30.6 | ||||||||||||||||||||||||||||||||||
| Transportation and logistics | - | - | 3,147,359 | 2,512,135 | 1,923,377 | 25.3 | 30.6 | |||||||||||||||||||||||||||||||||||||
| Total sales | 381,134,606 | - | 68,925,338 | 373,966,400 | 70,428,715 | 366,236,800 | 68,852,002 | (2.1 | ) | 2.3 | ||||||||||||||||||||||||||||||||||
Note: All intercompany sales transactions have been eliminated in full in order to show our sales to third parties.
In 2014, total revenues decreased by 2% as compared to 2013, mainly2015, primarily due to: 1) a 61.4% decrease in local crude oil revenues as volumes shifted toward export sales as a consequence of higher transport capacity for foreign sales, 2) the impact of an 8.6% reduction in the average price of Brent in 2014 as compared to 2013 and 3) a decrease in the export sales of refined products as a consequence of the shutdown of the Cartagena Refinery. This decrease was partially offset by: 1) an increase in crude export sales, 2), an increase in transportation revenues due to a larger volume of crude oil transported for third parties, 3) the start-up of operations at the Bicentenario Pipeline in November 2013 and 4) the depreciation of Peso against the U.S. dollar in 2014.
In 2013, total revenues increased by 2.3% as compared with 2012, mainly due to 1) a 1.3% increase in revenues from sales of crude and gas sales to third parties, which in turn resulted from higher local sales of crude oil and natural gas that more than offset a small decline in crude oil exports and lower average prices in U.S. dollars; (2) higher local sales of gasolines and medium distillates due to an increase in local demand for these products, (3) a 30.6% increase in the transportation segment sales to third parties due to the change in the business models of ODC and Ocensa from cost to profit centers and (4) the depreciation of Peso against the U.S. dollar in 2013.
Our cost of sales was principally affected by the factors described below. See Note 24—Cost of sales, to the consolidated financial statements for more detail.
Cost of sales in 2014 was Ps$45,054 billion, representing a Ps$2,500 billion (6%) increase as compared to 2013, primarily as a result of the following factors:
1) a Ps$1,762 billion, or 14,%, increase in the cost of input purchases mainly corresponding to naphtha for use as a crude diluent, as well as to increased purchases of refined product to substitute for the loss of production resulting from the shutdown of the Cartagena Refinery;
2) a Ps$893 billion increase in the amortization, depletion and depreciation of property, plant and equipment due to higher investments in the Castilla, Chichimene, Quifa and Rubiales fields and the Cupiagua gas plant;
3) a Ps$399 billion increase in costs related to (i) subsoil maintenance, (ii) increased maintenance activity in the Barrancabermeja Refinery and (iii) transportation-related maintenance costs (as a result of the start-up of operations at the Bicentenario Pipeline);
4) a Ps$207 billion increase resulting from the drawdown of crude oil inventories in 2014 as a result of lower production and an increase in purchases;
5) a Ps$1,438 billion decrease due to lower purchases of crude oil royalties from the ANH and other crude association and concession contracts in line with the 2% industry-wide decline in production in Colombia and lower purchased prices for purchased crude, which are indexed to our average export prices of both crude oil and gas.
Cost of sales in 2013 was Ps$42,554 billion, representing a Ps$ 2,018 billion (5%) increase as compared to 2012, primarily as a result of the following factors:
1) purchases of imported products increased by 25.6% in 2013 to Ps$11,862 billion as a result of higher volumes of naphtha purchased for use as a crude diluent, higher purchases of low sulphur gasoline and diesel for blending with our local production to meet local environmental regulations and higher purchases of petrochemicals and industrial products to fulfill our obligations under commercial agreements in the local market;
2) purchases of crude oil and gas from the ANH decreased by 9.7% in 2013 to Ps$7,808 billion as a result of lower purchase prices and a decrease in the volumes of gas purchased;
3) purchases of crude oil from third parties decreased by 19.4% in 2013 to Ps$5,806 billion as a result of lower transportation availability for Ecopetrol S.A. in the Ocensa pipeline;
4) the cost of services contracted with associations, which are pro rata expenses for our joint ventures, increased by 13% in 2013 to Ps$2,295 billion mainly due to our increased production. This increase resulted mainly from higher subsoil maintenance and water treatment costs due to increased sediment in crude oil;
5) maintenance costs increased by 16.6% to Ps$2,241 billion in 2013 due to the integrity program for the reliability of transport infrastructure, higher repair costs for pumping systems and higher costs to resume production after attacks on transportation infrastructure;
6) labor costs increased by 15.1% in 2013 to Ps$1,260 billion mainly due to a 10.2% increase in the number of employees and 3.7% increase in payroll expenses;
7) the cost of services contracted with third parties increased by 20.3% in 2013 to Ps$1,356 billion mainly as a result of an increase in leasing, professional, technological and surveillance services due to increased exploration activity;
Operating expenses and selling, general and administrative expenses amounted to Ps$7,269 billion in 2014, a Ps$1,230 billion (20%) increase as compared to 2013, mainly as a result of the following factors. See Note 25—Operating expenses,to the consolidated financial statements for more detail.
| · |
In 2013, our operating expenses increased by Ps$1,066 billion (21.4%) as compared to 2012, mainly as a result of the following factors:
| 80 |
Each of our operating segments bears the costs and expenses incurred for product use and marketing and each segment assumes administrative expenses and all non-operational transactions related to its activity. Discussion of operating expenses by business segment is included in the sectionFinancial Review – Operating Results — Segment Performance and Analysis.
Financial Income (expenses). Net financial income mainly includes exchange difference gains or losses and interest expense, yields and interest from our investments, and results from our hedging operations. Financial income amounted to a loss of Ps$671 billion in 2014 as compared to a gain of Ps$46 billion in 2013. The decrease was mainly due to: 1) higher interest expenses as a result of international bond offerings in May 2014 and September 2014 of US$2.0 billion and US$1.2 billion, respectively, 2) the negative impact resulting from the depreciation of the Peso against the U.S. dollar on our US dollar net liability position in the magnitude of Ps$275 billion and 3) Ps$127 billion in increased expenses relating to exchange rate hedging transactions entered into by Ocensa. For more detail see Note 26—Finance Income (expenses), net), to our consolidated financial statements.
Net financial income amounted to a profit of Ps$46 billion in 2013 as compared to a loss of Ps$168 billion in 2012. During 2013, our results reflected a net financial income due to the positive exchange rate gain resulting from the depreciation of the Peso against the U.S. dollar, partially offset by higher interest expenses due primarily to the local and international bond issuance of Ecopetrol S.A. in August and September 2013, respectively.
Pension expenses.Pension expenses include pension liabilities for health and education. This item increased by Ps$77 billion (16%) in 2014 as compared with 2013, mostly as a result of an increase in amortization of actuarial calculation and pensions as a consequence of a calculation update of the health reserve due to a 4.4% increase in the population covered by these services (retirees and their beneficiaries) and higher expected costs of health services per beneficiary. The latter was offset partially by a 4% decrease in the education provisions.
In 2013, pension expenses decreased by Ps$470 billion (50%) as compared to 2012, principally as a result of (1) a decrease in amortization of the actuarial calculation and pensions due to an actuarial calculation update of the health reserve which yielded a decrease of approximately 5.8% in the average health services costs per beneficiary and (2) a 0.2% decrease in the education reserve.
Other net income (expenses). Other net income includes recovery of expenses, other revenues and other recoveries. Other net expenses include legal and contribution expenses unrelated to income. Other net income decreased by Ps$435 billion in 2014 as compared to 2013, mainly due to extraordinary income recognized in 2013 due to certain asset divestments and recovery of expenses.
Other net income increased significantly in 2013 as compared to 2012, mainly due to an increase in recovery of certain expenses (owing mostly to our success in the Quifa field arbitration which resulted in other income of Ps.$ 215 billion) and the sale of certain fixed assets.
Income taxes amounted to Ps$ 7,135 billion in 2014, which is equivalent to an effective tax rate of 46.3%. In 2013, income taxes amounted to Ps$ 8,089 billion, which is equivalent to an effective tax rate of 36.9% and in 2012 amounted to Ps$ 7,133 billion in 2012, which is equivalent to an effective tax rate of 31.9%.
The increase in the effective tax rate from 2013 to 2014 was mainly due to a higher fiscal taxable income of Ecopetrol S.A. resulting from non-deductible foreign exchange gains related to our equity investments in subsidiary companies abroad. The increase in the effective tax rate from 2012 to 2013 was due to the new Equality Income Tax (Impuesto de Renta para la Equidad – CREE).
As a result of the foregoing,above-mentioned factors, our aggregate average production cost, on a Colombian Peso basis, decreased in 2014 our net income decreased by 43%2016 as compared with 2013. In 2013,to 2015. On a dollar basis, it decreased by 11% compared with 2012.to US$6.88 per boe in 2016 from US$7.92 per boe in 2015 also due to an 11.21% depreciation of the average exchange rate of the Colombian Peso against the U.S. dollar in 2016.
The aggregate average lifting cost, on a Colombian Peso basis, has decreased to COP$19,799 per boe during 2016 from COP$20,308 per boe during 2015, primarily due to:
| (i) | Reduction in number of services due to equipment failure, equipment reuse for electric submersible pump (ESP), less maintenance and |
| (ii) | Less tariffs on surface maintenance, reduction of costs by adjustment in integrity strategy, change in equipment inspection periods according to condition, decrease of tariffs of administrative items and prioritization of interventions. |
| (iii) | Decrease in energy tariffs, reduction of generation with liquid fuels (Diesel - Fuel Oil No.4), increase in efficiency through the entry of our own generation centers and increase in electrical reliability. |
| (iv) | Lower levels of chemical applied in the process of treatment of fluids, biological treatment insurance, reduction in production, transportation and disposal of oily waste and reduction of contracting, inspection and repair through renegotiation of contracts. |
| · | A decrease in production volumes in direct and associated contracts (excluding production tests and discovery of undeveloped fields), mainly due to smaller production in the Yarigui-Cantagallo and Pauto fields of direct operation and a decrease in production volumes from fields held as part of a partnership, such as Rubiales (first half of 2016), La Cira-Infantas and Chuchupa, which in turn was primarily due to the prioritization of investments for assets of fast cash return and our policy of profitable fields. |
In this section, including the tables below, our financial information is presented by segment: Exploration and Production, Refining and Petrochemicals and Transportation and Logistics. See the sectionBusiness Overview forAs a description of each segment.
Our reporting segments have changed since the first quarter of 2013, when we eliminated the marketing and supply segment. This change was made becauseresult of the marginal roleabove-mentioned factors, our aggregate average lifting cost, on a Colombian Peso basis, decreased in 2016 as compared to 2015. On a dollar basis, it decreased to US$6.49 per boe in 2016 from US$7.40 per boe in 2015 also due to an 11.21% depreciation of the segment with respectaverage exchange rate of the Colombian Peso against the U.S. dollar in 2016.
The difference between the aggregate average lifting cost and aggregate average production cost is that lifting costs do not include the costs related to consumption of hydrocarbons by us in our production process or that Ecopetrol sold to our core businessrefineries and the support role of marketing and supply to other segments, making it possible to attribute marketing and supply to the other segments. Therefore, the activities of marketing and supply have been reclassified to exploration and production, refining and transportation segments for the year 2012.natural gas liquid plants.
The following table presents oursets forth crude oil and natural gas average sales prices, the aggregate average lifting costs and net income by business segmentaggregate average unit production cost for the yearyears ended December 31, 2014, 2013,2016, 2015 and 2012:2014.
| Year ended December 31, | % change | |||||||||||||||||||
| Revenues by segment | 2014 | 2013 | 2012 | 2014-2013 | 2013-2012 | |||||||||||||||
| Exploration and Production | 44,756,059 | 49,979,203 | 52,651,123 | (10.5 | )% | (5.1 | )% | |||||||||||||
| Third parties | 39,376,475 | 39,594,405 | 39,070,306 | (0.6 | )% | 1.3 | % | |||||||||||||
| Local Crude oil | 442,173 | 1,145,278 | 823,191 | (61.4 | )% | 39.1 | % | |||||||||||||
| Export Crude oil | 36,311,352 | 35,820,182 | 35,886,860 | 1.4 | % | (0.2 | )% | |||||||||||||
| Natural gas local | 1,615,471 | 1,527,691 | 1,382,396 | 5.7 | % | 10.5 | % | |||||||||||||
| Export natural gas | 423,461 | 586,687 | 563,411 | (27.8 | )% | 4.1 | % | |||||||||||||
| Other income | 584,018 | 514,567 | 414,448 | 13.5 | % | 24.4 | % | |||||||||||||
| Inter-segment net operating revenues | 5,379,584 | 10,384,798 | 13,580,817 | (48.2 | )% | (23.5 | )% | |||||||||||||
| Refining and Petrochemicals | 27,110,257 | 29,235,679 | 29,512,101 | (7.3 | )% | (0.9 | )% | |||||||||||||
| Third parties | 26,401,504 | 28,322,175 | 27,858,319 | (6.8 | )% | 1.7 | % | |||||||||||||
| Local refined products | 20,956,935 | 20,463,151 | 20,068,579 | 2.4 | % | 2.0 | % | |||||||||||||
| Export refined products | 5,431,618 | 7,854,089 | 8,016,228 | (30.8 | )% | (2.0 | )% | |||||||||||||
| Other income | 12,951 | 4,935 | (226,488 | ) | 162.4 | % | (102.2 | )% | ||||||||||||
| Inter-segment net operating revenues | 708,753 | 913,504 | 1,653,782 | (22.4 | )% | (44.8 | )% | |||||||||||||
| Transportation and Logistics | 7,965,712 | 6,215,127 | 4,052,165 | 28.2 | % | 53.4 | % | |||||||||||||
| Third parties | 3,147,359 | 2,512,135 | 1,923,377 | 25.3 | % | 30.6 | % | |||||||||||||
| Inter-segment net operating revenues | 4,818,353 | 3,702,992 | 2,128,788 | 30.1 | % | 73.9 | % | |||||||||||||
| Eliminations of consolidations | (10,906,690 | ) | (15,001,294 | ) | (17,363,387 | ) | (27.3 | )% | (13.6 | )% | ||||||||||
| Total revenues | 68,925,338 | 70,428,715 | 68,852,002 | (2.1 | )% | 2.3 | % | |||||||||||||
| 81 |
Total income by segment includes exportsTable 48 – Crude Oil and local sales to third-partiesNatural Gas Average Prices and inter-segment sales. See the sectionFinancial Review–Operating Results–Consolidated Results of Operations–Total Revenues for prices and volumes to third parties.Costs
| Year ended December 31, | % change | |||||||||||||||||||
| Net income by segment | 2014 | 2013 | 2012 | 2014-2013 | 2013-2012 | |||||||||||||||
| Exploration and Production | 6,399,646 | 13,322,109 | 15,638,488 | (52.0 | )% | (14.8 | )% | |||||||||||||
| Refining and Petrochemicals | (897,918 | ) | (1,300,546 | ) | (919,600 | ) | (31.0 | )% | 41.4 | % | ||||||||||
| Transportation and Logistics | 1,766,498 | 1,124,264 | 186,259 | 57.1 | % | 503.6 | % | |||||||||||||
| Eliminations of consolidations | 242,044 | (39,325 | ) | (126,199 | ) | (715.5 | )% | (68.8 | )% | |||||||||||
| Net Income | 7,510,270 | 13,106,502 | 14,778,948 | (42.7 | )% | (11.3 | )% | |||||||||||||
| 2016 | 2015 | 2014 | ||||||||||
| Crude Oil Average Sales Price (U.S. dollars per barrel)(1) | 35.7 | 43.9 | 87.3 | |||||||||
| Crude Oil Average Sales Price (COP$ per barrel)(1) | 108,337 | 118,115 | 173,769 | |||||||||
| Natural Gas Average Sales Price (U.S. dollars per barrel equivalent) | 23.5 | 22.0 | 23.9 | |||||||||
| Natural Gas Average Sales Price (COP$ per barrel equivalent) | 71,893 | 60,120 | 47,912 | |||||||||
| Aggregate Average Unit Production Costs (U.S. dollars per boe)(2) | 6.88 | 7.92 | 12.43 | |||||||||
| Aggregate Average Unit Production Cost (COP$ per boe)(2) | 20,993 | 21,732 | 24,872 | |||||||||
| Aggregate Average Lifting Costs (U.S. dollars per boe)(3)(4)(5) | 6.49 | 7.40 | 11.29 | |||||||||
| Aggregate Average Lifting Costs (COP$ per boe)(3)(4) (5) | 19,799 | 20,308 | 22,581 | |||||||||
| (1) | Corresponds to our average sales price on a consolidated basis. |
| (2) | Unit production costs correspond to consolidated average costs on total production volumes net of royalties. Production costs do not include costs related to transport, commercialization and administrative expenses. |
| (3) | Lifting costs per barrel are calculated based on total production (excluding production tests and discovered undeveloped fields), which are net of royalties, and correspond to our lifting costs on a consolidated basis. |
| (4) | The cost indicator is calculated by using the cost of production (does not include costs related to hydrocarbons consumption by Ecopetrol in the production process, such as by our refineries and natural gas liquid plants) and dividing by the net produced volume (excluding royalties) as the denominator. |
| (5) | As a result of the evaluation of control over companies under IFRS, Ecopetrol does not consolidate Savia Perú and Equion. As a consequence, the information in the table above for this annual report (which has been prepared under IFRS) differs from the information we previously published for 2014 under Colombian Government Entity GAAP (where we did consolidate Savia Perú and Equion). |
In 2014, Exploration2016, ourtransportation and Productionlogistics segment sales were COP$10,648,776 million compared to COP$10,844,550 million in 2015. The 1.8% decrease in 2016 as compared with 2015 was mainly due to an 11.3% decrease in the volume of crude oil transported by our pipelines, which was primarily due to the production decrease at the national level, in spite of (i) the positive effect on our U.S. dollar-indexed transportation fees resulting from the devaluation of the Colombian Peso against the U.S. dollar and (ii) a 3.7% increase in the volume of refined products transported in the Galán-Sebastopol system to meet the demand for fuel in the country’s interior and the start-up of Reficar. Sales to third parties decreased in 2016 as compared to 2015 primarily due to the segment received income from the transportation services to Pacific Rubiales for its participation in the Rubiales field, and once the field returned to us in July 2016, these services were recognized as inter-segment sales.
In 2015, our transportation and logistics segment sales were Ps$44,756 billion,COP$10,844,550 million compared to Ps$49,979 billionCOP$8,343,934 million in 20132014. This 30% increase in 2015 as compared with 2014 was mainly due to higher volume of crude oil transported by the Ocensa, Caño Limón Coveñas and Ps$52,651 billionOleoducto Transandino pipelines due to the decline in 2012. In 2014,the number of attacks on our infrastructure and the positive effect on our U.S. dollar-indexed transportation fees resulting from the devaluation of the Colombian Peso against the U.S. dollar.
Thecost of sales for our transportation and logistics segment is mainly related to: (i) project costs associated with the maintenance of transportation networks and (ii) operating costs related to these systems, including the costs of labor, energy, fuels and lubricants and others.
The cost of sales amounted to COP$3,349,791 million in 2016 as compared to COP$3,744,422 million in 2015. The cost of sales for this segment decreased by 10.5% in 2016 as compared with 20132015 mainly asdue a result of:
The impact of the foregoing factors was partially offset by an increase in total revenuesmaterial processing costs needed for power generation in pumping stations and an increase in depreciation due to increaseda higher level of investments in the segment.
The cost of sales volumesamounted to COP$3,744,422 million in 2015 and COP$3,941,052 million in 2014. The cost of local natural gas to third partiessales for this segment decreased by 5% in 2015 as compared with 2014 mainly due to a decrease in costs associated with maintenance and operating supplies and materials. This decrease was partially offset by an increase in depreciation and amortization due to our increased demand from the domestic thermal power and industrial sectors and the increase of crude export sales.investments in this segment.
| 82 |
In 2013, Exploration and Production segment sales decreased2016,operating expenses before the impairment of non-current assets increased by 5%30.7% as compared with 2012 mainlyto 2015 due to a recovery of environmental provisions in 2015, no similar recoveries in 2016 and an increase in labor costs as a result of the following factors:implementation of the voluntary retirement plan. This increase was partially offset by lower wealth and industry taxes.
In 2015, operating expenses before the impairment of non-current assets decreased by 16.2% as compared to 2014 due to decreased expenses related to social investment and security agreements, and more stable operations due to a decrease in repairs of our transportation systems. This decrease was partially offset by (i) the Colombian wealth tax implemented in 2015 and, (ii) increased depreciation and amortization.
Theimpairment of non-current assets recognized in the segment in 2016 which totaled COP$41,062 million recovery in 2016 as compared to COP$81,388 million expense in 2015, decreased by 150.5% as compared to 2015 mainly by the incorporation, in the assessment of the recovery amount of this segment’s assets, of flows associated to the San Fernando - Apiay system project that affects the recoverable amount of the Llanos transportation line, partially offset by an increase in impairment of assets related to the southern transportation line. (See Note 17.3 to our consolidated financial statements for more detail).
The increased impairment charges for non-current assets in 2015, which totaled COP$81,388 million as compared to a COP$1,121 million recovery of impairment in 2014 was primarily due to Colombia’s hydrocarbon production curves, based on the crude oil price environment and pipeline transportation rates (see Note 17.3 to our consolidated financial statements).
The segment recorded net income attributable to owners of Ecopetrol of COP$2,960,449 million in 2016 as compared to net income of COP$2,819,759 million in 2015 and COP$1,758,777 million in 2014.
CostIn 2016, therefining and petrochemical segment sales were COP$24,823,714 million compared to COP$23,245,676 million in 2015. In 2016, sales of refined products and petrochemicals increased by 6.8% as compared with 2015, mainly due to an increase in the volume of domestic and export sales affectingmainly in mid-distillates due to the startup of operations at Reficar. This increase was partially offset by a decrease or our average products basket price due to the decrease in the international price of crude oil.
In 2015, the refining and petrochemical segment sales were COP$23,245,676 million compared to COP$27,172,300 million in 2014. In 2015, sales of refined products and petrochemicals decreased by 14.5% as compared with 2014, mainly due to: (i) a decrease in the international price of fuels and (ii) a decrease in foreign sales volumes of fuel oil due to the low water level in the Rio Magdalena. This decrease was partially offset by (i) an increase in the volume of domestic sales due to increased local demand for fuel resulting from an increased number of vehicles and the closure of Colombia’s border with Venezuela that led to higher diesel demand and (ii) an increase in intercompany sales due to higher volumes of diluent sold to our exploration and production segment.
Thecost of sales for our refined products and petrochemicals segment is mainly related to: 1)to the purchase of crude oil and natural gas for our refineries, imported products to substitute for the loss of production due to the closure of Reficar as the new refinery was being built for most of 2014 and 2015, feedstock transportation services, services contracted for maintenance of the refinery and the amortization and depletiondepreciation of our production assets, 2) contracted servicesrefining assets. Cost of sales amounted COP$22,843,987 million in association contracts2016, compared to COP$20,758,808 million in 2015 and 3) the costs related to maintenance, operational services, projects and labor of this segment. In addition, this segment’s costs are impacted by imported naphtha and by transportation services.COP$25,537,228 million in 2014.
In 2014,2016, the cost of sales for this segment increased by 5.4%10% as compared with 2013,2015, principally due to the net effect of:operation of Reficar’s units in 2016 which led to (i) an increase in crude oil purchases through import and inter-segment transactions as Reficar required a special raw material or ‘diet’ during the stabilization and performance testing period which increased production cost, (ii) an increase in the depreciation of Reficar’s units (iii) inventory consumption that had been in stock in December 2015, and (iv) higher costs for services contracted, materials of process, maintenance and electrical power. This increase was partially offset by lower imports of products and the excellent operational performance of the Barrancabermeja Refinery.
In 2013,2015, the cost of sales for this segment decreased by 2.8%18.7% as compared with 2012,2014, principally due to lower raw material costs, which corresponded to the decrease in international oil prices and lower operating costs as a result of cost optimization at the Barrancabermeja Refinery. This decrease was partially offset by higher imports of gasoline due to increased local demand for fuel resulting from an increased number of vehicles and the closure of Colombia’s border with Venezuela.
In 2016,operating expenses before the impairment of non-current assets increased by 27.3% as compared to 2015, due to an increase in labor expenses related to our voluntary retirement plan in 2016 and other expenses related to the start-up of operations at Reficar.
In 2015, operating expenses before the impairment of non-current assets increased by 23% as compared to 2014, due to higher levels of investment for the Reficar modernization project, the Colombian wealth tax implemented in 2015 and the increase in other expenses related to the start-up of operations at Reficar.
Theimpairment of non-current assets recognized in the segment in 2016, which totaled COP$773,361 million in 2016 as compared to COP$3,278,993 million in 2015, decreased by 76.4% as compared to 2015. The 2016 scenario incorporated the refining margins that include the effect of Marpol in 2016 compared to 2015, partially offset by the effect of adjustment of operational variables based on that observed during Reficar’s stabilization period and new ethanol prices on Bioenergy’s impairment (see Note 17.2 to our consolidated financial statements). As mentioned earlier, the refining segment is highly sensitive to changes in product prices and raw materials in the international market, the discount rate given the leveraging, the refining margins, changes in environmental regulations and cost structure and the level of capital expenditures.
The increased impairment charges for non-current assets in 2015, which totaled COP$3,278,993 million in 2015 as compared to COP$1,340,086 million in 2014 was recorded by the Cartagena Refinery due to the current low oil price environment, which resulted in a reduction in expected refining margins in the coming years, and an increase in market and country risk, which has been reflected in the discount rate (see Note 17.2 to our consolidated financial statements).
The gross margin in 2016 was 8%, compared to 10.7% in 2015. The decrease in the gross margin was explained principally by decreased operational activity during the period of stabilization and testing of Reficar.
The gross margin in 2015 was 10.7%, compared to 6% in 2014. The increase in the gross margin was explained principally by decrease in the oil price (feedstock) compared to the decrease in fuel prices (output).
The refining and petrochemicals segment recorded net loss attributable to owners of Ecopetrol of COP$1,823,020 million in 2016 as compared to a net loss attributable to owners of Ecopetrol of COP$4,016,050 million in 2015 and COP$1,627,705 million in 2014.
| 4.6 | Liquidity and Capital Resources |
Our principal sources of liquidity in 2016 were cash flows from our operations amounting to COP$14,232,940 million, and cash flows from financing activities, mainly from the proceeds of our net movement of indebtedness, which totaled COP$ 1,444,723 million.
Our principal uses of cash in 2016 were (i) COP$5,837,477 million in capital expenditures, which included investments in property, plant and equipment and natural and environmental resources and (ii) COP$5,446,507 in investment of liquidity surpluses in portfolios, (iii) dividend payments for the fiscal year 2015 amounting to COP$1,712,298 million, which included the last installment of dividends to the majority shareholder relating to fiscal year 2014 for COP$690,177 million and the payment of dividends to non-controlling interest in 2016 for COP$1,022,121 million.
On January 29, 2016, we entered into an international credit agreement for an aggregate amount of US$175 million with The Bank of Tokyo-Mitsubishi UFJ, Ltd. The credit agreement has a term of five years, repayable with a 2.5 year grace period on principal and interest, payable semi-annually at a rate of Libor plus 145 basis points.
| 84 |
On February 23, 2016, we entered into a bilateral commercial loan agreement with Bancolombia S.A. for COP$990 billion (approximately US$330 million at the representative exchange rate of as of December 31, 2016). This loan agreement had a term of 8 years and a 2-year grace period on principal, with interest payable semiannually at a rate of DTF TA plus 560 basis points. Ecopetrol prepaid this loan in full with excess liquidity in October 2016.
On May 16, 2016, we entered into a bilateral commercial loan agreement with Export Development Canada, an export promotion agency of the Canadian Government for US$ 300 million. This loan agreement has a term of five years, with interest payable semi-annually at rate of six-month Libor + 140 basis points.
On June, 2016, we issued US$500 million (COP$1,500 billion according to the COP$/US$ exchange rate as of December 31, 2016) aggregate principal amount of our SEC-registered 5.875% notes due 2023. The notes were listed on the NYSE.
| 4.6.1 | Review of Cash Flows |
Cash from operating activities
Net cash provided by operating activities increased by 21.9% in 2016 as compared to 2015, mainly as a result of (i) lower working capital needs mainly due to the higher oil prices observed at the end of 2016 versus the end of 2015, (ii) a 4% increase in our operational income before depreciation, depletion and amortization (DD&A) and impairment of non-current assets resulting from a decrease in our costs and operational expenses (before DD&A and impairment) due to our savings generated by the transformation plan. This increase was partially offset by (i) the decrease in international prices of crude oil during 2016, and (ii) an increase in income tax paid by the transportation and logistics segment due to the better results in 2015.
Net cash provided by operating activities decreased by 35.6% in 2015 as compared to 2014, mainly as a result of: (i) a 33.2% decrease in our gross income resulting from the decrease in international prices of crude oil during 2015 and (ii) higher operating expenses due to the Colombian wealth tax implemented and paid in 2015. This decrease was partially offset by a decrease in income tax paid due to the decrease in our income before tax for the year and lower working capital needs due to a decrease in variable costsinventories, trade receivables and accounts payable.
Cash used in investing activities
In 2016, net cash used in investing activities decreased by 26.8% as compared to 2015, mainly as a result of: (i) a 62.4% decreased investments in capital expenditures due to the effect of decreasing oil prices and the end of the Reficar modernization project, and (ii) additional cash proceeds from the sale of our investments in Empresa de Energía de Bogotá and Interconexion Electrica S.A, which totaled COP$966,715 million in the aggregate. This decrease was partially offset by increased investments of our excess liquidity in our investment portfolios, which in turn resulted from the savings we achieved and the recovery of the price of oil during the second half of 2016.
In 2015, net cash used in investing activities decreased by 2.4% as compared to 2014, mainly as a result of: (i) a decrease in the amount of dividends we received from associates and joint ventures companies (ii) slightly larger investments in capital expenditures, mainly relating to the Reficar modernization project and our drilling campaigns, primarily in the Castilla, Chichimene and Rubiales fields, and (iii) a lower net cash contribution from purchase and sale of fixed income investments. This decrease was partially offset by cash proceeds from the sale of our investment in Empresa de Energia de Bogotá, which totaled COP$613,998 million.
| 85 |
Cash used in financing activities
Net cash used in financing activities increased by 98.5% in 2016, as compared to 2015, due to a lower volumedecrease in cash from borrowings of COP$5,151,937 million which was partially offset by a decrease in dividends payments of COP$3,781,099 million in 2016 as compared to 2015.
Net cash used in financing activities decreased by 81% in 2015, as compared to 2014, due to a COP$7,023,166 million decrease in dividend payments, which was partially offset by an increase in borrowing and interest payments of COP$1,069,146 million in 2015 as compared to 2014, which in turn was due to the US$1,925 million international loan we entered into in February 2015 and the US$1,500 million international bond we issued in June 2015.
| 4.6.2 | Capital Expenditures |
Our consolidated capital expenditures in 2016, 2015 and 2014 were COP$5.8 trillion, COP$15.5 trillion and COP$15.6 trillion, respectively. These investments were distributed by business segment on average, for the past three years as follows: 61.2% for the exploration and production segment, 22.1% for refining and petrochemicals and 16.7% for the transportation and logistics segment. See Note 34.1.2 to our consolidated financial statements for more detail about capital expenditures by segment.
Our investment plan approved for 2017 totals US$3,500 million. The investments will be distributed as follows: 81% for exploration and production, 10% for refining and petrochemicals, 8% for transportation and logistics, and 1% for other investments.
The resources required for the investment plan will be funded through internal cash generation with no need to raise additional net financing.
| 4.6.3 | Dividends |
In 2016, we paid the last installment of dividends relating to our net income to the Nation of COP$690,177 million and our transportation and logistics’ subsidiaries paid dividends to their non-controlling shareholder for COP$1,022,121 million. Given the net loss we reported in 2015, our shareholders at the ordinary general shareholder’s meeting did not approve distribution of dividends for 2015.
On March 31, 2017, our shareholders at the ordinary general shareholders’ meeting approved dividends for the fiscal year ended December 31, 2016 amounting to COP$945,684 million, or COP$23 per share, based on the number of outstanding shares as of December 31, 2016. The dividend was paid in one installment on April 28, 2017.
| 4.7 | Summary of Differences between Internal Reporting (Colombian IFRS and IFRS) |
We prepare our interim and annual statutory financial information in accordance with our internal reporting policies, which follow Colombian IFRS and differ in certain significant aspects from IFRS. The following table sets forth our consolidated net income and equity for years ended December 31, 2016, 2015 and 2014, in accordance with Colombian IFRS and IFRS:
Table 49 – Consolidated Net Income and Equity
| For the year ended December 31, | ||||||||||||||||||||
| (Colombian Pesos in millions) | % Change | |||||||||||||||||||
| 2016 | 2015 | 2014 | 2016/2015 | 2015/2014 | ||||||||||||||||
| Net income attributable to owners of Ecopetrol (IFRS) | 2,447,881 | (7,193,859 | ) | 5,046,517 | (134.0 | ) | (242.6 | ) | ||||||||||||
| Cash flow hedge for future company exports | (494,604 | ) | 2,140,553 | – | (123.1 | ) | N/A | |||||||||||||
| Exchange rate effects on tax bases – Deferred tax | (388,568 | ) | 1,065,580 | 678,983 | (136.5 | ) | 56.9 | |||||||||||||
| Net income Attributable to owners of Ecopetrol (Colombian IFRS) | 1,564,709 | (3,987,726 | ) | 5,725,500 | (139.2 | ) | (169.6 | ) | ||||||||||||
| Net Equity (IFRS) | 43,560,501 | 43,100,963 | 48,534,228 | 1.1 | (11.2 | ) | ||||||||||||||
| Cash flow hedge for future company exports | (39,803 | ) | (74,259 | ) | – | (46.4 | ) | N/A | ||||||||||||
| Exchange rate effects on tax bases – Deferred tax | 1,799,020 | 2,205,064 | 998,440 | (18.4 | ) | 120.9 | ||||||||||||||
| Net Equity (Colombian IFRS) | 45,319,718 | 45,231,768 | 49,532,668 | 0.2 | (8.7 | ) | ||||||||||||||
| 86 |
As noted above, certain differences exist between our net income and equity as determined in accordance with our internal reporting policies, which follow Colombian IFRS, which are used for management reporting purposes, as presented in the business segment information, and our net income and equity as determined under IFRS, as presented in our consolidated financial statements.
The primary differences between Colombian IFRS and IFRS as they apply to our results of operations are summarized below:
| · | Cash flow hedge for future company exports. In September 2015, in order to hedge the effect of exchange rate volatility on Ecopetrol’s foreign currency debt, Ecopetrol’s Board of Directors approved a cash flow hedge for future crude oil exports. According to IAS 39 – Financial Instruments, Ecopetrol implemented this hedge beginning on October 1, 2015, the date on which it formally completed the related hedging documentation. |
Under Colombian IFRS, theContaduria General de la Nación (CGN for its acronym in Spanish) issued Resolution 509, which allows companies to apply hedge accounting for non-derivative financial instruments from any date within the transition period or the first period of application of International Accounting Standards in Colombia, even if such company has not yet formally documented the hedging relationship, the objective or the risk management strategy. Under these rules, Ecopetrol applied cash flow hedge accounting from January 1, 2015 in its financial statements under Colombian IFRS.
As a result of this accounting policy differences, for the year ended December 31, 2016, our net income as reported under IFRS was COP$494,604 million higher than our net income as reported under Colombian IFRS.
| · | Exchange rate effects on tax bases – Deferred tax. According to IAS 12.41, companies with a U.S. dollar functional currency and profit or tax loss in Colombian Pesos are required to recognize deferred taxes attributable to the difference between the carrying amounts of non-monetary assets in their financial statements and their respective tax bases converted from Colombian Pesos to U.S. dollars using the exchange rate on the closing date. The effect of the temporary difference is charged to profit and losses without a cash outflow expected in the future. Under local accounting principles, the result attributable to the aforementioned difference in accounting policies does not generate deferred taxes at December 31, 2016. |
Ecopetrol’s functional currency is the Colombian Peso and it consolidates some subsidiaries whose functional currency is the U.S. dollar but who settled their taxes in Colombian Pesos. As a result of the application of paragraph 41 – IAS 12, such subsidiaries are required to calculate deferred taxes under IFRS.
As a result of this accounting policy difference, for the year ended December 31, 2016, our net income attributable to owners of Ecopetrol as reported under IFRS was COP$388,568 million higher than our net income attributable to owners of Ecopetrol as reported under Colombian IFRS.
| 87 |
The application of IAS12.41 also generated adjustments to our goodwill and investments in companies impairments of COP$86,781 million in 2016 and COP$418,872 million in 2015 in connection with our purchase of subsidiaries whose functional currency is the U.S. dollar as well as adjustments to our revenue from the equity method of COP$71,056 million in 2016 and COP$81,808 million in 2015 in connection with our associates and joint ventures whose functional currency is the U.S. dollar.
As a result of these accounting policy differences described above, for the year ended December 31, 2016, we reported net income attributable to the owners of Ecopetrol under IFRS of COP$2,447,881 million as opposed to a net income attributable to the owners of Ecopetrol of COP$1,564,709 million reported under Colombian IFRS for the same period. For the year ended December 31, 2015, these same accounting differences led us to report a net loss under IFRS of COP$7,193,859 million as opposed to a net loss of a COP$3,987,726 million reported under Colombian IFRS for the same period.
| 4.8 | Financial Indebtedness and Other Contractual Obligations |
As of December 31, 2016, we had outstanding consolidated indebtedness of COP$52.2 trillion, which corresponded primarily to the following long-term transactions:
Table 50 – Consolidated Financial Indebtedness
| Company | Type | Initial Date | Original Amount | Maturity | Interest Rate | Amortization | ||||||||
| Ecopetrol S.A. | Bonds | July 23, 2009 | US$1,500 million | July 23, 2019 | 7.625 | % | Bullet | |||||||
| September 18, 2013 | US$350 million | September 18, 2018 | 4.250 | % | Bullet | |||||||||
| September 18, 2013 | US$1,300 million | September 18, 2023 | 5.875 | % | Bullet | |||||||||
| September 18, 2013 | US$850 million | September 18, 2043 | 7.375 | % | Bullet | |||||||||
| May 28, 2014 | US$2,000 million | May 28, 2045 | 5.875 | % | Bullet | |||||||||
| September 16, 2014 | US$1,200 million | January 16, 2025 | 4.125 | % | Bullet | |||||||||
| June 26, 2015 | US$1,500 million | June 26, 2026 | 5.375 | % | Bullet | |||||||||
| June 15, 2016 | US$500 million* | September 18, 2023 | 5.875 | % | Bullet | |||||||||
| December 1, 2010 | COP$138,700 million | December 1, 2017 | Floating | Bullet | ||||||||||
| December 1, 2010 | COP$479,900 million | December 1, 2020 | Floating | Bullet | ||||||||||
| December 1, 2010 | COP$284,300 million | December 1, 2040 | Floating | Bullet | ||||||||||
| August 27, 2013 | COP$120,950 million | August 27, 2018 | Floating | Bullet | ||||||||||
| August 27, 2013 | COP$168,600 million | August 27, 2023 | Floating | Bullet | ||||||||||
| August 27, 2013 | COP$347,500 million | August 27, 2028 | Floating | Bullet | ||||||||||
| August 27, 2013 | COP$262,950 million | August 27, 2043 | Floating | Bullet | ||||||||||
| Bank Loans* | May 27, 2013 | COP$1,839 billion** | May 24, 2025 | Floating | Semi-annual | |||||||||
| February 12, 2015 | US$1,925 million | February 12, 2020 | Floating | Bullet | ||||||||||
| January 29, 2016 | US$175 million | February 11, 2021 | Floating | Semi-annual | ||||||||||
| ECAs | March 22, 2013 | US$245 million | July 25, 2023 | Floating | Semi-annual | |||||||||
| March 22, 2013 | US$151 million | July 6, 2019 | Floating | Semi-annual | ||||||||||
| May 16, 2016 | US$300 million | May 24, 2021 | Floating | Bullet | ||||||||||
| Reficar | Project Finance | December 30, 2011 | US$3,497 million | December 20, 2027 | Floating / Fixed | Semi-annual | ||||||||
| Ocensa | Bond | May 7, 2014 | US$500 million | May 7, 2021 | 4.000 | % | Bullet | |||||||
| Oleoducto Bicentenario | Bank Loan | July 5, 2012 | COP$2,100 billion** | July 5, 2024 | Floating | Quarterly | ||||||||
| ODL | Bank Loan* | August 1, 2013 | COP$800,000 million** | August 1, 2020 | Floating | Quarterly | ||||||||
* Reopening of bond due to 2023.
** Bank loans refinanced from their original conditions.
The long term debt transactions executed in 2016 were as follows:
| · | On January 29, 2016, Ecopetrol S.A. entered into an international credit agreement in an aggregate amount of US$175 million with The Bank of Tokyo-Mitsubishi UFJ, Ltd. The credit agreement has a term of five years and a 2.5 year grace period on principal, with interest payable semi-annually at a rate of Libor plus 145 basis points. |
| · | On February 23, 2016, Ecopetrol S.A. entered into a bilateral commercial loan agreement with Bancolombia S.A. in an aggregate amount of COP$990 billion (approximately US$330 million at the representative exchange rate as of December 31, 2016). This loan agreement had a term of 8 years and a 2-year grace period on principal, with interest payable semiannually at a rate of DTF TA plus 560 basis points. As of the date of this annual report, this loan has been prepaid in full. |
| 88 |
| · | On May 16, 2016, Ecopetrol S.A. entered into a bilateral loan agreement with Export Development Canada (EDC), an agency for the promotion of exports of the Government of Canada, in an aggregate amount of US$300 million. This loan agreement has a term of 5 years with principal due at maturity and interest payable semiannually at a rate of LIBOR plus 140 basis points. |
| · | On June 15, 2016, Ecopetrol S.A reopened its SEC-registered 5.875% Notes due 2023 in an aggregate amount of US$500 million (COP$1,500 billion according to the COP$/US$ exchange rate as of December 31, 2016). The notes were listed on the NYSE. |
| · | On November 16, 2016, the Financial Superintendence of Colombia authorized Ecopetrol’s Bond Issuance and Allocation Programme renewal for three additional years, up until November 10, 2019. Thus far, Ecopetrol has issued under the Programme COP$ 900 billion. The Programme has a remaining amount of up to COP$2,100 billion and no modifications were made during the renewal process. |
Contractual Obligations
We enter into various commitments and contractual obligations that may require future cash payments. The following table summarizes our contractual obligations as of December 31, 2016.
Table 51 – Our Contractual Obligations
| COP$ in millions | Payments due by period | |||||||||||||||||||
| Contractual obligations | Total | Less than 1 year | 1 to 3 years | 3 to 5 years | More than 5 years | |||||||||||||||
| Employee Benefit Plan | 26,365,279.0 | 1,125,105.0 | 2,322,451.0 | 2,420,570.0 | 20,497,153.0 | |||||||||||||||
| Contract Service Obligations | 5,991,167.1 | 2,378,785.4 | 2,407,447.8 | 429,061.3 | 775,872.7 | |||||||||||||||
| Operating Lease Obligations | 652,681.2 | 190,875.0 | 157,100.1 | 118,815.1 | 185,891.0 | |||||||||||||||
| Natural Gas Supply Agreements | 2,107,163.5 | 229,202.5 | 495,130.2 | 395,420.0 | 987,410.9 | |||||||||||||||
| Purchase Obligations | 1,318,087.2 | 624,323.3 | 571,858.9 | 74,385.0 | 47,520.0 | |||||||||||||||
| Energy Supply Agreements | 795,408.8 | 97,418.0 | 155,820.8 | 121,267.0 | 420,902.9 | |||||||||||||||
| Capital Expenditures | 621,571.7 | 423,021.94 | 169,321.7 | 29,228.1 | - | |||||||||||||||
| Build, Operate, Maintain and Transfer Contracts (BOMT) | 576,758.8 | 65,155.9 | 114,724.0 | 113,351.5 | 283,527.4 | |||||||||||||||
| Capital (Finance) Lease Obligations | 381,838.6 | 254.1 | 23,649.2 | 40,011.2 | 317,924.1 | |||||||||||||||
| Financial Sector Debt | 20,162,033.8 | 1,333,129.9 | 3,181,732.0 | 9,712,744.3 | 5,934,427.7 | |||||||||||||||
| Bonds | 30,909,787.0 | 138,700.0 | 5,672,263.5 | 1,980,255.0 | 23,118,568.5 | |||||||||||||||
| Total | 89,881,776.78 | 6,605,971.01 | 15,271,499.17 | 15,435,108.32 | 52,569,198.28 | |||||||||||||||
The table does not include the contractual obligations of Equion, Savia and Ecodiesel, which do not consolidate within the Ecopetrol’s Group.
| 4.9 | Off Balance Sheet Arrangements |
As of December 31, 2016, we did not have off-balance sheet arrangements of the type that is required to be disclosed under Item 5.E of Form 20-F.
| 4.10 | Trend Analysis and Sensitivity Analysis |
Trend Analysis
Ongoing Trends
Ecopetrol updated its 2020 Business Plan on September 29, 2016. This Plan is based on three fundamental pillars: i) protection of cash and cost efficiency; ii) strict capital discipline; and iii) growth in reserves and production; these pillars will strengthen the Company’s financial sustainability and afford it opportunities for both organic and inorganic growth, generating value and profitability for its shareholders.
| 89 |
According to this business plan, during 2017 the Company will continue to pursue its transformation to ensure operational and financial sustainability. Ecopetrol has named Phase 3.0 of the business Transformation plan “Ecopetrol’s New Frontier”. It will focus on opening up new markets; multi-year fields development plans; improved return on assets; attracting and retaining the best human talent; committing ourselves to integrity, safe operations, environment consciousness and joint prosperity with communities in which we operate and execute projects.
We believe that our strategy of diversifying our export destinations and sales under term contracts with fixed discounts to reference prices will help to mitigate the impact of the current crude oversupply over the spread of our export basket. We forecast a discount between US$9 and US$10 per barrel compared to ICE Brent crude in 2017.
Furthermore, with the full operation of all units of Reficar since 2016 and shifting from stabilization to optimization, Ecopetrol’s trade balance is expected to continue improving due to the reduction of gasoline imports and incremental exports of fuels. Reficar’s fuels production is expected to continue being allocated primarily in the domestic market, with a surplus to be exported.
Adding reserves and maintaining the pace of production are the Company’s focus. The exploration campaign will be focused in regions of high prospectivity. Investment in exploration will rise from US$ 282 million to US$ 650 million, thus increasing offshore wells from one to six and onshore wells from five to 11 from 2016 to 2017. Enhanced recovery will continue to leverage additional reserves in mature fields.
We stress that a strong cash position allows us to assess opportunities for inorganic growth of Ecopetrol ‘s reserves.
The Company expects to continue the divestment program and expects to receive during 2017 between US$500 and US$1,000 million. The Company is in the process of carrying out the sale of non-strategic assets and shareholdings, such as Propilco, its remaining shares in Empresa de Energía de Bogota and minor production fields.
In order to preserve its investment grade ratings, the Company seeks to maintain financial sustainability and adequate levels of indebtedness. In 2016 international bonds were issued totaling US$ 500 million and commercial loans were entered into totaling US$ 475 million. Going forward, and according with the assumptions of the business plan, the Company does not foresee the issuance of new debt or short-term financing.
The Company will continue monitoring oil price scenarios to make the proper decisions and take preventive actions to ensure financial sustainability in 2017 such as: prioritization of investments associated with regulatory commitments and project completion, temporary closing of producing assets with negative margins, redefining and prioritizing maintenance activities and additional austerity measures related to administrative expenses, sponsorships and labor recruitment.
Sensitivity Analysis
Sensitivity Analysis of Reserves
The following table provides information about the sensitivity analysis conducted on our oil and gas reserves as of December 31, 2016, taking into account ICE Brent crude oil prices that reasonably reflect management’s view of crude oil purchasedprices given prevailing market conditions.
Table 52 – Sensitivity Analysis of Reserves
Oil and NGL (million barrels) | Natural Gas (bcf) | Total Oil and Gas (Mmboe) | ||||||||||
| Reserves as of December 31, 2016 | 1,033 | 3,218 | 1,598 | |||||||||
| Sensitivity Scenario | 1,182 | 3,252 | 1,752 | |||||||||
| Difference (million barrels) | 149 | 34 | 154 | |||||||||
| Difference (%) | 14.4 | 1 | 9.6 | |||||||||
The conversion rate used is 5,700 cf = 1 boe.
| 90 |
Assumptions for the Sensitivity Analysis of Reserves
| · | The sensitivity of the ICE Brent price index is forecasted to average US$55 per barrel in 2017, US$60 per barrel in 2018, US$65 per barrel in 2019, US$70 per barrel in 2020 and US$75 per barrel onwards. |
| · | The base scenario on which our sensitivity analysis is made corresponds to our oil, NGL and natural gas reserves, as of December 31, 2016, as presented elsewhere in this annual report. |
| · | Other variables such as the operating costs, capital costs and portfolio price were not varied for purposes of the analysis. |
Sensitivity Analysis of our Results
The following table provides information about the sensitivity of our results as of December 31, 2016, due to variations of US$1 in the price of ICE Brent crude and of 1% in the COP$/US$ exchange rate.
Table 53 – Results of Reserves’ Sensitivity Analysis
| Income Statement 2016 | Income Statement Case ICE Brent(1) | Difference Between Real 2016 and Case ICE Brent | Income Statement Case TRM(2) | Difference Between Real 2016 and | ||||||||||||||||
| (COP$ in billions) | ||||||||||||||||||||
| Revenue | 48,485,56 | 49,398,37 | 912,81 | 48,931,98 | 446,42 | |||||||||||||||
| Cost of sales | 34,251,42 | 34,606,79 | 355,37 | 34,472,25 | 220,83 | |||||||||||||||
| Gross Income | 14,234,14 | 14,791,58 | 557,44 | 14,459,73 | 225,60 | |||||||||||||||
| Operating expenses | 4,400,84 | 4,400,84 | - | 4,400,84 | - | |||||||||||||||
| Impairment of non-current assets | 928,75 | 928,75 | - | 928,75 | - | |||||||||||||||
| Operating income | 8,904,55 | 9,461,99 | 557,44 | 9,130,14 | 225,60 | |||||||||||||||
| Finance results, net | (1,175,37 | ) | (1,175,37 | ) | - | (1,175,37 | ) | - | ||||||||||||
| Share of profit of associates and joint ventures | 61,35 | 61,35 | - | 61,35 | - | |||||||||||||||
| Income before income tax | 7,790,53 | 8,347,97 | 557,44 | 8,016,12 | 225,60 | |||||||||||||||
| Income Tax | (4,543,05 | ) | (4,868,12 | ) | (325,07 | ) | (4,674,60 | ) | (131,56 | ) | ||||||||||
| Net Income | 3,247,48 | 3,479,85 | 232,37 | 3,341,52 | 94,04 | |||||||||||||||
| (1) | ICE Brent = US$45 per barrel |
| (2) | Exchange rate (TRM) = COP$3,051/US$1.00 |
Assumptions for the Sensitivity Analysis of our Results
| · | Our sensitivity analysis is based on the Consolidated Statement of Profit or Loss for 2016, as presented elsewhere in this annual report. |
| · | The sensitivity of the ICE Brent price index is in reference to an increase of US$1 per barrel of crude oil in the average ICE Brent reference price based on a 365-day year for 2016. Prices assumed correspond to realized prices for crude oil, natural gas and refined products for 2016, adjusted to account for the differences between such realized prices and the ICE Brent reference price. |
| 91 |
| · | The sensitivity of our results to changes in the exchange rate is in reference to a 1% average depreciation of the Colombian Peso against the U.S. dollar during 2016. Prices assumed correspond to realized prices of crude oil, natural gas and refined products in 2016 and are expressed for the sensitivity using the adjusted exchange rate (i.e. a 1% average depreciation of the Colombian Peso against the U.S. dollar during 2016). |
| · | The income tax for each of our sensitivity analyses (price of ICE Brent and COP$/US$ exchange rate) is estimated using the effective corporate tax rate of 58% for 2016. |
The table below sets forth the line items that are being affected by the variation on the reference prices or the average exchange rate.
Table 54
| VARIATION ON ICE BRENT REFERENCE PRICE | VARIATION ON AVERAGE EXCHANGE RATE |
REVENUE | |
| Sales of crude oil | Sales of crude oil |
| Sales of refined products | Sales of refined products |
| Sales of natural gas | Sales of natural gas |
| COST OF SALES | |
| Local purchases from business partners | Local purchases from business partners |
| Local purchases of hydrocarbons from the ANH | Local purchases of hydrocarbons from the ANH |
| Local purchases of natural gas | Local purchases of natural gas |
| Imports of products | Imports of products |
| 5. | Risk Review |
| 5.1 | Risk Factors |
The risks discussed below could have a material adverse effect, separately or in combination, on our business’s operating results, cash flows, liquidity and financial condition. Investors should carefully consider these risks.
| 5.1.1 | Risks Related to Our Business |
This section describes the most significant potential risks to our business.
Our crude oil and natural gas reserve estimates involve some degree of uncertainty and may prove to be incorrect over time, which could adversely affect our ability to generate revenue.
Reserves estimates are prepared using generally accepted geological and engineering evaluation methods and procedures. Estimates are based on geological, topographical and engineering facts. Actual reserves and production may vary materially from third partiesestimates shown in this annual report, and downward revisions in our reserve estimates could lead to lower future production which could affect our results of operations and financial condition.
Hydrocarbon reserves presented in this annual report were calculated in accordance with SEC regulations. As required by those regulations, reserves were valued based on the unweighted average of closing prices for the first day of each month in the 12-month periods ended December 31, 2016, 2015 and 2014, as well as other conditions in existence at those dates. The average of closing prices of ICE Brent crude oil for the first day of each month in the 12-month period was US$101.80 per barrel in 2014, US$55.57 per barrel in 2015 and US$44.49 per barrel in 2016. Mainly as a result of transport capacity restrictions mainlythe pronounced fall in hydrocarbon prices between 2014 and 2015, the Company recognized a reduction in oil and gas proven reserves of 11% in 2015 as compared to 2014, to 1,849 mmboe in 2015 from 2,084 mmboe in 2014. In 2016, the Company recognized a reduction in oil and gas proven reserves of 14% in 2016 as compared to 2015, to 1,598 mmboe in 2016 from 1,849 mmboe in 2015 For more information, see the sectionBusiness Overview—Exploration and Production—Reserves.
| 92 |
Furthermore, at least once a year, or more frequently if the circumstances require, the Company ascertains whether there are signs of impairment to its assets or cash-generating units (CGUs) due to the difference between the carrying amount of such assets or CGUs as opposed to their recoverable amounts, using reasonable assumptions, based on internal and external factors, which reflect market conditions. The recoverable amount is calculated based on the pipelines locatedfree cash flow method, discounted at the weighted average capital cost (WACC). Whenever the recoverable amount of an asset or CGU is lower than its net carrying amount, such amount is reduced to its recovery amount, recognizing a loss for impairment as an expense in the southern region, an increaseconsolidated statement of profit or loss.
Impairment charges for non-current assets in fixed costs mainly due2016 amounted to higherCOP$928,747 million before taxes as a result of the evaluation of the recoverable amount of the assets value which includes the variation in estimations of future prices under the current scenarios of OPEC’s oil quota agreements and the impact resulting from changes on specifications issued by the International Marine Organization agreement regarding marine pollution, Marpol, on crude and fuels with high sulfur content. For additional information about this impairment charges,see Notes 14, 17 and 28 to our consolidated financial statements.
Any significant change in estimates and judgments could have a material effect on the quantity and present value of our proved reserves and subsequently on the recognition or recovery of impairment charges. Changes to estimations of reserves are applied prospectively to the amounts of depreciation, depletion and amortization charged and, increased costsconsequently, the carrying amounts of subsoil maintenanceexploration and water disposal.production assets.
OperatingIn order to assess the possible impact of current expected oil price scenarios and market conditions, as well as of further developments driven by the economic environment for the oil and gas industry, the Company has performed a sensitivity analysis over its proved reserve balance as of December 31, 2016. Based on these calculations, assuming an average price per barrel of ICE Brent crude oil of US$55 per barrel in 2017, US$60 per barrel in 2018, US$65 per barrel in 2019, US$70 in 2020 and US$75 per barrel for later years, Ecopetrol could recognize an increase in oil and gas proved reserves of approximately 9.6%. This analysis takes into account Ecopetrol’s estimates and expectations regarding the main assumptions used in its proven reserve calculation, which final actual result may fluctuate and differ substantially from those provided herein due to several factors outside of the control of the Company. For additional information see the sectionFinancial Review—Trend Analysis and Sensitivity Analysis.
Moreover, any downward revision in our estimated quantities of proved reserves would indicate lower future production volumes, which could result in higher expenses increased by 46% in 2014 as compared with 2013for depreciation, depletion and amortization for properties to which we apply the units of production method for calculating these expenses. These higher expenses, and any lower revenues as a result of 1)actual production volumes and realized prices, could adversely impact our results of operations and financial condition.
Achieving our long-term growth depends on our ability to execute our strategic plan — specifically, the discovery and successful development of additional reserves.
Our long-term growth objectives depend largely on our ability to discover and/or acquire new reserves, and in turn developing them successfully and improving the recovery factor in our mature oil fields. Our exploration activities expose us to the inherent geological and drilling risks including the risk of not discovering commercially viable crude oil or natural gas reserves; and the risk that some exploratory wells initially budgeted for may be drilled at a later stage or not be drilled at all. Despite the effort we make to control costs associated with drilling, these are often uncertain, and numerous factors beyond our control may cause drilling operations to be curtailed, delayed or cancelled.
Our ability to add and develop reserves also depends on our capacity to structurally reduce costs to maintain the profitability of oil fields already being exploited.
If we are unable to successfully discover and develop additional reserves, or if we do not acquire properties having proved reserves, our reserves portfolio will decline. Failure to secure additional reserves may impede us from achieving or maintaining production targets, and may have a negative impact on our results of operations and financial condition.
| 93 |
See the sectionStrategy and Market Overview—Our Corporate Strategy for a discussion of our strategic plan.
Our business depends substantially on international prices for crude oil and refined products. The prices for these products are volatile; a sharp decrease could adversely affect our business prospects and results of operations.
In 2016, in Ecopetrol, approximately 91.7% of the revenues came from sales of crude oil, natural gas and refined products and 91% of the total volume sold of these products is indexed to international reference prices or benchmarks such as ICE Brent. Consequently, fluctuations in those international indexes have a direct effect on our financial condition and results of operations.
Prices of crude oil, natural gas and refined products have traditionally fluctuated as a result of a variety of factors including, among others, competition within the international oil and natural gas industry; long-term changes in the demand for crude oil (as further explained below), natural gas and refined products; the economic policies in the United States, China and the European Union; regulatory changes; changes in global supply, such as the current oversupply of crude oil; inventory levels; changes in the cost of capital; adverse economic conditions; global financial crises; development of substitute sources of energy, development of new technologies; global and regional economic and political developments in the Organization of the Petroleum Exporting Countries, (OPEC); the willingness and ability of the OPEC and its members to set production levels; local and global demand and supply for crude oil, refined products and natural gas; trading activity in oil and natural gas, which thereby affects their respective margins; derivative financial instruments related to oil and gas; development or availability of alternative fuels; weather conditions; natural events or disasters; and terrorism and global conflict. In 2016 the impact of an oversupplied market was put to test, as OPEC changed its traditional controlling role and let the market find its own balance. The price of crude oil may also fluctuate due to changes in demand. For example, Brexit’s impact on crude oil demand for 2017 is expected to be moderate, the Petroleum Industry Research (PIRA Energy Group) estimates a short-term impact of US$2 per barrel on crude oil due to a reduction between 100-200 KBD in demand for gasoline, middle distillates and other products.
When crude oil, refined products and natural gas prices are low, we earn less revenue and we generate lower cash flow and less income. Conversely, when crude oil, refined product and natural gas prices are high, we earn more and generate a larger amount of cash and net income. During 2016, our crude oil basket price was US$35.7 per barrel versus US$43.9 per barrel in 2015; the refined product basket price was US$50.1 per barrel versus US$63.4 per barrel in 2015; and the natural gas price was US$23.5 per barrel equivalent in 2016 versus US$22.0 per barrel equivalent in 2015. However, it is important to consider that the margin on refined products can result either in higher or lower margins due to a change in price of crude the same way gas prices can be impacted by local conditions, such as local demand and weather conditions.
Impairment charges for non-current assets in 2016 amounted to COP$928,747 million before taxes as a result of the evaluation of the recoverable amount of the assets’ value which includes the variation in estimations of future prices under the current scenarios of OPEC’s oil quota agreements and the impact resulting from changes on specifications issued by the International Marine Organization agreement regarding marine pollution, Marpol, on crude and fuels with high sulfur content. For additional information about this impairment charges,see Notes 14, 17 and 28 to our consolidated financial statements.
A reduction of international crude oil prices could also result in a delay or a change in our capital expenditure plan, in particular delaying exploration and development activities, thereby delaying the development of reserves and affecting future cash flows. In order to maintain a profitable operation and preserve the cash flow of the Company at certain oil price levels, some of our producing fields may have to be closed or their operations temporarily suspended which would affect our production levels and expected revenues.
| 94 |
Changes in the Colombian Peso/U.S. dollar exchange rate could have an adverse effect on our financial condition and results of operations given the amount of U.S. dollar denominated debt held by the company and the fact that most of our revenues is derived from sales of products quoted in or with reference to U.S. dollars.
Most of our revenues are derived from sales of products quoted in or with reference to U.S. dollars. Therefore when the Colombian Peso depreciates against the U.S. dollar, our revenues converted into Colombian Pesos, increase. Conversely, when the Colombian Peso appreciates against the U.S. dollar, our revenues decrease.
On the other hand, imported goods, oil services and the debt, which is mainly denominated in U.S. dollars, become less expensive when the Colombian Peso appreciates against the U.S. dollar and more expensive when the Colombian Peso depreciates against the U.S. dollar.
As of December 31, 2016 our U.S. dollar-denominated total debt was US$15.2 billion, which we recognize in our consolidated financial statements at its amortized cost, which corresponds to the present value of cash flows, discounted at the effective interest rate. Out of this total, US$12 billion relate to Ecopetrol S.A., whose functional currency is the Colombian Peso. Therefore, when the Colombian Peso depreciates against the U.S. dollar, Ecopetrol S.A. is exposed to an exchange rate loss. In contrast, when the Colombian Peso appreciates against the U.S. dollar, Ecopetrol S.A.is exposed to an exchange rate gain. Some of the Group’s affiliates have the U.S. dollar as functional currency and are not exposed to a material exchange rate risk resulting from fluctuations in the Colombian Peso against the U.S. dollar. On the asset side, when the financial statements of the Group are consolidated, the exchange rate differential of the affiliates’ assets and liabilities whose functional currency is the U.S. dollar is recognized directly in the equity, as part of the other comprehensive income.
The Company adopted hedge accounting as part of its risk management strategy, using two types of natural hedges with its U.S. dollar debt as a financial instrument: i) cash flow hedge for exports of crude oil and ii) hedge of a net investment in a foreign operation. As a result of the implementation of both hedges, 88%, or $10.5 billion, of Ecopetrol S.A.’s debt in U.S. dollars was designated as a hedge. With the adoption of hedge accounting, the effect of the volatility of the foreign exchange rate on the hedged portion of the debt is recognized directly in equity, as part of other comprehensive income. The remaining portion of Ecopetrol S.A.’s U.S. dollar-denominated debt as well as the financial assets and liabilities denominated in foreign currency continues to be exposed to the fluctuation in the exchange rate.
The U.S. dollar/Colombian Peso exchange rate has fluctuated during the last several years. On average, the Colombian Peso depreciated 7.05% against the U.S. dollar in 2014, 37.28% in 2015 and 11.18% in 2016. Additionally, as of December 31, 2016, the Colombian Peso appreciated 4.72%, but depreciated as of December 31, 2015 and 2014, 31.64% and 24.17%, respectively, from year-end exchange in the previous year. In addition, given the political uncertainty surrounding the United States of America following the recent presidential election and the unpredictability in the economic performance of some developed countries, there is no clear view of how the U.S. dollar will behave in the medium to long-term. Given that markets are dealing with a great deal of uncertainty, it is expected that U.S. dollar movements will remain difficult to forecast, as the U.S. currency will respond immediately to any new opportunities for or challenges to the U.S. economy.
A future depreciation in the exchange rate of the Colombian Peso against the U.S. dollar may affect our financial results when converted into Colombian Pesos, given the portion of our U.S. dollar debt that is not designated as hedge instrument and the future debt we may acquire. Please see our sensitivity analysis on our results of operation to exchange rate fluctuations in the sectionFinancial Review—Effect of Taxes, Exchange Rate Variation, Inflation and the Price of Oil on our Results—Exchange Rate Variationand in Note 31.2 to our consolidated financial statements.
Increased competition from local and foreign oil companies may have a negative impact on our ability to gain access to additional crude oil and natural gas reserves in Colombia and abroad.
We must bid for exploration blocks offered by the ANH in Colombia and similar authorities in other countries, which means we compete under the same conditions as other domestic and foreign oil and gas companies, and receive no special treatment. Our ability to obtain access to potential fields also depends on our ability for evaluating and selecting potential opportunities and to adequately bid for such opportunities.
| 95 |
We are also exposed to international competition as a result of our international exploratory activities. Currently, we are exploring in Brazil and the US Gulf of Mexico, where we both partner and compete with other oil and gas companies operating in those locations.
If we are unable to adequately compete with local and foreign oil companies, or if we cannot enter into joint ventures with market players having high potential exploration projects, our exploration activities may be limited. This could reduce our market share and, in turn, adversely affect our financial condition.
If operational risks to which we are exposed in Colombia or overseas materialize, the health and safety of our workforce, the local community and the environment may be affected. In addition, we may suffer a disruption or shutdown of our operational activities.
Our exploration, production, refining and transportation activities in Colombia and in the foreign countries in which we operate are subject to industry-specific operating risks, some of which, despite our internal procedures and adherence to industry best practices, are beyond our control. Our operations may be curtailed, delayed or cancelled due to adverse or abnormal weather conditions, natural disasters, blockages in the communities in which we operate, equipment failures or accidents, oil or natural gas spills or leaks, shortages or delays in the availability or in the delivery of equipment, delays or cancellation of environmental licenses or other government authorizations or judicial decisions, fires, explosions, blow-outs, surface cratering, pipeline failures, theft and damage to our transportation infrastructure, sabotage, terrorist attacks and criminal activities.
Some of our operations in Colombia and abroad could be conducted in remote and uninhabited locations which involve health and safety risks that could affect our workforce. By our own Company policy and practices, as well as under Colombian law and international industrial safety regulations, we are required to have health and safety practices that minimize risks and health issues faced by our workforce. Failure to comply with health and safety regulations in the jurisdictions where we operate may lead to investigations by health officials that could result in lawsuits or fines.
We may be required to incur in additional costs and expenses to allocate funds to industrial safety and health compliance under Colombian law and international industrial safety regulations. Additionally, if any operational incident occurs that affects local communities and ethnic communities in nearby areas, we will need to incur in additional costs and expenses in order to return affected areas to normality and to compensate for any damages we may cause. These additional costs may have a negative impact on the profitability of the projects we may decide to undertake.
The occurrence of any of these operating risks could result in substantial losses or slowdowns to our operations, including injury to our employees, malfunction or destruction of property, equipment and infrastructure, clean-up responsibilities, third-party liability claims, government investigations and imposition of fines, withdrawal of environmental licenses and other government permits, suspension or shutdown of our activities and loss of revenue. The occurrence of any of these events may have a material adverse effect on our financial condition and results of operations.
Our involvement in deep-water drilling either as direct operator or in conjunction with our business partners involves risks and costs, which may be out of our control.
Our deep-water drilling activities present severe risks, such as the risk of spills, explosions on platforms and drilling operations, and natural disasters. The occurrence of any of these events or other incidents could result in personal injuries, loss of life, severe environmental damage with the resulting containment, clean-up and repair expenses, equipment damage and liability in civil and administrative proceedings. Heightened risks and costs associated with deep-water drilling may have a negative effect on our results of operations and financial condition and in our reputation.
| 96 |
See the sectionBusiness Overview—Exploration and Production—Exploration Activities—Exploration Activities Outside of Colombia for a summary of our current deep-water drilling activities.
As a result of the oil spill in the Macondo field operated by British Petroleum in the U.S. Gulf Coast in April 2010, significant concerns regarding the safety of deep-water drilling have been raised and, as a result, applicable regulations in various countries have changed. More stringent government regulation may result in increased costs and longer exploration and development timeframes for our deep-water drilling operations and consequently could adversely affect our results of operations and financial condition.
We are exposed to the credit, political and regulatory risks of our customers and any material nonpayment or nonperformance by our key customers could adversely affect our cash flow and results of operations.
Some of our customers may experience financial problems that could have a significant negative effect on their creditworthiness. Severe financial problems encountered by our customers could limit our ability to collect amounts owed to us, or to enforce the performance of obligations owed to us under contractual arrangements. In addition, many of our customers finance their activities through their cash flows from operations, short and long term debt or equity.
The combination of decreasing cash flows as a result of declines in commodity prices, a reduction in borrowing bases under reserve-based credit facilities and the lack of availability of debt or equity may result in a significant reduction of our customers’ liquidity and limit their ability to make payments or perform their obligations to us.
Furthermore, some of our customers may be highly leveraged and subject to their own operating expenses. Therefore, the risk we face in doing business with these customers may increase. Other customers may also be subject to regulatory changes, which could increase the risk of defaulting on their obligations to us. Financial problems experienced by our customers could result in the impairment of our assets, a decrease in our operating cash flows and may also reduce or curtail our customers’ future use of our products and services, which may have an adverse effect on our revenues and our ability to make payments under our existing debt obligations.
Our ability to access the credit and capital markets on favorable terms to obtain funding to refinance our debt maturities may be limited due to the deterioration of these markets, any change to our credit ratings and the authorizations we need before incurring any financial indebtedness.
In recent years, particularly during the last quarter of 2015 and the first quarter of 2016, due to significant decrease in oil prices, domestic and global financial markets and economic conditions have been weak and volatile and have contributed significantly to a substantial deterioration in the credit markets. A new financial crisis, remaining volatility in prices in the oil and gas sector, the spread in protectionist policies in the United Statess and Europe, the lack of consensus among OPEC members and further geopolitical disruptions in the Middle East which could involve developed countries, which in turn could worsen risk perception with respect to the emerging markets, or the occurrence of any of the risks described in the sectionRisk Review—Risk Factors—Risks Related to Colombia’s Political and Regional Environment could also make it more difficult for us and our subsidiaries to access international and local capital markets and finance our operations and potentially refinance our debt maturities on terms acceptable to us. These conditions, along with significant write-offs in the financial services sector and the re-pricing of credit risk, can make it difficult for us to obtain funding for our capital needs on favorable terms. Access to credit and capital markets is also dependent on our credit ratings, which are mainly determined by our financial and operational strength, oil and gas market conditions and the support that could be provided by the Colombian government. On January 18, 2016, our senior unsecured debt ratings were downgraded to Baa3 from Baa2 by Moody’s Investors Service, and Standard & Poor’s (S&P) and Fitch Ratings revised our outlook from stable to negative on January 29 and July 26, 2016, respectively. We cannot assure that our credit ratings will continue for any given period of time or that the ratings will not be further lowered or withdrawn. An assigned rating may be raised or lowered depending, among other things, on the respective rating agency’s assessment of our financial strength. In addition, a downgrade in the rating of the Republic of Colombia could also trigger a downgrade on our ratings as our rating is capped by the rating of the Republic of Colombia and the implicit support that can potentially be provided to the Company. On February 16, 2016, S&P revised the outlook of the Republic of Colombia to negative. While on March 14, 2017, Fitch Ratings upgraded our outlook from negative to stable following the upgrade from the Republic of Colombia from negative to stable also in March 2017, we cannot offer any assurance that our credit rating will continue.
| 97 |
As a result of these factors, we may be forced to revise the timing and scope of our capital projects as necessary to adapt to existing market and economic conditions, downgrades to our credit ratings or to access the financial markets on terms less favorable, therefore negatively affecting our results of operations and financial condition.
In addition, under applicable regulation, the Government, through the Ministry of Finance and Public Credit and the favorable opinion of the National Planning Department, must authorize all indebtedness of state-owned entities and government-controlled companies through a majority equity stake. Consequently, excluding our foreign subsidiaries or those subsidiaries in which we hold minority interest, most of our indebtedness must be previously authorized by the Colombian Ministry of Finance and Public Credit and the National Planning Department. As such, our indebtedness is subject to the Government’s time frames and policies, and we cannot guarantee that such authorizations would be granted in a timely fashion or granted at all.
We may be exposed to increases in interest rates, thereby increasing our financial costs.
We may incur debt locally and in the international capital markets and, consequently, may be affected by changes in prevailing interest rates. If market interest rates increase, our financing expenses may increase, which could have an adverse effect on our results of operations and financial condition. Interest rates in the United States may continue rising due to Federal Reserve’s monetary policy, which is looking for economic activity expansion at a moderate pace, labor market conditions strengthening and inflation stability to 2% over the medium term.
As of December 31, 2016, approximately 31%, or US$5.4 billion (COP$16.2 trillion), of our total indebtedness consisted of floating rate debt. If market interest rates rise, our financing expenses will increase, which could have an adverse effect on our results of operations and financial condition. In addition, as we refinance our existing debt in the coming years, the mix of our indebtedness may change, specifically as it relates to the ratio of fixed to floating interest rates, the ratio of short-term to long-term debt, and the currencies in which our debt is denominated in or indexed to. We cannot assure you that such changes will not result in increased financing expenses borne by us. Finally, as we incur new debt in the future to fund our capital projects, the prevailing interest rates and spreads at any specific time could be less favorable in terms of cost when compared to our previous financing transactions, which could adversely affect our financial condition and results of operations.
Our current and planned investments and exploration activities outside Colombia are exposed to political and economic risks.
As part of our strategic plan, we operate through business partners, subsidiaries or affiliates outside of Colombia. We currently have investments, joint ventures and subsidiaries incorporated in Peru, Brazil, Bermuda, Panama, the Cayman Islands, Switzerland, Germany, Spain, the United Kingdom and the United States, and we are analyzing investments in other countries. In connection with making investments, we are and will be subject to risks related to economic and political conditions and governmental economic actions. We cannot predict the positions of foreign governments relating to the oil and gas industry, land tenure, protection of private property, environmental standards, regulation or taxation; nor can we assure you that future governments will maintain policies favorable to foreign investment or repatriation of capital.
We began exploration activities outside Colombia in 2006 through our Brazilian subsidiary, Ecopetrol Óleo e Gás do Brasil Ltda. Our foreign subsidiaries have subsequently entered into a number of joint venture exploration agreements with regional and international oil companies to explore acreage in Brazil and the U.S. Gulf Coast. We have limited experience exploring outside Colombia. We may face new and unexpected risks involving environmental and other legal requirements beyond those we currently experience.
| 98 |
The results of operations and financial condition of our subsidiaries in these countries also may be adversely affected not only by risks associated with hydrocarbon exploration and production, but also by fluctuations in their local economies, political instability and government actions, including: the imposition of price controls, the imposition of restrictions on hydrocarbon exports, fluctuation of local currencies against the Colombian Peso, the nationalization of oil and gas reserves, increases in export and income tax rates for crude oil and oil products, and unilateral (governmental) institutional and contractual changes, including controls on investments and limitations on new projects.
Any of these conditions occurring could disrupt or terminate our operations, causing our development activities to be curtailed or terminated in these areas, or our production to decline; limit our ability to pursue new opportunities; affect the recoverability of our assets; or cause us to incur additional costs or delay the timeline of our projects.
Our future performance depends on the successful development and deployment of new technologies and the knowledge to apply and improve them.
Technology, knowledge and innovation are essential to our business, especially for improvements in the production and transportation of heavy crude oil, the exploitation of mature fields, and reductions in our operating cost. If we do not develop the right technology or do not obtain the expertise to operate new technology or to improve our processes, do not have access to, or do not deploy the knowledge necessary to apply and improve such technology effectively, the execution of our corporate goals, our profitability and our earnings may be adversely affected. In the case of our recovery program, we not only depend on the successful development and deployment of new technologies but also in the response of the reservoir to the application of this recovery technology.
Our performance could be negatively affected by a deficiency in leadership capacity and lack of key skilled employees.
As the oil and gas industry faces an increasing number of challenges, the ability to react quickly to these challenges has become a key factor in achieving efficiency, profitability and sustainability. Our ability to achieve these goals can be negatively affected by a deficiency in leadership capacity and a lack of key skilled employees that can execute our business strategy with creativity and determination.
Our operations may not be able to keep pace with the increasing domestic demand for natural gas.
According to the Colombian Energy and Gas Regulatory Commission (CREG) Resolution 089 of 2013, a supplier of natural gas must possess sufficient economically viable natural gas reserves before executing a natural gas delivery contract with a customer. In the long term, we may not be able to keep up with increasing local demand for natural gas if demand outpaces the rate of growth of our natural gas supply, especially because of the decline of our main fields. As a result, we may lose market share, which may negatively impact our financial condition and results of operations.
Additionally, we are currently party to a number of national gas supply contracts that have firm gas commitments. If we are unable to deliver natural gas to these clients as a result of cuts in operations, delays in the completion of projects relating to our production facilities or the acceleration of the decline in our gas production, among other reasons, we may be required to compensate our customers for our failure to supply natural gas. In 2016, we paid a penalty due to a cut in operations that occurred on October 12, 2016. This cut was caused by an operational failure in the ignition system of the Guajira B compression train, which caused an unavailability of gas supply, which in turn affected gas demand in a portion of the industrial and thermal sectors.
Delays in the start of new projects could result in penalties imposed on us by our clients. Although we did not pay penalties due to delays in the start of new projects in 2016, we cannot assure you that in the future we will not be subject to additional monetary fines which can in turn affect our financial condition and results of operations.
| 99 |
We depend on others for the construction and availability of natural gas transportation infrastructure for the transport of our gas, which may limit our ability to develop new or existing fields or lead to the deterioration of related assets and may not allow us to recover the cost of capital invested in natural gas discoveries.
We are prohibited by law from holding more than 25% of the equity of any natural gas transportation company. Therefore, there can be no assurance that the transportation infrastructure necessary to transport natural gas from the fields to distribution points and our customers will be built by third parties or that if built there will be sufficient capacity available to us for the exploitation of new natural gas discoveries or the development of existing fields. The failure to commercially exploit new or existing discoveries may result in impairment of the related assets and our inability to recover the capital expenditures invested to make these natural gas discoveries. As a result, we may be required to enter into agreements with natural gas transportation companies on terms that are not favorable to us.
For example, we have developed natural gas reserves in the Cusiana and Cupiagua fields, but transportation capacity to deliver gas from these fields is currently limited. Although there are projects under development that will eliminate this limitation in 2018, we can offer no assurance that they prove successful.
Our operations have and may continue to be affected by reactions of labor unions, social organizations and contractors to organizational changes and other management decisions.
Due to the volatility of the markets and the existing low oil price environment, we have and will continue to undertake measures to enhance operating cost efficiency. Such measures involve changes in cost structure, downsizing our staff (including direct and indirect employees), and budget cuts, among others. Unions, contractors and social organizations in the communities where we have operations have in the past and may continue to oppose such measures causing work stoppages or decreasing productivity, which could have an adverse effect on our operations and financial condition.
In addition, our current collective bargaining agreement has been in effect since 2014 and has a term of five years, expiring June 30, 2018. There will be no changes to these terms until 2018; therefore, we do not expect any adverse reactions from our labor unions relating to this matter. However, we cannot assure you we will not experience strikes or labor unrest in the future.
Our activities may be interrupted or affected by external factors, such as abnormal weather conditions and natural disasters.
We are exposed to several risks that may partially interrupt our activities. They include fires or explosions, natural disasters, criminal acts and acts of terror, malfunction of pipelines and emission of toxic substances.
Also, the effects of climate change could create impacts and losses in any part of our business operations, for instance, as the result of increase in drythe intensity of the “La Niña” and “El Niño” climate phenomena, causing floods and drought periods, increased temperature and rising sea levels.
The “El Niño” climate phenomenon is characterized by (i) a lack of rainfall, which limits the amount of water necessary for the development of various activities of the company, and (ii) increased temperatures, which could have a direct impact on our workers’ health given an increased occurrence of heat waves and the increased occurrence of epidemics and diseases. The “La Niña” climate phenomenon is characterized by increased rainfall, which can generate (i) landslides that threaten pipeline infrastructure and limit road transportation and (ii) flooding, which could limit operations in our production fields and facilities.
As a result, our activities could be significantly affected or even paralyzed. These risks could result in property damage, loss of revenue, loss of life, pollution and harm to the environment, among others. If any of these occur, we may be exposed to economic sanctions, damages, fines or penalties in addition to the costs required to repair or remediate the related damage. These costs, fines and penalties may adversely affect our financial condition and results of operations.
| 100 |
Our operations, including our activities in areas classified as indigenous reserves and Afro-Colombian lands, are subject to opposition from members of various communities.
We currently carry out and plan to carry out activities in areas classified by the Government as indigenous reserves (resguardos) and Afro-Colombian lands (territorios colectivos). In order to undertake these activities, we must first comply with the previous consultation process, set forth by Colombian law. These consultation processes are part of the administrative procedures for obtaining environmental licenses to start our projects, works or activities in areas belonging to ethnic communities. In addition, consultations can be seen as a potential instrument to involve communities in the decision of developing extracting industry and infrastructure projects in their territories. Generally, these consultation processes last between six months to one year depending on the community expectations, but may be significantly delayed if we cannot reach an agreement with the communities. We strive to be respectful of the Constitution and laws and the autonomy of indigenous and Afro-descendant communities, and we therefore do not enter their territories until we have reached an agreement with them.
Our activities are subject to opposition, including protests by various communities, and even in areas in which the previous consultation process does not apply. Recently, through popular consultation, some communities have voted against the development of extractive industry projects. Any such similar situation may affect our future projects.
In recent years, indigenous communities have been claiming their ancestral territories and requesting recognition on previously closed consultation processes. We may be exposed to operational restrictions as a result of the opposition of these communities.
No certainty can be given that we will be able to reach an agreement with the different communities opposed to our operations or that such communities will participate in consultation processes if available. We may be exposed to similar delays due to opposition from local communities in other countries where we carry out our activities.
We have made significant investments in acquisitions and we may not realize the expected value.
We have acquired interests in several companies in Colombia and abroad. See the sectionBusiness Overview—Our Corporate Structure. Obtaining the expected benefits of the acquisitions will depend, in part, on our ability to (i) obtain the expected results of operations and financial condition from these acquisitions, (ii) manage disparate operations and integrate distinct corporate cultures, (iii) manage our objectives as a corporate group, and (iv) institute our corporate governance rules as well expenditures, 2)as other factors beyond our control such as (v) the economic and regulatory environment in countries in which we have made acquisitions and (vi) crude oil prices. These efforts may not succeed. Our failure to successfully obtain the expected results from our acquisitions could adversely affect our financial condition and results of operations.
We might be required to provide additional financial support to Bioenergy and Reficar in spite of the recent completion of their projects
Reficar raised US$3.5 billion through a limited-recourse project financing in which Ecopetrol S.A. provided both construction support and debt service guarantee and was also the sponsor of the financing. If Reficar experiences any situation that might affect the fulfillment of its financial obligations, Ecopetrol S.A. must provide financial support to Reficar, through capitalizations, subordinated loans or even the assumption of the debt. These situations might be related, but are not limited to, labor productivity, failure of the upgraded refinery to reach the expected performance level in terms of the quality of products and/or volumes produced. See the sectionBusiness Overview—Refining and Petrochemicals—Refining—Reficar.
Also, Bioenergy’s ethanol plant, that was financed with COP$123 billion through bilateral loans for its agricultural component and COP$382 billion through an infrastructure leasing for its industrial component, may also meet situations such as social unrest, strikes or other operational difficulties that could negatively impact its operation and financial results. Although Ecopetrol is not the sponsor and has not provided financing guarantees to Bioenergy, some additional financial support might be needed to assure the stabilization of the project.
| 101 |
Any situation that could affect the operations of these subsidiaries may have a negative impact on their profitability as well as their ability to pay their debt, which in turn could adversely affect our financial condition and results of operations.
Ongoing Colombian Statecontrol entities investigations regarding our subsidiaries Reficar and Bioenergy could adversely affect us.
Ecopetrol is a corporation majority owned by the Colombian Government that administers public resources and Reficar and Bioenergy are subsidiaries of Ecopetrol. Ecopetrol’s employees have a statutory responsibility to ensure the proper use of public resources. Reficar and Bioenergy’s employees also have a duty for proper management of public resources. The conduct of Ecopetrol, Bioenergy and Reficar’s employees are generally subject to the control and supervision of the Colombian State control entities. See the sectionRisk Review—Legal Proceedings and Related Matters for additional information.
The investigations concerning Reficar and Bioenergy that are described in the sectionRisk Review—Legal Proceedings and Related Mattersremain ongoing. Because these actions are in their early stages, it is still not possible to estimate the duration, scope or results of these investigations or related inquiries and requests for information by Colombian State control entities. While we are cooperating fully with both cases, adverse developments in connection with these investigations, including any expansion of the scope of the investigations, could negatively impact us and could divert the efforts and attention of our management team from our ordinary business operations.
As described in the sectionRisk Review—Legal Proceedings and Related Matters, the Prosecutor’s Office is conducting a confidential investigation regarding Reficar’s expansion and modernization project. On April 27, 2017, the Prosecutor’s Office announced its intention to pursue charges against eight individuals, including five past officers of Reficar or Ecopetrol, for the alleged crimes of document forgery, illegal interest in the execution of agreements, misappropriation of public funds and unjust enrichment. The Prosecutor’s Office has not yet made public the factual basis for such charges, and accordingly we are not in a position to predict the outcome of the Prosecutor’s Office’s investigation or the disposition of any charges that the Prosecutor’s Office may bring.
In connection with this investigation or any other investigation carried out by any other authority, there can be no assurance that we will not be required to pay penalties, or incur in additional costs and expenses, and expose us or our employees to sanctions and lawsuits, any of which could adversely impact our reputation and, in turn, could have adverse effects on our financial condition and results of operations.SeeRisk Review- Legal and Regulatory Risk - We may incur losses and spend time and money defending pending lawsuits and arbitrations and responding to administrative investigations.
Our results may be affected by the performance of our business partners or their third-party service providers, as many of our operations are executed under joint venture agreements.
Many of our operations are performed through joint ventures with our business partners. Consequently, we depend on the performance of our business partners. The poor performance of any of them, especially in those projects in which we do not act as operator, could negatively impact oil and natural gas production, which in turn could have a negative impact on our results of operations and financial condition. We are exposed to the risk of not finding business partners with the appropriate skills and performance we require for our projects. We are also indirectly exposed to supply agreements and other third-party services contracted by our business partners acting as operators under joint venture agreements.
Our insurance policies do not cover all liabilities and may not be available for all risks.
Our insurance policies do not cover all liabilities, and insurance may not be available for all risks. There can be no assurance that incidents will not occur in the future, that insurance will adequately cover the entire scope or extent of our losses or that we will not be found liable in connection with claims arising from these and other events, which could adversely affect our financial condition and results of operations.
A failure in our information technology systems or cyber security attacks may adversely affect our financial results.
We depend on the reliability and security of our information technology systems to conduct certain exploration, development and production activities, process financial records and operating data, communication with our employees and business partners, and for many other activities related to our business. Our information technology systems may fail or have other significant shortcomings due to operational system flaws or employee misuse, tampering or manipulation. In addition, we may become the target of cyber-attacks or information security breaches that could result in the unauthorized release, gathering, monitoring, misuse, loss or destruction of proprietary and other information. Any of these occurrences could disrupt our business, result in potential liability or reputational damage or otherwise have an adverse effect on our financial results.
| 102 |
During 2016, our internal cyber security systems identified several cyber security attacks such as brute force login attacks designed to identify valid credential in IT infrastructure and seventeen ransomware attacks-only one of them with data loss (low level confidentiality) at Ecopetrol S.A.-Our platforms also identified and controlled certain malware events and SQL injection attacks.
Although we have not experienced any material losses relating to failure of our information technology systems or cyber incidents, there can be no assurance that we will not suffer such losses in the future.
We are exposed to behaviors incompatible with our ethics and compliance standards.
Given the large number of contracts that we are a party to in Colombia and abroad with local and foreign suppliers, the geographic distribution of our operations and the great variety of actors that we interact within the course of business, we are subject to the risk that our employees, contractors, or any person having relations with us may misappropriate our assets, manipulate our assets or information or engage in money laundering or the financing of terrorism, for such person’s personal or business advantage. Our systems for identifying and monitoring these risks may not be effective to fully mitigate them in all situations. Such acts may result in material financial losses or reputational harm to the Company.
The reliability and capacity of national power supply systems may affect or limit the continuity of our operations or limit growth.
Our average energy consumption in 2016 was 6,948 GWh/year, of which 65% was supplied through self-generation, and the remaining 35% through power grid. Our demand is 10.5% of the total energy demand in Colombia.
Several producing fields are connected to the national transmission system and depend on its expansion and reliability to keep steady production levels and to accommodate future growth. The national electricity market is volatile due to changes in hydrology and availability of fuels (natural gas, diesel etc.); and the grid expansion projects which are executed by power distribution contractors have experienced delays due to licenses and limited execution capability. To mitigate these risk the Ecopetrol Group decided to centralize the management of power sources and uses in order to optimize the energy availability, quality and cost, for the short, medium and long term. While the intention is to enhance system reliability by timely execution of electrical projects and to launch energy efficiency programs in all of our segments, we cannot offer any assurance that we will prove successful.
Rising water production levels may affect or constrain our crude oil production.
During 2016, we produced approximately 9.36 million barrels of water per day. Taking into account the nature of our reservoirs, the water production levels to be managed by the Company may increase in expenditures for seismic studiesthe future. In order to achieve our oil and gas production goals and to avoid any production restrictions going forward, we will need to secure the required capacity to manage water levels. Factors that may trigger a possible constraint in our crude oil production due to increased on-shorethe rising water production levels are: (i) ineffective project management of the required facilities, (ii) the Company’s and its partners’ ability to timely obtain the environmental permits related to water management, (iii) social and community interactions that could affect the development and operation of these projects, and (iv) the availability of capital to execute the required projects.
| 5.1.2 | Risks Related to Colombia’s Political and Regional Environment |
This section discusses potential risks related to our extensive operations in Colombia.
| 103 |
The Colombian government could seize or expropriate Ecopetrol’s assets under certain circumstances.
Pursuant to Articles 58 and 59 of the Colombian constitution, the Government can exercise its eminent domain powers in respect of Ecopetrol’s assets in the event such action is deemed by the Government to be required in order to protect public interests. According to Law 388 of 1997, eminent domain powers may be exercised through: (i) an ordinary expropriation proceeding (expropiación ordinaria o judicial), or (ii) an administrative expropriation (expropiación administrativa). In all cases we would be entitled to a fair compensation for the expropriated assets. Also, as a general rule, compensation must be paid before the asset is effectively expropriated. However, the compensation may be lower than the price for which the expropriated asset could be sold in a free-market sale or the value of the asset as part of an ongoing business. The aforementioned Article 59 of the Colombian constitution establishes an expropriation for war reasons (expropiación en caso de guerra), which does not that compensation be paid before expropriation but can only be executed on a temporary basis.
Colombia has experienced internal security issues that have had or could have a negative effect on the Colombian economy and on us.
Colombia has experienced internal security issues, primarily due to the activities of guerrillas, paramilitary groups, drug cartels and criminal bands known asBacrim. From time to time, guerrillas target crude oil and multi-purpose pipelines, including the Oleoducto Transandino, Caño Limón-Coveñas and Oleoducto Bicentenario pipelines, and other related infrastructure disrupting our activities and 3)those of our business partners. During 2016, the attacks against our pipeline infrastructure decreased by 35% in relation to 2015 (80 attacks in 2015 compared with 52 attacks in 2016), however they were strategically targeted and more severe. This situation especially affected the infrastructure located in Nariño, Arauca and Norte de Santander and the following pipelines: Caño Limón Coveñas and Transandino. During the first quarter of 2017, 29 attacks against the infrastructure of the Caño Limon – Coveñas system have taken place, impacting our operations in this pipeline and resulting in deferred crude oil production of 603 thousand barrels. On several occasions, guerilla attacks have resulted in unscheduled shutdowns of transportation systems in order to repair or replace sections of pipelines or production facilities that have been damaged and deferral of production in certain fields, as well as caused us to undertake environmental remediation. For the pipeline infrastructure managed by Ecopetrol S.A., the direct cost of repair pipeline infrastructure due to terrorist attacks in 2016 was approximately COP$41.7 billion (US$13.9 million, with a 3,000.71 Colombian Peso/U.S. dollar exchange rate as of December 31, 2016). Also, our production was impacted by approximately 3,215 bpd due to events related to attacks on our infrastructure that limited our production. Guerrilla groups and other illegal armed groups also attacked natural gas transportation infrastructure that have affected our natural gas production in the past. These activities, their possible escalation and the effects associated with them have had, and may have in the future, a negative impact on the Colombian economy or on us, which may affect our customers, employees, assets or the environment, with resulting containment, clean-up and repair expenses.
Likewise, theft of refined products and crude oil, resulting from security issues, may impact our results in the future. Theft of refined products, which reached a peak of approximately 7,270 bpd in 2002, was reduced to approximately 28.5 bpd in 2016. The theft of crude oil increased from approximately 646 bpd in 2015 to approximately 1,830 bpd in 2016.
Despite the peace agreement between the Colombian government and the FARC and the ongoing peace negotiation process with the National Liberation Army (the ELN), some illegal and terrorist activities of guerrilla groups or their members may continue
On November 30, 2016, the Colombian Congress approved a peace agreement between the Colombian government and the Revolutionary Armed Forces of Colombia, or FARC. Currently, the Colombian government is in the process of gradually integrating FARC members into civilian life.
On the other hand, the National Liberation Army, or ELN, an insurgency guerrilla group, has increased its actions against the Colombian security forces and the critical infrastructure of the Nation in recent months, which we believe is an attempt to show its presence and influence in some regions and put pressure on the ongoing peace negotiations which formally began in February 2016.
| 104 |
Despite the progress made with the FARC and the ongoing negotiations with the ELN, some guerrilla groups may continue their illegal and terrorist activities, resulting in a deterioration of Colombia’s national security and, consequently, negatively impacting our operating results.
There have been certain events in Colombia and abroad, which have resulted in political tensions between Colombia and some of its neighboring countries.
Diplomatic relations between Colombia and some of its neighboring countries, in particular Venezuela, have been tense in the past. Although relations with Venezuela have stabilized and improved with Colombia’s current administration, economic differences between Colombia and Venezuela, mainly due to Venezuela’s current public disorder and internal political tension, could affect our diplomatic relations, impact border cities and therefore have a negative impact on Colombia’s economy and general security situation.
Companies operating in Colombia, including us, are subject to the prevailing economic conditions and the investment climate in Colombia, which may be less stable than the prevailing economic conditions and investment climate in developed countries.
Market prices of securities issued by Colombian companies, including us, are subject to the prevailing economic conditions in Colombia. A large portion of our assets and operations are located in Colombia and most of our sales are currently derived from our crude oil and natural gas production and the production of our refineries located in Colombia. Accordingly, our financial condition and results of operations depend to a significant extent on macroeconomic and political conditions prevailing from time to time in Colombia and on the exchange rates between the Colombian Peso and the U.S. dollar.
If the perception of improved overall security in Colombia deteriorates or if the investment climate worsens, the Colombian economy may face lower growth rates than the ones posted recently, which could negatively affect our financial condition and results of operations. Furthermore, the market price of our shares and American Depositary Shares, or ADSs, may be adversely affected by changes in governmental policies, particularly those affecting economic growth, exchange rates, interest rates, inflation and taxes. The Government has changed monetary, fiscal, taxation, labor and other policies over time and has thus influenced the performance of the Colombian economy. We have no control over the extent and timing of government intervention and policies.
Colombian political and economic conditions have a direct impact on our business and may have a material adverse effect on us.
Colombia’s economic policies may have direct impact on our company as well as market conditions, the prices of securities and our ability to access national and international capital markets. Our financial condition and results of operations may be adversely affected by the following factors, among others, and the Government’s response to such factors: exchange rate movements; inflation; exchange control policies; price instability; interest rates; liquidity of domestic capital and lending markets; tax policy; regulatory policy for the oil and gas industry, including pricing policy; and other political, diplomatic, social and economic developments in or affecting Colombia.
Uncertainty over whether the Government will implement changes in policy or regulations that may affect any of the factors mentioned above or other factors in the future may lead to economic uncertainty in Colombia and increase the volatility of the Colombian securities market and securities issued abroad by Colombian companies.
Developments and the perception of risk in other countries, especially emerging market countries, may adversely affect the market price of Colombian securities, including our ADSs.
Securities issued by Colombian companies may be affected by economic and market conditions in other countries, including other Latin American and emerging market countries. Although economic conditions in Latin American countries and in other emerging market countries may differ significantly from economic conditions in Colombia, investors’ reactions to developments in these other countries may have an adverse effect on the market value of securities of Colombian issuers and our ability to access capital markets.
| 105 |
Due to past financial crises in several emerging market countries (such as the Asian financial crisis of 1997, the Russian financial crisis of 1998 and the Argentine financial crisis of 2001), the world financial crisis of 2008 and the recent sovereign debt crises in certain European countries, investors may view investments in emerging markets with heightened caution. In the past, as a result of crises in other countries, flows of investments into Colombia have been reduced. Crises in other countries, especially in emerging market countries, may hamper investor enthusiasm for securities of Colombian issuers. If Latin America experiences a new slow-down or if the price for securities of Latin American issuers falls, the price for our ADSs could follow this trend and could be adversely affected as could our ability to access domestic or international capital markets.
The Ministry of Mines and Energy has not calculated or liquidated the corresponding Net Positions for Ecopetrol as refiner and/or importer and for each fuel (gasoline and motor fuel oil) to be recognized by the FEPC to Ecopetrol for the second half of 2016
Under current Colombian regulations, the Ministry of Mines and Energy is required to periodically (initially by quarters, now twice a year) calculate and liquidate each refiner and/or importer of fuel’s Participation Differential (i.e. this arise when the international parity price is lower than the reference price established by the Ministry of Mines and Energy), leading to a “Net Position”. However due to changes in law and the Ministry methodologies we have still not received the calculations or liquidations for the second semester of 2016.
We do not know and we cannot anticipate the terms and conditions that will be established by the Ministry of Mines and Energy for future liquidations. For more information regarding the FEPC, see the sectionBusiness Overview—Applicable Laws and Regulations—Regulation of Refining and Petrochemical Activities—Regulation Concerning Production and Prices.
New or higher impairment charges relatingtaxes resulting from changes in tax regulations or the interpretation thereof in Colombia could adversely affect our results of operations and financial condition.
New tax laws and regulations, and uncertainties in the interpretation with respect to existing and future tax policies pose risks to us. In recent years, the Colombian Congress and tax authorities have imposed additional taxes such as theImpuesto sobre la Renta para la Equidad (“CREE surtax”), and enacted modifications to taxes related to financial transactions, income, value added tax (“VAT”), and taxes on net worth. In addition, in December 2016, pursuant to Law 1819, the Colombian Congress enacted a new tax reform, which became effective in 2017. For a description of taxes affecting our results of operations and financial condition in 2016, see the sectionFinancial Review—Effect of Taxes, Exchange Rate Variation, Inflation and the Price of Oil on Our Results—Taxes. Changes in tax-related laws and regulations, and interpretations thereof, can affect tax burdens by increasing tax rates and fees, creating new taxes, limiting tax deductions, and eliminating tax-based incentives and non-taxed income. In addition, tax authorities and tax courts may interpret tax regulations differently than we do, which could result in tax litigation and associated costs and penalties.
Until recently, for Colombian income tax purposes, dividends that were distributed from profits taxed at the corporate level were not taxed or subject to withholding tax at the shareholder level. However, beginning in 2017, dividends paid to non-resident shareholders are subject to a withholding tax. The withholding tax rates applicable to dividends paid to non-resident shareholders are: (i) a 5% dividend tax on dividends distributed from profits taxed at the corporate level; (ii) a 35% withholding tax rate on dividends distributed from profits not taxed at the corporate level; and (iii) an additional 5% dividend tax rate after applying the initial 35% withholding tax rate. Tax treaty rules might also apply on dividend distributions when a shareholder is a resident in a country that has executed a tax treaty with Colombia.
| 5.1.3 | Legal and Regulatory Risks |
This section discusses potential legal and regulatory risks to Ecopetrol, including the risk of having to comply with new laws and regulations.
| 106 |
Our operations are subject to extensive regulation.
The Colombian hydrocarbons industry is subject to extensive regulation and supervision by the Government and regulatory agencies in matters including the award of exploration and production blocks by the ANH, the imposition of specific drilling and exploration obligations, restrictions on production, price controls, capital expenditures and required divestments. Existing regulation applies to virtually all aspects of our operations in Colombia and abroad. The commercialization activities of some of our products also face extensive regulation. Such regulation is subject to change by the applicable regulator affecting our ability to commercialize our products. See the sectionBusiness Overview—Applicable Laws and Regulations.
The terms and conditions of the agreements with the ANH under which we explore and produce crude oil and natural gas generally reflect negotiations with the ANH and other governmental authorities and may vary by fields, basins and hydrocarbons discovered.
We are required, as are all oil companies undertaking exploratory and production activities in Colombia, to pay a percentage of our production to the Government as royalties. The Colombian Congress has modified the royalty program for crude oil and natural gas production several times in the last 20 years, as it has modified the regime regulating new contracts entered into with the Government. In the future, the Colombian Congress may once again amend royalty payment levels for new contracts and such changes could have an adverse effect on our future exploration and production in Colombia. See the sectionBusiness Overview—Applicable Laws and Regulations—Regulation of Exploration and Production Activities—Business Regulation—Royaltiesfor a description of the current royalty scheme.
Our operations in Colombia are subject to extensive national, state and local environmental regulations. Environmental rules and regulations are applicable to our exploration, production, refining, transportation, supply and marketing activities, as well as the biofuels we produce. These regulations establish, among other things, quality standards for hydrocarbon products, air emissions and greenhouse gases, water discharges and waste disposal, soil remediation, water pollution and the general storage, handling, transportation and treatment of hydrocarbons in Colombia. Currently, all exploratory projects drilling in areas that do not yet have a license must undergo an environmental impact assessment and must receive an environmental license from the governmental agency responsible for awarding environmental licenses, the Environmental License National Agency or ANLA. Environmental authorities with jurisdiction over our activities routinely inspect our crude oil fields, refineries and other production sites, and they may decide to open investigations or sanction proceedings, which may result in the imposition of fines, restrictions on operations or other sanctions in connection with potential non-compliance with environmental laws.
We are also subject to control and monitoring by the regional autonomous corporations (CAR), which are regional environmental authorities that grant permits for the use and exploitation of natural resources, establish compensation measures for the use of these resources, and perform monitoring, control and sanctions function.
If we fail to comply with any of these national or regional environmental regulations or authorities, we could be subject to administrative and criminal penalties, including warnings, fines or closure orders of our facilities. Any such criminal penalty would be imposed on the legal representatives of the Company, including any legal representative, director or worker who participated or failed to take action related to the activities that lead to environmental damage. See the sectionBusiness Overview—Applicable Laws and Regulations—Regulation of Exploration and Production Activities—Business Regulation—Environmental Licensing and Prior Consultation.
Environmental regulation has become more stringent in Colombia in recent years. As a result, our operating costs have increased in order to comply with these new technical environmental requirements as well as the need to strengthen our specialized team in charge of environmental compliance in project and operations. If environmental laws continue to impose additional costs on us, we may need to reduce our investments on strategic projects in order to allocate funds to environmental compliance. We are also exposed to delays in obtaining environmental licenses from ANLA, which can lead to cost overruns or to changes in our investment plans. These additional costs may have a negative impact on the profitability of the projects we intend to undertake or may make them economically unattractive, in turn having a negative impact on our results of operations and financial condition.
| 107 |
We are subject to foreign environmental regulations for the exploratory activities conducted by us outside Colombia. Failure to comply with foreign environmental regulations may result in investigations by foreign regulators, which could lead to fines, warnings or temporary suspensions of our operations, which could have a negative impact on our financial condition and results of operations.
Under certain of our fields.credit agreements, we are under an obligation to comply with international environmental standards established by our lenders or by multilateral institutions. Failure to comply with such environmental standards could result in an event of default under the relevant credit agreements that we, or our subsidiaries, have entered into, which would affect our financial condition. For instance, the credit facility executed by Reficar for the financing of its expansion and modernization project includes an obligation to comply with the U.S.-Exim Environmental Procedures and Guidelines and the Organization for Economic Co-operation and Development (OECD) Common Approaches on Environment and Officially Supported Export Credits, and a credit agreement executed by Ecopetrol S.A. to finance purchases of U.S. goods and services requires Ecopetrol S.A. to comply with the U.S.-Exim Environmental Procedures and Guidelines.
In 2013, operating expenses increasedaddition, we may be subject to foreign health and safety and environmental regulations for our upstream activities conducted outside Colombia. Foreign health and safety regulations may be more severe than those established under Colombian law and, therefore, we may be required to make additional investments to comply with those regulations.
We may incur losses and spend time and money defending pending lawsuits and arbitrations and responding to administrative investigations.
We are currently a party to several legal proceedings filed against us. We are also subject to labor-related lawsuits filed by 11.2%current and former employees in connection with pension plans and retirement benefits. For example, as comparedof December 31, 2016, Ecopetrol S.A. was a party to 2,774 legal proceedings relating to civil, administrative, environmental, tax, and labor claims filed against us of which 341 met the accounting threshold for an accrual provision. Additionally, Ecopetrol S.A.’s subsidiaries were a party to 1,136 legal proceedings relating to civil, administrative, environmental, tax, and labor claims filed against them of which 86 met the accounting threshold for an accrual provision. We allocate substantial amounts of money and time to defend against these claims, in which the claimants often seek substantial sums of money as well as other remedies. See Note 23– Accrued liabilities and provisions to our consolidated financial statements and see the sectionRisk Review—Legal Proceedings and Related Matters. In addition, in accordance with 2012 mainly dueColombian law, we are subject to surveillance and investigations by certain administrative control entities in Colombia, which are intended to determine whether public funds have been misappropriated or whether they have been used in compliance with applicable law. Such investigations may divert the attention of management and subject the Company to reputational risk and increase difficulties in retaining talent. See the sectionRisk Review—Legal Proceedings and Related Matters.
| 5.1.4 | Risks Related to our ADSs |
This section discusses potential risks associated with an investment in our American Depository Shares (as opposed to our common shares) by investors outside Colombia.
Holders of our ADSs may encounter difficulties in protecting their interests.
Holders of our ADSs do not have the same voting rights as holders of our shares. As set forth in the deposit agreement, dated September 16, 2008, among Ecopetrol S.A., JP Morgan Chase Bank, N.A., as depositary, and all holders from time to time of our American Depositary Receipts (the “Deposit Agreement”), ADSs may instruct our current depositary, JP Morgan Chase Bank, N.A., to vote on shareholder matters prior to a higher provision forshareholders’ meeting. Colombia law does not, however, require Ecopetrol to request proxies from existing shareholders. Thus, shareholders may not become aware of some matters in time to instruct the calculation of the pension liabilities in Ecopetrol S.A.depositary to vote their shares.
| 108 |
The segment recorded net incomeDeposit Agreement provides ADSs with the right to instruct the depositary to vote common shares separately. The viability of Ps$6,399 billion in 2014, Ps$13,322 billion in 2013this contractual provision is unclear. This is because regulatory agencies have advanced inconsistent positions regarding whether a depository must vote common shares as a single block or may vote them separately. Going forward, the Colombian regulatory authorities may change their interpretation as to how the voting rights should be exercised by ADS holders, and Ps$15,638 billion in 2012.such possible interpretation could adversely affect the value of the common shares and ADSs.
Our ADSs holders may be subject to restrictions on foreign investment in Colombia.
Colombia’s International Investment Statute (the set of rules and regulations which govern the foreign exchange market and the transactions thereto, which include Resolution 8 of 2000 and External Circular No. DCIN 83 issued by the Colombian Central Bank among others) regulates the manner in which non-Colombian residents can invest in Colombia and participate in the Colombian securities market. Among other requirements, Colombian law requires foreign investors to register certain foreign exchange transactions with the Colombian Central Bank and outlines the necessary procedures to authorize certain types of foreign investments. Colombian law requires that certain foreign exchange transactions, including international investment in foreign currency between Colombian residents and non-Colombian residents, must be made through authorized foreign exchange market intermediaries. Any income or expenses under our American Depositary Receipt, or ADR, program must be made through the foreign exchange market.
Investors acquiring our ADRs are not required to register with the Colombian Central Bank directly, as they will benefit from the registration to be obtained by the custodian for our common shares underlying the ADRs in Colombia. If investors in ADRs choose to surrender their ADRs and withdraw common shares, they must register their investment in the common shares as a portfolio investment through their local representative, which may be a brokerage firm, trust company or investment management companies supervised by the Superintendence of Finance (
Lifting and Production Costs
The aggregate average production costscost, on a Colombian Peso basis, has increaseddecreased to Ps$24,872COP$20,993 per boe during 20142016 from Ps$23,601COP$21,732 per boe during 2013, mainly2015, primarily due to:
| · | Extension of our program for reducing operating costs as well as the implementation of our transformation program. The key optimization strategies contributing to decreased production costs are: |
(1) Decrease of 3.93% in volumes of production in direct and associated contracts (excluding production tests and discovery of undeveloped fields), mainly explained by the effect of: i) pipeline and field disruptions caused by community blockages, public order and violent action matters, ii) pending environmental licenses, iii)operational failures led by instability of the power grid, iv) fluid treatment hurdles, and v) rescheduling of maintenance mainly in the Orinoquia and Southern Regions;
| (i) | Reduction in number of services due to equipment failure, equipment reuse for electric submersible pump (ESP), less maintenance and well monitoring, renegotiation of tariffs and decrease in time to well interventions. |
| (ii) | Less tariffs on surface maintenance, reduction of costs by adjustment in integrity strategy, change in equipment inspection periods according to condition, decrease of tariffs of administrative items and prioritization of interventions. |
| (iii) | Decrease in energy tariffs, reduction of generation with liquid fuels (Diesel - Fuel Oil No.4), increase in efficiency through the entry of our own generation centers and increase in electrical reliability. |
| (iv) | Lower levels of chemical applied in the process of treatment of fluids, biological treatment insurance, reduction in production, transportation and disposal of oily waste and reduction of contracting, inspection and repair through renegotiation of contracts. |
(2) Increased costs in our joint venture contracts as a result of: i) higher water volumes requiring the application of injection techniques for water disposal demanding higher energy consumption, ii) higher repair costs as a consequence of increased terrorist attacks on the oil infrastructure in the Orinoquia and Southern regions and iii) rains that flooded our oilfields (especially in the Orinoquia region) and led to higher costs for maintenance, reconditioning and safety improvements. This increase was partially offset by a decrease in direct operation costs, especially in Orinoquia and Central region due to lower costs obtained once we implemented optimization projects to increase efficiency in processes like: subsurface and surface maintenance, energy savings, fluid treatment, and dilution of heavy crudes.
| 80 |
| (v) | A decrease in production volumes in direct and associated contracts (excluding production tests and discovery of undeveloped fields), mainly due to smaller production in the Yarigui-Cantagallo and Pauto fields of direct operation and a decrease in production volumes from fields held as part of a partnership, such as Rubiales (first half of 2016), La Cira Infantas and Chuchupa, which in turn was primarily due to the prioritization of investments for assets of fast cash return and our policy of profitable fields. |
As a result of the above-mentioned factors, our aggregate average lifting costsproduction cost, on a Colombian Peso basis, increaseddecreased in 20142016 as compared to 2013. However on2015. On a dollar basis, it decreased to US$11.296.88 per boe in 20142016 from US$11.577.92 per boe in 20132015 also due to a 7.05%an 11.21% depreciation of the average exchange rate of the Colombian Peso against the U.S. dollar.dollar in 2016.
The aggregate average production costslifting cost, on a Colombian PesosPeso basis, increasedhas decreased to Ps$23,601COP$19,799 per boe during 20132016 from Ps$23,088COP$20,308 per boe during 2012, mainly2015, primarily due to:
| · |
| (i) | Reduction in number of |
| (ii) | Less tariffs on surface maintenance, reduction of costs by adjustment in integrity strategy, change in equipment inspection periods according to condition, decrease of tariffs of administrative items and prioritization of interventions. |
| (iii) | Decrease in energy tariffs, reduction of generation with liquid fuels (Diesel - Fuel Oil No.4), increase in efficiency through the entry of our own generation centers and increase in electrical reliability. |
| (iv) | Lower levels of chemical applied in the process of treatment of fluids, biological treatment insurance, reduction in production, transportation and |
| · |
As a result of the above-mentioned factors, our aggregate average lifting costscost, on a Colombian Peso basis, increaseddecreased in 20132016 as compared to 2012. However on2015. On a dollar basis, it decreased to US$11.576.49 per boe in 20132016 from US$11.937.40 per boe in 20122015 also due to a 3.93%an 11.21% depreciation of the average exchange rate of the Colombian Peso against the U.S. dollar.dollar in 2016.
The difference between the aggregate average lifting costscost and aggregate average production costscost is that lifting costs do not include the costs related to consumption of hydrocarbons by Ecopetrolus in its Productionour production process andor that Ecopetrol sold to our refineries and natural gas liquid plants.
The following table sets forth crude oil and natural gas average sales prices, the aggregate average lifting costs and aggregate average unit production costscost for the years ended December 31, 2014, 20132016, 2015 and 2012.2014.
| 2014 | 2013 | 2012 | ||||||||||
| Crude Oil Average Sales Price (U.S. dollars per barrel)(1) | 87.55 | 98.85 | 103.11 | |||||||||
| Crude Oil Average Sales Price (Ps$per barrel)(1) | 174,274 | 184,768 | 186,004 | |||||||||
| Natural Gas Average Sales Price (U.S. dollars per barrel equivalent) | 23.72 | 26.99 | 27.80 | |||||||||
| Natural Gas Average Sales Price (Ps$per per barrel equivalent) | 47,663 | 50,448 | 49,983 | |||||||||
| Aggregate Average Unit Production Costs (U.S. dollars per boe)(2) | 12.43 | 12.63 | 12.84 | |||||||||
| Aggregate Average Unit Production Cost (Ps$per boe)(2) | 24,872 | 23,601 | 23,088 | |||||||||
| Aggregate Average Lifting Costs (U.S. dollars per boe)(3)(4) | 11.29 | 11.57 | 11.93 | |||||||||
| Aggregate Average Lifting Costs (Ps$per boe)(3)(4) | 22,581 | 21,624 | 21,441 | |||||||||
| 81 |
Table 48 – Crude Oil and Natural Gas Average Prices and Costs
| 2016 | 2015 | 2014 | ||||||||||
| Crude Oil Average Sales Price (U.S. dollars per barrel)(1) | 35.7 | 43.9 | 87.3 | |||||||||
| Crude Oil Average Sales Price (COP$ per barrel)(1) | 108,337 | 118,115 | 173,769 | |||||||||
| Natural Gas Average Sales Price (U.S. dollars per barrel equivalent) | 23.5 | 22.0 | 23.9 | |||||||||
| Natural Gas Average Sales Price (COP$ per barrel equivalent) | 71,893 | 60,120 | 47,912 | |||||||||
| Aggregate Average Unit Production Costs (U.S. dollars per boe)(2) | 6.88 | 7.92 | 12.43 | |||||||||
| Aggregate Average Unit Production Cost (COP$ per boe)(2) | 20,993 | 21,732 | 24,872 | |||||||||
| Aggregate Average Lifting Costs (U.S. dollars per boe)(3)(4)(5) | 6.49 | 7.40 | 11.29 | |||||||||
| Aggregate Average Lifting Costs (COP$ per boe)(3)(4) (5) | 19,799 | 20,308 | 22,581 | |||||||||
| (1) | Corresponds to our average sales price on a consolidated basis. |
| (2) | Unit production costs correspond to consolidated average costs on total production volumes net of royalties. Production costs do not include costs related to transport, commercialization and administrative expenses. |
| (3) | Lifting costs per barrel are calculated based on total production (excluding production tests and discovered undeveloped fields), which are net of royalties, and correspond to our lifting costs on a consolidated basis. |
| (4) | The cost indicator is calculated by using the cost of production (does not include costs related to hydrocarbons consumption by Ecopetrol in the production process, such as by our refineries and natural gas liquid plants) and dividing by the net produced volume (excluding royalties) as the denominator. |
| (5) | As a result of the evaluation of control over companies under IFRS, Ecopetrol does not consolidate Savia Perú and Equion. As a consequence, the information in the table above for this annual report (which has been prepared under IFRS) differs from the information we previously published for 2014 under Colombian Government Entity GAAP (where we did consolidate Savia Perú and Equion). |
| Transportation and Logistics Segment Results |
In 2014,2016, ourtransportation and logistics segment sales were COP$10,648,776 million compared to COP$10,844,550 million in 2015. The 1.8% decrease in 2016 as compared with 2015 was mainly due to an 11.3% decrease in the volume of crude oil transported by our pipelines, which was primarily due to the production decrease at the national level, in spite of (i) the positive effect on our U.S. dollar-indexed transportation fees resulting from the devaluation of the Colombian Peso against the U.S. dollar and (ii) a 3.7% increase in the volume of refined products transported in the Galán-Sebastopol system to meet the demand for fuel in the country’s interior and the start-up of Reficar. Sales to third parties decreased in 2016 as compared to 2015 primarily due to the segment received income from the transportation services to Pacific Rubiales for its participation in the Rubiales field, and once the field returned to us in July 2016, these services were recognized as inter-segment sales.
In 2015, our transportation and logistics segment sales were Ps$7,966 billionCOP$10,844,550 million compared to Ps$6,215 billionCOP$8,343,934 million in 2013 and Ps$4,052 billion in 2012.2014. This 28.2%30% increase in 20142015 as compared with 20132014 was mainly due to higher capacity and volume of crude oil and naphtha transported by Cenit,the Ocensa, Caño Limón Coveñas and ODL,Oleoducto Transandino pipelines due to the start-updecline in the number of Bicentenario Pipeline in November 2013attacks on our infrastructure and the positive effect on our U.S. dollar-indexed transportation fees resulting from the devaluation of the Colombian Peso against the U.S. dollar.
In 2013, our transportation and logistics segment sales increased by 53% as compared with 2012 mainly due to: 1) the new profit-center model for the segment; 2) an increase in the transported volumes of crude oil associated with higher crude oil production in Colombia and 3) higher volume of products transported, mainly as a result of higher volumes of naphtha transported to dilute heavy crude oil.
Thecost of sales for our transportation and logistics segment is mainly related to: 1)(i) project costs associated with the maintenance of transportation networks and 2)(ii) operating costs related to these systems, including the constructioncosts of labor, energy, fuels and conversion of existing pipelines for the transportation of heavy crude oil.lubricants and others.
The cost of sales amounted Ps$3,866 billionto COP$3,349,791 million in 2014, Ps$3,519 billion2016 as compared to COP$3,744,422 million in 2013 and Ps$2,952 billion in 2012.2015. The cost of sales for this segment increaseddecreased by 9.9%10.5% in 20142016 as compared with 20132015 mainly due to an increase of fixeda decrease in costs associated with maintenance, operating supplies and materials due to the continuity of our program to optimize our operating costs. This decrease was partially offset by an increase in material processing costs needed for power generation in pumping stations and an increase in depreciation due to a higher level of investments in the start of operation of the Bicentenario Pipeline.segment.
The cost of sales amounted to COP$3,744,422 million in 2015 and COP$3,941,052 million in 2014. The cost of sales for this segment increaseddecreased by 19.2%5% in 20132015 as compared with 20122014 mainly due to 58.6% changea decrease in variablecosts associated with maintenance and operating supplies and materials. This decrease was partially offset by an increase in depreciation and amortization due to our increased investments in this segment.
| 82 |
In 2016,operating expenses before the impairment of non-current assets increased by 30.7% as compared to 2015 due to a recovery of environmental provisions in 2015, no similar recoveries in 2016 and an increase in labor costs as a result of anthe implementation of the voluntary retirement plan. This increase in transported volumes (especially of heavy crude oil). Fixed costs increased 13.7% mainly due to an increase in the costs associated with the development of our pipeline integrity program.was partially offset by lower wealth and industry taxes.
In 2014,2015, operating expenses increasedbefore the impairment of non-current assets decreased by 5.5%16.2% as compared with 2013to 2014 due to the emergencies generated by attacks ondecreased expenses related to social investment and security agreements, and more stable operations due to a decrease in repairs of our transportation infrastructure. In 2013, operating expensessystems. This decrease was partially offset by (i) the Colombian wealth tax implemented in 2015 and, (ii) increased depreciation and amortization.
Theimpairment of non-current assets recognized in the segment in 2016 which totaled COP$41,062 million recovery in 2016 as compared to COP$81,388 million expense in 2015, decreased by 20.3%150.5% as compared with 2012, largely as a result of different capitalization criteria of Ecopetrol S.A. and Cenit for transportation assets when, as partto 2015 mainly by the incorporation, in the assessment of the transferrecovery amount of this segment’s assets, of flows associated to the San Fernando - Apiay system project that affects the recoverable amount of the Llanos transportation line, partially offset by an increase in impairment of assets related to Cenit, Cenit recognized expensesthe southern transportation line. (See Note 17.3 to our consolidated financial statements for more detail).
The increased impairment charges for non-current assets in 2015, which totaled COP$81,388 million as partcompared to a COP$1,121 million recovery of property, plantimpairment in 2014 was primarily due to Colombia’s hydrocarbon production curves, based on the crude oil price environment and equipment.pipeline transportation rates (see Note 17.3 to our consolidated financial statements).
The segment recorded anet income attributable to owners of Ecopetrol of COP$2,960,449 million in 2016 as compared to net income of Ps$1,767 billionCOP$2,819,759 million in 2014, Ps$1,124 billion2015 and COP$1,758,777 million in 2013 and Ps$186 billion.2014.
| Refining and Petrochemicals Segment Results |
In 2014,2016, therefining and petrochemical segment sales were COP$24,823,714 million compared to COP$23,245,676 million in 2015. In 2016, sales of refined products and petrochemicals increased by 6.8% as compared with 2015, mainly due to an increase in the volume of domestic and export sales mainly in mid-distillates due to the startup of operations at Reficar. This increase was partially offset by a decrease or our average products basket price due to the decrease in the international price of crude oil.
In 2015, the refining and petrochemical segment sales were Ps$27,110 billionCOP$23,245,676 million compared to Ps$29,236 billionCOP$27,172,300 million in 2013 and Ps$29,512 billion in 2012.2014. In 2014,2015, sales of refined products and petrochemicals decreased by 7%14.5% as compared with 2013,2014, mainly due to: 1)(i) a decrease in the international price of fuels and 2)(ii) a dropdecrease in exportforeign sales volumes of fuel oil due to the shutdownlow water level in the Rio Magdalena. This decrease was partially offset by (i) an increase in the volume of domestic sales due to increased local demand for fuel resulting from an increased number of vehicles and the Cartagena Refineryclosure of Colombia’s border with Venezuela that led to higher diesel demand and (ii) an increase in March 2014 in preparation for the new refinery. Sales decreased less thanintercompany sales due to higher volumes of diluent sold to our exploration and production because, given reduced output from the Cartagena Refinery, this segment purchased and resold refined products to meet domestic demand.segment.
In 2013, sales of refined products and petrochemicals decreased by 1% as compared with 2012 mainly due to lower intersegment sales of naphtha and the scheduled shutdown of the U-250 unit in the Barrancabermeja Refinery. Total refining and petrochemicals segment sales to third parties increasedTheby 1.7% mainly as a result of the higher demand for gasoline and middle distillates from the automotive, aviation and mining sectors.
The cost of sales for our refined products and petrochemicals segment is mainly related to the purchase of crude oil and natural gas for our refineries, imported products to substitute for the loss of production due to the planned shutdownclosure of Reficar as the Cartegena Refinery, feed stocknew refinery was being built for most of 2014 and 2015, feedstock transportation services, services contracted for maintenance of the refinery and the amortization and depreciation of refining assets. Cost of sales amounted Ps$25,947 billionCOP$22,843,987 million in 20142016, compared to Ps$29,214 billionCOP$20,758,808 million in 20132015 and Ps$29,423 billionCOP$25,537,228 million in 2012.2014.
In 2014,2016, the cost of sales for this segment increased 10% as compared with 2015, principally due to the operation of Reficar’s units in 2016 which led to (i) an increase in crude oil purchases through import and inter-segment transactions as Reficar required a special raw material or ‘diet’ during the stabilization and performance testing period which increased production cost, (ii) an increase in the depreciation of Reficar’s units (iii) inventory consumption that had been in stock in December 2015, and (iv) higher costs for services contracted, materials of process, maintenance and electrical power. This increase was partially offset by lower imports of products and the excellent operational performance of the Barrancabermeja Refinery.
| 83 |
In 2015, the cost of sales for this segment decreased 11%18.7% as compared with 2013,2014, principally due to lower raw material costs, which corresponded to the decrease in international oil prices reduced purchases of crude oil mainlyand lower operating costs as a consequenceresult of the shutdown of Refinería de Cartagena and lower imports of jet and diesel fuels due to increased production incost optimization at the Barrancabermeja Refinery. This decrease was partially offset by higher imports of fuels (mainly gasoline)gasoline due to meetincreased local demand infor fuel resulting from an increased number of vehicles and the north coastclosure of the country because of the shutdown of Refineria de Cartagena.Colombia’s border with Venezuela.
In 2013, cost2016,operating expenses before the impairment of sales for this segment decreasednon-current assets increased by 0.7%27.3% as compared with 2012to 2015, due to a 1.4% decreasean increase in variable costs, which accounts for 93%labor expenses related to our voluntary retirement plan in 2016 and other expenses related to the start-up of total costs, mainly as a result of the reduction in throughput of Barrancabermeja refinery as a result of crude unit U-250’s scheduled shutdown and lower availability of light crudes. On the other hand, fixed costs increased by 9.6%, primarily as a consequence of the 2012 tax reform, which required us to assume a higher VAT tax burden.operations at Reficar.
In 2014, the2015, operating expenses before the impairment of non-current assets increased by 23% as compared to 2014, due to higher levels of investment for the Reficar modernization project, the Colombian wealth tax implemented in 2015 and the increase in other expenses related to the start-up of operations at Reficar.
Theimpairment of non-current assets recognized in the segment in 2016, which totaled COP$773,361 million in 2016 as compared to COP$3,278,993 million in 2015, decreased by 6.7%76.4% as compared with 2013 mainly due to a lower pension liabilities provision which was2015. The 2016 scenario incorporated the refining margins that include the effect of Marpol in 2016 compared to 2015, partially offset by an increasethe effect of adjustment of operational variables based on that observed during Reficar’s stabilization period and new ethanol prices on Bioenergy’s impairment (see Note 17.2 to our consolidated financial statements). As mentioned earlier, the refining segment is highly sensitive to changes in loss from fixed assets from Reficar mainly due to obsolescence. In 2013, operating expenses increased by 75% as compared with 2012 mainly due to a higher pension provision.product prices and raw materials in the international market, the discount rate given the leveraging, the refining margins, changes in environmental regulations and cost structure and the level of capital expenditures.
The operating marginincreased impairment charges for non-current assets in 2015, which totaled COP$3,278,993 million in 2015 as compared to COP$1,340,086 million in 2014 was -1.3%recorded by the Cartagena Refinery due to the current low oil price environment, which resulted in a reduction in expected refining margins in the coming years, and an increase in market and country risk, which has been reflected in the discount rate (see Note 17.2 to our consolidated financial statements).
The gross margin in 2016 was 8%, compared to -5.5%10.7% in 2013.2015. The increasedecrease in the operatinggross margin was explained principally by a higherdecreased operational activity during the period of stabilization and testing of Reficar.
The gross margin in 2015 was 10.7%, compared to 6% in 2014. The increase in the gross margin was explained principally by decrease in the oil price (feedstock) compared to the decrease in fuel prices (output).
The refining and petrochemicals segment recorded net loss attributable to owners of Ecopetrol of COP$1,823,020 million in 2016 as compared to a net loss attributable to owners of Ps$898 billionEcopetrol of COP$4,016,050 million in 2014, Ps$1,301 billion2015 and COP$1,627,705 million in 2013 and Ps$920 billion in 2012.2014.
| Liquidity and Capital Resources |
Our principal sources of liquidity in 20142016 were cash flows from our operations amounting to Ps$17,505 billionCOP$14,232,940 million, and cash flows from financing activities, mainly from the proceeds of our additionalnet movement of indebtedness, which totaled Ps$7,153 billion.COP$ 1,444,723 million.
Our principal uses of liquiditycash in 20142016 were 1) Ps$15,682 billion(i) COP$5,837,477 million in capital expenditures, which included investments in property, plant and equipment and natural and environmental resources and reserves and additions to our property, plant and equipment and 2)(ii) COP$5,446,507 in investment of liquidity surpluses in portfolios, (iii) dividend payments for the fiscal year 20142015 amounting to Ps$12,558 billion.COP$1,712,298 million, which included the last installment of dividends to the majority shareholder relating to fiscal year 2014 for COP$690,177 million and the payment of dividends to non-controlling interest in 2016 for COP$1,022,121 million.
On January 29, 2016, we entered into an international credit agreement for an aggregate amount of US$175 million with The Bank of Tokyo-Mitsubishi UFJ, Ltd. The credit agreement has a term of five years, repayable with a 2.5 year grace period on principal and interest, payable semi-annually at a rate of Libor plus 145 basis points.
| 84 |
On February 23, 2016, we entered into a bilateral commercial loan agreement with Bancolombia S.A. for COP$990 billion (approximately US$330 million at the representative exchange rate of as of December 31, 2016). This loan agreement had a term of 8 years and a 2-year grace period on principal, with interest payable semiannually at a rate of DTF TA plus 560 basis points. Ecopetrol prepaid this loan in full with excess liquidity in October 2016.
On May 16, 2016, we entered into a bilateral commercial loan agreement with Export Development Canada, an export promotion agency of the Canadian Government for US$ 300 million. This loan agreement has a term of five years, with interest payable semi-annually at rate of six-month Libor + 140 basis points.
On June, 2016, we issued US$500 million (COP$1,500 billion according to the COP$/US$ exchange rate as of December 31, 2016) aggregate principal amount of our SEC-registered 5.875% notes due 2023. The notes were listed on the NYSE.
| 4.6.1 | Review of Cash Flows |
Cash from operating activities
Net cash provided by operating activities increased by 21.9% in 2016 as compared to 2015, mainly as a result of (i) lower working capital needs mainly due to the higher oil prices observed at the end of 2016 versus the end of 2015, (ii) a 4% increase in our operational income before depreciation, depletion and amortization (DD&A) and impairment of non-current assets resulting from a decrease in our costs and operational expenses (before DD&A and impairment) due to our savings generated by the transformation plan. This increase was partially offset by (i) the decrease in international prices of crude oil during 2016, and (ii) an increase in income tax paid by the transportation and logistics segment due to the better results in 2015.
Net cash provided by operating activities decreased by 0.10%35.6% in 20142015 as compared with 2013,to 2014, mainly as a result of 1)of: (i) a 2% drop33.2% decrease in our revenuesgross income resulting from the decrease in international prices of crude oil laterduring 2015 and (ii) higher operating expenses due to the Colombian wealth tax implemented and paid in the year, 2) higher cost of sales mainly resulting from higher naphtha and ultra low sulfur diesel purchases, and 3) an increase in dry well expenditures and purchases of seismic studies,2015. This decrease was partially offset by costsa decrease in income tax paid due to the decrease in our income before tax for purchased crude oil, gas and refined productsthe year and lower working capital needs.
Net cash provided by operating activities decreased by 17% in 2013 compared with 2012 as a result of a 5% increase in cost of sales mostlyneeds due to the increasea decrease in 1) purchases of imported products, mainly naphthainventories, trade receivables and ultra low sulfur diesel, 2) higher service costs in association contracts mainly for water treatment, 3) maintenance costs for the pipeline integrity program and 4) labor costs. The 21% increase in operating expenses in 2013 negatively impacted net cash as well, compared with 2012.accounts payable.
Cash used in investing activities
In 2014,2016, net cash used in investing activities increased by 46% as compared with 2013 mainly due to 1) larger investments in capital expenditures mainly in Cartagena and Barrancabermeja Refineries modernization projects and investments in Castilla, Rubiales and Chichimene fields 2) a lower net cash contribution from purchases and sales of fixed income investments.
Net cash used in investing activities decreased by 42% in 201326.8% as compared with 2012to 2015, mainly as a result of: (i) a 62.4% decreased investments in capital expenditures due to (1) a 49% reductionthe effect of investments for liquidity purposes, 2) a 19% decrease indecreasing oil prices and the end of the Reficar modernization project, and (ii) additional cash proceeds from the sale of our investments in property, plantEmpresa de Energía de Bogotá and equipmentInterconexion Electrica S.A, which totaled COP$966,715 million in the aggregate. This decrease was partially offset by increased investments of our excess liquidity in our investment portfolios, which in turn resulted from the savings we achieved and natural resources and 3)the recovery of the price of oil during the second half of 2016.
In 2015, net cash used in investing activities decreased by 2.4% as compared to 2014, mainly as a 13%result of: (i) a decrease in the redemptionsamount of dividends we received from associates and salesjoint ventures companies (ii) slightly larger investments in capital expenditures, mainly relating to the Reficar modernization project and our drilling campaigns, primarily in the Castilla, Chichimene and Rubiales fields, and (iii) a lower net cash contribution from purchase and sale of securities,fixed income investments. This decrease was partially offset by cash proceeds from the effectsale of our investment in Empresa de Energia de Bogotá, which was offset in part by a 12% increase in natural resources investments.totaled COP$613,998 million.
| 85 |
Cash used in financing activities
Net cash used in financing activities increased by 98.5% in 2016, as compared to 2015, due to a decrease in cash from borrowings of COP$5,151,937 million which was partially offset by a decrease in dividends payments of COP$3,781,099 million in 2016 as compared to 2015.
Net cash used in financing activities decreased 24%by 81% in 20142015, as compared with 2013 mainlyto 2014, due to a 14%COP$7,023,166 million decrease in dividend payments.
Net cash used in financing activities increased 110% in 2013 compared with 2012 mainly due to the 73% increase in dividend payments, which was partially offset by cash resources from financial obligationsan increase in borrowing and interest payments of COP$1,069,146 million in 2015 as compared to 2014, which increased 47%, mainly fromin turn was due to the US$1,925 million international loan we entered into in February 2015 and localthe US$1,500 million international bond issuances from Ecopetrol S.A.we issued in June 2015.
| 4.6.2 | Capital Expenditures |
The following table sets forth ourOur consolidated capital expenditures in 2016, 2015 and 2014 were COP$5.8 trillion, COP$15.5 trillion and COP$15.6 trillion, respectively. These investments were distributed by business segment on average, for each ofthe past three years as follows: 61.2% for the exploration and production segment, 22.1% for refining and petrochemicals and 16.7% for the transportation and logistics segment. See Note 34.1.2 to our business segmentsconsolidated financial statements for 2014, 2013, and 2012.more detail about capital expenditures by segment.
| For the year ended December 31, | ||||||||||||
| 2014 | 2013 | 2012 | ||||||||||
| (Pesos in millions) | ||||||||||||
| Exploration and Production | 9,848,039 | 9,622,932 | 8,225,642 | |||||||||
| Refining and Petrochemicals | 4,251,036 | 3,835,556 | 4,460,105 | |||||||||
| Transportation and Logistics | 1,583,317 | 766,326 | 2,782,115 | |||||||||
| Total | 15,682,392 | 14,224,814 | 15,467,862 | |||||||||
Our investment plan approved for 20152017 totals US$7,8603,500 million. The investments will be distributed as follows: 61%81% for exploration and production, 16%10% for refining and petrochemicals, and 23%8% for transportation and logistics.logistics, and 1% for other investments.
The resources required for the investment plan will be funded through internal cash generation divestment of non-strategic assets andwith no need to raise additional net financing. The Company has borrowing capacity, investment grade rating and access to capital markets in Colombia and abroad.
| 4.6.3 | Dividends |
In 2014,2016, we paid the last installment of dividends of Ps$12,558 billionrelating to our net income to the Nation of COP$690,177 million and our transportation and logistics’ subsidiaries paid dividends to their non-controlling shareholder for COP$1,022,121 million. Given the net loss we reported in 2015, our shareholders includingat the Nation. Asordinary general shareholder’s meeting did not approve distribution of December 31, 2014, we had no outstanding obligations to pay dividends.dividends for 2015.
On March 26, 2015,31, 2017, our shareholders at the ordinary general shareholders’ meeting approved dividends for the fiscal year ended December 31, 20142016 amounting to Ps$5,469 billion,COP$945,684 million, or Ps$133COP$23 per share, based on the number of outstanding shares as of December 31, 2014.
2016. The dividends corresponding to the Nation will bedividend was paid in four installments. The first payment will be made on October 23, 2015, the second will be made on November 20, 2015, the third will be made on December 15, 2015 and the fourth will be made between December 21, 2015 and March 11, 2016. The dividends corresponding to minority shareholders will be paid on a singleone installment on June 22, 2015.
No interest will accrue on the above-mentioned payments.April 28, 2017.
| 4.7 | Summary of Differences between Internal Reporting (Colombian IFRS and IFRS) |
We prepare our interim and annual statutory financial information in accordance with our internal reporting policies, which follow Colombian IFRS and differ in certain significant aspects from IFRS. The following table sets forth our consolidated net income and equity for years ended December 31, 2016, 2015 and 2014, in accordance with Colombian IFRS and IFRS:
Table 49 – Consolidated Net Income and Equity
| For the year ended December 31, | ||||||||||||||||||||
| (Colombian Pesos in millions) | % Change | |||||||||||||||||||
| 2016 | 2015 | 2014 | 2016/2015 | 2015/2014 | ||||||||||||||||
| Net income attributable to owners of Ecopetrol (IFRS) | 2,447,881 | (7,193,859 | ) | 5,046,517 | (134.0 | ) | (242.6 | ) | ||||||||||||
| Cash flow hedge for future company exports | (494,604 | ) | 2,140,553 | – | (123.1 | ) | N/A | |||||||||||||
| Exchange rate effects on tax bases – Deferred tax | (388,568 | ) | 1,065,580 | 678,983 | (136.5 | ) | 56.9 | |||||||||||||
| Net income Attributable to owners of Ecopetrol (Colombian IFRS) | 1,564,709 | (3,987,726 | ) | 5,725,500 | (139.2 | ) | (169.6 | ) | ||||||||||||
| Net Equity (IFRS) | 43,560,501 | 43,100,963 | 48,534,228 | 1.1 | (11.2 | ) | ||||||||||||||
| Cash flow hedge for future company exports | (39,803 | ) | (74,259 | ) | – | (46.4 | ) | N/A | ||||||||||||
| Exchange rate effects on tax bases – Deferred tax | 1,799,020 | 2,205,064 | 998,440 | (18.4 | ) | 120.9 | ||||||||||||||
| Net Equity (Colombian IFRS) | 45,319,718 | 45,231,768 | 49,532,668 | 0.2 | (8.7 | ) | ||||||||||||||
| 86 |
As noted above, certain differences exist between our net income and equity as determined in accordance with our internal reporting policies, which follow Colombian IFRS, which are used for management reporting purposes, as presented in the business segment information, and our net income and equity as determined under IFRS, as presented in our consolidated financial statements.
The primary differences between Colombian IFRS and IFRS as they apply to our results of operations are summarized below:
| · | Cash flow hedge for future company exports. In September 2015, in order to hedge the effect of exchange rate volatility on Ecopetrol’s foreign currency debt, Ecopetrol’s Board of Directors approved a cash flow hedge for future crude oil exports. According to IAS 39 – Financial Instruments, Ecopetrol implemented this hedge beginning on October 1, 2015, the date on which it formally completed the related hedging documentation. |
Under Colombian IFRS, theContaduria General de la Nación (CGN for its acronym in Spanish) issued Resolution 509, which allows companies to apply hedge accounting for non-derivative financial instruments from any date within the transition period or the first period of application of International Accounting Standards in Colombia, even if such company has not yet formally documented the hedging relationship, the objective or the risk management strategy. Under these rules, Ecopetrol applied cash flow hedge accounting from January 1, 2015 in its financial statements under Colombian IFRS.
As a result of this accounting policy differences, for the year ended December 31, 2016, our net income as reported under IFRS was COP$494,604 million higher than our net income as reported under Colombian IFRS.
| · | Exchange rate effects on tax bases – Deferred tax. According to IAS 12.41, companies with a U.S. dollar functional currency and profit or tax loss in Colombian Pesos are required to recognize deferred taxes attributable to the difference between the carrying amounts of non-monetary assets in their financial statements and their respective tax bases converted from Colombian Pesos to U.S. dollars using the exchange rate on the closing date. The effect of the temporary difference is charged to profit and losses without a cash outflow expected in the future. Under local accounting principles, the result attributable to the aforementioned difference in accounting policies does not generate deferred taxes at December 31, 2016. |
Ecopetrol’s functional currency is the Colombian Peso and it consolidates some subsidiaries whose functional currency is the U.S. dollar but who settled their taxes in Colombian Pesos. As a result of the application of paragraph 41 – IAS 12, such subsidiaries are required to calculate deferred taxes under IFRS.
As a result of this accounting policy difference, for the year ended December 31, 2016, our net income attributable to owners of Ecopetrol as reported under IFRS was COP$388,568 million higher than our net income attributable to owners of Ecopetrol as reported under Colombian IFRS.
| 87 |
The application of IAS12.41 also generated adjustments to our goodwill and investments in companies impairments of COP$86,781 million in 2016 and COP$418,872 million in 2015 in connection with our purchase of subsidiaries whose functional currency is the U.S. dollar as well as adjustments to our revenue from the equity method of COP$71,056 million in 2016 and COP$81,808 million in 2015 in connection with our associates and joint ventures whose functional currency is the U.S. dollar.
As a result of these accounting policy differences described above, for the year ended December 31, 2016, we reported net income attributable to the owners of Ecopetrol under IFRS of COP$2,447,881 million as opposed to a net income attributable to the owners of Ecopetrol of COP$1,564,709 million reported under Colombian IFRS for the same period. For the year ended December 31, 2015, these same accounting differences led us to report a net loss under IFRS of COP$7,193,859 million as opposed to a net loss of a COP$3,987,726 million reported under Colombian IFRS for the same period.
| Financial Indebtedness and Other Contractual Obligations |
As of December 31, 2014,2016, we had outstanding consolidated indebtedness of Ps$35,649 billion,COP$52.2 trillion, which corresponded mainlyprimarily to the following long termlong-term transactions:
Table 50 – Consolidated Financial Indebtedness
| Company | Type | Initial Date | Original Amount | Maturity | Interest Rate | Amortization | ||||||||
| Ecopetrol S.A. | Bonds | July 23, 2009 | July 23, 2019 | 7.625 | % | Bullet | ||||||||
| September 18, 2013 | September 18, 2018 | 4.250 | % | Bullet | ||||||||||
| September 18, 2013 | September 18, 2023 | 5.875 | % | Bullet | ||||||||||
| September 18, 2013 | September 18, 2043 | 7.375 | % | Bullet | ||||||||||
| May 28, 2014 | May 28, 2045 | 5.875 | % | Bullet | ||||||||||
| September 16, 2014 | January 16, 2025 | 4.125 | % | Bullet | ||||||||||
| % | Bullet | |||||||||||||
| June 15, 2016 | US$500 million* | September 18, 2023 | 5.875 | % | Bullet | |||||||||
| December 1, 2010 | December 1, 2017 | Floating | Bullet | |||||||||||
| December 1, 2010 | December 1, 2020 | Floating | Bullet | |||||||||||
| December 1, 2010 | December 1, 2040 | Floating | Bullet | |||||||||||
| August 27, 2013 | August 27, 2018 | Floating | Bullet | |||||||||||
| August 27, 2013 | August 27, 2023 | Floating | Bullet | |||||||||||
| August 27, 2013 | August 27, 2028 | Floating | Bullet | |||||||||||
| August 27, 2013 | August 27, 2043 | Floating | Bullet | |||||||||||
| Bank | May 27, 2013 | May | Floating | Semi-annual | ||||||||||
| February 12, 2015 | US$1,925 million | February 12, 2020 | Floating | Bullet | ||||||||||
| January 29, 2016 | US$175 million | February 11, 2021 | Floating | Semi-annual | ||||||||||
| ECAs | March 22, 2013 | July 25, 2023 | Floating | Semi-annual | ||||||||||
| March 22, 2013 | July 6, 2019 | Floating | Semi-annual | |||||||||||
| May 16, 2016 | US$300 million | May 24, 2021 | Floating | Bullet | ||||||||||
| Reficar | Project Finance | December 30, 2011 | December 20, 2027 | Floating / Fixed | Semi-annual | |||||||||
| Ocensa | Bond | May 7, 2014 | May 7, 2021 | 4.000 | % | Bullet | ||||||||
| Oleoducto Bicentenario | Bank Loan | July 5, 2012 | July 5, 2024 | Floating | Quarterly | |||||||||
| ODL | Bank Loan* | August 1, 2013 | August 1, 2020 | Floating | Quarterly | |||||||||
* Reopening of bond due to 2023.
** Bank loans refinanced from their original conditions.
The main new long term debt transactions executed in 20142016 were international bonds, as follows:
| · |
| · | On February 23, 2016, Ecopetrol S.A. entered into a bilateral commercial loan agreement with Bancolombia S.A. in an aggregate amount of COP$990 billion (approximately US$330 million at the representative exchange rate as of December 31, 2016). This loan agreement had a term of 8 years and a 2-year grace period on principal, with interest payable semiannually at a rate of DTF TA plus 560 basis points. As of the date of this annual report, this loan has been prepaid in full. |
| 88 |
| · | On May 16, 2016, Ecopetrol S.A. entered into a bilateral loan agreement with Export Development Canada (EDC), an agency for the promotion of exports of the Government of Canada, in an aggregate amount of US$300 million. This loan agreement has a term of 5 years with principal due at maturity and interest payable semiannually at a rate of LIBOR plus 140 basis points. |
| · | On June 15, 2016, Ecopetrol S.A reopened its SEC-registered 5.875% Notes due |
| · | On November 16, 2016, the |
Contractual Obligations
We enter into various commitments and contractual obligations that may require future cash payments. The following table summarizes our contractual obligations as of December 31, 2014.2016.
| Payments due by period | ||||||||||||||||||||
| Ps$ millions | Total | Less than 1 year | 1 to 3 years | 3 to 5 years | More than 5 years | |||||||||||||||
| Contractual Obligations: | ||||||||||||||||||||
| Employee Benefit Plan | 27,081,826 | 1,071,196 | 2,215,947 | 2,389,112 | 21,405,571 | |||||||||||||||
| Contract Service Obligations | 11,579,822 | 4,873,992 | 6,059,789 | 320,541 | 325.500 | |||||||||||||||
| Operating Lease Obligations | 419,274 | 14,176 | 26,479 | 55,699 | 322,920 | |||||||||||||||
| Natural Gas Supply Agreements | 1,910,410 | 160,122 | 533,491 | 415,205 | 801,601 | |||||||||||||||
| Purchase Obligations | 1,464,795 | 961,522 | 439,558 | 16,914 | 46,800 | |||||||||||||||
| Energy Supply Agreements | 2,385,454 | 217,178 | 1,668,804 | 73,255 | 426,218 | |||||||||||||||
| Capital Expenditures | 4,873,706 | 3,911,667 | 895,420 | 50,799 | 15,820 | |||||||||||||||
| Build, Operate, Maintain and Transfer Contracts (BOMT) | 345,009 | 70,467 | 127,530 | 69,290 | 77,722 | |||||||||||||||
| Capital (Finance) Lease Obligations | ||||||||||||||||||||
| Financial Sector Debt | 13,853,131 | 2,128,426 | 3,335,629 | 3,309,171 | 5,079,906 | |||||||||||||||
| Bonds | 20,321,942 | 97,100 | 1,097,011 | 5,264,820 | 13,863,011 | |||||||||||||||
| Total | 84,253,377 | 13,505,846 | 16,399,659 | 11,964,805 | 42,365,068 | |||||||||||||||
Table 51 – Our Contractual Obligations
| COP$ in millions | Payments due by period | |||||||||||||||||||
| Contractual obligations | Total | Less than 1 year | 1 to 3 years | 3 to 5 years | More than 5 years | |||||||||||||||
| Employee Benefit Plan | 26,365,279.0 | 1,125,105.0 | 2,322,451.0 | 2,420,570.0 | 20,497,153.0 | |||||||||||||||
| Contract Service Obligations | 5,991,167.1 | 2,378,785.4 | 2,407,447.8 | 429,061.3 | 775,872.7 | |||||||||||||||
| Operating Lease Obligations | 652,681.2 | 190,875.0 | 157,100.1 | 118,815.1 | 185,891.0 | |||||||||||||||
| Natural Gas Supply Agreements | 2,107,163.5 | 229,202.5 | 495,130.2 | 395,420.0 | 987,410.9 | |||||||||||||||
| Purchase Obligations | 1,318,087.2 | 624,323.3 | 571,858.9 | 74,385.0 | 47,520.0 | |||||||||||||||
| Energy Supply Agreements | 795,408.8 | 97,418.0 | 155,820.8 | 121,267.0 | 420,902.9 | |||||||||||||||
| Capital Expenditures | 621,571.7 | 423,021.94 | 169,321.7 | 29,228.1 | - | |||||||||||||||
| Build, Operate, Maintain and Transfer Contracts (BOMT) | 576,758.8 | 65,155.9 | 114,724.0 | 113,351.5 | 283,527.4 | |||||||||||||||
| Capital (Finance) Lease Obligations | 381,838.6 | 254.1 | 23,649.2 | 40,011.2 | 317,924.1 | |||||||||||||||
| Financial Sector Debt | 20,162,033.8 | 1,333,129.9 | 3,181,732.0 | 9,712,744.3 | 5,934,427.7 | |||||||||||||||
| Bonds | 30,909,787.0 | 138,700.0 | 5,672,263.5 | 1,980,255.0 | 23,118,568.5 | |||||||||||||||
| Total | 89,881,776.78 | 6,605,971.01 | 15,271,499.17 | 15,435,108.32 | 52,569,198.28 | |||||||||||||||
The table does not include the contractual obligations of Equion, Savia and Ecodiesel, which do not consolidate within the Ecopetrol’s Group.
| Off Balance Sheet Arrangements |
As of December 31, 2014,2016, we did not have off-balance sheet arrangements of the type that is required to be disclosed under Item 5.E of Form 20-F.
| Trend Analysis and Sensitivity Analysis |
Trend Analysis
After a decadeOngoing Trends
Ecopetrol updated its 2020 Business Plan on September 29, 2016. This Plan is based on three fundamental pillars: i) protection of strongcash and cost efficiency; ii) strict capital discipline; and iii) growth that led Ecopetrol to establish itself as one ofin reserves and production; these pillars will strengthen the 35 largest oil companies in the world, the Company is currently in the approval stage of the new strategy aimed to generate sustainableCompany’s financial sustainability and afford it opportunities for both organic and inorganic growth, generating value toand profitability for its shareholders.
Consistent with the crude oil price environment and the Company’s focus on value creation, Ecopetrol revised its investment plan, prioritizing investments that maximize value for shareholders. As a result, the Group's investment plan totals US$7.860 billion for 2015, 9% lower than capital expenditures made in 2014, in which the predominant percentage of funds will be allocated toward improving production, completing the modernization of the Cartagena refinery, and strengthening transportation capacity. A further reduction of international crude oil prices could result in a delay or a change in our capital expenditure plan, in particular delaying exploration and development activities.
| 89 |
We are engaged in different initiatives aimed at aligning cost structures in our different business segments, streamlining the corporate structure and the optimization of support processes. For 2015 our budget estimates savings of around US$3.6 billion, out of which US$2.9 billion come mainly from lower value of purchases of crude oil, diluent and products due to the price declining and US$0.7 billion from lower maintenance, operational and administrative expenses. Under a scenario in which current prices continue declining, additional savings would be required in order to preserve the cash flow of the Group without risking the safety of our people, the environment and our facilities.
Our exports, which represented 61% of our total sales in 2014,According to this business plan, during 2017 the Company will continue to be our primary sourcepursue its transformation to ensure operational and financial sustainability. Ecopetrol has named Phase 3.0 of revenues, including expected exports of premium products from the Cartagena refinery,business Transformation plan “Ecopetrol’s New Frontier”. It will focus on opening up new markets; multi-year fields development plans; improved return on assets; attracting and retaining the best human talent; committing ourselves to integrity, safe operations, environment consciousness and joint prosperity with communities in which is expected to resume operations during the second half of 2015.
We anticipate that heavy crude oil indexes, as Maya, will remain under pressure by the larger availability of Canadian crudes in the US Gulf Coast. In spite of this, we expect the Maya-Brent differential to narrow to between US$10operate and US$12 per barrel, below the US$13 per barrel differential observed in 2014, due to a greater decline in the price of light crudes, such as Brent.execute projects.
We believe that our strategy of diversifying our export destinations and sellingsales under term contracts with fixed discounts to benchmarkreference prices will help usto mitigate the negative impact of the current crude oil oversupply onover the discounts fromspread of our export basket. We expect our crude basket to reflect an approximatelyforecast a discount between US$119 and US$10 per barrel average discountcompared to ICE Brent crude in 2015.2017.
Furthermore, with the full operation of all units of Reficar since 2016 and shifting from stabilization to optimization, Ecopetrol’s trade balance is expected to continue improving due to the reduction of gasoline imports and incremental exports of fuels. Reficar’s fuels production is expected to continue being allocated primarily in the domestic market, with a surplus to be exported.
Adding reserves and maintaining the pace of production are the Company’s focus. The exploration campaign will be focused in regions of high prospectivity. Investment in exploration will rise from US$ 282 million to US$ 650 million, thus increasing offshore wells from one to six and onshore wells from five to 11 from 2016 to 2017. Enhanced recovery will continue to leverage additional reserves in mature fields.
We stress that a strong cash position allows us to assess opportunities for inorganic growth of Ecopetrol ‘s reserves.
The Company expects to continue the divestment program and expects to receive during 2017 between US$500 and US$1,000 million. The Company is in the process of carrying out the sale of non-strategic assets and shareholdings, such as Propilco, its remaining shares in Empresa de Energía de Bogota and minor production fields.
In terms of production,order to preserve its investment grade ratings, the Company seeks to achieve an average productionmaintain financial sustainability and adequate levels of 760,000 boe per day in 2015. Our investments are being allocated toindebtedness. In 2016 international bonds were issued totaling US$ 500 million and commercial loans were entered into totaling US$ 475 million. Going forward, and according with the highest value projects in our portfolio fittingassumptions of the available cash. As a consequence, some development projects have been postponedbusiness plan, the Company does not foresee the issuance of new debt or delayed, which could limit growth in production in future years.short-term financing.
Our explorationThe Company will continue monitoring oil price scenarios to make the proper decisions and take preventive actions to ensure financial sustainability in 2017 such as: prioritization of investments associated with regulatory commitments and project completion, temporary closing of producing assets with negative margins, redefining and prioritizing maintenance activities in 2015 include drilling in the Colombian Caribbean offshore and the US Gulf of Mexico, as well as in the Colombian onshore. These activities will build on the first deep water discovery in Colombia, the Orca-1 well, completed in 2014 by Petrobras (40%), in joint venture with Ecopetrol (30%)additional austerity measures related to administrative expenses, sponsorships and Repsol (30%). However, a trend of even lower crude prices could affect the development of some of the new discoveries. In refining, we anticipate that output from the modernized Cartagena refinery, together with products from our refinery at Barrancabermeja, will be sufficient to meet domestic Colombian demand for diesel and jet fuel for the next five years.
In Transportation and logistics, we are striving to implement world-class operational standards and practices and an efficient development of our transport and logistics infrastructure. A lower production outlook for Colombia could lead us to revise and postpone some investments for the expansion of our transportation network. For more information on our planned pipeline projects, see the sectionBusiness Overview–Transportation and Logistics–Open Access Business Model–Pipelines.
Furthermore, a long-term trend of lower crude oil prices would result in the de-booking of some of our proved reserves. See the sectionRisk Review–Risk Factors.labor recruitment.
Sensitivity Analysis
Sensitivity Analysis of Reserves
The following table provides information about the sensitivity analysis conducted on our oil and gas reserves as of December 31, 2016, taking into account ICE Brent crude oil prices that reasonably reflect management’s view of crude oil prices given prevailing market conditions.
Table 52 – Sensitivity Analysis of Reserves
Oil and NGL (million barrels) | Natural Gas (bcf) | Total Oil and Gas (Mmboe) | ||||||||||
| Reserves as of December 31, 2016 | 1,033 | 3,218 | 1,598 | |||||||||
| Sensitivity Scenario | 1,182 | 3,252 | 1,752 | |||||||||
| Difference (million barrels) | 149 | 34 | 154 | |||||||||
| Difference (%) | 14.4 | 1 | 9.6 | |||||||||
The conversion rate used is 5,700 cf = 1 boe.
| 90 |
Assumptions for the Sensitivity Analysis of Reserves
| · | The sensitivity of the ICE Brent price index is forecasted to average US$55 per barrel in 2017, US$60 per barrel in 2018, US$65 per barrel in 2019, US$70 per barrel in 2020 and US$75 per barrel onwards. |
| · | The base scenario on which our sensitivity analysis is made corresponds to our oil, NGL and natural gas reserves, as of December 31, 2016, as presented elsewhere in this annual report. |
| · | Other variables such as the operating costs, capital costs and portfolio price were not varied for purposes of the analysis. |
Sensitivity Analysis of our Results
The following table provides information about the sensitivity of our results as of December 31, 2014,2016, due to variations of US$1 in the price of ICE Brent crude and of 1% in the COP$/US$ exchange rate.
| Income Statement 2014 | Income | Difference Between Real 2014 and Case Brent | Income | Difference Between Real 2014 and Case TRM | ||||||||||||||||
| (Ps$ in billions) | ||||||||||||||||||||
| Local Revenue | 26,715.01 | 26,919.08 | 204.06 | 26,829.46 | 114.44 | |||||||||||||||
| Export Revenue | 42,210.32 | 42,507.50 | 297.18 | 42,331.66 | 121.34 | |||||||||||||||
| Total Revenue | 68,925.34 | 69,426.58 | 501.24 | 69,161.12 | 235.78 | |||||||||||||||
| Cost of Sales | 45,054.02 | 45,254.82 | 200.80 | 45,132.59 | 78.57 | |||||||||||||||
| Selling Operating Expenses | 5,591.94 | 5,591.94 | 0.00 | 5,591.94 | 0.00 | |||||||||||||||
| Administrative Operating Expenses | 1,677.39 | 1,677.39 | 0.00 | 1,677.39 | 0.00 | |||||||||||||||
| Operating Profit | 16,601.99 | 16,902.42 | 300.43 | 16,759.19 | 157.21 | |||||||||||||||
| Non-Operating Income (Expenses) | (1,181.24 | ) | (1,181.24 | ) | 0.00 | (1,181.24 | ) | 0.00 | ||||||||||||
| Profit before Income Tax | 15,420.75 | 15,721.18 | 300.43 | 15,577.95 | 157.21 | |||||||||||||||
| Income Tax | (7,135.07 | ) | (7,150.41 | ) | (15.35 | ) | (7,155.51 | ) | (20.44 | ) | ||||||||||
| Minority Interest | (775.41 | ) | (775.41 | ) | 0.00 | (775.41 | ) | 0.00 | ||||||||||||
| Net Income | 7,510.27 | 7,795.36 | 285.09 | 7,647.03 | 136.76 | |||||||||||||||
Table 53 – Results of Reserves’ Sensitivity Analysis
| Income Statement 2016 | Income Statement Case ICE Brent(1) | Difference Between Real 2016 and Case ICE Brent | Income Statement Case TRM(2) | Difference Between Real 2016 and | ||||||||||||||||
| (COP$ in billions) | ||||||||||||||||||||
| Revenue | 48,485,56 | 49,398,37 | 912,81 | 48,931,98 | 446,42 | |||||||||||||||
| Cost of sales | 34,251,42 | 34,606,79 | 355,37 | 34,472,25 | 220,83 | |||||||||||||||
| Gross Income | 14,234,14 | 14,791,58 | 557,44 | 14,459,73 | 225,60 | |||||||||||||||
| Operating expenses | 4,400,84 | 4,400,84 | - | 4,400,84 | - | |||||||||||||||
| Impairment of non-current assets | 928,75 | 928,75 | - | 928,75 | - | |||||||||||||||
| Operating income | 8,904,55 | 9,461,99 | 557,44 | 9,130,14 | 225,60 | |||||||||||||||
| Finance results, net | (1,175,37 | ) | (1,175,37 | ) | - | (1,175,37 | ) | - | ||||||||||||
| Share of profit of associates and joint ventures | 61,35 | 61,35 | - | 61,35 | - | |||||||||||||||
| Income before income tax | 7,790,53 | 8,347,97 | 557,44 | 8,016,12 | 225,60 | |||||||||||||||
| Income Tax | (4,543,05 | ) | (4,868,12 | ) | (325,07 | ) | (4,674,60 | ) | (131,56 | ) | ||||||||||
| Net Income | 3,247,48 | 3,479,85 | 232,37 | 3,341,52 | 94,04 | |||||||||||||||
| (1) | ICE Brent = US$ |
| (2) |
Assumptions for the Sensitivity Analysis of Financial Statementsour Results
| · |
| · | The sensitivity of the ICE Brent price index is |
| 91 |
| · | The sensitivity of our results to changes in the exchange |
| · | The income tax for |
The table below sets forth the line items that are being affected by the variation on the reference prices or the average exchange rate.
Table 54
| VARIATION ON ICE BRENT REFERENCE PRICE | VARIATION ON AVERAGE EXCHANGE RATE | |
REVENUE | ||
| Sales of crude oil | ||
| COST OF SALES | ||
| Local purchases | ||
| Imports of products | ||
| Imports | ||
| 5. | Risk Review |
| Risk Factors |
The risks discussed below could have a material adverse effect, separately or in combination, on our business’s operating results, cash flows, liquidity and financial condition. Investors should carefully consider these risks.
| 5.1.1 | Risks Related to Our Business |
This section describes the most significant potential risks to our business.
Our crude oil and natural gas reserve estimates involve some degree of uncertainty and may prove to be incorrect over time, which could adversely affect our ability to generate revenue.
Reserves estimates are prepared using generally accepted geological and engineering evaluation methods and procedures. Estimates are based on geological, topographical and engineering facts but also depend on many factors and assumptions, including various assumptions that are based on conditions in existence as of the dates of the estimates. Any material changes in those conditions or other factors affecting those assumptions could impair the quantity and value of our reserves, and actualfacts. Actual reserves and production may vary materially from estimates presentedshown in this Annual Report.annual report, and downward revisions in our reserve estimates could lead to lower future production which could affect our results of operations and financial condition.
Hydrocarbon reserves presented in this Annual Reportannual report were calculated in accordance with SEC regulations. As required by those regulations, reserves were valued based on the unweighted average of closing prices for the first day of each month in the 12-month periods ended December 31, 2014, 20132016, 2015 and 2012,2014, as well as other conditions in existence at those dates. For 2014, theThe average of closing prices of ICE Brent crude oil for the first day of each month in the 12-month period was Brent crude oil of US$101.80 per barrel.barrel in 2014, US$55.57 per barrel in 2015 and US$44.49 per barrel in 2016. Mainly as a result of the pronounced fall in hydrocarbon prices between 2014 and 2015, the Company recognized a reduction in oil and gas proven reserves of 11% in 2015 as compared to 2014, to 1,849 mmboe in 2015 from 2,084 mmboe in 2014. In 2016, the Company recognized a reduction in oil and gas proven reserves of 14% in 2016 as compared to 2015, to 1,598 mmboe in 2016 from 1,849 mmboe in 2015 For more information, see the sectionBusiness Overview—Exploration and Production—Reserves.
| 92 |
Furthermore, at least once a year, or more frequently if the circumstances require, the Company ascertains whether there are signs of impairment to its assets or cash-generating units (CGUs) due to the difference between the carrying amount of such assets or CGUs as opposed to their recoverable amounts, using reasonable assumptions, based on internal and external factors, which reflect market conditions. The recoverable amount is calculated based on the free cash flow method, discounted at the weighted average capital cost (WACC). Whenever the recoverable amount of an asset or CGU is lower than its net carrying amount, such amount is reduced to its recovery amount, recognizing a loss for impairment as an expense in the consolidated statement of profit or loss.
Impairment charges for non-current assets in 2016 amounted to COP$928,747 million before taxes as a result of the evaluation of the recoverable amount of the assets value which includes the variation in estimations of future prices under the current scenarios of OPEC’s oil quota agreements and the impact resulting from changes on specifications issued by the International Marine Organization agreement regarding marine pollution, Marpol, on crude and fuels with high sulfur content. For additional information about this impairment charges,see Notes 14, 17 and 28 to our consolidated financial statements.
Any significant future price change in estimates and judgments could have a material effect on the quantity and present value of our proved reserves. The average benchmark closing pricesreserves and subsequently on the recognition or recovery of Brent crudeimpairment charges. Changes to estimations of reserves are applied prospectively to the amounts of depreciation, depletion and amortization charged and, consequently, the carrying amounts of exploration and production assets.
In order to assess the possible impact of current expected oil price scenarios and market conditions, as well as of further developments driven by the economic environment for the first day ofoil and gas industry, the first four months of 2015 was US$58.01 per barrel. Unless crude oil prices increase during the remainder of 2015 to levels well in excess of those currently expected by market participants,Company has performed a portion of oursensitivity analysis over its proved reserves, and possibly a material portion, would be deemed uneconomic and no longer be classified as provedreserve balance as of December 31, 2015.2016. Based on these calculations, assuming an average price per barrel of ICE Brent crude oil of US$55 per barrel in 2017, US$60 per barrel in 2018, US$65 per barrel in 2019, US$70 in 2020 and US$75 per barrel for later years, Ecopetrol could recognize an increase in oil and gas proved reserves of approximately 9.6%. This analysis takes into account Ecopetrol’s estimates and expectations regarding the main assumptions used in its proven reserve calculation, which final actual result may fluctuate and differ substantially from those provided herein due to several factors outside of the control of the Company. For moreadditional information see the sectionBusiness Overview–ExplorationFinancial Review—Trend Analysis and Production–ReservesSensitivity Analysis.
AnyMoreover, any downward revision in our estimated quantities of proved reserves would indicate lower future production volumes, which could result in higher expenses for depreciation, depletion and amortization for properties to which we apply the units of production method for calculating these expenses. These higher expenses, and any lower revenues as a result of actual production volumes and realized prices, could adversely impact our results of operations and financial condition. In addition, estimated proved reserves are used to calculate future cash flows from oil and gas properties, which are used to assess whether any impairment loss has occurred with respect to our oil and gas properties. The smaller is the volume of estimated reserves, the higher is the likelihood of asset impairment.
Achieving our long-term growth prospects depends on our ability to execute our Strategic Planstrategic plan — specifically, the discovery and successful development of additional reserves.
Our long-term growth objectives depend largely on our ability to discover and/or acquire new reserves, and in turn developing them successfully develop them and to improveimproving the recovery factor in our recovery factor.mature oil fields. Our exploration activities expose us to the inherent geological and drilling risks of drilling including the risk that we willof not discoverdiscovering commercially productiveviable crude oil or natural gas reservesreserves; and the risk that some exploratory wells initially budgeted for may be drilled at a later stage or not be drilled at all. TheDespite the effort we make to control costs associated with drilling, wellsthese are often uncertain, and numerous factors beyond our control may cause drilling operations to be curtailed, delayed or cancelled.
Our ability to add and develop reserves also depends on our capacity to structurally reduce costs to maintain the profitability of oil fields already being exploited.
If we are unable to successfully discover and develop additional reserves, or if we do not acquire properties having proved reserves, our level of proved reserves portfolio will decline. Failure to secure additional reserves may impede us from achieving or maintaining production targets, and may have a negative impact on our results of operationoperations and financial condition.
| 93 |
See the sectionStrategy and Market Overview–Overview—Our Corporate Strategyfor a discussion of our Strategic Plan.strategic plan.
Our business depends substantially on international prices for crude oil and refined products. The prices for these products are volatile; a sharp decrease could adversely affect our business prospects and results of operations.
As of December 2014,In 2016, in Ecopetrol, S.A., nearly 96%approximately 91.7% of ourthe revenues came from sales of crude oil, natural gas and refined products and 99%91% of our revenues from the salestotal volume sold of these products areis indexed to international reference prices or benchmarks such as Brent and fuel oil.ICE Brent. Consequently, fluctuations in those international indexes have a direct effect on our financial condition and results of operations.
Prices of crude oil, natural gas and refined products have traditionally fluctuated as a result of a variety of factors including, among others, competition within the international oil and natural gas industry; changes in international prices of natural gas and refined products; long-term changes in the demand for crude oil (as further explained below), natural gas and refined products; the economic policies in the United States, China and the European Union; regulatory changes; changes in global supply, such as the current oversupply of crude oil; inventory levels; changes in the cost of capital; adverse economic conditions; global financial crises, such as the financial crisiscrises; development of 2008;substitute sources of energy, development of new technologies; global and regional economic and political developments in the Organization of the Petroleum Exporting Countries, or OPEC;(OPEC); the willingness and ability of the OPEC and its members to set production levels and prices;levels; local and global demand and supply for crude oil, refined products and natural gas; trading activity in oil and natural gas; transactions ingas, which thereby affects their respective margins; derivative financial instruments related to oil and gas; development or availability of alternative fuels; weather conditions; natural events or disasters; and terrorism and global conflict. In 2016 the impact of an oversupplied market was put to test, as OPEC changed its traditional controlling role and let the market find its own balance. The price of crude oil may also fluctuate due to changes in demand. For example, Brexit’s impact on crude oil demand for 2017 is expected to be moderate, the Petroleum Industry Research (PIRA Energy Group) estimates a short-term impact of US$2 per barrel on crude oil due to a reduction between 100-200 KBD in demand for gasoline, middle distillates and other products.
Ecopetrol S.A. has not entered into transactions that hedge the risk of changes of oil or gas prices. Therefore, any substantial or extended declines in internationalWhen crude oil, refined products and natural gas prices may haveare low, we earn less revenue and we generate lower cash flow and less income. Conversely, when crude oil, refined product and natural gas prices are high, we earn more and generate a material adverse effect onlarger amount of cash and net income. During 2016, our business, results of operations and financial condition,crude oil basket price was US$35.7 per barrel versus US$43.9 per barrel in 2015; the refined product basket price was US$50.1 per barrel versus US$63.4 per barrel in 2015; and the natural gas price was US$23.5 per barrel equivalent in 2016 versus US$22.0 per barrel equivalent in 2015. However, it is important to consider that the margin on refined products can result either in higher or lower margins due to a change in price of crude the same way gas prices can be impacted by local conditions, such as local demand and weather conditions.
Impairment charges for non-current assets in 2016 amounted to COP$928,747 million before taxes as a result of the evaluation of the recoverable amount of the assets’ value which includes the variation in estimations of future prices under the current scenarios of OPEC’s oil quota agreements and the impact resulting from changes on specifications issued by the International Marine Organization agreement regarding marine pollution, Marpol, on crude and fuels with high sulfur content. For additional information about this impairment charges,see Notes 14, 17 and 28 to our proved reserves. In addition, aconsolidated financial statements.
A reduction of international crude oil prices could also result in a delay or a change in our capital expenditure plan, in particular delaying exploration and development activities, thereby delaying the development of reserves and affecting future cash flows. In order to maintain a profitable operation and preserve the cash flow of the Company at certain oil price levels, some of our producing fields may have to be closed or their operations temporarily suspended which would affect our production levels and expected revenues.
| 94 |
Changes in the Colombian Peso/U.S. dollar exchange rate could have an adverse effect on our financial condition and results of operations given the amount of U.S. dollar denominated debt obtainedheld by the company and the fact that most of our revenues is derived from sales of products quoted in or with reference to U.S. dollars.
Most of our revenues isare derived from sales of products quoted in or with reference to U.S. dollars. The impact of fluctuations in exchange rates, especiallyTherefore when the Peso/U.S. dollar rate, on our operations has been and may continue to be material. From a cash flow perspective, as exports still account for a large portion of our sales, a substantial share of our liquid assets are held in U.S. dollars and gain value when converted into Pesos as theColombian Peso depreciates against the U.S. dollar, and lose value whenour revenues converted into Colombian Pesos, asincrease. Conversely, when the Colombian Peso appreciates against the U.S. dollar, our revenues decrease.
On the other hand, imported goods, oil services and the debt, which is mainly denominated in U.S. dollars, become less expensive when the Colombian Peso appreciates against the U.S. dollar and more expensive when the Colombian Peso depreciates against the U.S. dollar.
As of December 31, 2016 our U.S. dollar-denominated total debt was US$15.2 billion, which we recognize in our consolidated financial statements at its amortized cost, which corresponds to the present value of cash flows, discounted at the effective interest rate. Out of this total, US$12 billion relate to Ecopetrol S.A., whose functional currency is the Colombian Peso. Therefore, when the Colombian Peso depreciates against the U.S. dollar, Ecopetrol S.A. is exposed to an exchange rate loss. In contrast, when the Colombian Peso appreciates against the U.S. dollar, Ecopetrol S.A.is exposed to an exchange rate gain. Some of the Group’s affiliates have the U.S. dollar as functional currency and are not exposed to a material exchange rate risk resulting from fluctuations in the Colombian Peso against the U.S. dollar. On the asset side, when the financial statements of the Group are consolidated, the exchange rate differential of the affiliates’ assets and liabilities whose functional currency is the U.S. dollar is recognized directly in the equity, as part of the other comprehensive income.
The Company adopted hedge accounting as part of its risk management strategy, using two types of natural hedges with its U.S. dollar debt as a financial instrument: i) cash flow hedge for exports of crude oil and ii) hedge of a net investment in a foreign operation. As a result of the implementation of both hedges, 88%, or $10.5 billion, of Ecopetrol S.A.’s debt in U.S. dollars was designated as a hedge. With the adoption of hedge accounting, the effect of the volatility of the foreign exchange rate on the hedged portion of the debt is recognized directly in equity, as part of other comprehensive income. The remaining portion of Ecopetrol S.A.’s U.S. dollar-denominated debt as well as the financial assets and liabilities denominated in foreign currency continues to be exposed to the fluctuation in the exchange rate.
The U.S. dollar/Colombian Peso exchange rate has fluctuated during the last several years. TheOn average, the Colombian Peso depreciated 3.9% on average7.05% against the U.S. dollar in 2013,2014, 37.28% in 2015 and 11.18% in 2014 depreciated 7.1%. When the Peso appreciates against the U.S. dollar, our revenues from exports decrease when converted into Pesos. However, imported goods, oil services and interest on external debt denominated in U.S. dollars become less expensive for us. Conversely, when the Peso depreciates against the U.S. dollar, our revenues from exports, when converted into Pesos, increase, and our imports and external debt service become more expensive. Because2016. Additionally, as of December 31, 2016, the Colombian Peso appreciated 4.72%, but depreciated as of December 31, 2015 and 2014, our U.S. dollar-denominated liabilities are almost four times as much as our31.64% and 24.17%, respectively, from year-end exchange in the previous year. In addition, given the political uncertainty surrounding the United States of America following the recent presidential election and the unpredictability in the economic performance of some developed countries, there is no clear view of how the U.S. dollar denominated assets,will behave in the medium to long-term. Given that markets are dealing with a great deal of uncertainty, it is expected that U.S. dollar movements will remain difficult to forecast, as the U.S. currency will respond immediately to any new opportunities for or challenges to the U.S. economy.
A future depreciation in the exchange rate of the Colombian Peso against the U.S. dollar may adversely affect our financial results when converted into Colombian Pesos, given the portion of our U.S. dollar debt that is not designated as hedge instrument and the future debt we may acquire. Please see our abilitysensitivity analysis on our results of operation to comply withexchange rate fluctuations in the sectionFinancial Review—Effect of Taxes, Exchange Rate Variation, Inflation and the Price of Oil on our obligations underResults—Exchange Rate Variationand in Note 31.2 to our existing indebtedness and our ability to pay dividendsconsolidated financial statements.
Increased competition from local and foreign crude oil companies may have a negative impact on our ability to gain access to additional crude oil and natural gas reserves in Colombia.Colombia and abroad.
We must bid for exploration blocks offered by the ANH the governmental entity responsible for promoting oil and gas investments in Colombia establishing terms of reference for exploration rounds and assigning exploration blocks to domestic and foreign oil and gas companies via competitive rounds. Thissimilar authorities in other countries, which means we compete under the same conditions as other domestic and foreign oil and gas companies, and receive no special treatment. Our ability to obtain access to potential production fields also depends on our ability to evaluatefor evaluating and selectselecting potential hydrocarbon-producing fieldsopportunities and to adequately bid for these exploration fields.such opportunities.
| 95 |
We are also exposed to international competition as a result of our international exploratory activities. Currently, we are developing exploratory activitiesexploring in Brazil Peru and the US Gulf of Mexico, where we face competition fromboth partner and compete with other oil and gas companies operating in those locations.
If we are unable to adequately compete with local and foreign oil companies, or if we cannot enter into joint ventures with market players withhaving high potential exploration projects, where we could potentially find additional reserves, weour exploration activities may be limited to conducting exploration activities in less attractive blocks.limited. This could reduce our market share of the market and, in turn, adversely affect our financial condition.
If operational risks to which we are exposed in Colombia or overseas materialize, the health and safety of our workforce, the local community and the environment may be affected. In addition, we may suffer a disruption or shutdown of our operational activities.
Our exploration, production, refining and transportation activities in Colombia and in the foreign countries in which we operate are subject to industry-specific operating risks, some of which, despite our internal procedures and adherence to industry best practices, are beyond our control. Our operations may be curtailed, delayed or cancelled due to adverse or abnormal weather conditions, natural disasters, blockages in the communities in which we operate, equipment failures or accidents, oil or natural gas spills or leaks, shortages or delays in the availability or in the delivery of equipment, delays or cancellation of environmental licenses or other government authorizations or judicial decisions, fires, explosions, blow-outs, surface cratering, pipeline failures, theft and damage to our transportation infrastructure, sabotage, terrorist attacks and criminal activities.
Some of our operations in Colombia and abroad could be conducted in remote and uninhabited locations which involve health and safety risks that could affect our workforce. By our own Company policy and practices, as well as under Colombian law and international industrial safety regulations, we are required to have health and safety practices that minimize risks and health issues faced by our workforce. Failure to comply with health and safety regulations in the jurisdictions where we operate may lead to investigations by health officials that could result in lawsuits or fines.
We may be required to incur in additional costs and expenses to allocate funds to industrial safety and health compliance under Colombian law and international industrial safety regulations. Additionally, if any operational incident occurs that affects local communities and ethnic communities in nearby areas, we will need to incur in additional costs and expenses in order to return affected areas to normality and to compensate for any damages we may cause. These additional costs may have a negative impact on the profitability of the projects we may decide to undertake.
The occurrence of any of these operating risks could result in substantial losses or slowdowns to our operations, including injury to our employees, malfunction or destruction of property, equipment and infrastructure, clean-up responsibilities, third-party liability claims, government investigations and imposition of fines, withdrawal of environmental licenses and other government permits, suspension or shutdown of our activities and loss of revenue. The occurrence of any of these events may have a material adverse effect on our financial condition and results of operations.
Our involvement in deep waterdeep-water drilling either as direct operatorsoperator or in conjunction with our business partners involves certain risks and costs, which may be outsideout of our control.
Our deepwaterdeep-water drilling activities present severalsevere risks, such as the risk of spills, explosions inon platforms and drilling operations, and natural disasters. The occurrence of any of these events or other incidents could result in personal injuries, loss of life, severe environmental damage with the resulting containment, clean-up and repair expenses, equipment damage and liability in civil and administrative proceedings. Heightened risks and costs associated with deep waterdeep-water drilling may have a negative effect on our results of operations and financial condition and in our reputation.
| 96 |
See the sectionBusiness Overview–Overview—Exploration Activities–and Production—Exploration Activities—Exploration Activities Outside of Colombia for a summary of our current deepwaterdeep-water drilling activities.
As a result of the oil spill in the Macondo field operated by British Petroleum in the U.S. Gulf Coast in April 2010, significant concerns regarding the safety of deep waterdeep-water drilling have been raised and, as a result, applicable regulations in various countries have changed. More stringent government regulation may result in increased costs and longer exploration and development timeframes for our deep waterdeep-water drilling operations and consequently could adversely affect our results of operations and financial condition.
We are exposed to the credit, political and regulatory risks of our customers and any material nonpayment or nonperformance by our key customers could adversely affect our cash flow and results of operations.
Some of our customers may experience financial problems that could have a significant negative effect on their creditworthiness. Severe financial problems encountered by our customers could limit our ability to collect amounts owed to us, or to enforce the performance of obligations owed to us under contractual arrangements. In addition, many of our customers finance their activities through their cash flows from operations, the incurrence of short and long term debt or the issuance of equity.
The combination of decreasing cash flows as a result of declines in commodity prices, a reduction in borrowing bases under reserve-based credit facilities and the lack of availability of debt or equity financing may result in a significant reduction of our customers’ liquidity and limit their ability to make payments or perform their obligations to us.
Furthermore, some of our customers may be highly leveraged and subject to their own operating expenses. Therefore, the risk we face in doing business with these customers may increase. Other customers may also be subject to regulatory changes, which could increase the risk of defaulting on their obligations to us. Financial problems experienced by our customers could result in the impairment of our assets, a decrease in our operating cash flows and may also reduce or curtail our customers’ future use of our products and services, which may have an adverse effect on our revenues and our ability to make payments under our existing debt obligations.
Our ability to access the credit and capital markets on favorable terms to obtain funding forto refinance our capital projectsdebt maturities may be limited due to the deterioration of these markets, any change to our credit ratings and the authorizations we need before incurring any financial indebtedness.
We expect to make significant capital and operations expenditures to reach our corporate goals. Our ability to fund these expenditures is dependent on our ability to access the capital necessary to finance them on terms acceptable to us. In recent years, particularly during the last quarter of 2015 and the first quarter of 2016, due to significant decrease in oil prices, domestic and global financial markets and economic conditions have been weak and volatile and have contributed significantly to a substantial deterioration in the credit and capital markets. A new financial crisis, a renewalremaining volatility in prices in the oil and gas sector, the spread in protectionist policies in the United Statess and Europe, the lack of consensus among OPEC members and further geopolitical disruptions in the European sovereign debt crisis,Middle East which could involve developed countries, which in turn could worsen the risk perception inwith respect to the emerging markets, or the occurrence of any of the risks described in the sectionRisk Review – Review—Risk Factors – Factors—Risks relatedRelated to Colombia’s politicalPolitical and regional environmentRegional Environment could also make it more difficult for us and our subsidiaries to access international and local capital markets and finance our operations and capital expenditures in the futurepotentially refinance our debt maturities on terms acceptable to us. These conditions, along with significant write-offs in the financial services sector and the re-pricing of credit risk, can make it difficult for us to obtain funding for our capital needs on favorable terms. Access to credit and capital markets is also dependent on our credit ratings, which are mainly determined by our financial and operational strength, oil and gas market conditions and the support that could be provided by the Colombian government. On January 18, 2016, our senior unsecured debt ratings were downgraded to Baa3 from Baa2 by Moody’s Investors Service, and Standard & Poor’s (S&P) and Fitch Ratings revised our outlook from stable to negative on January 29 and July 26, 2016, respectively. We cannot assure that our credit ratings will continue for any given period of time or that the ratings will not be further lowered or withdrawn. An assigned rating may be raised or lowered depending, among other things, on the respective rating agency’s assessment of our financial strength. In addition, a downgrade in the rating of the Republic of Colombia could also trigger a downgrade on our ratings as our rating is capped by the rating of the Republic of Colombia and the implicit support that can potentially be provided to the Company. On February 16, 2016, S&P revised the outlook of the Republic of Colombia to negative. While on March 14, 2017, Fitch Ratings upgraded our outlook from negative to stable following the upgrade from the Republic of Colombia from negative to stable also in March 2017, we cannot offer any assurance that our credit rating will continue.
| 97 |
As a result of these factors, we may be forced to revise the timing and scope of theseour capital projects as necessary to adapt to existing market and economic conditions, downgrades to our credit ratings or to access the financial markets on terms less favorable, therefore negatively affecting our results of operations and financial condition.
In addition, under applicable regulation, the Government, through the Ministry of Finance and Public Credit and the favorable opinion of the National Planning Department, must authorize all indebtedness of state-owned entities and government-controlled companies through a majority equity stake. Consequently, all of our indebtedness, except forexcluding our foreign subsidiaries or those subsidiaries in which we hold minority interest, most of our indebtedness must be previously authorized by the Colombian Ministry of Finance and Public Credit and the National Planning Department. As such, our indebtedness is subject to the Government’s time frames and policies, and we cannot guarantee that such authorizations would be granted in a timely fashion or granted at all.
We may be exposed to increases in interest rates, thereby increasing our financial costs.
We may incur debt locally and in the international capital markets and, consequently, may be affected by changes in prevailing interest rates. If market interest rates increase, our financing expenses may increase, which could have an adverse effect on our results of operations and financial condition. Interest rates in the United States may continue rising due to Federal Reserve’s monetary policy, which is looking for economic activity expansion at a moderate pace, labor market conditions strengthening and inflation stability to 2% over the medium term.
As of December 31, 2014,2016, approximately 28.20%31%, or US$ 4,0665.4 billion (COP$16.2 trillion), of our total long term indebtedness consisted of floating rate debt. If market interest rates rise, our financing expenses will increase, which could have an adverse effect on our results of operations and financial condition. In addition, as we refinance our existing debt in the coming years, the mix of our indebtedness may change, specifically as it relates to the ratio of fixed to floating interest rates, the ratio of short-term to long-term debt, and the currencies in which our debt is denominated in or indexed to. We cannot assure you that such changes will not result in increased financing expenses borne by us. Finally, as we incur new debt in the future to fund our capital projects, the prevailing interest rates and spreads at any specific time could be less favorable in terms of cost when compared to our previous financing transactions, which could adversely affect our financial condition and results of operations.
Our current and planned investments and exploration activities outside Colombia are exposed to political and economic risks.
As part of our Strategic Plan,strategic plan, we operate through business partners, subsidiaries or affiliates outside of Colombia. We currently have investments, joint ventures and subsidiaries incorporated in Peru, Angola, Brazil, Bermuda, Panama, the Cayman Islands, Switzerland, Germany, Spain, the United Kingdom and the United States, and we are analyzing investments in other countries. In connection with making investments, we are and will be subject to risks related to economic and political conditions and governmental economic actions. We cannot predict the positions of foreign governments relating to the oil and gas industry, land tenure, protection of private property, environmental standards, regulation or taxation; nor can we assure you that future governments will maintain policies favorable to foreign investment or repatriation of capital.
We began exploration activities outside Colombia in 2006 through our Brazilian subsidiary, Ecopetrol Óleo e Gás do Brasil Ltda. Our foreign subsidiaries have subsequently entered into a number of joint venture exploration agreements with regional and international oil companies to explore blocksacreage in Peru, Angola, Brazil and the U.S. Gulf Coast. We have limited experience exploring outside Colombia. We may face new and unexpected risks involving environmental and other legal requirements beyond those we currently face.experience.
| 98 |
The results of operations and financial condition of our subsidiaries in these countries also may be adversely affected not only by risks associated with hydrocarbon exploration and production, but also by fluctuations in their local economies, political instability and government actions, including: the imposition of price controls, the imposition of restrictions on hydrocarbon exports, fluctuation of local currencies against the Colombian Peso, the nationalization of oil and gas reserves, increases in export tax and income tax rates for crude oil and oil products, and unilateral (governmental) institutional and contractual changes, including controls on investments and limitations on new projects.
Any of these conditions occurring could disrupt or terminate our operations, causing our development activities to be curtailed or terminated in these areas, or our production to decline; limit our ability to pursue new opportunities; affect the recoverability of our assets; or cause us to incur additional costs or delay the timeline of our projects.
Our future performance depends on the successful development and deployment of new technologies and the knowledge to apply and improve them.
Technology, knowledge and innovation are essential to our business, especially for improvements in the production and transportation of heavy crude oil, the exploitation of mature fields, the development of unconventional hydrocarbons and reductions in our operating cost. If we do not develop the right technology or do not obtain the expertise to operate new technology or to improve our processes, do not have access to, or do not deploy the knowledge necessary to apply and improve such technology effectively, the execution of our corporate goals, our profitability and our earnings may be adversely affected. In the case of our recovery program, we not only depend on the successful development and deployment of new technologies but also in the response of the reservoir to the application of this recovery technology.
We may not
Our performance could be able to achieve our corporate goals if we face difficultynegatively affected by a deficiency in finding competent successors to our current managementleadership capacity and lack of key skilled employees.
Our growth strategy and the successful achievement of our corporate goals depend on the competence and skills of our management and employees, and our ability to successfully recruit new employees, in particular technical specialists such as petroleum engineers and scientists, as well as our ability to retain our current employees. If our managers and employees decide to retire or leave us, it may be difficult for us to find adequate successors with the required skills, knowledge, leadership and qualifications for the job. In addition, we may face difficulties in retaining our key managers and employees because of the high level of competition for human resources with experience and knowledge inAs the oil and gas industries. Furthermore, our compensation structure may notindustry faces an increasing number of challenges, the ability to react quickly to these challenges has become a key factor in achieving efficiency, profitability and sustainability. Our ability to achieve these goals can be able to meet industry levels and, asnegatively affected by a result, our key employees may leave for jobs offering higher compensation.
Inability to develop humandeficiency in leadership capacity and capability, both across the organizationa lack of key skilled employees that can execute our business strategy with creativity and in specific operating locations, could jeopardize performance delivery. Execution of short- and long- and term goals will depend on recruiting and retaining high-quality employees. See the sectionCorporate Governance—Board of Directors.determination.
Our operations may not be able to keep pace with the increasing domestic demand for natural gas or our natural gas supply commitments.gas.
According to the Colombian Commission for Regulation of Energy and Gas Regulatory Commission (CREG) Resolution 089 of 2013, a supplier of natural gas must possess sufficient economically viable natural gas reserves before executing a natural gas delivery contract with a customer. In the long term, we may not be able to keep up with increasing local demand for natural gas if demand outpaces the rate of growth of our new natural gas developments and discoveries orsupply, especially because of the decline of our main fields. As a result, we may lose market share, which may negatively impact our financial condition and results of operations.
Additionally, we are currently party to certaina number of national and international gas supply contracts that have firm gas commitments. If we are unable to deliver natural gas to these clients as a result of cuts in operations, delays in the completion of projects relating to our production facilities or the acceleration of the decline in our gas production, among other reasons, we may be required to compensate our customers for our failure to supply natural gas. In 2016, we paid a penalty due to a cut in operations that occurred on October 12, 2016. This cut was caused by an operational failure in the ignition system of the Guajira B compression train, which caused an unavailability of gas supply, which in turn affected gas demand in a portion of the industrial and thermal sectors.
Delays in the start of new projects could result in penalties imposed on us by our clients. Although we did not pay any such penalties due to delays in 2014,the start of new projects in 2016, we cannot assure you that in the future we will not be subject to additional monetary fines which can in turn affect our financial condition and results of operations.
| 99 |
We depend on others for the construction and availability of natural gas transportation infrastructure for the transport of our gas, which may limit our ability to develop new or existing fields or lead to the deterioration of related assets and may not allow us to recover the cost of capital invested in natural gas discoveries.
We are prohibited by law from holding more than 25% of the equity of any natural gas transportation company. Therefore, there can be no assurance that the transportation infrastructure necessary to transport natural gas from the fields to distribution points and our customers will be built by third parties or that if built there will be sufficient capacity available to us for the exploitation of new natural gas discoveries or the development of existing fields. The failure to commercially exploit new or existing discoveries may result in impairment of the related assets and our inability to recover the capital expenditures invested to make these natural gas discoveries. As a result, we may be required to enter into agreements with natural gas transportation companies on terms that are not favorable to us.
For example, we have developed natural gas reserves in the Cusiana and Cupiagua fields, but transportation capacity to deliver gas from these fields is currently limited. Although there are projects under development that will eliminate this limitation in 2018, we can offer no assurance that they prove successful.
Our operations couldhave and may continue to be affected by conflicts withreactions of labor unions.unions, social organizations and contractors to organizational changes and other management decisions.
Due to the volatility of the markets and the existing low oil price environment, we have and will continue to undertake measures to enhance operating cost efficiency. Such measures involve changes in cost structure, downsizing our staff (including direct and indirect employees), and budget cuts, among others. Unions, contractors and social organizations in the communities where we have operations have in the past and may continue to oppose such measures causing work stoppages or decreasing productivity, which could have an adverse effect on our operations and financial condition.
In the past, we have been affected by strikes and work stoppages promoted byaddition, our own labor unions as well as our industry’s labor unions. Because of the expiration of thecurrent collective bargaining agreement that washas been in effect from 2009 tosince 2014 and the filinghas a term of petitions by four offive years, expiring June 30, 2018. There will be no changes to these terms until 2018; therefore, we do not expect any adverse reactions from our labor unions (USO, ADECO, SINDISPETROL and ASPEC), a process of collective bargaining began in the second half of 2014 and concluded with the signing of a new collective bargaining agreement with a term of four years, beginning on July 1, 2014. This collective bargaining agreement establishes the conditions that govern the labor contracts during its term and it appliesrelating to all unionized employees of the Company as well as to those unionized employees who voluntarily decide to benefit from it. The collective bargaining agreement also establishes the labor conditions that govern the contracts during its term. The 2014 negotiation was conducted without Company employee strikes, and the parties signed the collective agreement in the direct settlement stage. Nevertheless,this matter. However, we cannot assure you that we will not experience strikes or labor unrest in the future. If relations with the labor unions deteriorate, which could result in strikes, work stoppages or even sabotage, our results of operations and financial condition could be adversely affected.
Our subsidiaries are also exposed to strikes and work stoppages. For example, during 2014, Bioenergy was affected by 25 work stoppages that in total represented 269 nonproductive hours for the company. The main cause of these events was the non-fulfillment by the Isolux Ingeniería’s subcontractors of their labor obligations with the workers of the company. Cenit was also affected by a number of work stoppages promoted by the USO and organized by employees of certain of its contractor and subcontractors, including the stoppage during the maintenance activities in the section“Billete Blanco" of Galán – Salgar pipeline, which resulted in 17 nonproductive days.
Our activities may be interrupted or affected by external factors, such as abnormal weather conditions and natural disasters.
We are exposed to several risks that may partially interrupt our activities. They include fires or explosions, natural disasters, criminal acts and acts of terror, malfunction of pipelines and emission of toxic substances.
Also, the effects of climate change could create impacts and losses in any part of our business operations, resulting, for instance, as the result of increase in incidents generated by effects of rainfall in different areasthe intensity of the country, like the potential effects of the“La Niña” and “El Niño” phenomenon,climate phenomena, causing overflows in Ecopetrol infrastructure such as tanks, observation well, pools, API boxes, among others.floods and drought periods, increased temperature and rising sea levels.
For instance, in 2011 we were affectedThe “El Niño” climate phenomenon is characterized by weather conditions that intensified(i) a lack of rainfall, which limits the strengthamount of water necessary for the development of various activities of the average rain seasoncompany, and (ii) increased temperatures, which could have a direct impact on our workers’ health given an increased occurrence of heat waves and the increased occurrence of epidemics and diseases. The “La Niña” climate phenomenon is characterized by increased rainfall, which can generate (i) landslides that threaten pipeline infrastructure and limit road transportation and (ii) flooding, which could limit operations in Colombia, causing landslides due to the abnormal concentration of water in the soil. On December 11, 2011, our Caño Limón-Coveñas oil pipeline ruptured,production fields and on December 23, 2011, our Salgar-Cartago pipeline ruptured, in both cases as a result of soil movement caused by heavy rains.facilities.
As a result, of the occurrence of similar events in the future, our activities could be significantly affected or even paralyzed. These risks could result in property damage, loss of revenue, loss of life, pollution and harm to the environment, among others. If any of these occur, we may be exposed to economic sanctions, damages, fines or penalties in addition to the costs required to repair or remediate the related damage. These costs, fines and penalties may adversely affect our financial condition and results of operations.
| 100 |
Our operations, including our activities in areas classified as indigenous reserves and Afro-Colombian lands, are subject to opposition from members of communities in the surrounding area.various communities.
We currently carry out and plan to carry out activities in areas classified by the Government as indigenous reserves (resguardos) and Afro-Colombian lands (territorios colectivos). In order to undertake these activities, we must first comply with the Previous Consultancyprevious consultation process, set forth by Colombian law. These consultation processes are part of the administrative procedures for obtaining environmental permits or licenses to start our projects, works or activities in areas belonging to ethnic communities. In addition, consultations can be seen as a potential instrument to involve communities in the decision of developing extracting industry and infrastructure projects in their territories. Generally, these consultation processes last between foursix months to six months,one year depending on the community expectations, but may be significantly delayed if we cannot reach an agreement with the communities. We strive to be respectful of the Constitution and laws and the autonomy of indigenous and Afro-descendant communities, and we therefore do not enter their territories until we have reached an agreement with them.
Our activities are subject to opposition, including protests by various communities, in the surrounding area, and even in areas in which the previous consultancyconsultation process does not apply. Recently, through popular consultation, some communities have voted against the development of extractive industry projects. Any such similar situation may affect our future projects.
In recent years, indigenous communities have been claiming their ancestral territories and requesting recognition on previously closed consultation processes. We may be exposed to operational restrictions as a result of the opposition of these communities.
No assurancecertainty can be given that we will be able to reach an agreement with the different communities opposed to our operations or that such communities will participate in consultancyconsultation processes if available. We may be exposed to similar delays due to opposition from local communities in other countries where we carry out our activities.
We have made significant investments in acquisitions and we may not realize the expected value.
We have acquired interests in several companies in Colombia and abroad. See the sectionBusiness Overview—Our Corporate Structure. Obtaining the expected benefits of the acquisitions will depend, in part, on our ability to (1)(i) obtain the expected operationalresults of operations and financial resultscondition from these acquisitions, (2)(ii) manage disparate operations and integrate distinct corporate cultures, and (3)(iii) manage our objectives as a corporate group.group, and (iv) institute our corporate governance rules as well as other factors beyond our control such as (v) the economic and regulatory environment in countries in which we have made acquisitions and (vi) crude oil prices. These efforts may not succeed. Our failure to successfully obtain the expected results from our acquisitions could adversely affect our financial condition and results of operations.
Our constructionWe might be required to provide additional financial support to Bioenergy and Reficar in spite of the recent completion of their projects such as those being undertaken by our subsidiaries Reficar and Bioenergy, may be delayed or cost more than projected, which could affect our operating results and financial condition.
Our current and future investment projects could face planning and implementation problems, which could impact the competitiveness of our programs and projects, adversely affecting our results of operation and financial condition.
For example, Reficar raised US$3.5 billion through a limited-recourse project financing in which we acted as sponsor andEcopetrol S.A. provided both a construction support and a debt service guarantee. Ifguarantee and was also the constructionsponsor of the project to upgradefinancing. If Reficar experiences any situation that might affect the Cartagena refinery is delayed becausefulfillment of operational problems,its financial obligations, Ecopetrol S.A. must provide financial support to Reficar, through capitalizations, subordinated loans or even the sufficient financial resources, either by meansassumption of capital contributions or by granting a subordinated loan, so that Reficar can reach completion. Operational problems may include,the debt. These situations might be related, but are not limited to, labor productivity, or unavailability of construction material in the development of the project, or failure of the upgraded refinery to reach the expected performance level in terms of the quality of products and/or volumes produced. If Ecopetrol S.A. is required to provide additional capital or guarantees, other strategic projects may be delayed or cancelled, thereby affecting our operating results and financial condition.
During 2013 and 2014 we were called upon to provide Reficar with financial support beyond the US$3.5 billion Reficar raised through limited-recourse project financing. First, in 2013, Reficar requested approximately US$1 billion, under the Construction Support Agreement, and in 2014, Reficar requested US$1.4 billion for its construction project. Any increase in the project’s capital expenditures is expected to be funded under the Construction Support Agreement between Reficar and Ecopetrol S.A.. See the sectionBusiness Overview—Refining and Petrochemicals—Refining—ReficarReficar.. Further delays in the implementation of the project may result in larger capital expenditures, which could increase the overall cost of the project and impact our financial results.
Bioenergy is executing the construction of anAlso, Bioenergy’s ethanol plant, that was financed with COP$123 billion through bilateral loans for its agricultural component and COP$382 billion through an installed capacity of 480,000 liters per day. The project is currently expected to begin commercial operations in the second half of 2016. Any performance defaults by the new contractor,infrastructure leasing for its industrial component, may also meet situations such as social unrest, strikes or other labor actions strikesoperational difficulties that could negatively impact this estimated date, costsits operation and financial results. Although Ecopetrol is not the sponsor and has not provided financing guarantees to Bioenergy, some additional financial support might be needed to assure the stabilization of the project andproject.
| 101 |
Any situation that could affect the operations of these subsidiaries may have a negative impact on their profitability as well as their ability to pay their debt, which in turn could adversely affect our financial results.condition and results of operations.
Ongoing Colombian Statecontrol entities investigations regarding our subsidiaries Reficar and Bioenergy could adversely affect us.
Ecopetrol is a corporation majority owned by the Colombian Government that administers public resources and Reficar and Bioenergy are subsidiaries of Ecopetrol. Ecopetrol’s employees have a statutory responsibility to ensure the proper use of public resources. Reficar and Bioenergy’s employees also have a duty for proper management of public resources. The conduct of Ecopetrol, Bioenergy and Reficar’s employees are generally subject to the control and supervision of the Colombian State control entities. See the sectionRisk Review—Legal Proceedings and Related Matters for additional information.
The investigations concerning Reficar and Bioenergy that are described in the sectionRisk Review—Legal Proceedings and Related Mattersremain ongoing. Because these actions are in their early stages, it is still not possible to estimate the duration, scope or results of these investigations or related inquiries and requests for information by Colombian State control entities. While we are cooperating fully with both cases, adverse developments in connection with these investigations, including any expansion of the scope of the investigations, could negatively impact us and could divert the efforts and attention of our management team from our ordinary business operations.
As described in the sectionRisk Review—Legal Proceedings and Related Matters, the Prosecutor’s Office is conducting a confidential investigation regarding Reficar’s expansion and modernization project. On April 27, 2017, the Prosecutor’s Office announced its intention to pursue charges against eight individuals, including five past officers of Reficar or Ecopetrol, for the alleged crimes of document forgery, illegal interest in the execution of agreements, misappropriation of public funds and unjust enrichment. The Prosecutor’s Office has not yet made public the factual basis for such charges, and accordingly we are not in a position to predict the outcome of the Prosecutor’s Office’s investigation or the disposition of any charges that the Prosecutor’s Office may bring.
In connection with this investigation or any other investigation carried out by any other authority, there can be no assurance that we will not be required to pay penalties, or incur in additional costs and expenses, and expose us or our employees to sanctions and lawsuits, any of which could adversely impact our reputation and, in turn, could have adverse effects on our financial condition and results of operations.SeeRisk Review- Legal and Regulatory Risk - We may incur losses and spend time and money defending pending lawsuits and arbitrations and responding to administrative investigations.
Our results may be affected by the performance of our business partners or their third-party service providers, as many of our operations are executed under association and joint venture agreements with business partners.agreements.
Many of our operations are executedperformed through associations, joint ventures and other agreements with our business partners. Consequently, we depend on the performance of our business partners. The poor performance of any of our business partners,them, especially in those projects in which we do not act as operators,operator, could negatively impact oil and natural gas production, which in turn could have a negative impact on our results of operations and financial condition. We are exposed to the risk of not finding business partners with the appropriate skills and performance that we require for our projects. We are also indirectly exposed to the supply agreements and other third-party services contracted by our business partners in fields where we are not the operator.acting as operators under joint venture agreements.
Our insurance policies do not cover all liabilities and may not be available for all risks.
Our insurance policies do not cover all liabilities, and insurance may not be available for all risks. There can be no assurance that incidents will not occur in the future, that insurance will adequately cover the entire scope or extent of our losses or that we will not be found liable in connection with claims arising from these and other events, which could adversely affect our financial condition and results of operations.
A failure in our information technology systems or cyber security attacks may adversely affect our financial results.
We depend on the reliability and security of our information technology systems to conduct certain exploration, development and production activities, process financial records and operating data, communication with our employees and business partners, and for many other activities related to our business. Our information technology systems may fail or have other significant shortcomings due to operational system flaws or employee misuse, tampering or manipulation. In addition, we may become the target of cyber-attacks or information security breaches that could result in the unauthorized release, gathering, monitoring, misuse, loss or destruction of proprietary and other information. Any of these occurrences could disrupt our business, result in potential liability or reputational damage or otherwise have an adverse effect on our financial results.
| 102 |
During 2014,2016, our internal cyber security systems identified 288,194 Command & Controlseveral cyber security attacks such as brute force login attacks designed to extract information fromidentify valid credential in IT infrastructure and seventeen ransomware attacks-only one of them with data loss (low level confidentiality) at Ecopetrol S.A as well as an effective “Defacement” attack on a secondary site of Ecopetrol S.A.’s website (www.ecopetrol.com.co).S.A.-Our platforms also identified and controlled certain malware events and SQL injection attacks.
We have experienced a number of cyber attacks in the past, and althoughAlthough we have not experienced any material losses relating to failure of our information technology systems or cyber incidents, there can be no assurance that we will not suffer such losses in the future.
We are exposed to behaviors incompatible with our ethics and compliance standards.
Given the large number of contracts that we are a party to in Colombia and abroad with local and foreign suppliers, the geographic distribution of our operations and the great variety of actors that we interact within the course of business, we are subject to the risk that our employees, contractors, or any person having business relations with us may misappropriate our assets, manipulate our assets or information or engage in money laundering or the financing of terrorism, for such person’s personal or business advantage. Our systems for identifying and monitoring these risks may not be effective to fully mitigate them in all situations. Such acts may result in material financial losses or reputational harm to the Company.
Unavailability
The reliability and capacity of electricnational power supply systems may affect or limit the continuity of our operations or limit growth.
Ecopetrol S.A.’sOur average energy consumption in 20142016 was 678 MW equivalent,6,948 GWh/year, of which 90%65% was supplied through self-generation, and the remaining 10%35% through unregulated purchasespower grid. Our demand is 10.5% of the total energy demand in Colombia.
Several producing fields are connected to the national transmission system and depend on its expansion and reliability to keep steady production levels and to accommodate future growth. The national electricity market is volatile due to changes in hydrology and availability of fuels (natural gas, diesel etc.); and the grid expansion projects which are executed by power distribution contractors have experienced delays due to licenses and limited execution capability. To mitigate these risk the Ecopetrol Group decided to centralize the management of power sources and uses in order to optimize the energy availability, quality and cost, for the short, medium and long term. While the intention is to enhance system reliability by timely execution of electrical energy in the open market. Ecopetrol’s energy demand is expected to increase in 2015 to 978.8 MW equivalent, which would be supplied through similar proportions of self-generation and unregulated purchases. Given the growth in production and the start of a new transport and refining system, it is possible that during the next few years there will be insufficient electrical energy for our operations or the operations of fields in which we are a non-operating partner. This is because of the unavailability of market power given the delay of several energy transmission and generation infrastructure projects, the increase in the share of consumption by non-regulated users, and because of high dependency on the execution of self-generation and transmission projects and contracts managed by us or byto launch energy efficiency programs in all of our business partnerssegments, we cannot offer any assurance that are exposed to a number of risks, including high volatility in national energy conditions (such as hydrology, availability of natural gas), licensing restrictions and attacks on infrastructure, among others.we will prove successful.
Rising water production levels may affect or constrain our crude oil production.
During 2014, Ecopetrol S.A. and its partners2016, we produced more than 8approximately 9.36 million barrels of water per day. Limitations on the available water disposal capacity from time to time during the year affected our overall average oil production by almost 12,000 bpd, mainly in the Rubiales, Castilla and Chichimene fields. Although some of these limitations have been already addressed, takingTaking into account the nature of our reservoirs, we expect during 2015 a further increase in the water production levels to be managed by the Company may increase in our main fields. Ecopetrol, inthe future. In order to achieve itsour oil &and gas production goals and to avoid any additional production restrictions in the future,going forward, we will need to secure the required capacity to manage water levels. Factors that may trigger a possible constraint in our crude oil production due to the rising water production levels are: (1)(i) ineffective project management of the required facilities, and developments, (2)(ii) the Company’s and its partnerspartners’ ability to timely obtain the environmental permits related to water management, (3)(iii) social and community interactions that could affect the development and operation of these projects, and (4) at the current price levels,(iv) the availability of capital to execute the required projects. Higher water production levels could cause lower crude oil production, which could in turn negatively impact our results of operations.
| 5.1.2 | Risks |
This section discusses potential risks related to our extensive operations in Colombia.
| 103 |
The Colombian Governmentgovernment could seize or expropriate Ecopetrol’s assets under certain circumstances.
Pursuant to ArticleArticles 58 and 59 of the Colombian constitution, the Government can exercise its eminent domain powers in respect of Ecopetrol’s assets in the event such action is deemed by the Government to be required in order to protect public interests. According to Law 388 of 1997, eminent domain powers may be exercised through: (i) an ordinary expropriation proceeding (expropiació(expropiación ordinaria)ordinaria o judicial), or (ii) an administrative expropriation (expropriació(expropiación administrativa) or (iii) an expropriation for war reasons (expropiación en caso de guerra)administrativa). In all cases we would be entitled to a fair compensation for the expropriated assets. Also, as a general rule, compensation must be paid before the asset is effectively expropriated. However, the compensation may be lower than the price for which the expropriated asset could be sold in a free-market sale or the value of the asset as part of an ongoing business. The aforementioned Article 59 of the Colombian constitution establishes an expropriation for war reasons (expropiación en caso de guerra), which does not that compensation be paid before expropriation but can only be executed on a temporary basis.
Colombia has experienced internal security issues that have had or could have a negative effect on the Colombian economy and on us.
Colombia has experienced internal security issues, primarily due to the activities of guerrillas, paramilitary groups, drug cartels and criminal bands known asBacrim. From time to time, guerrillas target crude oil and multi-purpose pipelines, including the Oleoducto Transandino, Caño Limón-Coveñas and OcensaOleoducto Bicentenario pipelines, and other related infrastructure disrupting our activities and those of our business partners. During 2014,2016, the attacks against our pipeline infrastructure decreased by 43%35% in relation to 2013 (2252015 (80 attacks in 20132015 compared with 13052 attacks in 2014).2016), however they were strategically targeted and more severe. This situation especially affected the infrastructure located in Putumayo, Nariño, Arauca and Norte de Santander and the following pipelines: San Miguel Orito, Transandino, Bicentenario and Caño Limón Coveñas.as and Transandino. During the first quarter of 2017, 29 attacks against the infrastructure of the Caño Limon – Coveñas system have taken place, impacting our operations in this pipeline and resulting in deferred crude oil production of 603 thousand barrels. On several occasions, guerilla attacks have resulted in unscheduled shutdowns of transportation systems in order to repair or replace sections of pipelines or production facilities that have been damaged and deferral of production in certain fields, as well as caused us to undertake environmental remediation. For the pipeline infrastructure managed by Ecopetrol S.A., the direct cost of repair pipeline infrastructure due to terrorist attacks in 20142016 was approximately Ps$85,826COP$41.7 billion (US$33.56 million)13.9 million, with a 3,000.71 Colombian Peso/U.S. dollar exchange rate as of December 31, 2016). Also, our production was impacted by approximately 3,215 bpd due to events related to attacks on our infrastructure that limited our production. Guerrilla groups and other illegal armed groups also attacked natural gas transportation infrastructure that have affected our natural gas production in the past. These activities, their possible escalation and the effects associated with them have had, and may have in the future, a negative impact on the Colombian economy or on us, which may affect our customers, employees, assets or the environment, with resulting containment, clean-up and repair expenses. In the context of this complex security situation, allegations and court judgments have been levied against members of the Colombian Congress and on government officials for possible ties with illegal groups. This situation may have a negative impact on the credibility of the Colombian government, which could in turn have a negative impact on the Colombian economy or on us in the future.
Likewise, theft of refined products and crude oil—which are the results ofoil, resulting from security issues—issues, may impact our results in the future. Theft of refined products, which reached a peak of approximately 7,270 bpd in 2002, was reduced to 23.1approximately 28.5 bpd in 2013, but in 2014 increased to 51 bpd mainly due to the activity of gang leaders who have recently resumed their criminal acts.2016. The theft of crude oil increased from 541approximately 646 bpd in 20132015 to 840approximately 1,830 bpd in 2014, mainly due to2016.
Despite the security situation in southern Colombia and the presence of illegal groups who attack oil and gas infrastructure, including the theft of crude oil from pipelines.
Since 2012,peace agreement between the Colombian government has been in negotiationsand the FARC and the ongoing peace negotiation process with the National Liberation Army (the ELN), some illegal and terrorist activities of guerrilla groups or their members may continue
On November 30, 2016, the Colombian Congress approved a peace agreement between the Colombian government and the Revolutionary Armed Forces of Colombia, or FARC, the largest guerrilla group in Colombia, with a view to end the armed conflict. This is the latest attempt in a series of unsuccessful negotiations betweenFARC. Currently, the Colombian government is in the process of gradually integrating FARC members into civilian life.
On the other hand, the National Liberation Army, or ELN, an insurgency guerrilla group, has increased its actions against the Colombian security forces and the FARC. While the process is ongoing, military operations and hostilities continue. If the negotiations fail, the intensitycritical infrastructure of the internal armed conflict could increase,Nation in recent months, which we believe is an attempt to show its presence and influence in some regions and put pressure on the ongoing peace negotiations which formally began in February 2016.
| 104 |
Despite the progress made with the FARC and the ongoing negotiations with the ELN, some guerrilla groups may continue their illegal and terrorist activities, resulting in a deterioration of Colombia’s national security and, consequently, negatively impacting our operating results. We cannot assure you that, if the negotiations turn out to be successful, some of the guerrilla groups may not continue their illegal and terrorist activities, which could affect our operations.
There have been certain events in Colombia and abroad, which have resulted in political tensions between Colombia and some of its neighboring countries.
Diplomatic relations between Colombia and some of its neighboring countries, in particular Ecuador and Venezuela, have been tense in the past. These political tensions were heightened by the Colombian Government’s allegations that neighboring countries were supporting the guerilla groups, as well as by claims made by Venezuela stating that the Colombian army has entered its territory while in pursuit of FARC members. Although relations with these countriesVenezuela have stabilized there can be no assurance that similar allegations that may result in new and heightened tensionsimproved with Colombia’s neighbors would not be made again as was done in the past,current administration, economic differences between Colombia and would notVenezuela, mainly due to Venezuela’s current public disorder and internal political tension, could affect our diplomatic relations, impact border cities and therefore have a negative impact on Colombia’s economy and general security situation.
Companies operating in Colombia, including us, are subject to the prevailing economic conditions and the investment climate in Colombia, which may be less stable than the prevailing economic conditions and investment climate in developed countries.
Market prices of securities issued by Colombian companies, including us, are subject to the prevailing economic conditions in Colombia. A large portion of our assets and operations are located in Colombia and most of our sales are currently derived from our crude oil and natural gas production and the production of our refineries located in Colombia. Accordingly, our financial condition and results of operations depend to a significant extent on macroeconomic and political conditions prevailing from time to time in Colombia and on the exchange rates of exchange between the Colombian Peso and the U.S. dollar.
If the perception of improved overall security in Colombia deteriorates or if the investment climate worsens, the Colombian economy may face lower growth rates than the ones posted recently, which could negatively affect our financial condition and results of operations. Furthermore, the market price of our shares and American Depositary Shares, or ADSs, may be adversely affected by changes in governmental policies, particularly those affecting economic growth, exchange rates, interest rates, inflation and taxes. The Government has changed monetary, fiscal, taxation, labor and other policies over time and has thus influenced the performance of the Colombian economy. We have no control over the extent and timing of government intervention and policies.
Colombian political and economic conditions have a direct impact on our business and may have a material adverse effect on us.
Colombia’s economic policies may have direct impact on our company as well as market conditions, the prices of securities and our ability to access national and international capital markets. Our financial condition and results of operations may be adversely affected by the following factors, among others, and the Government’s response to such factors: exchange rate movements; inflation; exchange control policies; price instability; interest rates; liquidity of domestic capital and lending markets; tax policy; regulatory policy for the oil and gas industry, including pricing policy; and other political, diplomatic, social and economic developments in or affecting Colombia.
Uncertainty over whether the Government will implement changes in policy or regulations that may affect any of the factors mentioned above or other factors in the future may lead to economic uncertainty in Colombia and increase the volatility of the Colombian securities market and securities issued abroad by Colombian companies, which may have a material adverse effect on our results of operations and financial condition.companies.
Developments and the perception of risk in other countries, especially emerging market countries, may adversely affect the market price of Colombian securities, including our ADSs.
Securities issued by Colombian companies may be affected by economic and market conditions in other countries, including other Latin American and emerging market countries. Although economic conditions in Latin American countries and in other emerging market countries may differ significantly from economic conditions in Colombia, investors’ reactions to developments in these other countries may have an adverse effect on the market value of securities of Colombian issuers and our ability to access capital markets.
| 105 |
Due to past financial crises in several emerging market countries (such as the Asian financial crisis of 1997, the Russian financial crisis of 1998 and the Argentine financial crisis of 2001), the world financial crisis of 2008 and the recent sovereign debt crises in certain European countries, investors may view investments in emerging markets with heightened caution. In the past, as a result of crises in other countries, flows of investments into Colombia have been reduced. Crises in other countries, especially in emerging market countries, may hamper investor enthusiasm for securities of Colombian issuers. If Latin America experiences a new slow-down or if the price for securities of Latin American issuers falls, the price for our ADSs could follow this trend and could be adversely affected as could our ability to access domestic or international capital markets.
The Ministry of Mines and Energy has not calculated or liquidated the corresponding Net PositionPositions for eachEcopetrol as refiner and/or importer and for each fuel (gasoline and motor fuel oil) to be recognized by the FEPC to Ecopetrol since, and including,for the last quartersecond half of 2013.2016
The obligations on FEPC relatedUnder current Colombian regulations, the Ministry of Mines and Energy is required to periodically (initially by quarters, now twice a year) calculate and liquidate each refiner and/or importer of fuel’s Participation Differential (i.e. this arise when the paymentinternational parity price is lower than the reference price established by the Ministry of Mines and Energy), leading to a “Net Position”. However due to changes in law and the Net Position in favorMinistry methodologies we have still not received the calculations or liquidations for the second semester of Ecopetrol, when2016.
We do not know and if applicable, are subject towe cannot anticipate the issuance of a resolutionterms and conditions that will be established by the Ministry of Mines and Energy indicating the respective amounts and the deadline for its payment in Colombian Pesos, taking into account the availability of resources of the FEPC, all in accordance with the terms of Decree 1880 of 2014. Said Decree does not expressly state the obligation to liquidate and pay delayed interest on those amounts. Delays in the calculation, liquidation or payment of the Net Position in favor of Ecopetrol, when and if applicable, may have an adverse effect on the financial situation, the operational results and the liquidity of the Company.future liquidations. For more information regarding the FEPC, please see the sectionBusiness Overview—Applicable Laws and Regulations—Regulation of Refining and Petrochemical Activities—Regulation Concerning Production and Prices.
New or higher taxes resulting from changes in tax regulations or the interpretation thereof in Colombia could adversely affect our results of operations and financial condition.
New tax laws and regulations, and uncertainties in the interpretation with respect to existing and future tax policies pose risks to us. In recent years, the Colombian Congress and tax authorities have imposed additional taxes such as theImpuesto sobre la Renta para la Equidad (“CREE surtax, an income tax with specific purpose of the funding of social investment programs for the benefit of population in need and others,surtax”), and enacted modifications to taxes related to financial transactions, income, value added tax or VAT,(“VAT”), and taxes on net worth. In addition, in December 2016, pursuant to Law 1819, the Colombian Congress enacted a new tax reform, which became effective in 2017. For a description of taxes affecting our results of operations and financial condition in 2014,2016, see the sectionFinancial Review—Effect of Taxes, Exchange Rate Variation, Inflation and the Price of Oil on Our Results—Taxes. Changes in tax-related laws and regulations, and interpretations thereof, can affect tax burdens by increasing tax rates and fees, creating new taxes, limiting tax deductions, and eliminating tax-based incentives and non-taxed income. In addition, tax authorities and tax courts may interpret tax regulations differently than we do, which could result in tax litigation and associated costs and penalties. For
Until recently, for Colombian income tax purposes, and, as a general rule, dividends that arewere distributed from profits taxed at the corporate level arewere not taxed or subject to withholding tax at the shareholder level. However, beginning in 2017, dividends paid to non-resident shareholders are subject to a withholding tax. The withholding tax rates applicable to dividends paid to non-resident shareholders are: (i) a 5% dividend tax on dividends distributed from profits taxed at the corporate level; (ii) a 35% withholding tax rate on dividends distributed from profits not taxed at the corporate level; and (iii) an additional 5% dividend tax rate after applying the initial 35% withholding tax rate. Tax treaty rules might also apply on dividend distributions when a shareholder is a resident in a country that has executed a tax treaty with Colombia. However, this tax treatment may change in the future, and any change could have an adverse effect on our results of operations and financial condition.
| 5.1.3 | Legal and Regulatory Risks |
This section discusses potential legal and regulatory risks to Ecopetrol, including the risk of having to comply with new laws and regulations.
| 106 |
Our operations are subject to extensive regulation.
The Colombian hydrocarbons industry is subject to extensive regulation and supervision by the Government and regulatory agencies in matters including the award of exploration and production blocks by the ANH, the imposition of specific drilling and exploration obligations, restrictions on production, price controls, capital expenditures and required divestments. Existing regulation applies to virtually all aspects of our operations in Colombia and abroad. The commercialization activities of some of our products also face extensive regulation. Such regulation is subject to change by the applicable regulator affecting our ability to commercialize our products. See the sectionBusiness Overview—Applicable Laws and Regulations.
The terms and conditions of the agreements with the ANH under which we explore and produce crude oil and natural gas generally reflect negotiations with the ANH and other governmental authorities and may vary by fields, basins and hydrocarbons discovered.
We are required, as are all oil companies undertaking exploratory and production activities in Colombia, to pay a percentage of our production to the Government as royalties. The Colombian Congress has modified the royalty program for crude oil and natural gas production several times in the last 20 years, as it has modified the regime regulating new contracts entered into with the Government. In the future, the Colombian Congress may once again amend royalty payment levels for new contracts and such changes could have an adverse effect on our future exploration and production in Colombia. See the sectionBusiness Overview–Overview—Applicable Laws and Regulations–Regulations—Regulation of Exploration and Production Activities – Activities—Business Regulation–Regulation—Royaltiesfor a description of the current royalty scheme.
Our operations in Colombia are subject to extensive national, state and local environmental regulations. Environmental rules and regulations are applicable to our exploration, production, refining, transportation, supply and marketing activities, as well as the biofuels we produce. These regulations establish, among other things, quality standards for hydrocarbon products, air emissions and greenhouse gases, water discharges and waste disposal, environmental standards for abandoned crude oil wells, soil remediation, water pollution and the general storage, handling, transportation and treatment of hydrocarbons in Colombia. Currently, all exploratory projects drilling in areas that do not yet have a license must undergo an environmental impact assessment and must receive an environmental license from the governmental agency responsible for awarding environmental licenses, the Environmental License National Agency or ANLA. Environmental authorities with jurisdiction over our activities routinely inspect our crude oil fields, refineries and other production sites, and they may decide to open investigations or sanction proceedings, which may result in the imposition of fines, restrictions on operations or other sanctions in connection with potential non-compliance with environmental laws.
We are also subject to control and monitoring by the regional autonomous corporations (CAR), which are regional environmental regulations issued byauthorities that grant permits for theCorporaciones Autónomas Regionalesor CARs, which oversee compliance with regional environmental regulations. use and exploitation of natural resources, establish compensation measures for the use of these resources, and perform monitoring, control and sanctions function.
If we fail to comply with any of these national or regional environmental regulations or authorities, we could be subject to administrative and criminal penalties, including warnings, fines or closure orders of our facilities. Any such criminal penalty would be imposed on the legal representatives of the Company, including any legal representative, director or worker who participated or failed to take action related to the activities that lead to environmental damage. See the sectionBusiness Overview–Overview—Applicable Laws and Regulations–Regulations—Regulation of Exploration and Production Activities–Activities—Business Regulation–Regulation—Environmental Licensing and Prior Consultation.
Environmental regulation has become more stringent in Colombia in recent years. As a result, weour operating costs have allocated a greater percentage ofincreased in order to comply with these new technical environmental requirements as well as the need to strengthen our expenditures toward compliance with applicable law, and dedicated a managementspecialized team in charge of environmental compliance.compliance in project and operations. If environmental laws continue to impose additional costs on us, and as new laws and regulations relating to climate change become applicable to us, we may need to reduce our investments on strategic projects in order to allocate funds to environmental compliance. We are also exposed to delays in obtaining environmental licenses from ANLA, which can lead to cost overruns or to changes in our investment plans. These additional costs may have a negative impact on the profitability of the projects we intend to undertake or may make them economically unattractive, in turn having a negative impact on our results of operations and financial condition.
| 107 |
We are subject to foreign environmental regulations for the exploratory activities conducted by us outside Colombia. Failure to comply with foreign environmental regulations may result in investigations by foreign regulators, which could lead to fines, warnings or temporary suspensions of our operations, which could have a negative impact on our financial condition and results of operations.
Under certain of our credit agreements, we are under an obligation to comply with international environmental standards established by our lenders or by multilateral institutions. Failure to comply with such environmental standards could result in an event of default under the relevant credit agreements that we, or our subsidiaries, have entered into, which would affect our financial condition. For instance, the credit facility executed by Reficar for the financing of its expansion and modernization project includes an obligation to comply with the U.S.-Exim Environmental Procedures and Guidelines and the Organization for Economic Co-operation and Development (OECD) Common Approaches on Environment and Officially Supported Export Credits, and a credit agreement executed by Ecopetrol S.A. to finance purchases of U.S. goods and services requires Ecopetrol S.A. to comply with the U.S.-Exim Environmental Procedures and Guidelines.
In addition, we may be subject to foreign health and safety and environmental regulations for our exploratoryupstream activities conducted outside Colombia. Foreign health and safety regulations may be more severe than those established under Colombian law and, therefore, we may be required to make additional investments to comply with those regulations.
Legislation and regulatory initiatives relating to hydraulic fracturing and other drilling activities for unconventional oil and gas reserves could increase the cost of implementing our projects and the future costs of doing business or cause delays and adversely affect our operations.
Hydraulic fracturing is a commonly used process that involves injecting water, sand and small volumes of chemicals into the wellbore to fracture the hydrocarbon-bearing rock thousands of feet below the surface to facilitate higher flow of hydrocarbons into the wellbore. We expect to begin using hydraulic fracturing combined with horizontal drilling in the production of oil and natural gas from certain reservoirs, especially shale formations. The Government has promulgated a set of technical and environmental regulations to guide exploration activities in reservoirs which require these types of technologies. As a result, we are pursuing the relevant licenses to make these projects viable within our portfolio.
Outside Colombia, a number of groups have proposed initiatives to, among other things: further regulate hydraulic fracturing practices; limit water withdrawals and water use; require disclosure of fracturing fluid constituents; restrict which additives may be used; and implement temporary or permanent bans on hydraulic fracturing. Some of these initiatives have resonated with certain local groups, which are promoting banning or suspending hydraulic fracturing and other unconventional drilling activities in Colombia. These efforts may affect the regulatory framework related to these activities and could significantly increase the cost of, or cause delays in, the implementation of our Strategic Plan and adversely affect our operations and results of operations.
We may incur losses and spend time and money defending pending lawsuits and arbitrations.arbitrations and responding to administrative investigations.
We are currently a party to several legal proceedings filed against us. We are also subject to labor-related lawsuits filed by current and former employees in connection with pension plans and retirement benefits. For example, as of December 31, 2014,2016, Ecopetrol S.A. was a party to 2,9292,774 legal proceedings relating to civil, administrative, environmental, tax, and labor claims filed against us of which270 341 met the accounting threshold for an accrual provision. Additionally, Ecopetrol S.A.’s subsidiaries were a party to 1,136 legal proceedings relating to civil, administrative, environmental, tax, and labor claims filed against them of which 86 met the accounting threshold for an accrual provision. We allocate substantial amounts of money and time to defend against these claims, in which the claimants often seek substantial sums of money as well as other remedies. See Note 18—Estimated23– Accrued liabilities and provisions, and Note 29—Contingencies, to our consolidated financial statements and see the sectionRisk review – Review—Legal Proceedings.Proceedings and Related Matters. In addition, in accordance with Colombian law, we are subject to surveillance and investigations by certain administrative control entities in Colombia, which are intended to determine whether public funds have been misappropriated or whether they have been used in compliance with applicable law. Such investigations may divert the attention of management and subject the Company to reputational risk and increase difficulties in retaining talent. See the sectionRisk Review—Legal Proceedings and Related Matters.
| 5.1.4 | Risks |
This section discusses potential risks associated with an investment in our American Depository Shares (as opposed to our common shares) by investors outside Colombia.
Holders of our ADSs may encounter difficulties in protecting their interests.
Holders of our ADSs do not have the same voting rights as holders of our shares. As set forth in the Deposit Agreement,deposit agreement, dated September 16, 2008, among Ecopetrol S.A., JP Morgan Chase Bank, N.A., as depositary, and all holders from time to time of our American Depositary Receipts (the “Deposit Agreement”), ADSs may instruct our current depositary, JP Morgan Chase Bank, N.A., to vote on shareholder matters prior to a shareholders’ meeting. Colombia law does not, however, require Ecopetrol to request proxies from existing shareholders. Thus, shareholders may not become aware of some matters in time to instruct the depositary to vote their shares.
| 108 |
The Deposit Agreement provides ADSs with the right to instruct the depositary to vote common shares separately. The viability of this contractual provision is unclear. This is because regulatory agencies have advanced inconsistent positions regarding whether a depository must vote common shares as a single block or may vote them separately. Going forward, the Colombian regulatory authorities may change their interpretation as to how the voting rights should be exercised by ADS holders, and such possible interpretation could adversely affect the value of the common shares and ADSs.
Our ADSs holders may be subject to restrictions on foreign investment in Colombia.
Colombia’s International Investment Statute (the set of rules and regulations which govern the foreign exchange market and the transactions thereto, which include Resolution 8 of 2000 and External Circular No. DCIN 83 issued by the Colombian Central Bank among others) regulates the manner in which non-Colombian residents can invest in Colombia and participate in the Colombian securities market. Among other requirements, Colombian law requires foreign investors to register certain foreign exchange transactions with the Colombian Central Bank and outlines the necessary procedures to authorize certain types of foreign investments. Colombian law requires that certain foreign exchange transactions, including international investment in foreign currency between Colombian residents and non-Colombian residents, must be made through authorized foreign exchange market participants.intermediaries. Any income or expenses under our American Depositary Receipt, or ADR, program must be made through the foreign exchange market.
Investors acquiring our ADRs are not required to register with the Colombian Central Bank directly, as they will benefit from the registration to be obtained by the custodian for our common shares underlying the ADRs in Colombia. If investors in ADRs choose to surrender their ADRs and withdraw common shares, they must register their investment in the common shares as a portfolio investment through their local representative, which may be a brokerage firm, trust company or investment management companies supervised by the SuperintendencySuperintendence of Finance.Finance (Superintendencia Financiera de Colombia). Investors will only be allowed to transfer dividends abroad after their foreign investment registration procedure with the Colombian Central Bank has been completed. Investors withdrawing common shares could incur expenses and/or suffer delays in the application process. The failure of a non-resident investor to report or register foreign exchange transactions with the Colombian Central Bank relating to investments in Colombia on a timely basis may prevent the investor from remitting dividends abroad, or initiateresult in the initiation of an investigation that may resultand in a fine.the imposition of fines. In the future, the Government, the Colombian Congress or the Colombian Central Bank may amend Colombia’s International Investment Statute or the foreign investment rules, which could result in more restrictive rules and could negatively affect trading of our ADSs.
While Colombia currently has a floating exchange rate system, it is subject to change.free convertibility system. If a more restrictive convertibility system is implemented, the depositary may experience difficulties when converting Colombian Peso amounts into U.S. dollars to remit dividend payments. Also, currently Colombia has a floating exchange rate system that might be subject to change in the future. See the sectionShareholder Information–Information—Exchange Controls and Limitations.Limitations.
Holders of our ADSs may not be able to effect service of process on us, our directors or executive officers within the United States, which may limit your recovery in any foreign judgment you obtain against us.
We are a mixed economy company organized under the laws of Colombia. In addition, most of the members of our Board of Directors (“Directors”) and executive officers reside outside the United States. All or a substantial portion of our assets and the assets of these persons are located outside of the United States. As a result, it may not be possible for you to effect service of process within the United States upon us or these persons or to enforce judgments against us or them in U.S. courts obtained in such courts predicated upon the civil liability provisions of the U.S. federal securities laws. Colombian courts determine whether to enforce a U.S. judgment predicated on the U.S. securities laws through a procedural system known asexequatur. For a description of these limitations, see the sectionShareholder Information–Information—Enforcement of Civil Liabilities.Liabilities.
| 109 |
The protections afforded to minority shareholders in Colombia are different from those in the United States, and may be difficult to enforce.
Under Colombian law, the protections afforded to minority shareholders are different from those in the United States. In particular, the legal framework with respect to shareholder disputes is substantially different under Colombian law than U.S. law and there are different procedural requirements for commencing shareholder lawsuits, such as shareholder derivative suits. As a result, it may be more difficult for our minority shareholders to enforce their rights against us or our Directors or controlling shareholder than it would be for shareholders of a U.S. company.
ADRs do not have the same tax treatment as other equity investments in Colombia.
Although ADRs represent Ecopetrol’s common shares, for Colombian tax purposes, ADRs are securities different from their underlying assets. Therefore, ADR holders are not entitled to the tax treatment granted to holders of the common shares. Such tax treatment include,includes, among others, those benefits relating to dividends and profits derived from sale of Colombian common shares. For further information see the sectionShareholder Information–Taxation–Information—Taxation—Colombian Tax Considerations.
Judgments of Colombian courts with respect to our ADSs will be payable only in Colombian Pesos.
If proceedings are brought in the courts of Colombia seeking to enforce the rights of ADS holders of common shares, we will be required to discharge our obligation amounts in Colombian Pesos. Colombian law provides that an obligation in Colombia to pay amounts denominated in foreign currency may only be satisfied in Colombian currency at the Representative Market Exchange Rate of the date the judgment is obtained, and such amounts are then adjusted to reflect exchange rate variations through the effective payment date.
The relative volatility and illiquidity of the Colombian securities markets may substantially limit our investors’ ability to sell our ADSs at the price and time they desire.
Investing in securities that are traded in emerging markets, such as Colombia, often involves greater risk when compared with other world markets, and these investments are generally considered to be more speculative in nature.
The Colombian securities market is substantially smaller, less liquid, more concentrated and can be more volatile than other securities markets in the United States. TheAs of December 31, 2016, the Colombian Stock Exchange (Bolsa de Valores de ColombiaColombiaI),or BVC,“BVC”) had a market capitalization of approximately Ps$364,107COP$311,384 billion (US$153 billion103,770 million using the closing rate for 2014) as of December 31, 2014,2016), a 12.4% decrease12% increase when compared with the amount at the end of 2013,2015, a daily average trading volume of approximately Ps$167,448COP$194,116 million (US$83.7764.69 million, using the average exchange rate for 2014)2016), a 0.6% decrease42% increase when compared with the volume in 2013.2015. By comparison, the New York Stock Exchange or NYSE,(the “NYSE”) had a market capitalization of US$19.3519.6 trillion as of December 31, 2014,2016, and a daily trading volume of approximately US$49.968.9 billion in 2014.2016.
As of December 31, 2014,2016, our shares represented the highest market capitalization of the BVC accounting for 23.5%as of 7.6% of the total COLCAP index, which reflects the price volatiliyvolatility of the 20 most-liquid stocks.
Given the current ownership structure of our shares, it may be difficult for you to purchase large quantities of shares from a single shareholder. We cannot assure you that a liquid trading market for our ADSs will develop or, if developed, that it will be maintained. Without a liquid trading market, the ability of investors in our ADSs to sell them at the desired price and time could be substantially limited.
We are not required to disclose as much information to investors as a U.S. issuer is required to disclose.
We are subject to the reporting requirements of the SuperintendencySuperintendence of Finance and the BVC. The corporate disclosure requirements that apply to us may not be equivalent to the disclosure requirements that apply to a U.S. issuer and, as a result, you may receive less interim information about us than you would receive from a U.S. issuer.
| 110 |
| 5.1.5 | Risks |
Our controlling shareholder’s interests may be different from those of our minority shareholders.
Colombian Law 1118 of 2006 requires the Nation to maintain the majority of our outstanding capital stock. The Nation currently holds 88.49% of our outstanding capital stock, making it our controlling shareholder. The Nation as our controlling shareholder has majority voting rights at the shareholders’ meeting to elect the members of our Board of Directors. The Nation may propose and approve decisions that are in its own interest and in furtherance of its own economic and political interests that do not necessarily benefit minority shareholders.
Our controlling shareholder may approve dividends at the ordinary general shareholders’ meeting, notwithstanding the interest of minority shareholders, in an amount that results in us having to reduce our capital expenditures or increase our debt levels, thereby negatively affecting our prospects, results of operations and financial condition. See the sectionShareholder Information–Information—Dividend Policy.
Additionally, given our controlling shareholder’s interests, it may undertake projects, approve decisions or make announcements about its intentions related to its holding of our capital stock which may not be in our best interest or in the best interest of our minority shareholders, including holders of our ADSs, and could impact the price of our shares or ADSsADSs.
| Risk Management |
| 5.2.1 | Managing |
Since 2003,Under the leadership of the Vice-Presidency of Compliance, Ecopetrol S.A. hasconsolidated its internal control systems into an unified system that integrates the best practices called for by the Committee of Sponsoring Organizations of the Treadway Commission (COSO 2013), Sarbanes–Oxley Act (SOX), governance and management of enterprise IT (COBIT), Enterprise Risk Management -ERM- system, which is framed within the Internal Control System, is aligned(ERM) and our ethics and compliance rules, with the strategic planaim of the organization and is systematically monitored by the Boardestablishing an integrated management system for all control components; thereby allowing us to strengthen all of Directors semiannually and by the Enterprise Management Committee on a monthly basis.our control system.
The main purpose of the Ecopetrol S.A. ERM system’s Internal Control System is to contribute to achieving the strategic plan, ensuring proper management of risks that may cause deviations fromprovide reasonable assurance regarding the achievement of goals or affect the most valuable resourcesall of the company, generating relevant information for decision-makingCompany’s objective relating to operations, strategy, reporting and confidence in their stakeholders.compliance, through the appropriate risks management and ensuring the effectiveness of its controls. The system performance is systematically monitored by the Board of Directors semiannually.
Ecopetrol S.A.’s ERM systemInternal Control System is aligned to the Company’s strategy and business processes and gives responsibility to all employees to manage risk, to maintain the effectiveness of controls, to report incidents and deficiencies and to ensure continuous improvement of processes.
The risk management component of our Internal Control System is in charge of identifying events or situations that may affect our defined objectives, assessing and prioritizing them to implement the most appropriate response. This component has been designed and implemented across all the organization, with focus in two levels: Level 0a two-level focus: Enterprise Risk and Processes and Enterprise Level.Risks.
| (i) | Enterprise Risks: Are those risks that are directly associated with the business strategy plan of the Company and are systematically monitored by the Management Committee on a monthly basis. The management of those risks is led by a member of the Management Committee; and each risk has a defined treatment plan and monitoring indicators. |
| (ii) | Processes Risks: Are those risks that tend to identify potential failures in the activities related to our core and support business processes that drive us to achieve our strategic objectives. At this level, each process has its own identified risks with respective mitigation methods, including financial and non-financial control, treatment plans and/or monitoring indicators. |
| 111 |
Our risk management approach is based around the risk management cycle, consisting in six (6)five main stages: planning, identifying, evaluating, treatment and monitoring risks, as well as a cross-stage communication.communication across stages. This cycle is supported in three (3) pillars of risk management: culture, organizational structure and normative and management tools.
EachThree of the identified risks has an analysis of causes and consequences. Ecopetrol S.A. does use multidimensional risk analysis in which each risk impact is assessed in five (5) dimensions (People, Environment, Economics, Reputation and Clients) which represent theour most important resources to be protected by the company. This analysis is done to prioritize the risks by assigning valuestools within predefined scales of impact and probability. The risk level (Very High, High, Medium, Low or None) is obtained from the combination of the consequences (impacts) and the probability of occurrence of those consequences. According with the level of risk, action plans for management and mitigation are defined.
Also, as part of the monitoring stage of the risk management cycle, Ecopetrol has implemented Key Risk Indicators (KRIs) as a high impact tool for risk analysis. KRIs are metrics used to provide early signals of increasing risk exposures. These signals constitute information for proactive decision making in order to avoid risk materialization. Each one of the strategic risks identified in the company has at least one related KRI.component are:
| (i) | Risk Assessment Methodology: In order to properly prioritize mitigation, treatment and monitoring efforts of risk management at the process level, a standardized methodology was established to assess inherent and residual risk levels. The risk level (Very High, High, Medium, Low or None) is obtained from the combination of the consequences (impacts) and the probability of occurrence of those consequences. According with the level of risk, action plans for management and mitigation are defined. |
| (ii) | Mitigation Plans: Each year, in the risk management cycle, we define and implement mitigation plans in order to reduce the levels of exposure to risk through mitigation or elimination of some of its causes. Metrics and goals must be defined during the development of each plan to ensure its effectiveness and to prioritize our efforts on those with the greatest impacts. |
| (iii) | Monitoring Indicators: As part of the monitoring stage of the risk management cycle, Ecopetrol has implemented Key Risk Indicators (KRIs) which are metrics used to provide early signals of increasing risk exposures. These signals constitute information for proactive decision making in order to avoid risk materialization. |
Ecopetrol S.A. has defined guidelines and minimum requirements to implement an ERMInternal Control System framework for its subsidiaries. These guidelines provide different risk classifications according to three important variables: the size of the organizational structure, the scope of SOX and risk management maturity levelthe asset value of each subsidiary. The risk classification of each subsidiary determines the scope of implementation (Basic, Intermediate and Complete) of the ERM system.our Internal Control System. Under those guidelines, each subsidiary must report its risk management performance to its enterprise management committee, audit committee.committee, or board of directors (or whoever is acting on their behalf). In addition, they have to report it annually to Ecopetrol S.A. To assureensure compliance with the above measures, the subsidiaries have methodological support from Ecopetrol S.A. when it is requested. Additionally, yearly the information reported by the subsidiaries is also part of the analysis to update the Ecopetrol S.A. Strategic Risks Map.
| 5.2.2 | Managing Information Security and Cybersecurity |
Ecopetrol S.A. has a dedicated management team focused on information security issues and such as therisk analysis, treatment of information, safe information management practices, classification of critical business information, controlscontrol systems compliance and effectiveness of available information security technologies, all of which are articulated with the ERM system at the enterprise level.
Ecopetrol S.A. has recently reviewed itsincluded cybersecurity exposurerisk as one of the key enterprise risks. During 2014,Based on that, a working group was formed ledin 2014, coordinated by the our Vice-president of Innovation and Technology andinformation security area with the participation of managers of industrial control systems (SCADA systems)specialists, has been understanding the new challenges of cybersecurity risk; developing activities to identify critical digital assets and its security threats. During 2016, Ecopetrol S.A., informatics security and information security, withas a NOC (National Oil Company), reported to the purposeCyber Defense Command Unit (Comando Conjunto Cibernético, an entity under the control of identifying our cybersecurity risks.the Colombian Ministry of Defense) the first basic inventory of its critical cybernetic infrastructure to be included in the classified catalogue of national critical cybernetic infrastructure.
Although Ecopetrol S.A. is still at an early stage of managing its cybersecurity risks, our Vice-presidentthe working group has developed some activities in order to advance in the incorporation of Innovationcybersecurity practices to enhance the awareness about these risks at an operational level and Technology has begun a process of socialization and involvement byadjust current information security practices considering the higher-level employees of the organization, suchnew cyberthreat context. Likewise, as the Audit Committee of the Board of Directors, to which a report was presented summarizing the most relevant aspects of our cyber security issues. As a result of this process, we are currently reviewing the feasibility of incorporating elements and strategic toolsrelative to the management of the cyber security threat;threat, including, among others, policies, hedging,cybersecurity insurance coverage, and specialized monitoring and control mechanisms.
In addition,
| 112 |
Currently, Ecopetrol S.A. shareshas incorporated a Security Operations Center service, which enhances our ability to foresee and identify trends in attacks in Ecopetrol S.A.’s information withtechnology infrastructure and to monitor Ecopetrol’s reputation on the “Comando Conjunto Cibernético”, an entity under the Ministry of Defense, through which the national government is monitoring cyber security themes, in order to have a clearer view of the scope of protection required in these infrastructures.internet.
| 5.2.3 | Managing Financial Risk |
We are exposed to certain risks associated with the nature of our operations and the financial instruments we use. Among thosethe risks that affect our financial assets, liabilities and expected future cash flows are the changes in commodity prices, currency exchange rates, interest rates and the credit quality of our counterparties.
Commodity price risk is associated with our day-to-day operations as we export and import crude oil, natural gas and refined products. We control our exposure to commodity price volatility using the “cash flow at risk” methodology, under which we estimate the impact that price fluctuations have over the liquidity of the company. We occasionally use hedges attached to cash flows topartially protect our financial statementsresults from price fluctuations.fluctuations taking into account that part of our financial exposure under purchase contracts for crude oil and refined products depends on international oil prices. We believe that the risk of such exposure is partially naturally hedged since we either export crude oil at international market prices or sell refined products at prices that are correlated to international market prices. We do not use derivative financial instruments for speculative or profit-generating purposes.
Consequently, part of our financial exposure under crude oil and refined products purchase contracts with certain of our business partners and third parties depends on international oil prices. We believe that the risk of such exposure is naturally hedged since we either export the crude oil at international market prices or sell refined products at prices which are correlated with international market prices. Under most of our existing contracts, the purchases are subject to pipeline capacity.
Currency risk arises in our operations because we havegiven the fact that most of our revenues are derived from sales of products quoted in or with reference to sell U.S. dollars regularly in order to cover any currency mismatches that may arise. For example, such currency mismatches can be observed in that approximately 64% of Ecopetrol S.A.’s incomedollars. Therefore when the Colombian Peso depreciates against the U.S. dollar, our revenues converted into Colombian Pesos, increase. Conversely, when the Colombian Peso appreciates against the U.S. dollar, our revenues decrease. On the other hand, imported goods, oil services and the debt, which is mainly denominated in U.S. dollars, while only 33%become less expensive when the Colombian Peso appreciates against the U.S. dollar and more expensive when the Colombian Peso depreciates against the U.S. dollar.
As of December 31, 2016 our U.S. dollar-denominated total debt was US$15.2 billion, which we recognize in our consolidated financial statements at its amortized cost, which corresponds to the present value of cash flows, discounted at the effective interest rate. Out of this total, US$12 billion relate to Ecopetrol S.A., whose functional currency is the Colombian Peso. Therefore, when the Colombian Peso depreciates against the U.S. dollar, Ecopetrol S.A. is exposed to an exchange rate loss. In contrast, when the Colombian Peso appreciates against the U.S. dollar, Ecopetrol S.A. is exposed to an exchange rate gain. Some of the Ecopetrol Group’s subsidiaries have the U.S. dollar as functional currency and are not exposed to a material exchange rate risk resulting from fluctuations in the Colombian Peso against the U.S. dollar. On the asset side, when the financial statements of the Group are consolidated, the exchange rate differential of the subsidiaries’ assets and liabilities whose functional currency is the U.S. dollar is recognized directly in equity, as part of other comprehensive income.
Taking previous considerations into account, Ecopetrol seeks to identify and manage currency risk in a comprehensive manner, using an integrated analysis of natural hedges in order to benefit from the correlation between income or investments in a foreign operations and debt denominated in foreign currency. In addition, the risk management strategy of the Company may involve the use of financial derivative instruments, and non-derivative financial instruments. On October 1, 2015, Ecopetrol S.A. adopted hedge accounting as part of its expenses arerisk management strategy, using the natural hedge between exports and dollar-denominated debt. US$5.4 billion of Ecopetrol S.A.’s debt in U.S. dollars was designated as hedge instrument of its future export sales for the period 2015 – 2023. On June 8, 2016, Ecopetrol S.A. continued its hedge accounting strategy, using the natural hedge between some of its foreign investments and its dollar-denominated debt in an amount of US$5.2 billion. The remaining portion, 12% of Ecopetrol S.A.’s dollar-denominated debt, as well as the financial assets and liabilities denominated in foreign currency continue to be exposed to the fluctuation of the exchange rate, which means that an appreciation of the Colombian peso against the U.S dollar could generate a loss if companies whose functional currency is the Colombian peso have an active net position in U.S. dollars or a gain if they have a net liability position in U.S. dollars. Similarly, 67%Conversely, a depreciation of Ecopetrol S.A.’s expenses are denominated inthe Colombian Pesos, while 36% our incomepeso against the U.S. dollar could generate a gain if companies whose functional currency is denominated inthe Colombian Pesos. When possible, Ecopetrol S.A. controls its currency risk through natural hedging by maintaining fundspeso have a net active position in U.S. dollars or a loss if they have a net liability position in U.S. dollars. Finally, the Company maintains enough cash in Colombian pesos and Colombian PesosU.S. dollars to meet its expenses in each respective currency. In addition, Ecopetrol S.A. usually use derivativecurrency (see Note 4.1.5 to our financial instruments such as forwards, futuresstatements for further explanation of the accounting policy and swaps depending onNote 31.2 for details of the impacthedge accounting adopted). With the adoption of hedge accounting, the effect of volatility of foreign exchange rate on its U.S. dollar-denominated obligations, which may affect the hedged portion of the debt is recognized directly in equity, as part of other comprehensive income. Our hedge management strategy is completely focused on our accounting, reason why the ultimate effect will only be determined when the hedge operations come to an end. Nevertheless, it is important to bear in mind that for Ecopetrol S.A’s cash flow, the effect of the Company. These strategies partially mitigate any adverse effectColombian peso appreciation against the U.S dollar is positive given the fact that we habitually convert our income in foreign currency risk may have over our financial statements.to Colombian pesos.
| 113 |
Interest rate risk arises from our exposure to changes in interest rates mainly as we have floating-rate instruments in our investment portfolio anda result of the issuances of floating rate debt linked to LIBOR, DTF and IPC rates.CPI (with a participation of 18.9%, 8.2% and 3.5%, respectively, of the nominal debt balance as of December 31, 2016). Thus, volatility in interest rates may affect the fair value of and cash flows related to our investments and floating rate debt. In 2014,2016, our analysis of the situation about credit risk events and the global financial markets drove us to decide not to hedge the interest rate risk. Nevertheless, our treasury office continuously monitors the performance of interest rates and its impactthe effect of interest rates on our financial statements. Ecopetrol S.A. controls the exposure to interest rate risk of its fixed income portfolio by establishing limits to its effective duration (between +/- 25% of the portfolio’s benchmark duration), Value at Risk of not more than 1.65% of the carrying value of the fixed income portfolio and Tracking Error, a measure of the return based on the funds' net asset value, relative to the return of the index over time, of not more than 80 basis points relative to the benchmark index for the fixed income portfolio.
The trust funds linked to Ecopetrol S.A.’s pension obligations (PAP) are also exposed to changes in interest rates, as they include fixed- and floating-rate instruments that are markedmark to market. This exposure is continuously monitored by our treasury office given the potential impact volatility may have on our financial statements.results. The treasury office’s information is gathered from reports sentprovided by the asset managers. These reports refer to regulatory limits as well as market, credit and liquidity risks. The investment guidelines with respect to the PAPs are issued by the Colombian regulation for pension funds, as stipulated in the Decree 941 of 2002 and Decree 1861 of 2012, where it is indicated that they have to follow the same regime as the regular obligatory pension funds in their moderate (i.e., neither conservative nor aggressive) portfolio. For further information regarding the trust funds linked to the pension obligations of the company, see Note 22—Memorandum accounts,22.2 Plan assets to theour consolidated financial statements.
Finally, counterparty risk is the potential probability that a borrower or counterparty defaults on any obligation. In our case, we are exposed to this risk as we invest in different financial instruments and receive letters of credit in order to mitigate our exposure with our commercial counterparties. We manage this risk through an analysis of thean issuer’s creditworthiness, the stock price behavior, spreads on credit default swaps and their probabilitiesthe probability of default.
Investment Guidelines
Ecopetrol S.A.
Following the promulgation of Decree 1525 of 2008, which provides general rules on investments for public entities, Ecopetrol S.A.’s management established guidelines for our investment portfolios. These guidelines determine that investments in Ecopetrol S.A.’s U.S. dollar portfolio are generally limited to investments of our excess cash in fixed-income securities issued by entities rated A or higher in the long term and A1/P1/F1 or higher in the short term (international scale) by Standard & Poor’s Ratings Services, Moody’s Investors Service or Fitch Ratings. In addition, Ecopetrol S.A. may also invest in securities issued or guaranteed by the U.S. government or Colombian government, without regard to the ratings assigned to such securities. In Ecopetrol S.A.’s Colombian Peso portfolio, it must invest our excess cash in fixed-income securities of issuers rated AAA in the long term, and F1+/BRC1+ in the short term (local scale) by Fitch Ratings Colombia or BRC Standard & Poor’s. In addition, Ecopetrol S.A. may also invest in securities issued or guaranteed by the Colombian government without rating restrictions.
In order to diversify risk in our Colombian Peso portfolio, Ecopetrol S.A. does not invest more than 10% of the excess of cash in one specific issuer. In the case of our U.S. dollar portfolio, it does not invest more than 5% of the excess of cash in one specific issuer in the short term (up to one year), or 1% in the long term.
| 114 |
Ecopetrol S.A.’s investment portfolio in U.S. dollars is segmented into four tranches, each one matching our liquidity needs. The working capital tranche is calculated taking into account our cash flow needs for the next 60 days. The liquidity tranche is calculated as the contingent cash flow needs over the working capital, taking into account the development of capital expenditures related to projects. The asset liability tranche is built to match our long-term debt. The investment tranche includes the remaining amount of the total portfolio after deducting the amounts pertaining to the above mentioned tranches and after subtracting the Colombian Peso portfolio.
Ecopetrol S.A.’s investment portfolio in Colombian Pesos is segmented in two tranches, each one matching our liquidity needs. The first tranche is calculated taking into account our cash flow needs for the next 30 days, and the second tranche is built for investment purposes.
| Legal Proceedings and Related Matters |
We are a party to various legal proceedings in the ordinary course of business. Other than the proceedings disclosed in this annual report, we are not involved in any pending (or, to our knowledge, threatened) litigation or arbitration proceeding that we believe will have a material adverse effect on our Company. Other legal proceedings that are pending against or involve us and our subsidiaries are incidental to the conduct of our and their business. We believe that the ultimate disposition of such other proceedings individually or in an aggregate basis will not have a material adverse effect on our consolidated financial condition or results of operations.
As of December 31, 2014,2016, Ecopetrol S.A. was a party to 2,9292774 legal proceedings relating to civil, administrative, environmental, tax and labor claims filed against us in the Colombian courts and arbitration tribunals, of which 270341 had an accrual provision. We allocate sufficient amounts of money and time to defend these claims. Historically, we have been successful in defending lawsuits filed against us. Other than the environmental administrative proceedings described in the last paragraph of this section, based on the advice of our legal advisors, it is reasonable to assume that the litigation procedures brought against us will not materially affect our financial position or solvency regardless of the outcome. See Note 29—Contingencies,23 – Accrued liabilities and provisions to theour consolidated financial statements included in this annual report for a discussion of our legal proceedings.
Llanos Oil
In December 2010, Llanos Oil Exploration Ltd., or Llanos Oil, filed a lawsuit against us in a district court of the Netherlands before The Court of The Hague which, if decided against us, could materially affect our financial condition. The plaintiff alleges early termination attributable to us of the following exploration activity contracts: the 1997 Las Nieves Association Contract and the 2002 Guatapurí Association Contract. These contracts were terminated because of the default by Llanos Oil on July 28, 2000, and July 23, 2003, respectively, in accordance with the provisions of the contracts. In the incidental proceedings judgment of May 30, 2012, the district court in The Hague ruled that it lacks jurisdiction to hear the case and rejected all the legal grounds of the plea of Llanos Oil regarding the jurisdiction of the court. Llanos Oil appealed on August 2012. On October 15, 2013, the Court of Appeals rejected Llanos Oil’s appeal in full; the judgment of the Court of First Instance that the Dutch Courts do not have jurisdiction was confirmed. Llanos Oil appealed the judgment of the Court of Appeals before the Supreme Court. On March 18, 2015, the Supreme Court summarily denied Llanos Oil’s appeal, thereby rejecting Llanos Oil’s case against Ecopetrol in the Dutch courts.
Caño Limón-Coveñn – Coveñas Crude Oil Pipeline Spill
On December 11, 2011, the Caño Limón-Coveñas oil pipeline ruptured and caused the spill of approximately 3,267 barrels of crude oil into the Iscala creek, which connects with the Pamplonita River that provides water to the city of Cúcuta. The incident did not cause any fatalities or injuries.
We launched an internal investigation and hired a highly renowned international consultant to investigate the causes of this incident. The conclusion of the investigations was that the rupture occurred as a result of an unusual movement of soil and the tensioning of the pipeline.
A class action lawsuit has been filed against Ecopetrol S.A. and against employees of the company, and the First Administrative Court of Cucuta has jurisdiction to conduct the case, which is in the probatory stage.
The Regional Environmental Authorityauthority of Norte de Santander, or CorporacióCoporación Autónoma Regional de la Frontera Nororiental – CORPONOR, initiated an investigation into the causes of the incident and also initiated enforcement actions against us for the allegedly wrongful implementation of the contingency plan. These proceedings were assumed by the National Authority on Environmental Licensing – ANLA according to national jurisdiction rules. As of the date of this annual report, the Agency has ceased all efforts on the aforementioned investigation and is determining whether or not to open a new investigation.
The Colombian General Comptroller’s Office initiated an investigation to determine whether Ecopetrol’s President, the Vice-president of Transportation, and two other employees of the company should be held financially liable for the Caño Limón-Coveñas pipeline spill and consequently for having caused a decrease in the assets of Ecopetrol. As of the date of this annual report, the investigation is in the probatory stage.
CORPONOR(CORPONOR) has filed a lawsuit against Ecopetrol at the First Administrative Court of Cucuta claiming for (i) the environmental loss caused by the incident and (ii) for compensation costs relating to the environment damage for approximately Ps$COP$33 billion. Ecopetrol’s legal counsel filed to dismiss the lawsuit on June 2, 2014, based on three grounds: (i) there is no proof of environmental loss, (ii) CORPONOR does not have the authority to file this lawsuit and (iii) CORPONOR’s petition for direct compensation is not the proper legal action according to the applicable procedural rules. Currently this lawsuit is in probatory stage.
Ecopetrol and national and local authorities are developing a project for the development of an alternative to the water supply in the intake of the aqueduct in Cúcuta, which was approved by the Company’s Board of Directors in December 2011 as part of the strengthening of its contingency plans and its relationship with its stakeholders. WeCurrently local authorities are currently designing detailed engineering plansattempting to acquire the necessary economic resources for the project.project and Ecopetrol has finalized the basic and detailed engineering.
| 115 |
BT Energy Challenger
On October 22, 2014, we were served with a class action suit against us seeking monetary damages of approximately Ps$COP$7.4 trillion related to an incident that occurred on August 21, 2014, during the loading operations of the BT Energy Challenger vessel. The claimants alleged possible damage to the port area of Ecopetrol’s terminal in Coveñas, as well as of marine and submarine areas and beaches that form the geographical area of the Morrosquillo Gulf. This allegation is currently under investigation by the HarbourHarbor Master of Coveñas. Ecopetrol filed a motion requesting the judge to require the claimants to amend their claim to more precisely set forth the facts and evidence it believes establishes Ecopetrol’s liability. As
On March 3, 2015, Ecopetrol filed its statement of defense arguing the dateexclusive fault of this annual report,a third party. On October 20, 2015, the judge has not decided on Ecopetrol’s motion, soCourt denied a class action of more than 100 informal traders in the period for Ecopetrolregion because there is no common identity with the initial class (hotel employees). However, during 2016 the Sucre Administrative Tribunal accepted another 1208 informal traders and fishermen as claimants.
On March 10, 2017, a mandatory conciliatory hearing was held in order to file the answer to the lawsuit has not yet ended.seek an agreement but it was declared unsuccessful.
PetroTiger
As highlighted in a previous 20-F and previous 6-K filing,filings, on January 6, 2014, the United States Department of Justice (DOJ) announced the unsealing of charges against two former co-chief executive officers (CEOs) and the former general counsel of PetroTiger Ltd. (PetroTiger), alleging, among other things, violations of the U.S. Foreign Corrupt Practices Act (FCPA) and conspiracy to commit violations of the FCPA and money laundering in connection with payments made to an Ecopetrol employee. By the time of the DOJ announcement, that employee no longer worked at the Company. The DOJ alleged the payments were made to secure Ecopetrol’s approval for PetroTiger’s entry into an oil services contract with Mansarovar Energy Colombia Ltd. Ecopetrol participated in the Mansarovar project as non-operating partner in a joint operating agreement. Also on January 6, 2014, the DOJ announced that the general counsel of PetroTiger had pled guilty on November 8, 2013, to one count of conspiracy to violate the FCPA and to commit wire fraud. One of the charged former co-CEOs pleaded guilty on February 18, 2014, to the same charge. On May 9, 2014, the DOJ charged the other former co-CEO with conspiracy to violate the anti-bribery provisions of the FCPA, conspiracy to commit wire fraud, conspiracy to launder money, and substantive FCPA anti-bribery and money laundering violations. On June 15, 2015, that co-CEO pleaded guilty to conspiracy to violate the FCPA.
After the DOJ unsealed its charges on January 6, 2014, Ecopetrol filed a complaint the same month, jointly with the Transparency Secretariat of the Presidency of the Republic, to Colombia'sColombia’s Attorney General'sGeneral’s office requesting the investigation of individuals who may have been involved in the wrongdoing related to the Mansarovar contract. Colombian authorities initiated a proceeding related to PetroTiger, and on March 11, 2015, arrested four current Ecopetrol employees and two former Ecopetrol employees related to their investigation of the Mansarovar project and five other contracts involving PetroTiger and Ecopetrol. To date, the control entities investigations are ongoing. Throughout 2016, Colombia authorities issued several judgments in connection with former PetroTiger directors, a retired employee of Ecopetrol and other persons involved.
Ecopetrol has responded to information requests from the DOJ and Colombian authorities in connection with their investigations of PetroTiger. Ecopetrol has suspendedbeen designated with the formal status of victim in the local Colombian proceedings. It has terminated the employment of the four charged individuals who were Ecopetrol employees consistent with Colombian law.at the time of the arrests. Ecopetrol has also initiatedconcluded an internal investigation focused onand has not identified any new issues identified in the U.S. and Colombian proceedings and, upon completion of that investigation, will evaluate any further measures.relating to PetroTiger.
Salgar-Cartago Multipurpose Pipeline Spill
On December 23, 2011 our Salgar-Cartago pipeline ruptured. Internal and external experts believe this incident occurred as a result of creep movement of soil caused by severe weather conditions, causing the soil surrounding the pipeline to exert strong pressure on the pipeline and rupture it. Due to the rupture, approximately 59,976 U.S. gallons of gasoline spilled into the surrounding area in La Divisa and Villa Carola in the Municipality of Dosquebradas, Risaralda. The spilled gasoline from the pipeline subsequently came into contact with a heat source which ignited it, causing several explosions that tragically resulted in 33 fatalities and 35 injuries, as well as damage to the neighboring houses and buildings. In January 2012, we launched the Dosquebradas Project to address the effects of the incident, and asAs of the date of this annual report, the project’s health, legal, environmental and social components have been successfully completed.13 lawsuits related to this incident are active for an approximately worth of COP$16.2 billion.
| 116 |
Colombia’s National Authority on Environmental Licensing (ANLA) conducted an investigation into Ecopetrol’s fulfillment of its obligations regarding forest conservation and subterranean-waters and soils monitoring. The investigation was closed on September 10, 2014 because ANLA accepted and agreed with Ecopetrol’s internal investigation of the incident, which concluded that the origin of the rupture of the pipeline was the result of a creep movement caused by severe weather conditions in the area, causing the surrounding soil to exert strong pressure on the pipeline.
Environmental Administrative Proceedings
As of December 2014,2016, Ecopetrol S.A. was party to 166209 environmental administrative proceedings, of which 146193 were initiated before 2014,2015, and 2016 during 2014.2016. During 2014, eight2016, six proceedings were concluded, in twofour of them we were subject to monetary fines.fines through Resolutions Corporinoquía Resolution 200.41-16-0551 of May 3, 2016, Corporinoquía Resolution 200.41-16-0873 of July 18, 2016, Cam Resolution 2134 of July 25, 2016 and Corpoamazonía Resolution 1162 of September 9, 2016. However, these four proceedings were suspended due to the replenishment of resources. It is not possible for us to determine whether the pending proceedings could have a material effect on Ecopetrol.
Reficar Investigations
Ecopetrol is a corporation majority owned by the Colombian Government that administers public resources and Reficar is a wholly owned subsidiary of Ecopetrol. Ecopetrol’s employees have a statutory responsibility to ensure the proper use of public resources. Reficar’s employees also have a duty for proper management of public resources.
The conduct of Ecopetrol’s and Reficar’s employees are generally subject to the control and supervision of the following control entities, among others:
| · | The Attorney General’s Office (Procuraduría General de la Nación) is the entity that supervises compliance with applicable law by public employees and private sector employees that carry out public functions. The Office has the responsibility for investigating and disciplining individuals in respect of any failure to so comply. |
| · | The Prosecutor’s Office (Fiscalía General de la Nación) is the entity in charge of investigating potential crimes and prosecuting alleged crimes before the court in judicial proceedings. |
The following are the most significant investigations and proceedings carried out by the aforementioned state entities:
| 1. | The Office of the Comptroller General’s investigations and proceedings: |
As a result of the modifications of the schedule and budget related to Reficar’s expansion and modernization project (the “Project”), the Office of the General Comptroller initiated a special audit investigation of the Project in 2016 and delivered a final report to Reficar on December 5, 2016. The report made 36 findings most of which were related to increased costs compared to budget for services, labor and materials. As required, on January 18, 2017, Reficar submitted an action plan exposing and addressing the 36 findings in the following areas: (i) contract management, (ii) supervision of engineering standards contracted with third parties, and (iii) documentation of the control, reporting and monitoring mechanisms of subcontracts.
As a result of the findings described above the Office of the General Comptroller recently opened actions for financial responsibility (proceso de responsabilidad fiscal) against 36 individuals and the six companies involved in the Project, including current and former members of Ecopetrol’s Board of Directors; former members of Reficar’s Board of Directors; current and former employees of Ecopetrol; and former employees of Reficar, as well as Chicago Bridge & Iron Company N.V., CBI - Chicago Bridge & Iron company (CB&I) Americas Ltd., Chicago Bridge & Iron Company CB&I UK Limited, CBI Colombiana S.A., Foster Wheeler USA Corporation and Process Consultants Inc. The current members of Ecopetrol’s board and senior management subject to these proceedings are Juan Carlos Echeverry Garzón, Chief Executive Officer; and Joaquín Moreno Uribe, Horacio Ferreira and Mauricio Cárdenas Santamaría, all of them members of the Board of Directors. These actions pertain to an eventual reduction of the value of state assets due to a lower than expected profitability at Reficar as a result of the modifications of the schedule and budget of the project.
| 117 |
On January 2017, the Office of the General Comptroller initiated another special audit in Reficar. As of the date of this annual report, the audit is in its preliminary stage.
| 2. | The Attorney General’s Office investigations: |
The Attorney General’s Office currently has two ongoing investigations relating to the Project: (i) the first, initiated in 2012 against members of Reficar’s Board of Directors at the time, as well as certain current and former officers of Reficar; and (ii) a more recent investigation regarding delays in the completion of the Project, focusing on the role of current and former officers of Ecopetrol, as well as current and former members of Ecopetrol’s Board of Directors.
| 3. | The Prosecutor’s Office investigations: |
The Prosecutor’s Office is conducting a confidential investigation. In connection therewith, on April 27, 2017, the Prosecutor’s Office announced in a press release its intention to pursue charges for the alleged crimes of document forgery, illegal interest in the execution of agreements, misappropriation of public funds and unjust enrichment against: (i) four former executives and officials of Ecopetrol and Reficar (ii) one current employee of Ecopetrol who was assigned to work in Reficar between 2012 and 2016, (iii) two executives of CB&I and (iv) Reficar’s statutory auditor from 2013-2015. According to the announcement the total amount involved in the alleged charges is estimated at COP 610 billion pesos (equivalent to approximately US$ 209 million at the Representative Exchange Rate as of May 26, 2017 of COP 2,911.66 per US$).
The Ecopetrol and Reficar executives and officials are: Orlando José Cabrales Martínez (Reficar CEO, 2009-12); Reyes Reinoso Yañez (Reficar CEO, 2012-16), current employee of Ecopetrol; Felipe Laverde Concha (Reficar General Counsel, 2009-March 2017); Pedro Alfonso Rosales Navarro (Ecopetrol Downstream Executive Vice President, 2008-15); and Nicolás Isaksson Palacios (Reficar Lead Legal Counsel, 2013-January 2017).
The Prosecutor’s Office has not yet made public the factual basis for such charges, and accordingly we are not in a position to predict the outcome of the Prosecutor’s Office’s investigation or the disposition of any charges that the Prosecutor’s Office may bring. As of the date of this annual report, to the best of Ecopetrol’s knowledge, the financial statements continue to fairly represent the financial and operational condition of the Company in all material aspects and its internal controls remain effective.
In the press release, the Prosecutor’s Office also announced that in order to conclude the next phases of the investigation, related to, among others, the selection of the strategic partner, the exit of Glencore and the selection of the contractor, it would be interviewing executives of Ecopetrol, Reficar, Glencore and the supervisory joint venture conformed by Foster Wheeler USA Corporation and Process Consultants Inc.
In connection with the Prosecutor’s Office press release, on May 9, 2017, the Audit Committee of the Board of Directors retained a U.S.-based outside law firm to commence a third-party investigation into the matters set forth in the Prosecutor’s Office announcement.
Ecopetrol and Reficar have cooperated closely and extensively with the control entities in furthering their investigations and will continue to monitor the status and development of these investigations.
In March 2016 Reficar filed a Request for Arbitration before the International Chamber of Commerce against Chicago Bridge & Iron Company N.V., CB&I (UK) Limited, and CBI Colombiana S.A. with respect to the Engineering, Procurement, and Construction Contract entered into by and between Reficar and CB&I for the expansion of the Cartagena Refinery in Cartagena, Colombia. Reficar is the Claimant in the ICC arbitration proceeding and seeks no less than US$2 billion in damages plus lost profits from CB&I. On May 25, 2016, CB&I filed an answer and counterclaim of approximately USD $213 million. On June 27, 2016, Reficar filed its reply to CB&I’s counterclaim denying any liability to CB&I. On April 28, 2017, Reficar submitted its Non-Exhaustive Statement of Claim and CB&I submitted its Statement of Counterclaim. The ICC proceeding is currently in its preliminary stage and is scheduled for a hearing in October 2018. The outcome of these actions is unknown.
Bioenergy Special Audit
The Office of the General Comptroller, in exercise of its fiscal monitoring duties and authority as set forth in Article 267 of the Political Constitution and the law, has undertaken audits of the performance of the Bioenergy S.A and Bioenergy Zona Franca S.A.S. investments.
On February 6, 2017 the Office of the General Comptroller initiated a Special Intervention (Special Audit) of Bioenergy Zona Franca S.A.S. and Bioenergy S.A. The Company is cooperating with the oversight and control entities and has responded to the information requirements that have been requested to date.
| 6.1 | Shareholders’ General Assembly |
Our Shareholders’ General Assembly was held on March 26, 2015. In it,31, 2017 and the following matters were approved:
| · | The |
| · | Appointed Ernst & Young as external auditor of Ecopetrol for |
| · | The |
| 118 |
Non Independent Directors:
| Ø | Minister of Finance and Public Credit | |
| Ø | Ana Milena López Rocha |
Independent Directors:
| Ø | Mauricio Cabrera Galvis | |
| Ø | Yesid Reyes Alvarado | |
| Ø | Jaime Ardila Gómez | |
| Ø | Carlos Cure Cure | |
| Ø | Joaquín Moreno Uribe | |
| Ø | Horacio Ferreira Rueda (nominated by the hydrocarbon producing provinces) | |
| Ø | Carlos Gustavo Cano Sanz (nominated by the minority shareholders with the greatest share |
| Dividend Policy |
We do not haveIn 2016, the Board of Directors approved as a dividend policy. policy under which we are to distribute the distribution of 40% of net income before the effect of impairment of non-current assets (net of taxes) at the corporate group level. This policy cannot exceed the maximum amount to be distributed and should keep the Company’s debt metrics in line with an investment grade rating. The maximum amount to be distributed is the profits available to shareholders (net income after release and appropriation for legal, fiscal and occasional reserves).
Pursuant to Colombian law, dividend distribution to our shareholders must be approved by a 78% majority of the shares represented in the corresponding shareholders’ meeting. In the absence of this special majority, at least 50% of the net profits must be distributed. In 2012, 2013 and 2014 the shareholders approved the distribution of 79.9%, 79.9% and 80.1% of 2011, 2012 and 2013 net income, respectively.
On March 26, 2015,31, 2017, our shareholders at the ordinary general shareholders’ meeting approved an ordinary dividend of 70%40% of our net income before the impairment of non-current assets (net of taxes) for the fiscal year ended December 31, 2014.2016. Given that the fiscal year ended December 31, 2015 resulted in a net loss for Ecopetrol S.A., our shareholders at the Ordinary General Stockholder Meeting held on March 31, 2016, approved that there was no distribution of profits for the fiscal year ended December 31, 2015. Pursuant to Article 456 of the Code of Commerce the Company absorbed the net loss for the fiscal year ended December 31, 2015 through its legal reserve. In 2014 and 2015, the shareholders approved the distribution of 80.1% and 70% of 2013 and 2014 net income, respectively. See the sectionFinancial Review–Review—Liquidity and Capital Resources–Resources—Dividends.
Ecopetrol S.A. is required to have legal reserves equal to 50% of its subscribed capital. If the legal reserves are less than 50% of subscribed capital, we will contribute 10% of net income to our legal reserves every year until our legal reserves meet the required level. After giving effect to the capitalization of our reserves by $14.76 billion pesos at the 2015 shareholders meeting, our subscribed capital will be Ps$25,040 billion.
| Market and Market Prices |
In August 2007, we conducted an initial public offering of 10.1% of our common shares in Colombia. As a result of such offering, our common shares have tradedStarting on the Colombia Stock Exchange (Bolsa de Valores de Colombia) or BVC since November 2007 under the symbol “ECOPETROL.” Our ADSs, representing 20 common shares, have been traded on the NYSE under the symbol “EC” since September 2008. JPMorgan Chase Bank, N.A. serves as depositary for our ADSs.
Since August 2010, our ADSs have been tradedbegan trading on the Toronto Stock Exchange (“TSX”) under the symbol “ECP.” On February 17, 2016, we announced the application for voluntary delisting from the Toronto Stock Exchange after in an ordinary meeting held on January 27, 2016, during which the Board of Directors made the decision to delist from the TSX. This decision was based on the Board of Director’s assessment of, among other factors, the limited trading activity of our ADRs in Canada, a liquid market for our ADRs on the NYSE and for our ordinary shares on the local Colombian Stock Exchange (Bolsa de Valores de Colombia), both of which enable interested investors to acquire a participation in Ecopetrol S.A. The time and administrative efforts associated with maintaining the listing of the ADRs on the TSX were also taken into account. On March 2, 2016, Ecopetrol’s ADRs were delisted from the TSX. After delisting from the TSX, the ADRs have continued to trade on the NYSE and the ordinary shares have continued to trade in the Colombian stock market. Therefore, the Company continues to be subject to United States as well as Colombian reporting and corporate governance obligations.
| 119 |
The second round of the equity offering program took place between July 27 and August 17, 2011. The offer was directed exclusively to investors in Colombia as permitted by Law 1118 of 2006. A total of 644,185,868 shares were allotted, equivalent to approximately Ps$2.38 trillion. Out of the 219,054 investors participating in this round, 73% were new stockholders. In addition, 87% of the offering was allocated to retail investors and the remaining 13% to institutional investors. Funds obtained by us through this offering were allocated to the Company’s investment plan.
In the future, the Nation (via the Ministry of Finance and Public Credit), as our controlling shareholder, may make decisions or announcements about its intention to sell part of its holding of our capital stock, as it has announced in recent years. We understand that our cooperation is necessary for the successful coordination of the Nation’s process.
The following table sets forth reported high and low closing prices in Colombian Pesos for our shares and the reported average daily trading volume of our shares on the BVC for the periods indicated. The table also sets forth information on the trading price of our shares in Colombian Pesos and U.S. dollars, as well as the average trading volume.
| Shares Traded on the BVC | ||||||||||||||||||||
| Pesos per share | U.S. dollars per share(1) | Average number of shares traded | ||||||||||||||||||
| High | Low | High | Low | Per day | ||||||||||||||||
| 2010 | 4,660 | 2,370 | 2.5582 | 1.1958 | 8,764,023 | |||||||||||||||
| 2011 | 4,300 | 3,575 | 2.2823 | 1.9466 | 6,750,979 | |||||||||||||||
| 2012 | 5,850 | 4,200 | 3.3236 | 2.1619 | 8,396,801 | |||||||||||||||
| 2013 | 5,710 | 3,695 | 3.2091 | 1.8992 | 7,018,859 | |||||||||||||||
| 2014 | 4,030 | 1,815 | 2.0556 | 0.7546 | 8,222,596 | |||||||||||||||
| Most recent quarters | ||||||||||||||||||||
| First quarter 2013 | 5,710 | 4,895 | 3.2091 | 2.7050 | 6,608,557 | |||||||||||||||
| Second quarter 2013 | 5,020 | 3,850 | 2.7447 | 1.9815 | 9,265,648 | |||||||||||||||
| Third quarter 2013 | 4,495 | 3,875 | 2.3672 | 2.0181 | 6,141,186 | |||||||||||||||
| Fourth quarter 2013 | 4,590 | 3,695 | 2.4388 | 1.8992 | 6,081,654 | |||||||||||||||
| First quarter 2014 | 4,030 | 3,390 | 2.0506 | 1.6755 | 7,720,085 | |||||||||||||||
| Second quarter 2014 | 4,030 | 3,410 | 2.0556 | 1.7042 | 7,977,622 | |||||||||||||||
| Third quarter 2014 | 3,380 | 3,110 | 1.8092 | 1.4223 | 7,405,784 | |||||||||||||||
| Fourth quarter 2014 | 3,140 | 1,815 | 1.5529 | 0.7546 | 9,767,957 | |||||||||||||||
| First quarter 2015 | 2,305 | 1,800 | 0.9575 | 0.7016 | 12,356,758 | |||||||||||||||
| Most recent six months | ||||||||||||||||||||
| October 2014 | 3,140 | 2,750 | 1.5529 | 1.3411 | 8,759,299 | |||||||||||||||
| November 2014 | 2,750 | 2,290 | 1.3337 | 1,0577 | 10,975,313 | |||||||||||||||
| December 2014 | 2,285 | 1,815 | 1.0357 | 0,7546 | 9,726,740 | |||||||||||||||
| January 2015 | 2,080 | 1,815 | 0,8694 | 0,7586 | 10,121,171 | |||||||||||||||
| February 2015 | 2,305 | 2,070 | 0,9575 | 0,8392 | 14,028,575 | |||||||||||||||
| March 2015 | 2,005 | 1,800 | 0,8030 | 0,7016 | 13,072,511 | |||||||||||||||
| April 2015 (through 27) | 2,085 | 1,985 | 0,8431 | 0,7697 | 10,146,381 | |||||||||||||||
Table 55 – Shares Traded on the Bolsa de Valores de Colombia
| Shares Traded on the BVC | ||||||||||||||||||||
| Colombian Pesos per share | U.S. dollars per share(1) | Average number of shares traded | ||||||||||||||||||
| High | Low | High | Low | Per day | ||||||||||||||||
| 2012 | 5,850 | 4,200 | 3.3236 | 2.1619 | 8,396,801 | |||||||||||||||
| 2013 | 5,710 | 3,695 | 3.2091 | 1.8992 | 7,018,859 | |||||||||||||||
| 2014 | 4,030 | 1,815 | 2.0556 | 0.7546 | 8,222,596 | |||||||||||||||
| 2015 | 2,305 | 1,090 | 0.8402 | 0.3973 | 10,109,301 | |||||||||||||||
| 2016 | 1,465 | 881 | 0.4802 | 0.2888 | 13,077,105 | |||||||||||||||
| Most recent quarters | ||||||||||||||||||||
| First quarter 2015 | 2,305 | 1,800 | 0.9335 | 0.7289 | 12,054,021 | |||||||||||||||
| Second quarter 2015 | 2,085 | 1,625 | 0.8337 | 0.6497 | 10,056,874 | |||||||||||||||
| Third quarter 2015 | 1,675 | 1,285 | 0.5706 | 0.4377 | 9,516,211 | |||||||||||||||
| Fourth quarter 2015 | 1,515 | 1,090 | 0.4953 | 0.3563 | 8,805,595 | |||||||||||||||
| First quarter 2016 | 1,425 | 881 | 0.4386 | 0.2712 | 17,971,092 | |||||||||||||||
| Second quarter 2016 | 1,465 | 1,220 | 0.4892 | 0.4074 | 14,267,136 | |||||||||||||||
| Third quarter 2016 | 1,410 | 1,170 | 0.4786 | 0.3971 | 10,403,945 | |||||||||||||||
| Fourth quarter 2016 | 1,385 | 1,240 | 0.4593 | 0.4112 | 9,760,236 | |||||||||||||||
| First quarter 2017 | 1,415 | 1,290 | 0.4842 | 0.4414 | 10,004,466 | |||||||||||||||
| Most recent six months | ||||||||||||||||||||
| November 2016 | 1,330 | 1,240 | 0.4276 | 0.3987 | 10,179,339 | |||||||||||||||
| December 2016 | 1,385 | 1,305 | 0.4602 | 0.4336 | 8,629,345 | |||||||||||||||
| January 2017 | 1,415 | 1,360 | 0.4811 | 0.4624 | 8,948,342 | |||||||||||||||
| February 2017 | 1,395 | 1,310 | 0.4844 | 0.4549 | 11,907,449 | |||||||||||||||
| March 2017 | 1,350 | 1,290 | 0.4588 | 0.4384 | 9,282,601 | |||||||||||||||
| April 2017 | 1,400 | 1,340 | 0.4865 | 0.4656 | 13,581,125 | |||||||||||||||
| May 2017 (through May 26, 2017) | 1,480 | 1,335 | 0.5054 | 0.4559 | 18,112,368 | |||||||||||||||
| (1) | U.S. dollars per common share translated at the Representative Market Exchange Rate as of each period. |
The following table sets forth reported high and low closing prices in U.S. dollars for our ADSs and the average daily trading volume of our ADSs on the NYSE for the periods indicated. The table also sets forth information on the trading price of our ADSs in U.S. dollars, as well as the average trading volume.
| ADSs Traded on NYSE | ||||||||||||
| U.S. dollars per ADS(1) | Average number of adss Traded | |||||||||||
| High | Low | per day | ||||||||||
| 2010 | 51.92 | 23.60 | 163,749 | |||||||||
| 2011 | 46.00 | 38.47 | 357,289 | |||||||||
| 2012 | 67.48 | 44.52 | 551,410 | |||||||||
| 2013 | 63.80 | 37.93 | 464,193 | |||||||||
| 2014 | 41.16 | 14.77 | 603,083 | |||||||||
| Most recent quarters | ||||||||||||
| First quarter 2013 | 63.80 | 53.71 | 480,344 | |||||||||
| Second quarter 2013 | 54.70 | 39.87 | 621,213 | |||||||||
| Third quarter 2013 | 47.69 | 40.40 | 337,225 | |||||||||
| Fourth quarter 2013 | 48.91 | 37.93 | 420,859 | |||||||||
| First quarter 2014 | 40.79 | 33.20 | 624,531 | |||||||||
| Second quarter 2014 | 41.16 | 34.05 | 468,611 | |||||||||
| Third quarter 2014 | 36.39 | 28.60 | 425,034 | |||||||||
| Fourth quarter 2014 | 30.94 | 14.77 | 892,769 | |||||||||
| First quarter 2015 | 19.80 | 13.89 | 1,083,162 | |||||||||
| Most recent six months | ||||||||||||
| October 2014 | 30.94 | 26.80 | 743,780 | |||||||||
| November 2014 | 26.08 | 20.29 | 816,741 | |||||||||
| December 2014 | 20.11 | 14.77 | 1,107,871 | |||||||||
| January 2015 | 17.14 | 14.93 | 1,087,704 | |||||||||
| February 2015 | 19.80 | 16.71 | 948,535 | |||||||||
| March 2015 | 15.74 | 13.89 | 1,201,011 | |||||||||
| April 2015 (through 27) | 17.26 | 15.52 | 844,549 | |||||||||
Table 56 – Shares Traded on the New York Stock Exchange
| ADSs Traded on NYSE | ||||||||||||
U.S. dollars per ADS(1) | Average number of ADSs Traded per | |||||||||||
| High | Low | day | ||||||||||
| 2012 | 67.48 | 44.52 | 551,410 | |||||||||
| 2013 | 63.80 | 37.93 | 464,193 | |||||||||
| 2014 | 41.16 | 14.77 | 603,083 | |||||||||
| 2015 | 19.80 | 6.50 | 960,193 | |||||||||
| 2016 | 10.04 | 5.40 | 1,160,901 | |||||||||
| Most recent quarters | ||||||||||||
| First quarter 2015 | 19.80 | 13.89 | 1,083,162 | |||||||||
| Second quarter 2015 | 17.48 | 12.85 | 809,096 | |||||||||
| Third quarter 2015 | 12.72 | 8.28 | 915,918 | |||||||||
| Fourth quarter 2015 | 10.63 | 6.50 | 937,078 | |||||||||
| First quarter 2016 | 9.22 | 5.40 | 1,559,605 | |||||||||
| Second quarter 2016 | 10.04 | 7.89 | 1,257,883 | |||||||||
| Third quarter 2016 | 9.80 | 7.83 | 914,424 | |||||||||
| Fourth quarter 2016 | 9.37 | 7.85 | 926,722 | |||||||||
| First quarter 2017 | 9.67 | 8.60 | 986,373 | |||||||||
| Most recent six months | ||||||||||||
| November 2016 | 8.80 | 7.85 | 1,042,780 | |||||||||
| December 2016 | 9.25 | 8.58 | 866,147 | |||||||||
| January 2017 | 9.56 | 9.28 | 984,122 | |||||||||
| February 2017 | 9.67 | 9.01 | 1,118,084 | |||||||||
| March 2017 | 9.33 | 8.60 | 879,525 | |||||||||
| April 2017 | 9.72 | 9.06 | 1,210,834 | |||||||||
| May 2017 (through May 26, 2017) | 10.24 | 8.97 | 1,307,921 | |||||||||
| (1) |
TRADING ON THE COLOMBIA STOCK EXCHANGE
| 120 |
The BVC is the largest stock exchange in Colombia for trading securities and derivatives. The BVC is a member of the World Federation of Exchanges and theFederación Iberoamericana de Bolsas.
The BVC is the only exchange where our common shares trade in Colombia. The table below sets forth the reported aggregate market capitalization of the companies traded on the BVC, as of December 31, 2014.
| Aggregate Market Capitalization of the BVC | ||||||||
| Market Capitalization | Market Capitalization | |||||||
| (Ps$ in billions) | (US$ in billions)(1) | |||||||
| December 31, 2014 | 364,107 | 153,078 | ||||||
Registration and Transfer of Shares
Under Colombian law, transfers of shares must be registered on the issuer’s stock ledger. Only those holders registered on the stock ledger are considered by law as shareholders. Ecopetrol’s shares are in electronic form, other than those shares held by the Nation, which are in physical form.
Transfers of shares evidenced in electronic form required to be negotiated through the Colombia Stock Exchange. In Colombia, only the relevant stockbrokers calledsociedades comisionistas de bolsa are authorized to make the transfers of shares through the Colombia Stock Exchange. The transfers of shares are registered in the Centralized Security Deposit (Depósito Centralizado de Valores) or DECEVAL, through the relevant stockbrokers. DECEVAL records the share transfer on its systems, in order to make the corresponding registration in the issuer stock ledger.
Under Colombian legislation, if a transfer of shares for a value equivalent to or higher than 66,000 UVR (UVR= 215.0333(the UVR was COP$ 242.4513 as of December 31, 2014)2016) must be made through the BVC if the shares are registered with the BVC. Otherwise, shareholders can freely negotiate a transfer of shares.
Nevertheless, the following transfers are not required to be executed through the BVC:
| · | Transfers between shareholders who are considered to be the same beneficial owner; |
| · | Transfers of shares owned by financial institutions, under supervision of |
| · | Repurchases of shares by the issuer; |
| · | Property delivered in lieu of payment, or payment of money or other valuable property, different than the amount owed or demanded, in exchange for the extinguishment of the debt; |
| · | Transfers of shares made by the Nation or the Financial Institutions Warranty Fund (Fondo de Garantías de Instituciones Financieras) or FOGAFIN; |
| · | Transfers of shares issued abroad by Colombian companies, provided they take place outside Colombia; |
| · | Transfers of shares issued by foreign companies, offered through a public offer in Colombia, provided that they take place outside Colombia; and |
| · | Any other transaction specifically authorized by the |
| 121 |
For the purposes described above, multiple transfer transactions made within one hundred twenty (120) calendar days, between the same parties on shares of the same issuer and under similar conditions, are treated as a single transfer.
| Ecopetrol ADR |
Fees and Charges That a Holder of Our ADSs May Have to Pay, Either Directly or Indirectly
JPMorgan Chase Bank, N.A., our Depositary, may charge each person to whom ADSs are issued, including, without limitation, issuances against deposits of shares, issuances in respect of share distributions, rights and other distributions, issuances pursuant to a stock dividend or stock split declared by us or issuances pursuant to a merger, exchange of securities or any other transaction or event affecting the ADSs or deposited securities, and each person surrendering ADSs for withdrawal of deposited securities in any manner permitted by the deposit agreementDeposit Agreement or whose ADRs are cancelled or reduced for any other reason, US$5.00 for each 100 ADS (or any portion thereof) issued, delivered, reduced, cancelled or surrendered, as the case may be. The Depositary may sell (by public or private sale) sufficient securities and property received in respect of a share distribution, rights and/or other distribution prior to such deposit to pay such charge.
The Depositary collects its fees for issuance and cancellation of ADSs directly from investors depositing shares or surrendering ADSs for the purpose of withdrawal or from intermediaries acting for them. The Depositary collects fees for making distributions to investors by deducting those fees from the amounts distributed or by selling a portion of distributable property to pay the fees. The Depositary may collect its annual fee for Depositary services by deduction from cash distributions, or by directly billing investors, or by charging the book-entry system accounts of participants acting for them. The Depositary may generally refuse to provide services to any holder until the fees and expenses owing by such holder for those services or otherwise are paid.
The following additional charges may be incurred by ADS holders, by any party depositing or withdrawing shares or by any party surrendering ADSs or to whom ADSs are issued (including, without limitation, issuance pursuant to a stock dividend or stock split declared by us or an exchange of stock regarding the ADRs or the deposited securities or a distribution of ADSs), whichever is applicable:
| · | A fee of US$1.50 per ADR or ADRs for transfers of certificated or direct registration ADRs; |
| · | A fee of up to US$0.02 per ADS for any cash distribution made pursuant to the |
| · | A fee of US$0.05 per ADS per calendar year (or portion thereof) for services performed by the Depositary in administering our ADR program (which fee may be charged on a periodic basis during each calendar year and shall be assessed against holders of ADRs as of the record date or record dates set by the Depositary during each calendar year and shall be payable in the manner described in the next succeeding provision); |
| · | Any other charge payable by the Depositary, or any of the Depositary’s agents, including, without limitation, the custodian, or the agents of the Depositary’s agents in connection with the servicing of our shares or other deposited securities (which charge shall be assessed against registered holders of our ADRs as of the record date or dates set by the Depositary and shall be payable at the sole discretion of the Depositary by billing such registered holders or by deducting such charge from one or more cash dividends or other cash distributions); |
| · | A fee for the distribution of securities (or the sale of securities in connection with a distribution), such fee being in an amount equal to the fee for the execution and delivery of ADSs which would have been charged as a result of the deposit of such securities (treating all such securities as if they were shares) but which securities or the net cash proceeds from the sale thereof are instead distributed by the Depositary to those holders entitled thereto; |
| · | Stock transfer or other taxes and other governmental charges; |
| 122 |
| · | Cable, telex and facsimile transmission and delivery charges incurred at the ADS holder’s request; |
| · | Transfer or registration fees for the registration of transfer of deposited securities on any applicable register in connection with the deposit or withdrawal of deposited securities; |
| · | Expenses of the Depositary in connection with the conversion of foreign currency into U.S. dollars; and |
| · | Such fees and expenses as are incurred by the Depositary (including, without limitation, expenses incurred in connection with compliance with foreign exchange control regulations or any law or regulation relating to foreign investment) in delivery of deposited securities or otherwise in connection with the Depositary’s or its custodian’s compliance with applicable laws, rules or regulations. |
We will pay all other charges and expenses of the Depositary and any agent of the Depositary (except the custodian) pursuant to agreements from time to time between us and the Depositary. The fees described above may be amended from time to time.
Fees and Other Direct and Indirect Payments Made by the Depositary to Us
Our Depositary has agreed to reimburse us for certain expenses we incur that are related to establishment and maintenance of the ADR program, including investor relations expenses and exchange application and listing fees. In 2013, the Depositary did not make reimbursements to us. In 2014, reimbursements were made in the amount of approximately US$3,093,346 for expenses related to investor relations activities. In 2015, reimbursements were made in the amount of approximately US$2,069,202 for expenses related to investor relations activities. In 2016, reimbursements were made in the amount of approximately US$2,366,395 for expenses related to investor relations activities.
| Taxation |
| 6.5.1 | Colombian Tax Considerations |
The following is a general description of the Colombian tax considerations for investments in common shares in Colombia or for the purchase of ADSs, in a foreign securities market. This description is based on applicable law in effect as of the date of this annual report is issued, which may be subject to changes.
Prospective purchasers of common shares or ADSs should consult their own tax advisors for a detailed analysis of the tax consequences in Colombia, resulting from the acquisition, ownership and disposition of common shares or ADSs.
General Rules
Colombian entities and individuals who are deemed to be residents within the Colombian national territory for Colombian tax purposes are subject to Colombian income tax on their worldwide income. Foreign entities and individuals, as well as their permanent establishments in Colombia, who are not deemed to be residents in Colombia for tax purposes are subject to income tax in Colombia only with respect to their national-source income, which is generally defined as income obtained from (i) the rendering of services inside Colombian territory, (ii) the exploitation of tangible and intangible assets in Colombia, and (iii) the sale of tangible or intangible assets that are located inside Colombian territory at the time of title passage.the sale Double taxation treaties signed by Colombia, if applicable, may provide for special regulations regarding income tax.
Dividends paid by Colombian companies are deemed Colombian income. However, whether they are taxed or not depends on an imputation system set forth in articles 48 and 49 of the Colombian Tax Code (hereinafter “CTC”). According to this system, dividends are taxable when paid out of non-taxed profits, in which case a 35% withholding applies when paid to non-resident shareholders. Conversely, they are non-taxable when paid out of taxed profits.
| 123 |
One of the novelties introduced by law 1819 of December 29 of 2016 (the “Tax Reform”) was the creation of a new dividends tax that applies on all dividend distributions to Colombian individuals or to any type of non-resident shareholder, absent any specific treaty or exception. According to the Tax Reform, dividend payments made to foreign shareholders will be subject to a 5% withholding. This new tax will only apply to dividends paid from profits accrued as from fiscal year 2017.
Note that the dividend tax will apply simultaneously with the aforementioned imputation system. Accordingly, dividends paid from non-taxed profits will be subject to a 35% withholding for income tax, and an additional 5% dividend tax on the balance. This means that the overall burden in this scenario is 38.25% (e.g. $100 *35% = $35, plus $65 * 5% = $3.25).
Relief or reduced tax rates may apply under an applicable treaty to avoid double taxation, but the application of any such rules must be analyzed on a case-by-case basis.
For Colombian tax purposes, an individual is considered to be a Colombian resident when he/she meets any of the following criteria:
| He/she remains in Colombia continuously or discontinuously for more than 183 calendar days within any given 365-consecutive-day term; |
| He/she is related to the Colombian |
| He/she is a Colombian national and: |
| - | Has a spouse or permanent companion, or dependent children, who are tax residents in Colombia, or |
| - | 50% or more of his or her total income is Colombian source income, or |
| - | 50% or more of his or her assets are managed in Colombia, or |
| - | 50% or more of his or her assets are deemed to be located or possessed in Colombia, or |
| - | Has failed to provide proof of residency in another country (different from Colombia) upon previous official request by the Colombian tax office, or |
| - | He/she has a tax residency in a country considered by the Colombian |
Law 1739 of 2014 clarifies that Colombian nationals who meet any of the following requirements, will not be deemed as tax residents:
| - | If more than 50% of his or her annual income, has its source in the jurisdiction where he or she is domiciled and whose country of domicile is not Colombia. |
| - | If more than 50% of his/her assets are located in the jurisdiction where he or she is domiciled and whose country of domicile is not Colombia. |
For purposes of Colombian taxation, an entity is deemed to be a “national” or a “Colombian entity” and, therefore, subject to taxation in Colombia on its worldwide income, if it meets any of the following criteria:
| It has its place of effective management, in Colombia during the corresponding year or taxable period; |
| It has its main domicile in the Colombian territory; or |
| 124 |
| It has been incorporated in Colombia, in accordance with Colombian laws. |
Pursuant to the Colombian Tax Statute,Code, a foreign company or non-resident individual has a permanent establishment in Colombia when said company or individual performs activities in Colombia through: (1) a fixed place of business (i.e., branches, factories or offices), or (2) an individual who is not an independent agent empowered to execute agreements on behalf of the foreign company. PermanentAs noted above, permanent establishments are considered Colombian taxpayers in connection with the Colombian-source income and Colombian-source taxable gains attributed to said permanent establishment. A foreign company or entity will not be deemed to have a permanent establishment by the sole fact that it acts through a broker or any other independent agent. In addition, passive-income generating activities, such as dividends, royalties and interests, typically do not qualify as entrepreneurial and are not deemed to create permanent establishments.
Tax Treatment of a Non-Colombian Entity and a Non-Resident Individual of Colombia Who Purchases an ADS in a Foreign Securities Market
Dividends
As a general rule, dividends paid to foreign companies, foreign entities or non-resident individuals who are investing in ADSs which underlying assets are Colombian shares are treated as Colombian-source income and are thus subject to Colombian income tax.
To avoid double taxation, dividends paid by Colombian entities are not subject to income tax at the shareholder level when they are paid out of corporate profits that have been previously taxed at the corporate level. As of taxable year 2017, a withholding tax on dividends is triggered for dividends paid to non-resident shareholders. Withholding tax rates on dividends varies as follows: (i) 5% dividend tax for dividends distributed out of profits already taxed at the company´s level; (ii) 35% withholding tax rate for dividends distributed out of profits not taxed at the company´s level, plus an additional 5% dividend tax rate after having applied and deducted the initial 35% withholding. As of fiscal year 2017, for Colombian individuals, dividends will be taxed between 5% and 10% depending on the dividend amount. Profits that did not pay tax at the corporate level would be subject to a 35% withholding tax at the time of distribution. In this case, the base amount subject to the dividend tax would be the remaining amount after the 35% withholding tax. Dividends tax will be applicable to profits generated as of 2017. Finally, dividends paid to local corporations are not subject to this tax.
In light ofFurther to the above, the applicable withholding tax rate for an entity or a non-resident individual investing through a Foreign Funds Administration Account (FFAA) is 25%, since its investment qualifies as portfolio investments and the dividends that are distributed by the Colombian entity are not taxed at the corporate level (assuming that the dividends cannot be attributed to a permanent establishment in Colombia belonging to the shareholder). These foreign shareholders subject to this withholding tax are not required to file an income tax return in Colombia.
In addition to the above, the new dividend tax will apply at a 5% rate.
Taxation of Capital Gains Fromfrom the Sale of ADSs
Capital gains obtained from the sale of ADSs by non-Colombian entities, Colombian individuals who are non-residents in Colombia and foreign non-resident individuals, are not subject to income tax in Colombia as such sale does not generate Colombian-source income to the extent that the ADSs are not deemed to be possessedsourced in Colombia.
If the holder of the ADSs who is a non-resident entity, a Colombian individual who is not a resident in Colombia or a foreign non-resident individual, decides to surrender the ADSs and withdraw the underlying common shares, it is arguable that such transaction does not generate a capital gain subject to income tax in Colombia. However, different interpretations may be adopted by the Colombian Tax Authorities on this matter.
| 125 |
Tax Treatment in Colombia of a Non-Colombian Entity and a Non-Resident Individual of Colombia Who Purchases Ecopetrol’s Shares in Colombia’s Securities Market
Dividends
As a general rule, dividends paid to foreign companies, foreign entities, or to non-resident individuals in Colombia, who are investing in Colombian shares directly or through a FFAA, are treated as national-source income; thus, they are subject to Colombian income tax.
To avoid double taxation, dividends are not subject to income tax at the shareholder level when they are paid out of corporate profits that have been previously taxed at the corporate level. However, as of taxable year 2017, a withholding tax on dividends is triggered for dividends paid to non-resident shareholders. Withholding tax rates on dividends varies as follows: (i) 5% dividend tax for dividends distributed out of profits already taxed at the company´s level; (ii) 35% withholding tax rate for dividends distributed out of profits not taxed at the company´s level, plus an additional 5% dividend tax rate after having applied and deducted the initial 35% withholding. As of fiscal year 2017, for Colombian individuals, dividends will be taxed between 5% and 10% depending on the dividend amount. Profits that did not pay tax at the corporate level would be subject to a 35% withholding tax at the time of distribution. In this case, the base amount subject to the dividend tax would be the remaining amount after the 35% withholding tax. Dividends tax will be applicable to profits generated as of 2017. Finally, dividends paid to local corporations are not subject to this tax.
IfFor fiscal year 2017 if the shareholder is a non-resident entity or a non-resident individual investing directly, it will be taxed upon distribution, by means of the withholding tax mechanism, provided that its investment does not qualify as portfolio investments and dividends that are distributed are not taxed at the corporate level. In this case, dividends will likely be subject to income taxa 35% withholding at a rate of 39% (FY 2015), 40% (FY 2016), 42% (FY 2017) and 43% (FY2018) upon distribution.
There is a line of interpretation according to which a fixed withholding rate of 33% should be applicable. Further regulations clarifying this point may be issued by the relevant authorities. Foreign shareholders subject to this withholding tax are not required to file an income tax return in Colombia.tax.
Non-resident entities or non-resident individuals will be taxed upon distribution by means of the withholding tax mechanism, provided that their investments qualify as portfolio investments (i.e., investing through a FFAAFFAA) and dividends that are distributed by the Colombian entity are not taxed at the corporate level. In this case, pursuant to Article 18-1 of the Colombian Tax Code, the applicable withholding tax rate is 25%, assuming that the dividends cannot be attributed to a permanent establishment in Colombia belonging to the shareholder).shareholder. These foreign shareholders subject to this withholding tax are not required to file an income tax return in Colombia.
In addition to the above, the new dividend tax will apply at a 5% rate.
Taxation of Capital Gains for the Sale of Shares
CapitalPursuant to Article 36-1 of the Colombian Tax Code, capital gains derived from the sale of shares listed on the BVC and owned by the same beneficial owner, are deemed as non-taxable income in Colombia, provided that the shares sold during the same taxable year do not represent more than 10% of the outstanding shares of the listed company. Pursuant to Article 18 of Decree 2634 of 2012, sellers of shares are not required to file an income tax return for the transfer of securities that are listed in the National Registry of Securities and Issuers (Registro Nacional de Valores y Emisores or RNVE)) as long as the foreign investment is treated as a portfolio investment according to article 3 of Decree 2080 of 2000.
If the above-mentioned requirements are not met, the capital gain obtained in the sale of shares is subject to income tax or capital gains tax, under the following rules:
| · | The gain or loss arising therefrom will be |
| · | The applicable tax rate and the withholding tax rate have to be determined on a case-by-case basis. Generally, if the shares have been owned for at least two years, the profits from the sale will qualify as capital gains taxable at 10%, otherwise, profits will qualify as ordinary income taxable at approximately 40% in fiscal year 2017, approximately 37% for fiscal year 2018, and 33% as from fiscal year 2019. |
| 126 |
Tax Treatment of Non-Residents Who Purchase Ecopetrol’s Shares in the BVC Market and Exchange Them for ADSs
Dividends
Payment of dividends by Colombian entities to foreign companies, foreign entities or to non-resident individuals who are investing in ADSs which underlying assets are Colombian shares or in Colombian shares directly are subject to the tax treatment described above.
Taxation on Capital Gains for the Sale of Shares
If the holder of the Colombian shares is a non-resident entity, a Colombian individual who is not a resident in Colombia or a foreign non-resident individual, and such holder decides to exchange such common shares for ADSs, it is arguable that such transaction should not generate a capital gain subject to income tax in Colombia. However, different interpretations may be adopted by the Colombian tax authorities on this matter. For instance, assuming that the exchange of securities is treated as a sale of Ecopetrol’s shares, the seller would be subject to the tax treatment described above in connection with the taxation of capital gains for the sale of shares. Absent any specific rules or regulations addressing this specific situation, a case-by-case analysis would be necessary.
| 6.5.2 | U.S. Federal Income Tax Consequences |
This summary describes the principal U.S. federal income tax consequences of the ownership and disposition of common shares or ADSs, but it does not purport to be a comprehensive description of all of the U.S. tax consequences that may be relevant to a decision to hold or dispose of common shares or ADSs. This summary applies only to purchasers of common shares or ADSs who will hold the common shares or ADSs as capital assets for U.S. federal income tax purposes and does not apply to special classes of holders such as dealers in securities or currencies, holders whose functional currency is not the U.S. dollar, holders of ten percent or more of our shares (taking into account shares held directly or through depositary arrangements), tax-exempt organizations, financial institutions, holders liable for the alternative minimum tax, securities traders who elect to account for their investment in common shares or ADSs on a mark-to-market basis, partnerships or other pass-through entities and investors therein, insurance companies, U.S. expatriates, persons that purchase or sell common shares or ADSs as part of a wash sale for tax purposes, and persons holding common shares or ADSs in a hedging transaction or as part of a straddle, conversion or other integrated transaction for U.S. federal income tax purposes. The statements regarding U.S. tax law set forth in this summary is based on the Internal Revenue Code of 1986, as amended, which we call the “Code,” its legislative history, existing and proposed U.S. Treasury regulations, published rulings and court decisions all as in force on the date of this annual report, and changes to such law subsequent to the date of this annual report may affect the tax consequences described herein (possibly with retroactive effect). This summary is also based in part on the representations of the Depositary and the assumption that each obligation in the deposit agreementDeposit Agreement and any related agreement will be performed in accordance with its terms.
Each holder is encouraged to consult such holder’s tax advisor concerning the overall tax consequences to it, including the consequences under laws other than U.S. federal income tax laws, of an investment in common shares or ADSs.
In this discussion, references to a “U.S. Holder” are to a beneficial holderowner of a common share or an ADS that is for U.S. federal income tax purposes (1) aan individual citizen or resident of the United States, (2) a corporation, or any other entity taxable as a corporation, organized under the laws of the United States, any state thereof or the District of Columbia, (3) an estate whose income is subject to United StatesU.S. federal income tax regardless of its source, or (4) a trust if (i) a United States court can exercise primary supervision over the trust'strust’s administration and one or more United States persons are authorized to control all substantial decisions of the trust.trust or (ii) it has in effect a valid election under applicable U.S. Treasury regulations to be treated as a U.S. person.
| 127 |
For United StatesU.S. federal income tax purposes, holders of ADSs will generally be treated as owners of the common shares represented by such ADSs.
This discussion addresses only United Statesdoes not address any aspect of U.S. federal taxation other than U.S. federal income taxation.taxation (such as the estate and gift tax or the Medicare tax on net investment income). Holders of common shares or ADSs should consult their own tax advisor regarding the United StatesU.S. federal, state and local and other tax consequences of owning and disposing of common shares and ADSs in their particular circumstances.
Distributions on Common Shares or ADSs
A distribution to U.S. Holders made by us of cash or property with respect to common shares or ADSs generally will be treated as a dividend for U.S. federal income tax purposes to the extent paid out of our current or accumulated earnings and profits (as determined under U.S. federal income tax principles). Distributions in excess of our current or accumulated earnings and profits, as determined for United StatesU.S. federal income tax purposes, will be treated first as a tax-free return of capital reducing such U.S. Holder’s adjusted tax basis in the common shares or ADSs. Any distribution in excess of such adjusted tax basis will be treated as capital gain and will be either long-term or short-term capital gain depending upon whether the U.S. Holder held the common shares or ADSs for more than one year. Distributions of additional common shares or ADSs to U.S. Holders that are part of a pro rata distribution to all of our shareholders generally will not be subject to U.S. federal income tax. We do not maintain calculations of our earnings and profits under U.S. federal income tax principles, and, therefore, except as described in the previous sentence, U.S. Holders should expect that any distributions generally will be reported as dividends for U.S. federal income tax purposes. As used below, the term “dividend” means a distribution that constitutes a dividend for U.S. federal income tax purposes.
The amount of any distribution will include the amount of any Colombian tax withheld on the amount distributed, and the amount of a distribution paid in Colombian Pesos will be measured by reference to the exchange rate for converting Colombian Pesos into U.S. dollars in effect on the date the distribution is received by the Depositary (or by a U.S. Holder in the case of a holder of common shares) regardless of whether the payment is in fact converted into U.S. dollars. If the Depositary (or U.S. Holder in the case of a holder of common shares) does not convert such Colombian Pesos into U.S. dollars on the date it receives them, generally, any gain or loss resulting from currency exchange fluctuations during the period from the date the dividend payment is included in income to the date the payment is converted into U.S. dollars will be treated as ordinary income or loss and will not be eligible for the special tax rate applicable to qualified dividend income (as discussed below). The gain or loss generally will be income or loss from sources within the United States for foreign tax credit limitation purposes. Dividends paid by us will not be eligible for the dividends received deduction allowed to corporations under the Code.
If you are a noncorporatenon-corporate U.S. Holder, dividends that constitute qualified dividend income will be taxable to you at the preferential rates applicable to long-term capital gains provided that you meet certain holding requirements. Dividends paid on the ADSs will be treated as qualified dividend income if (1) the ADSs are readily tradable on an established securities market in the United States and (2) we were not, in the year prior to the year in which the dividend was paid, and are not, in the year in which the dividend is paid, a passive foreign investment company (PFIC). The ADSs are listed on the New York Stock Exchange, and will qualify as readily tradable on an established securities market in the United States so long as they are so listed. Based on our audited financial statements and relevant market and shareholder data, we believe that we were not treated as a PFIC for U.S. federal income tax purposes with respect to our 20132016 taxable year. In addition, based on our audited financial statements and our current expectations regarding the value and nature of our assets, the sources and nature of our income, and relevant market and shareholder data, we do not anticipate becoming a PFIC for the 20142017 taxable year. However, this conclusion is a factual determination that is made annually and thus may be subject to change. Based on existing guidance, it is not clear whether dividends received with respect to the common shares will be treated as qualified dividends. In addition, the U.S. Treasury has announced its intention to promulgate rules pursuant to which holders of ADSs or common shares and intermediaries through whom such securities are held will be permitted to rely on certifications from issuers to treat dividends as qualified for tax reporting purposes. Because such procedures have not yet been issued, it is not clear whether we will be able to comply with them. Holders of ADSs and common shares should consult their own tax advisers regarding the availability of the reduced dividend tax rate in the light of the considerations discussed above and their own particular circumstances.
| 128 |
A U.S. Holder will be entitled, subject to a number of complex limitations and conditions, to claim a U.S. foreign tax credit in respect of any Colombian income taxes withheld on dividends received on common shares or ADSs. U.S. Holders who do not elect to claim a credit for any foreign income taxes paid during the taxable year may instead claim a deduction in respect of such Colombian income taxes provided the U.S. Holder elects to deduct (rather than credit) all foreign income taxes for that year. Dividends received with respect to the common shares or ADSs will be treated as foreign source income, subject to various classifications and other limitations. For the purposes of the U.S. foreign tax credit limitations, the dividends paid with respect to our common shares or ADSs will generally constitute either “passive” or “general” income.“passive category income” for most U.S. Holders. The rules relating to computing foreign tax credits or deducting foreign income taxes are extremely complex, and U.S. Holders are urged to consult their own independent tax advisers regarding the availability of foreign tax credits with respect to any Colombian income taxes withheld.
Sale, Exchange or Other Taxable Dispositions of Common Shares or ADSs
A U.S. Holder generally will recognize capital gain or loss upon the sale, exchange or other taxable disposition of common shares or ADSs in an amount equal to the difference between the U.S. dollar value of the amount realized on the sale, exchange or other taxable disposition of the common shares or ADSs and the U.S. Holder’s adjusted tax basis, determined in U.S. dollars, in the common shares or ADSs. Any gain or loss will be long-term capital gain or loss if the common shares or ADSs have been held for more than one year. Certain non-corporate U.S. Holders (including individuals) may be eligible for preferential rates of U.S. federal income tax in respect of long-term capital gains. The deductibility of capital losses is subject to limitations under the Code.
If you are a U.S. Holder of common shares or ADSs, the initial tax basis of your common shares or ADSs will be the U.S. dollar value of the Colombian Peso-denominated purchase price determined on the date of purchase. If the common shares or ADSs are treated as traded on an “established securities market,” a cash basis U.S. Holder, or, if it elects, an accrual basis U.S. Holder, will determine the dollar value of the cost of such common shares or ADSs by translating the amount paid at the spot rate of exchange on the settlement date of the purchase. Such an election by an accrual basis U.S. Holder must be applied consistently from year to year and cannot be revoked without the consent of the Internal Revenue Service (“IRS”). If you convert U.S. dollars to Colombian Pesos and immediately use that currency to purchase common shares or ADSs, such conversion generally will not result in taxable gain or loss to you.
With respect to the sale or exchange of common shares or ADSs, the amount realized generally will be the U.S. dollar value of the payment received determined on (1) the date of receipt of payment in the case of a cash basis U.S. Holder and (2) the date of disposition in the case of an accrual basis U.S. Holder. If the common shares or ADSs are treated as traded on an “established securities market,” a cash basis taxpayer, or, if it elects, an accrual basis taxpayer, will determine the U.S. dollar value of the amount realized by translating the amount received at the spot rate of exchange on the settlement date of the sale.
Deposits and withdrawals of common shares in exchange for ADSs, and ADSs for common shares generally will not result in the realization of gain or loss for U.S. federal income tax purposes.
Backup Withholding and Information Reporting
In general, dividends on common shares or ADSs, and payments of the proceeds of a sale, exchange or other taxable disposition of common shares or ADSs, paid within the United States, by a U.S. payor through certain U.S.-related financial intermediaries to a U.S. Holder are subject to information reporting and may be subject to backup withholding at a current rate of 28% unless the holder (1) establishes that it is a corporation or other exempt recipient or (2) with respect to backup withholding, provides an accurate taxpayer identification number and certifies that it is a U.S. person and that no loss of exemption from backup withholding has occurred.
| 129 |
Backup withholding is not an additional tax. The amount of any backup withholding tax from a payment to a U.S. Holder will be allowed as a credit against the U.S. Holder’s U.S. federal income tax liability, provided that the required information is timely furnished to the Internal Revenue Service (the “IRS”).IRS. A U.S. Holder generally may obtain a refund of any amounts withheld under the backup withholding rules that exceed its U.S. federal income tax liability by timely filing a refund claim with the IRS.
U.S. Tax Considerations for Non-U.S. Holders
A holder or beneficial owner of common shares or ADSs that is not a U.S. Holder for U.S. federal income tax purposes (a “non-U.S. Holder”) generally will not be subject to U.S. federal income or withholding tax on dividends received on common shares or ADSs, unless the dividends are “effectively connected” with the non-U.S. Holder’s conduct of a trade or business within the United States. In such a case a non-U.S. Holder generally will be taxed in the same manner as a U.S. Holder. In the case of “effectively connected” dividends received by a corporate non-U.S. Holder, the corporate non-U.S. Holder may, under certain circumstances, be subject to an additional “branch profits tax” at a 30% rate.
A non-U.S. Holder of common shares or ADSs will not be subject to U.S. federal income or withholding tax on gain realized on the sale of common shares or ADSs, unless (i) the gain is “effectively connected” with the non-U.S. Holder’s conduct of a trade or business in the United States, or (ii) in the case of gain realized by an individual non-U.S. Holder, the non-U.S. Holder is present in the United States for 183 days or more in the taxable year of the sale and certain other conditions are met. In the case of “effectively connected” gains realized by a corporate non-U.S. Holder, the corporate non-U.S. Holder may, under certain circumstances, be subject to an additional “branch profits tax” at a 30% rate.
Although non-U.S. Holders generally are exempt from backup withholding and information reporting requirements, a non-U.S. Holder may be required to comply with certification and identification procedures in order to establish its exemption from information reporting and backup withholding.
| Exchange Controls and Limitations |
Payments in foreign currency with respect to certain foreign exchange transactions including international investments between Colombian residents and non-Colombian residents must by law be conducted through the commercialforeign exchange market. Therefore, any foreign currency income or expensesexpense under the ADRs must be channeledcompleted through thatthe appropriate channels of the foreign exchange market. Transactions conducted through the commercialforeign exchange market are made at market rates freely negotiated with authorized foreign exchange intermediaries (banks,(local banks, financial corporations, administrators and others). As of September 25, 1999 the Colombian foreign exchange regime is structured under the system of free flotation of the exchange rate whereby market forces determine the level of exchange rate from time to time.
Foreign portfolio investments must be made through authorized foreign exchange investment management companies. Only brokerage firms, trust companies and investment management companies, subject to the inspection and supervision of the SuperintendencySuperintendence of Finance, are allowed to make investments in the local Colombian market on behalf of foreign investors. Such brokerage firms, trust companies and investment management companies also act as the foreign investors’ local representatives for tax and foreign exchange purposes.
Colombian law provides that the Colombian Central Bank may intervene in the foreign exchange market at its own discretion at any time. Likewise,time (i.e. it may limit the remittance of dividends whenever the international reserves fall below an amount equal to three months of imports). Additionally, from time to time, the Colombian government introduces amendments to the International Investment Statute. The Colombian Central Bank may also limit the remittance of dividends and/or investments of foreign currency received by Colombian residents whenever the international reserves fall below an amount equal to three months of imports. WeHence, we cannot assure you that the Colombian Central Bank will not intervene in the future. However, sincefuture imposing restrictions to the establishment of the current foreign exchange regimefree convertibility system currently applicable in 1991, the Colombian Central Bank has never taken such action except for a brief restriction by the national government in 2004.Colombia. See the sectionRisk Review–Review—Risk Factors–Factors—Risks RelatingRelated to Colombia’s Political and Regional Environment.
| 130 |
Registration of Foreign Investment Represented in Underlying Shares
Colombia’s International Investment Statute and the regulations issued by the Colombian Central Bank, which have been amended from time to time through related decrees and regulations, regulategovern the manner in which non-Colombian resident entities and individuals can invest in Colombia and participate in the Colombian securities markets. Among other requirements, the statuteInternational Investment Statute and Colombian Central Bank regulations mandate registration of foreign investment transactions with the Colombian Central Bank and specify procedures to authorize and administer such foreign investment transactions. Additionally, pertinent information related to foreign investment transactions must be updated on a regular basis (yearly or monthly, depending on the type of information).
Under these foreign investmentthe International Investment Statute and Colombian Central Bank regulations, the failure of a foreign investor to report or register with the Colombian Central Bank foreign exchange transactions relating to investments in Colombia on a timely basis may (i) prevent the investor from obtaining remittance rights, (ii) constitute an exchange control infraction, and (iii) result in a fine.financial sanctions.
ForeignNotwithstanding the regulations described above, foreign investors who acquire ADRs are not required to directly register this investment with Colombian authorities. Holders of ADRs will benefit from the registration to be obtained by the local custodian for our common shares underlying the ADRs in Colombia. Such registration allows the custodian to convert dividends and other distributions with respect to the common shares into foreign currency and remit the proceeds abroad. If investors in ADRs choose to surrender their ADRs and withdraw common shares, they must retain an administrator, who will act as a local representative for the investments, and register their investments in common shares as a portfolio investment through theirsaid local representative. The local representative is the brokerage firm, trust company or investment management company that acts on behalf of the holders of the ADRs in Colombia, and the request for registration is made by them.
Colombian residents who acquire ADRs and either receive profits from this investment, surrender their ADRs or liquidate their investment in ADRs must register these operations with the Colombian authorities and comply with applicable regulations through its Colombian brokerage firm.
In obtaining its own foreign investment registration, an investor who surrenders its ADRs and sells common shares may incur expenses and/or suffer delays in the application process. Investors would only be allowed to transfer dividends abroad or transfer funds received as distributions relating to our common shares after their foreign investment registration procedure with the Colombian Central Bank has been completed. In addition, the depositary’s foreign investment registration may also be adversely affected by future legislative changes, but its rights to transfer dividends abroad or profits arising from distributions relating to our common shares must be maintained according to Colombian law and foreign investment treaties entered into by Colombia in force at the time of the registration of the investment, except when Colombia’s international reserves fall below an amount equivalent to three months’ worth of imports. Prospective purchasers of common shares or ADSs should consult their own foreign exchange advisors.
| Exchange Rates |
On April 28, 2015,May 26, 2017, the Representative Market Exchange Rate was Ps$2,419.81COP$2,911.66 per US$1.00. The Federal Reserve Bank of New York does not report a noon-buying rate for Colombian Pesos. TheSuperintendencia Financiera, or SuperintendencySuperintendence of Finance, calculates the Representative Market Exchange Rate based on the weighted averages of the buy and sell foreign exchange rates quoted daily by foreign exchange rate market intermediaries including financial institutions for the purchase and sale of U.S. dollars. The SuperintendencySuperintendence of Finance also calculates the Representative Market Exchange Rate for each month for purposes of preparing financial statements and converting amounts in foreign currency to Colombian Pesos.
| 131 |
The following table sets forth the high, low, average and period-end exchange rate for Colombian Peso/U.S. dollar Representative Market Exchange Rate for each of the last five years and for the last six months.
| Exchange Rates | ||||||||||||||||
| High | Low | Average | Period-End | |||||||||||||
| 2010 | 2,044.23 | 1,786.20 | 1,897.89 | 1,913.98 | ||||||||||||
| 2011 | 1,972.76 | 1,748.41 | 1,848.17 | 1,942.70 | ||||||||||||
| 2012 | 1,942.70 | 1,754.89 | 1,798.23 | 1,768.23 | ||||||||||||
| 2013 | 1,952.11 | 1,758.45 | 1,868.90 | 1,926.83 | ||||||||||||
| 2014 | 2,446.35 | 1,846.12 | 2,000.68 | 2,392.46 | ||||||||||||
| October | 2,074.40 | 2,021.49 | 2,047.03 | 2,050.52 | ||||||||||||
| November | 2,206.35 | 2,061.92 | 2,127.25 | 2,206.19 | ||||||||||||
| December | 2,446.35 | 2,206.19 | 2,344.23 | 2,392.46 | ||||||||||||
| 2015: | ||||||||||||||||
| January | 2,452.11 | 2,361.54 | 2,397.69 | 2,441.10 | ||||||||||||
| February | 2,500.59 | 2,371.31 | 2,420,38 | 2,496.99 | ||||||||||||
| March | 2,677.97 | 2,486.99 | 2,586.58 | 2,576.05 | ||||||||||||
| April (through April 28) | 2,598.36 | 2,419.81 | 2,506.99 | 2,419.81 | ||||||||||||
Table 57 – Colombian Peso/U.S. dollar Representative Market Exchange Rate
| Exchange Rates | ||||||||||||||||
| High | Low | Average | Period-End | |||||||||||||
| 2012 | 1,942.70 | 1,754.89 | 1,798.23 | 1,768.23 | ||||||||||||
| 2013 | 1,952.11 | 1,758.45 | 1,868.90 | 1,926.83 | ||||||||||||
| 2014 | 2,446.35 | 1,846.12 | 2,000.68 | 2,392.46 | ||||||||||||
| 2015 | 3,356.00 | 2,360.58 | 2,746.47 | 3,149.47 | ||||||||||||
| 2016 | 3,434.89 | 2,833.78 | 3,053.42 | 3,000.71 | ||||||||||||
| Most recent six months | ||||||||||||||||
| November 2016 | 3,187.97 | 2,984.78 | 3,106.40 | 3,165.09 | ||||||||||||
| December 2016 | 3,085.60 | 2,964.56 | 3,009.53 | 3,000.71 | ||||||||||||
| January 2017 | 3,000.71 | 2,908.53 | 2,944.65 | 2,936.66 | ||||||||||||
| February 2017 | 2,921.90 | 2,851.98 | 2,881.68 | 2,896.27 | ||||||||||||
| March 2017 | 3,004.43 | 2,880.24 | 2,943.49 | 2,880.24 | ||||||||||||
| April 2017 | 2,944.31 | 2,837.90 | 2,872.82 | 2,944.31 | ||||||||||||
| May 2017 (through May 26, 2017) | 2,967.44 | 2,873.22 | 2,929.30 | 2,911.66 | ||||||||||||
Source: SuperintendencySuperintendence of Finance for historical data.Banco de la República, or the Colombian Central Bank, for averages.
| Major Shareholders |
Major Shareholders
The following table sets forth the names of our major shareholders, and the number of shares and the percentage of outstanding shares owned by them at March 31, 2015:2017:
| At March 31, 2015 | ||||||||
| Shareholders | Number of shares | % Ownership | ||||||
| Nation(1) – Ministry of Finance and Public Credit | 36,384,788,817 | 88.49 | ||||||
| Public float | 4,731,909,639 | 11.51 | ||||||
| Total | 41,116,698,456 | 100 | ||||||
Table 58 – Major Shareholders
| At March 31, 2017 | ||||||||
| Shareholders | Number of shares | % Ownership | ||||||
| Nation(1) – Ministry of Finance and Public Credit | 36,384,788,817 | 88.49 | ||||||
| Public float | 4,731,905,873 | 11.51 | ||||||
| Total | 41,116,694,690 | 100.00 | ||||||
| (1) | Includes 2,000 shares owned by other state entities. |
All our common shares have identical voting rights.
As of March 31, 2015, 1.47%2017, 1.8% of our common shares were held of record in the form of American Depository Shares. As of March 31, 2015,2017, we had 3541 registered holders and as of February 23, 20152017 we had 15,24211,970 beneficiaries of common shares, or ADSs representing common shares, in the United States.
Changes in the Capital of the Company
There are no conditions in our bylaws governing changes in our capital stock that are more stringent than those required under Colombian law, with the exception that the Nation must hold a minimum of 80% of our capital stock at all times.
| Enforcement of Civil Liabilities |
We are a Colombian company. AllMost of our Directors and executive officers and some of the experts named in this annual report reside outside the United States. All or a substantial portion of our assets and the assets of these persons are located outside of the United States. As a result, it may not be possible for you to effectaffect service of process within the United States upon us or these persons who are residents in Colombia or to enforce against us or them judgmentsthese persons who are residents in Colombiajudgments in U.S. courts obtained in such courts predicated upon the civil liability provisions of the U.S. federal securities laws. Colombian courts will enforce a U.S. judgment predicated on the U.S. securities laws through a procedural system known under Colombian Law as exequatur.“exequatur.” The Colombian Supreme Court will enforce a foreign judgment, without reconsideration of the merits only if the judgment satisfies the requirements set forth in Articles 693 through 695 of the Colombian Civil Procedure Code (Código de Procedimiento Civil) which will be abrogated by Articles 605 through 607 of Law 1564 of 2012 (Código General del Proceso) subject to the entrywhich entered into force on January 1, 2016, pursuant toAcuerdoNo. PSAA15-10392, of Law 1564 of 2012 in the terms of Article 627, paragraph 6 thereof and as determinedOctober 1, 2015, issued by the Colombian Superior Council of the Judiciary (Consejo Superior de la Judicatura),as follows:
| 132 |
| · | A treaty exists between Colombia and the country where the judgment was granted relating to the recognition and enforcement of foreign judgments or, in the absence of such treaty, there is reciprocity in the recognition of foreign judgments between the courts of the relevant jurisdiction and the courts of Colombia; |
| · | The foreign judgment does not relate to “in rem rights” vested in assets that were located in Colombia at the time the suit was filed; |
| · | The foreign judgment does not contravene or conflict with Colombian laws relating to public order other than those governing judicial procedures; |
| · | The foreign judgment, in accordance with the laws of the country where it was rendered, is final and is not subject to appeal; |
| · | A duly |
| · | The foreign judgment does not refer to any matter upon which Colombian courts have exclusive jurisdiction; |
| · | No proceeding is pending in Colombia with respect to the same cause of action, and no final judgment has been awarded in any proceeding in Colombia on the same subject matter and between the same parties; |
| · | In the proceeding commenced in the foreign court that issued the judgment, the defendant is served in accordance with the laws of such jurisdiction and in a manner reasonably designated to give the defendant an opportunity to defend against the action; and |
| · | The legal requirements pertaining to the exequatur proceedings have been observed; |
The United States and Colombia do not have a bilateral treaty providing for automatic reciprocal recognition and enforcement of judgments in civil and commercial matters. The Colombian Supreme Court has in the past accepted that reciprocity exists when it has been proven that either a U.S. court has enforced a Colombian judgment or that a U.S. court would enforce a foreign judgment, including a judgment issued by a Colombian court. However, such enforceability decisions are considered by Colombian courts on a case-by-case basis.
Proceedings for enforcement of a money judgment by attachment or execution against any assets or property located in Colombia are within the exclusive jurisdiction of Colombian courts and such proceedings are conducted in Spanish. All parties affected by a foreign judgment in exequatur proceedings must be summoned to the exequatur proceedings in accordance with the rules that apply to the Colombian courts. In the course of such proceedings, both the plaintiff and the defendant are afforded the opportunity to request that evidence be collected in connection with the requirements listed above. In addition, before the judgment is rendered, each party may file final allegations in support of such party’s position regarding the above-mentioned requirements.
Assuming that a foreign judgment complies with the standards set forth in the preceding paragraphs and the absence of any condition referred to above that would render a foreign judgment not subject to recognition under Colombian law, such foreign judgment would be enforceable in Colombia in an enforcement proceeding under the laws of Colombia, provided that the Colombian Supreme Court has previously granted exequatur upon the foreign judgment.
| 133 |
| 7. | Corporate Governance |
Since 2004, Ecopetrol S.A. has voluntarily adopted transparency, governance and control practices to facilitate corporate governance in order to generate confidence among stakeholders and ensure the sustainability of its business.
The corporate governance practices at Ecopetrol S.A.:
| · | Promote and guarantee all stakeholders transparency, objectivity and competiveness. |
| · | Add value to the company and attract investors. |
| · | Protect shareholders, investors and stakeholders rights. |
| · | Encourage financial markets confidence. |
| · | Accomplish the highest corporate governance standards. |
Statement of the Nation as Majority Shareholder
Ecopetrol’s majority shareholder (the Nation, represented by the Ministry of Finance)Finance and Public Credit), is unilaterally committed to protect the interests of the minority shareholders in the following topics:
| · | Composition of Board of Directors: including in its list of candidates a Representative for hydrocarbon producing departments operated by Ecopetrol and a Representative for the minority shareholders, who will be chosen by the 10 shareholders with the largest stock participations. |
According to corporate governance practices recommended by the OECD, organization to which Colombia is in the process of access, the National Government begun to implement the practice of reducing the participation of Directors with a ministerial level in Ecopetrol’s Board of Directors. Thus, in 2017 in the ordinary Shareholders’ Assembly, the National Government nominated only one (1) non-independent Director with a ministerial level and in 2018 no director of ministerial rank will be nominated.
| · | Dividend policy: guaranteeing the right of each shareholder to receive his pro rata dividends in accordance with Colombian law. |
| · | Issues not included in the agenda of extraordinary meetings of the Shareholders Assembly: permitting a vote on those initiatives submitted by one or more shareholders representing at least 2% of the subscribed shares of the company. |
| · | Asset disposal: ensuring that any asset disposal of an amount equal or higher than 15% of the stock exchange capitalization of Ecopetrol is discussed and decided by the Shareholders’ General Assembly and that the Nation will only vote affirmatively if the vote of minority shareholders is equal to or exceeds 2% of the shares subscribed by shareholders other than the Nation. |
| Bylaws |
The Bylaws of Ecopetrol S.A. are contained in Public Deed No. 5314 of December 14, 2007, issued by the Second Notary of Bogotá; amended by Public Deed No. 560 of May 23, 2011, issued by the Notary Forty- Six of Bogotá, and the Deed No. 666 of May 7, 2013, issued by the Notary Sixty-Five of Bogotá, and Deed No. 1049 of May 19, 2015, issued by the Notary Second of Bogotá.
| 134 |
This summary does not purport to be complete and is qualified by reference to our bylaws, which are filed as an exhibit to this annual report. For a description of the provisions of our bylaws relating to our Board of Directors and its committees, see the sectionsCorporate Governance—Board of Directors—Board Practices and— and—Board Committees.
On March 26, 2015, the Shareholders’ General Assembly approved the following amendments to our bylaws (as to which the corresponding deed has not yet been issued):
General Meeting of Shareholders
Shareholders’ meetings may be ordinary or extraordinary. Ordinary meetings will take place in our legal domicile located in Bogota, Colombia, within the first three months following the end of each fiscal year, on the day and at the time set forth in the notice for the general shareholders’ meeting. The call for the general shareholders’ meeting may be made electronically or by written communication sent to each shareholder. In both casesis published on the call must be publishedEcopetrol S.A. website and in a newspaper of wide circulation 30 calendar days prior to the date on which the meeting will take place and on the Sunday previous to the meeting, must be published at Ecopetrol S.A.’s websitewww.ecopetrol.com.co. www.ecopetrol.com.co. The call for the general shareholders’ meeting is also sent electronically to shareholders.
In the ordinary general shareholders’ meeting, our Board of Directors and the external auditor are appointed and our annual financial statements, profit distribution, audit and management reports, including our corporate governance report and sustainability report, and any other matter provided under applicable law or our corporate bylaws are approved.
Extraordinary meetings of shareholders may be called by our Board of Directors, by our president or chief executive officer, by our external auditor, or by shareholders holding at least 5% of the shares outstanding, or when unforeseen or urgent needs of the Company require it. Calls to extraordinary meetings should be made at least 15 calendar days prior to the date of the meeting, with the exception of the case where the Law requires a greater time between the summons and the meeting,meeting. Such a call is published on the Ecopetrol S.A. website and may be made electronically or by written communication to each shareholder; in both cases the call must be published in a newspaper of wide circulation. The meeting notice must specify the agenda for the meeting.
The required quorum for both ordinary and extraordinary meetings is a plural number of shareholders representing 50% plus one of the subscribed shares entitled to vote and decisions are approved with a majority of the members present. This quorum is exempted in the case of “second-call meetings,” which may take place when a meeting fails to obtain the required quorum and is called within a period between 10 business days and 30 business days from the first date, in which case decisions may be adopted by a majority of the shares present regardless of the number represented.
Decisions made at ordinary and extraordinary shareholders’ meeting must be approved by a plural number of shareholders representing the majority of the shares present. Colombian law requires supermajorities in the following cases:
| · | The vote of at least 70% of the shares present and entitled to vote at the ordinary shareholders’ meeting is required to approve the issuance of stock not subject to preemptive rights; |
| · | The vote of at least 78% of the shares represented entitled to vote is required to approve the distribution of the annual net profits. In the absence of this special majority, at least 50% of the net profits must be distributed. If the sum of all legal reserves (statutory, legal and optional) exceeds the amount of the outstanding capital, the Company must distribute at least 70% of the annual net profits; |
| · | The vote of at least 80% of the shares represented is required to approve the payment of dividends in shares; and |
| · | The vote of 100% of the outstanding and issued shares is required to replace a vacancy on the Board of Directors without applying the electoral quotient system. |
Shareholders may be represented by proxies provided that the proxy: (1) is in writing (faxes and electronic documents are valid), (2) specifies the name of the representative, (3) specifies the date or time of the meeting for which the proxy is given and (4) includes other information specified by the applicable law. Proxies granted abroad do not require legalization or an apostille.
| 135 |
During our ordinary annual shareholders’ meeting, our employees and Directors are only allowed to represent their own shares, unless they act as legal representatives.
Preference Rights and Restrictions Attaching to Our Shares
We have only one class of stock without special rights or restrictions (ordinary shares). Our shareholders do not have any type of preemptive rights.
Under Commercial Colombian law, our shareholders have the following economic privileges and voting rights:
| · | To participate and vote on the decisions of the general shareholders’ meeting; |
| · | To receive dividends based on the financial performance of the Company in proportion to their share ownership; |
| · | To transfer and sell shares according to our bylaws and Colombian law; |
| · | To inspect corporate books and records 15 business days prior to the ordinary shareholders’ meeting where the year-end financial statements are to be approved; |
| · | Upon liquidation, to receive a proportional amount of the corporate assets after the payment of external liabilities; and |
| · | To sell the shares, known asderecho de retiro, if a corporate restructuring affects the economic or voting rights of the shareholders in the terms and conditions established under Colombian law. |
Our bylaws and corporate governance code provide additional rights to our minority shareholders. These rights include:
| · | Sale of Assets. For a ten-year period counted from the date of subscription of the declaration of the Nation dated July 26, 2007 or until the Nation loses its status as majority shareholder, the Nation guarantees that any sale of 15% or more of our assets requires the approval of the general shareholders’ meeting and that the Nation would only be allowed to vote its shares in favor of the proposal if 2% or more of our minority shareholders accept the proposal. |
| · | Candidate List. Pursuant to our bylaws and Law 1118 of 2006, the Nation will include in its candidate list for election of members of the Board of Directors one member selected by the departments that produce hydrocarbons. In addition, pursuant to the declaration of the Nation dated July 26, 2007, the Nation will include in its candidate list for election of members of the Board of Directors one member selected by the ten largest minority shareholders. The minority shareholders’ right to select a candidate loses its effect when minority shareholders, according to their share participation, name a member to our Board of Directors. |
| · | Extraordinary Meetings. Our bylaws and corporate governance code provide that the entity exercising permanent control over Ecopetrol must instruct the Company’s CEO or External Auditor to call an extraordinary meeting of the Company’s shareholders when so requested by a plurality of shareholders holding at least 5% of the total number of outstanding shares. Such requests shall be made in writing and must clearly indicate the purpose of the meeting. |
| · | Investor Attention Office. Ecopetrol has an investor attention office, a specialized unit responsible for receiving complaints from our shareholders. Pursuant to our bylaws, shareholders holding at least 5% of the total number of shares outstanding may request that the investor attention office conduct a special audit of the following documents: the income statement; the proposal for the distribution of profits; the report of the Board of Directors as to the economic and financial status of our Company; the report from our general counsel as to the legal status of our Company; and the report from the independent auditors. Special audits cannot be made of documents that contain scientific, technological or statistical information of our Company, or agreement that gives us competitive and economic advantages over our competitors, or in respect of any document related to intellectual property. Shareholders also have the right to propose good corporate governance recommendations to the office for the protection of investors. |
| 136 |
| · | Others. Pursuant to our bylaws, shareholders holding at least 5% of the total number of shares outstanding may propose recommendations to our Board of Directors pertaining to the management of our Company. Any shareholder may file a written petition to our Board of Directors to investigate corporate governance violations that the shareholder believes to have been committed. |
Amendments to Rights and Restrictions to Shares
We have only one class of stock and it has no special rights or restrictions (ordinary shares). Our shareholders do not have any type of preemptive rights. The rights given to our shareholders by law are described in our bylaws and may only be modified through an amendment to the law.
The additional rights given to our minority shareholders in our bylaws and corporate governance code may only be modified through an amendment of those internal documents.
Limitations on the Rights to Hold Securities
There are no limitations in our bylaws or Colombian law on the rights of Colombian residents or foreign investors to own the shares of our Company, or on the right to hold or exercise voting rights with respect to those shares, except in cases of legal representation and except that the Nation must hold a minimum of 80% of our capital stock at all times.
Restrictions on Change of Control Mergers, Acquisitions or Corporate Restructuring of the Company
Under Colombian law and our bylaws, the general shareholders’ meeting has full authority to approve any corporate restructuring, including any mergers, acquisitions or spin-offs. Corporate restructurings are also subject to the requirement that the Nation must hold a minimum of 80% of our common stock at all times. So long as Law 1118 of 2006 is in effect, there cannot be any restructuring that resultsresult in a change of control of our Company.
Ownership Threshold Requiring Public Disclosure
Our corporate governance code (TitleThe Corporate Governance Code, Title III, chapterChapter 1, Section 5, states: Identification of the Main Shareholders) provides that we must disclose periodically on our web page, the namesMajor Shareholders. The shareholding composition of the shareholders of our Company, including,indicating at least the 20 shareholderstwenty (20) people with the greatest number of shares. We must also disclose this information to the Superintendency of Financeshares, is disclosed on Ecopetrol’s website at the end of each quarter.
www.ecopetrol.com.co. Colombian securities regulations set forth the obligation to disclose any material event orhecho relevante. Any transfer of shares equal or greater than 5% of our capital stock, or any personlegal entity or individual acquiring a percentage of shares that would make him the beneficial owner of 5% or more of our capital stock, is a material event, and therefore, must be disclosed to the SuperintendencySuperintendence of Finance. The regulation includes other criteria in order to identify when to report a material event other than the situations described in the previous sentence.
External Auditor
Pursuant to our bylaws, our external auditor shall not be appointed for more than five consecutive one-year terms by us. However, an external auditor may be hired again after two terms have passed since the conclusion of its last term of appointment. At the ordinary general shareholders’ meeting on March 26, 2015,31, 2017, the shareholders appointed PricewaterhouseCoopers Ltda.Ernst & Young as external auditor of Ecopetrol.Ecopetrol for the fiscal year 2017.
| Code of Ethics |
We have adopted a code of ethics, which complies with applicable U.S. and Colombian law. Our code of ethics applies to our chiefBoard of Directors, our Chief Executive Officer, our Chief Financial Officer, principal accounting officer, persons performing similar functions and in general to all of the other personnel.employees of the company and its affiliates.
| 137 |
All of our agreements with suppliers or third parties include a provision relating to compliance with applicable anti-bribery and anti-corruption regulations. These agreements also require our suppliers and third parties to accept our Code of Ethics and our compliance manuals.
Our code of ethics is available on our website athttp://www.ecopetrol.com.co/especiales/codigoEtica_/index.html.index.html.
If we amend the provisions of our code of ethics that apply to our chief Executive Officer, our Chief Financial Officer, our principal accounting officer and persons performing similar functions, or if we grant any waiver of such provisions, we will disclose such amendment or waiver on our website at the same address.
| Board of Directors |
The information below sets forth the names and business experience of each of our current Directors elected at the shareholders’ ordinary meeting held on March 26, 201531, 2017 for terms of one year beginning on that date, as of the date hereof:
Minister of Mines and Energy, Tomás González Estrada (44) has been a member of our Board of Directors since August 29, 2014. He holds a BA in economics from the University of Los Andes with a Master’s Degree in Economic Sciences and a phd in Economics from the University of London. He has accumulated over 15 years of experience in both the private and public sectors. Within the public sector, he was the Vice-Minister of Mines and Energy from 2010 to 2013, a period where he presided over the Commission for the Regulation of Energy and Gas (CREG), taking the lead in the creation of the National Mining Agency (ANM), the reorganization of the gas sector and the restructuring of state entities related to mining and energy activities.
He has also served in the public sector as an Economic Advisor to President Andrés Pastrana and as the Deputy Director of the National Department of Planning (DNP). Additional positions have included his role as the technical secretary of the National Council for Social and Economic Policy (CONPES) and as a member of the boards of directors for different public and private organizations, including Isa, Isagen and Hocol.
Mr. González worked for BP Colombia as a manager of external affairs and has been a professor at the University of London and the University of Los Andes, where he taught a seminar on Economy, Petroleum and Development. He was appointed as a Director by the Nation.
Minister of Finance and Public Credit, Mauricio Cárdenas Santamaría (52)(54) has been a memberis the Minister of our Board of DirectorsFinance and Public Credit since March 27, 2008. Mr. CárdenasSeptember, 2012. He was the Minister of Mines and Energy of Colombia from September 26, 2011 to August 30,September 3, 2012. He has served as Senior Fellow and Director at the Latin America Initiative of the Brookings Institution in Washington D.C. Previously, Mr. Cárdenas served as Executive Director of Fedesarrollo (Fundación para la Educación Superior y el Desarrollo) (FEDESARROLLO), PresidentCEO of Empresa de Energía Eléctrica de Bogotá, Minister of Economic Development, Minister of Transport, and Director of the National Planning Agency of Colombia. Mr. Cárdenas has also served as a member of the Board of Directors of various organizations, including the Latin American and Caribbean Economic Association (LACEA), Universidad de los Andes and the BVC. Currently, he is a Director of the Central Bank of Colombia. Mr. Cárdenas holds a BAB.A. and an MSCmaster degree in economics from the Universidad de losUniversity Andes and a Ph.D. in economics from the University of California, Berkeley.Berkeley, California. In 2001, Mr. Cárdenas was a visiting scholar at Harvard University’s Center for International Development. In 1999, he was elected by Time Magazine and CNN as one of Latin America’s Leaders for the New Millennium. Mr. Cárdenas was appointedhas also served as a member of the board of directors of various organizations, including the Latin American and Caribbean Economic Association (LACEA), University Andes and the Colombia Stock Exchange (BVC). Currently he is a Director by the Nation.of Banco de la República. Mr. Cárdenas has served as a Director of Ecopetrol´s Board since March 27, 2008. Currently Mr. Cárdenas is a non-independent Director of Ecopetrol´s Board.
Mauricio Cabera Galvis (65) currently serves as Director of the firm Cabrera & Bedoya Investment Bankers. He has been President of the FES Foundation and Banco de Occidente. He has served as Director of INCORBANK S.A. and as Public Credit Director in the Finance and Public Credit Ministry of Colombia. He has been Technical Vice President of the Banking Association of Colombia and Head of the Global Programming Unit of the National Planning AgencyDepartment. He was Dean of the Faculty of Economics of the Universidad Externado de Colombia Simón Gaviria Muñoz (34) is member of our Board of Directors since August 29, 2014. He isand an economist in the Western Hemisphere Department of the International Monetary Fund. He holds a degree in Philosophy from the University of Pennsylvania withUniversidad Javeriana and holds a Master’s Degree in mathematicsEconomics from Universidad de los Andes. He attended the Ph.D. program at the London School of Economics. He is a Director of Industrias de Licores del Valle, Clínica DIME, ASTORGA and econometrics from the same university. Before reaching the National Planning Agency,Fabricato. Mr. Gaviria was the head of the Colombian Liberal Party. Between 2006 and 2014 heCabrera has served as representative to the Cámara de Representantes by Bogotá. Between July 2011 and July 2012 he served as chairman of the Cámara de Representantes.
During his early professional years he worked as a financial analyst at US banks, JP Morgan Chase Corporate Finance in New York. In 2005 he was adviser to the candidate for President of the Republic, Enrique Peñalosa. Mr. Gaviria was the author of the Insolvency Act and the Cellular One Number Act. It also highlights its initiative of Statute Law Consumer and general framework of warrant to facilitate access to credit at lower interest rates. Mr. Gaviria was appointed as a Director by the Nation.of Ecopetrol’s Board since March 31, 2017. Currently Mr. Cabrera is an independent Director of Ecopetrol´s Board.
Jorge Pinzón Sánchez (55)Yesid Reyes Alvarado (58)has been a memberprofessor at the Universities Externado, Libre, Santo Tomás, Autónoma of our BoardMadrid and Los Andes. He has acted as Associate Judge in the Tribunal Superior de Bogotá, Consejo Superior de la Judicatura, Supreme Court and Constitutional Court. He has also been a columnist for the newspaper El Espectador. He served as Minister of Directors since December 6, 2012.Justice and Law of Colombia during august 2014 to April 2016. He is a freelance attorneycurrently Director of the Center for Research in Philosophy and an arbitrator registeredLaw at the CentersUniversity Externado. Mr. Reyes holds a degree in law and a specialization and Master in Criminal, Criminological and Criminalistics Sciences in the same university. He holds a PhD in Law from the University Autónoma of ConciliationMadrid and Arbitrationhad a research fellowship in Alexander von Humboldt Stiftug at the University of the Chambers of Commerce of Bogotá and Barranquilla. He was a partner at Estudios Palacios Lleras S.A., a law firm in consulting and arbitration of business, commercial and tax law. He alsoBonn (Germany). Mr. Reyes has served as a Director of Ecopetrol’s Board since September 14, 2016. Currently Mr. Reyes is an independent Director of Ecopetrol’s Board.
| 138 |
Ana Milena López Rocha (36) serves as the headDirector of Public Credit and National Treasury at the Superintendency of Corporations as well as of the SuperintendencyColombian Ministry of Finance of Colombia. Hesince April 2015. She was alsoa Partner at asset manager Newfoundland Capital Management and an external advisor to Fiduciaria Alianza and Alianza Valores. She held leadership positions at Sociedades Bolivar S.A. and J.P. Morgan Chase Bank. Ms. López holds a B.A. in Economics from Harvard University and a Master´s Degree in Business from Columbia Business School. She is a member of the Advisory Committee of the Banking Superintendency, member of the General Board of Directors of Interconexión Eléctrica S.A. E.S.P. - (ISA) and Financiera de Desarrollo Nacional. Ms. López has served as a Director of Ecopetrol’s Board since September 14, 2016. Currently Ms. López is a non-independent Director of Ecopetrol´s Board.
Jaime Ardila Gómez (61)was president of General Motors for South America and has held various positions within General Motors. Among these, he acted as President for Brazil and Mercosur; CFO for Latin America, Africa and the Securities Superintendency of Colombia,Middle East; CEO and Managing Director in Argentina; CEO and Managing Director in COLMOTORES, CEO and Managing Director in Ecuador; Omnibus BB, CFO in Chile; and Treasurer in Mexico, among others. He also served as Managing Director in Colombian Operations for N.M Rothschild and Sons and Secretary General of the Ministry of FinanceIndustry and Public CreditTrade in Colombia. Mr. Ardila holds a B.A. in economics from the University of Bogota Jorge Tadeo Lozano and Deputy General Counsel, Secretary Generala master degree in economics from the London School of Economics. He is a member of the Board of Directors of Goldman Sachs BDC, Accenture, Council of the Americas and General Counsel of Banco del Comercio, among other positions in the public and private sector. He serves as an arbitrator in the Center of Arbitration of the Chamber of Commerce of Bogotá andBrazil. Mr. Ardila has served several years as a Colombian representative to the United Nations Commission on International Trade Law (UNCITRAL).Director of Ecopetrol’s Board since March 31, 2016. Currently Mr. Pinzón has been a member of several boards of directors of Colombian financial sector companies. He also was a law professor at Universidad Javeriana, Universidad de los Andes, as well as other universities. He has also published several legal articles. Mr. Pinzón earned a degree in law and a master’s degree in Philosophy from Universidad Javeriana. He was appointed asArdila is an independent Director.Director of Ecopetrol´s Board.
Luis Fernando Ramírez (56)Carlos Alfredo Cure Cure (72) serves as Presidentwas Ambassador of Federación Colombiana de Compañías de Leasing. Previously, Mr. RamírezColombia to Venezuela. He was CEO of Bavaria S.A., the largest brewery in Colombia. He also served as Ministeran advisor to the Board of National Defense from 1999 to 2001, Ministerthe Olympic Group S.A. and member of Laborthe Board of Avianca S.A. (Colombia’s national airline).He acted as deputy financial manager of Cementos del Caribe, CEO of Cementos Toluviejo and Social Security from 1992 to 1994, Vice-MinisterCEO of Finance and Public Credit and General Director of Taxes from 1986 to 1992.Astilleros Unión Industrial. Mr. Ramírez earnedCure holds a degree in AccountingCivil Engineering from Universidad Jorge Tadeo Lozano and he was Fellowthe National University of the Center for International Affairs from Harvard University, Cambridge, Massachusetts.Medellin. Mr. Ramírez was appointedCure has served as a Director of Ecopetrol´s Board since September 5, 2015. Currently Mr. Cure is an independent Director.Director of Ecopetrol´s Board.
Joaquín Moreno Uribe (65)(68) has beenearned a member of our Board of Directors since March 27, 2008.degree in civil engineering from Universidad Industrial de Santander and completed a The Advanced Management Program (AMP) at The Harvard University Business School. Mr. Moreno worked initially as Director for 33 years forConstructions and Engineering of Urbanas, in Bucaramanga, Colombia. He then joined the Royal Dutch/Shell Group. He has heldGroup of companies for more than 33 years. His career with Shell included various positions such as Project Managerat technical, managerial and leadership levels, in Colombia; Projectdifferent sectors of the Oil & Gas Industries (Upstream and Operations ManagerDownstream), Chemicals, Metals and MarketingCoal. He worked in different countries in America and Operations Manager of Shell Química de Venezuela; Director of Marketing for Agrochemical ProductsEurope, including several appointments at regional, global and Global Marketing Manager for Petrochemical Products at Shell Centre–Shell International Chemicals Company in London; Director of Shell Venezuela S.A.; Director of Shell Colombia S.A., Director of Cerromatoso S.A., a Colombian mining company that is located in the department of Córdoba, dedicated to the production of ferro-nickel and iron-nickel alloy, and Exploration and Production Business Economics and Strategic Planning Director for Europe and the Middle Eastcorporate levels at the Shell International Headquarters of the RDS Group in London and The Hague, the Netherlands.Hague. Mr. Moreno has also served as Country Chairman and President for Shell in Mexico, Colombia and Venezuela, as well as Regional CEO for Downstream Oil Business in the Northern Latin American Region. On his return to Colombia, he was appointed by the Presidency of the Country, as High Presidential Commissioner –Ad Honorem- in charge of coordinating the reconstruction of the areas affected by the heavy rain season and floods of early 2005, in the Region of Santander and Northern Santander. Mr. Moreno has been a member of the boards of directors of various local and international companies.companies, as well as educational and leadership institutions and initiatives. Mr. Moreno earnedhas served as a degree in civil engineering from Universidad Industrial de Santander and completed a program in advanced management at Harvard University Business School in Cambridge, Massachusetts. He was appointed asDirector of Ecopetrol´s Board since March 27, 2008. Currently Mr. Moreno is an independent Director.
Gonzalo Restrepo López (64)serves as ChairmanDirector of the Board of Directors. Mr. Restrepo was the Chief Executive Officer of Grupo Éxito S.A. for 23 years. Prior to this position, he served as CEO of Caribú Internacional, a textile and apparel company in Medellín; Caribe Motor S.A. and other private companies. Mr. Restrepo has been a member of different boards of directors of Colombian companies. In 2013, he received the Cross of Boyacá in the Order of Grand Official, the highest decoration and distinction of the Colombian state, given by the President of the country. Mr. Restrepo earned a degree in Management from Syracuse University, United States and an MBA in Marketing from the University of Georgia, Athens, Georgia. Mr. Restrepo was appointed as an independent Director.Ecopetrol´s Board.
Horacio Ferreira(45) Rueda (47) is an executive leader with more than 20 years of international experience in the oil industry. His knowledge and expertise stem from previous positions as CEO and President of an oilfield services company in Houston, TX to application of state of art technologies in the oil industry. He has led and executed numerous reservoir engineering projects in the Americas, Europe, Africa, Middle East and Far East and has conducted research in optimization of multiphase meters, underbalanced reservoir engineering, real time reservoir and production analysis, reservoir simulation and waterflood techniques with horizontal wells. Mr. Ferreira has several technical publications in reservoir management with a focus on production optimization and reservoir management. He holds a BS in Petroleum Engineering from Texas A&M University, MSUniversidad América, master and D.Eng. Degreesdoctoral degrees in Petroleum Engineering from Texas A&M University and a business graduate degree in Management of International Corporations from Texas A&M University. He was appointedMr. Ferreira has served as a Director of Ecopetrol´s Board, nominated by the hydrocarbon producing provinces of Colombia, since January 23, 2014. Currently Mr. Ferreira is an independent Director representingof Ecopetrol´s Board, nominated by the hydrocarbon producing provinces of Colombia.
| 139 |
Roberto Steiner Sampedro (55)has been a member
Carlos Gustavo Cano Sanz (70) currently serves as Professor in the Master of our Board of Directors since October 12, 2011. Mr. Steiner is an associate researcher and former ExecutiveCorporate Finance at CESA. He was Director of Fedesarrollo.Banco de la República from February 4, 2005 to January 31, 2017. He was Minister of Agriculture between August 7, 2002 and February 3, 2005. He served as Alternate Executive Director ofan external consultant to the International Monetary FundAlternative Development and Competitiveness for the Andean Region from 20021999 to 2007, Director of the Economics Research Department of the Central Bank of2002. He represented Colombia from October 1989 to April 1993, Director of the Economic Development Research Centre of Universidad de los Andes, Consultant at the World BankInter-American Institute for Cooperation on Agriculture (IICA) from 1997 to 1999. He acted as President of COMUNICAN S.A. from 1996 to 1997, Caja Agraria from 1995 to 1996 Deputyand Sociedad de Agricultores de Colombia (SAC) from 1990 to 1991. He was General Manager of the National Federation of Rice Growers (FEDEARROZ) and the Agroindustrial Complex of Tolima S.A. (CATSA). Mr. Cano is an Economist from the University of Los Andes with a master degree in Economics from the University of Lancaster, England. He has a postgraduate degree in Government, Business and International Economics from Harvard University and from the Institute of Higher Business Management (INALDE). He has served as a member of various boards of directors, including the Comisión Nacional de Crédito Agropecuario, FINAGRO, Banco Agrario, ICA, CORPOICA, the National Coffee Growers Committee, among others. He doesn’t serve as a Director of Fedesarrollo from 1993 to 1994, Deputyjoint-stock company. Mr. Cano has served as a Director of Ecopetrol’s Board, nominated by the Economics Research Department ofminority shareholders with the Central Bank of Colombia from 1988 to 1989, and Senior Economist at the Central Bank of Colombia from 1986 to 1988. He was a professor and researcher at various Colombian universities, including the Universidad de los Andes, Universidad Javeriana and Universidad Nacional. In 1995, he was a summer professor at Columbia University in New York. He has published several books, articles and research papers on economics.greatest share participation, since March 31, 2017. Currently Mr. Steiner earned a degree in economics from Universidad de los Andes and M.A. and M.Phil degrees in economics from Columbia University in New York. Mr. Steiner was appointed asCano is an independent Director.Director of Ecopetrol´s Board, nominated by the minority shareholders with the greatest share participation.
| 7.3.1 | Board Practices |
Our Board of Directors is composed of nine members and is responsible for, among other things, establishing our general business policies. The majority of the Board of Directors must be independent, and must be elected pursuant to the criteria set out in paragraph two, Article 44, Law 964, 2005, and in accordance with the procedure determined in Decree 3923, 2006, or any other provisions that regulate, amend, replace or add such regulations. In addition, pursuant to our bylaws and in accordance the procedures described therein, our majority shareholder must include, in its list of candidates for the last two seats in the Board of Directors, the name of one individual jointly proposed by departments that produce hydrocarbons and one individual jointly proposed by the ten minority shareholders with the highest equity participation. According to Colombian law, the members of the Board of Directors must be elected atby the annual shareholders’ meeting in accordance with a proportional representation system similar to cumulative voting (through an electoral quota voting system). The number of votes required to fill each position is calculated by dividing the number of possible votes by the number of open board positions. The members of the Board of Directors may be elected without an electoral quota voting system when there is unanimity. Pursuant to our bylaws, Directors are elected for a one-year term, and the positions are filled either by person or by position. Members of the Board may be reelected indefinitely. Currently, we have three membersone Director appointed by theirhis position: the Minister of Mines and Energy, the Minister of Finance and Public Credit and the Director of the National Planning Agency.Credit. Our current Directors were elected at the ordinary shareholders’ meeting held on March 26, 2015.31, 2017. Directors may be removed without cause at any moment by a majority of the shareholders present at a general shareholders’ meeting.
Our CEO is appointed by the Board of Directors and has two alternates. The CEO is elected for a two-year term, may be reelected indefinitely and freely removed prior to the expiration of his term. In accordance with our bylaws, the Board of Directors must evaluate the annual performance of the CEO and such results must be published in Ecopetrol’s web page or in an alternative media vehicle.
The compensation of our Directors is set exclusively by the shareholders at the general shareholders’ meeting. Directors are compensated for attending board meetings and committee meetings. A Board meeting requires a quorum of at least five members and decisions are approved with a majority of the membersDirectors present. None ofIn the contracts of any of our Directors contains provisions for benefits upon termination of such Director’s services.practice a consensus decision making operates in the Board.
Under Colombian law, a director or executive officer must disclose during the general shareholders’ meetingabstain from participating in any transaction that may result in a conflict of interest.interest or that involves competition with the company, unless authorized at a general shareholders’ meeting. The general shareholders’ meetingshareholders may approve or reject the transaction giving rise to the conflict of interest with the vote of the majority of the shares present at the shareholders’ meeting. If the director or executive officer who has the conflict is a shareholder, his or her vote must be excluded. We disclose conflicts of interest of our employees, executive officers and directorsDirectors in our Corporate Governance and Board of Directorsannual reports.
| 140 |
Neither our bylaws nor our corporate governance code provide a retirement age for our Directors. Under our bylaws, there is no requirement for a person to have a minimum number of shares to be elected as a Director. Colombian law provides that Directors willing to sell or purchase shares in our Company need prior authorization from the entire Board of Directors. Colombian law does not impose any limitation as to the number of shares that may be acquired by a Director.
| 7.3.2 | Board Committees |
Pursuant to our bylaws, our Board of Directors has four committees (Audit Committee, Corporate Governance(audit and Sustainability Committee, Compensationrisk committee, corporate governance and Nomination Committeesustainability committee, compensation and Business Committee)nomination committee and business committee), which establish guidelines, set specific actions and evaluate and submit proposals designed to improve performance in the areas under their supervision and control. These committees are comprised of members of the Board of Directors who are also appointed by the members of the Board of Directors.Directors and the chairman of each of the committees must be an independent Director. In addition to applicable regulations, the committees also have their own specific regulations that establish their purposes, duties and responsibilities.
Table 65 – Composition of committees of the Board Committees’ Compositionof Directors as of April 17, 2015.20, 2017
Audit and Risk Committee | Compensation and | Corporate Governance | ||||
Horacio Ferreira Rueda
Carlos Gustavo Cano Sanz | Minister of Finance and Public Credit Carlos Cure Cure Ana Milena López Rocha Joaquín Moreno Uribe Mauricio Cabrera Galvis | Minister of Finance and Public Credit
| Horacio Ferrerira Rueda
|
Carlos Gustavo Cano Sanz
| ||||
| Business Committee | ||||
Minister of
Horacio Ferreira Rueda
Jaime Ardila Gómez Carlos Gustavo Cano Sanz Mauricio Cabrera Galvis |
Audit and Risk Committee
Our audit and risk committee, which must be comprised of at least three members, all of them independent Directors, is our highest internal control body and provides support to our Board of Directors on risk, accounting and financial matters. It is in charge of guaranteeing the design, implementation and supervision of our internal control over financial reporting. It also ratifies the annual hydrocarbons reserves report and provides support for our Board on analyzing topics related to financial matters, risks, control environment and the assessment of the Company’s internal and external auditors.
All committee members are required to be knowledgeable in accounting matters and at least one of them is required to be an expert in financial and accounting matters.
Our Board of Directors has determined that Luis Fernando RamirezJaime Ardila Gómez qualifies as an “audit committee financial expert,” and he is independent under the definition of “independent” applicable to us under the rules of the NYSE.
The audit and risk committee approves on a case-by-case basis any engagement of our external independent auditors to provide services different than those related to auditing our financial statements. Occasionally, the Audit Committeeaudit and risk committee will have no doubt that these additional services do not compromise the external auditor’s independence. When in doubt, the Committeecommittee will request the opinion of the internal auditor.
| 141 |
Compensation and Nomination Committee
Our compensation and nomination committee, which must be comprised of at least three members, including at least one independent director, provides general guidelines for the selection and compensation of our executive officers and employees.
Corporate Governance and Sustainability Committee
Our corporate governance and sustainability committee, which must be comprised of at least three members, including at least one independent director, makes proposals to our Board of Directors to ensure and supervise the fulfillment of our good corporate governance and sustainability practices in accordance with our corporate governance code.
Business Committee
Our business committee, which must be comprised of at least five members, including at least one independent Director, assists our Board in analyzing potential business ventures. Based on its delegation of power, the committee studies and analyzes capital expenditure policies, major investment projects, strategy, new business and other matters that would help us move forward in our efforts toward the consolidation of our strategy. The primary criteria used in the committee’s decision-making process are the optimization of our portfolio and the proper allocation of our resources.
| Compliance with NYSE Listing Rules |
The following is a summary of the significant differences between our corporate governance practices and those required for U.S. companies under the NYSE listing standards.
NYSE Standards | Our Corporate Governance Practices | |
Director Independence | ||
| The majority of the board of directors must be independent. §303A.01. “Controlled companies,” which would include Ecopetrol if we were a U.S. issuer, are exempt from this requirement. A controlled company is one in which more than 50% of the voting power is held by an individual, group or another company, rather than the public. §303A.00. | ||
| Executive Sessions | ||
| The non-management directors of each listed company must meet at regularly scheduled executive sessions without management. §303A.03. | A comparable rule does not exist under Colombian law. Except for our | |
| Nominating/Corporate Governance and Sustainability Committee | ||
| A nominating/corporate governance and sustainability committee composed entirely of independent directors is required. The committee must have a charter specifying the purpose, duties and evaluation procedures of the committee. §303A.04. “Controlled companies” are exempt from these requirements. §303A.00. | Colombian law does not require the establishment of a nominating and a corporate governance and sustainability committee composed entirely of independent directors. Pursuant to our bylaws | |
| Compensation Committee | ||
| A compensation committee composed entirely of independent directors is required, which must evaluate and approve executive officer compensation. The committee must have a charter specifying the purpose, duties and evaluation procedures of the committee. §303A.05. “Controlled companies” are exempt from this requirement. §303A.00. | Colombian law does not require the establishment of a compensation committee composed entirely of independent directors. Pursuant to our bylaws | |
| 142 |
NYSE Standards | Our Corporate Governance Practices | |
Audit and Risk Committee | ||
| An audit committee with a minimum of three independent directors satisfying the independence and other requirements of Rule 10A-3 under the Exchange Act and the more stringent requirements under the NYSE standards is required. §§303A.06 and 303A.07. | According to Law 964 of 2005, Colombian companies that are authorized to issue securities by the | |
| Equity Compensation Plans | ||
| Equity compensation plans and all material revisions thereto require shareholder approval, subject to limited exemptions. §§303A.08 and 312.03. | Under Colombian law, no similar right to vote on equity compensation plans and material revisions thereto is given to shareholders. We do not give our shareholders the right to vote on equity compensation plans and material revisions thereto. | |
| Corporate Governance Guidelines | ||
| Listed companies must adopt and disclose corporate governance guidelines. §303A.09. | The | |
| Code of Ethics for Directors, Officers and Employees | ||
| Corporate governance guidelines and a code of business conduct and ethics is required, with disclosure of any waiver for directors or executive officers. The code must contain compliance standards and procedures that will facilitate the effective operation of the code. §303A.10. | We have adopted a code of ethics which complies with applicable U.S. and Colombian law. Our code of ethics applies to our chief executive officer, chief financial officer, principal accounting officer, persons performing similar functions and | |
| Management |
The following presents information concerning our executive officers and senior management. Unless otherwise noted, allthe majority of these individuals are Colombian citizens.
| 143 |
Juan Carlos Echeverry (52)(54)Mr. Echeverry ishas served as the Chief Executive Officer of Ecopetrol, Colombia’s National Oil Company. He has previously served asCompany, since April 2015. From 2010 to 2012, he was Colombia’s Minister of Finance and Minister of Economic Planning.Finance. During his mandate, as Minister of Finance in 2011, four international publications (The Banker, AmericaAmérica Economía, Emerging Markets, and Institutional Investor) awarded him as the Best Finance Minister of the Americas. Previously,Prior to his current role, Mr. Echeverry represented Colombia in the Board of Directors of the Inter-AmericanInter–American Development Bank (Washington D.C.) and. He also served as Dean of Economics at Universidad de losUniversity of the Andes (Bogotá). From 2000 to 2002 he was the Director of Economic Planning of Colombia. In 2002, Mr. Echeverry founded Econcept, a Bogotá based economics and business consultancy, and was partner of Global Source, a New York based consultancy. He is the author of several books about the Colombian economy and co-author of publications focusing on developing economies. Among his work there are economic studies on Africa and countries of the Pacific Basin.
Mr. Echeverry hasreceived a Ph.D. in Economics from New York University, a graduate studies degree in International Economics from Kiel Institute of the World Economy and an outstanding academic careerB.A. in Economics from the fieldUniversity of Economics.
the Andes (Bogotá).
Camilo Marulanda (37)
Felipe Bayon Pardo (51)has been ourserved as the Executive Vice-presidentVice-President of Ecopetrol since March 2015February 2016. Mr. Bayon holds a degree in Mechanical Engineering from the Universidad de Los Andes (Bogotá). He has over 1125 years of experience in the oil and gas industry, having occupied important positions suchindustry. For more than 20 years, he worked at BP plc, most recently as Senior Vice-President of BP America and Head of Global Deepwater Response. From 2005 to 2010, he was the Regional President of BP Southern Cone (South America), and prior to 2005 he worked in BP’s headquarters as Chief Executive Officer of CENITStaff to the Upstream CEO and Vicepresident of Strategy and Growth as well as Vice-president of Supply and Marketing at Ecopetrol. He has also held other managerial positions at Ecopetrol, such as Sales Manager of Refined and Petrochemical Products as well as Department Head of Marketing. Mr. Marulandathe Executive Office for Exploration and Production. He began his career in 1995 in BP Colombia, as Category and Account Manager at Procter & Gamble. He holds an Executive MBA with a specialtyProject Engineer, where he held various positions until becoming Vice-President of Operations in Marketing and Economics from the Universidad de los Andes in BogotáColombia.
Max TorresMaría Fernanda Suárez (42) (57) has served as Exploration Vice President since September 2014. Mr. Torres holds a B.S. degree in Geology from Universidad Nacional of Tucumán in Argentina and an M.S. in Stratigraphy from Georgia State University (1987). He has more than 28 years of experience in oil and gas exploration and production and is a proven world class oil gas finder and a champion of Latin American oil and gas exploration. Among his many professional accomplishments, Mr. Torres was directly responsible for 16 the Tcfg Perla gas field discovery in Venezuela, the 275 Tcfg super giant Galkynysh gas field discovery in Turkmenistan, as well as other oil and gas discoveries. Prior to joining Ecopetrol, Mr. Torres worked at Repsol from 1997 to 2013 as Exploration Director for Europe and the Middle East, Exploration Director for Europe and Africa and Exploration Director for Latin America.
Adriana M. Echeverri (44) joined Ecopetrol in 1994. She is currently serving as Chief Strategy and Development Officer (CSO) and previously served as Chief Financial Officer until May 2013. Previously, Mrs. Echeverri also worked as Head of the Finance and Treasury Unit and Head of the Corporate Finance Unit. She earned a bachelor’s degree in finance and foreign affairs as well as an MBA from Universidad Externado de Colombia.
Magda Manosalva (43) joined Ecopetrol in 2005. She has been serving as Ecopetrol S.A.’s Chief Financial Officer since November 2013. Prior to being appointed as our CFO, Mrs. Manosalva was assigned, in 2012, as the Chief Financial Officer of Reficar S.A. Mrs. Manosalva earnedEcopetrol since August 2015. Ms. Suárez holds a degree in Business Administration from CESA and a master’s degree in EconomicsPolicy Management from Universidad Nacional de Colombia,Georgetown University. Ms. Suárez has 20 years of experience in the public and a specialization degreeprivate sectors. She has held various positions in financethese sectors, including Director of Public Credit and National Treasury at Harvard Extension School. OverMinistry of Finance and Public Credit in the courseTreasury Department, Investment Chief Officer at Porvenir and other high-level positions at Citibank, ABN AMRO and Bank of her career she has worked on matters related to Treasury, financial risks and liquidity management.
Margarita Obregón (56) joined Ecopetrol in 2000. Mrs. ObregónAmerica. She has served as Secretary General and Secretaryon the board of the Board of Directors since January 2008. She also serves as the company’s Chief Ethics and Compliance Officer, whose responsibilities include monitoring and supervising the ethics and compliance program,directors for ISA, Isagen, XM, FEN, Cenit, among others, and as Leader of Corporate Social Responsibility, Corporate Governance and Corporate Communications. Prior to joining Ecopetrol, Mrs. Obregón worked in the supply department of Previsora S.A., an insurance company, and as a legal advisor of lands for British Petroleum Company – BP, at Alvaro Rengifo y Cia. She also served as the head of the Business and Administration department of the Fiduciaria del Estado. Mrs. Obregón earned a law degree from Colegio Mayor de Nuestra Señora del Rosario with specialization degrees in public management and financial law.others.
Hector Manosalva (52)(54) joined Ecopetrol in 1986 and serveshas served as Vice-President for Development and Production.Production since July, 2014. Mr. Manosalva holds a degree in petroleum engineeringPetroleum Engineering from the Universidad de América in BogotáAmerica (Bogotá), and completed post-graduate studies in Financefinance at the Universidad EAFIT and Executive Management at the Universidad de los Andes. Over the course of his career at Ecopetrol, Mr. Manosalva has held various positions, including Executive Vice-President for Production and Exploration, Vice-President of Production, Production Manager of the Central Region, President of Colombia’s Advisor for Safety and Security of National Energy Infrastructure, Director of HSE and Corporate Social Responsibility, Production Manager of the Southern Region and Head of the Production Planning Division.
Pedro A. RosalesMax Torres (59) (51) joined Ecopetrol in 1989, and has served as our Downstream ExecutiveExploration Vice-President since February 2008.September 2014. Mr. RosalesTorres holds a B.S. degree in Geology from Universidad Nacional of Tucumán in Argentina and an M.S. in Stratigraphy from Georgia State University. He has more than 28 years of experience in oil and gas exploration and production and is a proven world class oil and gas finder and a champion of Latin American oil and gas exploration. Among his many professional accomplishments, Mr. Torres was directly responsible for the Company’s refining, petrochemicals, marketing and distribution, biofuels16 Tcfg Perla gas field discovery in Venezuela, the 275 Tcfg super giant Galkynysh gas field discovery in Turkmenistan, as well as other oil and gas businesses. Mr. Rosales has held several positions in the Company within the areas of maintenance, operations, projects, planning and administration.discoveries. Prior to becoming our Downstream Executive Vice-President,joining Ecopetrol, Mr. Rosales servedTorres worked at Repsol from 1997 to 2013 as our Vice-President of Transportation since January 2003Exploration Director for Europe and as our Chief Operations Officer since 2006. Mr. Rosales earned a degree in mechanical engineeringthe Middle East, Exploration Director for Europe and an MBA from Universidad de los Andes.Africa and Exploration Director for Latin America.
Rafael Espinosa (48)(49)has served as Vice-President of Transportation since January 15, 2015.September 2016. Mr. Espinosa earnedholds a bachelor’s degree in civil engineeringCivil Engineering from Universidad Santo Tomas in Colombia a specialization degree in Strategic Leadership and ana MBA from Universidad de los Andes. He also holds studies in development and management innovation from Universidad Francisco de Paula Santander.University of the Andes (Bogotá). He has worked for Ecopetrol for the last 2223 years and has held various positions within the company, including oil & gas plant coordinator, headOperations and Maintenance General Manager, Pipelines Manager, Central Operation Superintendent, Chief of the operations department, crude oil pipelines manager, general manager of operationsOperations Department, Plant Coordinator, Pipeline Maintenance Engineer and maintenance, as well as other functions within the spheres of crude oil pipeline maintenance and community relations.Community Relationships Engineer.
Jaime Bocanegra (46)
| 144 |
Rafael Guzman (50) joined Ecopetrol in 2010 and has served as Technical Vice-President since May 2013. Mr. Guzman holds a B.S. degree in Petroleum Engineering from Universidad America in Colombia (1995), a M.S. in Petroleum Engineering and a PhD in Petroleum Engineering with minor in Mathematics both from Stanford University. Mr. Guzman has been with Ecopetrol since October 2010, where he has held several positions as regional production manager. Prior to that, Mr. Guzman worked with ENI in managerial positions in Europe and Latin America.
Luisa Fernanda Lafaurie (56)has served as Cenit’s Chief Executive Officer since September 2016. Ms. Lafaurie holds a degree in Economics from the Universidad Javeriana with a Master’s Degree in Business Administration and a Degree in Finance and Senior Management from Los Andes University (Bogotá). Ms. Lafaurie has accumulated extensive experience in the energy sector, both in the public and private sector, serving as Minister of Mines and Energy (2001-2002) and Deputy Minister of Mines and Energy (1998-2000), and in the private sector as an external advisor to mining and fuel distributors companies. She was a founding member of Sumatoria, a firm where she worked as an advisor on corporate strategies and business issues. As chief executive officer of HJDK (2009-2013), German Efromovich´s business group in Colombia, Ms. Lafaurie led the development of hospitality and agribusiness companies. She was also an advisor for the Synergy Group corporations in Colombia with the exception of Avianca. Ms. Lafaurie worked at Carbocol (1985-1996) and has served as a member of the board of different companies such as Ocensa, Ecopetrol, Carbocol, Minercol, Ecogas, ISA, Almacenes Exito, ISAGEN, and Conconcreto in Colombia, and CTEEP in Brazil. Currently, she is member of the board of directors of Avianca, Financiera de Desarrollo Nacional (FDN), Emgesa, Ocensa and Oleoducto Bicentenario.
Tomas Hernandez (62) has served as Vice-President of Sustainable DevelopmentRefining and EnvironmentalIndustrial Processes since January 2015.February 2016. He has over 37 years of international experience in the oil and gas sector. He has served as Business Manager at Chevron’s Pascagoula refinery in the United States, General Manager for Marketing Operations for Chevron Texaco in Latin America and Africa-Europe-Pakistan Regions and has spent over 20 years in managerial positions in various refineries at Chevron. Prior to joining Ecopetrol, he was Deputy Upgrader Manager at Petropiar, a joint venture in which Chevron participates. Mr. Bocanegra earnedHernandez holds a degree in Chemical Engineering from the University of Missouri – Rolla (University of Science and Technology Missouri).
Jürgen Loeber (59) has served as the Projects & Engineering Vice-President of Ecopetrol since May 2016. Mr. Loeber holds a degree in Business Administration from Universidad del Norte and specialization in Project Management. He joined the Army Corps of Engineers as reserve officer and reached a captain rank. He has over 30 years of experience in the Oil & Gas industry. For the last 10 years, he worked at Equion Limited (formerly BP Exploration Colombia) as Project Director. From 2001 to 2006, he was Project Director for Wood Group Colombia. From 1992 to 2001 he worked for BP in various countries as project manager, construction manager and project control engineer. He began his career in 1985 in Exxon as financial analyst.
Pedro Manrique (52) was named Commercial and Marketing Vice President as of April 2017. Mr. Manrique holds a bachelor’s degree in petroleum engineeringElectrical Engineering from Universidad de Américathe Industrial University of Santander, Colombia. He has a Master’s degree in Industrial and Systems Engineering from the University of Florida and an MBA from the IE Business School in Madrid, Spain. Mr. Manrique has 27 years of experience in the oil and gas industry. His previous position was as the Commercial and Business Planning Manager for Chevron Latin America, in Caracas, Venezuela. At Chevron he also served as Commercial and Business Development Manager in Chevron Colombia based in Bogotá, Colombia. During his career he also worked Enron Energy Services as Risk Manager, out of their headquarter offices in Houston, Texas. He has also served as member of the Leadership Team of Chevron Latin America and as member of the national operations council of natural gas in Colombia, a specialization degree in Management, a specialization degree in International Management of Oil and Gas Industry and Strategic Leadership. He has worked for Ecopetrol for the last 22 years and has held various positions within the company, including Vice-President of Transportation, Plant Coordinator, Multipurpose Pipelines Manager, Chief of Department, Program Manager of Dosquebradas and Chief of the Centralized Operations.among many other responsibilities.
Alejandro LinaresCarlos Alberto Vargas Medina (47) (55)has served as Vice-President of Transformation since December 2015. Mr. Linares CantilloVargas holds a degree in Petroleum Engineering from America University. He has been Vice-president23 years of experience across the integrated oil and gas value chain with a focus in drilling and well interventions and an expertise in exploration, appraisal, development and production onshore and offshore wells. He has held management positions in the United Kingdom, Argentina, Bolivia and Colombia, where he has developed key skills in strategy, performance management systems, risks management, HSE and integration of multicultural and multidisciplinary teams. Prior to taking his current position, he was the Vice-President of Drilling and Completions at Equion.
| 145 |
Fernán Ignacio Bejarano Arias (60) has served as Vice-President of Legal Affairs and General Counsel at Ecopetrol since October 1, 2014. He has more than thirty years of professional experience. He was a Partner at the law firm of Gómez-Pinzón Zuleta Abogados for twenty years and was recently nominated by the Council of State as a candidate to the Constitutional Court of Colombia.March 2016. Mr. Alejandro Linares CantilloBejarano Arias holds a bachelor’s degree in Law from Universidad de los AndesJaveriana in Bogotá and earned a graduate degree in finance at Universidad de los Andes as well as an LLM from Harvard Law School. He also earnedthe American University (Washington D.C.). In his more than thirty years of professional experience, he has been a graduate diploma on international tax from Harvard Universitypartner at the law firms of Estudios Palacios Lleras S.A, Bejarano Cárdenas y Ospina y Asociados Ltda and is currentlyOPEBSA Compañía de Abogados S.A.S. and has worked for several years at important positions in the processpublic sector, such as the Vice-Minister of obtainingForeign Affairs, Secretary of the Monetary Board, Secretary of the Board of Directors of the Banco de la República (Colombian Central Bank), Office of Legal Affairs Counselor at the Presidency of the Republic of Colombia, Vice-President of Legal Affairs and General Counsel at Corporación Finaciera Colombiana. Mr. Bejarano Arias has been a PhDprofessor at the Faculty of Law of the Universidad Javeriana, and has been arbitrator before the Center for Arbitration and Conciliation of the Bogotá Chamber of Commerce.
María Juliana Albán (41) has served as Compliance Vice-President and Compliance Officer since July 2015. Ms. Alban holds a law degree from Universidad Sergio Arboleda with a specialization in Commercial and Financial Law from the Universidad Externadosame institution. Since 2007, Ms. Alban has worked in the Attorney General’s Office (Procuraduría General de Colombia.la Nación) as Attorney General for State Contracts, General Secretary and Chief of Legal Office, among other positions within the institution.
Alejandro Arango (54)(57)Mr. Arango has been Vice-presidentserved as Vice-President of Human Resources at Ecopetrol S.A. since October 14, 2014. He has more than twenty20 years of professional experience around the world and has worked as a Vice-presidentVice-President of Human Resources at Banco Santander in Colombia alsoand as Human Resources Director of the Consumer Finance Division, Strategy Division and Cards Division at Banco Santander in Spain. Mr. Arango has also served as Human Resources Director for the Asia-PacificAsia Pacific region at Banco Santander in Hong Kong and as a Global Human Resources Division T&O, among others. Mr. Arango holds a degree in Strategic Marketing from CESA School of Business and a bachelor’s degree in Theology from the Universidad Hochschule Sankt Georgen (Frankfurt) and a bachelor’s degree in Philosophy from Javeriana University.
Néstor Saavedra (52)Andrés Mantilla (46)has served as our Vice-President of Innovation and Technology since September 2012. Mr. Saavedra earned a degree in petroleum engineering from Universidad Industrial de Santander and a master’s degree in petroleum engineering from Texas A&M University. His work within the Company has included serving as Director of the Colombian Petroleum Institute of Ecopetrol, coordinating horizontal wellthe technology and rock mechanics projects, as well as assessing and predicting the behavior of Colombian oil fields. Mr. Saavedra was Directordevelopment center of the Societycompany, since September 2013. He holds a degree in Petroleum Engineering from Universidad Industrial de Santander, Colombia, Master of Science degree in Petroleum EngineersEngineering from Stanford University, and a Ph.D. in Geophysics from Stanford University. His professional work includes the leadership and management of oil and gas technology development, demonstration and implementation teams. He worked for Ecopetrol holding various positions between 1994 and 2006. Before rejoining Ecopetrol in 2013, he worked for BP Colombia, Marathon Oil Company and Maersk Oil. During his professional career he has had exposure to exploration and production projects and the evaluation of new ventures in Colombia, the Gulf of Mexico, the North Sea, West Africa, South AmericanAmerica and Caribbean Region from 2012 to 2014.the Middle East.
Carlos Zamudio (49)Eduardo Uribe Botero (57) has been the Director of Shared Services since August 2012. Mr. Zamudio has more than 20 years of extensive experience in service delivery operations in multinational companies at regional and global levels. He previously worked at Belcorp, where he was the Corporate Director of the Shared Services Center, overseeing 15 countries including the U.S. and Brazil. He also worked at Procter & Gamble, where he was the Corporate Finance Manager for Chile, Brazil, Costa Rica and Colombia, as well as the Global Business Services Manager for the Latin America region.
Edgar Rey(55)has served as Internal Audit DirectorVice-President of EcopetrolSustainable Development and Environmental since November 2009. HasAugust 2015. Mr. Uribe holds a degree in Agricultural Engineering from Caldas University, a master’s of science in Soil Chemistry and a Ph.D. in Fertility and Management of Tropical Soils. He has over 25 years of experience in the oilprivate and gas industry, having workedpublic sectors. In 1994, he was appointed the first Vice-Minister of the Environment in Colombia. In recent years he has served as a strategic, environmental and social advisor to companies and organizations in the United States,fields of hydrocarbons, mining, energy, forestry, environmental and agribusiness through the United Kingdom and in Latin America. Some of his prior experience includes having served in senior audit and internal control roles for BP as well as nine years of experience at one of the big four International Audit firms. Mr. Rey earned a bachelor’s degree in Public Accounting and an MBA from the Universidade de Los Andes and Cidenal with FFMM in Colombia.consulting firm Optim Consulting.
Ingrid Lorena DumezAlberto Consuegra Granger (57)(47) joined Ecopetrol in 2000 and has headed the Ethics and Compliance Office since its creation. Mrs. Dumez’s responsibilities include overseeing the promotion of corporate ethical values and the prevention of corruption, fraud, money laundering and terrorist financing.
Andres Macias Franco (41) is the acting Head of the Disciplinary Control Office. He has more than 15 years of experience within disciplinary issues; 10 of those years having been spent at Ecopetrol and 5 years between the Central Board of Accountants and the Administrative Department of Security (DAS). He holds a Law degree with a specialization in Public Law from Autonoma de Bucaramanga University as well as a specialization degree in Labor Law at Pontificia Universidad Javeriana. In 2010, Mr. Franco attended the training course for judges and magistrates of the Republic of Colombia. Mr. Franco also worked as a professor of Collective Labor Law at Universidad Cooperativa de Colombia in Barrancabermeja.
Bernardo Castro (51) has served as CommercialVice-President of Supply and Marketing Deputy Vice-PresidentServices since February 15, 2015.August 2016. Mr. CastroConsuegra holds a degree in MechanicalCivil Engineering from Cartagena University and has a master’s degree in Pavements and Construction Management from Texas A&M University. His latest position was Vice-President of Exploration and Production at Equion Energia Limited, where he also served as the Vice-President for Projects and Production. Alberto began his professional career in 1984 by working for Morrison Knudsen International as a contract coordinator during the construction of the Cerrejon project. In 1993 he joined Ecopetrol, working in the project group, afterwards, he went on to BP Exploration, where he worked for 16 years starting as a contract coordinator, then as procurement and contract manager, then human resource manager for the Andean area, and finally as leader of the Colombian Performance Unit.
| 146 |
Mónica Jiménez González (41) has served as Secretary General of Ecopetrol SA since July 2016. Ms. Jiménez holds a law degree from University of the Andes (Bogotá) and has been allowed to practice as a foreign lawyer in Canada. She holds a post-graduate degree in Civil and State Responsibility from the Universidad Externado de AmericaColombia and a specialization degreeMaster of Science in Hydrocarbons ManagementDevelopment Studies from Universidad Industrial de Santander. He hasthe London School of Economics and Political Science (LSE). Before studying abroad, Ms. Jimenez worked in Ecopetrol foras a lawyer at a Colombian law firm and then as lawyer advising the last 26 years and has worked in maintenance, planning and costs and budget divisions within the company. He has also served in the Coordination of Operations DepartmentMinister and the Economics DepartmentDeputy Minister of Reficar, and the Investment Management and Budget division within Ecopetrol S.A. Mr. Castro hasDefense of Colombia in matters related to international law. Prior to returning to Colombia, she lived in Canada for 13 years, time during which she worked as the Manager of Operational Planning for the last 4 yearsa lawyer in a boutique law firm specialized in international law and then, in a major Canadian law firm in Vancouver, BC.
None of our Directors or executive officers has any familial relationship with any directorDirector or executive officer.
| Compensation of Directors and Management |
Based on a resolution adopted at our annual shareholders’ meeting in 2012, compensation for directors’Directors’ attendance in person at meetings of the Board of Directors and/or committee meetings increased from the equivalent of four to six minimum monthly wage salaries, which totals approximately Ps$3.7COP$4.1 million for 20142016 and Ps$COP$3.9 million for 2015. Fees for attendance at virtual meetings are set at 50% of the in-person meeting fee.
The total compensation paid to our Directors, executive officers and senior management active as of December 31, 2016 during 20142016 amounted to Ps$9.1 billion.COP$13,901 million.
Our Directors are notOnly one of our executive officers is eligible to receive pension and retirement benefits from us. The total amount set aside to provide pension and retirement benefits to our eligible executive officers totals Ps$13.4 billion.COP$4,674 million.
| Share Ownership of Directors and Executive Officers |
No individual Director or executive officer beneficially owns more than 1% of our outstanding shares.
Table 59 –The following Directors and executive officers own shares of Ecopetrol:
| Director | Shares | % | ||||||
| Joaquín Moreno Uribe | 127,988 | 0.0003113 | % | |||||
| Mauricio Cárdenas Santamaría | 2,000 | 0.0000049 | % | |||||
| Juan Carlos Echeverry Garzón | 33,420 | 0.0000813 | % | |||||
| Executive Officer | Shares | % | ||||||
| Héctor Manosalva | 49,380 | 0.0001201 | % | |||||
| Rafael Espinosa Rozo | 7,200 | 0,0000175 | % |
Under Colombian law, all of our shareholders have the same economic privileges and voting rights.
| Controls and Procedures |
Disclosure Controls and Procedures
As required by Rules 13a-15(e) and 15d-15(e) under the Securities Exchange Act of 1934, as of December 31, 2014,2016, we evaluated the design and effectiveness of our financial disclosure controls and procedures under the supervision and participation of our management, including our Chief Executive Officer and Chief Financial Officer. There are inherent limitations to the effectiveness of any system of disclosure controls and procedures, including the possibility of human error and the circumvention or overriding of the controls and procedures. Accordingly, even if effective, disclosure controls and procedures can only provide reasonable assurance of achieving their control objectives.
| 147 |
Based upon this evaluation, our Chief Executive Officer and Chief Financial Officer concluded that as of the end of the period covered by this annual report, our disclosure controls and procedures were effective to provide reasonable assurance that the information required to be disclosed in the reports that we file and submit under the Securities Exchange Act of 1934 is recorded, summarized and reported as and when required and is accumulated and communicated to our management, including our Chief Executive Officer and Chief Financial Officer, or persons performing similar functions, as appropriate to allow timely decisions regarding required disclosure.]
Management’s Annual Report on Internal Control over Financial Reporting
Our management is responsible for establishing and maintaining adequate internal control over financial reporting as defined in Rules 13a-15(f) and 15(d)-15(f) under the Securities Exchange Act of 1934. Our internal control over financial reporting is a process designed under the supervision of our Chief Executive Officer and Chief Financial Officer, and affected by our board of directors, management and other personnel, to provide reasonable assurance regarding the reliability of financial reporting and the preparation of our financial statements for external reporting purposes in accordance with generally accepted accounting principles, and it includes those policies and procedures that:
• pertain to the maintenance of records that, in reasonable detail, accurately and fairly reflect transactions and dispositions of our assets;
| · | pertain to the maintenance of records that, in reasonable detail, accurately and fairly reflect transactions and dispositions of our assets; |
• provide reasonable assurance that transactions are recorded as necessary to permit preparation of financial statements in accordance with generally accepted accounting principles, and that receipts and expenditures are being made only in accordance with authorization of our management and directors; and
| · | provide reasonable assurance that transactions are recorded as necessary to permit preparation of financial statements in accordance with generally accepted accounting principles, and that receipts and expenditures are being made only in accordance with authorization of our management and directors; and |
• provide reasonable assurance regarding prevention or timely detection of unauthorized acquisition, use or disposition of our assets that could have a material effect on our financial statements.
| · | provide reasonable assurance regarding prevention or timely detection of unauthorized acquisition, use or disposition of our assets that could have a material effect on our financial statements. |
Because of its inherent limitations, internal control over financial reporting may not prevent or detect misstatements. Therefore, effective control over financial reporting cannot, and does not, provide absolute assurance of achieving our control objectives. Also, projection of any evaluation of the effectiveness of the internal controls to future periods is subject to the risk that controls may become inadequate because of changes in conditions or that the degree of compliance with the policies or procedures may deteriorate.
As of the year ended December 31, 2014,2016, our management conducted an assessment of the effectiveness of our internal control over financial reporting in accordance with the criteria established in the publication “Internal Control – Integrated Framework (2013)”, issued by the Committee of the Sponsoring Organizations of the Treadway Commission, (COSO), as well as the rules set by the SEC in its Final Rule “Management’s Report on Internal Control Over Financial Reporting and Certification of Disclosure in Exchange Act Periodic Reports.”
Based on the assessment performed, management concluded that our internal control over financial reporting was effective as of the end of the period covered by this annual report.
The effectiveness of our internal control over financial reporting has been audited by PricewaterhouseCoopers Ltda.Ernst & Young Audit S.A.S., an independent registered public accounting firm, as stated in their audit report accompanying our consolidated financial statements.
Audit and Non-Audit Fees
Our consolidated financial statements for the fiscal yearsyear ended December 31, 2014 and December 31, 20132016 were audited by PricewaterhouseCoopers Ltda. and ourErnst & Young Audit S.A.S. Our consolidated financial statements for the fiscal years ended December 31, 2015 were audited by PricewaterhouseCoopers Ltda.
| 148 |
The following table sets forth the fees billed to us by Ernst & Young Audit S.A.S. during the fiscal year ended December 31, 2012 were audited2016.
Table 60 – Fees Billed to us by KPMG Ltda.Ernst & Young Audit S.A.S.
| As of December 31, | ||||
| 2016 | ||||
| (in millions of Colombian Pesos, excluding 16% value added tax) | ||||
| Audit fees | 7,800 | |||
| Audit-related fees | 538 | |||
| Tax fees | 916 | |||
| All other fees | - | |||
| Total | 9,254 | |||
Audit Fees. The audit fees listed in the table above are the aggregated fees billed by Ernst & Young Audit S.A.S. in connection with their audits of our annual consolidated financial statements (IFRS), interim consolidated financial statements (under IFRS), statutory audits of Ecopetrol S.A. and its consolidated subsidiaries and some of its associate entities (under local GAAP) and review of periodic documents filed with the SEC. In addition, these audit fees include fees related to our independent auditors’ audits of our internal controls over financial reporting.
Audit-related Fees. The audit-related fees listed in the table above are the fees billed by Ernst & Young Audit S.A.S. in connection with their agreed-upon procedures of our variable compensation bonus system and its review procedures in connection with the offering document related to the SEC-registered bonds we reopened in 2016.
Tax Fees. The tax fees listed in the table above correspond to (i) advising some subsidiaries about the tax consequences associated with new or proposed legislation, and (ii) rendering advice to some subsidiaries on the likely tax consequences of proposed transactions and the appropriate methods of structuring and reporting.
The following table sets forth the fees billed to us by PricewaterhouseCoopers Ltda. during the fiscal year ended December 31, 2014.2015.
Table 61 – Fees Billed to us by PricewaterhouseCoopers Ltda.
| 2015 | ||||
| (in millions of Colombian Pesos, excluding 16% value added tax) | ||||
| Audit fees | ||||
| Audit-related fees | ||||
| Tax fees | ||||
| All other fees(1) | ||||
| Total | ||||
| (1) | These fees are comprised of coaching sessions in management skills dictated to officers of some affiliates as well as participation in open training courses. |
Audit Fees. The audit fees listed in the table above are the aggregated fees billed by PricewaterhouseCoopers Ltda. in connection with their audits of our annual consolidated financial statements (under Colombian Government Entity GAAP and U.S. GAAP)(IFRS), interim consolidated financial statements (under Colombian Government Entity GAAP), audits of subsidiaries (under local GAAP) and periodic review of documents filed with the SEC. In addition, these audit fees include fees related to our independent auditors’ audits of our internal controls over financial reporting.
Audit-related Fees. The audit-related fees listed in the table above are those fees billed by PricewaterhouseCoopers Ltda. in connection with their agreed-upon audit procedures of our variable compensation bonus system.
Tax Fee. The tax fees listed in the table above correspond to (1) assisting some subsidiaries in the preparation of the income tax return and information submitted in magnetic means, (2) preparation of the income tax returns and information for submission in magnetic means for some expatriate officers of the Company, and (3) review of compliance with transfer pricing obligations.
The following table sets forth the fees billed to us by PricewaterhouseCoopers Ltda. during the fiscal year ended December 31, 2013 and KPMG Ltda. during the fiscal year ended 2012.
| As of December 31, | ||||||||
| 2013 PricewaterhouseCoopers Ltda | 2012 KPMG Ltda | |||||||
| (in millions of pesos, excluding 16% value added tax) | ||||||||
| Audit fees | 7,029 | 6,548 | ||||||
| Audit-related fees | 378 | 225 | ||||||
| Tax fees | 151 | 295 | ||||||
| All other fees(1) | 384 | 3,384 | ||||||
| Total | 7,942 | 10,452 | ||||||
Audit Fees. The audit fees listed in the table above are the aggregated fees billed by KPMG Ltda. in connection with their audits of our annual consolidated financial statements (under Colombian Government Entity GAAP and U.S. GAAP), interim consolidated financial statements (under Colombian Government Entity GAAP)IFRS), subsidiary audits (under local GAAP) and review of periodic documents filed with the SEC. In addition, these audit fees include fees related to our independent auditors’ audits of our internal controls over financial reporting.
Audit-related Fees. The audit-related fees listed in the table above are the fees billed by KPMGPricewaterhouseCoopers Ltda. in connection with their agreed-upon procedures of our variable compensation bonus system.
system as well as the audit of the joint operation agreement of ECP Oil and Gas Germany GmbH.
Tax FeeFees. The tax fees listed in the table above correspond to (1) assisting some subsidiaries in the preparation and filing of appropriate tax returns with the tax authorities (including electronic filings), (2) advising some subsidiaries about the tax consequences associated with new or proposed legislation and (3) rendering advice to some subsidiaries on the likely tax consequences of proposed transactions and the appropriate methods of structuring and reporting.
| 149 |
Changes in Internal Control over Financial Reporting
There were no changes made in our internal control over financial reporting during the year ended December 31, 20142016 that have materially affected or are reasonably likely to materially affect the Company’s internal controls over financial reporting.
Attestation Report of the Registered Public Accounting Firm
Pricewaterhousecoopers Ltda.Ernst & Young Audit S.A.S.’s attestation report on our internal control over financial reporting is included in their audit report accompanying our consolidated financial statements. SeeReport of Independent Registered Public Accounting Firm—PricewaterhouseCoopers LtdaFirm, to the consolidated financial statements.
Significant Changes
For a description of significant events since December 31, 2014,2016, please see Note 31—36 – Subsequent events, toeventsto our consolidated financial statements.
| 150 |
| 8. | Financial Statements |
Ecopetrol S.A. and Subsidiaries
S. A.
Consolidated Financial Statements
YearsAt December 31, 2016 and 2015 and for three years ended December 31, 2014, 20132016, 2015 and 2012
Ecopetrol S.A. and Subsidiaries2014
Consolidated Financial Statements
| 151 |
Index
Years ended December 31, 2014, 2013 and 2012
Contents
| F-1 |
Report of Independent Registered Public Accounting Firm
To theThe Board of Directors
and Shareholders of Ecopetrol S.A. and subsidiaries
In our opinion,We have audited the accompanying consolidated balance sheetsstatement of financial position of Ecopetrol S.A. and subsidiaries as of December 31, 2016 and the related consolidated statements of financial, economic, social and environmental activities, ofprofit or loss, other comprehensive income, changes in shareholders’ equity and of cash flows for the year ended December 31, 2016. These financial statements are the responsibility of the Company’s management. Our responsibility is to express an opinion on these financial statements based on our audit.
We conducted our audit in accordance with the standards of the Public Company Accounting Oversight Board (United States). Those standards require that we plan and perform the audit to obtain reasonable assurance about whether the financial statements are free of material misstatement. An audit includes examining, on a test basis, evidence supporting the amounts and disclosures in the financial statements. An audit also includes assessing the accounting principles used and significant estimates made by management, as well as evaluating the overall financial statement presentation. We believe that our audit provide a reasonable basis for our opinion.
In our opinion, the financial statements referred to above present fairly, in all material respects, the consolidated financial position of Ecopetrol S.A. and its subsidiaries (the “Company”) at December 31, 20142016, and 2013, and the consolidated results of their operations and their cash flows for the two yearsyear ended December 31, 20142016, in conformity with generally accepted accounting principles for Colombian Government EntitiesInternational Financial Reporting Standards as issued by the Contaduría General de la Nación. AlsoInternational Accounting Standards Board.
We also have audited, in our opinion,accordance with the standards of the Public Company maintained, in all material respects, effectiveAccounting Oversight Board (United States), Ecopetrol S.A. and its subsidiaries’ internal control over financial reporting as of December 31, 2014,2016, based on criteria established in Internal Control - IntegratedControl-Integrated Framework 2013 issued by the Committee of Sponsoring Organizations of the Treadway Commission (COSO)“(2013 framework)” and our report dated May 30, 2017 expressed an unqualified opinion thereon.
/s/ Ernst & Young Audit S.A.S.
Bogota, Colombia
May 30, 2017
| F-2 |
Report of Independent Registered Public Accounting Firm
The Board of Directors and Shareholders of Ecopetrol S.A. and subsidiaries
We have audited Ecopetrol S.A. and subsidiaries’ internal control over financial reporting as of December 31, 2016, based on criteria established in Internal Control—Integrated Framework issued by the Committee of Sponsoring Organizations of the Treadway Commission “(2013 framework)” (the COSO criteria). The Company'sEcopetrol S.A. and subsidiaries’ management is responsible for these financial statements, for maintaining effective internal control over financial reporting, and for its assessment of the effectiveness of internal control over financial reporting included in Item 7.8. of this Form 20-F as December 31, 2014.the accompanying Management’s Annual Report on Internal Control over Financial Reporting. Our responsibility is to express opinions on these financial statements andan opinion on the Company'sEcopetrol S.A. and subsidiaries’ internal control over financial reporting based on our integrated audits. audit.
We conducted our auditsaudit in accordance with the standards of the Public Company Accounting Oversight Board (United States). Those standards require that we plan and perform the auditsaudit to obtain reasonable assurance about whether the financial statements are free of material misstatement and whether effective internal control over financial reporting was maintained in all material respects. Our audits of the financial statements included examining, on a test basis, evidence supporting the amounts and disclosures in the financial statements, assessing the accounting principles used and significant estimates made by management, and evaluating the overall financial statement presentation. Our audit of internal control over financial reporting included obtaining an understanding of internal control over financial reporting, assessing the risk that a material weakness exists, and testing and evaluating the design and operating effectiveness of internal control based on the assessed risk. Our audits also includedrisk, and performing such other procedures as we considered necessary in the circumstances. We believe that our audits provideaudit provides a reasonable basis for our opinions.
Generally accepted accounting principles for Colombian Government Entities vary in certain significant respects from accounting principles generally accepted in the United States of America. Information relating to the nature and effect of such differences is presented in Note 33 to the consolidated financial statements.opinion.
A company’s internal control over financial reporting is a process designed to provide reasonable assurance regarding the reliability of financial reporting and the preparation of financial statements for external purposes in accordance with generally accepted accounting principles. A company’s internal control over financial reporting includes those policies and procedures that (i)(1) pertain to the maintenance of records that, in reasonable detail, accurately and fairly reflect the transactions and dispositions of the assets of the company; (ii)(2) provide reasonable assurance that transactions are recorded as necessary to permit preparation of financial statements in accordance with generally accepted accounting principles and that receipts and expenditures of the company are being made only in accordance with authorizations of management and directors of the company; and (iii)(3) provide reasonable assurance regarding prevention or timely detection of unauthorized acquisition, use, or disposition of the company’s assets that could have a material effect on the financial statements.
Because of its inherent limitations, internal control over financial reporting may not prevent or detect misstatements. Also, projections of any evaluation of effectiveness to future periods are subject to the risk that controls may become inadequate because of changes in conditions, or that the degree of compliance with the policies or procedures may deteriorate.
/s/ PricewaterhouseCoopers Ltda.In our opinion, Ecopetrol S.A. and subsidiaries maintained, in all material respects, effective internal control over financial reporting as of December 31, 2016, based on the COSO criteria.
BogotáWe also have audited, in accordance with the standards of the Public Company Accounting Oversight Board (United States), the consolidated statements of financial position of Ecopetrol S.A. and subsidiaries as of December 31, 2016 and the related consolidated statements of profit or loss, other comprehensive income, changes in equity and cash flows for the year ended December 31, 2016 of Ecopetrol S.A. and subsidiaries and our report dated May 30, 2017 expressed an unqualified opinion thereon.
/s/ Ernst & Young Audit S.A.S.
Bogota, Colombia
April 28, 2015May 30, 2017
| F-3 |
Report of Independent Registered Public Accounting Firm
To the Board of Directors and
And Shareholders of
Ecopetrol S.A.:S. A.
We have auditedIn our opinion, the accompanying consolidated balance sheetsstatement of Ecopetrol S.A. and subsidiaries (the “Company”) as of December 31, 2012,financial position and the related consolidated statementsstatement of Financial, Economic, Socialprofit and Environmental Activities, Changesloss, other comprehensive income, changes in Stockholders’ Equity,equity and Cash Flowscash flows present fairly, in all material respects, the financial position of Ecopetrol S. A. and its subsidiaries (the ¨Company¨) at December 31, 2015, and the results of their operations and their cash flows for each of the yeartwo years in the period ended December 31, 2012.2015 in conformity with International Financial Reporting Standards as issued by the International Accounting Standards Board. These financial statements are the responsibility of the Company’s management. Our responsibility is to express an opinion on these consolidated financial statements based on our audits.
We conducted our audits of these statements in accordance with the standards of the Public Company Accounting Oversight Board (United States). Those standards require that we plan and perform the auditsaudit to obtain reasonable assurance about whether the financial statements are free of material misstatement. Our audits of the consolidated financial statements includedAn audit includes examining, on a test basis, evidence supporting the amounts and disclosures in the financial statements, assessing the accounting principles used and significant estimates made by management, and evaluating the overall financial statement presentation. Our audits also included performing such other procedures as we considered necessary in the circumstances. We believe that our audits provide a reasonable basis for our opinion.
In our opinion,As discussed in Note 2.8 to the consolidated financial statements, referred to above present fairly, in all material respects, the financial position of the Company ashas elected to change the manner in which it presents dry wells in the consolidated statements of December 31, 2012 and the results of its operations and its cash flows for the years then ended, in conformity with accounting principles generally accepted in Colombia, promulgated by the National Accounting Office (Contaduría General de la Nación or CGN).2016.
Accounting principles generally accepted for Colombian Government Entities vary in certain significant respects from accounting principles generally accepted in the United States of America. Information relating to the nature and effects of such differences is presented in Note 33 to the consolidated financial statements.
/s/ KPMGPricewaterhouseCoopers Ltda.
Bogotá, Colombia
April 29, 201328, 2016, except for the change in the manner in which the company presents dry wells in the consolidated statements of cash flows in 2016 as discussed in Note 2.8 to the consolidated financial statements, as to which the date is May 30, 2017.
| F-4 |
ECOPETROL S. A. and SubsidiariesEcopetrol S.A.
Consolidated Balance Sheets
Asstatements of December 31, 2014 and December 31, 2013financial position
(ExpressedFigures expressed in millions of Colombian pesos)
| 2014 | 2013 | |||||||
| Assets | ||||||||
| Current assets: | ||||||||
| Cash and cash equivalents (Notes 2 and 3) | $ | 7,951,201 | $ | 8,841,438 | ||||
| Investments (Notes 2 and 4) | 1,087,439 | 1,883,235 | ||||||
| Accounts and notes receivable, net (Notes 2 and 5) | 4,109,054 | 6,176,891 | ||||||
| Inventories, net (Note 6) | 3,023,503 | 3,625,904 | ||||||
| Advances and deposits ( Notes 2 and 7) | 8,330,229 | 8,614,050 | ||||||
| Deferred tax assets | 53,908 | 27,732 | ||||||
| Prepaid expenses (Note 8) | 197,064 | 148,344 | ||||||
| Total current assets | $ | 24,752,398 | $ | 29,317,594 | ||||
| Long term assets: | ||||||||
| Investments (Notes 2 and 4) | 1,605,987 | 1,363,672 | ||||||
| Accounts and notes receivable, net (Note 5) | 857,630 | 520,056 | ||||||
| Advances and deposits (Notes 7) | 225,197 | 192,613 | ||||||
| Deposits held in trust (Note 9) | 508,259 | 468,794 | ||||||
| Property, plant and equipment, net (Note 10) | 50,656,194 | 40,150,534 | ||||||
| Natural and environmental resources, net (Note 11) | 31,660,175 | 27,071,381 | ||||||
| Deferred charges (Note 12) | 2,724,176 | 2,872,435 | ||||||
| Other assets (Notes 2 and 13) | 3,006,929 | 3,509,819 | ||||||
| Valuations | 26,184,346 | 26,961,096 | ||||||
| Total assets | 142,181,291 | 132,427,994 | ||||||
| Liabilities and shareholders' Equity | ||||||||
| Current liabilities: | ||||||||
| Financial obligations (Notes 2 and 14) | 1,789,320 | 774,559 | ||||||
| Accounts payable (Notes 2 and 15) | 8,968,120 | 9,472,824 | ||||||
| Taxes, contributions and duties payable (Note 16) | 7,088,490 | 9,183,501 | ||||||
| Labor and pension liabilities (Note 17) | 369,205 | 289,628 | ||||||
| Estimated liabilities and provisions (Notes 2 and 18) | 2,173,242 | 2,515,005 | ||||||
| Total current liabilities | 20,388,377 | 22,235,517 | ||||||
| Long term liabilities: | ||||||||
| Financial obligations (Notes 2 and 14) | 33,859,657 | 21,423,992 | ||||||
| Accounts payable (Notes 2 and 15) | 219,370 | 591,998 | ||||||
| Labor and pension liabilities (Note 17) | 4,574,158 | 4,277,831 | ||||||
| Estimated liabilities and provisions (Note 18) | 6,937,470 | 5,163,819 | ||||||
| Other long-term liabilities (Note 19) | 3,460,352 | 3,041,886 | ||||||
| Total liabilities | 69,439,384 | 56,735,043 | ||||||
| Non-controlling interest (Note 20) | 4,195,935 | 4,573,748 | ||||||
| Shareholders' equity | ||||||||
| (Note 21 and see attached statement) | 68,545,972 | 71,119,203 | ||||||
| Total liabilities and Shareholders' Equity | 142,181,291 | 132,427,994 | ||||||
| Memorandum accounts | ||||||||
| Debtors (Note 22) | 172,448,043 | 152,210,701 | ||||||
| Creditors (Note 22) | $ | (149,920,013 | ) | $ | (111,774,620 | ) | ||
| As of December 31, | ||||||||||
| Notes | 2016 | 2015 | ||||||||
| Assets | ||||||||||
| Current assets | ||||||||||
| Cash and cash equivalents | 6 | 8,410,467 | 6,550,450 | |||||||
| Trade and other receivables, net | 7 | 4,212,701 | 3,427,412 | |||||||
| Inventories, net | 8 | 3,841,901 | 3,057,958 | |||||||
| Other financial assets | 9 | 5,315,537 | 329,227 | |||||||
| Tax assets | 10 | 1,129,098 | 4,501,734 | |||||||
| Equity instruments measured at fair value | 11 | 51,610 | 913,488 | |||||||
| Other current assets | 12 | 1,035,632 | 1,090,324 | |||||||
| 23,996,946 | 19,870,593 | |||||||||
| Assets held for sale | 13 | 132,216 | 242,745 | |||||||
| Total current assets | 24,129,162 | 20,113,338 | ||||||||
| Non-current assets | ||||||||||
| Investments in associates and joint ventures | 14 | 1,552,694 | 1,931,934 | |||||||
| Trade and other receivables, net | 7 | 729,410 | 584,571 | |||||||
| Property, plant and equipment | 15 | 62,328,502 | 65,105,073 | |||||||
| Natural and environmental resources | 16 | 22,341,047 | 24,043,297 | |||||||
| Intangibles | 18 | 272,132 | 388,051 | |||||||
| Deferred tax assets | 10 | 5,726,961 | 8,239,472 | |||||||
| Other financial assets | 9 | 1,371,358 | 1,256,152 | |||||||
| Goodwill | 19 | 1,159,922 | 1,159,922 | |||||||
| Other non-current assets | 12 | 826,736 | 766,380 | |||||||
| Total non-current assets | 96,308,762 | 103,474,852 | ||||||||
| Total assets | 120,437,924 | 123,588,190 | ||||||||
| Liabilities | ||||||||||
| Current liabilities | ||||||||||
| Loans and borrowings | 20 | 4,126,203 | 4,573,620 | |||||||
| Trade and other payables | 21 | 6,854,363 | 7,757,277 | |||||||
| Provisions for employee benefits | 22 | 1,974,496 | 1,392,266 | |||||||
| Tax liabilities | 10 | 2,130,940 | 2,803,559 | |||||||
| Accrued liabilities and provisions | 23 | 821,954 | 653,497 | |||||||
| Other financial liabilities | - | 101,319 | ||||||||
| Other liabilities | 439,274 | 144,441 | ||||||||
| 16,347,230 | 17,425,979 | |||||||||
| Liabilities related to assets held for sale | 13 | 40,128 | 17,628 | |||||||
| Total current liabilities | 16,387,358 | 17,443,607 | ||||||||
| Non-current liabilities | ||||||||||
| Loans and borrowings | 20 | 48,095,824 | 48,649,718 | |||||||
| Trade and other payables | 21 | 23,893 | 6 | |||||||
| Provisions for employee benefits | 22 | 3,901,082 | 2,459,849 | |||||||
| Deferred tax liabilities | 10 | 3,118,650 | 6,026,050 | |||||||
| Accrued liabilities and provisions | 23 | 5,095,916 | 5,423,850 | |||||||
| Other non-current liabilities | 254,700 | 484,147 | ||||||||
| Total non-current liabilities | 60,490,065 | 63,043,620 | ||||||||
| Total liabilities | 76,877,423 | 80,487,227 | ||||||||
| Equity | ||||||||||
| Ecopetrol shareholders’ equity | 24 | 42,026,858 | 41,225,908 | |||||||
| Non-controlling interests | 1,533,643 | 1,875,055 | ||||||||
| Total equity | 43,560,501 | 43,100,963 | ||||||||
| Total liabilities and equity | 120,437,924 | 123,588,190 | ||||||||
The accompanying notes are an integral part of the Consolidated Financial Statements
ECOPETROL S. A.and Subsidiaries
Consolidated Statements of Financial, Economic, Social and Environmental Activities
For the years ended December 31, 2014, 2013 and 2012
(Expressed in millions of Colombian pesos, except for earnings per share which is expressed in Colombian pesos)
| 2014 | 2013 | 2012 | ||||||||||
| Revenues (Note 23): | ||||||||||||
| Domestic sales | 26,715,013 | 26,207,900 | 24,361,913 | |||||||||
| Foreign sales | 42,210,325 | 44,220,815 | 44,490,089 | |||||||||
| Total revenues | 68,925,338 | 70,428,715 | 68,852,002 | |||||||||
| Cost of sales (Note 24) | 45,054,016 | 42,554,282 | 40,535,508 | |||||||||
| Gross margin | 23,871,322 | 27,874,433 | 28,316,494 | |||||||||
| Operating expenses (Note 25) | ||||||||||||
| Administration | 1,677,391 | 1,455,717 | 874,980 | |||||||||
| Operation and projects | 5,591,942 | 4,583,986 | 4,098,610 | |||||||||
| Operating income | 16,601,989 | 21,834,730 | 23,342,904 | |||||||||
| Non-operating income (expenses): | ||||||||||||
| Financial Income (expenses), net (Note 26) | (671,490 | ) | 45,652 | (167,889 | ) | |||||||
| Pension expenses (Note 27) | (555,246 | ) | (478,737 | ) | (948,455 | ) | ||||||
| Inflation gain | - | 156 | 97,663 | |||||||||
| Other income (expenses), net (Note 28) | 45,494 | 480,407 | 7,478 | |||||||||
| Income before income tax and non-controlling interest | 15,420,747 | 21,882,208 | 22,331,701 | |||||||||
| Current income tax (Note 16) | 6,731,655 | 8,291,572 | 7,095,874 | |||||||||
| Deferred income tax (Note 16) | 403,413 | (202,733 | ) | 37,521 | ||||||||
| Income before non-controlling interest | 8,285,679 | 13,793,369 | 15,198,306 | |||||||||
| Non-controlling interest | (775,409 | ) | (686,866 | ) | (419,359 | ) | ||||||
| Net income for the year | 7,510,270 | 13,106,503 | 14,778,947 | |||||||||
| Earnings per share | 182.66 | 318.76 | 359.44 | |||||||||
The accompanying notes are an integral part of the Consolidated Financial Statements
| F-5 |
ECOPETROL S. A. and SubsidiariesEcopetrol S.A.
Consolidated Statementstatements of Changes in Shareholders´ Equity
For the twelve-month periods ended December 31, 2014 and 2013.profit or loss
(ExpressedFigures expressed in millions of Colombian pesos, except for the dividendnet earnings (loss) per share, which is expressed in Colombian pesos)
| Subscribed and paid-in capital | Additional paid-in capital | Legal and other reserves | Incorporated institutional equity | Equity method surplus | Valuation Surplus | Public Accounting regime | Accumulated retained earnings | Total shareholders' equity | ||||||||||||||||||||||||||||
| Balance as of December 31, 2012 | 10,279,175 | 6,954,247 | 12,292,735 | 174,080 | 824,701 | 19,775,661 | (16,231 | ) | 14,456,513 | 64,740,881 | ||||||||||||||||||||||||||
| Distribution of dividends ($291 per share) | - | - | - | - | - | - | - | (11,964,960 | ) | (11,964,960 | ) | |||||||||||||||||||||||||
| Additional paid-in capital receivable | - | 45 | - | - | - | - | - | - | 45 | |||||||||||||||||||||||||||
| Additional paid-in capital - called in guarantees | - | 82 | - | - | - | - | - | - | 82 | |||||||||||||||||||||||||||
| Valuation surplus | - | - | - | - | - | 4,830,558 | - | - | 4,830,558 | |||||||||||||||||||||||||||
| Property, plant and equipment revaluation | - | - | - | - | - | - | 1,363 | - | 1,363 | |||||||||||||||||||||||||||
| Regulatory Decree 2336/95 reserve appropriation | - | - | 215,407 | - | - | - | - | (215,407 | ) | - | ||||||||||||||||||||||||||
| Corporate Group unrealized reserve appropriation | - | - | 3,461,741 | - | - | - | - | (3,461,741 | ) | - | ||||||||||||||||||||||||||
| Appropriation of reserves for new explorations. | - | - | 2,595,112 | - | - | - | - | (2,595,112 | ) | - | ||||||||||||||||||||||||||
| Appropriation of reserves for investment projects | - | - | 2,628,878 | - | - | - | - | (2,628,878 | ) | - | ||||||||||||||||||||||||||
| Appropriation of reserves for infill drilling campaign | - | - | 1,260,000 | - | - | - | - | (1,260,000 | ) | - | ||||||||||||||||||||||||||
| Release of the Regulatory Decree 2336/95 reserves for the previous year | - | - | (1,829,362 | ) | - | - | - | - | 1,829,362 | - | ||||||||||||||||||||||||||
| Release of the Corporate Group's unrealized reserves from prior years | - | - | (2,595,112 | ) | - | - | - | - | 2,595,112 | - | ||||||||||||||||||||||||||
| Release transportation infrastructure integrity strengthening reserve | - | - | (605,135 | ) | - | - | - | - | 605,135 | - | ||||||||||||||||||||||||||
| Release of the Corporate Group's unrealized reserves | - | - | (2,123,538 | ) | - | - | - | - | 2,123,538 | - | ||||||||||||||||||||||||||
| Equity method surplus exchange rate adjustment | - | - | - | - | 404,504 | - | - | - | 404,504 | |||||||||||||||||||||||||||
| Incorporated institutional equity adjustment | - | - | - | 227 | - | - | - | - | 227 | |||||||||||||||||||||||||||
| Net income for the period | - | - | - | - | - | - | - | 13,106,503 | 13,106,503 | |||||||||||||||||||||||||||
| Balance as of December 31, 2013 | 10,279,175 | 6,954,374 | 15,300,726 | 174,307 | 1,229,205 | 24,606,219 | (14,868 | ) | 12,590,065 | 71,119,203 | ||||||||||||||||||||||||||
| Distribution of dividends ($260 per share) | - | - | - | - | - | - | - | (10,690,342 | ) | (10,690,342 | ) | |||||||||||||||||||||||||
| Additional paid-in capital receivable | - | 41 | - | - | - | - | - | - | 41 | |||||||||||||||||||||||||||
| Additional paid-in capital - called in guarantees | - | 31 | - | - | - | - | - | - | 31 | |||||||||||||||||||||||||||
| Valuation surplus | - | - | - | - | - | (657,990 | ) | - | - | (657,990 | ) | |||||||||||||||||||||||||
| Property, plant and equipment impairment | - | - | - | - | - | - | 7,718 | - | 7,718 | |||||||||||||||||||||||||||
| Regulatory Decree 2336/95 reserve appropriation | - | - | 20,989 | - | - | - | - | (20,989 | ) | - | ||||||||||||||||||||||||||
| Corporate Group unrealized reserves appropriation from prior years | - | - | 3,169,024 | - | - | - | - | (3,169,024 | ) | - | ||||||||||||||||||||||||||
| Corporate Group unrealized reserves appropriation for the year | - | - | 2,159,429 | - | - | - | - | (2,159,429 | ) | - | ||||||||||||||||||||||||||
| Appropriation of reserves for new explorations | - | - | 3,855,112 | - | - | - | - | (3,855,112 | ) | - | ||||||||||||||||||||||||||
| Appropriation of reserves for future investments | - | - | 3,619,229 | - | - | - | - | (3,619,229 | ) | - | ||||||||||||||||||||||||||
| Release of the Regulatory Decree 2336/95 reserve for the previous year | - | - | (215,406 | ) | - | - | - | - | 215,406 | - | ||||||||||||||||||||||||||
| Release of the Corporate Group´s unrealized reserves from previous years | - | - | (3,461,742 | ) | - | - | - | - | 3,461,742 | - | ||||||||||||||||||||||||||
| Release for new explorations | - | - | (2,595,113 | ) | - | - | - | - | 2,595,113 | - | ||||||||||||||||||||||||||
| Release of reserve for investment projects | - | - | (2,628,878 | ) | - | - | - | - | 2,628,878 | - | ||||||||||||||||||||||||||
| Release for infill drilling campaign | - | - | (1,260,000 | ) | - | - | - | - | 1,260,000 | - | ||||||||||||||||||||||||||
| Equity method capital surplus exchange rate adjustment | - | - | - | - | 1,271,403 | - | - | - | 1,271,403 | |||||||||||||||||||||||||||
| Incorporated institutional equity adjustment | - | - | - | (14,362 | ) | - | - | - | - | (14,362 | ) | |||||||||||||||||||||||||
| Net income for the year | - | - | - | - | - | - | - | 7,510,270 | 7,510,270 | |||||||||||||||||||||||||||
| Balance as of December 31, 2014 | 10,279,175 | 6,954,446 | 17,963,370 | 159,945 | 2,500,608 | 23,948,229 | (7,150 | ) | 6,747,349 | 68,545,972 | ||||||||||||||||||||||||||
The accompanying notes are an integral part of the Consolidated Financial Statements
| For the years ended December 31, | ||||||||||||||
| Notes | 2016 | 2015 | 2014 | |||||||||||
| Sales revenue | 25 | 48,485,561 | 52,347,271 | 65,971,888 | ||||||||||
| Cost of sales (before impairment of non-current assets) | 26 | 34,251,423 | 36,994,516 | 42,975,128 | ||||||||||
| Gross profit (excluding impairment) | 14,234,138 | 15,352,755 | 22,996,760 | |||||||||||
| Administration expenses | 27 | 1,923,268 | 1,700,985 | 1,031,035 | ||||||||||
| Operation and project expenses | 27 | 2,751,687 | 4,034,268 | 5,520,325 | ||||||||||
| Impairment of non-current assets | 28 | 928,747 | 7,864,875 | 2,304,567 | ||||||||||
| Other operating income and (expenses), net | 29 | (274,112 | ) | (378,538 | ) | (308,194 | ) | |||||||
| Operating income | 8,904,548 | 2,131,165 | 14,449,027 | |||||||||||
| Financial result, net | 30 | |||||||||||||
| Financial income | 1,311,743 | 621,924 | 399,818 | |||||||||||
| Financial expenses | (3,463,540 | ) | (2,718,414 | ) | (1,640,294 | ) | ||||||||
| Foreign exchange gain (loss), net | 976,430 | (5,566,614 | ) | (2,270,193 | ) | |||||||||
| (1,175,367 | ) | (7,663,104 | ) | (3,510,669 | ) | |||||||||
| Share of profit (loss) of associates and joint ventures | 14 | 61,345 | (46,687 | ) | 166,070 | |||||||||
| Income before income tax expense | 7,790,526 | (5,578,626 | ) | 11,104,428 | ||||||||||
| Income tax expense | 10 | (4,543,046 | ) | (710,353 | ) | (5,434,855 | ) | |||||||
| Net income (loss) for the period | 3,247,480 | (6,288,979 | ) | 5,669,573 | ||||||||||
| Net income (loss) attributable to: | ||||||||||||||
| Company’s shareholders | 2,447,881 | (7,193,859 | ) | 5,046,517 | ||||||||||
| Non-controlling interests | 799,599 | 904,880 | 623,056 | |||||||||||
| 3,247,480 | (6,288,979 | ) | 5,669,573 | |||||||||||
| Earnings (loss) per share (basic and diluted) | 24.6 | 59.5 | (175.0 | ) | 122.7 | |||||||||
| F-6 |
ECOPETROL S. A. and SubsidiariesEcopetrol S.A.
Consolidated Statementsstatements of Cash Flows
For the twelve-month periods ended December 31, 2014 and 2013.other comprehensive income
(ExpressedFigures expressed in millions of Colombian pesos)
| December 2014 | December 2013 | December 2012 | ||||||||||
| Cash flows from operating activities: | ||||||||||||
| Net income for the year | 7,510,270 | 13,106,503 | 14,778,947 | |||||||||
| Adjustments to reconcile net income to cash provided by operating activities: | ||||||||||||
| Non-controlling interest | 775,409 | 686,866 | 419,359 | |||||||||
| Deferred income and CREE tax, net | 403,413 | (202,733 | ) | 37,521 | ||||||||
| Property, plant and equipment depreciation | 2,248,409 | 1,982,706 | 2,027,658 | |||||||||
| Exchange rate differences | 257,735 | (17,972 | ) | 309,130 | ||||||||
| Amortizations | 4,234,957 | 3,535,383 | 3,441,192 | |||||||||
| Provisions, net of recovery | 297,267 | 660,036 | 319,297 | |||||||||
| Pension liabilities (health and pension) | 308,584 | 226,244 | 869,491 | |||||||||
| Property, plant and equipment write-off | 315,157 | 27,233 | 127 | |||||||||
| Recovery of property, plant and equipment | - | (152,964 | ) | - | ||||||||
| Goodwill impairment | 182,631 | 353,012 | - | |||||||||
| Natural and environmental resource write-off | 852,060 | 843,228 | 34,191 | |||||||||
| Loss in investments valuation | 227,201 | 4,728 | 65,096 | |||||||||
| Profit in equity method investments | (44,914 | ) | (120,060 | ) | (125,277 | ) | ||||||
| Net changes in operating asset and liabilities: | ||||||||||||
| Accounts and notes receivable | 1,765,004 | (6,090,115 | ) | (2,522,804 | ) | |||||||
| Inventories | 567,950 | (465,611 | ) | (390,847 | ) | |||||||
| Deferred charges and other assets | 201,812 | 118,186 | 895,618 | |||||||||
| Accounts payable | 94,667 | 676,518 | 2,601,167 | |||||||||
| Taxes, contributions and duties payable | (2,159,387 | ) | 2,300,118 | (730,923 | ) | |||||||
| Labor and pension obligations | (70,303 | ) | (790,808 | ) | 34,632 | |||||||
| Estimated liabilities and provisions | (378,108 | ) | 1,085,193 | 116,552 | ||||||||
| Other long-term liabilities | (84,765 | ) | (242,930 | ) | (998,029 | ) | ||||||
| Net cash provided by operating activities | 17,505,049 | 17,522,761 | 21,182,098 | |||||||||
| Cash flows from investing activities: | ||||||||||||
| Payment and advance for the companie, net of acquired cash | - | - | ||||||||||
| Increase in investments | (5,684,018 | ) | (7,567,590 | ) | (14,911,124 | ) | ||||||
| Redemption and sale of investments | 7,106,487 | 11,933,852 | 13,772,436 | |||||||||
| Dividends received | 80,147 | 98,281 | 70,690 | |||||||||
| Investment in natural and environmental resources | (8,135,660 | ) | (6,267,691 | ) | (5,615,306 | ) | ||||||
| Additions to property, plant and equipment | (7,546,732 | ) | (7,957,123 | ) | (9,852,556 | ) | ||||||
| Proceeds from sales of natural resources | 734 | 100,790 | - | |||||||||
| Proceeds from sales of property, plant and equipment | 79,381 | (2,963 | ) | - | ||||||||
| Net cash used in investing operating activities | (14,099,661 | ) | (9,662,444 | ) | (16,535,860 | ) | ||||||
| Cash flows from financing activities: | ||||||||||||
| Non-controlling interests | (69,823 | ) | ||||||||||
| Financial obligations | �� | 7,153,041 | 7,492,632 | 5,110,249 | ||||||||
| Capitalizations | 41 | 82 | 10,390 | |||||||||
| Dividends paid by Ecopetrol S.A. | (12,000,234 | ) | (14,570,467 | ) | (8,419,332 | ) | ||||||
| Dividends paid by controlled entities | (558,016 | ) | - | - | ||||||||
| Net cash used in financing activities | (5,405,168 | ) | (7,077,753 | ) | (3,368,516 | ) | ||||||
| Net (decrease) increase in cash and cash equivalents | (1,999,780 | ) | 782,563 | 1,277,722 | ||||||||
| Exchange rate difference in cash and cash equivalents | 1,109,543 | 118,185 | (116,969 | ) | ||||||||
| Cash and cash equivalents at the beginning of the year | 8,841,438 | 7,940,690 | 6,779,937 | |||||||||
| Cash and cash equivalents at the end of the year | 7,951,201 | 8,841,438 | 7,940,690 | |||||||||
The accompanying notes are an integral part of the Consolidated Financial Statements.
| For the years ended December 31, | ||||||||||||||
| Notes | 2016 | 2015 | 2014 | |||||||||||
| Net income (loss) of the year | 3,247,480 | (6,288,979 | ) | 5,669,573 | ||||||||||
| Other comprehensive income | ||||||||||||||
| Items that may be reclassified subsequently to profit or loss (net of tax): | ||||||||||||||
| Unrealized gain (loss) on hedges: | ||||||||||||||
| Cash flow hedge for future exports | 31 | 461,424 | (217,291 | ) | - | |||||||||
| Hedge of a net investment in a foreign operation | 31 | (155,359 | ) | - | - | |||||||||
| Cash flow hedge with derivative instruments | 31 | 33,869 | (60,083 | ) | - | |||||||||
| Gain (loss) on equity instruments measured at fair value | 11 | 126,205 | (106,911 | ) | 76,435 | |||||||||
| Realized gain on proceeds from sales of equity instruments measured at fair value | (68,497 | ) | (19,405 | ) | - | |||||||||
| Foreign currency translation | (925,981 | ) | 5,979,644 | 3,398,374 | ||||||||||
| (528,339 | ) | 5,575,954 | 3,474,809 | |||||||||||
| Items that will not be reclassified subsequently to profit or loss (net of tax): | ||||||||||||||
| Remeasurement (loss) gain on defined benefit plans | (1,153,442 | ) | 1,404,602 | 743,793 | ||||||||||
| Others (losses) gains | (46,826 | ) | 58,643 | - | ||||||||||
| (1,200,268 | ) | 1,463,245 | 743,793 | |||||||||||
| Other comprehensive income | (1,728,607 | ) | 7,039,199 | 4,218,602 | ||||||||||
| Total comprehensive income | 1,518,873 | 750,220 | 9,888,175 | |||||||||||
| Attributable to: | ||||||||||||||
| Ecopetrol shareholders | 784,658 | (328,604 | ) | 9,114,221 | ||||||||||
| Non-controlling interests | 734,215 | 1,078,824 | 773,954 | |||||||||||
| 1,518,873 | 750,220 | 9,888,175 | ||||||||||||
| F-7 |
Ecopetrol S.A. and Subsidiaries
Notes to the Consolidated Financial Statements
Years ended December 31, 2014, 2013 and 2012statements of changes in equity
(ExpressedFigures expressed in millions of Colombian pesos)
| Notes | Subscribed and paid-in capital | Additional paid-in capital | Reserves (1) | Other comprehensive income | Retained earnings (1) | Equity attributable to Company’s shareholders | Non- controlling interests | Total equity | ||||||||||||||||||||||||||
| Balance as of December 31, 2015 | 25,040,067 | 6,607,699 | 5,546,570 | 10,846,004 | (6,814,432 | ) | 41,225,908 | 1,875,055 | 43,100,963 | |||||||||||||||||||||||||
| Net income | - | - | - | - | 2,447,881 | 2,447,881 | 799,599 | 3,247,480 | ||||||||||||||||||||||||||
| Dividends declared | (1,029,612 | ) | (1,029,612 | ) | ||||||||||||||||||||||||||||||
| Legal reserve used to offset previous year loss | 24 | - | - | (3,869,907 | ) | - | 3,869,907 | - | - | - | ||||||||||||||||||||||||
| Appropriation of reserves, net | - | - | (117,819 | ) | - | 117,819 | - | - | - | |||||||||||||||||||||||||
| Other movements | (23,637 | ) | (23,637 | ) | (6,086 | ) | (29,723 | ) | ||||||||||||||||||||||||||
| Other comprehensive income | ||||||||||||||||||||||||||||||||||
| Gain (loss) on hedging instruments: | ||||||||||||||||||||||||||||||||||
| Cash flow hedge for future exports | 31 | - | - | - | 461,424 | - | 461,424 | - | 461,424 | |||||||||||||||||||||||||
| Hedge of a net investment in a foreign operation | 31 | - | - | - | (155,359 | ) | - | (155,359 | ) | - | (155,359 | ) | ||||||||||||||||||||||
| Cash flow hedge with derivative instruments | - | - | - | 24,546 | - | 24,546 | 9,323 | 33,869 | ||||||||||||||||||||||||||
| Net fair value gain on equity instruments measured at fair value | 11 | - | - | - | 57,708 | - | 57,708 | - | 57,708 | |||||||||||||||||||||||||
| Foreign currency translation | - | - | - | (811,345 | ) | - | (811,345 | ) | (114,636 | ) | (925,981 | ) | ||||||||||||||||||||||
| Actuarial valuation losses | 22 | - | - | - | (1,153,442 | ) | - | (1,153,442 | ) | - | (1,153,442 | ) | ||||||||||||||||||||||
| Other movements | - | - | - | (46,826 | ) | - | (46,826 | ) | - | (46,826 | ) | |||||||||||||||||||||||
| Balance as of December 31, 2016 | 25,040,067 | 6,607,699 | 1,558,844 | 9,222,710 | (402,462 | ) | 42,026,858 | 1,533,643 | 43,560,501 | |||||||||||||||||||||||||
| Notes | Subscribed and paid-in capital | Additional paid-in capital | Reserves (1) | Other comprehensive income | Retained earnings (1) | Equity attributable to Company’s shareholders | Non- controlling interests | Total equity | ||||||||||||||||||||||||||
| Balance as of December 31, 2014 | 10,279,175 | 6,607,612 | 17,963,370 | 3,980,749 | 8,192,040 | 47,022,946 | 1,511,282 | 48,534,228 | ||||||||||||||||||||||||||
| Net income (loss) | - | - | - | - | (7,193,859 | ) | (7,193,859 | ) | 904,880 | (6,288,979 | ) | |||||||||||||||||||||||
| Dividends declared | 24 | - | - | - | - | (5,468,521 | ) | (5,468,521 | ) | (715,051 | ) | (6,183,572 | ) | |||||||||||||||||||||
| Appropriation of reserves, net | - | - | 2,344,095 | (2,344,095 | ) | - | ||||||||||||||||||||||||||||
| Capitalization of reserves | 14,760,895 | - | (14,760,895 | ) | - | - | - | - | - | |||||||||||||||||||||||||
| Other movements | (3 | ) | 87 | - | - | 3 | 87 | - | 87 | |||||||||||||||||||||||||
| Other comprehensive income | ||||||||||||||||||||||||||||||||||
| Loss on hedging instruments: | ||||||||||||||||||||||||||||||||||
| Cash flow hedge for future exports | 31 | - | - | - | (217,291 | ) | - | (217,291 | ) | - | (217,291 | ) | ||||||||||||||||||||||
| Cash flow hedge with derivative instruments | - | - | - | (43,590 | ) | - | (43,590 | ) | (16,493 | ) | (60,083 | ) | ||||||||||||||||||||||
| Net fair value (loss) on equity instruments measured at fair value | 11 | - | - | - | (126,316 | ) | - | (126,316 | ) | - | (126,316 | ) | ||||||||||||||||||||||
| Foreign currency translation | - | - | - | 5,789,207 | - | 5,789,207 | 190,437 | 5,979,644 | ||||||||||||||||||||||||||
| Actuarial valuation gains | 22 | - | - | - | 1,404,602 | - | 1,404,602 | - | 1,404,602 | |||||||||||||||||||||||||
| Other movements | - | - | - | 58,643 | - | 58,643 | - | 58,643 | ||||||||||||||||||||||||||
| Balance as of December 31, 2015 | 25,040,067 | 6,607,699 | 5,546,570 | 10,846,004 | (6,814,432 | ) | 41,225,908 | 1,875,055 | 43,100,963 | |||||||||||||||||||||||||
(1) For comparative purposes, the initial balances of reserves and accumulated profits were reclassified, without changing the equity attributable to the shareholders of Ecopetrol. See note 2.8.
| F-8 |
Ecopetrol S.A.
Consolidated statements of changes in equity
(Figures expressed in millions of Colombian pesos)
| Notes | Subscribed and paid- in capital | Additional paid-in capital | Reserves (1) | Other comprehensive income | Retained earnings (1) | Equity attributable to Company’s shareholders | Non- controlling interests | Total equity | ||||||||||||||||||||||||||
| Balance as of January 1st, 2014 | 10,279,175 | 6,607,540 | 15,300,725 | (86,956 | ) | 16,498,512 | 48,598,996 | 1,265,573 | 49,864,569 | |||||||||||||||||||||||||
| Net income | - | - | - | - | 5,046,517 | 5,046,517 | 623,056 | 5,669,573 | ||||||||||||||||||||||||||
| Dividends declared | 24 | - | - | - | - | (10,690,342 | ) | (10,690,342 | ) | (516,331 | ) | (11,206,673 | ) | |||||||||||||||||||||
| Appropriation of reserves, net | 24 | - | - | 2,662,645 | - | (2,662,645 | ) | - | - | - | ||||||||||||||||||||||||
| Other movements | - | 72 | - | - | (2 | ) | 70 | (11,914 | ) | (11,844 | ) | |||||||||||||||||||||||
| Other comprehensive income | ||||||||||||||||||||||||||||||||||
| Net fair value gain (loss) on equity instruments measured at fair value | 11 | - | - | - | 76,435 | - | 76,435 | - | 76,435 | |||||||||||||||||||||||||
| Foreign currency translation | - | - | - | 3,247,477 | - | 3,247,477 | 150,898 | 3,398,375 | ||||||||||||||||||||||||||
| Actuarial valuation gains | 22 | - | - | - | 743,793 | - | 743,793 | - | 743,793 | |||||||||||||||||||||||||
| Balance as of December 31, 2014 | 10,279,175 | 6,607,612 | 17,963,370 | 3,980,749 | 8,192,040 | 47,022,946 | 1,511,282 | 48,534,228 | ||||||||||||||||||||||||||
(1) For comparative purposes, the initial balances of reserves and accumulated profits were reclassified, without changing the equity attributable to the shareholders of Ecopetrol. See note 2.8.
| F-9 |
Consolidated statements of cash flows
(Figures expressed in millions of Colombian pesos)
| For the years ended December 31, | ||||||||||||||
| Note | 2016 | 2015 | 2014 | |||||||||||
| Cash flow provided by operating activities: | ||||||||||||||
| Net income (loss) for the period | 3,247,480 | (6,288,979 | ) | 5,669,573 | ||||||||||
| Adjustments to reconcile net income (loss) to cash provided by operating activities: | ||||||||||||||
| Income tax | 10 | 4,543,046 | 710,353 | 5,434,855 | ||||||||||
| Depreciation, depletion and amortization | 15,16,18 | 7,607,000 | 6,770,358 | 6,417,207 | ||||||||||
| Foreign exchange loss | 30 | (976,430 | ) | 5,566,614 | 2,270,193 | |||||||||
| Finance costs recognised in profit or loss | 3,345,515 | 2,396,445 | 1,405,331 | |||||||||||
| Dry wells | 2.8 - 16 | 342,691 | 1,266,440 | 1,563,384 | ||||||||||
| Loss on disposal of non-current assets | 78,990 | 59,932 | 231,899 | |||||||||||
| Impairment of assets | 1,003,140 | 7,856,177 | 2,381,413 | |||||||||||
| Fair value (gain) loss on financial assets valuation | (59,593 | ) | (109,673 | ) | 135,427 | |||||||||
| (Gain) loss on share of profit of associates and joint ventures | 14 | (61,345 | ) | 46,687 | (166,070 | ) | ||||||||
| (Gain) on sale of equity instruments measured at fair value | (47,129 | ) | (72,339 | ) | - | |||||||||
| Realized foreign exchange cash flow hedges | 25 | (33,074 | ) | (7,646 | ) | - | ||||||||
| Net changes in operating assets and liabilities | - | |||||||||||||
| Accounts and notes receivable | (1,400,583 | ) | 751,031 | 1,507,923 | ||||||||||
| Inventories | (217,198 | ) | (183,231 | ) | 610,843 | |||||||||
| Accounts payable | (619,131 | ) | (2,202,808 | ) | (322,819 | ) | ||||||||
| Taxes payable | 2,547,232 | (1,964,995 | ) | (3,124,887 | ) | |||||||||
| Labor obligations | (11,677 | ) | (206,444 | ) | (259,043 | ) | ||||||||
| Estimated liabilities and provisions | (827,153 | ) | (216,939 | ) | (146,499 | ) | ||||||||
| Other assets | 118,523 | 654,960 | (653,196 | ) | ||||||||||
| Income tax paid | (4,347,364 | ) | (3,148,028 | ) | (4,819,169 | ) | ||||||||
| Net cash provided by operating activities | 14,232,940 | 11,677,915 | 18,136,365 | |||||||||||
| Cash flows from investing activities: | ||||||||||||||
| Investment in property, plant and equipment | 15 | (3,646,929 | ) | (8,548,933 | ) | (8,923,568 | ) | |||||||
| Investment in natural and environmental resources | 2.8 - 16 | (2,121,295 | ) | (6,856,761 | ) | (6,601,680 | ) | |||||||
| Additions to intangibles | 18 | (69,253 | ) | (112,255 | ) | (112,018 | ) | |||||||
| Proceeds from sales of equity instruments measured at fair value | 11 | 966,715 | 613,998 | - | ||||||||||
| (Purchases) sales of other financial assets | (5,446,507 | ) | 1,208,898 | 1,313,837 | ||||||||||
| Interest received | 386,001 | 293,507 | 286,527 | |||||||||||
| Dividends received | 437,803 | 423,856 | 720,217 | |||||||||||
| Proceeds from sales of property, plant and equipment | 109,896 | 166,211 | 184,424 | |||||||||||
| Net cash used in investing activities | (9,383,569 | ) | (12,811,479 | ) | (13,132,261 | ) | ||||||||
| Cash flows from financing activities: | ||||||||||||||
| Proceeds from borrowings | 4,594,640 | 10,985,933 | 9,094,818 | |||||||||||
| Repayment of borrowings | (3,149,917 | ) | (4,903,592 | ) | (2,693,104 | ) | ||||||||
| Interest paid | (2,495,446 | ) | (1,981,127 | ) | (1,231,392 | ) | ||||||||
| Capitalizations | - | 3 | 41 | |||||||||||
| Dividends paid | 24 | (1,712,298 | ) | (5,493,400 | ) | (12,516,566 | ) | |||||||
| Net cash used in financing activities | (2,763,021 | ) | (1,392,183 | ) | (7,346,203 | ) | ||||||||
| Exchange difference in cash and cash equivalents | (226,333 | ) | 1,458,019 | 1,155,187 | ||||||||||
| Net increase (decrease) in cash and cash equivalents | 1,860,017 | (1,067,728 | ) | (1,186,912 | ) | |||||||||
| Cash and cash equivalents at the beginning of the year | 6 | 6,550,450 | 7,618,178 | 8,805,090 | ||||||||||
| Cash and cash equivalents at the end of the year | 8,410,467 | 6,550,450 | 7,618,178 | |||||||||||
| Non-cash transactions | ||||||||||||||
| Capitalization of reserves | - | 14,760,895 | - | |||||||||||
| Payment of income tax through offset of recoverable balances | 656,121 | 894,451 | - | |||||||||||
| F-10 |
Ecopetrol S.A.
Notes to Consolidated Financial Statements
(Figures expressed in millions of Colombian pesos, unless otherwise stated)
Reporting entity
Ecopetrol S.A. (hereinafter Ecopetrol or the Company) was constituted by Law 165 of 1948 and transformed through Extraordinary Decree 1760 of 2003 (as well as Decree 409 of 2006) and Law 1118 of 2006 into a state-owned stock company and then intois a mixed economy company, ofwith a commercial nature, atformed in 1948 in Bogotá – Colombia, headquarters of the national level, linked to the Ministry of Mines and Energy, with an indefinite life term. Ecopetrol’sEcopetrol Business Group. Its corporate purpose is the development, in Colombia or abroad, ofto develop commercial or industrial activities arising from or related to the exploration, production, refining, transportation, storage, distribution, and selling of hydrocarbons, their by-products and associated products as well as subsidiary operations, connectedon its own or complementary to these activities, in accordance with applicable regulations. Ecopetrol’s main domicile is Bogotáthrough its subsidiaries (hereafter “Ecopetrol”, Colombia, and it may establish subsidiaries, branches and agencies in Colombiathe “Company” or abroad.Ecopetrol Business Group).
Pursuant to Transformation Decree 1760An 11.51% of 2003, all administrationEcopetrol S.A.’s shares are publicly traded on the Stock Exchanges of Colombia, New York, USA and Lima, Peru. The remaining shares (88.49% of the Colombian nation’s hydrocarbon reserves, as well as the administration of non-strategic assets represented by stocks and shares in companies, were separated from Ecopetrol. Furthermore, Ecopetrol’s basic structure was changed and two entities were created: a) the Agencia Nacional de Hidrocarburos (National Hydrocarbons Agency, hereinafter ANH) was created to issue and develop Colombian oil policy from that point forward (formerly the responsibility of Ecopetrol), and b) Sociedad Promotora de Energía de Colombia S.A., which received the non-strategic assetstotal outstanding shares) are owned by Ecopetrol.
Law 1118 of December 27, 2006 changed the legal nature of Ecopetrol and authorized the Company to issue shares to be placed on the public market and acquired by Colombian individuals or legal entities. Once the shares corresponding to 10.1% of the authorized capital were issued and placed, at the end of 2007, the Company became a public-private entity of a commercial nature, at the national level, related to the Ministry of MinesFinance and Energy.
Ecopetrol entered into a deposit agreement with JP Morgan Chase Bank, N.A., as depositary, for the issuance of ADSs evidenced by ADRs. Each of the ADSs represents 20 of Ecopetrol’s common shares or the right to receive 20 common shares of Ecopetrol.
On September 12, 2008, Ecopetrol submitted an application to the U.S. Securities and Exchange Commission (SEC) to register and list the Company’s ADSs evidenced by ADRs on the New York Stock Exchange (NYSE). The Company’s ADSs began trading on the NYSE under the “EC” symbol on September 18, 2008.
On December 3, 2009, the National Oversight Commission for Entities and Securities of Peru (from the Spanish Comisión Nacional Supervisora de Empresas y Valores del Perú - CONASEV) approved the listing of Ecopetrol’s ADRs on the Lima Stock Exchange and the registration of such securities with the Public Registry of the Securities Market. The ADRs began trading on the Lima Stock Exchange on December 4, 2009 in the Peruvian market under the “EC” symbol.
On August 13, 2010, Ecopetrol began trading its ADRs on the Toronto Stock Exchange, Canada. Thus, Ecopetrol became the first Colombian company to be listed on the Toronto Stock Exchange.
Between July 27 and August 17, 2011, Ecopetrol carried out the second placement of its public offering, authorized by Law 1118 of 2006. As a result of this process, 644,185,868 common shares were issued at a nominal price of $3,700 per share, for a total amount of $2,383,488. The common shares were registered with the National Registry of Securities and Issuers in accordance with Decree 2555 of 2010. Following this, the Colombian National Government’s equity participation in Ecopetrol was 88.49%.
Ecopetrol S.A. and Subsidiaries
Notes to the Consolidated Financial Statements
Years ended December 31, 2014, 2013 and 2012
(Expressed in millions of Colombian pesos)Credit.
The companies consolidated byaddress of the main office of Ecopetrol S.A. are:is Bogotá – Colombia, Carrera 13 No. 36 - 24.
| 2.1 | Statement of compliance and authorization of the financial statements |
Ecopetrol S.A. and Subsidiaries
Notes to the Consolidated Financial Statements
Years ended December 31, 2014, 2013 and 2012
(Expressed in millions of Colombian pesos)
Cartagena Refinery Operations
As from March 5, 2014, the crude oil division ceased its refining operations at the Cartagena Refinery. As from that date, the division primarily, focused on marketing activities.
The Company and some of its subsidiaries carry out exploration and production operations through Exploration and Production (E&P) Contracts and Technical Evaluation Contracts and Agreements (TEA) signed with the ANH, as well as through Association Contracts and other types of contracts in various forms.
A summary of the production and exploration contracts for 2014 is as follows:
| Number of Contracts | ||||||||||||||||||||||||
| Type of contract | Ecopetrol S. A. | Hocol Petroleum Ltd. | Ecopetrol Oleo é Gas do Brasil Ltda. | Ecopetrol America Inc. | Ecopetrol del Perú S. A. | Equión Energía Limited | ||||||||||||||||||
| Exploration | ||||||||||||||||||||||||
| E&P-ANH Contracts | 44 | 18 | - | - | 6 | 2 | ||||||||||||||||||
| E&P-ANH Agreements | 6 | - | - | - | - | - | ||||||||||||||||||
| TEA’s – ANH | 7 | 1 | - | - | - | - | ||||||||||||||||||
| Association Contracts | 3 | 1 | 3 | 16 | - | - | ||||||||||||||||||
| Production | ||||||||||||||||||||||||
| Association | 51 | 7 | - | 3 | - | 4 | ||||||||||||||||||
| E&P-ANH Contracts | - | 1 | - | - | - | - | ||||||||||||||||||
| Undeveloped and inactive discovered fields (CDNDI) | 9 | - | - | - | - | - | ||||||||||||||||||
| Incremental production | 5 | 1 | - | - | - | - | ||||||||||||||||||
| Risk participation | 3 | - | - | - | - | - | ||||||||||||||||||
| Technological partnership | 1 | - | - | - | - | - | ||||||||||||||||||
| Business cooperation | 1 | - | - | - | - | 1 | ||||||||||||||||||
| Shared risk participation | 1 | - | - | - | - | - | ||||||||||||||||||
| Operation | 1 | - | - | - | - | - | ||||||||||||||||||
| Production services with risk | 1 | - | - | - | - | - | ||||||||||||||||||
| 133 | 29 | 3 | 19 | 6 | 7 | |||||||||||||||||||
Ecopetrol S.A. and Subsidiaries
Notes to the Consolidated Financial Statements
Years ended December 31, 2014, 2013 and 2012
(Expressed in millions of Colombian pesos)
A summary of the production and exploration contracts for 2013 is as follows:
| Number of Contracts | ||||||||||||||||||||||||
| Contract Modality | Ecopetrol S. A. | Hocol Petroleum Ltd. | Ecopetrol Oleo é Gas do Brasil Ltda. | Ecopetrol America Inc. | Ecopetrol del Perú S. A. | Equión Energía Limited | ||||||||||||||||||
| Exploration | ||||||||||||||||||||||||
| E&P-ANH Contracts | 47 | 15 | - | - | - | 3 | ||||||||||||||||||
| E&P-ANH Agreements | 6 | - | - | - | - | - | ||||||||||||||||||
| TEA’s – ANH | 7 | 1 | - | - | - | - | ||||||||||||||||||
| Association Contracts | 3 | 1 | 16 | 14 | 1 | - | ||||||||||||||||||
| Production | ||||||||||||||||||||||||
| Association | 51 | 8 | - | 4 | - | 4 | ||||||||||||||||||
| E&P-ANH Contracts | - | 1 | - | - | - | - | ||||||||||||||||||
| Undeveloped and inactive discovered fields (CDNDI) | 9 | - | - | - | - | - | ||||||||||||||||||
| Incremental production | 5 | 1 | - | - | - | - | ||||||||||||||||||
| Risk participation | 3 | - | - | - | - | - | ||||||||||||||||||
| Technological partnership | 1 | - | - | - | - | - | ||||||||||||||||||
| Business cooperation | 1 | - | - | - | - | 1 | ||||||||||||||||||
| Shared risk participation | 1 | - | - | - | - | - | ||||||||||||||||||
| Operation | 1 | - | - | - | - | - | ||||||||||||||||||
| Production services with risk | 1 | - | - | - | - | - | ||||||||||||||||||
| 136 | 27 | 16 | 18 | 1 | 8 | |||||||||||||||||||
Principal accounting policies and practices
TheContaduría General de la Nación (CGN – National Accounting Office) adopted the Public Accounting Regime (RCP) in September 2007, defining its configuration, scope and application. Pursuant to CGN Communication No. 20079-101345 of September 28, 2007, RCP went into effect for Ecopetrol on January 1, 2008.
Consolidation process
TheThese consolidated financial statements of Ecopetrol for the years ended on December 31, 2016, 2015 and 2014 have been prepared in accordance with Articles 23International Financial Reporting Standards (IFRS) and 122their interpretations, issued by the International Accounting Standards Board (IASB). The Ecopetrol Business Group adopted IFRS starting January 1, 2015, with a transition date of Decree 2649 of 1993. The latter article states that an economic entity that owns more than 50% of the capital stock of the other economic entities, must present along with its basic financial statements, theJanuary 1, 2014.
Accounting policies described in Note 4 have been applied consistently in all periods.
These consolidated financial statements and their respective notes. The consolidation method used is the full consolidation method set out in External Circular Letter No. 005 of April 6, 2000 issuedwere approved by the Office of the Superintendent of Corporations, which establishes that the consolidated financial statements must be aggregated basedEcopetrol’s Management on the individual financial statements of the parent company and of each of its subsidiaries, identifying the effect on assets, liabilities, equity and results of operations of all the transactions carried out between group companies.
The consolidation of the group was performed with the financial statements of the parent company and its subsidiaries, as of the same cut-off date of December 31, 2014 and 2013, after they were standardized according to the Public Accounting Regime, issued by the Office of the General Accountant of the Nation.May 30, 2017.
| Basis |
The consolidated financial statements were prepared by consolidating all companies set out in accordance with Colombian Government Entity GAAP standards and principles issued byExhibit 1, which are those where Ecopetrol exercises direct or indirect control. Control is achieved when the CGN, and other legal provisions. These principles may differ in certain respectsCompany:
| § | Has power over the investee; |
| § | Is exposed, or has the rights, to variable returns from its involvement with the investee; and |
| § | Has the ability to use its power to affect its operational returns. This occurs when the Company has less than a majority of the voting rights of an investee, and it still has the power over the investee to provide it with the practical ability to direct the relevant activities of the investee unilaterally. The Company considers all relevant facts and circumstances in assessing whether or not the Company’s voting rights in an investee are sufficient or not to give it power, including: |
| a) | The percentage of the Company's voting rights regarding to the size and division of the shares of other vote holders; |
| b) | Potential voting rights held by the Company, other vote holders or other parties; |
| c) | Rights arising from other contractual arrangements; and |
| d) | Any additional facts and circumstances that indicate that the Company has, or does not have, the current ability to direct the relevant activities, at the time that decisions need to be made, including voting patterns at previous shareholders’ meetings |
Subsidiaries are consolidated from those established by other standards and otherthe date on which control authorities, and CGN opinions on specific matters prevail over other standards.is obtained until the date that such control ceases, using consistent accounting policies.
The accrual method was applied forAll inter-company assets and liabilities, equity, income, expenses and cash flows relating to transactions between entities of the accounting recognitionGroup were eliminated on consolidation. Unrealized losses are also eliminated. Non-controlling interest represents the proportion of financial, economic, environmentalprofit, other comprehensive income and social activities.net assets in subsidiaries that are not attributable to Ecopetrol’s shareholders.
A structure was established in accordance with the rules for the inspection, supervision, and/or control of Ecopetrol, and the companies that apply the regime of public accounting (RCP, to record operations at the level of source documents, or for standardization purposes, to define the accounting treatment of operations not covered by the CGN.The structure involves: i) principal and permanent inspection, supervision, and control: Superintendence of Domiciliary Public Services; ii) residual control: Superintendence of Corporations; and iii) concurrent control: Superintendence of Finance, of the activities of the Company in its capacity as issuer in the stock market. International Financial Reporting Standards (IFRS) are applied to define regulatory differences, while accounting standards under Generally Accepted Accounting Principles in the United States (USGAAP) are applied for accounting issues related to crude oil and natural gas activities.
| F-11 |
Ecopetrol S.A. and Subsidiaries
Notes to the Consolidated Financial Statements
Years ended December 31, 2014, 2013 and 2012
(ExpressedFigures expressed in millions of Colombian pesos)pesos, unless otherwise stated)
In 2015, the Board of Directors of Ecopetrol S.A authorized the creation of a Colombian company indirectly wholly owned by Ecopetrol S.A. This Company will develop offshore activities in Colombia, which the company currently carries out as operator and non-operator, and take advantage of the benefits of Decree 2682/14, “pursuant to which the conditions and requirements are established for declaring the existence of Permanent Offshore Free Trade Zones”. At December 31, 2015, the legal proceedings were pending to formalize the establishment of the subsidiary.
The basic consolidated financial statements defined byfollowing are the CGN are: the Balance Sheet, the Statement of Financial, Economic, Social and Environmental Activity, the Statement of Changessubsidiaries that were incorporated in Shareholders’ Equity and the Statement of Cash Flows. The notes to the basic consolidated financial statements are an integral part of thereof.2016:
| a) | Ecopetrol Costa Afuera S.A.S.: Subsidiary engaged in the production and exploration segment with a 100% ownership by the Group and that was created with the purpose of carrying out offshore activities in Colombia, which Ecopetrol is currently conducting as operator and non-operator of permits. |
| b) | Sento S.A.S.:Subsidiary engaged in the transport segment that was created for transferring 100% of the equity share held by Equion in Oleoducto de Colombia S.A. |
| 2.3 | Measurement basis |
The consolidated financial statements includehave been prepared on a historical cost basis, except for financial assets and liabilities that are measured at fair value through profit or loss and / or through other comprehensive income at the accountsend of each reporting period, as explained in the accounting policies included below.
Historical cost is generally based on fair value of the businessesconsideration given in which the Company holds a direct or indirect share of over 50% of capital, or over which it has significant influence without being a majority shareholder. All inter-company transactions among consolidated companies have been eliminated. The attached consolidated financial statements consolidate the assets, liabilities, equityexchange for goods and results of the subsidiaries.services.
The accompaning financial statements consolidate assets, liabilities, equity and resultsfair value is the price that would be received from selling an asset or that would be paid for transferring a liability among market participants, in an orderly transaction, on the date of operationsmeasurement. When estimating the fair value, the Group uses assumptions that market participants would use for pricing an asset or liability at current market conditions, including risk assumptions.
| 2.4 | Functional and presentation currency |
The functional currency of each group’s company is determined in relation to the subsidiary companies.main economic environment where they operate. The investments recorded in those companies are recognized by the equity method. The annual consolidated financial statements are presented beforein Colombian pesos, which is the General AssemblyGroup’s functional and presentation currency.
The statement of Shareholdersprofit or loss and statement of cash flows of subsidiaries with functional currencies different from Ecopetrol’s functional currency are translated at the basis for dividend distributionexchange rates on the dates of the transaction or at the monthly average exchange rate. Assets and liabilities are translated at the closing rate and other appropriations.equity items are translated at exchange rates at the time of the transaction. All resulting exchange differences are recognized in other comprehensive income. Upon disposal of all or part of an interest in a subsidiary, the portion of the cumulative translation adjustment related to the company is recognized in the consolidated statement of profit or loss.
The financial statements are presented in Colombian pesos rounded up to the closest million unit (COP 000,000) except when otherwise indicated.
| F-12 |
Ecopetrol S.A.
Notes to Consolidated Financial Statements
(Figures expressed in millions of Colombian pesos, unless otherwise stated)
| 2.5 | Foreign currency |
In the preparation of the financial statements of Ecopetrol, transactions in currencies other than the Company’s functional currency are recognized at the rates of exchange prevailing at the date of the transactions. At the end of each reporting period, monetary items denominated in foreign currencies are translated at the rates prevailing at the period end and variations presented on translation are recognized in financial results, net, except those resulting from the conversion of loans and borrowings designated as cash flow hedges or net investment in a business abroad, which are recognized in other comprehensive income within equity. When the hedged item affects the results, exchange differences accumulated in equity are reclassified to the consolidated statement of profit or loss as part of the operating result.
Non-monetary items carried at fair value that are denominated in foreign currencies are translated using the rates prevailing at the date when the fair value was determined.
Net investment in foreign operations includes equity financing and long-term inter-company loans for which settlement is neither planned nor likely to occur in the foreseeable future. The exchange differences derived from the translation of net investment in a foreign operation are accumulated in the other comprehensive income.
An economic fact is material whenever, due to its nature, amountIn the consolidated statement of financial position, assets and surrounding circumstances, the knowledge or ignorance of it, may significantly alter the economic decisions of users of such financial information.
As set forth by the RCP, the information disclosed in the financial statements and financial accounting reports must cover the main aspects of the Government Accounting entity in a way that must be significantly close to the truth, so that it is relevant and reliable for decision-making purposes or the required evaluations based on accounting information objectives. Materiality depends on the nature of the facts or the magnitude of the amounts disclosed or not revealed.
The consolidated financial statements include specific headingsliabilities are classified in accordance with legal requirementstheir maturities between current, those with maturity equal to or for elements representing 5% or more of total assets, current assets, total liabilities, current liabilities, working capital, equityless than twelve months, and income, as appropriate. In addition, lower amounts are shown when they are deemed to contribute to a better interpretation of financial information.non-current, those with maturity exceeding twelve months.
Basic earnings (loss) per share is calculated by dividing the profit for the year attributable to ordinary equity holders of the parent by weighted average number of ordinary shares outstanding during the year. There is no potential dilution of shares.
| 2.8 | Changes in presentation policies and reclassifications |
| a) | Subsequent to the issuance of the consolidated financial statements as of December 31, 2015, the Company modified its presentation policy in the cash flows statements to dry wells, for better understanding and comparability respect to the amount invested in exploration activities; the above is aligned with the policy of successful efforts described in Note 4.7 which states that the costs of exploratory wells are initially capitalized until it is determined if they are commercially viable, additionally, it allows alignment of the information presented with the annual investment budget published by the Company, which includes investments to be made during the period, whether commercially viable or not. With this change, starting in 2016, investments that could result in dry wells are added back to net income in determining cash flows provided by operations and are included in cash flows used in investing activities. The following is the detail of the mentioned change: |
| F-13 |
Ecopetrol S.A.
Notes to Consolidated Financial Statements
(Figures expressed in millions of Colombian pesos, unless otherwise stated)
| December 31, 2015 as previously reported | Reclassifications | December 31, 2015 as adjusted | ||||||||||
| Cash provided by operating activities: | ||||||||||||
| Dry wells | - | 1,266,440 | 1,266,440 | |||||||||
| Total cash provided by operating activities | 10,411,475 | 1,266,440 | 11,677,915 | |||||||||
| Cash provided by operating activities:: | ||||||||||||
| Investment in natural and environmental resources | (5,590,321 | ) | (1,266,440 | ) | (6,856,761 | ) | ||||||
| Total cash used in investing activities | (11,545,039 | ) | (1,266,440 | ) | (12,811,479 | ) | ||||||
| Cash and cash equivalents at the end of the year | 6,550,450 | - | 6,550,450 | |||||||||
| December 31, 2014 as previously reported | Reclassifications | December 31, 2014 as adjusted | ||||||||||
| Cash provided by operating activities: | ||||||||||||
| Dry wells | - | 1,563,384 | 1,563,384 | |||||||||
| Total cash provided by operating activities | 16,572,981 | 1,563,384 | 18,136,365 | |||||||||
| Cash provided by operating activities: | ||||||||||||
| Investment in natural and environmental resources | (5,038,296 | ) | (1,563,384 | ) | (6,601,680 | ) | ||||||
| Total cash used in investing activities | (11,568,877 | ) | (1,563,384 | ) | (13,132,261 | ) | ||||||
| Cash and cash equivalents at the end of the year | 7,618,178 | - | 7,618,178 | |||||||||
| b) | For comparison purposes, the Company reclassified certain amounts from prior periods, in the concepts that comprise the statement of changes in equity, as well as, the reconciliation of the income tax expense related in the note 10 - Taxes, to allow better comparability with the current period. These reclassifications do not impact either profit or loss or equity. |
| 3. | Significant estimates and accounting judgments |
The preparation of consolidatedthe financial statements requires thatestimates from Company management to quantify some assets, liabilities, sales revenues, costs and commitments recognized in the management offinancial statements. These estimates have been made based on the Company make estimatesbest available data for realized facts. Uncertainty on the assumptions and assumptionsestimations could result into material future changes that could affect the recordedvalue of assets or liabilities. The changes to such estimates are recognized in a prospective manner during the period in which the estimate is reviewed.
The following are accounting judgments and estimates with the most significant effect for preparing the financial statements:
| 3.1 | Oil and Gas reserves |
Measurements relating to depreciation, depletion, amortization, impairment and asset abandonment obligations are determined, in part, based on the Company's estimated reserves of oil and natural gas. Reserves estimation is an inherently complex process and it involves professional judgments.
| F-14 |
Ecopetrol S.A.
Notes to Consolidated Financial Statements
(Figures expressed in millions of Colombian pesos, unless otherwise stated)
The reserves estimation is conducted annually at December 31 in accordance with the United States Securities and Exchange Commission (SEC) definitions and rules set forth in Rule 4-10(a) of SEC Regulation S-X and the disclosure guidelines contained in the SEC final rule - Modernization of Oil and Gas Reporting.
As required by current regulations, the future estimated date in which a field will no longer produce for economic reasons, is based on actual costs and average of crude prices (calculated as the arithmetical average of prices on the first day of the past 12 months). The estimated date for end of production will affect the amount of reserves, unless the prices have been defined by contractual agreements; therefore, if the prices and costs change from one year to the other, the proved reserves estimate also changes. Generally, our prove reserves decrease as prices go down and increase when prices go up.
Reserves estimations are prepared using geological, technical and economic factors, including projections of future production rates, oil prices, engineering data and length and amount of future investments with a certain degree of uncertainty. These estimations reflect the regulatory and market conditions existing on the date of which could significantly differ from other conditions during the year or in future periods. Any changes in regulatory and/or market conditions and assumptions could materially affect the reserves estimation.
Impact of oil reserves and natural gas in depreciation and depletion
Changes in estimates of proved developed reserves may affect the carrying amounts of exploration and production assets, natural resources and environment, goodwill, liabilities resultsfor dismantling and depreciation, depletion and amortization. With all other variables remaining unchanged, a decrease in estimated proved reserves would increase, prospectively, depreciation, depletion and amortization expenses, while an increase in reserves would reduce depreciation and amortization expenses, as depreciation, depletion and amortization charges are calculated using the units of activitiesproduction method.
Information about the carrying amounts of exploration and production assets and the attached notes. Theseamounts charged to income, including depreciation, depletion and amortization, is presented in Notes 15 and 16.
| 3.2 | Asset impairment (recovery) |
The Company uses its professional judgment in assessing the existence of evidence of impairment, based on internal and external factors. If impairment indicators exist, Company estimated the recoverable amount of the cash generating units, which is considered to be the higher of the fair value less costs of disposal and value in use. The assessments require the use of estimates and assumptions including: (1) Estimation of the volumes and market value of oil and natural gas reserves; (2) production profiles for oilfields and future production of refined and chemical products; (3) investments, taxes and future costs; (4) useful life of assets; (5) future prices, and (6) discount rate, which is revised annually and determined as the weighted average cost of capital (WACC), (7) changes in environmental regulation, among other factors. The recoverable amount is compared to the carrying amount of the asset or the cash generating unit, to determinate if the asset is impaired.
Future price assumptions are estimated at current market conditions. Expected production volumes, which comprise proved and unproved reserves, are used for impairment testing because management believes this to be the most appropriate indicator of expected future cash flows, which would also be considered by market participants. Reserves estimates are carried outinherently imprecise and subject to risk and uncertainty. Furthermore, projections about unproved volumes are based on information that is necessarily less robust than that available for mature reservoirs.
Changes in estimates and judgments may impact these projections, which may impact the recoverable amount of the cash generating units and, as a consequence, may also impact the recognition or recovery of asset impairment
| F-15 |
Ecopetrol S.A.
Notes to Consolidated Financial Statements
(Figures expressed in millions of Colombian pesos, unless otherwise stated)
| 3.3 | Exploration and evaluation costs |
Certain exploration and evaluation costs are initially capitalized when it is expected that an economically viable extraction operation can be established. The Company uses its professional judgment of future events and circumstances and makes estimates in order to assess annually the generation of future economic benefits for extracting the oil resources, as well as technical criteria,and commercial analyses to confirm intent of continuing their development. Changes regarding available information such as drilling success level or changes in the project's economics, production costs, investment levels, and others, may result in capitalized exploration drilling costs being recognized as a cost in profit or loss for the period. Since 2016, dry wells are treated as investment activities in the statement of cash flows.
3.4 Determination of cash generating units (CGU)
The allocation of assets in cash generating units requires significant judgment, as well as interpretations regarding the integration between assets, the existence of active markets, similar exposure to market risk, shared infrastructure, and tenets pursuantthe way in which management monitors the operations. See Note 4.12 - Impairment in the value of assets for more information.
| 3.5 | Asset retirement obligation |
According to environmental and oil regulations, the Company must recognize costs for the abandonment of oil extraction and transportation facilities, which include the cost of plugging and abandoning wells, dismantling facilities, and environmental remediation in the affected areas.
The estimated costs of dismantling and abandonment of these facilities are recorded in the functional currency of each company at the time of the installation of assets. The estimated obligation created for the abandonment and dismantling are subject to annual reviews and adjusted to reflect the best available estimation due to technological changes, political, economic, and environmental and security issues, as well as relationships with stakeholders.
The determination of these estimations is complex and involve significant judgment by Management, such as internal projections of costs, changes in reserve estimates, future inflation and discount rates. The Company considers that the abandonment costs are reasonable, based on the experience of the Ecopetrol Business Group and market conditions; nevertheless, significant variations in external factors used for the calculation of the estimation could significantly impact the financial statements.
| 3.6 | Pension plan and other benefits |
The calculation of expenses, liabilities and adjustments relating to pension plans and other defined retirement benefits requires management to use judgment in the actuarial assumptions used in such calculation. The actuarial assumptions include estimates regarding future mortality, retirement, changes in compensation and discount rate in order to reflect the value of money over time, in addition to the regulationsrate of return on the plan's assets. Due to the complexity of the valuation of these variables, as well as the long term nature, the obligations that are defined are quite sensitive to any change of these assumptions.
These assumptions are reviewed on an annual basis for purposes of actuarial valuations and may differ materially from actual results due to changing economic and market conditions, regulatory events, judicial rulings, higher or lower retirement rates, or longer or shorter life expectancies among employees. The calculation of pension bonds is maintained for compliance with the Company's pension obligations, in accordance with current regulations.
| F-16 |
Ecopetrol S.A.
Notes to Consolidated Financial Statements
(Figures expressed in millions of Colombian pesos, unless otherwise stated)
| 3.7 | Goodwill impairment |
The Company performs an annual impairment test of goodwill to assess if it carrying amount is recoverable. Goodwillis allocated to each of the cash-generating units (or groups of cash generating units) expecting to benefit from the synergies of the combination.
The determination of the recoverable value is described in note 4.12 and its calculation requires assumptions and estimations. The Company considers that the assumptions and estimations used are reasonable and supportable based on the current market conditions and are aligned to the risk profile of the related assets. However, different assumptions and estimations may be used which would lead to different results. Valuation models used to determine fair value are sensitive to changes in the underlying assumptions. For example, sales volumes and prices that will be paid for the purchase of raw materials are assumptions that may vary in the future. Adverse changes in any of these assumptions could lead to the recognition of goodwill impairment.
| 3.8 | Litigation |
The Company is subject to claims for regulatory and arbitration proceedings, tax assessments and other claims arising in the ordinary course of business. Management evaluates these claims based on their nature, the likelihood that they materialize, and the amounts involved, to decide on any changes to the amounts accrued and/or disclosed in the financial statements. This analysis, which may require considerable judgment, includes assessment of current legal proceedings brought against the Company and claims not yet initiated. A provision is recognized when the Company has a present obligation as a result of a past event, it is probable that an outflow of resources embodying economic benefits will be required to settle the obligation and a reliable estimate can be made of the amount of the obligation.
| 3.9 | Taxes |
Calculation of the income tax provision requires interpretation of the tax law in the jurisdictions where the Ecopetrol Business Group operates. Significant judgment is required to determine estimates for income tax and to evaluate the recoverability of deferred tax assets, which is based on estimates of future taxable income and the ability to generate sufficient results during the periods in which such deferred taxes are deductible. Liabilities for deferred taxes are recorded in accordance with estimates of net assets that in the future will not be tax deductible.
To the extent that actual future cash flows and taxable income differ significantly from the estimates, the Company's capacity recover recorded deferred tax assets could be affected.
Additionally, changes in tax rules could limit the capacity of the Company to obtain tax deductions in future years, as well as new potential liabilities resulting from questioning by the reviews of tax authorities.
Tax positions used imply a thorough evaluation by Management, and these are reviewed and adjusted in response to situations such as expiry in application of laws, closing of tax audits, additional disclosures caused by any legal issue or a court decision related to a particular tax issue. The Company creates provisions based on the estimation of a potential adverse decision that could be derived from a tax audit. The amount of these provisions depends on factors such as previous experience in effect. Actualtax audits and different interpretations of tax rules by tax paying entities and tax authorities. The actual results may differ from recorded amounts.
| F-17 |
Ecopetrol S.A.
Notes to Consolidated Financial Statements
(Figures expressed in millions of Colombian pesos, unless otherwise stated)
| 3.10 | Hedge Accounting |
The process of identifying hedge relations among hedging elements and instruments (derivative and non-derivative such estimates.as long term debt in foreign currency), and the related effectiveness requires management judgment. The Company periodically assesses alignment between identified hedges and its risk management policy.
Foreign currency transactionsThe accounting policies below have been consistently applied in all the periods presented, unless otherwise indicated.
| 4.1 | Financial instruments |
The classification of financial instruments depends on the nature and purpose for which the financial assets or liabilities were acquired and is determined at the time of initial recognition. Financial assets and financial liabilities are initially measured at their fair value. Transaction costs that are directly attributable to the acquisition or issue of financial assets and financial liabilities (other than financial assets and financial liabilities at fair value through profit or loss) are added to or deducted from the fair value of the financial assets or financial liabilities, as appropriate, on initial recognition. Transaction costs directly attributable to the acquisition of financial assets or financial liabilities at fair value through profit or loss are recognized immediately in accordancethe statement of profit or loss.
Financial assets with applicable regulationschanges in profit or loss and recordedother comprehensive income are stated at fair value. Financial instruments such as, loans and trade receivables, other receivables and financial assets held-to-maturity are stated at amortized cost using the appropriate exchange rates on the transaction date. Balances denominated in foreign currencieseffective interest method.
Available for sale equity investments that do not have a market quoted price and which fair value cannot be reliably measured are expressed in Colombian pesosmeasured at the representative market exchange ratescost less any loss for impairment identified at the end of each reporting period.
The exchange difference resulting from asset adjustments is recorded in results, except those generated by variable yield investments in foreign subsidiaries, which are recorded as an increase or decrease in equityFair value in accordance with Decree 4918 of December 26, 2007 issued by theMinisterio de Comercio, Industria y Turismo (Ministry of Trade, Industry and Tourism). In cases where the investment is settled, thismeasurement
Fair value is recordedthe price that would be received to sell an asset or paid to transfer a liability in an orderly transaction between market participants at the measurement date. The fair value measurement is based on the presumption that the transaction to sell the asset or transfer the liability takes place either in the resultsprincipal market for the year.asset or liability or in absence of a principal market, in the most advantageous market for the asset or liability.
Exchange differences resulting from liabilities are recorded in results only when they are not attributable to asset acquisition costs. Exchange differences are attributable to asset acquisition costs during the construction, installation or start-up phase of thoseAll assets and until they areliabilities for which fair value is measured or disclosed in operable condition.
While performing its oil industry activities, the Company can freely deal in foreign currencies, provided that it complies with the provisions of Colombia’s exchange rate regime.
The conversion of financial statements of subsidiariesare categorized within the fair value hierarchy, based on the lowest level input that use currencies other thanis significant to the Colombian peso, is performed by translate from the functional currency into US Dollars and then into Colombian pesos. For translation of asset and liability balances, was used the Market Representative Exchange Rate (TRM)fair value measurement as of December 31, 2014 was used. For translation of income statement figures, the monthly average TRMs were used, and historical rates were used for capital figures.a whole, as follows::
| · | Level 2: Entries different from those of Level 1 that are observable, either directly or indirectly. For the Company, Level-2 entries include prices of similar assets, prices obtained through quotations made by stockbrokers, and prices that can be substantially corroborated with other observable data with the same term of the contract. |
| · | Level 3: Unobservable inputs. The Company does not use Level-3 inputs for the measurement of financial assets and liabilities. The Company may use Level-3 inputs for the determination of fair value associated with certain measurements of non-financial assets to determine their recoverable amount. |
| F-18 |
Ecopetrol S.A.
Notes to Consolidated Financial Statements
(Figures expressed in millions of Colombian pesos, unless otherwise stated)
Effective interest method
The effective interest method is a method of calculating the amortized cost of a financial instrument and accounting of income or financial cost over the relevant period. The effective interest rate is the discount rate that exactly discounts estimated future cash receipts or payments (including all fees, transaction costs and other premiums or discounts) through the expected life of the financial instrument (or, when appropriate, at a shorter period), to the net carrying amount on initial recognition.
Impairment
The Company assesses, at each reporting date, whether there is objective evidence that a financial asset or a groupof financial assets is impaired. Financial assets are assessed for impairment indicators at the end of each reporting period. Financial assets are considered to be impaired when there is objective evidence that, as a result of one or more events that occurred after initial recognition, the estimated future cash flows of the asset have been affected. For financial assets measured at amortized cost, the amount of the impairment loss recognized is the difference between the asset’s carrying amount and the present value of estimated future cash flows, discounted at the financial asset’s original effective interest rate.
De-recognition of financial assets and liabilities
Ecopetrol derecognizes a financial asset only upon expiration of the contractual rights to receive cash flows from the financial asset or, when it has transferred its rights to receive cash flows from the asset or has assume an obligation to pay the received cash flows in full without material delay to a third party and either (a) it has transferred substantially all the risks and rewards inherent in the ownership of the financial asset or (b) it has neither transferred nor retained substantially all the risks and rewards of the asset, but has transferred control of the asset.
When the Company neither transfer nor retain substantially all the risks and rewards of the asset nor transferred control of the asset, the Company continues recognizing the transferred asset, to the extent of it continuing involvement, and also recognizes an associated liability.
| 4.1.1 | Cash and cash equivalents |
Cash and cash equivalents include cash on hand and at banks and short-term investments with original maturity dates of 90 days or less, which are subject to insignificant risks of changes in value.
| 4.1.2 | Financial assets |
The Company classifies its financial assets in the following categories:
| a) | Financial assets measured at fair value through profit or loss |
Financial assets at fair value through profit or loss are financial assets held for trading and financial assets designated at the time of the initial recognition at fair value through profit or loss. Financial assets are classified as held for trading if they are acquired to be sold or repurchased in the short term. Financial assets at fair value through profit or loss are carried at fair value with net changes in fair value recognized in the statement of profit or loss.
| b) | Financial assets measured at fair value with changes in other comprehensive income |
These are equity instruments of other non-controlled and non-strategic companies not allowing for any type of control or material influence thereon and where the Company management is not intended to negotiate with them in the short-term. These instruments are recognized for their fair value and unrealized losses or gains are recognized in other comprehensive income. The sales revenues received by these equity instruments are recognized as financial sales revenues in the period results.
| F-19 |
Ecopetrol S.A. Notes to Consolidated Financial Statements (Figures expressed in millions of Colombian pesos, unless otherwise stated) |
At the time of sale or recognition of losses for impairment in its value, the cumulative adjustment for valuation in the other comprehensive income and the profit or loss in sale are recognized in the statement of profit or loss.
| c) | Loans and receivables |
Loans and receivables are non-derivative financial assets with fixed or determinable payments that are not quoted in an active market. Loans and receivables are classified as current, except when their maturity is longer than twelve months as of the date of the statement of financial position, in which case they are classified as non-current. Loans and receivables, including trade and other receivables, are initially measured at fair value and subsequently at amortized cost using the effective interest rate method, less impairment.
Loans to employees are initially recognized using the present value of the future cash flows, discounted at the current market rate for similar loans. If the interest rate is less than the current market rate, fair value will be less than the amount of the loan. This difference is recorded as a benefit to employees.
| 4.1.3 | Financial liabilities |
Financial liabilities correspond to the financing obtained by the Company through bank credit facilities and bonds, accounts payable to suppliers and creditors.
Bank credit facilities and bonds are initially recognized at their fair value, net of transactions costs incurred. The difference between the amount received and its nominal value is recognized in the results of the period during the time of amortization of the financial obligation, using the effective interest rate method. The effective interest method amortization is included as financial expense in the statement of profit or loss.
Accounts payable to suppliers and creditors are short term financial liabilities recorded at their nominal value, which does not differ significantly from their fair value.
A financial liability is derecognized when the obligation under the liability is discharged or cancelled expires. When an existing financial liability is replaced by another from the same lender, on substantially different terms, or the terms of an existing liability are substantially modified such an exchange or modification is treated as the derecognition of the original liability and the recognized as a new liability. The difference in the respective carrying amounts is recognized in the statement of profit or loss.
| 4.1.4 | Derivative financial instruments and hedging activities |
Financial derivative instruments are initially recognized in the statement of financial position as assets or liabilities and are measured at fair value on the date the derivative is entered into and are subsequently measured at fair value. Changes in the fair value of derivatives are recognized as gain or loss in the statement of profit or loss, except for the effective portion of cash flow hedges, which is recognize in other comprehensive income and later reclassified to profit or loss when the hedge item affects profit or loss.
The profit or loss of derivative contracts, neither qualified nor designated as hedges, including forward sale and purchase contracts of commodities in trading for delivery or physical receiving of the commodity are registered in profit or loss.
Embedded derivatives in contracts that do not yet require being recognized at fair value and that are not directly related to the host contract in terms of economics characteristics and risks are separated from their host contract and recognized at fair value; associated gains and losses are recognized in profit or loss.
| F-20 |
Ecopetrol S.A. Notes to Consolidated Financial Statements (Figures expressed in millions of Colombian pesos, unless otherwise stated) |
| 4.1.5 | Hedging operations |
For purpose of hedge accounting, hedges are classified as:
| § | Fair value hedges, when hedging the exposure to changes in fair value of a recognized asset or liability, or an unrecognized firm commitment, or an identifiable portion of such asset, liability or firm commitment. |
| § | Cash flow hedges when hedging of the exposure to variability in cash flows that is either attributable to a particular risk associated with a recognized asset or liability or a highly probable forecast transaction. |
| § | Hedges of a net investment in a foreign operation. |
At the inception of a hedge relationship, the Company formally designates and documents the hedge relationship to which it wishes to apply hedge accounting, including the relationship between the hedging instrument and the hedged item, the risk management objectives and strategy to perform hedging transactions. Furthermore, such hedges are expected to be highly effective in achieving offsetting changes in fair value or cash flows and are assessed on an ongoing basis to determine that they actually have been highly effective throughout the financial reporting periods for which they were designated.
Hedging instruments are classified as non-current assets or liabilities when their expiration is more than 12 months from the statement of financial position date, otherwise they are classified as current assets or liabilities.
| 4.1.5.1 | Cash flow hedge |
The effective portion of the gain or loss on the hedging instrument is recognized in other comprehensive income, while any ineffective portion is recognized in the statement of profit or loss, in the net financial results line item.
The amounts previously recognized in other comprehensive income are transferred to profit or loss. When the hedged item is a non-financial asset or liability, the amounts previously recognized in other comprehensive income are transferred and included in the initial carrying amount of the cost of the non-financial asset or liability.
If the hedging instrument expires or is sold, terminated or exercised without replacement or rollover, or if it designation as a hedge is revoked or when the hedge no longer meets the criteria for hedge accounting, any cumulative gain or loss previously recognized in other comprehensive income remains separately in equity until the transaction is recognized in profit or loss. When it is no longer expected that the initially hedged transaction occurs, any profit or loss accumulated in equity is immediately recognized in profit or loss.
Ecopetrol designates long term loans as hedging instrument for their exposure to the exchange risk in future oil exports. See Note 31 for further information.
| 4.1.5.2 | Hedge of a net investment in a foreign operation |
Hedges of net investment in a foreign operation are accounted for in a way similar to the cash flow hedges.
Gains or losses on of the hedging instrument related to the effective portion of the hedge are recognized in other comprehensive income, while any gains or losses relating to the ineffective portion are recognized in the statement profit or loss. Cumulative gains or losses recorded in equity is transferred to profit or loss when the foreign subsidiary is partially or totally disposed of.
| F-21 |
Ecopetrol S.A. Notes to Consolidated Financial Statements (Figures expressed in millions of Colombian pesos, unless otherwise stated) |
Ecopetrol uses long term loans as a hedge of its exposure to foreign exchange risk on its investment in subsidiaries whose functional currency is the U.S. dollar. See Note 31 for further information.
| 4.2 | Inventories |
Inventories are stated at the lower of cost and net realizable value.
Inventories mainly comprise crude oil, fuels and petrochemicals and consumable inventories (spares and supplies).p
The cost of crude oil is the production costs, including transportation costs.
The crude required to bring the pipeline into working order, is treated as part of the related pipeline.
The cost of other inventories is determined based on the weighted average method, which includes acquisition costs (deducting commercial discounts, rebates and other similar items), transformation, and other costs incurred to bring inventory to their current location and condition, such as transportation costs.
Consumable inventories (spares and supplies) are recognized as inventory and then charged to expense, maintenance or project to the extent that such items are consumed.
Ecopetrol estimates the net realizable value of inventories at the end of the period. When the circumstances that previously caused inventories to be written down below cost no longer exist, or when there is clear evidence of an increase in the net realizable value because of a change in economic circumstances, the amount of the write-down is reversed.The reversal cannot be greater than the amount of the original write-down, so that the new carrying amount will always be the lower of the cost and the revised net realizable value.
| 4.3 | Related parties |
Related parties are considered those in which one party has the ability to control, or has joint control of the other, or exercises significant influence over the other party in making financial or operational decisions, or is a member of key management personnel (or close relative of a member). The Company has considered as related parties, associates, joint ventures, key management, entities managing resources for payment of employee post-employment benefit plans, and some relevant transactions with Colombian government entities, such as the purchase of hydrocarbons and the fuel price stabilization fund. See note 4.16.
| 4.3.1 | Investments in associates |
An associate is an entity over which the Group has significant influence but not control. Significant influence is the power to participate in the financial and operating policy decisions of the investee, but is not control or joint control over those policies. Generally, these entities are those in which an equity interest is maintained from 20% to 50% of the voting rights. See Exhibit I - Consolidated companies, associates and joint ventures for further details..
Investments in associates are accounted for using the equity method. Under the equity method, the investment in an associate is initially recognized at cost. The carrying amount of investment in associates includes goodwill identified on acquisition, which is not tested for impairment separately.
| F-22 |
Ecopetrol S.A. Notes to Consolidated Financial Statements (Figures expressed in millions of Colombian pesos, unless otherwise stated) |
The Company's share of the results of operations of the associate is recognized in the consolidated statement of profit or loss. Any changes in other comprehensive income of the associates is recognized in the Company’s other comprehensive income.
After application of the equity method, the Company determines if it is necessary to recognize an impairment loss on its investment in its associate. At each reporting date, the Company determines whether there is objective evidence that the investment in the associate is impaired. If there is such evidence, the Company calculates the amount of impairment as the difference between the recoverable amount of the associate and its carrying value, and then recognizes the loss in the statement of profit or loss.
When necessary, the Company makes adjustments to the accounting policies of associates to ensure consistency with the policies adopted by the Company. In addition, the equity method of these companies is measured on their most recent financial statements.
| 4.3.2 | Joint ventures |
A joint venture is a joint arrangement whereby two or more parties that have joint control of the arrangement have rights to the net assets of the joint arrangement. Joint venturecontrol exists only when decisions about the relevant activities require unanimous consent of the parties sharing such control. The accounting treatment for the recognition of joint ventures is the same as investments in associates.
| 4.4 | Joint operations |
A joint operation is a type of joint arrangement whereby the parties that have joint control of the arrangement have rights to the assets and obligations for the liabilities, relating to the arrangement.
Joint operation contracts are entered into between Ecopetrol and third parties in order to share the risk, secure capital, maximize operating efficiency and optimize the recovery of reserves. In these joint ventures,operations, one party is designated as the operator to execute the expense and investment budget and report to partners according to their participation interests. EachFurthermore, each party takes its share of the hydrocarbons (crude oil or gas) produced according to its agreed participation.
Ecopetrol S.A. and Subsidiaries
Notes to the Consolidated Financial Statements
Years ended December 31, 2014, 2013 and 2012
(Expressed in millions of Colombian pesos)their production share.
When Ecopetrol participates as a non-operator partner, it records the assets, liabilities, sales revenues, costs and expenses based on information reported by the operators.operators' report. When Ecopetrol is the direct operator of the joint venture contracts, it records 100%its percentage of the assets, liabilities, sales revenues, costs and expenses, recognizing, on a monthly basis, the distribution based on each partner’s participation interests in the line items corresponding to assets, liabilities, expenses, costs and revenues assigned to the associate by said participation.sales revenues.
CashNon-current assets are classified as held for sale if their carrying values will be recovered principally through a sale transaction rather than through continued use. Non-current assets are classified as held for sale only when the sale is highly probable within one year from the date of classification and cash equivalentsthe asset (or group of assets) is available for immediate sale in its present condition. These assets are represented by negotiable investments with maturity dates that fall within ninety (90) daysmeasured at the lower of their acquisition,carrying amount and are recorded as liquidity management investments.fair value less related disposal costs.
Cash from joint operations in which the Company is the operating partner corresponds to advances from partners (including the companies in the group), according to their contractually agreed participation percentages, and funds are managed in a joint operation exclusive-use bank account.
| F-23 |
Ecopetrol S.A. Notes to Consolidated Financial Statements (Figures expressed in millions of Colombian pesos, unless otherwise stated) |
Ecopetrol and the Companies in the group enter into financial hedging agreements to hedge against international fluctuations in crude-oil prices, product prices and exchange rates. The difference between the contract value and market value, generated by hedging operations, is recognized as financial income or expense in the statement of Financial, Economic, Social and Environmental Activity. The Group does not use said financial instruments for speculative purposes.
The investments are classified as: i) liquidity management investments, ii) investments for policy purposes, and iii) equity investments.
Their values are updated using the equity method, as established in CGN Resolution 145 of 2008.
Investments in entities in which Ecopetrol and/or its subsidiaries exert significant influence are recorded using the equity method.
Significant influence is defined as the power the entity has, whether or not the percentage of ownership is 50% or lower, to participate in setting and directing the financial and operational policies of another entity for the purpose of obtaining profits from that entity.
Significant influence may be present in one or more of the following ways:
For foreign subsidiaries, the equity method must be applied in the Colombian legal currency, prior translation of the foreign-currency financial statements.
Ecopetrol S.A. and Subsidiaries
Notes to the Consolidated Financial Statements
Years ended December 31, 2014, 2013 and 2012
(Expressed in millions of Colombian pesos)
Equity investments in uncontrolled entities include low or minimum trading shares, or shares not listed on an exchange. They do not enable any type of control or significant influence and are recorded at historical cost; their change in value arises from periodically comparing the cost of the investment to its intrinsic value or its market value.
Investments made in foreign currency are recognized applying the TRM on the transaction date. The amount should be periodically restated based upon the TRM, provided that the valuation methodology does not consider it.
Changes in equity generated by an adjustment for conversion of a controlled entity are recorded as equity method surplus, without prejudice to a debit balance in the sub-account, the foregoing is in compliance with CGN resolution 193 of July 27, 2010.
Accounts and notes receivable are recorded at their original amount or at the value accepted by the debtor, subject to periodic updating according to legal provisions in effect, or according to agreed upon contract terms.
The accounts receivable allowance is reviewed and updated periodically based on the age of the balances and the recovery analysis of individual accounts. The Group carries out the necessary administrative and legal steps to recover overdue accounts receivable and to collect interest from clients who do not comply with payment policies.
Accounts and notes receivable are only written off against the allowances when there is reasonable legal or material certainty of the total or partial loss of the incorporated or represented right.
Inventories include assets extracted, in production process, transformed or acquired for any reason, for the purpose of being sold, transformed and consumed in the production process, or as part of services delivered. A perpetual inventory system is used.
Inventories are stated at historical cost or at purchase price, including direct and indirect charges incurred to prepare the inventory for sale or production.
The value of inventories is measured using the weighted average cost method, taking into account the following parameters:
Raw materials and supplies in joint ventures are controlled by the operator and reported in a joint account at the acquisition cost (recorded in the original currency at average costs). Inventory consumption is charged to the joint venture as a cost, expense or investment, as appropriate.
Furthermore, inventories are valued at market cost or average cost, whichever is lower, and in-transit inventories are valued at actual cost incurred. At the end of the fiscal year allowances are calculated to take into account impairment, obsolescence, excess, or loss of market value.
| Property, plant and equipment |
Recognition and measurement
Property, plant and equipment are recordedstated at historical cost which includes: a)less accumulated depreciation and accumulated impairment losses. Tangible components related to natural and environmental resources are part of property, plant and equipment.
The initial cost of an assets comprises its purchase price or construction cost, including import duties and non-refundable purchase taxes, any costs directly attributable to bringing the asset into operation, costs of employee benefits arising directly from the construction or acquisition, borrowing costs incurred that are attributable to the acquisition and construction of qualifying assets and start-up costs; b) financial expenses and exchange differences on liabilities incurred in foreign currency from their acquisition up until commissioningthe initial estimate of the asset; c) for assets acquired with specific debt, financial revenues fromcosts of dismantling and abandonment of the unused portion of financial obligations acquired to finance the investment projects; and d) adjustments for inflation accumulated up until December 31, 2001.item.
WhenSpare parts and servicing equipment are recorded as inventories and recognized as an asset is sold or retired,expense as they are used. Major spare parts and stand-by equipment that the adjusted costentity expects to use during more than one period are recognized as property, plant and accumulated depreciation are written off and anyequipment.
Any gain or loss arising from the disposal of a property, plant and equipment item is recordedrecognized in profit or loss of the year’s results.period.
DepreciationSubsequent disbursements
They correspond to all payments to be made on existing assets in order to increase or extend the initial expected useful life, increase productivity or productive efficiency, allow for significant reduction of operating costs, increase the level of reserves in exploration or production areas or replace a part or component of an asset that is calculated onconsidered critical for the total acquisition costoperation.
The costs of repair, conservation and maintenance of a day to day nature are expensed when incurred. However, disbursements related to major maintenance are capitalized.
Depreciation
Property, plant and equipment is depreciated using the straight-line method, except for those associated with exploration and production activities which are depreciated using the units-of-production method. Technical useful lives are updated annually considering factors such as: additions or improvements (due to parts replacement or critical components for the asset’s operation), technological advances, obsolescence and other factors; the effect of this change is recognized from the period in which it was executed. Depreciation of an asset starts when it is ready to be used.
Useful lives are determined based on the assets’period over which an asset is expected to be available for use, physical exhaustion, technical or commercial obsolescence and legal limits or restrictions over the use of the asset.
The estimated useful life which is reviewed periodically. Annual depreciation rates are:are as follows:
| Plant and equipment | 7 - 56 years | |||
| 10 - 53 years | ||||
| Buildings | 19 - 72 years | |||
| Other | 3 - 38 years | |||
Land is recorded separately from buildings and facilities and they are not subject to depreciation.
Depreciation methods and useful lives are reviewed annually and adjusted if appropriate.
Ecopetrol S.A.
Notes to Consolidated Financial Statements (Figures expressed in millions of Colombian pesos, unless otherwise stated) |
| Natural and environmental resources |
The Group followsRecognition and measurement
Ecopetrol uses the successful efforts method of accountingto account for investments in exploration and production or development. Expensesof crude oil and gas activities, following the provisions of IFRS 6 – Exploration for geological, geophysical, and seismic studies are recorded asexpenses as they are incurred.the evaluation of mineral resources.
Exploration costs
Acquisition and exploration costs are capitalizedrecorded as exploration and evaluation assets until the determination of whether the exploration drilling is successful or not; if determined to be unsuccessful, all costs incurred are recognized as expenses in the statement of profit or loss.
Exploration costs are those incurred with the objective of identifying areas that are considered to have prospects of containing oil and gas reserves, including geological and geophysical, seismic costs, viability, and others, which are recognized as expenses when incurred. Furthermore, disbursements associated with the drilling of exploratory wells and those related to stratigraphic wells of an exploratory nature are charged as assets until it is determined whetherif they are commercially viable; otherwise, they are expensed in the profit or loss as as dry wells expense. Other expenditures are recognized as expenses when incurred.
An exploration drilling was successfuland evaluation asset shall no longer be classified as such when the technical feasibility and commercial viability of extracting a mineral resource are demonstrable. Exploration and evaluation assets shall be assessed for impairment, and any impairment loss recognised, before reclassification.
All capitalized costs are subjected to technical and commercial revisions at least once a year to confirm continuity to develop and produce such fields; otherwise, these costs are transferred to profit or not. If it is not successful, allloss.
Exploration costs are net of the revenues obtained from the sale of crude oil during the extensive testing period, net of cost of sales, since they are considered necessary to complete the asset.
Development Costs
Development costs correspond to those costs incurred are charged to expenses.obtain access to proved reserves and to provide facilities for extracting, treating, gathering and storing. When a project is approved for development, the accumulated value of the acquisition and exploration costs is classified as natural and environmental resources and costs subsequent to the exploration phase are classifiedcapitalized as development costs of the properties that contain such natural resources. All development costs are capitalized, including drilling costs of unsuccessful development wells.
Production costs
Production costs are those incurred to operate and maintain productive wells, and are part of the corresponding equipment and facilities. The production activity includes extraction of oil and gas to the surface, its gathering, treatment and processing as well as storage in the oil investment account, including financial expenses and the exchange difference on attributable financial obligations and field abandonment costs. Asset and liability balances related to asset retirementfield. Production costs are updated annually. expenses in profit and loss as incurred unless they add oil and gas reserves, in which case they are capitalized.
Production and support equipment is accounted for on a historicalrecognized at cost basis and is included inpart of property, plant and equipment subject to depreciation.
Oil investmentsCapitalized costs also include decommissioning, dismantling, retiring and restoration costs, as well as the estimated cost of future environmental obligations. The estimation includes plugging and abandonment costs, facility dismantling and environmental recovery of areas and wells. Changes arising in new abandonment liability estimations and environmental remediation are amortized by applyingcapitalized in the amortization factor based on technical unitscarrying amount of productionthe related asset.
| F-25 |
Ecopetrol S.A. Notes to Consolidated Financial Statements (Figures expressed in millions of Colombian pesos, unless otherwise stated) |
Depletion
Depletion of natural and provenenvironmental resources is determined using the unit-of-production method per field, using proved developed reserves per field, after royalties, estimated as of December 31 of the immediately preceding year. The amortization charged to results is adjusted at the end of December, recalculating the DD&A (Depletion, Depreciation and Amortization) as of January 1 of the current year,a base. Amortization factors are reviewed annually, based on the reserve study updated atreport and the endimpact of changes of such factors on the current year.amortization is recognized prospectively in the financial statements.
Oil investments are reviewed for possible impairment in their recoverable value when events or changes in circumstances indicate that their book value may be impaired. If circumstances require an oil or gas asset to be tested for possible loss, the Company will compare the expected undiscounted cash flows of the assets with their book value. If the asset’s book value is not recoverable from undiscounted future cash flows, an allowance is recorded in the amount by which the book value exceeds its fair value.
In the same way that it receives property, plant and equipment upon termination of a partnership contract, Ecopetrol receives, at no cost, the associate´s percentage share on amortizable oil investments that were an associate’s property.
Ecopetrol has established a corporate process for reserves led by the Reserves Corporate Management, which reports directly to the Vice-President Corporate Finance. The reserves are audited by internationally recognized external consultants and approved by the Company’s Board of Directors. ProvenProved reserves consist of the estimated quantities of crude oil and natural gas demonstrated with reasonable certainty by geological and engineering data to be recoverable in future years from known reserves under existing economic and operating conditions, that is, at the prices and costs that apply at the date of the estimate.estimation.
Estimating hydrocarbon reserves isImpairment
Assets associated to exploration, evaluation and production are subject to several uncertainties inherentreview for possible impairment in determining proven reserves, includingtheir recoverable amount. See notes 3.2 – Asset impairment (recovery) and 4.12 - Impairment in the value of assets.
| 4.8 | Capitalization of borrowing costs |
Borrowing costs related to the acquisition, construction or production recovery rates,of a qualifying asset that requires a substantial period of time to get ready for its intended use are capitalized as part of the timelinesscost of such asset when it is probable that future economic benefits associated with the item will flow to the Company and costs can be measured reliably. Other borrowing costs are recognized as finance costs in making the investmentsperiod in which they are incurred. Projects that have been suspended but that the Company intends to develop oilfieldscontinue pursue their developing in the future, are not considered qualifying assets for the purpose of capitalization of borrowing costs.
| 4.9 | Intangibles assets |
Intangible assets with a defined useful life, which were acquired separately, are stated at cost less accumulated amortization and any impairment loss. Intangible assets are amortized under the straight line method, over their estimated useful lives. The estimated useful lives and amortization method are revised at the end of each reporting period; any change in the estimates is recognized on a prospective basis.
The disbursements in relation to research activities are expensed as incurred.
| 4.10 | Goodwill |
Goodwill is initially measured at cost (being the excess of the aggregate of the consideration transferred and the degreeamount recognised for non-controlling interests and any previous interest held over the net identifiable assets acquired and liabilities assumed). After initial recognition goodwill is measured at cost less any accumulated impairment loss. Goodwill is not amortized but annually tested for impairment.
| 4.11 | Leases |
Leases are classified as finance leases whenever the terms of maturitythe lease transfer substantially all the risks and rewards of fields.ownership. All other leases are classified as operating leases.
Assets held under finance leases, when Ecopetrol is the lessee, are recognized in the statement of financial position at an amount equal to the fair value of the leased asset or, if lower, the present value of the minimum lease payment. These assets are depreciated over the asset's useful life. When a well locatedthere is no reasonable certainty that the company will obtain ownership of the asset at the end of the contract, the leased assets are depreciated in an exploration areathe shortest period between the asset estimated useful life and the lease term.
| F-26 |
Ecopetrol S.A. Notes to Consolidated Financial Statements (Figures expressed in millions of Colombian pesos, unless otherwise stated) |
The corresponding liability to the lessor is determined to have no proven reserves, it is classifiedincluded in the consolidated statement of financial position as a dry wellfinance lease obligation, in the loans and financing line item.
Lease payments are apportioned between financial charges and reduction of lease liabilities in order to achieve a constant rate of interest on the liability remaining balance. Interest expenses are recognized immediately in the statement of profit or non-commercial well and its accumulated costsloss.
Operating lease payments are recordedrecognized as an expense on a straight-line basis over the lease term, except where another systematic prorating basis is more representative of the time pattern of economic benefits from the lease. Contingent rentals arising under operating leases are recognized as an expense in the same year duringperiod in which such determination is made.
Since Ecopetrol became an issuer on the Colombian Stock Exchange (Bolsa de Valores de Colombia - BVC) and the New York Stock Exchange - NYSE, the Company has applied the methodology approved by the SEC (Securities Exchange Commission) for estimating reserves.
In accordance with the provisions of Resolution 494 of December 22, 2009, issued by the National Hydrocarbons Agency (ANH, Agencia Nacional de Hidrocarburos), Ecopetrol is in compliance with the release of information to the ANH using the SEC methodology. Reserves contained in the reportsthey are audited by three independent specialized firms.
Ecopetrol S.A. and Subsidiaries
Notes to the Consolidated Financial Statements
Years ended December 31, 2014, 2013 and 2012
(Expressed in millions of Colombian pesos)incurred.
Deferred charges include: i) deferred income taxIn order to evaluate the recoverable amount of tangible and deferred income tax for equality - CREEintangible assets, Ecopetrol compares the carrying amount with its recoverable amount at the end of each reporting period or earlier, if there is any indicator that an asset may be impaired.
In order to make an impairment analysis, the assets are grouped into cash generating units (CGU), provided that those assets individually considered do not generate cash inflows that, to a greater extent, are independent from those generated by temporary differencesother assets or CGUs. The group of assets in different CGUs requires the exercise of professional judgment and the consideration, among other parameters, of the business segments. In this sense, in the segment of Exploration and Production, each CGU corresponds to each one of the different contractual areas commonly called “fields”; by exception, in those cases in which the cash inflows generated by several fields are interdependent on each other, those fields are grouped into a single CGU. In the case of the Refining and Petrochemicals segment, the CGU´s correspond to each one of the refineries of the group and for the segment of Transportation each pipeline is taken as an independent CGU.
The recoverable amount of the asset is the higher of the fair value less costs of disposal or its value in use. If the recoverable amount of an asset (or of a CGU) is lower than its net carrying amount, such amount (or that of the CGU) is reduced to its recoverable amount, recognizing a loss for impairment of value in the results of the period.
The fair value less costs of disposal will be greater than the value in use for the asset’s production segment due to use of the value in use methodology has some significant restrictions included in future cash flows, as the following: a) future capital expenses that improve the CGU performance, which could result in expected increase of net cash flows, and b) items before taxes that reflect specific business risks, resulting on a higher discount rate.. The recoverable amount of assets in the business segments is the highest between the basis for determining accounting incomefair value less costs of disposal and taxable incomevalue in use.
The fair value less costs of disposal is determined as the sum of the future discounted cash flows adjusted to the estimated risk. The estimations of future cash flows used in the current year,evaluation of impairment of assets are made with projections of commodity prices, supply and whichdemand estimations and the margins of the products. In case of assets or cash generating units engaged in the evaluation and exploration of reserves, proved, probable and possible reserves are determined basedconsidered, with a risk factor associated to them also being considered.
The calculations are verified with valuation multiples, quoted prices of stock in companies comparable to Ecopetrol.
Once a loss for impairment of value has been recorded, future amortization expense is calculated on the tax rates applicable when said differences are expectedbasis of the adjusted recoverable amount. Impairment losses may be reversed only if the reversal is related to reverse; ii) discountsa change in issuanceestimations used after the loss for impairment was recognized. These reversals shall not exceed the carrying amount of bonds and government securities; and iii) the equity tax, which was amortized upassets net of depreciation or amortization that would have been determined if neither the impairment had ever been recognized, nor the recoverable amount on the date of assessment of the impairment.
| F-27 |
Ecopetrol S.A. Notes to Consolidated Financial Statements (Figures expressed in millions of Colombian pesos, unless otherwise stated) |
In the reclassification of any non-current asset to 2014.assets held-for-sale, the carrying amount of these assets is revised to its fair value less costs of disposal. No other provision for depreciation, depletion or amortization is recorded if the fair value less costs of disposal is lower than the carrying amount.
Other assets include goodwill, which corresponds to the difference between the purchase value of equity investments in controlledProvisions are recognized when Ecopetrol has a current obligation (legal or joint-control entities, and their intrinsic value, which reflects the economic benefits expected to be achieved from the investment, created by brand name, specialized personnel, preferential credit reputation, prestige due to sale of better products and services, favorable location and the expectations of new businesses, among other things.
Goodwill is amortized using the straight-line method over the term for expected recovery of the investment, which is 10 to 18 years. At the close of each accounting period, the Group must evaluate goodwill to determine whether the conditions for the generation of future economic benefits still exist; otherwise, the asset must be impaired. If the carrying value of the equity investment plus the carrying value of goodwill, which includes its historical cost including all price adjustments and amortizations, is greater than the market value, the asset shall,implied) as a result of such difference,a past event, it is probable that Ecopetrol will be impaired inrequired to settle the obligation, and a reliable estimation can be made of the amount of the obligation. Where applicable, they are recorded at present value, using a rate reflecting the liability specific risk.
Disbursements related to the conservation of the environment for current or future operations, are accounted for as expenses or assets, as the case may be. Disbursements related to operations of the past that do not contribute to the obtaining of current or future income, are charged to expenses.
The creation of these provisions coincides with the identification of an obligation related to environmental remediation and Ecopetrol has adequate information to determine a reasonable estimation of the related period, with a charge to results, and the reasons for said impairment shall be disclosed.cost.
Intangible assets such as software, licenses and patentsContingent liabilities are not recognized at acquisition, development or production cost. Intangible assets are amortized using the straight-line method over the periods during which the benefits arising from the incurred costs and expenses are expected to occur, or during the term of the legal or contractual coverage of the granted rights.
Assets acquired under financial leasesbut are subject to depreciationdisclosure in order to recognize the lossexplanatory Notes whenever the outflow of operational capacity due to their use.resources is possible; including those which values cannot be estimated.
WorksWhenever expected that the provision is reimbursed, either in whole or in part, for example by virtue of an insurance contract, the reimbursement is recognized as a separate asset only in cases in which such reimbursement is almost certain. The expense corresponding to any provision is presented in the profit or loss statement in the line that best reflects the nature of the provision, net of any related reimbursement, to the extent that it is almost certain.
If the effect of the time value of money is significant, the provisions are discounted using the current market rate before taxes reflecting, as applicable, the liability specific risks. When recognizing the discount, the increase of the provision resulting from time elapsed is recognized as financial cost in the profit or loss statement.
Asset retirement obligation
Liabilities associated to the retirement of assets are recognized when there are current obligations, either legal or implied, related to the abandonment and improvements on leasehold propertydismantling of wells, facilities, pipelines, buildings and equipment. The obligation is usually acquired when the assets are installed or third party property other than propertythe surface or the environment are altered at the operating sites. These liabilities are recognized using the discounted cash flow method, at all rate before taxes reflecting current market evaluations of a similar risk liability and considering the economic limits of the field or the useful life of the respective asset. When it is not possible to determine a reliable estimation in the period in which the obligation originates, a provision is recognized when there is sufficient information available to make the best estimation.
The carrying amount of the provision is reviewed and adjusted annually considering changes in the variables used for its estimation, using a rate that can be recognizedreflects the liability specific risk. Any change in the present value of the estimated expenditure is reflected as an adjustment to the provision and the corresponding property, plant and equipment are amortized duringand natural and environmental resources. When a decrease in the asset retirement obligation related to a producing asset exceeds the carrying amount of the asset, the excess is recognised the Consolidated statement of profit or loss. The financial cost of updating these liabilities is recognized in results for the period established in the contract covering the use of such property, or the estimated useful life of the property, whichever is shorter, resulting from additions or improvements made, only when the cost of said works and improvements is not reimbursable.as financial expense.
| F-28 |
Ecopetrol S.A. Notes to Consolidated Financial Statements (Figures expressed in millions of Colombian pesos, unless otherwise stated) |
Valuations of assets that are part of equity include:
The methodology used for plant and equipment appraisals is the current use value (CUV) for running businesses, for the economic valuation of assets, taking into account a facilities’ current conditions and useful life in terms of production capability and ability to generate income.
When the recoverability of the accounting value of oil and gas tangible assets is evaluated, and their accounting value is found to exceed their fair value, the difference is recorded as a decrease in the valuations of said assets and charged against the valuation surplus until the latter has been exhausted. Any additional default is recorded as a loss in the results statement.
It is not mandatory to adjust the value of movable property when its historical value, taken individually, is lower than 35 current monthly legal minimum wages, or of property, plant and equipment located in high risk zones.
Public credit operations pertain to any actions undertaken or contracts entered into, in compliance with legal regulations governing public credit, to supply the Company with resources, goods and services under specific payment terms such as loans, issue and placement of bonds and public credit securities, and suppliers’ credit.
Ecopetrol S.A. and Subsidiaries
Notes to the Consolidated Financial Statements
Years ended December 31, 2014, 2013 and 2012
(Expressed in millions of Colombian pesos)
With respect to loans, public credit operations must be recorded for the actual disbursed amount, while bonds and securities placed are recorded at their par value. Issuance costs are carried directly to expenses.
| Income tax and |
The provisionIncome tax expense is comprised of income tax payable for the period (including, income tax and income tax for equality (CREE)- CREE, as appropriate) and the effect of deferred taxes in each period.
Current income taxes are recognized in income except when they relate to items recognized in other comprehensive income, in which case the tax is calculated by applyingrecognized in equity. Income tax assets and liabilities are presented separately in the effective tax rate, asConsolidated Statement of the closeFinancial Position except where there is a right of the correspondingset-off within fiscal year,jurisdictions and an intention to settle such balances on the pre-tax taxable income.a net basis.
| 4.14.1 | Current income tax |
The effectCompany determines the provision for income tax based on the highest amount between taxable income and presumptive income (the minimum estimated amount of temporarytaxable profit on which the law expects to quantify and collect the income tax). Taxable income differs from profit before tax as reported in the consolidated statement of profit or loss, because of: items of income or expense that are taxable or deductible in other periods, special taxable deductions, tax losses and income and line items measured that, according to applicable tax laws in each jurisdiction, are considered nontaxable or nondeductible.
| 4.14.2 | Deferred income tax |
Deferred tax is accounted for according to the liability method. Deferred tax assets and liabilities are recognized for future tax consequences attributable to differences between the basis for determining accounting incomecarrying amounts of existing assets and taxable incomeliabilities in the current yearconsolidated financial statements and their respective tax bases. A deferred tax liability is recorded as arecognized for all taxable temporary differences. A deferred tax asset or liability,is recognized for both incomeall deductible temporary differences and for all tax and income tax for equality (CREE) and the corresponding surcharge,losses to be amortized, insofar as appropriate, provided that there is a reasonable expectation that the Company will have future tax profits with which it may offset such differencestemporary differences.
Deferred taxes on assets and liabilities are calculated based on tax rates that will be reversed forapplied to taxable income during the years in which temporary differences between the carrying amounts and tax bases are expected to be reversed.
The carrying amount of a deferred tax asset is subject to review at the end of each reporting period and it is reduced to the extent it is estimated probable that there will not be enough future taxable profit that allows the total or partial recovery of the asset.
Consolidated deferred tax, is calculated as the sum of the deferred tax asset,in the individual financial statements of the companies of the Ecopetrol Business Group adjusted by deferred taxes on business combinations, inter-company transactions or sufficient taxable income is generated to recover taxes. Deferred income tax is calculatedother adjustments at the rates established by current legislation.a consolidated level.
The determinationDeferred taxes are not recognized when they arise in the initial recognition of an asset or liability in a transaction (except in a business combination) and at the time of the taxable income basistransaction, does not affect the accounting or tax profit, or in respect of the taxes on the possible future distribution of accumulated profits of subsidiaries or investments accounted for by the withholdingequity method, if at the time of incomethe distribution it may be controlled by Ecopetrol and related taxesit is probable that the retained earnings will be reinvested by the Group companies and, income tax for equality (CREE) is subjecttherefore, will not be distributed to current regulations in each case.Ecopetrol.
The Company recognizes in profit or loss the costs and expenses related to other taxes than the income tax, such as the wealth tax, which is determined based on the tax equity, the industry and commerce tax on income obtained in the municipalities for performance of commercial, industrial and service activities, and the transport tax on volumes loaded in the transport systems. Taxes are calculated in accordance with current tax regulations. For more details, see Note 10.
| F-29 |
Ecopetrol S.A. Notes to Consolidated Financial Statements (Figures expressed in millions of Colombian pesos, unless otherwise stated) |
| 4.15 | Employee benefits |
Salaries and benefits for Ecopetrol staff are governed by the Collective Labor Agreement(Agreement 01 of 1977,1977), and, in their absence, by the Substantive Labor Code. In addition to the legally mandated benefits, employees are entitled to fringe benefits which are subject to the place of work, type of work, length of service, and basic salary. AnnualAn annual interest of 12% is recognized on accumulated severance amounts for each employee, and the payment of indemnitiescompensations is provided for when special circumstances arise that resultresulting in the non-voluntary termination of the contract, without just cause, and in periods other than the probationary period.
For pensions,Ecopetrol belonged to the actuarial calculation includes activespecial pension regime under which allowances are a Company’s responsibility and not a Pension Fund’s responsibility. However, Law 797 of January 29, 2003 and Legislative Act 001 of 2005 determined that Ecopetrol will no longer belong to said regime and that from thereon employees as described in the paragraphs below, with indefinite term contracts, pensioners and heirs, for pension, health care and education plans; similarly, it includes pension bonds for temporary employees, active employees and voluntary retirements. Health care and education obligations do not comprise pension liabilities; they arewould be part of benefit obligations.the General Pension Regime. Consequently, allowances for employees pensioned until July 31, 2010 are still Ecopetrol’s responsibility. Likewise, these employees are entitled to such pension bonus if they worked with Ecopetrol prior to January 29, 2003, but whose labor agreement expired without renewal before that date.
All sociallabor benefits of employees who joined the Company before 1990 are theEcopetrol’s responsibility, of Ecopetrol, without the involvement of any social security entity or institution. The cost of health services for the employee and his/her relatives registered with the Company is determined by means of thea mortality table, prepared based on facts occurring during the year. Similarly, Ecopetrol calculates educational allowances according to experience, based on the annual average cost of each business, subdivided in accordance with the type of studies: Pre-school, elementary, high school and university.
For employees who joined the Company subsequent to the entry into effect of Act 50 of 1990, the Company makes periodic contributions for severance payments, pensions and occupational injurieslabor risks to the funds created for these respective obligations. Similarly, Act 797 of January 29, 2003 determined that Ecopetrol employees who joined the Company as of that date would be subject to the provisions of the General Pension Regime.funds.
Pursuant to Legislative Act 01 of 2005, enacted by the Colombian Congress, the pension regimes excludes the General Social Security System in Colombia expired on July 31, 2010. In accordance with the provisions therein, the Ministry of Social Protection’s judicial pronouncement on the matter and the analysis conducted by Ecopetrol’s labor advisers, it was concluded that those workers who had met the age and continuous or discontinuous service time requirements of the law, the Collective Bargaining Agreement in effect and/or Agreement 01 of 1977, prior to August 1, 2010, had consolidated their right to their pension. It was, however, mandatory for other workers, who were not covered, to join the General Pension System. The pension administrator chosen by the worker (either Colpensiones or Private Pension Fund or whichever may correspond) would be responsible for recognizing and paying the respective pension.
As set out in Decree 941 of 2002, upon approval of the actuarial calculation by the Ministry of Finance in October 2008, and upon approval of the mechanism by the Ministry of Social Protection through the Administration Act of December 29, 2008, the CompanyEcopetrol partially switched overcommuted the value corresponding to monthly pension payments from its pension liabilities, transferring the saidsuch liabilities and their underlying amounts to pension-related autonomous equities (PAP, perfor its acronym in Spanish). The funds transferred, and returns on those funds, cannot be redirected nor they can they be returned to the Company until all of the pension obligations have been fulfilled.
The transferred liability corresponds only to pensioncommuted obligation covers allowances and pension bonds. The portion relating tobonds payments; while health care and education services remains within Ecopetrol’sunder the labor liabilities.liability in charge of Ecopetrol.
At each period end, Ecopetrol S.A. must review the amount reported by the PAP with respect to the value of the pension liability updated based on the latest actuarial computation. In the event that the equity yieldsEmployee-benefits are insufficient to cover 100% of the liability, the Company must recognize an allowance for the difference, which must be funded should the contingency materialize. Ecopetrol remains materially responsible for payment of the pension liabilities.
Ecopetrol S.A. and Subsidiaries
Notes to the Consolidated Financial Statements
Years ended December 31, 2014, 2013 and 2012
(Expressed in millions of Colombian pesos)
Through Resolution 1555 of July 30, 2010, the Superintendence of Finance replaced the mortality tables used to prepare actuarial calculations and stipulated that the effects of the change could be recognized gradually. Subsequently, Decree 4565 of December 7, 2010 modified the accounting standards for amortization of the actuarial calculation in effect up to that date. Pursuant to the new decree, the companies that had amortized 100% of their actuarial calculation at December 31, 2009 could gradually amortize the increase in the actuarial calculation for 2010 using the new mortality tables, up to 2029.
Given the above, in 2010 Ecopetrol modified its accounting policy for amortization of the actuarial calculation of monthly pension payments, pension quotas and bonds (transferred liabilities) and health bonds, and adopted a five-year term to amortize the increase in the 2010 actuarial calculation. At the end of December 2014, the corresponding liabilities are fully amortized.divided into four groups comprised as follows:
PursuantBenefits to employees in the short term mainly correspond to those which payment will be made in the term of twelve months following the closing of the period in which the employees have rendered their services. These mainly include salaries, severance payments, vacation, bonuses and other benefits.
Post-employment benefits of defined contributions correspond to the sale of Ecogas by the National Government,periodic payments for severance, pensions and following specific instructions from CGN,labor risk payments that the Company recordedmakes to the respective funds that assume these obligations in their entirety.
The above benefits are recognized as deferred incomean expense with an associated liability after deducting any already paid amounts.
| F-30 |
Ecopetrol S.A. Notes to Consolidated Financial Statements (Figures expressed in millions of Colombian pesos, unless otherwise stated) |
| b) | Post-employment defined benefit plans |
In the netdefined benefits plan, the Company provides the benefits agreed to current and former employees and assumes the actuarial and investment risks.
The following benefits are classified as long-term defined benefit plans recognized in the financial statements according to the calculations of an independent actuary:
| · | Pensions |
| · | Pension bonds |
| · | Health |
| · | Educational plan |
| · | Retroactive severances |
Liabilities recognized in the statement of financial position in respect of these benefit plans are the present value of the future payment schemedefined benefit obligation at the date of the statement of financial position, less the fair value of plan assets.
The defined benefit obligation is calculated annually by independent actuaries using the projected credit unit method, which takes into account employees’ years of service and, for pensions, average or final pensionable remuneration. This obligation is discounted at its present value using interest rates of high-quality government bonds denominated in connection with Ecopetrol’s debt toward BOMT contractors. These liabilities are duethe currency in 2017,which the year when the contract obligationsbenefits will be fulfilled.paid and of a duration consistent with the plan obligations.
These actuarial calculations involve several assumptions that could differ from the events that will effectively take place in the future. Said assumptions include the determination of the discount rate, future salary increases, mortality rates and future pension increase. Because of the complexity of the calculation, the underlying assumptions and long-term nature of these plans, the obligations for defined benefits are extremely sensitive to changes in assumptions. All key variables are revised at the close of the reported period.
When determining the appropriate discount rate, in absence of a broad high quality bond market, Management considers interest rates corresponding to the class B TES bonds issued by the Colombian Government as its best reference, at an appropriate discount rate with maturities extrapolated in line with the term expected for each benefit plan. The mortality rate is based on the particular country’s rate, which latest version is the RV08 mortality table published in resolution 1555 of October 2010. The future salary and pension increases are linked to the country's future inflation rates. Note 22 - Provisions for employee benefits provides further details on key assumptions used.
The amounts recognized in profit or loss related to employees defined benefit plans are comprised mainly by service cost and the net interest. Service cost includes mainly the increase in present value of the benefit obligation during the period (current service cost) and the amount resulting from a new benefit plan. Plan amendments corresponds to changes in benefits and are usually recognized when all legal and regulatory approvals have been obtained and the effects have been conveyed to the employees involved. The net interest is calculated using the net liability for defined benefits as compared with the yield curve of the discount rate at the beginning of each year for each plan. The net defined benefit liability or asset resulting from actuarial profits and losses, the asset ceiling effect and the asset profitability, excluding the value of recognized in the profit or loss, are recognized in other comprehensive income.
There is no service cost for the pension plan of employees because in their capacity as pensioners there is no service time to which the pension benefit can be charged; in other words, the benefit is 100% cost and is not in the cumulative stage.
When the plan assets exceed the gross obligation, the recognized asset is limited to the lower of the surplus in the defined benefits plan and the ceiling of assets determined using a discount rate based on Colombian Government bonds.
| F-31 |
Ecopetrol S.A. Notes to Consolidated Financial Statements (Figures expressed in millions of Colombian pesos, unless otherwise stated) |
| c) | Other long term benefits |
Other long-term benefit is the five-year term bonus which also considered in the actuarial calculation. This benefit is a cash bond that accumulates annually and is paid every five years to employees. The Company recognizes in profit or loss the service cost, the net financial cost and the adjustment to the obligation of the defined benefit plan.
Termination benefits are recognized only when a detailed plan exists for such process and there is no possibility to withdraw the offer. The Company purchases hydrocarbons thatrecognizes a liability and an expense for termination benefits at the ANH receives from all production in Colombia, at prices established according to section fourearliest date between the date when the offer of Law 756 of 2002such benefits cannot be withdrawn and Resolution 18-1709 of 2003 of the Ministry of Mines and Energy, taking into account international reference prices.
Hydrocarbonsdate when the restructuring costs are also purchased from partners and other producers in Colombia and abroad to meet the Group’s needs and operating plans.recognized.
RevenueSales revenue from crude oil and natural gas sales is recognized at the time of transfer of title to the buyer, including risks and rewards.rewards of ownership. In the case of refined and petrochemical products, sales revenue is recognized when products are shipped by the refinery and subsequently adjusted in accordance with the volumes actually delivered. Revenueprice changes when dealing with regulated price products. Sales revenue from transportation services is recognized when products are transported and delivered to the buyer in accordance with sale terms. In all other cases, sales revenue is recognized at the time it is earned and a true, probable and quantifiable right to demand its payment arises.
Under current regulations, Ecopetrol and Refinería de Cartagena S.A,S.A., sell regular gasoline and mid-distillates at a regulated price,price.
In accordance with Decree 1068 of 2015, the Ministry of Mines and Energy calculates semi-annually and settles Ecopetrol’s net position to be stabilized for each fuel by the Fuel Price Stabilization Fund (FEPC, for its acronym in Spanish). The net position is calculated by adding all differentials throughout the six-month period and the National Government recognizes forresult is an amount in Colombian pesos in favor of the Company and chargeable to the amountFEPC. The differential is calculated as the volume reported by the Company at the time of the subsidy on regular gasoline and diesel granted to local consumers, which is generatedsale multiplied by adding the difference between the producer’s regulated revenuesinternational parity price and the regulated price. The international parity price;price is the latter is equivalentdaily price of gasoline and diesel oil of the respective month in Colombian pesos, indexed to the opportunity costUnited States of the local product or to the import cost of gas or ACPM at the U.S.America Gulf Coast reference price. Decree 1880 of September 2014 andmarket, calculated in accordance with Resolution 18052218 0522 of 2010 issuedand the Producer Price reference defined by the Ministry of Mines and Energy, regulate the procedureEnergy. Therefore, this difference represents a higher or lower value of sale sales revenues for recognizing subsidies in the event that they exist.Ecopetrol andRefinería de Cartagena S.A.
Costs are recognized at their historic value both for goods purchased for sale and for the accumulated production costs of goods produced and services rendered. Costs are disclosed according to the operation generating them.
Expenses correspond to the amounts required for the development of ordinary activities and include those related to activities caused by extraordinary events. Expenses are disclosed in accordance with their nature and the occurrence of extraordinary events.
Costs and expenses are recognized upon receiptpresented according to their nature; they are detailed in the related disclosures in cost of goods or services or when there is certainty that the economic event will occur. Fuel shortagessales, and losses due to theftadministrative, operating, projects and explosions are recorded as non-operatingother associated expenses.
The Group recognizes an estimated liability for future environmental obligations,financial income and its contra entry is a higher value for natural resource and environmental assets. The estimate includes theexpenses include mainly: a) cost of plugginginterest on loans and abandoning wells, dismantling facilitiesfinancing, except for those that are capitalized as part of the asset cost, b) valuation of profits and losses of financial instruments measured at fair value with changes in profit or loss, c) exchange differences of financial assets and liabilities, except for debt instruments designated as hedging instruments, d) expenses for financial updating of long term liabilities (abandonment costs and pension liabilities), e) dividends derived from equity instruments measured at fair value with changes in other comprehensive income.
| F-32 |
Ecopetrol S.A. Notes to Consolidated Financial Statements (Figures expressed in millions of Colombian pesos, unless otherwise stated) |
| 4.19 | Information by business segment |
Ecopetrol presents the environmental recoveryrespective disclosures relative to its business segments in its consolidated financial statements in accordance with paragraph 4 of areasIFRS 8 - Operation segments.
The operation of the Ecopetrol Business Group is performed through three business segments: 1) Exploration and wells. Amortizationproduction, 2) Transport and logistics, and 3) Refining, petrochemical and biofuels. This segmentation is recorded as production costs, using the technical units-of-production method, based on remaining proved developed reserves. Changes resulting from new estimatesmanagement of liability for abandonmentobjectives and environmental restorationcorporate strategic plan, considering that these businesses: (a) are accounted for underengaged in differential commercial activities, which generate sales revenues and incur costs and expenses; (b) the corresponding asset.
Ecopetrol S.A. and Subsidiaries
Notesoperational results are revised regularly by the Group's Governance that makes operational decisions to allocate resources to the Consolidated Financial Statements
Years ended December 31, 2014, 2013various segments and 2012
(Expressed in millions of Colombian pesos)
Depending on the scope of certain partnership contracts, field abandonment costsassess their performance; and (c) there is differentiated financial information available. Internal transfers represent sales to inter-company segments and are taken on by partners according to the same participation percentages set out in each contract. Ecopetrol has not allocated funds to cover these obligations, with the exception of the Casanare, Orocue, Garcero, Estero, Corocora, Monas, Guajira, Tisquirama, Cravo Norteregistered and Opon partnership contracts; however, as activities linked to field abandonment take place, they will be covered by the Group.presented at market prices.
| 2) | Transport and logistics- This segment includes sales revenues and costs associated with the transport and distribution of hydrocarbons, derivatives and products operation. |
| 3) | Refining and petrochemicals- This segment mainly includes activities performed at the Barrancabermeja and Cartagena refineries, where crude from production fields is transformed. The sales revenues from products are realized to other segments and domestic and foreign customers and include refined and petrochemical products at market prices and some fuels at regulated price. This segment also includes industrial service sales to customers. |
| F-33 |
Ecopetrol S.A. Notes to Consolidated Financial Statements (Figures expressed in millions of Colombian pesos, unless otherwise stated) |
| 5. | New standards issued by the IASB |
OnThe following rules, interpretations and amendments issued by the date of issuance of these consolidated Financial Statements, conditions might exist that could result in losses for the Company that will only be known if specific future circumstances arise. The nature, probability of such situations,IASB are applicable to yearly periods commencing on January 1, 2017 and the amounts involved are evaluated by Management, the Vice-President of Legal Affairs, and legal consultants, so that decisions can be made regarding changes to amounts provisioned and/or disclosed. This analysis includes current legal suits against the companies of the Group.
For the assessment of the contingencies lawsuits and arbitrations filed against Ecopetrol, a methodology is established based on procedural risk indicators, strength of lawsuits, sufficiency of evidences, strength of contestation, and case law background.thereon:
| - | IFRS 15 "Sales revenues from Ordinary Activities in Contracts with Customers" and its amendments provide a five-step model to measure sales revenues derived from contracts with customers. In accordance with IFRS 15, the sales revenue is recognized as an amount reflecting the offsetting that an entity expects to be entitled to in exchange for transferring goods or services to a customer. The principles of IFRS 15 suppose a more structured approach to value and register sales revenues. A full or partial retroactive application is required for periods commencing on January 1, 2018. The Company plans to adopt the new standard by using the modified retrospective method and keeps assessing its impact on the consolidated financial statements. |
CreditorThis new standard is applicable to all entities and debtor memorandum accounts represent the estimated value of facts or circumstances that could affect the Company’s financial, economic, social and environmental situation. They also disclose the value of the goods, rights and obligations that require control, the amount of the claimswill derogate all previous standards on litigations and lawsuits of uncertain resolution, and differences between accounting information and the information used for tax purposes, among others.sales revenue recognition.
Net earnings per share is calculated based on net earnings for the year, divided by the weighted average number of subscribed shares in circulation.
The Company does not have share-based employee incentive plans.
| - | Amendments to IAS 12:Recognition of Assets for Deferred Taxes for Unrealized Losses. These amendments clarify how to register assets for deferred taxes corresponding to debt instruments measured at fair value. This rule is effective for annual periods commencing on January 1, 2017. |
On December 29, 2012,Ecopetrol is not expecting to adopt the Ministryaforementioned standards before their date of Commerce, Industryimplementation. The impact from these standards is being evaluated by Company Management, particularly IFRS 16, which could affect the recognition of assets and Tourism issued Decree 2784, and on December 27, 2013, said entity issued Decrees 3023 and 3024, regulating Law 1314liabilities in the financial situation statement, as well as the recognition of 2009 setting forthlease charges in the technical regulatory framework for preparersprofit or loss of financial information that comprise group 1: security issuers, public interest entities and large entities that meet certain parameters as defined by said provisions.the period.
This technical framework was prepared basedThere are no new or amended standards or interpretation adopted in 2016 that had a material impact on International Financial Reporting Standards (IFRS), International Accounting Standards (IAS); SIC interpretations, IFRIC interpretations and the conceptual framework forconsolidated financial information, issued in Spanish on January 1, 2012, by the International Accounting Standards Board (IASB).
According to the implementation schedule, 2013 was a preparation period to define implementation plans, and 2014 was a transition period toward full adoption of the new regulatory framework in 2015, which requires the preparation of an opening statement of Financial Position as at January 1, 2014, under the new standards, so as to accomplish the transition during 2014, with the simultaneous application of current and new accounting standards.
The last official financial statements prepared in accordance with the accounting rules and principles of the Colombian Public Accounting Regime correspond to the period ended December 31, 2014, and the first financial statements under the new standards will correspond to 2015, which require a comparison with transition information for 2014.statements.
| F-34 |
Ecopetrol S.A. Notes to Consolidated Financial Statements (Figures expressed in millions of Colombian pesos, unless otherwise stated) |
Ecopetrol S.A. and Subsidiaries
Notes to the Consolidated Financial Statements
Years ended December 31, 2014, 2013 and 2012
(Expressed in millions of Colombian pesos)
Transactions and balances in foreign currency are converted at the representative market exchange rate certified by the Superintendence of Finance of Colombia.
As of December 31, 2014 and December 31, 2013, the consolidated financial statements include the following assets and liabilities denominated in foreign currency (converted to Colombian pesos at the closing exchange rates of $2,392.46 and $1,926.83 per US$1, respectively).
| 2014 | 2013 | |||||||||||||||
| Thousands of dollars | Equivalent millions of pesos | Thousands of dollars | Equivalent millions of pesos | |||||||||||||
| Assets | ||||||||||||||||
| Cash and cash equivalents | 2,088,438 | 4,996,504 | 1,814,012 | 3,495,293 | ||||||||||||
| Investments | 434,825 | 1,040,302 | 1,177,758 | 2,269,340 | ||||||||||||
| Accounts and notes receivable | 1,477,837 | 3,535,666 | 2,222,269 | 4,281,935 | ||||||||||||
| Advances and deposits | 153,979 | 368,390 | 143,544 | 276,584 | ||||||||||||
| Other assets | 143,596 | 343,547 | 470,659 | 906,878 | ||||||||||||
| 4,298,675 | 10,284,409 | 5,828,242 | 11,230,030 | |||||||||||||
| Liabilities | ||||||||||||||||
| Financial obligations | 11,945,733 | 28,579,688 | 7,814,330 | 15,056,886 | ||||||||||||
| Accounts payable | 1,581,418 | 3,783,480 | 1,546,046 | 2,978,968 | ||||||||||||
| Estimated liabilities and provisions | 201,652 | 482,446 | 206,443 | 397,781 | ||||||||||||
| Other liabilities | 187,478 | 448,535 | 247,447 | 476,790 | ||||||||||||
| 13,916,281 | 33,294,149 | 9,814,268 | 18,910,425 | |||||||||||||
| Net liability position | (9,617,606 | ) | (23,009,740 | ) | (3,986,027 | ) | (7,680,394 | ) | ||||||||
The net liability position in 2013 were adjusted relative to the previous year's report, to display the values of financial liabilities and investments in foreign currency shown in the respective–Note 4–Investments and Note 14–Financial obligations from our financial statements. This change has no impact on the Company's reported net income or shareholders' equity.
| Cash and cash equivalents |
The balance of cash and cash equivalents as ofat December 31, 2016 and 2015 is comprised as follows:
| 2014 | 2013 | |||||||
| Banks and corporations (1) | 5,549,330 | 6,440,081 | ||||||
| Fixed-term deposit certificates | 1,384,183 | 906,106 | ||||||
| Special funds (2) | 1,016,938 | 1,494,760 | ||||||
| Cash | 750 | 491 | ||||||
| 7,951,201 | 8,841,438 | |||||||
| 2016 | 2015 | |||||||
| Banks and corporations | 3,319,465 | 4,483,900 | ||||||
| Short-term investments | 5,090,048 | 2,065,731 | ||||||
| Cash | 954 | 819 | ||||||
| 8,410,467 | 6,550,450 | |||||||
Ecopetrol S.A. and Subsidiaries
Notes to the Consolidated Financial Statements
Years endedAs of December 31, 2014, 20132016, it includes restricted cash for COP$114,206 (2015 - COP$108,348), intended for the exclusive payment of principal and 2012interest on loans contracted by Oleoducto Bicentenario and Oleoducto de los Llanos. The use of short-term financial investments depends on the liquidity requirements of the Company.
(Expressed
The fair value of cash and cash equivalents approximates their carrying amount due to their short-term nature and their high liquidity.
The average return on cash and cash equivalents as of December 31, 2016 was 3.5% (2015 - 2.6%). The credit quality of issuers and counterparties in millions of Colombian pesos)transactions involving cash and cash equivalents is described in Note 31.3 – Credit risk.
The balance of investments astrade and other receivables, net of December 31,provision is comprised as follows:follows at December 31, 2016 and 2015:
| 2014 | 2013 | |||||||
| Current | ||||||||
| Variable yield – Shares (1) | 223,925 | 223,925 | ||||||
| Fixed yield | ||||||||
| Term deposits | 248,273 | 954,705 | ||||||
| Bonds and securities of private or foreign entities | 173,286 | 260,991 | ||||||
| Bonds issued by the Colombian Government | 40,599 | 153,343 | ||||||
| Specific purpose fund – legal contingencies (2) | 187,509 | 110,427 | ||||||
| Treasury securities – TES | 99,705 | - | ||||||
| Hedging financial instruments | 113,752 | 179,725 | ||||||
| Trust rights | 153 | 119 | ||||||
| Other investments | 237 | - | ||||||
| Total fixed yield | 863,514 | 1,659,310 | ||||||
| Total current | 1,087,439 | 1,883,235 | ||||||
| Non-current | ||||||||
| Variable yield – Shares (1) | 1,125,147 | 995,819 | ||||||
| Fixed yield | ||||||||
| Bonds and securities of foreign entities | 106,313 | 13,981 | ||||||
| Bonds issued by the Colombian Government | 13,624 | 86,616 | ||||||
| Specific purpose fund – legal contingencies (2) | 360,903 | 260,960 | ||||||
| Other investments | - | 6,296 | ||||||
| Total fixed yield | 480,840 | 367,853 | ||||||
| Total non-current | 1,605,987 | 1,363,672 | ||||||
| 2016 | 2015 | |||||||
| Current | ||||||||
| Customers | ||||||||
| Foreign | 1,366,322 | 1,126,511 | ||||||
| Domestic | 1,180,577 | 1,731,547 | ||||||
| Fuel price stabilization fund (1) | 1,203,811 | 155,789 | ||||||
| Related parties (Note 32) | 97,730 | 64,724 | ||||||
| Industrial services | 60,025 | 34,987 | ||||||
| Employee loans (2) | 42,407 | 50,667 | ||||||
| Other | 261,829 | 263,187 | ||||||
| Total current | 4,212,701 | 3,427,412 | ||||||
| Non-current | ||||||||
| Employee loans (2) | 425,468 | 432,450 | ||||||
| Related parties (Note 32) | 170,121 | - | ||||||
| Fuel price stabilization fund (1) | 77,510 | 77,510 | ||||||
| Other | 56,311 | 74,611 | ||||||
| Total non-current | 729,410 | 584,571 | ||||||
| (1) |
The following is a breakdown of the variable yield investments at December 31, 2014 and December 31, 2013:
| 2014 | 2013 | |||||||
| Companies: | ||||||||
| Significant influence | 1,112,842 | 982,847 | ||||||
| Non-strategic | 236,247 | 236,897 | ||||||
| Less – Investment protection allowance | (17 | ) | - | |||||
| Total | 1,349,072 | 1,219,744 | ||||||
Ecopetrol S.A. and Subsidiaries
Notes to the Consolidated Financial Statements
Years ended December 31, 2014, 2013 and 2012
(Expressed in millions of Colombian pesos)
A summary of long-term investments as of December 31, 2014, recognized by the equity method, is as follows:
| Company | Number of Shares and/or Quotas | Percentage of ownership | Valuation date | Historical cost | Book value | Equity Method Effect | ||||||||||||||||
| Significant Influence | ||||||||||||||||||||||
| Ecodiesel Colombia S. A. | 10,500,000,000 | 50 | December | 10,500 | 38,984 | 28,484 | ||||||||||||||||
| Invercolsa S. A. | 1,213,801,146 | 43.35 | November | 61,671 | 223,481 | 161,810 | ||||||||||||||||
| Offshore International Group | 250 | 50 | December | 396,627 | 801,731 | 405,104 | ||||||||||||||||
| Sociedad Portuaria | 349,992 | 50 | November | 649 | 693 | 44 | ||||||||||||||||
| Serviport S. A. | 58,800,000 | 49 | December | 2,081 | 8,382 | 6,301 | ||||||||||||||||
| Transgas | 27,372,771 | 20 | November | 4,051 | 39,571 | 35,520 | ||||||||||||||||
| Total | 475,579 | 1,112,842 | 637,263 | |||||||||||||||||||
A summary of long-term investments as of December 31, 2013, recognized using equity method, is as follows:
| Company | Number of Shares and/or Quotas | Percentage of ownership | Valuation date | Historical cost | Book value | Equity Method Effect | ||||||||||||||||
| Significant Influence | ||||||||||||||||||||||
| Ecodiesel Colombia S. A. | 10,500,000,000 | 50 | December | 10,500 | 26,677 | 16,177 | ||||||||||||||||
| Invercolsa S. A. | 1,213,801,146 | 43.35 | December | 61,671 | 269,342 | 207,671 | ||||||||||||||||
| Offshore International Group | 250 | 50 | December | 319,434 | 637,778 | 318,344 | ||||||||||||||||
| Serviport S. A. | 58,800,000 | 49 | December | 2,081 | 7,319 | 5,238 | ||||||||||||||||
| Transgas | 27,372,771 | 20 | October | 4,051 | 41,731 | 37,680 | ||||||||||||||||
| Total | 397,737 | 982,847 | 585,110 | |||||||||||||||||||
A summary of long-term investments as of December 31, 2014, recognized by the cost method, is as follows:
| Company | Number of Shares and/or Quotas | Participation Percentage | Valuation Date | Historical Cost | Market/ intrinsic value | Appreciation/ depreciation | ||||||||||||||||
| STRATEGIC | ||||||||||||||||||||||
| Zona Franca de Cartagena S,A, | 290 | 10 | November | 392 | 1,737 | 1,345 | ||||||||||||||||
| Sociedad Portuaria del Dique | 200 | 1 | November | 5 | 35 | 30 | ||||||||||||||||
| Los Arces Group (1) | 10,001 | 100 | December | 5,100 | 5,100 | - | ||||||||||||||||
| Amandine Holding (1) | 500 | 100 | December | 6,657 | 6,657 | - | ||||||||||||||||
| 12,154 | 13,529 | 1,375 | ||||||||||||||||||||
| NON STRATEGIC | ||||||||||||||||||||||
| Empresa de Energía de Bogotá | 631,098,000 | 6.87 | December | 154,376 | 1,072,867 | 918,491 | ||||||||||||||||
| Interconexión Eléctrica S. A. | 58,925,480 | 5.32 | December | 69,549 | 509,944 | 440,395 | ||||||||||||||||
| Concentra Inteligencia en Energía S.A.S. | 168,000 | 9.52 | November | 168 | 149 | (19 | ) | |||||||||||||||
| 224,093 | 1,582,960 | 1,358,867 | ||||||||||||||||||||
| 236,247 | 1,596,489 | 1,360,242 | ||||||||||||||||||||
Ecopetrol S.A. and Subsidiaries
Notes to the Consolidated Financial Statements
Years ended December 31, 2014, 2013 and 2012
(Expressed in millions of Colombian pesos)
A summary of long-term investments as of December 31, 2013, recognized by the cost method, is as follows:
| Company | Number of Shares and/or Quotas | Participation Percentage | Valuation Date | Historical Cost | Market/ intrinsic value | Appreciation/ depreciation | ||||||||||||||||
| STRATEGIC | ||||||||||||||||||||||
| Zona Franca de Cartagena S.A. | 290 | 10 | November | 394 | 1,478 | 1,084 | ||||||||||||||||
| Sociedad Portuaria del Dique | 200 | 1 | November | 5 | 44 | 39 | ||||||||||||||||
| Sociedad Portuaria Olefinas | 249,992 | 50 | November | 649 | 1,462 | 813 | ||||||||||||||||
| Los Arces Group | 10,001 | 100 | December | 5,100 | 5,100 | - | ||||||||||||||||
| Amandine Holding | 500 | 100 | December | 6,657 | 6,657 | - | ||||||||||||||||
| 12,805 | 14,741 | 1,936 | ||||||||||||||||||||
| NON-STRATEGIC | ||||||||||||||||||||||
| Empresa de Energía de Bogotá | 631,098,000 | 6.87 | December | 154,375 | 968,736 | 814,361 | ||||||||||||||||
| Interconexión Eléctrica S. A. | 58,925,480 | 5.32 | December | 69,549 | 536,222 | 466,673 | ||||||||||||||||
| Concentra Inteligencia en Energía S.A,S. | 168 | 9.52 | November | 168 | 150 | (18 | ) | |||||||||||||||
| 224,092 | 1,505,108 | 1,281,016 | ||||||||||||||||||||
| 236,897 | 1,519,849 | 1,282,952 | ||||||||||||||||||||
Restrictions on long-term investments – variable yield:
As of January 10, 2015, regarding the legal proceedings of Invercolsa S.A.: The cessation extraordinary appeal put forth by AFIB S.A. and Fernando Londoño Hoyos against the sentence of the Superior Court of the Judicial District of Bogota – Civil Chamber, on January 11, 2011 and confirming the first instance sentence issued by the 28th Civil Circuit Court on February 8, 2007 have been submitted to the civil chamber of the Supreme Court of Justice. The following proceedings were had during the processing of the aforementioned extraordinary appeal: i) On October 6, 2014, transfer was set for Explotaciones Cóndor S.A., and South American Gula Oil Company –Sagoc, which expired on October 27, 2014; ii) On October 22, 2014, the legal representative of the aforementioned companies, Jorge Buitrago, filed the defence to the aforementioned claim; and, iii) On January 28, 2015, transfers expire and shall be submitted to the Reporting Judge for resolution.
The appeal sentence of January 11, 2011 ordered: i) That the purchase of 145 million shares of Invercolsa by Fernando Londoño Hoyos are to be cancelled; ii) that the cancellation of the said transaction is to be recorded in the shareholders’ book, including the pledge in favor of the Pacífico Colombia y Panamá banks, as well as the payment in kind of the shares of Arrendadora Financiera Internacional Bolivariana S.A.; iii) that Fernando Londoño Hoyos and AFIB are forced to return the Invercolsa dividends, along with the new shares received as profit and/or revaluations; iv) to declare that Fernando Londoño Hoyos did not acquire or possess in good faith the 145 million Invercolsa shares; and v) that Invercolsa is to adjust its operation and the Shareholders’ meeting to the declarations made in the sentence.
The economic activity for the entities in which Ecopetrol Group has direct investments through the equity method is as follows:
Ecopetrol S.A. and Subsidiaries
Notes to the Consolidated Financial Statements
Years ended December 31, 2014, 2013 and 2012
(Expressed in millions of Colombian pesos)
Maturity of fixed-yield investments – non-current
The following is a summary showing the maturity of non-current fixed-yield investments as of December 31, 2014:
| Maturity | >1 - 3 Years | > 5 Years | Total | |||||||||
| Bonds and other fiering securities | 106,312 | - | 106,312 | |||||||||
| Bonds issued by the Colombian Government | 13,625 | - | 13,625 | |||||||||
| Specific destination fund | 336,134 | 24,769 | 360,903 | |||||||||
| 456,071 | 24,769 | 480,840 | ||||||||||
The following is a summary showing the maturity of non-current fixed-yield investments as of December 31, 2013:
| Maturity | >1 - 3 Years | < 5 Years | > 5 Years | Total | ||||||||||||
| Bonds and other fiering securities | 8,251 | 5,730 | - | 13,981 | ||||||||||||
| Bonds issued by the Colombian Government | - | 86,616 | - | 86,616 | ||||||||||||
| Specific destination fund | 217,011 | 1,994 | 41,955 | 260,960 | ||||||||||||
| Others | - | 6,296 | - | 6,296 | ||||||||||||
| 225,262 | 100,636 | 41,955 | 367,853 | |||||||||||||
| Accounts |
The balance of accounts and notes receivable, net, as of December 31, is comprised as follows:
| 2014 | 2013 | |||||||
| Current portion | ||||||||
| Customers | ||||||||
| Domestic | 1,197,370 | 1,121,881 | ||||||
| Foreign | 1,717,447 | 2,943,686 | ||||||
| Price differential to be received from the Ministry of Mines and Energy (1) | 750,055 | 1,058,738 | ||||||
| Various debtors | 358,526 | 988,904 | ||||||
| Reimbursements and yields on investments | 83 | 439 | ||||||
| Accounts receivable from employees | 21,878 | 23,821 | ||||||
| Doubtful accounts | 9,544 | 1,527 | ||||||
| Industrial service clients | 19,337 | 14,594 | ||||||
| Employee loans (2) | 43,884 | 50,844 | ||||||
| Total | 4,118,124 | 6,204,434 | ||||||
| Less – Allowance for doubtful accounts | (9,070 | ) | (27,543 | ) | ||||
| Total current | 4,109,054 | 6,176,891 | ||||||
| Non-current portion | ||||||||
| Domestic | 155,134 | 5,664 | ||||||
| Foreign | 16,530 | 2,506 | ||||||
| Employee loans (2) | 455,637 | 393,158 | ||||||
| Price differential to be received from the Ministry of Mines and Energy (1) | 77,510 | 77,510 | ||||||
| Credit portfolio | 1,349 | 10,227 | ||||||
| Others | 151,470 | 32,195 | ||||||
| Doubtful accounts | 239,455 | 227,372 | ||||||
| Total | 1,097,085 | 748,632 | ||||||
| Less – Allowance for doubtful accounts | (239,455 | ) | (228,576 | ) | ||||
| Total Non-current | 857,630 | 520,056 | ||||||
Ecopetrol S.A. and Subsidiaries
Notes to the Consolidated Financial Statements
Years ended December 31, 2014, 2013 and 2012
(Expressed in millions of Colombian pesos)
The following shows the changes in the allowance for doubtful accounts:
| 2014 | 2013 | 2012 | ||||||||||
| Opening balance | 256,119 | 236,755 | 138,673 | |||||||||
| Additions (new allowances) | 3,332 | 31,681 | 88,441 | |||||||||
| Recovery of allowances | (251 | ) | (2,716 | ) | (5,945 | ) | ||||||
| Accounts receivable write-off | (22,871 | ) | (255 | ) | (78 | ) | ||||||
| Use of allowances | 12,196 | (9,346 | ) | 14,461 | ||||||||
| Closing balance | 248,525 | 256,119 | 235,552 | |||||||||
| (2) | The administration, management and control of loans granted to employees by Ecopetrol were transferred to Cavipetrol (“Corporación de los trabajadores de la Empresa Colombiana de Petróleos Ecopetrol S.A.”), which |
Future collections
| F-35 |
Ecopetrol S.A. Notes to Consolidated Financial Statements (Figures expressed in millions of Colombian pesos, unless otherwise stated) |
The following shows the changes in allowance for doubtful accounts receivable from Cavipetrol as ofrelated to trade and other receivables, provisioned in full, at December 31, 2014 are estimated as follows:31:
| Maturity | Amount | |||
| 2015 | 43,847 | |||
| 2016 | 17,638 | |||
| 2017 | 18,662 | |||
| 2018 and beyond | 399,231 | |||
| 479,378 | ||||
As of December 31, 2014 there are loans made to employees ofEquión amounting to $10,700, Hocol amounting to $8,724; Propilco, $605; Comai, $66;Ecopetrol Oleo e Gas do Brasil Ltda. $11; and Others by $37.
| 2016 | 2015 | |||||||
| Opening balance | 160,406 | 245,114 | ||||||
| Additions (recovery) of allowances | 19,438 | (74,378 | ) | |||||
| Accounts receivable write-off and uses | (35,515 | ) | (10,330 | ) | ||||
| Closing balance | 144,329 | 160,406 | ||||||
| Inventories, net |
The balance of inventories,Inventories, net as of a provision at December 31, 2016 and 2015 is comprised as follows:
| 2014 | 2013 | |||||||
| Finished products | ||||||||
| Crude oil | 664,539 | 1,179,509 | ||||||
| Fuels | 928,666 | 895,384 | ||||||
| Petrochemicals | 131,793 | 87,024 | ||||||
| Purchased products | ||||||||
| Fuels | 102,796 | 124,269 | ||||||
| Crude oil | 310,085 | 419,203 | ||||||
| Petrochemicals | 25,515 | 21,790 | ||||||
| Agricultural Products | 1,625 | 869 | ||||||
| Raw materials | ||||||||
| Crude oil | 101,345 | 31,854 | ||||||
| Petrochemicals | 48,815 | 36,985 | ||||||
| Agricultural Products | 681 | |||||||
| Products in process | ||||||||
| Fuels | 747,633 | 362,929 | ||||||
| Petrochemicals | 16,813 | 11,309 | ||||||
| Packaging material | 1,658 | 1,940 | ||||||
| Materials for the production of goods | 19,619 | 483,117 | ||||||
| Materials in transit | 61,456 | 79,746 | ||||||
| Total | 3,163,039 | 3,735,928 | ||||||
| Less – Allowance for inventories | (139,536 | ) | (110,024 | ) | ||||
| Total | 3,023,503 | 3,625,904 | ||||||
Ecopetrol S.A. and Subsidiaries
Notes to the Consolidated Financial Statements
Years ended December 31, 2014, 2013 and 2012
(Expressed in millions of Colombian pesos)
| 2016 | 2015 | |||||||
| Crude | 1,557,267 | 1,007,275 | ||||||
| Fuels and petrochemicals | 1,270,870 | 1,487,217 | ||||||
| Materials for the production of goods | 1,013,764 | 563,466 | ||||||
| Total | 3,841,901 | 3,057,958 | ||||||
The following shows a breakdown of the changes in the allowanceprovisions for inventories:
| 2014 | 2013 | 2012 | 2016 | 2015 | ||||||||||||||||
| Opening balance | 110,024 | 27,150 | 27,653 | 198,539 | 151,997 | |||||||||||||||
| Allowance increase (decrease) | 29,512 | 82,874 | (503 | ) | ||||||||||||||||
| Additions (recoveries), net | 41,957 | 53,205 | ||||||||||||||||||
| Foreign currency translation | 50,053 | 13,670 | ||||||||||||||||||
| Uses | (25,114 | ) | (20,333 | ) | ||||||||||||||||
| Closing balance | 139,536 | 110,024 | 27,150 | 265,435 | 198,539 | |||||||||||||||
Natural gas imbalance: The Group uses the entitlement method of ownership for gas balancing agreements, through which the quantity of natural gas sold is based upon the shared ownership interest. As of December 31, 2014, the Group showed gas imbalance of $824 (US$ 344,304) in its favor, equivalent to 155,643 MBTU. As of December 31, 2013 the Group showed gas imbalance of $4,142 (US$ 2,064,417) in its favor, equivalent to 516,436 MBTU. The natural gas imbalances are settled through sales or purchases to the partner that are recorded at end of the period.
| F-36 |
Ecopetrol S.A. Notes to Consolidated Financial Statements (Figures expressed in millions of Colombian pesos, unless otherwise stated) |
The balance of advancesother financial assets at December 31, 2016 and deposits as of December 31,2015 is comprised as follows:
| 2014 | 2013 | |||||||
| Current portion | ||||||||
| Official entities (1) | 7,223,443 | 7,845,825 | ||||||
| Partners in joint ventures (2) | 749,598 | 388,276 | ||||||
| Customs agents | 584 | 3,587 | ||||||
| Advanced payments to contractors | 5,558 | 12,610 | ||||||
| Agreements (3) | 28,265 | 19,593 | ||||||
| Advances to employees | 933 | 855 | ||||||
| Advances to suppliers | 321,848 | 343,304 | ||||||
| Total current portion | 8,330,229 | 8,614,050 | ||||||
| Non-current portion | ||||||||
| Advances and deposits | 225,197 | 192,613 | ||||||
| Total non-current portion | 225,197 | 192,613 | ||||||
| Total | 8,555,426 | 8,806,663 | ||||||
| 2016 | 2015 | |||||||
| Assets measured at fair value through profit or loss | ||||||||
| Investment portfolio – Local currency | 2,519,311 | 385,992 | ||||||
| Investment portfolio – Foreign currency | 4,116,987 | 1,189,667 | ||||||
| 6,636,298 | 1,575,659 | |||||||
| Assets measured at amortized cost | 4,152 | 9,364 | ||||||
| Hedging instruments | 46,445 | 356 | ||||||
| Total | 6,686,895 | 1,585,379 | ||||||
| Current | 5,315,537 | 329,227 | ||||||
| Non-current | 1,371,358 | 1,256,152 | ||||||
| 6,686,895 | 1,585,379 | |||||||
The average return on investments in Colombian pesos and US dollars portfolio was 8.1% (2015 - 5.5%) and 0.8% (2015 - 0.5%), respectively. The credit quality of issuers and counterparties in transactions involving the other financial assets is described in Note 31.3 – Credit risk.
The fair value measured is recognized against financial result (see note 30).
| 9.1 | Restrictions |
As of December 31, 2016, no resource of the investment portfolio was restricted. As of December 31, 2015, COP$699,832 related to the Santiago de las Atalayas process were restricted.
On November 6, 2016, through the Ministries of Mines and Energy and Finance and Public Credit the termination of Ecopetrol's condition as sequester in the process for nullity and re-establishment of rights filed against the Comuneros de Santiago de las Atalayas was confirmed. In view of the foregoing, the restricted resources related to this case belong to Ecopetrol (see Note 23.3 - Provisions and contingencies, for further information).
| 9.2 | Maturity |
The following are the maturities of other financial assets at December 31, 2016 and 2015:
| 2016 | 2015 | |||||||
| Up to 1 year | 5,315,537 | 329,227 | ||||||
| 1 - 2 years | 838,786 | 739,337 | ||||||
| 2 - 5 years | 497,204 | 470,375 | ||||||
| > 5 years | 35,368 | 46,440 | ||||||
| 6,686,895 | 1,585,379 | |||||||
| 9.3 | Fair value |
The classification of other financial assets at fair value, corresponding to the investment portfolio is as follows at December 31, 2016 and 2015:
| 2016 | 2015 | |||||||
| Level 1 | 25,066 | 975,262 | ||||||
| Level 2 | 6,611,232 | 600,397 | ||||||
| 6,636,298 | 1,575,659 | |||||||
| F-37 |
Ecopetrol S.A. Notes to Consolidated Financial Statements (Figures expressed in millions of Colombian pesos, unless otherwise stated) |
There were no transfers between hierarchy levels during the years 2016 and 2015.
The securities comprising Ecopetrol's portfolio are valued on a daily basis pursuant to the provisions issued by the Financial Superintendence of Colombia. To this end, the Company uses the information provided by the entities authorized for this purpose, which collect data from active markets. For cases in which market data is not available other directly or indirectly observable data is used.
For dollar-denominated investments the information provider is Bloomberg while for investments denominated in pesos, Infovalmer, an entity authorized by the Financial Superintendence of Colombia.
For the process of establishing levels of the fair value for investments, in addition to the information used for valuation, other relevant aspects are also taken into account, such as the issuer rating, investment rating and issuer risk analysis performed by Ecopetrol, thus making it possible to establish the appropriate hierarchy level for investments.
| 10. | Taxes |
| 10.1 | Current tax assets and tax liabilities |
The balance at December 31, 2016 and 2015 of current tax assets and tax liabilities is comprised as follows:
| 2016 | 2015 | |||||||
| Current tax assets | ||||||||
| Income tax | 308,868 | 3,403,190 | ||||||
| Credit tax balance (1) | 598,140 | 1,098,544 | ||||||
| Other taxes | 222,090 | - | ||||||
| Total | 1,129,098 | 4,501,734 | ||||||
| Current tax liabilities | ||||||||
| Income tax | 1,478,294 | 2,120,398 | ||||||
| National tax on gasoline and surtax on gasoline | 324,402 | 314,723 | ||||||
| Other taxes (2) | 328,244 | 368,438 | ||||||
| Total | 2,130,940 | 2,803,559 | ||||||
| (1) |
| (2) | Consists primarily of the |
Income tax asset is related with prepayments made by the group companies which cannot be offset with the income tax liability because they are generated by different companies.
| 10.2 | Income tax |
The current tax regulations applicable to Ecopetrol for the taxable year 2016 establish that:
| (a) | As of January 1, 2013 until December 31, 2016, taxable income in Colombia is taxed at 25% on account of income tax plus 9% as the surtax on income for equality-CREE, excluding tax |
| F-38 |
Ecopetrol S.A. Notes to Consolidated Financial Statements (Figures expressed in millions of Colombian pesos, unless otherwise stated) |
On December 23, 2014, through Law 1739, a surtax on income for equality - CREE was established for the years 2015, 2016, 2017 and 2018, which is applicable for taxpayers with taxable base above COP$800 million, at rates of 5%, 6%, 8% and 9% per year, respectively.
For taxable year 2016, the Ecopetrol Group has companies that measure taxes at the ordinary income tax rate of 40%. Companies in free trade zones are subject to tax at 15%, some have taxable income calculated based on presumptive income, as explained above, and others with foreign income are taxed at the respective foreign income tax rates.
| (b) | Regarding to current expense for income tax, as of December 31, 2016 and |
Ecopetrol S.A.
The impact of tax losses in the Bioenergy and SubsidiariesBioenergy Zona Franca with respect to deferred tax is mentioned in this Note under the chapter titled "Deferred Tax on Income".
Notes
Effective for the year 2015, in accordance with that provided for in Law 1739 of December 2014, tax losses and minimal CREE base surplus can be offset with future income originated in the income tax for equality - CREE, considering the same rules set out for income and supplementary taxes.In accordance with article 290 of Law 1819 of 2016, the presumptive income surplus and minimal base surplus generated before 2017 on income tax and CREE that have not been offset, are subject for offsetting to the Consolidated Financial Statementsapplication of a formula contained in said article and subject to the term established in article 189 of the Tax Code.
Years
The Colombian government issued Law 1819 of 2016 (Structural Tax Reform), whereby it is established that companies can offset tax losses originated on or after 2017 with ordinary net income to be obtained in the next twelve (12) taxable periods. Reficar and Bioenergy ZF, as they entered into a legal stability agreement that included offsetting tax losses, do not have time limits and are not subject to this restriction insofar as the contract is still in force.
Statute of limitation of review of tax returns
Tax returns may be reviewed by the tax authorities within the next 5 years following the filing date and/or amendment, considering that the returns reflected tax losses.
According to law 1819 the general rule extended from 2 to 3 years the statute of limitation of tax returns. Tax returns extemporarily filed will have a 3 year statute of limitations from the day the tax return was filed. The statute of limitations for income tax returns subject to the transfer pricing regime is 6 years. Tax returns with balances in favor, the statute of limitation will be 3 years starting from the date when the offset or refund request is filed. Tax returns in which tax losses are originated, will have a statute of limitation period of 12 years, which will be extended to 15 years if losses are offset within the last 2 years of the 12 year period.
Tax returns in which tax losses are offset will have a 6-year statute of limitation period.
| F-39 |
Ecopetrol S.A. Notes to Consolidated Financial Statements (Figures expressed in millions of Colombian pesos, unless otherwise stated) |
Presumptive income
The taxable income of the tax payer cannot be lower than 3% of its net equity as of December 31 of immediately preceding taxable period. As of the year 2017, it will be at a rate of 3.5%.
Income tax expense
The following table shows a breakdown of the income tax recognized in profit or loss for the years ended December 31, 2016, 2015 and 2014:
| 2016 | 2015 | 2014 | ||||||||||
| Current income tax | 4,517,336 | 3,510,546 | 6,389,978 | |||||||||
| Deferred income tax | 25,710 | (2,800,193 | ) | (955,123 | ) | |||||||
| Income tax expense | 4,543,046 | 710,353 | 5,434,855 | |||||||||
Reconciliation of the income tax expense
The reconciliation between income tax expense and the tax determined based on the official tax rate applicable to the Company in Colombia is as follows:
| 2016 | 2015 | 2014 | ||||||||||
| Net income (loss) before income tax | 7,790,526 | (5,578,626 | ) | 11,104,428 | ||||||||
| Statutory rate | 40 | % | 39 | % | 34 | % | ||||||
| Income tax at statutory rate | 3,116,210 | (2,175,664 | ) | 3,775,506 | ||||||||
| ETR reconciliation items: | ||||||||||||
| Effect in changes in tax rates and effect in tax base (CREE) | 807,989 | 2,063,782 | (151,244 | ) | ||||||||
| Non deductible wealth tax | 229,375 | 253,422 | (21,233 | ) | ||||||||
| Foreign currency translation and exchange difference | (234,316 | ) | 310,657 | 609,130 | ||||||||
| Prior year taxes | 140,630 | (21,233 | ) | |||||||||
| Non deductible expenses | 486,300 | 251,246 | 378,218 | |||||||||
| Valuation of investments | - | 48,129 | 922,028 | |||||||||
| Non taxable income | (3,142 | ) | (19,986 | ) | (17,352 | ) | ||||||
| Others | - | - | (60,198 | ) | ||||||||
| Income tax calculated | 4,543,046 | 710,353 | 5,434,855 | |||||||||
| Current | 4,517,336 | 3,510,546 | 6,389,978 | |||||||||
| Deferred | 25,710 | (2,800,193 | ) | (955,123 | ) | |||||||
| 4,543,046 | 710,353 | 5,434,855 | ||||||||||
The effective tax rate (ETR) as of December 31, 2016 was 58.3% (2015: 12.7%). The increase compared to the previous year is mainly due to the following: a) The effect of the increase of unrecognized deferred tax assets on tax carryforwards in the group that according to the financial projections will not be able to be recovered in a predictable future, and b) the increase in non-deductible expenses due to the amendment of the 2015 income tax.
Income tax returns for taxable years 2012 to 2015 and CREE of taxable years 2013 to 2015 are open to review in accordance with the applicable statute of limitations. The auditing of those tax returns may result in additional taxes, or interest, or penalties which could give rise to administrative proceedings with applicable authorities. Management of the Group Companies considers that the amounts accounted as a liability for the tax payable is supported by tax law, regulations and official opinion in order to address any legal claim that could be requested by the tax authority. The strategy's Company is do not take aggressive or risk tax positions that could put into question these tax returns.
| F-40 |
Ecopetrol S.A. Notes to Consolidated Financial Statements (Figures expressed in millions of Colombian pesos, unless otherwise stated) |
Deferred income tax
The balance at December 31, 2016 and 2015 of deferred taxes is comprised as follows:
| 2016 | 2015 | |||||||
| Deferred tax asset | 5,726,961 | 8,239,472 | ||||||
| Deferred tax liability | 3,118,650 | 6,026,050 | ||||||
| Total deferred income tax | 2,608,311 | 2,213,422 | ||||||
Deferred tax is measured at the tax rates that are expected to be applied to temporary differences when they reverse, using taxrates enacted or substantively enacted at the reporting date.
The table below shows an analysis of the Company´s deferred tax assets and liabilities:
| 2016 | 2015 | |||||||
| Deferred tax assets | ||||||||
| Property, plant and equipment and Natural and environmental resources (1) | 2,185,792 | 4,094,250 | ||||||
| Provisions | 1,875,964 | 1,867,461 | ||||||
| Employee benefits (2) | 656,997 | - | ||||||
| Loss carry forwards | 477,808 | 238,193 | ||||||
| Accounts payable | 311,646 | 726,256 | ||||||
| Borrowings and other financial liabilities | - | 986,689 | ||||||
| Accounts receivable | 135,092 | 17,927 | ||||||
| Others (3) | 83,662 | 308,696 | ||||||
| Total | 5,726,961 | 8,239,472 | ||||||
| 2016 | 2015 | |||||||
| Deferred tax liabilities | ||||||||
| Property, plant and equipment and Natural and environmental resources (1) | 2,406,106 | 3,888,751 | ||||||
| Goodwill | 345,288 | 262,291 | ||||||
| Borrowings and other financial liabilities | 113,497 | 1,527,501 | ||||||
| Others (3) | 253,759 | 347,507 | ||||||
| Total | 3,118,650 | 6,026,050 | ||||||
| (1) | For tax purposes, natural resources and property, plant and equipment have specific useful lives and a methodology of capitalization different from those determined under IFRS. This difference will result in a difference in the depreciable basis for accounting and tax purposes. |
| (2) | Difference in valuation of the actuarial liability. |
| (3) | Investments, inventories and intangible assets. |
| F-41 |
Ecopetrol S.A. Notes to Consolidated Financial Statements (Figures expressed in millions of Colombian pesos, unless otherwise stated) |
The movements of deferred income tax for the years ended December 31, 2016 and 2015 is as follows:
Deferred tax assets:
| Property, plant and equipment and natural resources | Provisions | Employee benefits | Tax losses | Accounts payable | Accounts receivable | Borrowings and other financial obligations | Others | Total | ||||||||||||||||||||||||||||
| December 31, 2014 | 1,007,559 | 1,814,433 | 352,720 | 227,078 | 111,300 | 113,889 | 268,210 | 350,227 | 4,245,416 | |||||||||||||||||||||||||||
| Recognized in deferred income tax expense | 3,086,691 | 53,028 | 370,863 | 11,115 | 614,956 | (95,962 | ) | 718,479 | (41,531 | ) | 4,717,639 | |||||||||||||||||||||||||
| Recognized in other comprehensive income | - | - | (723,583 | ) | - | - | - | - | - | (723,583 | ) | |||||||||||||||||||||||||
| December 31, 2015 | 4,094,250 | 1,867,461 | - | 238,193 | 726,256 | 17,927 | 986,689 | 308,696 | 8,239,472 | |||||||||||||||||||||||||||
| Recognized in deferred income tax expense | (1,908,458 | ) | 8,503 | 40,300 | 239,615 | (414,610 | ) | 117,165 | (986,689 | ) | 18,282 | (2,885,892 | ) | |||||||||||||||||||||||
| Recognized in other comprehensive income | - | - | 616,697 | - | - | - | - | (243,316 | ) | 373,381 | ||||||||||||||||||||||||||
| December 31, 2016 | 2,185,792 | 1,875,964 | 656,997 | 477,808 | 311,646 | 135,092 | - | 83,662 | 5,726,961 | |||||||||||||||||||||||||||
Deferred tax liabilities:
| Property, plant and equipment and natural resources | Goodwill | Financial obligations | Others | Total | ||||||||||||||||
| December 31, 2014 | 2,933,009 | 473,293 | 571,105 | 190,737 | 4,168,144 | |||||||||||||||
| Recognized in deferred income tax expense | 1,074,825 | (211,002 | ) | 788,797 | 264,826 | 1,917,446 | ||||||||||||||
| Recognized in other comprehensive income | - | - | 167,599 | - | 167,599 | |||||||||||||||
| Foreign exchange | (119,083 | ) | - | - | (108,056 | ) | (227,139 | ) | ||||||||||||
| December 31, 2015 | 3,888,751 | 262,291 | 1,527,501 | 347,507 | 6,026,050 | |||||||||||||||
| Recognized in deferred income tax expense | (1,482,645 | ) | 82,997 | (1,414,004 | ) | (46,530 | ) | (2,860,182 | ) | |||||||||||
| Foreign exchange | - | - | - | (47,218 | ) | (47,218 | ) | |||||||||||||
| Recognized in other comprehensive income | - | - | - | - | - | |||||||||||||||
| December 31, 2016 | 2,406,106 | 345,288 | 113,497 | 253,759 | 3,118,650 | |||||||||||||||
Deferred tax assets and liabilities are offset if there is a legally enforceable right to offset current tax liabilities and assets, andthey relate to taxes levied by the same tax authority on the same taxable entity, or on different tax entities, but they intend to settlecurrent tax liabilities and assets on a net basis or their tax assets and liabilities will be realized simultaneously.
In accordance with the current tax law losses generated in income and supplementary taxes and/or income tax for equality - CREE before 2017 must be offset with the net income obtained in 2017 and subsequent periods, taking into account the formula set out in article 290 of Law 1819 of 2016. Tax losses determined must not be tax re-adjusted.
Starting in 2017 companies can offset tax losses obtained in the current period, with taxable income generated through the next 12 taxable periods, following the attainment of said tax losses, without prejudice of the period's presumptive income.
The asset for deferred tax related to tax losses generated by Bioenergy S.A. and Bioenergy Zona Franca were written off in 2016 because, even though they can be offset in the long term, Management concluded that it is not likely that the asset deferred tax related to such tax losses would be recoverable in the short term. If the Ecopetrol Group could have recognized the deferred tax asset that was not recognized the income for the period ended on December 31, 2016 would have increased by COP$83,595.
| F-42 |
Ecopetrol S.A. Notes to Consolidated Financial Statements (Figures expressed in millions of Colombian pesos, unless otherwise stated) |
As per Colombian tax law, excess of presumptive income can be carried forward for 5 years. As of December 31, 2016, Ecopetrol Group has unrecognized deferred tax assets on cumulative excess of presumptive income of COP 49,155, which expires between 2017 and 2020.The Deferred tax assets have not been recognized in respect of these carryforwards, as they may not be used to offset taxable profits in the Group.
In accordance with tax provisions applicable until December 31, 2016 the surplus of presumptive income and minimal base generated before 2017 in income and supplementary taxes and in the income tax for equality - CREE, respectively, can be offset with ordinary net income obtained by the Company in the next five years, using for such purpose the formula set out in number 6, article 290 of law 1819 of 2016.
The movements of deferred income tax for the years ended December 31, 2016 and 2015 are as follows:
| 2016 | 2015 | |||||||
| Opening balance | 2,213,422 | 77,272 | ||||||
| Deferred tax recognized in profit or loss | (25,710 | ) | 2,800,193 | |||||
| Deferred tax recognized in other comprehensive income (a) | 420,599 | (664,043 | ) | |||||
| Closing balance | 2,608,311 | 2,213,422 | ||||||
| (a) | The following is the breakdown of income tax recorded against other comprehensive income: |
| December 31, 2016 | Pre-tax | Deferred tax | After tax | |||||||||
| Actuarial valuation gains (losses) | 1,770,139 | (616,697 | ) | 1,153,442 | ||||||||
| Cash flow hedging for future crude oil exports | (757,469 | ) | 296,047 | (461,422 | ) | |||||||
| Derivative financial instruments | (56,448 | ) | 22,579 | (33,869 | ) | |||||||
| Others | - | (47,217 | ) | (47,217 | ) | |||||||
| 956,222 | (345,288 | ) | 610,934 | |||||||||
| December 31, 2015 | Pre-tax | Deferred tax | After tax | |||||||||
| Actuarial valuation gains (losses) | (2,128,184 | ) | 723,582 | (1,404,602 | ) | |||||||
| Cash flow hedging for future crude oil exports | 344,836 | (127,545 | ) | 217,291 | ||||||||
| Derivative financial instruments | 100,134 | (40,051 | ) | 60,083 | ||||||||
| Others | - | 108,057 | 108,057 | |||||||||
| (1,683,214 | ) | 664,043 | (1,019,171 | ) | ||||||||
| 10.3 | Other taxes |
| 10.3.1 | Tax on dividends |
The new tax on dividends will be applicable to foreign companies and entities on profits generated starting 2017.
Dividends will be taxed at 5%. For Colombian individuals the rate would be up to 10%. Profits that did not pay tax at the corporate level, would be subject to a 35% withholding tax at the time of distribution. In this case, the distribution, after being reduced by the 35% withholding tax, would be subject to the dividend tax. Dividends tax will be applicable to profits generated as of 2017.
| 10.3.2 | Transfer prices |
Colombian Taxpayers carrying out operations with related parties located abroad are required to submit the disclosure return of transactions with related parties. For these taxpayers it is necessary to prepare and maintain supporting documentation only for those types of operations, if the annual amount accumulated in the relevant tax year exceeds ten thousand units of taxable value units (10.000 UVT) (For 2016: COP$ 29,753).
| F-43 |
Ecopetrol S.A. Notes to Consolidated Financial Statements (Figures expressed in millions of Colombian pesos, unless otherwise stated) |
The Companies are required to file their transfer pricing information for the taxable year 2015 and the related supporting documents.
For fiscal year 2016 the transactions performed with foreign economically related parties, as well as the business conditions for such operations and their general structure, did not vary significantly as compared with the previous year. It is estimated that no adjustments will be required derived from the analysis of transfer pricing in 2016 which imply amendments of the income provision of taxable year 2016.
| 10.3.3 | Value added tax (VAT) |
General VAT rate increased from 16% in 2016 to 19% and a differential rate of 5% for certain goods and services is maintained. The modification on the general rate is effective from January 1st, 2017.
VAT taxable event is expanded to all goods in general, including intangible goods (related to intellectual property) and real estate property (unless provided otherwise).
Fixed assets are still not levied with VAT, except for real estate property for residential use, automobile and other fixed assets sold on the ordinary course of business in the name and on behalf of third parties. For this purposes, real estate has been excluded unless the value of the first sale is higher than 26.800 tax value unit (“UVT” by its acronyms in Spanish), approximately COP $854 million, which will be taxed at a 5% rate.
Unless expressly excluded, services rendered from abroad will be levied with VAT. The assignment of rights is included as a form of service.
Periods for filing VAT returns and payments will be only two, bimonthly and quarterly. The statute of limitations for the request of VAT credit tax balance is increased to three bimonthly periods following the period of causation.
| 10.3.4 | Wealth tax |
Law 1739 of 2014 2013stablished wealth tax (“impuesto a la riqueza”) for the years 2015-2018. According to the Law, entities that own wealth in Colombia –exceeding the limits established to be considered taxpayers, this is COP$ 1,000 million- have the obligation to file and 2012pay the wealth tax.
(Expressed
The applicable rate will depend on the taxable base of each tax payer and the paid value will not be deductible nor discountable on income and supplementary taxes for income tax for equality - CREE, nor can they be offset with these, nor any other taxes.
In 2016, the wealth tax paid by the Ecopetrol Group amounted to COP$569,756, which was recognized as an expense in the period (2015 - COP$649,800).
| F-44 |
Ecopetrol S.A. Notes to Consolidated Financial Statements (Figures expressed in millions of Colombian pesos, unless otherwise stated) |
| 11. | Equity instruments measured at fair value |
The balance at December 31, 2016 and 2015 of Colombian pesos)equity instruments measured at fair value is comprised as follows:
| 2016 | 2015 | |||||||
| Empresa de Energía de Bogotá (1) | 51,522 | 478,618 | ||||||
| Interconexión Eléctrica S.A (2) | - | 434,870 | ||||||
| Other | 88 | - | ||||||
| 51,610 | 913,488 | |||||||
| (1) | Through Decree 2305 of November 13, 2014, the Company obtained authorizations from the Government to start the alienation program of its equity holding in Empresa de Energía de Bogotá S.A. E.S.P. |
For the period of authorization and December 31, 2016 Ecopetrol sold in three auctions 95.5% of its equity share equivalent to 602,632,965 shares for COP$1,067,313 as follows:
| - | On July 27, 2015, the sale of 352,872,414 shares took place at a selling price of COP$1,740 per share. The operation amounted to $613,998. |
| - | On June 7, 2016, the second auction was performed for 191,639,698 shares at a price of COP$1,815 for a total of COP$347,827. |
| - | On December 6, 2016, the third auction was performed for the sale of 58,120,853 shares, at a price of COP$1,815 for a total of COP$105,489. |
In December 2016, the Council of Ministers approved a one extension for the terms of the alienation program, period in which Ecopetrol expects to sell the remaining 28,465,035 shares it holds.
| (2) |
| 2014 | 2013 | |||||||
| Partners in contracts for which Ecopetrol is not the operator | ||||||||
| Meta Petroleum Ltd. | 172,223 | 39,787 | ||||||
| Occidental de Colombia Inc. | 24,303 | 26,907 | ||||||
| Perenco Colombia Limited | 61,173 | 25,721 | ||||||
| Petrobras Colombia Limited | 51,358 | 21,770 | ||||||
| Repsol Exploración Colombia S. A. | 12,517 | 16,166 | ||||||
| Anadarko Colombia Company | - | 15,245 | ||||||
| Emerald Energy PLC Suc Colombia | 5,149 | 13,375 | ||||||
| Vanco Energy | - | 7,352 | ||||||
| Mansarovar Energy Colombia Ltd. | 46,199 | 6,744 | ||||||
| Occidental Andina Llc | 247 | 5,559 | ||||||
| CEPSA Colombia S. A. | 6,386 | 4,484 | ||||||
| Petrosantander Colombia Inc. | 3,584 | 4,182 | ||||||
| Petroleos del Norte S. A. | 15,041 | 3,822 | ||||||
| Chevron Petroleum Company | 169 | 2,698 | ||||||
| Anadarko Petroleum Corporation | 28,095 | 275 | ||||||
| Petrobras Energía Perú S. A. | - | 181 | ||||||
| Petrobras Internacional Braspetro B.V. | 42,324 | 127 | ||||||
| Talisman Perú BV, Sucursal del Perú | - | 111 | ||||||
| Talisman Colombia Oil & Gas Ltd | 1,023 | - | ||||||
| Petrominerales | - | 78 | ||||||
| Maurel et Prom Colombia B.V. | (71 | ) | - | |||||
| Lewis Energy Colombia | 2,403 | - | ||||||
| Other operations | 12,080 | 10,546 | ||||||
| Pacific Stratus energy Colombia Ltda. | 6,707 | - | ||||||
| Total E&P Colombie Sucursal Colombia | 1,705 | - | ||||||
| Petroleos Brasilerios S. A. | 209 | - | ||||||
| Repsol Sinopec | 608 | - | ||||||
| Partners in contracts for which Ecopetrol is the operator: | ||||||||
| Bloque CPO-9 | 115,156 | 89,962 | ||||||
| La Cira | 40,839 | 23,712 | ||||||
| Crudos Pesados Bloque CPE-4 | 14,149 | 19,137 | ||||||
| Oleoducto Caño Limón | 17,460 | 16,360 | ||||||
| Acuerdo operación TLU-3 | 22,074 | 10,028 | ||||||
| Crudos Pesados Bloque CPE-2 | 5,189 | 8,816 | ||||||
| Acuerdo operación TLU-1 | 25,251 | 5,817 | ||||||
| JOA Caño Sur | 4,001 | 3,838 | ||||||
| DOIMA | 269 | - | ||||||
| San Jacinto y Rio Paez | 383 | - | ||||||
| Oleoducto Alto Magdalena | 31 | - | ||||||
| Tangara | 111 | - | ||||||
| Rio Cabrera | 133 | - | ||||||
| Mundo Nuevo | 273 | - | ||||||
| Other operations | 10,847 | 5,476 | ||||||
| Total | 749,598 | 388,276 | ||||||
Ecopetrol S.A. and Subsidiaries
Notes to the Consolidated Financial Statements
Years ended December 31, 2014, 2013 and 2012
(Expressed in millions of Colombian pesos)
The balance of prepaid expenses as of December 31, is comprised as follows:
| 2014 | 2013 | |||||||
| Insurance (1) | 77,131 | 144,890 | ||||||
| Other (2) | 119,933 | 3,454 | ||||||
| 197,064 | 148,344 | |||||||
The balance of deposits held in trust as of December 31, is comprised as follows:
| 2014 | 2013 | |||||||
| Pension funds (1) | 329,960 | 314,114 | ||||||
| SecuritizationCorficolombiana– ODL | 139,688 | 134,015 | ||||||
| Other | 37,532 | 20,665 | ||||||
| Abandonment fund | 1,079 | - | ||||||
| Total | 508,259 | 468,794 | ||||||
The property, plant and equipment shown below, along with related accumulated depreciation, are underproceeds from the full ownership and controlsale of these shares have been used to finance the Group. There are no restrictions or pledges on the assets, nor have they been offered as collateral for obligations. As of December 31, they included:Company's investment plan.
| December 31, 2014 | Adjusted cost | Accumulated depreciation | Allowances (2) | Net cost | Valuation | Net plus Valuation | ||||||||||||||||||
| Plant and equipment | 19,562,381 | (12,377,361 | ) | (153,157 | ) | 7,031,863 | 5,088,700 | 12,120,563 | ||||||||||||||||
| Pipelines, networks and lines | 24,606,294 | (11,722,961 | ) | (55,993 | ) | 12,827,340 | 14,016,404 | 26,843,744 | ||||||||||||||||
| Construction in progress (1) | 24,011,883 | - | - | 24,011,883 | 353,469 | 24,365,352 | ||||||||||||||||||
| Buildings | 5,544,102 | (1,655,479 | ) | (182,805 | ) | 3,705,818 | 1,723,809 | 5,429,627 | ||||||||||||||||
| Equipment on deposit and in transit | 1,586,226 | - | - | 1,586,226 | - | 1,586,226 | ||||||||||||||||||
| Computer equipment | 493,032 | (371,018 | ) | (7,355 | ) | 114,659 | 68,970 | 183,629 | ||||||||||||||||
| Transportation equipment and other assets | 621,210 | (326,144 | ) | (18,637 | ) | 276,429 | 101,392 | 377,821 | ||||||||||||||||
| Land | 929,242 | (1,660 | ) | (8,314 | ) | 919,268 | 3,471,341 | 4,390,609 | ||||||||||||||||
| Operation materials | 202,636 | - | (19,928 | ) | 182,708 | - | 182,708 | |||||||||||||||||
| Total | 77,557,006 | (26,454,623 | ) | (446,190 | ) | 50,656,194 | 24,824,085 | 75,480,279 | ||||||||||||||||
| December 31, 2013 | Adjusted cost | Accumulated depreciation | Allowances (2) | Net cost | Valuation | Net plus valuation | ||||||||||||||||||
| Plant and equipment | 17,412,346 | (10,988,633 | ) | (29,826 | ) | 6,393,887 | 5,144,384 | 11,538,271 | ||||||||||||||||
| Pipelines, networks and lines | 22,155,219 | (10,992,889 | ) | (87,570 | ) | 11,074,760 | 14,588,429 | 25,663,189 | ||||||||||||||||
| Construction in progress | 16,405,380 | - | - | 16,405,380 | - | 16,405,380 | ||||||||||||||||||
| Agricultural plantations | 62,862 | - | - | 62,862 | - | 62,862 | ||||||||||||||||||
| Buildings | 4,370,321 | (1,468,769 | ) | (141,075 | ) | 2,760,477 | 2,231,946 | 4,992,423 | ||||||||||||||||
| Equipment on deposit and in transit | 1,227,278 | - | - | 1,227,278 | - | 1,227,278 | ||||||||||||||||||
| Computer equipment | 552,013 | (391,669 | ) | (5,357 | ) | 154,987 | 38,775 | 193,762 | ||||||||||||||||
| Transportation equipment and other assets | 1,725,372 | (907,123 | ) | (106,157 | ) | 712,092 | 245,422 | 957,514 | ||||||||||||||||
| Land | 1,210,828 | - | (8,358 | ) | 1,202,470 | 3,429,170 | 4,631,640 | |||||||||||||||||
| Operation materials | 171,107 | - | (14,766 | ) | 156,341 | - | 156,341 | |||||||||||||||||
| Total | 65,292,726 | (24,749,083 | ) | (393,109 | ) | 40,150,534 | 25,678,126 | 65,828,660 | ||||||||||||||||
Ecopetrol S.A. and Subsidiaries
Notes to the Consolidated Financial Statements
Years ended December 31, 2014, 2013 and 2012
(Expressed in millions of Colombian pesos)
Depreciation charged to results of operations in 2014 amounted to $2,248,409 (2013 – $1,982,706).
Starting in 2014, the Company has been reflecting property, plant and equipment construction in progress separately from explorations underway, which partially represents the changes in account balances. Up until that date, explorations underway were reflected together with construction in progress. Corresponding balances as of December 31, 2013 were reclassified for comparison purposes with 2014.
| 2014 | 2013 | 2012 | ||||||||||
| Opening balance | 393,109 | 563,996 | 1,057,740 | |||||||||
| Additions to new allowances (a) | 126,726 | 54,874 | 315,627 | |||||||||
| Adjustment to existing provisions | (4,162 | ) | (292,396 | ) | 30,590 | |||||||
| Depreciation of assets | (8,087 | ) | (1,364 | ) | (680,128 | ) | ||||||
| (Impairment) recovery | (61,396 | ) | 67,999 | (159,833 | ) | |||||||
| Closing balance | 446,190 | 393,109 | 563,996 | |||||||||
Technical appraisals of fixed assets take place every three years in accordance with the stipulations of the Public Accounting Regime. At the close of 2013, the last technical appraisal of assets for the Barrancabermeja Refinery was updated by the T.F. Auditores & Asesores firm.
The balancemovement of natural and environmental resources, net, as ofnon-current assets held for sale at December 31, 2016 and 2015 is comprised as follows:
| 2014 | 2013 | |||||||
| Amortizable oil investments (1) | 46,286,127 | 40,445,485 | ||||||
| Less: Accumulated amortization of oil investments (2) | (26,880,037 | ) | (23,489,999 | ) | ||||
| 19,406,090 | 16,955,486 | |||||||
| Plugging and abandonment, facility dismantling and environmental recovery costs | 6,733,161 | 4,936,316 | ||||||
| Less: Accrued amortization for facility abandonment (2) | (2,858,900 | ) | (2,309,036 | ) | ||||
| 3,874,261 | 2,627,280 | |||||||
| Reservoirs and appraisals | 701,590 | 701,590 | ||||||
| Less: Accumulated depletion | (649,372 | ) | (642,299 | ) | ||||
| 52,218 | 59,291 | |||||||
| Exploration activities (3) | 8,586,014 | 7,429,324 | ||||||
| Total | 31,918,583 | 27,071,381 | ||||||
| Less: – Allowance for natural and environmental resources (4) | (258,408 | ) | - | |||||
| Total | 31,660,175 | 27,071,381 | ||||||
| 2016 | 2015 | |||||||
| Opening balance | 913,488 | 1,581,466 | ||||||
| Fair value adjustments | 126,205 | (106,911 | ) | |||||
| Proceeds from sales of shares | (966,715 | ) | (613,998 | ) | ||||
| (Loss) gain on sale of shares (1) | (21,368 | ) | 52,931 | |||||
| Closing balance | 51,610 | 913,488 | ||||||
| F-45 |
Ecopetrol S.A. Notes to Consolidated Financial Statements (Figures expressed in millions of Colombian pesos, unless otherwise stated) |
These equity instruments are measured at fair value with changes in fair value recorded in the other comprehensive income. Its hierarchy level is 1 using the price quoted in the Stock Exchange of Colombia as a reference.
| (1) | As of December 31, |
| 12. | Other assets |
The balance at December 31, 2016 and 2015 of other assets is comprised as follows:
| 2016 | 2015 | |||||||
| Current | ||||||||
| Partners in joint operations | 735,032 | 431,523 | ||||||
| Advanced payments to contractors and suppliers | 151,871 | 370,269 | ||||||
| Prepaid expenses | 140,606 | 226,842 | ||||||
| Related parties (Note 32) | 7,135 | 28,668 | ||||||
| Other advances and agreements | 988 | 33,022 | ||||||
| Total current | 1,035,632 | 1,090,324 | ||||||
| Non-current | ||||||||
| Abandonment and pension funds (1) | 312,423 | 274,938 | ||||||
| Employee benefits | 187,969 | 91,625 | ||||||
| Judicial deposits and attachments | 140,338 | 146,701 | ||||||
| Trust funds (2) | 87,602 | 125,720 | ||||||
| Advances and deposits | 63,402 | 18,405 | ||||||
| Other assets | 35,002 | 108,991 | ||||||
| Total non-current | 826,736 | 766,380 | ||||||
| (1) | Corresponds to trusts established to support the |
| (2) |
Ecopetrol S.A. and Subsidiaries
Notes to the Consolidated Financial Statements
Years ended December 31, 2014, 2013 and 2012
(Expressed in millions of Colombian pesos)
The balance of deferred charges as of December 31, is comprised as follows:
| 2014 | 2013 | |||||||
| Deferred income tax and deferred tax on CREE | 2,293,571 | 2,112,829 | ||||||
| Other deferred charges, net | 430,605 | 759,606 | ||||||
| 2,724,176 | 2,872,435 | |||||||
The balance of other assets as of December 31, is comprised as follows:
| 2014 | 2013 | |||||||
| Goodwill (1) | 1,747,561 | 2,175,084 | ||||||
| Assets acquired under financial leasing | 393,320 | 405,600 | ||||||
| Intangibles (net): (brands, licences, patents and software) | 261,310 | 293,286 | ||||||
| Trust funds (2) | 155,472 | 217,980 | ||||||
| National Royalties Fund (3) | 80,671 | 73,469 | ||||||
| Other assets (4) | 368,595 | 344,400 | ||||||
| Total | 3,006,929 | 3,509,819 | ||||||
| Company | Acquisition date | Goodwill amount | Amortized amount | Pending amortization | Amortization period (years) | |||||||||||||
| Propilco S.A. | 07/04/2008 | 176,507 | (77,384 | ) | 99,123 | 17.8 | ||||||||||||
| Andean Chemicals | 07/04/2008 | 205,541 | (88,379 | ) | 117,162 | 17.8 | ||||||||||||
| IPL Enterprises | 17/03/2009 | 880,127 | (263,859 | ) | 616,268 | 15 | ||||||||||||
| Offshore International (a) | 06/02/2009 | 248,635 | (147,691 | ) | 100,944 | 14 | ||||||||||||
| Hocol Petroleum Limited | 27/05/2009 | 742,345 | (251,836 | ) | 490,509 | 16 | ||||||||||||
| Equión Energía Limited | 24/01/2011 | 629,375 | (306,720 | ) | 322,655 | 10 | ||||||||||||
| Bioenergy Zona Franca | 30/08/2008 | 900 | - | 900 | ||||||||||||||
| Total | 2,883,430 | (1,135,869 | ) | 1,747,561 | ||||||||||||||
| Company | Acquisition date | Goodwill amount | Amortized amount | Pending amortization | Amortization period (years) | |||||||||||||
| Propilco S.A. | 07/04/2008 | 176,507 | (68,370 | ) | 108,137 | 17.8 | ||||||||||||
| Andean Chemicals | 07/04/2008 | 205,541 | (77,729 | ) | 127,812 | 17.8 | ||||||||||||
| IPL Enterprises | 17/03/2009 | 880,127 | (196,631 | ) | 683,496 | 15 | ||||||||||||
| Offshore International | 06/02/2009 | 536,079 | (194,631 | ) | 341,448 | 14 | ||||||||||||
| Hocol Petroleum Limited | 27/05/2009 | 742,345 | (204,747 | ) | 537,598 | 16 | ||||||||||||
| Equión Energía Limited | 24/01/2011 | 629,375 | (253,682 | ) | 375,693 | 10 | ||||||||||||
| Bioenergy Zona Franca | 30/08/2008 | 900 | - | 900 | ||||||||||||||
| Total | 3,170,874 | (995,790 | ) | 2,175,084 | ||||||||||||||
Ecopetrol S.A. and Subsidiaries
Notes to the Consolidated Financial Statements
Years ended December 31, 2014, 2013 and 2012
(Expressed in millions of Colombian pesos)
At the close of 2015, the pension resources managed byFiduciaria Bancolombia (equivalent to COP$342,951, from the termination of the Cravo Norte Partnership agreement with Occidental de Colombia) were returned to Ecopetrol S.A., since the pension obligation arising from such agreement is supported by the pension trusts described in note 22 - Provisions for employee benefits.
| F-46 |
Ecopetrol S.A. Notes to Consolidated Financial Statements (Figures expressed in millions of Colombian pesos, unless otherwise stated) |
| 13. | Assets held for sale and their related liabilities |
At December 31, 2016, the balance of assets classified as non-current assets held for sale amounted to COP$132,216 and it was comprised of:
| § | Assets remaining from the expansion of the oil pipeline to transport extra-heavy crude oil conducted by Oleoducto Central S.A. - Ocensa, for COP$65,703. |
The balance of financial obligationsrelated liabilities as of December 31, 2016 amounts to COP$40,128 and corresponds mainly to abandonment costs and environmental commitments of these assets.
Assets held for sale at December 31, 2015 for COP$242,745 and its related liabilities for COP$17,628 corresponded to fields La Hocha and La Cañada, owned by Hocol S.A., on which the sale was abandoned in 2016 because the offer did not meet economic expectations.
| F-47 |
Ecopetrol S.A. Notes to Consolidated Financial Statements (Figures expressed in millions of Colombian pesos, unless otherwise stated) |
| 14. | Investments in associates and joint ventures |
| 14.1 | Composition and movements |
The balance at December 31, 2016 and 2015 of the investments in associates and joint ventures is as follows:
| 2016 | 2015 | |||||||
| Investments in joint ventures | ||||||||
| Equion Energía Limited | 1,156,430 | 1,430,206 | ||||||
| Offshore International Group (1) | 937,938 | 1,097,929 | ||||||
| Ecodiesel Colombia S.A. | 39,525 | 37,161 | ||||||
| 2,133,893 | 2,565,296 | |||||||
| Less impairment: | ||||||||
| Equion Energía Limited | (253,683 | ) | (172,528 | ) | ||||
| Offshore International Group | (577,053 | ) | (530,350 | ) | ||||
| 1,303,157 | 1,862,418 | |||||||
| Investments in associates | ||||||||
| Invercolsa S.A. | 243,156 | 61,503 | ||||||
| Serviport S.A. | 5,255 | 8,490 | ||||||
| Sociedad Portuaria Olefinas | 1,126 | 649 | ||||||
| 249,537 | 70,642 | |||||||
| Less impairment: Serviport S.A. | - | (1,126 | ) | |||||
| 249,537 | 69,516 | |||||||
| 1,552,694 | 1,931,934 | |||||||
| (1) | According to the assessment of control carried out as of December 31, 2016, the investment in Offshore International Group was classified as joint venture from an associate, due to the existence of joint control. For comparative purposes, the balance was reclassified as of December 31, 2015 to joint ventures. |
The detail of the investments, economic activity, domicile, area of operation and financial information of the investments in joint ventures and associates is shown in Exhibit I.
The following is the movement of these investments:
For the year ended December 31, 2016:
| Associates | Joint ventures | Total | ||||||||||
| Opening balance | 69,516 | 1,862,418 | 1,931,934 | |||||||||
| Effects of equity method through: | ||||||||||||
| Profit or loss | 48,299 | 13,046 | 61,345 | |||||||||
| Other comprehensive income | 173,772 | (49,127 | ) | 124,645 | ||||||||
| Dividends declared | (42,050 | ) | (384,787 | ) | (426,837 | ) | ||||||
| Impairment | - | (127,858 | ) | (127,858 | ) | |||||||
| Reclassifications | - | (10,535 | ) | (10,535 | ) | |||||||
| Closing balance | 249,537 | 1,303,157 | 1,552,694 | |||||||||
| F-48 |
Ecopetrol S.A. Notes to Consolidated Financial Statements (Figures expressed in millions of Colombian pesos, unless otherwise stated) |
For the year ended December 31, 2015:
| Associates | Joint ventures | Total | ||||||||||
| Opening balance | 64,710 | 2,325,479 | 2,390,189 | |||||||||
| Effects of equity method through: | ||||||||||||
| Profit or loss | 45,988 | (92,675 | ) | (46,687 | ) | |||||||
| Other comprehensive income | - | 508,968 | 508,968 | |||||||||
| Dividends declared | (41,182 | ) | (291,210 | ) | (332,392 | ) | ||||||
| Impairment | - | (588,144 | ) | (588,144 | ) | |||||||
| Closing balance | 69,516 | 1,862,418 | 1,931,934 | |||||||||
| 14.2 | Impairment on the value of investments in companies |
Investments in associates and joint ventures are recorded under the equity method. Ecopetrol evaluates if such investments were impaired during the period, and assesses if there is objective evidence of a potential impairment, particularly for companies that were acquired with goodwill.
As a result, the Company recognized impairment expense in the value of its investments in companies at December 31, as follows:
| 2016 | 2015 | 2014 | ||||||||||
| Equion Energía Limited | 81,155 | 172,528 | - | |||||||||
| Offshore International Group | 46,703 | 415,616 | 114,734 | |||||||||
| Total | 127,858 | 588,144 | 114,734 | |||||||||
The main assumptions used for determining the fair value less costs to sell of the investments, which perform hydrocarbon exploration and production activities, include:
| - | Financial projections for the above companies were made taking into account the fair value less cost of disposal based on the discounted cash flow after taxes, that are derived from business plans approved by the company's management. The plans are developed based on long term macroeconomic factors such as price curves and fundamental supply and demand assumptions. The fair value category is level 3. |
| - | The forecasts include US$56.8/barrel for 2017, US$67.9/barrel average for the next six years and US$80/barrel in the long-term. Prices are based on information from recognized suppliers well known by the market and by management analysts. In 2015, the assumptions made used a price of US$40/barrel in 2016 reaching US$60 in the long-term. The production profiles were estimated based on third-party perspectives, which rely on their companies’ vision. |
| - | The rates used for discounting cash flows are based on the WACC methodology and reflect the specific risk of the business segment. The rate used for 2016 was 8.9% for Equion Energía Limited (2015 – 8.4%) and 8% for Offshore International Group (2015 – 8.4%). |
| - | Certified reserves balances, in addition to prove, probable and possible reserves were also considered adjusted by different risk factors. |
The impairment recognized in 2015 was caused mostly by the adverse economic context of the hydrocarbon industry, which translated into the reduction of oil price forecast and increase in the market and country risks reflected on the discount rate. For 2016, despite of better forecasts for long term oil prices, the Company recognized an additional impairment in the investment in the Offshore International Group and Equion for the return to local authorities of low-prospectively exploration blocks, high geological risk and low economic viability with respect to a new price scenario.
| F-49 |
Ecopetrol S.A. Notes to Consolidated Financial Statements (Figures expressed in millions of Colombian pesos, unless otherwise stated) |
| 14.3 | Restrictions on investments |
The number of shares held by Ecopetrol in Invercolsa S.A. has been subjected to a legal dispute with another shareholder of this company. The Courts decided in favor of Ecopetrol through ruling of 2011, whereby it was determined that 324 million shares, equivalent to 11.58% of Invercolsa’s social capital should be returned to Ecopetrol. The Ecopetrol’s equity share in said company is 43.35%. The dividends paid in relation with the shares returned to Ecopetrol are also subject to controversy, as well as the ownership of the shares that represent 8.53% of Invercolsa. At December 31, 2016, the settlement of these claims is still pending.
| F-50 |
Ecopetrol S.A. Notes to Consolidated Financial Statements (Figures expressed in millions of Colombian pesos, unless otherwise stated) |
| 14.4 | Additional information about associates and joint ventures |
The balance of assets, liabilities and results of most relevant associates and joint ventures at December 31, 2016 and 2015 is comprised as follows:
| 2014 | 2013 | |||||||
| Current | ||||||||
| Foreign-currency debt (1) | 425,378 | 337,967 | ||||||
| Local-currency debt (2) and (4) | 934,247 | 216,860 | ||||||
| Bonds and issued (3) | 429,695 | 219,732 | ||||||
| Total Current | 1,789,320 | 774,559 | ||||||
| Non-current | ||||||||
| Local-currency debt (2) nd (4) | 4,679,027 | 4,805,073 | ||||||
| Foreing-currency debt (1) | 27,377,730 | 14,718,919 | ||||||
| Bonds and issued (3) | 1,802,900 | 1,900,000 | ||||||
| Total non-current | 33,859,657 | 21,423,992 | ||||||
| 2016 | 2015 | |||||||||||||||
| Equion Energía Limited | Offshore International Group | Equion Energía Limited | Offshore International Group | |||||||||||||
| Statement of financial position | ||||||||||||||||
| Current assets | 712,078 | 317,700 | 854,445 | 310,677 | ||||||||||||
| Non-current assets | 1,406,510 | 1,693,947 | 2,114,689 | 2,089,841 | ||||||||||||
| Total assets | 2,118,588 | 2,011,647 | 2,969,134 | 2,400,518 | ||||||||||||
| Current liabilities | 417,203 | 147,090 | 549,281 | 477,611 | ||||||||||||
| Non-current liabilities | 170,527 | 671,577 | 352,182 | 409,946 | ||||||||||||
| Total liabilities | 587,730 | 818,667 | 901,463 | 887,557 | ||||||||||||
| Equity | 1,530,858 | 1,192,980 | 2,067,671 | 1,512,961 | ||||||||||||
| Other complementary information | ||||||||||||||||
| Cash and cash equivalents | 300,689 | 22,224 | 340,797 | 25,760 | ||||||||||||
| Financial obligations, short-term | 328,497 | 21,408 | 423,132 | 337,506 | ||||||||||||
| Financial obligations, long-term | 309 | 356,353 | 751 | 33,025 | ||||||||||||
| 2016 | 2015 | |||||||||||||||
| Equion Energía Limited | Offshore International Group | Equion Energía Limited | Offshore International Group | |||||||||||||
| Statement of profit or loss | ||||||||||||||||
| Sales revenue | 1,204,301 | 379,811 | 1,218,796 | 463,660 | ||||||||||||
| Costs | (969,318 | ) | (502,107 | ) | (958,467 | ) | (654,095 | ) | ||||||||
| Administration and other expenses | (44,810 | ) | (221,238 | ) | (74,258 | ) | (128,895 | ) | ||||||||
| Financial income (expenses) | 59,143 | (12,010 | ) | 37,970 | (8,528 | ) | ||||||||||
| Income tax | 30,199 | 107,507 | (209,221 | ) | 90,294 | |||||||||||
| Net income for the period | 279,515 | (248,037 | ) | 14,820 | (237,564 | ) | ||||||||||
| F-51 |
Ecopetrol S.A. Notes to Consolidated Financial Statements (Figures expressed in millions of Colombian pesos, unless otherwise stated) |
Included below, there is a reconciliation of equity between the most significant participations and the carrying amount of investments at December 31:
| 2016 | 2015 | |||||||||||||||
| Equion Energía Limited | Offshore International Group | Equion Energía Limited | Offshore International Group | |||||||||||||
| Equity of the associate | 1,530,858 | 1,192,980 | 2,067,671 | 1,512,961 | ||||||||||||
| % of Ecopetrol’s ownership | 51 | % | 50 | % | 51 | % | 50 | % | ||||||||
| Ecopetrol’s ownership | 780,738 | 596,490 | 1,054,513 | 756,482 | ||||||||||||
| Additional value of the investment | 375,693 | 341,448 | 375,693 | 226,713 | ||||||||||||
| Less Impairment expense | (253,684 | ) | (577,053 | ) | (172,528 | ) | (415,616 | ) | ||||||||
| Carrying amount of the investment | 902,747 | 360,885 | 1,257,678 | 567,579 | ||||||||||||
| F-52 |
Ecopetrol S.A. Notes to Consolidated Financial Statements (Figures expressed in millions of Colombian pesos, unless otherwise stated) |
Terms and conditions of the guarantee programs are as follows:
|
| |
As of December 31 2013, the Company concluded the disbursements under the LTG for an amount of US$245 million and those of the MTG program for an amount US$151 million in July 2014. With closing as of December 2014 the payments of principal and interest for each facility have been made, and thus the balances in effect are US$220 million for LTG and US$145 million for MTG as of December 2014 and 2013.
Summary of the issuance of international bonds:equipment
Issuance of International Bonds 2009
On July 23, 2009, the Company issued unsecured and unsubordinated debt bonds (notes) with the right to register them with the SEC for an amount of US$1,500 million and maturing in 2019. The registration took place on October 6, 2009. The notes were issued under Rule-144A/Regulation S with SEC registration rights. The terms of the transaction were:
Ecopetrol S.A. and Subsidiaries
Notes to the Consolidated Financial Statements
Years ended December 31, 2014, 2013 and 2012
(Expressed in millions of Colombian pesos)
Issuance of International Bonds 2013
On September 18, 2013, the Company issued unsecured and unsubordinated debt bonds (notes) for an amount of US$2,500 million, registered with the SEC, divided into three tranches and with the following terms and conditions:
| Redemption term: | 5 years | 10 years | 30 years |
| Maturity: | September 18, 2018 | September 18, 2023 | September 18, 2043 |
| Amount US$ (millions): | 350 | 1,300 | 850 |
| Coupon: | 4.250% | 5.875% | 7.375% |
| Make Whole Call (pbs): | 40 | 45 | 50 |
| Dates for payment of interest: | March 18 and September 18 | ||
Issuance of International Bonds 2014
On May 28, 2014, the Company issued unsecured and unsubordinated debt bonds (notes) for an amount of US$2,000 million, registered with the SEC, with the following terms and conditions:
Subsequently, on September 16, 2014, the Company issued new unsecured and unsubordinated debt bonds (notes) for an amount of US$1,200 million, registered with the SEC, with the following terms and conditions:
In accordance with the definitions set forth in the issuance documents for 2009, 2013 and 2014, the Company has complied with the various covenants, including the due and timely payment of interest and capital; no creation of collateral pledges by Ecopetrol and its subsidiaries, except for authorized collateral; and the offer to purchase the bonds in the event of repurchasing for control change.
Ecopetrol S.A. and Subsidiaries
Notes to the Consolidated Financial Statements
Years ended December 31, 2014, 2013 and 2012
(Expressed in millions of Colombian pesos)
As of December 31, 2014Refinería de Cartagena S.A. has current the following loans amounting to US$ 3,497 million:
| ||||||
Likewise, it mainly includes, other financial liabilities acquired by Group companies, mainly by: ODL Finance S.A., 7-year syndicated loan of $647,029 at interest rate equal to DTF + 2.50%; and Bioenergy, 15-year, $411,282 with average interest rate of DTF + 3%.
Provided below is a summary of the guarantees granted by ODL as of December 31, 2014:
Irrevocable mercantile trust agreement between Oleoducto de los Llanos Orientales S.A. Sucursal Colombia and Fiduciaria Corficolombiana S.A. creating ODL – Ecopetrol Issuers of the ODL securities– Ecopetrol trust funds.
Guarantee: ODL – Ecopetrol loan securities.
According to clause seven of the contract, “ODL shall use the resources from the placement to finance the project to build and commission the pipeline, and to return capital to the pipeline sponsors, as established in the Information Prospectus”. Additionally, Clause 10.2.1 mentions that there will be a Prime Fund that will be a book account of the trust fund that will be created to manage the resources coming from the payment of the Financial tariff payments (“Tarifa Financiera Títulos”) for Ecopetrol, and Clause 10.2.2.2 states that the resources deposited in the Interim Reserve Fund may only be used to make debt payments.
Ecopetrol S.A. and Subsidiaries
Notes to the Consolidated Financial Statements
Years ended December 31, 2014, 2013 and 2012
(Expressed in millions of Colombian pesos)
As of the December 31, 2014, the promissory notes have the following balances:
Currently, Bioenergy is in the process of releasing the mortgage that had been granted for the disbursements of the loans given by Bancolombia through aFinagrocredit line in 2008, which is secured with the property “La Esperanza” whose carrying value is $4,096.
Domestic Bank Loan
Corresponds to financing in local currency with seven Colombian banks, with the following terms:
The following shows a breakdown of long-term capital amortization payments:
| 2016 | 102,167 | |||
| 2017 | 204,333 | |||
| 2018 | 204,334 | |||
| 2019 | 204,333 | |||
| 2020 | 204,333 | |||
| 2021 | 204,333 | |||
| 2022 | 204,334 | |||
| 2023 | 204,333 | |||
| 2024 | 204,333 | |||
| 2025 | 102,167 | |||
| 1,839,000 |
Issuance of Local Bonds 2010
Through Resolution No. 3150 on October 20, 2010, Ecopetrol was authorized by the Ministry of Financechanges in property, plant and Public Credit to issue, subscribeequipment and place internal public debt bondsits depreciation and impairment for an amount of up to one billion pesos, to finance the 2010 Investment Plan. Subsequently, through Resolution No. 2176 of November 11, 2010, the Company obtained the Finance Superintendence of Colombia’s authorization to register its internal public debt bonds with the National Register of Securities and Issuing Agencies, and to place them through public offering.
The terms of the issuance and placement of the internal public debt bonds are as follows:
Ecopetrol S.A. and Subsidiaries
Notes to the Consolidated Financial Statements
Years ended December 31, 2014, 20132016 and 2012
(Expressed in millions of Colombian pesos)2015:
Issuance of Local Bonds 2013
Through Resolution No. 2462 on July 30, 2013, issued by the Ministry of Finance and Public Credit, Ecopetrol was authorized to issue, subscribe and place up to three billion pesos in bonds and commercial paper in the Colombian Public Stock Market through thePrograma de Emisión y Colocación (Issuance and Placement Program). Subsequently, through Resolution No. 1470 of August 2, 2013, the Finance Superintendence of Colombia granted the Company authorization to register the bonds and commercial paper under said program with the National Register of Securities and Issuing Agencies, and place the bonds in public offering.
The following was the result of the first issuance and placement of internal public debt bonds under the program:
| Amount placed: | $900,000 million | ||||
| Issuance date: | August 27, 2013 | ||||
| Amortization: | At maturity | ||||
| Interest paid: | Semi-annually | ||||
| Series C: | Bonds denominated in pesos with a variable rate based on the CPI | ||||
| Redemption term: | 5 years | 10 years | 15 years | 30 years | |
| Rate: | CPI + 3.79% | CPI + 4.60% | CPI + 4.90% | CPI + 5.15% | |
| Amount (millions) | $ | 120,950 | 168,600 | 347,500 | 262,950 |
The balance for accounts payable as of December 31, is comprised as follows:
| 2014 | 2013 | |||||||
| Current | ||||||||
| Suppliers | 6,304,889 | 5,459,752 | ||||||
| Partner advances | 1,112,536 | 854,884 | ||||||
| Various creditors | 760,531 | 348,987 | ||||||
| Income and VAT tax withholdings | 407,123 | 459,866 | ||||||
| Deposits received from third parties | 316,466 | 626,945 | ||||||
| Reimbursement of exploratory costs | 22,533 | 23,158 | ||||||
| Interest payable | 22,408 | - | ||||||
| Purchase of hydrocarbons from National Hydrocarbons Agency | 17,930 | 385,636 | ||||||
| Dividends payable | 3,704 | 1,313,596 | ||||||
| Total Current | 8,968,120 | 9,472,824 | ||||||
| Non-current | ||||||||
| Other accounts payables | 219,370 | 591,998 | ||||||
| Total non-current | 219,370 | 591,998 | ||||||
The balance for taxes, contributions and duties payable as of December 31, is comprised as follows:
| 2014 | 2013 | |||||||
| Income tax and complementary taxes | 6,018,066 | 7,872,189 | ||||||
| Income tax for equality (CREE) | 356,926 | 315,218 | ||||||
| National tax on gasoline and surtax on gasoline | 269,612 | 224,694 | ||||||
| Sales tax – VAT | 3,877 | 24,826 | ||||||
| Tax on Equity (1) | - | 567,002 | ||||||
| Industry and commerce tax and other minor taxes | 440,009 | 91,649 | ||||||
| Audit fee | - | 87,923 | ||||||
| Total | 7,088,490 | 9,183,501 | ||||||
The balance of deferred income tax, income tax for equity CREE and surtax CREE asset/liability is as follows:
| 2014 | 2013 | |||||||
| Deferred tax asset | ||||||||
| Initial balance Income and CREE | 2,140,561 | 1,557,224 | ||||||
| Movement for the year Income, CREE and surtax CREE | 206,918 | 583,337 | ||||||
| Ending balance | 2,347,479 | 2,140,561 | ||||||
| Deferred tax liability | ||||||||
| Initial balance Income and CREE | 2,201,728 | 1,790,546 | ||||||
| Movement for the year Income, CREE and surtax CREE | 610,744 | 411,182 | ||||||
| Ending balance | 2,812,472 | 2,201,728 | ||||||
Ecopetrol S.A. and Subsidiaries
Notes to the Consolidated Financial Statements
Years ended December 31, 2014, 2013 and 2012
(Expressed in millions of Colombian pesos)
Breakdown of expenses for income tax, capital gain tax, income tax for equality CREE and surcharge tax CREE
The expense for income tax, capital gains tax and income tax for equality CREE, and surcharge CREE, is comprised as follows:
| 2014 | 2013 | 2012 | ||||||||||
| Current taxes | ||||||||||||
| Current income tax and CREE | 6,727,229 | 8,283,605 | 7,081,647 | |||||||||
| Income and CREE tax from prior periods | 4,426 | 7,967 | 14,227 | |||||||||
| Deferred income tax assets, CREE and Surtax CREE | (158,217 | ) | 27,661 | 35,199 | ||||||||
| Deferred income tax liability, CREE and Surtax CREE | 561,630 | (230,394 | ) | 2,322 | ||||||||
| 7,135,068 | 8,088,839 | 7,133,395 | ||||||||||
The effect of temporary differences that imply the payment of a lower or greater income tax in the current year is recorded as deferred tax asset or liability, both for the income tax and for the income tax for equity CREE and surtax CREE, as applicable, provided that there are reasonable expectations that those differences shall revert in the case of the deferred tax asset, or enough taxable income is generated to recover the tax.
The determination of the taxable income basis for the withholding of income and related taxes and income tax for equality (CREE) is subject to current regulations in each case. The write-off of the tax bases is described as follows:
Income tax and complementary taxes
Current tax regulations applicable to Colombia establish the following:
The Tax Authorities can review the income tax returns within the two years following their filing.
Income tax for equality – CREE
Current tax regulations applicable to Colombia establish the following:
Ecopetrol S.A. and Subsidiaries
Notes to the Consolidated Financial Statements
Years ended December 31, 2014, 2013 and 2012
(Expressed in millions of Colombian pesos)
Income tax for equality (CREE) returns can be reviewed by tax authorities up to two years after filing. The review period for the 2013 return is currently open.
Income tax for equality (CREE) surcharge
For the years 2015, 2016, 2017 and 2018, Law 1739 of December 23, 2014 establishes a surtax on the Income tax for equality (CREE) payable by individuals and entities subject to said tax, to be applied to taxable income over $800 million at the rates of 5%, 6%, 8% and 9% per year, respectively. The impact of said surtax on the current year is taken into account for the purposes of properly determining the deferred tax.
Wealth tax
Through Law 1739 of 2014, the wealth tax was established, which defines as its taxable event the possession of wealth as of January 1, 2015, 2016 and 2017, to be paid by income tax payers. Ecopetrol shall determine its wealth tax under the following terms:
Transfer pricing
Since 2004, income taxpayers who had entered into transactions with related parties abroad, and/or with residents of countries considered to be tax havens, are under the obligation of determining, for income tax purposes, their ordinary and extraordinary income, costs and deductions, and assets and liabilities, taking into account the denominated market prices and profit margins for these transactions (Arm’s length principles). Based on the opinion of the Company’s advisor, no significant changes are expected for taxable year 2014 related to the compliance with the principle of full jurisdiction set out in Article 260-1 of the Colombian Tax Code, and there are no foreseen adjustments to the determination of income tax expenses for the said year.
The balance of labor and pension liabilities as of December 31, is comprised as follows:
| 2014 | 2013 | |||||||
| Current portion | ||||||||
| Vacations | 113,806 | 101,241 | ||||||
| Premiums, bonuses and allowances | 144,574 | 91,489 | ||||||
| Severance payments | 63,335 | 52,739 | ||||||
| Salaries and pensions payable | 7,751 | 5,774 | ||||||
| Interest on severance | 7,047 | 5,961 | ||||||
| Other | 32,692 | 32,424 | ||||||
| Total current portion | 369,205 | 289,628 | ||||||
| Non-current portion | ||||||||
| Actuarial liability for health and education (1) | 4,500,173 | 4,211,288 | ||||||
| Retirement pensions joint ventures | 73,985 | 66,543 | ||||||
| Total non-current portion | 4,574,158 | 4,277,831 | ||||||
| Total | 4,943,363 | 4,567,459 | ||||||
Ecopetrol S.A. and Subsidiaries
Notes to the Consolidated Financial Statements
Years ended December 31, 2014, 2013 and 2012
(Expressed in millions of Colombian pesos)
The following is the detail of the actuarial liability:
| Concept | 2014 | 2013 | ||||||
| Actuarial calculation of health liabilities | 4,131,205 | 4,053,865 | ||||||
| Less - Actuarial calculation pending amortization | - | (227,416 | ) | |||||
| Amortized actuarial health liability | 4,131,205 | 3,826,449 | ||||||
| Actuarial calculation of education liabilities | 368,968 | 384,839 | ||||||
| Amortized actuarial health and education liability | 4,500,173 | 4,211,288 | ||||||
The variation on the amortized actuarial liability is as follows:
| 2014 | 2013 | Variation | ||||||||||
| Health | ||||||||||||
| Active Personnel | 549,202 | 518,089 | 31,113 | |||||||||
| Retirees | 3,582,003 | 3,308,360 | 273,643 | |||||||||
| Education | ||||||||||||
| Active Personnel | 9,424 | 48,081 | (38,657 | ) | ||||||||
| Retirees | 359,544 | 336,758 | 22,786 | |||||||||
| Total | 4,500,173 | 4,211,288 | 288,885 | |||||||||
The balance of estimated liabilities and provisions as of December 31, is comprised as follows:
| 2014 | 2013 | |||||||
| Current portion | ||||||||
| Provisions for contingencies (1) | 1,072,625 | 926,118 | ||||||
| Other Provisions | 576,440 | 953,893 | ||||||
| Provision for legal proceedings (2) (see note 29) | 297,442 | 524,937 | ||||||
| Provision for abandonment, facility dismantling and environmental recovery costs (3) | 226,735 | 109,557 | ||||||
| Provision for pension obligations | - | 500 | ||||||
| Total current portion | 2,173,242 | 2,515,005 | ||||||
| Non-current portion | ||||||||
| Provision for abandonment, facility dismantling and environmental recovery costs (3) | 6,276,739 | 4,636,968 | ||||||
| Provisions forcomuneros(community members) (4) | 551,497 | 445,364 | ||||||
| Provision for legal proceedings (2) | 9,932 | 16,910 | ||||||
| Other Provisions | 99,302 | 64,577 | ||||||
| Total non-current portion | 6,937,470 | 5,163,819 | ||||||
| Total | 9,110,712 | 7,678,824 | ||||||
| Plant and equipment | Pipelines, networks and lines | Work in progress (1) | Buildings | Lands | Other | Total | ||||||||||||||||||||||
| Cost | ||||||||||||||||||||||||||||
| Balance at December 31, 2015 | 37,360,222 | 26,856,085 | 11,015,010 | 6,479,356 | 4,068,951 | 3,653,798 | 89,433,422 | |||||||||||||||||||||
| Additions/capitalizations | 1,457,547 | 1,383,352 | (107,181 | ) | 360,596 | 41,202 | 511,413 | 3,646,929 | ||||||||||||||||||||
| (Decrease) increase in abandonment costs | (84,780 | ) | (78,712 | ) | - | - | - | 6,137 | (157,355 | ) | ||||||||||||||||||
| Capitalized interest | - | - | 205,662 | - | - | 37,116 | 242,778 | |||||||||||||||||||||
| Exchange differences capitalized | - | - | 8,639 | - | - | - | 8,639 | |||||||||||||||||||||
| Disposals | (158,193 | ) | (21,814 | ) | (16,031 | ) | (12,540 | ) | 713 | (15,455 | ) | (223,320 | ) | |||||||||||||||
| Foreign currency translation | (42,870 | ) | (298,750 | ) | (1,629,613 | ) | (9,832 | ) | (69,878 | ) | 12,416 | (2,038,527 | ) | |||||||||||||||
| Other (reclassifications) (2) | 4,076,350 | 1,247,621 | (4,602,080 | ) | 94,177 | (146,768 | ) | (722,986 | ) | (53,686 | ) | |||||||||||||||||
| Balance at December 31, 2016 | 42,608,276 | 29,087,782 | 4,874,406 | 6,911,757 | 3,894,220 | 3,482,439 | 90,858,880 | |||||||||||||||||||||
| Accumulated depreciation and impairment | ||||||||||||||||||||||||||||
| Balance at December 31, 2015 | (13,469,749 | ) | (8,572,373 | ) | (19,566 | ) | (1,698,791 | ) | (13,689 | ) | (554,181 | ) | (24,328,349 | ) | ||||||||||||||
| Depreciation expense | (1,869,604 | ) | (1,426,659 | ) | - | (392,294 | ) | - | (102,621 | ) | (3,791,178 | ) | ||||||||||||||||
| Impairment (Note 17) | (659,223 | ) | 33,048 | (3,270 | ) | 57,157 | 24,067 | (13,517 | ) | (561,738 | ) | |||||||||||||||||
| Disposals | 121,382 | 14,022 | - | 7,021 | 15 | 11,524 | 153,964 | |||||||||||||||||||||
| Foreign currency translation | 272,582 | 138,611 | 38,904 | 12,658 | - | 8,007 | 470,762 | |||||||||||||||||||||
| Other (reclassifications) (2) | 92,617 | (152,203 | ) | (278,665 | ) | (74,229 | ) | (37,245 | ) | (24,114 | ) | (473,839 | ) | |||||||||||||||
| Balance at December 31, 2016 | (15,511,995 | ) | (9,965,554 | ) | (262,597 | ) | (2,088,478 | ) | (26,852 | ) | (674,902 | ) | (28,530,378 | ) | ||||||||||||||
| Net balance at December 31, 2016 | 27,096,281 | 19,122,228 | 4,611,809 | 4,823,279 | 3,867,368 | 2,807,537 | 62,328,502 | |||||||||||||||||||||
| (1) | The balance of |
| (2) |
| 2014 | 2013 | |||||||
| Opening balance | 541,847 | 792,894 | ||||||
| Additions, new allowances | 48,578 | 107,107 | ||||||
| Recovery | (251,288 | ) | (314,144 | ) | ||||
| Use | (31,763 | ) | (44,010 | ) | ||||
| Closing balance | 307,374 | 541,847 | ||||||
| Number of proceedings at year-end | 360 | 368 | ||||||
| F-53 |
Ecopetrol S.A. Notes to Consolidated Financial Statements (Figures expressed in millions of Colombian pesos, unless otherwise stated) |
| Plant and equipment | Pipelines, networks and lines | Work in progress (1) | Buildings | Lands | Other | Total | ||||||||||||||||||||||
| Cost | ||||||||||||||||||||||||||||
| Balance at December 31, 2014 | 16,109,035 | 19,938,115 | 24,009,694 | 5,199,417 | 3,614,237 | 3,135,873 | 72,006,371 | |||||||||||||||||||||
| Additions | 2,720,120 | 2,213,663 | 2,446,904 | 755,565 | 112,972 | 299,709 | 8,548,933 | |||||||||||||||||||||
| Increase (decrease) in abandonment costs | 242,815 | (115,608 | ) | 14,184 | - | - | - | 141,391 | ||||||||||||||||||||
| Capitalized interest | - | - | 553,061 | - | - | - | 553,061 | |||||||||||||||||||||
| Exchange differences capitalized | - | - | 110,485 | - | - | - | 110,485 | |||||||||||||||||||||
| Disposals | (94,227 | ) | (187,964 | ) | (32,842 | ) | (5,060 | ) | (9,786 | ) | (70,445 | ) | (400,324 | ) | ||||||||||||||
| Foreign currency translation | 5,093,932 | 2,526,312 | 159,154 | 258,070 | 354,898 | 190,381 | 8,582,747 | |||||||||||||||||||||
| Other (reclassifications) | 13,288,547 | 2,481,567 | (16,245,630 | ) | 271,364 | (3,370 | ) | 98,280 | (109,242 | ) | ||||||||||||||||||
| Balance at December 31, 2015 | 37,360,222 | 26,856,085 | 11,015,010 | 6,479,356 | 4,068,951 | 3,653,798 | 89,433,422 | |||||||||||||||||||||
| Accumulated depreciation and Impairment | ||||||||||||||||||||||||||||
| Balance at December 31, 2014 | (7,446,991 | ) | (6,071,305 | ) | (1,209,229 | ) | (1,146,453 | ) | (70,332 | ) | (397,054 | ) | (16,341,364 | ) | ||||||||||||||
| Depreciation expense | (1,168,864 | ) | (1,300,687 | ) | - | (329,396 | ) | - | (124,309 | ) | (2,923,256 | ) | ||||||||||||||||
| Impairment (Nota 17) | (2,787,539 | ) | (584,736 | ) | (509,195 | ) | (161,431 | ) | (13,689 | ) | (88,164 | ) | (4,144,754 | ) | ||||||||||||||
| Disposals | 75,305 | 90,389 | - | 4,208 | - | 64,283 | 234,185 | |||||||||||||||||||||
| Foreign currency translation | (219,358 | ) | (481,180 | ) | (404,872 | ) | (37,259 | ) | - | (10,491 | ) | (1,153,160 | ) | |||||||||||||||
| Other (reclassifications) | (1,922,302 | ) | (224,854 | ) | 2,103,730 | (28,460 | ) | 70,332 | 1,554 | - | ||||||||||||||||||
| Balance at December 31, 2015 | (13,469,749 | ) | (8,572,373 | ) | (19,566 | ) | (1,698,791 | ) | (13,689 | ) | (554,181 | ) | (24,328,349 | ) | ||||||||||||||
| Net balance at December 31, 2015 | 23,890,473 | 18,283,712 | 10,995,444 | 4,780,565 | 4,055,262 | 3,099,617 | 65,105,073 | |||||||||||||||||||||
Ecopetrol S.A. and Subsidiaries
Notes to the Consolidated Financial Statements
Years endedThe balance for projects in progress at December 31, 2014, 20132015, primarily consists of investments for development projects in the Castilla, Rubiales and 2012
(Expressed in millions of Colombian pesos)Chichimene fields as well as projects to modernize the Barrancabermeja refinery and the industrial services master plan.
| 2014 | 2013 | 2012 | ||||||||||
| Opening balance | 4,746,525 | 3,946,560 | 3,843,550 | |||||||||
| Abandonment cost evaluation update | 1,819,134 | 1,016,762 | 392,197 | |||||||||
| Withdrawals and Use | (96,878 | ) | (232,813 | ) | (273,325 | ) | ||||||
| Effect from exchange rates | 34,693 | 16,016 | (15,862 | ) | ||||||||
| Closing balance | 6,503,474 | 4,746,525 | 3,946,560 | |||||||||
| F-54 |
Ecopetrol S.A. Notes to Consolidated Financial Statements (Figures expressed in millions of Colombian pesos, unless otherwise stated) |
The following shows a breakdown of the changes in Natural and environmental resources and its depletion and impairment for the years ended December 31, 2016 and 2015. The depletion method used is units of production.
| Oil and gas investments | Asset retirement cost | Exploration and evaluation (1) | Total | |||||||||||||
| Cost | ||||||||||||||||
| Balance at December 31, 2015 | 44,148,353 | 1,762,374 | 6,189,142 | 52,099,869 | ||||||||||||
| Additions/capitalizations | 3,045,474 | 10,391 | (934,570 | ) | 2,121,295 | |||||||||||
| Increase (decrease) in abandonment costs | - | 566,213 | (4,062 | ) | 562,151 | |||||||||||
| Disposals | (26,548 | ) | (37,942 | ) | (121,032 | ) | (185,522 | ) | ||||||||
| Dry wells (2) | - | - | (342,691 | ) | (342,691 | ) | ||||||||||
| Capitalized interest | - | - | 98,431 | 98,431 | ||||||||||||
| Capitalized exchange differences | - | - | 7,259 | 7,259 | ||||||||||||
| Foreign currency translation | (352,766 | ) | (8,049 | ) | (103,728 | ) | (464,543 | ) | ||||||||
| Other (reclassifications) | 264,583 | 11,928 | 29,375 | 305,886 | ||||||||||||
| Balance at December 31, 2016 | 47,079,096 | 2,304,915 | 4,818,124 | 54,202,135 | ||||||||||||
| Accumulated depletion and impairment | ||||||||||||||||
| Balance at December 31, 2015 | (26,874,774 | ) | (1,181,798 | ) | - | (28,056,572 | ) | |||||||||
| Depletion expense | (3,496,998 | ) | (208,769 | ) | - | (3,705,767 | ) | |||||||||
| Impairment (Note 17) | (239,151 | ) | - | - | (239,151 | ) | ||||||||||
| Disposals | 26,320 | 37,942 | - | 64,262 | ||||||||||||
| Foreign currency translation | 218,898 | 5,171 | - | 224,069 | ||||||||||||
| Others | (104,710 | ) | (43,219 | ) | - | (147,929 | ) | |||||||||
| Balance at December 31, 2016 | (30,470,415 | ) | (1,390,673 | ) | - | (31,861,088 | ) | |||||||||
| Net balance at December 31, 2016 | 16,608,681 | 914,242 | 4,818,124 | 22,341,047 | ||||||||||||
| (1) | The balance of |
| (2) | Includes dry wells in operation of: Ecopetrol COP$302,965, ECP Oil and Gas Germany GmbH COP$26,273, Ecopetrol America Inc COP$5,032, Hocol S.A COP$5,049, Ecopetrol Brasil COP$3,372. |
| (3) | Corresponds mainly to transfers to: a) non-current assets held for sale COP$244,387 and b) property, plant and equipment COP$(68,898) and c) other COP$(17,532). |
| F-55 |
Ecopetrol S.A. Notes to Consolidated Financial Statements (Figures expressed in millions of |
| Oil and gas investments | Asset retirement cost | Exploration and evaluation (1) | Total | |||||||||||||
| Cost | ||||||||||||||||
| Balance at December 31, 2014 | 37,168,922 | 1,895,149 | 6,114,019 | 45,178,090 | ||||||||||||
| Additions/capitalizations | 5,776,253 | 9,520 | 1,070,988 | 6,856,761 | ||||||||||||
| Decrease in abandonment costs | - | (139,670 | ) | - | (139,670 | ) | ||||||||||
| Disposals | (13,475 | ) | - | (56,962 | ) | (70,437 | ) | |||||||||
| Dry wells (2) | - | - | (1,266,440 | ) | (1,266,440 | ) | ||||||||||
| Capitalized interest | - | - | 191,365 | 191,365 | ||||||||||||
| Capitalized exchange differences | - | - | 39,416 | 39,416 | ||||||||||||
| Foreign currency translation | 1,031,595 | 6,299 | 272,890 | 1,310,784 | ||||||||||||
| Other (reclassifications) | 185,058 | (8,924 | ) | (176,134 | ) | - | ||||||||||
| Balance at December 31, 2015 | 44,148,353 | 1,762,374 | 6,189,142 | 52,099,869 | ||||||||||||
| Accumulated depletion and impairment | ||||||||||||||||
| Balance at December 31, 2014 | (20,223,671 | ) | (833,755 | ) | - | (21,057,426 | ) | |||||||||
| Depletion expense | (3,424,212 | ) | (300,650 | ) | - | (3,724,862 | ) | |||||||||
| Impairment (Note 17) | (2,865,077 | ) | - | - | (2,865,077 | ) | ||||||||||
| Disposals | 9,040 | - | - | 9,040 | ||||||||||||
| Foreign currency translation | (356,815 | ) | (61,432 | ) | - | (418,247 | ) | |||||||||
| Others | (14,039 | ) | 14,039 | - | - | |||||||||||
| Balance at December 31, 2015 | (26,874,774 | ) | (1,181,798 | ) | - | (28,056,572 | ) | |||||||||
| Net balance at December 31, 2015 | 17,273,579 | 580,576 | 6,189,142 | 24,043,297 | ||||||||||||
| (1) | The balance for exploration and |
| It mainly includes dry wells in Ecopetrol S.A. operations for COP$ 912,695, Ecopetrol America Inc. for COP$131,447, Hocol S.A. for COP$139,362 and ECP Oil and Gas Germany GmbH for COP$82,936. |
| F-56 |
Ecopetrol S.A. Notes to Consolidated Financial Statements (Figures expressed in millions of Colombian pesos, unless otherwise stated) |
Accounting for suspended exploratory wells
The following table shows the classification by ages, from the completion date, of the exploratory wells that are suspended as of December 31, 2016, 2015 and 2014:
| 2016 | 2015 | 2014 | ||||||||||
| Between 1 and 3 years | 611,682 | 490,184 | 416,687 | |||||||||
| Between 3 and 5 years | 197,997 | 100,316 | 25,703 | |||||||||
| More than 5 years | 153,552 | 161,392 | 41,621 | |||||||||
| Total suspended exploratory wells | 963,231 | 751,892 | 484,011 | |||||||||
| No. of projects exceeding 1 year | 24 | 59 | 42 | |||||||||
| Wells under 1 year of suspended | 90,486 | 280,801 | 259,932 | |||||||||
It corresponds mainly to exploratory wells of Ecopetrol, OIG and Hocol.
| F-57 |
Ecopetrol S.A. Notes to Consolidated Financial Statements (Figures expressed in millions of Colombian pesos, unless otherwise stated) |
| 17. |
In accordance with that mentioned in section 4.12 of the accounting policies every year the Company assesses if there are any indications of impairment in its assets or cash generating units.
The Company is exposed to certain future risks derived from variations in: a) oil prices, b) refining margins and profitability, c) cost profile, d) investment and maintenance, e) amount of recoverable reserves, f) market and country risk reflected on the discount rate, g) changes in domestic and international regulations, etc. Any change in the foregoing variables to calculate the recoverable amount can have a material effect on the recognition or recovery of impairment charges. For example, the exploration and production segment is highly sensitive to variation of hydrocarbon prices, while the refining segment is highly sensitive to the discount rate given the leveraging of said segment as well as the refining margins.
Based on impairment tests conducted by the Company, the following impairment losses (reversals) were recorded for the years ended on December 31, 2016, 2015 and 2014:
| 2016 | 2015 | 2014 | ||||||||||
| Impairment (recovery) | ||||||||||||
| Exploration and production | 68,590 | 3,649,451 | 853,179 | |||||||||
| Refining and petrochemicals | 773,361 | 3,278,993 | 1,336,158 | |||||||||
| Transportation and logistics | (41,062 | ) | 81,387 | 496 | ||||||||
| 800,889 | 7,009,831 | 2,189,833 | ||||||||||
| Recognized in: | ||||||||||||
| Property, plant and equipment (Note 15) | 561,738 | 4,144,754 | 1,491,809 | |||||||||
| Natural resources (Note 16) | 239,151 | 2,865,077 | 694,720 | |||||||||
| Intangibles (Note 18) | - | - | 3,304 | |||||||||
| 800,889 | 7,009,831 | 2,189,833 | ||||||||||
| 17.1 | Exploration and production segment |
The expense (recovery) for impairment of assets of the exploration and production segment for the years ended December 31, 2016, 2015 and 2014 comprises:
2016
Cash-generating unit | Carrying amount | Recoverable amount | Impairment loss (reversal) | |||||||||
| Fields in Colombia | ||||||||||||
| Expense | 5,258,265 | 4,902,943 | 1,117,020 | |||||||||
| Recovery | 17,502,391 | 36,704,807 | (1,090,434 | ) | ||||||||
| Fields abroad | ||||||||||||
| Expense | 688,895 | 647,272 | 42,004 | |||||||||
| 68,590 | ||||||||||||
2015
| Cash-generating unit | Carrying amount | Recoverable Amount | Impairment loss (reversal) | |||||||||
| Fields in Colombia | 10,323,500 | 7,645,665 | 2,430,923 | |||||||||
| Fields abroad | 1,242,979 | 24,451 | 1,218,528 | |||||||||
| 3,649,451 | ||||||||||||
2014
| Cash-generating unit | Carrying amount | Recoverable Amount | Impairment loss (reversal) | |||||||||
| Fields in Colombia | 4,186,400 | 5,581,870 | 841,937 | |||||||||
| Fields abroad | 477,484 | 466,242 | 11,242 | |||||||||
| 853,179 | ||||||||||||
| F-58 |
Ecopetrol S.A. Notes to Consolidated Financial Statements (Figures expressed in millions of Colombian pesos, unless otherwise stated) |
In 2016, as a result of revising the expected long term oil prices it was identified that some impairments recognized in previous years for oil fields should be reversed. The fields for which there was impairment reversal were mainly Chichimene, Caño Sur, Apiay and Llanito. On the other hand, the new technical information and operational aspects that gave rise to changes in investment levels resulted in the recognition of an impairment charge in Casabe, Tibú, Gunflint and Niscota fields.
The assumptions used in the model to determine the recoverable amounts include:
| - | The fair value less the cost of disposal of assets in the exploration and production segment was determined based on cash flows after taxes that are derived from the business plans approved by Company management; these are developed on the base of long term macroeconomic variables and fundamental supply and demand assumptions. The fair value category is level 3. |
| - | The discount rate in real terms determined as the weighted average cost of capital of market participants (WACC) was established for each company in the segment, with rates ranging between 7.9% and 8.9% (2015 – 8.4%). |
| - | Oil price - Brent: The forecasts include US$56.8/barrel for 2017, US$67.9/barrel average for the next six years and US$80/barrel in the long-term |
For 2015, the estimated prices were US$40/barrel for the short term reaching US$60 in the medium and long term. Prices were based on information provided by specialized market analysts and management analysts.
| - | Certified balance of oil and gas reserves, in addition to prove reserves included in Note 37, probable and possible reserves were also considered adjusted by different risk factors. |
The aggregation of assets to identify the CGU's is consistent as compared to the prior period.
In 2015, the impairment expense was caused mostly by the adverse economic context of the hydrocarbon industry, which translated into a decrease in the oil price forecast and increase in the market and country risks reflected on the discount rate and the reduction on the recoverable amount of reserves. The most representative cash generating units impacted for the foregoing factors were the oil fields operated at domestic level: Casabe, Chichimene, Tibú, CP09, Apiay, Llanito and La Hocha and the fields in the Gulf of Mexico K2 and Dalmatian.
| 17.2 | Refining and petrochemicals segment |
Assets impairment in the refining and petrochemicals segment for the years ended December 31, 2016, 2015 and 2014 comprises:
2016
| Cash-generating unit | Carrying amount | Recoverable amount | Expense for impairment | |||||||||
| Refinería de Cartagena | 21,672,367 | 21,206,515 | 465,852 | |||||||||
| Bioenergy | 925,955 | 618,446 | 307,509 | |||||||||
| 22,598,322 | 21,824,961 | 773,361 | ||||||||||
| F-59 |
Ecopetrol S.A. Notes to Consolidated Financial Statements (Figures expressed in millions of Colombian pesos, unless otherwise stated) |
2015
| Cash-generating unit | Carrying amount | Recoverable amount | Expense for impairment | |||||||||
| Refinería de Cartagena | 26,561,335 | 23,335,096 | 3,226,240 | |||||||||
| Bioenergy | 642,139 | 589,386 | 52,753 | |||||||||
| 27,203,474 | 23,924,482 | 3,278,993 | ||||||||||
2014
| Cash-generating unit | Carrying amount | Recoverable amount | Expense for impairment | |||||||||
| Refinería de Cartagena | 18,794,568 | 17,469,140 | 1,325,428 | |||||||||
| Otros menores | 100,311 | 89,581 | 10,730 | |||||||||
| 18,894,879 | 17,558,721 | 1,336,158 | ||||||||||
Refinería de Cartagena
The recoverable amount forRefinería de Cartagena was calculated based on the fair value less cost of disposal, with level of hierarchy 3, which corresponds to the future cash flows discounted after taxes. The assumptions used in the model to determine the recoverable amounts included: a) an average gross margin of US$18.9/barrel (2015 - US$17.5), determined by specialists of market participants; b) adjustments associated with effects of the stabilization period; c) an actual discount rate of 6.3% (2015 - 7.2% and 2014 – 7.1%) determined under the WACC methodology; and d) extension of current conditions and benefits, or similar, as industry user of goods and services in the free trade zone and during the term of the license.
In 2016, there is an impairment loss generated mostly by adjustment of operational variables based on observed data during the stabilization period, offset by a lower discount rate and better refining margins.
The impairment expense in 2015 was caused mostly by the adverse economic context of the hydrocarbon industry, which translated into reduction of the refining market expectations in coming years, an increase country and market risk that was reflected on the discount rate.
Bioenergy
The recoverable amount for Bioenergy was calculated based on the value in use, which is greater than the fair value less cost of disposal and corresponds to future cash flows discounted before taxes. The assumptions used in the model to determine the recoverable amount included: a) forecast of ethanol prices based on projections made by home office specialists; and b) a 6.7% discount rate in actual terms (2015 – 6.8% in actual terms) determined under the WACC methodology.
In 2016 and 2015, the Company recorded an impairment loss, due to mainly by the updating of the start date of operations and changes in product price projections.
| 17.3 | Transportation and logistics segment |
In 2016, there was an impairment recovery for the transport and logistics segment for COP$41,062 (2015 - COP$81,387 and 2014 - COP$496 of impairment expense) mainly by the incorporation of flows associated to the San Fernando - Apiay system project that affects the recoverable amount of the Llanos transport line, offset with greater impairment on the southern transport line. The recoverable amount of these assets was determined based on its fair value less disposal costs with level of hierarchy 3, which corresponds to discounted cash flows based on the hydrocarbon production curves and rates regulated by the Ministry of Mines and Energy and the Energy and Gas Regulating Commission - CREG. The actual discount rate used in the valuation was 4.98% (2015 - 5.9% and 2014 -7.2%).
| F-60 |
Ecopetrol S.A. Notes to Consolidated Financial Statements (Figures expressed in millions of Colombian pesos, unless otherwise stated) |
| 18. | Intangibles |
The following shows a breakdown of the changes in Intangibles and their amortization for the years ended December 31, 2016 and 2015:
| Licenses and software | Other intangibles (1) | Total | ||||||||||
| Cost | ||||||||||||
| Balance at December 31, 2015 | 733,115 | 244,063 | 977,178 | |||||||||
| Additions | 63,560 | 5,693 | 69,253 | |||||||||
| Disposals | (29,099 | ) | �� | - | (29,099 | ) | ||||||
| Foreign currency translation | (9,359 | ) | (149 | ) | (9,508 | ) | ||||||
| Reclassifications | 26,103 | (110,625 | ) | (84,522 | ) | |||||||
| Balance at December 31, 2016 | 784,320 | 138,982 | 923,302 | |||||||||
| Accumulated amortization | ||||||||||||
| Balance at December 31, 2015 | (533,784 | ) | (55,343 | ) | (589,127 | ) | ||||||
| Amortization expense | (81,913 | ) | (28,142 | ) | (110,055 | ) | ||||||
| Disposals | 29,097 | - | 29,097 | |||||||||
| Foreign currency translation | 8,527 | 1 | 8,528 | |||||||||
| Reclassifications | (5,607 | ) | 15,994 | 10,387 | ||||||||
| Balance at December 31, 2016 | (583,680 | ) | (67,490 | ) | (651,170 | ) | ||||||
| Net balance at December 31, 2016 | 200,640 | 71,492 | 272,132 | |||||||||
| Useful life | <5 years | <7 years | ||||||||||
| Licenses and software | Other intangibles (1) | Total | ||||||||||
| Cost | ||||||||||||
| Balance at December 31, 2014 | 575,535 | 127,519 | 703,054 | |||||||||
| Additions | 107,815 | 4,440 | 112,255 | |||||||||
| Disposals | (615 | ) | - | (615 | ) | |||||||
| Foreign currency translation | 53,242 | - | 53,242 | |||||||||
| Reclassifications | (2,862 | ) | 112,104 | 109,242 | ||||||||
| Balance at December 31, 2015 | 733,115 | 244,063 | 977,178 | |||||||||
| Accumulated amortization | ||||||||||||
| Balance at December 31, 2014 | (425,357 | ) | (32,545 | ) | (457,902 | ) | ||||||
| Amortization expense | (66,043 | ) | (24,196 | ) | (90,239 | ) | ||||||
| Disposals | 309 | 23 | 332 | |||||||||
| Foreign currency translation | (41,318 | ) | - | (41,318 | ) | |||||||
| Reclassifications | (1,375 | ) | 1,375 | - | ||||||||
| Balance at December 31, 2015 | (533,784 | ) | (55,343 | ) | (589,127 | ) | ||||||
| Net balance at December 31, 2015 | 199,331 | 188,720 | 388,051 | |||||||||
| Useful life | <5 years | <7 years | ||||||||||
| (1) | It includes mainly easements and right of use of the pipeline Caño Limón - Coveñas. |
| F-61 |
Ecopetrol S.A. Notes to Consolidated Financial Statements (Figures expressed in millions of Colombian pesos, unless otherwise stated) |
| 19. | Goodwill |
The balance of other long-term liabilities as ofat December 31, 2016 and 2015 of Goodwill from acquisitions of controlled companies is comprised as follows:
| 2014 | 2013 | |||||||
| Deferred income tax credit | 2,774,106 | 2,177,409 | ||||||
| Advances received from Ecogas for BOMT | 333,310 | 402,660 | ||||||
| Other liabilities | 352,936 | 461,817 | ||||||
| Total | 3,460,352 | 3,041,886 | ||||||
| 2016 | 2015 | |||||||
| Transportation and logistics | ||||||||
| Oleoducto Central S.A. | 683,496 | 683,496 | ||||||
| Exploration and production | ||||||||
| Hocol Petroleum Limited | 537,598 | 537,598 | ||||||
| Refining and petrochemicals | ||||||||
| Andean Chemical Limited | 127,812 | 127,812 | ||||||
| Propilco S.A. | 108,137 | 108,137 | ||||||
| 1,457,043 | 1,457,043 | |||||||
| Less: Impairment loss of Hocol Petroleum Ltd | (297,121 | ) | (297,121 | ) | ||||
| Total | 1,159,922 | 1,159,922 | ||||||
At December 31, 2016, the Company assessed the recoverability of the carrying value of goodwill generated in the acquisition of controlled companies. The recoverable amount was determined based on the fair value less cost of disposal using the present value of future cash flows for each of the companies acquired. Future cash flows was based on financial projections of each company derived from the business plans approved by management, which were developed based on long term macro-economic factors such as price curves and margins and fundamental assumptions of supply and demand. As a result of the analysis the Company did not identify any goodwill impairment.
In 2015, given the adverse economic environment faced by the hydrocarbon sector the Company was exposed to certain future risks such as a further decline in oil prices, lower refining margins, lower profit margins, changes in cost profiles, changes in levels of capital expenditures and maintenance, a reduction in recoverable reserves amount, and an increase in market and country risk that is reflected in a higher discount rate. Any significant change in the estimates and judgments used to calculate these variables can have a material effect on the recognition of goodwill impairment charges. Different variables have different impact on segments. For example, the Exploration and Production segment is highly sensitive to the price of hydrocarbons, while the Refining segment is highly sensitive to the discount rate given the leverage in that segment. As a result, at December 31, 2015 the company recognized a goodwill impairment of COP$266,900 in Hocol Petroleum Limited, due mainly from the current adverse economic context faced by the hydrocarbon sector. Regarding goodwill allocated to the Transportation and Logistics Segment and the Refining and Petrochemicals Segment Ecopetrol did not identify the need to recognize any goodwill impairment.
| F-62 |
Ecopetrol S.A. Notes to Consolidated Financial Statements (Figures expressed in millions of Colombian pesos, unless otherwise stated) |
| 2014 | 2013 | |||||||
| Ocensa S.A. | 2,144,251 | 2,187,766 | ||||||
| Equion S.A. | 1,030,114 | 1,376,968 | ||||||
| ODL Finance S.A. | 394,033 | 377,245 | ||||||
| Oleoducto Bicentenario S.A.S. | 350,070 | 312,515 | ||||||
| Oleoducto de Colombia S.A. | 258,444 | 299,851 | ||||||
| Bioenergy S.A. | 19,023 | 19,403 | ||||||
| Total | 4,195,935 | 4,573,748 | ||||||
| 20.1 | Composition of loans and borrowings |
Non-controlling interestThe balance at December 31, 2016 and 2015 is calculated by taking the total equity of consolidated subsidiariescomprised as follows:
| Weighted average effective interest rate at December 31, 2016 / 2015 | 2016 | 2015 | ||||||||
| Local currency | ||||||||||
| Bonds | 8.6% / 9.8% | 2,008,203 | 1,960,695 | |||||||
| Syndicated loan | 9.5% / 7.7% | 3,828,329 | 4,226,454 | |||||||
| Commercial loans and other | 9.1% / 7.9% | 905,266 | 945,331 | |||||||
| Total local currency | 6,741,798 | 7,132,480 | ||||||||
| Foreign currency | ||||||||||
| Bonds | 6.0% / 6.1% | 29,310,165 | 29,121,535 | |||||||
| Commercial loan-Refinería de Cartagena | 4.1% / 4.1% | 7,988,678 | 9,107,938 | |||||||
| Other commercial loans | 2.9% / 2.1% | 7,945,693 | 7,101,195 | |||||||
| Other (1) | 235,693 | 760,190 | ||||||||
| Total foreign currency | 45,480,229 | 46,090,858 | ||||||||
| Total loans and borrowings | 52,222,027 | 53,223,338 | ||||||||
| Less short-term | 4,126,203 | 4,573,620 | ||||||||
| Total long-term | 48,095,824 | 48,649,718 | ||||||||
| (1) | Includes financial leasing and build, operation, maintenance and transfer contracts. |
| 20.2 | New borrowings |
The main financing operations during 2016 and multiplying by the share percentage that is attributable to stockholders that are foreign to the controlling company.2015 were as follows:
Bonds – Foreign currency
| - | At June 2015, Ecopetrol S.A. issued US$1,500 million of bonds in the international market with payment of principal at maturity (June 26, 2026) and interest payable semi-anually at a coupon rate of 5.375%. |
Commercial loans
| § | On January 29, 2016, Ecopetrol entered into a commercial loan for US$175 million with The Bank of Tokyo-Mitsubushi UFJ, Ltd. This loan has a 5 years term, is amortizable with a 2.5 years of grace period on principal and interest is payable semi-annually at a rate of 6-M Libor + 145 basis points. |
Subscribed
| F-63 |
Ecopetrol S.A. Notes to Consolidated Financial Statements (Figures expressed in millions of Colombian pesos, unless otherwise stated) |
| § | On May 16, 2016, Ecopetrol entered into a commercial loan for US$300 million with Export Development Canada, the Canadian government’s export promotion agency.This loan has a 5-year term with principal payable at maturity and interest payable semi-annually at a rate of 6-M Libor+ 140 basis points rate. |
| · | On February 23, 2016, Ecopetrol entered into a commercial loan for COP$990,000 with Bancolombia S.A. which was canceled in early October 2016. This loan had an 8-year term, amortizable with a 2 years grace period on capital with interest payable semi-annually at a DTF rate of TA + 560 basis points. |
| · | In February 2015, Ecopetrol S.A. entered into a commercial loan for US$1,925 million. The operation was conducted with the participation of 8 international banks. The loan maturity date is February 2020 payable at maturity with semiannual interest payments at Libor + 140 basis points. |
For the acquisition of the above credits, no guarantees have been granted due to the support of the Colombian Government through the Ministry of Finance and paid-inPublic Credit.
Other
During 2016, the Company fully paid the short-term remittances financed in dollars with domestic banks for the payment of imports that were in effect as of December 31, 2015 in the amount of US$203 million with a financing rate of Libor + 65 basis points.
| F-64 |
Ecopetrol S.A. Notes to Consolidated Financial Statements (Figures expressed in millions of Colombian pesos, unless otherwise stated) |
The following table details the main characteristics of the most significant loans of the Ecopetrol Business Group at December 31, 2016:
Initial amount at original currency | Balance at December 31, | Principal | Interest | ||||||||||||||||||||||||
| Type | Company | Starting date | Currency | (millions) | 2016 | 2015 | Maturity | Interest rate | payment | payment | |||||||||||||||||
| Dec-10 | COP $ | 138,700 | 138,700 | 138,700 | dec-17 | Floating | Bullet* | Semi-annually | |||||||||||||||||||
| Dec-10 | COP $ | 479,900 | 479,900 | 479,900 | dec-20 | Floating | Bullet | Semi-annually | |||||||||||||||||||
| Dec-10 | COP $ | 284,300 | 284,300 | 284,300 | dec-40 | Floating | Bullet | Semi-annually | |||||||||||||||||||
| Bonds in | Ecopetrol S.A | Aug-13 | COP $ | 120,950 | 120,950 | 120,950 | aug-18 | Floating | Bullet | Semi-annually | |||||||||||||||||
| local-currency | Aug-13 | COP $ | 168,600 | 168,600 | 168,600 | aug-23 | Floating | Bullet | Semi-annually | ||||||||||||||||||
| Aug-13 | COP $ | 347,500 | 347,500 | 347,500 | aug-28 | Floating | Bullet | Semi-annually | |||||||||||||||||||
| Aug-13 | COP $ | 262,950 | 262,950 | 262,950 | aug-43 | Floating | Bullet | Semi-annually | |||||||||||||||||||
| Syndicated loan | Ecopetrol S.A. | May-13 | COP $ | 1,839,000 | 1,736,833 | 1,839,000 | may-25 | Floating | Semi-annually | Semi-annually | |||||||||||||||||
| in local-currency | Oleoducto Bicentenario | Jul-12 | COP $ | 2,100,000 | 1,549,625 | 1,717,625 | jul-24 | Floating | Quarterly | Quarterly | |||||||||||||||||
| ODL Finance S.A. | Aug-13 | COP $ | 800,000 | 480,000 | 608,000 | aug-20 | Floating | Quarterly | Quarterly | ||||||||||||||||||
| Jul-09 | US$ | 1,500 | 1,500 | ** | 1,500 | jul-19 | Fixed | Bullet | Semi-annually | ||||||||||||||||||
| Sep-13 | US$ | 350 | 350 | ** | 350 | sep-18 | Fixed | Bullet | Semi-annually | ||||||||||||||||||
| Sep-13 | US$ | 1,300 | 1,800 | ** | 1,300 | sep-23 | Fixed | Bullet | Semi-annually | ||||||||||||||||||
| Sep-13 | US$ | 850 | 850 | 850 | sep-43 | Fixed | Bullet | Semi-annually | |||||||||||||||||||
| Bonds in foreign | Ecopetrol S.A. | May-14 | US$ | 2,000 | 2,000 | ** | 2,000 | may-45 | Fixed | Bullet | Semi-annually | ||||||||||||||||
| currency | Sep-14 | US$ | 1,200 | 1,200 | ** | 1,200 | may-25 | Fixed | Bullet | Semi-annually | |||||||||||||||||
| Jun-15 | US$ | 1,500 | 1,500 | ** | 1,500 | jun-26 | Fixed | Bullet | Semi-annually | ||||||||||||||||||
| Jun-16 | US$ | 500 | 500 | ** | - | aug-23 | Fixed | Bullet | Semi-annually | ||||||||||||||||||
| Oleoducto Central S.A. | May-14 | US$ | 500 | 500 | ** | 500 | may-21 | Fixed | Bullet | Semi-annually | |||||||||||||||||
| Refinería de | Dec-11 | US$ | 2,747 | 2,177 | 2,394 | dec-27 | Fixed | Semi-annually | Semi-annually | ||||||||||||||||||
| Cartagena S.A. | Dec-11 | US$ | 310 | 246 | 270 | dec-27 | Floating | Semi-annually | Semi-annually | ||||||||||||||||||
| Dec-11 | US$ | 440 | 374 | 402 | dec-25 | Floating | Semi-annually | Semi-annually | |||||||||||||||||||
| Mar-13 | US$ | 245 | 171 | ** | 196 | jul-23 | Floating | Semi-annually | Semi-annually | ||||||||||||||||||
| Commercial loans | Mar-13 | US$ | 151 | 66 | ** | 105 | jul-19 | Floating | Semi-annually | Semi-annually | |||||||||||||||||
| in foreign currency | Ecopetrol S.A. | Feb-15 | US$ | 1,925 | 1,925 | ** | 1,925 | feb-20 | Floating | Bullet | Semi-annually | ||||||||||||||||
| Feb-16 | US$ | 175 | 175 | - | feb-21 | Floating | Semi-annually | Semi-annually | |||||||||||||||||||
| May-16 | US$ | 300 | 300 | - | may-21 | Floating | Bullet | Semi-annually | |||||||||||||||||||
* Bullet: Nominal value is fully paid on the maturity date.
** Loans designated as hedging instrument (see Note 31).
| F-65 |
Ecopetrol S.A. Notes to Consolidated Financial Statements (Figures expressed in millions of Colombian pesos, unless otherwise stated) |
| 20.3 | Maturity of loans and borrowings |
The following is the maturity profile of loans as of December 31, 2016:
| Up to 1 year | 1 - 5 years | 5-10 years | > 10 years | Total | ||||||||||||||||
| Local currency | ||||||||||||||||||||
| Bonds | 312,207 | 955,204 | 357,015 | 383,777 | 2,008,203 | |||||||||||||||
| Commercial loans | 793,743 | 2,375,023 | 659,563 | - | 3,828,329 | |||||||||||||||
| Others | 58,952 | 333,372 | 339,009 | 173,933 | 905,266 | |||||||||||||||
| Total local currency | 1,164,902 | 3,663,599 | 1,355,587 | 557,710 | 6,741,798 | |||||||||||||||
| Foreign currency | ||||||||||||||||||||
| Bonds | 1,648,707 | 10,956,507 | 12,133,576 | 4,571,375 | 29,310,165 | |||||||||||||||
| Commercial loan Refinería de Cartagena | 875,734 | 3,549,216 | 3,472,379 | 91,349 | 7,988,678 | |||||||||||||||
| Other commercial loans | 371,804 | 7,450,587 | 123,302 | - | 7,945,693 | |||||||||||||||
| Other | 65,056 | 114,226 | 56,411 | - | 235,693 | |||||||||||||||
| Total foreign currency | 2,961,301 | 22,070,536 | 15,785,668 | 4,662,724 | 45,480,229 | |||||||||||||||
| Total | 4,126,203 | 25,734,135 | 17,141,255 | 5,220,434 | 52,222,027 | |||||||||||||||
| 20.4 | Breakdown by type of interest rate |
| 2016 | 2015 | |||||||
| Local - currency | ||||||||
| Fixed interest rate | 299,472 | 19,410 | ||||||
| Floating interest rate | 6,442,326 | 7,113,070 | ||||||
| 6,741,798 | 7,132,480 | |||||||
| Foreign currency | ||||||||
| Fixed interest rate | 35,719,486 | 36,994,095 | ||||||
| Floating interest rate | 9,760,743 | 9,096,763 | ||||||
| 45,480,229 | 46,090,858 | |||||||
| Total loans and borrowings | 52,222,027 | 53,223,338 | ||||||
Local currency loans and borrowings at floating rates are mainly indexed to the CPI (Consumer Price Index) and DTF (Fixed Term Deposit). The foreign currency loans and borrowings at floating rates are indexed mainly to Libor plus a spread.
| 20.5 | Loans designated as hedging instruments |
As of December 31, 2016 the Company designated US$10,512 million of foreign currency debt as a hedging instrument; of which US$5,312 million correspond to the cash flow hedge for future crude exports and US$5,200 million to hedge investments in subsidiaries with the US dollar as their functional currency. See Note 31 - Risk management, for further information.
| F-66 |
Ecopetrol S.A. Notes to Consolidated Financial Statements (Figures expressed in millions of Colombian pesos, unless otherwise stated) |
| 20.6 | Guarantees and covenants |
For financing obtained by Ecopetrol in the capital markets, which correspond to issuance of local and foreign bonds that, are not guaranteed due to the support of the Colombian Government through the Ministry of Finance and Public Credit.
Refinería de Cartagena (Reficar) carried out an international commercial loan for US$3,497 million to finance the expansion project of Cartagena Refinery in 2011. This operation imposes restrictions on Reficar’s debt ratio, except for certain conditions expressly set out in contracts about working capital needs. Regarding the financial covenants Reficar is required to maintain a coverage ratio of minimum debt service of 1.35: 1 at certain times of the loan’s life. This subsidiary is in compliance with all covenants and debt commitments as of December 31, 2016.
Under the same transaction Reficar entered into a commercial trust and Security and Depositary Agreement to receive the resources of the new refinery to meet specific purposes such as operating expenses, interest and others.
In the case of financing obtained by Oleoducto Bicentenario S.A.S. for the construction of the project and startup of the pipeline the creation of a main fund was established to manage the funds for the payment of the syndicated loan.
| 20.7 | Fair value of loans |
The fair value of the loans is COP$52,109,438 and COP$49,668,119 as of December 31, 2016 and 2015, respectively.
Loans are recorded in the financial statements at their amortized cost, which is the financial amount of initial recognition less principal repayments, plus or minus the cumulative amortization using the effective interest method of any difference between that initial amount and the maturity amount.
For fair value measurement, bonds and local currency securities were valued using Infovalmer's reference prices, while for dollar-denominated bonds the Bloomberg methodology was used as the source. With regard to the other financial obligations for which there is no market benchmark a discount to present value technique was used. These rates incorporate market risk through some benchmark (Libor, DTF) and the Company's credit risk (spread).
| F-67 |
Ecopetrol S.A. Notes to Consolidated Financial Statements (Figures expressed in millions of Colombian pesos, unless otherwise stated) |
| 21. | Trade and other payables |
The balance at December 31, 2016 and 2015 of trade and other payables is comprised as follows:
| 2016 | 2015 | |||||||
| Suppliers | 4,687,353 | 4,979,932 | ||||||
| Partners’ advances | 864,971 | 675,527 | ||||||
| Withholding tax | 379,194 | 346,578 | ||||||
| Deposits received from third parties | 209,570 | 571,577 | ||||||
| Related parties (Note 32) | 114,420 | 87,463 | ||||||
| Agreements in transport contracts (2) | 111,899 | 33,735 | ||||||
| Insurance and reinsurance | 110,530 | 118,338 | ||||||
| Dividends payable (1) | 11,193 | 693,878 | ||||||
| Various creditors | 389,126 | 250,255 | ||||||
| 6,878,256 | 7,757,283 | |||||||
| Current | 6,854,363 | 7,757,277 | ||||||
| Non-current | 23,893 | 6 | ||||||
| 6,878,256 | 7,757,283 | |||||||
| (1) | During the first quarter of 2016 the last installment of dividends on 2014 net profits was paid to the Ministry of Finance and Public Credit by COP$690,177 |
| (2) | Corresponds to the value of the debt for agreements in the contracts of transport by pipelines and poliducts calculated in the volume compensation by quality and other agreements of management of inventories. |
The carrying amount of trade accounts and other accounts payable approximates their fair value due to its short-term nature.
| 22. | Provisions for employee benefits |
The following are the balances of provisions for employee benefits as of December 31, 2016 and 2015:
| 2016 | 2015 | |||||||
| Post-employment benefits | ||||||||
| Healthcare | 4,475,540 | 3,593,428 | ||||||
| Pension | 531,596 | (262,182 | ) | |||||
| Education | 333,379 | 535,356 | ||||||
| Bonds | (191,338 | ) | (483,876 | ) | ||||
| Other | 67,945 | 41,263 | ||||||
| Termination benefits - Voluntary retirement plan | 161,796 | - | ||||||
| 5,378,918 | 3,423,989 | |||||||
| Welfare benefits and salaries payable | 423,360 | 353,285 | ||||||
| Other post-employment benefits | 73,300 | 74,841 | ||||||
| Total | 5,875,578 | 3,852,115 | ||||||
| Current | 1,974,496 | 1,392,266 | ||||||
| Non-current | 3,901,082 | 2,459,849 | ||||||
| 5,875,578 | 3,852,115 | |||||||
| F-68 |
Ecopetrol S.A. Notes to Consolidated Financial Statements (Figures expressed in millions of Colombian pesos, unless otherwise stated) |
| 22.1 | Post-employment benefits liability (asset) |
The following table shows the movement in liabilities and assets, net of post-employment benefits and termination benefits at December 31, 2016 and 2015:
| Pension and pension bonds (1) | Healthcare, Education and others | Total | ||||||||||||||||||||||
| 2016 | 2015 | 2016 | 2015 | 2016 | 2015 | |||||||||||||||||||
| Employee benefits liabilities | ||||||||||||||||||||||||
| Opening balance | 10,435,546 | 11,559,018 | 4,170,047 | 5,515,809 | 14,605,593 | 17,074,827 | ||||||||||||||||||
| Current service cost | - | - | 53,771 | 53,095 | 53,771 | 53,095 | ||||||||||||||||||
| Past service cost | - | - | 164,271 | - | 164,271 | - | ||||||||||||||||||
| Interest expense | 876,076 | 839,716 | 337,844 | 395,977 | 1,213,920 | 1,235,693 | ||||||||||||||||||
| Actuarial losses (gains) | 1,915,767 | (1,252,017 | ) | 616,834 | (1,490,315 | ) | 2,532,601 | (2,742,332 | ) | |||||||||||||||
| Paid benefits | (763,956 | ) | (711,171 | ) | (301,634 | ) | (304,519 | ) | (1,065,590 | ) | (1,015,690 | ) | ||||||||||||
| Closing balance | 12,463,433 | 10,435,546 | 5,041,133 | 4,170,047 | 17,504,566 | 14,605,593 | ||||||||||||||||||
| Plan assets | ||||||||||||||||||||||||
| Opening balance | 11,181,604 | 11,657,629 | - | - | 11,181,604 | 11,657,629 | ||||||||||||||||||
| Return on assets | 950,704 | 849,556 | - | - | 950,704 | 849,556 | ||||||||||||||||||
| Change in the effect of the asset ceiling | 379,884 | (329,825 | ) | - | - | 379,884 | (329,825 | ) | ||||||||||||||||
| Paid benefits | (771,528 | ) | (711,432 | ) | 2,406 | - | (769,122 | ) | (711,432 | ) | ||||||||||||||
| Actuarial gains (losses) | 382,511 | (284,324 | ) | 67 | - | 382,578 | (284,324 | ) | ||||||||||||||||
| Closing balance | 12,123,175 | 11,181,604 | 2,473 | - | 12,125,648 | 11,181,604 | ||||||||||||||||||
| Net post-employment benefits liability (asset) | 340,258 | (746,058 | ) | 5,038,660 | 4,170,047 | 5,378,918 | 3,423,989 | |||||||||||||||||
| (1) | There is no service cost for pension and pension plans because the beneficiaries were all retired by July 31, 2010. |
| F-69 |
Ecopetrol S.A. Notes to Consolidated Financial Statements (Figures expressed in millions of Colombian pesos, unless otherwise stated) |
The following table shows the movement in results and other comprehensive income as of December 31, 2016 and 2015:
| 2016 | 2015 | |||||||
| Recognized in profit or loss | ||||||||
| Current service cost | 53,771 | 53,095 | ||||||
| Past service cost | 164,271 | - | ||||||
| Interest expense, net | 263,216 | 386,137 | ||||||
| 481,258 | 439,232 | |||||||
| Recognized in other comprehensive income | ||||||||
| Healthcare | (792,093 | ) | 1,359,631 | |||||
| Pension and pension bonds | (1,533,256 | ) | 967,693 | |||||
| Education and severance | 175,259 | 130,684 | ||||||
| Termination benefits | 67 | - | ||||||
| Change in the effect of the asset ceiling | 379,884 | (329,824 | ) | |||||
| (1,770,139 | ) | 2,128,184 | ||||||
| Deferred tax | 616,697 | (723,582 | ) | |||||
| Other comprehensive income, net of taxes | (1,153,442 | ) | 1,404,602 | |||||
| 22.2 | Plan assets |
Plan assets are represented in the resources provided to Pension Trusts, for payment of the pension liabilities relating to the obligations for monthly pension payments and bonds; that pertaining to health and education is under the responsibility of Ecopetrol. The destination of trust resources and its yields cannot be changed or returned to the Company until all pension obligations have been fulfilled.
The composition by investment type is comprised as follows at December 31, 2016 and 2015:
| 2016 | 2015 | |||||||
| Bonds issued by the Colombian Government | 4,410,326 | 4,099,067 | ||||||
| Bonds of private entities | 2,880,958 | 3,405,440 | ||||||
| Other bonds of public entities | 693,061 | 790,601 | ||||||
| Bonds of foreign entities | 622,817 | 300,181 | ||||||
| Variable yield | 305,052 | 278,716 | ||||||
| Other local currency | 2,910,083 | 2,257,655 | ||||||
| Other foreign currency | 300,878 | 429,828 | ||||||
| Fair value of plan assets | 12,123,175 | 11,561,488 | ||||||
| Less asset ceiling | - | (379,884 | ) | |||||
| 12,123,175 | 11,181,604 | |||||||
The yield on plan assets as of December 31, 2016 was 11.60% (4.96% - 2015). The credit quality of issuers and counterparties in transactions involving plan assets is described in Note 31.3 – Credit risk.
The following is the fair value hierarchy of the plan assets as of December 31, 2016 and 2015:
| 2016 | 2015 | |||||||
| Level 1 | 5,604,643 | 3,876,386 | ||||||
| Level 2 | 6,518,532 | 7,685,102 | ||||||
| 12,123,175 | 11,561,488 | |||||||
The fair value of the plan assets is calculated using prices quoted in the relevant assets’ market. The Company obtains these prices through reliable financial data suppliers recognized in Colombia or abroad depending on the investment.
| F-70 |
Ecopetrol S.A. Notes to Consolidated Financial Statements (Figures expressed in millions of Colombian pesos, unless otherwise stated) |
For the securities issued in local currency the fair value of the plan assets is calculated using information published by Infovalmer, a supplier of prices authorized by the Superintendency of Finance. According to its methodology prices may be calculated based on market information at the valuation date or estimated based on historic inputs in accordance with the criteria established for the calculation of each of the prices.
The fair value is calculated based on the most representative market of the transactions carried out through electronic platforms approved and supervised by the regulator.
The estimated price is calculated for investments that do not reflect sufficient information to estimate an average market price replicating quoted prices for similar assets or prices obtained through stock broker quotes. This estimated price is also given by Infovalmer as a result of the application of robust methodologies approved by the financial regulator and widely used by the financial sector.
| 22.3 | Actuarial assumptions |
The following are the actuarial assumptions used in determining the present value of defined employee benefit obligations at December 31, 2016 and 2015:
| 2016 | Pension | Bonds | Healthcare | Education | Other benefits (1) | |||||||||||||||
| Discount rate | 7.25 | % | 7.00 | % | 7.25 | % | 6.50 | % | 6.67 | % | ||||||||||
| Salary growth rate | N/A | N/A | N/A | N/A | 4.25 | % | ||||||||||||||
| Expected inflation rate | 3.00 | % | 3.00 | % | 3.00 | % | 3.00 | % | 3.00 | % | ||||||||||
| Pension growth rate | 3.00 | % | N/A | N/A | N/A | N/A | ||||||||||||||
| Cost trend | ||||||||||||||||||||
| Short-term rate | N/A | N/A | 3.00 | % | 4.00 | % | N/A | |||||||||||||
| Long-term rate | N/A | N/A | 4.00 | % | 4.00 | % | N/A | |||||||||||||
| 2015 | Pension | Bonds | Healthcare | Education | Other benefits (1) | |||||||||||||||
| Discount rate | 8.50 | % | 8.50 | % | 8.50 | % | 7.75 | % | 8.00 | % | ||||||||||
| Salary growth rate | 4.25 | % | N/A | N/A | N/A | 4.25 | % | |||||||||||||
| Expected inflation rate | 3.00 | % | 3.00 | % | 3.00 | % | 3.00 | % | 3.00 | % | ||||||||||
| Pension growth rate | 3.00 | % | N/A | N/A | N/A | N/A | ||||||||||||||
| Cost trend | ||||||||||||||||||||
| Short-term rate | N/A | N/A | 3.50 | % | 4.00 | % | N/A | |||||||||||||
| Long-term rate | N/A | N/A | 4.00 | % | 4.00 | % | N/A | |||||||||||||
N/A: Not applicable for this benefit.
| (1) | Weighted average rates. |
The cost trend is the projected increase for the initial year which includes the expected inflation rate.
The mortality table used for all calculations was ´Valid Annuitants” for men and women based on the experience gained for the period 2005-2008 of the Colombian Social Security Institute – ISS.
| F-71 |
Ecopetrol S.A. Notes to Consolidated Financial Statements (Figures expressed in millions of Colombian pesos, unless otherwise stated) |
| 22.4 | Maturity of benefit obligation |
The cash flow required for post-employment benefits liability is comprised as follows:
| Period | Pension and pension bonds | Other benefits | Total | |||||||||
| 2017 | 794,566 | 330,539 | 1,125,105 | |||||||||
| 2018 | 820,364 | 328,351 | 1,148,715 | |||||||||
| 2019 | 842,858 | 330,878 | 1,173,736 | |||||||||
| 2020 | 864,392 | 333,292 | 1,197,684 | |||||||||
| 2021 | 886,464 | 336,423 | 1,222,887 | |||||||||
| 2022-2025 | 4,877,784 | 1,672,066 | 6,549,850 | |||||||||
| 22.5 | Sensitivity analysis |
The sensitivity analysis below has been determined based on reasonably possible changes of the respective assumptions occurring at the end of the reporting period, while keeping all other assumptions as constant, at December 31, 2016:
| Pension | Pension bonds | Healthcare | Education | Other benefits | ||||||||||||||||
| Discount rate | ||||||||||||||||||||
| -50 basis points | 12,278,122 | 894,404 | 4,785,817 | 345,279 | 235,987 | |||||||||||||||
| +50 basis points | 10,996,917 | 815,680 | 4,197,636 | 329,870 | 224,749 | |||||||||||||||
| Inflation rate | ||||||||||||||||||||
| -50 basis points | 10,946,122 | 814,065 | - | - | 161,456 | |||||||||||||||
| +50 basis points | 12,330,307 | 895,826 | - | - | 167,152 | |||||||||||||||
| Salary growth rate | ||||||||||||||||||||
| -50 basis points | - | - | - | - | 62,511 | |||||||||||||||
| +50 basis points | - | - | - | - | 69,633 | |||||||||||||||
| Cost trend | ||||||||||||||||||||
| -50 basis points | - | - | 4,198,775 | 330,360 | - | |||||||||||||||
| +50 basis points | - | - | 4,782,280 | 344,700 | - | |||||||||||||||
The Company conducted a sensitivity analysis related to the interest rate variation on plan assets. See section 30 – Risk management.
| 22.6 | Voluntary retirement plan |
In August 2016 the Company offered a voluntary retirement plan to 200 employees who met certain criteria. As of December 31, 2016 137 employees were part of plan, with a corresponding cost of COP$161,796. This plan includes benefits such as monthly income, education and health benefits until the date on which the employee is granted their retirement pension.
| F-72 |
Ecopetrol S.A. Notes to Consolidated Financial Statements (Figures expressed in millions of Colombian pesos, unless otherwise stated) |
| 23. | Accrued liabilities and provisions |
The following shows a breakdown of the changes in the different categories of accrued liabilities and provisions for the years ended December 31, 2016 and 2015:
| Asset retirement obligation | Litigations | Comuneros provision | Environmental contingencies and others | Total | ||||||||||||||||
| Balance at December 31, 2015 | 4,452,369 | 99,798 | 702,486 | 822,694 | 6,077,347 | |||||||||||||||
| Increase in abandonment costs | 404,797 | - | - | - | 404,797 | |||||||||||||||
| Additions (recoveries) | 18,285 | 44,120 | (702,486 | ) | (74,312 | ) | (714,393 | ) | ||||||||||||
| Uses | (68,460 | ) | (4,585 | ) | - | (31,218 | ) | (104,263 | ) | |||||||||||
| Financial cost | 317,448 | - | - | (173 | ) | 317,275 | ||||||||||||||
| Foreign currency translation | (14,703 | ) | (355 | ) | - | (2,759 | ) | (17,817 | ) | |||||||||||
| Transfers (1) | (45,076 | ) | 70,954 | - | (70,954 | ) | (45,076 | ) | ||||||||||||
| Balance at December 31, 2016 | 5,064,660 | 209,932 | - | 643,278 | 5,917,870 | |||||||||||||||
| Current | 330,057 | 146,767 | - | 345,130 | 821,954 | |||||||||||||||
| Non-current | 4,734,603 | 63,165 | - | 298,148 | 5,095,916 | |||||||||||||||
| Total | 5,064,660 | 209,932 | - | 643,278 | 5,917,870 | |||||||||||||||
| Asset retirement obligation | Litigations | Comuneros provision | Environmental contingencies and others | Total | ||||||||||||||||
| Balance at December 31, 2014 | 4,281,107 | 299,551 | 551,497 | 705,916 | 5,838,071 | |||||||||||||||
| Additions (recoveries) | (60,813 | ) | (188,962 | ) | 150,989 | 188,701 | 89,915 | |||||||||||||
| Uses | (84,333 | ) | (10,791 | ) | - | (74,876 | ) | (170,000 | ) | |||||||||||
| Financial cost | 238,876 | - | - | 2,417 | 241,293 | |||||||||||||||
| Foreign currency translation | 89,793 | - | - | 5,905 | 95,698 | |||||||||||||||
| Transfers (1) | (12,261 | ) | - | - | (5,369 | ) | (17,630 | ) | ||||||||||||
| Balance at December 31, 2015 | 4,452,369 | 99,798 | 702,486 | 822,694 | 6,077,347 | |||||||||||||||
| Current | 195,858 | 85,364 | - | 372,275 | 653,497 | |||||||||||||||
| Non-current | 4,256,511 | 14,434 | 702,486 | 450,419 | 5,423,850 | |||||||||||||||
| Total | 4,452,369 | 99,798 | 702,486 | 822,694 | 6,077,347 | |||||||||||||||
| (1) | Mainly includes transfers to liabilities associated with assets held for sale. |
| 23.1 | Asset retirement obligation |
Asset retirement obligation corresponds to the Company's future obligation to restore environmental conditions in a manner similar to those existing prior to the start of projects or activities as described in section 3.5. As long-term obligations this liability is estimated by projecting the expected future payments and discounting at present value with a rate referenced to the Company's financial obligations, taking into account the temporality and risks of this obligation. The weighted average discount rate at December 31, 2016 was 7.80% (2015 - 7.28%).
| F-73 |
Ecopetrol S.A. Notes to Consolidated Financial Statements (Figures expressed in millions of Colombian pesos, unless otherwise stated) |
| 23.2 | Litigations |
The following is a summary of the main legal proceedings recognized in the statement of financial position, whose loss expectations are highly probable and could imply an outflow of resources at December 31, 2016 and 2015:
| Claims | 2016 | 2015 | ||||||
| Provision for payment of premium to update the Legal Stability Contract with the Ministry of Finance and Public Credit, generated by the increased investment in the expansion project. | 59,528 | 54,181 | ||||||
| Settlement before the Procuraduría General de la Nación with the firms Acciona Infraestructura S.A. y Mantenimiento y Montajes S.A., on August 18, 2016. | 44,986 | - | ||||||
| Litigation with Schrader Camargo, supplier for Reficar | 17,003 | 17,003 | ||||||
| Damage to third parties caused by hydrocarbon easement in a property near toRefinería de Cartagena. | 11,019 | 11,019 | ||||||
| Lawsuit by the Sincco consortium for damage related to contractual conditions for the modernization project at the product filling station at the Barrancabermeja industrial complex. | 5,347 | 5,347 | ||||||
| Damage to third parties caused by a spill of oil owned by Ecopetrol during a car accident in the Raizal rural district in Cundinamarca. | 3,500 | 3,500 | ||||||
| Labor proceeding in 2007 for recalculation of salaries and benefits based on the collective agreement for 232 contractors of Ecopetrol. In the last quarter of 2015 the claimant filed a request for settlement for a new amount of COP$9,338. In 2016 the ruling issued was favorable to Ecopetrol. | 10 | 9,338 | ||||||
| 23.3 | Comuneros - Santiago de las Atalayas provisions |
On November 8, 2016, the Ministry of Mines and Energy concluded that the amounts being held were not royalties and therefore not due to the Comuneros. The amounts belonged to Ecopetrol and therefore Ecopetrol recovered the provision it had been recognizing in its financial statements relating to this dispute.
In accordance with the foregoing, the resources held by Ecopetrol are their property without any claim or discussion to date regarding ownership title thereof. On November 8, 2016, the amount of the controversy added up to COP$688,664 originated mostly from the valuation and financial yields of the fund where the resources were deposited. The reversal of this provision was recognized in the net financial results of the period ending December 31, 2016.
| 23.4 | Environmental contingencies and others |
These are mainly contingencies for environmental incidents and environmental compensation obligations for the use and impact on natural resources within the framework of environmental authorizations and 1% mandatory investment for the use of water taken directly from natural sources pursuant to that provided for in Law 99 of 1993, article 43 and Decree 1900 of 2006 in relation with Ecopetrol projects in the region. On December 22, 2016, the Ministry of the Environment and Sustainable Development issued Decree 2099, whereby it amended the Regulatory Single Decree of the environment and sustainable development sector, Decree 1076 of 2015 related to their mandatory investment for the use of water taken directly from natural sources; the Company is currently analyzing the impact derived from its implementation.
| F-74 |
Ecopetrol S.A. Notes to Consolidated Financial Statements (Figures expressed in millions of Colombian pesos, unless otherwise stated) |
| 23.5 | Legal proceedings not recognized |
The following is a summary of the main contingent liabilities that have not been recognized in the statement of financial position since according to evaluations performed by Company’s internal and external advisors their occurrence is not probable at December 31, 2016 and 2015:
| Claims | 2016 | 2015 | ||||||
| Income tax for taxable year 2010 of Hocol - Rejections related to: a) Special production on productive fixed assets related to unsuccessful exploratory wells. b) Deduction of disbursements related to geology, geophysics and seismic, which must be capitalized and amortized. | 197,824 | 197,824 | ||||||
| Income tax for taxable year 2011 of Hocol - Rejections related to: a) Special production on real productive fixed assets related to unsuccessful exploratory wells. b) Deduction of disbursements related to geology, geophysics and seismic, which must be capitalized and amortized. | 147,091 | 147,091 | ||||||
| On March 14, 2016, a lawsuit was filed for default in settling the contract between Konidol and Ecopetrol, which gave rise to excess costs in the maintenance contract. | 62,131 | - | ||||||
| Indemnity to third parties for damage caused by hydrocarbon spills during a tanker truck accident on the Villeta - Guaduas road. | 43,333 | 43,333 | ||||||
| Recalculation of legal and extralegal social benefits on cash paid for the benefit of saving incentives. | 16,562 | 16,562 | ||||||
| Claim to Ecopetrol for legal actions filed against Cepsa as the operator of the Association contract for excess costs in current contracts. | 10,608 | - | ||||||
| Default by Ecopetrol in fulfilling contractual terms of the civil works project with the contractor Edgar Gómez Lucena y Asociados Ltda. | 10,000 | 10,000 | ||||||
Transfers of the electric energy sector for electric power self–generation, pursuant to Law 142 of 1994. In 2016 there was a second instance ruling that was favorable to Ecopetrol. | - | 219,944 | ||||||
| F-75 |
Ecopetrol S.A. Notes to Consolidated Financial Statements (Figures expressed in millions of Colombian pesos, unless otherwise stated) |
| 23.6 | Detail of contingent assets |
Included below, there is a detail of the major assets contingencies of which occurrence is possible at December 31, 2016 and 2015:
| Claims | 2016 | 2015 | ||||||
| Default in fulfilling the pipe purchase order subscribe to with Daewoo International Corp. | 21,232 | 21,232 | ||||||
| Public lighting tax in the municipality of Barrancabermeja for the years 2003 to 2005. | 17,490 | - | ||||||
| Nullity of administrative act issued by the DIAN, which ordered a special contribution for public works contracts. | 13,214 | 13,214 | ||||||
| Nullity of resolution 113 of 1971 of the Presidency of Colombia, whereby the subsurface property titles were transferred to private parties known with the names of Santiago de las Atalayas and Pueblo Viejo de Cusiana. In 2016, the lawsuit ended in favor of Ecopetrol, making it clear that the sequestered cash is the property of Ecopetrol. | - | 175,000 | ||||||
| Nullity of administrative act that ordered a special contribution for public works contracts. In 2016, there was a first instance ruling that is partially favorable to the claims of Ecopetrol. | 2 | 14,956 | ||||||
Refinería de Cartagena
On March 8, 2016 Reficar presented a request for Arbitration before the International Chamber of Commerce (ICC) against Chicago Bridge & Iron Company NV, CB&I (UK) Limited and CBI Colombiana S.A. (collectively, "CB&I") related to the contract for the construction, procurement and engineering entered into by Reficar and CB&I for the expansion ofRefinería de Cartagena in Cartagena, Colombia. Reficar is the claimant in the arbitration process of the ICC and requests at least US$2 billion from CB&I. On May 25, 2016 CB&I filed a counterclaim of approximately US$213 million. On June 27, 2016, Reficar answered this request denying any responsibility. The International Chamber of Commerce process is currently in its preliminary stage and a hearing is scheduled for October 2018.
| F-76 |
Ecopetrol S.A. Notes to Consolidated Financial Statements (Figures expressed in millions of Colombian pesos, unless otherwise stated) |
| 24. | Equity |
The main components of equity are comprised as follows:
| 24.1 | Subscribed and paid-in capital |
Ecopetrol’s authorized capital amounts to $15,000,000,$36,540,000, and is comprised byof 60,000,000,000 ordinary nominative shares, at a $250 pesos par value each. 41,116,698,45641,116,694,690 of such shares have been subscribed represented by 11.51% (4,731,905,873 shares) of non-controlling interestnatural and non-government entities and 88.49% (36,384,788,817 shares) held of shareholders fromby Government entities. The value of the reserve shares amounts to $4,720,825$11,499,933 comprised by 18,883,301,54418,883,305,310 shares. At December 31, 2016 and 2015, subscribed and paid-in capital amounts to $25,040,067. There are no potentially dilutive instruments.
Additional paid-in capitalOn March 26, 2015, the General Stockholders’ Meeting approved the capitalization of occasional reserves of Ecopetrol S.A. for COP$14,760,893 through the mechanism of increasing the face value. This capitalization of reserves did not modify materially the number of ordinary shares registered.
| 24.2 | Additional paid-in capital |
Mainly
It mainly corresponds to: (i) surplus with respect to its nominal value derived from the sale of shares upon capitalization in 2007, in the amount of $4,700,963,for $4,457,997, (ii) $31,225,$31,377 the value generated by the process of placing the shares on the secondary market, arising from the calling of guarantees from debtors in arrears, according to the stipulationsprovisions of Article 397 of the Commercial Code andof Commerce, (iii) to the surplus over nominal value arising from the sale of shares awarded in the second round, which took place in September 2011, in the amount of $2,222,443.$2,118,468, and (iv) Additional paid-in capital receivable for $(143).
Ecopetrol S.A. and Subsidiaries
Notes to the Consolidated Financial Statements24.3 Equity reserves
Years ended
The balance of equity reserves is comprised as follows at December 31, 2014, 20132016 and 20122015:
(Expressed in millions of Colombian pesos)
| 2016 | 2015 | |||||||
| Legal reserve | 1,269,680 | 5,139,587 | ||||||
| Fiscal and statutory reserves | 289,164 | 405,660 | ||||||
| Occasional reserves | - | 1,323 | ||||||
| Total | 1,558,844 | 5,546,570 | ||||||
The following shows the balance and a breakdown of additional paid-in capital as ofthe changes in equity reserves at December 31:31, 2016 and 2015:
| 2014 | 2013 | |||||||
| Additional paid-in capital | 6,954,672 | 6,954,631 | ||||||
| Additional paid-in capital receivable | (226 | ) | (257 | ) | ||||
| Total | 6,954,446 | 6,954,374 | ||||||
| 2016 | 2015 | |||||||
| Opening balance | 5,546,570 | 17,963,370 | ||||||
| Appropriation of reserves, net | (117,819 | ) | 2,344,095 | |||||
| Legal reserve used to offset previous year loss (Note 24.4) | (3,869,907 | ) | - | |||||
| Capitalization of occasional reserves | - | (14,760,895 | ) | |||||
| Closing balance | 1,558,844 | 5,546,570 | ||||||
Effect of applying the Public Accounting Regime
Corresponds to the transfer of negative balances derived from devaluation of property, plant and equipment constructed up until 2007, pursuant to the Public Accounting Regime.
This heading also shows the responsibilities pending decision arising from the proceedings on loss of materials, through enforcement of the process established in the above-mentioned standard.
Equity reservesLegal reserve
The legal reserve is made upColombian Code of Commerce establishes the appropriation obligation of 10% of net income andto the legal reserves until the legal reserves are equal to 50% of the subscribed capital. The legal reserve can be used as compensation forto offset losses or for distribution in the event of liquidation of the Company.a Company’s liquidation.
| F-77 |
Ecopetrol S.A. Notes to Consolidated Financial Statements (Figures expressed in millions of Colombian pesos, unless otherwise stated) |
Occasional reserves
This corresponds to the appropriation of earnings ordered by the Stockholders’ meeting to carry out new explorations and future investments, as well as unrealized profits between group companies. On March 26, 2014,2015, the results forStockholders’ Meeting approved, after the appropriation of the occasional reserves of the 2014 period, were made available to the General Shareholders’ Meeting. It was decided thatcapitalization of occasional reserves for $14,760,895 through the legal reserve should not be increased, since it currently represents 50%mechanism of the subscribed capital.face value increase.
As of December 31, theTax and mandatory reserves included:
| 2014 | 2013 | |||||||
| Legal | 5,139,587 | 5,139,587 | ||||||
| Occasional reserves for investment programs | 12,802,794 | 9,945,733 | ||||||
| Reserve for investment appreciation (Decree 2336/95) | 20,989 | 215,406 | ||||||
| Total | 17,963,370 | 15,300,726 | ||||||
Incorporated institutional equity
CorrespondsThe Colombian tax regime contemplates the appropriation of the period’s profits equivalent to 70% when the value of the depreciation deduction for tax purposes exceeds the accounting depreciation. This reserve may be released to the productextent that the depreciations subsequently accounted exceed those annually claimed for tax purposes or the assets that generated the higher value deducted are sold.
In addition, Decree 2336 of commercial activity linked mainly1995 set out the obligation to establish a reserve for valuation of investments. The profits generated at the following partnership contracts: Nare, Matambo, Garcero, Corocora, Estero, Caracara, for the Sardinas 6, Remache Norte 3, Abejas 3, Jaguar T5 and T6 wells, Orocué, the Guarilaque 7 well, Campo Rico for the Candalay, Jordán 5, Remache Norte 2 and 5, Abejas 2 and Vigia wells, and the incorporationclosing of the Cocorná materials warehouse. Additionally, it contemplates the effectaccounting period as a consequence of the merger through absorption betweenCenitapplication of special valuation systems at market prices and Ecopetrol Pipelines International Limited.that have not been made on behalf of the Company, will be taken to a reserve.
The following shows the balance and a breakdown of the changes in retained earnings at December 31, 2016 and 2015:
| 2016 | 2015 | |||||||
| Opening balance | (6,814,432 | ) | 8,192,040 | |||||
| Profit (loss) attributable to owners of Ecopetrol’s shareholders | 2,447,881 | (7,193,859 | ) | |||||
| Appropriation of reserves | 117,819 | (2,344,095 | ) | |||||
| Legal reserve used to offset previous year loss (1) | 3,869,907 | |||||||
| Dividends declared (1) | - | (5,468,521 | ) | |||||
| Other movements | (23,637 | ) | 3 | |||||
| Closing balance | (402,462 | ) | (6,814,432 | ) | ||||
| (1) | The Company distributes dividends based on its separate financial statements prepared under Colombian IFRS. |
The Ordinary General Meeting of Shareholders held on March 31, 2016, approved the proposal for profit distribution, which established that there would be no distribution for the year 2015, given the net loss occurred in that year; in addition, the shareholders voted to use the legal reserve to offset this loss, as permitted by the Article 456 of the Colombian Code of Commerce. The amount of losses offset with the legal reserve once releases and tax and mandatory appropriations amounted to $ 3,869,907. Dividends paid in 2016 attributable to non-controlling shareholders of subsidiaries amounted to COP$1,022,121.
On the results of 2014 the General Stockholders Meeting approved the distribution of an ordinary dividend per share of COP$133. In June, 2015 the Company paid the minority stockholders COP$629,344 and COP$4,149,000 to majority stockholders. Dividends declared to the majority shareholder in 2015 payable at December 31, 2015 amounted to COP$690,177 and were fully paid during the first quarter of 2016. Dividends paid in 2015 attributable to non-controlling shareholders of subsidiaries amounted to COP$715,053.
| F-78 |
Ecopetrol S.A. Notes to Consolidated Financial Statements (Figures expressed in millions of Colombian pesos, unless otherwise stated) |
| 24.5 | Other comprehensive income attributable to owners of the Company |
The following is a breakdown of memorandum accounts asother comprehensive income, net of tax at December 31, 2016 and 2015:
| 2014 | 2013 | |||||||
| Debtors | ||||||||
| Exploitation rights - Decree 727 of 2007 (1) | 72,796,569 | 61,016,768 | ||||||
| Other contingent rights and debtor accounts (2) | 54,013,087 | 42,656,068 | ||||||
| Tax debtors | 31,749,770 | 34,836,502 | ||||||
| Autonomous pension trust (3) | 11,707,688 | 11,449,876 | ||||||
| Securities given in custody and guarantee | 1,347,968 | 1,447,325 | ||||||
| Implementation of investment projects | - | 21,953 | ||||||
| Legal proceedings | 832,961 | 782,209 | ||||||
| Total | 172,448,043 | 152,210,701 | ||||||
| Creditors | ||||||||
| Legal proceedings | 45,569,723 | 28,804,122 | ||||||
| Goods received in custody (4) | 30,045,734 | 20,455,350 | ||||||
| Contractual guarantees (5) | 25,344,883 | 17,434,639 | ||||||
| Tax creditors | 21,818,865 | 16,988,683 | ||||||
| Autonomous pension trust (6) | 12,649,604 | 12,254,234 | ||||||
| Project contracts | 2,633,141 | 3,267,904 | ||||||
| Mandate agreements (7) | 978,250 | 1,279,886 | ||||||
| Savings and petroleum stabilization fund | 1,012,940 | 1,033,557 | ||||||
| Future BOMT payments | 421,038 | 170,028 | ||||||
| Other contingent obligations | 9,445,835 | 9,680,448 | ||||||
| Potential obligations – pension liabilities (6) | - | 405,769 | ||||||
| Total | 149,920,013 | 111,774,620 | ||||||
Ecopetrol S.A. and Subsidiaries
Notes to the Consolidated Financial Statements
Years ended December 31, 2014, 2013 and 2012
(Expressed in millions of Colombian pesos)
| 2016 | 2015 | |||||||
| Actuarial gain on defined benefit plans | 994,953 | 2,148,395 | ||||||
| Gain (loss) on equity instruments measured at fair value (1) | 7,828 | (49,881 | ) | |||||
| Cash flow hedges for future exports | 244,131 | (217,291 | ) | |||||
| Hedge of a net investment in a foreign operation | (155,359 | ) | - | |||||
| Cash flow hedge with derivative instruments | (19,042 | ) | (43,590 | ) | ||||
| Others | 11,817 | 58,643 | ||||||
| Foreign currency translation | 8,138,382 | 8,949,728 | ||||||
| 9,222,710 | 10,846,004 | |||||||
| (1) |
| 2016 | 2015 | |||||||
| Profit (loss) attributable to Ecopetrol’s shareholders | 2,447,881 | (7,193,859 | ) | |||||
| Weighted average number of outstanding shares | 41,116,694,690 | 41,116,694,690 | ||||||
| Net basic earnings (loss) per share (basic and diluted -Colombian pesos) | 59.5 | (175.0 | ) | |||||
The following shows a breakdownThere is no potential dilution of autonomous pension trust funds:shares.
| 2014 | 2013 | |||||||
| Consorcio Ecopensiones 2011 | 3,063,193 | 3,007,450 | ||||||
| Porvenir S.A. | 2,588,139 | 2,525,046 | ||||||
| Consorcio Pensiones Ecopetrol 2011 | 1,779,768 | 2,058,602 | ||||||
| Unión Temporal Skandia-HSBC | 2,026,434 | 1,813,095 | ||||||
| Consorcio Bogotá-Colpatria-Occidente | 2,250,154 | 2,045,683 | ||||||
| 11,707,688 | 11,449,876 | |||||||
| F-79 |
Ecopetrol S.A. Notes to Consolidated Financial Statements (Figures expressed in millions of Colombian pesos, unless otherwise stated) |
On December 30, 2011, the financial closure took place for Ecopetrol to grant two contingency guarantees to Refinería de Cartagena S.A. - Reficar, as part of the financing granted by a group of export credit agencies and commercial banks, for the project to expand and modernize the Cartagena Refinery. The Project Finance financing structure has a maximum repayment period of 14 years, starting six months after the date of completion of the Project. For the purposes of financing the Project, Ecopetrol gave Reficar: i) a contingent commercial agreement for construction support for resources needed to complete the project – US$722 million equivalent to $1,727,356 (2013 – $2,788,123); and ii) a contingent guarantee to pay potential amounts that Reficar may need to service the debt for the immediately following year, that is, 2015 (US$378.6 million equivalent to $905,785 million (2013 – $479,781).
Ecopetrol S.A. and Subsidiaries
Notes to the Consolidated Financial Statements
Years ended December 31, 2014, 2013 and 2012
(Expressed in millions of Colombian pesos)
The actuarial calculation for 2014 and 2013 was carried out using a technical interest rate of 4%. The increase in salaries, pensions in cash and pensions in kind was calculated using the average inflation rate by theDepartamento Administrativo Nacional de Estadística(DANE – National Administrative Department of Statistics), for the three years immediately preceding the calculation year.
The balance of amortized actuarial liability is as follows:
| Concept | 2014 | 2013 | ||||||
| Actuarial calculation of the obligation for monthly pension payments and pension bonds | 12,649,604 | 12,660,003 | ||||||
| Less – Actuarial calculation pending amortization | - | (405,769 | ) | |||||
| Amortized actuarial liability | 12,649,604 | 12,254,234 | ||||||
As of December 31, 2014, 13,042 (2013 – 13,106) people were covered in the actuarial calculation and 14,556 (2013 – 13,885) were covered in pension bonds
The following is the detaila breakdown of revenuessales revenue for the years ended of December 31:31, 2016, 2015 and 2014:
| 2014 | 2013 | 2012 | 2016 | 2015 | 2014 | |||||||||||||||||||
| Domestic sales | ||||||||||||||||||||||||
| Domestic- distillates | 11,984,024 | 11,582,902 | 11,132,983 | |||||||||||||||||||||
| National sales | ||||||||||||||||||||||||
| Mid-distillates | 8,553,503 | 10,215,224 | 11,983,455 | |||||||||||||||||||||
| Gasoline | 6,396,282 | 5,968,084 | 5,697,178 | 6,092,739 | 6,128,208 | 6,394,422 | ||||||||||||||||||
| Services | 2,858,302 | 2,535,867 | 2,077,858 | 4,043,284 | 4,435,274 | 3,778,073 | ||||||||||||||||||
| Natural gas | 1,615,471 | 1,255,092 | 1,108,164 | 1,988,336 | 1,845,345 | 1,346,625 | ||||||||||||||||||
| Plastic and rubber | 724,708 | 724,392 | 667,563 | |||||||||||||||||||||
| L.P.G. and propane | 405,869 | 335,494 | 426,450 | |||||||||||||||||||||
| Crude | 553,666 | 491,279 | 1,213,718 | |||||||||||||||||||||
| Asphalts | 340,400 | 461,188 | 459,072 | |||||||||||||||||||||
| Other products | 2,047,362 | 1,738,288 | 2,100,780 | 994,645 | 988,346 | 1,001,321 | ||||||||||||||||||
| L.P.G. and propane | 426,920 | 375,358 | 492,440 | |||||||||||||||||||||
| Asphalts | 459,072 | 392,010 | 369,768 | |||||||||||||||||||||
| Crude | 442,171 | 1,421,620 | 572,969 | |||||||||||||||||||||
| 26,229,604 | 25,269,221 | 23,552,140 | 23,697,150 | 25,624,750 | 27,270,699 | |||||||||||||||||||
| Recognition of price differential (1) | 485,409 | 938,679 | 809,773 | 1,048,022 | 441,871 | 485,409 | ||||||||||||||||||
| 26,715,013 | 26,207,900 | 24,361,913 | 24,745,172 | 26,066,621 | 27,756,108 | |||||||||||||||||||
| Foreign sales | ||||||||||||||||||||||||
| Crude | 36,311,352 | 35,726,701 | 35,884,535 | 17,278,579 | 21,181,265 | 30,835,510 | ||||||||||||||||||
| Fuel oil | 3,921,703 | 4,463,237 | 4,283,814 | 2,158,539 | 2,166,469 | 3,921,703 | ||||||||||||||||||
| Natural gas | 423,461 | 586,687 | 563,412 | |||||||||||||||||||||
| Trading of crude | - | 1,309,196 | 1,486,060 | |||||||||||||||||||||
| Diesel | 1,594,945 | 81,982 | 179,738 | |||||||||||||||||||||
| Plastic and rubber | 1,171,342 | 1,096,730 | 975,282 | |||||||||||||||||||||
| Gasoline and turbo fuel | 127,091 | 789,071 | 1,182,367 | 1,046,758 | 93,125 | 127,090 | ||||||||||||||||||
| Propylene | - | 272 | - | |||||||||||||||||||||
| Plastic and Rubber | 975,862 | 857,397 | - | |||||||||||||||||||||
| Diesel | 179,738 | 1,195,704 | 1,223,159 | |||||||||||||||||||||
| Cash flow hedge for future exports – Reclassification to profit or loss (Note 31.2.1) | 33,074 | 7,646 | - | |||||||||||||||||||||
| Other products | 271,118 | 601,746 | 1,352,802 | 457,152 | 344,237 | 690,397 | ||||||||||||||||||
| 42,210,325 | 44,220,815 | 44,490,089 | 23,740,389 | 26,280,650 | 38,215,780 | |||||||||||||||||||
| Total revenues | 68,925,338 | 70,428,715 | 68,852,002 | |||||||||||||||||||||
| Total sales revenue | 48,485,561 | 52,347,271 | 65,971,888 | |||||||||||||||||||||
| (1) | Corresponds to the application of Decree 1880 of September 2014 and Resolution 180522 of 2010, which defined the procedure for price differentials (value generated by the difference between the parity price and the regulated price, which can be positive or negative). |
Ecopetrol S.A. and Subsidiaries
Notes to the Consolidated Financial Statements
Years ended December 31, 2014, 2013 and 2012
(Expressed in millions of Colombian pesos)
The cost ofSales by geographic areas
Operating sales revenue by geographic areas is comprised as follows for the years ended December 31, is comprised as follows:2016, 2015 and 2014:
| 2014 | 2013 | 2012 | ||||||||||
| Variable costs | ||||||||||||
| Imported products (1) | 13,242,615 | 11,862,265 | 9,447,041 | |||||||||
| Hydrocarbon purchases – ANH (2) | 6,705,881 | 7,808,844 | 8,646,762 | |||||||||
| Purchases of crude in association and concession | 5,470,951 | 5,805,854 | 7,207,707 | |||||||||
| Amortization and depletion | 3,827,215 | 3,202,007 | 3,000,758 | |||||||||
| Purchases of other products and gas | 979,772 | 598,035 | 618,715 | |||||||||
| Hydrocarbon transportation services | 973,171 | 1,610,287 | 1,106,649 | |||||||||
| Services contracted in associations | 612,013 | 603,011 | 512,138 | |||||||||
| Electric power | 411,731 | 308,927 | 306,942 | |||||||||
| Gas royalties in cash (3) | 388,147 | - | - | |||||||||
| Processing materials | 289,544 | 310,657 | 276,550 | |||||||||
| Volume adjustments and other allocations | 134,715 | (72,837 | ) | (296,434 | ) | |||||||
| Units of production depreciation | 93,699 | 94,760 | 105,805 | |||||||||
| 33,129,454 | 32,131,810 | 30,932,633 | ||||||||||
| Fixed costs: | ||||||||||||
| Maintenance | 2,639,336 | 2,240,543 | 1,921,008 | |||||||||
| Depreciation | 2,096,806 | 1,828,228 | 1,886,620 | |||||||||
| Services contracted in associations | 1,673,548 | 1,691,656 | 1,519,143 | |||||||||
| Contracted services | 1,582,635 | 1,356,452 | 1,127,284 | |||||||||
| Labor costs | 1,393,891 | 1,260,436 | 1,095,495 | |||||||||
| Hydrocarbon transportation services | 620,716 | 2,257 | - | |||||||||
| Taxes and contributions | 607,744 | 625,272 | 401,576 | |||||||||
| General costs | 522,084 | 450,922 | 402,672 | |||||||||
| Materials and operating supplies | 425,536 | 364,554 | 388,673 | |||||||||
| Non-capitalized project costs | 191,189 | 469,926 | 561,416 | |||||||||
| Amortization of the actuarial calculation for health and education | 40,895 | 104,499 | 127,086 | |||||||||
| Amortization of deferred charges, intangible assets and insurance policies | 130,182 | 27,727 | 171,902 | |||||||||
| 11,924,562 | 10,422,472 | 9,602,875 | ||||||||||
| 45,054,016 | 42,554,282 | 40,535,508 | ||||||||||
Operating expenses for the years ended December 31, are comprised as follows:
| 2014 | 2013 | 2012 | ||||||||||
| Administration | ||||||||||||
| Labor expenses | 491,201 | 412,586 | 321,643 | |||||||||
| General expenses | 322,088 | 221,666 | 172,735 | |||||||||
| Amortizations (1) | 277,559 | 344,868 | 313,344 | |||||||||
| Maintenance (2) | 208,364 | 6,794 | 5,756 | |||||||||
| Goodwill impairment | 182,631 | 353,012 | - | |||||||||
| Taxes | 119,803 | 63,827 | 4,932 | |||||||||
| Depreciations | 57,904 | 35,169 | 35,233 | |||||||||
| Rentals and leasing | 15,670 | 16,025 | 12,441 | |||||||||
| Amortization of the actuarial calculation for health and education | 2,022 | 1,770 | 8,896 | |||||||||
| Fees | 149 | - | - | |||||||||
| 1,677,391 | 1,455,717 | 874,980 | ||||||||||
| Operations and projects | ||||||||||||
| Exploration expenses (3) | 2,605,706 | 1,355,007 | 1,419,530 | |||||||||
| Projects expenses | - | - | 237,280 | |||||||||
| General expenses | 1,000,877 | 1,105,733 | 678,792 | |||||||||
| Taxes | 923,895 | 924,620 | 957,407 | |||||||||
| Provision and provision recover (4) | 287,770 | 650,660 | 318,629 | |||||||||
| Labor expenses | 268,092 | 231,454 | 277,430 | |||||||||
| Fuel loss | 209,742 | 100,857 | 83,039 | |||||||||
| Contributions and donations | 118,215 | 44,661 | 39,293 | |||||||||
| Audit fees | 101,223 | 95,062 | 55,786 | |||||||||
| Previous year | 60,027 | 50,160 | (124,167 | ) | ||||||||
| Transportation via gas pipelines | 13,996 | 17,287 | 136,573 | |||||||||
| Maintenance | 2,399 | 8,485 | 19,018 | |||||||||
| 5,591,942 | 4,583,986 | 4,098,610 | ||||||||||
| Total operating expenses | 7,269,333 | 6,039,703 | 4,973,590 | |||||||||
Ecopetrol S.A. and Subsidiaries
Notes to the Consolidated Financial Statements
Years ended December 31, 2014, 2013 and 2012
(Expressed in millions of Colombian pesos)
| Allowance (Recovery) | 2014 | 2013 | 2012 | |||||||||
| Oil investments (see note 11) | 258,408 | - | - | |||||||||
| Pension transfer | 137,557 | 833,248 | 23,087 | |||||||||
| Inventories | 29,512 | 13,449 | 2,493 | |||||||||
| Receivables | 3,082 | 28,964 | 86,961 | |||||||||
| Property, plant and equipment | 65,458 | 54,515 | 144,525 | |||||||||
| Litigations | (202,709 | ) | (194,299 | ) | 333,578 | |||||||
| Other | (3,538 | ) | (85,217 | ) | (272,015 | ) | ||||||
| Operating provisions, net | 287,770 | 650,660 | 318,629 | |||||||||
Net financial expenses for the years ended December 31, is comprised as follows:
| 2014 | 2013 | 2012 | ||||||||||
| Income: | ||||||||||||
| Foreign exchange gain | 9,069,249 | 3,219,704 | 4,087,029 | |||||||||
| Yields and interest | 467,073 | 461,303 | 383,795 | |||||||||
| Equity method profit | 173,603 | 120,060 | 125,474 | |||||||||
| Dividends in cash | 54,352 | 66,635 | 32,541 | |||||||||
| Investment portfolio valuation earnings | 22,540 | 59,608 | 178,076 | |||||||||
| Others | 3,585 | 8,328 | 5,647 | |||||||||
| Hedging transactions | 2,806 | 2,847 | 20,906 | |||||||||
| 9,793,208 | 3,938,485 | 4,833,468 | ||||||||||
| Expenses: | ||||||||||||
| Foreign exchange loss | 9,326,984 | 3,201,732 | 4,396,159 | |||||||||
| Interest | 817,546 | 592,643 | 581,597 | |||||||||
| Hedging transactions | 141,347 | 14,148 | 4,253 | |||||||||
| Equity method loss | 128,689 | - | 197 | |||||||||
| Administration and issuance of securities | - | - | 59 | |||||||||
| Other minor expenses | 50,132 | 84,310 | 19,092 | |||||||||
| 10,464,698 | 3,892,833 | 5,001,357 | ||||||||||
| Net | (671,490 | ) | 45,652 | (167,889 | ) | |||||||
Ecopetrol S.A. and Subsidiaries
Notes to the Consolidated Financial Statements
Years ended December 31, 2014, 2013 and 2012
(Expressed in millions of Colombian pesos)
Pension expenses for the years ended December 31, is comprised as follows:
| 2014 | 2013 | 2012 | ||||||||||
| Amortization of actuarial calculation and pensions | 265,668 | 196,747 | 688,693 | |||||||||
| Health care services | 234,127 | 226,643 | 204,269 | |||||||||
| Education services | 55,451 | 55,347 | 55,493 | |||||||||
| 555,246 | 478,737 | 948,455 | ||||||||||
Other income (expenses), net, for the years ended December 31, is comprised as follows:
| 2014 | 2013 | 2012 | ||||||||||
| Other income | ||||||||||||
| Deferred BOMT income | 140,372 | 130,690 | 125,542 | |||||||||
| Other minor income | 138,916 | 221,361 | 132,714 | |||||||||
| Recovery of expenses | 60,092 | 285,723 | 61,443 | |||||||||
| Earnings from the sale of materials and property, plant and equipment | 34,994 | 111,760 | 5,052 | |||||||||
| Compensation received | 24,673 | 14,326 | 19,512 | |||||||||
| Income from services | 5,159 | 20,792 | 18,551 | |||||||||
| Income prior years | 14 | - | - | |||||||||
| Recovery of exploration expenses | - | - | 23,722 | |||||||||
| Recovery of services to associates | - | - | 4,743 | |||||||||
| Assigned rights revenue | - | 73,494 | 725 | |||||||||
| 404,220 | 858,146 | 392,004 | ||||||||||
| Other expenses | ||||||||||||
| Loss on fixed assets write-off | 163,026 | 32,993 | 1,495 | |||||||||
| Gas pipeline availability under BOMT contracts | 102,916 | 102,819 | 108,134 | |||||||||
| Other minor expenses | 66,853 | 241,927 | 274,897 | |||||||||
| Provisions | 11,244 | - | - | |||||||||
| Taxes | 8,154 | - | - | |||||||||
| Expenses from prior years – net | 5,419 | - | - | |||||||||
| Contributions and donations | 1,114 | - | - | |||||||||
| 358,726 | 377,739 | 384,526 | ||||||||||
| 45,494 | 480,407 | 7,478 | ||||||||||
| 2016 | % | 2015 | % | 2014 | % | |||||||||||||||||||
| Colombia | 24,745,172 | 51.0 | % | 26,066,621 | 49.8 | % | 27,756,108 | 42.1 | % | |||||||||||||||
| United States of America | 11,956,967 | 24.7 | % | 11,921,720 | 22.8 | % | 14,977,109 | 22.7 | % | |||||||||||||||
| Asia | 2,717,414 | 5.6 | % | 6,123,593 | 11.7 | % | 13,416,506 | 20.3 | % | |||||||||||||||
| Europe | 2,945,951 | 6.1 | % | 3,981,926 | 7.6 | % | 5,915,190 | 9.0 | % | |||||||||||||||
| Central America and Caribbean | 3,551,894 | 7.3 | % | 3,366,978 | 6.4 | % | 3,049,688 | 4.6 | % | |||||||||||||||
| South America and others | 2,568,163 | 5.3 | % | 886,433 | 1.7 | % | 857,287 | 1.3 | % | |||||||||||||||
| Total | 48,485,561 | 100 | % | 52,347,271 | 100 | % | 65,971,888 | 100 | % | |||||||||||||||
| F-80 |
Ecopetrol S.A.
Notes to Consolidated Financial Statements
(Figures expressed in millions of Colombian pesos, unless otherwise stated)
Ecopetrol S.A. and Subsidiaries
Notes to the Consolidated Financial Statements
Years ended December 31, 2014, 2013 and 2012
(Expressed in millions of Colombian pesos)
The following is a summary of the most significant proceedings with claims above $10,000, for which allowances have been recognized, according to evaluations by the Company’s internal and external advisors, as of December 31, 2014 and 2013:
| Proceeding | Suit | 2014 | 2013 | |||||||
| Municipality of Arauca | Class action suit. Contributions to the solidarity and electric-power-generation income redistribution fund, pursuant to Law 142 of 1994. | 141,505 | 283,010 | |||||||
| Garcero partnership contract | Class action suit by Luis Enrique Olivera Petro against Ecopetrol, the Nation, the Ministry of Mines and others, on the extension of the Garcero partnership contract. | 77,592 | 155,184 | |||||||
| Compensation for damages for hydrocarbon easement | Proceeding for damages for easement in property preventing its use and exploitation. | 11,019 | - | |||||||
| Reassessment of salaries, social benefits and/or pension based at CCTV | Labor proceeding of 2007 for the reassessment of salaries and social benefits to 232 Ecopetrol contractors. Claimants Marcos Leonel Sánchez Jaimes and others. | 10,060 | - | |||||||
| Salary Impact – Saving Stimulus suit | Proceeding to reassess social, legal and extralegal benefit payments and monthly pension payments made under the saving stimulus heading. | 4,731 | 18,689 | |||||||
| Offshore Exploration and Production, LLC | International Court of Arbitration. In the framework of the purchase of Offshore International Group, the Seller (Offshore Exploration and Production, LLC) filed a claim against the Buyers (Ecopetrol and KNOC) in an international arbitration court, before the International Center of Dispute Resolution, seeking to establish the liability limits acquired and established in the Purchase Contract, with the aim of being able to reject claims and requests for compensation presented by Ecopetrol and KNOC to the Seller. Ecopetrol and KNOC filed a counterclaim. A favorable ruling in the proceedings was obtained in the second half of 2014. | - | 23,122 | |||||||
As of December 31, 2014, the balance of the allowance for legal proceedings amounts to $279,261 (2013 - $516,446).
Gas supply contracts
In addition to existing contracts, the Company has concluded new gas sale or supply contracts with third parties, such as Surtigas S.A. E.S.P., Gases del Caribe S.A. E.S.P., Zona Franca S.A. E.S.P., Gecelca S.A. E.S.P., and Gas Natural S.A. E.S.P.
Ship or Pay contracts
Ecopetrol S.A. and ODL Finance S.A. have signed a Ship or Pay contract under which it is established that the transporter owns a hydrocarbons transportation system called Oleoducto de los Llanos Orientales, under which the transporter commits to providing transportation and custody services for the sender’s crude oil through the pipeline: (i) from the Rubiales pump station to receipt points at Monterrey station and Cusiana station, (ii) under the ‘Ship or Pay’ and ‘Ship and Pay’ modalities, (iii) for the committed capacity equivalent to 221,000 Bpd at 18° API, until 2020. In exchange for the shipping service, the sender must pay a fixed monthly tariff, even if no barrels at all are shipped, corresponding to (i) a volume of 167,000 Bpd of diluted crude oil (GSV), starting on the effective date and until December 31, 2014, (ii) a volume of 149,000 Bpd of diluted crude oil (GSV), from January 1, 2015 until December 31, 2015, and (iii) a volume of 139,000 Bpd of diluted crude oil (GSV), from January 1, 2016 until December 31, 2020, which shall be billed and paid for by the sender under the Ship or Pay modality. In addition, in the event that the nomination exceeds capacity in the ‘Ship or Pay’ modality, the ‘Ship and Pay’ modality shall be applied, which consists of multiplying the number of barrels of diluted crude oil (GSV) nominated in excess, times the tariff, times the number of days in the calendar month being billed, considering that in this modality the number of barrels actually transported must be paid. The contract is effective until December 31, 2020, and renewable.
Bicentenario Ship or Pay contract for crude oil transportation
The contract concluded between Ecopetrol and Oleoducto Bicentenario aims to ensure the financial viability of the construction and maintenance of the Araguaney - Banadía route under a Ship or Pay modality in which the Company shall pay the tariff corresponding to the committed capacity based on its equity participation. During the term of the “Ship or Pay” contract; Ecopetrol pledges to pay Bicentenario a tariff for the committed capacity per number of days in the calendar month, regardless of whether the nominated amount is lower than the committed capacity.
Ecopetrol S.A. and Subsidiaries
Notes to the Consolidated Financial Statements
Years ended December 31, 2014, 2013 and 2012
(Expressed in millions of Colombian pesos)
According to Exhibit Nº 2 it was established that in the event that the tariff payment start date occurs before the service start date, Ecopetrol pledges to pay the amount calculated in the foregoing paragraph. Said payments shall be processed as follows: provided that Bicentenario can address payment obligations incurred in the construction, operation, maintenance, administration, among others, the amounts corresponding to the tariff paid by Ecopetrol between the tariff payment start date (July 1, 2013) and December 31, 2013 shall be considered payment advances charged to Ecopetrol in favors of Bicentenario. Amounts corresponding to the tariff paid by Ecopetrol starting January 1, 2014 shall be considered amounts actually paid under the Ship or Pay modality; therefore, they shall not be considered an advance and, as such, cannot be allocated or offset by any payment.
The contract shall be effective (i) for the term of the Ship or Pay contract, corresponding to the committed capacity and subject to availability and for the barrels actually transported corresponding to the conditional capacity, and ii) for the term of the Ship and Pay contract, up to Ecopetrol’s committed capacity, and subject to availability and the number of barrels actually transported corresponding to the conditional capacity.
Commitments of Ecopetrol Peru
The local financial statement details the list of bailment letters in force and effect as of this date. According to the Peruvian Organic Act of Hydrocarbons, Article 21 states that:
“In every contract, each period of the exploration phase must have a minimum mandatory work program. Each of these programs will be guaranteed with a bailment the amount of which will be agreed-to with the Contracting Party, which shall be joint and several, unconditional, irrevocable, or immediate realization in Peru, without the benefit of legal seizure and issued by a duly qualified entity of the Financial System, domiciled in the country.” By virtue of this Law, Ecopetrol Peru keeps in force and effect a series of bailment letters that guarantee the commitment of the company to comply with the minimum mandatory work programs in the various sub-stages of exploration of the different oil plots as per the following detail:
| Detail | Maturity | Bailment Letter | % | US | ||||||||||||||||
| Start Date | Number | Description | Beneficiary | Date | Value | Share | Dollars | |||||||||||||
| 24/08/2011 | cf N° oc 110586 52 9800185976 | License Contract Plot 101 | SCOTIABANK PERU SA | 25/01/2015 | 1,521,850 | 30 | % | 456,555 | ||||||||||||
| 28/12/2012 | cf N° oc 110586 52 9800243429 | License Contract Plot 158 | MINISTERIO DE ENERGIA Y MINAS | 25/12/2014 | 66,507 | 100 | % | 66,507 | ||||||||||||
| 28/12/2012 | cf N° oc 110586 55 9800243437 | License Contract Plot 134 | SCOTIABANK PERU SA | 25/12/2014 | 99,760 | 45 | % | 44,892 | ||||||||||||
| 02/10/2013 | cf N° oc 110586 52 9800271686 | License Contract Plot 109 | PERUPETRO SA | 26/03/2015 | 2,100,000 | 30 | % | 630,000 | ||||||||||||
| Total bailment letters | 1,197,954 | |||||||||||||||||||
Commitments of Hocol
On May 2013, Hocol S.A. and Surtigás S.A. E.S.P. signed a “Take or Pay” contract for gas production from Bonga and Mamey field. Hocol as the seller has signed a guarantee in the amount of US$32,700,000 in favor of Surtigás, in order to comply with the obligations under the contract. This guarantee must be in effect during the term of the contract or until the Energy and Gas Regulatory Commission "CREG" (from the Spanish Comisión Reguladora de Energía y Gas) approve all the investments required to expand the capacity of the transportation system of the Atlantic coast in the Mamey, San Mateo, Sincelejo and Cartagena trenches. The expiration date of guarantee is November 30, 2015 (third yearr) and according to the contract it should be renewed and updated thirty days before its expiration and have a term of one year. Hocol should recognize no liability associated with this transaction.
Additionally, the Company has bank collateral amounting to US$ 25,000,000 and twenty-five letters of credit amounting to US$ 46,977,337, which seek to guarantee the different commitments thatHocol has with the National Hydrocarbons Agency (ANH) in the exploration and production contracts. These collaterals have a validity term between 2015 and 2018.
Ecopetrol S.A. and Subsidiaries
Notes to the Consolidated Financial Statements
Years ended December 31, 2014, 2013 and 2012
(Expressed in millions of Colombian pesos)
The main subsequent events are listed below:
Fall in international oil and gas prices
The crude oil and natural gas market is characterized by its highly volatile prices. Although prices may fall significantly, in the long term they are determined by supply and demand. Significantly lower oil and gas prices could lead to future losses in assets and reserves if such a fall in prices indicates a long-term trend.
Financing
On February 12, 2015, Ecopetrol obtained a commercial loan for US$1,925 million. The transaction was carried out with the participation of eight international banks: JPMorgan Chase Bank, N.A.; BNP Paribas; Mizuho Bank Ltd.; Bank of America, N.A.; HSBC Bank USA, National Association; Banco Bilbao Vizcaya Argentaria S.A., Grand Cayman Branch; Banco Santander, S.A.; Citibank, N.A. The financing term is five years, with amortization at maturity and interest paid semi-annually at the Libor rate + 140 basis points.
Dry Wells
As disclosed in Note xiv. Ecopetrol charged to expense an amount of $126,427 of capitalized exploratory costs regarding the Bonga, adjustment Blocks 38 and 39, Agrio,Circe, Pasifea, Estracasu, Latino, Pinocho and Pastinaca 5, dry wells declared during first quarter 2015.
Inventories
Received the final reports of volume metric for quality by pipelines, whose main impact is related to higher deliveries of volumes of inventories by third parts, Ecopetrol should recognize more inventories for $15,224 and account payable.
Certain line items from the financial statements as of December 31, 2013 were reclassified in order to make the presentation of such financial statements comparable to that of the financial statements as of December 31, 2014, as disclosed in the related notes.
Some details of the tables’s contents may not cross directly with subtotals or totals with other information due to arithmetic rounding.
Ecopetrol S.A. and Subsidiaries
Notes to the Consolidated Financial Statements
Years ended December 31, 2014, 2013 and 2012
(Expressed in millionsConcentration of Colombian pesos)
The Company's consolidated financial statements are prepared in accordance with Colombian Government Entity GAAP (RCP). These principles and regulations differ in certain significant aspects from accounting principles generally accepted in the United States of America (U.S. GAAP), and therefore this note presents reconciliations of net income and shareholders’ equity determined under Colombian Government Entity GAAP to those same amounts as determined according to U.S. GAAP. Also presented in this note are those disclosures required under U.S. GAAP but not required under Colombian Government Entity GAAP.
A) Reconciliation of net income attributable to Ecopetrol:
The following table presents the reconciliation of consolidated net income under Colombian Government Entity GAAP to consolidated net income under U.S. GAAP attributable to Ecopetrol for the years ended December 31, 2014, 2013 and 2012:
| 2014 | 2013 | 2012 | ||||||||||||
| Consolidated net income under Colombian Government Entity GAAP | $ | 7,510,270 | $ | 13,106,503 | $ | 14,778,947 | ||||||||
| i. | Investment securities: | |||||||||||||
| a. Unrealized gain (loss) | (1,608 | ) | 75,458 | (45,199 | ) | |||||||||
| b. Impairment | (3,197 | ) | 65,921 | (34,657 | ) | |||||||||
| ii. | Investments in non-marketable securities: | |||||||||||||
| a. Equity method | 240,419 | 66,558 | (109,749 | ) | ||||||||||
| b. Variable interest entity (VIE) | - | 13 | - | |||||||||||
| c. Impairment | (294,931 | ) | (51,664 | ) | 9 | |||||||||
| iii. | Derivatives | 3,160 | (3 | ) | (4,709 | ) | ||||||||
| v. | Deferred charges | 521,356 | 476,091 | 493,159 | ||||||||||
| vi. | Employee benefit plans | (105,137 | ) | (40,439 | ) | (157,893 | ) | |||||||
| vii. | Provisions and contingencies | 273,446 | 802,341 | 141,755 | ||||||||||
| viii. | Assets and liabilities present value | (1,157 | ) | (39,029 | ) | (99,188 | ) | |||||||
| ix. | Deferred income taxes | 1,076,387 | (685,981 | ) | (392,593 | ) | ||||||||
| x. | Revenue recognition: | |||||||||||||
| a. Cost of sales – over and under deliveries | (29,522 | ) | 296,317 | 208,644 | ||||||||||
| b. Other income | (28,096 | ) | 28,242 | 6,100 | ||||||||||
| xi. | Inflation adjustment | 37,282 | 46,283 | 165,867 | ||||||||||
| xii. | Inventories | (9,124 | ) | 30,289 | (16,699 | ) | ||||||||
| xiii. | Lease accounting | (45,470 | ) | (50,101 | ) | (75,203 | ) | |||||||
| xiv. | Property, plant and equipment: | |||||||||||||
| a. Interest | (272,907 | ) | (480,513 | ) | (607,200 | ) | ||||||||
| b. Impairment | (159,300 | ) | (188,615 | ) | (43,609 | ) | ||||||||
| d. Capitalized expenses | (39,104 | ) | (53,987 | ) | 17,685 | |||||||||
| e. Exchange difference | (2,366,138 | ) | (17,953 | ) | 28,793 | |||||||||
| xv. | Depreciation, depletion and amortization | 82,035 | (33,177 | ) | 239,571 | |||||||||
| xvi. | Asset retirement obligations | (46,104 | ) | (41,964 | ) | (117,988 | ) | |||||||
| xvii. | Equity contributions: | |||||||||||||
| a. Incorporated institutional equity | 11,100 | 9,113 | 14,195 | |||||||||||
| b. Reversal of concession rights contributed as capital | 1,780 | 2,280 | 2,725 | |||||||||||
| xviii. | Indebtedness cost | 5,131 | 1,385 | (36 | ) | |||||||||
| xix. | Business combinations: | |||||||||||||
| a. Goodwill | 221,771 | 403,460 | 275,271 | |||||||||||
| xx. | Non-controlling interest | 91,868 | 147,177 | 227,514 | ||||||||||
| xxi. | Cumulative translation adjustment | 145,340 | 72,850 | (199,863 | ) | |||||||||
| Consolidated net income under U.S. GAAP attributable to Ecopetrol | $ | 6,819,550 | $ | 13,946,855 | $ | 14,695,649 | ||||||||
Ecopetrol S.A. and Subsidiaries
Notes to the Consolidated Financial Statements
Years ended December 31, 2014, 2013 and 2012
(Expressed in millions of Colombian pesos)
B) Reconciliation of shareholders’ equity attributable to Ecopetrol:
The following table presents the reconciliation of Ecopetrol shareholders’ equity under Colombian Government Entity GAAP to Ecopetrol shareholders’ equity under U.S. GAAP attributable to Ecopetrol for the years ended December 31, 2014 and 2013:
| 2014 | 2013 | |||||||||
| Consolidated shareholders’ equity under Colombian Government Entity GAAP | $ | 68,545,972 | $ | 71,119,203 | ||||||
| i. | Investment securities: | |||||||||
| a. Unrealized gain | 1,325,299 | 1,248,863 | ||||||||
| ii. | Investments in non-marketable securities: | |||||||||
| a. Equity method | (1,669,644 | ) | (1,639,221 | ) | ||||||
| b. Variable interest entity (VIE) | 320,600 | 320,600 | ||||||||
| c. Valuation surplus | (1,359,646 | ) | (1,282,966 | ) | ||||||
| d. Impairment | (399,630 | ) | (104,699 | ) | ||||||
| iii. | Derivatives | 1,843 | (2 | ) | ||||||
| iv. | Exchange of non-monetary assets | 1,135,175 | 1,135,175 | |||||||
| v. | Deferred charges | (78,681 | ) | (597,966 | ) | |||||
| vi. | Employee benefit plans | (829,763 | ) | (2,177,494 | ) | |||||
| vii. | Provisions and contingencies | 1,568,010 | 1,294,564 | |||||||
| viii. | Assets and liabilities present value | (40,894 | ) | (39,737 | ) | |||||
| ix. | Deferred income taxes | (3,117,604 | ) | (3,722,236 | ) | |||||
| x. | Revenue recognition: | |||||||||
| a. Over and under deliveries - cost of sales | 88,830 | 117,650 | ||||||||
| b. Other income | (1,113 | ) | 27,112 | |||||||
| xi. | Inflation adjustment | (2,982,062 | ) | (3,022,227 | ) | |||||
| xii. | Inventories | (12,410 | ) | (18,410 | ) | |||||
| xiii. | Lease accounting | 146,811 | 190,612 | |||||||
| xiv. | Property, plant and equipment: | |||||||||
| a. Interest | (1,708,135 | ) | (1,403,746 | ) | ||||||
| b. Impairment | (1,209,286 | ) | (1,046,498 | ) | ||||||
| c. Revaluation of property, plant and equipment and public accounting effect | (24,824,704 | ) | (25,678,134 | ) | ||||||
| d. Capitalized expenses | (655,370 | ) | (616,023 | ) | ||||||
| e. Exchange difference | (5,118,707 | ) | (180,764 | ) | ||||||
| xv. | Depreciation, depletion and amortization | 5,334,250 | 5,357,117 | |||||||
| xvi. | Asset retirement obligations | 45,427 | 93,320 | |||||||
| xvii. | Equity contributions: | |||||||||
| a. Incorporated institutional equity | (19,195 | ) | (28,613 | ) | ||||||
| b. Reversal of concession rights contributed as capital | (12,953 | ) | (14,733 | ) | ||||||
| xviii. | Indebtedness cost | 12,959 | 7,828 | |||||||
| xix. | Business combinations: | |||||||||
| a. Goodwill | 1,283,577 | 1,061,806 | ||||||||
| b. Fair value adjustments to assets and liabilities acquired | (1,405,659 | ) | (1,405,659 | ) | ||||||
| xx. | Non-controlling interest | 2,564,628 | 2,775,478 | |||||||
| xxi. | Cumulative translation adjustment | 5,144,985 | 105,025 | |||||||
| Consolidated Ecopetrol shareholders’ equity under U.S. GAAP | $ | 42,072,910 | $ | 41,875,225 | ||||||
Ecopetrol S.A. and Subsidiaries
Notes to the Consolidated Financial Statements
Years ended December 31, 2014, 2013 and 2012
(Expressed in millions of Colombian pesos)
C) Supplemental condensed consolidated financial statements under U.S. GAAP
1. Supplemental condensed consolidated balance sheets of the Company as of December 31, 2014 and 2013 in conformity with under U.S. GAAP are presented below:
| 2014 | 2013 | |||||||
| Assets | ||||||||
| Current assets: | ||||||||
| Cash and cash equivalents | $ | 7,982,225 | $ | 8,750,039 | ||||
| Investments | ||||||||
| Available for sale | 2,206,791 | 743,987 | ||||||
| Held to maturity | 4,713 | 99,007 | ||||||
| Trading securities | - | 569,119 | ||||||
| Accounts and notes receivable, net | 6,240,505 | 8,139,457 | ||||||
| Inventories | 2,717,753 | 3,209,523 | ||||||
| Prepaid expenses and other assets | 501,932 | 593,550 | ||||||
| Deferred income taxes | 970,592 | 683,140 | ||||||
| Restricted assets | 102,374 | 123,031 | ||||||
| Total current assets | $ | 20,726,885 | $ | 22,910,853 | ||||
| Long term assets | ||||||||
| Investments | ||||||||
| Available for sale | 295,244 | 1,748,497 | ||||||
| Equity method | 1,033,371 | 1,119,981 | ||||||
| Accounts and notes receivable, net | 878,505 | 541,019 | ||||||
| Restricted assets | 745,781 | 605,915 | ||||||
| Property, plant and equipment, net | 47,329,687 | 36,558,890 | ||||||
| Natural and environmental resources, net | 27,878,388 | 25,181,018 | ||||||
| Goodwill | 1,356,331 | 1,095,047 | ||||||
| Deferred charges and other assets | 903,670 | 1,018,400 | ||||||
| Deferred income taxes | 695,350 | 405,840 | ||||||
| Capital lease | 467,603 | 502,456 | ||||||
| Total assets | $ | 102,310,815 | $ | 91,687,916 | ||||
| Liabilities and shareholders’ equity | ||||||||
| Current liabilities: | ||||||||
| Financial obligations | $ | 1,801,885 | $ | 759,703 | ||||
| Accounts payable and related parties | 9,047,494 | 8,653,917 | ||||||
| Taxes payable | 2,063,632 | 2,975,099 | ||||||
| Dividends Payable | 3,704 | 1,313,596 | ||||||
| Labor and pension plan obligations | 369,206 | 289,629 | ||||||
| Estimated liabilities and provisions | 1,495,142 | 2,047,490 | ||||||
| Capital lease liability | 115,956 | 126,695 | ||||||
| Other short-term liabilities | - | 25,170 | ||||||
| Total current liabilities | $ | 14,897,019 | $ | 16,191,299 | ||||
| Financial obligations, long-term | 33,280,826 | 21,192,120 | ||||||
| Accounts payable, long-term | 201,311 | 56,230 | ||||||
| Capital lease liability | 771,866 | 772,273 | ||||||
| Pension plan obligation and other labor obligations, long-term | 5,408,780 | 6,459,947 | ||||||
| Estimated liabilities and provisions | 2,713,354 | 2,020,030 | ||||||
| Other long-term liabilities | 316,381 | 305,460 | ||||||
| Total long term liabilities | 42,692,518 | 30,806,060 | ||||||
| Total liabilities | 57,589,537 | 46,997,359 | ||||||
| Shareholders’ equity of Ecopetrol | 42,072,910 | 41,875,226 | ||||||
| Non-controlling interest | 2,648,368 | 2,815,331 | ||||||
| Total equity | $ | 44,721,278 | $ | 44,690,557 | ||||
| Total liabilities and shareholders’ equity | $ | 102,310,815 | $ | 91,687,916 | ||||
Ecopetrol S.A. and Subsidiaries
Notes to the Consolidated Financial Statements
Years ended December 31, 2014, 2013 and 2012
(Expressed in millions of Colombian pesos)
2. Supplemental consolidated statements of income
The consolidated statements of income of the Company for the years ended December 31, 2014, 2013 and 2012 in conformity with under U.S. GAAP are presented below:
| 2014 | 2013 | 2012 | ||||||||||
| Revenue: | ||||||||||||
| Local sales | $ | 26,758,252 | $ | 26,425,495 | $ | 24,918,476 | ||||||
| Foreign sales | 39,359,248 | 42,007,150 | 41,948,661 | |||||||||
| Total revenue | 66,117,500 | 68,432,645 | 66,867,137 | |||||||||
| Cost of sales | 42,173,581 | 40,173,040 | 38,353,685 | |||||||||
| Gross income | 23,943,919 | 28,259,605 | 28,513,452 | |||||||||
| Operating expenses: | ||||||||||||
| Administration | 2,092,609 | 1,457,994 | 2,057,796 | |||||||||
| Selling and projects | 5,389,512 | 3,481,675 | 2,898,693 | |||||||||
| Operating income | 16,461,798 | 23,319,936 | 23,556,963 | |||||||||
| Non-operating income, net | (2,900,026 | ) | (58,573 | ) | (1,143,481 | ) | ||||||
| Income before income tax | 13,561,772 | 23,261,363 | 22,413,482 | |||||||||
| Income tax: | ||||||||||||
| Current income tax | 6,731,655 | 8,291,571 | 7,095,874 | |||||||||
| Deferred income tax | (672,974 | ) | 483,248 | 430,114 | ||||||||
| 6,058,681 | 8,774,819 | 7,525,988 | ||||||||||
| Net income | 7,503,091 | 14,486,544 | 14,887,494 | |||||||||
| Less: Net income attributable to non-controlling interest | (683,541 | ) | (539,689 | ) | (191,845 | ) | ||||||
| Net Income attributable to Ecopetrol | $ | 6,819,550 | $ | 13,946,855 | $ | 14,695,649 | ||||||
| Earnings per share (Basic) attributable to Ecopetrol common shareholders | $ | 165.86 | $ | 339.20 | $ | 357.41 | ||||||
| Weighted-average shares outstanding (Basic) | 41,116,698,456 | 41,116,698,456 | 41,116,698,456 | |||||||||
Ecopetrol S.A. and Subsidiaries
Notes to the Consolidated Financial Statements
Years ended December 31, 2014, 2013 and 2012
(Expressed in millions of Colombian pesos)
3. Supplemental consolidated comprehensive income
| 2014 | 2013 | 2012 | ||||||||||
| Net income | $ | 7,503,091 | $ | 14,486,544 | $ | 14,887,494 | ||||||
| Other comprehensive income, net of tax: | ||||||||||||
| Unrealized gain (loss) on investment securities, net of tax: | 80,127 | 44,293 | 18,088 | |||||||||
| Unrealized actuarial gain (loss), net of tax | 958,893 | 731,709 | (57,500 | ) | ||||||||
| Translation gain (loss) adjustment | 3,250,928 | 1,556,233 | (943,192 | ) | ||||||||
| Total other comprehensive income | 4,289,948 | 2,332,236 | (982,604 | ) | ||||||||
| Comprehensive income | 11,793,039 | 16,929,458 | 13,904,890 | |||||||||
| Comprehensive income attributable to the non-controlling interest | (905,085 | ) | (627,438 | ) | (141,999 | ) | ||||||
| Comprehensive income attributable to Ecopetrol | $ | 10,887,954 | 16,191,692 | $ | 13,762,891 | |||||||
A reconciliation of accumulated other comprehensive income attributable to Ecopetrol, including the related income tax effects, is presented below:
| 2014 | ||||||||||||
| Before-Income Tax Amount | Income Tax (Expense) Benefit | Net of Income Tax Amount | ||||||||||
| Unrealized gain on securities available for sale | $ | 1,320,531 | $ | 468 | $ | 1,320,999 | ||||||
| Pension liability – net unamortized actuarial gain (loss) | (1,658,862 | ) | 532,894 | (1,125,968 | ) | |||||||
| Cumulative translation adjustment | 3,022,171 | - | 2,759,348 | |||||||||
| Other comprehensive income (loss) | $ | 2,683,840 | $ | 533,362 | $ | 2,954,379 | ||||||
| 2013 | ||||||||||||
| Before-Income Tax Amount | Income Tax (Expense) Benefit | Net of Income Tax Amount | ||||||||||
| Unrealized gain on securities available for sale | $ | 1,239,347 | $ | 1,457 | $ | 1,240,804 | ||||||
| Pension liability – net unamortized actuarial gain (loss) | (3,111,731 | ) | 1,026,871 | (2,084,860 | ) | |||||||
| Cumulative translation adjustment | (7,144 | ) | - | (7,495 | ) | |||||||
| Other comprehensive income (loss) | $ | (1,879,528 | ) | $ | 1,028,326 | $ | (851,552 | ) | ||||
| 2012 | ||||||||||||
| Before-Income Tax Amount | Income Tax (Expense) Benefit | Net of Income Tax Amount | ||||||||||
| Unrealized gain (loss) on securities available for sale | $ | 1,242,990 | $ | (46,437 | ) | $ | 1,196,553 | |||||
| Pension liability – net unamortized actuarial gain (loss) | (4,203,835 | ) | 1,387,265 | (2,816,570 | ) | |||||||
| Cumulative translation adjustment | (1,476,022 | ) | - | (1,476,022 | ) | |||||||
| Other comprehensive income (loss) | $ | (4,436,867 | ) | $ | 1,340,828 | $ | (3,096,039 | ) | ||||
The following table axplain the reclasifications out of Accumulated Other Comprehensive Income for the period ended december 31, 2014, 2013 and 2012
| Unrealized Gains and Losses on available-for-sale Securities | ||||||||||||
| 2014 | 2013 | 2012 | ||||||||||
| Beginning Balance | $ | 1,240,803 | $ | 1,196,553 | $ | 1,178,586 | ||||||
| Other Comprehensive income before reclasifications | 78,807 | 180,951 | 49,918 | |||||||||
| Amounts reclassified from accumulated other comprehensive income (a) | 1,389 | (136,701 | ) | (31,951 | ) | |||||||
| Net current-period other comprehensive income | 80,196 | 44,250 | 17,967 | |||||||||
| Ending Balance | $ | 1,320,999 | $ | 1,240,803 | $ | 1,196,553 | ||||||
(a) Affected Line item in the statement Where Net Income Is Presented: Realized gain/ (loss) on sale of securities
Ecopetrol S.A. and Subsidiaries
Notes to the Consolidated Financial Statements
Years ended December 31, 2014, 2013 and 2012
(Expressed in millions of Colombian pesos)
4. Supplemental condensed consolidated statements of cash flows
The statements of cash flows of the Company for the years ended December 31, 2014, 2013 and 2012 under U.S. GAAP are presented below:
| 2014 | 2013 | 2012 | ||||||||||
| Cash flows provided by operating activities: | ||||||||||||
| Net income | $ | 6,819,550 | $ | 13,946,855 | $ | 14,695,649 | ||||||
| Adjustments to reconcile net income to cash provided by operating activities: | ||||||||||||
| Non-controlling interest | 683,540 | 539,689 | 191,845 | |||||||||
| Equity method in non-marketable securities | (204,657 | ) | (185,514 | ) | (15,528 | ) | ||||||
| Depreciation, depletion and amortization | 5,500,002 | 4,849,461 | 4,977,009 | |||||||||
| Accretion Expense | 202,013 | 177,545 | 148,593 | |||||||||
| Capitalized exploratory well costs charged to expense | 854,265 | 939,419 | 278,254 | |||||||||
| Impairment | 787,905 | 377,792 | 276,147 | |||||||||
| Provisions | 58,507 | (219,692 | ) | 431,293 | ||||||||
| Deferred income tax | (672,974 | ) | 483,248 | 428,559 | ||||||||
| Exchange gain (loss) | 2,379,089 | (84,783 | ) | 267,125 | ||||||||
| Loss on retirement of property, plant and equipment | 467,919 | 19,678 | 64,385 | |||||||||
| Losses in retirement of natural and environmental resources | 734 | 19,438 | 358,599 | |||||||||
| Net changes in operating assets and liabilities: | ||||||||||||
| Accounts and notes receivable | 1,193,872 | (3,922,852 | ) | (1,099,884 | ) | |||||||
| Inventories | 531,820 | (472,975 | ) | (423,073 | ) | |||||||
| Deferred charges and other assets | 432,357 | (231,681 | ) | (1,060,411 | ) | |||||||
| Accounts payable and related parties | (289,620 | ) | 1,186,615 | 2,668,864 | ||||||||
| Taxes payable | (918,056 | ) | (785,356 | ) | (2,890,533 | ) | ||||||
| Labor obligations | 149,675 | 165,724 | 888,708 | |||||||||
| Estimated liabilities and provisions | (936,036 | ) | (41,752 | ) | (58,268 | ) | ||||||
| Net cash provided by operating activities | 17,039,905 | 16,760,859 | 20,127,333 | |||||||||
| Cash flows from investing activities: | ||||||||||||
| Dividends received | 80,147 | 73,501 | 32,541 | |||||||||
| Purchase of investment securities | (5,453,019 | ) | (7,656,234 | ) | (15,281,566 | ) | ||||||
| Redemption of investment securities | 7,106,488 | 11,933,853 | 14,458,913 | |||||||||
| Proceeds from sales of property, plant and equipment | 80,114 | 103,753 | - | |||||||||
| Investment in natural and environmental resources | (8,075,147 | ) | (6,278,439 | ) | (5,872,995 | ) | ||||||
| Additions to property, plant and equipment | (7,295,534 | ) | (7,226,860 | ) | (9,350,074 | ) | ||||||
| Net cash used in investing activities | (13,556,951 | ) | (9,050,426 | ) | (16,013,181 | ) | ||||||
| Cash flows from financing activities: | ||||||||||||
| Payment of financial obligations | (1,461,438 | ) | (3,207,566 | ) | (1,203,309 | ) | ||||||
| Proceeds from financial obligations | 8,658,650 | 10,727,037 | 5,995,738 | |||||||||
| Proceeds from issuance of shares | 41 | 82 | 171,582 | |||||||||
| Cash paid to acquire a non-controlling interest | - | - | (1,917 | ) | ||||||||
| Dividends paid | (12,558,250 | ) | (14,570,466 | ) | (8,419,331 | ) | ||||||
| Net cash used in financing activities | (5,360,997 | ) | (7,050,913 | ) | (3,457,237 | ) | ||||||
| Effect of exchange rate changes on cash | 1,110,229 | 118,184 | 241,870 | |||||||||
| Net increase (decrease) in cash and cash equivalents | (1,878,043 | ) | 659,520 | 656,915 | ||||||||
| Cash and cash equivalents at beginning of year | 8,750,039 | 7,972,335 | 7,073,550 | |||||||||
| Cash and cash equivalents at end of year | $ | 7,982,225 | $ | 8,750,039 | $ | 7,972,335 | ||||||
Ecopetrol S.A. and Subsidiaries
Notes to the Consolidated Financial Statements
Years ended December 31, 2014, 2013 and 2012
(Expressed in millions of Colombian pesos)
| 2014 | 2013 | 2012 | ||||||||||
| Supplemental cash flows information | ||||||||||||
| Cash paid during the year | ||||||||||||
| Interest | $ | 1,113,264 | $ | 581,541 | $ | 732,335 | ||||||
| Income taxes | $ | 5,168,043 | $ | 7,289,682 | $ | 8,320,779 | ||||||
| Non-cash transactions | ||||||||||||
| Assets acquired through capital lease contracts | $ | 3,658 | $ | 8,460 | $ | 260,648 | ||||||
| Increase of natural and environmental resources through asset retirement obligations | $ | 666,912 | $ | 417,238 | $ | (156,871 | ) | |||||
Under Colombian Government Entity GAAP as in effect from 2007, some deposits with banks were considered as short-term investments since they produced yields and the Company has defined them to be used for specific purposes. Under U.S. GAAP, these deposits are considered cash and are valued at fair value. The amounts reclassified as of December 31, 2014 was $719, as of December 31, 2013 was $119.
Ecopetrol S.A. and Subsidiaries
Notes to the Consolidated Financial Statements
Years ended December 31, 2014, 2013 and 2012
(Expressed in millions of Colombian pesos)
5. Supplemental consolidated statements of shareholders’ equity.
The statements of shareholders’ equity of the Company for the years ended December 31, 2014, 2013 and 2012 under U.S. GAAP as follows:
| Common Stock | ||||||||||||||||||||||||||||||||||||
| Millions of shares | Value | Additional paid- in-capital | Comprehensive Income | Retained earnings | Accumulated Other Comprehensive income (loss) | Ecopetrol’s Equity | Non- Controlling Interest | Total Equity | ||||||||||||||||||||||||||||
| Balance at December 31, 2011 | 41,117 | $ | 10,279,175 | $ | 5,215,300 | $ | 22,723,983 | $ | (2,163,281 | ) | $ | 36,055,173 | $ | 2,288,119 | $ | 38,343,292 | ||||||||||||||||||||
| Acquired non-controlling interest | - | - | - | - | (689 | ) | - | (689 | ) | (1,125 | ) | (1,814 | ) | |||||||||||||||||||||||
| Other non-controlling interest | - | - | - | - | (103 | ) | - | (103 | ) | - | (103 | ) | ||||||||||||||||||||||||
| Spin-off | (37 | ) | (37 | ) | ||||||||||||||||||||||||||||||||
| Issuance of Company shares | - | - | 166,090 | - | - | - | 166,090 | 5,492 | 171,582 | |||||||||||||||||||||||||||
| Distribution of dividends ($300 per share) | - | - | - | - | (12,335,009 | ) | - | (12,335,009 | ) | - | (12,335,009 | ) | ||||||||||||||||||||||||
| Comprehensive income: | ||||||||||||||||||||||||||||||||||||
| Net income | - | - | - | $ | 14,887,494 | 14,695,648 | - | 14,695,648 | 191,845 | 14,887,493 | ||||||||||||||||||||||||||
| Other comprehensive income, net of tax: | ||||||||||||||||||||||||||||||||||||
| Unrealized earnings on investment securities, net of tax effect of $(27,734) | - | - | - | 18,088 | - | - | 17,967 | 121 | 18,088 | |||||||||||||||||||||||||||
| Actuarial (loss), net of tax effect of $27,522 | - | - | - | (57,500 | ) | - | - | (57,500 | ) | - | (57,500 | ) | ||||||||||||||||||||||||
| Translation adjustment | - | - | - | (943,192 | ) | - | - | (893,225 | ) | (49,967 | ) | (943,192 | ) | |||||||||||||||||||||||
| Total other comprehensive income | - | - | - | $ | (982,604 | ) | - | (932,758 | ) | - | - | - | ||||||||||||||||||||||||
| Comprehensive income | - | - | - | $ | 13,904,890 | - | - | - | - | - | ||||||||||||||||||||||||||
| Balance at December 31, 2012 | 41,117 | $ | 10,279,175 | $ | 5,381,390 | - | $ | 25,083,830 | $ | (3,096,039 | ) | $ | 37,648,352 | $ | 2,434,448 | $ | 40,082,800 | |||||||||||||||||||
| Other non-controlling interest | - | - | - | - | 14 | 14 | 14 | |||||||||||||||||||||||||||||
| Issuance of Company shares | - | - | 127 | - | - | 127 | 9,164 | 9,291 | ||||||||||||||||||||||||||||
| Distribution of dividends ($291 per share) | - | - | - | - | (11,964,960 | ) | (11,964,960 | ) | (255,719 | ) | (12,220,679 | ) | ||||||||||||||||||||||||
| Comprehensive income: | ||||||||||||||||||||||||||||||||||||
| Net income | - | - | - | $ | 14,486,544 | 13,946,855 | - | 13,946,855 | 539,689 | 14,486,544 | ||||||||||||||||||||||||||
| Other comprehensive income, net of tax: | ||||||||||||||||||||||||||||||||||||
| Unrealized earnings on investment securities, net of tax effect of $47,894 | - | - | - | 44,293 | - | - | 44,250 | 43 | 44,293 | |||||||||||||||||||||||||||
| Actuarial (loss), net of tax effect of $(360,396) | - | - | - | 731,709 | - | - | 731,709 | - | 731,709 | |||||||||||||||||||||||||||
| Translation adjustment | - | - | - | 1,556,584 | - | - | 1,468,878 | 87,706 | 1,556,584 | |||||||||||||||||||||||||||
| Total other comprehensive income | - | - | - | $ | 2,332,586 | - | 2,244,837 | - | - | - | ||||||||||||||||||||||||||
| Comprehensive income | - | - | - | $ | 16,819,130 | - | - | - | - | - | ||||||||||||||||||||||||||
| Balance at December 31, 2013 | 41,117 | $ | 10,279,175 | $ | 5,381,517 | $ | 27,065,740 | $ | (851,202 | ) | $ | 41,875,226 | $ | 2,815,331 | $ | 44,690,558 | ||||||||||||||||||||
| Other non-controlling interest | - | - | - | - | - | - | (48 | ) | (48 | ) | ||||||||||||||||||||||||||
| Issuance of Company shares | - | - | 72 | - | - | 72 | 3,578 | 3,650 | ||||||||||||||||||||||||||||
| Distribution of dividends ($260 per share) | - | - | - | - | (10,690,342 | ) | (10,690,342 | ) | (1,075,159 | ) | (11,765,501 | ) | ||||||||||||||||||||||||
| Return of capital due to a spin-off | - | - | - | - | - | - | (420 | ) | (420 | ) | ||||||||||||||||||||||||||
| Comprehensive income: | ||||||||||||||||||||||||||||||||||||
| Net income | - | - | - | $ | 7,503,091 | 6,819,550 | - | 6,819,550 | 683,541 | 7,503,091 | ||||||||||||||||||||||||||
| Other comprehensive income, net of tax: | ||||||||||||||||||||||||||||||||||||
| Unrealized earnings on investment securities, net of tax effect of $(989) | - | - | - | 80,127 | - | - | 80,196 | (69 | ) | 80,127 | ||||||||||||||||||||||||||
| Actuarial (loss), net of tax effect of $ (493,975) | - | - | - | 958,893 | - | - | 958,893 | - | 958,893 | |||||||||||||||||||||||||||
| Translation adjustment | - | - | - | 3,250,928 | - | - | 3,029,315 | 221,614 | 3,250,929 | |||||||||||||||||||||||||||
| Total other comprehensive income | - | - | - | $ | 4,289,948 | - | 4,068,404 | - | - | - | ||||||||||||||||||||||||||
| Comprehensive income | - | - | - | $ | 11,793,039 | - | - | - | - | - | ||||||||||||||||||||||||||
| Balance at December 31, 2014 | 41,117 | $ | 10,279,175 | $ | 5,381,589 | $ | 23,194,948 | $ | 3,217,202 | $ | 42,072,910 | $ | 2,648,368 | $ | 44,721,278 | |||||||||||||||||||||
Ecopetrol S.A. and Subsidiaries
Notes to the Consolidated Financial Statements
Years ended December 31, 2014, 2013 and 2012
(Expressed in millions of Colombian pesos)
D) Summary of significant differences between Colombian Government Entity GAAP and U.S. GAAP and required U.S. GAAP disclosures
The Company’s investments include both marketable and non-marketable securities. Under Colombian Government Entity GAAP, the Company classifies investment securities based on the form of their investment return, either as fixed-yield investment or as variable-yield investments. Fixed-yield investments generally represent debt securities and are initially recorded at cost with subsequent adjustments to fair value recorded in the income statement. Variable-yield investments generally represent equity securities or interests in other entities and are initially recorded at cost. Subsequent adjustments to fair value are made with increases in fair value resulting in an increase to equity, while decreases in fair value are charged to the income statement. Fair values are determined using quoted market prices, if and when available. In the absence of quoted market prices, these investments are recorded at Management’s estimate of fair value using discounted cash flow techniques.
Under U.S. GAAP, the Company has classified its investment securities as held to maturity or available for sale, as defined in ASC 320-10-25, Accounting for Certain Investments in Debt and Equity Securities. Debt security investments for which the Company has demonstrated its ability and intent to hold until maturity are classified as held-to-maturity. Such investments are reported at amortized cost. Investments classified as available-for-sale are reported at fair value, with unrealized gains and losses reported, net of taxes, as a component of other comprehensive income. Investment held for trading securities are recorded at fair value with unrealized holding gains and losses included in net income.
In the event that any other than temporary impairment of the investments value occurs, the impairment loss is recorded in net income.
The Company’s short-term and long-term investments at December 31, 2014, 2013, and 2012 consist of the following:
| As of December 31, 2014 | Aggregated Fair Value | Gross Unrealized Holding Gains | Gross Unrealized Holding Losses | Gross Recognized Losses | Cost Basis | |||||||||||||||
| Short-term investments – available for sale securities: | ||||||||||||||||||||
| Securities issued or secured by Colombian government | $ | 140,338 | $ | 192 | $ | - | $ | - | $ | 104,146 | ||||||||||
| Securities issued or secured by the U.S. government | 6,939 | 2 | - | - | 6,936 | |||||||||||||||
| Securities issued or secured by financial entities | 453,905 | 55 | - | - | 453,905 | |||||||||||||||
| Other debt securities | 24,216 | 12 | - | - | 24,201 | |||||||||||||||
| Securities issued by mixed – economy governmental entities | 1,581,393 | 1,320,395 | 260,998 | |||||||||||||||||
| Total short-term investments classified as available for sale | $ | 2,206,791 | $ | 1,320,656 | $ | (1 | ) | $ | - | $ | 886,136 | |||||||||
| Long-term investments – available for sale securities: | ||||||||||||||||||||
| Securities issued or secured by Colombian government | 43,025 | - | (455 | ) | - | 43,480 | ||||||||||||||
| Securities issued or secured by government sponsored enterprise (GSEs) | 124,620 | 6 | (134 | ) | - | 124,749 | ||||||||||||||
| Securities issued or secured by financial entities | 2,324 | - | (2 | ) | - | 2,326 | ||||||||||||||
| Securities issued or secured by the U.S. government | 116,083 | 28 | (46 | ) | - | 116,102 | ||||||||||||||
| Other debt securities | 9,192 | - | (4 | ) | - | 9,195 | ||||||||||||||
| Securities issued by mixed- economy governmental entities | - | 5 | (4 | ) | - | �� | (2 | ) | ||||||||||||
| Total long-term investments classified as available for sale | $ | 295,244 | $ | 39 | $ | (646 | ) | $ | - | $ | 295,851 | |||||||||
| Total available for sale | $ | 2,502,035 | $ | 1,320,695 | $ | (646 | ) | $ | - | $ | 1,181,987 | |||||||||
| Aggregated Fair Value | Gross Unrealized Holding Gains | Gross Unrealized Holding Losses | Net Carrying Amount | |||||||||||||
| Short-term investments – held to maturity securities: | ||||||||||||||||
| Other debt securities | $ | 4,713 | $ | - | $ | - | $ | 4,713 | ||||||||
| Total short-term investments classified as held to maturity | $ | 4,713 | $ | - | $ | - | $ | 4,713 | ||||||||
| Total held to maturity | $ | 4,713 | $ | - | $ | - | $ | 4,713 | ||||||||
| As of December 31, 2013 | Aggregated Fair Value | Gross Unrealized Holding Gains | Gross Unrealized Holding Losses | Gross Recognized Losses | Cost Basis | |||||||||||||||
| Short-term Investments – available for sale securities: | ||||||||||||||||||||
| Securities issued or secured by Colombian government | $ | 100,299 | $ | 130 | $ | (825 | ) | $ | - | $ | 100,994 | |||||||||
| Securities issued or secured by financial entities | 643,688 | 7 | - | - | 643,681 | |||||||||||||||
| Other debt securities | - | - | - | - | - | |||||||||||||||
| Total short-term investments classified as available for sale | 743,987 | 137 | (825 | ) | - | 744,675 | ||||||||||||||
| Long-term investments – available for sale securities: | ||||||||||||||||||||
| Securities issued or secured by Colombian government | 110,195 | - | (1,668 | ) | - | 111,863 | ||||||||||||||
| Securities issued or secured by government sponsored enterprise (GSEs) | 42,129 | 13 | (29 | ) | - | 42,145 | ||||||||||||||
| Securities issued or secured by financial entities | 8,136 | - | (1 | ) | - | 8,137 | ||||||||||||||
| Securities issued or secured by the U.S. government | 73,794 | 76 | - | - | 73,718 | |||||||||||||||
| Other debt securities | 9,286 | - | (108 | ) | - | 9,394 | ||||||||||||||
| Securities issued by mixed- economy governmental entities | 1,504,957 | 1,243,959 | - | - | 260,998 | |||||||||||||||
| Total long-term investments classified as available for sale | 1,748,497 | 1,244,048 | (1,806 | ) | - | 506,255 | ||||||||||||||
| Total available for sale | $ | 2,492,484 | $ | 1,244,185 | $ | (2,631 | ) | $ | - | $ | 1,250,930 | |||||||||
Ecopetrol S.A. and Subsidiaries
Notes to the Consolidated Financial Statements
Years ended December 31, 2014, 2013 and 2012
(Expressed in millions of Colombian pesos)
| Aggregated Fair Value | Gross Unrealized Holding Gains | Gross Unrealized Holding Losses | Net Carrying Amount | |||||||||||||
| Short-term investments – held to maturity securities: | ||||||||||||||||
| Securities issued or secured by Colombian government | $ | 98,039 | $ | 3,950 | $ | - | $ | 94,089 | ||||||||
| Other debt securities | 1,692 | - | (3,226 | ) | 4,918 | |||||||||||
| Total short-term investments classified as held to maturity | 99,731 | 3,950 | (3,226 | ) | 99,007 | |||||||||||
| Total held to maturity | $ | 99,731 | $ | 3,950 | $ | (3,226 | ) | $ | 99,007 | |||||||
| As of December 31, 2012 | Aggregated Fair Value | Gross Unrealized Holding Gains | Gross Unrealized Holding Losses | Gross Recognized Losses | Cost Basis | |||||||||||||||
| Short-term Investments – available for sale securities: | ||||||||||||||||||||
| Securities issued or secured by Colombian government | $ | 844,764 | $ | 29,365 | $ | (41 | ) | $ | (27,899 | ) | $ | 843,338 | ||||||||
| Securities issued or secured by government sponsored enterprise (GSEs) | 92,536 | - | (57 | ) | - | 92,594 | ||||||||||||||
| Securities issued or secured by financial entities | 197,933 | 989 | (5 | ) | (734 | ) | 197,683 | |||||||||||||
| Other debt securities | 196,432 | 1,000 | (90 | ) | (967 | ) | 196,490 | |||||||||||||
| Total short-term investments classified as available for sale | $ | 1,331,665 | $ | 31,354 | $ | (193 | ) | $ | (29,600 | ) | $ | 1,330,105 | ||||||||
| Long-term investments – available for sale securities: | ||||||||||||||||||||
| Securities issued or secured by Colombian government | 2,156,611 | 59,719 | (1,059 | ) | (17,363 | ) | 2,115,315 | |||||||||||||
| Securities issued or secured by government sponsored enterprise (GSEs) | 1,545,377 | 3,466 | (401 | ) | (2,865 | ) | 1,545,178 | |||||||||||||
| Securities issued or secured by financial entities | 18,112 | 362 | - | (309 | ) | 18,059 | ||||||||||||||
| Securities issued or secured by the U.S. government | 44,265 | 18 | - | - | 44,247 | |||||||||||||||
| Other debt securities | 464,202 | 5,103 | (283 | ) | (2,466 | ) | 461,847 | |||||||||||||
| Securities issued by mixed- economy governmental entities | 1,367,178 | 1,106,181 | - | - | 260,998 | |||||||||||||||
| Total long-term investments classified as available for sale | $ | 5,595,745 | $ | 1,174,849 | $ | (1,743 | ) | $ | (23,003 | ) | $ | 4,445,644 | ||||||||
| Total available for sale | $ | 6,927,410 | $ | 1,206,203 | $ | (1,936 | ) | $ | (52,603 | ) | $ | 5,775,749 | ||||||||
| Aggregated Fair Value | Gross Unrealized Holding Gains | Gross Unrealized Holding Losses | Net Carrying Amount | |||||||||||||
| Short-term investments – held to maturity securities: | ||||||||||||||||
| Other debt securities | $ | 2,411 | $ | - | $ | (2,642 | ) | $ | 5,054 | |||||||
| Total short-term investments classified as held to maturity | $ | 2,411 | $ | - | $ | (2,642 | ) | $ | 5,054 | |||||||
| Long-term investments- held to maturity securities: | ||||||||||||||||
| Securities issued or secured by Colombian government | 96,791 | 8,803 | - | 87,988 | ||||||||||||
| Total long-term investments classified as held to maturity | $ | 96,791 | $ | 8,803 | $ | - | $ | 87,988 | ||||||||
| Total held to maturity | $ | 99,202 | $ | 8,803 | $ | (2,642 | ) | $ | 93,042 | |||||||
| 2014 | 2013 | 2012 | ||||||||||
| Short-term Investments – Trading securities: | ||||||||||||
| Other debt securities or mixed/economy governmental entities | $ | - | $ | 569,119 | $ | - | ||||||
| Total Short-term Investments classified as Trading | $ | - | $ | 569,119 | $ | - | ||||||
Ecopetrol S.A. and Subsidiaries
Notes to the Consolidated Financial Statements
Years ended December 31, 2014, 2013 and 2012
(Expressed in millions of Colombian pesos)
The maturities of fixed-income investments as of December 31, 2014 and 2013 are as follows:
| As of December 31, 2014 | ||||||||||||||||
| Available for Sale | Held to Maturity | |||||||||||||||
| Cost Basis | Fair Value | Cost Basis | Fair Value | |||||||||||||
| Due in one year or less | $ | 625,137 | $ | 625,398 | $ | 4,713 | $ | 4,713 | ||||||||
| Due in one to five years | 556,850 | 1,876,638 | - | - | ||||||||||||
| Total | $ | 1,181,987 | $ | 2,502,035 | $ | 4,713 | $ | 4,713 | ||||||||
| As of December 31, 2013 | ||||||||||||||||
| Available for Sale | Held to Maturity | |||||||||||||||
| Cost Basis | Fair Value | Cost Basis | Fair Value | |||||||||||||
| Due in one year or less | $ | 744,674 | $ | 743,987 | $ | 99,007 | $ | 99,731 | ||||||||
| Due in one to five years | 506,256 | 1,748,497 | - | - | ||||||||||||
| Total | $ | 1,250,930 | $ | 2,492,484 | $ | 99,007 | $ | 99,731 | ||||||||
Amounts recorded in other comprehensive income in prior years realized on available for sale securities sold during 2014, 2013 and 2012 were:
| 2014 | 2013 | 2012 | ||||||||||
| Losses | $ | 5,617 | $ | 1,566 | $ | 2,004 | ||||||
| Gains | $ | 4,228 | $ | 138,268 | $ | 33,955 | ||||||
Available-for-sale securities in an unrealized loss position as of December 31, 2014 and 2013 are as follows:
| As of December 31, 2014 | ||||||||||||||||||||||||
| Less than 12 months | 12 Months or Greater | Total | ||||||||||||||||||||||
| Descriptions of Securities | Fair Value | Unrealized Losses | Fair Value | Unrealized Losses | Fair Value | Unrealized Losses | ||||||||||||||||||
| Securities issued or secured by Colombian government | $ | 140,338 | $ | - | $ | 43,025 | $ | 455 | $ | 183,363 | $ | 455 | ||||||||||||
| Securities issued or secured by financial entities | 453,905 | - | 2,324 | 2 | 456,229 | 2 | ||||||||||||||||||
| Securities issued or secured by government sponsored enterprise (GSEs) | - | - | 124,620 | 134 | 124,620 | 134 | ||||||||||||||||||
| Securities issued or secured by government USA | 6,939 | - | 116,083 | 46 | 123,022 | 46 | ||||||||||||||||||
| Other debt securities | 24,216 | - | 9,192 | 7 | 33,408 | 7 | ||||||||||||||||||
| Total | $ | 625,398 | $ | - | $ | 295,244 | $ | 644 | $ | 920,642 | $ | 644 | ||||||||||||
| As of December 31, 2013 | ||||||||||||||||||||||||
| Less than 12 months | 12 Months or Greater | Total | ||||||||||||||||||||||
| Descriptions of Securities | Fair Value | Unrealized Losses | Fair Value | Unrealized Losses | Fair Value | Unrealized Losses | ||||||||||||||||||
| Securities issued or secured by Colombian government | $ | 90,089 | $ | 825 | $ | 110,195 | $ | 1,668 | $ | 200,284 | $ | 2,492 | ||||||||||||
| Securities issued or secured by financial entities | 25,308 | - | 1,840 | 1 | 27,147 | 1 | ||||||||||||||||||
| Securities issued or secured by government sponsored enterprise (GSEs) | - | - | 24,470 | 29 | 24,470 | 29 | ||||||||||||||||||
| Other debt securities | - | - | 9,286 | 108 | 9,286 | 108 | ||||||||||||||||||
| Total | $ | 115,397 | $ | 825 | $ | 145,791 | $ | 1,806 | $ | 261,187 | $ | 2,630 | ||||||||||||
Restricted Assets
Under U.S. GAAP the Company classifies as restricted assets, those assets where their availability depends on a court decision, contractual or legal restrictions, such as cash, trust funds or investments. The detail of restricted assets as of December 31, 2014 and 2013 is as follows:
Ecopetrol S.A. and Subsidiaries
Notes to the Consolidated Financial Statements
Years ended December 31, 2014, 2013 and 2012
(Expressed in millions of Colombian pesos)
| Concept | 2014 | 2013 | ||||||
| Investment securities | $ | 548,413 | $ | 371,386 | ||||
| Specific destination funds | 226,094 | 299,703 | ||||||
| Cash | 73,649 | 57,857 | ||||||
| Total | $ | 848,156 | $ | 728,946 | ||||
In Specific destination funds the most significant items are resources intended to guarantee contractual obligations of our subsidiaries Equión $6,299, ODL Finance $9,402, Oleoducto Bicentenario $85,890, Ocensa $982 and Cenit $33,617.
Other significant restricted assets are related to Santiago de las Atalayas Fund which is detailed in the chart below:
| Concept | 2014 | 2013 | ||||||
| Investments available for sale | $ | 548,413 | $ | 371,387 | ||||
| Specific destination funds * | 172 | 73,467 | ||||||
| Cash | 2,912 | 510 | ||||||
| Total | $ | 551,497 | $ | 445,364 | ||||
*This fund receives the coupons and principal payments of Santiago de las Atalayas investments in U.S. dollars.
The investments related to Santiago de las Atalayas at December 31, 2014 and 2013 consist of the following:
| As of December 31, 2014 | Aggregated Fair Value | Gross Unrealized Holding Gains | Gross Unrealized Holding Losses | Gross Recognized Losses | Cost Basis | |||||||||||||||
| Short-term Investments - Available for Sale Securities: | ||||||||||||||||||||
| Securities issued or secured by Colombian government | $ | 45,422 | $ | 44 | $ | (74 | ) | $ | - | $ | 45,453 | |||||||||
| Securities issued by mixed – economy governmental entities | - | - | - | - | - | |||||||||||||||
| Securities issued or secured by financial entities | 111,013 | 4 | - | - | 11,101 | |||||||||||||||
| Securities issued or secured by government sponsored enterprise (GSEs) | 7,178 | - | (1 | ) | - | 7,179 | ||||||||||||||
| Securities issued or secured by government USA | 11,963 | 4 | - | - | 11,959 | |||||||||||||||
| Other debt securities | 11,933 | - | - | - | 11,932 | |||||||||||||||
| Total Short-term Investments classified as available for sale | $ | 187,509 | $ | 51 | $ | (75 | ) | $ | - | $ | 187,533 | |||||||||
| Long-term Investments - Available for Sale Securities: | 69,544 | - | (991 | ) | - | 70,535 | ||||||||||||||
| Securities issued or secured by Colombian government | 439 | 18 | - | - | 422 | |||||||||||||||
| Securities issued or secured by financial entities | 132,341 | 76 | (248 | ) | - | 132,512 | ||||||||||||||
| Securities issued or secured by government sponsored enterprise (GSEs) | 136,267 | 75 | (110 | ) | (68 | ) | 13,637 | |||||||||||||
| Securities issued or secured by government USA | 22,312 | 4 | (1,039 | ) | - | 23,347 | ||||||||||||||
| Other debt securities | $ | 360,903 | 173 | (2,387 | ) | (68 | ) | 363,185 | ||||||||||||
| Total Available for Sale | $ | 548,413 | $ | 224 | $ | (2,462 | ) | $ | (68 | ) | $ | 550,718 | ||||||||
| As of December 31, 2013 | Aggregated Fair Value | Gross Unrealized Holding Gains | Gross Unrealized Holding Losses | Gross Recognized Losses | Cost Basis | |||||||||||||||
| Short-term Investments – available for sale securities: | ||||||||||||||||||||
| Securities issued or secured by Colombian government | $ | 9,118 | $ | 23 | $ | (45 | ) | $ | - | $ | 9,140 | |||||||||
| Securities issued by mixed – economy governmental entities | 16,064 | - | (24 | ) | - | 16,088 | ||||||||||||||
| Securities issued or secured by financial entities | 65,889 | 133 | (15 | ) | (133 | ) | 65,904 | |||||||||||||
| Total Short-term Investments classified as available for sale | $ | 91,071 | $ | 156 | $ | (84 | ) | $ | (133 | ) | $ | 91,132 | ||||||||
| Long-term Investments – available for sale securities: | ||||||||||||||||||||
| Securities issued or secured by Colombian government | 62,123 | 174 | (1,272 | ) | - | 63,221 | ||||||||||||||
| Securities issued or secured by government sponsored enterprise (GSEs) | 162,130 | 22 | (70 | ) | - | 162,178 | ||||||||||||||
| Securities issued by mixed- economy governmental entities | 36,888 | 340 | (1,273 | ) | - | 37,821 | ||||||||||||||
| Securities issued or secured by the U.S. government | 19,175 | - | (37 | ) | - | 19,212 | ||||||||||||||
| Total Long-term Investments classified as available for sale | $ | 280,316 | 536 | (2,652 | ) | - | 282,432 | |||||||||||||
| Total Available for Sale | $ | 371,387 | $ | 692 | $ | (2,736 | ) | $ | (133 | ) | $ | 373,564 | ||||||||
The unrealized gains and losses of the restricted assets are recognized in other comprehensive income.
Impairment of investment securities available for sale are reported differently under Colombian Government Entity GAAP and U.S. GAAP. Under Colombian Government Entity GAAP, impairment is charged to income in the current period, but recoveries in value can be recorded up to the amount that was originally impaired. Under U.S. GAAP, other-than-temporary impairments should be charged to income in the current period and a new cost basis for the security is established. Subsequent increases in the cost basis of an impaired investment as a result of a recovery in fair value are included in other comprehensive income.
Ecopetrol S.A. and Subsidiaries
Notes to the Consolidated Financial Statements
Years ended December 31, 2014, 2013 and 2012
(Expressed in millions of Colombian pesos)
The Company has a policy under which they conduct periodic reviews of marketable securities to assess whether other-than-temporary impairment exists. A number of factors are considered in performing an impairment analysis of securities. Those factors include:
The Company also takes into account changes in global and regional economic conditions and changes related to specific issuers or industries that could adversely affect these values.
Ecopetrol’s marketable security portfolio consists only of debt securities, such as treasury investments, bonds, and commercial papers. For this reason, the Company has an internal policy to limit the ratings of their investments and issuers as follows:
The Company recognized impairments on its investment securities resulting from the exchange differences amounting to $1,352, $133 and $50,126 in 2014, 2013 and 2012, respectively. In addition, we recognized an other than temporary impairment for fair value in an amount of $1,971 in 2014. There was no other than temporary impairment for fair value in 2013 and 2012.
Under Colombian Government Entity GAAP, equity securities for which prices are unquoted, or for which trading volume is lower, and the Company does not control the investee, are accounted for under the cost method and subsequently are valued by the equity method. Under the equity method, the Company accounts for the difference between its proportionate share of shareholders' equity of the investee and its acquisition cost, adjusted for inflation through 2001, in a separate valuation account in the assets and equity (valuation surplus), if the proportionate share of shareholders’ equity of the investee is higher than its cost or as an allowance for losses, affecting net income, if the cost is higher than the proportionate share of shareholders’ equity of the investee. Under this method, the Company only records dividends as income when received. From 2008 the Colombian Government Entity GAAP incorporated the concept of significant influence for the recognition of investments in associated entities and established the equity method to update these investments.
Under U.S. GAAP, an investment in a non-marketable equity security is recorded using the equity method when the investor can exercise significant influence over the investee, or the cost method when significant influence cannot be exercised. Under the equity method of accounting for U.S. GAAP the carrying value of such an investment is adjusted to reflect (1) the Company’s proportionate share of earnings or losses from the investee and (2) additional investments and distributions of dividends. The Company’s proportionate share of income or loss is reported in earnings however any dividends or additional investments are reported only as an adjustment of the carrying amount of the investment.
The differences between the application of the cost and the equity method under U.S. GAAP were:
Ecopetrol S.A. and Subsidiaries
Notes to the Consolidated Financial Statements
Years ended December 31, 2014, 2013 and 2012
(Expressed in millions of Colombian pesos)
The summary of the investments valued by the equity method for U.S. GAAP purposes is shown in the following table:
For the Year Ended December 31, 2014
| Company | Percentage Voting Interest | Equity Calculated | Equity Under Colombian GAAP | Assets Under Colombian | Liabilities Under Colombian GAAP | Net Income (Loss) Under Colombian GAAP | Investment Under U.S. GAAP Equity Method | Equity Method Accounting Adj (*) |
Impairment | Total Equity Method Investment | ||||||||||||||||||||||||||||||
| Invercolsa S.A. | 43.35 | % | $ | 130,903 | $ | 515,527 | $ | 516,075 | $ | 548 | $ | 70,261 | $ | 56,746 | $ | - | $ | $ | 56,746 | |||||||||||||||||||||
| Serviport S.A. | 49.00 | % | 12,704 | 17,106 | 47,222 | 32,284 | 2,511 | 6,225 | - | 6,225 | ||||||||||||||||||||||||||||||
| Offshore International Group | 50.00 | % | 1,351,924 | 1,351,924 | 2,244,434 | 892,510 | 15,471 | 675,962 | 521,646 | 294,933 | 902,675 | |||||||||||||||||||||||||||||
| Ecodiesel S.A. | 50.00 | % | 64,511 | 77,968 | 151,438 | 73,470 | 22,376 | 32,256 | - | 32,256 | ||||||||||||||||||||||||||||||
| Sociedad Portuaria de Olefinas | 50.00 | % | 1,050 | 1,386 | 1,562 | 176 | 87 | 525 | - | 525 | ||||||||||||||||||||||||||||||
| Transgas de Occidente S.A. | 20.00 | % | 177,035 | 211,622 | 308,656 | 97,024 | 12,525 | 35,407 | (463 | ) | 34,944 | |||||||||||||||||||||||||||||
| $ | 807,121 | $ | 521,183 | $ | 294,933 | $ | 1,033,371 | |||||||||||||||||||||||||||||||||
For the Year Ended December 31, 2013
| Company | Percentage of Voting Interest | Equity Calculated under U.S. GAAP | Equity Under Colombian GAAP | Assets Under Colombian GAAP | Liabilities Under Colombian GAAP | Net Income (Loss) Under Colombian GAAP | Investment Under U.S. GAAP Equity Method | Equity Method Accounting Adj (*) | Impairment Under U.S. GAAP | Total Equity Method Investment | ||||||||||||||||||||||||||||||
| Invercolsa S.A. | 43.35 | % | $ | 252,973 | $ | 621,319 | $ | 622,105 | $ | 785 | $ | 51,644 | $ | 109,664 | $ | - | $ | - | $ | 109,664 | ||||||||||||||||||||
| Serviport S.A. | 49.00 | % | 15,525 | 14,938 | 47,222 | 32,284 | 2,511 | 7,607 | - | - | 7,607 | |||||||||||||||||||||||||||||
| Offshore International Group | 50.00 | % | 1,076,347 | 1,076,347 | 2,049,502 | 973,155 | 109,925 | 538,174 | 472,094 | 51,671 | 958,597 | |||||||||||||||||||||||||||||
| Ecodiesel S.A. | 50.00 | % | 52,976 | 53,353 | 137,384 | 84,031 | 22,765 | 26,488 | - | - | 26,488 | |||||||||||||||||||||||||||||
| Sociedad Portuaria de Olefinas | 50.00 | % | 1,022 | 1,299 | 1,518 | 219 | 198 | 511 | - | - | 511 | |||||||||||||||||||||||||||||
| Transgas de Occidente S.A. | 20.00 | % | 149,189 | 211,622 | 308,655 | 97,024 | 12,525 | 29,838 | (12,724 | ) | - | 17,114 | ||||||||||||||||||||||||||||
| $ | 712,282 | $ | 459,370 | $ | 51,671 | $ | 1,119,981 | |||||||||||||||||||||||||||||||||
| Concept | 2014 | 2013 | ||||||
| Fair value of property, plant and equipment | $ | 3,075 | $ | (9,946 | ) | |||
| Goodwill | 518,571 | 469,316 | ||||||
| Total | $ | 521,646 | $ | 459,370 | ||||
The number of shares which the Company owns with respect to its investment in Invercolsa S.A. has been subject to a legal dispute with another Invercolsa shareholder. Lower court decisions had ruled in favor of both the Company and the other shareholder and a final court decision in January 2011 determined that 324 million shares, equivalent to 11.58% of the capital stock of Invercolsa should be returned to Ecopetrol. As a result Ecopetrol controls 43.35%. The dividends paid relating to the shares returned to Ecopetrol are still in dispute, as well as the ownership of shares constituting 8.53% of Invercolsa. The resolution of these matters is still pending.
Under U.S. GAAP, ASC 810-10-15-10 requires that consolidated financial statements include subsidiaries in which the Company has a controlling financial interest, i.e., a majority voting interest. However, application of the majority voting interest requirement to certain types of entities may not identify the party with a controlling financial interest because that interest may be achieved through other arrangements. Thus, the U.S. GAAP rules also require a Company to consolidate a variable interest entity if that company is the primary beneficiary of the VIE, with that has the power to direct the activities of the VIE that most significantly affect the entity’s economic performance and will absorb a majority of the entity’s expected losses, receive a majority of the entity’s expected residual returns, or both. In determining whether it is a primary beneficiary of a variable interest entity, a company shall treat variable interests in that same entity held by the Company’s related parties as its own interest. Under Colombian Government Entity GAAP, consolidated financial statements only include subsidiaries in which the Company has the majority voting interest.
In October 2009, the subsidiary Oleoducto de los Llanos Orientales (hereinafter “ODL”) assigned its rights under a "Ship or Pay” contract for the completion of a securitization for the purpose of obtaining funds required to finish the second phase of the project, the refund of capital to the associates, and maintaining the capital structure initially agreed. The structure of this issuance was made through assets in a trust fund (hereinafter “Fideicomiso P.A. ODL - ECOPETROL”) administered by Corficolombiana S.A., who has to pay the security holder on the due dates. Additionally, each month, the trust company must report to ODL income and expenses that are generated in this process and that are paid, if applicable, to ODL as advances.
Ecopetrol S.A. and Subsidiaries
Notes to the Consolidated Financial Statements
Years ended December 31, 2014, 2013 and 2012
(Expressed in millions of Colombian pesos)
Based on the ASC 810, ODL determined that it must consolidate Fideicomiso P.A. ODL - ECOPETROL, since it is a VIE and ODL is the primary beneficiary.
The adjustments of Fideicomiso P. A. ODL – ECOPETROL, according to financial information under U.S. GAAP as of and for the years ended December 31, 2014 and 2013, are as follows:
| 2014 | 2013 | |||||||
| Assets | $ | (96,055 | ) | $ | (93,076 | ) | ||
| Liabilities | 96,055 | 93,076 | ||||||
| Equity | $ | - | $ | - | ||||
| Net income | $ | - | $ | - | ||||
The financial information summary of Fideicomiso P. A. ODL - ECOPETROL according to U.S. GAAP as of and for the years ended December 31, 2014 and 2013, are as follows:
| 2014 | 2013 | |||||||
| Assets | $ | 336,902 | $ | 433,560 | ||||
| Liabilities | (206,616 | ) | (306,923 | ) | ||||
| Equity | $ | 130,286 | $ | 126,636 | ||||
| Net income | $ | 105,213 | $ | 106,675 | ||||
Under Colombian Government Entity GAAP it is not mandatory to perform impairment tests of the Equity Method Investments unless positive evidence is identified. For the years 2014 and 2013, the investment in Offshore International Group was evaluated for impairment resulting in an impairment loss in the amount of $182,631 and $123,136 respectively.
Under U.S. GAAP ASC 323-10-35-31 to 33 and 325-20-35 1A and 2, assets held at cost, including non-marketable equity investments, should be evaluated for impairment if the Company is aware of any events or changes in circumstances that may have significant adverse effects on the fair value of the investment. If the Company believes such circumstances exist, the Company would estimate the asset’s fair value and compare that to cost to determine if any impairment is necessary.
During 2014 and 2013 the Company evaluated its investments and concluded that there were recorded an impairment of $ 294,933 and $51,672 respectively, regarding Offshore International Group – “OIG”. The main reasons that explain Savia’s impairment were the decreases of international oil prices (Brent reference).
Ecopetrol is exposed to market risk from changes in foreign currency exchange rates, interest rate risk of its financial obligations and to commodity price risk, resulting from the fluctuations of international crude oil prices which affect its earnings, cash flows and financial condition. Ecopetrol manages its exposure to these market risks through its regular operating and financial activities and, when appropriate, through the use of derivative financial instruments. Ecopetrol has established control activities to assess, approve and monitor derivative financial instrument operations. Ecopetrol does not buy, hold or sell derivative financial instruments for trading purposes. Ecopetrol's primary foreign currency exposures relate to the U.S. dollar; however, Ecopetrol manages its foreign currency risk position internally, using non-deliverable forwards, according to the size of the mismatches between its asset-liability position in U.S. dollars and its asset-liability position in Colombian pesos. If no mismatches occur, Ecopetrol has a perfect natural hedge. Ecopetrol also utilizes other derivative agreements to mitigate changes in the fair value of commodities. None of the derivatives were designated or documented for hedge accounting.
As of December 31, 2014, only the subsidiaries HOCOL S.A. and OCENSA are exposed to foreign currency fluctuations. Such exposures arise primarily from expenditures that are denominated in currencies other than the functional currency. The Company constantly monitors its exposure to foreign currency risks. To reduce its foreign currency exposure associated with operating expenses incurred in Colombian pesos, the Company may enter into foreign currency derivatives to manage such risks. These derivatives are recognized at their fair value as either a financial asset or obligation with the corresponding income or expense recognized.
Total results recognized related to derivative activities during the years are as follows:
| 2014 | 2013 | 2012 | ||||||||||||||||||||||
| Realized | Unrealized | Realized | Unrealized | Realized | Unrealized | |||||||||||||||||||
| Options (1) | $ | (1,497 | ) | $ | (3,992 | ) | $ | 467 | $ | (45 | ) | $ | 4,315 | $ | 4,619 | |||||||||
| Swaps | - | - | - | - | - | - | ||||||||||||||||||
| Forwards | 380 | (130,272 | ) | 542 | - | 695 | - | |||||||||||||||||
| Total | $ | (1,117 | ) | $ | (134,264 | ) | $ | 1,009 | $ | (45 | ) | $ | 5,010 | $ | 4,619 | |||||||||
(1) Amounts include premiums paid
Ecopetrol S.A. and Subsidiaries
Notes to the Consolidated Financial Statements
Years ended December 31, 2014, 2013 and 2012
(Expressed in millions of Colombian pesos)
Under RCP, each derivative has its own accounting treatment depending on the type of derivative. Option premiums paid are recorded as deferred charges and amortized to the income statement as financial expense on a straight-line basis over the life of the contract, the option contract is recognized in memo accounts unless it is likely to be exercised, and the gain is recognized as an investment. Swap and forward contract net results are recorded as an investment. In all cases, gains and losses are recognized in earnings as financial income or expense. Amounts receivable or payable upon maturity resulting from net payments are recorded using current rates for the period.
U.S. GAAP requires that all derivative instruments be recorded on the balance sheet at fair value. Changes in the fair value of derivatives are recorded each period in current earnings. The fair value of derivatives instruments is recorded as other assets and other liabilities.
Under U.S. GAAP, embedded derivative instruments shall be separated from the host contract, and2016 Organización Terpel accounted for using different measurement attributes, if certain conditions are met. In the case14.4% of the Company, some contracts to which the Company is counterparty include embedded foreign exchange derivatives. According to ASC paragraph 815-15-15-10 through 13 these contracts do not require separate accounting for the embedded derivative and the host contract because contract payments are made in the functional currency of a party to the contract or contract payments are made in a currency in which the price of the good or service delivered is routinely denominated in international commerce. In other cases, contracts indexed to inflation considered clearly and closely related.
During 2007, the Company exchanged a refinery business with a book value of $234,371 for a 49% interest in Refinería de Cartagena S.A. The Company estimated the fair value of the 49% investment as $1,369,546. Under Colombian Government Entity GAAP, this difference between the cost of the assets given and the fair value of the assets received was recorded as an increase to asset revaluation and equity. However, under ASC 845-10-30, 51% of the difference between the book value of the Refinery and the fair value of the assets received, which the Company determined to be a more reliable indicator of the value of the exchange, was recorded in the results of operations as a gain in the amount of $578,939. The remaining 49% of unrealized gain was recorded as a deferred gain with a corresponding increase to the investment, equivalent to a deferred gain of $556,236, to be amortized over the expected useful life of the equipment. In 2011, the Company determined that in 2009, as a result of the acquisition of the remaining participation in Reficar S.A., the unamortized unrealized gain should have been recorded at fair value since the Company obtained the remaining 51% of Refinería de Cartagena S.A. in 2009 in line with the acquired entity’s fair value of the assets and liabilities acquired as of May 27, 2009. However, according to ASC 250 and SAB 108, we do not consider such amount significant and decided to fully amortize the remaining balance as of 2011. As a result, the net income reconciliation includes amortized income of $425,521 in 2011.
Under Colombian Government Entity GAAP, the Equity Tax is recognized as a deferred charge for the total amount due payable during the years 2011 through 2014. The deferred charge is amortized as an expense of the year based on the payments made. The local regulatory entities also allowed companies that applied inflation adjustments and still have outstanding balances in the Equity Revaluation account to reduce such balance instead of recognizing a deferred charge. Under U.S. GAAP Equity Tax was fully expensed in 2011 since amortization of certain expenses is not allowed under ASC 350.
Other deferred assets recognized under Colombian Government Entity GAAP are related to certain pre-operating expenses and other charges that include normal recurring maintenance and fees. Under U.S. GAAP ASC 730 forbids namely capitalization of pre-operating expenses and thus established that these are expensed as incurred.
For U.S. GAAP purposes, the amount of the adjustment in the Company’s net income related to deferred expenses amounting to $521,358 in 2014, $476,091 in 2013 and $493,159 in 2012.
Under Colombian Government Entity GAAP, the Company estimates the net present value of its actuarial obligation for all pension plans and other post-retirement obligations. Annually, the Company estimates the net present value of the actuarial obligation and adjusts it accordingly. The amounts of the adjustments related to health care, education and severance plans are reflected in the Company’s net income. However, the amounts related to the pension and bonds plans are recorded in memorandum accounts.
For other post-retirement benefits, the payments are made according to seniority and the salary at the time of retirement, as stipulated in the Collective Labor Convention and Agreement No. 01.
Ecopetrol S.A. and Subsidiaries
Notes to the Consolidated Financial Statements
Years ended December 31, 2014, 2013 and 2012
(Expressed in millions of Colombian pesos)
Under the post-retirement benefits plan those workers who had met the age and continuous or discontinuous service time requirements of the law, the Collective Bargaining Agreement in effect and/or Agreement 01 of 1977, prior to August 1, 2010, had consolidated their right to their pension with Ecopetrol. However, it was mandatory for other workers, who were not covered, to join the General Pension System. The pension administrator chosen by the worker (either Colpensiones or Private Pension Fund or whichever may correspond) would be responsible for recognizing and paying the respective pension.
Under the post-retirement benefits plan for Ecopetrol personnel, the Company covers 90% of educational expenses for children of employees, including enrollment fees, tuition and other associated costs. A fixed annual sum, depending on education level, is also provided for the acquisition of textbooks. Educational coverage includes kindergarten, elementary school, high school and college. Ecopetrol´s financial statements must also show the cost of post-retirement educational benefits for children of retired employees, since benefits continue irrespective of retirement or death.
According to the Collective Labor Agreement and Agreement No. 01, the Company will pay for health services for employees and enrolled family members. Health services include: office visits and required laboratory services, drugs, diagnostic examinations, ambulatory treatment, hospitalization due to illness or accident, surgery due to illness or accident, maternity and rehabilitation treatments and orthopedic parts. Therefore, such post-retirement health benefit costs are recorded in the consolidated financial statements of the Company prepared in accordance with Colombian Government Entity GAAP, since retired workers and enrolled family members continue to receive full medical coverage. The same is true for deceased non-retired employees.
The Collective Labor Agreement was negotiated in 2014. See details of the final agreement on 3.12.2 Collective Bargaining Arrangements.
Under U.S. GAAP, the Company applies the provisions of ASC 710, 715 and 835 as amended. Accordingly, the Company accrues for its obligations under its employee defined benefit plans, net of plan assets. The cost of defined benefit pensions and other post-employment benefits is actuarially determined using the projected benefit method based on length of service and reflects Management’s best estimate of salary escalation, retirement ages of employees and expected future health care costs. The expected return on plan assets is based on historical and projected rates of return for assets in the investment plan portfolio. The actual return is based on the fair value of plan assets. The projected benefit obligation is discounted using the market interest rate on high-quality corporate debt instruments as at the measurement date. Actuarial gains and losses related to the change in the over-funded or under-funded status of the defined benefit pension plan and other post-employment benefit plans are recognized in other comprehensive income.
Under Colombian law, employees are entitled to one month salary for each year of service. This benefit is known as the “severance obligation” or “cesantias”. This benefit accumulates during the time of employment and is paid to employees upon their termination or retirement from Ecopetrol. However, employees may request advanced benefit payments at any time. In 1990, the Colombian government revised its labor regulations to permit companies, subject to employee approval, to pay the severance obligation to their employees on a current basis. Law 50 of 1990 also enabled each employee to freely choose which trust fund would manage the amount accrued during each year in which they are eligible for severance payments. This amount must be transferred by the company to the trust fund no later than February 14th in the subsequent year.
In addition, under Colombian law the Company must pay pension bonds for certain employees when they leave Ecopetrol. Those bonds payable accrue interest at the DTF rate, according to the class of bonds, as follows:
The economic assumptions used in the determination of pension obligations under U.S. GAAP differ from those used under RCP since the latter are established by Colombian regulations.
The combined costs for the above mentioned benefit plans, determined using U.S. GAAP, for the years ended December 31, 2014, 2013 and 2012 are summarized below: (all obligations were measured at year-end)
| 2014 | 2013 | 2012 | ||||||||||||||||||||||||||||||||||
| Components of net periodic benefit costs: | Pension | Other Benefits (*) | Total | Pension | Other Benefits (*) | Total | Pension | Other Benefits (*) | Total | |||||||||||||||||||||||||||
| Service cost | $ | - | 60,982 | 60,982 | $ | - | $ | 63,742 | $ | 63,742 | $ | - | $ | 44,089 | $ | 44,089 | ||||||||||||||||||||
| Interest cost | 775,297 | 431,219 | 1,206,516 | 739,816 | 402,817 | 1,142,633 | 840,944 | 525,628 | 1,366,572 | |||||||||||||||||||||||||||
| Expected return on plan assets | (568,964 | ) | (40,182 | ) | (609,146 | ) | (592,897 | ) | (38,922 | ) | (631,819 | ) | (720,034 | ) | (45,265 | ) | (765,299 | ) | ||||||||||||||||||
| Amortization of net actuarial gain or loss | 10,989 | 19,050 | 30,039 | 31,605 | 69,126 | 100,731 | 18,531 | 81,589 | 100,120 | |||||||||||||||||||||||||||
| Net periodic pension cost under U.S. GAAP | 217,322 | 471,069 | 688,391 | 178,524 | 496,763 | 675,287 | 139,441 | 606,041 | 745,482 | |||||||||||||||||||||||||||
| Net periodic pension cost under Colombian GAAP (gain) or loss | - | 583,254 | 583,254 | - | 500,855 | 500,855 | (83,776 | ) | 849,961 | 766,185 | ||||||||||||||||||||||||||
| Difference to be recognized under U.S. GAAP (income) loss | $ | 217,322 | (112,185 | ) | 105,137 | $ | 178,524 | $ | (4,092 | ) | $ | 174,432 | $ | 223,217 | $ | (243,920 | ) | $ | (20,703 | ) | ||||||||||||||||
(*) Other benefits include education, health care, pension bonds and accrued retroactive severance.
Ecopetrol S.A. and Subsidiaries
Notes to the Consolidated Financial Statements
Years ended December 31, 2014, 2013 and 2012
(Expressed in millions of Colombian pesos)
In 2008, Ecopetrol was approved by Colombian Government to partially transfer its pension net liability to an autonomous trust fund. According to Colombian Government Entity GAAP (RCP), the assets and liabilities transferred shall be accounted for in memorandum accounts, off balance sheet. This implies that the net liability transferred is not part of the assets and liabilities of Ecopetrol instead a pension trust fund, a separate entity not controlled by the Company. In 2012, we found a misstatement in our reconciliation to U.S. GAAP, due to we considered the transferred assets and liabilities to be a part of the Company’s balance sheet, when reconciling our financial statements to U.S. GAAP. According to ASC 250, we analyzed the effect of this error and conclude it did not have a material effect on previously issued financial statements. As of December 2012, this error had a net effect on the net actuarial liability of $89,775, net after tax. Since this is not a material misstatement, we corrected it prospectively in our 2013 financial statements.
The changes in the benefit obligations and in plan assets for the above mentioned benefit plans, determined using U.S. GAAP, for the years end December 31, 2014 and 2013, are summarized below:
| Pension Plan | Other Benefits | |||||||||||||||
| 2014 | 2013 | 2014 | 2013 | |||||||||||||
| Reconciliation of project benefit obligation: | ||||||||||||||||
| Project benefit obligation as of January 1 | $ | (11,422,854 | ) | $ | (12,179,576 | ) | $ | (6,412,978 | ) | $ | (6,770,823 | ) | ||||
| Service cost | - | - | (60,982 | ) | (63,742 | ) | ||||||||||
| Interest cost | (775,297 | ) | (739,816 | ) | (431,219 | ) | (402,817 | ) | ||||||||
| Actuarial gain (loss) | 575,360 | 826,026 | 428,672 | 541,090 | ||||||||||||
| Benefit payments | 680,313 | 670,512 | 295,885 | 283,314 | ||||||||||||
| Plan amendments | 86,597 | |||||||||||||||
| Projected benefit obligation as of December 31 | $ | (10,942,478 | ) | $ | (11,422,854 | ) | $ | (6,094,025 | ) | $ | (6,412,978 | ) | ||||
| Reconciliation of plan assets : | ||||||||||||||||
| Fair value of plan assets as of January 1 | 10,691,989 | 11,122,471 | 757,887 | 743,593 | ||||||||||||
| Fund contribution | 200,778 | - | 91,886 | 281,561 | ||||||||||||
| Actual return on assets | 877,256 | 240,030 | 64,090 | 16,047 | ||||||||||||
| Benefits paid | (680,313 | ) | (670,512 | ) | (295,885 | ) | (283,314 | |||||||||
| Fair value of plan assets as of December 31 | $ | 11,089,710 | $ | 10,691,989 | $ | 617,978 | $ | 757,887 | ||||||||
| Net liability | 147,232 | (730,865 | ) | (5,476,047 | ) | (5,655,091 | ) | |||||||||
| Net liability under Colombian Government Entity GAAP | - | - | (4,499,052 | ) | (4,208,462 | ) | ||||||||||
| Net effect under pension plan and other benefits | $ | 147,232 | $ | (730,865 | ) | $ | (976,995 | ) | $ | (1,446,629 | ) | |||||
| Amounts recognized in other comprehensive (income) | (458,860 | ) | (1,353,502 | ) | (1,286,599 | ) | (1,758,229 | ) | ||||||||
Net liability of employee benefit plans, net of other employee benefits, is classified as follows:
| Pension Plans | Other Benefits | TOTAL | ||||||||||||||||||||||
| 2014 | 2013 | 2014 | 2013 | 2014 | 2013 | |||||||||||||||||||
| Current portion | $ | - | $ | - | $ | (321,261 | ) | $ | (281,019 | ) | $ | (321,261 | ) | $ | (281,019 | ) | ||||||||
| Long-term portion | 147,232 | (730,865 | ) | (5,154,786 | ) | (5,374,072 | ) | (5,007,554 | ) | (6,104,937 | ) | |||||||||||||
| Net liability | $ | 147,232 | $ | (730,865 | ) | $ | (5,476,047 | ) | $ | (5,655,091 | ) | $ | (5,328,815 | ) | $ | (6,385,956 | ) | |||||||
As of December 31, 2014 and 2013, net obligation amounts recognized in the balance sheet related to pension, health, education, bonds and severance obligations consist of:
| 2014 | 2013 | |||||||
| Long-term liability | ||||||||
| Pension | $ | 147,232 | $ | (730,865 | ) | |||
| Health care | (4,546,652 | ) | (4,910,787 | ) | ||||
| Education | (605,099 | ) | (449,269 | ) | ||||
| Bonds | - | (13,183 | ) | |||||
| Severance | (3,035 | ) | (833 | ) | ||||
| Total long-term liability | $ | (5,007,554 | ) | $ | (6,104,937 | ) | ||
As of December 31, 2014, 2013 and 2012, the amounts recognized in accumulated other comprehensive income, related to pension, health and education obligations consist of:
| 2014 | 2013 | 2012 | ||||||||||
| Other comprehensive income | ||||||||||||
| Actuarial income (loss) | ||||||||||||
| Pension | $ | (458,860 | ) | $ | (1,353,502 | ) | $ | (1,858,266 | ) | |||
| Health care | (2,034,211 | ) | (2,671,715 | ) | (3,239,842 | ) | ||||||
| Education | (450,216 | ) | (215,252 | ) | (213,816 | ) | ||||||
| Bonds | 1,244,440 | 1,124,927 | 1,102,706 | |||||||||
| Severance | 4,553 | 3,811 | 5,382 | |||||||||
| Total other comprehensive income (loss) | (1,694,294 | ) | (3,111,731 | ) | (4,203,836 | ) | ||||||
| Deferred income tax effect | 532,896 | 1,026,871 | 1,387,266 | |||||||||
| Total | $ | (1,161,398 | ) | $ | (2,084,860 | ) | $ | (2,816,570 | ) | |||
Ecopetrol S.A. and Subsidiaries
Notes to the Consolidated Financial Statements
Years ended December 31, 2014, 2013 and 2012
(Expressed in millions of Colombian pesos)
The significant variation in other comprehensive income from 2013 to 2014 relates to Health and Pension plans due to changes in actuarial assumptions since the last actuarial valuation.
The Company expects the following amounts in other comprehensive income to be recognized as components of net periodic pension cost during 2015:
| Amortization Gain (loss) | ||||
| Health Care | $ | (81,021 | ) | |
| Education | (33,377 | ) | ||
| Bonds | 99,793 | |||
| Severance | 371 | |||
| Total | $ | (14,234 | ) | |
As of December 31, 2014 and 2013, the amounts of gain (loss) in the year and accumulated related to pension, health, education bonds and severance consist of:
| 2014 | 2013 | |||||||||||||||
| Gain (loss) in the year | Cumulative Gain (loss) | Gain (loss) in the year | Cumulative gain (loss) | |||||||||||||
| Pension | $ | 883,652 | $ | (458,860 | ) | $ | 473,159 | $ | (1,353,502 | ) | ||||||
| Health care | 474,994 | (2,034,211 | ) | 434,236 | (2,671,715 | ) | ||||||||||
| Education | (243,421 | ) | (450,216 | ) | (9,437 | ) | (215,252 | ) | ||||||||
| Bonds | 220,265 | 1,244,440 | (94,583 | ) | 1,124,927 | |||||||||||
| Severance | $ | 742 | $ | 4,553 | $ | (1,167 | ) | $ | 3,811 | |||||||
The economic assumptions adopted are shown below in nominal terms. Those assumptions were used in determining the actuarial present value of the pension obligation and the projected pension obligations for the plans:
| 2014 | 2013 | |||||||||||||||||||||||||||||||||||||||
| Pension | Health | Education | Bonds | Severance | Pension | Health | Education | Bonds | Severance | |||||||||||||||||||||||||||||||
| Discount rate | 7.50 | % | 7.50 | % | 6.75 | % | 7.00 | % | 7.50 | % | 7.00 | % | 7.00 | % | 6.50 | % | 6.25 | % | 6.75 | % | ||||||||||||||||||||
| Rate of compensation increase | 4.25 | % | N/A | N/A | N/A | 4.25 | % | 4.50 | % | N/A | N/A | N/A | 4.50 | % | ||||||||||||||||||||||||||
| Rate of pension and bonds increase | 3.00 | % | N/A | N/A | 3.00 | % | N/A | 3.00 | % | N/A | N/A | 3.00 | % | N/A | ||||||||||||||||||||||||||
| Cost trend rate | N/A | 9.60 | % | 9.40 | % | N/A | N/A | N/A | 10.40 | % | 7.50 | % | N/A | N/A | ||||||||||||||||||||||||||
| Expected rate of return | 6.00 | % | N/A | N/A | 6.00 | % | N/A | 5.50 | % | N/A | N/A | 5.50 | % | N/A | ||||||||||||||||||||||||||
| Mortality table | * | * | * | * | * | * | * | * | * | * | ||||||||||||||||||||||||||||||
* Colombian Mortality Table ISS, male and female, 2005-2008.
The actuarial assumptions of the Health Plan have changed since the last actuarial valuation as of December 31, 2013. In 2013 we used a health cost trend rate starting at 10.40% and grading down to general inflation +1% over 9 years. In 2014, trend rate starts at 9.60% and grades down to inflation + 1% in 10 years, since the most recent analyses by the health department shows a decrease tendency related to costs control initiatives from management.
Regarding the education plans, in 2014; the cost trend rate started at 9.4% and grades down to inflation +1% in 9 years; in 2013, we used a cost trend rate starting at 7.5% and grading down to general inflation +1% over 7 years.
The 2014 and 2013 pension bond liability was calculated assuming that if a retired participant had not claimed his bond there was a likelihood that we would never claim it of: a) 100 % after 3 years and b) 0% for less than 3 years.
Estimated future benefit payments
The benefit payments, which reflect expected future service, as appropriate, are expected to be paid as follows:
| Period | Pension Benefits | Health Care benefits | Education benefits | Pension Bonds | Severance Plan | |||||||||||||||
| 2015 | $ | 715,455 | $ | 241,141 | $ | 78,771 | $ | 32,927 | $ | 1,349 | ||||||||||
| 2016 | 731,772 | 259,547 | 83,403 | 6,171 | 62 | |||||||||||||||
| 2017 | 750,301 | 276,709 | 84,737 | 17,415 | 67 | |||||||||||||||
| 2018 | 768,747 | 295,414 | 83,734 | 25,933 | 73 | |||||||||||||||
| 2019 | 786,807 | 309,855 | 80,935 | 28,737 | 110 | |||||||||||||||
| Years 2020 – 2024 | $ | 4,191,082 | $ | 1,725,029 | $ | 326,330 | $ | 226,682 | $ | 931 | ||||||||||
Ecopetrol S.A. and Subsidiaries
Notes to the Consolidated Financial Statements
Years ended December 31, 2014, 2013 and 2012
(Expressed in millions of Colombian pesos)
All of the benefits estimated in the table above are to be paid from plan assets. The Company does not have any insurance policies that are intended to cover benefits that plan participants are to receive in the future.
Furthermore, the Company does not intend to contribute to the fund in the upcoming fiscal year. Management believes that the plan assets will provide for a sufficient return to cover any payments that are necessary to be made in the upcoming year.
Assumed health care cost trend rates have an effect on the amounts reported for the health care plans. A one percentage point change in assumed health care cost trend rates would have the following effects:
| 1% Percentage Point | ||||||||
| Increase | Decrease | |||||||
| Effect on total of service and interest cost components | $ | 63,501 | $ | (51,238 | ) | |||
| Effect on postretirement benefit obligation | $ | 650,388 | $ | (554,518 | ) | |||
The discount rate is a critical assumption on the actuarial calculation. The effect of variations in the projected benefit obligation by plan is as follows:
| % point variation | Increase | Decrease | ||||||||||
| Pension plan | 0.5 | % | $ | (579,801 | ) | $ | 638,313 | |||||
| Medical plan | 0.5 | % | (295,149 | ) | 329,499 | |||||||
| Education plan | 0.5 | % | (18,832 | ) | 19,812 | |||||||
| Pension Bonds plan | 0.5 | % | (31,613 | ) | 33,997 | |||||||
| Severance plan | 0.5 | % | $ | (149 | ) | $ | 157 | |||||
Plan assets
Medical, Education and Severance plans are unfunded. Pension and pension bonds plans are covered by assets in five trust funds with the following investment allocation:
| Investment | 2014 | 2013 | ||||||||||||||
| Colombian Government treasury bonds (TES) | $ | 4,298,278 | 37 | % | $ | 4,311,575 | 38 | % | ||||||||
| Non-governmental entity bonds | 3,591,046 | 30 | % | 3,567,065 | 31 | % | ||||||||||
| Other securities in COP | 2,094,568 | 18 | % | 2,038,017 | 18 | % | ||||||||||
| Other bonds | 825,970 | 7 | % | 864,917 | 8 | % | ||||||||||
| Other securities in foreign currency | 480,712 | 4 | % | 389,416 | 3 | % | ||||||||||
| Foreign countries government treasury bonds | 230,772 | 2 | % | 196,404 | 1 | % | ||||||||||
| Variable yield investments and other | 210,505 | 2 | % | 82,948 | 1 | % | ||||||||||
| Total | $ | 11,731,851 | 100 | % | $ | 11,450,342 | 100 | % | ||||||||
The plan assets do not contain any shares of stock of Ecopetrol or any of its related parties. However it includes bonds issued by the Company, representing 1.0% of fund investments. There is no significant risk concentrations within the plan assets.
The fair value of plan asset is calculated using quoted market prices in active markets. The company obtains these quoted prices from renowned trustworthy financial data providers in Colombia or abroad depending on the investment. For those portfolio items not having a quoted price the Company uses an income approach technique capturing observable market data. Our fair value measurements do not use any unobservable inputs for significant valuations.
Decree 1861 of 2012 establishes the investment regime for trust funds guaranteeing pension plans of governmental entities, whose precepts are intended to bear a moderate risk. Assets fund investment decisions are made accordingly, following, among other, the following restrictions:
Ecopetrol S.A. and Subsidiaries
Notes to the Consolidated Financial Statements
Years ended December 31, 2014, 2013 and 2012
(Expressed in millions of Colombian pesos)
For U.S. GAAP, Accounting for Contingencies (ASC 450), provides guidance for recording contingencies. Under ASC 450, there are three levels of assessment of contingent events – probable, reasonably possible and remote. The term probable in ASC 450 is defined as “the future event or events that are likely to occur”. The term reasonably possible is defined as “the chance of the future event or events occurring is more than remote but less than likely”. While the term remote is defined as “the chance of the future event or events occurring is slight”.
Under ASC 450, an estimated loss related to a contingent event shall be accrued by a charge to income if both of the following conditions are met:
The amount recorded is an estimate of the amount of loss at the date of the financial statements. If the contingent event is evaluated to be reasonably possible, no provision for the contingent event may be made, but disclosure of the event is required with amount of loss that is reasonably possible.
As a result of the difference in the definition of “probable” between Colombian Government Entity GAAP and U.S. GAAP, and the general interpretation of the definition in practice in Colombia, there is a difference in the amount of the provision for legal proceedings.
Under Colombian Government Entity GAAP, it is required to recognize additional provisions regarding to capitalize the pension assets. According to Colombian actuarial assumptions, we estimate the difference between pension assets and liabilities, and accrued a provision due to capitalize the five trusts funds during 2014. Under U.S. GAAP, the estimates is write-off due to the explanation showed at note vi. Employee benefit plans.
The effects of these adjustments in the reconciliation of income were $273,446; $802,341 and $141,755 in December 2014, 2013 and 2012, respectively.
The effects of these adjustments in the reconciliation of consolidated shareholders´ equity were $1,568,010 and 1,294,564 in December 2014 and 2013, respectively.
Under Colombian government Entity GAAP, accounts receivable and payable are recognized at amortized cost, represented by any uncollected or unpaid balances, regardless if such balances are due within the year or not. For U.S. GAAP purposes, the Company measures the long-term balances at present value by discounting future cash flows at the appropriate discount rate. Such balance is amortized using the effective interest method.
The estimated discount rate for long-term liability is based on the Colombian Government Treasury bonds as it was considered that the Company has a similar credit risk.
As a result of the measurement of the Equity Tax liability and after minor adjustments recognized by Ecopetrol and its subsidiaries in the year 2014, 2013 and 2012, an adjustment for $(1,157) $39,029, and $(99,188), respectively was recorded.
Under U.S. GAAP a valuation allowance is provided for deferred tax assets to the extent that it is more likely than not that they will not be realized.
Under Colombian Government Entity GAAP, deferred income taxes are calculated using the current statutory tax rate. Under U.S. GAAP, deferred income taxes are calculated based on rates and tax laws enacted at the reporting date considering the future tax rate that will apply when the deferred income tax difference will be realized.
All of the income tax effects in the U.S. GAAP reconciliation are the tax effect of pretax adjustments, and none relate to differences between the accounting for income tax standards.
Ecopetrol S.A. and Subsidiaries
Notes to the Consolidated Financial Statements
Years ended December 31, 2014, 2013 and 2012
(Expressed in millions of Colombian pesos)
The Company and its subsidiaries file separate income tax returns since tax regulations do not allow consolidated income tax returns. There are no requirements to file tax returns by segments. Tax returns for each legal entity are required. Tax rate of Refineria de Cartagena S.A. Bioenergy and Comai is 15% because it has tax benefit for are located to the free trade zone until 2023, 2025 and 2021, respectively. The tax savings for the last three years has not been significant.
Taxable loss carry forwards will be deductible in future years, depend on countries’ tax regulations. As of December 31, 2014, Ecopetrol’s subsidiaries had accumulated tax loss carry-forwards and excesses of presumptive income generated in previous years, as follows:
| Expiration date | Loss carry-forwards | Deferred Income Tax | Excess of presumed income | Deferred Income Tax | ||||||||||||
| 2015 | $ | 61 ,424 | $ | 9,276 | $ | $ | ||||||||||
| 2016 | 38,488 | 5,868 | ||||||||||||||
| 2017 | 34,876 | 5,431 | ||||||||||||||
| 2018 | 16,600 | 2,615 | ||||||||||||||
| 2019 | 25,896 | 3,633 | ||||||||||||||
| 2020 | 2,143 | 528 | ||||||||||||||
| With no Maximum expiry date | 1,476,566 | 527,794 | ||||||||||||||
| $ | 179,428 | $ | 27,351 | $ | 1,476,566 | $ | 527,794 | |||||||||
Tax reform
The Colombian Congress adopted Law 1739 of 2014, which introduces significant reforms to the Colombian tax system, such as:
The Wealth Tax – The wealth tax would apply for 2015 through 2017 to domestic and foreign companies that hold any wealth in Colombia. The progressive rates for wealth tax are: 1.15% for 2015, 1% for 2016, and 0.4% for 2017. For individual tax payers would range from 0.20% to 1.5% until 2018.
CREE surtax - Impose a new CREE surtax for corporations and entities whose net income in fiscal years 2015 to 2018 is equal or greater than COP $800 million, with the CREE surtax rate imposed at a rate of 5% for 2015, 6% for 2016, 8% for 2017 and 9% for 2018.
Therefore, the rate of the income tax for Colombia-source income of foreign corporations and entities not attributable to a permanent establishment or branch in Colombia, according to the following schedule: 39% in 2015; 40% in 2016; 42% in 2017; 43% in 2018 and 34% since 2019 onwards.
The following information regarding income taxes has been prepared under U.S. GAAP:
Income Taxes
Total income taxes for the years ended December 31, 2014, 2013 and 2012 were comprised as follows:
| 2014 | 2013 | 2012 | ||||||||||
| Income tax expense | $ | 6,058,681 | $ | 8,774,819 | $ | 7,525,988 | ||||||
| Income tax effects based on items of other comprehensive income: | ||||||||||||
| Pension plan liability | 494,000 | 360,395 | 28,321 | |||||||||
| Available-for-sale securities | 1,000 | (47,894 | ) | (27,721 | ) | |||||||
| $ | 6,553,681 | $ | 9,087,320 | $ | 7,526,588 | |||||||
Income tax expense attributable to income consists of:
| 2014 | 2013 | 2012 | ||||||||||
| Current provision | $ | 6,731,655 | $ | 8,291,571 | $ | 7,095,874 | ||||||
| Deferred tax | (672,974 | ) | 483,248 | 430,114 | ||||||||
| $ | 6,058,681 | $ | 8,774,819 | $ | 7,525,988 | |||||||
In 2014, 2013 and 2012, there are foreign subsidiaries that do not pay income taxes and therefore do not generate income tax expense or deferred tax effects. Those entities that do pay taxes and are currently not generating taxable income will record a valuation allowance against any deferred tax asset recorded.
During 2014, the foreign pretax income of Hocol Petroleum Limited, Andean and Ecopetrol Pipelines International Limited, where reclassified to domestic pretax income due to decree 3026 of 2013. Those investment vehicles are considered local companies for tax purposes, even if there are located outside of Colombia
Ecopetrol S.A. and Subsidiaries
Notes to the Consolidated Financial Statements
Years ended December 31, 2014, 2013 and 2012
(Expressed in millions of Colombian pesos)
Amount of foreign and domestic pretax income:
| 2014 | 2013 | 2012 | ||||||||||
| Domestic pretax income | $ | 15,009,647 | $ | 22,692,204 | $ | 21,083,067 | ||||||
| Foreign pretax income | (1,447,875 | ) | 569,160 | 1,330,415 | ||||||||
| Income before income tax | $ | 13,561,772 | $ | 23,261,364 | $ | 22,413,482 | ||||||
Unremitted earnings accumulated as of December 31, 2014 of certain international subsidiaries totaling $1,210,345 are permanently invested. No deferred tax liability was recognized for the remittance of such earnings. The income tax liability that might be incurred if such earnings were remitted to Colombia is not practicable to estimate.
Tax Rate Reconciliation
Income tax expense attributable to income was $6,058,681 $8,774,819, and $7,525,988, for the years ended December 31, 2014, 2013, and 2012 respectively, and differed from the amounts computed by applying the statutory income tax rate for Colombian entities that is 34% in 2014-2013 and 33% in 2012 to pretax income from continuing operations as follows:
| 2014 | 2013 | 2012 | ||||||||||
| Statutory income tax | 34.00 | % | 34.00 | % | 33.00 | % | ||||||
| Non – taxable income (exempt domestic dividend income) | 1.83 | % | (0.36 | )% | 0.04 | % | ||||||
| Non – deductible expenses | 2.45 | % | 3.03 | % | 0.28 | % | ||||||
| Others | 3.44 | % | 0.62 | % | (0.15 | )% | ||||||
| Other exempt income | - | % | - | % | (0.30 | )% | ||||||
| Income taxable at other tax rate | 4.68 | % | 0.47 | % | 0.60 | % | ||||||
| Changes in tax rate | (1.72 | )% | (0.03 | )% | 0.11 | % | ||||||
| Effective income tax under U.S. GAAP | 44.67 | % | 37.72 | % | 33.58 | % | ||||||
Ecopetrol has no unrecognized tax benefits. The taxes years open to the taxing authority’s reviews by major components are as follows:
The Company is subject to income taxation in many jurisdictions around the world. Unrecognized tax benefits reflect the difference between positions taken or expected to be taken on income tax returns and the amounts recognized in the financial statements.
We recognize interest accrued related to an underpayment of income taxes in interest expense. Penalties, if recognized, would be presented as a component of other expense.
Deferred Taxes
The significant components of deferred income tax expense attributable to income for the years ended December 31, 2014, 2013 and 2012 are as follows:
Ecopetrol S.A. and Subsidiaries
Notes to the Consolidated Financial Statements
Years ended December 31, 2014, 2013 and 2012
(Expressed in millions of Colombian pesos)
| 2014 | 2013 | 2012 | ||||||||||
| Deferred income tax expense (exclusive of the effects of other components below): | ||||||||||||
| Accounts payable | $ | 51,161 | $ | (64,485,00 | ) | $ | 100,511 | |||||
| Inventories | (100,447 | ) | 314 | (5,967 | ) | |||||||
| Property, plant and equipment, principally due to DD&A | (1,090,163 | ) | (123,172 | ) | 78,201 | |||||||
| Deferred charges | (15,804 | ) | (13,357 | ) | (11,185 | ) | ||||||
| Prepaid expenses | (3,031 | ) | 161 | (75 | ) | |||||||
| Capital lease asset | (52,268 | ) | (43,086 | ) | 83,829 | |||||||
| Monetary correction and other | 29,055 | 84,370 | (275,294 | ) | ||||||||
| DD&A and inflation adjustments | 777,499 | 191,961 | 310,351 | |||||||||
| Investment | (179,334 | ) | (236,500 | ) | (352,018 | ) | ||||||
| Direct finance lease | 12,482 | 44,847 | (39,922 | ) | ||||||||
| Estimated liabilities and provisions | (324,892 | ) | (101,425 | ) | (73,955 | ) | ||||||
| Accounts and notes receivable | 59,391 | (80,492 | ) | (6,194 | ) | |||||||
| Carry forward loss | (125,181 | ) | (914,601 | ) | (159,549 | ) | ||||||
| Pension and benefits obligations | 407,674 | 363,630 | (56,941 | ) | ||||||||
| Natural and environmental resources capitalized expenses | (578,758 | ) | 667,635 | 381,072 | ||||||||
| Valuation allowance | 450,979 | 304,623 | 604,394 | |||||||||
| Additional tax discount on the acquisition of productive assets according to ASC 740 (1) | 9,226 | (15,114 | ) | 534 | ||||||||
| Excess in presumptive income tax | 22,055 | 641,773 | (373,085 | ) | ||||||||
| Other | 388,916 | (88,861 | ) | 37,676 | ||||||||
| Amortization of actuarial loss recorded in OCI | (493,975 | ) | (360,395 | ) | 28,321 | |||||||
| Unrealized loss in available for sale securities | (989 | ) | 47,894 | (27,721 | ) | |||||||
| Amortization of fiscal goodwill according to (ASC 830) | 83,430 | 177,527 | 187,132 | |||||||||
| $ | (672,974 | ) | $ | 483,247 | $ | 430,115 | ||||||
The tax effects of temporary differences that give rise to significant portions of the deferred tax assets and deferred tax liabilities at December 31, 2014, 2013 and 2012 are presented below:
| 2014 | 2013 | 2012 | ||||||||||
| Deferred income tax assets and liabilities | ||||||||||||
| Deferred income tax assets: | ||||||||||||
| Inventories | $ | 140,019 | $ | 39,572 | $ | 39,886 | ||||||
| Investments | 440,711 | 195,808 | 1,390,880 | |||||||||
| Accounts and notes receivable | 32,281 | 97,920 | 6,896 | |||||||||
| Deferred income | - | - | - | |||||||||
| Property, plant and equipment, principally due to DD&A | 4,346,543 | 3,263,018 | 2,991,078 | |||||||||
| Deferred charges | 57,510 | 41,706 | 28,348 | |||||||||
| Prepaid expenses | 3,039 | 9 | 169 | |||||||||
| Financial obligation, principally due to capitalized leasing | 158,150 | 105,882 | 62,797 | |||||||||
| Pension obligations | 332,851 | 740,525 | 1,104,155 | |||||||||
| Accounts payable | 183,400 | 234,561 | 170,076 | |||||||||
| Carry forward loss (1) | 1,373,126 | 1,247,945 | 333,344 | |||||||||
| Excess in presumptive income tax (2) | 27,351 | 49,406 | 691,179 | |||||||||
| Other | 10,365 | (7,813 | ) | 1,295 | ||||||||
| Amortization of fiscal goodwill according to ASC 830 | 112,573 | 206,734 | 385,800 | |||||||||
| Estimated liabilities and provisions | 1,345,086 | 1,020,194 | 918,770 | |||||||||
| Total gross deferred income tax assets | 8,563,005 | 7,235,467 | 8,124,673 | |||||||||
| Less valuation allowance (3) | (1,582,215 | ) | (1,131,236 | ) | (826,612 | ) | ||||||
| Deferred income tax assets | 6,980,790 | 6,104,231 | 7,298,061 | |||||||||
| Accounts and notes receivable | 4,284 | 10,532 | - | |||||||||
| Natural and environmental properties due to the difference between the methods of amortization | 2,004,034 | 2,582,791 | 1,915,156 | |||||||||
| Monetary correction and other | 534,634 | 590,158 | 505,788 | |||||||||
| DD&A and inflation adjustments | 2,160,509 | 1,383,011 | 1,191,049 | |||||||||
| Investments | 469,479 | 403,910 | 1,835,482 | |||||||||
| Cash and equivalents | 84,579 | - | - | |||||||||
| Direct finance lease | 57,329 | 44,847 | - | |||||||||
| Deferred income tax liabilities | 5,314,848 | 5,015,249 | 5,447,475 | |||||||||
| Net deferred income tax assets | $ | 1,665,942 | $ | 1,088,982 | $ | 1,850,586 | ||||||
Ecopetrol S.A. and Subsidiaries
Notes to the Consolidated Financial Statements
Years ended December 31, 2014, 2013 and 2012
(Expressed in millions of Colombian pesos)
The realization of the net deferred tax assets detailed above is expected given that it is more likely than not that the results of future operations will generate sufficient taxable income to realize the deferred tax. For those which realization are not sure or have some doubts, a valuation allowances have been provided.
Valuation allowance
| 2014 | Variation | 2013 | ||||||||||
| Ecopetrol do Brazil | $ | 305,875 | $ | (340 | ) | $ | 306,215 | |||||
| Ecopetrol del Peru | 59,489 | 2,266 | 57,223 | |||||||||
| Ecopetrol Germany | 77,519 | 77,519 | - | |||||||||
| Bioenergy | 463 | - | 463 | |||||||||
| Ecopetrol America Inc. | 1,138,869 | 392,869 | 746,000 | |||||||||
| Refineria de Cartagena | - | (21,335 | ) | 21,335 | ||||||||
| $ | 1,582,215 | $ | 450,979 | $ | 1,131,236 | |||||||
Under Colombian Government Entity GAAP, the Company recognizes receivables from or payables to partners and to pipeline companies based on the cost of the inventory.
For U.S. GAAP purposes, the Company utilizes the entitlement method of accounting for over and under positions by which the amount of crude oil sold is based on its shared interest in the properties, and revenue is recognized based on market prices. The pipeline imbalances determined through volume allocation are recorded as either receivables or payables as per ASC 932-10-S99-5 valued at selling prices.
The Company’s crude oil under balance position at December 31, 2014 was $114,226 and at December 31, 2013 was $119,010 equivalent to 1,281,022 and 662,545 barrels, respectively.
During 2013, in the U.S. GAAP reconciliation process we did not reversed the previously adjustment for over & under lifting. As a result, the amount reported as an account receivable in 2013 was increased on $77,031. According to ASC 250, we analyzed the effect of this error and conclude it did not have a material effect on previously issued financial statements. This adjustment was corrected in our 2014 financial statements.
Under U.S. GAAP, the related cost of sale in the reconciliation of net income for over and under deliveries transactions described at a.1 above amounted to $(29,522), $296,317 and $208,644 during 2014, 2013 and 2012, respectively, in comparison with the amount recognized under Colombian Government Entity GAAP.
The Company the sales transactions where it transports crude oil, from the supplier to the customer, using its pipelines. For U.S. GAAP purposes, when price is fixed, there are no changes made to the product and the Company has no physical inventory loss risk, among other criteria, the Company records such sales on a net basis. Under Colombian Government Entity GAAP, such crude oil sales are recognized gross.
The Colombian Government Entity GAAP consolidated financial statements were adjusted for inflation based on the variation in the IPC (Colombia’s equivalent to the consumer price index in the United States) for middle income-earners from January 1, 1992 to December 31, 2001 for Ecopetrol S.A. and from January 1, 1992 to December 31, 2006 for Oleoducto de Colombia S.A. (ODC), Hocol S.A., Oleoducto Central S.A. (Ocensa), Equion, and Reficar S.A. The adjustment was applied monthly to non-monetary assets, equity (except for the valuation surplus) and memorandum accounts.
Under U.S. GAAP, the aforementioned adjustments under Colombian Government Entity GAAP are not applicable and have been reversed.
Ecopetrol S.A. and Subsidiaries
Notes to the Consolidated Financial Statements
Years ended December 31, 2014, 2013 and 2012
(Expressed in millions of Colombian pesos)
Under Colombian Government Entity GAAP, inventories are valued at the lower of average cost or sale price. Under U.S. GAAP, inventories are valued at the lower of average cost or market value, the determination of which can be made using several different methods acceptable under U.S. GAAP. An adjustment has been recorded to reflect the difference in the method used to determine the valuation of inventories that arises from using sale price instead of market value, as defined by U.S. GAAP. Inventories are also affected by the effect of adjustments to cost of sales included in this reconciliation. These adjustments are related to depreciation, capitalized expenses in property, plant and equipment, asset retirement cost and impairment of long-lived assets.
The effects of this adjustment (loss) gain in the reconciliation of income were $(9,124), $30,289 and $(16,699) in December 2014, 2013 and 2012, respectively.
The effects of these adjustments in the reconciliation of equity and the corresponding effect in inventory were $(12,410) and $(18,410) at December 31, 2014 and 2013, respectively.
Under both Colombian Government Entity GAAP and U.S. GAAP there are, lessee accounting for capital leases and operating leases. However, the tests used to determine if a lease is a capital or an operating lease differs between Colombian Government Entity GAAP and U.S. GAAP. In applying the tests in accordance with Colombian Government Entity GAAP, the Company has determined that all leases are operating leases. Under U.S. GAAP some of these leases should be accounted for as capital leases in accordance with ASC 840-10. As a result, adjustments were recorded to reflect the related assets and liabilities, and to recognize interest expense and de-recognize operating expenses associated with the lease payments.
Embedded Leasing
Under Colombian Government Entity GAAP, there is no requirement to identify whether the arrangements or contracts contain leases.
Under U.S. GAAP, an arrangement contains a lease if both of the following criteria are met:
Under U.S. GAAP, if the arrangement contains a lease, ASC 840 is applied by both purchaser and supplier for recognition, measurement, classification and disclosure purposes.
Build, Operate, Maintain and Transfer (BOMT)
| Future Payments | Ecogas (1) - ECP | |||||||
| Year | USD (million) | Pesos | ||||||
| 2015 | 17.0 | 40,641 | ||||||
| 2016 | 16.2 | 38,825 | ||||||
| 2017 | 10.4 | 24,825 | ||||||
| Payments after 2018 | - | - | ||||||
| $ | 43.6 | $ | 104,290 | |||||
Ecopetrol S.A. and Subsidiaries
Notes to the Consolidated Financial Statements
Years ended December 31, 2014, 2013 and 2012
(Expressed in millions of Colombian pesos)
| Future Payments | Termo ERB (2) - ODL | Termo Servicios (2) - ODL | Termo Proyectos (2) - ODL | |||||||||||||||||||||
| Year | USD (million) | Pesos | USD (million) | Pesos | USD (million) | Pesos | ||||||||||||||||||
| 2015 | 1.85 | 4,420.48 | 1.83 | 4,374.15 | 1.84 | 4,400.31 | ||||||||||||||||||
| 2016 | 1.90 | �� | 4,553.10 | 1.88 | 4,505.37 | 1.89 | 4,532.32 | |||||||||||||||||
| 2017 | 1.96 | 4,689.69 | 1.94 | 4,640.54 | 1.95 | 4,668.29 | ||||||||||||||||||
| 2018 | 2.02 | 4,830.38 | 2.00 | 4,779.75 | 2.01 | 4,808.34 | ||||||||||||||||||
| Payments after 2019 | 4.95 | 11,841.97 | 5.44 | 13,021.94 | 6.58 | 15,752.85 | ||||||||||||||||||
| $ | 12.68 | $ | 30,335.63 | $ | 13.09 | $ | 31,321.75 | $ | 14.28 | $ | 34,162.09 | |||||||||||||
In 2010, we entered in a new BOMT, corresponding to the gas treatment plant located in the Dina-Tello field with an estimated value of construction US$28 million. This BOMT is accounted as capital lease in accordance with ASC 840 such as the contracts described previously, this contract had an original term of 8 years, ending in 2017.
Ecopetrol subscribed a contract with Unión Temporal Gas Gibraltar firm to advance the design, build, operation and maintenance of a treatment plant with 30 mpcd capacity. Likewise, we entered into a contract with Natural Gas E.S.P for marketing purposes. The Gibraltar gas processing plant is located between the cities of Toledo (Norte de Santander) and Cubará (Boyacá). This BOMT is accounted as a capital lease in accordance with ASC 840. This contract had original term of 15 years, ending in 2026.
Since 2012, the gas treatment plant located in Dina- Tello field, and the contracts with Unión Temporal Gas Gibraltar were recognized in our local financial statements, as a result of an internal consistency process between local and U.S. GAAP requirements.
|
Under Colombian Government Entity GAAP, property, plant and equipment are recorded at cost and are adjusted for inflation until 2001. The cost includes administrative expenses until 2004, financial expenses and exchange differences from foreign currency financing until the asset is placed in service. Normal disbursements for maintenance and repairs are charged to expense and those significant costs that improve efficiency or extend the useful life are capitalized. Under U.S. GAAP, cost includes expenditures until the asset is placed in service such as installation cost, freight, interest, retirement cost; construction cost and other direct expenses are capitalized, with exception of adjustment for inflation and foreign currency loss. For U.S. GAAP purposes, administrative expenses capitalized were eliminated from property, plant and equipment. In addition, a deferred income tax asset resulted from the application of the provisions of ASC 740-10,Accounting for Acquired Temporary Differences in Certain Purchase Transactions that are not Accounted for as Business Combinations, since the investment in real productive assets creates an additional tax deduction of 30% in 2010. Starting in January 2011, income tax deductions from investments in said asset are no longer be available.
The following table reflects the net changes in capitalized exploratory wells during 2014 and 2013. It does not include amounts that were capitalized and recorded as expenses during the same period under the successful efforts method.
| 2014 | 2013 | |||||||
| Opening balance at January 1 | $ | 2,353,822 | $ | 1,427,947 | ||||
| Additions to capitalized exploratory well costs | 960,641 | 1,456,994 | ||||||
| Reclassifications to wells, facilities and equipment based on the determination of proved reserves | (350,419 | ) | (136,747 | ) | ||||
| Capitalized exploratory well costs charged to expense* | (653,752 | ) | (394,372 | ) | ||||
| Retirement for sale due to declarations of commerciality | (917 | ) | - | |||||
| Conversion effect | 90,381 | - | ||||||
| Ending balance at December 31 | $ | 2,399,756 | $ | 2,353,822 | ||||
* Includes $126,427 and $110,327 of capitalized exploratory well costs at December 31, 2014 and 2013 respectively, which were declared as dry wells during 2015 and 2014 respectively.
Ecopetrol S.A. and Subsidiaries
Notes to the Consolidated Financial Statements
Years ended December 31, 2014, 2013 and 2012
(Expressed in millions of Colombian pesos)
Accounting For Suspended Exploratory Wells
The following table represents a classification by ages for constructions in progress based on the drilling completion date and the number of projects that are in ongoing drilling for a period exceeding one year as from the completion date.
| 2014 | 2013 | |||||||
| Between 1 and 3 years (a) | $ | 416,687 | $ | 400,276 | ||||
| Between 3 and 5 years (b) | 25,703 | 53,028 | ||||||
| More than 5 years (c) | 41,622 | 33,521 | ||||||
| Total suspended exploratory wells | $ | 484,011 | $ | 486,825 | ||||
| No. of projects exceeding 1 year | 36 | 26 | ||||||
Under Colombian Government Entity GAAP, all interest paid net of interest income is subject to capitalization regardless of the utilization of the funds. Exchange rate differential is also capitalized as part of the asset.The Company´s assessment of the methodology followed to determine the capitalization amount under U.S. GAAP considered more detailed information available to estimate the interest to be capitalized.
Previous to 2010, the calculations were made based on the average monthly disbursements, as an improvement, the Company obtained a detail of the assets associated to the debt and was able to apply the analysis and calculations based on each project, providing further detail of interest capitalized. The impact was recognized during 2010 as it was considered a change in an accounting estimate per ASC 250-10-45-17 and 18, Change in Accounting Estimates.
The total interest capitalized during 2014 under Colombian Government Entity GAAP was $687,371 and the total interest capitalized under U.S. GAAP was $414,464. The effect of this adjustment in the reconciliation of income was $272,907. The total interest capitalized during 2013 under Colombian Government Entity GAAP was $637,043 and the total interest capitalized under U.S. GAAP was $156,530. The effect of this adjustment in the reconciliation of income was $480,513. The total interest capitalized during 2012 under Colombian Government Entity GAAP was $761,199 and the total interest capitalized under U.S. GAAP was $153,999. The effect of this adjustment in the reconciliation of income was $607,200.
Under Colombian Government Entity GAAP, technical appraisals for property, plant and equipment are performed at least every three years. If the technical study is higher or lower that the carrying value, the difference is recorded as an increase or decrease of equity. If the technical study reduces the valuation surplus below zero, the negative difference is recorded as expenses in results of operations. Under U.S. GAAP, in accordance with ASC 360-10, Property, Plant, and Equipment - Impairment or Disposal of Long-Lived Assets (ASC 360-10), property, plant, and equipment are reviewed for impairment whenever events or changes in circumstances indicate that the carrying amount of an asset may not be recoverable. If circumstances require a long-lived asset to be tested for possible impairment, the Company first compares undiscounted cash flows expected to be generated by the asset to the carrying value of the asset. If the carrying value of the long-lived asset is not recoverable on an undiscounted cash flow basis, impairment is recognized to the extent that the carrying value exceeds its fair value. Until 2013, fair value was determined through discounted cash flow models computed by applying unweighted arithmetic average of the first-day-of-the-month for oil and gas price to year-end quantities of estimated net proved reserves. In 2014, fair value was determined through discounted cash flow models computes applying market prices as a result of decline in the international oil prices. For U.S. GAAP purposes, the Company reviewed property, plant and equipment for impairment as of December 31, 2014, 2013, 2012, and recorded impairment losses when required.
For U.S. GAAP purposes, the Company recorded an impairment loss of $402,247 in 2014 related mainly to the decline in the international oil prices and the decrease of reserve estimate revision. In 2013 the Company recognized an impairment loss of $45,620 related to the decrease of reserves estimate revision. In 2012, the company recognized an impairment loss of $276,145, $80,242 corresponding to production fields and $195,903 related to pipeline transportation systems.
Ecopetrol S.A. and Subsidiaries
Notes to the Consolidated Financial Statements
Years ended December 31, 2014, 2013 and 2012
(Expressed in millions of Colombian pesos)
Under Colombian Government Entity GAAP valuation surplus of property, plant and equipment and public accounting effect correspond to the difference between net book value and the market value for real estate or the current value in use for property, plant and equipment, determined by specialists. These accounts are reflected as valuations and as valuation surplus from reappraisals of assets and the public accounting effect (components of equity) in the Company’s consolidated balances sheets. The last valuation was in December 2013. Technical appraisals are valid for three years.
Under U.S. GAAP, the valuation surplus of assets and the public accounting effect are not permitted.
Under Colombian Government Entity GAAP, all tangible equipment, including those used in crude oil and natural gas, exploration and development, are depreciated on a straight-line basis over the related estimated useful lives. Intangible crude oil and natural gas assets reflected on the Company’s consolidated balance sheets as natural and environmental resources are depleted on a units-of-production basis.
In the case of HOCOL, all tangible and intangible assets used in the production of crude and natural gas production are depreciated or depleted using the units of production method, using proved developed reserves, except for the pipeline assets which are depreciated on a straight-line basis over the related estimated useful life (18, 23 and 40 years). For BIOENERGY, in relation to agricultural sugarcane crops, the company develops the plantations that it will use as base for the production of Bioethanol. The cost of the agricultural plantations will be amortized during productive cycle time frame, using a method at recognized technical value.
Under U.S. GAAP, all assets, including tangible equipment, used in crude oil and natural gas producing activities are required to be depreciated or depleted using a units-of-production method, using proved developed reserves calculated in accordance with SEC requirements. Therefore, an adjustment to net income per U.S. GAAP has been recorded to account for the difference in depreciation, depletion and amortization expense based on the above-described differences in the methods used. In addition, the financial statements reflect the amortization of those assets affected by the application of ASC 740-10, Accounting for Acquired Temporary Differences in Certain Purchase Transactions That Are Not Accounted for as Business Combinations. Therefore, an adjustment to net income per U.S. GAAP has been recorded to account for the difference in depreciation, depletion and amortization expense.
Under Colombian Government Entity GAAP, the Company updates annually the analysis of the estimated liability for future asset retirement obligations as of each balance sheet date. The liability is adjusted to the current value and an offsetting amount is recorded as an adjustment to the asset cost.
For purposes of U.S. GAAP reporting, the Company follows the provisions of Accounting Standards Codification ASC 410-20Asset Retirement Obligations. ASC 410-20 requires the Company to recognize a liability for the present value of all legal obligations associated with the retirement of tangible, long-lived assets as of the date when the legal obligation began and capitalize an equal amount as an asset retirement cost (asset). Each period the liability is accreted using the effective interest rate method. The accretion is included as an operating expense. The cost associated with the abandonment obligation, is included in the computation of depreciation, depletion and amortization.
An adjustment has been recorded in the consolidated financial statements to reflect accretion expense, and the related obligation and assets in accordance with ASC 410-20.
For Pipeline systems there is insufficient information to reasonably determine the timing and/or method of settlement for estimating the fair value of the asset retirement obligation. In these cases, the asset retirement obligation cost is considered indeterminate because there is no data or information that can be derived from past practice, industry practice, our intentions or the estimated economic life of the asset. Useful lives of most pipeline systems are primarily derived from available supply resources and ultimate consumption of those resources by end users. Variables can affect the remaining lives of the assets which preclude us from making a reasonable estimate of the asset retirement obligation.
Indeterminate asset retirement obligation costs will be recognized in the period in which sufficient information exists to allow us to reasonably estimate potential settlement dates(2015 - 14.4% and methods.
In addition to the aforementioned situation, it is not possible at this time to reasonably estimate the amount of any obligation for asset retirement obligation related to refineries. In addition, The Company believes there is not sufficient information available to estimate the fair value of the asset retirement obligation because the settlement date or the range of potential settlement dates have not been specified by others and information is not available to apply an expected present value technique.
The following table presents the changes in asset retirement obligations for 2014 and 2013 as is required by ASC 410-20.
Ecopetrol S.A. and Subsidiaries
Notes to the Consolidated Financial Statements
Years ended December 31, 2014, 2013 and 2012
(Expressed in millions of Colombian pesos)
| 2014 | 2013 | |||||||
| Balance at beginning of year | $ | 2,754,070 | $ | 2,219,651 | ||||
| Liabilities incurred in the current year | 168,669 | 25,097 | ||||||
| Revisions in estimated cash flows | 436,412 | 426,727 | ||||||
| Liabilities settled in the current period | (102,840 | ) | (94,950 | ) | ||||
| Accretion expense | 202,013 | 177,545 | ||||||
| Balance at end of year | $ | 3,458,324 | $ | 2,754,070 | ||||
At the end of association contracts that were signed prior to January 1, 2004, private companies are required to transfer, without cost, to Ecopetrol, all producing wells, facilities and other real estate and assets acquired in executing the contracts. Under Colombian Government Entity GAAP, the Company accounts for the receipt, using the relinquishing Company’s reported historical cost, by recording an increase to assets and equity. The assets are then depreciated in accordance with the Company’s previously disclosed accounting policies. For U.S. GAAP reporting purposes, these balances and their related impacts on accumulated depreciation, depletion and amortization, and cost of production have been removed from the financial statements, based on the fact that the cost of these assets is zero.
The adjustment to conform to U.S. GAAP in 2014 was a reduction in equity of $18,812 (original value of $151,387 net of $132,575 in accumulated depreciation or the assets received), holds materials of $1,062.
The adjustment to conform to U.S. GAAP in 2013 was a reduction in equity of $28,300 (original value of $149,923 net of $121,623 in accumulated depreciation or the assets received), holds materials of $1,068.
Under Colombian Government Entity GAAP, the Company recorded as reservoirs the contributions of the Nation represented by crude oil and natural gas reserves deriving from the reversion of concessions of oilfield areas in favor of the Nation, given before the effectiveness of Decree 1760 of 2003. Reserves were valued by means of the technical-economic model where the value per barrel resulted from the relation of the net present value obtained at a discount rate and the total proved reserves on the contribution date.
For U.S. GAAP purposes, these reversions were considered a transfer of assets between entities under common control. Ecopetrol, the entity that received the net assets, recognized the assets transferred at their carrying amounts in the accounts of the transferring entity at the date of transfer which was zero value. The unamortized amount reverted at December 31, 2014 and 2013 was $12,953 and $14,733 respectively. Since 2003 (creation of the Agencia Nacional de Hidrocarburos - ANH) there have not been reversals of concessions.
Under Colombian Government Entity GAAP, the borrowing costs correspond to interest paid, lender commissions and other costs related to the debt transactions, the exchange difference for the interest rate to be paid, the amortization of premiums and discounts in the placement of bonds and securities, and any income results earned on the temporary investment of such loans.
Under U.S. GAAP, the borrowing costs correspond to interest paid, lender commissions and other costs related to the debt transactions, the amortization of premiums and discounts in the placement of bonds and securities, should not offset interest expense with interest income, unless the financing transaction involves restricted, tax-exempt borrowings. Unlike Colombian Government Entity GAAP, the cost of borrowing does not include the exchange difference for the interest rate to be paid, unless such difference forms part of the negotiation of the interest rate for the transaction.
The total indebtedness cost incurred during 2014 under Colombian Government Entity GAAP was $652,489 and the total indebtedness cost incurred under U.S. GAAP was $647,358. The effects of this adjustment in the reconciliation of income were $5,131. The total indebtedness cost incurred during 2013 under Colombian Government Entity GAAP was $1,022,774 and the total indebtedness cost incurred under U.S. GAAP was $1,021,389. The effects of this adjustment in the reconciliation of income were $1,385. The total indebtedness cost incurred during 2012 under Colombian Government Entity GAAP was $820,821 and the total indebtedness cost incurred under U.S. GAAP was $820,856. The effects of this adjustment in the reconciliation of income were $36.
In 2013 an amount of $389,259 about the foreign exchange difference related to indebtedness cost on Reficar were capitalized. According to ASC 250, we analyzed the effect of this error and conclude it did not have a material effect on previously issued financial statements, we corrected it prospectively in our 2014 financial statements.
Ecopetrol S.A. and Subsidiaries
Notes to the Consolidated Financial Statements
Years ended December 31, 2014, 2013 and 2012
(Expressed in millions of Colombian pesos)
Under Colombian Government Entity GAAP, goodwill corresponds to the difference between the acquisition price and the book value of the acquired company and is recognized as an intangible asset. Separate intangibles are not identified under Colombian Government Entity GAAP nor are assets stepped up to fair values as a result of acquisitions; if the book value is higher than the acquisition price, the resulting difference is recorded as a gain. The amount recognized as goodwill is amortized during the period in which the Company expects to receive future benefits; in addition, it is subject to an annual impairment test.
Under U.S. GAAP ASC 350-20-35-3, we first assess qualitative factors to determine whether to perform the goodwill impairment test. If determined necessary, we use the two step impairment test in order to identify potential goodwill impairments and to measure the amount of impairment loss to be recognized. In the first step, we compare the fair value of a reporting unit with its carrying amount, including goodwill. If the carrying amount of a reporting unit exceeds its fair value of the reporting unit, goodwill of the reporting unit is considered impaired; thus, the second step of the impairment test is necessary.
The second step of the goodwill impairment test, used to measure the amount of impairment loss, compares the implied fair value of reporting unit goodwill with the carrying amount of that goodwill. If the carrying amount of reporting unit goodwill exceeds the implied fair value of that goodwill, an impairment loss shall be recognized in an amount equal to that excess. The loss recognized cannot exceed the carrying amount of goodwill.
After a goodwill impairment loss is recognized, the adjusted carrying amount of goodwill shall be its new accounting basis.
The following table shows, by Company, the goodwill balance as of December 31, 2014, 2013 and 2012, net of the amount of deferred income tax on goodwill and the translation adjustment:
| Company | Balance before impairment 2013 | Goodwill acquired during 2014 | Exchange rate effect | Deferred income tax | Balance before impairment 2014 | Accumulated impairment 2014 | Balance 2014 | |||||||||||||||||||||
| Propilco | $ | 687,337 | $ | - | $ | 87,405 | $ | (1,540 | ) | $ | 773,202 | $ | (327,183 | ) | $ | 446,019 | ||||||||||||
| Refineria de Cartagena S.A. | 725,900 | - | 175,419 | - | 901,319 | - | 901,319 | |||||||||||||||||||||
| Bioenergy | 8,993 | - | - | - | 8,993 | - | 8,993 | |||||||||||||||||||||
| Total | $ | 1,422,230 | $ | - | $ | 262,824 | $ | (1,540 | ) | $ | 1,683,514 | $ | (327,183 | ) | $ | 1,356,331 | ||||||||||||
| Company | Balance before impairment 2012 | Goodwill acquired during | Exchange rate effect | Deferred income tax | Balance before impairment 2013 | Accumulated impairment 2013 | Balance 2013 | |||||||||||||||||||||
| Propilco | $ | 636,018 | $ | - | $ | 52,859 | $ | (1,540 | ) | $ | 687,337 | $ | (327,183 | ) | $ | 360,154 | ||||||||||||
| Refineria de Cartagena S.A. | 666,150 | - | 59,750 | - | 725,900 | - | 725,900 | |||||||||||||||||||||
| Bioenergy | 8,993 | - | - | - | 8,993 | - | 8,993 | |||||||||||||||||||||
| Total | $ | 1,311,161 | $ | - | $ | 112,609 | $ | (1,540 | ) | $ | 1,422,230 | $ | (327,183 | ) | $ | 1,095,047 | ||||||||||||
Ecopetrol S.A. and Subsidiaries
Notes to the Consolidated Financial Statements
Years ended December 31, 2014, 2013 and 2012
(Expressed in millions of Colombian pesos)
Under Colombian Government Entity GAAP, the following table shows the amounts deductible for income tax purposes for 2014 and 2013.
| 2014 | ||||||||||||||||||||
| Company | Goodwill | Accumulated Amortization | Balance | Net Effect | Remaining time-years | |||||||||||||||
| Propilco | $ | 176,506 | $ | (78,133 | ) | $ | 98,373 | $ | 36,766 | 12.8 | ||||||||||
| Andean Chemicals Ltd | 205,541 | (89,267 | ) | 116,274 | 43,456 | 12.8 | ||||||||||||||
| IPL Enterprises | 880,127 | (269,462 | ) | 610,665 | 232,389 | 10.0 | ||||||||||||||
| Offshore International Group – “OIG” | 248,636 | (150,585 | ) | 98,050 | 116,092 | 9.0 | ||||||||||||||
| Hocol | 742,345 | (255,760 | ) | 486,585 | 182,783 | 11.0 | ||||||||||||||
| Equion | 629,375 | (311,141 | ) | 318,234 | 127,736 | 6.3 | ||||||||||||||
| Total | $ | 2,882,530 | $ | (1,154,348 | ) | $ | 1,728,182 | $ | 739,223 | |||||||||||
| 2013 | ||||||||||||||||||||
| Company | Goodwill | Accumulated Amortization | Balance | Net Effect | Remaining time-years | |||||||||||||||
| Propilco | $ | 176,506 | $ | (68,370 | ) | $ | 108,137 | $ | 36,766 | 13.8 | ||||||||||
| Andean Chemicals Ltd | 205,541 | (77,729 | ) | 127,812 | 43,456 | 13.8 | ||||||||||||||
| IPL Enterprises | 880,127 | (196,631 | ) | 683,496 | 232,389 | 11.0 | ||||||||||||||
| Offshore International Group – “OIG” | 536,079 | (194,631 | ) | 341,448 | 116,092 | 10.0 | ||||||||||||||
| Hocol | 742,345 | (204,747 | ) | 537,598 | 182,783 | 12.0 | ||||||||||||||
| Equion | 629,375 | (253,682 | ) | 375,693 | 127,736 | 7.3 | ||||||||||||||
| Total | $ | 3,169,973 | $ | (995,790 | ) | $ | 2,174,184 | $ | 739,222 | |||||||||||
Under Colombian Government Entity GAAP in 2014 and 2013, $158,559 and $144,356 were amortized in regard to goodwill acquired from OIG, Hocol, Andean Chemicals, IPL Enterprises, Propilco and Equion. The amortization in the table above represents the accumulated amortization of the companies that could be deductible for income tax purposes. Under U.S. GAAP, goodwill acquired from OIG, which is recognized by the equity method, is included as part of the investment.
Under U.S. GAAP, Ecopetrol tests goodwill for impairment at least annually using a two-step process that begins with an estimation of the fair value of a reporting unit. The first step is a screen for potential impairment and the second step measures the amount of impairment. Ecopetrol did not perform a qualitative analysis although allowed.
For impairment purposes fair value is determined by reference to market value, if available, or by a qualified evaluator or pricing model. Determination of a fair value by a qualified evaluator or pricing model requires management to make assumptions and use estimates. Management believes that the assumptions and estimates used are reasonable and supportable in the existing market environment and commensurate with the risk profile of the assets valued. However, different assumptions and estimates could be used which would lead to different results. The valuation models used to determine the fair value of these companies are sensitive to changes in the underlying assumptions. For example, the prices and volumes of product sales to be achieved and the prices which will be paid for the purchase of raw materials are assumptions which may vary in the future. Adverse changes in any of these assumptions could lead the Company to record a goodwill impairment charge.
During 2013, Ecopetrol performed an impairment test of goodwill which showed that the Propilco was impaired by $280,493. During 2013, lower supply from Ecopetrol increased the variable costs, as the company switched their raw material suppliers. Furthermore, the company performance was challenged by shifts in the petrochemical markets, as a result of new shale gas discoveries in the U.S. and low costs products coming from Asia. During 2014 and 2012, Ecopetrol performed an impairment test of goodwill and there was no impairment.
During 2014 and 2013, Ecopetrol was not in any business combinations.
Next table presents the carrying amount of total equity (net assets) attributable to the non-controlling interest under U.S. GAAP as of December 31st of 2014, 2013 and 2012.
| OCENSA | ODC | ODL | BIOENERGY | OBC | EQUION | TOTAL | ||||||||||||||||||||||
| Balance 2011 | $ | 92,307 | $ | 2,646 | $ | 227,639 | $ | 7,230 | $ | 306,888 | $ | 1,651,409 | $ | 2,288,119 | ||||||||||||||
| Acquired non-controlling interest | - | - | - | (1,797 | ) | 672 | - | (1,125 | ) | |||||||||||||||||||
| Issuance of Company shares | - | - | - | 5,492 | - | - | 5,492 | |||||||||||||||||||||
| Net income (loss) | 51,408 | 11,888 | 46,133 | (1,593 | ) | (13,700 | ) | 97,709 | 191,845 | |||||||||||||||||||
| Other comprehensive income | - | - | - | - | - | 121 | 121 | |||||||||||||||||||||
| Translation adjustments | - | - | (44 | ) | - | - | (49,923 | ) | (49,967 | ) | ||||||||||||||||||
| Spin-off of Ocensa shares | 73,797 | (73,797 | ) | - | ||||||||||||||||||||||||
| Dividends for Spin-Off | (37 | ) | (37 | ) | ||||||||||||||||||||||||
| Balance 2012 | $ | 217,512 | $ | 14,534 | $ | 273,728 | $ | 9,332 | $ | 293,860 | $ | 1,625,482 | $ | 2,434,448 | ||||||||||||||
| Payment of dividends | (255,719 | ) | (255,719 | ) | ||||||||||||||||||||||||
| Capital contribution | 9,164 | 9,164 | ||||||||||||||||||||||||||
| Net income (loss) | 344,247 | 18,566 | 56,583 | (2,335 | ) | (37,992 | ) | 160,620 | 539,689 | |||||||||||||||||||
| Other comprehensive income | 43 | 43 | ||||||||||||||||||||||||||
| Translation adjustments | 85 | 87,621 | 87,706 | |||||||||||||||||||||||||
| Balance 2013 | $ | 306,040 | $ | 33,100 | $ | 330,396 | $ | 16,161 | $ | 255,868 | $ | 1,873,766 | $ | 2,815,331 | ||||||||||||||
| Net income (loss) | 388,728 | 29,309 | 81,417 | (5,054 | ) | 93,300 | 95,793 | 683,493 | ||||||||||||||||||||
| Payment of dividends | (388,188 | ) | (19,005 | ) | (71,030 | ) | - | (38,920 | ) | (558,016 | ) | (1,075,159 | ) | |||||||||||||||
| Return of capital to shareholders | - | (8,935 | ) | - | - | - | - | (8,935 | ) | |||||||||||||||||||
| Translation adjustments | - | - | (1,279 | ) | - | - | 222,893 | 221,614 | ||||||||||||||||||||
| Issuance of company shares | - | 3,578 | - | - | 3,578 | |||||||||||||||||||||||
| Transfer to retained earnings | - | 8,515 | - | - | - | - | 8,515 | |||||||||||||||||||||
| Other comprehensive Income | - | - | - | - | - | (69 | ) | (69 | ) | |||||||||||||||||||
| Balance 2014 | $ | 306,580 | $ | 42,984 | $ | 339,504 | $ | 14,685 | $ | 310,248 | $ | 1,634,367 | $ | 2,648,368 | ||||||||||||||
Ecopetrol S.A. and Subsidiaries
Notes to the Consolidated Financial Statements
Years ended December 31, 2014, 2013 and 2012
(Expressed in millions of Colombian pesos)
Under Colombian Government Entity GAAP, the companies domiciled outside Colombia, regardless of their functional currency, must report in USD and translate balances to Colombian pesos with the impact recorded as a cumulative translation adjustment.
For U.S. GAAP, the Company must remeasure all subsidiary financial information to its functional currency and then translate it to the reporting currency. This difference in methodology results in a difference in the translated amounts recorded in the consolidated financial statements.
Under Colombian Government Entity GAAP, earnings per share ("EPS"13.7%) are calculated by dividing net income by the weighted average of both common and preferred shares outstanding for each period presented. However, although the Company has presented EPS under Colombian Government Entity GAAP for informational purposes, the presentation of EPS is not required for financial statements issued under Colombian Government Entity GAAP. The Company does not have any issued or outstanding preferred shares.
U.S. GAAP requires dual presentation of basic and diluted EPS for entities with complex capital structures, as well as a reconciliation of the basic EPS calculation with the diluted EPS calculation. Basic EPS is calculated by dividing net income available to common shareholders by the weighted average of common shares outstanding for the corresponding period.
Diluted EPS assumes the issuance of common shares for all dilutive potential common shares outstanding during the reporting period. For the years ended December 31, 2014, 2013 and 2012, the Company had a simple capital structure. There are not any other compensation plan involving shares. Therefore, the Company is not required to present diluted EPS for these years.
The Company did not adopt authoritative guidance in 2014 that had a material impact on the Company´s consolidated financial statements.
In May 2014, the FASB issued ASU 2014-09, which becomes effective for the company January 1, 2017. Early adoption is not permitted. The standard provides that an entity should recognize revenue to align with the transfer of promised goods or services to customers in an amount that reflects the consideration that the entity expects to be entitled to receive in exchange for those goods or services. The ASU, which replaces most existing revenue recognition guidance in U.S. GAAP, provides a five-step model for recognition of revenue, guidance on the accounting for certain costs of obtaining or fulfilling contracts with customers and specific disclosure requirements. Transition guidance permits either retrospective application or presentation of the cumulative effect at the adoption date. The company is reviewing the requirements of the ASU to determine the transition method it will apply and to update its assessments developed throughout the FASB’s deliberation period. The company is evaluating the effect of the standard on the company’s consolidated financial statements.
Note: At its April 1, 2015, meeting, the FASB tentatively decided to defer for one year the effective date of the new revenue standard (ASU 2014-09), this is beginning after December 15, 2017. Also entities would be permitted to early adopt the standard as of the original effective date in ASU 2014-09.
Other accounting standards that have been issued by the FASB or other standards-setting bodies are not expected to have a material impact on the Ecopetrol’s financial position, results of operations and/or cash flows.
In January, 2015, FASB issued ASU No. 2015-01 Income Statement—Extraordinary and Unusual Items (Subtopic 225-20), simplifying Income Statement presentation by eliminating the concept of Extraordinary Items. Eliminating the concept of extraordinary items will save time and reduce costs for preparers because they will not have to assess whether a particular event or transaction event is extraordinary (even if they ultimately would conclude it is not). This also alleviates uncertainty for preparers, auditors, and regulators because auditors and regulators no longer will need to evaluate whether a preparer treated an unusual and/or infrequent item appropriately. The amendments in this Update are effective for fiscal years, and interim periods within those fiscal years, beginning after December 15, 2015; early adoption is permitted.As of the reporting date we do not expect any significant effects arising from the adoption of this ASU.
Ecopetrol S.A. and Subsidiaries
Notes to the Consolidated Financial Statements
Years ended December 31, 2014, 2013 and 2012
(Expressed in millions of Colombian pesos)
In February, 2015 ASU No. 2015-02 Consolidation was issued by FASB. The amendments in this Update affect reporting entities that are required to evaluate whether they should consolidate certain legal entities. All legal entities are subject to reevaluation under the revised consolidation model. Specifically, the amendments:
The amendments in this Update are effective for public business entities for fiscal years, and for interim periods within those fiscal years, beginning after December 15, 2015. For all other entities, the amendments in this Update are effective for fiscal years beginning after December 15, 2016, and for interim periods within fiscal years beginning after December 15, 2017. Early adoption is permitted, however Ecopetrol has not been considered it yet.
In April 2015, FASB issued ASU No 2015-03 Interest—Imputation of Interest (Subtopic 835-30). The Board received feedback that having different balance sheet presentation requirements for debt issuance costs and debt discount and premium creates unnecessary complexity. To simplify presentation of debt issuance costs, the amendments in this Update require that debt issuance costs related to a recognized debt liability be presented in the balance sheet as a direct deduction from the carrying amount of that debt liability, consistent with debt discounts. The recognition and measurement guidance for debt issuance costs are not affected by the amendments in this Update. For a public entity, the amendments in this Update are effective for annual reporting periods beginning after December 15, 2015 Ecopetrol is still assessing the impact of ASU No. 2015-03 in their financial statements.
In April, 2015 ASU No. 2015-04 Compensation – Retirement Benefits was issued by FASB. If a contribution or significant event (such as a plan amendment, settlement, or curtailment that calls for a remeasurement in accordance with existing requirements) occurs between the month-end date used to measure defined benefit plan assets and obligations and an entity’s fiscal year-end, the entity should adjust the measurement of defined benefit plan assets and obligations to reflect the effects of those contributions or significant events. However, an entity should not adjust the measurement of defined benefit plan assets and obligations for other events that occur between the month-end measurement and the entity’s fiscal year-end that are not caused by the entity (for example, changes in market prices or interest rates).
Currently, Ecopetrol actuarial calculations are performed in an interim date closest the end of the year. In addition, recent changes to the collective labor agreement were conducted in June 2014 and are effective for the next four years. The valuations take into account those changes and amendments made to each benefit plan.
Given the above and since the date of application of this ASU is December 15, 2015, Ecopetrol has not considered for early adoption, the update would have no impact.
In 2014 one customer of the refining segment accounted for 12.1% of total sales. No other customers accounted forcustomer has more than 10% of total sales in 2014.In 2013 there was one customer of the refining segment that accounted 11.4% of total sales. In 2012 there were no customers in excess of 10% of totalconsolidated sales. There was no exposure that affects the financial position of Ecopetrol if the companyCompany lost the client. The commercial relationship with this customer is the sale of refine products and transportation service. Sales to this customer are recognized by the Refining and Petrochemical and transportation and logistics Segments. Organizacion Terpel, is leader thanks to its network of petrol stations and industrial sales strategy and in the aviation segment.
| 26. | Cost of sales (before impairment of non-current assets) |
The following is the detail of cost of sales per function for the years ended December 31, 2016, 2015 and 2014:
| 2016 | 2015 | 2014 | ||||||||||
| Variable costs | ||||||||||||
| Imported products (1) | 12,049,477 | 12,935,878 | 13,264,700 | |||||||||
| Depreciation, depletion and amortization | 5,333,245 | 5,166,455 | 5,114,053 | |||||||||
| Hydrocarbon purchases - ANH (2) | 3,178,199 | 3,741,010 | 6,630,309 | |||||||||
| Purchases of crude in association and concession | 1,517,829 | 1,928,938 | 3,293,594 | |||||||||
| Hydrocarbons transportation services | 783,307 | 1,380,733 | 1,548,115 | |||||||||
| Processing materials | 608,535 | 366,454 | 349,953 | |||||||||
| Electric power | 618,675 | 424,920 | 408,248 | |||||||||
| Gas royalties in cash | 478,332 | 481,029 | 399,752 | |||||||||
| Purchases of other products and gas | 519,884 | 703,163 | 1,021,327 | |||||||||
| Services contracted in associations | 305,326 | 563,032 | 612,013 | |||||||||
| Others (3) | (432,694 | ) | (322,547 | ) | 98,904 | |||||||
| 24,960,115 | 27,369,065 | 32,740,968 | ||||||||||
| Fixed costs | ||||||||||||
| Depreciation and amortization | 2,050,739 | 1,433,263 | 1,144,437 | |||||||||
| Maintenance | 1,998,128 | 2,334,130 | 2,646,832 | |||||||||
| Labor cost | 1,571,511 | 1,542,701 | 1,369,654 | |||||||||
| Services contracted in associations | 1,260,470 | 1,415,422 | 1,674,322 | |||||||||
| Services contracted | 1,083,176 | 1,301,094 | 1,578,918 | |||||||||
| Taxes and contributions | 391,032 | 461,624 | 607,494 | |||||||||
| General costs | 383,842 | 461,994 | 441,718 | |||||||||
| Materials and operating supplies | 333,258 | 435,238 | 500,934 | |||||||||
| Hydrocarbons transportation services | 157,463 | 147,733 | 74,976 | |||||||||
| Non-capitalized project costs | 61,689 | 92,252 | 194,875 | |||||||||
| 9,291,308 | 9,625,451 | 10,234,160 | ||||||||||
| 34,251,423 | 36,994,516 | 42,975,128 | ||||||||||
| (1) | Purchases of diesel and diluent agents to facilitate the transportation of heavy crude oil. |
| (2) | Corresponds mainly to purchases of crude royalties that Ecopetrol makes from the National Hydrocarbons Agency (Agencia Nacional de Hidrocarburosor ANH by its acronym in Spanish) derived from national production by both the Company in direct operation and third parties. |
| (3) | Corresponds to the allocation of inventories because the concepts of cost of sales are presented at 100%. |
| F-81 |
Ecopetrol S.A. Notes to Consolidated Financial Statements (Figures expressed in millions of Colombian pesos, unless otherwise stated) |
| 27. | Administration, operation and project expenses |
The following is the detail of administration, operation and project expenses, according to their function for the years ended December 31, 2016, 2015 and 2014:
| 2016 | 2015 | 2014 | ||||||||||
| Administration expenses | ||||||||||||
| Taxes (1) | 663,889 | 730,841 | 102,028 | |||||||||
| Labor expenses | 657,051 | 491,748 | 463,836 | |||||||||
| General expenses and other | 556,563 | 393,971 | 410,288 | |||||||||
| Depreciation and amortization | 45,765 | 84,425 | 54,883 | |||||||||
| 1,923,268 | 1,700,985 | 1,031,035 | ||||||||||
| Operation and project expenses | ||||||||||||
| Exploration expenses | 728,590 | 1,584,249 | 2,576,294 | |||||||||
| Commissions, fees, freights and services | 568,513 | 878,259 | 1,244,045 | |||||||||
| Corporate projects | 301,854 | 456,159 | 269,495 | |||||||||
| Taxes | 286,331 | 348,871 | 449,824 | |||||||||
| Labor expenses | 278,383 | 309,021 | 266,362 | |||||||||
| Depreciation and amortization | 177,252 | 86,215 | 103,834 | |||||||||
| Maintenance | 147,197 | 181,630 | 241,313 | |||||||||
| Fee for regulatory entities | 87,325 | 77,909 | 108,263 | |||||||||
| Various | 176,242 | 111,955 | 260,895 | |||||||||
| 2,751,687 | 4,034,268 | 5,520,325 | ||||||||||
| (1) | It mainly includes the recognition of wealth tax. See Note 10 taxes. |
| 28. | Impairment of non-current assets |
The detail of non-current assets impairment charges for the years ended December 31, 2016, 2015 and 2014 is as follows:
| 2016 | 2015 | 2014 | ||||||||||
| Property, plant and equipment and Intangibles (Note 17) | 561,738 | 4,144,754 | 1,495,113 | |||||||||
| Natural and environmental resources (Note 17) | 239,151 | 2,865,077 | 694,720 | |||||||||
| Investments in associates and joint ventures (Note 14.2) | 127,858 | 588,144 | 114,734 | |||||||||
| Goodwill (Note 19) | - | 266,900 | - | |||||||||
| 928,747 | 7,864,875 | 2,304,567 | ||||||||||
| F-82 |
Ecopetrol S.A. Notes to Consolidated Financial Statements (Figures expressed in millions of Colombian pesos, unless otherwise stated) |
| 29. | Other operating income and (expenses), net |
The following is the detail of other operating income and (expenses) for the years ended December 31, 2016, 2015 and 2014:
| 2016 | 2015 | 2014 | ||||||||||
| Deferred income BOMT's (1) | 211,768 | 193,197 | 140,372 | |||||||||
| Recovery of provisions for litigation | 112,999 | 205,879 | 203,688 | |||||||||
| Compensation received | 17,790 | 29,848 | 24,648 | |||||||||
| Profit (loss) on sale of materials and property, plant and equipment | (82,200 | ) | 6,744 | (111,378 | ) | |||||||
| Current assets impairment expense (2) | (98,739 | ) | (2,858 | ) | (24,784 | ) | ||||||
| Gas pipeline availability under BOMT’s contracts (1) | (125,077 | ) | (124,957 | ) | (102,916 | ) | ||||||
| Other income (expenses), net | 237,571 | 70,685 | 178,564 | |||||||||
| 274,112 | 378,538 | 308,194 | ||||||||||
| (1) | BOMT:Build, Operate, Maintain and Transfer contracts arising from the sale of Ecogas. |
| (2) | Includes mainly an allowance for doubtful accounts and provisions for inventories. |
| 30. | Financial result, net |
The following is the detail of financial results net for the years ended December 31, 2016, 2015 and 2014:
| 2016 | 2015 | 2014 | ||||||||||
| Financial income | ||||||||||||
| Resources from Santiago de las Atalayas (1) | 688,664 | - | - | |||||||||
| Yield and interest | 386,001 | 293,507 | 286,527 | |||||||||
| Valuation of financial assets | 136,715 | 164,614 | 57,807 | |||||||||
| Gain on sale of available-for-sale assets | 47,129 | 72,339 | - | |||||||||
| Gain on valuation of derivatives | 42,865 | - | 2,282 | |||||||||
| Dividends | 10,369 | 91,464 | 53,202 | |||||||||
| 1,311,743 | 621,924 | 399,818 | ||||||||||
| Financial expenses | ||||||||||||
| Interest (2) | (2,765,024 | ) | (1,768,618 | ) | (754,276 | ) | ||||||
| Financial cost of other liabilities (3) | (580,491 | ) | (627,827 | ) | (651,055 | ) | ||||||
| Other financial expenses | (67,786 | ) | (45,614 | ) | (36,410 | ) | ||||||
| Expense from financial assets | (48,997 | ) | (167,869 | ) | (57,640 | ) | ||||||
| Loss on valuation of derivatives | (1,242 | ) | (108,486 | ) | (140,913 | ) | ||||||
| (3,463,540 | ) | (2,718,414 | ) | (1,640,294 | ) | |||||||
| Foreign exchange gain (loss), net (4) | 976,430 | (5,566,614 | ) | (2,270,193 | ) | |||||||
| Financial result, net | (1,175,367 | ) | (7,663,104 | ) | (3,510,669 | ) | ||||||
| (1) | Corresponds to the reversal of a provision relating to a litigation Santiago de las Atalayas which mostly from the valuation and financial yields generated in the time of permanence of the cash that was subject to the caution (see Note 23.3 for more information). |
| (2) | Interest was capitalized during the period to natural resources and property, plant and equipment for COP$341,209 (2015 – COP$744,426 and 2014 – COP$640,698) |
| (3) | Includes financial cost of asset retirement obligation and post-employment benefits liabilities. |
| (4) | Foreign exchange gain was COP$17,359,601 in 2016 (2015 - COP$21,813,720 and 2014 – COP$27,380,334) and foreign exchange loss was COP$16,383,171 in 2016 (2015 – COP$7,360,782 and 2014 – COP$9,630,975). |
| F-83 |
Ecopetrol S.A. Notes to Consolidated Financial Statements (Figures expressed in millions of Colombian pesos, unless otherwise stated) |
| 31. | Risk management |
| 31.1 | Commodity price risk |
Ecopetrol´s business depends substantially on international prices for crude oil and refined products. The prices for these products are volatile and drastic changes couldadversely affect the Company business prospects and results of operations
A large proportion of Ecopetrol´s sales revenues come from sales of crude oil, natural gas and refined products. These products are indexed to international reference prices such as the Brent Index. Consequently, fluctuations in those international indexes have a direct effect on the financial condition and Company´s results of operations.
Prices of crude oil, natural gas and refined products have historically fluctuated as a result of a variety of factors including, among others, competition within the oil and natural gas industry; changes in international prices of natural gas and refined products; long-term changes in the demand for crude oil, natural gas and refined products; regulatory changes; changes in the cost of capital; adverse economic conditions; transactions in derivative financial instruments related to oil and gas and development or availability of alternative fuels.
The majority of the Company’s assets and activities are located in Colombia. The financial position and results of operations of those subsidiaries located outside of Colombia are not material to the Company.
From the first quarter of 2013Ecopetrol Business Group has a change was implemented in the reported segments, which consisted of removing the segment of Supply and Marketing. This change is because the marketing margin, which was the reason for that segment, has suffered different impacts (changes in the marketing scheme ANH royalties and therefore in agreement with that entity; preference of the Refinery by loading ANH crude and third parties, leaving this segment the crude oil marketing that has lower earning, among others) that make such a small margin today; and therefore cannot be considered in itself a core business of the company. This activity could migrate to a simple model of marketing services to Exploration and Production and Refining segments.
By eliminating the Supply and Marketing segment,which waspolicy approved by the Board Director,revenues and costs associated withof Directors that allows it to use derivative financial instruments in the marketingorganized market over the counter (OTC) to cover itself from the risk of refined products, buyingprice fluctuations of crude oil and gas,refined products associated to physical transactions. The Company has established appropriate processes to handle risk that include constant monitoring of physical and financial market to identify risks in order to subsequently prepare and execute hedging strategies.
Ecopetrol does not regularly use derivative instruments to hedge exposures to sales or purchase price risks. The impact of the settlement of the price hedges made during the years 2016 and 2015 has not been material and were allocated in proportionexecuted as hedging instruments to their usemitigate risk at different price indices to the Refining & Petrochemicalsbenchmark of the Company's international trade strategy on exports of crude and Exploration & Production segments. imports of products.
As of December 31, 2016 and 2015 price hedges were fully settled with an impact on the result of COP$3,181 and COP$4,141, respectively.
| 31.2 | Exchange rate risk |
The amounts for 2012group mainly operates in Colombia and makes sales in the local and international markets. For this reason, it is exposed to the exchange rate risk that arises from various foreign currency exposures due tocommercial transactions and assets and liabilities held in foreign currency.The impact of fluctuations in exchange rates, especially the Pesos/US$rate, on operations has been material.
The US$/pesos exchange rate has fluctuated over the last few years. The peso depreciated by an average of 11.2% and 37.3% in 2016 and 2015, respectively; on the other hand, the closing exchange rates were restated for comparative purposes.COP$3,000.71, COP$3,149.47 and COP$2,392.46 as of December 31, 2016, 2015 and 2014, respectively.
When the Colombian peso appreciates in comparison with the U.S. dollar export sales revenue decrease when translated into COP. However, imported goods, the oil services and interest on external debt denominated in U.S. dollars, become less expensive. Conversely, when the Colombian peso depreciates in comparison with the U.S. dollar sales revenues from exports, when translated into COP, increase, and imports and external debt service become more expensive.
The following segment informationtable sets out the carrying values for financial assets and liabilities denominated in foreign currencies at December 31, 2016 and 2015:
| 2016 | 2015 | |||||||
| US$ Million | ||||||||
| Cash and cash equivalents | 1,916 | 970 | ||||||
| Other financial assets | 1,367 | 381 | ||||||
| Trade receivables and payables, net | (282 | ) | (546 | ) | ||||
| Loans and borrowings | (15,172 | ) | (14,634 | ) | ||||
| Net liability position | (12,171 | ) | (13,829 | ) | ||||
| F-84 |
Ecopetrol S.A. Notes to Consolidated Financial Statements (Figures expressed in millions of Colombian pesos, unless otherwise stated) |
Of the total net liability position US$2,878 million relates to financial assets and liabilities for companies that have the Colombian peso as their functional currency whose value has been prepared accordingaffected results for the financial year. Likewise, US$(15,049) million of the net position relates to ASC 280, Disclosure about Segmentsmonetary assets and liabilities for group companies that have the dollar as their functional currency and non-derivate hedging instruments from Ecopetrol whose value is recognized in other comprehensive income.
The Company’s risk management strategy involves the use of an Enterprisenon-derivative financial instruments related to cash flow hedges for future exports and Related Information. Financial informationhedges of a net investment in a foreign operation, in order to minimize exposure to currency rate risk, which is detailed below.
| 31.2.1 | Cash flow hedge for future exports |
Ecopetrol is exposed to foreign exchange risk given that a high percentage of its crude export sales revenues are denominated in U.S. dollars. In recent years, the Company has acquired long-term debt for investment activities in the same currency that projects receiving the cash flow of its export sales revenues. This situation creates a natural hedge relationship due to the fact that the risks generated by business segment is reportedthe foreign exchange difference of export sales revenues to Ecopetrol´s functional currency (Colombian pesos) are naturally hedged with the foreign exchange valuation risks of the long-term debt in U.S. dollars, aligned with the company’s risk management strategy.
With the objective of presenting in the financial statements the effect of the mentioned natural hedge between exports and debt, understanding that the exchange rate risk materializes when the exports are made, on October 1, 2015, the Board of Directors designated US$5,440 million of Ecopetrol’s debt as hedge instrument of its future export sales for the period 2015- 2023, in accordance with the internal reporting system under RCPIAS 39 – Financial instruments: recognition and shows internal segment information that is used by the chief operating decision maker to manage and measure the performance of Ecopetrol.
Ecopetrol S.A. and Subsidiaries
Notes to the Consolidated Financial Statements
Years ended December 31, 2014, 2013 and 2012
(Expressed in millions of Colombian pesos)measurement.
The financial information among segments is reported considering each business as a separate entity. Prices between segments are established by referencing those that would apply in an arm’s length transaction. Each segment should bearHedge accounting records the costs and expenses required to putimpact of foreign exchange gains/losses on the product in termshedging instrument on statement of useprofit or marketing. Each segment assumes its administrative expenses and all non-operational transactions related to their activity.
The Company operates underloss effectively at the following segments, which are described as follows:
Exploration and Production - this segment includes the Company’s oil & gas exploration and production activities. Revenue is derived from the saletime of crude oil and natural gas to inter-company segments, at market prices, and to third parties. Revenue is derived from local sales of crude oil, regulated fuels, non-regulated fuels and natural gas. Sales are made to local and foreign distributors. Costs include those costs incurred in production. Expenses include all exploration costs that are not capitalized.
Refining and Petrochemicals -this segment includes the Company’s refining activities. Goods sold, both internally and to third parties, include refined products such as motor fuels, fuel oils and petrochemicals at market prices. This segment also includes sales of industrial services to third parties.
Transportation and Logistics - this segment includes the Company’s sales and costs associated with the Company’s pipelines and other transportation activities
These functions have been defined as the operating segmentsrealization of the Company since thesehedged risk. For this to happen, every month when the foreign currency debt is translated to Colombian pesos at the closing exchange rate, the effects on foreign exchange differences are recognized as part of the segments (a) that engageother comprehensive income. Once the hedged operation occurs and sales revenue is recognized, the cumulative exchange differences held within in business activities from which revenues are earnedother comprehensive income is reclassified to profit or loss statement, impacting operating income and expenses are incurred; (b) whose operating results are regularly reviewed by the Company's chief operating decision maker to allocate resources to the segments and assess their performance; and (c) for which discrete financial information is available. Internal transfers represent sales to intercompany segments and are recorded and presented at market prices.EBITDA.
The following tables presentshows the Company’s consolidated balance sheet by segment in accordance with Colombian Government Entity GAAP:movement of this non-derivative hedging instrument at December 31, 2016 and 2015:
| As of December 31, 2014 | ||||||||||||||||||||
| Exploration & Production | Refining Activities | Transportation & logistics | Eliminations | Total | ||||||||||||||||
| Current assets | ||||||||||||||||||||
| Cash and cash equivalents | $ | 3,762,124 | $ | 756,415 | $ | 3,432,662 | $ | - | $ | 7,951,201 | ||||||||||
| Accounts and notes receivable | 2,346,871 | 1,395,581 | 673,263 | (306,661 | ) | 4,109,054 | ||||||||||||||
| Inventories | 1,361,538 | 1,463,727 | 232,885 | (34,647 | ) | 3,023,503 | ||||||||||||||
| Investments | 886,760 | 32,791 | 167,888 | - | 1,087,439 | |||||||||||||||
| Other current assets | 6,987,538 | 934,428 | 666,666 | (7,431 | ) | 8,581,201 | ||||||||||||||
| 15,344,831 | 4,582,942 | 5,173,364 | (348,739 | ) | 24,752,398 | |||||||||||||||
| Investments in non-consolidated companies | 1,511,367 | 58,823 | 35,797 | - | 1,605,987 | |||||||||||||||
| Property, plant and equipment, net | 13,376,080 | 23,730,491 | 13,678,119 | (128,496 | ) | 50,656,194 | ||||||||||||||
| Natural and environmental resources, net | 31,650,038 | 10,137 | - | - | 31,660,175 | |||||||||||||||
| Other long term assets | 8,035,797 | 7,893,999 | 17,570,021 | 6,720 | 33,506,537 | |||||||||||||||
| Long term assets | 54,573,282 | 31,693,450 | 31,283,937 | (121,776 | ) | 117,428,893 | ||||||||||||||
| Total assets | $ | 69,918,113 | $ | 36,276,392 | $ | 36,457,301 | $ | (470,515 | ) | $ | 142,181,291 | |||||||||
| Accounts payable | $ | (5,203,899 | ) | $ | (2,708,409 | ) | $ | (1,353,731 | ) | $ | 297,919 | $ | (8,968,120 | ) | ||||||
| Financial obligations short-term | (781,245 | ) | (421,432 | ) | (586,643 | ) | - | (1,789,320 | ) | |||||||||||
| Other current liabilities | (4,924,191 | ) | (2,625,015 | ) | (2,084,971 | ) | 3,240 | (9,630,937 | ) | |||||||||||
| Current liabilities | (10,909,335 | ) | (5,754,856 | ) | (4,025,345 | ) | 301,159 | (20,388,377 | ) | |||||||||||
| Financial obligations long-term | (11,866,828 | ) | (14,762,680 | ) | (7,232,456 | ) | 2,307 | (33,859,657 | ) | |||||||||||
| Other long term liabilities | (11,939,476 | ) | (1,920,398 | ) | (1,338,304 | ) | 6,828 | (15,191,350 | ) | |||||||||||
| Long term liabilities | (23,806,304 | ) | (16,683,078 | ) | (8,570,760 | ) | 9,135 | (49,051,007 | ) | |||||||||||
| Total liabilities | (34,715,639 | ) | (22,437,934 | ) | (12,596,105 | ) | 310,294 | (69,439,384 | ) | |||||||||||
| Non-controlling interest | (1,030,114 | ) | (19,023 | ) | (3,146,798 | ) | - | (4,195,935 | ) | |||||||||||
| Shareholders’ equity of Ecopetrol | (34,172,360 | ) | (13,819,435 | ) | (20,714,398 | ) | 160,221 | (68,545,972 | ) | |||||||||||
| Total equity | (35,202,474 | ) | (13,838,458 | ) | (23,861,196 | ) | 160,221 | (72,741,907 | ) | |||||||||||
| Total liabilities and equity | $ | (69,918,113 | ) | $ | (36,276,392 | ) | $ | (36,457,301 | ) | $ | 470,515 | $ | (142,181,291 | ) | ||||||
| Capital expenditures | $ | 9,901,856 | $ | 4,274,267 | $ | 1,591,969 | $ | (85,700 | ) | $ | 15,682,392 | |||||||||
| Goodwill | $ | 914,107 | $ | 217,186 | $ | 616,268 | $ | $ | 1,747,561 | |||||||||||
| As of December 31, 2013 | ||||||||||||||||||||
Exploration & Production | Refining Activities | Transportation & logistics | Eliminations | Total | ||||||||||||||||
| Current assets | ||||||||||||||||||||
| Cash and cash equivalents | $ | 4,341,135 | $ | 870,078 | $ | 3,630,225 | $ | - | $ | 8,841,438 | ||||||||||
| Accounts and notes receivable | 4,514,267 | 2,482,038 | 960,467 | (1,779,881 | ) | 6,176,891 | ||||||||||||||
| Inventories | 2,091,002 | 1,649,069 | 58,738 | (172,905 | ) | 3,625,904 | ||||||||||||||
| Investments | 2,546,465 | 7,322 | 263,497 | (934,049 | ) | 1,883,235 | ||||||||||||||
| Other current assets | 7,728,544 | 653,566 | 411,047 | (3,031 | ) | 8,790,126 | ||||||||||||||
| 21,221,413 | 5,662,073 | 5,323,974 | (2,889,866 | ) | 29,317,594 | |||||||||||||||
| Investments in non-consolidated companies | 469,027 | 263,406 | 263,384 | - | 995,817 | |||||||||||||||
| Property, plant and equipment, net | 9,390,055 | 17,505,340 | 13,305,781 | (50,642 | ) | 40,150,534 | ||||||||||||||
| Natural and environmental resources, net | 27,071,381 | - | - | - | 27,071,381 | |||||||||||||||
| Other long term assets | 10,174,551 | 4,787,534 | 21,331,735 | (1,401,152 | ) | 34,892,668 | ||||||||||||||
| Long term assets | 47,105,014 | 22,556,280 | 34,900,900 | (1,451,794 | ) | 103,110,400 | ||||||||||||||
| Total assets | $ | 68,326,427 | $ | 28,218,353 | $ | 40,224,874 | $ | (4,341,660 | ) | $ | 132,427,994 | |||||||||
| Accounts payable | $ | (5,505,697 | ) | $ | (3,139,887 | ) | $ | (2,488,495 | ) | $ | 1,661,255 | $ | (9,472,824 | ) | ||||||
| Financial obligations short-term | (236,376 | ) | (451,817 | ) | (261,708 | ) | 175,342 | (774,559 | ) | |||||||||||
| Other current liabilities | (7,239,844 | ) | (2,777,506 | ) | (1,970,784 | ) | - | (11,988,134 | ) | |||||||||||
| Current liabilities | (12,981,917 | ) | (6,369,210 | ) | (4,720,987 | ) | 1,836,597 | (22,235,517 | ) | |||||||||||
| Financial obligations long-term | (6,814,352 | ) | (10,901,056 | ) | (5,081,564 | ) | 1,372,980 | (21,423,992 | ) | |||||||||||
| Other long term liabilities | (10,003,930 | ) | (1,904,224 | ) | (2,103,773 | ) | 936,393 | (13,075,534 | ) | |||||||||||
| Long term liabilities | (16,818,282 | ) | (12,805,280 | ) | (7,185,337 | ) | 2,309,373 | (34,499,526 | ) | |||||||||||
| Total liabilities | (29,800,199 | ) | (19,174,490 | ) | (11,906,324 | ) | 4,145,970 | (56,735,043 | ) | |||||||||||
| Non-controlling interest | (1,376,969 | ) | (19,402 | ) | (3,177,377 | ) | - | (4,573,748 | ) | |||||||||||
| Shareholders’ equity of Ecopetrol | (37,149,259 | ) | (9,024,461 | ) | (25,141,173 | ) | 195,690 | (71,119,203 | ) | |||||||||||
| Total equity | (38,526,228 | ) | (9,043,863 | ) | (28,318,550 | ) | 195,690 | (75,692,951 | ) | |||||||||||
| Total liabilities and equity | $ | (68,326,427 | ) | $ | (28,218,353 | ) | $ | (40,224,874 | ) | $ | 4,341,660 | $ | (132,427,994 | ) | ||||||
| Capital expenditures | $ | 9,633,996 | $ | 3,972,027 | $ | 834,826 | $ | (216,035 | ) | $ | 14,224,814 | |||||||||
| Goodwill | $ | 1,254,739 | $ | 236,849 | $ | 683,497 | $ | - | $ | 2,175,084 | ||||||||||
Ecopetrol S.A. and Subsidiaries
Notes to the Consolidated Financial Statements
Years ended December 31, 2014, 2013 and 2012
(Expressed in millions of Colombian pesos)
| (US$ Million) | 2016 | 2015 | ||||||
| Hedging instrument at the beginning of the period | 5,376 | 5,376 | ||||||
| Reassignment of hedging instruments | 870 | 277 | ||||||
| Realized exports | (870 | ) | (277 | ) | ||||
| Capital payments | (64 | ) | - | |||||
| Hedging instrument at the end of the period | 5,312 | 5,376 | ||||||
The Company’s consolidated statement of net income by segment is as follows in accordance with Colombian Government Entity GAAP:
| Year ended December 31, 2014 | ||||||||||||||||||||
| Exploration & Production | Refining Activities | Transportation & logistics | Eliminations | Total | ||||||||||||||||
| Revenues: | ||||||||||||||||||||
| Local sales | $ | 2,510,099 | $ | 20,956,935 | $ | - | $ | - | $ | 23,467,034 | ||||||||||
| Foreign sales, net | 36,778,707 | 5,431,618 | - | - | 42,210,325 | |||||||||||||||
| Services | 87,669 | 12,951 | 3,147,359 | - | 3,247,979 | |||||||||||||||
| Inter-segment net operating revenues | 5,379,584 | 708,753 | 4,818,353 | (10,906,690 | ) | - | ||||||||||||||
| Total Revenue | 44,756,059 | 27,110,257 | 7,965,712 | (10,906,690 | ) | 68,925,338 | ||||||||||||||
| Cost of sales | 21,446,806 | 25,363,205 | 3,092,744 | (10,975,387 | ) | 38,927,368 | ||||||||||||||
| Depreciation, depletion and amortization | 4,769,778 | 583,813 | 773,057 | - | 6,126,648 | |||||||||||||||
| Selling and projects | 4,663,772 | 969,004 | 335,160 | (193,363 | ) | 5,774,573 | ||||||||||||||
| Administration expenses | 607,480 | 547,516 | 341,463 | (1,699 | ) | 1,494,760 | ||||||||||||||
| Costs and expenses | 31,487,836 | 27,463,538 | 4,542,424 | (11,170,449 | ) | 52,323,349 | ||||||||||||||
| Operating income | 13,268,223 | (353,281 | ) | 3,423,288 | 263,759 | 16,601,989 | ||||||||||||||
| Financial income (expenses), net | (551,492 | ) | (290,574 | ) | 170,930 | (354 | ) | (671,490 | ) | |||||||||||
| Pension expenses | (225,208 | ) | (255,913 | ) | (74,125 | ) | - | (555,246 | ) | |||||||||||
| Other non-operating income (expenses) | 153,080 | (90,074 | ) | (12,352 | ) | (5,160 | ) | 45,494 | ||||||||||||
| Other expenses, net | (623,620 | ) | (636,561 | ) | 84,453 | (5,514 | ) | (1,181,242 | ) | |||||||||||
| Income before income taxes and non-controlling | 12,644,603 | (989,842 | ) | 3,507,741 | 258,245 | 15,420,747 | ||||||||||||||
| Income tax benefit (expense) | (6,051,719 | ) | 87,784 | (1,154,932 | ) | (16,201 | ) | (7,135,068 | ) | |||||||||||
| Non-Controlling interest | (193,238 | ) | 4,140 | (586,311 | ) | - | (775,409 | ) | ||||||||||||
| Net income for the year | $ | 6,399,646 | $ | (897,918 | ) | $ | 1,766,498 | $ | 242,044 | $ | 7,510,270 | |||||||||
| Year ended December 31, 2013 | ||||||||||||||||||||
| Exploration & Production | Refining Activities | Transportation & logistics | Eliminations | Total | ||||||||||||||||
| Revenues: | ||||||||||||||||||||
| Local sales | $ | 3,141,286 | $ | 20,463,151 | $ | - | $ | - | $ | 23,604,437 | ||||||||||
| Foreign sales, net | 36,440,725 | 7,854,089 | - | - | 44,294,814 | |||||||||||||||
| Services | 12,394 | 4,935 | 2,512,135 | - | 2,529,464 | |||||||||||||||
| Inter-segment net operating revenues | 10,384,798 | 913,504 | 3,702,992 | (15,001,294 | ) | - | ||||||||||||||
| Total Revenue | 49,979,203 | 29,235,679 | 6,215,127 | (15,001,294 | ) | 70,428,715 | ||||||||||||||
| Cost of sales | 20,962,509 | 28,642,962 | 2,970,887 | (15,052,311 | ) | 37,524,047 | ||||||||||||||
| Depreciation, depletion and amortization | 3,911,239 | 570,900 | 548,096 | - | 5,030,235 | |||||||||||||||
| Selling and projects | 2,963,917 | 1,150,460 | 301,145 | 168,464 | 4,583,986 | |||||||||||||||
| Administration expenses | 640,800 | 475,518 | 340,175 | (776 | ) | 1,455,717 | ||||||||||||||
| Costs and expenses | 28,478,465 | 30,839,840 | 4,160,303 | (14,884,623 | ) | 48,593,985 | ||||||||||||||
| Operating income | 21,500,738 | (1,604,161 | ) | 2,054,824 | (116,671 | ) | 21,834,730 | |||||||||||||
| Financial income (expenses), net | 58,161 | (153,974 | ) | 126,068 | 15,397 | 45,652 | ||||||||||||||
| Pension expenses | (192,587 | ) | (218,827 | ) | (67,323 | ) | - | (478,737 | ) | |||||||||||
| Other non-operating income (expenses) | 250,126 | 158,437 | 72,340 | (340 | ) | 480,563 | ||||||||||||||
| Other expenses, net | 115,700 | (214,364 | ) | 131,085 | 15,057 | 47,478 | ||||||||||||||
| Income before income taxes and non-controlling | 21,616,438 | (1,818,525 | ) | 2,185,909 | (101,614 | ) | 21,882,208 | |||||||||||||
| Income tax benefit (expense) | (8,039,278 | ) | 515,831 | (627,682 | ) | 62,290 | (8,088,839 | ) | ||||||||||||
| Non-Controlling interest | (255,051 | ) | 2,148 | (433,963 | ) | - | (686,866 | ) | ||||||||||||
| Net income for the year | $ | 13,322,109 | $ | (1,300,546 | ) | $ | 1,124,264 | $ | (39,324 | ) | $ | 13,106,503 | ||||||||
Ecopetrol S.A. and Subsidiaries
Notes to the Consolidated Financial Statements
Years ended December 31, 2014, 2013 and 2012
(Expressed in millions of Colombian pesos)
| Year ended December 31, 2012 | ||||||||||||||||||||
| Exploration & Production | Refining Activities | Transportation | Eliminations | Total | ||||||||||||||||
| Revenues: | ||||||||||||||||||||
| Local sales | $ | 2,472,532 | $ | 19,807,144 | $ | - | $ | - | $ | 22,279,676 | ||||||||||
| Services | 36,473,861 | 8,016,228 | - | - | 44,490,089 | |||||||||||||||
| Foreign sales, net | 123,913 | 34,947 | 1,923,377 | - | 2,082,237 | |||||||||||||||
| Inter-segment net operating revenues | 13,580,817 | 1,653,782 | 2,128,788 | (17,363,387 | ) | - | ||||||||||||||
| Total Revenue | 52,651,123 | 29,512,101 | 4,052,165 | (17,363,387 | ) | 68,852,002 | ||||||||||||||
| Cost of sales | 21,910,603 | 28,871,613 | 2,179,951 | (17,419,842 | ) | 35,542,325 | ||||||||||||||
| Depreciation, depletion and amortization | 3,669,404 | 551,625 | 772,154 | - | 4,993,183 | |||||||||||||||
| Selling and projects | 2,769,044 | 724,073 | 605,493 | - | 4,098,610 | |||||||||||||||
| Administration expenses | 471,779 | 204,423 | 198,778 | - | 874,980 | |||||||||||||||
| Costs and expenses | 28,820,830 | 30,351,734 | 3,756,376 | (17,419,842 | ) | 45,509,098 | ||||||||||||||
| Operating income | 23,830,293 | (839,633 | ) | 295,789 | 56,455 | 23,342,904 | ||||||||||||||
| Financial income (expenses), net | (153,936 | ) | 76,245 | 63,997 | (154,195 | ) | (167,889 | ) | ||||||||||||
| Pension expenses | (379,565 | ) | (431,320 | ) | (137,570 | ) | - | (948,455 | ) | |||||||||||
| Other non-operating income (expenses) | 140,002 | (22,969 | ) | 16,738 | (28,630 | ) | 105,141 | |||||||||||||
| Other expenses, net | (393,499 | ) | (378,044 | ) | (56,835 | ) | (182,825 | ) | (1,011,203 | ) | ||||||||||
| Income before income taxes and non-controlling | 23,436,794 | (1,217,677 | ) | 238,954 | (126,370 | ) | 22,331,701 | |||||||||||||
| Income tax benefit (expense) | (7,445,657 | ) | 296,938 | 15,325 | (1 | ) | (7,133,395 | ) | ||||||||||||
| Non-Controlling interest | (352,649 | ) | 1,139 | (68,020 | ) | 171 | (419,359 | ) | ||||||||||||
| Net income for the year | $ | 15,638,488 | $ | (919,600 | ) | $ | 186,259 | $ | (126,200 | ) | $ | 14,778,947 | ||||||||
| F-85 |
Ecopetrol S.A. Notes to Consolidated Financial Statements (Figures expressed in millions of Colombian pesos, unless otherwise stated) |
The following tables illustrate sales by geographic zones:is the movement in the other comprehensive income as of December 31:
Sales by geographic zones December 31, 2014
| Zone | Products | Value | Participation | |||||||
| Colombia* | Crude oil, Refined, Petrochemicals and natural gas | $ | 26,949,939 | 39.1 | % | |||||
| United States of America | Crude oil, Refined and Petrochemicals | 18,002,467 | 26.1 | % | ||||||
| Asia | Crude oil, Refined and Petrochemicals | 13,395,766 | 19.4 | % | ||||||
| Europe | Crude oil, Refined and Petrochemicals | 6,328,423 | 9.2 | % | ||||||
| Central America and Caribbean | Crude oil, Refined and Petrochemicals | 3,042,278 | 4.4 | % | ||||||
| South America | Crude oil, Refined Petrochemicals and natural gas | 973,615 | 1.4 | % | ||||||
| Other | Petrochemicals | 232,850 | 0.3 | % | ||||||
| $ | 68,925,338 | 100.0 | % | |||||||
*Inludes sales to free trade zone by $128,516
Sales by geographic zones December 31, 2013
| Zone | Products | Value | Participation | |||||||
| Colombia* | Crude oil, Refined, Petrochemicals and natural gas | $ | 26,352,462 | 37.4 | % | |||||
| United States of America | Crude oil, Refined and Petrochemicals | 20,609,349 | 29.2 | % | ||||||
| Asia | Crude oil, Refined and Petrochemicals | 11,326,247 | 16.1 | % | ||||||
| Europe | Crude oil, Refined, and Petrochemicals | 4,895,570 | 7.0 | % | ||||||
| South America | Crude oil, Refined Petrochemicals and natural gas | 1,666,422 | 2.4 | % | ||||||
| Central America and Caribbean | Crude oil, Refined and Petrochemicals | 3,640,865 | 5.2 | % | ||||||
| Other | Petrochemicals | 1,937,800 | 2.7 | % | ||||||
| $ | 70,428,715 | 100.0 | % | |||||||
*Includes sales to free trade zone by $144,562
Sales by geographic zones December 31, 2012
| Zone | Products | Value | Participation | |||||||
| Colombia* | Crude oil, Refined, Petrochemicals and natural gas | $ | 24,447,603 | 35.5 | % | |||||
| United States of America | Crude oil, Refined and Petrochemicals | 24,721,340 | 35.9 | % | ||||||
| Asia | Crude oil, Refined and Petrochemicals | 7,201,295 | 10.5 | % | ||||||
| Africa | Refined and Petrochemicals | 330,775 | 0.5 | % | ||||||
| Europe | Crude oil, Refined, and Petrochemicals | 3,977,682 | 5.8 | % | ||||||
| South America | Crude oil, Refined Petrochemicals and natural gas | 1,791,111 | 2.6 | % | ||||||
| Central America and Caribbean | Crude oil, Refined and Petrochemicals | 6,213,770 | 9.0 | % | ||||||
| Other | Petrochemicals | 168,426 | 0.2 | % | ||||||
| $ | 68,852,002 | 100.0 | % | |||||||
*Includes sales to free trade zone by $85,690
Ecopetrol S.A. and Subsidiaries
Notes to the Consolidated Financial Statements
Years ended December 31, 2014, 2013 and 2012
(Expressed in millions of Colombian pesos)
| 2016 | 2015 | |||||||
| Opening balance | 217,291 | - | ||||||
| Exchange difference on hedging instruments | (724,395 | ) | 352,482 | |||||
| Reclassification to profit or loss | (33,074 | ) | (7,646 | ) | ||||
| Deferred income tax | 296,047 | (127,545 | ) | |||||
| Closing balance | (244,131 | ) | 217,291 | |||||
The following tables illustrate salesexpected reclassification of products by segment:exchange differences accumulated in other comprehensive income to profit or loss,setting the exchange rate at COP$3000.71 is as follows:
| Year | Peso equivalents | Income tax | Net | |||||||||
| 2017 | 102,454 | (41,838 | ) | 60,616 | ||||||||
| 2018 | 117,447 | (47,960 | ) | 69,487 | ||||||||
| 2019 | 102,307 | (41,778 | ) | 60,529 | ||||||||
| 2020 | 33,981 | (13,876 | ) | 20,105 | ||||||||
| 2021 | 16,847 | (6,880 | ) | 9,967 | ||||||||
| 2022 | 16,847 | (6,880 | ) | 9,967 | ||||||||
| 2023 | 22,750 | (9,290 | ) | 13,460 | ||||||||
| 412,633 | (168,502 | ) | 244,131 | |||||||||
| 31.2.2 | Hedge of a net investment in a foreign operation |
The Board of Directors approved the application of hedge accounting of net investment from June 8, 2016. The measure seeks to reduce the volatility of non-operating income due to the exchange difference. The hedge of a net investment applies to a portion of the investments the Company has in foreign currency, in this case in subsidiaries with the US dollars as their functional currency, using as hedging instrument a portion of the Company’s debt denominated in US dollars.
SalesEcopetrol designated as hedged items net investments in Ocensa, Ecopetrol America Inc., Hocol Petroleum Ltd. (HPL) and Reficar; and as a hedging instrument a portion of products by segmentits debt denominated in US dollars in a total amount equivalent to US $5,200 million.
From the implementation to the date of this report this hedge has been effective.
Gain on exchange difference of these debts net of taxes recognized in the other comprehensive income at December 31, 2014
| Local Sales | Exploration & Production | Refining Activities | Transportation | Eliminations | Total | |||||||||||||||
| Medium distillates | $ | 1,241 | $ | 11,982,782 | $ | - | $ | - | $ | 11,984,023 | ||||||||||
| Gasolines | - | 6,396,282 | - | - | 6,396,282 | |||||||||||||||
| Crude oil | 442,173 | - | - | - | 442,173 | |||||||||||||||
| Other products | 226,536 | 1,246,189 | - | - | 1,472,725 | |||||||||||||||
| Services | 87,670 | 12,951 | 3,147,359 | - | 3,247,980 | |||||||||||||||
| Natural gas | 1,615,471 | - | - | - | 1,615,471 | |||||||||||||||
| L.P.G. | 178,341 | 248,578 | - | - | 426,919 | |||||||||||||||
| Diesel and gasoline subsidies | 46,336 | 412,736 | - | - | 459,072 | |||||||||||||||
| Plastic and rubber | - | 670,368 | - | - | 670,368 | |||||||||||||||
| Total local sales | $ | 2,597,768 | $ | 20,969,886 | $ | 3,147,359 | $ | - | $ | 26,715,013 | ||||||||||
| Foreign Sales | Exploration & Production | Refining Activities | Transportation | Eliminations | Total | |||||||||||||||
| Crude oil | $ | 36,311,351 | $ | - | $ | - | $ | - | $ | 36,311,351 | ||||||||||
| Fuel oil | - | 3,921,703 | - | - | 3,921,703 | |||||||||||||||
| Gasolines | - | 127,091 | - | - | 127,091 | |||||||||||||||
| Diesel | - | 179,738 | - | - | 179,738 | |||||||||||||||
| L.P.G | 13,444 | 30,477 | - | - | 43,921 | |||||||||||||||
| Natural gas | 423,462 | - | - | - | 423,462 | |||||||||||||||
| Plastic and rubber | - | 975,862 | - | - | 975,862 | |||||||||||||||
| Other products and services | 30,450 | 196,747 | - | - | 227,197 | |||||||||||||||
| Total foreign sales | $ | 36,778,707 | $ | 5,431,618 | $ | - | $ | - | $ | 42,210,325 | ||||||||||
Sales of products by segment December 31, 2013
| Local Sales | Exploration & Production | Refining Activities | Transportation | Eliminations | Total | |||||||||||||||
| Medium distillates | $ | 4,428 | $ | 11,578,473 | $ | - | $ | - | $ | 11,582,901 | ||||||||||
| Gasolines | 613 | 5,967,471 | - | - | 5,968,084 | |||||||||||||||
| Crude oil | 1,145,278 | - | - | - | 1,145,278 | |||||||||||||||
| Other products | 327,234 | 1,123,788 | - | - | 1,451,022 | |||||||||||||||
| Services | 12,394 | 4,935 | 2,512,135 | - | 2,529,464 | |||||||||||||||
| Natural gas | 1,527,691 | - | - | - | 1,527,691 | |||||||||||||||
| L.P.G. | 136,042 | 239,316 | - | - | 375,358 | |||||||||||||||
| Diesel and gasoline subsidies | - | 938,679 | - | - | 938,679 | |||||||||||||||
| Plastic and rubber | - | 615,424 | - | - | 615,424 | |||||||||||||||
| Total local sales | $ | 3,153,680 | $ | 20,468,086 | $ | 2,512,135 | $ | - | $ | 26,133,901 | ||||||||||
| Foreign Sales | Exploration & Production | Refining Activities | Transportation | Eliminations | Total | |||||||||||||||
| Crude oil | $ | 35,820,182 | $ | - | $ | - | $ | - | $ | 35,820,182 | ||||||||||
| Fuel oil | - | 5,374,617 | - | - | 5,374,617 | |||||||||||||||
| Gasolines | - | 52,664 | - | - | 52,664 | |||||||||||||||
| Diesel | - | 23,231 | - | - | 23,231 | |||||||||||||||
| L.P.G | 8,702 | 19,988 | - | - | 28,690 | |||||||||||||||
| Natural gas | 586,687 | - | - | - | 586,687 | |||||||||||||||
| Plastic and rubber | - | 2,029,870 | - | - | 2,029,870 | |||||||||||||||
| Other products and services | 25,154 | 353,719 | - | - | 378,873 | |||||||||||||||
| Total foreign sales | $ | 36,440,725 | $ | 7,854,089 | $ | - | $ | - | $ | 44,294,814 | ||||||||||
Ecopetrol S.A. and Subsidiaries
Notes to the Consolidated Financial Statements
Years ended December 31, 2014, 2013 and 2012
(Expressed in millions of Colombian pesos)
Sales of products by segment December 31, 2012
| Local Sales | Exploration & Production | Refining Activities | Transportation | Eliminations | Total | |||||||||||||||
| Medium distillates | $ | 1,839 | $ | 11,131,140 | $ | - | $ | - | $ | 11,132,979 | ||||||||||
| Gasolines | - | 5,697,178 | - | - | 5,697,178 | |||||||||||||||
| Crude oil | 823,191 | - | - | - | 823,191 | |||||||||||||||
| Other products | 116,265 | 1,112,132 | - | - | 1,228,397 | |||||||||||||||
| Services | 123,913 | 34,947 | 1,923,377 | - | 2,082,237 | |||||||||||||||
| Natural gas | 1,382,396 | - | - | - | 1,382,396 | |||||||||||||||
| L.P.G. | 148,750 | 343,690 | - | - | 492,440 | |||||||||||||||
| Diesel and gasoline subsidies | - | 809,773 | - | - | 809,773 | |||||||||||||||
| Plastic and rubber | 91 | 713,231 | - | - | 713,322 | |||||||||||||||
| Total local sales | $ | 2,596,445 | $ | 19,842,091 | $ | 1,923,377 | $ | - | $ | 24,361,913 | ||||||||||
| Foreign Sales | Exploration & Production | Refining Activities | Transportation | Eliminations | Total | |||||||||||||||
| Crude oil | $ | 35,886,859 | $ | - | $ | - | $ | - | $ | 35,886,859 | ||||||||||
| Fuel oil | - | 4,283,814 | - | - | 4,283,814 | |||||||||||||||
| Gasolines | - | 1,182,367 | - | - | 1,182,367 | |||||||||||||||
| Diesel | - | 1,216,213 | - | - | 1,216,213 | |||||||||||||||
| L.P.G | 2,968 | 48,540 | - | - | 51,508 | |||||||||||||||
| Natural gas | 563,412 | - | - | - | 563,412 | |||||||||||||||
| Plastic and rubber | - | 754,648 | - | - | 754,648 | |||||||||||||||
| Other products and services | 20,622 | 530,646 | - | - | 551,268 | |||||||||||||||
| Total foreign sales | $ | 36,473,861 | $ | 8,016,228 | $ | - | $ | - | $ | 44,490,089 | ||||||||||
NOTE: Certain amounts of the consolidated financial statements of December 2013 and December 2012 were reclassified for presentation purposes consistent with those of December 31, 2014.2016, was COP$155,359.
| Hedges with derivatives to minimize currency risk |
The Company carries out forwards hedging operations using the Non-Delivery modality whose purpose is majoritymitigating the volatility of the exchange rate in the cash flow required for operations of its subsidiary Ocensa, whose functional currency is US dollars. The forward hedging instruments used enable setting the sale price in US dollars, seeking to counteract the effects from devaluation or revaluation at the time in which Ocensa monetizes the resources necessary to fulfill its monthly or specific obligations relative to operational cost and tax payments, which are payable in Colombian pesos.
As of December 31, 2016 there are forwards contracts with a net short position of US $323 million (2015 - US $387). The impact on the income statement resulting from the liquidation of these hedges amounting to COP$42,865 of profit (2015- COP$86,914 of loss) and the amount recognized on the other comprehensive income was COP$33,869 of profit (2015 – COP$60,083 of loss).
| F-86 |
Ecopetrol S.A. Notes to Consolidated Financial Statements (Figures expressed in millions of Colombian pesos, unless otherwise stated) |
| 31.2.4 | Sensitivity analysis for exchange rate risk |
The following table shows the impact that a variation of 1% and 5% in the exchange rate of the Colombian peso vs the US dollar would have on the assets and liabilities held in such currency at December 31, 2016:
Scenario/ | Effect on income before taxes (+/-) | Effect on other comprehensive income (+/-) | ||||||||
| 1% | 86,363 | 451,577 | ||||||||
| 5% | 431,813 | 2,257,884 | ||||||||
The sensitivity analysis includes only monetary assets and monetary liabilities held in foreign currency at the closing date.
| 31.3 | Credit risk |
Credit risk is the risk that the Company may suffer losses as a consequence of the breach of contracts for purchase and sale of crude oil, gas, refined and petrochemical products and transportation services, in addition to the financial institutions in which it keeps investments or the counterparties with which it has contracted derivative financial instruments.
Credit risk for customers
In performance of the sale process of crude oil, gas, refined and petrochemical products and transportation services the Company may be exposed to credit risk in the event that customers fail to comply with their payment obligations. Risk management has designed mechanisms and procedures that have permitted the Company to minimize the probability of materialization thus safeguarding the Company’s cash flow.
The Company performs a continuous analysis of the financial strength of its counterparties which implies their classification according to their risk level and financial supports in the event of a cessation of payments. In addition, a constant monitoring is made of the national and international market conditions in order to establish early alerts of major changes that may have an impact on the timely payment of obligations from customers of the Company.
For the bad debts, an individual analysis is performed that allow to analyze the situation of each customer and thus define the applicable allowance to be established, such as age of receivables. The group carries out the administrative and legal actions necessary to recover past due accounts receivable as well as the recognition of interest of customers who do not comply with payment policies.
The business group does not have significant concentrations of credit risk. The following is the analysis of aging of customer portfolio in arrears but not impaired, at December 31, 2016 and 2015:
| 2016 | 2015 | |||||||
| Less than 3-month overdue | 179,008 | 71,791 | ||||||
| Between 3- and 6- month overdue | 14,275 | 4,862 | ||||||
| More than 6-month overdue | 103,574 | 116,849 | ||||||
| Total | 296,857 | 193,502 | ||||||
| F-87 |
Ecopetrol S.A. Notes to Consolidated Financial Statements (Figures expressed in millions of Colombian pesos, unless otherwise stated) |
Credit quality of resources in financial assets
Following the promulgation of Decree 1525 of 2008, which provides general rules on investments for public entities, Ecopetrol’s management established guidelines for our investment portfolios. These guidelines determine that investments in Ecopetrol’s U.S. dollar portfolio are generally limited to investments of our excess cash in fixed-income securities issued by entities rated A or higher in the long term and A1/P1/F1 or higher in the short term (international scale) by Standard & Poor’s Ratings Services, Moody’s Investors Service or Fitch Ratings.
In addition, Ecopetrol may also invest in securities issued or guaranteed by the U.S. government or Colombian government, without regard to the ratings assigned to such securities. In Ecopetrol’s peso portfolio, it must invest cash excess in fixed-income securities of issuers rated AAA in the long term, and F1+/BRC1+ in the short term (local scale) by Fitch Ratings Colombia or BRC Standard & Poor’s. In addition, Ecopetrol may also invest in securities issued or guaranteed by the Colombian government without rating restrictions.
In order to diversify risk in our peso portfolio, Ecopetrol does not invest more than 10% of the excess of cash in one specific issuer. In the case of our U.S. dollar portfolio, it does not invest more than 5% of the excess of cash in one specific issuer in the short term (up to 1 year), or 1% in the long term. The Company complied with this policy as of December 31,2016 and 2015.
The tables below reflects the credit quality of issuers and counterparties in transactions involving financial instruments at December 31, 2016 and 2015:
| Cash and cash equivalents | Other financial assets | Plan assets | ||||||||||||||||||||||
| Credit quality | 2016 | 2015 | 2016 | 2015 | 2016 | 2015 | ||||||||||||||||||
| AAA | 3,198,394 | 581,303 | 1,858,665 | 1,130,216 | 9,077,893 | 7,597,462 | ||||||||||||||||||
| F1+ | 2,188,471 | 3,696,327 | 1,636,039 | 217,493 | 416,439 | 43,351 | ||||||||||||||||||
| A1 | 1,466,015 | - | 3,060,660 | - | - | - | ||||||||||||||||||
| F1 | 545,872 | 1,247,398 | - | 48,919 | - | - | ||||||||||||||||||
| F2 | 409,717 | 421,084 | - | - | - | - | ||||||||||||||||||
| BRC 1+ | 312,290 | 120,217 | - | - | 309,282 | 221,257 | ||||||||||||||||||
| Prime-2 | 78,989 | - | - | - | - | - | ||||||||||||||||||
| A1+ | 73,470 | 294,931 | - | - | - | - | ||||||||||||||||||
| F3 | 37,172 | - | - | - | - | - | ||||||||||||||||||
| Prime-3 | 32,748 | 31,862 | - | - | - | - | ||||||||||||||||||
| B | 144 | - | - | - | - | - | ||||||||||||||||||
| AA+ | - | - | 50,192 | - | 470,944 | 661,604 | ||||||||||||||||||
| AA | - | - | 5,289 | - | 79,750 | 68,481 | ||||||||||||||||||
| AA- | - | - | 3,730 | - | 34,197 | 55,077 | ||||||||||||||||||
| A | - | - | - | - | 4,175 | 4,682 | ||||||||||||||||||
| BBB+ | - | - | - | - | 193,835 | 196,815 | ||||||||||||||||||
| BBB | - | - | - | 125,936 | 150,808 | 388,586 | ||||||||||||||||||
| BBB- | - | - | - | - | 23,237 | 1,569,850 | ||||||||||||||||||
| BB+ | - | - | - | - | - | 28,999 | ||||||||||||||||||
| BB | - | - | - | - | - | 22,572 | ||||||||||||||||||
| CCC | - | - | - | - | 489 | 1,035 | ||||||||||||||||||
| A- | - | - | - | - | 9,111 | - | ||||||||||||||||||
| A+ | - | - | - | - | 8,841 | - | ||||||||||||||||||
| A3 | - | - | - | - | 61,325 | - | ||||||||||||||||||
| AA3 | - | - | - | - | 14,385 | - | ||||||||||||||||||
| BA2 | - | - | - | - | 3,006 | - | ||||||||||||||||||
| BA3 | - | - | - | - | 12,802 | - | ||||||||||||||||||
| BAA1 | - | - | - | - | 5,274 | - | ||||||||||||||||||
| BAA2 | - | - | - | - | 141,940 | - | ||||||||||||||||||
| BAA3 | - | - | - | - | 131,993 | - | ||||||||||||||||||
| BB- | - | - | - | - | 11,001 | - | ||||||||||||||||||
| BRC1 | - | - | - | - | 7,710 | - | ||||||||||||||||||
| BRC2+ | - | - | - | - | 5,763 | - | ||||||||||||||||||
| CC | - | - | - | - | 734 | - | ||||||||||||||||||
| SP1+ | - | - | - | - | 7,013 | - | ||||||||||||||||||
| VRR1+ | - | - | - | - | 55,821 | - | ||||||||||||||||||
| Unrated | 67,185 | 157,328 | 72,320 | 62,815 | 885,407 | 701,717 | ||||||||||||||||||
| Total | 8,410,467 | 6,550,450 | 6,686, 895 | 1, 585,379 | 12,123,175 | 11,561,488 | ||||||||||||||||||
| F-88 |
Ecopetrol S.A. Notes to Consolidated Financial Statements (Figures expressed in millions of Colombian pesos, unless otherwise stated) |
| 31.4 | Interest rate risk |
Interest rate risk arises from Ecopetrol’s exposure to changes in interest rates because the group has fixed floating-rate instruments in Ecopetrol’s investment portfolio and issuances of floating rate debt linked to LIBOR, DTF and IPC rates. Thus, interest rate volatility may affect the fair value and cash flows related to the Company's investments and the financial expense of floating rate loans and financing.
As of December 31, 2016 and 2015 31% of indebtedness has a floating rate. As a result, if the market interest rate rises financing costs will increase which could have an adverse effect on the results of operations.
Ecopetrol controls the exposure to interest rate risk by establishing limits to its effective duration, Value at Risk - VAR andtracking error.
Autonomous equities linked to Ecopetrol’s pension obligations are also exposed to changes in interest rates, as they include fixed and floating rate instruments that are marked to market. Colombian regulation for pension funds, as stipulated in the Decree 941 of 2002 and Decree 1861 of 2012, indicates that they have to follow the same regime as the regular obligatory pension funds in their moderate portfolio.
The following table provides information about the sensitivity of Company´s results and other comprehensive income for the next 12 months to variations in interest rate of 100 basis points:
| Financial liabilities | Financial assets | Plan assets | ||||||||||
| Variation in interest rate | (Financial expenses) | (Financial income) | (Other comprehensive income) | |||||||||
| + 100 basis points | 321,000 | 40,670 | 376,255 | |||||||||
| - 100 basis points | (245,568 | ) | (40,670 | ) | (383,158 | ) | ||||||
Sensitivity analysis of discount rates on pension plans is shown in the Note 22 – Provisions for employee benefits.
| 31.5 | Liquidity risk |
The ability to access the capital necessary to finance the Company´s investment plans on acceptable terms, can be limited due to deterioration in market conditions. A new financial crisis could worsen the risk perception in the emerging markets.
Risks related to Colombia’s political and regional environment could also make it more difficult to access the international capital markets. These conditions, along with significant write-offs in the financial services sector and the re-pricing of credit risk, can make it difficult to obtain funding for capital needs on favorable terms. As a result, we may be forced to revise the timing and scope of these projects as necessary to adapt to existing market and economic conditions, or access the financial markets on terms less favorable; therefore, negatively affecting the Company´s results of operations and financial condition.
Liquidity risk is managed in accordance with the Company´s policies aimed at ensuring that there are sufficient net funds to meet the Company's financial commitments within its maturity schedules with no additional costs. The main method for the measurement and monitoring of liquidity is cash flow forecasting.
The following is a summary of the maturity of financial liabilities at December 31, 2016. The amounts disclosed in the table are the contractual undiscounted cash flows. The payments in foreign currency were restated taking a constant exchange rate of $ 3,000.71 Colombian pesos per dollar. Consequently, these amounts may not reconcile with the amounts disclosed on the consolidated statement of financial position:
| Up to 1 year | 1-5 years | 5-10 years | > 10 years | Total | ||||||||||||||||
| Loans (principal and interests) | 4,268,060 | 29,965,353 | 25,736,624 | 20,589,796 | 80,559,833 | |||||||||||||||
| Trade and other accounts payable | 6,854,363 | 23,893 | - | - | 6,878,256 | |||||||||||||||
| Total | 11,122,423 | 29,989,246 | 25,736,624 | 20,589,796 | 87,438,089 | |||||||||||||||
| F-89 |
Ecopetrol S.A. Notes to Consolidated Financial Statements (Figures expressed in millions of Colombian pesos, unless otherwise stated) |
| 31.6 | Capital management |
The main objective of Ecopetrol’s Capital Management is to ensure a financial structure that will optimize the Company’s cost of capital, maximize the returns to its shareholders and allows access to financial markets at a competitive cost to cover is financing needs.
The leverage index at the relevant periods is comprised as follow at December 31, 2016 and 2015:
| 2016 | 2015 | |||||||
| Loans and borrowings (Note 20) | 52,222,027 | 53,223,338 | ||||||
| Cash and cash equivalents (Note 6) | (8,410,467 | ) | (6,550,450 | ) | ||||
| Other financial assets not restricted (Note 9) | (6,686,895 | ) | (885,547 | ) | ||||
| Net financial debt | 37,124,665 | 45,787,341 | ||||||
| Equity (Note 24) | 43,560,501 | 43,100,963 | ||||||
| Leverage (1) | 46.01 | % | 51.51 | % | ||||
| (1) | Net financial debt / (Net financial debt + Equity) |
| F-90 |
Ecopetrol S.A. Notes to Consolidated Financial Statements (Figures expressed in millions of Colombian pesos, unless otherwise stated) |
| 32. | Related parties |
Balances with associated companies and joint ventures as of December 31, 2016 and 2015 are as follows:
| Accounts receivable | Other assets | Accounts payable | Loans | |||||||||||||
| Joint ventures | ||||||||||||||||
| Equion Energía Limited | 97,601 | 7,135 | 89,666 | 30,644 | ||||||||||||
| Ecodiesel Colombia S.A. | 129 | - | 20,765 | - | ||||||||||||
| Offshore International Group (1) | 170,121 | - | - | - | ||||||||||||
| Associates | ||||||||||||||||
| Serviport S.A. | - | - | 3,989 | - | ||||||||||||
| Balance at December 31, 2016 | 267,851 | 7,135 | 114,420 | 30,644 | ||||||||||||
| Accounts receivable | Other assets | Accounts payable | Loans | |||||||||||||
| Joint ventures | ||||||||||||||||
| Equion Energía Limited | 64,583 | 28,668 | 62,861 | 45,913 | ||||||||||||
| Ecodiesel Colombia S.A. | - | - | 22,243 | - | ||||||||||||
| Associates | ||||||||||||||||
| Serviport S.A. | 141 | - | 2,359 | - | ||||||||||||
| Balance at December 31, 2015 | 64,724 | 28,668 | 87,463 | 45,913 | ||||||||||||
(1) The accounts receivable correspond to a loan granted to Offshore International Group Inc. for US $57 million in April 2016, at an interest rate of 4.99% payable semi-annually from 2017 and maturing in 2021.
The amounts outstanding are not guaranteed and will be settled in cash. No expense has been recognized in the current period or in prior periods with respect to uncollectible or doubtful accounts related to amounts owed by related parties.
The main transactions with related entities for the years ended December 31, 2016, 2015 and 2014 are detailed as follows:
| 2016 | 2015 | 2014 | ||||||||||||||||||||||
| Sales and services | Purchases and others | Sales and services | Purchases and others | Sales and services | Purchases and others | |||||||||||||||||||
| Joint ventures | ||||||||||||||||||||||||
| Equion Energía Limited | 491,698 | 418,618 | 515,968 | 190,158 | 908,357 | 79,264 | ||||||||||||||||||
| Ecodiesel Colombia S.A. | 5,744 | 265,584 | 7,245 | 267,647 | 3,840 | 220,834 | ||||||||||||||||||
| Offshore International Group | 6,285 | - | - | - | - | - | ||||||||||||||||||
| Associates | ||||||||||||||||||||||||
| Serviport S.A. | - | 24,572 | - | - | - | - | ||||||||||||||||||
| Total | 503,727 | 708,774 | 523,213 | 457,805 | 912,197 | 300,098 | ||||||||||||||||||
The dividends received by these companies are listed in Note 14 - Investments in companies.
| F-91 |
Ecopetrol S.A. Notes to Consolidated Financial Statements (Figures expressed in millions of Colombian pesos, unless otherwise stated) |
| 32.1 | Key executives management |
Based on a resolution adopted at the annual shareholders’ meeting in 2012 compensation to directors is the equivalent of four to six minimum monthly wage salaries, which totals approximately COP $3,870,000 pesos for 2015 and COP $4,140,000 pesos for 2016. Fees for attendance at virtual meetings are set at 50% of the face-to-face meeting fee. The Board of Directors is not subject to any variable remuneration.The amount canceled in 2016 for fees to Board members amounted to COP$1,253 (2015 - COP$1,238).
The total compensation paid to Directors, executive officers and senior management during the year ended December 31, 2016 amounted to COP$13,901 (2015 - COP$6,690). The Directors are not eligible to receive pension and retirement benefits. The total amount set aside as of December 31, 2016 to provide pension and retirement benefits to our eligible executive officers amounted to COP$4,674 (2015 - COP$10,341).
As of December 31, 2016, the following key management executives owned less than 1% of the outstanding shares of Ecopetrol, as follows:
| Key management executive | % Shareholding | ||
| Joaquín Moreno Uribe | <1% of outstanding shares | ||
| Mauricio Cárdenas Santamaría | <1% of outstanding shares | ||
| Héctor Manosalva Rojas | <1% of outstanding shares | ||
| Rafael Espinosa Rozo | <1% of outstanding shares | ||
| Patricia Stella Zuluaga | <1% of outstanding shares | ||
| Juan Carlos Echeverry | <1% of outstanding shares |
| 32.2 | Post-employment benefit plans |
The administration and management of resources for payment of Ecopetrol's pension obligations are managed by pension autonomous equities (PAP, by its acronym in Spanish) which serve as guarantee and payment source. These funds were established in compliance with the provisions of decree 2153 of 1999 which authorized as of December 31, 2008 partial commutation of the value corresponding to monthly payments, bonuses and contributions, transferring said obligations and money supporting them to autonomous patrimonies of a pensional nature.
As of December 31, 2016, the entities managing these resources were: Fiduciaria Bancolombia, Fiduciaria de Occidente and Consorcio Ecopetrol PAAC (comprised by Fiduciaria La Previsora, Fiduciaria Bancoldex, Fiduciaria Agraria and Fiduciaria Central). These entities will manage pension resources for a five-year term (2016 - 2021) and as consideration they receive a remuneration with fixed and variable components which is calculated on the gross yield of the portfolios and are charged to manage resources.
| 32.3 | Government related parties |
Colombian Government so other state-owned companies andholds control of Ecopetrol with a stock ownership of 88.49%. The most significant transactions with governmental entities are consideredcomprised as follows:
| a) | Purchase of oil form the National Hydrocarbons Agency - ANH |
Because of the business nature the Company has a direct relationship with ANH, an entity which operates under the Ministry of Mines and Energy rules, of which objective is to be related parties. In addition to those transactions disclosed in 3.10 Related Party Transactions, numerous transactions with these entities exist. The most significant of them are disclosed below.manage the oil and gas reserves and resources owned by the Colombian Nation.
Fuel subsidy: Selling prices of regular motor gasoline and diesel are regulated by government. However a subsidy is granted to producers to compensate the difference between selling price and U.S. Gulf reference market price. The amount received by the Company in 2014, 2013 and 2012 was $485,409, $938,679, and $809,773, respectively.
| F-92 |
Ecopetrol S.A. Notes to Consolidated Financial Statements (Figures expressed in millions of Colombian pesos, unless otherwise stated) |
Purchases of hydrocarbons from ANH: The CompanyEcopetrol purchases the physical productcrude oil that the ANH receives from all producers in Colombia at the prices set forthin accordance with a jointly established formula, which reflects the export sale prices (crude oils and products), adjustment to the API gravity quality, sulfur content, transportation rates from the wellhead to the ports of Coveñas and Tumaco, refining process cost and a commercialization rate. This contract was extended to June 30, 2018.
At December 2013 the Company commercialized, on behalf of the ANH, the natural gas received by Law 756the latter in kind from the producers. Since January 2014 ANH receives the royalties in cash for the production of 2002natural gas.
The purchase value of oil and Resolution 18-1709gas from AHN is detailed in Note 26 - Cost of 2003, which references international prices.sales.
Additionally Ecopetrol, like other oil companies, takes part in "rounds" for the allocation of exploration blocks in Colombia without implying special treatment for Ecopetrol on account of it being an entity whose majority shareholder is the Ministry of Finance.
| b) | Price differential |
Regular gasoline and diesel sale prices are regulated by the National Government. In this case, there are differentials between the volume reported by the Colombian companies at the time of the sale and the difference between the parity price and the benchmark price, where the parity price is that corresponding to the daily motor gasoline and diesel prices observed during the month. These differentials may be in favor or against the producers. The value of this differential is detailed in Note 25 - Sales revenue and 7 – Trade and other receivables, net.
| c) | National Tax and Customs Direction |
Ecopetrol, just like any other company in Colombia, has tax obligations that it must comply with in respect of this entity and Ecopetrol does not have any other kind of association or commercial relationship with it. For more information on this transaction, please see Note 24.10 – Taxes.
| d) | Comptroller General of the Republic |
Ecopetrol, just like any other state entity in Colombia, is obliged to comply with the requirements set out by this control entity and make an annual payment to this entity on account of a maintenance fee. Ecopetrol does not have any other kind of association or commercial relationship with this entity.
| F-93 |
Ecopetrol S.A. Notes to Consolidated Financial Statements (Figures expressed in millions of Colombian pesos, unless otherwise stated) |
| 33. | Joint operations |
The Company also paid in kind royalties over certain fields as set forth in Law 141 of 1994, the Administrative Agreement of Collaborative Collection of Liquid Hydrocarbon Royaltiescarries out exploration and production operations through Exploration and Production (E&P) Contracts, Technical Evaluation (TEA) Contracts and Agreements signed on September 16, 2010, with the National Hydrocarbons Agency or ANH, as well as through Partnership Contracts and Decree 4923other types of 2011.contracts. The quantitiesmain joint operations in 2016 are as follows:
Contracts in which Ecopetrol is not the operator:
| Partners | Contract | Type | % Participation | Geographic area of operations | |||||
| Chipirón | 30-47% | ||||||||
| Cosecha | 30% | ||||||||
| Occidental Andina LLC | Cravo norte | Production | 50% | Colombia | |||||
| Rondón | 50% | ||||||||
| Chevron Petroleum Company | Guajira | Production | 57% | Colombia | |||||
| Mansarovar Energy Colombia Ltd | Nare | Production | 50% | Colombia | |||||
| Meta Petroleum Corp | Quifa | Production | 30% | Colombia | |||||
| Equion Energía Limited | Piedemonte | Production | 50% | Colombia | |||||
| Casanare | 64% | ||||||||
| Corocora | 56% | ||||||||
| Perenco Colombia Limited | Estero | Production | 89% | Colombia | |||||
| Garcero | 76% | ||||||||
| Orocúe | 63% | ||||||||
| Casanare | 13% | ||||||||
| Estero | 7% | ||||||||
| Perenco Colombia Limited | Garcero | Production | 15% | Colombia | |||||
| Orocue | 23% | ||||||||
| Corocora | 28% | ||||||||
| Noble Energy | Gunflint | Production | 32% | ||||||
| Murphy Oil | Dalmatian | Production | 30% | EEUU | |||||
| Anadarko | K2 | Production | 9% | ||||||
| ONGC Videsh Limited Sucursal Colombia | Ronda Caribe RC-10 | Exploration | 50% | Offshore North Caribbean | |||||
| Petrobras, Repsol & Statoil | Tayrona | Exploration | 30% | Offshore North Caribbean | |||||
| Repsol & Statoil | TEA GUA OFF-1 | Exploration | 50% | Offshore North Caribbean | |||||
| Anadarko | Fuerte Norte | Exploration | 50% | Offshore North Caribbean | |||||
| Fuerte Sur | 50% | ||||||||
| Equion Energía Limited | Niscota | Exploration | 20% | Colombia | |||||
| PAMA-M-187 | |||||||||
| PAMA-M-188 | |||||||||
| Petrobras | PAMA-M-222 | Exploration | 30% | Brazil | |||||
| PAMA-M-223 | |||||||||
| BM-S-63 | |||||||||
| Vanco | BM-S-71 | Exploration | 30% | Brazil | |||||
| BM-S-72 | |||||||||
| Shell | Deep Rydberg/Aleatico | Exploration | 29% | ||||||
| Repsol | Leon | Exploration | 40% | ||||||
| Stone Energy | Parmer | Exploration | 30% | EEUU | |||||
| Murphy Oil | Sea Eagle | Exploration | 50% | ||||||
| Anadarko | Warrior | Exploration | 20% |
| F-94 |
Ecopetrol S.A. Notes to Consolidated Financial Statements (Figures expressed in millions of Colombian pesos, unless otherwise stated) |
Termination of oilRubiales and gas paidPirirí contracts
Since July 1, 2016 Ecopetrol took over the direct operation of the Rubiales field, which up to that date had been operated by Pacific Rubiales Energy. Upon termination of the contract Ecopetrol received the assets from said operation and the obligations associated with the BOMT contracts for US$46 million.
Termination ofTauramena association agreement
On July 3, 2016, the Tauramena Association Agreement was terminated and for this reason, Ecopetrol began to operate directly the Cusiana field, Casanare. Since its commercialization in 1993 it was operated first by BP and then by Equion. Cusiana represents for Ecopetrol a 98% participation in the Unified Exploitation Plan (PEU) of the field, while Equión and Emerald will maintain both 2%.
Contracts in which Ecopetrol is the operator:
| Partners | Contract | Type | % Participation | Geographic area of operations | |||||
| VMM29 | |||||||||
| ExxonMobil Exploration Colombia | CR2 | Exploration | 50% | Colombia | |||||
| C62 | |||||||||
| Talisman Colombia Oil | CPO9 | Exploration | 55% | Colombia | |||||
| ONGC Videsh Limited Sucursal Colombia | Ronda Caribe Nueve | Exploration | 50% | Colombia | |||||
| CPVEN Sucursal Colombia | VMM32 | Exploration | 51% | Colombia | |||||
| Shell Exploración and Producción | CR4 | Exploration | 50% | Colombia | |||||
| SK Innovation Co Ltd. | San Jacinto | Exploration | 70% | Colombia | |||||
| Repsol Exploración Colombia S.A. | Catleya | Exploration | 50% | Colombia | |||||
| Emerald Energy PLC Suc. Colombia | Cardon | Exploration | 50% | Colombia | |||||
| Maurel & Prom Colombia | CPO 17 | Exploration | 50% | Colombia | |||||
| JX Nippon | FAZ M-320 R11 | Exploration | 70% | Brazil | |||||
| Lewis | Clarinero | Exploration y Production (E&P) | 50% | Colombia | |||||
| Gas Ltd. | CPO9 - Akacias | Production | 55% | Colombia | |||||
| Occidental Andina LLC | La Cira Infantas | Production | 54% | Colombia | |||||
| Teca | 87% | Colombia | |||||||
| Ramshorn International Limited | Guariquies I | Production | 50% | Colombia | |||||
| Equion Energía Limited | Cusiana | Production | 98% | Colombia | |||||
| Planta de gas | |||||||||
| Perenco Oil And Gas | 18% | ||||||||
| Cepsa Colombia | San Jacinto y Rio Paez | Production | 18% | Colombia | |||||
| 18% | |||||||||
| Equion Energía Limited Emerald Energy Pacific Rubiales | OAM | Production | 45% | Colombia |
| F-95 |
Ecopetrol S.A. Notes to Consolidated Financial Statements (Figures expressed in millions of Colombian pesos, unless otherwise stated) |
| 34. | Segment information |
The description of the business segments can be seen in note 4.19 – Information by business segment.
| 34.1 | Statement of profit or loss |
The following segment information is reported based on the information used by the Board of Directors as in-kind royaltiesthe top body to make strategic and operational decisions of these business segments. The performance of the ANHsegments are based primarily on an analysis of income, costs, expenses and results for the period generated by each segment which are regularly monitored.
The information disclosed in each segment is presented net of transactions between the Ecopetrol Group companies.
The following presents the consolidated statement of profit or loss for the years ended December 31, 2014, 20132016, 2015 and 2012 were 45,421,258, 51,973,436 boe and 54,095,846 boe, respectively.2014:
| F-96 |
Ecopetrol S.A. Notes to Consolidated Financial Statements (Figures expressed in millions of Colombian pesos, unless otherwise stated) |
The following tables present consolidated accounts receivable, accounts payable as well as revenues and expenses with related parties of the Company as of December 31, 2014 and 2013:
Ecopetrol S.A. and Subsidiaries
Notes to the Consolidated Financial Statements
Years ended December 31, 2014, 2013 and 2012
(Expressed in millions of Colombian pesos)
| For the year ended December 31, 2016 | ||||||||||||||||||||
| Exploration and production | Refining and petrochemicals | Transportation and logistics | Eliminations | Total | ||||||||||||||||
| Third-party sales | 20,527,332 | 24,194,024 | 3,764,205 | - | 48,485,561 | |||||||||||||||
| Inter-segment sales | 7,693,878 | 629,690 | 6,884,571 | (15,208,139 | ) | - | ||||||||||||||
| Total sales revenue | 28,221,210 | 24,823,714 | 10,648,776 | (15,208,139 | ) | 48,485,561 | ||||||||||||||
| Fixed cost | 6,940,074 | 2,458,745 | 2,861,269 | (2,968,780 | ) | 9,291,308 | ||||||||||||||
| Variable cost | 16,032,574 | 20,385,242 | 488,522 | (11,946,223 | ) | 24,960,115 | ||||||||||||||
| Cost of sales | 22,972,648 | 22,843,987 | 3,349,791 | (14,915,003 | ) | 34,251,423 | ||||||||||||||
| Gross profit | 5,248,562 | 1,979,727 | 7,298,985 | (293,136 | ) | 14,234,138 | ||||||||||||||
| Administration expenses | 832,266 | 574,413 | 516,884 | (295 | ) | 1,923,268 | ||||||||||||||
| Operation and projects expenses | 1,656,960 | 1,206,718 | 180,353 | (292,344 | ) | 2,751,687 | ||||||||||||||
| Impairment of non-current assets | 196,448 | 773,361 | (41,062 | ) | - | 928,747 | ||||||||||||||
| Other operating income and expenses, net | (349,419 | ) | 20,947 | 53,559 | 801 | (274,112 | ) | |||||||||||||
| Operating income | 2,912,307 | (595,712 | ) | 6,589,251 | (1,298 | ) | 8,904,548 | |||||||||||||
| Financial result, net | ||||||||||||||||||||
| Financial income | 983,472 | 46,469 | 61,373 | 220,429 | 1,311,743 | |||||||||||||||
| Financial expenses | (2,017,641 | ) | (952,006 | ) | (262,844 | ) | (231,049 | ) | (3,463,540 | ) | ||||||||||
| Foreign exchange gain (loss), net | 923,573 | 94,715 | (41,858 | ) | - | 976,430 | ||||||||||||||
| (110,596 | ) | (810,822 | ) | (243,329 | ) | (10,620 | ) | (1,175,367 | ) | |||||||||||
| Share of profit of associates | 39,397 | 22,785 | (837 | ) | - | 61,345 | ||||||||||||||
| Income before tax | 2,841,108 | (1,383,749 | ) | 6,345,085 | (11,918 | ) | 7,790,526 | |||||||||||||
| Income tax | (1,518,738 | ) | (446,595 | ) | (2,577,713 | ) | - | (4,543,046 | ) | |||||||||||
| Net income for the period | 1,322,370 | (1,830,344 | ) | 3,767,372 | (11,918 | ) | 3,247,480 | |||||||||||||
| Income attributable to: | ||||||||||||||||||||
| Company’s shareholders | 1,322,370 | (1,823,020 | ) | 2,960,449 | (11,918 | ) | 2,447,881 | |||||||||||||
| Non-controlling interests | - | (7,324 | ) | 806,923 | - | 799,599 | ||||||||||||||
| 1,322,370 | (1,830,344 | ) | 3,767,372 | (11,918 | ) | 3,247,480 | ||||||||||||||
| Supplementary information | ||||||||||||||||||||
| Depreciation, depletion and amortization | 5,482,827 | 1,145,780 | 978,394 | - | 7,607,001 | |||||||||||||||
| 2014 | 2013 | |||||||||||||||
| Assets | Liabilities | Assets | Liabilities | |||||||||||||
| Direccion de Impuestos y Aduanas Nacionales | $ | 5,308,166 | $ | 782,497 | $ | 4,893,051 | $ | 866,996 | ||||||||
| E.S.P. Empresa de Energía de Bogotá S.A. | 1,072,880 | - | 968,735 | - | ||||||||||||
| Interconexión Eléctrica S.A. | 508,611 | - | 536,222 | - | ||||||||||||
| Ministerio de Minas y Energía | 206,767 | 71 | 50,401 | 278 | ||||||||||||
| Ministerio de Hacienda y Crédito Público | 119,727 | 620 | 586,870 | 1,457,389 | ||||||||||||
| Entidades Territoriales | 97,781 | 120,914 | 63,217 | 39,307 | ||||||||||||
| E.S.P. Generadora y Comercializadora de Energía del Caribe S.A. | 20,345 | 26,214 | 11,184 | 2,231 | ||||||||||||
| Isagen S.A. | 14,226 | 12,569 | 12,689 | 5 | ||||||||||||
| Empresas Públicas de Medellín | 8,796 | 28,151 | 9,168 | 101 | ||||||||||||
| Banco Agrario de Colombia | 5,316 | 80,397 | 5,482 | 276,128 | ||||||||||||
| U.A.E. Agencia Nacional de Hidrocarburos | 1,157 | 18,064 | 61 | 2,345 | ||||||||||||
| Instituto Colombiano de Bienestar Familiar | 925 | 1,924 | - | 2,315 | ||||||||||||
| Contraloría General de la Republica | - | - | - | 87,923 | ||||||||||||
| Ministerio de Defensa Nacional | - | 66,234 | - | - | ||||||||||||
| Fondo Rotario de la Policía Nacional | - | 6,776 | - | 138 | ||||||||||||
| Corporación Autónoma Regional de la Frontera Nororiental | - | 6,363 | - | 1 | ||||||||||||
| Others | 10,164 | 26,304 | 10,178 | 12,197 | ||||||||||||
| $ | 7,374,861 | $ | 1,177,098 | $ | 7,147,258 | $ | 2,747,354 | |||||||||
| F-97 |
Ecopetrol S.A. Notes to Consolidated Financial Statements (Figures expressed in millions of Colombian pesos, unless otherwise stated) |
Other transactions with related parties during 2014, 2013 and 2012 are:
| For the year ended December 31, 2015 | ||||||||||||||||||||
| Exploration and production | Refining and petrochemicals | Transportation and logistics | Eliminations | Total | ||||||||||||||||
| Third-party sales | 25,669,213 | 22,456,866 | 4,221,192 | - | 52,347,271 | |||||||||||||||
| Inter-segment sales | 6,063,398 | 788,810 | 6,623,358 | (13,475,566 | ) | - | ||||||||||||||
| Total Revenue | 31,732,611 | 23,245,676 | 10,844,550 | (13,475,566 | ) | 52,347,271 | ||||||||||||||
| Fixed costs | 7,208,632 | 1,902,797 | 3,304,815 | (2,790,793 | ) | 9,625,451 | ||||||||||||||
| Variable costs | 18,500,240 | 18,856,011 | 439,607 | (10,426,793 | ) | 27,369,065 | ||||||||||||||
| Cost of sales | 25,708,872 | 20,758,808 | 3,744,422 | (13,217,586 | ) | 36,994,516 | ||||||||||||||
| Gross income | 6,023,739 | 2,486,868 | 7,100,128 | (257,980 | ) | 15,352,755 | ||||||||||||||
| Administration expenses | 731,626 | 451,250 | 518,109 | - | 1,700,985 | |||||||||||||||
| Operation and projects expenses | 2,969,723 | 1,155,301 | 157,596 | (248,352 | ) | 4,034,268 | ||||||||||||||
| Impairment of non-current assets | 4,504,497 | 3,278,993 | 81,388 | 7,864,878 | ||||||||||||||||
| Other operating income and expenses, net | (399,954 | ) | 122,595 | (101,182 | ) | - | (378,541 | ) | ||||||||||||
| Operating income | (1,782,153 | ) | (2,521,271 | ) | 6,444,217 | (9,628 | ) | 2,131,165 | ||||||||||||
| Finance results, net | ||||||||||||||||||||
| Financial income | 536,121 | 135,622 | 86,568 | (136,387 | ) | 621,924 | ||||||||||||||
| Financial expenses | (1,774,090 | ) | (451,906 | ) | (492,485 | ) | 67 | (2,718,414 | ) | |||||||||||
| Foreign exchange gain (loss), net | (4,798,741 | ) | (949,176 | ) | 181,303 | - | (5,566,614 | ) | ||||||||||||
| (6,036,710 | ) | (1,265,460 | ) | (224,614 | ) | (136,320 | ) | (7,663,104 | ) | |||||||||||
| Share of profit of companies | (70,407 | ) | 23,187 | 533 | - | (46,687 | ) | |||||||||||||
| Income before tax | (7,889,270 | ) | (3,763,544 | ) | 6,220,136 | (145,948 | ) | (5,578,626 | ) | |||||||||||
| Income tax | 2,037,650 | (257,256 | ) | (2,490,747 | ) | - | (710,353 | ) | ||||||||||||
| Net income (loss) for the period | (5,851,620 | ) | (4,020,800 | ) | 3,729,389 | (145,948 | ) | (6,288,979 | ) | |||||||||||
| Income attributable to: | ||||||||||||||||||||
| Owners of the Company | (5,851,620 | ) | (4,016,050 | ) | 2,819,759 | (145,948 | ) | (7,193,859 | ) | |||||||||||
| Non-controlling interests | - | (4,750 | ) | 909,630 | - | 904,880 | ||||||||||||||
| (5,851,620 | ) | (4,020,800 | ) | 3,729,389 | (145,948 | ) | (6,288,979 | ) | ||||||||||||
| Supplementary information | ||||||||||||||||||||
| Depreciation, depletion and amortization | 5,318,587 | 570,033 | 881,738 | - | 6,770,358 | |||||||||||||||
| 2014 | 2013 | 2012 | ||||||||||||||||||||||
| Income | Expenses | Income | Expenses | Income | Expenses | |||||||||||||||||||
| Direccion de Impuestos y Aduanas Nacionales | $ | 31 | $ | 229,475 | $ | 19 | $ | 17,828 | $ | - | $ | 16,563 | ||||||||||||
| U.A.E. Agencia Nacional de Hidrocarburos | 23 | 214,346 | 1,950 | 317,060 | 1,158 | 213,974 | ||||||||||||||||||
| Contraloría General de la Republica | - | 112,538 | - | 88,786 | - | 64,519 | ||||||||||||||||||
| Fuerzas Militares | - | 106,823 | - | 280,665 | 225,019 | |||||||||||||||||||
| Entidades Territoriales | 290 | 66,856 | - | 79,309 | 1 | 59,313 | ||||||||||||||||||
| Instituto Colombiano de Bienestar Familiar | - | 7,439 | - | 6,621 | - | 6,892 | ||||||||||||||||||
| Unidad de Planeación Minero Energética | - | 5,027 | - | 7,282 | - | 1,287 | ||||||||||||||||||
| Corporación Autónoma Regional de la Orinoquia | - | 499 | 4 | 631 | 2 | 2,433 | ||||||||||||||||||
| Fiduciaria la Previsora S. A. | 12 | 350 | 36 | 854 | - | 501 | ||||||||||||||||||
| E.S.P. Transportadora de Gas Internacional S.A. | - | 278 | 736 | 330 | - | 600 | ||||||||||||||||||
| Fondo Nacional Ambiental | - | 203 | 11 | 865 | - | 281 | ||||||||||||||||||
| Ministerio de Hacienda y Crédito publico | 353,312 | 200 | - | 126,836 | 616 | 196,404 | ||||||||||||||||||
| E.S.P. Empresa de Energía del Casanare - Enerca S.A. | - | 189 | 686 | 137 | 78 | 70 | ||||||||||||||||||
| Banco Agrario de Colombia | 20,730 | 99 | - | 11,641 | - | 20,696 | ||||||||||||||||||
| E.S.P. Empresa de Acueducto y Alcantarillado de Bogotá | 57 | 10 | 45 | 9 | 44 | 1 | ||||||||||||||||||
| Fondo Rotario de la Policía Nacional | - | - | - | 13,093 | - | 5,610 | ||||||||||||||||||
| Empresas Públicas de Medellín | - | - | 26,511 | 641 | 19,220 | - | ||||||||||||||||||
| Ministerio de Minas y Energía | - | - | 331 | - | - | 173 | ||||||||||||||||||
| E.S.P. Aguas de Barrancabermeja S.A. | - | - | - | 13,000 | - | - | ||||||||||||||||||
| Others | 91 | 15,580 | 237 | 41,096 | 3,237 | 32,019 | ||||||||||||||||||
| $ | 374,546 | $ | 759,912 | $ | 30,566 | $ | 1,006,684 | $ | 24,356 | $ | 846,355 | |||||||||||||
| F-98 |
Ecopetrol S.A. Notes to Consolidated Financial Statements (Figures expressed in millions of Colombian pesos, unless otherwise stated) |
| For the year ended December 31, 2014 | ||||||||||||||||||||
| Exploration and production | Refining and petrochemicals | Transportation and logistics | Eliminations | Total | ||||||||||||||||
| Third-party sales | 35,903,045 | 26,612,204 | 3,456,639 | - | 65,971,888 | |||||||||||||||
| Inter-segment sales | 9,252,146 | 560,096 | 4,887,295 | (14,699,537 | ) | - | ||||||||||||||
| Total Revenue | 45,155,191 | 27,172,300 | 8,343,934 | (14,699,537 | ) | 65,971,888 | ||||||||||||||
| Fixed costs | 6,788,549 | 1,888,558 | 3,538,797 | (1,981,744 | ) | 10,234,160 | ||||||||||||||
| Variable costs | 21,139,234 | 23,648,670 | 402,255 | (12,449,191 | ) | 32,740,968 | ||||||||||||||
| Cost of sales | 27,927,783 | 25,537,228 | 3,941,052 | (14,430,935 | ) | 42,975,128 | ||||||||||||||
| Gross income | 17,227,408 | 1,635,072 | 4,402,882 | (268,602 | ) | 22,996,760 | ||||||||||||||
| Administration expenses | 335,432 | 354,221 | 341,523 | (141 | ) | 1,031,035 | ||||||||||||||
| Operation and projects expenses | 4,288,108 | 1,039,695 | 380,940 | (188,418 | ) | 5,520,325 | ||||||||||||||
| Impairment of non-current assets | 965,607 | 1,340,086 | (1,121 | ) | - | 2,304,572 | ||||||||||||||
| Other operating income and expenses, net | (285,821 | ) | 12,490 | (36,643 | ) | 1,775 | (308,199 | ) | ||||||||||||
| Operating income | 11,924,082 | (1,111,420 | ) | 3,718,183 | (81,818 | ) | 14,449,027 | |||||||||||||
| Finance results, net | ||||||||||||||||||||
| Financial income | 251,902 | 113,237 | 127,262 | (92,583 | ) | 399,818 | ||||||||||||||
| Financial expenses | (837,510 | ) | (306,174 | ) | (496,615 | ) | 5 | (1,640,294 | ) | |||||||||||
| Foreign exchange gain (loss), net | (2,243,938 | ) | (309,449 | ) | 283,194 | - | (2,270,193 | ) | ||||||||||||
| (2,829,546 | ) | (502,386 | ) | (86,159 | ) | (92,578 | ) | (3,510,669 | ) | |||||||||||
| Share of profit of companies | 154,816 | 11,254 | - | - | 166,070 | |||||||||||||||
| Income before tax | 9,249,352 | (1,602,552 | ) | 3,632,024 | (174,396 | ) | 11,104,428 | |||||||||||||
| Income tax | (4,159,511 | ) | (29,251 | ) | (1,246,093 | ) | - | (5,434,855 | ) | |||||||||||
| Net income for the period | 5,089,841 | (1,631,803 | ) | 2,385,931 | (174,396 | ) | 5,669,573 | |||||||||||||
| Income attributable to: | ||||||||||||||||||||
| Owners of the Company | 5,089,841 | (1,627,705 | ) | 1,758,777 | (174,396 | ) | 5,046,517 | |||||||||||||
| Non-controlling interests | - | (4,098 | ) | 627,154 | - | 623,056 | ||||||||||||||
| 5,089,841 | (1,631,803 | ) | 2,385,931 | (174,396 | ) | 5,669,573 | ||||||||||||||
| Supplementary information | ||||||||||||||||||||
| Depreciation, depletion and amortization | 5,172,743 | 548,539 | 695,925 | - | 6,417,207 | |||||||||||||||
Accounting standards for fair value measurement (ASC 820) establish a framework for measuring fair value and stipulate disclosures about fair value measurements. The standards apply to recurring and non-recurring financial and non-financial assets and liabilities that require or permit fair-value measurements. Among the required disclosures is the fair-value hierarchy of inputs the Company uses to value an asset or a liability. The three levels of the fair-value hierarchy are described as follows:
Level 1: Quoted prices (unadjusted) in active markets for identical assets and liabilities. For the Company, Level 1 inputs include marketable securities that are actively traded.
Level 2: Inputs other than Level 1 that is observable, either directly or indirectly. For the Company, Level 2 inputs include quoted prices for similar assets, prices obtained through third-party broker quotes, and prices that can be corroborated with other observable inputs for substantially the complete term of a contract.
Level 3: Unobservable inputs - The Company does not use Level 3 inputs for any of its recurring fair-value measurements. Level 3 inputs may be required for the determination of fair value associated with certain non-recurring measurements of non-financial assets and liabilities. The Company uses Level 3 inputs to determine the fair value of certain non-recurring non-financial assets.
The fair value hierarchy for recurring assets measured at fair value at December 31, 2014, and December 31, 2013, is as follows:
Ecopetrol S.A. and Subsidiaries
Notes to the Consolidated Financial Statements
Years ended December 31, 2014, 2013 and 2012
(Expressed in millions of Colombian pesos)
| Fair Value at Reporting Date Using | Fair Value at Reporting Date Using | |||||||||||||||||||||||||||||||
Quoted Price Markets for Identical Assets | Significant Other Observable Inputs | Significant Unobservable Inputs (i) | Quoted Price in Active Markets for Identical Assets | Significant Other Observable Inputs | Significant Unobservable Inputs | |||||||||||||||||||||||||||
| Description | 2014 | (Level 1) | (Level 2) | (Level 3) | 2013 | (Level 1) | (Level 2) | (Level 3) | ||||||||||||||||||||||||
| ASSETS | ||||||||||||||||||||||||||||||||
| Available for sale debt securities | ||||||||||||||||||||||||||||||||
| Securities issued by mixed – economy governmental entities | $ | 1,581,393 | $ | 1,581,393 | $ | - | $ | - | $ | 1,504,957 | $ | 1,504,957 | $ | - | $ | - | ||||||||||||||||
| Securities issued or secured by Colombian government | 183,363 | 183,363 | - | - | 210,493 | 210,493 | - | - | ||||||||||||||||||||||||
| Securities issued or secured by government sponsored enterprise (GSEs) | 124,620 | - | 124,620 | - | 42,129 | 42,129 | - | - | ||||||||||||||||||||||||
| Securities issued or secured by financial entities | 2,324 | - | 2,324 | - | 10,167 | 10,167 | - | - | ||||||||||||||||||||||||
| Securities issued or secured by financial entities | 453,905 | - | 176,279 | 277,626 | 641,658 | - | 641,658 | - | ||||||||||||||||||||||||
| Other debt securities | 33,408 | - | 33,408 | - | 9,286 | 9,286 | - | - | ||||||||||||||||||||||||
| Securities issued or secured by USA government | 123,022 | - | 123,022 | - | 73,794 | 73,794 | - | - | ||||||||||||||||||||||||
| Total available for sale debt securities | $ | 2,502,035 | $ | 1,754,756 | $ | 459,653 | $ | 277,626 | $ | 2,492,484 | $ | 1,850,826 | $ | 641,658 | $ | - | ||||||||||||||||
| Short-term Investments – held to maturity securities: | ||||||||||||||||||||||||||||||||
| Securities issued or secured by Colombian government | - | - | - | - | 98,039 | - | - | - | ||||||||||||||||||||||||
| Other debt securities | 4,713 | - | - | - | 1,692 | - | - | - | ||||||||||||||||||||||||
| Total Short-term Investments classified as held to maturity | $ | 4,713 | $ | - | $ | - | $ | - | $ | 99,731 | $ | - | $ | - | $ | - | ||||||||||||||||
| Derivatives | ||||||||||||||||||||||||||||||||
| Option | (3,992 | ) | - | (3,992 | ) | - | (45 | ) | - | (45 | ) | - | ||||||||||||||||||||
| Swap | - | - | - | - | - | - | - | - | ||||||||||||||||||||||||
| FX Forward | (130,272 | ) | - | (130,272 | ) | - | - | - | - | - | ||||||||||||||||||||||
| Total derivatives | (134,264 | ) | - | (134,264 | ) | - | (45 | ) | - | (45 | ) | - | ||||||||||||||||||||
| Total Recurring Assets at fair value | $ | 2,372,484 | $ | 1,754,756 | $ | 325,389 | $ | 277,626 | $ | 2,592,170 | $ | 1,850,826 | $ | 641,613 | $ | - | ||||||||||||||||
Ecopetrol S.A. Notes to Consolidated Financial Statements (Figures expressed in millions of Colombian pesos, unless otherwise stated) |
| 34.2.1 | Sales by |
The fair value plan assetssales by product of each of the segments are detailed below for the years ended December 31, 2016, 2015 and 2014:
Medical, Education and Severance plans are unfunded. Pension and pension bonds plans are covered by assets in five trust funds with the following investment allocation:
| For the year ended December 31, 2016 | ||||||||||||||||||||
| Exploration and production | Refining and petrochemicals | Transportation and logistics | Eliminations | Total | ||||||||||||||||
| Local sales | ||||||||||||||||||||
| Med-distillates | - | 8,553,503 | - | - | 8,553,503 | |||||||||||||||
| Gasoline and turbo fuel | - | 6,465,939 | - | (373,200 | ) | 6,092,739 | ||||||||||||||
| Services | 73,247 | 41,736 | 10,572,170 | (6,643,869 | ) | 4,043,284 | ||||||||||||||
| Natural gas | 2,383,323 | 11,763 | - | (406,750 | ) | 1,988,336 | ||||||||||||||
| Plastic and rubber | - | 724,708 | - | - | 724,708 | |||||||||||||||
| L.P.G. and propane | 90,783 | 319,644 | - | (4,558 | ) | 405,869 | ||||||||||||||
| Crude oil | 5,284,554 | - | - | (4,730,888 | ) | 553,666 | ||||||||||||||
| Asphalts | 31,277 | 309,123 | - | - | 340,400 | |||||||||||||||
| Aromatics | - | 186,228 | - | - | 186,228 | |||||||||||||||
| Oil fuel | 1,382 | 146,866 | - | - | 148,248 | |||||||||||||||
| Other products | 424,952 | 669,568 | 75,793 | (510,144 | ) | 660,169 | ||||||||||||||
| 8,289,518 | 17,429,078 | 10,647,963 | (12,669,409 | ) | 23,697,150 | |||||||||||||||
| Recognition of price differential | - | 1,048,022 | - | - | 1,048,022 | |||||||||||||||
| 8,289,518 | 18,477,100 | 10,647,963 | (12,669,409 | ) | 24,745,172 | |||||||||||||||
| Foreign sales | ||||||||||||||||||||
| Crude | 19,516,197 | - | - | (2,237,618 | ) | 17,278,579 | ||||||||||||||
| Oil fuel | - | 2,158,539 | - | - | 2,158,539 | |||||||||||||||
| Med-distillates | 1,594,945 | - | - | 1,594,945 | ||||||||||||||||
| Plastic and rubber | - | 1,171,342 | - | - | 1,171,342 | |||||||||||||||
| Gasoline and turbo fuel | 1,046,758 | - | - | 1,046,758 | ||||||||||||||||
| Natural gas | 350,685 | - | - | (291,875 | ) | 58,810 | ||||||||||||||
| L.P.G. and propane | 6,342 | 2,225 | - | - | 8,567 | |||||||||||||||
| Cash flow hedging – Reclassification to profit or loss | 33,074 | - | - | - | 33,074 | |||||||||||||||
| Other products | 25,395 | 363,250 | 814 | 316 | 389,775 | |||||||||||||||
| 19,931,693 | 6,337,059 | 814 | (2,529,177 | ) | 23,740,389 | |||||||||||||||
| Total sales revenue | 28,221,211 | 24,814,159 | 10,648,777 | (15,198,586 | ) | 48,485,561 | ||||||||||||||
| F-100 |
Ecopetrol S.A. Notes to Consolidated Financial Statements (Figures expressed in millions of Colombian pesos, unless otherwise stated) |
| Investment | 2014 | Level | 2013 | Level | ||||||||
| Colombian government treasury bonds in COP | $ | 4,298,278 | 1 | $ | 3,099,060 | 1 | ||||||
| Other securities, liquidity, non-governmental entity bonds in COP | - | 978,427 | 1 | |||||||||
| Colombian government treasury bonds in COP | - | 472,085 | 2 | |||||||||
| Other securities, liquidity, non-governmental entity bonds in COP | 5,685,614 | 2 | 6,143,307 | 2 | ||||||||
| Colombian government treasury bonds in USD | 230,772 | 1 | 175,791 | 1 | ||||||||
| Other securities, liquidity, non-governmental entity bonds in USD | - | 562,401 | 1 | |||||||||
| Other securities, liquidity, non-governmental entity bonds in USD | 480,712 | 2 | 19,271 | 2 | ||||||||
| Other bonds | 1,036,475 | 2 | - | |||||||||
| Total | $ | 11,731,851 | $ | 11,450,342 | ||||||||
| Exploration and production | Refining and petrochemicals | Transportation and logistics | Eliminations | Total | ||||||||||||||||
| Local sales | ||||||||||||||||||||
| Med-distillates | 25,782 | 10,206,599 | - | (17,157 | ) | 10,215,224 | ||||||||||||||
| Gasoline | - | 6,464,661 | - | (336,453 | ) | 6,128,208 | ||||||||||||||
| Services | 118,812 | 198,369 | 10,822,078 | (6,703,985 | ) | 4,435,274 | ||||||||||||||
| Natural gas | 2,198,284 | - | - | (352,939 | ) | 1,845,345 | ||||||||||||||
| Crude oil | 5,847,368 | - | - | (5,356,089 | ) | 491,279 | ||||||||||||||
| Diesel and asphalts | 49,583 | 411,605 | - | - | 461,188 | |||||||||||||||
| Plastic and rubber | - | 724,392 | - | - | 724,392 | |||||||||||||||
| L.P.G. and propane | 154,201 | 190,346 | - | (9,053 | ) | 335,494 | ||||||||||||||
| Other products | 262,906 | 1,070,725 | 22,472 | (367,757 | ) | 988,346 | ||||||||||||||
| 8,656,936 | 19,266,697 | 10,844,550 | (13,143,433 | ) | 25,624,750 | |||||||||||||||
| Recognition of price differential | - | 441,871 | - | - | 441,871 | |||||||||||||||
| 8,656,936 | 19,708,568 | 10,844,550 | (13,143,433 | ) | 26,066,621 | |||||||||||||||
| Foreign sales | ||||||||||||||||||||
| Crude | 21,495,762 | - | - | (314,497 | ) | 21,181,265 | ||||||||||||||
| Fuel oil | - | 2,166,469 | - | - | 2,166,469 | |||||||||||||||
| Trading of crude | 1,309,196 | 1,309,196 | ||||||||||||||||||
| Natural gas | 233,500 | - | - | (50,550 | ) | 182,950 | ||||||||||||||
| Gasoline and turbo fuel | 27,756 | 65,369 | - | - | 93,125 | |||||||||||||||
| Diesel | - | 81,982 | - | - | 81,982 | |||||||||||||||
| Plastic and rubber | - | 1,096,730 | - | - | 1,096,730 | |||||||||||||||
| Cash flow hedging – Reclassification to profit or loss | 7,646 | - | - | - | 7,646 | |||||||||||||||
| Other products and services | 1,815 | 126,558 | - | 32,914 | 161,287 | |||||||||||||||
| 23,075,675 | 3,537,108 | - | (332,133 | ) | 26,280,650 | |||||||||||||||
| Total revenue | 31,732,611 | 23,245,676 | 10,844,550 | (13,475,566 | ) | 52,347,271 | ||||||||||||||
| Exploration and production | Refining and petrochemicals | Transportation and logistics | Eliminations | Total | ||||||||||||||||
| Local sales | ||||||||||||||||||||
| Med-distillates | 1,241 | 11,982,214 | - | - | 11,983,455 | |||||||||||||||
| Gasoline | - | 6,979,197 | - | (584,775 | ) | 6,394,422 | ||||||||||||||
| Services | 245,798 | 152,267 | 8,324,753 | (4,944,745 | ) | 3,778,073 | ||||||||||||||
| Natural gas | 1,580,941 | - | - | (234,316 | ) | 1,346,625 | ||||||||||||||
| Crude oil | 9,487,864 | - | - | (8,274,146 | ) | 1,213,718 | ||||||||||||||
| Diesel and asphalts | 46,336 | 412,736 | - | - | 459,072 | |||||||||||||||
| Plastic and rubber | - | 667,563 | - | - | 667,563 | |||||||||||||||
| L.P.G. and propane | 181,806 | 248,578 | - | (3,934 | ) | 426,450 | ||||||||||||||
| Other products | 102,696 | 812,510 | 19,181 | 66,934 | 1,001,321 | |||||||||||||||
| 11,646,682 | 21,255,065 | 8,343,934 | (13,974,982 | ) | 27,270,699 | |||||||||||||||
| Recognition of price differential | 485,409 | - | - | 485,409 | ||||||||||||||||
| 11,646,682 | 21,740,474 | 8,343,934 | (13,974,982 | ) | 27,756,108 | |||||||||||||||
| Foreign sales | ||||||||||||||||||||
| Crude | 31,524,915 | - | - | (689,405 | ) | 30,835,510 | ||||||||||||||
| Fuel oil | - | 3,921,703 | - | - | 3,921,703 | |||||||||||||||
| Trading of crude | 1,486,060 | 1,486,060 | ||||||||||||||||||
| Natural gas | 439,076 | - | - | (15,615 | ) | 423,461 | ||||||||||||||
| Gasoline and turbo fuel | - | 127,090 | - | - | 127,090 | |||||||||||||||
| Diesel | - | 179,738 | - | - | 179,738 | |||||||||||||||
| Plastic and rubber | - | 975,282 | - | - | 975,282 | |||||||||||||||
| Other products and services | 58,458 | 228,013 | - | (19,535 | ) | 266,936 | ||||||||||||||
| 33,508,509 | 5,431,826 | - | (724,555 | ) | 38,215,780 | |||||||||||||||
| Total revenue | 45,155,191 | 27,172,300 | 8,343,934 | (14,699,537 | ) | 65,971,888 | ||||||||||||||
| F-101 |
Ecopetrol S.A. Notes to Consolidated Financial Statements (Figures expressed in millions of Colombian pesos, unless otherwise stated) |
| 34.2.2 | Capital expenditures by segment |
The fair valuefollowing are the amounts of investments made by each segment for the plan assets is calculated using the information published by INFOVALMER, a renowned trustworthy financial price provider authorized by the Colombian Financial Regulator (Superintendencia Financiera de Colombia). Accordingly, there are two methodologies to calculate the prices of the securities: Average Price and Estimated price.
The Average Price is calculated mainly from representative market transactions carried through electronic platforms approved and supervised by the named regulator. The Investments that reflect this condition are located under level 1, bearing in mind that they include marketable securities that are actively traded. Likewise, the Estimated Price is calculated for investments that do not reflect enough information to estimate an average market price, replicating quoted prices for similar assets or prices obtained through third-party broker quotes. This estimated price is also given by INFOVALMER as a result of the application of robust methodologies approved by the Financial Regulator and broadly used by the financial industry. The investments reflecting this condition are located under level 2.
Ecopetrol S.A. and Subsidiaries
Notes to the Consolidated Financial Statements
Yearsyears ended December 31, 2014, 20132016, 2015 and 2012
(Expressed in millions of Colombian pesos)
The fair value restricted assets
Under U.S. GAAP the Company classifies as restricted assets, those assets where their availability depends on a court decision, contractual or legal restriction, such as cash, trust funds or investments. The detail of restricted assets mainly is as follows:
| Concept | 2014 | Level | 2013 | Level | ||||||||||||
| Investment securities | $ | 114,966 | 1 | $ | 336,714 | 1 | ||||||||||
| Investment securities | 310,692 | 2 | 34,673 | 2 | ||||||||||||
| Investment securities | 122,755 | 3 | - | - | ||||||||||||
| Specific destination funds | 226,094 | 2 | 299,702 | 2 | ||||||||||||
| Total™ | $ | 774,507 | $ | 671,089 | ||||||||||||
The most significant restricted assets are related to Santiago de Las Atalayas Fund which are detailed as follows:
| Concept | 2014 | Level | 2013 | Level | ||||||||||||
| Investments available for sale | $ | 114,966 | 1 | $ | 336,714 | 1 | ||||||||||
| Investments available for sale | 310,692 | 2 | 34,673 | 2 | ||||||||||||
| Investments available for sale | 122,755 | 3 | - | - | ||||||||||||
| Total | $ | 548,413 | $ | 371,387 | ||||||||||||
2014:
For fair value analysis purposes, the assets related to Santiago de Las Atalayas and other founds do not include the cash and cash equivalents.
| 2016 | Exploration and production | Refining and petrochemicals | Transportation and logistics | Total | ||||||||||||
| Property, plant and equipment | 1,208,464 | 1,099,850 | 1,338,615 | 3,646,929 | ||||||||||||
| Natural and environmental resources | 2,121,295 | - | - | 2,121,295 | ||||||||||||
| Intangibles | 53,774 | 10,274 | 5,205 | 69,253 | ||||||||||||
| 3,383,533 | 1,110,124 | 1,343,820 | 5,837,477 | |||||||||||||
| 2015 | Exploration and production | Refining and petrochemicals | Transportation and logistics | Total | ||||||||||||
| Property, plant and equipment | 2,460,975 | 3,590,279 | 2,497,679 | 8,548,933 | ||||||||||||
| Natural and environmental resources ( Note 2.8) | 6,856,761 | - | - | 6,856,761 | ||||||||||||
| Intangibles | 69,126 | 18,494 | 24,635 | 112,255 | ||||||||||||
| 9,386,862 | 3,608,773 | 2,522,314 | 15,517,949 | |||||||||||||
| 2014 | Exploration and production | Refining and petrochemicals | Transportation and logistics | Total | ||||||||||||
| Property, plant and equipment | 3,556,536 | 3,730,289 | 1,636,743 | 8,923,568 | ||||||||||||
| Natural and environmental resources (Note 2.8) | 6,601,680 | - | - | 6,601,680 | ||||||||||||
| Intangibles | 26,610 | 10,636 | 74,772 | 112,018 | ||||||||||||
| 10,184,826 | 3,740,925 | 1,711,515 | 15,637,266 | |||||||||||||
| F-102 |
Ecopetrol S.A. Notes to Consolidated Financial Statements (Figures expressed in millions of Colombian pesos, unless otherwise stated) |
| 35. | Contractual obligations |
Other restricted assets like specific destination, Equión $6,299, ODL Finance $9,402, Oleoducto Bicentenario $85,890, Ocensa $982Ecopetrol business group enter into various commitments and Cenit Transporte y Logística $33,617 Classify all in level 2.
Marketable Securities:contractual obligations that may require future cash payments. The Company calculates fair value for its marketable securities based on quoted market prices.
Derivatives: The Company’s derivative instruments principally include foreign exchange and refined-product (asphalt) swaps, options and forward contracts, principally with financial institutions and other oil and gas companies, the fair values for which are obtained from third-party broker quotes, industry pricing services and exchanges.
The Company obtains multiple sources of pricing information for the Level 2 instruments. Since this pricing information is generated from observable market data, it has historically been very consistent. The Company does not materially adjust this information.
The fair value hierarchy for non-recurring assets measured at fair value at December 31, 2014 is as follows:
| Fair Value Measurements Using | ||||||||||||||||||||||||
| Description | 2014 | Quoted Price in Active Markets for Identical Assets Level 1 | Significant Other Observable Inputs Level 2 | Significant Unobservable Inputs Level 3 | Total Gains (Losses) | 2013 | ||||||||||||||||||
| Goodwill | $ | - | $ | - | $ | - | $ | - | $ | - | $ | 930,023 | ||||||||||||
| Production fixed assets with impairment | 17,960 | - | - | 17,960 | (402,247 | ) | 94,193 | |||||||||||||||||
| Total Non-Recurring Assets | $ | 17,960 | $ | - | $ | - | $ | 17,960 | $ | (402,247 | ) | $ | 1,024,216 | |||||||||||
Impairment of “Goodwill”- During 2012, Ecopetrol performed an impairment test of goodwill which showed that goodwill was cero. In 2013, Ecopetrol performed an impairment test on the recognized goodwill, resulting in a Propilco impairment of $280,493. During 2013, lower supply from Ecopetrol increased the variable costs, as the company switched their raw material suppliers. Furthermore, the company performance was challenged by shifts in the petrochemical markets, as a result of new shale gas discoveries in the U.S. and low costs products coming from Asia. During 2014 the impairment was cero.
Impairment of “Properties, plant and equipment”- During 2014 and in accordance with the accounting standard for the impairment or disposal of long-lived assets (ASC 360), long-lived assets “held and used” with a carrying amount of $420,207 were written down to a fair value of $17,960, resulting in a before-tax loss of $402,247. The fair values were determined from internal cash-flow models, using discount rates consistent with those used by the Company to evaluate cash flows of other assets of a similar nature. The respective long-lived assets were reviewed for impairment on a field-by-field basis.
Assets and Liabilities Not Required to Be Measured at Fair Value
The Company holds cash and cash equivalents. The instruments held are primarily time deposits and money market funds. The fair values reflect the cash that would have been received or paid if the instruments were settled at year-end. Cash equivalents had carrying/fair values of $7,982,225 and $8,750,039 at December 31, 2014 and 2013, respectively. Fair values of other financial instruments at the end of 2014 and 2013 were not material.
Ecopetrol S.A. and Subsidiaries
Notes to the Consolidated Financial Statements
Years ended December 31, 2014, 2013 and 2012
(Expressed in millions of Colombian pesos)
The Company’s financial instruments that are exposed to concentrations of credit risk consist primarily of cash and accounts receivables. The carrying value of cash and accounts receivable reflects management’s assessment of credit risk. As of December 31, 2014 and 2013, cash and cash equivalents includes balances in savings and checking accounts, as well as term deposits and certificates of deposit, placed primarily with governments and financial institutions with strong investment grade ratings.
The carrying amountsdetails of the Company’s accounts receivable, accounts payablecommitments and current notes payable approximate fair value because they have relatively short-term maturitiescontractual obligations can be found in section 4.8 Financial Review - Financial Indebtedness and bear interest at rates tied to market indicators, as appropriate. The Company’s long-term debt consists of debt instruments that bear interest at fixed or variable rates tied to market indicators.
The carrying amount and estimated fair values of the Company’s financial instruments that are not recognized in the balance sheets at fair value as of December 31 are as follows:
| 2014 | 2013 | |||||||||||||||||||
| Description | Carrying Amount | Estimated Fair Value | Fair value hierarchy | Carrying Amount | Estimated Fair Value | Fair value hierarchy | ||||||||||||||
| Long-term notes payable | $ | 13,955,114 | $ | 13,357,850 | Level 2 | $ | 11,284,800 | $ | 10,757,433 | Level 2 | ||||||||||
| Long-term debt | $ | 19,325,712 | $ | 20,206,915 | Level 1 | $ | 9,907,320 | $ | 10,998,186 | Level 1 | ||||||||||
| Total | $ | 33,280,826 | $ | 33,564,765 | $ | 21,192,120 | $ | 21,755,619 | ||||||||||||
National Bank Loan: The assessment was made discounting the projected flow of credit, according to their contractual terms, at a rate estimated using the average of two quotations received by two banks participating in the credit spreads reflect on current DTF for credit of these characteristics. DTF for the forward curve at 12/31/2014 calculated by the prices provider Infovalmer was used.
International Banking Loan: The assessment was performed by projecting the flow of credit in accordance with their contractual terms. To calculate the Libor 6M, the SWAP Bloomberg calculator was used, considering the average life of the loans. To discount the CIRR rate (minimum rate would charge the Exim Bank in a direct credit) for loans with similar terms are used.
The note ii. investments in non-marketable securities describes the impairment test of the equity method investment.Other Contractual Obligations.
| Subsequent events |
| 1. | On February 15, 2017 the fourth auction was carried out corresponding to the Second Stage of the Alienation and Awarding Program of 28,465,035 shares of Empresa de Energía de Bogotá S.A. E.S.P, the auction was declared deserted. |
| 2. | The Ordinary General Shareholders’ Meeting, held on March 31, 2017, approved the profit distribution project, which establishes that a common dividend per share of twenty-three pesos (COL $ 23) will be distributed. The shareholders’ dividend was paid in a single installment on April 28, 2017. |
| 3. | On April 28, 2017 Ecopetrol transferred the fields Santana and Nancy-Maxine-Burdine to Gran Tierra for a total amount of US$30.41 million. On May 26, 2017 the company IHSA paid US$21.74 million to acquire the fields Rio de Oro and Puerto Barco, Rio Zulia and Valdivia Almagro, which will be transferred on May 30 and 31, 2017. All of these fields were awarded through an auction offered in November 2016. |
| 4. | As part of the investigations carried out by various control entities on the Cartagena refinery modernization and expansion project, the Prosecutor’s Office (Fiscalia General de la Nación) is conducting a confidential investigation. In connection therewith, on April 27, 2017, through a press release informed its intention to pursue charges including document forgery, illegal interest in the execution of agreement, misappropriation of public funds and unjust enrichment. |
The Prosecutor’s Office has not yet made public the factual basis for such charges, and accordingly we are not in a position to predict the outcome of the Prosecutor’s Office investigation or the disposition of any charges that the Prosecutor’s Office may bring. Given the early stage of the investigation, it is not possible to assess the probability of any other consequences that might impact the financial statements, such as additional provisions, fines, legal costs, disallowance of tax deductions that may impact the recognition of tax reserves or the carrying amount of deferred tax assets or any other impact that is not known at the present time.
| F-103 |
Ecopetrol S.A. Notes to Consolidated Financial Statements (Figures expressed in millions of Colombian pesos, unless otherwise stated) |
| 37. | Supplemental information on oil and gas producing activities (unaudited) |
The information in this note is referred to as “unaudited” as a means of clarifying that it is not covered by the audit opinion of the independent registered public accounting firm that has audited and reported on the “Consolidated Financial Statements”.
In accordance with the requirements of the United States Securities and Exchange Commission (SEC), Release 33-8879, Accounting Standards Codification 932 and the ASU- 2010-03 “Oil and Gas reserve Estimation and Disclosures” rule, this section provides supplemental information on oil and gas exploration and producing activities of the Company. The information included in items (i) through (iii)sections a) to c) provides historical cost information pertaining to costs incurred in exploration, property acquisitions and development, capitalized costs and results of operations. The information included in items (iv)sections d) and (v)e) presents information on Ecopetrol’s estimated net proved reserve quantities, standardized measure of estimated discounted future net cash flows related to proved reserves and changes in estimated discounted future net cash flows.
The following information corresponds to Ecopetrol’s oil and gas producing activities atas of December 31 2016, 2015 and 2014, 2013 and 2012 in directincludes information related to the Company’s consolidated subsidiaries as well as its investments the joint ventures Equion Energía Limited and Offshore International Group. The oil and gas exploration and production activities of these two joint operations.ventures are immaterial, as such the corresponding information has not been disclosed separately.
Under the SEC final rule optional disclosure of possible and probable reserves is allowed. But,allowed but, the Company opted not to do so. Ecopetrol estimated its reserves without considering non-traditional resources.
Table i – Capitalized costs relating to oil and gas producing activities
| (a) | Capitalized costs relating to oil and gas exploration and production activities |
| Year ended December 31 | December 31, | |||||||||||||||||||||||
| 2014 | 2013 | 2012 | 2016 | 2015 | 2014 | |||||||||||||||||||
| Natural and environmental properties | $ | 38,659,400 | $ | 30,639,705 | $ | 25,836,787 | 47,097,475 | 45,789,713 | 40,356,524 | |||||||||||||||
| Wells, equipment and facilities – property, plant and equipment | 14,034,676 | 11,714,769 | 10,045,169 | 29,931,039 | 21,822,897 | 17,839,350 | ||||||||||||||||||
| Construction in progress | 9,625,512 | 8,064,129 | 5,841,384 | 6,855,832 | 9,145,198 | 8,110,401 | ||||||||||||||||||
| Accumulated depreciation, depletion and amortization | (28,186,559 | ) | (22,647,249 | ) | (18,802,677 | ) | (49,714,944 | ) | (39,743,147 | ) | (32,003,657 | ) | ||||||||||||
| Net capitalized costs | $ | 34,133,029 | $ | 27,771,354 | $ | 22,920,663 | 34,169,402 | 37,014,661 | 34,302,618 | |||||||||||||||
It includes information of the exploration and production segment subsidiaries.
In accordance with ASC 410-20, theseIAS 37, natural and environmental costsproperties include the asset retirement obligations amounting $52,487, $12,598,COP$766,909, COP$580,575 and $80,244,COP$1,061,392 during 2016, 2015 and 2014, 2013 and 2012, respectively.
Ecopetrol S.A. and Subsidiaries
Notes to the Consolidated Financial Statements
Years ended December 31, 2014, 2013 and 2012
(Expressed in millions of Colombian pesos)
For 2012, we disclosed an amount increased in $19,014 due to a difference between our ARO tool and the accounting system. According to ASC 250, we consider this difference is not material.
Table ii – Costs incurred in oil and gas exploration and development activities
| (b) | Costs incurred in oil and gas exploration and developed activities |
Costs incurred are summarized below and include both amounts expensed and capitalized in the corresponding period.
| Year ended December 31 | Year ended December 31 | |||||||||||||||||||||||
| 2014 | 2013 | 2012 | 2016 | 2015 | 2014 | |||||||||||||||||||
| Acquisition of proved properties (1) | $ | 16,747 | $ | 336,954 | - | |||||||||||||||||||
| Acquisition of Proved properties | - | - | 16,747 | |||||||||||||||||||||
| Acquisition of unproved properties | - | - | 67,016 | - | 357,772 | 263,057 | ||||||||||||||||||
| Exploration costs | 2,801,928 | 2,486,283 | 1,676,821 | 852,097 | 1,012,264 | 2,036,526 | ||||||||||||||||||
| Development costs | 8,068,975 | 9,724,280 | 9,204,629 | 2,190,426 | 8,018,131 | 8,189,239 | ||||||||||||||||||
| Total costs incurred | $ | 10,887,650 | $ | 12,547,517 | $ | 10,948,466 | 3,042,523 | 9,388,167 | 10,505,569 | |||||||||||||||
| (1) |
| F-104 |
Ecopetrol S.A. Notes to (Figures expressed in |
| (c) | Results of operations for oil and |
The Company’s results of operations from oil and gas exploration and production activities for the years ended December 31, 2016, 2015 and 2014 are as follows:
| 2016 | 2015 | 2014 | ||||||||||
| Net revenues | ||||||||||||
| Sales | 21,322,662 | 26,039,708 | 36,678,579 | |||||||||
| Transfers | 7,734,195 | 5,692,902 | 8,476,612 | |||||||||
| Total | 29,056,857 | 31,732,610 | 45,155,191 | |||||||||
| Production cost (1) | 5,785,950 | 6,006,563 | 6,457,013 | |||||||||
| Depreciation, depletion and amortization (2) | 6,123,914 | 9,887,331 | 6,129,538 | |||||||||
| Other production costs (3) | 12,370,540 | 14,457,836 | 16,406,789 | |||||||||
| Exploration expenses (4) | 730,393 | 1,586,940 | 2,590,778 | |||||||||
| Other expenses (5) | 1,488,143 | 2,711,274 | 2,478,563 | |||||||||
| Total | 26,498,940 | 34,649,944 | 34,062,681 | |||||||||
| Income before income tax | 2,557,918 | (2,917,333 | ) | 11,092,510 | ||||||||
| Income tax expenses | (1,367,357 | ) | (371,376 | ) | (5,428,674 | ) | ||||||
| Results of operations for producing activities | 1,190,561 | (3,288,709 | ) | 5,663,836 | ||||||||
Table iii – Results of operations for oil and gas producing activities
| 2014 | 2013 | 2012 | ||||||||||
| Net revenues | ||||||||||||
| Sales | $ | 40,509,025 | $ | 44,727,535 | $ | 29,515,227 | ||||||
| Transfers | 4,595,252 | 5,601,988 | 12,980,714 | |||||||||
| Total | $ | 45,104,277 | $ | 50,329,523 | $ | 42,495,941 | ||||||
| Production cost (1) | 8,395,246 | 6,752,329 | 5,361,603 | |||||||||
| Depreciation, depletion and amortization (2) | 4,737,037 | 3,439,227 | 3,365,845 | |||||||||
| Other production costs (3) | 14,687,318 | 15,387,409 | 6,502,268 | |||||||||
| Exploration expenses (4) | 2,484,642 | 1,473,261 | 1,392,834 | |||||||||
| Other expenses (5) | 2,942,740 | 2,257,494 | 1,369,032 | |||||||||
| Total | $ | 33,246,983 | $ | 29,309,720 | $ | 17,991,582 | ||||||
| Income before income tax | 11,857,294 | 21,019,803 | 24,504,359 | |||||||||
| Income tax expenses | (5,454,355 | ) | (7,777,327 | ) | (8,064,384 | ) | ||||||
| Results of operations for producing activities | $ | 6,402,939 | $ | 13,242,476 | $ | 16,439,975 | ||||||
Note: Effects of naphtha addition are included into results of operations in the table above. During 2014, 2013 and 2012 the additional total barrels (million boe) were 27.5, 25.1 and 19.4 respectively.
| (1) | Production costs are lifting costs incurred to operate and maintain productive wells and related equipment and facilities including costs such as operating labor, materials, supplies, and fuel consumed in operations and the costs of operating natural gas liquids plants. In addition, it includes accretion expense related to the asset retirement obligations that were recognized during |
| (2) | In accordance with |
| (3) | Corresponds to transportation costs and naphtha that are not part of the Company´s lifting cost. |
| (4) | Exploration expenses include the costs of geological and geophysical activities as well as the non-productive exploratory wells. |
| (5) | Corresponds to administration and marketing expenses. |
During 2016, 2015 and 2014 2013 and 2012, respectively,, the Company transferred approximately 10%17.7%, 11%17.9% and 31%18.8%, respectively, of its crude oil and gas production; (percentages based on the value sales in Colombian pesos) to intercompany business units. BaseBased on volume those transfers were 39%46.1%, 36%,37.4% and 39%38.8%, respectively (including Reficar).
The intercompany transfers were recordedperformed at values equal to the Company’s market prices.
| F-105 |
Ecopetrol S.A. Notes to Consolidated Financial Statements (Figures expressed in millions of Colombian pesos, unless otherwise stated) |
| (d) | Reserve information |
Ecopetrol S.A.follows international standards for estimating, classifying and Subsidiaries
Notesreporting reserves framed under SEC definitions. The process is led by the Reserves Department which submits the report to the Consolidated Financial Statements
Years ended December 31, 2014, 2013 and 2012
(Expressed in millionsBoard of Colombian pesos)
Table iv – Reserve information
The reserve information presented in this section is based on the definitions and rules usedDirectors for U.S. GAAP purposes. The estimates for proved oil and gas reserves used in the preparation of the consolidated financial statements were prepared by Ecopetrol’s engineers, audited in a 99% by the “external engineers”.
Reserves are first estimated internally. This process is supervised and coordinated by the corporate manager of reservoirs, a geologist who holds a master’s degree in geology and has more than 20 years of experience in projects associated with reservoir characterization and development, estimation, and reporting of reserves. The employees involved in the reserves process meet the Society of Petroleum Engineers, or SPE, qualifications for reserves estimators. Internally estimated reserves are submitted to an external audit process, which was conducted by the external engineers Ryder Scott Company and DeGolyer and MacNaughton as of December 31, 2014. These firms have audited 99% of our total net proved reserves. The external engineers DeGolyer and MacNaughton, Ryder Scott Company, and Gaffney & Cline audited 99% of our estimated net proved reserves for each of the years ended December 31, 2013, and 2012. According to our corporate policy, we report the reserves values obtained from the External Engineers.approval.
The reserves estimation process ends whenwere audited at a level of 99% by 2 specialized auditing companies: DeGolyer and MacNaughton and Ryder Scott Company. According to these certifications the Corporate Reserves Director consolidatesreserves report complies with the resultscontent and presents them to the Reserves Committee, whose members are the Chief Financial Officer, Vice-President of Development and Production, and the Corporate Vice President of Strategy and Growth. Results are presented to the Audit Committee of the Board of Directors and finally approved by the Board of Directors.
Information concerning the technical definitions used for the estimated proved reserves is included in this annual report. The information provided in this annual report about our 2014 net proved reserves is based on the 2014 audited reserve reports for 99% of our total reserves prepared by experts under the SEC definitions and rules. The remaining 1% corresponds to calculations made by us internally using SEC definitions and rulesguidelines set forth in Rule 4-10(a)4-10 of Regulation S-X and the disclosure guidelines contained in the SEC’s “Modernization of Oil and Gas Reporting” final rule dated December 31, 2008 and effective as of January 1, 2010.
Our crude oil and natural gas net proved reserves include reserves from our subsidiaries located inissued by the United States (Gulf of Mexico) and Perú, and Equión and Hocol’s assets in Colombia.
The Company’s proved reserves as of December 31, 2014, 2013 and 2012 are based on the SEC average price methodology for U.S. GAAP purposes, which mirrors the average price methodology used by the Company in Colombia during this period.
Future development, abandonment and production costs were computed by estimating the expenditures to be incurred in developing, producing, and abandoning proved oil and gas reserves at the end of the year, based on year-end costs. Future income taxes were computed by applying statutory tax rates to the estimated net pre-tax cash flows after consideration of tax basis and tax credits and carry forwards. Discounted future net cash flows are calculated using 10% mid period discount factors. This discounting requires a year-by-year estimate of when the future expenditures will be incurred and when the reserves will be produced.
The arbitrary valuation methodology prescribed under ASU 2010-03 and ASU-2010-14 requires assumptions as to the timing and amount of future development and production costs. The calculations are made as of December 31 each year and should not be relied upon as an indication of the Company’s future cash flows or the value of its oil and gas reserves.
Ecopetrol used deterministic methods that are commonly used internationally to estimate reserves. These methods have some uncertainty in degradation, and thus, the estimates should not be interpreted as being exact amounts. However, the technology used to estimate reserves is considered reliable.
Estimates of reserves were prepared by geological and engineering methods commonly used in the oil industry. The method or combination of methods used in the analysis of each reserve was adopted from experience with similar reserves, stage of development, quality and completeness of basic data and production history.
The majority of the producing proved reserves were estimated by applying appropriate decline curves or other performance relationships. In analyzing decline curves, reserves were estimated by calculating economic limits that are based on current economic conditions. In certain cases, where the methods previously employed could not be used, reserves were estimated by analogy with similar reserves where more complete data was available.
Most of the Company’s activities and reserves are located in Colombia. The Colombian Nation is the owner of all mineral interests located in Colombia. The Company and, by extension of joint association contracts, its partners, are given the right to explore, develop, produce and sell those reserves, but do not own them. The reserve quantities and their standardized measure, presented in the following tables, represent those reserves and their estimated value that the Company has the right to extract and sell.
Ecopetrol S.A. and Subsidiaries
Notes to the Consolidated Financial Statements
Years ended December 31, 2014, 2013 and 2012
(Expressed in millions of Colombian pesos)
The information provided does not represent management’s estimate of the Company’s expected future cash flows or value of proved oil and gas reserves. Estimates of proved reserve quantities involve uncertainty and change over time as new information becomes available.
The table below sets forth the Company’s total proved oil and gas reserves together with their changes therein as of and for the years ended December 31, 2014, 2013 and 2012. The estimates (oil in million barrels, gas in billion cf, gas converted to million barrels at 5.7 billion cf per million barrels) using the SEC rules in effect for each respective year.SEC.
The following isinformation relates to the reserve quantity information:net proven reserves owned by the Ecopetrol Business Group in 2016, 2015 and 2014, and corresponds to the official reserves statements prepared by the Company:
| 2014 | 2013 | 2012 | ||||||||||||||||||||||||||||||||||
| Oil | Gas | Total | Oil | Gas | Total | Oil | Gas | Total | ||||||||||||||||||||||||||||
| million barrels | billion cf | million boe | million barrels | billion cf | Million boe | Million barrels | billion cf | million boe | ||||||||||||||||||||||||||||
| Proved Reserves: | ||||||||||||||||||||||||||||||||||||
| Beginning of year | 1,433.6 | 3,068.4 | 1,971.9 | 1,370.3 | 2,886.4 | 1,876.7 | 1,371.0 | 2,768.4 | 1,856.7 | |||||||||||||||||||||||||||
| Revisions of previous estimates | 154.4 | 665.8 | 271.2 | 172.7 | 337.5 | 231.9 | 42.7 | 8.8 | 44.2 | |||||||||||||||||||||||||||
| Improved recovery | 34.0 | 0.4 | 34.1 | 23.2 | 19.9 | 26.7 | 65.3 | - | 65.3 | |||||||||||||||||||||||||||
| Purchases of minerals in place | - | - | - | 7.5 | 11.0 | 9.4 | - | - | - | |||||||||||||||||||||||||||
| Extensions and discoveries | 39.9 | 58.2 | 50.1 | 66.2 | 49.3 | 74.9 | 90.4 | 298.6 | 142.8 | |||||||||||||||||||||||||||
| Sales of minerals in place | - | - | - | (0.6 | ) | (12.3 | ) | (2.8 | ) | - | - | - | ||||||||||||||||||||||||
| Production | (196.8 | ) | (263.8 | ) | (243.0 | ) | (205.7 | ) | (223.5 | ) | (244.9 | ) | (199.2 | ) | (189.3 | ) | (232.4 | ) | ||||||||||||||||||
| End of year | 1,465.1 | 3,529.0 | 2,084.3 | 1,433.6 | 3,068.4 | 1,971.9 | 1,370.3 | 2,886.4 | 1,876.7 | |||||||||||||||||||||||||||
| Proved developed reserves: | ||||||||||||||||||||||||||||||||||||
| Beginning of year | 933.3 | 2,663.3 | 1,400.3 | 933.3 | 2,535.9 | 1,378.2 | 855.8 | 2,229.5 | 1,246.9 | |||||||||||||||||||||||||||
| End of year | 1,042.2 | 3,284.0 | 1,618.3 | 933.0 | 2,663.3 | 1,400.3 | 933.3 | 2,535.9 | 1,378.2 | |||||||||||||||||||||||||||
| Proved undeveloped reserves: | ||||||||||||||||||||||||||||||||||||
| Beginning of year | 500.6 | 405.0 | 571.7 | 437.0 | 350.6 | 498.5 | 515.2 | 538.9 | 609.8 | |||||||||||||||||||||||||||
| End of year | 422.9 | 244.9 | 465.9 | 500.6 | 405.0 | 571.7 | 437.0 | 350.6 | 498.5 | |||||||||||||||||||||||||||
| 2016 | 2015 | 2014 | ||||||||||||||||||||||||||||||||||
| Oil | Gas | Total | Oil | Gas | Total | Oil | Gas | Total | ||||||||||||||||||||||||||||
| (Mbls) | (Gpc) | (Mbe) | (Mbls) | (Gpc) | (Mbe) | (Mbls) | (Gpc) | (Mbe) | ||||||||||||||||||||||||||||
| Proved reserves: | ||||||||||||||||||||||||||||||||||||
| Opening balance | 1,239 | 3,479 | 1,849 | 1,465 | 3,529 | 2,084 | 1,434 | 3,068 | 1,972 | |||||||||||||||||||||||||||
| Revisions of previous estimates (1) | (50 | ) | (23 | ) | (54 | ) | (64 | ) | 225 | (25 | ) | 154 | 666 | 270 | ||||||||||||||||||||||
| Improved recovery | 11 | 1 | 11 | 16 | 3 | 17 | 33 | - | 34 | |||||||||||||||||||||||||||
| Extensions and discoveries | 22 | 25 | 27 | 24 | - | 24 | 41 | 59 | 51 | |||||||||||||||||||||||||||
| Production | (189 | ) | (264 | ) | (235 | ) | (202 | ) | (278 | ) | (251 | ) | (197 | ) | (264 | ) | (243 | ) | ||||||||||||||||||
| Closing balance | 1,033 | 3,218 | 1,598 | 1,239 | 3,479 | 1,849 | 1,465 | 3,529 | 2,084 | |||||||||||||||||||||||||||
| Proved developed reserves: | ||||||||||||||||||||||||||||||||||||
| Opening balance | 913 | 3,176 | 1,470 | 1,042 | 3,284 | 1,618 | 933 | 2,663 | 1,400 | |||||||||||||||||||||||||||
| Closing balance | 779 | 3,131 | 1,329 | 913 | 3,176 | 1,470 | 1,042 | 3,284 | 1,618 | |||||||||||||||||||||||||||
| Proved undeveloped reserves: | ||||||||||||||||||||||||||||||||||||
| Opening balance | 326 | 303 | 379 | 423 | 245 | 466 | 501 | 405 | 572 | |||||||||||||||||||||||||||
| Closing balance | 254 | 87 | 269 | 326 | 303 | 379 | 423 | 245 | 466 | |||||||||||||||||||||||||||
Revisions
In 2014, net revisions increased reserves by 271 million boe. As discussed above, beginning on January 1, 2014, the royalties associated with natural gas and NGL are required to be paid to the ANH in cash, and are therefore considered a financial obligation and are no longer deducted from net reserves. As a result, reported reserves increased by 148 million boe in 2014. New development projects in Caño Sur, Moriche, Quifa, Rubiales, Provincia and Palagua fields resulted in a 91 million boe increase in reserves.
| (1) | It represents changes in previous proved reserves, upward or downward, resulting from new information (except for an increase in proved area), usually obtained from development drilling and production history or result from changes in economic factors. |
The revisions described above accounted for 88%sectionOverview Business – Exploration and Production – Reserves contains additional information of the increase inprocess of estimating reserves due to revisions in 2014. The remaining 12% were due to varying increases and decreases from other fields.
Improved Recovery
In 2014, improved recovery increased reserves by 34 million boe. The additions were associated withmain explanations about the continued development of waterflood projects through existing wells, though additional drilling may be required to fully optimize the development configuration. The main additions were in La Cira, Infantas and Yarigui Cantagallo fields representing a 25 million boe increase.
Extensions and Discoveries
Extensions and discoveries during 2014 amounted to 50 million boe, which is comprised of 47 million boe of extensions of proved acreage and 4 million boe from newly discovered fields and reservoirs. The newly discovered fields in Colombia corresponded to the Guando South West and Rex fields, and in the southern Gulf of Mexico, the Dalmatian South field. New reservoirs were discovered in the La Cañada Norte and Chipiron fields.
The extensions of proved acreage resulted mainly from activities in new proved areas in the Chichimene, Gibraltar Provincia, and Rubiales fields, which accounted for 33 million boe of the total of 47 million boe from extensions of proved acreage. The remaining 14 million boe corresponds to smaller changes in several other fields.
Purchases & Sales
In 2014, we neither purchased nor sold any participation in producing oil or gas properties.
Ecopetrol S.A. and Subsidiaries
Notes to the Consolidated Financial Statements
Years ended December 31, 2014, 2013 and 2012
(Expressed in millions of Colombian pesos)Proved Reserves.
| Standardized measure of discounted future net cash flows relating to proved oil and gas quantities and changes therein |
The standardized measure of discounted future net cash flows related to the above proved crude oil and natural gas reserves is calculated in accordance with the requirements of ASU 2010-03. Estimated future cash inflows from production under U.S. GAAPSEC requirements are computed by applying unweighted arithmetic average of the first-day-of-the-month for oil and gas price to year-end quantities of estimated net proved reserves.
| 2014 | 2013 | 2012 | 2016 | 2015 | 2014 | |||||||||||||||||||
| Future cash inflows | $ | 310,138,127 | $ | 264,155,176 | $ | 251,891,162 | 140,458,230 | 176,865,586 | 310,138,127 | |||||||||||||||
| Future production cost | (107,629,865 | ) | (72,941,680 | ) | (68,593,660 | ) | ||||||||||||||||||
| Future development costs | (23,504,455 | ) | (17,793,007 | ) | (12,811,379 | ) | ||||||||||||||||||
| Future income tax expenses | (60,366,272 | ) | (58,115,581 | ) | (55,445,509 | ) | ||||||||||||||||||
| Future costs | ||||||||||||||||||||||||
| Production | (60,705,779 | ) | (76,363,169 | ) | (107,629,865 | ) | ||||||||||||||||||
| Development | (12,005,835 | ) | (16,498,118 | ) | (23,504,455 | ) | ||||||||||||||||||
| Income tax expenses | (15,400,000 | ) | (30,052,830 | ) | (60,366,272 | ) | ||||||||||||||||||
| Future net cash flow | 118,637,535 | 115,304,908 | 115,040,614 | 52,346,616 | 53,951,469 | 118,637,535 | ||||||||||||||||||
| 10% annual discount for estimated timing of cash flows | (43,604,395 | ) | (42,044,683 | ) | (42,457,937 | ) | (18,221,004 | ) | (19,117,422 | ) | (43,604,395 | ) | ||||||||||||
| Standardized measure of discounted future net cash flows | $ | 75,033,140 | $ | 73,260,225 | $ | 72,582,677 | 34,125,612 | 34,834,047 | 75,033,140 | |||||||||||||||
| F-106 |
Ecopetrol S.A. Notes to Consolidated Financial Statements (Figures expressed in millions of Colombian pesos, unless otherwise stated) |
The following are the principal sources of change in the standardized measure of discounted net cash flows:flows in 2016, 2015 and 2014:
| 2014 | 2013 | 2012 | 2016 | 2015 | 2014 | |||||||||||||||||||
| Net change in sales and transfer prices and in production (lifting) cost related to future production | $ | 11,813,532 | $ | 11,751,390 | $ | 8,921,835 | 3,603,876 | (50,472,025 | ) | 12,924,167 | ||||||||||||||
| Changes in estimated future development costs | (10,987,031 | ) | (5,387,485 | ) | 2,092,588 | (4,767,340 | ) | 592,529 | (10,987,031 | ) | ||||||||||||||
| Sales and transfer of oil and gas produced during the period | (36,709,031 | ) | (43,577,194 | ) | (37,134,338 | ) | (23,270,907 | ) | (25,726,047 | ) | (38,698,178 | ) | ||||||||||||
| Net change due to extensions and discoveries | (902,356 | ) | (142,673 | ) | 2,370,545 | 154,352 | (93,190 | ) | (902,356 | ) | ||||||||||||||
| Net change due to purchase and (sales) of minerals in place | - | 55,199 | - | (83,450 | ) | - | - | |||||||||||||||||
| Net change due to revisions in quantity estimates | 18,712,764 | 15,600,101 | 3,017,004 | (2,570,103 | ) | (985,217 | ) | 18,866,518 | ||||||||||||||||
| Previously estimated development costs incurred during the period | 8,702,964 | 6,176,479 | 5,928,223 | 5,042,697 | 10,769,369 | 8,702,964 | ||||||||||||||||||
| Accretion of discount | 11,018,459 | 10,756,496 | 10,527,661 | 5,423,781 | 11,321,221 | 11,018,459 | ||||||||||||||||||
| Timing and other | 1,378,320 | 7,387,316 | 6,564,830 | 6,394,404 | (4,381,037 | ) | 2,103,078 | |||||||||||||||||
| Net change in income taxes | (1,254,706 | ) | (1,942,081 | ) | 1,293,602 | 9,364,255 | 18,775,304 | (1,254,706 | ) | |||||||||||||||
| Aggregate change in the Standardized measure of discounted future net cash flows for the year | $ | 1,772,915 | $ | 677,548 | $ | 3,581,950 | (708,435 | ) | (40,199,093 | ) | 1,772,915 | |||||||||||||
| F-107 |
Ecopetrol S.A. Notes to Consolidated Financial Statements (Figures expressed in millions of Colombian pesos, unless otherwise stated) |
Exhibit 1 - Consolidated companies, associates and joint ventures
Consolidated subsidiaries
| Company | Functional currency | Ownership interest Ecopetrol | Activity | Shared interest | Country/ Domicile | Geographic area of operations | Net equity | Income (loss) for the period | |||||||||
| Ecopetrol Global Energy S.L.U | U.S. Dollar | 100% | Investment vehicle | Ecopetrol America Inc., Ecopetrol Oleo & Gas do Brazil Ltda., Ecopetrol del Perú S. A.,ECP Oil and Gas Germany GmbH Gmbh, Refinería de Cartagena S. A., Bioenergy S. A. | Spain | Spain | 2,727,352 | (380,156 | ) | ||||||||
| Ecopetrol Oleo é Gas do Brazil Ltda. | Real | 100% | Hydrocarbon exploration and explotation | Sociedad Portuaria de Oleofinas y Derivados, Propileno del Caribe S. A | Brazil | Brazil | 27,617 | (50,849 | ) | ||||||||
| Ecopetrol del Perú S. A. | U.S. Dollar | 100% | Hydrocarbon exploration and explotation | - | Peru | Peru | 51,523 | (2,847 | ) | ||||||||
| Ecopetrol América Inc. | U.S. Dollar | 100% | Hydrocarbon exploration and explotation | Ecopetrol Perú S.A., Ecopetrol Oleo é Gas do Brazil Ltda., Propileno del Caribe S. A, Sociedad Portuaria de Oleofinas y Derivados | United States of America | United States of America | 2,645,772 | (298,055 | ) | ||||||||
| Black Gold Re Ltd. | U.S. Dollar | 100% | Reinsurer of Ecopetrol and its subsidiaries | - | Bermuda | Bermuda | 581,901 | 36,808 | |||||||||
| ECP Oil and Gas Germany GmbH | U.S. Dollar | 100% | Hydrocarbon exploration and explotation | - | Germany | Angola | 2,476 | (27,530 | ) | ||||||||
| Hocol Petroleum Limited | U.S. Dollar | 100% | Investment vehicle. | Hocol S. A. | Bermuda | Bermuda | 2,267,217 | (15,627 | ) | ||||||||
| Hocol S.A | U.S. Dollar | 100% | Hydrocarbon exploration and explotation | ODC, Oleoducto Bicentenario | Cayman Islands | Colombia | 1,563,126 | 659 |
| F-108 |
Ecopetrol S.A. Notes to Consolidated Financial Statements (Figures expressed in millions of Colombian pesos, unless otherwise stated) |
| Company | Functional currency | Ownership interest Ecopetrol | Activity | Shared interest | Country/ Domicile | Geographic area of operations | Net equity | Income (loss) for the period | |||||||||
| Andean Chemicals Ltd. | U.S. Dollar | 100% | Investment vehicle | Bioenergy S. A., Refinería de Cartagena, Propileno del Caribe S. A. y Comai S.A. | Bermuda | Bermuda | 4,857,372 | (1,564,731 | ) | ||||||||
| Refinería de Cartagena S. A. | U.S. Dollar | 100% | Hydrocarbons refining, marketing and distribution | - | Colombia | Colombia | 6,969,793 | (2,205,876 | ) | ||||||||
| Propileno del Caribe Propilco S. A. | U.S. Dollar | 100% | Production and marketing of polypropylene resin | Comai S. A., Refinería de Cartagena., Bioenergy S. A., Sociedad Portuaria Oleofinas y Derivados | Colombia | Colombia | 1,195,760 | 191,060 | |||||||||
| COMAI - Compounding and Masterbatching Industry | Colombian peso | 100% | Manufacturing of polypropylene compounds and master batches for a wide range of uses | Refinería de Cartagena., Bioenergy S. A., Zona franca de Cartagena S.A , Sociedad Portuaria del Dique | Colombia | Colombia | 131,227 | 103,888 | |||||||||
| Bioenergy S. A. | Colombian peso | 98.46% | Biofuels production | Bioenergy Zona Franca S. A., Amandine Holdings Corp. y Los Arces Group Corp. | Colombia | Colombia | 313,824 | (475,294 | ) | ||||||||
| Bioenergy Zona Franca S. A. | Colombian peso | 98.46% | Biofuels production | - | Colombia | Colombia | 251,185 | (362,102 | ) | ||||||||
| Amandine Holdings Corp. | Colombian peso | 98.46% | In a winding-up process | - | Panama | Panama | 6,657 | - | |||||||||
| Los Arces Group Corp. | Colombian peso | 98.46% | In a winding-up process | - | Panama | Panama | 5,100 | - | |||||||||
| Cenit S.A.S. | Colombian peso | 100% | Storage and transportation through hydrocarbon pipelines | Oleoducto Bicentenario, Ocensa, ODC, ODL, Sento S.A.S, Serviport | Colombia | Colombia | 10,767,210 | 2,915,342 |
| F-109 |
Ecopetrol S.A. Notes to Consolidated Financial Statements (Figures expressed in millions of Colombian pesos, unless otherwise stated) |
| Company | Functional currency | Ownership interest Ecopetrol | Activity | Shared interest | Country/ Domicile | Geographic area of operations | Net equity | Income (loss) for the period | |||||||||
| Oleoducto Central S. A. - Ocensa | U.S. Dollar | 72.65% | Pipeline transportation of crude oil | - | Colombia | Colombia | 2,446,722 | 1,779,134 | |||||||||
| ODL S. A. | Colombian peso | 65% | Pipeline transportation of crude oil | - | Panama | Colombia | 1,044,369 | 341,362 | |||||||||
| Oleoducto de Colombia S. A. – ODC | Colombian peso | 73% | Pipeline transportation of crude oil | - | Colombia | Colombia | 288,734 | 237,787 | |||||||||
| Oleoducto Bicentenario de Colombia SAS | Colombian peso | 55.97% | Pipeline transportation of crude oil | - | Colombia | Colombia | 945,026 | 440,371 | |||||||||
| Ecopetrol Capital AG | U.S. Dollar | 100% | Financing, liquidation of funding for companies, groups or any business or related activity | - | Switzerland | Switzerland | 1,098,981 | 143,805 | |||||||||
| Ecopetrol Global Capital SLU | Euro | 100% | Investment vehicle | - | Spain | Spain | 31 | (53 | ) | ||||||||
| Ecopetrol Costa Afuera S.A.S. | Colombian peso | 100% | Offshore exploration | - | Colombia | Colombia | 7,954 | (1,834 | ) | ||||||||
| Sento S.A.S. | Colombian peso | 100% | Investments in hydrocarbon transportation business | ODC | Colombia | Colombia | 21,453 | 10,918 |
| F-110 |
Ecopetrol S.A. Notes to Consolidated Financial Statements (Figures expressed in millions of Colombian pesos, unless otherwise stated) |
Associates and joint ventures
| Company | Functional currency | Ownership interest Ecopetrol | Activity | Country/ Domicile | Geographic area of operations | Net equity | Income (loss) for the period | ||||||||
| Associates | |||||||||||||||
| Invercolsa S.A. (*) | Colombian peso | 43.35% | Investment in companies of transport and distribution of natural gas and L.P.G. in Colombia | Colombia | Colombia | 560,915 | 111,997 | ||||||||
| Serviport S.A. | Colombian peso | 49% | Services for oil-vessel loading and unloading support; supply of equipment; technical inspections and loading | Colombia | Colombia | 18,259 | 877 | ||||||||
| Sociedad Portuaria Olefinas y Derivados S.A. (*) | Colombian peso | 50% | Construction, use, maintenance, adaptation and administration of ports and private or public docks facilities | Colombia | Colombia | 2,669 | 469 | ||||||||
| Joint ventures | |||||||||||||||
| Equion Energía Limited | U.S. Dollar | 51% | Hydrocarbon exploration, exploitation and production | United Kingdom | Colombia | 1,530,858 | 279,515 | ||||||||
| Ecodiesel Colombia S.A. | Colombian peso | 50% | Production, commercialization and distribution of biofuels and oleo chemicals | Colombia | Colombia | 79,050 | 24,176 | ||||||||
| Offshore International Group | U.S. Dollar | 50% | Hydrocarbon exploration, exploitation and production | United States of America | Peru | 1,192,980 | (248,037 | ) |
(*) Information available as of November 30, 2016.
| F-111 |
| 9. | Signature Page |
SIGNATURES
The registrant hereby certifies that it meets all of the requirements for filing on Form 20-F and that it has duly caused and authorized the undersigned to sign this annual report on its behalf.
| Ecopetrol S.A. | |||
| By: | /s/ | ||
| Name: | |||
| Title: | Chief Financial Officer | ||
| By: | /s/ Juan Carlos Echeverry | ||
| Name: | Juan Carlos Echeverry | ||
| Title: | Chief Executive Officer | ||
| Dated: May 30, 2017 | |||
Dated: April 28, 2015
| 152 |
| 10. | Exhibits |
Exhibit No. | Description | |
| 1.1 | Amended and Restated Bylaws of Ecopetrol S.A., dated March | |
| 4.1 | Transportation Agreement between Ecopetrol S.A. and Oleoducto Central S.A., dated March 31, 1995 (incorporated by reference to Exhibit 4.1 on Form 20-F filed with the U.S. Securities and Exchange Commission on September 12, 2008 (File No. 001-34175)) (English Translation). | |
| 4.2 | Supplementary Agreement to Transportation Agreement between Ecopetrol S.A. and Oleoducto Central S.A., dated January | |
| 4.3 | Natural Gas Transportation Agreement between Ecopetrol S.A. and Transportadora de Gas del Interior S.A. ESP, dated October 1, 2008 (incorporated by reference to Exhibit 4.3 on Form 20-F filed with the U.S. Securities and Exchange Commission on April 29, 2013 (File | |
| 4.4 | Supplementary Agreement No. 1, dated December 5, 2008, to the Natural Gas Transportation Agreement between Ecopetrol S.A. and Transportadora de Gas del Interior S.A. ESP, dated October 1, 2008 (incorporated by reference to Exhibit 4.4 on Form 20-F filed with the U.S. Securities and Exchange Commission on April 29, 2013 (File | |
| 4.5 | Supplementary Agreement No. 2, dated April 11, 2012, to the Natural Gas Transportation Agreement between Ecopetrol S.A. and Transportadora de Gas Internacional S.A. E.S.P., dated October 1, 2008 (incorporated by reference to Exhibit 4.5 on Form 20-F filed with the U.S. Securities and Exchange Commission on April 29, 2013 (File | |
| 4.6 | Crude Oil Transportation Services Agreement between Ecopetrol S.A. and Cenit Transporte y Logística de Hidrocarburos S.A.S., dated April 1, 2013 (incorporated by reference to Exhibit 4.6 on | |
| 4.7 | Refined Products Transportation Services Agreement between Ecopetrol S.A. and Cenit Transporte y Logística de Hidrocarburos S.A.S., dated April 1, 2013 (incorporated by reference to Exhibit 4.7 on Form 20-F filed with the U.S. Securities and Exchange Commission on April 29, 2013 (File | |
| 4.8 | Indenture, dated as of July 23, 2009, between the Company and The Bank of New York Mellon, as trustee (incorporated by reference to Exhibit 4.2 to the Company’s Form F-4 filed with the U.S. Securities and Exchange Commission on July 31, 2009 (File No. 333-160965)). | |
| 4.9 | Bicentenario Transport Contract between Oleoducto Bicentenario de Colombia S.A.S. and Ecopetrol S.A., dated June 20, 2012 incorporated by reference to Exhibit 4.9 on Form 20-F filed with the U.S. Securities and Exchange Commission on April 25, 2014 (File |
| 4.11 | Supplementary Agreement No. 2, dated March 28, 2014, to the Bicentenario Transport Contract between Oleoducto Bicentenario de Colombia S.A.S. and Ecopetrol S.A., dated June 20, 2012 (incorporated by reference to Exhibit 4.11 on Form 20-F filed with the U.S. Securities and Exchange Commission on April 28, 2016 (File No. 001-34175)) (English Translation). | |
| 4.12 | Supplementary Agreement No. 4, dated April 6, 2015, to the Bicentenario Transport Contract between Oleoducto Bicentenario de Colombia S.A.S. and Ecopetrol S.A., dated June 20, 2012 (incorporated by reference to Exhibit 4.12 on Form 20-F filed with the U.S. Securities and Exchange Commission on April 28,2016 (File No. 001-34175)) (English Translation). | |
| 4.13 | Amendment No. 6, dated April 25, 2016, to the Crude Oil Transportation Services Agreement between Ecopetrol S.A. and Cenit Transporte y Logística de Hidrocarburos S.A.S., dated April 1, 2013 (English Translation). |
| 153 |
Exhibit No. | Description | |
| 4.14 | Amendment No. 7, dated December 28, 2016, to the Crude Oil Transportation Services Agreement between Ecopetrol S.A. and Cenit Transporte y Logística de Hidrocarburos S.A.S., dated April 1, 2013 (English Translation). | |
| 8.1 | List of subsidiaries of Ecopetrol S.A. | |
| 12.1 | Section 302 Certification of the Chief Executive Officer. | |
| 12.2 | Section 302 Certification of the Chief Financial Officer. | |
| 13.1 | Section 906 Officer Certification. | |
| 99.1 | Third-Party Reserve Report of Ryder Scott Company, L.P. | |
| 99.2 | Third-Party Reserve Report of DeGolyer and |
| 11. | Cross-reference to Form 20-F |
Sections | ||||
| Item 1. | Identity of Directors, Senior Management and Advisers | N/A | ||
| Item 2. | Offer Statistics and Expected Timetable | N/A | ||
| Item 3. | Key Information | |||
| A. Selected Financial Data | ||||
| B. Capitalization and Indebtedness | N/A | |||
| C. Reasons for the Offer and Use of Proceeds | N/A | |||
| D. Risk Factors | 5.1 | |||
| Item 4. | Information on the Company | |||
| A. History and Development of the Company | ||||
| B. Business Overview | 2; 3.3 – 3.9; 4.5.1 | |||
| C. Organizational Structure | 3.2 | |||
| D. Property, Plants and Equipment | 3.4 – 3.6; 4.6.2; Notes 15, 16 and 18 to the consolidated financial statements | |||
| E. Oil and Gas Disclosures | 3.3 – 3.6; Notes 15 and 16 and Supplemental information on Oil and Gas producing activities (unaudited by EY) to the consolidated financial statements | |||
| Item 4A. | Unresolved Staff Comments | None | ||
| Item 5. | Operating and Financial Review and Prospects | |||
| A. Operating Results | ||||
| B. Liquidity and Capital Resources | ||||
| C. Research and development, Patents and Licenses, etc. | 3.7; Note | |||
| D. Trend Information | ||||
| E. Off-Balance Sheet Arrangements | ||||
| F. Tabular Disclosure of Contractual Obligations | ||||
| G. Safe Harbor | ||||
| Item 6. | Directors, Senior Management and Employees | |||
| A. Directors and Senior Management | 7.3; 7.5 | |||
| B. Compensation | 7.6; | |||
| C. Board Practices | 7.3 | |||
| D. Employees | 3.12 | |||
| E. Share Ownership | 7.7 |
Sections | ||||
| Item 7. | Major Shareholders and Related Party Transactions | |||
| A. Major Shareholders | ||||
| B. Related Party Transactions | 3.10; Note | |||
| C. Interests of Experts and Counsel | N/A |
| Item 8. | Financial Information | |||
| A. Consolidated Statements and Other Financial Information | 4; 5.3; 6.2; 8 | |||
| 7.8; Note | ||||
| Item 9. | The Offer and Listing | |||
| A. Offer and Listing Details | 6.3 | |||
| B. Plan of Distribution | N/A | |||
| C. Markets | 6.3 | |||
| D. Selling Shareholders | N/A | |||
| E. Dilution | N/A | |||
| F. Expenses of the Issue | N/A | |||
| Item 10. | Additional Information | |||
| A. Share Capital | N/A | |||
| B. Memorandum and Articles of Association | 7.1 | |||
| C. Material Contracts | 3.4.4; 4.8; Exhibits 4.1 – 4.12 | |||
| D. Exchange Controls | 5.1.4; 6.6 | |||
| E. Taxation | 4.2.1; 6.5; Note 10 to the consolidated financial statements | |||
| F. Dividends and Paying Agents | N/A | |||
| G. Statements by Experts | ||||
| 1.1 | ||||
| I. Subsidiary Information | N/A | |||
| Item 11. | Quantitative and Qualitative Disclosures About Market Risk | 4.10; 5.1.1; 5.2.1; 5.2.3; Note 31 to the consolidated financial statements | ||
| Item 12. | Description of Securities Other than Equity Securities |
| A. Debt Securities | N/A | |||
| B. Warrants and Rights | N/A | |||
| C. Other Securities | N/A | |||
| D. American Depositary Shares | ||||
| 6.4 | ||||
| Item 13. | Defaults, Dividend Arrearages and Delinquencies | None | ||
| Item 14. | Material Modifications to the Rights of Security Holders and Use of Proceeds | None | ||
| Item 15. | Controls and Procedures | |||
| 5.2; 7.8 | ||||
| Item 16A. | Audit Committee Financial Expert | 7.3.2 | ||
| Item 16B. | Code of Ethics | 7.2; 7.4 | ||
| Item 16C. | Principal Accountant Fees and Services | 7.8 | ||
| Item 16D. | Exemptions from the Listing Standards for Audit Committees | N/A | ||
| Item | 16E. | Purchases of Equity Securities by the Issuer and Affiliated Purchases | N/A | |
| Item 16F. | Changes in Registrant’s Certifying Accountant | |||
| 7.8 | ||||
| Item 16G. | Corporate Governance | |||
| Item | 16H. | Mine Safety Disclosure | N/A | |
| Item | 17. | Financial Statements | N/A | |
| Item 18. | Financial Statements | |||
| 8 | ||||
| Item 19. | Exhibits | 10 |
| 155 |