
As filed with the Securities and Exchange Commission on May 30, 2017April 5, 2019
UNITED STATES
SECURITIES AND EXCHANGE COMMISSION
Washington, D.C. 20549
FORM 20-F
ANNUAL REPORT PURSUANT TO
SECTION 13 OR 15(d) OF
THE SECURITIES EXCHANGE ACT OF 1934
For the fiscal year ended December 31, 20162018
Commission file number: 001-34175
ECOPETROL S.A.
(Exact name of Registrant as specified in its charter)
N/A
(Translation of Registrant’s name into English)
REPUBLIC OF COLOMBIA
(Jurisdiction of incorporation or organization)
Carrera 13 No. 36 – 24
BOGOTA – COLOMBIA
(Address of principal executive offices)
Tel. (571) 234 4000
Andrés Felipe Sánchez
Investor Relations Officer
investors@ecopetrol.com.co
Tel. (571) 234 5190
Carrera 13 N.36-24 Piso 5
7
Bogota, Colombia
(Name, Telephone, E-Mail and/or Facsimile number and Address of Company Contact Person)
Securities registered or to be registered pursuant to Section 12(b) of the Act.
| Title of each class | Name of each exchange on which registered: | |
| American Depository Shares (as evidenced by American Depository Receipts), each representing 20 common shares par value COP$609 per share | New York Stock Exchange | |
| Ecopetrol common shares par value COP$609 per share | New York Stock Exchange (for listing purposes only) |
| Title of each class | ||
| 5.875% Notes due 2023 | New York Stock Exchange |
| 4.125% Notes due 2025 | New York Stock Exchange | |
| 5.375% Notes due 2026 | New York Stock Exchange | |
| 7.375% Notes due 2043 | New York Stock Exchange | |
| 5.875% Notes due 2045 | New York Stock Exchange | |
Securities registered or to be registered pursuant to Section 12(g) of the Act: None
Securities for which there is a reporting obligation pursuant to Section 15(d) of the Act: None
Indicate the number of outstanding shares of each of the issuer’s classes of capital or common stock as of the close of the period covered by the annual report.
41,116,694,690 Ecopetrol common shares, par value COP$609 per share
Indicate by check mark if the registrant is a well-known seasoned issuer, as defined in Rule 405 of the Securities Act.
x Yes¨ No
If this report is an annual or transition report, indicate by check mark if the registrant is not required to file reports pursuant to Section 13 or 15(d) of the Securities Exchange Act of 1934.
¨ Yesx No
Indicate by check mark whether the registrant (1) has filed all reports required to be filed by Section 13 or 15(d) of the Securities Exchange Act of 1934 during the preceding 12 months (or for such shorter period that the registrant was required to file such reports), and (2) has been subject to such filing requirements for the past 90 days.
x Yes¨ No
Indicate by check mark whether the registrant has submitted electronically and posted on its corporate Web site, if any, every Interactive Data File required to be submitted and posted pursuant to Rule 405 of Regulation S-T (§232.405 of this chapter) during the preceding 12 months (or for such shorter period that the registrant was required to submit and post such files).
N/Ax Yes¨ No
Indicate by check mark whether the registrant is a large accelerated filer, an accelerated filer, or a non-accelerated filer.filer, or an emerging growth company. See definition of “large accelerated filer,” “accelerated filer,” and large accelerated filer”“emerging growth company” in Rule 12b-2 of the Exchange Act. (Check one):
| Large accelerated filerx | Accelerated filer¨ | Non-accelerated filer¨ | Emerging growth company¨ |
��
If an emerging growth company that prepares its financial statements in accordance with U.S. GAAP, indicate by check mark if the registrant has elected not to use the extended transition period for complying with any new or revised financial accounting standards† provided pursuant to Section 13(a) of the Exchange Act. ☐¨
† The term “new or revised financial accounting standard” refers to any update issued by the Financial Accounting Standards Board to its Accounting Standards Codification after April 5, 2012.
Indicate by check mark which basis of accounting the registrant has used to prepare the financial statements included in this filing:
| ¨ U.S. GAAP | x International Financial Reporting Standards as issued by the International Accounting Standards Board | ¨ Other |
If “Other” has been checked in response to the previous question, indicate by check mark which financial statement item the registrant has elected to follow:
¨ Item 17¨ Item 18
If this is an annual report, indicate by check mark whether the registrant is a shell company
(as defined in Rule 12b-2 of the Exchange Act).
¨ Yesx No
Annual Report on Form 20-F 20162018
| 1. | Introduction | 1 | ||||
| 1.1 | About This Report | 1 | ||||
| 1.2 | Forward-looking Statements | 1 | ||||
| 1.3 | Selected Financial and Operating Data | 2 | ||||
| 2. | Strategy and Market Overview | 4 | ||||
| 2.1 | Our Corporate Strategy | 5 | ||||
| 3. | Business Overview | 6 | ||||
| 3.1 | Our History | 6 | ||||
| 3.2 | Our Corporate Structure | 7 | ||||
| 3.3 | Our Business | 9 | ||||
| 3.4 | Exploration and Production | 9 | ||||
| 3.4.1 | Exploration Activities | 9 | ||||
| 3.4.1.1 | Exploration Activities in Colombia | 9 | ||||
| 3.4.1.2 | Exploration Activities Outside of Colombia | 12 | ||||
| 3.4.2 | Production Activities | 13 | ||||
| 3.4.2.1 | Production Activities in Colombia | 14 | ||||
| 3.4.2.1.1. | Ecopetrol S.A.’s Production Activities in Colombia | 14 | ||||
| 3.4.2.1.2. | Ecopetrol S.A.’s Affiliates and Subsidiaries’ Production Activities in Colombia | 19 | ||||
| 3.4.2.2 | Production Activities Outside Colombia | 22 | ||||
| 3.4.2.3 | Marketing of Crude Oil, Natural Gas and Refined Products | 23 | ||||
| 3.4.3 | Reserves | 25 | ||||
| 3.4.4 | Joint Venture and Other Contractual Arrangements | 30 | ||||
| 3.5 | Transportation and Logistics | 34 | ||||
| 3.5.1.1 | Transportation Activities | 34 | ||||
| 3.5.1.2 | Pipelines | 37 | ||||
| 3.5.1.3 | Export and Import Facilities | 39 | ||||
| 3.5.2 | Other Transportation Facilities | 39 | ||||
i
ii
iii
iv
v
vi
| 6.6 | Exchange Controls and Limitations | 130 | ||
| 6.7 | Exchange Rates | 131 | ||
| 6.8 | Major Shareholders | 132 | ||
| 6.9 | Enforcement of Civil Liabilities | 132 | ||
| 7. | Corporate Governance | 134 | ||
| 7.1 | Bylaws | 134 | ||
| 7.2 | Code of Ethics | 137 | ||
| 7.3 | Board of Directors | 138 | ||
| 7.3.1 | Board Practices | 140 | ||
| 7.3.2 | Board Committees | 141 | ||
| 7.4 | Compliance with NYSE Listing Rules | 142 | ||
| 7.5 | Management | 143 | ||
| 7.6 | Compensation of Directors and Management | 147 | ||
| 7.7 | Share Ownership of Directors and Executive Officers | 147 | ||
| 7.8 | Controls and Procedures | 147 | ||
| 8. | Financial Statements | 151 | ||
| 9. | Signature Page | 152 | ||
| 10. | Exhibits | 153 | ||
| 11. | Cross-reference to Form 20-F | 154 | ||
vii
| 1. | Introduction |
We file our Annual Report on Form 20-F and other information with the U.S. Securities and Exchange Commission.
We file reports, including annual reports on Form 20-F, and other information with the SEC pursuant to the rules and regulations of the SEC that apply to foreign private issuers. YouThe materials included in this annual report on Form 20-F may read and copy any materials filed with the SEC inbe downloaded at the SEC’s public reference room at 100 F Street, NE, Washington, D.C. 20549. Please call the SEC at 1-800-SEC-0330 for further information on the operation of the public reference room.website: http://www.sec.gov. Any filings we make are also available to the public over the Internet at the SEC’s website at www.sec.gov and at our website at www.ecopetrol.com.co. (This URL is intended to be an inactive textual reference only. It is not intended to be an active hyperlink to our website. The information on our website, which might be accessible through a hyperlink resulting from this URL, is not and shall not be deemed to be incorporated into this annual report.)
Unless the context otherwise requires, the terms “Ecopetrol”, “we”, “us”, “our”“Ecopetrol,” “we,” “us,” “our,” or the “Company” are used in this annual report to refer to Ecopetrol S.A. and its subsidiaries on a consolidated basis.
References to the Nation in this annual report relate to the Republic of Colombia (“Colombia”), our controlling shareholder. References made to the Colombian government or the Government correspond to the executive branch including the President of Colombia, the ministries and other governmental agencies responsible for regulating our business.
This annual report on Form 20-F contains forward-looking statements within the meaning of the safe harbor provisions of the U.S. Private Securities Litigation Reform Act of 1995. These statements are not based on historical facts and reflect our expectations for future events and results. Most facts are uncertain because of their nature. Words such as “anticipate”, “believe”, “could”, “estimate”, “expect”, “should”, “plan”, “potential”, “predicts”, “prognosticate”, “project”, “target”,“anticipate,” “believe,” “could,” “estimate,” “expect,” “should,” “plan,” “potential,” “predicts,” “prognosticate,” “project,” “target,” “achieve” and “intend”,“intend,” among other similar expressions, are understood as forward-looking statements. We have made forward-looking statements that address, among other things:
| · | our exploration and production activities, including drilling; |
| · | import and export activities; |
| · | our liquidity, cash flow, and sources of funding; |
| · | our projected and targeted capital expenditures and other cost commitments and revenues; and |
| · | dates by which certain areas will be developed or will come on-stream. |
Our forward-looking statements and sensitivity analysis are not guarantees of future performance and are subject to assumptions that may prove incorrect and to risks and uncertainties that are difficult to predict. Actual results could differ materially from those expressed or forecastforecasted in any forward-looking statements as a result of a variety of factors. These factors may include, but are not limited to, the following:
| · | general economic and business conditions, including crude oil and other commodity prices, refining margins and prevailing exchange rates; |
| · | competition; |
| · | our ability to obtain financing; |
| · | our ability to find, acquire or gain access to additional reserves and our ability to develop existing reserves; |
| · | uncertainties inherent in making estimates of our reserves; |
| 1 |
| · | significant political, economic and social developments in Colombia and other countries where we do business; |
| · | natural disasters, military operations, terrorist acts, wars or embargoes; |
| · | regulatory developments, including regulations related to climate change; |
| · | receipt of government approvals and licenses; |
| · | technical difficulties; and |
| · | other factors discussed in Section 5.1 of this document as “Risk Factors.” |
All forward-looking statements attributed to us are qualified in their entirety by this cautionary statement. We undertake no obligation to publicly update or revise any forward-looking statements, whether as a result of new information or for any other reason. Accordingly, readers should not place undue reliance on the forward-looking statements contained in this annual report.statements.
1.3Selected Financial and Operating Data
The following table sets forth, for the periods and at the dates indicated, our selected historical financial and certain key operating data. The selected financial data has been derived from and should be read in conjunction with, and is qualified in its entirety by reference to, our consolidated audited financial statements, presented in Colombian Pesos.
Table 1 – Selected Operating Data
| Operating Information | 2016 | 2015 | 2014 | 2013 | 2012 | 2018 | 2017 | 2016 | 2015 | 2014 | ||||||||||||||||||||||||||||||
| Oil and gas production (mboed) | 717.9 | 760.7 | 755.4 | 788.2 | 754.0 | 720.4 | 715.1 | 717.9 | 760.7 | 755.4 | ||||||||||||||||||||||||||||||
| Proved oil and gas reserves (Mmboe)(1) | 1,598 | 1,849 | 2,084 | 1,972 | 1,877 | 1,727 | 1,659 | 1,598 | 1,849 | 2,084 | ||||||||||||||||||||||||||||||
| Exploratory Wells(2) | 6 | 5 | 28 | 22 | 23 | 17 | 20 | 6 | 5 | 28 | ||||||||||||||||||||||||||||||
| Refinery Through-put (bpd)(3) | 332,751 | 234,861 | 240,484 | 283,362 | 296,340 | 375,666 | 347,483 | 332,751 | 234,861 | 240,484 | ||||||||||||||||||||||||||||||
| 1P Reserves replacement ratio | (7 | %) | 6 | % | 146 | % | 139 | % | 108 | % | 129 | % | 126 | % | (7 | )% | 6 | % | 146 | % | ||||||||||||||||||||
| (1) |
| (2) | Gross exploratory wells. |
| (3) | Refinery |
Financial Information
International Financial Reporting Standards (“IFRS”)
(Expressed in millions of Colombian Pesos, except for the net income per share and net operating income per share, which are expressed in Colombian Pesos)
Table 2 – Selected Financial Data
| Financial Information | 2016 | 2015 | 2018 | 2017 | 2016 | 2015 | 2014 | |||||||||||||||||||||
| Revenue | 48,485,561 | 52,347,271 | 68,603,872 | 55,954,228 | 48,485,561 | 52,347,271 | 65,971,888 | |||||||||||||||||||||
| Operating income | 8,904,548 | 2,131,165 | 22,458,414 | 16,171,855 | 8,904,548 | 2,131,165 | 14,449,027 | |||||||||||||||||||||
| Net income (loss) attributable to Ecopetrol’s shareholders | 2,447,881 | (7,193,859 | ) | 11,381,386 | 7,178,539 | 2,447,881 | (7,193,859 | ) | 5,046,517 | |||||||||||||||||||
| Net operating income per share | 217 | 52 | ||||||||||||||||||||||||||
| Weighted average number of shares outstanding | 41,116,694,690 | 41,116,694,690 | ||||||||||||||||||||||||||
| Earnings(loss) per share (basic and diluted) | 59.5 | (175.0 | ) | |||||||||||||||||||||||||
| Total assets | 120,437,924 | 123,588,190 | ||||||||||||||||||||||||||
| Financial Information | 2016 | 2015 | ||||||
| Total equity | 43,560,501 | 43,100,963 | ||||||
| Subscribed and paid-in capital | 25,040,067 | 25,040,068 | ||||||
| Number of common shares | 41,116,694,690 | 41,116,694,690 | ||||||
| Dividends declared per share | 23 | - | ||||||
| Total liabilities | 76,877,423 | 80,487,227 | ||||||
| 2 |
| Financial Information | 2018 | 2017 | 2016 | 2015 | 2014 | |||||||||||||||
| Net operating income per share | 546 | 393 | 217 | 51.8 | 351.4 | |||||||||||||||
| Weighted average number of shares outstanding | 41,116,694,690 | 41,116,694,690 | 41,116,694,690 | 41,116,694,690 | 41,116,698,456 | |||||||||||||||
| Earnings (loss) per share (basic and diluted) | 277 | 175 | 59.5 | (175.0 | ) | 122.7 | ||||||||||||||
| Total assets | 124,643,498 | 117,847,412 | 118,958,977 | 123,588,190 | 110,923,851 | |||||||||||||||
| Total equity | 57,107,780 | 48,215,699 | 43,560,501 | 43,100,963 | 48,534,228 | |||||||||||||||
| Subscribed and paid-in capital | 25,040,067 | 25,040,067 | 25,040,067 | 25,040,068 | 10,279,175 | |||||||||||||||
| Number of common shares | 41,116,694,690 | 41,116,694,690 | 41,116,694,690 | 41,116,694,690 | 41,116,698,456 | |||||||||||||||
| Dividends declared per share | 225 | 89 | 23 | - | 133 | |||||||||||||||
| Total liabilities | 67,535,718 | 69,631,713 | 75,398,476 | 80,487,227 | 62,389,623 | |||||||||||||||
Our consolidated financial statements for the years ended December 31, 2014, 2015, 2016, 2017 and 20162018 were prepared in accordance with IFRS as issued by IASB. References in this annual report to IFRS mean IFRS as issued by the IASB. Our date of transition to IFRS was January 1, 2014. Our consolidated financial statements for the year ended December 31, 2015 were our first set of consolidated financial statements prepared in accordance with IFRS.
IFRS differs in certain significant aspects from the current reporting standards as in effect in Colombia (“Colombian IFRS”)), which is the accounting standard we use for local reporting purposes. As a result, our financial information presented under IFRS is not directly comparable to our financial information presented under Colombian IFRS. For a description of the differences between Colombian IFRS and IFRS, see sectionFinancial Review—Summary of Differences between Internal Reporting Policies and IFRS.
Our consolidated financial statements were consolidated line by line and all transactions and balances between subsidiaries have been eliminated. These financial statements include the financial results of all subsidiary companies controlled, directly or indirectly, by Ecopetrol S.A. See Exhibit 1 – Consolidated companies, associates and joint ventures, to our consolidated financial statements included in this annual report.
As indicated in paragraphs 9 and 18 of the International Accounting Standard 27IFRS 10 “Consolidated and Separated Financial Statements” we must present our financial information on a consolidated basis as if we were a single entity, combining the financial statements of Ecopetrol S.A. and its subsidiaries line by line, adding assets, liabilities, shareholder’s equity, revenues and expenses of similar nature, removing the reciprocal items among members of the Ecopetrol Group (“Ecopetrol Group” or “EG”) and recognizing non-controlling interest. We present our operating information on a consolidated basis.basis in accordance with IFRS.
The regulations of the SEC do not require foreign private issuers that prepare their financial statements on the basis of IFRS to reconcile such financial statements to U.S. GAAP. Accordingly, while we have in the past reconciled our consolidated financial statements prepared in accordance with Colombian Government Entity GAAP to U.S. GAAP, thosethese reconciliations are no longerhave not been presented in our filings beforeto the SEC.SEC since 2015. We do continue to provide the disclosure required under the U.S. Financial Accounting Standards Board (FASB) Accounting Standards Codification (ASC) Topic 932 “Extractive Activities—Oil and Gas” (which we refer to as ASC Topic 932), as this is required, regardless of the basis of accounting on which we prepare our financial statements. Other than as required under ASC Topic 932, any references to accounting treatments under Colombian Government Entity GAAP or U.S. GAAP relate solely to the application of Colombian Government Entity GAAP or U.S. GAAP to our historical consolidated financial statements.
In this annual report, references to “US$” or “U.S. dollars” are to United States dollars and references to “COP$,” “Colombian Peso” or “Colombian Pesos” are to Colombian Pesos, the Ecopetrol Group’s functional and presentation currency under which we prepare our consolidated financial statements. This annual report translates certain Colombian Peso amounts into U.S. dollars at specified rates solely for the convenience of the reader. Unless otherwise indicated, such Colombian Peso amounts have been translated at the rate of COP$3,053.422,956.55 per US$1.00, which corresponds to theTasa Representativa Promedio del Mercado(TRM), or Average Representative Market Exchange Rate, for 2016.2018. Such conversion should not be construed as a representation that the Colombian Peso amounts correspond to, or have been or could be converted into, U.S. dollars at that rate or any other rate. On May 26, 2017,April 1, 2019, the Representative Market Exchange Rate was COP$2,911.663,174.79 per US$1.00.
| 3 |
Certain figures shown in this annual report have been subject to rounding adjustments, and, accordingly, certain totals may therefore not precisely equal the sum of the numbers presented. In this annual report a billion is equal to one with nine zeros.
| 2. | Strategy and Market Overview |
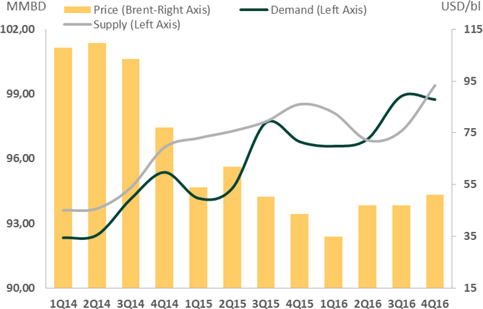
Due to market imbalances, there wasAfter experiencing a sharp contraction in crude oil price, particularly ingradual recovery during the first quarterhalf of 2016. As demand proved to sustain itself while producers implemented previously announced capital expenditure reduction decisions that encompassed the adjustments necessary under the new price environment, the market began its path towards tighter balances (see Graph 1 – Supply/Demand vs ICE Brent price evolution). Although oil prices have recovered from the lowest prices during the oil crisis, high levels of uncertainty persist indicating2018 and reaching a less than smooth recovery. Nonetheless, the changepeak in OPEC’s stance, announced at the end of September 2016 and later ratified in early December 2016, towards coordinated production cuts provided a lift that allowedOctober, the ICE Brent price suffered a downward trend in the latter part of 2018. The expectation of weaker economic growth for 2019 and a mismatch of supply and demand of crude played a fundamental role in this trend. The US government imposed sanctions on Iran in August of 2018, announcing the goal of reducing Iranian crude and condensate exports to endalmost zero. This created an expectation of a tight oil market during the year above US$55 per barrel.latter part of 2018. However, several factors did not support a strong market outlook: refining margins weakened, inventories began to pile up and production from the US, Saudi Arabia and Russia ramped up, all at the same time. Additionally, the US government provided waivers to Iranian crude importers. As a reaction to low crude prices, the OPEC+ countries agreed to cut production in order to rebalance the crude market. On the demand side, weaker economic growth in China and Europe did not favor crude oil consumption.
According to estimates of the Energy Information Administration (“EIA”), in 2018 global consumption of petroleum and other liquids fuels grew by 1.4 mmboepd while Non-OPEC petroleum and other liquid fuels supply grew by 2.5 mmboepd. On the other hand, OPEC reduced its production by 0.09 mmboepd, mainly due to unplanned crude oil disruptions which in December amounted to 2.2 mmboepd in Libya and Nigeria, Iranian sanctions and decreasing production in Venezuela.
Graph 1 – Supply/Demand Balance vs ICE Brent Price Evolution
Source: PIRAEIA: Short term Energy Group, World Oil Market Forecast (February 28, 2017)Outlook (January 15, 2019)
Although international oil prices and global demand and supply dynamics are significant factors affecting our business and financial condition, Colombia’s local economic factors have also influenced, and could continue to influence, our performance given that we conduct most of our business in Colombia.
| 4 |
The performance of Colombia’s gross domestic product (GDP) is one of the main drivers of fuel consumption in Colombia. According to the National Administrative Department of Statistics (DANE for its acronym in Spanish), during 20162018 Colombia’s GDP grew 2%2.7% in real terms, as compared to 2015.2017. The industriessectors with the greatest growth rates were financial institutions, insurance, real estateretail, manufacturing and business services, construction and manufacturing.state defense spending which had the largest contribution to national GDP. On the other hand, agricultural and cattle activities had the industry with the largest drop in growth was mining.worst performance. Local sales of liquid fuels (diesel, gasoline, jet fuel and LPG) increased by 2% mainly1.3%, boosted by increased demand for diesel and jet fuel.
Natural gas demand in Colombia grew by 5.1% in 2018 due to the increase in sales of gasoline. Gasoline domestic sales were more competitive than its substitutes due to its price decrease and fewer than expected conversions tohigher demand from natural gas fired power plants and from non-thermal demand, mainly for vehicles (NGV)household consumption.
Ecopetrol’s 2019 – 2021 (the “Business Plan”) maintains the strategic priorities set forth in the previous 2020 plan: we continue to prioritize profitable reserves and production growth, underpinned by strict capital discipline and continued focus on cost efficiency and cash flow generation. The plan seeks to maximize value generation for our shareholders with continued focus on our incumbent position in Colombia, ensuring sustainability, competitiveness and profitability.
Among other matters, the Business Plan calls for achieving the following targets by the end of 2021: (i) organic production levels between 750-770 mboed, (ii) optimum throughput of the integrated refining system at a level between 370-400 mbpd, (iii) increasing transported volumes in line with the country’s production, (iv) investing approximately US$12-15 billion during the period and (v) maintaining a robust cash position and optimal leverage levels. The Business Plan is based on a reference price of US$65/bl.
Growth in reserves and production will be supported by four levers: (i) continuing the growth of our recovery factors and underlying hydrocarbons in place in existing fields, (ii) the diversification of our exploration portfolio in Colombia, (iii) the internationalization of our operations through both organic and inorganic means, and (iv) the appraisal and development of identified unconventional hydrocarbon potential in Colombia.
We estimate that by 2021 hydrocarbons originally in place (HCIIP) associated to our assets in Colombia will be approximately 60 billion barrels compared to 55 billion barrels as of the end of 2018. This increase is expected to be supported by seismic reprocessing, reassessments of reservoirs and drilling of advanced wells, among others. Additionally, the enhanced program is expected to continue to leverage our reserve and production growth.
Growth in the exploratory portfolio in Colombia will prioritize the incorporation of short cycle resources through the strengthening of the near field exploration activity in Colombia, mainly in the Llanos and Middle Magdalena basins. Furthermore, we seek to expand our presence in high potential under-explored basins, such as Putumayo and Piedemonte, and developing the potential of our operations in the offshore Caribbean.
The internationalization lever seeks to develop and maximize the potential of the position we have built in Brazil, the U.S. Gulf Mexico and Mexico. In 2016, there were no major changesaddition, we expect to continue assessing business opportunities associated with unconventional hydrocarbon basins in naturalthe United States and other mergers and acquisition opportunities in those geographies.
We have identified unconventional hydrocarbons potential in two basins in Colombia of approximately 10 tera cubic feet of gas regulation. With respectand between 4 and 7 billion barrels of crude. In our investment plan described below, we are allocating US$500 million for the development of pilot programs between 2019 and 2021, subject to natural gas supply, in November 2016, a new regasification plant located in Cartagena became available, meaning that Colombia is now connectedgovernment approval. If successful, we would then move to the international LNG marketcommercial development of these pilots after 2021.
Our sustainability and LNG pricesgrowth are also leveraged in the concept of integration of our different segments.
We expect our midstream segment (or “transportation and logistics segment”) to continue being an important cash generator. In order to do so, the Business Plan calls for, among others, the segment to focus on improving efficiencies and synergies in our transportation system and pursuing investment opportunities in product pipelines given the increase in demand for fuels in Colombia. The Business Plan is currently projecting that our transport systems will be a reference for national gas prices.move between 1.10-1.25 million barrels of oil and products per day during the period.
In our downstream segment (or “refining, petrochemicals, and biofuels segment”), the Business Plan focuses on the use and optimization of current infrastructure in order to achieve an expected refining throughput between 370-400 mbpd and an expected refining margin between US$12-15/bl, subject to market conditions. We expect to achieve this (i) through the incorporation of synergies between the Barrancabermeja and Cartagena refineries and (ii) by capturing market opportunities associated with the implementation of the International Convention for the Prevention of Pollution from Ships (Marpol), which favors the use of fuels with lower sulfur content in maritime transport. Additionally, as we did in 2018, we expect to continue delivering low sulfur diesel of 20 parts per million (ppm) and gasoline of 100 ppm versus the Colombian regulation of 50 ppm and 300 ppm, respectively.
The low oil price environment present atFollowing the end of 2015 and the beginning of 2016 led to a revisionimplementation of our business plan 2015-2020, originally launchedtransformation program in May 2015, with a price scenario ofwe have accumulated approximately US$80 per barrel.3.3 billion in efficiencies to date. Our new 2017-2020 business planBusiness Plan is focused on value generation, profitabilitycontinuing this trend. We expect to capture savings of approximately US$1.45-2.0 billion between 2019 and financial sustainability under a price scenario of US$50 per barrel,2021, particularly: (i) capital expenditure efficiencies, (ii) revenue and allows for considerable upsides in case of potential price increases. For example, if prices were to increase to an average price of US$70 per barrel, production by 2020 could reach 830 thousand barrels equivalent per day, or 16% over the current production.margin optimization and (iii) operating expenditure efficiencies.
The three pillarsIn terms of sustainability, the Business Plan calls for integral water management, the protection of biodiversity and a continued focus on climate change, among others, all within the framework of the plan are: (i) cash flow focusUnited Nations Sustainable Development Goals 2030. We expect to invest approximately COP$2 trillion in socio-environmental projects between 2019 and cost efficiency, (ii) strict capital discipline2021. We are also seeking to reduce our energy costs by US $100 million by 2021 and (iii) profitable reserves and production growth.increase our investments in renewable energy sources through the incorporation of 60 MW of renewable photovoltaic energy to our energy matrix, which already has 43 MW of biomass generation.
Cash flow focus and cost efficiency: In 2015, we launchedWe currently expect the 2015-2020 Transformation Program (the “Transformation Program”) with a goal of increasing our efficiency and decreasing cost. The Transformation Program has allowed usBusiness Plan to decrease structural costs by US$1.5 billion compared to 2014. Such reduction has been accomplished due to the implementation of initiatives through our different business segments and corporate areas. The new business plan entails a second phase of the Transformation Program, with activities aimed to achieve excellence in project planning and execution as well as in our production, transportation, refining and marketing operations.
Capital discipline: We have preserved a rigorous level of capital discipline through the adjustment of investments and the adoption of strict controls to ensure that projects are delivered efficiently and within the expected time frame and budget. The plan calls forrequire investments of between US$12-15 billion during the 2019-2021 period, of which approximately US$13 billion between 2017 and 2020. By 2020, approximately 90% of this investment will82% would be allocated to the development of explorationupstream segment, 8% to the midstream segment, 7% to the downstream segment and production projects, while3% to other. These investments in transportation and refining will seek to improve operational integrity and reliability.exclude inorganic growth opportunities, which if materialized, could be financed through cash from operations.
As partThe Business Plan seeks to maintain leverage metrics to help us preserve our investment grade rating while allowing flexibility for specific optimizations of our capital discipline, Ecopetrol is currently engaged instructure during the divestment of non-strategic assets and the sale of minor fields, and has also defined a dividend policy as described inSection 6.2 Dividend Policy.period.
Profitable growth in production and exploration: One of the pillars of the revised business plan is the view that a strong production portfolio and a greater exploratory success will bring about profitable growth. Under a price scenario of US$50 per barrel, production should average 760 thousand barrels of oil equivalent per day by 2020, an approximately 6% growth from 2016. Approximately 94% of this production will come from the current producing assets.2.1.22019 Investment Plan
In exploration,November 2018, the plan estimates the incorporation of approximately 1,000 million barrels of contingent resources. In respect of adding reserves, we highlight the results of the exploratory campaigns in the Colombian Caribbean offshore and the Gulf of Mexico in the United States. During the period 2017 – 2020, Ecopetrol expects to add 600 million barrels of proven reserves from current fields and exploration.
Consistent with the business plan update, in November 2016, the board of directors of Ecopetrol (“Board of Directors”)Directors approved abetween US$3.5 and US$4.0 billion for the 2019 investment plan for 2017.plan. The Ecopetrol Group will continueplans to produce an average of about 715between 720 and 730 thousand barrels of oil equivalent per day during 2017. This production level lays the foundation for Ecopetrol’s expected increase in production by 2020.
Most of the investment will be in exploration and production. In refining, petrochemicals and biofuels, and transportation and logistics, investments will be made to comply with integrity and operational requirements as well as project completion.2019. The table below sets forth the details of the investment plan per business segment.
Table 3 – 20172019 Investment Plan
| Business Segment | Millions of US$(1) | % Percentage | ||||||
| Exploration | 650 | 18.6 | % | |||||
| Production | 2,200 | 62.9 | % | |||||
| Transportation and Logistics | 265 | 7.6 | % | |||||
| Refining, Petrochemicals, and Biofuels | 360 | 10.3 | % | |||||
| Others | 25 | 0.6 | % | |||||
| TOTAL | 3,500 | 100 | % | |||||
| Business Segment | Millions of US$(1) | %Percentage(2) | ||||||
| Exploration | 430-490 | 12 | % | |||||
| Production | 2,385-2,725 | 68 | % | |||||
| Midstream | 240-275 | 7 | % | |||||
| Downstream | 365-420 | 11 | % | |||||
| Others | 80-90 | 2 | % | |||||
| TOTAL | 3,500-4,000 | 100 | % | |||||
| (1) | Rounded figures. |
| Percentage over the upper range |
Exploration
In the exploration segment, US$650430-US$490 million will behas been allocated mainly to the evaluation and appraisal of discoveries and ongoing exploration effortsactivity of Ecopetrol S.A. (approximately US$460 million)44%), Hocol S.A. (“Hocol”) (approximately US$114 million)12%), Ecopetrol America Inc. (approximately US$11 million)1%), ECP Hidrocarburos Mexico (approximately 7%), Ecopetrol Costa Afuera (approximately US$44 million)3%) and Ecopetrol Brazil (approximately US$21 million)33%).
| 6 |
Production
In the production segment, US$1,9772,385-US$2,725 million will behas been allocated mainly to the execution of development and incremental production projects in theof Ecopetrol S.A. (approximately 91%) primarily at Castilla, Rubiales, Yarigui-Cantagallo,Chichimene, Apiay-Suria, Yariguí-Cantagallo, La Cira - Infantas, Tibú,Cira-Infantas, Casabe, Piedemonte Chichimene, Quifa, Provincia and Cusiana-Cupiagua fields (approximately US$1,147 million).Quifa. We have also allocated funds for our affiliates and subsidiaries as follows: US$64 millionapproximately 3% for the development, operation and maintenance of fields of Ecopetrol America Inc. in the U.S. Gulf of Mexico, US$88 millionapproximately 5% to Hocol, US$63 millionapproximately 1% to Equion and US$8 million to Savia.
Transportation and logisticsMidstream
In the transportation and logisticsmidstream segment, US$138240-US$275 million will behas been allocated to investments focused on the completion of projects such as San Fernando-Monterreysystem and transportation of heavy crude oils as well as crude oil dilution projects.operational integrity. The segment is seeking a higher efficiency in operations and maintenance practices.
Refining, petrochemicals, and biofuelsDownstream
In the refining, petrochemicals, and biofuelsdownstream segment, US$105365-US$420 million will behas been principally allocated to Reficar, US$150 million to programs to improve operations at the Barrancabermeja Refineryrefinery and Reficar through initiatives aimed to increaseat increasing revenues, improveenhancing integrity management, improving efficiency and reducereducing operational costs and US$82 million to Bioenergy.costs. The segment is seeking a higher efficiency in operations and maintenance practices. It is importantpractices in order to highlight thatmaximize the Barrancabermeja Refinery modernization plan will continue to be delayed untilvalue of the oil price environment allows investments to be made in such a major project. The mode of execution will be defined in this context, after analyzing alternatives which include a modular option in time and investment.existing assets.
| 3. | Business Overview |
We were formed in 1951 by the Colombian government asEmpresa Colombiana de Petróleos and began operating the crude oil fields at La Cira-Infantas, the oldest Colombian oil field, whosewhere production started in 1918, and the pipeline that connected that field with the Barrancabermeja Refineryrefinery and the port of Cartagena. In 1961, we assumed the direct operation of the Barrancabermeja Refineryrefinery and continued its transformation into an industrial complex. In 1974, we acquired the Cartagena Refinery (as defined below), which had been in operation since 1957. Pursuant to Decree 0062 of 1970, we were transformed into a governmental, industrial and commercial company.
In 2003 pursuant to Decree Law 1760, theAgencia Nacional de Hidrocarburos - National Hydrocarbons Agency (the “ANH”) was created and Ecopetrol´sEcopetrol’s public role as administrator and regulator of the national hydrocarbons resources was transferred to the ANH. Ecopetrol modified its organic structure and became Ecopetrol S.A., a public stock-holding corporation, one hundred percent state-owned, and continued the development of exploration and production activities in a competitive basis with autonomy over our business decisions. Since 2006, according to Law 1118, we have been evolving from a wholly state-owned entity to a mixed-economy company with private capital. This process has resulted in a substantial change in the legal framework to which we are subject and in the nature of our relationship with the Nation. Nation, as our controlling shareholder. As of March 23, 2018, pursuant to our amended bylaws, the duration of the Company is 100 years.
We carried out our initial public offering in November 2007, when our common shares becamewere listed on the Colombian Stock Exchange. Our American Depository Shares (“ADSs”) were listed on the New York Stock Exchange in 2008. Starting in August 2010, our ADSs began trading on the Toronto Stock Exchange (“TSX”) under the symbol “ECP.” On February 17, 2016, we announced our application for voluntary delisting from the TSX. On March 2,25, 2016, our ADR´sADR’s were officially delisted from the TSX. On December 7, 2017, we applied to the Alberta Securities Commission and the Ontario Securities Commission to cease our reporting requirements, due to our delisting process. On September 4, 2018, we announced that effective August 29, 2018, we had ceased to be a reporting issuer in each of the provinces of Alberta and Ontario and hence were no longer a reporting issuer in any jurisdiction in Canada. Accordingly, Ecopetrol no longer has any continuous disclosure obligations in Canada.
We operate in the following business segments: i) Exploration and Production; ii) Transportation and Logistics; and iii) Refining, Petrochemicals, and Biofuels.
Our subsidiaries, Refinería de Cartagena (Reficar)S.A. (“Reficar” or “Cartagena Refinery”), Cenit Transporte y Logistica de Hidrocarburos S.A.S. (Cenit) and OcensaOleoducto Central S.A. (Ocensa) are significant subsidiaries, as such term is defined under SEC Regulation S-X.
We have a number of directly and indirectly held subsidiaries both in Colombia and abroad. Our subsidiaries are either directly owned by us or indirectly owned by us through one or more of our other subsidiaries. As of MarchDecember 31, 2017,2018, we have eightseven directly owned and 2029 indirectly owned subsidiaries.
During 2016,2018, the following changes were made to the Ecopetrol Group’s structure:
| In |
Exhibit 8.1 to this annual report identifies our principal operating subsidiaries, their respective countries of incorporation, and our percentage ownership in each (both directly and indirectly through other subsidiaries), in each case as of March 31, 2017.
Graph 2 – Ecopetrol Corporate Structure


The stock ownership percentage listed refers to Ecopetrol S.A.’s direct and indirect participation. The data in this structure shows neither the whole ownership nor its decimal figures, so they will be used only for information purposes.
The so-called shareholding (Ecopetrol S.A.’s direct participation), affiliated, subsidiary companies are listed, as well as the stock interest of Ecopetrol S.A.’s subordinate companies.
We areIn 2017, Ecopetrol completed the divestment of its stake in Empresa de Energía de Bogotá S.A. E.S.P. EEB for a total of COP$1,124 billion. The operation was carried out in accordance with the processprocedures defined by the Law 226 of selling some1995, the Decree 2305 of our non-core shareholdings:November 13, 2014, and the Decree 2110 of December 22, 2016.
| 8 |
We currently own 100% of the total outstanding shares of Esenttia. In connection with the review of its long-term strategy, the Board of Directors decided to suspend the 2016 plan to sell Ecopetrol’s shares in Esenttia.
Exhibit 8.1 to this annual report identifies our principal operating subsidiaries, their respective countries of incorporation, and our percentage ownership in each (both directly and indirectly through other subsidiaries).
We are a vertically integrated oil company with a presence primarily in Colombia and with activities in Peru, Brazil, Mexico and the U.S. Gulf Coast. The Nation currently controls 88.49% of our voting capital stock. We are among the top 36 oil and gasworld’s biggest state-owned companies, in the worldranking 300 based on the Petroleum Intelligence Weekly Top 50Forbes Global 2000 Ranking - 2016.2018. We play a key role in the local Colombian hydrocarbon market.
Our exploration and production business segment includes exploration, development and production activities in Colombia and abroad. We began local exploration in 1955 and international exploration in 2006. We conduct explorationExploration and production activities are conducted directly inby Ecopetrol S.A., and through some of our subsidiaries, andas well as through joint ventures with third parties. As of December 31, 2016,2018, we were the largest operator and the largest producer of crude oil and natural gas in Colombia, maintaining the largest acreage exploration position in Colombia.
Ecopetrol is planning to incorporate about 1 billion barrels of contingent resources by 2020, through exploration activities in the following areas: (i) offshore Colombia, (ii) near field exploration in Colombia, (iii) consolidation of exploration areas outside of Colombia, such as the Gulf of Mexico, Brazil and other areas in America.
During 2016 our exploration activities focused in three work fronts: onshore Colombia, Colombia and the US Gulf of Mexico offshore and near field exploration in Colombia.
On January15, 2016 Hocol Petroleum Limited - HPL, subsidiary of Ecopetrol S.A. and owned 100% by Ecopetrol, constituted and registered before the Chamber of Commerce in Colombia the company Ecopetrol Offshore (“Ecopetrol Costa Afuera”or “ECAS”). ECAS and Hocol S.A. are subsidiaries of HPL.
ECAS´ purpose is to develop oil and gas activities in offshore Colombia by taking advantage of offshore free trade zones regime. These activities include exploration, exploitation, production, transport, distribution, export, sales and commercialization of oil and gas and any other hydrocarbon products or derivatives.
During 2016 bidding rounds were not launched by the National Hydrocarbons Agency to offer licenses for exploratory activities in Colombia.
Ecopetrol signed farmout agreements with the following companies: Parex Resouces Colombia Ltd (acquired 50% of the working interest in Convenio Playón and 50% of the working interest in Convenio de Mares), Talisman Colombia Oil & Gas Ltd (acquired 49% of the working interest in Convenio Upar) and Hupecol Operating Co LLC (acquired 100% of the working interest in CPO-11 E&P Contract).
Additionally, Ecopetrol carried out its Onshore Round 1-2016 offering working interest in the onshore blocks LLA-38, LLA-39, LLA-52, PUT 13 and VMM-32 located in Colombia.
For purposes of this exploration section, “we” refers to Ecopetrol S.A., its subsidiaries and partnerships in which Ecopetrol has an interest. Unless otherwise stated, all figures are given before deductions fordeducting royalties.
Currently we haveUnder the framework of the Business Plan, Ecopetrol is aiming to incorporate contingent resources in high reward projects concentrated in: (i) near field exploratory activity, (ii) underexplored basins, such as Putumayo and Piedemonte, (iii) offshore Colombia, and (iv) international areas such as Brazil, the U.S. Gulf of Mexico and Mexico.
Graph 3- Sedimentary Basins where Ecopetrol executes exploration activities in most of the sedimentary basins in Colombia, in which active oil and gas operations are found.

| 9 |
The following map showsDuring 2018, the basins where Ecopetrol has been conducting its main exploration activities.strategy was directed at leveraging our goal on three working fronts: onshore Colombia, offshore Caribbean, and strengthening and diversifying our exploration overseas.
Graph 3 – Sedimentary Basins3.4.1.1Exploration Activities in Colombia

Source: ANH
We conduct exploration activities in Colombia on our own and through joint ventures with regional and global oil and gas companies.
Seismic
During 2016, two 2D seismic programs were acquired in Colombia: Cardon (106.5 Km) and Nogal (44 Km).These seismic programs are intended to increase the knowledge of the Caguan-Putumayo basin.
Additionally, our subsidiary Hocol S.A. successfully completed the acquisition of 294.9 km2 of 3D seismic in the exploratory blocks GUA2 (213.5 km2) and YDSN1 (81.4 km2) in Middle Magdalena Basin and Llanos Basin, respectively.
Exploratory Wells
During 2016, onshore drilling operations were started in five wells by2018, Ecopetrol and its subsidiary Hocol S.A. in the Lower Magdalena Basin and Llanos Basin. Additionally Hocol finalizedsubsidiaries conducted drilling operations in twelve exploration wells (A3/A2) and in five appraisal wells (A1) in Colombia. Of these seventeen wells, six were successful, seven were plugged and abandoned, and four were under evaluation as of December 31, 2018. This activity was concentrated mainly in the Payero well (Piedemontefollowing basins: Eastern Plains (Llanos Orientales), Lower Magdalena Valley, Middle Magdalena Valley and foothills.
In terms of onshore Colombia, our exploration efforts were focused on searching for hydrocarbons in mature basins, near-field exploration and areas close to existing production infrastructure.
In offshore activities, we increased our participation from 50% to 100% in theFuerte Sur and Purple Angel blocks (Sinu offshore basin), which started in December 2015 and was operatedwere relinquished by Equion.Anadarko Petroleum Corporation. In termsthe case of the block Col-5 (Sinu offshore Colombia, drilling operations started atbasin), the Purple-Angel 1 well (followingANH approved the discovery announced at the Kronos-1 well in July 2015) and at the Gorgon-1 prospect. Our joint venture partner Anadarko operates both wells. On March 8, 2017, we announced the discoveryconversion of a gas presence at Purple-Angel 1.Technical Evaluation Agreement (as defined below) to an Exploration and Production Contract (as defined below), where we have a 100% participation.
The following table sets forth, for the periods indicated, the number of gross and net productive and dry exploratory wells drilled by us and our joint venture partners, and the exploratory wells drilled by third parties pursuant to sole risk contracts with us.
Table 4 – Exploratory Drilling in Colombia
| For the year ended December 31, | For the year ended December 31, | |||||||||||||||||||||||
| 2016 | 2015 | 2014 | 2018 | 2017 | 2016 | |||||||||||||||||||
| (number of wells) | (number of wells) | |||||||||||||||||||||||
| COLOMBIA | ||||||||||||||||||||||||
| Ecopetrol S.A. | ||||||||||||||||||||||||
| Gross Exploratory Wells | ||||||||||||||||||||||||
| Owned and operated by Ecopetrol | ||||||||||||||||||||||||
| Productive(1) | – | – | 3.0 | |||||||||||||||||||||
| Productive | – | – | – | |||||||||||||||||||||
| Dry | 1.0 | 1.0 | 9.0 | – | 1.0 | 1.0 | ||||||||||||||||||
| Total | 1.0 | 1.0 | 12.0 | – | 1.0 | 1.0 | ||||||||||||||||||
| Operated by Partner in Joint Venture | ||||||||||||||||||||||||
| Productive | – | 1.0 | 1.0 | 5.0 | 3.0 | – | ||||||||||||||||||
| Dry | – | 1.0 | 2.0 | 1.0 | 2.0 | – | ||||||||||||||||||
| Total | – | 2.0 | 3.0 | 6.0 | 5.0 | – | ||||||||||||||||||
| Operated by Ecopetrol in Joint Venture | ||||||||||||||||||||||||
| Productive | – | – | 1.0 | – | – | – | ||||||||||||||||||
| Dry | – | – | – | – | 1.0 | – | ||||||||||||||||||
| Total | – | – | 1.0 | – | 1.0 | – | ||||||||||||||||||
| Net Exploratory Wells | ||||||||||||||||||||||||
| Productive | – | 0.5 | 4.1 | 1.9 | 1.5 | – | ||||||||||||||||||
| Dry | 1.0 | 1.5 | 10.7 | 0.3 | 2.3 | 1.0 | ||||||||||||||||||
| Total | 1.0 | 2.0 | 14.8 | 2.2 | 3.8 | 1.0 | ||||||||||||||||||
| Sole Risk | ||||||||||||||||||||||||
| Productive | – | – | – | – | – | – | ||||||||||||||||||
| Dry | – | – | – | 2.0 | – | – | ||||||||||||||||||
| Total | – | – | – | 2.0 | – | – | ||||||||||||||||||
| Equion | ||||||||||||||||||||||||
| ECAS | ||||||||||||||||||||||||
| Gross Exploratory Wells | ||||||||||||||||||||||||
| Productive | – | – | – | |||||||||||||||||||||
| Dry | – | – | – | |||||||||||||||||||||
| Total | – | – | – | |||||||||||||||||||||
| Hocol | ||||||||||||||||||||||||
| Gross Exploratory Wells | ||||||||||||||||||||||||
| Productive | 1.0 | 1.0 | – | |||||||||||||||||||||
| Dry | – | – | 4.0 | |||||||||||||||||||||
| Total | 1.0 | 1.0 | 4.0 | |||||||||||||||||||||
| Net Exploratory Wells | ||||||||||||||||||||||||
| Productive | 0.5 | 0.5 | – | |||||||||||||||||||||
| Dry | – | – | 3.0 | |||||||||||||||||||||
| Total | 0.5 | 0.5 | 3.0 | |||||||||||||||||||||
| 10 |
| For the year ended December 31, | ||||||||||||
| 2018 | 2017 | 2016 | ||||||||||
| (number of wells) | ||||||||||||
| Productive | – | – | – | |||||||||
| Dry | – | 1.0 | – | |||||||||
| Total | – | 1.0 | – | |||||||||
| Net Exploratory Wells(2) | ||||||||||||
| Productive | – | – | – | |||||||||
| Dry | – | 0.5 | – | |||||||||
| Total | – | 0.5 | – | |||||||||
| Equion | ||||||||||||
| Gross Exploratory Wells | ||||||||||||
| Productive | – | – | – | |||||||||
| Dry | – | – | – | |||||||||
| Total | – | – | – | |||||||||
| Hocol | ||||||||||||
| Gross Exploratory Wells | ||||||||||||
| Productive | 1.0 | – | 1.0 | |||||||||
| Dry | 4.0 | 1.0 | – | |||||||||
| Total | 5.0 | 1.0 | 1.0 | |||||||||
| Net Exploratory Wells(2) | ||||||||||||
| Productive | 1.0 | – | 0.5 | |||||||||
| Dry | 3.2 | 1.0 | – | |||||||||
| Total | 4.2 | 1.0 | 0.5 | |||||||||
| A dry well or hole is an exploratory well found to be incapable of producing either crude oil or natural gas in sufficient quantities to justify completion as a crude oil or natural gas well. |
| (2) | Net exploratory wells |
Ecopetrol drilled six successful wells in Colombia in 2018: (i) Jaspe 6D, where Ecopetrol holds a 30% working interest, and Frontera as the operator holds the remaining 70% at the Quifa block, (ii) Andina-1, where Ecopetrol holds a 50% working interest, and Parex Resources as the operator holds the remaining 50% at the Capachos block, (iii) Rex NE-02 ST-1, where Ecopetrol holds a 30% working interest, and Occidental Petroleum Corporation as the operator holds the remaining 70% at the Cosecha block, (iv) Andina-2, where Ecopetrol holds a 50% working interest, and Parex Resources as the operator holds the remaining 50% at the Capachos block, (v) Cosecha C-01, where Ecopetrol holds a 30% working interest, and Occidental Petroleum Corporation as the operator holds the remaining 70% at the Cosecha block and (vi) Arrecife-1, where our subsidiary Hocol owns a 100% working interest in the VIM-8 block.
Seven wells located in the Eastern plains (Llanos Orientales) and foothills were plugged and abandoned as follows: (i) Payero E-1 ST-1, where Ecopetrol holds a 20% working interest through our subsidiary Hocol, Repsol a 30% working interest and Total a 50% working interest, with Equion as operator in the Niscota block, (ii) Ocelote 500, operated by our subsidiary Hocol who holds a 100% working interest in the Guarrojo block, (iii) Ocelote 510, operated by our subsidiary Hocol who holds a 100% working interest in the Guarrojo block, (iv) Ocelote 520, operated by our subsidiary Hocol who holds a 100% working interest in the Guarrojo block, (v) Jaspe-7D, where Ecopetrol holds a 30% working interest and Frontera Energy Group as the operator holds a 70% working interest in the Quifa block, (vi) the Chipiron Far North-01 sole risk contract from Occidental Petroleum Corporation in the Chipiron block, (vii) the Pulpo-1 sole risk contract from Occidental Petroleum Corporation in the Rondon block.
In addition, four appraisal wells were drilled as of December 31, 2018, and are currently under evaluation: (i) Cira-7000 located at La Cira Infantas block, operated by Occidental Petroleum Corporation, which holds a 52% working interest in partnership with Ecopetrol, holding the remaining 48% working interest, (ii) Capachos Sur-2 located at the Capachos Block, operated by Parex Resources, which holds a 50% working interest in partnership with Ecopetrol, holding the remaining 50%, (iii) Coyote-2 located at the Mares Block, operated by Parex Resources, which holds a 50% working interest in partnership with Ecopetrol, holding the remaining 50% and (iv) Bufalo-1 located at VMM-32 block, operated by us, where we hold a 51% working interest in partnership with CPVEN, which holds the remaining 49%.
| 11 |
Ecopetrol drilled two wells in 2016: (i) Chimú-1 St-1 well, where Ecopetrol holds a 100% working interest at Caño Sur Block, which was a dry well, and (ii) Boranda well, in which Ecopetrol holds a 50% working interest and Parex holds the remaining 50% working interest, as block operator. As of March 30, 2017 we announced that the presence of crude was discovered at this well.Seismic
OurIn Colombia our subsidiary Hocol S.A. drilled three wellsacquired a total of 337 km of 2D in 2016: (i) Payero E1 well, located at Niscota Blockthe SN 15 block and operated by Equión. Total holds a 50% working interest, Repsol holds a 30% working interest and Hocol S.A. holds a 20% working interest, this well was declared temporarily suspended; (ii) Bullerengue Sur-1 well, located at SSJN1 Block. Hocol S.A. holds a 50% working interest and Lewis Energy holdsthrough our joint venture partner, Ismocol-Joshi-Parko, 60 km2 of 3D were acquired over the remaining 50%, this one is a productive well, and (iii) Pegaso well, located at CPO 16 Block where Hocol S.A. holds a 100% working interest, this well was under evaluation as of December 31, 2016.Palagua-Caipal field.
Furthermore, Ecopetrol purchased three additional 3D seismic surveys for a total of 292.5 km2 in the Putumayo basin to improve the subsurface coverage and imaging of the basin.
3.4.1.2Exploration Activities Outside Colombia
Our international exploration strategy is focused onaims to expand and renew our exploration portfolio in basins with remaining long term potential, diversify our risks and improve the possibilities of increasing our crude oil and natural gas reserves. Key aspects of this strategy might include participating in bidding rounds to secure blocks available for exploration and entering into joint ventures with international and regional oil companies. We believe exploring outside Colombia allows us to diversify our riskscompanies that bring operational experience and improvetechnology into the possibilities of increasing our crude oil and natural gas reserves.consortium.
In partnership with BP and CNOOC, Ecopetrol was awarded the block Pau-Brazil in the Santos Basin in Brazil during the Pre-Salt 5th bidding round, organized by the National Agency of Petroleum, Natural Gas and Biofuels (ANP). Moreover, Ecopetrol is awaiting approval from the ANP to access a 10% working interest in offshore block Saturno, also located in the Santos basin, which is operated by Shell (who holds a 45% working interest) in partnership with Chevron (who holds the remaining 45% working interest). With respectthe participation in these two deep water blocks, Ecopetrol has managed to obtain a position in the pre-salt play in Brazil. In order to advance our seismic data outsideprevious commitments in Brazil, we will continue with regional studies in the Ceará, Potiguar and Sergipe Blocks.
As part of Colombia, during 2016,the committed exploration plan in our current assets of the Equatorial Margin (CE-M-715 in the Ceará Basin, POT-M-567 in Potiguar and FZA-M-320 in Foz do Amazonas), both geology and geophysics work and technical maturation activities were carried out to help obtain a deeper understanding of the prospective potential in these provinces.
Additionally our subsidiary, Ecopetrol Brasil bought 854 Km2America Inc., was awarded the Green Canyon 404, 405, 448 and 492 blocks in the Gulf of seismic data on the Potiguar basin, POT-M-567, in which Ecopetrol Brasil holds a 100% working interest.Mexico during Lease Sale 251.
WithWe secured the approval of the National Hydrocarbons Commission (CNH) for the exploration plan through our partnership with PEMEX in respect of block 8 (October) and Petronas-block 6 (November). The exploration plan for block 6 considers purchasing seismic, geological and geophysical analysis, seismic interpretation and drilling of the first exploration well in Mexico in 2020 and the exploration plan for block 8 considers seismic licensing, processing and the interpretation required to ouridentify the potential prospects in the block.
During the course of 2018, Ecopetrol and its partners did not carry out any exploratory drilling outside of Colombia, during 2016, we have undertaken deep water exploratory drilling in the U.S. Gulf Coast in association with our business partners. The following table sets forth information on our exploratory drilling in the years 2016, 2015 and 2014.Colombia.
| 12 |
The following table sets forth information on our exploratory drilling for the periods indicated.
Table 5 – Exploratory Drilling Outside Colombia
| For the year ended December 31, | For the year ended December 31, | |||||||||||||||||||||||
| 2016 | 2015 | 2014 | 2018 | 2017 | 2016 | |||||||||||||||||||
| (number of wells) | (number of wells) | |||||||||||||||||||||||
| INTERNATIONAL | ||||||||||||||||||||||||
| Ecopetrol America Inc. | ||||||||||||||||||||||||
| Gross Exploratory Wells | ||||||||||||||||||||||||
| Productive | 1.0 | – | 2.0 | – | – | 1.0 | ||||||||||||||||||
| Dry | – | 1.0 | 3.0 | – | 2.0 | – | ||||||||||||||||||
| Total | 1.0 | 1.0 | 5.0 | – | 2.0 | 1.0 | ||||||||||||||||||
| Net Exploratory Wells | ||||||||||||||||||||||||
| Productive | 0.2 | – | 0.7 | – | – | 0.2 | ||||||||||||||||||
| Dry | – | 0.5 | 0.5 | – | 0.6 | – | ||||||||||||||||||
| Total | 0.2 | 0.5 | 1.2 | – | 0.6 | 0.2 | ||||||||||||||||||
| Ecopetrol Óleo e Gás do Brasil Ltda. | ||||||||||||||||||||||||
| Gross Exploratory Wells | – | – | – | |||||||||||||||||||||
| Productive | – | – | – | – | – | – | ||||||||||||||||||
| Dry | – | – | – | – | – | – | ||||||||||||||||||
| Total | – | – | – | – | – | – | ||||||||||||||||||
| Net Exploratory Wells | ||||||||||||||||||||||||
| Productive | – | – | – | – | – | – | ||||||||||||||||||
| Dry | – | – | – | – | – | – | ||||||||||||||||||
| Total | – | – | – | – | – | – | ||||||||||||||||||
| Ecopetrol Germany | ||||||||||||||||||||||||
| Gross Exploratory Wells | – | – | – | |||||||||||||||||||||
| Productive | – | – | – | – | – | – | ||||||||||||||||||
| Dry | – | – | 2.0 | – | – | – | ||||||||||||||||||
| Total | – | – | 2.0 | – | – | – | ||||||||||||||||||
| Net Exploratory Wells | ||||||||||||||||||||||||
| Productive | – | – | – | – | – | – | ||||||||||||||||||
| Dry | – | – | 0.2 | – | – | – | ||||||||||||||||||
| Total | – | – | 0.2 | – | – | – | ||||||||||||||||||
| Savia Perú | ||||||||||||||||||||||||
| Gross Exploratory Wells | – | – | – | |||||||||||||||||||||
| Productive | – | – | – | – | – | – | ||||||||||||||||||
| Dry | – | – | – | – | – | – | ||||||||||||||||||
| Total | – | – | – | – | – | – | ||||||||||||||||||
| Net Exploratory Wells | ||||||||||||||||||||||||
| Productive | – | – | – | – | – | – | ||||||||||||||||||
| Dry | – | – | – | – | – | – | ||||||||||||||||||
| Total | – | – | – | – | – | – | ||||||||||||||||||
| A dry well or hole is an exploratory well found to be incapable of producing either crude oil or natural gas in sufficient quantities to justify completion as a crude oil or natural gas well. |
| (2) | Net exploratory wells are calculated according to our percentage of ownership in these wells. |
| (3) | None of our international wells were |
As set forthSeismic
Our subsidiary, Ecopetrol Brazil, purchased 874 km of 2D (spectrum survey) and 5,441 km2 3D (CGG and PGS) to evaluate the structures of Saturno, Titan and Ferradura (Round 15), as well as the blocks Uirapuru (Round 4) and Pau Brazil (Round 5), all of them located in the table above, in 2016, our subsidiary Ecopetrol America Inc. drilled inpre-salt play over the United States Gulf of Mexico the Warrior exploratory well, in which Ecopetrol America Inc. holds a 20% working interestSantos and our partners Anadarko (operator) holds a 65% working interest and MCX Gulf of Mexico LLC holds the remaining 15% working interest. The well was declared productive. This oil discovery is the result of our new exploratory strategy, which includes partnerships with leading companies to diversify risk, undertake further exploration activities and increase contingent resources. The Warrior well is the fifth oil discovery of the Ecopetrol Group in this prosperous oil region and contributes with increasing our contingent resources.Campos basins.
Ecopetrol AmericaHidrocarburos Mexico Inc. also drilledprocured a successful appraisal well in Leon discovery (León large 60,076 km 2D seismic survey and 11,009 km2 BP4) of 3D seismic data (surveys: Campeche Sur, Campeche Somero and Tabasco), operated by Repsol, which holds a 60% working interest. Ecopetrol America Inc. holdsto evaluate the remaining 40% working interest.The result of this well adds contingent resources to those initially discovered with the León 1 exploratory well in 2014.
During 2016, Ecopetrol S.A. did not participate in bidding roundsSalina basin in the Gulf of Mexico.
With regards to ECP Oil and Gas Germany GmbH´s operations in Angola, we reached an agreement with our partners on the terms upon which we will withdraw from Block 38/11 and Block 39/11. This agreement was sent for approval of the National Concessionaire, Sonangol EP, followed by the issuance of a decree from the Ministry of Petroleum. We expect the withdrawal process to be concluded by mid-year of 2017.
Our consolidated average production was 717.9 thousand boepd in 2016, a decrease of approximately 43 thousand boepd as compared to 2015. This decrease is mainly the result of the natural production decline of our fields and a reduction in the upstream investments during 2016, as a consequence of the drop in oil prices.
| 13 |
Our consolidated average production was 720.4 thousand boepd in 2018, an increase of approximately 5 thousand boepd as compared to 2017. This increase is mainly the result of an increase in upstream investments during 2018.
The following table summarizes the results of our oil and gas production activities for the periods indicated:
Table 6 – Ecopetrol Group’s Oil and Gas Production
| For the year ended December 31, | For the year ended December 31, | |||||||||||||||||||||||||||||||||||||||||||||||||||||||||||||||||||||||
| 2016 | 2015 | 2014 | 2018 | 2017 | 2016 | |||||||||||||||||||||||||||||||||||||||||||||||||||||||||||||||||||
| Oil | Gas(1) | Total | Oil | Gas(1) | Total | Oil | Gas(1) | Total | Oil | Gas(1) | Total | Oil | Gas(1) | Total | Oil | Gas(1) | Total | |||||||||||||||||||||||||||||||||||||||||||||||||||||||
| (thousand boepd) | (thousand boepd) | |||||||||||||||||||||||||||||||||||||||||||||||||||||||||||||||||||||||
| Total production in Colombia(2) | 582.5 | 123.3 | 705.8 | 619.2 | 130.4 | 749.6 | 610.9 | 133.3 | 744.2 | 578.4 | 125 | 703.4 | 577.3 | 121.6 | 698.9 | 582.5 | 123.3 | 705.8 | ||||||||||||||||||||||||||||||||||||||||||||||||||||||
| Total International production(3) | 9.6 | 2.5 | 12.1 | 7.3 | 3.8 | 11.1 | 8.6 | 2.6 | 11.2 | 14.1 | 2.9 | 17.0 | 13.6 | 2.6 | 16.2 | 9.6 | 2.5 | 12.1 | ||||||||||||||||||||||||||||||||||||||||||||||||||||||
| Total production of Ecopetrol Group | 592.1 | 125.8 | 717.9 | 626.5 | 134.2 | 760.7 | 619.5 | 135.9 | 755.4 | 592.5 | 127.9 | 720.4 | 590.9 | 124.2 | 715.1 | 592.1 | 125.8 | 717.9 | ||||||||||||||||||||||||||||||||||||||||||||||||||||||
| (1) | Conversion between mcfpd and boepd is performed at 5,700 mcfpd to 1 boepd. |
| (2) | Total production in Colombia corresponds to Ecopetrol S.A., Hocol and Equion. |
| (3) | Total International production corresponds to Savia Perú and Ecopetrol America Inc. |
3.4.2.1 Production Activities in Colombia
3.4.2.1.1Ecopetrol S.A.’s Production Activities in Colombia
For the year ended December 31, 2016,2018, Ecopetrol S.A. was the largest participant in the Colombian hydrocarbons industry, accounting for approximately 62%63% of crude oil production (according to calculations made by Ecopetrol based on information from the Ministry of Mines and Energy) and approximately 61%66% of natural gas production (according to calculations made by Ecopetrol based on information from the Ministry of Mines and Energy). Also during 2016,2018, Ecopetrol S.A. carried out development drilling mainly in the OrienteEastern and Orinoquia regions, drilling 133528 development wells; 83wells (226 of those through direct operations and 50302 through joint ventures.ventures).
In terms of operational structure, Ecopetrol S.A. manages its production operations through a regional organization. Since July 1, 2014, three regional Vice-Presidencies were created: Central, Orinoquia and Southern. After the company took over the operations of the Rubiales field in July of 2016, a new Vice-Presidency, the Eastern Region, was incorporated to this scheme. Our operating assets are distributed in the following regions:
| · | Central Region: comprising |
| · | Orinoquía Region: comprising |
| · | Southern Region: comprising |
| · | Eastern Region: comprising |
A fifth Vice-Presidency, the Vice-Presidency of Associated Operations, is responsible for all of the production activities in which a partner is involved, regardless of the location of such activities in Colombia. This Vice- Presidency is comprised of 137126 fields with active production in 2016.2018.
The map below indicatesshows the locations of Ecopetrol S.A´sS.A.’s operations with production information for each of our administrative regions followingdescribed in the subsequentfollowing paragraphs.
| 14 |
Graph 4 – Ecopetrol S.A. Operations in Colombia
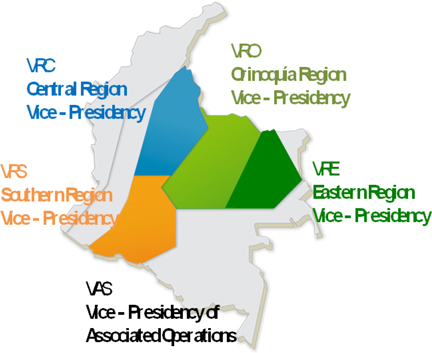

Note: VAS is thea countrywide Vice-presidency.
Crude Oil Production
The average daily production of crude oil in Colombia by Ecopetrol S.A. (excluding its subsidiaries), was 552.1548.7 mbod in 2016, 34.12018, 3.7 mbod lowerhigher than in 2015,2017, which represents a year-to-year decreaseincrease of 6%0.7%.
However, it is important to highlight that since July of 2016 we took over the operations of the Rubiales and Cusiana fields. A plan was set up with more than two years in advance, which allowed us to successfully transition between operators, without technical, operational or communities’ issues in any of the two fields. In the case of the Rubiales field, it is important to highlight that we restarted investments in the asset with new development drilling during the last quarter of the year 2016, which helped us mitigate the production decline observed during 2015.
The following chart summarizes Ecopetrol S.A.’s average daily crude oil production in Colombia by Region, prior to deducting royalties, for the periods indicated.
| 15 |
Table 7 – Ecopetrol S.A.’s Average Daily Crude Oil Production in Colombia by Region Vice-Presidency
| For the year ended December 31, | For the year ended December 31, | |||||||||||||||||||||||
| 2016 | 2015 | 2014 | 2018 | 2017 | 2016 | |||||||||||||||||||
| (thousand bpd) | (thousand bpd) | |||||||||||||||||||||||
| Central Region | ||||||||||||||||||||||||
| 1) La Cira – Infantas | 19.1 | 22.9 | 24.6 | 28.1 | 22.6 | 19.1 | ||||||||||||||||||
| 2) Casabe | 17.8 | 21.9 | 22.0 | 13.9 | 15.9 | 17.8 | ||||||||||||||||||
| 3) Yarigui | 16.6 | 17.8 | 16.7 | 14.4 | 14.5 | 16.6 | ||||||||||||||||||
| 4) Other | 21.3 | 23.7 | 21.0 | 17.3 | 18.5 | 21.3 | ||||||||||||||||||
| Total Central Region | 74.8 | 86.3 | 84.3 | 73.7 | 71.5 | 74.8 | ||||||||||||||||||
| Orinoquía Region | ||||||||||||||||||||||||
| 1) Castilla | 121.3 | 122.5 | 104.4 | 113.9 | 114.1 | 121.3 | ||||||||||||||||||
| 2) Chichimene | 74.0 | 78.0 | 56.2 | 67.7 | 70.5 | 74.0 | ||||||||||||||||||
| 3) Cupiagua | 11.3 | 14.0 | 16.4 | 8.3 | 9.6 | 11.3 | ||||||||||||||||||
| 4) Other | 18.3 | 21.1 | 26.0 | 25.5 | 24.3 | 18.3 | ||||||||||||||||||
| Total Orinoquía Region | 224.9 | 235.6 | 203.0 | 215.4 | 218.5 | 224.9 | ||||||||||||||||||
| Eastern Region | ||||||||||||||||||||||||
| 1) Rubiales(1) | 61.5 | 0 | 0 | 119.5 | 118.7 | 61.5 | ||||||||||||||||||
| 2) Caño Sur(2) | 0.4 | 0 | 0 | 3.2 | 1.4 | 0.4 | ||||||||||||||||||
| Total Eastern Region | 61.9 | 0 | 0 | 122.7 | 120.1 | 61.9 | ||||||||||||||||||
| Southern Region | ||||||||||||||||||||||||
| 1) San Francisco | 6.5 | 8.1 | 9.2 | 6.0 | 6.2 | 6.5 | ||||||||||||||||||
| 2) Huila Area | 7.4 | 7.8 | 8.2 | |||||||||||||||||||||
| 2) Huila Area(3) | 3.5 | 3.1 | 7.4 | |||||||||||||||||||||
| 3) Tello | 4.4 | 4.5 | 4.3 | 3.6 | 3.9 | 4.4 | ||||||||||||||||||
| 4) Other | 9.4 | 11.0 | 11.8 | 11.7 | 12.2 | 9.4 | ||||||||||||||||||
| Total Southern Region | 27.7 | 31.4 | 33.5 | 24.8 | 25.4 | 27.7 | ||||||||||||||||||
| Associated Operations | ||||||||||||||||||||||||
| 1) Rubiales(1) | 41.4 | 94.3 | 104.3 | – | – | 41.4 | ||||||||||||||||||
| 2) Quifa | 19.6 | 24.2 | 33.0 | 21.2 | 18.8 | 19.6 | ||||||||||||||||||
| 3) Caño Limon | 23.3 | 25.6 | 30.0 | 25.3 | 22.2 | 23.3 | ||||||||||||||||||
| 4) Cusiana(3) | 2.6 | 5.2 | 7.0 | |||||||||||||||||||||
| 4) Cusiana(4) | – | – | 2.6 | |||||||||||||||||||||
| 5) Other | 75.9 | 83.6 | 84.6 | 65.6 | 68.5 | 75.9 | ||||||||||||||||||
| Total Associated Operations | 162.8 | 232.9 | 258.9 | 112.1 | 109.5 | 162.8 | ||||||||||||||||||
| Total average daily crude oil production Ecopetrol S.A. (Colombia) | 552.1 | 586.2 | 579.7 | 548.7 | 545.0 | 552.1 | ||||||||||||||||||
| (1) | In the first half of 2016, the Rubiales field was part of the Vice-Presidency of Associated Operations. Since July 1, 2016, it |
| (2) | In the first half of 2016, the Caño Sur field was part of the Orinoquia Region. Since July 1, 2016, it |
| (3) | Huila Area: some assets were reclassified and are reported under Other in the Southern Region. |
| (4) | In the first half of 2016, the Cusiana field was part of the Vice-Presidency of Associated Operations. Since July 3, 2016, it |
Table 8 – Ecopetrol S.A. Production per Type of Crude
| 2016 (mbod) | Year-on-Year ∆ (%) | 2015 (mbod) | Year-on-Year ∆ (%) | 2014 (mbod) | 2018 (mbod) | Year-on- Year ∆(%) | 2017 (mbod) | Year-on- Year ∆(%) | 2016 (mbod) | |||||||||||||||||||||||||||||||
| Light | 44.6 | (0.0 | )% | 44.6 | 0.2 | % | 44.5 | 40.7 | (4.0 | )% | 42.4 | (4.9 | )% | 44.6 | ||||||||||||||||||||||||||
| Medium | 161.5 | (13.7 | )% | 187.1 | (5.8 | )% | 198.6 | 154.4 | 1.8 | % | 151.6 | (6.1 | )% | 161.5 | ||||||||||||||||||||||||||
| Heavy | 346.0 | (2.4 | )% | 354.5 | 5.3 | % | 336.6 | 353.6 | 0.7 | % | 351.0 | 1.4 | % | 346.0 | ||||||||||||||||||||||||||
| Total | 552.1 | (5.8 | )% | 586.2 | 1.1 | % | 579.7 | 548.7 | 545.0 | 552.1 | ||||||||||||||||||||||||||||||
Ecopetrol S.A.’s crude oil production during 20162018 consisted of approximately 37%36% light and medium crudes and 63%64% heavy crudes. In 2015,2017, approximately 40%36% of the crude oil production consisted of light and medium crudes and 64% consisted of heavy crudes. In 2016, approximately 37% of the crude oil production corresponded to light and medium crudes and 60%63% to heavy crudes. During 2014, production distribution was approximately 42% of light and medium crudes and 58% of heavy crudes.
Natural Gas Production
In 2016,2018, the average daily production of natural gas by Ecopetrol S.A. reached 116.0112.5 mboed, including natural gas liquids (“NGLs”), corresponding to a 4% decrease1.4% increase in comparison to 20152017 production.
We have three main natural gas production fields, Guajira, Cusiana and Cupiagua. In the Guajira field, we have partnered with Chevron who operates the field. The development of Cusiana field had a change in participation, because Tauramena joint venture expired on July 3, 2016. The Tauramena block is part of the Cusiana unified exploitation plan. As a consequence of the termination of the Tauramena joint venture, Ecopetrol´sEcopetrol’s participation increased from 63.4% to 97.8%, and Ecopetrol assumed the operation of the Cusiana unified exploitation plan. Ecopetrol S.A. is the operator of the Cupiagua field.field and other wells previously under the Recetor contract that were transferred from Equion to Ecopetrol as a result of the full return of the Recetor Field to Ecopetrol on May 29, 2017.
| 16 |
Of our total natural gas production during the year ended December 31, 2016,2018, approximately 29%20% was supplied from the Guajira field, 25%31% from the Cusiana field, 25%24% from the Cupiagua field and the remaining 21%25% from other fields.
The following table sets forth Ecopetrol S.A.’s average daily natural gas production in Colombia, including NGLs, prior to deducting royalties, for the years ended on December 31, 2016, 20152018, 2017 and 2014.2016.
Table 9 – Ecopetrol S.A.’s Average Daily Natural Gas Production in Colombia
| For the year ended December 31, | For the year ended December 31, | |||||||||||||||||||||||
| 2016 | 2015 | 2014 | 2018 | 2017 | 2016 | |||||||||||||||||||
| (thousand boepd) | (thousand boepd) | |||||||||||||||||||||||
| COLOMBIA | ||||||||||||||||||||||||
| Central Region | ||||||||||||||||||||||||
| 1) La Cira – Infantas | 0.17 | 0.12 | 0.16 | 0.16 | 0.15 | 0.17 | ||||||||||||||||||
| 2) Provincia | 3.09 | 3.75 | 4.00 | 1.96 | 2.41 | 3.09 | ||||||||||||||||||
| 3) Yarigui | 0.56 | 0.56 | 0.50 | 0.42 | 0.48 | 0.56 | ||||||||||||||||||
| 4) Gibraltar | 6.32 | 5.52 | 5.57 | 6.87 | 7.16 | 6.32 | ||||||||||||||||||
| 4) Other | 1.60 | 1.51 | 1.02 | 1.86 | 2.02 | 1.60 | ||||||||||||||||||
| Total Central Region | 11.74 | 11.46 | 11.25 | 11.27 | 12.22 | 11.74 | ||||||||||||||||||
| Orinoquía Region | ||||||||||||||||||||||||
| 1) Cupiagua | 28.72 | 24.09 | 22.80 | 26.97 | 25.29 | 28.72 | ||||||||||||||||||
| 2) Cusiana(1) | 15.98 | 0.00 | 0.00 | 34.73 | 31.97 | 15.98 | ||||||||||||||||||
| 2) Other | 1.44 | 1.18 | 1.37 | |||||||||||||||||||||
| 3) Other | 2.80 | 2.44 | 1.44 | |||||||||||||||||||||
| Total Orinoquía Region | 46.14 | 25.27 | 24.17 | 64.5 | 59.70 | 46.14 | ||||||||||||||||||
| Southern Region | ||||||||||||||||||||||||
| 1) Huila Area | 0.64 | 0.85 | 1.14 | 0.13 | 0.10 | 0.64 | ||||||||||||||||||
| 2) Tello | 0.35 | 0.35 | 0.26 | 0.11 | 0.22 | 0.35 | ||||||||||||||||||
| 3) Other | 0.03 | 0.03 | 0.04 | 0.25 | 0.40 | 0.03 | ||||||||||||||||||
| Total Southern Region | 1.02 | 1.23 | 1.44 | 0.49 | 0.72 | 1.02 | ||||||||||||||||||
| Associated Operations | ||||||||||||||||||||||||
| 1) Guajira | 33.34 | 42.71 | 50.11 | 23.02 | 27.09 | 33.34 | ||||||||||||||||||
| 2) Cusiana(1) | 12.65 | 27.03 | 26.53 | 0.00 | 0.00 | 12.65 | ||||||||||||||||||
| 3) Other | 11.10 | 13.47 | 11.87 | 13.21 | 11.29 | 11.10 | ||||||||||||||||||
| Total Associated Operations | 57.09 | 83.21 | 88.51 | 36.23 | 38.38 | 57.09 | ||||||||||||||||||
| Total Natural Gas Production (Colombia) | 115.99 | 121.17 | 125.37 | 112.49 | 111.02 | 115.99 | ||||||||||||||||||
Note: Conversion between mcfpd and boepd is performed at 5,700 mcfpd to 1 boepd.
| (1) | In the first half of 2016, the Cusiana field was part of the Vice-Presidency of Associated Operations. Since July 3, 2016, it |
| (2) | In the Southern Region, some assets that were previously part of the Huila area were reclassified as Other. |
Projects to Increase Recovery Factor:Factor
During 2016 Ecopetrol prioritized opportunities withincontinues to invest in its recovery factor program in order to increase reserves and production. In 2018, the recovery factor program keeping 18 activeincreased proven reserves by 129 million boe. US$94 million was invested for the execution of 60 studies and 19 pilots to reduce uncertainties and mature these opportunities into projects in operationthe medium or long term. These pilots under assessment had a daily production of approximately 17 mboed.
Secondary and developing a new additional one. Fromtertiary recovery technologies contributed 167 mboed or 23% of the current pilots, 12 have already presented an increase inEcopetrol Group’s total daily production, withinprimarily from the area impacted by the pilot.Castilla, Chichimene, Teca, La Cira Infantas, Casabe, Yarigui, Tibú, Asociacion Nare, Cusiana, Cupiagua and Piedemonte fields.
| 17 |
AmongIn 2018, the main results of the pilots in 2016, it is important to highlight thefollowing projects exhibited positive results in both efficiency of injection and response in production: (i) the water floodinginjection pilots inat Castilla, Chichimene, Apiay, Suria and La Cira sands A and B, (ii) the heavy crudeimproved water injection pilots at Chichimene, La Cira Infantas, Casabe and Yarigui fields, of Castilla and Chichimene. These fields reported a growth in(iii) the recovery factor of 5.2% in the pilot area of Chichimene field and 2.5% in the pilot area of Castilla field. Also in 2016, we continued the evaluation of steam injection pilots inat the JazminTeca and Teca projects, with participation from partners, located in the Middle Magdalena Valley, where we also obtained positive responses in terms of production.Nare fields.
In the air injection pilot at Chichimene field,2018, a detailed revisionfinal investment decision was taken in respect of the scopecommencement of eight recovery projects based on the results of their correspondent pilots: (i) six water injection projects (Chichimene, Castilla, Suria, La Cira sands A and of the works required was carried out due to the drop in global oil prices. During 2017, additional works will be completedB, Llanito-Gala and it is expected that the start of theGalan), (ii) one enhanced water injection will take place in the last quarter of 2017.
Since the beginning of theproject (Dina K) and (iii) one continuous steam injection project (Teca). Additionally, nine recovery factor increase program, we have started 34 recovery pilots, of which 24 have shown positive results in terms of pressure increase and 19 in incremental crude production.technology expansion projects are currently being structured.
Development Wells
The following table sets forth the number of gross and net development wells drilled in Colombia, both solely by Ecopetrol S.A. and with its joint ventures that reached total depth for the years ended December 31, 2016, 20152018, 2017 and 2014.2016.
Table 10 – Ecopetrol S.A.’s Gross and Net Development Wells in Colombia
| For the year ended December 31, | ||||||||||||
| 2016 | 2015 | 2014 | ||||||||||
| (number of wells) | ||||||||||||
| COLOMBIA | ||||||||||||
| Central Region | ||||||||||||
| Gross wells owned and operated by Ecopetrol | - | 79 | 104 | |||||||||
| Orinoquía Region | ||||||||||||
| Gross wells owned and operated by Ecopetrol | 47 | 109 | 65 | |||||||||
| Southern Region | ||||||||||||
| Gross wells owned and operated by Ecopetrol | - | 21 | 8 | |||||||||
| Eastern Region | ||||||||||||
| Gross wells owned and operated by Ecopetrol | 36 | - | - | |||||||||
| Total gross wells owned and operated by Ecopetrol S.A. in Colombia | 83 | 209 | 177 | |||||||||
| Associated Operations | ||||||||||||
| Gross wells in joint ventures | 50 | 330 | 584 | |||||||||
| Net wells(1) | 19 | 146 | 374 | |||||||||
| Total gross wells in joint ventures Ecopetrol S.A. in Colombia | 50 | 330 | 584 | |||||||||
| Total net wells in joint ventures Ecopetrol S.A. in Colombia(1) | 19 | 146 | 374 | |||||||||
| Total gross wells Ecopetrol S.A. in Colombia | 133 | 539 | 761 | |||||||||
| Total net wells Ecopetrol S.A. in Colombia(1) | 102 | 355 | 551 | |||||||||
| For the year ended December 31, | ||||||||||||
| 2018 | 2017 | 2016 | ||||||||||
| (number of wells) | ||||||||||||
| COLOMBIA | ||||||||||||
| Central Region | ||||||||||||
| Gross wells owned and operated by Ecopetrol | 12 | – | – | |||||||||
| Orinoquía Region | ||||||||||||
| Gross wells owned and operated by Ecopetrol | 77 | 56 | 47 | |||||||||
| Southern Region | ||||||||||||
| Gross wells owned and operated by Ecopetrol | 19 | – | – | |||||||||
| Eastern Region | ||||||||||||
| Gross wells owned and operated by Ecopetrol | 118 | 143 | 36 | |||||||||
| Total gross wells owned and operated by Ecopetrol S.A. in Colombia | 226 | 199 | 83 | |||||||||
| Associated Operations | ||||||||||||
| Gross wells in joint ventures | 302 | 276 | 50 | |||||||||
| Net wells(1) | 144.2 | 97 | 19 | |||||||||
| Total gross wells in joint ventures Ecopetrol S.A. in Colombia | 302 | 276 | 50 | |||||||||
| Total net wells in joint ventures Ecopetrol S.A. in Colombia(1) | 144.2 | 97 | 19 | |||||||||
| Total gross wells Ecopetrol S.A. in Colombia | 528 | 475 | 133 | |||||||||
| Total net wells Ecopetrol S.A. in Colombia(1) | 370.2 | 296 | 102 | |||||||||
| (1) | Net wells correspond to the sum of wells owned and operated by Ecopetrol plus the net wells in our |
Production Acreage
The following table sets forth Ecopetrol S.A.’s developed and undeveloped gross and net acreage of crude oil and natural gas production in Colombia for the year ended December 31, 2016.2018.
Table 11 – Ecopetrol S.A.’s Developed and Undeveloped Gross
and Net Acreage of Crude Oil and Natural Gas Production in Colombia
| Production Acreage as of December 31, 2016 ( acres) | ||||||||||||||||
| Developed | Undeveloped | |||||||||||||||
| Gross | Net | Gross | Net | |||||||||||||
| Ecopetrol S.A. | 448,782 | 343,233 | 5,040,681 | 3,679,116 | ||||||||||||
| Production Acreage as of December 31, 2018 ( acres) | ||||||||||||||||
| Developed | Undeveloped | |||||||||||||||
| Gross | Net | Gross | Net | |||||||||||||
| Ecopetrol S.A. | 452,121 | 349,954 | 4,653,531 | 3,426,785 | ||||||||||||
| 18 |
Gross and Net Productive Wells
The following table sets forth Ecopetrol S.A.’s total gross and net productive wells by region as of December 31, 2016.2018.
Table 12 – Ecopetrol S.A.’s Gross and Net Productive Wells by Region
| As of December 31, 2016 (number of wells) | As of December 31, 2018 (number of wells) | |||||||||||||||||||||||||||||||
| Crude Oil(1) | Natural Gas(2) | Crude Oil(1) | Natural Gas(2) | |||||||||||||||||||||||||||||
| Gross | Net | Gross | Net | Gross | Net(3) | Gross | Net(3) | |||||||||||||||||||||||||
| COLOMBIA | ||||||||||||||||||||||||||||||||
| Ecopetrol S.A. | ||||||||||||||||||||||||||||||||
| Central region | 2,286 | 1,807 | 9 | 9 | 2,244 | 1,767 | 9 | 9 | ||||||||||||||||||||||||
| Orinoquía region | 952 | 946 | 17 | 17 | 1,086 | 1,077 | 22 | 18 | ||||||||||||||||||||||||
| Southern region | 583 | 520 | 6 | 6 | 589 | 534 | 13 | 13 | ||||||||||||||||||||||||
| Eastern Region | 780 | 780 | 0 | 0 | 693 | 693 | - | - | ||||||||||||||||||||||||
| Region of Associated Operations | 2,829 | 1,425 | 27 | 10 | 2,602 | 1,260 | 16 | 7 | ||||||||||||||||||||||||
| Total (Ecopetrol S.A.) | 7,430 | 5,478 | 59 | 42 | 7,214 | 5,331 | 60 | 47 | ||||||||||||||||||||||||
| Note: | The above table reflects the productive wells that directly contribute to hydrocarbon production and therefore excludes wells used for injection, disposal, water abstraction, or other similar activities. |
| (1) | We consider crude oil wells to be those in which the main operation is oil production, although many of these wells produce gas associated with oil production that, in some cases, have a commercial purpose. |
| (2) | Natural gas wells are those in which operations are directed only toward the production of commercial gas. |
| (4) | Wells from oil fields transferred to Hocol are not included. |
3.4.2.1.2Ecopetrol S.A.’s Affiliates and Subsidiaries’ Production Activities in Colombia
Crude Oil Production
The following table sets forth our average daily crude oil production from Hocol and Equion, prior to deducting royalties, for the periods indicated.
Table 13 – Ecopetrol S.A.’s Subsidiaries in Colombia Average Daily Crude Oil Production
| For the year ended December 31, | For the year ended December 31, | |||||||||||||||||||||||
| 2016 | 2015 | 2014 | 2018 | 2017 | 2016 | |||||||||||||||||||
| (thousand bpd) | (thousand bpd) | |||||||||||||||||||||||
| Hocol | ||||||||||||||||||||||||
| Joint venture operation | 2.6 | 2.1 | 2.5 | 2.3 | 2.3 | 2.6 | ||||||||||||||||||
| Direct operation | 15.4 | 19.3 | 18.8 | 18.4 | 19.4 | 15.4 | ||||||||||||||||||
| Total Hocol | 18.0 | 21.4 | 21.3 | 20.7 | 21.7 | 18.0 | ||||||||||||||||||
| Equion | ||||||||||||||||||||||||
| Joint venture operation | 0.1 | – | – | – | 0.1 | 0.1 | ||||||||||||||||||
| Direct operation | 12.3 | 11.6 | 10.0 | 9.0 | 10.5 | 12.3 | ||||||||||||||||||
| Total Equion | 12.4 | 11.6 | 10.0 | 9.0 | 10.6 | 12.4 | ||||||||||||||||||
| Production Tests | – | – | – | – | – | – | ||||||||||||||||||
| Total Average Daily Crude Oil Production (Subsidiaries in Colombia) | 30.4 | 33 | 31.3 | 29.7 | 32.3 | 30.4 | ||||||||||||||||||
The 4.6% decrease in Hocol’s production in 2018, as compared to 2017, was mainly due to result of the natural production decline of our fields.
| 19 |
The 15.4%15.1% decrease in Hocol’sEquion’s production in 20162018, as compared to 20152017, was mainly due to the temporary closureresult of the natural production decline of our fields, Guarrojo, Ortega, Toldado, Toy, Quimbaya and Puli as a result of community blockages and governmental resolutions (Constitutional Court) which were lifted afterwards.
The 7% increase in Equion’s production in 2016 as compared to 2015 was mainly due to the start of productiontransfer of a new well andpart of its participation in the increase of three wells previously drilled as a result of specific interventions.Recetor contract to Ecopetrol.
Natural Gas Production
The following table sets forth our subsidiaries’ average daily natural gas production, prior to deducting royalties, for the periods indicated.
Table 14 – Ecopetrol S.A.’s Subsidiaries in Colombia Average Daily Natural Gas Production
| For the year ended December 31, | For the year ended December 31, | |||||||||||||||||||||||
| 2016 | 2015 | 2014 | 2018 | 2017 | 2016 | |||||||||||||||||||
| (thousand boepd)(1) | (thousand boepd)(1) | |||||||||||||||||||||||
| Hocol | ||||||||||||||||||||||||
| Joint venture operation | 0.2 | – | – | 1.6 | 0.6 | 0.2 | ||||||||||||||||||
| Direct operation | 0.6 | 0.2 | 0.1 | 5.9 | 5.2 | 0.6 | ||||||||||||||||||
| Total Hocol | 0.8 | 0.2 | 0.1 | 7.5 | 5.8 | 0.8 | ||||||||||||||||||
| Equion | ||||||||||||||||||||||||
| Joint venture operation | 0.1 | – | – | 0.2 | 0.2 | 0.1 | ||||||||||||||||||
| Direct operation | 6.4 | 9 | 7.8 | 4.8 | 4.6 | 6.4 | ||||||||||||||||||
| Total Equion | 6.5 | 9 | 7.8 | 5.0 | 4.8 | 6.5 | ||||||||||||||||||
| Production Tests | – | – | – | – | – | – | ||||||||||||||||||
| Total Natural Gas Production (Subsidiaries in Colombia) | 7.3 | 9.2 | 7.9 | 12.5 | 10.6 | 7.3 | ||||||||||||||||||
| (1) | Conversion between mcfpd and boepd is performed at 5,700 mcfpd to 1 boepd. |
Development Wells
The following table sets forth the number of gross and net development wells drilled exclusively by our subsidiaries and in their joint ventures in Colombia for the periods indicated.
Table 15 – Ecopetrol S.A.’s Subsidiaries in Colombia Gross and Net Development Wells
| For the year ended December 31, | For the year ended December 31, | |||||||||||||||||||||||
| 2016 | 2015 | 2014 | 2018 | 2017 | 2016 | |||||||||||||||||||
| (number of wells) | (number of wells) | |||||||||||||||||||||||
| Hocol | ||||||||||||||||||||||||
| Gross wells owned and operated by Hocol | 9 | 13 | 16 | 12 | 17 | 9 | ||||||||||||||||||
| Gross wells in joint ventures | – | 1 | 6 | 2 | – | – | ||||||||||||||||||
| Net wells(1) | 9 | 13 | 17 | 13 | 17 | 9 | ||||||||||||||||||
| Equion | ||||||||||||||||||||||||
| Gross wells owned and operated by Equion(2) | – | – | – | – | – | – | ||||||||||||||||||
| Gross wells in joint ventures | 1 | 5 | 2 | – | 1 | 1 | ||||||||||||||||||
| Net wells(1) | – | 1 | 1 | – | – | – | ||||||||||||||||||
| Total gross wells owned and operated in Colombia | 9 | 13 | 16 | 12 | 17 | 9 | ||||||||||||||||||
| Total gross wells in joint ventures in Colombia | 1 | 6 | 8 | 2 | 1 | 1 | ||||||||||||||||||
| Total net wells (Subsidiaries in Colombia) | 9 | 14 | 18 | 13 | 17 | 9 | ||||||||||||||||||
| (1) | Net wells correspond to the sum of wells owned and operated by our subsidiaries and their ownership percentage of wells owned in joint ventures with their partners. |
| (2) | Even though for the last three years Equion has operated every well, Equion has not owned any well 100%; rather Equion has drilled wells in joint venture with Ecopetrol. Therefore, after a careful review of the categories, all Equion data was moved from gross wells owned and operated by Equion to gross wells in joint ventures. However, the number of wells remains the same. |
| 20 |
Production Acreage
Production Acreage
The following table sets forth our subsidiaries’ developed and undeveloped gross and net acreage of crude oil and natural gas production in Colombia for the year ended December 31, 2016.2018.
Table 16 – Ecopetrol S.A.’s Subsidiaries in Colombia Developed and Undeveloped Gross and Net Acreage of
Crude Oil and Natural Gas Production
| Production acreage as of December 31, 2016 | Production acreage as of December 31, 2018 | |||||||||||||||||||||||||||||||
| Developed | Undeveloped | Developed | Undeveloped | |||||||||||||||||||||||||||||
| Gross | Net | Gross | Net | Gross | Net | Gross | Net | |||||||||||||||||||||||||
| (in acres) | (in acres) | |||||||||||||||||||||||||||||||
| Hocol | 18,787.4 | 8,547.0 | 346.8 | 329.6 | 17,845 | 15,930 | 675 | 666 | ||||||||||||||||||||||||
| Equion | 20,867.4 | 5,269.0 | 84,826.9 | 19,853.0 | 16,300 | 4,104 | 54,666 | 12,162 | ||||||||||||||||||||||||
| Total (Subsidiaries in Colombia) | 39,654.8 | 13,816.0 | 85,173.7 | 20,182.6 | 34,145 | 20,034 | 55,341 | 12,828 | ||||||||||||||||||||||||
Gross and Net Productive Wells
The following table sets forth our subsidiaries’ total gross and net productive wells in Colombia for the year ended December 31, 2016. We consider crude oil wells to be those in which the main operation is oil production, although many of these wells produce gas associated with oil production that, in some cases, have a commercial purpose. Natural gas wells are those in which operations are directed only towards production of commercial gas. Information in the table below reflects productive wells that directly contribute to hydrocarbons production and therefore excludes wells used for injection, disposal, water abstraction, or other similar activities.2018.
Table 17 – Ecopetrol S.A.’s Subsidiaries in Colombia Gross and Net Productive Wells(1)
| For the year ended December 31, 2016 | ||||||||||||||||
| Crude Oil | Natural Gas | |||||||||||||||
| Gross | Net | Gross | Net | |||||||||||||
| (number of wells) | ||||||||||||||||
| Hocol | 231 | 163.9 | 5 | 4.5 | ||||||||||||
| Equion | 22 | 11 | 22 | 11 | ||||||||||||
| Total (Subsidiaries in Colombia) | 253 | 174.9 | 27 | 15.5 | ||||||||||||
| For the year ended December 31, 2018 | ||||||||||||||||
| Crude Oil | Natural Gas | |||||||||||||||
| Gross | Net | Gross | Net | |||||||||||||
| (number of wells) | ||||||||||||||||
| Hocol | 281 | 241.9 | 20 | 18.5 | ||||||||||||
| Equion | 15 | 8 | 15 | 8 | ||||||||||||
| Total (Subsidiaries in Colombia) | 296 | 249.9 | 35 | 26.5 | ||||||||||||
3.4.2.2 Production Activities Outside Colombia
The Ecopetrol Group’s production outside of Colombia comes from 100% of the production of Ecopetrol America Inc. and 50% of our share of Savia in Peru. In 2018, the production obtained from these two companies was 17 boepd, which represents 2.4% of the total production of the Ecopetrol Group.
Crude Oil Production
The following table sets forth our average daily crude oil production outside Colombia, prior to deducting royalties, for the periods indicated.
Table 18 – Ecopetrol S.A.’s Subsidiaries Outside Colombia Average Daily Crude Oil Production
| For the year ended December 31, | For the year ended December 31, | |||||||||||||||||||||||
| 2016 | 2015 | 2014 | 2018 | 2017 | 2016 | |||||||||||||||||||
| (thousand bpd) | (thousand bpd) | |||||||||||||||||||||||
| Savia Perú | 4.1 | 4.8 | 5.9 | 3.9 | 3.9 | (1) | 4.1 | |||||||||||||||||
| Ecopetrol America Inc. | 5.5 | 2.5 | 2.6 | 10.2 | 9.2 | 5.5 | ||||||||||||||||||
| Total average daily crude oil production (International) | 9.6 | 7.3 | 8.5 | 14.1 | 13.1 | 9.6 | ||||||||||||||||||
| (1) | In 2017, Savia’s crude oil production included NGLs. In preparing our 2018 operational information, those NGLs were reclassified into our 2017 natural gas production. |
| 21 |
Natural Gas Production
The following table sets forth our average daily natural gas production outside Colombia, prior to deducting royalties, for the periods indicated.
Table 19 – Ecopetrol S.A.’s Subsidiaries Outside Colombia Average Daily Natural Gas Production
| For the year ended December 31, | For the year ended December 31, | |||||||||||||||||||||||
| 2016 | 2015 | 2014 | 2018 | 2017 | 2016 | |||||||||||||||||||
| (thousand boepd) | (thousand boepd) | |||||||||||||||||||||||
| Savia Perú | 1.3 | 1.2 | 0.5 | 1.1 | 1.1 | (1) | 1.3 | |||||||||||||||||
| Ecopetrol America Inc. | 1.2 | 2.6 | 2.1 | 1.8 | 2.0 | 1.2 | ||||||||||||||||||
| Total average daily natural gas production (International) | 2.5 | 3.8 | 2.6 | 2.9 | 3.1 | 2.5 | ||||||||||||||||||
| (1) | In 2017, Savia’s crude oil production included NGLs. In preparing our 2018 operational information, those NGLs were reclassified into our 2017 natural gas production. |
Development Wells
The following table sets forth the number of gross and net development wells outside Colombia, drilled exclusively by us and in joint ventures for the periods indicated. Information in the table below reflects productive wells that directly contribute to hydrocarbons production and therefore excludes wells used for injection, disposal, water abstraction, or other similar activities.
Table 20 – Ecopetrol S.A.’s Subsidiaries Outside Colombia Gross and Net Development Wells(1)
| For the year ended December 31, | For the year ended December 31, | |||||||||||||||||||||||
| 2016 | 2015 | 2014 | 2018 | 2017 | 2016 | |||||||||||||||||||
| (number of wells) | (number of wells) | |||||||||||||||||||||||
| Savia Perú | ||||||||||||||||||||||||
| Gross wells | - | - | 13 | - | - | - | ||||||||||||||||||
| Net wells(1) | - | - | 6.5 | |||||||||||||||||||||
| Net wells(2) | - | - | - | |||||||||||||||||||||
| Ecopetrol America Inc. | - | - | - | |||||||||||||||||||||
| Gross wells | 3 | 2 | - | 1 | 2 | 3 | ||||||||||||||||||
| Net wells(1) | 0.7 | 0.4 | - | |||||||||||||||||||||
| Net wells(2) | 0.3 | 0.4 | 0.7 | |||||||||||||||||||||
| Total gross wells (International) | 3 | 2 | 13 | 1 | 2 | 3 | ||||||||||||||||||
| Total net wells (International) | 0.7 | 0.4 | 6.5 | 0.3 | 0.4 | 0.7 | ||||||||||||||||||
| (1) | Information in the table above reflects productive wells that directly contribute to hydrocarbons production and therefore excludes wells used for injection, disposal, water abstraction or other similar activities. |
| (2) | Net wells correspond to the sum of wells entirely owned by us or our subsidiaries and our ownership percentage of wells owned in joint ventures with our partners. |
Production Acreage
The following table sets forth our developed and undeveloped gross and net acreage of crude oil and natural gas production outside Colombia for the year ended December 31, 2016.2018.
| 22 |
Table 21 – Ecopetrol S.A.’s Subsidiaries Outside Colombia Developed and Undeveloped Gross and Net
Acreage of Crude Oil and Natural Gas Production
| Production acreage as of December 31, 2016 | Production acreage as of December 31, 2018 | |||||||||||||||||||||||||||||||
| Developed | Undeveloped | Developed | Undeveloped | |||||||||||||||||||||||||||||
| Gross | Net | Gross | Net | Gross | Net | Gross | Net | |||||||||||||||||||||||||
| (in acres) | (in acres) | |||||||||||||||||||||||||||||||
| Savia Perú | 137,246 | 79,575 | 57,671 | 0 | 79,575 | 39,788 | 57,671 | 28,836 | ||||||||||||||||||||||||
| Ecopetrol America Inc.(1) | 49,680 | 10,645 | 18,261 | 5,736 | 55,440 | 15,059 | 23,040 | 6,566 | ||||||||||||||||||||||||
| Total (International) | 186,926 | 90,220 | 75,932 | 5,736 | 135,015 | 54,847 | 80,711 | 35,402 | ||||||||||||||||||||||||
| (1) | Production and acreage from Ecopetrol America Inc. is related to the K2, Dalmatian and Gunflint field blocks in the Gulf of Mexico. For K2, there are four blocks in the production stage. For Dalmatian, there are |
Gross and Net Productive Wells
The following table sets forth our total gross and net productive wells outside Colombia for the year ended December 31, 2016.2018.
Table 22 – Ecopetrol S.A.’s Subsidiaries Outside Colombia Gross and Net Productive Wells
| As of December 31, 2016 | As of December 31, 2018 | |||||||||||||||
| Crude Oil | Crude Oil | |||||||||||||||
| Gross | Net | Gross | Net | |||||||||||||
| (number of wells) | (number of wells) | |||||||||||||||
| INTERNATIONAL | ||||||||||||||||
| Savia Perú | 639 | 320 | 606 | 303 | ||||||||||||
| Ecopetrol America Inc. | 14 | 2.4 | 15 | 3.6 | ||||||||||||
| Total (International) | 653 | 322.4 | 621 | 306.6 | ||||||||||||
3.4.2.3 Marketing of Crude Oil and Natural Gas
In 2016,2018, Ecopetrol sold 962.5 mboepd,899.5 mboed, out of which 449.7 mbopd400.4 mboed represented sales of crude oil (46.7%(44%), 77.8 mboepd78.5 mboed natural gas (8.1%(9%) and 435.0 mboepd420.6 mboed of fuels and petrochemicals (45.2%(47%).
Crude Oil Export Sales
ExportCrude oil export sales of crude oil in 20162018 decreased by 10124 mbopd as compared to 2015 primarily2017 mainly due to the crude Castilla blend and the Vasconia Norte blend being used as partsubstitution of the slateimports at Reficar for Reficar and therefore not available for exporting activities.domestic crudes. Ecopetrol’s crude oil export sales are traded both in the spot and contract markets, primarily to refiners in the United States, Asia Europe, Central America and the Caribbean.Europe.
The Castilla blend is the principalmain type of crude oil for foreignexport sales, with 330.8334 mbopd sold during 20162018 (a 74%84% share of our crude oil basket) followed by the Vasconia Norte with 32.319 mbopd (an 7%(a 5% share in our crude oil basket) and the Magdalena, South blend with 2411 mbopd (a 5%3% share of our crude oil basket), and Vasconia Norte with 9.4 mbopd (a 2% share of our crude oil basket).
A market diversification strategy has allowed Ecopetrol to shift towardsplaced its exports in markets where it captures a betterthat represent the best value for its crudes. The United States, Europe, Central America and Caribbean were destinations that showed an increase in ourIn 2018, Asia was the main destination, representing 41% of crude oil export volume, from 67% of total export sales in 2015 to 81% of total export sales in 2016. In contrast, other destinations, such as Asia, experienced a decrease in volume mainly due to: (i) larger supply coming into this market from the Middle East and (ii) more opportunities for Ecopetrol S.A. to sell inexports, closely followed by the United States becausewith 40% of crude oil exports. The expansion of refining capacity both in the private and state owned companies in countries like China has supported the increase in crude oil flows from Colombia to Asia, volatility in the production of regional producers has given US refiners an incentive to diversify their supply sources which has opened opportunities for Colombian producers. Ecopetrol’s crude basket was discounted by US$ 8.5/bl below the ICE Brent price. Our crude basket increased by US$15.4/bl year over year due to the strength of the interest of refiners in imported crude.ICE Brent price and our persistent commercial strategy towards markets with higher value.
| 23 |
Crude Oil Purchase Contracts
Ecopetrol has signed several crude oil purchase contracts with third parties and business partners. Ecopetrol also purchases crude oil received byfrom the ANH as royalties from other producers in Colombia.royalties. This oil is processed in Ecopetrol’s refineries or exported. The purchase price correspondsis referenced to export parity based on international market prices plus a commercial fee.
The term of some of our purchase contracts is linked to the term of the exploration and production contracts signed with our business partners. Other clauses of the contracts such as price and place of delivery vary and may be subject to renegotiation during the term of the contract. Certain purchase contracts not linked to joint venture agreements may be extended and renegotiated by the parties.
The table below sets forth the volumes of crude oil purchased from our business partners and third parties and volumes of crude oil purchased from the ANH corresponding tofrom royalties for the years ended on December 31, 2016, 20152018, 2017 and 2014.2016.
Table 23 – Ecopetrol Consolidated Crude Oil Purchases
| For the year ended December 31, | For the year ended December 31, | |||||||||||||||||||||||
| 2016 | 2015 | 2014 | 2018 | 2017 | 2016 | |||||||||||||||||||
| (million barrels) | (million barrels) | |||||||||||||||||||||||
| Ecopetrol Corporate Group | ||||||||||||||||||||||||
| Crude oil purchased from the ANH | 42.9 | 45.6 | 45.4 | |||||||||||||||||||||
| Crude oil purchased from ANH royalties | 37.6 | 40.3 | 42.9 | |||||||||||||||||||||
| Crude oil purchased from third parties | 15.5 | 15.6 | 20.9 | 20.7 | 16.7 | 15.5 | ||||||||||||||||||
| Crude oil imported from third parties | 22 | 1.8 | - | 14.0 | 24.8 | 22.0 | ||||||||||||||||||
During 2018, part of Ecopetrol’s crude strategy was centered on increasing the purchase of crude oil from third parties, which enables further optimization of the supply chain.
Import of Diluents
In 2016,2018, Ecopetrol decreased by 12.3% (7.9 mboepd) the imports of diluentsdiluent by 1.7% (0.9 mbpd) compared to 2017. Diluent is used to allowtransport our heavy crudes to be pumped through pipelines, as compared to 2015,the pipeline system, and the reduction is due to an increaseoptimizations in dilution processes within the viscosity specifications in the transport of heavy crude oil.transformation plan last year.
Natural Gas Sales
Ecopetrol sells natural gas to distribution companies through firm, interruptible and conditional contracts. These distributors supply natural gas to the residential market, foras compressed natural gas for vehicles market and to industrieslarge industrials in Colombia. We also market and sell natural gas directly to the industrial sector and to gas-fired and combined cycle power plants.
Despite higher demand by thermal power plants due to “El Niño” climate phenomenon, Ecopetrol’s natural gas sales decreased 15.9% (14.7and self-consumption increased by 1.0% (0.93 mboepd) as compared to 20152017, due to the decline of production at the Guajira field, restrictions on transporting natural gas by pipelinean increase in short term sales to dispatch natural gas from fields found in the inner part of Colombia and the decrease in consumption of the industrial and vehicular sectors. Our market share in 2016 was 64% as compared to 63% in 2015.consumers.
Natural Gas Delivery Commitments
The table below sets forth the commitments we have in Colombia under firm contracts with local natural gas distribution companies, local industries, gas firedgas-fired power generators and internal agreements with our refineries and fields.
Table 24 – Ecopetrol Consolidated Natural Gas Delivery Commitments
| For the year ended December 31, | ||||||||||||||||
| 2019 | 2020 | 2021 | 2022 | |||||||||||||
| (gbtud) | ||||||||||||||||
| Volume for sales third parties | 526.8 | 549.2 | 499.9 | 323.0 | ||||||||||||
| Volume for self-consumption | 140.4 | 175.2 | 185.3 | 194.8 | ||||||||||||
| Total Commitments | 667.2 | 724.4 | 685.2 | 517.8 | ||||||||||||
| 24 |
Table 24 – Ecopetrol Consolidated Natural Gas Delivery Commitments
| For the year ended December 31, | ||||||||||||||||
| 2017 | 2018 | 2019 | 2020 | |||||||||||||
| (gbtud) | ||||||||||||||||
| Volume for sales third parties | 475.2 | 464.2 | 246.2 | 190.2 | ||||||||||||
| Volume for self-consumption | 224.4 | 231.4 | 225.4 | 265.4 | ||||||||||||
| Total Commitments | 699.6 | 695.6 | 471.6 | 455.6 | ||||||||||||
Neither Ecopetrol America, Equion nor Savia Peru are included in the table above since they do not consolidate within Ecopetrol Group. In respectData was updated based on current contracts and the official report made to the Ministry of Ecopetrol America Inc., it does not have anyMines and Energy in 2018. During 2017 the Energy and Gas Regulatory Commission published a new resolution modifying the existing trading rules in the Colombian natural gas delivery or supply commitments.market. See the sectionBusiness Overview—Applicable Laws and Regulations—Regulation of the Natural Gas Market.
Refined Products3.4.3 Reserves
Domestic sales of refined products increased by 3.6 mboepd, an increase of 1.2% compared with 2015. This increase is primarily the result of: (i) a 10%, or 10.2 mboepd, increase in gasoline sales mainly due to a 13% decrease in gasoline prices as compared to 2015 and less production of ethanol for blending, (ii) a 5%, or 1.3 mboepd increase, in fuel sales mainly due to a 5% increase in the number of passengers transported as compared to 2015 and a 2% increase in air freight as compared to 2015, (iii) a 28%, or 1.3 mboepd, increase in fuel oil sales mainly as a result of new contracts and higher domestic fuel sales at Reficar, and (iv) a 1.9%, or 0.3 mboepd, increase in LPG sales mainly due to an increase in production at Reficar. These increases were partially offset by a 6%, or 7.5 mboepd, decrease in diesel sales mainly due to the freight land transportation strike in June and July 2016 and lower than expected economic growth.
Exports of products increased by 93.7% as compared to 2015, due to 74 mboepd increase by Reficar mainly due to: (i) the finalization of the entire expansion and modernization project, followed by the startup process completed in July 2016, thereby advancing to the stabilization phase, and (ii) an increase in Propilco’s exports of close to 0.6 mboepd in 2016 (9.9 mboepd vs. 9.3 mboepd of 2015). This increase was partially offset by a decrease in fuel oil exports by 6 mboepd, or 10%, due to lower fuel oil production in the Barrancabermeja Refinery.
In addition, local sales of petrochemicals (included in domestic sales of products) decreased as compared to the previous year (19.2 mboepd in 2016 compared with 21.7 mboepd in 2015), due to a decrease in asphalt and aromatic solvents sales by Ecopetrol S.A. and a decrease in Propilco’s sales.
The reserves auditreporting process was conducted in accordance with SEC definitions and rules set forth in Rule 4-10(a) of Regulation S-X and the disclosure guidelines contained in the SEC’s Modernization of Oil and Gas Reporting final rule dated December 31, 2008 and effective as of January 1, 2010.
The estimated reserve amounts presented in this report, as of December 31, 2016,2018, are based on the average prices during the 12-month period prior to the ending date of the period covered in this report, determined as the unweighted arithmetic averages of the prices in effect on the first day of the month for each month within such period, unless prices were defined by contractual arrangements, as required by the SEC regulations.
Our crude oil and natural gas net proved reserves include reserves from our subsidiaries located in the United States (Gulf of Mexico) and Peru, and Equion and Hocol’s assets in Colombia.
Estimated Net Proved Reserves
The following table sets forth our estimated net proved developed reserves of crude oil and gas by region for the years ended December 31, 2016, 20152018, 2017 and 2014.2016.
Table 25 – Net Proved Developed Reserves
| Net Proved Developed Reserves | Colombia | North America | South America excluding Colombia | Total | Colombia | North America | South America excluding Colombia | Total | ||||||||||||||||||||||||
| Net Proved Developed oil reserves in million barrels oil equivalent | ||||||||||||||||||||||||||||||||
| At December 31, 2014 | 967 | 2 | 10 | 979 | ||||||||||||||||||||||||||||
| At December 31, 2015 | 849 | 3 | 6 | 858 | ||||||||||||||||||||||||||||
| At December 31, 2016 | 710 | 6 | 7 | 723 | 710 | 6 | 7 | 723 | ||||||||||||||||||||||||
| At December 31, 2017 | 747 | 10 | 6 | 763 | ||||||||||||||||||||||||||||
| At December 31, 2018 | 814 | 13 | 5 | 832 | ||||||||||||||||||||||||||||
| Net Proved Developed NGL reserves in million barrels oil equivalent | ||||||||||||||||||||||||||||||||
| At December 31, 2014 | 62 | 0 | 1 | 63 | ||||||||||||||||||||||||||||
| At December 31, 2015 | 54 | 0 | 1 | 55 | ||||||||||||||||||||||||||||
| At December 31, 2016 | 55 | 0 | 1 | 56 | 55 | - | 1 | 56 | ||||||||||||||||||||||||
| At December 31, 2017 | 54.6 | - | 0.8 | 55.4 | ||||||||||||||||||||||||||||
| At December 31, 2018 | 50.5 | - | 0.6 | 51.1 | ||||||||||||||||||||||||||||
| Net Proved Developed gas reserves in billion standard cubic feet | ||||||||||||||||||||||||||||||||
| At December 31, 2014 | 3,260 | 14 | 9 | 3,284 | ||||||||||||||||||||||||||||
| At December 31, 2015 | 3,156 | 16 | 5 | 3,176 | ||||||||||||||||||||||||||||
| At December 31, 2016 | 3,114 | 9 | 8 | 3,131 | 3,114 | 9 | 8 | 3,131 | ||||||||||||||||||||||||
| At December 31, 2017 | 3,143 | 10 | 5 | 3,158 | ||||||||||||||||||||||||||||
| At December 31, 2018 | 2,865.5 | 10 | 7 | 2,882 | ||||||||||||||||||||||||||||
| Net Proved Developed oil, NGL and gas reserves in million barrels oil equivalent | ||||||||||||||||||||||||||||||||
| At December 31, 2014 | 1,602 | 5 | 12 | 1,618 | ||||||||||||||||||||||||||||
| At December 31, 2015 | 1,457 | 5 | 7 | 1,470 | ||||||||||||||||||||||||||||
| At December 31, 2016 | 1,311 | 8 | 10 | 1,329 | 1,311 | 8 | 10 | 1,329 | ||||||||||||||||||||||||
| At December 31, 2017 | 1,353 | 11 | 8 | 1,372 | ||||||||||||||||||||||||||||
| At December 31, 2018 | 1,368 | 14 | 7 | 1,389 | ||||||||||||||||||||||||||||
The conversion rate used is 5,700 standard cubic feet = 1 barrel of oil equivalent.
| 25 |
We are required, as are all oil companies undertaking exploratory and production activities in Colombia, to pay a percentage of our production to the Government as royalties. However, the ANH’s Resolution 877 of 2013, Resolution 351 of 2014 and Resolution 640 of 2014 require natural gas royalties to be paid in cash, which means that the determination of the property rights to the quantities of natural gas we produce is based on the total volume produced without deductions on account of royalties. The main producing gas fields are Guajira, Cusiana, Cupiagua, Pauto, Chuchupa, Gibraltar, Ballena and Ballena.
The Ministry of Mines and Energy is responsible for reviewing and approving the design of and tracks for crude oil pipelines in Colombia. The Ministry of Mines and Energy establishes transportation rates based on information provided by the service suppliers, with the tariffs based on the principle of cost recovery plus a reasonable rate of return.
In prior filings, Ecopetrol has used the tariffs set by the Ministry of Mines and Energy as transportation cost to be deducted from the crude benchmark price for the purpose of evaluating the economic production, economic life and reserves of Colombian assets.Mamey.
Ecopetrol S.A. owns 100% of Cenit, a subsidiary that operates in Colombia and is dedicated to the storage and transportation of hydrocarbons through pipelines. Cenit provides transportation services for the entire Ecopetrol Group and we fully consolidate Cenit into our consolidated results of operations. Therefore, the difference between the tariffs set by the Ministry of Mines and Energy and the real transportation costs (fixed and variable operating expenses) does not affect our consolidated income statement. Thus, in presenting our reserves information in thisthe 2016, 2017 and 2018 annual report,reports, we have used our real transportation costs, rather than the regular tariffs set by the Ministry of Mines and Energy.
The following table summarizes our proved oil, NGL and natural gas reserves, which includes 23416 million barrels of fuel oil, 327 billion standard cubic feet of fuel gas within our natural gas results and 671534 billion cubic feet of royalties, as of December 31, 2016.2018.
Table 26 – Proved Oil, NGL and Natural Gas Reserves
| Reserves Category | Oil (million barrels) | NGL (million barrels) | Natural Gas (bcf) | Total Oil and Gas (Mmboe) | Oil (million barrels) | NGL (million barrels) | Natural Gas (bcf) | Total Oil and Gas (Mmboe) | ||||||||||||||||||||||||
| PROVED DEVELOPED RESERVES | ||||||||||||||||||||||||||||||||
| Total (Colombia) | 710 | 55 | 3,114 | 1,311 | 814 | 50.5 | 2,866 | 1,368 | ||||||||||||||||||||||||
| International: | ||||||||||||||||||||||||||||||||
| North America | 6 | 0 | 9 | 8 | 13 | - | 10 | 14 | ||||||||||||||||||||||||
| South America | 7 | 1 | 8 | 10 | 5 | 0.5 | 7 | 7 | ||||||||||||||||||||||||
| TOTAL PROVED DEVELOPED RESERVES | 723 | 56 | 3,131 | 1,329 | 832 | 51 | 2,883 | 1,389 | ||||||||||||||||||||||||
| PROVED UNDEVELOPED RESERVES | ||||||||||||||||||||||||||||||||
| Total (Colombia) | 238 | 13 | 85 | 266 | 285 | 22 | 113 | 327 | ||||||||||||||||||||||||
| International: | ||||||||||||||||||||||||||||||||
| North America | 3 | 0 | 2 | 3 | 10 | - | 6 | 11 | ||||||||||||||||||||||||
| South America | 0 | 0 | 0 | 0 | - | - | - | - | ||||||||||||||||||||||||
| TOTAL PROVED UNDEVELOPED RESERVES | 241 | 13 | 87 | 269 | 295 | 22 | 119 | 338 | ||||||||||||||||||||||||
| TOTAL PROVED RESERVES | 964 | 69 | 3,218 | 1,598 | 1,127 | 73 | 3,002 | 1,727 | ||||||||||||||||||||||||
The conversion rate used is 5,700 standard cubic feet = 1 barrel of oil equivalent.
Reserves Replacement
The reserves replacement ratio is defined as the sum of additions and revisions of proved reserves divided by produced volumes in any given period. The following table presents the changes in reserves in each category relating to the reserve replacement ratio for the years 2016, 20152018, 2017 and 2014.2016.
Changes in Proved Reserves
Table 27 – Changes in Proved Reserves
| As of December 31, | As of December 31, | |||||||||||||||||||||||
| 2016 | 2015 | 2014 | 2018 | 2017 | 2016 | |||||||||||||||||||
| Consolidated Company (million barrels oil equivalent) | ||||||||||||||||||||||||
| Revisions of previous estimates | (54 | ) | (25 | ) | 270 | 120.5 | 174 | (54 | ) | |||||||||||||||
| Improved Recovery | 11 | 16 | 34 | 129.1 | 73 | 11 | ||||||||||||||||||
| Extensions and discoveries | 27 | 24 | 51 | 57.4 | 44 | 27 | ||||||||||||||||||
| Purchases | - | 4 | – | |||||||||||||||||||||
| Total reserves additions | (16 | ) | 16 | 355 | 307 | 295 | (16 | ) | ||||||||||||||||
| Production | (235 | ) | (251 | ) | (243 | ) | (239 | ) | (234 | ) | (235 | ) | ||||||||||||
| Net change in proved reserves | (251 | ) | (235 | ) | 112 | 68 | 61 | (251 | ) | |||||||||||||||
| 26 |
The reserves replacement ratio for 20162018 was (0.07)1.29 barrels compared to 0.061.26 barrels in 2015.2017. The average replacement ratio for the last three years was 0.48.0.83 barrels.
Table 28 – Reserves Replacement Ratio (including purchase and sales)
| As of December 31, | As of December 31, | |||||||||||||||||||||||
| 2016 | 2015 | 2014 | 2018 | 2017 | 2016 | |||||||||||||||||||
| Annual | (0.07 | ) | 0.06 | 1.46 | 1.29 | 1.26 | (0.07 | ) | ||||||||||||||||
| Three year average | 0.48 | 0.97 | 1.31 | 0.83 | 0.42 | 0.48 | ||||||||||||||||||
Revisions of Previous Estimates
In 2018, revisions increased reserves by 120 million boe, mainly as a result of:
| (i) | An increase of 87 million boe due to the continuous development of the Rubiales, Chichimene and Quifa fields, of which a 68 million boe increase in reserves is due to improved reservoir performance in the Rubiales field. |
| (ii) | An increase 14 million boe increase in reserves due to development activities in the Bonanza and Ocelote fields. |
| (iii) | The remaining 16%, or 19.8 million boe, increase in reserves was due to varying increases and decreases from other fields. |
Improved Recovery
In 2018, improved recovery increased reserves by 129 million boe. The additions were associated with new proved areas under water flooding in the Chichimene, Castilla, La Cira-Infantas, Apiay, Suria, Yarigui, Casabe and Dina Cretaceo fields 86 million boe increase. In addition, the new steam injection project at the Teca-Cocorná field accounted for a 19 million boe increase in reserves.
The remaining 19%, or 24 million boe, increase was due primarily to water injection reservoir responses at various fields.
Extensions and Discoveries
Extensions and discoveries during 2018 amounted to 57 million boe primarily due to extensions of proved acreage mainly from activities in new proved areas in the Rubiales, Castilla, Cupiagua, Pauto and Caño Sur fields, which accounted for 45 million boe and newly discovered fields and reservoirs accounted for 12 million boe. The remaining 9 million boe corresponds to smaller changes in several other fields.
Purchases
There were no purchases or acquisitions in 2018.
| 27 |
Revisions of Previous Estimates
In 2016, revisions reduced reserves by 54 million boe, mainly as a result of:
Improved Recovery
In 2016, improved recovery increased reserves by 11 million boe. The additions were associated with the continued development of water flood projects through existing wells, although additional drilling may be required to fully optimize the development configuration. The main additions were in La Cira-Infantas, Chichimene, Casabe and Yarigui fields, which collectively accounted for an 8 million boe increase.
Extensions and Discoveries
Extensions and discoveries during 2016 amounted to 27 million boe, which is comprised of 25 million boe of extensions of proved acreage and 2 million boe from newly discovered fields and reservoirs. The newly discovered fields in Colombia corresponded to the Bayonero and Oripaya fields, and new reservoirs were discovered in Coren, Corocora Sur and Cravo Este. The extensions of proved acreage resulted mainly from activities in new proved areas in the Castilla, Chichimene, Gibraltar, Pauto and Rubiales fields, which accounted for 20 million boe of the total of 25 million boe from extensions of proved acreage. The remaining 5 million boe corresponds to smaller changes in several other fields.
Development of reserves
As of December 31, 2016,2018, our total proved undeveloped oil and gas reserves amounted to 269338 million boe, 27%21% of which areis related to new drilling activities in the Rubiales field, 41% is related to development activities in the Castilla, Caño Sur, Chichimene, Quifa, Cupiagua and Yarigui fields and 22% of which is related to the drilling activities in Area Castilla and 25% to thenew development activities in Rubiales field.the Teca, Pauto, Bonanza and Ryberg fields. The Cupiagua, Palagua, Pauto, Quifa, and Yarigui fields collectively accounted for 27% of total proved undeveloped oil and gas reserves with the remaining 21%16% comes from activities at several other fields.
Our proved undeveloped reserves represent 17%20% of our total proved reserves.
The Ecopetrol’s year-end development plans are consistent with SEC guidelines for the development of proved undeveloped reserves within five years.
The following table reflects the developed and undeveloped proved reserves estimates through the past three fiscal years.
Table 29 – Developed and Undeveloped Proved Reserves
| Proved Reserves as of December 31, | Oil | NGL | Gas | Total | ||||||||||||
| Mmbls | Mmbls | Bcf | Mmboe | |||||||||||||
| 2016 proved reserves | ||||||||||||||||
| Developed | 723 | 56 | 3,131 | 1,329 | ||||||||||||
| Undeveloped | 241 | 13 | 87 | 269 | ||||||||||||
| 2015 proved reserves | ||||||||||||||||
| Developed | 858 | 55 | 3,176 | 1,470 | ||||||||||||
| Undeveloped | 308 | 18 | 303 | 379 | ||||||||||||
| 2014 proved reserves | ||||||||||||||||
| Developed | 979 | 63 | 3,284 | 1,618 | ||||||||||||
| Undeveloped | 405 | 18 | 245 | 466 | ||||||||||||
| Proved Reserves as of December 31, | Oil | NGL | Gas | Total | ||||||||||||
| Mmbls | Mmbls | Bcf | Mmboe | |||||||||||||
| 2018 proved reserves | ||||||||||||||||
| Developed | 832 | 51 | 2,882 | 1,389 | ||||||||||||
| Undeveloped | 295 | 23 | 119 | 338 | ||||||||||||
| 2017 proved reserves | ||||||||||||||||
| Developed | 763 | 55 | 3,158 | 1,372 | ||||||||||||
| Undeveloped | 251 | 19 | 96 | 287 | ||||||||||||
| 2016 proved reserves | ||||||||||||||||
| Developed | 723 | 56 | 3,131 | 1,329 | ||||||||||||
| Undeveloped | 241 | 13 | 87 | 269 | ||||||||||||
Of the total amount of proved undeveloped reserves that Ecopetrol had at the end of 2015 (3792017 (287 million boe), we converted approximately 6884 million boe, or 18%29%, to provedproven developed reserves during 2016,2018.
Approximately 69% of the total conversion is primarily associated with the development of crude oil and gas projects in the Castilla, Pauto, Mamey, BongaRubiales and Gunflint fields. These projects accounted for approximately 84% of the total conversionChichimene fields (58 million boe), while the remaining 16%31% is associated with development execution in other fields such as the QuifaOcelote, La Cira Infantas, Caño Sur and RubialesK2 fields, among others. The amount of investments made during 20162018 to convert proved undeveloped reserves to proved developed reserves was US$709841 million.
Changes in Undeveloped Proved Reserves
The following table reflects the main changes in undeveloped proved reserves during 2016.2018.
Table 30 – Changes in Undeveloped Proved Reserves in 20162018
| Consolidated Companies | ||||
| Revisions of previous estimates | ||||
| Improved recovery | ||||
| Extensions and discoveries | ||||
| Proved Undeveloped converted to Proved Developed | ( | ) | ||
| Net change in unproved reserves | ||||
The conversion rate used is 5,700 standard cubic feet = 1 barrel of oil equivalent.
Reserve Estimation Process
Ecopetrol’s reserves process is supervised and coordinated by the Corporate Reserves Director,Manager, a highly experienced geologist and engineer, who reports to the Upstream Chief Financial Officer. The Ecopetrol reserves audit group is comprised of reserves coordinators who are geologist and petroleum engineers, each with more than 10ten years of experience in reservoir characterization, field development, estimation and reporting of reserves and who have supervisionsupport and supporting responsibilities overinteract with the professionalsspecialists involved in the estimation and reporting process.
Reserves are first estimated internally, supervised and coordinated by the Corporate Manager of Reservoirs, a geologist who holds a Master’s degreeprocess, following an established procedure with its corresponding internal controls. As in geology and has more than 20previous years, of experience in projects associated with reservoir characterization and development, estimation, and reporting of reserves. The employees involved in the reserves process meetare estimated and certified by recognized external independent engineers (this year consisting of Ryder Scott Company, Gaffney, Cline & Associates, Sproule International Limited and DeGolyer and MacNaughton) in compliance with the definitions of the Society of Petroleum Engineers qualifications for reserves estimators. Internally estimated reserves are submitted to an external audit process, which was conducted byand the external engineers (Ryder Scott and DeGolyer and MacNaughton).applicable SEC rules. According to our corporate policy, we report the reserves values obtained from the external engineers, even if they are lower than our internal estimatedexpected reserves.
| 28 |
The reserves estimation process ends when the Corporate Reserves DirectorManager consolidates the results and together, with the Development Vice-President and the Upstream Chief Financial Officer, presents themthe outcome to the Reserves Committee, which is composed ofcomprises the Chief Financial OfficerCEO, the Ecopetrol’s Group’s CFO and the Vice-President of Development and Production. Results are later presented to the Audit and Risk Committee of the Board of Directors and finally approved by the Board of Directors.
Petroleum engineering consultants Ryder Scott Company, Gaffney, Cline & Associates, Sproule International Limited and DeGolyer and MacNaughton have estimated and Ryder Scott have auditedcertified Ecopetrol’s proved reserves as of December 31, 2016.2018. These external engineers auditedestimated 99% of our estimated net proved reserves. The reserves reports of the external engineers are included as exhibits to this annual report. The external engineers DeGolyer and MacNaughton and Ryder Scott audited 99% of our estimated net proved reserves for the year ended December 31, 2015 and 2014.
EcopetrolEcopetrol’s reserves process uses deterministic methods thatwhich are commonly used internationally to estimate reserves. These methods have some uncertainty with respect to degradation, and thus, the estimates should not be interpreted as being exact amounts. However, the technology used to estimate reserves is considered reliable. The majority of the producing proved reserves were estimated by applying appropriate decline curves or other performance relationships. In analyzing decline curves, reserves were estimated by calculating economic limits that are based on current economic conditions. In certain cases, where the methods previously employed could not be used, reserves were estimated by analogy with similar reserves for which more complete data was available.
Estimates of reserves were prepared by geological and engineering standard methods commonly used in the oil and gas industry. The method or combination of methods used in the analysis of each reserve was adopted from experience analogy reserves, including information on the stage of development, quality and completeness of basic data and production history.
The following table reflects the estimated proved reserves of oil and gas as of December 31, 20142016 through 2016,2018, and the changes therein.
Table 31 – Estimated Proved Reserves of Oil and Gas
| Consolidated companies | Colombia | North America | South America excluding Colombia | Total | Colombia | North America | South America excluding Colombia | Total | ||||||||||||||||||||||||
| Net proved oil, NGL and gas reserves in Mmboe | Net proved oil, NGL and gas reserves in Mmboe | |||||||||||||||||||||||||||||||
| At December 31, 2016 | 1,577 | 11 | 10 | 1,598 | ||||||||||||||||||||||||||||
| Revisions | 264.7 | 1.7 | 4.0 | 270.4 | 170 | 4.6 | (0.3 | ) | 174.3 | |||||||||||||||||||||||
| Purchase of Minerals | 0.0 | 0.0 | 0.0 | 0.0 | ||||||||||||||||||||||||||||
| Improved Recovery | 34.1 | 0.0 | 0.0 | 34.1 | 73 | - | - | 73 | ||||||||||||||||||||||||
| Extensions and discoveries | 50.1 | 0.8 | 0.0 | 50.9 | 44 | - | - | 44 | ||||||||||||||||||||||||
| Sales | 0.0 | 0.0 | 0.0 | 0.0 | ||||||||||||||||||||||||||||
| Purchases | - | 4 | - | 4 | ||||||||||||||||||||||||||||
| Production | (239.6 | ) | (1.5 | ) | (2.0 | ) | (243 | ) | (229 | ) | (3.6 | ) | (1.5 | ) | (234.1 | ) | ||||||||||||||||
| At December 31, 2014 | 2,043 | 18 | 23 | 2,084 | ||||||||||||||||||||||||||||
| Revisions | (14.8 | ) | (2.8 | ) | (7.1 | ) | (24.7 | ) | ||||||||||||||||||||||||
| Purchase of Minerals | 0.0 | 0.0 | 0.0 | 0.0 | ||||||||||||||||||||||||||||
| Improved Recovery | 15.8 | 0.0 | 0.0 | 15.8 | ||||||||||||||||||||||||||||
| Extensions and discoveries | 24.4 | 0.0 | 0.0 | 24.4 | ||||||||||||||||||||||||||||
| Sales | 0.0 | 0.0 | 0.0 | 0.0 | ||||||||||||||||||||||||||||
| Production | (247.5 | ) | (1.4 | ) | (1.8 | ) | (250.7 | ) | ||||||||||||||||||||||||
| At December 31, 2015 | 1,821 | 14 | 14 | 1,849 | ||||||||||||||||||||||||||||
| At December 31, 2017 | 1,635 | 16 | 8.2 | 1,659.2 | ||||||||||||||||||||||||||||
| Revisions | (51 | ) | (0.7 | ) | (2.5 | ) | (54 | ) | 114 | 5.8 | 1 | 120.8 | ||||||||||||||||||||
| Improved Recovery | 11 | 0 | 0 | 11 | 129 | - | - | 129 | ||||||||||||||||||||||||
| Extensions and discoveries | 27 | 0 | 0 | 27 | 50 | 7 | - | 57 | ||||||||||||||||||||||||
| Production | (231 | ) | (2.3 | ) | (1.7 | ) | (235 | ) | (233 | ) | (3.8 | ) | (2 | ) | (238.8 | ) | ||||||||||||||||
| At December 31, 2016 | 1,577 | 11 | 10 | 1,598 | ||||||||||||||||||||||||||||
| At December 31, 2018 | 1,695 | 25 | 7.2 | 1,727.2 | ||||||||||||||||||||||||||||
For more information regarding the potential impacts of oil prices on our reserve estimates, see the sectionsFinancial Review—Trend Analysis and Sensitivity Analysis andRisk Review—Risk Factors.
3.4.4 Joint Venture and Other Contractual Arrangements
We conduct our exploration and production business through a variety of types of contractual arrangements with the Colombian government or with third parties. Below is a general description of each type of contractual arrangement to which we were a party as of December 31, 2016:2018:
Association Contract
CreatedThe purpose of this type of contract, created by the Decree 2310 of 1974, the purpose of this contract is the exploration of the areas covered by the contract, and the exploitation of hydrocarbons found in that area. This type of contract, together with E&P contracts and Special Contracts (Casabe, La Cira and La Cira)Teca-Cocorná fields) which are described below, are the most significant in terms of our production and proved reserves.
Under association contracts, the exploratory risk is assumed entirely by Ecopetrol S.A.’s contractual partner, the associate. If there is a discovery and Ecopetrol S.A. agrees that the relevant field is commercially viable, Ecopetrol S.A. will participate in the field’s development. A joint account will be created, and Ecopetrol S.A. and the partner will participate in the expenses and investments in the proportions established in the corresponding contract. Ecopetrol S.A. will reimburse the direct exploratory expenses incurred by the contractual partner in the proportions established by the contract.
If Ecopetrol S.A. does not believe that the relevant field is commercially viable, the partner has the right to execute on its own all activities considered necessary for the field’s exploitation as a “sole risk operation”,operation,” and to be reimbursed for a defined percentage of all investments for such sole risk operation in accordance with the corresponding contract.
Every association contract provides for an executive committee that makes all technical, financial and operational decisions if Ecopetrol S.A. has agreed that a field is economically viable. All major decisions of this committee must be made unanimously by the parties.
The maximum term of an association contract is 28 years. The first six years of the contract are for the exploratory phase, and are extendible for 1 or 2 more years at the partner’s request. The remaining time is for the exploitation phase.
Incremental Production Contract
We enter into incremental production contracts to obtain incrementaladditional hydrocarbon production beyond a base production curve that is established based on the proven reserves of a specific field or well. Under this type of arrangement, Ecopetrol S.A. owns 100% of the hydrocarbons defined by the base production curve. The incremental production (i.e.(i.e., the hydrocarbon volume obtained beyond the basic production as a result of investment activities), will be owned by the parties to such incremental production contract in the proportions established by such contract.
The initial phase of an incremental production contract has a term of up to 3 years, in which the contractual partner executes an initial work program approved by Ecopetrol S.A. in order to gain the right (but not the obligation) to continue with the second phase. If Ecopetrol’s partner decides to continue with the project for the second phase (the complementary phase), it must inform Ecopetrol S.A. in writing no later than 90 days prior to the termination date of the initial phase and deliver a proposed development plan for each covered field. The second phase is the production phase and has a maximum term of 22 years minus the length of the initial phase.
Incremental production contracts provide for an executive committee that is responsible for taking all decisions in order to approve, control and supervise all operations that take place during the duration of the contract. These contracts also provide for a steering committee, which is responsible for the supervision of the execution of the work programs, the annual budget and other items.
| 30 |
Risk Production Contract for Discovered Undeveloped and Inactive Fields (First Round 2003)
We have entered into risk production contracts for discovered undeveloped fields to promote exploration by private companies of both undeveloped and inactive fields. Under these contracts, the contracting party assumes all costs and expenses for the development and operation of a field in exchange for a percentage interest in the fields’field’s production as specified in the contract. This type of contract has a ten-year term calculated as from its date of execution;execution: one year for the evaluation period and a maximum of nine years for the development period. Some of these contracts have subsequently been extended beyond their original term.
Operation for Risk Production Contracts for Discovered Undeveloped and Inactive Fields (Second Round 2005)
The contracts awarded in the second round of undeveloped and inactive discovered fields are service contracts wherein services rendered are payable with a percentage of the production. Ecopetrol S.A. keeps all rights to explore and exploit hydrocarbons found in the area.
These contracts have a 10 year term, including an evaluation period of 8 months, within which the operator has to comply with a minimum commitment to conduct a technical evaluation of the field at its own risk.
The facilities built during the term of the contract, other than facilities associated with drilled wells, will be owned by the operator, who will remain responsible for them, even after contract ends. Only drilled wells become property of Ecopetrol S.A. upon the contract’s termination.
Risk Participation Contract
The purpose of this contract is the exploration of the contracted area, and the exploitation of the oil found in the contracted area. Unlike in the association contract, Ecopetrol S.A. shares exploratory risks and costs with the contractual partner, the associate, together with the oil produced, in the proportions established by the contract.
Risk participation contracts provide for an executive committee which is created upon the execution of the contract.
These contracts have a 28 year term, including an exploratory period of six years (which period is extendible under certain contracts for one or two years), after which the exploitation period commences.
Special Contracts
We are party to a Joint Venture Contract for Exploration and Exploitation of “La Cira-Infantas” Area, “Teca Cocorná” Area; and a Services and Technical Collaboration Contract for the “Casabe” field.
Joint Venture Contracts for Exploration and Exploitation of “La Cira-Infantas” Area and of “Teca-Cocorná” Area
These contracts between Ecopetrol S.A. and Occidental Andina LLC, executed on September 6, 2005 and June 24, 2014, respectively, have as their purpose, a joint collaboration between the parties with the goal of increasing the economic value of the La Cira-Infantas field and the Teca-Corcorná field by means of hydrocarbon exploration and production activities, including, among others, an incremental production project to improve the recovery factor, process optimization and exploratory activities.
Ecopetrol S.A. partially assigned its exploratory and production rights in the Contracted Areas to Occidental Andina LLC. Ecopetrol S.A. provides financial resources and the preferential rights of use for the existing infrastructure in that zone and Occidental Andina LLC provides financial resources and the technical and operative experience in mature fields redevelopment projects and enhanced recovery technologies.
Ecopetrol S.A. is the operator under both Joint Venture Contracts, and on behalf of the parties is responsible for the conduction, execution and control, directly or via contractors, of the operational activities.
The La Cira-Infantas contract’s term is divided in three phases. The first phase lasts 180 days, the second 730 days and the third up to the economical limit.
The incremental production, after deduction of the royalties, is owned 52% by Ecopetrol S.A. and 48% by Occidental Andina LLC. These same percentages apply to the participation in the operational and direct expenses. Adjustments to the participations for the benefit of Ecopetrol S.A. will occur if there are high production levels or high prices.
The Teca-Cocorná contract’s term is divided in two phases. The first phase lasts three years, extendable for up to an additional year, the second 20 years counted as from the initiation for the second phase and will be reduced by the term of any extensions of the first phase.
The basic production is 100% owned by Ecopetrol S.A. The incremental production, after deduction of the royalties, is owned 60% by Ecopetrol S.A. and 40% by Occidental Andina LLC. These same percentages apply to the participation in the operational and direct expenses. Adjustments to the participations for the benefit of Ecopetrol S.A. will occur if there are high production levels and high prices.
Services and Technical Collaboration Contract “Casabe”
The purpose of the contract executed between Ecopetrol S.A. and Schlumberger Surenco S.A. on April 26, 2004, is the evaluation, design and execution of work programs specifically with the purpose of increasing the value in the Casabe field by means of development ofhydrocarbon exploration and production activities to obtain incremental production, application of new technologies, application of techniques for deposits management and operational costs reduction. Ecopetrol S.A. is the operator and Schlumberger Surenco S.A. keeps the right of first option regarding the activities to be executed in the area of interest.
Both parties can invest in all the activities seeking to evaluate, obtain and incorporate incremental value in the area of interest. Such activities are developed directly by the parties or via contractors (Ecopetrol) or subcontractors (Schlumberger). Amounts expended pursuant to the contract are reimbursed depending on the incremental value (monthly valuation in US$ of the results obtained from the execution of the work programs) created through the contract and the activities executed thereunder.
| 31 |
Both Ecopetrol S.A. and Schlumberger Surenco S.A. commit to assume full responsibility for damages and/or losses suffered by their respective personnel and goods in development of the contract, regardless of the cause. The maximum authority is the Management Committee.
The contract had an initial term of 10 years, and was amended several times to include an additional term of six years for which a new business was structured.
The National Hydrocarbons Agency (ANH) and its Contracts
The National Hydrocarbon Agency (“ANH”) was created by Decree Law 1760 of 2003 and was given the authority to administer all national hydrocarbon reserves under contracts executed beginning on January 1, 2004 (Decree2004. Decree Law 1760 of 2003 states, “The Empresa Colombiana de Petróleos, Ecopetrol, is split, its organic structure is modified, and the Agencia Nacional de Hidrocarburos and the Sociedad Promotora de Energía de Colombia S.A. are created”).created.” Prior to January 1, 2004, Ecopetrol S.A. had the authority to contract with third parties for the exploration and production of new areas.
The creation of the ANH did not modify the rights or obligations of Ecopetrol or other parties with respect to contracts in existence atbefore January 1, 2004 when the time when ANH was created and therefore Ecopetrol retains the authority to execute agreements with respect to all areas that it held as of January 1, 2004 when the ANH was created.prior to that date.
Below, we include a brief description of each type of contract that we have entered into with the ANH:
Technical Evaluation Agreement
This type of contract grants to the contractor the right to develop technical evaluation operations with operational autonomy at its own cost and risk, seeking to appraise the hydrocarbon potential, with the purpose of identifying the zones of prospective interest in the area by means of the execution of an exploratory program. The contractor has the option to request the conversion of a technical evaluation agreement (“Technical Evaluation Agreement” or “TEA”) into one or more E&P Contracts that cover the area of the TEA (or a portion thereof).
The contractor can conduct evaluation activities for terms that vary between 18, 24 and 36 months, depending on the terms of reference of the ANH’s bidding round.
E&P Contract
The ANH enters into concession contracts pursuant to which the Nation grants exploration and production rights, and receives royalties and taxes. In turn, the contractor provides 100% of the investment and expenses resources, and receives 100% of the production after royalties and taxes. The ANH has named this contract an “Exploration and Production Contract” (E&P Contract).
Pursuant to the first stage of this contractual model, the ANH only receivedreceives a percentage of oil revenues in two cases: (i) when the international oil prices rose beyond a specified price, above which the ANH has a right to participate in a share of the increased revenues generated, or (ii) in the case of recognition of production rights in an extended contractual phase.
| (i) | when the international oil prices rise beyond a specified price, above which the ANH has a right to participate in a share of the increased revenues generated, or |
| (ii) | in the case of recognition of production rights in an extended contractual phase. |
Under all E&P contracts executed since ANH’s 2008 bidding round, the ANH receives a percentage of the production from the beginning of the contract, upon the commencement of the production phase, and not only in the extension phase of the contract as mentioned in the previous paragraph, inparagraph. In addition, toANH has economic rights when the price of oil exceeds a reference price set in the contract (high price fee) and the superficiary canon.
E&P contracts have two phases: (i) an exploration period, which term is 6 years counted from the effective date, renewable for two additional years, and (ii) a production period, which is, with respect to each production field, 24 years plus any extensions, which are counted from the date of declaration of commerciality of the corresponding field. The above-mentionedabovementioned terms have been modified during ANH’s 2014 bidding round for unconventional and offshore reservoirs to an exploration period of nine years and a 30 years30-year production period.
| 32 |
ANH and Ecopetrol Agreements (Convenios)
At the time of termination or extension of any association contract (executedexecuted by Ecopetrol S.A. before December 31, 2003),2003, the rights over the production area and over the movable and immovable assets therein will continue to belong to Ecopetrol S.A.
Pursuant to article 2 of Decree 2288 of 2004, which regulates Decree Law 1760 of 2003, Ecopetrol S.A. must execute an agreement with the ANH to regulate the exploration and exploitation terms and conditions of the relevant area, which was previously subject to an association contract.
Decree 2288 of 2004 also established that Ecopetrol S.A. would have to execute agreements with ANH covering fields directly operated by Ecopetrol S.A. Under these agreements ANH recognizes the exclusive right of Ecopetrol S.A. to explore and exploit the hydrocarbons property of the Nation that are obtained in the areas they cover, until resource depletion or until Ecopetrol S.A. returns the area to the Nation through the ANH.
These agreements also provide the conditions under which Ecopetrol S.A. is able to assign, partially or completely, its rights and duties thereunder to third parties.
3.5 Transportation and Logistics
3.5.1 Transportation Activities
The transportation and logistics segment includes the transportation of crude oil, motor fuels, fuel oil and other refined products including diesel, jet and biofuels. We conduct most of these activities through our wholly-ownedwholly owned subsidiary Cenit and its subsidiaries.
The map below shows the locations of the main transportation networks owned by our business partners and us.
| 33 |
Graph 5 – Map of Oil Pipelines


Graph 6 – Map of Multipurpose Pipeline
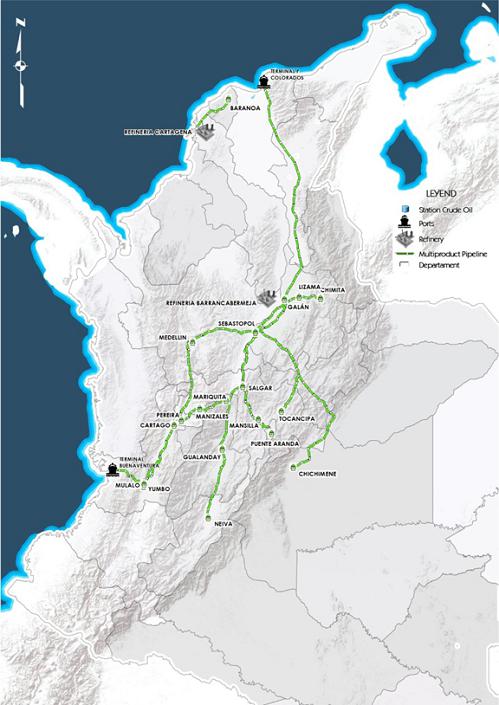

| 35 |
The table below sets forth the volumes of crude oil and refined products transported through the crude oil pipelines and multipurpose pipelines owned by us.
Table 32 – Volumes of Crude Oil and Refined Products Transported
| For the year ended December 31, | For the year ended December 31, | |||||||||||||||||||||||
| 2016 | 2015 | 2014 | 2018 | 2017 | 2016 | |||||||||||||||||||
| (thousand bpd) | (thousand bpd) | |||||||||||||||||||||||
| Crude oil transport(1) | 867 | 978 | 954 | 836.2 | 823.3 | 864.7 | ||||||||||||||||||
| Refined products transport(2) | 263 | 254 | 251 | 273.4 | 268.2 | 262.4 | ||||||||||||||||||
| Total | 1,130 | 1,232 | 1,205 | 1,109.6 | 1,091.5 | 1,127.1 | ||||||||||||||||||
| (1) | The crude oil transported volumes correspond to the following systems: Ocensa Segment 3, ODC, Vasconia-Galan, Ayacucho-Galan, Ayacucho-Coveñas and Trasandino Pipeline. |
| (2) | The pipelines transporting refined products include the following: Galan-Sebastopol, Galan-Salgar, Galan-Bucaramanga, Buenaventura-Yumbo and Cartagena-Baranoa. |
The volume of crude oil transported by Cenit´sCenit’s main systems and those of affiliates decreasedincreased in 20162018 by 11%1.6% compared to the previous year. This decreaseincrease was mainly the result of lower production volumes in Colombia and impacted mosta higher volume of ourCastilla Norte crude oil pipelines.coming from the Barrancabermeja refinery through the Ayacucho-Coveñas 16”/24” systems. Additionally, we experienced an increase in the volume of Castilla crude oil transported through the Llanos node, which increased the proportion of that crude oil in the systems that reach Coveñas. Of the total volume of crude transported by oil pipeline, approximately 68%75.7% belonged to Ecopetrol’s corporate group.
The volume of refined products transported by Cenit increased by 4%1.9% in 20162018 mainly due to a higher volumegrowth of products transported through the Galan – Sebastopol system to fulfill the demand in the central region.local fuel demand. Of the total volume of refined products transported in multi-purpose pipelines during the year, 20%33% belonged to Ecopetrol’s corporate group.
Transportation Capacity
During 2016,2018, due to the calculation of our service factor (which determines the transportation capacity that can be offered), we increaseddecreased the capacity of our primary and secondary oil and product pipelines and loading facilities duefacilities. Our service factor is calculated on a monthly basis and may vary from time to the reversiontime, as it considers operative and technical effects (whether scheduled or unscheduled) within a certain period of the Ayacucho-Galan 14” system. Meanwhile, our main expansion projects are under way with our main focus being to perform the adjustments to our infrastructure to allow the transportation of heavier crude oil.time. Our main crude oil pipeline systems’ operating capacity increaseddecreased from 1,336,0001,500,000 bpd in 20152017 to 1,369,0001,497,000 bpd in 2016.
2018. Our main refined products pipeline transportation capacity decreased from 529518.6 thousand bpd in 20152017 to 515510 thousand bpd in 2016. This decrease in capacity was primarily the result of a reduction in the utilization of drag reducer agent (DRA) in our Galan – Sebastopol 12” system and the transportation of three refined products (naphtha, gasoline and diesel) in our Pozos Colorados – Galan system instead of the two refined products (naphtha and diesel) transported in 2015.2018.
References to our crude oil transportation capacity in this annual report refer to the capacity of the pipelines that belong to Cenit and its subsidiaries to transport crude oil volumes either to the Barrancabermeja Refineryrefineries or to our export facilities. In addition, we have other feeder systems that transport oil volumes from producing facilities or other pumping stations to these main pipelines. References to our refined products transportation capacity refer to the capacity of our Galan-Sebastopol, Galan-Bucaramanga, Cartagena-Baranoa, Pozos Colorados-Galanpipelines that begin in the Galan station (Barrancabermeja refinery) and Buenaventura-Yumbo systems.Cartagena station (Cartagena Refinery).
As of December 31, 2016,2018, we, directly or indirectly with private partners, own, operate and maintain an extensive network of crude oil and refined products pipelines. These pipelines connect our own and third-party production centers, import facilities and terminals to refineries, major distribution points and export facilities in Colombia. Cenit directly owns 49%45% of the total crude oil pipeline shipping capacity in Colombia. When aggregated with the crude oil pipelines in which Cenit owns an interest, Cenit owns 81%82% of the oil pipeline shipping capacity in Colombia. By December 31, 2016,2018, our network of crude oil and multipurpose pipelines was approximately 8,8609,071 kilometers in length. The transportation network consists of approximately 5,1465,362 kilometers of main crude terminals and oil pipeline networks connecting various fields to the Barrancabermeja Refineryrefinery and Reficar, as well as to our export facilities. We also own 3,7143,709 kilometers of multipurpose pipelines for transportation of refined products from the Barrancabermeja Refineryrefinery and from Reficar to major distribution points. Out of the 5,1465,362 kilometers of crude oil pipelines, owned by us, 2,9853,150 kilometers of crude oil pipeline are wholly owned, and 2,1612,212 kilometers of crude oil pipeline are owned through non-wholly owned subsidiaries.
The following table sets forth our main pipelines in which we own an indirect interest as of December 31, 2016.2018.
Table 33 – Our Main Pipelines
| Pipeline | Kilometers | Capacity (mbd) | Product Transported | Origin | Destination | Indirect Ownership Percentage | Kilometers | Capacity (mbd) | Product Transported | Origin | Destination | Indirect Ownership Percentage | ||||||||||||||||||||||||
| Caño Limón-Coveñas | 771 | 250 | Crude Oil | Caño Limón | Coveñas | 100.00 | % | 771 | 250 | Crude Oil | Caño Limón | Coveñas | 100.00 | % | ||||||||||||||||||||||
| Oleoducto de Alto Magdalena (OAM) | 391 | 110 | Crude Oil | Tenay | Vasconia | 87.29 | % | 391 | 110 | Crude Oil | Tenay | Vasconia | 95.8 | % | ||||||||||||||||||||||
| Oleoducto de Colombia (ODC) | 483 | 236 | Crude Oil | Vasconia | Coveñas | 73.00 | % | 483 | 236 | Crude Oil | Vasconia | Coveñas | 73.00 | % | ||||||||||||||||||||||
| Oleoducto Central –Ocensa (*Segment 2) | 836 | 616 | * | Crude Oil | Cupiagua | Coveñas | 72.65 | % | ||||||||||||||||||||||||||||
| Oleoducto Central –Ocensa(1) | 848 | 745 | Crude Oil | Cupiagua | Coveñas | 72.65 | % | |||||||||||||||||||||||||||||
| Oleoducto de los Llanos (ODL) | 260 | 340 | Crude Oil | East fields | Monterrey Cusiana | 65.00 | % | 260 | 314 | (2) | Crude Oil | East fields | Monterrey Cusiana | 65.00 | % | |||||||||||||||||||||
| Oleoducto Bicentenario de Colombia | 230 | 110 | (1) | Crude Oil | Araguaney | Banadia | 55.97 | % | 230 | 110 | (3) | Crude Oil | Araguaney | Banadia | 55.97 | % | ||||||||||||||||||||
| (1) | Ocensa has four segments with different capacities. 745 mbd refers to the capacity of segment two (El Porvenir-Vasconia). The capacity of the other segments are as follows: |
| Cupiagua-Cusiana (segment zero): 198 mbd |
| b. | Cusiana-El Porvenir (segment one): 745 mbd |
| c. | Vasconia-Coveñas (segment three): 550 mbd |
| (2) | Transportation capacity for this pipeline is measured by using crude oil viscosity of 690 cStk (30° C). |
| (3) | Represents the contractual crude oil transportation capacity for the pipeline currently in operation. |
As of December 31, 20162018 we owned 6873 stations, 3439 located in crude oil pipelines, 30 in refined products pipelines, 2 in crude oil ports and 2 in refined product ports.
As of December 31, 2016,2018, we had a nominal storage capacity associated with the transportation network of 1617.7 million barrels of crude oil and 44.9 million barrels of refined products. We do not own any tankers.
The Transportation and Logistics segment has a maintenance operating model with the aim of unifying criteria for planning and execution among the companies of the segment.
Pipeline Projects SAN FERNANDO
San Fernando – MONTERREYMonterrey
The San Fernando – the Monterrey project’s initial objectives includeincluded ensuring the ability to transport 300,000 bpd at 300 cSt of diluted crude oil from the Chichimene and Castilla fields to the Monterrey pumping station and the transportation of 45,000 bpd of diluent (naphtha) between the Apiay station and the Castilla and Chichimene fields.
The scope of the project includes the construction of a new 30” 171 km119-km crude oil pipeline, a receipt,new pumping station to include reception, storage and pumping station, anddilution facilities, the reversion/conversion of the existing pipeline of 16”10” between the Castilla II plant and the Apiay station, and the construction of a new 10” pipeline between Chichimene and San Fernando fields in order to transport diluent (naphtha) from the Apiay station to the Castilla IISan Fernando plant.
AsIn 2018, the project completed the maximum pumping test, in accordance with the operational system parameter and owner’s requirements; as a result, of the evaluations we made and due to the reduction in production forecasts, the scopemain functional services of the project was modifiedwere validated. The construction, startup phase and the transportation capacity was reduced from 390,000 bpdcommissioning of all systems were completed in January 2018. The system is able to 300,000 bpd fromtransport crude oil at 750 cSt between the San Fernando station to the Monterrey station.
During 2016 progress was achieved on construction of the San Fernando station, especially with regards to the assembly of the pumping system units. We completed the construction of the lines between San Fernando and Apiay and the branch lines between San Fernando and the Castilla and Chichimene stations. By the end of the first quarter of 2017 the filling of tanks and lines and the testing of main pumping units had been completed.
OCENSA (P135)Oleoducto al Pacifico SAS
Given the uncertainties around the future results of the exploration and production activities in Colombia and the current expected return of the investment, in December 2017 the parties engaged in the Oleoducto al Pacifico suspended the project. Based on our current view, this decision has had no impact on the oil industry in Colombia and can be reconsidered in the event the transportation system may be necessary.
Replacement of El Porvenir Station Pumping Units
During 2018, Ocensa began to replace five pumping units with internal combustion engines with electrical energy engines. The OCENSA P135 project’s main objectivegoal of this project is to increasereduce the pipeline transportation capacity by 135,000 bpd. The project involves improvinglevel of greenhouse gas emissions and noise pollution, thereby having a positive effect on the pumping systemenvironment and increasing the storage capacity. The main project activities were completed at the end of December 2016potentially reduce operation and the shippers were notified of such completion by Ocensa. Before commencing operations, Ocensa is expecting the ruling required by the Colombian Ministry of Mines and Energy.maintenance costs.
OLEODUCTO AL PACIFICO SAS
Cenit is participating in the Oleoducto al Pacífico SAS, led by Enbridge, which intends to transport heavy crude oil to the Colombian Pacific coast. In 2015, the scopeAdaptation of work was focused on reviewing the business case for the development of the project, conducting advance prior consultations with communities along the rights of way, negotiating project governance matters and reviewing regulatory, commercial and technical issues.
Due to the environment of the oil industry and uncertainty about future volume of oil production in Colombia, the project continuity is under review and it was put on hold.
TRANSPORTATION OF HIGHER VISCOSITY CRUDES
In 2016 crude was transported at viscosities greater than 405 cSt on the principal systems, particularly at Ocensa, where since the last quarter of 2016 there has been the ability to transport crudes at viscosities of up to 600 cSt.
Adaptations were also made to one of the single buoy moorings of the Coveñas terminal to permit the importation of naphtha for dilution at this terminal. Integral capacity tests are scheduled to be executed in 2017 for the transport of crude with this viscosity, and transport is expected to begin in the second quarter of 2017.Cusiana Truck Unloading Facility
The main modifications are on:Cusiana truck unloading facilities enables exploration and production companies in blocks or areas not connected to the ODL pipeline (Oleoducto de los Llanos; Rubiales – Cusiana), onnetwork to access Ocensa Segment 1 (Cusiana – Porvenir), Segments 2 & 3 (El Porvenir – Vasconia – Coveñas) and on the Oleoducto de Colombia Pipeline (ODC – Oleoducto de Colombia). This project, combined with the expansion of capacity on Ocensa (P-135), will make it possible to transport higher viscosity crudes.pipeline.
During 2018 Ocensa adapted its facilities to Colombia’s new crude oil quality basket and increased capacity up to 81 thousand bpd by means of the implementation of in-line dilution facilities. As a result, shippers can now unload heavy crudes and blend them with light crudes or refined diluents in order to maximize the value of the crude oil.
3.5.1.2 Export and Import Facilities
We currently have concessions granted by the NationColombian Government for four export/import docks for crude oil and refined products: Coveñas, Tumaco, Pozos Colorados and Cartagena. Our export capacity reached 1.24 million bpd for crude oil. Our import capacity of refined products and crude oil reached 0.180.19 million bpd.bpd and 0.25 million bpd, respectively.
Our crude oil loading facilities can load tankers of up to 350 thousand deadweight tonnage (DWT). Adjacent to these loading facilities we also have crude oil storage facilities that are capable of storing 911.6 million barrels. Our docks used for import and export of refined products can load tankers of 70 thousand DWT. Additionally, these facilities have storage capacity of up to 1.25.6 million barrels.
3.5.2 Other Transportation Facilities
We have entered into transportation agreements with tanker-trucktanker truck and barge companies in order to transport crude oil from locations that do not have pipeline connections to refineries and export facilities. The volume of refined products that cannot be transported inby pipelines or in tanker trucks because of capacity limitation is transported by barges. During 2016, 22.92018, 27.9 million barrels of crude oil and refined products were transported by tanker trucks, and 7.97.2 million barrels of crude oil and refined products were transported by barges, particularly using the Rio Magdalena River, connecting Barrancabermeja with Barranquilla and Cartagena.
3.5.3 Marketing of Transportation Services
Cenit and its subsidiaries’ main line of business is the crude oil pipeline transport (73%(75% of revenues), followed by the refined products pipeline transport (17%(16% of revenues) and ports and related services (8%(6% of revenues).
Transportation contracts of crude oil may take several forms: ship or pay (payment for the availability of a fixed capacity in the system), ship and pay (payment for volumes actually transported) or spot. The main users for the crude oil transportation business are Ecopetrol S.A., Frontera, Trafigura, Mansarovar, Metapetroleum Corp., Petrominerales, Occidental de Colombia, Mansarovar and Gran Tierra, who collectively represented 92%93% of this business segment’s revenues in 2016.2018. Transportation services for crude oil provided to Ecopetrol S.A. represented 60%57% of this business segment’s crude oil transport revenues.
Cenit also transports refined products. Its main client for this service is Ecopetrol S.A., which accounted for 41%40% of refined products pipeline transport revenues in 2016,2018, principally due to the transport of naphtha.naphtha, diesel and gasoline. Cenit also has 1514 other fuel wholesalers’ customers for whom it transports other refined products. The most significant of these customersamong them are Organizacion Terpel, ExxonMobil, Chevron Petroleum Company, Biocombustibles S.A.S. and Petrobras Colombia.Distribuidora Andina.
Deregulated businesses, such as ports and crude loadingcrude-loading facilities, represent a smaller portion of Cenit’s revenue (8%(6% in 2016)2018). Clients for these businesses include some of the same parties for which Cenit provides crude oil and refined products transportation services.
Developments with certain clients of Bicentenario and Cenit
Oleoducto Bicentenario de Colombia S.A.S.
During July 2018, the carriers Frontera Energy Colombia Corp. (“Frontera”), Canacol Energy Colombia S.A.S. (“Canacol”) and Vetra Exploración y Producción Colombia S.A.S. (“Vetra” and, together with Frontera and Canacol, the “Carriers”) sent letters to Oleoducto Bicentenario de Colombia S.A.S. (“Bicentenario”) alleging they were early termination rights under the Ship-or-Pay Transport Agreements entered by each of them and Bicentenario in 2012 (the “Transport Agreements”). Bicentenario has rejected the terms of the letters, noting that there is no option for early termination and reiterating to the Carriers that the Transport Agreements are current and therefore the Carriers must fullfill their obligations under the Transport Agreements in a timely fashion.
Under Bicentenario’s understanding that the Transport Agreements remain current and that the Carriers are in violation of their obligations under such agreements, Bicentenario declared the Carriers delinquent because of their failure to pay for transport service under the aforementioned agreements.
Consequently, Bicentenario executed the standby letters of credit posted as guarantee for the Transport Agreements. On October 19, 2018, Bicentenario notified Frontera of the existence of a “Dispute” pursuant to Clause 20 of the respective Transport Agreement and moved to the party dispute settlement stage as provided for in such clause. Such discussions ended without an agreement on December 19, 2018. On January 28,2019, Bicentenario filed an Arbitration Claim against Frontera in accordance with the arbitration clause of the Transportation Agreement to claim any compensation, indemnification or other restitution deriving from the alleged early termination of said agreements.
Similarly, on November 1, 2018, Bicentenario notified Vetra and Canacol of the existence of a “Dispute” pursuant to Clause 20 of the respective Transport Agreement and moved to the party dispute settlement stage as provided for in each such respective clause. Such discussions ended without agreement on March, 2019.
As of the date of these financial statements, Bicentenario continues evaluating its options under the Transport Agreements and the Shareholders Agreement (Acuerdo Marco de Inversión) in order to guarantee compliance and claim any compensation, indemnification or other restitution deriving from the alleged early termination of said agreements and any other contractual breaches by the Carriers.
Cenit Transporte y Logística de Hidrocarburos S.A.S.
During July 2018, the carriers Frontera, Vetra and Canacol (“carriers”) sent notifications to Cenit Transporte y Logística de Hidrocarburos SAS (“Cenit”) alleging they were exercising their early termination right under the Ship-or-Pay Crude Oil Transport Agreements (SoP agreements) entered among each of them and Cenit for the transportation of crude oil through the Caño Limón – Coveñas pipeline (owned by Cenit).
In response to the alleged termination of SoP Agreements, CENIT issued letters stating that the alleged event which would have given the carriers early termination rights had not occurred as provided for in Clause 13.3 and other clauses of the aforementioned SoP agreements. In the same letters, CENIT stated that it would continue invoicing and charging for the transport services as stipulated in the SoP agreements, since they remain in force, and therefore, Carriers must fulfill their contractual obligations.
In November, 2018, CENIT filed an arbitration demand against Frontera Energy Group pleadging that SoP Agreements are in full force and effect, that Frontera is obliged to comply its terms and conditions and, therefore, is obliged to pay transportation tariffs as agreed in the SoP agreements. In similar terms an arbitration demand was also filed against Vetra and the same will occur against Canacol.
3.6 Refining and Petrochemicals
Our main refineries are: (i)are the Barrancabermeja Refinery,refinery, which Ecopetrol S.A. directly owns and operates, and (ii) Reficar Refinery, locateda refinery in the free trade zoneFree Trade Zone in Cartagena which isowned by Reficar, a wholly owned subsidiary of Ecopetrol S.A. Ecopetrol S.A. also owns and operates two other minor refineries – Orito and Apiay, but these are considered part of the upstream segment since the majority of the products areproduction is for local on-site consumption.self-consumption.
TheseOur refineries produce a full range of refined products, including gasoline, diesel, jet fuel, liquefied petroleum gas (LPG),LPG and heavy fuel oils, among others.
The following table sets forth our average daily average installed and actual refinery capacity for each of the last three years:
Table 34 ––Average Daily Average Installed and Actual Refinery Capacity
| For the year ended December 31, | For the year ended December 31, | |||||||||||||||||||||||||||||||||||||||||||||||||||||||||||||||||||||||
| 2016 | 2015 | 2014 | 2018 | 2017 | 2016 | |||||||||||||||||||||||||||||||||||||||||||||||||||||||||||||||||||
| Capacity | Through- put | % Use | Capacity | Through- put | % Use | Capacity | Through- put | % Use | Capacity | Through- put | % Use | Capacity | Through- put | % Use | Capacity | Through- put | % Use | |||||||||||||||||||||||||||||||||||||||||||||||||||||||
| (bpd) | (bpd) | (bpd) | (bpd) | (bpd) | (bpd) | (bpd) | (bpd) | (bpd) | (bpd) | (bpd) | (bpd) | (bpd) | (bpd) | (bpd) | ||||||||||||||||||||||||||||||||||||||||||||||||||||||||||
| Barrancabermeja | 250,000 | 213,091 | 85 | % | 250,000 | 221,900 | 89 | % | 250,000 | 226,900 | 91 | % | 250,000 | 221,946 | 89 | % | 250,000 | 209,838 | 84 | % | 250,000 | 213,091 | 85 | % | ||||||||||||||||||||||||||||||||||||||||||||||||
| Reficar(1) | 150,000 | 117,188 | 78 | % | 165,000 | (3) | 10,428 | 6 | % | 80,000 | 10,420 | 13 | % | 150,000 | 151,331 | 101 | % | 150,000 | 135,700 | 90 | % | 150,000 | 117,188 | 78 | % | |||||||||||||||||||||||||||||||||||||||||||||||
| Apiay(2) | 2,500 | 1,382 | 55 | % | 2,500 | 1,604 | 64 | % | 2,500 | 1,380 | 55 | % | 2,500 | 939 | 38 | % | 2,500 | 997 | 40 | % | 2,500 | 1,382 | 55 | % | ||||||||||||||||||||||||||||||||||||||||||||||||
| Orito(2) | 2,500 | 1,090 | 44 | % | 2,500 | 929 | 37 | % | 2,500 | 1,784 | 71 | % | 2,300 | (3) | 1,228 | 53 | % | 2,500 | 948 | 38 | % | 2,500 | 1,090 | 44 | % | |||||||||||||||||||||||||||||||||||||||||||||||
| Total | 405,000 | 332,751 | 82 | % | 420,000 | 234,861 | 56 | % | 335,000 | 240,484 | 72 | % | 404,800 | 375,444 | 93 | % | 405,000 | 347,483 | 86 | % | 405,000 | 332,751 | 82 | % | ||||||||||||||||||||||||||||||||||||||||||||||||
| (1) |
| (2) | Apiay and Orito are |
| (3) |
The 3.6.1.1 Barrancabermeja Refinery
We estimate that the Barrancabermeja refinery supplies 73.8%48% of the fuels consumed in Colombia according to internal calculations made by the Barrancabermeja Refineryus and Colombia´sColombia’s fuels consumption reported by the Ministry of Finance.
The following table sets forth the production of refined products of the Barrancabermeja refinery for the periods indicated.
Table 35 – Production of Refined Products from the Barrancabermeja Refinery
| For the year ended December 31, | For the year ended December 31, | |||||||||||||||||||||||
| 2016 | 2015 | 2014 | 2018 | 2017 | 2016 | |||||||||||||||||||
| (bpd) | (bpd) | |||||||||||||||||||||||
| LPG, Propylene and Butane | 11,956 | 13,623 | 13,834 | 11,813 | 10,712 | 11,956 | ||||||||||||||||||
| Gasoline Fuels and Naphtha | 59,305 | 59,487 | 68,914 | 58,623 | 56,047 | 59,305 | ||||||||||||||||||
| Diesel | 48,233 | 46,212 | 44,273 | 58,305 | 56,090 | 48,233 | ||||||||||||||||||
| Jet Fuel and Kerosene | 20,435 | 22,388 | 23,227 | 23,604 | 20,421 | 20,435 | ||||||||||||||||||
| Fuel Oil | 55,730 | 64,306 | 66,928 | 36,636 | 38,217 | 55,730 | ||||||||||||||||||
| Lube Base Oils and Waxes | 668 | 521 | 1,103 | 729 | 609 | 668 | ||||||||||||||||||
| Aromatics and Solvents | 2,879 | 3,197 | 2,640 | 3,106 | 2,847 | 2,879 | ||||||||||||||||||
| Asphalts and Aromatic Tar | 14,092 | 9,519 | 7,501 | 31,104 | 26,468 | 14,092 | ||||||||||||||||||
| Polyethylene, Sulfur and Sulfuric Acid | 1,541 | 1,318 | 1,094 | 1,479 | 1,509 | 1,541 | ||||||||||||||||||
| Total | 214,839 | 220,571 | 229,514 | 225,399 | 212,920 | 214,839 | ||||||||||||||||||
| Difference between Inventory of Intermediate Products | (661 | ) | 142 | (640 | ) | (1,018 | ) | (405 | ) | (661 | ) | |||||||||||||
| Total Production | 214,178 | 220,713 | 228,874 | 224,381 | 212,515 | 214,178 | ||||||||||||||||||
In 2016,2018, total production from the Barrancabermeja Refinery decreased 3.0%refinery increased by 5.6% from 220,713212,515 bpd in 20152017 to 214,178224,381 bpd in 20162018 primarily as a result of stable operation and improved throughput due to the processingimplementation of a heavier crude slate which lowered throughput,initiatives to segregate and the scheduled maintenance of two of its crude units in Marchpurchase light and October 2016.intermediate crudes.
We own and operate four petrochemical plants and one paraffin and lube plant located within the Barrancabermeja Refinery.refinery. In 2016,2018, we produced 55,64248,468 tons of low-density polyethylene, an increasea decrease of 26%9.3% compared to the production of 44,16153,417 tons in 2015.2017. This increasedecrease was due primarily to the recoverya reduction of ethylene availability due to a turnaround of one of the Turbo expander unit, which resumed operations in August 2015 and supplied a greater amount of feedstock (ethylene) to polyethylene plants.fluid catalytic cracking (FCC) units. We produced 1,994 mboepd894 mboe of aromatics (benzene, toluene, xylene, orthoxylene, heavy aromatics and cyclohexane), a 12% decrease4.3% increase as compared with the production of 2,259 mboepd857 mboe of aromatics in 2015.2017. The declineincrease was mainly the result of lower demand.an increase in local demand for benzene, toluene, xylene, orthoxylene (BTXO).
The gross refining margin decreased from US$16.813.5 per barrel in 20152017 to US$1411.8 per barrel in 2016,2018, primarily due to the decrease in the price differentials of refined products, mainly gasoline and fuel oil, as compared to crude oil, in line with international market trends.
the ICE Brent. The average conversion ratioindex for the Barrancabermeja Refineryrefinery was 74.6%84.6% in 20162018 and 73.5%82.7% in 2015.2017. This increase in the conversion ratio was primarily due to the upgradingoperation at higher capacity of a gasoil hydro-treating unit to a mild hydrocracker unit allowing higher middle distillate yields.the units that convert bottom streams into diesel.
The following table sets forth the production of refined products from Reficarthe Cartagena Refinery for the periods indicated.
Table 36 – Production of Refined Products from Reficarthe Cartagena Refinery
For the year ended December 31,(1) | For the year ended December 31, | |||||||||||||||||||||||
| 2016 | 2015 | 2014 | 2018 | 2017 | 2016 | |||||||||||||||||||
| (bpd) | (bpd) | |||||||||||||||||||||||
| LPG, Propylene and Butane | 6,080 | 0 | 0 | 4,227 | 6,791 | 6,080 | ||||||||||||||||||
| Motor Fuels | 35,012 | 1,558 | 1,997 | |||||||||||||||||||||
| Gasoline Fuels and Naphta | 51,703 | 43,728 | 35,012 | |||||||||||||||||||||
| Diesel | 40,950 | 2,282 | 2,254 | 76,833 | 60,467 | 40,950 | ||||||||||||||||||
| Jet Fuel and Kerosene | 5,768 | 1,202 | 812 | 8,057 | 6,700 | 5,768 | ||||||||||||||||||
| Fuel Oil | 24,602 | 2,826 | 3,352 | 4,671 | 10,150 | 24,602 | ||||||||||||||||||
| Sulfur | 241 | 0 | 0 | 581 | 446 | 241 | ||||||||||||||||||
| Total | 112,653 | 7,868 | 8,415 | 146,072 | 128,282 | 112,653 | ||||||||||||||||||
| Difference between Inventory of Intermediate Products | 911 | 2,476 | 1,896 | 39 | 3,916 | 911 | ||||||||||||||||||
| Total Production | 113,564 | 10,344 | 10,311 | 146,111 | 132,198 | 113,564 | ||||||||||||||||||
| Petcoke (Metric tons) | 601,163 | 0 | 0 | 984,558 | 704,073 | 601,163 | ||||||||||||||||||
| (1) |
| Does not include petcoke. |
During the second half of 2016, the refinery initiated its stabilization period.
The following tables set forth the imports and sales of refined products from Reficarthe Cartagena Refinery for the periods indicated.
Table 37 – Imports and Sales of Refined Products from Reficarthe Cartagena Refinery
| For the year ended December 31, | For the year ended December 31, | |||||||||||||||||||||||
| 2016 | 2015 | 2014 | 2018 | 2017 | 2016 | |||||||||||||||||||
| (bpd) | (bpd) | |||||||||||||||||||||||
| Imports | ||||||||||||||||||||||||
| Motor Fuels | 3,641 | 15,112 | 11,460 | - | 212 | 3,641 | ||||||||||||||||||
| Diesel | 6,155 | 21,979 | 18,334 | - | – | 6,155 | ||||||||||||||||||
| Jet Fuel and Kerosene | 2,211 | 4,384 | 3,419 | 466 | 847 | 2,211 | ||||||||||||||||||
| Alkylate | 83 | - | - | - | – | 83 | ||||||||||||||||||
| LPG and Butane | 355 | - | - | 739 | 618 | 355 | ||||||||||||||||||
| Total Imports | 12,445 | 41,475 | 33,213 | 1,205 | 1,677 | 12,445 | ||||||||||||||||||
| 40 |
During 2016, Reficar2018, the Cartagena Refinery imported products to cover the North Coast sales demand.demand primarily due to operational turnarounds during the last quarter of 2018.
| For the year ended December 31, | For the year ended December 31, | |||||||||||||||||||||||
| 2016 | 2015 | 2014 | 2018 | 2017 | 2016 | |||||||||||||||||||
| (bpd) | (bpd) | |||||||||||||||||||||||
| Sales | ||||||||||||||||||||||||
| Motor Fuels | 38,534 | 16,101 | 14,154 | 52,126 | 44,051 | 38,534 | ||||||||||||||||||
| Diesel | 46,060 | 22,692 | 21,942 | 78,007 | 60,289 | 46,060 | ||||||||||||||||||
| Jet Fuel and Kerosene | 7,479 | 5,012 | 3,681 | 8,082 | 7,489 | 7,479 | ||||||||||||||||||
| Fuel Oil | 16,593 | 2,066 | 4,335 | 4,704 | 7,528 | 16,593 | ||||||||||||||||||
| Other Products | 22,990 | 2,281 | 2,194 | 19,942 | 27,099 | 22,990 | ||||||||||||||||||
| Total Sales | 131,656 | 48,152 | 46,306 | 162,861 | 146,456 | 131,656 | ||||||||||||||||||
After seven years of construction work, Reficar reachedDuring its most important historical milestone to date by entering 34 operating units into operation in July 2016. Reficar´s new and expanded processing capacity may exceed 150 thousand barrels of crude oil per day with a high value product conversion factor of 97.5%. A number of critical milestones were reached during the first semester of 2016, including finishing project construction activities and developing successful sequential start-up of the units up to July 2016. Reficar is now the most modern refinery in Latin America, introducing new technology to the Colombian refinery industry with delayed coking and hydrocracking facilities; and it now has the ability to process heavier crudes and produce gasolines and diesel fuels with ultra-low sulphur contents.
In September 2016, the operation of the new refinery was formally transferred to Ecopetrol under an Operation and Maintenance Agreement that leverages on Ecopetrol´s existing refining capabilities while keeping Reficar as independent manager and owner of the assets.
Following full start-up, the focus areas of the operation have been the stabilization of the production process and the execution of individual unit’s performance tests, (62%, or 21 of 34, have been performed to date). The reliability test of the refinery as a whole is expected to be performedperiod in the second half of 2017, the Cartagena Refinery reached the goal of completing individual unit performance tests (for 100% of units), and the Global Performance Test on December 5, 2017.
As part of the initial phase of the refinery optimization process, during the first half of 2018 the maximum load capacity of certain of the Cartagena Refinery’s plants were tested and provided the following results: (i) the coke unit, with maximum load of 46,088 bpd versus a nominal capacity of 45,000 bpd, (ii) the crude unit, with 166,607 bpd versus a nominal capacity of 150,000 bpd and (iii) the hydrocracking unit with, 38,204 bpd versus a nominal capacity of 35,000 bpd.
In August 2018 a test was run using 100% domestic crude during nine days, achieving an average throughput of 164 mbd. In September 2018, the highest average throughput per month under regular operation was achieved since the refinery’s commissioning, at 161 mbd.
Finally, the fluid catalytic cracking unit ran at 43,515 bpd versus a nominal capacity of 40,000 bpd after coupling and putting into operation the turbo expander.
In terms of gross refining margin, the refinery advancedprogressed from US$9.5 per barrel in 2017 to US$11.0 per barrel in 2018. Throughput also improved during 2018, increasing from an average of approximately US$ 3 per barrel between January and July 2016, to around US$ 9 per barrel between August and December 2016 (stabilization and performance testing period), with expectations that136 mbd in 2017 to 151 mbd in 2018. This result primarily reflects the margin will begood performance of the refinery after its stabilization period and commencing its optimization process in line with the market trend for highly complex refineries.2018.
Reficar´s 2016 financialsThe Cartagena Refinery’s 2018 figures already reflect the operation of the newall units, thus total sales have increased 85% as compared to 2015,2017, from US$ 1,1553,085 million in 20152017 to US$ 2,1424,129 million in 2016.2018. A total of 42.955.3 million barrels of crude were processed in 20162018 compared to 3.849.5 million barrels processed in 2015.2017. Exports to international markets represented 54%42% of total sales (US$ 1,1581,749 million). The refinery’s production has substituted 10 million barrels of gasoline and diesel imports, which previously had to be imported in order to supply the domestic demand. As per information provided by the Colombian Government (specifically by the National Statistics Department –DANE-), Reficar’s entrance into operation contributed 3.8% to the National Industrial GDP, and 0.4% to the National GDP during 2016.
Financing
On December 30, 2011, with the approval from the Colombian Ministry of Finance and Public Credit, Reficar executed a US$3.5 billion project finance to partially fund the expansion and modernization of the refinery in Cartagena Refinery, loans with tenors of 14 and 16 years from Commercial Banks and Export Credit Agency Facilities, respectively. The aggregate amount drawn under these finance agreements totaled US$3,496.6 million. As of December 31, 2016,These credit agreements included a mechanism by which Reficar can exit the principal amount owedfacility by transferring the debt to the senior lenders under these finance agreements was US$2,796.3 million. Interest payments during 2015 and 2016 were US$92 million and US$87 million, respectively.
As partEcopetrol parent level by either (i) the occurrence of the project finance structure, Ecopetrol S.A. entered into a Construction Support Agreement (the “Construction Support Agreement”) andmandatory debt assumption event or (ii) a Debt Service Guarantee Agreement (the “Debt Service Guarantee Agreement”) to support certain obligations of Reficar. Pursuant to the terms of the Construction Support Agreement, Ecopetrol S.A. agrees to support up to the completion date, any additional costs, expenses or delays incurred during the construction phase of the expansion and modernization of the refinery in Cartagena. By means of the Debt Service Guarantee Agreement, Ecopetrol S.A. provides a liquidity mechanism, allowing Reficar to pay itsvoluntary debt service in situations in which there are liquidity shortfalls.assumption.
During 2016,2017, Reficar received capitalizations forcapital injections of US$615269 million to cover project capital expenditures, start-up costs, one-off stabilization costs of the new refinery and a portion itsthe debt service payments.payments due on June 20, 2017. The amount requested by Reficar under the Construction Support Agreement was US$42597 million. The amount requested by Reficar under the Debt Service Guarantee Agreement was US$170172 million. There was no need to request additional contributions under the Debt Service Guarantee to cover the debt service payment due on December 2016. Total debt service2017.
| 41 |
The principal amount repaid by Reficar during 2016 was US$269 million and during 2017 was US$130 million. Interest payments during 2016 totaledand 2017 were US$356 million.87 million and US$42 million, respectively.
The current credit agreements include a mechanism to exit the project finance by transferring the debt at the levelAs part of Ecopetrol S.A., either by (i)Group’s strategy to optimize its capital structure, on December 13, 2017, with the occurrenceapproval of the senior lenders and the Colombian Ministry of Finance and Public Credit, Ecopetrol S.A. voluntarily assumed Reficar’s senior debt. As of the date of the voluntary assumption, Reficar owed the senior lenders a Mandatory Debt Assumption Event or (ii) a Voluntary Debt Assumption; as defined in said agreements.principal amount of US$2,666 million (in nominal terms).
In total,order to finalize the implementation of Ecopetrol Group’s strategy to optimize its capital structure, the following capital injections were undertaken by Ecopetrol on December 13, 2017, increasing its shareholding participation in Reficar modernization project has had capital expenditure needs of US$7,867 million of a total capital expenditures approval of US$8,016 million.from 75.96% to 99.34%:
| ii. | Ecopetrol requested that the existing subordinated COP-denominated loan it granted in Reficar in the amount of $1,522,760 million (book value as of December 13, 2017) be repaid with new Reficar shares. |
| iii. | Additionally, on December 7, 2018, the direct shareholding participation of Ecopetrol S.A. in Reficar increased from 75.96% to 99.34%, after additional contributions of paid-in capital. |
During 2016, Propilco2018, Esenttia production totaled 445447 thousand tons of petrochemical products, a 2.5%2% increase compared to the 434441 thousand tons produced in 2015,2017 primarily due to higher sales volumes explained by greater competitivenessdelays in the local market.supply of raw materials as a result of Hurricane Harvey. The total contribution margin in 20162018 (including the contribution of polypropylene, polyethylene and masterbatches) was 9% higher11.2% lower than in 2015, an increase2017, a decrease from US$293215 per ton in 20152017 to US$318191 per ton in 2016.2018. The increasedecrease in contribution margin was primarily due to higher volatility in the execution of a new commercial strategy focused on differentiation and value-added products and services.propylene market, Esenttia’s main feedstock.
Table 38 – Operating Capacity of PropilcoEsenttia
| For the year ended December 31, | For the year ended December 31, | |||||||||||||||||||||||
| 2016 | 2015 | 2014 | 2018 | 2017 | 2016 | |||||||||||||||||||
| (Metric Tons) | (Metric Tons) | |||||||||||||||||||||||
| Average capacity | 470,000 | 470,000 | 475,000 | 470,000 | 470,000 | 470,000 | ||||||||||||||||||
| Throughput | 444,812 | 434,484 | 389,604 | 447,290 | 440,632 | 444,812 | ||||||||||||||||||
| % Use | 95 | % | 92 | % | 82 | % | 95 | % | 94 | % | 95 | % | ||||||||||||
We have investments in two biofuelsbiofuel companies: (i) Bioenergy S.A.S.A.S., in which we own 98.6%indirectly 99.35% of the shares, currently advancing onthat in 2017 began the constructionoperation of an ethanol plant with theoreticalnominal capacity of 480,000 liters / liters/day, and (ii) Ecodiesel Colombia S.A., in which we own 50% of the shares, currently in operationsoperation with a theoretical capacity of 100,000 tons per year of biodiesel.
3.6.2 Marketing and Supply of Refined Products
We are the main producer and supplier of refined products in Colombia. We market a full range of refined and feedstock products, including regular and high-octane gasoline, diesel fuel, jet fuel, LPG, natural gas and petrochemical products, among others.
Domestic sales of products increased by 4.7 mboepd, an increase of 1.6% compared to 2017. This increase is primarily the result of: (i) a 2.5%, or 3.7 mboepd, increase in middle distillates sales mainly due to higher economic growth in general and higher airplane transportation demand by passengers, (ii) a 5.3%, or 0.9 mboepd, decrease in LPG sales, primarily as a result of lower production at Reficar and Barrancabermeja, (iii) a 12%, or a 2.2 mboepd, increase in petrochemical sales, due to an increase in asphalt sales by Ecopetrol, as a consequence of the reactivation of domestic demand and local sales to clients who then export the product.
The Colombian Petroleum Institute,During 2018, 8.8 million barrels of diesel and 3.4 million barrels of gasoline produced by Reficar were allocated to the local market in order to complement the supply from the Barrancabermeja refinery and fulfill Colombia’s demand, avoiding larger imports and allowing Ecopetrol to maintain the share of the national market. In addition, Ecopetrol imported petrochemicals in order to complement the national supply, generating additional sales of lubricating bases, polyethylene, hexanes and others.
Exports of products increased by 8.3% compared to 2017, 12 mbd from Reficar and 3.0 mbd from Ecopetrol, primarily due to (i) a 97%, or 16 mbd increase in exports of high sulfur diesel, partially offset by (ii) a 21%, or 8.4 mbd decrease in fuel oil exports.
3.7 Research and Development; Intellectual Property
Our innovation and technology center of Ecopetrol, was createdis the Colombian Petroleum Institute, established in June 1985 and located in Bucaramanga, Santander. In 2018, research and development expenses were US$40.67 million, compared to US$25.7 million in 2017. Technology and innovation are essential to our efforts to add value to our business segments through innovation and the development of proprietary technologies and competitive advantages.advantages and the adaptation of third-party technologies to our processes.
The focus of technology development is on designing high added-value products and solutions for Ecopetrol and the Colombian oil industry. The scope of the Colombian Petroleum Institute activities covers all of our value chain segments: exploration, production, refining, transportation and commercialization, as well as environmental sustainability and asset integrity and automation. integrity.
Each year Ecopetrol presents to the Colombian Institute for the Development of Science and Technology (Instituto Colombiano para el Desarrollo de la Ciencia y la Tecnología, or COLCIENCIAS) its research, technology development projects and innovation initiatives, in order to obtain certifications for its science and technology investments. COLCIENCIAS certifies science and technology investments, which are deductible from income tax upon execution; and Ecopetrol takes advantage of thatapplies the tax benefit. In 2016,2018, we obtained US$5.61.66 million in science and technology-relatedscience-and-technology-related tax benefits certified by COLCIENCIAS.
Our intellectual capital isintangible assets are preserved through a technological value-generation process and an intellectual property protection process, which include the consolidation of trade secrets, patents, copyrights, trademarks, industrial designs, and publications in specialized journals. Ecopetrol has filed 194224 patent applications in the last ten11 years, 1217 of them in 2016.2018. Our most recent patent applications include innovative technologies, such as (i) a catalystmethod that uses nanofluids to efficiently upgradeimprove the oil relative permeability in heavy and extra-heavy oil fields, (ii) a device for controlling production fluctuations at the well head, and the subsequent separation of heavy oil residuesand water, (iii) a process to enhance the flow capacity of oil-water-diluent mixtures and the dilution capacity of diluents used in heavy and extra-heavy oil production and transportation, (iv) a slurry-type hydrocracking reactor; (ii)method and device to determine the volumetric contraction of mixtures of heavy oil and light hydrocarbons, and (v) a systemvisbreaking process for refining heavy petroleum components in the early predictionpresence of production events that are likely to trigger artificial lift system failures that may be avoidable; (iii) an intelligent tool to locate restrictions in pipelines;a catalyst and (iv) two methods to obtain nanotechnology-based fluids, to prevent the flocculation of asphaltenes around the wellbore, and to break down emulsions, respectively. hydrogen at low pressure.
In 2016,2018, Ecopetrol declared threetwo industrial secrets that strengthen its competitive advantages in the exploration and transportation of Colombian basins.
In 2016,hydrocarbons. The Colombian and international authorities granted us 1015 new patents.patents, including one in Mexico and another in Ecuador. We currently hold 7987 patents in Colombia, the United States, Mexico, Russia, Peru, Venezuela, Ecuador, Brazil, Nigeria, Indonesia and Malaysia.
| 43 |
In 2016,2018, Ecopetrol S.A. licensed twelve (12)7 of its technologies to private companies for manufacturing, marketing commercialization and after-sales support. To date, we have licensed 2849 technologies to Colombian and multi-national companies. These licensed technological products have been tested and successfully used in our organization to solve problems related to refining, production and transportation of hydrocarbons, and some have potential uses in other industries.
3.8 Applicable Laws and Regulations
3.8.1 Regulation of Exploration and Production Activities
Pursuant to the Colombian Constitution, the Nation is the exclusive owner of all hydrocarbon resources located in Colombia and has full authority to determine the rights to be held and royalties or compensation to be paid by investors for the exploration or production of any hydrocarbon reserves. The Ministry of Mines and Energy and the ANH are the authorities responsible for regulating all activities related to the exploration and production of hydrocarbons in Colombia.
Decree Law 1056 of 1953 (the Petroleum Code, orCódigo de Petróleos) declares that the hydrocarbon industry and its activities of exploration, exploitation, refinement, transportation and distribution are of public interest, which means that, in the interest of the hydrocarbon industry, the Colombian government may order necessary expropriations in order to develop such industry. The hydrocarbon industry is under governmental supervision and control, regulated mainly by the Ministry of Mines and Energy and the ANH.
Ministry of Mines and Energy Resolution 181495 of 2009, as amended by Resolution 40048 of 2015, establishes a series of regulations regarding hydrocarbon exploration and production.
Ministry of Mines and Energy Resolution 180742 of 2012, partially repealed by Resolution 90341 of 2014, includedincludes a series of technical regulations for unconventional hydrocarbon resources, including the procedures for advancing the exploration and exploitation of unconventional reserves. It also establishes the types of wells and their classification, as well as the fulfillment of those minimum (drilling and abandoning) conditions necessary to initiate or perform E&P activities. Furthermore, it contemplates the applicable procedure to resolve disputes between the mining sector and the oil and gas sector, regarding the coexistence of their rights in some specific projects.
On May 26, 2015, the Ministry of Mines and Energy issued Decree 1073 which compilescompiled the majority of Colombian decrees and regulations in force regarding the administrative sector of mines and energy.
Agreement (Acuerdo,a type of regulation) 004 of 2012, as issued by the ANH, amends Agreement 008 of 2004 and sets forth the rules governing the award of exploration and production areas and the execution of contracts. As set forth below, Agreement 002 of 2017 replaces thisAcuerdo.
Agreement 003 of 2014, as issued by the ANH, complements Agreement 004 of 2012 by setting forth the contractual framework for the carrying out of activities in unconventional reservoirs, the procurement regulations for the exploration and exploitation of unconventional fields and the procurement process for the awarding of hydrocarbon exploration and exploitation areas.
Agreement 002 of 2015, as issued by the ANH, partially amends Agreement 004 of 2012 and sets forth the initial rules and measures the Government can take to mitigate the adverse effects of the decline of international oil prices. The main measures established by this agreement are the following:
| (i) | The extension of terms and deadlines for the execution of activities related to investments in exploration and evaluation phases and for the declaration of commercial discoveries; |
| (ii) | The establishment of procedures to transfer investments in exploration programs between allocated |
| 44 |
| (iii) | The |
Agreement 003 of 2015, as issued by the ANH, modifies and also partially amends Agreement 004 of 2012, and provides certain rules and measures the Government can take to mitigate the adverse effects of the decline of international oil prices. This agreement permits performance guarantees required under E&P contracts to be reduced in the same amount as the works actually performed during the term of the respective phase.
Agreement 004 of 2015, as issued by the ANH, also partially amends Agreement 004 of 2012, and provides certain rules and measures for the Government to mitigate the adverse effects of the decline of international oil prices. This agreement allows contractors to attribute additional activities carried out under a TEA to commitments under the first phase of an E&P contract.
Agreement 002 of 2017, as issued by the ANH on May 18, 2017, replaces Agreement 004 of 2012, Agreement 003 of 2014, and Agreements 002, 003, 004 and 005 of 2015. It establishes the general structure of the New Regulation for Administration and Assignment of Areas and the general guidelines regarding future hydrocarbon contracts in Colombia. Seeking the interests of the Nation, the market conditions, the national hydrocarbon sector strategy, the competitive context of producer countries and the Nation’s social and environmental evolution.
Agreement 002 of 2017 adapts the existing regulations for the selection of contractors, and the applicable rules for the award, execution, termination, liquidation, monitoring, control and surveillance of the contracts signed with the ANH.
On February 4, 2019, the ANH published the new model contract for offshore exploration and production. The purpose of this new model contract is to foster and stimulate investments in exploration and the exploitation of offshore hydrocarbons, enhancing Colombia’s competitiveness to attract and retain investments from large and experienced O&G operators.
Resolution 078 of 2019, as issued by the ANH, approved the terms of reference and the model of the contract for the “permanent bidding procedure.” Pursuant to this procedure, the ANH will select areas over which proposals may be received at any time, without the need of launching specific bidding procedures for their allocation.
3.8.1.1.1 Environmental Licensing and Prior Consultation
Law 99 of 1993 and other environmental regulations, such as particularly Decree 1076 of 2015 in particular (compilation decree regarding the administrative sector of environment and sustainable development), impose on companies, including oil and gas companies, the obligation to obtain an environmental license prior to undertaking any activity that may result in the serious deterioration of renewable natural resources, or that may have the capacity of materially modifying the physical environment.
The National Authority on Environmental Licensing (ANLA), created by means of Decree 3573 of 2011, is the entity responsible for evaluating the applications and issuing the environmental licenses for oil & gas-related activities, as well as surveilling and overseeing all hydrocarbonshydrocarbon projects and monitoring the environmental compliance of such activities.
If the projects or activities could have a direct impact over the territories or the interests of indigenous, Afro-Colombian or Raizal communities, the Colombian Constitution provides that the companies developing such projects or activities must undertake a public consultation process with those communities before initiating such projects or activities. This consultation process is a pre-requisiteprerequisite for obtaining the required environmental licenses.
In addition, the Colombian Constitution and laws establish that, as part of the public participation mechanisms, Colombian individuals may request information regarding the activities of the project and their potential impacts. They may also request to undertake an environmental hearing so as to obtain information of the project subject to environmental licensing.
On May 26, 2015, the Ministry of Environment and Sustainable Development (“MESD”) issued Decree 1076, which compiles the majority of Colombian regulations in force regarding environment and sustainable development.
| 45 |
The environmental license encompasses all of the necessary permits, authorizations, concessions and other control instruments necessary under Colombian environmental law to undertake a project or activity that may result in the serious deterioration of renewable natural resources, or that have the capacity of materially modifying the physical environment. The license shall define specific conditions under which the beneficiary of the license may undertake such project or activity. The procedure to obtain an environmental license begins when the company files an Environmental Impact Study (EIA) related to the project before the ANLA. The licensing process includes an application for the use of natural renewable resources (water, soil and air), the filing of an EIA and a plan to prevent, mitigate, correct and compensate for any activity that may harm the environment, known as the Environmental Management Plan (PMA).
A newThe environmental licensing procedure came into force in Colombia on January 1, 2015 as a result of the enactment of Decree 2041 of 2014, which now is compiled byset forth in Decree 1076 of May 26, 2015, repealing the licensing process defined in decree 2820 of 2010.2015. According to the regulation currently in effect, the procedure to obtain an environmental license shall not take more than 90 business days but,days. But, depending on the complexity of the information requested by the ANLA and administrative delays, including an oral hearing to determine the viability of the project, the procedure may take between 165 and 265 business days, depending on whether the applicant is required to file additional information. The newactual procedure incorporates an oral hearing between the ANLA and the applicant in order to evaluate the information provided in the license application and whether it is necessary or not to request additional information about the proposed project. The ANLA will have no other opportunities to request additional information after this hearing.
The Ministry of Environment and Sustainable DevelopmentMESD is also responsible for establishing guidelines regarding climate change policies for the hydrocarbon sector in Colombia. We are in compliancecomply with those guidelines. At present, the Ministry of Environment and Sustainable DevelopmentMESD has not proposed any specific steps for the implementation of the Kyoto Protocol or the Paris Agreement, as they relate to our operations. We are continuously monitoring climate change requirements that could be applicable to us. A company that does not comply with the applicable environmental laws and regulations, does not execute the Environmental Management Plan (PMA) approved by the environmental authority or ignores the requirements imposed by an environmental license may be subject to an administrative proceeding initiated by the ANLA or the regional environmental authorities established by Law 1333 of 2009. The proceeding may result in oral or written warnings, monetary penalties, fines, license revocation or the temporary or permanent suspension of the activity being undertaken. Apart from administrative sanctions, the Colombian judiciary or other law enforcement authorities may also impose civil and even criminal sanctions if environmental damages are verified as a consequence of having breached the environmental laws and regulations applicable to the project.
3.8.1.1.2 Royalties
In Colombia, the Nation is the owner of minerals and non-renewable resources located in the subsoil, including hydrocarbons. Thus, companies engaged in exploration and production of hydrocarbons, such as Ecopetrol, must pay to the National Hydrocarbons Agency (ANH), as representative of the National Government of Colombia, a royalty on the production volume of each production field, as determined by the ANH.
Royalties may be paid in kind or in cash. Each production contract has its applicable royalty arrangement in accordance with applicable law. In 1999, a modification to the royalty regime established a sliding scale for royalty payments for crude oil and natural gas production fields discovered after July 29, 1999 and depending on the quality of the crude oil produced. Since 2002, as a result of the enactment of Law 756 of 2002, the royalty rate was fixed as a sliding scale depending on the produced volume from 8% for fields producing up to five thousand bpd5 mbd to 25% for fields producing in excess of 600 thousand bpd. Changesmbd. Notwithstanding the royalties for Incremental Production Contracts, Contracts for Undeveloped and Inactive Fields, and Incremental Production Projects defined in paragraph 3 article 16 Law 756 of 2002, and article 29 of the Law 1753 of 2015, the changes in the royalty regime only apply to new discoveries and do not apply to fields already in the production stage as of July 29, 1999. Producing fields pay royalties in accordance with the royalty law in force at the time of the discovery.
Regarding natural gas, in accordance with Resolution 877 of 2013, as amended by Resolution 640 of 2014, starting on January 1, 2014, the ANH has received royalties in cash rather than in kind. Thus, the producer may dispose of its gas production volumes corresponding to royalties paid in cash.
3.8.2 Regulation of Transportation Activities
Hydrocarbon transportation activity is considered a public interest activity in Colombia and a public service. As such, it is under governmental supervision and control, regulated mainly by the Ministry of Mines and Energy and CREG.theComisión de Regulación de Energía y Gas (“CREG” as per its Spanish acronym).
Transportation and distribution of crude oil, liquefied petroleum gas and refined products must comply with the Petroleum Code, the Code of Commerce and all governmental decrees and resolutions. However, liquefied petroleum gas-related activities are regulated by CREG. According to Law 681 of 2001, multipurpose pipelines owned by Ecopetrol (through Cenit)Cenit (a company wholly owned by Ecopetrol) must be open to third-party use on the basis of equal access to all.
Notwithstanding the general rules for hydrocarbon transportation in Colombia, Law 142 of 1994 defines the regulatory framework for the provision of public utility services, including the provision of natural gas. Moreover, natural gas transportation is subject to regulations specific to the natural gas industry as issued by CREG, due to the categorization of natural gas distribution as a public interest activity under Colombian laws.
Transportation systems, classified as crude oil pipelines and refined product pipelines, may be owned by private parties. Pipeline construction, operation and maintenance must comply with environmental, social, technical and economic requirements under national guidelines and international standards for the oil and gas industry.
Construction of transportation systems requires licenses and local permits awarded by the Ministry of Mines and Energy, the Ministry of Environment and Sustainable Development and regional environmental authorities, respectively.
Crude oil transport
The regulatory framework relating to crude oil transportation accounts for both private use and public use pipelines. Private use pipelines are those built by the operating or refining entity for its own exclusive right and that of its affiliates. Public access pipelines are defined as pipelines built and operated by a public or private legal entity, for the purpose of publicly providing crude oil transportation services. The Colombian government, through the ANH, has a preferential right to use up to 20% of the total capacity of any public or private access pipeline to transport its share of production.crude oil royalties. However, for both private and public access pipelines, the ANH must pay the tariff for the pipeline use to transport its percentage of production.
The Ministry of Mines and Energy is responsible for reviewing and approving the design of and tracks for crude oil pipelines, by establishing transport rates based on information provided by the service providers. It also oversees the calculation and payment of hydrocarbon transport-related taxes and manages the information system for the oil product distribution chain.
In 2014, the Ministry updated the transport regulation and the rate calculation method for this line of business. It introduced a framework for the secondary market and incentives for new pipeline construction and current pipeline capacity expansions. According to the Petroleum Code, rates are tomust be revised every four years.
During the scheduled revision of 2015 and due to the dramatic changes in international crude oil prices, the Ministry of Mines and Energy allowed, by means of Resolution 31 32531325 and Resolution 31489 of 2015, transportation companies and oil production companies to engage in direct negotiations in order to agree on a tariff suitable for both parties. The negotiation period was extended until June 2016. Notwithstanding the fact that tariff agreements were reached with certain companies, the results of the negotiations were not positive. Thus, tariffs were set by the Ministry of Mines and Energy in accordance with the criteria previously established by Resolution 72146 of 2014, latterlyas further amended by Resolution 31325 of 2015.2015 and Resolution 31285 of 2016.
The Port Superintendence is the authority that oversees the port business for crude oil and refined products. Although this business is not highly regulated, market participants are required to report certain information to the Port Superintendence.
| 47 |
As a result of the enactment of Decree 119 of 2015, operators of private use hydrocarbon ports are currently able to provide hydrocarbon transport services to third parties pursuant to a mechanism established under that decree.
Decree 119 of 2015 was incorporated into Decree 1079 of 2015 issued by the Ministry of Transport, which compiles the majority of Colombian decrees and regulations in force regarding the administrative sector of transportation.
Refined products and liquefied petroleum gas transport
In 2014 CREG assumed responsibility for regulating product pipeline transportation from the Ministry of Mines and Energy, in addition to its pre-existing regulatory responsibility for liquefied petroleum gas, natural gas and electric energy transportation.
In August 2017 CREG issued a draft resolution 113 of 2017, which introduced a new framework for the transportation regulation of liquefied petroleum gas and refined products. The draft resolution was open for observations from the general public and the oil and gas industry until January 12, 2018, but the final resolution has not been issued yet. CREG is also in the process of defining and introducing the transportation regulation and the rate calculation method for refined products. On September 25, 2015, CREG published a draft resolution that established the proposed regulations for transport of liquid fuels and liquefied petroleum gas. The primary goals and components of the proposed regulation are: a)(i) to ensure access to the transport systems for liquid fuels and the LPG pipeline systems without discrimination; b)(ii) to promote the timely expansion of the transport system in line with the needs of the market; c)(iii) to promote competition and prevent restrictive practices; d)(iv) to separate the operations of refining and transport; and e)(v) to ensure the efficient and continuous operation of transport systems. Currently, CREG continues withAs of the taskdate of drafting this regulation.annual report, the above mentioned resolution has not been issued.
3.8.3 Regulation of Refining and Petrochemical Activities
Article 58 of the Petroleum Code establishes that oil refining activities can be developed throughout the Colombian territory and are not reserved to the State. However, Article 4 establishes that such activities are considered of public interest subject to governmental regulation, and the development of those activities must comply with technical requirements established by regulation.
In 2008, Law 1205, further developed by Resolution 180689 of 2010, issued by the Ministry of Mines and Energy, was issued with the main purpose of contributing to a cleaner environment. It established the minimum quality specifications for fuels in Colombia. Since August 2010, Ecopetrol has been selling dieselproducing and gasoline at its refinery in Barrancabermeja in order to produceselling diesel and gasoline that complies with the requirements of the aforementioned law.law and, for some cities, we sell with better standards.
Since 1995, under Resolution number 898 of August 23, 1995 the Ministries of Environment and Sustainable Development and of Mines and Energy, have regulated the environmental criteria for liquid and solid fuels used in commercial and industrial furnaces and boilers, as well as automobile internal combustion engines. Resolution 898 has been subject to numerous modifications through the years, the most recent by Resolution 40619 of June 30, 2017. Ecopetrol has been complying with this regulation and working with governmental entities in order to improve air quality in the most critical areas in Colombia.
3.8.3.1 Regulation of Liquefied Petroleum Gas (LPG) and Liquid Fuels
Wholesale marketing, transport, distribution and retail marketing of LPG are mainly regulated by CREG Resolution 74 of 1996, and subsequent resolutions. LPG in Colombia is primarily obtained through Ecopetrol’s refineries, field production and imports. The LPG must meet minimum quality standards to be marketed. Our marketing activities are regulated by CREG Resolution 53 of 2011 (as amended by CREG Resolutions 108 of 2011, 154 of 2014, 019 of 2015, and 034, 063 and 064 of 2016). The LPG price is regulated by CREG Resolutions 66 of 2007 (as amended by CREG Resolutions 59 of 2008, 002 of 2009, 123 of 2010, 095 of 2011, and 65 and 129 of 2016).
According to Article 4 and 212 of the Petroleum Code and Law 39 of 1987 (added by Law 26 of 1989), the distribution of liquid fuelscrude oil and theirits derivatives has a public purpose (utilidad pública), and the distribution of fuel oil and crude oil by-products is considered a public utility.utility activity. Consequently, individuals or entities engaged in these activities are subject to regulations issued by the Colombian government. The Government has the power to determine quality standards, measurement and control of liquid fuels, and establish penalties that may apply to dealers who do not operate in compliance therewith.
| 48 |
The Ministry of Mines and Energy is the entity that controls and exercises technical supervision over the distribution of liquid fuels derived from petroleum, including the refining, import, storage, transportation and distribution in the country. Law 812 of 2003 identified the agents of the supply chain of petroleum-based liquid fuels. In this context, the Ministry of Mines and Energy through Resolution 40344 of 2017, published the required actions to ensure the LPG supply for the priority sectors in the country.
The distribution of liquid fuels, except LPG, is governed by Decree 1073 of 2015, which establishes the requirements, obligations and penalties applicable to supply agents in the distribution, refining, import, storage, wholesale, transportation, retail sale and consumption of liquid fuels.
Decree 1073 of 2015 establishes the minimum technical requirements for the construction of storage plants and service stations. This Decree also regulates the distribution of liquid fuels, except LPG establishing the minimum requirements for distributors and the activities and types of agreements permitted for these agents. The Ministry of Mines and Energy also regulates the types of liquid fuels that can be sold and purchased and the penalties for noncompliance with governmental regulations.
Pursuant to Law 1430 of 2010, the distribution of fuels in areas near Colombian borders is the responsibility of the Ministry of Mines and Energy and is subject to specific regulations that impose strong control procedures and requirements. The Ministry of Mines and Energy establishes the safety standards for LPG, storage equipment, maintenance and distribution of LPG. Resolution 31514 of 1992 established that any LPG household, commercial and industrial facility with a storage capacity of LPG greater than 420 pounds must receive an authorization from the Ministry of Mines and Energy prior to commencing operations.
The Superintendence of Public Domestic Public Service SuperintendenceUtilities also oversees the liquefied petroleum gas transportation business. Cenit reports key operational and financial indicators to it on a monthly basis.
3.8.3.2 Regulation Concerning Production and Prices
According to the Decree - Law 4130 of 2011 and Decree 1260 of 2013, CREG is in charge of setting the prices of petroleum by-products throughout the entire chain of production and distribution, except for current gasoline engine, diesel and biofuels. On the other hand, by Decree 381 of 2012, as amended by Decree 1617 of 2013, the Ministry of Mines and Energy is in charge of setting the methodology to determine the reference price of gasoline, diesel, (ACPM), biofuels and mixtures thereof.
Then, since May 2012, CREG fixes the prices for most crude oil by-products, but for gasoline, diesel ACPM and biofuels. CREG determines the methodology to calculate their price while the Ministry of Mines and Energy fixes the relevant prices in accordance with said methodology. The ANH does not intervene in the definition of prices of gasoline and diesel fuel. In addition, under Resolution 007 of 2017, CREG determined the basis for the methodology of compensation of terrestrial transportation of liquid fuel-oil, including current gasoline, diesel and biofuels between the storage plant and the fuel service station.
The methodology for calculating jet fuel prices is set out in Law 1450 of 2011, and jet fuel prices themselves are set by the Ministry of Mines and Energy.
The ANH determines the formula that is used to calculate royalty payments corresponding to the production of crude oil and the crude oil price reference for local refining.oil.
Decree 381 of 2012 and 1617 of 2013, as amended by Decree 2881 of 2013, as compiled in Decree 1073 of 2015, restructured the Ministry of Mines and Energy and gave it the responsibility to study industry problems and implement short- and long-term refining planning policies. The Ministry is also responsible for establishing the governmental policies and goals to ensure the reliability, stability and continuity for the production of liquid fuels, biofuels and others.
Pursuant to Article 58 of the Petroleum Code, if there is a fuel shortage, any refining company operating in Colombia must provideoffer to sell a portion or, if needed, the total of its production to supply local demand prior to exporting any production. If local demand increases, and imported crudes are needed, the refining company may charge the State additional transportation costs in proportion to the imported crudes delivered to the refinery.
The Fuel Price Stabilization Fund (FEPC) was created by means of Law 1151 of 2007 with the aim to mitigate, in the domestic market, the impact of fluctuations in fuel prices (gasoline and motor fuel oil) in international markets. As per article 2.3.4.1.3 of Decree 1068 of 2015, the funding for the operation of the FEPC comes from the following sources: (i) financial returns on the funds of the FEPC; (ii) extraordinary contributions from the National Treasury; and (iii) resources from the General Budget of Colombia.
| 49 |
Fuel Price Stabilization Fund (FEPC)
The Fuel Price Stabilization Fund was created by Law 1151 of 2007. It is a fund assigned and administered by the Ministry of Finance and Public Credit. Its function is to attenuate, in the domestic market, the impact of fluctuations on fuel prices in international markets.
According to article 2.3.4.1.3 of Decree 1068 of 2015, amended by Decree 1451 of 2018, the resources for the functioning of the FEPC come from the following sources: (a) financial returns of resources of the Fund; (b) extraordinary credit resources received from the National Treasury; (c) funds allocated to the FEPC in the national general budget; (d) fuel taxes and; (e) bonds or other public debt securities issued by the Nation in favor of the FEPC, in order to cover the obligations of the Fund.
The operation of the FEPC is currently regulatedgoverned by Decree 1068 of 2015, which compilesamended by Decree 18801451 of 2014,2018, Chapter 1, Title 4 (compilation decree regarding treasury public sector). First, refiners and/or importers of regular gasoline and sets forth the calculation method of the Differential as the product of the volume reported by the refiner and/or importerdiesel must report to the Ministry of Mines and Energy times the difference betweenvolume of regular gasoline and diesel sold in the international parity priceprevious month and such reports must be made within the next 35 calendar days of each month.
The report must also contain, among other matters: information corresponding to each fuel disaggregated daily; the discrimination of the volumes sold, and the reference price. It also provides that refiners and/origin national or importers shall submit monthly reports toimported of the gasoline and diesel sold. If the regular gasoline or the diesel is of national origin, the refiner/importer must inform from which refinery they come. Secondly, the Ministry of Mines and Energy on the volume, origincalculates and type of fuel (gasoline and motor fuel oil) sold in the domestic market for said period.
Based on those reports, the Ministry of Mines and Energy shall calculate and liquidateliquidates, by resolution, the Net Position every six monthsof each refiner/importer and each fuel to be stabilized by issuing a resolution provided, however, that such Net Position results from the sum of the differentials for the relevant six-month period. FEPC.
Decree 1068 of 2015, alsoamended by Decree 1451 of 2018, provides that the FEPC shallwill pay in Colombian Pesospesos the value corresponding to the six-monthcalculation and settlement of the Net Position of each refiner and/or importer within the term thatdefined by the Ministry of Mines and Energy establishes and based on availability of resourcesFEPC resources.
Law 1819 of 2016 created a tax, related contribution to finance the FEPC. This contribution is caused when the sum of the FEPC. For more information regardingDifferentials of Participation (difference between the FEPCProducer Income and Ecopetrol, see the section 5.1.2.International Parity Price, when the first is greater than the second on the date of issuance of the sales invoice, multiplied by the volume of fuel sold) is greater than the sum of the Differentials of Compensation (the difference presented between the Producer Income and the International Parity Price, when the second is greater than the first on the date of issuance of the sales invoice, multiplied by the volume of fuel sold).
By Resolution 31356The event that generates the contribution is the sale in Colombia of 2016,gasoline or diesel by the refiners and/or importers to the wholesale distributor of fuels, according to the price set by the Ministry of Mines and Energy, liquidatedhowever, if the net positionsimporter is at the same time a wholesale distributor, the triggering event shall be the withdraw of the product to be sold. The taxpayer responsible for Ecopetrol corresponding to December 23 to 31, 2014the contribution is the refiner and/or importer and the first and second quartersactive subject is the Nation. The tax base corresponds to the positive difference between the sum of 2015, establishing that Ecopetrol must pay to FEPC COP$114,172,749,145.09 as a contribution differential; Ecopetrol appealed but the MinistryDifferentials of Mines and Energy confirmed its decision by Resolution 31121 of 2017.
By Resolution 31127 of 2017, the Ministry of Mines and Energy liquidated the net position for the third quarter of 2015 and October 1 to November 25, 2015, establishing that FEPC must pay to Ecopetrol COP$318,638,400,647.33.
By Resolution 31128 the Ministry of Mines and Energy liquidated the net position for Ecopetrol corresponding to November 26 to December 31, 2015Participation and the first half of 2016 establishing that FEPC must pay to Ecopetrol COP$338,252,758,969.68.
Assum of the dateDifferentials of this annual report, the Ministry of Mines and Energy has not calculated or liquidated the Net Position for each fuel (gasoline and motor fuel oil) to be paid by the FEPC to Ecopetrol for its sales during the second half of 2016.
Recently, Law 1819 of December 29, 2016, created a contribution to finance the FEPC which will come from the sales in Colombia of gasoline or ACPM by the refiner or importer to the wholesale distributor, on the basis of the differential between the international parity price and the reference price.Compensation.
The Ministry of Mines and Energy will exercisecalculates the functions of control, management, settlement, determination, discussion and collection of the contribution. In particular, it will calculate the contribution to the FEPC through the liquidation of the quarterly Net Position of each refiner or importer with respect to the FEPC based on the reporting of informationreport that the refiners and/or importers present.submit. If the sum of the Differentials of Participation is greater than the sum of the Differentials of Compensation and the contribution is caused, the Ministry of Mines and Energy will order the refiner or the importer to pay the contribution to the National Treasury within the 30 days following the execution of the liquidation resolution.
Subsequently, Law 1837 of 2017 (article 16) provided that the remaining resources that were in the Ecopetrol’s accounts as of December 2014, as a result of the collection of the Differential Contribution from the FEPC, would be transferred to the General Direction of Public Credit and Treasury of the Ministry of Finance and Public Credit (DGCPTN).
The Ministry of Mines and Energy issued Resolutions 31536 and 31538 of 2018 which contain the settlement of our Net Positions corresponding to: (i) the period between December 29 and 31, 2016 and the first and second quarters of 2017, and (ii) the third and fourth quarters of 2017. In those resolutions the FEPC was ordered to transfer COP $729,729,493,450.88 and COP $1,183,672,269,819.52 to Ecopetrol, respectively.
As of the date of this report, the Ministry of Mines and Energy has not calculated the Net Positions corresponding to the year 2018.
3.8.3.3 Regulation of Biofuel and Related Activities
The sale and distribution of biofuels is regulated by the Ministry of Mines and Energy. Regulations establish the quality and pricing standards for biofuels and impose minimum requirements for mixing ethanol with gasoline and biodiesel with diesel.
The sale and distribution of biofuels is provided under CREG Resolution 240 of 2016, which particularly regulates: a) the sorts of market that will be served with biogas and biomethane; b) the quality and safety conditions; and c) the tariff regime (article 2).regime. Pursuant to article 4 of the before mentionedforegoing Resolution, biogas supply through isolated networks to serve non-regulated users and natural gas vehicles (“GNV” as per its Spanish acronym), shall be incorporated as a public utility company. Furthermore, article 5 provides that biomethane supply through isolated networks or interconnected networks to the National Transportation System shall also be incorporated as a public utility company. Finally, article 12 states that biogas suppliers may develop the production, transportation, distribution and commercialization activities through integrated structures, provided that they keep separate accounts for each activity and grant free access to the networks to both regulated and non-regulated users. InTo the same way,extent, production, distribution and commercialization of biomethane through interconnected networks to the National Transportation System may be developed through integrated structures, as long as the supplier keeps separate accounts for each activity and grants free access to the networks to both regulated and non-regulated users.
3.8.4 Regulation of the Natural Gas Market
Decree 1073 of 2015, issued by the Ministry of Mines and Energy,Part 2, Title 2, Chapter 2, established that all producers have to issue a production statement that includes the volumes of natural gas available for sale for a period of ten years. This decree established the regime for the selling and marketing of natural gas in Colombia, including specific procedures that regulate the Colombian market in order to manage the remaining natural gas reserves owned by the Nation, and to protect domestic consumers, especially residential consumers, by prioritizing delivery of gas to residential consumers, regulating the export of natural gas and setting forth the export restrictions applicable during an internal shortage of natural gas.
Currently in Colombia other than with respect to the Opón field, the price of natural gas is determined by the market.
market, but some agreements still have to conform to the regulated formula. CREG issued Resolutions 088Resolution 114 of 2017 which adjusted commercial aspects of the wholesale natural gas market in Colombia and compiled CREG Resolution 089 of 2013 and 089 of 2013 (amended by CREG Resolutions 204 of 2013, 089 and 122 of 2014, 022, 032, 088, 105, 139, 143, and 218 of 2015, 137 and 070 of 2016 and 001 of 2017) that established the procedures for marketing natural gas in Colombia.its amendments. However, pursuant to Decree 1073 of 2015, such procedures do not apply to the following activities: a) natural gas exports; b) natural gas as raw material in petrochemical production; c) natural gas commercialization from minor fields (production capacity under 30 million cfpd)SCFD); d) natural gas commercialization from hydrocarbon fields under testing phase or which have not yet been declared commercially viable; e) natural gas commercialization from unconventional reservoirs; and f) internal consumption from natural gas producers.
CREG determines which agents can participate in the primary and secondary markets. Ecopetrol is authorized to participate as a seller in the primary market as a natural gas producer and as a buyer in the secondary market when Ecopetrol requires natural gas from other producers for its own needs. CREG regulations provide that a natural gas producer cannot participate as a merchant of natural gas in the secondary market, except that it may purchase gas to meet its existing contractual obligations. Ecopetrol is also able to re-sellresell available natural gas transportation capacity into the secondary market.
Priority for the Supply of Natural Gas
The export of natural gas, in contrast, is not considered a public utility activity under Colombian law and therefore is not subject to Law 142 of 1994. Nevertheless, the internal supply of natural gas is a priority for the Colombian government and is considered to be a public utility complementary activity, and therefore public utility regulations apply to the internal supply of natural gas.
| 51 |
Decree 1073 of 2015 (amended by Decree 2345 of 2015) provides that in the event the supply of natural gas is reduced or halted as a result of a shortage, the Colombian government has the right to suspend the supply of natural gas for exportation.export. If such export contracts are suspended by the Colombian government, the export agents are entitled to receive compensation in accordance to article 2.2.2.2.15 and 2.2.2.2.38 of Decree 1073, 2015. Notwithstanding the foregoing, Decree 1073 of 2015 establishes freedom to export natural gas under normal gas-reserve conditions. Producers of natural gas may enter into natural gas export contracts if the ratio of proved reserves to consumption exceeds seven years, as determined by the Colombian Energy Planning Authority (or UPME for its Colombian acronym).
Decree 1073 of 2015 (amended by Decree 2345 of 2015) establishes an order of supply when restrictions are placed on the supply of natural gas or serious emergency situations arise that preclude the continued provision of certain services, as follows: (i) essential demand, as established in Decree 1073 of 2015, (ii) non-essential demand under an existing agreement with a warranty of uninterrupted provision and (iii) fairfirm exports delivery.
The order of priority for the supply of natural gas is as follows: (i) the operation of the compressor stations of the National Transportation System, (ii) residential users and small business users engaged in the distribution network, (iii) vehicular compressed natural gas and (iv) gas refineries, excluding those destined for self-generation of electricity that can be replaced with energy from National Transportation System, which has first priority. The Ministry of Mines and Energy also establishes distribution priorities in the event of a natural gas shortfall derived from supply or infrastructure issues. This order of priority is based on the type of contract, with firm supply contracts having priority over interruptible supply contracts.
Decree 1073 of 2015 and CREG Resolutions 089Resolution 114 of 2013 and 204 of 20132017: (i) provide specific procedures and forms of supply agreements determined by CREG pursuant to which an agent may sell and buy natural gas in the Colombian primary and secondary market produced from large fields (capacity of more than 30 million cfpd). Decree 1073 of 2015CFPD); and CREG Resolution 089 of 2013 permits(ii) permit the sale of natural gas from small fields (capacity under 30 million cfpd)CFPD) pursuant to contracts that fulfill certain regulatory requirements but whose form is not prescribed by law.
3.9 Sustainability Initiatives
This section describes the health, safety and environmental (HSE) practices of Ecopetrol S.A. Currently, subsidiaries of Ecopetrol S.A. establish their own HSE models, provided that these models must be consistent with guidelines established by Ecopetrol S.A.
One of the principles that guideguides Ecopetrol is our commitment to our employees and the development of those communities in which we operate. For that reason, Ecopetrol S.A. is devoted to improving our health, safety and environmental (HSE) practices.
The results of the HSE performance in 2018, compared with the prior year, were:
| · | A reduction in the Total Recordable Incidents Frequency Index (TRIF), which represents the number of employee or contractor injuries that require medical treatment or time off for every million hours worked, including fatalities, from 0.64 incidents per million hours worked in 2017 to 0.63 in 2018; an improvement compared with the 2.96 recorded in 2012; |
| · | A 51% decrease in road accidents, due to improvements in real-time monitoring of drivers’ safety habits, an increase in control check points for tracking tankers and awareness campaigns for drivers; |
| · | Improvement in reporting of minor oil spills and identification of their causes; and |
| · | We maintained the same process safety performance compared to 2017, 0.05, an improvement compared with the 0.11 recorded in 2012 |
| 52 |
We did observe an increase in some other indicators as set forth below:
| · | A 12% increase in the number of incidents involving employee or contractor injuries that require medical treatment, restricted work or lost days; |
| · | An increase greater than 100% in the severity of occupational incidents due to a fatality that must add to the severity index 6,000 lost days, according to Colombian legal requirements; and |
| · | An increase greater than 100% in the amount of oil spilled, primarily due to the Lisama 158/La Fortuna Incident. See “—Lisama 158/ La Fortuna Incident” below. |
We have several programs in place aimed at increasing the safety of our industrial processes and minimizing the number of occupational accidents and other major incidents. Our HSE management model is based on key focus areas that are aligned with our integrated management system.


The resultsTotal Recordable Incident Rate – Employees and Contractors
Ecopetrol S.A. places an important emphasis on understanding, monitoring and controlling our impacts on workers and contractors.
TRIF has improved from 2.96 incidents per million hours worked in 2012 to 0.63 in 2018. In 2018, 68 recordable cases occurred, where 24% led to restricted work, 7% required medical treatment and 69% led to lost days. Additionally, we had a 12% increase in occupational incidents compared to 2017 due to a higher level of activity at the HSE strategies in 2016, compared with the prior year, were:Company which led to a higher exposure of workers to incidents.
Graph 7 – Total Recordable Incident Rate – Employees and
Contractors(*) (**)
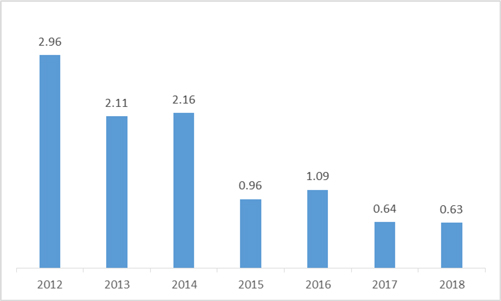
| ** | Includes data for Ecopetrol S.A. and the Vice-Presidency of Transport and Logistics, but does not include data for subsidiaries of Ecopetrol |
Contingency Plans and Environmental Remediation
All of our operational areas have preparedness and emergency response plans, each in accordance with Colombian legal requirements and our new internal guidelines for emergency management.
Our preparedness and emergency response plans have been developed based on our analysis of risk scenarios, the estimated consequences of these events and the implementation of strategies to be followed in response to each scenario. These contingency plans have the approval of the ANLA.
The objectives of our contingency plans are to:
| · | Protect the health and safety of our workers, contractors and the communities in which we |
| · | Prevent oil spills and leaks of harmful substances in offshore and onshore areas, fires and explosions and |
Our contingency plan includes:includes, among others:
| · | Procedures for the containment of oil and other harmful substances, as well as procedures to safeguard the safety of affected communities, the environment and the personnel involved in such containment |
| · | Strategies for responding to emergencies located outside of our facilities and mutual aid emergency plans, including actions developed with local environmental authorities, |
Further, we are upgrading the skills of our fire brigade, ensuring the reliability of firefighting and emergency equipment and working on improving our performance during emergency drills.
In offshore operations, ourthe operator has the responsibility of designing and implementing plans and strategies aligned with international best practices that cover various emergency response scenarios.
Total Recordable Incident Rate – Employees and Contractors
Ecopetrol S.A. places an important emphasis on understanding, monitoring and controlling our impacts on workers and contractors.
Ecopetrol S.A. monitors a standard measure of occupational safety known as the Total Recordable Incidents Frequency Index (TRIF), which represents the number of employee or contractor injuries that require medical treatment or time off for every million hours worked.
TRIF has improved from 4.28 incidents per million hours worked in 2010 to 1.09 in 2016. In 2016, 28% of occupational accidents affecting our employees and contractors resulted in a medical treatment, restricted work or time away from work that lasted for three days or less. Additionally, we had a 38% reduction in occupational incidents compared to 2015 as a result of the sustained implementation of the HSE management system.
Graph 7 – Total Recordable Incident Rate – Employees andContractors (*) (**)

Frequency of process safety incidents
Our “Process Safety Management” (PSM) strategy is to: first, define high-risk processes; second, prioritize intervention in high-risk processes; and third, apply all PSM elements in the prioritized high-risk processes.
Loss of primary containment is the number of unplanned or uncontrolled releases of oil, gas or other hazardous materials.
We report Tier 1 process safety events per million hours worked, which are the losses of primary containment of greatest consequence causing harm to a member of the workforce, costly damage to equipment or exceeding defined quantities according to API-754. We reduced ourmaintained the same Tier 1 process safety indicator by 33%performance compared to 2015 (2016: 0.062017 (0.05 in both 2017 and 2015: 0.09)2018). The reporting thresholds for API-754 Tier 1 is an unplanned or uncontrolled release of any material, including non-toxic and non-flammable materials, from a process that results in one or more health, safety or environmental consequences set forth under those guidelines. In 2016,2018, there were 0.060.05 Tier 1 process safety incidents per million hours worked.
Frequency of Tier 1 process safety incidents per hours worked (per million hours worked):
| 54 |
Graph 8 – Tier 1 Process Safety Incidents(*) (**)


| * | Tier 1 process safety incidents per million hours worked (API-754). |
| ** | Includes data for Ecopetrol S.A. and the Vice-Presidency of Transport and Logistics classified according to the criteria in API-754 Tier 1, but does not include |
Environmental Incidents
In 2016,2018, Ecopetrol S.A. recorded 811 environmental incidents, compared with 1114 in 20152017 and 298 in 2014.2016. The volume of oil spills was 730.26 barrels in 2018, an increase from 50.7 barrels in 2017 and 202 barrels in 2016, a decrease from 207 barrels in 2015 and 885 barrels in 2014.2016. The decrease in the numbers of environmental incidents and oil spills was the result of improvement in the identification of critical equipment operating in highhigh- or very high riskhigh-risk conditions, and the implementation of asset integrity plans designed to mitigate those risk conditions. The increase in oil spilled was due mainly to the Lisama 158/La Fortuna incident as described below.
Lisama 158/La Fortuna Incident
On March 2, 2018, a seepage of water and traces of crude oil occurred near the Lisama 158 well, located in the village of La Fortuna, in the Middle Magdalena Valley of Colombia. Ecopetrol activated its contingency plan to contain the spill. It is estimated that between March 12 and March 15, 550 barrels of crude, mixed with mud and rainwater, seeped into the streams of La Lizama and Caño Muerto. As of March 30, 2018, the Lisama 158 well was sealed and stopped flowing.
Ecopetrol’s internal investigation concluded that there were four concurrent critical factors leading to the incident and that in the absence of any of them, the incident would not have occurred.
The four critical factors were the following:
| ii. | The rupture or failure of the “blanking plug” produced a flow of unexpected fluids that required the injection of fluids at a pressure of 1,250 PSI, which in turn could have generated the loss of the mechanical integrity in the casing of 9 5/8” affected by wear. |
| iii. | Presence of a natural system of geological faults in the area, which in addition to the other factors, allowed well fluids to migrate to the surface. |
| iv. | Time of exposure of the upper formations to the over-pressure of the reservoir, which contributed to the emergence of fluids in a farm near the well, a mixture of water, mud, crude oil and gas. |
| 55 |
Corrective and mitigation actions implemented by Ecopetrol
With respect to the actions performed by Ecopetrol to address, mitigate other damages and manage the incident, in compliance of the obligations contained in Law 1523 of 2012, Presidential Decree 321 of 1999 and the contingency plan for the Lisama Well, Ecopetrol did the following:
| i. | Implementation of control and containment procedures to slow the spread of the spill and keep it contained. |
| ii. | Activities to protect the life and health of the surrounding communities. |
| iii. | Monitoring of the following resources: water, air and land. |
| iv. | Activities to protect and preserve fauna and flora in the area of influence and. |
| v. | Operational attention and verification of the causes which led to the incident. |
While CenitIn terms of attention to the incident, Ecopetrol coordinated actions and additional mitigation activities with several Colombian governmental authorities, including: the municipalities of Barrancabermeja, San Vicente de Chucurí and Puerto Wilches, the Department of Santander, the Environmental Regional Autonomous Authority of Santander, the Environmental Police of Barrancabermeja, the National Licensing Authority, the Colombian Red Cross, the Civil Defense, the Ministry Public, the Hydrocarbons National Authority, the Ministry of Environment and Sustainable Development, the Institute of Hydrology, Meteorology and Environmental Studies and, the Colombian Public Defender Office.
In addition, for the preparation and performance of the Environmental Recovery Plan (PRA) which Ecopetrol proposed and filed before the environmental authorities, Ecopetrol had previously followed Ecopetrol’s HSEthe support of the Biological Resources Investigation Institute Alexander Von Humboldt (pursuant to which a contract was entered into between the aforementioned parties). Furthermore, to ensure the attention and management of wildlife actually and potentially affected by the incident, Ecopetrol had the support and advice of Cabildo Verde Sabana de Torres, a non-governmental agency.
On another hand, the government of Colombia, through the Ministry of Environment and Sustainable Development, requested an independent audit review from a group of environmental and humanitarian experts, composed by the Joint UNEP/OCHA Environment Unit (JEU) and the activation of the UNDAC mechanism of the United Nations Office for the Coordination of Humanitarian Affairs. The aforementioned experts delivered a report that included a set of conclusions and recommendations which were accepted and included by Ecopetrol within the guidelines of its Environmental Recovery Plan (PRA).
The following are the most important milestones which were carried out by Ecopetrol in 2015, Cenit established its own HSE practicethe attention of the incident:
Since April 8, 2018, Ecopetrol intervened the Lisama Well with a snubbing unit (specialized unit which handles pressure), with the purpose to verify the integrity of the casing, the cement used for the casing and setto seal off the area where the spill was occurring. These activities finalized successfully on May 8, of 2018, when the Lisama Well was finally plugged with a double seal of cement.
On May 27, 2018, after ensuring that the activities described above were successfully performed to control the spill, the 63 families (approximately 177 individuals) which were directly affected by the spill returned to their homes.
On June 2, 2018, the technical abandonment of the Lisama Well initiated, a process which ended on the July 11, 2018.
On October 19, 2018 and defined its own HSE Key Performance Indicators (KPIs)in compliance to Resolution 1767 of 2006, Ecopetrol filed before the ANLA the Environmental Recovery Plan (PRA), whereby a plan to perform several activities to ensure the recovery of affected natural resources (water, air and targetsland) plus fauna and flora was prepared, including the following aspects:
Components of intervention:
| 1. | Activities to recover the biotic environment. |
| 56 |
| 2. | Activities to recover the abiotic environment. |
| 3. | Socio-economical activities. |
| 4. | Follow up activities. |
Intervention strategies:
| 1. | Water: Recovery of affected water bodies. |
| 2. | Land: Dismantling of the protection and defense mechanisms in place and reconfiguration and land suitability procedures on the site of the spill. |
| 3. | Flora: Following up and monitoring of regeneration regarding sapling and pole stage (brinzal y latizal) specimens; following up and monitoring of affected specimens; recovery of vegetation in place; recovery of the riparian vegetation of the gorge La Lizama and La Muerte canyon; incorporation of tree nurseries for the riparian vegetation recovery. |
| 4. | Fauna: Activities to manage wildlife specimens affected. |
| 5. | Social and Economical: Information and awareness campaigns. |
| 6. | Monitoring: Supervising and following up procedures of natural recovery. |
Additionally, Ecopetrol has been reporting the advances achieved of the Environmental Recovery Plan (PRA) to all competent authorities.
Investigations and legal claims
Investigations
As of the date of this report the following investigations are being conducted by environmental authorities and control agencies in respect of its non-operative facilitiesthe incident:
| · | The National Environmental Licensing Authority opened an investigation for environmental damages alleging violation of, among others, the due implementation of the Contingency Plan. The investigation is currently in the evidentiary stage. |
| · | The Attorney General’s Office (First Solicitor’s Office Delegate for Administrative Supervision) opened a disciplinary investigations against certain Ecopetrol’s employees for alleged disciplinary infringements related to the oil well abandonment process. The Company´s employees currently being investigated are: |
(i) Felipe Bayón (CEO and offices. This resultedformer Chief Operating Officer)
(ii) Héctor Manosalva Rojas (former Vice-President of Development and Production)
(iii) Ricardo Ernesto Coral Lucero (former Vice-President of the Central Region)
(iv) Oscar Ferney Rincón (Development and Production Operations Manager of the De Mares region)
An initial suspension order against those Ecopetrol workers was at first issued and lifted in significant cost reductions with no changeAugust 2018. Currently their investigations are in risk levelsthe probationary stage.
| · | The Prosecutor’s Office – National Human Rights Unit and International Human Rights has conducted a preliminary investigation against Ecopetrol and governmental employees for the alleged crime of environmental pollution due to the exploitation of mining or hydrocarbon deposits. Currently the investigation is in the pre-trial stage. |
| 57 |
Legal Claims
As of the date of this annual report:
| · | Seven writs of protection (injunctive actions) seeking the protection of fundamental rights have been ruled in favor of Ecopetrol. |
| · | In addition, there are two additional actions that have been filed before the Administrative Court of Santander, related to the Lisama 158 incident: |
-Approximately 600 people, members of the community and fishermen who live in 2015the vicinity of where the incident took place, filed a class action in the amount of COP $614,503,232,689, seeking compensation for damages allegedly suffered as consequence of the incident.
-Senator Antonio Eresmid Sanguino filed a class action seeking protection of collective rights (no compensation or indemnification petitions), arguing that the incident led to the destruction of (i) people´s health and 2016. Local(ii) damages to the environment caused by the incident.
As of the date of this annual report, both complaints were properly answered and field operations, however, are still conducted under Ecopetrol’s HSE model and guidelines.currently awaiting the commencement of the evidentiary stage.
Cenit intends to implementestablished its own HSE Management System based on Decree 1072 of 2015 in 2017, and this was implemented during the first half of 2017.2018. Cenit is also leading the definition of standard HSE KPIs withkey process indicators (“KPIs”) for all of the midstream subsidiaries to be able to measure the transportation business as a whole and share the lessons learned and best practices within the industry. Cenit consolidated the 2018 KPIs and agreed upon the goals for 2019 for the transportation business to obtain the results for each subsidiary and for the entire group. Local and field operations are mainly conducted under Ecopetrol’s HSE model and guidelines.
In 2016,2018, around 10.4 million6,779,729 man-hours were employed conducting Reficar’s business activities. Our HSE performance indicators for Total Recordable Cases (TRIF), Process Safety Incident (ISP) and Environmental Incident (EI) were well-withinwell within our established guidelines.expectations, but the indicator for Total Recordable Cases (TRIF) exceeded our established expectations (TRIF=1.2).
The following table covers Reficar´s Total Recordable Cases (TRIF)Reficar’s TRIF for 20152016, 2017 and 2016,2018, which includesinclude Ecopetrol Operation and Maintenance (O&M), Reficar and subcontractors. The table presents statistics related to construction, pre-commissioning, start-up and operating activities. Reficar has not reported more than 145 million man-hours without fatalities (accidents that caused deaths) during the period 2010-2016.2010 – 2018.
Table 39 – Performance Indicators
| METRIC | 2016 | 2015(1) | 2018 | 2017 | 2016 | |||||||||||||||
| Man-hours | 10,351,896 | 32,944,698 | 6.779.729 | 7.495.531 | 10.351.896 | |||||||||||||||
| Recordable accidents | 29 | 57 | 12 | 9 | 29 | |||||||||||||||
| Total recordable cases (TRIF)* | 2.80 | 1.73 | 1,77 | 1,2 | 2,80 | |||||||||||||||
| Environmental Incidents (EI) | 0 | 0 | 0 | 0 | 0 | |||||||||||||||
| Process Safety Incidents (ISP)* | 0.19 | 0.03 | 0 | 0,13 | 0,19 | |||||||||||||||
(1) In our annual report on Form 20-F for 2015, man hours and accidents corresponding to Reficar’s construction stage were reported. This report registers man hours and accidents of 2015 corresponding to the entire operation of the Refinery.
* In the second half of 2016, these risks were associated with the new stage of operation of the units while in 2015 they were associated with the construction, commissioning, precomissioning and start-up of the new refinery.
| * | In the second half of 2016, these risks were associated with the new stage of operation of the units. For 2017 and 2018, these risks were associated with normal operations. |
The results of other related performance indicators during 20162018 were:
| Lost Time Injury Incidents: |
Ecopetrol has a Human Rights Policy with an integrated and systemic management approach to human rights based on the due diligence principle, which we continued to strengthen in 2016.
In view of our commitment to respect and promote human rights, Ecopetrol updated its human rights risk assessment in order to evaluate and mitigate human rights impacts. As a result of this assessment, Ecopetrol S.A. has focused its efforts on the following principles:
| ii. | Medical Treatment Injury: zero incidents. |
| iii. | Restricted Work Incidents: 5 incidents, which include 5 for Ecopetrol O&M, and 0 incidents for Reficar and subcontractors; |
| iv. | Environmental Incidents: zero; and |
| v. | Process Safety Incidents: zero. |
3.9.2 Corporate Responsibility
During 2018, Ecopetrol updated its corporate responsibility strategic guidelines. These updated guidelines were developed based on the following three pillars:
| · |
| · |
| · |
As in previous years, during 2018 the Corporate Responsibility Area consulted the perceptions and expectations of our seven stakeholder groups (shareholders and investors; associates and partners; clients; contractors and its employees; employees and pensioners; community and local government; and national government) in respect of eleven attributes (i.e. compliance with made commitments, ethical and transparent behavior, responsibility with the community, the environment and Human Rights, among others).
On average, 73% of respondents rated these attributes in the two highest options on the scale. This represents an improvement of 3% to the result obtained in 2017 (70%). Of particular note, are the improvements in results obtained in the community and local government and associates and partners stakeholder groups.
During 2018, following the United Nations Guiding Principles on Business and Human Rights, we conducted two Human Rights risk assessments for the activities we carry out in our Oriente and Orinoquía regions, which represent the largest part of our gross production. As a result of the evaluations, action plans were proposed, which will guide the incorporation of the results in the processes of each relevant company.
Additionally, in 2018 we applied the Corporate Social Responsibility self-diagnosis designed by UNICEF for children and adolescents. The recommendations we received from this self-diagnosis will also be incorporated into the processes of each relevant company.
3.9.3 Environmental Sustainability
3.9.3.1 Environmental Practices
Ecopetrol S.A.
During 2016,2018, the environmental management strategy of Ecopetrol included the following components:
| Environmental Viability: this strategy concentrates on obtaining environmental licenses and permits as well as adequate land management that ensures the sustainability of operations through timely prevention efforts and management of environmental impacts, constant and systematic relationships with stakeholders and participation in the sustainable development of the territories in which we operate. |
| 59 |
| Climate Change: this strategy aims to decrease our carbon emissions and reduce the vulnerability of our operations and our facilities to the effects of climate change through the implementation of four strategic action lines: |
| Vulnerability and |
| Research and |
| Involvement in |
| Eco-efficiency: this strategy aims to maximize our efficient use of resources and mitigate our environmental impacts. Through this strategy, which extends to our supply chain, we seek to utilize energy, materials and, in general, all natural resources as efficiently as we can, thereby reducing the environmental impacts from our operations and projects and minimizing emissions, effluents and waste disposal from our operations and projects while taking into account our production benchmarks. |
| Integrated Management of Water Resources: |
Since 2009,In 2018, Ecopetrol has reported its achievements in the sphere ofperformance related to environmental management in its Sustainability Management Report to various relevant organizationsinstitutions focused onin promoting sustainable business practices,issues, such as the Dow Jones Sustainability Index, the Carbon Disclosure Project (CDP) and the CDP Water Information Request; Environmental Benchmarkingenvironmental benchmarking of ARPEL.Asociación Regional de Empresas del Sector Petróleo, Gas y Biocombustibles en Latinoamérica y el Caribe (ARPEL).
RefiningEcopetrol is committed to improving the quality of the fuels it supplies in order to contribute to a better air quality for Colombians and comply with fuel quality regulations. Taking advantage of being an integrated company, after April 2018, we reduced the sulfur content in our diesel B2 (98% fossil and 2% biodiesel) to under 25 ppm. In particular, in December 2018, the diesel that we distributed in Colombia had an average of 16 ppm of sulfur and the gasoline we distributed had an average of 108 ppm of sulfur, values that are lower than the current local regulations of 50 ppm in diesel and 300 ppm in gasoline.
Ecopetrol’s refining companiesIn compliance with Ecopetrol's Climate Change Strategy, since 2010, we have developed greenhouse gas reduction projects in various of our operating areas. As a result, in 2018, we achieved a reduction of about 1.2 million tons of CO2e, through the implementation of projects in energy efficiency and reducing gas flaring, among others.
Ecopetrol has been undertaking significant efforts to make efficient and rational use of energy resources in its production processes and to reduce energy consumption, and costs and carbon dioxide emissions. We focus on efficiency, reliability, and optimization and energy diversification.
Refining
During 2016,2018, the refinery segment’sBarrancabermeja refinery’s average monthly energy consumption was 61.42 MWhm (megawatts66 GWhm (gigawatts per hour per month) equivalents,, provided through self-generation. The Cartagena Refinery’s average monthly energy consumption was 67 GWhm (gigawatts per hour per month), 100% was provided through self-generation.
Production
Further, during 2018, Ecopetrol S.A.’s production segment had an average monthly energy consumption of 399 GWhm (gigawatts per hour per month) for its direct operation, from which 99.9%68% was provided through self-generation and the remaining 0.01%32% with non-regulated energy purchased from the National Transmission System.
ProductionThe cost of power transmission and the cost of operation and maintenance for the self-generation centers of the Rubiales field were reduced through the renegotiation of the contracts.
| 60 |
We also began the construction of our first solar complex that will allow us to supply part of the energy required by the Castilla field, becoming the largest self-generation park with non-conventional renewable sources in Colombia.
Transport
Further, during 2016, Ecopetrol S.A.’s production sector had an average a monthly energy consumptionThe cost of 272,839 MWhm (megawatts per hour per month)power transmission for Oleoducto de los Llanos (ODL) was reduced due to the optimization of its direct operation, from which 76% was provided through self-generation and the remaining 24% with non-regulated energy purchased from the National Transmission System.take or pay contract.
3.10 Related Party and Intercompany Transactions
Set forth below is a description of material related partyrelated-party transactions. For additional information about transactions with related parties, see Note 32 – Related Parties29 to our consolidated financial statements.
Ocensa
Ecopetrol S.A. has entered into a number of agreements with its 72.65%-owned subsidiary, Ocensa, of which the following are the most significant:
| · | In March 1995, Ecopetrol S.A. entered into an agreement for the transportation of crude oil through the Ocensa pipeline. Pursuant to the terms of this agreement, Ecopetrol S.A. was required to make monthly payments that varied, depending on both the volume of crude oil transported through the pipeline and a tariff imposed by Ocensa on the basis of Ocensa’s financial projections and their expected volumes of crude oil. On January 17, 2013, this agreement was amended as a result of Ocensa’s new business model. Among other changes, this amendment to the transportation agreement establishes the payment of the tariff, calculated according to Resolutions issued in 2010 by the Ministry of Mines and Energy. In 2013, another amendment was executed that modified the terms by which the payments of invoices should be made. In 2015 Ecopetrol received a temporary release of capacity from Vitol of 24,000 barrels per day for segment I and II and 14,000 barrels per day for segment III. |
On July 29, 2014, after Ocensa implemented and carried out an open process to receive offers to enter into transportation agreements for an extended capacity of approximately 135,000 barrels per day in Ocensa’s pipeline (the “P135 Project”), Ocensa accepted the proposal made by Ecopetrol S.A. to enter into a ship-or-pay transportation agreement for 70,000 barrels per day of crude.
On November 20, 2014, after a total and definitive assignment agreement that was notified to Ocensa on December 15, 2016, Ecopetrol became the successor of Hocol, of a ship-or-pay transportation agreement for 17,500 barrels per day, thus increasing Ecopetrol’s contracted capacity in the P135 Project to 87,500 barrels per day.
On July 1, 2017, with the consent of Ecopetrol and Ocensa, and as contemplated in the Act of Commencement of Operations issued by the Ministry of Mines and Energy (Resolution 31344 dated April 27, 2017), Ocensa started supplying increased capacity in the P135 Project.
On July 17, 2018, Ecopetrol and Ocensa entered into an amendment to the P135 ship-or-pay transportation agreements mentioned above (consisting of a capacity of 87,500 barrels of crude per day) in order to adjust the standard tariff and monetary conditions. This followed Ocensa having entered into a settlement agreement as approved by an arbitration panel with Frontera Energy Colombia and executed on May 15, 2018 pursuant to which the transportation tariff and monetary conditions in Ocensa's ship-or-pay transportation agreement with Frontera Energy Colombia in respect of the P135 Project were adjusted. Therefore, in application of regulatory principles, Ocensa offered similar terms to the remaining shippers of the P135 Project, including Ecopetrol, and executed (i) settlement agreements with those who accepted Ocensa's offer and (ii) the corresponding amendments to the transportation agreements.
In 2018, payments made by Ecopetrol S.A. under these two agreements amounted to US$1.049 million.
| · | On July 10, 2012, Ecopetrol entered into a |
| 2017. On |
The Ocensa shareholders’ agreement establishes the basis for Ocensa’s corporate governance model. It provides for a board of directors composed of five members, two of which must be independent. Cenit may nominate three members of the board of directors, including the two independent members, while minority shareholders may together nominate the remaining two members.
The Ocensa shareholders’ agreement provides the minority shareholders with certain rights, including the right to nominate two members of the five-member board of directors. Significant decisions must be approved by a qualified majority of at least four Ocensa shareholders, and by supermajorities of the outstanding Ocensa shares. These actions include, among others (i) issuing additional shares or publicly listing shares, declarations of dividends in amounts other than all distributable income and certain amendments to Ocensa’s bylaws and (ii) asset sales in excess of US$50 million;
| · | On October 28, 2013, Ecopetrol entered into a natural gas supply contract in force until November 30, 2018, pursuant to which Ecopetrol S.A. supplies gas to Ocensa and receives a fixed price per MBTU (million British Thermal Units). This agreement replaced the contract for natural gas supply in Cusiana entered into |
Ocensa has entered into the following agreements, among others, with some of our other subsidiaries:
| · | In March 1995, Equion and Santiago Oil Company entered into agreements for the transportation of crude oil through the Oleoducto Central S.A. (Ocensa) pipeline. In November 2012, Equion and Santiago Oil Company transferred, by means of various transactions, its shares (24.8%) and transportation rights (19.8%) holdings in the Ocensa pipeline to wholly owned subsidiaries of Ecopetrol S.A. (51%) and Talisman (49%). Equion and Santiago Oil Company kept 5% of transportation rights in Ocensa. In 2014, the transportation fees billed by Ocensa were: Equion (US$44.4 million), Santiago Oil Company (US$3.8 million) and Hocol (US$30.8 million). On January 17, 2013, this agreement was amended as a result of Ocensa’s new business model. Among other changes, the amendment to the transportation agreement establishes that tariff payments are to be calculated according to resolutions issued by the Ministry of Mines and Energy. On May 23, 2013, another amendment was executed that modified the terms by which the payments of invoices should be made. In |
| · | On July 9, 2012, Ocensa and ODL entered into a strategic alliance for the dilution of crude oil in the Cusiana station. The term of this contract is of five years. Once the initial term of the agreement ends, Ocensa has a purchase option over the assets that perform the dilution process. In 2015, the parties signed two addenda to the agreement in order to include additional construction work to be conducted by ODL and supervised by Ocensa for an agreed fee. In 2018 the parties agreed to extend the agreement for six months in order to negotiate the general terms and conditions for the following years. ODL paid Ocensa US$ |
Oleoducto de Colombia S.A. (ODC)
Ecopetrol S.A. entered into the following agreements with its 73%-owned subsidiary, ODC:
| · | In July 1992, a |
| 62 |
| · | In August 1992, an operation and maintenance agreement was signed for the Vasconia and Coveñas terminals both property of ODC. The duration of this agreement is indefinite, but can be terminated by any party upon six months’ notice. The initial contract included services rendered by Ecopetrol directly or by third-party contractors hired by Ecopetrol through |
| · | In March 1998, a joint operation agreement was signed for the TLU-1 Coveñas buoy. The duration of this agreement is indefinite and can be terminated by mutual agreement. In December 2013, Ecopetrol S.A. assigned its rights under this agreement to Cenit, though Ecopetrol S.A. kept its role as operator under the agreement. Pursuant to the terms of this agreement, ODC paid Ecopetrol S.A. approximately US$7 million in |
| · | In September 1999, a joint operation agreement was signed for the TLU-3 Coveñas buoy between Ocensa, ODC and Ecopetrol. Pursuant to the terms of this agreement, ODC paid approximately US$ |
| · | In July 2006, an operation and maintenance agreement was signed for the Caucasia station and the Vasconia-Coveñas pipeline system. The duration of this agreement is indefinite. Since 2010, this agreement only covers the operation of the Caucasia station and the Vasconia-Coveñas pipeline system, both property of ODC. The initial contract included services rendered by Ecopetrol directly or by |
ODC has entered into the following agreements with some of our other subsidiaries:
| · | Between March 1992 and January 1993, Hocol, Equion and Santiago Oil Company each entered into agreements with ODC for the transportation of crude oil through the Vasconia-Coveñas pipeline. The term of each of these agreements is indefinite. As of January 2013, the applicable tariff is the one set by the Ministry of Mines and Energy. In |
Oleoducto de los Llanos Orientales (ODL)
Ecopetrol S.A. has entered into the following agreements, among others, with its 65%-owned subsidiary, ODL:
| · | In March 2009, Ecopetrol S.A. entered into a ship-or-pay agreement with ODL that establishes a financing tariff used to pay ODL’s indebtedness to Grupo Aval for five years. This agreement was superseded by a new contract executed in May 2010, with a seven-year term, to reflect new conditions agreed with Grupo Aval. In August 2013, this contract was amended, providing a new term of seven years, including |
| · | In September 2009, Ecopetrol S.A. entered into a second ship-or-pay agreement with ODL that establishes a financing tariff collected through a trust fund that in turn is responsible for making debt service payments to security holders. Under this agreement, ODL committed to transport 19,500 bpd during the first phase of the ODL project (which began in September 2009 and ended in the first quarter of 2010) and 39,000 bpd upon commencement of the second phase of the ODL project which occurred in the first quarter of 2010 and was completed in the third quarter of 2016, |
| · | In December 2009, Ecopetrol S.A. entered into a service agreement with ODL to transport crude oil. This agreement was replaced in January 2014 by a new agreement that expires in December 2020. This is a |
| · | In March 2010, Ecopetrol S.A. entered into a pipeline operating and maintenance agreement with ODL. This agreement had an original five-year term and was amended in 2015 to extend the term another |
| · | In |
| · | In August 1, 2015, ODL entered into an indefinite management agreement with Oleoducto Bicentenario by means of which ODL receives legal representation and provides management services to Oleoducto Bicentenario. In August 1, 2017, the agreement was amended in order to change the way ODL is remunerated by this service, improving the structure of the agreement. Pursuant to the terms of this agreement, Bicentenario paid to ODL COP$ |
| 64 |
Oleoducto Bicentenario de Colombia S.A.S.
Ecopetrol S.A. has entered into the following agreements, among others, with its 55.97% owned subsidiary, Oleoducto Bicentenario:
| · | In June 2012, Ecopetrol S.A. entered into ship-or-pay and ship-and-pay |
| · | In June 2012, Ecopetrol S.A. and Hocol entered into storage or pay and storage and pay agreements with Oleoducto Bicentenario. Under these agreements, Oleoducto Bicentenario is committed to receive, store, preserve and deliver our crude oil. The storage or pay agreement will terminate when Oleoducto Bicentenario’s indebtedness to local banks has been entirely paid, and the duration of the storage and pay agreement is 20 years after the storage or pay agreement terminates. In April 2015, this contract was amended to modify certain definitions to reflect new terms from the negotiation of the debt, which included a modification of participant banks and a reduction of the interest rate. In September 2018, this agreement was assigned by Hocol to Ecopetrol. Pursuant to the terms of this agreement, |
| · | In August 2012, Ecopetrol S.A. entered into an Operation and Maintenance agreement for the Araguaney – Banadia pipeline system. The duration of this agreement is 15 years. This agreement was partially assigned in January 2017 by Ecopetrol to Cenit due to matters related to the management of plants and pipeline assets. In July 2018 Oleoducto Bicentenario and Cenit signed a settlement agreement to recognize costs related to this contract. Pursuant to the terms of those agreements, Bicentenario paid to Cenit COP$1.47 billion, plus applicable taxes, in 2018. |
| · | In November 2017, the maintenance obligations of the transportation system were partially assigned to Cenit S.A.S. During December 2017 the agreement was modified to exclude from its scope the Araguaney and Banadía Stations’ maintenance. In November 2018 the pipeline maintenance obligations were extended until April 2019. Pursuant to the terms of this agreement, Bicentenario paid to Ecopetrol S.A. |
| 65 |
Ecodiesel
| · | Ecopetrol S.A. entered into a supply agreement with Ecodiesel Colombia S.A. (“Ecodiesel”), a company in which Ecopetrol S.A. has a 50% equity interest. This agreement has been operative since August 1, 2010. Pursuant to the terms of this agreement, Ecodiesel must deliver to Ecopetrol S.A. and Ecopetrol S.A. must in turn purchase 48,100 barrels of Ecodiesel’s biodiesel production each month. Payments vary depending on the purchased volumes and the prices of biodiesel. This agreement was renewed on January 25, 2018 and expires on |
Savia Peru S.A.
| · | On February 19, 2016, Ecopetrol S.A., as lender and shareholder of 50%, and Savia Perú, as borrower, entered into a five-year loan agreement for an aggregate principal amount not to exceed US$70 million. The proceeds of the facility will be used to (i) repay short term loans and (ii) pay shortfalls related to final judgments (in case they materialize). The loan agreement accrues interest at an annual rate of 4.99%, which can be adjusted on an annual basis, with semi-annual interest payments and principal payments beginning on the 21st month following the disbursement date. Total disbursement was US$57 million through the disbursement period ended on December 31, 2017. As of April |
Transactions with Other State-Controlled Entities
Other than the agreements that we have entered into with the ANH, in the ordinary course of business we enter into transactions with other state-owned entities that include but are not limited to the following:
| · | Selling and purchasing goods, including crude oil purchases of ANH royalties (see below); |
| · | Properties and other assets; |
| · | Rendering and receiving services; |
| · | Leasing assets; |
| · | Depositing and borrowing money; and |
| · | Using public utilities. |
For the years ended December 31, 2016, 20152018, 2017 and 2014,2016, we purchased the following volumes of crude oil from the ANH (National Hydrocarbon Agency) corresponding to royalties paid in kind by oil producers in Colombia: 42.937.6 million barrels, 45.640.3 million barrels and 45.442.9 million barrels, respectively. See the sectionBusiness Overview—Applicable Laws and Regulations—Regulation of Exploration and Production Activities—Business Regulation—Royaltiesfor a description of the current royalty scheme.
We have a clear and defined corporate policy based on risk financing guidelines that summarizes the Company’s risk transfer and retention alternatives and provides support and guidance for all the insurance-related issues of all of our affiliated and subsidiary companies.
| 66 |
There are three corporate insurance programs covering Ecopetrol S.A. and its subsidiaries. In the text and tables below, we set forth our insurance programs and the companies covered, along with limits and coverage details.
Group 1- Downstream Program:This insurance program provides coverage for downstream (assets and operations) of Ecopetrol S.A. and all of its subsidiaries in excess of their local insurance programs, when applicable. Coverage includes all physical damage and sabotage and terrorism, which were designed to cover downstream operations.
Table 40 – Group 1 Downstream Program
| Limit (eel/agg*) | Deductible | Ecopetrol | Limit (eel/agg)(1) | Deductible | Ecopetrol | |||||||||||||||||||||||||||||||||||
| Onshore | Offshore | On shore | Off shore | Downstream | Reficar | Propilco | Onshore | Off shore | On shore | Off shore | Downstream | Reficar | Bioenergy | Esenttia | ||||||||||||||||||||||||||
| (figures in USD in millions) | (figures in USD millions) | |||||||||||||||||||||||||||||||||||||||
| Policies | ||||||||||||||||||||||||||||||||||||||||
| Property all risk | 2,744 | 0 | 5 | N/A | X | X | X | 3.50 | N/A | 5 | N/A | X | X | X | X | |||||||||||||||||||||||||
| Sabotage and terrorism | 600 | 0 | 0.5 | N/A | X | X | X | 600 | N/A | 0.5 | N/A | X | X | X | X | |||||||||||||||||||||||||
(*) Eel: each and every loss. Agg: Aggregate
| (1) | Eel: each and every loss. Agg: Aggregate. |
Group 2 – Up and MidstreamUpstream Program:This program provides coverage for upstream and midstream (assets and operations) of Ecopetrol’s interests and all of its upstream subsidiaries. Coverage includes all physical damage, sabotage and terrorism and control of wells.
Table 41 – Group 2 Upstream and Midstream Program
| Limit (eel/agg*) | Deductible | Ecopetrol | ||||||||||||||||||||||||||||||||||||||||||||||||||||||||||||
| Onshore | Offshore | Onshore | Offshore | Upstream | Equion | Hocol | América | Brazil | ODL | Cenit | ||||||||||||||||||||||||||||||||||||||||||||||||||||
| (figures in USD in millions) | Limit (eel/agg)*(1) | Deductible | Ecopetrol | Santiago | ECP | ECP Costa | ||||||||||||||||||||||||||||||||||||||||||||||||||||||||
| Policies | Onshore | Offshore | Onshore | Offshore | Upstream | Equion | Hocol | Oil | America | Brazil | ODL | Cenit | Afuera | |||||||||||||||||||||||||||||||||||||||||||||||||
| (figures in USD millions) | ||||||||||||||||||||||||||||||||||||||||||||||||||||||||||||||
| Property all risk | 400 | 400 | 0.25 | 0.5 | X | X | X | X | NA | X | X | 400(2) | 0.25 for assets over 5 million; 0.05 for assets under 5 million | 0.5 | X | X | X | X | N/A | N/A | N/A | N/A | X | |||||||||||||||||||||||||||||||||||||||
| Sabotage and terrorism | 55 | 0 | 0.5 | N/A | X | X | X | NA | NA | X | X | 55 | 0 | 0.5 | N/A | X | X | X | X | N/A | N/A | N/A | N/A | X | ||||||||||||||||||||||||||||||||||||||
| Control of Wells | 250/50** | 400 | 0.25-0.5 | 5 | X | X | X | X | X | NA | NA | 250 / 100(3) | 800/ 162.5 / 135 | 0.25 | 5 | /6 | X | X | X | N/A | X | X | N/A | N/A | X | |||||||||||||||||||||||||||||||||||||
| (1) | Eel: each and every loss. Agg: Aggregate. |
| (2) | US$250 million Property All Risk but US$400 million Maximum Loss limit and in the aggregate in respect of earthquakes. |
(*) Eel: each and every loss. Agg: Aggregate
(**) Drilling USD250M / Production USD50M
| (3) | Drilling: US$250 million; Production: US$100 million for wells with a depth of 10.001 or more feet, US$75 million for wells with a depth between 5.001 and 10.000 feet, and US$50 million for wells with a depth between 0 and 5.000 feet. |
Group 3 – Transversal Program:This program provides coverage for downstream, upstream and midstream operations of Ecopetrol and its subsidiaries and all of its subsidiaries in excess of their local insurance programs. Coverage includes general liability, directors and officers, cargo, crime and charterers’ liability.
Table 42 – Group 3 Transversal Program
| Limit (eel/agg*) | Deductible | Ecopetrol | Ecopetrol | |||||||||||||||||||||||||||||||||||||||||||||||||||||||||||||||||||||||||||||||
| On shore | Off shore | On shore | Off shore | Down stream | Reficar | Propilco | Up stream | Equion | Hocol | América | Brazil | ODL | Cenit | |||||||||||||||||||||||||||||||||||||||||||||||||||||||||||||||||||||
| (figures in USD in millions) | Limit (eel/agg)(1) | |||||||||||||||||||||||||||||||||||||||||||||||||||||||||||||||||||||||||||||||||
| Policies | Limit | Deductible | Ecopetrol | Reficar | Esenttia | Bioenergy | Equion | Hocol | Santiago Oil | ECP America | Brazil | Cenit | Ocensa | ODL | OBC | ODC | ||||||||||||||||||||||||||||||||||||||||||||||||||||||||||||||||||
| (figures in USD millions) | ||||||||||||||||||||||||||||||||||||||||||||||||||||||||||||||||||||||||||||||||||
| Third Party Liability | 500 | 500 | 1 | 1 | X | X | X | X | X | X | X | X | X | X | 500 | 1 | X | X | X | X | X | X | X | X | X | X | X | X | X | X | ||||||||||||||||||||||||||||||||||||||||||||||||||||
| Crime | 75/150 | Various | Various | X | X | X | X | X | X | NA | NA | NA | X | 75/150 | Various | X | X | X | X | X | X | X | X | X | N/A | N/A | N/A | N/A | N/A | |||||||||||||||||||||||||||||||||||||||||||||||||||||
| Directors& Officers | 250 | Various | Various | X | X | X | X | X | X | X | X | NA | X | |||||||||||||||||||||||||||||||||||||||||||||||||||||||||||||||||||||
| Directors & Officers | 170 | Various | X | X | X | X | X | X | X | X | X | X | X | X | X | X | ||||||||||||||||||||||||||||||||||||||||||||||||||||||||||||||||||
| Cargo | 120 | 3% dispatch | NA | X | X | NA | X | NA | X | NA | NA | NA | NA | 120 | 3% dispatch | X | X | N/A | N/A | N/A | X | N/A | N/A | N/A | N/A | N/A | N/A | N/A | N/A | |||||||||||||||||||||||||||||||||||||||||||||||||||||
| Charterers | 750 | 0.02 | NA | NA | NA | X | NA | NA | NA | NA | NA | NA | 750 | 0.02 | X | X | N/A | N/A | N/A | N/A | N/A | N/A | N/A | N/A | N/A | N/A | N/A | N/A | ||||||||||||||||||||||||||||||||||||||||||||||||||||||
(*) Eel: each and every loss. Agg: Aggregate
| (1) | Eel: each and every loss. Agg: Aggregate. |
Our third-party liability insurance policies cover Ecopetrol S.A., our subsidiaries and affiliates in excess of local underlying policy limits for claims made against them by third parties. Our commercial general liability coverage will pay on behalf of or indemnify amounts for which an insured becomes legally obligated to pay, including damages in respect of bodily injury, property, pollution and product liability. Coverage of bodily injury and property damage is subject to coverage territory during the policy period.
| 67 |
Ecopetrol’s midstream subsidiaries (Cenit, Ocensa, ODL, Bicentenario and ODC) have an independent program for its oil transportation companies (including crime and directors & officers policies).
Table 43 – Midstream Program
Limit (eel/agg)(1) | Deductible | |||||||||||||||||||||||||
| Onshore | Offshore | Onshore | Offshore | Cenit | Ocensa | ODL | OBC | ODC | ||||||||||||||||||
| (figures in millions of USD) | ||||||||||||||||||||||||||
| Policies | ||||||||||||||||||||||||||
| Property all risk | 200 | (2) | 200 | (2) | 0.25 | 0.5 | X | X | X | X | X | |||||||||||||||
| Sabotage and terrorism | 70 | 20 | (3) | 0.075 | 0.5 | X | X | X | X | X | ||||||||||||||||
| Third Party Liability | 100 | 100 | 0.35 | (4) | 0.35 | (4) | X | X | X | X | X | |||||||||||||||
| (1) | Eel: each and every loss. Agg: Aggregate. |
| (2) | US$200 million each company and an aggregated excess shared limit of US$500 million. |
| (3) | Included in property all risk policy. |
| (4) | US$0.35 million for pollution and US$0.09 million other events. |
The corporate insurance programs detailed above are subject to particular conditions, limits, sub-limits, deductibles, guarantees and exclusions applying for each line of insurance and each coverage. For purposes of this annual report, only the main limits and deductibles were mentioned in each group.
With respect to offshore operations in the U.S. Gulf Coast, Ecopetrol America Inc. is party to Operating Agreements, or OAS,OAs, that include customary conditions and which contain similar terms and provisions to those in the Model Form of Offshore Deepwater Operating Agreement of the American Association of Professional Landmen. In general, pursuant to these OAs, the obligations, duties, and liabilities of the contract parties are several, and not joint or collective, for all operations covered by the OAs.
Ecopetrol S.A. has a contract with two local insurance companies for domestic operations. The local policies relate to transit, accidents, mandatory policies, liability mandatory policies, and personal accidents policies, among others. Additional policies are requested from the insurers as they are needed.
3.12 Human Resources/Labor Relations
As of December 31, 2016,2018, the Ecopetrol Corporate Group had 10,92012,228 employees, an increase of 1.48%4.3% from 2015.2017. Most of our employees are located in Colombia. The table below presents the breakdown of Ecopetrol employees according to the business segments where they work, and the personnel of our subsidiaries for the years ended December 31, 2016, 20152018, 2017 and 2014.2016.
Table 4344 – Corporate Group’s Employees
| As of December 31, | As of December 31, | |||||||||||||||||||||||
| 2016 | 2015(1) | 2014(2) | 2018 | 2017 | 2016 | |||||||||||||||||||
| (number of employees) | (number of employees) | |||||||||||||||||||||||
| Ecopetrol S.A. | ||||||||||||||||||||||||
| Exploration and Production | ||||||||||||||||||||||||
| Exploration | 225 | 218 | 187 | 215 | 197 | 225 | ||||||||||||||||||
| Production | 2,095 | 1,880 | 2,022 | 2,258 | 2,141 | 2,095 | ||||||||||||||||||
| Others | 452 | 457 | 429 | 758 | 639 | 452 | ||||||||||||||||||
| Total Exploration and Production | 2,772 | 2,555 | 2,638 | 3,231 | 2,977 | 2,772 | ||||||||||||||||||
| Downstream | ||||||||||||||||||||||||
| Refining | 2,685 | 2,700 | 2,771 | 2,696 | 2,669 | 2,685 | ||||||||||||||||||
| Marketing | 133 | 136 | 199 | 136 | 132 | 133 | ||||||||||||||||||
| Others | 72 | 6 | 19 | 74 | 67 | 72 | ||||||||||||||||||
| Total Downstream | 2,890 | 2,842 | 2,989 | 2,906 | 2,868 | 2,890 | ||||||||||||||||||
| Transport | 949 | 1,158 | 1,251 | 798 | 817 | 949 | ||||||||||||||||||
| Others | 244 | 61 | 3 | 351 | 330 | 244 | ||||||||||||||||||
| Total Operations | 6,855 | 6,616 | 6,881 | 7,286 | 6,992 | 6,855 | ||||||||||||||||||
| Corporate | 1,993 | 2,115 | 2,269 | 2,417 | 2,290 | 1,993 | ||||||||||||||||||
| TOTAL ECOPETROL S.A. | 8,848 | 8,731 | 9,150 | 9,703 | 9,282 | 8,848 | ||||||||||||||||||
| Ecopetrol America Inc. | 71 | 75 | 57 | |||||||||||||||||||||
| Bioenergy S.A. | 145 | 122 | 96 | |||||||||||||||||||||
| Bioenergy Zona Franca S.A.S. | 258 | 126 | 94 | |||||||||||||||||||||
| Hocol S.A. | 179 | 172 | 185 | |||||||||||||||||||||
| Equion Energía Limited | 321 | 458 | 462 | |||||||||||||||||||||
| Oleoducto Central S.A. | 290 | 271 | 249 | |||||||||||||||||||||
| Oleoducto de Colombia S.A. | 2 | 2 | 1 | |||||||||||||||||||||
| Oleoducto de los Llanos S.A. | 55 | 56 | 33 | |||||||||||||||||||||
| Oleoducto Bicentenario de Colombia S.A.S. | 0 | 0 | 39 | |||||||||||||||||||||
| Ecopetrol del Perú S.A. | 0 | 0 | 0 | |||||||||||||||||||||
| Ecopetrol Costa Afuera de Colombia S.A.S. | 0 | |||||||||||||||||||||||
| Refinería de Cartagena S.A. | 170 | 270 | 247 | |||||||||||||||||||||
| Ecopetrol Óleo e Gás do Brasil Ltda. | 16 | 17 | 14 | |||||||||||||||||||||
| Polipropileno del Caribe S.A. (Esenttia S.A.) | 409 | 388 | 374 | |||||||||||||||||||||
| Cenit Transporte y Logistica de Hidrocarburos S.A.S. | 156 | 73 | 72 | |||||||||||||||||||||
| TOTAL | 10,920 | 10,761 | 11,073 | |||||||||||||||||||||
| As of December 31, | ||||||||||||
| 2018 | 2017 | 2016 | ||||||||||
| (number of employees) | ||||||||||||
| Ecopetrol America Inc. | 68 | 70 | 71 | |||||||||
| Bioenergy S.A.S. | 441 | 358 | 145 | |||||||||
| Bioenergy Zona Franca S.A.S. | 279 | 316 | 258 | |||||||||
| Hocol S.A. | 221 | 205 | 179 | |||||||||
| Equion Energía Limited | 284 | 298 | 321 | |||||||||
| Oleoducto Central S.A. | 275 | 290 | 290 | |||||||||
| Oleoducto de Colombia S.A. | 3 | 1 | 2 | |||||||||
| Oleoducto de los Llanos S.A. | 75 | 68 | 55 | |||||||||
| Oleoducto Bicentenario de Colombia S.A.S. | 0 | 0 | 0 | |||||||||
| Ecopetrol del Perú S.A. | 0 | 0 | 0 | |||||||||
| Ecopetrol Costa Afuera de Colombia S.A.S. | 0 | 6 | 0 | |||||||||
| Refinería de Cartagena S.A.S. | 153 | 185 | 170 | |||||||||
| Ecopetrol Óleo e Gás do Brasil Ltda. | 16 | 16 | 16 | |||||||||
| Polipropileno del Caribe S.A. (now Esenttia S.A.) | 428 | 417 | 408 | |||||||||
| Cenit Transporte y Logistica de Hidrocarburos S.A.S. | 282 | 217 | 156 | |||||||||
| TOTAL | 12,228 | 11,729 | 10,919 | |||||||||
The number of Polipropileno del Caribe S.A. (now Esenttia S.A.) employees reported in 2017 was re-stated to include Esenttia Masterbach’s employees. Essentia Masterbach is a subsidiary of Esenttia S.A.
Loans and investment on training and development for our employees
To improve the qualityAs part of life of our employees,its total compensation programme, Ecopetrol S.A. extends various types of loans to its employees, including housing loans and general-purpose loans. The principal amount of the loan depends on the applicant’s tenure and cannot exceed 59 times the applicant’s monthly salary.tenure. Ecopetrol S.A. does not guarantee any loans made by third parties. In 2016,Since January, 2018 and up February 2019, Ecopetrol S.A. extended 999913 housing loans for a total of COP$173184 billion and 1,7422,329 general-purpose loans for a total of COP$1321 billion. In 2018, Ecopetrol S.A. also provided on-site and external training and development, which totaltotaled to COP$5.720.8 billion, and it extended a total of COP$165213 billion in subsidies for education.
We have not provided loans (including housing loans), extended or maintained credit lines, arranged for the extension of credit by third parties, materially modified or renewed an extension of credit lines, in the form of a personal loan to or for any of our executive officers (defined as first line management under the bylaws of Ecopetrol S.A.) since our ADSs were registered under the Exchange Act.
There are no executive officers with housing loans from Ecopetrol.
Labor Regulation
In accordance with article 123 of the Colombian Constitution and the article 7th of the Law 1118 of 2006, our employees are considered “public servants”;servants,” even though they are subject to the common labor law. As such, their behavior is subject to the rules to those who handle public interests and goods and could be held liable for their illegal actions and omissions pursuant to the following regimes: (i) disciplinary (Law 734 of 2002), (ii) criminal or (iii) civil.
3.12.2 Collective Bargaining Arrangements
Ecopetrol S.A.
A collective bargaining agreement between us and our main labor unions governs labor relations with our unionized employees, which amounted to 4,18050.3% employees as of January 1, 2017.2019. The agreement also governs our labor relations with the 2,8182,657 non-unionized employees who, according to current labor legislation, have been beneficiaries of the collective bargaining agreement.
| 69 |
We currently have fiveeight industry-wide labor unions and seven company labor unions:
| · | Unión Sindical Obrera de la Industria del Petróleo — USO (industry labor union); |
| · | Asociación de Trabajadores Directivos Profesionales y, Técnicos |
| · | Sindicato Nacional de Trabajadores de Empresas Operadoras, Contratistas, Subcontratistas de Servicios y Actividades de la Industria |
| · | Unión de Trabajadores de la Industria Petrolera y Energética |
| · | Asociación Sindical de Trabajadores de la Industria del Petróleo – ASTIP (industry labor union); |
| · | Sindicato Nacional de Trabajadores de la Industria de los Hidrocarburos – SINATRINHI (industry labor union); |
| · | Asociación Sindical de |
| · | Sindicato Nacional de Trabajadores de Mantenimiento de la Industria del Petróleo, Gas y Carbón - SINTRAMANPETROL (industry labor union); |
| · | Asociación de Profesionales de Ecopetrol — |
| · | Asociación Sindical de Empleados de Ecopetrol – ASOPETROL (company labor union); |
| · | Asociación Sindical de Trabajadores de Ecopetrol – TRASINE (company labor union); |
| · | Asociación Sindical de Trabajadores de Ecopetrol – ASTECO (company labor union); |
| · | Sindicato de Trabajadores Petroleros de Ecopetrol – SINPECO (company labor union) |
| · | Sindicato de Profesionales de Ecopetrol S.A. – SINPROECOP (company labor union) |
Currently Ecopetrol S.A. does not have any workers in the SINCOPETROL union. This union does not participate in the negotiation process.
| · | Asociación de Profesionales y Tecnólogos Empleados de ECOPETROL S.A. – APROTECO (company labor union). |
Any employee working for any company in the oil and gas industry may join the USO, ADECO, SINDISPETROL, UTENUTIPEC, ASTIP, SINATRINHI, ASINTRAHC or ASTIP.SINTRAMANPETROL. Only our employees may join the company labor unions.
Ecopetrol S.A. relations with unions are based on a permanent dialogue and communication sessions where different matters are discussed in order to solve and prevent any labor conflict.
TheOur current collective bargaining agreement has been in effect since 2014July 1, 2018 and expires on June 30, 2018. In 2016, the agreement was reviewed on application matters, except for monetary expenses (including wageshas a term of four and benefits). This review ended with a mutual arrangement document, signedhalf years, expiring on December 10, 2016.31, 2022. The collective bargaining agreement included an increase in salaries at an annual rate of the local consumer price index (CPI) +1.21% for the remainder of 2018 and CPI +1.70% every year for the remainder of its duration. The agreement covers health, food, loans and transportation, among other benefits for workers, within reasonable criteria. It also includes union guarantees and addresses regulatory issues. The following unions are parties to the new collective bargaining agreement: USO, ADECO, TRASINE, UTIPEC, APROTECO, SINDISPETROL and ASINTRAHC.
| 70 |
This agreement currently covers all workers benefiting from the Collective Labor Convention, regardless of whether they are part of any labor union.
| 4. | Financial Review |
Our consolidated financial statements for the years ended December 31, 2014, 20152016, 2017 and 20162018 were prepared in accordance with IFRS. Our date of transition from our previous GAAP to IFRS was January 1, 2014.
IFRS differs in certain significant respectsaspects from the current Colombian IFRS (which is the accounting standard we use for local statutory reporting purposes). As a result, our financial information presented under IFRS is not directly comparable to certain of our financial information presented under Colombian IFRS. A description of the differences between Colombian IFRS and IFRS is presented underSummary of Differences between Internal Reporting (Colombian IFRS and IFRS) below.
Our consolidated financial statements were consolidated line by line and all transactions and significant balances between affiliates have been eliminated. These financial statements include the financial results of all subsidiaries companies controlled, directly or indirectly, by Ecopetrol S.A. See Exhibit 1—Consolidated companies, associates and joint ventures, to our consolidated financial statements included in this annual report.
4.1 Factors Affecting Our Operating Results
Our operating results were affected mainly by international prices of crude oil, and, to a somewhat lesser extent, international prices for refined products and local prices for natural gas, as well as sales volumes, product mix, exchange rate and our operational performance. Crude oil prices and volumes are particularly important to the results of our exploration and production segment. This is because as export volumes or export prices of crude oil and products decrease or increase, thusour revenues too.do also. Results from our refining activities are also affected by the price of crude oil used as raw material, changes in product prices in the international market, change in environmental regulations, conversion ratios and utilization rates and refining capacity, all of which affect our refining margins. ChangesTerrorist attacks by guerillas against our pipelines and other facilities or social unrest can lead to loss of revenues by restricting the availability of transport systems for exports or sales of crude oil and products and/or production activities, in addition to the direct costs of repairing and cleaning. Finally, changes in the value of foreign currencies, particularly the U.S. dollar against the Colombian Peso, can also have a significant effect on our financial statements. Finally, terrorist attacks by guerillas against our pipelines and other facilities can lead to loss of revenues by restricting the availability of transport systems for exports or sales of crude oil and products in addition to the direct costs of repairing and cleaning them.
Sales volumes and prices
Our results from the exploration and production segment dependsdepend mainly on our sales volumes and average local and international prices for crude oil petrochemicals and natural gas. Additionally, sales volumes are affected byalso reflect the purchase of crude oil and natural gas that we make from third parties and the ANH.
We sell crude oil mainlyand natural gas in the local and the international market. We also process crude oil at the Barrancabermeja and Reficar refineries and sell refined and other petrochemical products in the local and international markets.
Local sales and prices
We have a number of crude oil short-term commercial agreements with local customers, and natural gas short and long-term supply contracts with gas-fired power plants and local natural gas distribution companies. Local sale prices are determined in accordance with existing regulations, contractual arrangements and the spot market linked to international benchmarks. Local sales represent 48%49.9% of our total revenues, on average, for the past three years.
International Sales and Prices
Our foreign sales represented 52%50.1% of our total revenues, on average, for the past three years.
International sale prices are determined in accordance with contractual arrangements and the spot market linked to international benchmarks primarily ICE Brent benchmark.
A market diversification strategy has allowed us to focus towardscapture markets where we have been able to capture better valueobtain higher prices for our crudes and refined products. We sell our crudes and refined products in various regions, such as the U.S., Central America and the Caribbean, Asia and Europe. In our negotiations with potential customers, we seek to use the most liquid benchmark reference prices in each region.
| 71 |
Exploration costs
We account for exploratory drilling costs using the successful efforts method, whereby all costs associated with the exploration and drilling of productive wells are initially capitalized. Costs incurred in exploring and drilling of dry or unsuccessful wells are expensed in the period in which the well is determined to be a dry or unsuccessful well and are accounted for under “Exploration and Project expenses.” Consequently, an increase in the number of exploratory wells we declare as dry or unsuccessful will negatively affect our results and may cause volatility in our operating expenses. See Note 4.7 to our consolidated financial statements for a summary of our accounting policy for exploration costs.
Royalties
Each of our production contracts has its own royalty arrangement in accordance with applicable law. Law 141 of 1994 established a royalty fixed rate equivalent to 20% of total production. In 1999, a modification to the royalty system established a sliding scale for royalty percentage linked to the production level of crude oil and natural gas to fields discovered after July 29, 1999, depending on whether the production is crude oil or natural gas, and on the quality of the crude oil produced. Since 2002, as a result of the enactment of Law 756 of 2002, the royalty percentage has ranged from 8% for fields producing up to five thousand bpd to 25% for fields producing an excess of 600 thousand bpd. Producing fields pay royalties in accordance with the applicable royalty rate at the time of the discovery. Also, Law 756 of 2002 establishes that in the fields of the association contracts that finalize or revert back, an additional royalty rate of 12% of the basic production applies. Therefore, pursuant to this law, in 2016, as a result of the return of the Rubiales field to Ecopetrol in July 2016, the royalty rate went from 20% to 32%.
Since January 2014, the ANH has collected natural gas production royalties from producers settled in cash based on a formula, regardless of whether a producer has sold the gas. As a result, we no longer commercialize this gas on behalf of the ANH. In addition, because the royalties are now payable to the ANH in cash, all the gas we produce is considered part of our reserves and production, without any deduction for royalties. The cost of natural gas royalties totaled COP$ 478,332423,939 million in 2016.2018.
Purchases of hydrocarbons
We continue purchasingpurchase all crude oil delivered to the ANH as royalties by us and by third parties. The purchase price is calculated according to a formula set forth in a contract between usEcopetrol and the ANH that reflects our export sales prices (crudes and products), a quality adjustment for API gravity and sulfur content, transportation rates from the wellhead to the Coveñas andor Tumaco ports and a marketing fee. We sell the physical product purchased from the ANH as part of our ordinary business. In June 2016, theThe contract between the ANH and us was extended until June 30, 2018.
Our purchases of hydrocarbons from the ANH are made in the ordinary course of business, and on terms comparable to those offered to private parties. We have established procurement policies and approval processes for purchases of products and services, which do not depend on whether the counterparties are state-owned entities.January 31, 2020.
Since 2016, we importhave imported crude oil for Reficar feedstock when such imports are to result in a better operational or economic performance of the Ecopetrol Group.
4.2 Effect of Taxes, Exchange Rate Variation, Inflation and the Price of Oil on our Results
In December 2016, the Colombian Congress adopted Law 1819, which introduced more changes to the Colombian tax system, applicable beginning in 2017, including the following aspects:
| · |
| · | An income tax surtax for profits above COP$800 million is set which will be 6% |
| · | Taxpayers must calculate their taxable income taking as initial base the year and result under Colombian IFRS. Accounting profit is reconciled to obtain the net income |
| · |
| (i) | For non-resident shareholders: (i) a 5% dividend tax if the dividend is paid out of profits that were accrued as of January 1, 2017 and were taxed at the corporate level; (ii) no dividend tax if the dividend is paid out of profits that accrued prior to and including December 31, 2016 and were taxed at the corporate level; (iii) a 35% withholding tax rate on dividends distributed from profits not taxed at the corporate level if the dividend is paid out of profits that accrued as of January 1, 2017, plus an additional, 5% dividend tax after applying the initial 35% withholding tax rate; and (iv) a 35% withholding tax rate on dividends distributed from profits not taxed at the corporate if the dividend is paid out of profits that accrued prior to and including December 31, 2016. |
| (ii) | For Colombian individuals: dividends paid were taxed at 5% if they were between 600 and 1,000 Tax Value Unit (“UVT” orUnidad de Valor Tributario for its acronym in Spanish) and 10% if they were greater than 1,000 UVT. |
| · | Dividends paid to local corporations during 2017 and 2018 were not subject to any income tax, provided that such dividends were taxed at the corporate level. |
| · | Tax lossesaccrued as of fiscal year 2017 may be offset against ordinary net income obtained in the following 12 taxable years. |
| · | Depreciation and amortization methods and annual percentages are limited to |
| · |
| · | The |
| · | The charge on financial transactions is |
| · |
|
For the oil and gas industry the tax reform includesadditional information SeeNote 10.4of our Finacial Statements.
The 2016 Tax Reform included two tax benefits that are expected to improve the operations of the oil and gas industry:
For exploration activities, the “CERT” (for its acronym in Spanish) incentive was approved, consisting of the reimbursement of part of the investment made in the exploration phase. The reimbursement will depend on certain percentages that should be established and further regulated by Colombian Government.
The CERT will be granted when the income tax return is filed, subject to the procedure to be established by the Colombian Government.
The CERT can only be redeemed to pay taxes and is effective up to two years after it is issued. However, the CERT can also be sold and traded in fixed income market.
For production activities, the CERT will be granted exclusively to investments that increase the recovery factor, i.e. investments that increase the reserves that are currently proved in certain wells.
The effect of this regulation is still uncertain and will depend on how and when the government issues the detailed regulations.“CERT: Certificado de Reembolso Tributario” incentive:
| · | For exploration activities, the “CERT” (for its acronym in Spanish) incentive was approved, consisting of the reimbursement of part of the investment made in the exploration phase. |
| · | The CERT will be granted when the income tax return is filed. |
| · | The CERT can only be redeemed to pay taxes at the national level and its effective maturity date is two years after it is issued. Nevertheless, Decree 2253 of 2017 establishes that a CERT redemption can be made from year two to year five, as from the date of the granting of the incentive. The CERT can also be sold and traded in fixed income market. |
| · | For production activities, the CERT reimbursement will be granted exclusively to investments that increase the recovery factor,i.e. investments that increase the reserves that are currently proved in certain wells. |
| 73 |
| · | On December 29, 2017, the Colombian Government issued Decree 2253, which establishes that companies who (i) qualify as operators of association agreements entered into with Ecopetrol, (ii) have exploration and production of hydrocarbons agreements and (iii) are currently involved in the exploration and production of hydrocarbons, among others, can also qualify for the CERT. Additionally, the CERT will not qualify as taxable income or capital gain for the taxpayer receiving or acquiring such incentive. |
| · | On March 23, 2018, the following Resolutions were issued in order to regulate the procedures and requirements that companies must comply to claim the CERT: 0860 of Ministry of Finance and Public Credit, 108 of ANH and 40284 and 40285 of Ministry of Mines and Energy. |
Refundable VAT on O&G exploration:
Taxpayers in the oil and gas industry are entitled to refund VAT paid in the exploration phase for offshore projects. Taxpayers can request for this VAT as of the next fiscal year in which the investment was made. VAT that is reimbursed cannot be used as a higher cost or expense for income tax purposes.
In December 2018, the Colombian Congress adopted Law 1943, which introduced the following key changes to the Colombian tax system, among others:
| · | The corporate income tax rates will be gradually reduced from 33% to 30% as follows: 33% in 2019, 32% in 2020, 31% in 2021 and 30% 2022 onwards. |
| · | The presumptive income tax rate will be reduced to 1.5% for fiscal years 2019 and 2020 and 0% from 2021 onwards. |
| · | The creation of a “normalization tax” in order to enable taxpayers to regularize certain omissions of information about their assets and/or incorrect information about their liabilities, subject to the payment of a 13% tax on the value of the amount of the omitted information. |
| · | Introduces the Colombian Holding Companies (CHC) regime. |
| · | As of 2019, taxes are fully deductible if they are effectively paid during the fiscal year, except for: (i) income tax, equity tax and normalization tax are non-deductible; (ii) only 50% of the financial transactions tax is deductible; and (iii) only 50% of the industry and commerce tax can be taken as a discount (tax credit) to income tax. |
| · | VAT paid on the acquisition, import, creation or construction of tangible fixed assets used in income generating activities may be treated as discount (tax credit) for income tax purposes, in the same year or in future years. |
| · | The dividend tax regime was modified and, as of 2019, will be as follows: |
| (i) | For resident companies and non-resident shareholders (companies and individuals): (i) a 7.5% dividend tax on dividends distributed from profits taxed at the corporate level (except that dividends paid to non-resident shareholders out of profits taxed at the corporate level prior to and including December 31, 2016, are not subject to this tax); and (ii) 33% withholding tax rate on dividends distributed from profits not taxed at the corporate level (32% for 2020, 31% for 2021 and 30% as of 2022), plus an additional 7.5% dividend tax after applying the initial 33% withholding tax rate. |
| (ii) | For Colombian resident individuals: dividend income in excess of 300 UVT is taxed at a rate of 15%. |
| 74 |
The functional currency of each of the companies of Ecopetrol Group company is determined in relation to the main economic environment where each company operates; however our consolidated financial results are reported in Colombian Pesos, which is the Ecopetrol Group’s functional and presentation currency. A substantial part of our consolidated revenues comingcomes from Ecopetrol Group companies whose functional currency is the Colombian Peso. The conversion effect from U.S. dollar to Colombian Peso is derived frommainly due to local sales and exports of crude oil, natural gas and refined products whose prices are sold at prices referenced tobased on benchmarks quoted in U.S. dollars. Therefore, they are exposed to foreign currency exchange risk on revenues, capital expenditures and financial instruments that are denominated in a currency other than its functional currency.
Fluctuations in the U.S. dollar-Colombian Peso exchange rate have effects on our consolidated financial statements. As crude oil is priced in U.S. dollars, fluctuations in the exchange rate of the Colombian Peso against the U.S. dollar may have a significant impact on revenues, cost, monetary assets and liabilities held in foreign currency.
An appreciation of the Colombian Peso has a negative impact on our results of operations because our revenues from exports of crude oil, natural gas and refined products are primarily expressed in Colombian Pesos.U.S. dollars. Costs of imported goodsproducts and contracted services expressed in U.S. dollars will also be lower when expressed in Colombian Pesos, but on balance, our operating income in Colombian Pesos tends to decline when the Colombian Peso appreciates, other factors being equal. The appreciation of the Colombian Peso against the U.S. dollar also decreases the debt service requirements of our Companies with the Colombian Peso as their functional currency, as the amount of the Colombian pesos necessary to pay principal and interest on foreign currency debt decreases with the appreciation of the Colombian Peso.
Conversely, when the Colombian Peso depreciates against the U.S. dollar, our reported revenues, costs related to imported goodsproducts and services, interest costs, and operating income, all tend to increase. As crude oil is priced in U.S. dollars, fluctuations in the exchange rate of
During 2018, the Colombian Peso depreciated slightly on average 0.2% against the U.S. dollar may have a significant impactdollar. During 2017, the Colombian Peso appreciated on revenues, cost, assets and liabilities held in foreign currency.
Duringaverage 3.35% against the U.S. dollar. In 2016, 2015 and 2014, the Colombian Peso depreciated on average 11.18%, 37.28% and 7.05%, respectively, against the U.S. dollar. Additionally, as of December 31, 20162018 the Colombian Peso appreciated 4.72%Peso/U.S. dollar exchange rate depreciated 8.91% from the rate a year earlier. AsIn contrast, of December 31, 20152017 and 2014, in contrast,December 31, 2016, the Colombian Peso depreciated 31.64%Peso/U.S. dollar exchange rate appreciated 0.56% and 24.17%,4.72% respectively from the rate a year earlier.
In 2018, our consolidated debt in foreign currency decreased by a total of US$2,123 million mainly as a result of prepayments of local and foreign currency of US$2,446 million and amortization of foreign currency capital expenditures. In 2017, our consolidated debt in foreign currency decreased by a total of US$2,582 million mainly as a result of prepayments of foreign currency denominated loans of US$2,400 million and amortization of foreign currency capital expenditures. In 2016, our consolidated debt in foreign currency increased by a total of US$975 million as Ecopetrol S.A. raised US$475 million through international loans and US$500 million through an international bond issuance. In 2015, our consolidated debt in foreign currency increased by a total of US$3,425 million as Ecopetrol S.A. raised US$1,925 million through an international loan and US$1,500 million through an international bond issuance. In 2014, our consolidated debt in foreign currency increased through international bond issuances by Ecopetrol S.A. and Ocensa for a total of US$3,700 million.
As of December 31, 20162018 our U.S. dollar-denominateddollar denominated total debt was US$15.2 billion,10,467 million, which we recognize in our financial statements at its amortized cost, which corresponds to the present value of cash flows, discounted at the effective interest rate. Out of this total, US$12 billion9,689 million relates to Ecopetrol S.A., whose functional currency is the Colombian Peso. Therefore, when the Colombian Peso depreciates against the U.S. dollar, Ecopetrol S.A. is exposed to an exchange rate loss. In contrast, when the Colombian Peso appreciates against the U.S. dollar, Ecopetrol S.A. has an exchange rate gain. Some of the Ecopetrol Group companies have the U.S. dollar as their functional currency and are not exposed to a material exchange rate risk resulting from fluctuations in the Colombian Peso against the U.S. dollar. On the asset side, when the financial statements of the Group are consolidated, the exchange rate differential of the subsidiaries’ assets and liabilities whose functional currency is the U.S. dollar is recognized directly in equity, as part of the other comprehensive income.
The CompanyIn 2015, Ecopetrol S.A. adopted hedge accounting, as part of its risk management strategy, using two types of natural hedges with its U.S. dollar debt as a financial instrument: i)(i) a cash flow hedge for exports of crude oil and ii)(ii) a hedge of athe net investment in a foreign operation.operations. As a result of the implementation of both hedges 88% ($10.5 billion)67.1% (US$6,500 million) of Ecopetrol S.A.’s debt in U.S. dollars, as of December 31, 2018, was designated as a hedge. With the adoption of hedge accounting, the effect of the volatility of the foreign exchange rate on the hedged portion of the debt is recognized directly in equity, as part of the other comprehensive income.
| 75 |
The remaining portion of Ecopetrol S.A.’s U.S. dollar-denominated debt, as well as the financial assets and liabilities denominated in foreign currency, continues to be exposed to the fluctuation in the exchange rate, which means that an appreciation of the Colombian pesoPeso against the U.SU.S. dollar could generate a loss iffor companies whose functional currency is the Colombian pesoPeso that have an activea net position in U.S. dollars or a gain if they have a net liability position in U.S. dollars. Conversely, a depreciation of the Colombian pesoPeso against the U.S. dollar could generate a gain iffor companies whose functional currency is the Colombian peso that have a net active position in U.S. dollars or a loss if they have a net liability position in U.S. dollars.
As of December 31, 2016,2018, Ecopetrol Group companies withhave the U.S. dollar as functional currency haveequivalent of a net active U.S. dollar position of US$0.7 million after the instrumentsimplementation of the natural hedging previously mentioned.mentioned above, neutralizing the effect of exchange rate fluctuations in their results for the year.
Inflation in Colombia has not exceeded anThe average annual rate of 8%inflation in Colombia for the past ten years.years is 4.04%. It decreased in 20162018 as compared to 2015.2017. As measured by the general consumer price index, average annual inflation in Colombia for the years ended December 31, 2018, 2017 and 2016 2015was 3.18%, 4.09% and 2014; inflation was 5.75%, 6.77% and 3.66%, respectively. The decrease in inflation in 20162018 is mainly explained bydue to the normalizationfavorable price behavior of prices as a consequence of the ending of “El Niño” weather phenomenonboth tradable and the slight appreciation of the Colombian Peso against the U.S. dollar in the second half of 2016.non-tradable items. Cost inflation in the prices of goods, raw materials, interest cost of debt in local currency indexed to inflation and services that are necessary for the development and operation of oil and gas producing assets can vary over time and between each market segment.
The average price of ICE Brent crude in 2018 was US$71.7 per barrel as compared to US$54.7 per barrel in 2017 and US$45.1 per barrel in 2016 as compared to US$53.6 per barrel in 20152016. See sectionStrategy and US$99.3 per barrel in 2014. As a consequence, our average price crude oil basket was US$35.7 per barrel in 2016 as compared to US$43.9 per barrel in 2015 and US$87.3 per barrel in 2014, which represents a decrease of US$8.2 per barrel in 2016 compared to 2015. This decrease is mainly explained by a continuing imbalance between supply and demand in the global crude market due to higher OPEC production as well as a resilient North American production. Nevertheless, the Ecopetrol’sMarket Overview.
In addition, Ecopetrol’ average crude oil basket price relative to ICE Brent reported a discount of US$9.48.50 per barrel in 2018, a higher discount than the US$6.90 in 2017 and a lower discount than the $9.40 observed in 2016 stronger thandue to: (i) our knowledge of the US$9.7refining market for heavy and US$12 observedintermediate crudes, (ii) the ability to identify and capture opportunities in 2015the United States and 2014, respectively, dueAsia, and (iii) the incorporation of new refinery customers in those markets. Our average price crude oil basket was US$63.2 per barrel in 2018 as compared to US$47.8 per barrel in 2017 and US$35.7 per barrel in 2016, which represents an active commercial strategy.increase of US$15.4 per barrel in 2018 compared to 2017.
In theOperating Results section below, we present the impact of the price decline inincrease on our revenue and cost of sales.
Additionally, fluctuations in the price of oil have had an impact on the value of our oil and gas reserves. TheReserves valuation of these reserves wasis made using a price in accordance with SEC price regulations. A declineVolatility in hydrocarbon prices, refining margins and reserves, as well as changes in environmental regulations may lead to the recognition of impairment or recovery of non-recurring assets. In 2015, in connection with the current adverse economic context faced by the hydrocarbons sector, which resulted in a reduction in forecasted oil prices and an increase in market and country risk that is reflected in the discount rate, as well as a reduction in the recoverable reserves amount and refining margin, among other factors, Ecopetrol recognized an impairment of non-current assets of COP$7,864,875 million before taxes. In 2016, in connection with our evaluation of the recoverable amount of the assets value, which includes the variation in estimations of future prices under the current scenarios of OPEC’s oil quota agreements and the impact resulting from changes on specifications issued by the International Marine Organization agreement regarding marine pollution, Marpol on crude and fuels with high sulfur content, Ecopetrol recognized an impairment of non-current assets of COP$928,747 million before taxes.
For additional information about this impairment charges, and reversals, see Notes 14, 17sectionsOperating Results—Consolidated Results of Operations—Impairment of non-current assets,Segment Performance and 28Analysis and Note 16 to our consolidated financial statements.
Our consolidated financial statements for the years ended December 31, 2014, 20152018, 2017 and 2016 were prepared in accordance with IFRS. Our date of transition to IFRS was January 1, 2014. The detail of the accounting policies is described in Note 4 to our consolidated financial statements.
4.4Critical Accounting Judgments and Estimates
Critical accounting policies are those policies that require us to exercise judgment or involve a higher degree of complexity in the application of the accounting policies that currently affect our financial condition and results of operations. The accounting judgments and estimates we make in these contexts require us to calculate variables and make assumptions about matters that are highly uncertain. In each case, if we had made other estimates, or if changes in the estimates occur from period to period, our financial condition and results of operations could be materially affected.
| 76 |
See Note 3 to our consolidated financial statements for a summary of the critical accounting judgments and estimates applicable to us. There are many other areas in which we use estimates about uncertain matters, but we believe the reasonably likely effect of changed or different estimates would not be material to our financial presentation.
The following discussion is based on information contained in our audited consolidated financial statements and should be read in conjunction therewith.
4.5.1Consolidated Results of Operations
The following table sets forth components of our income statement for the years ended December 31, 2016, 20152018, 2017 and 2014.2016.
Table 4445 – Consolidated Income Statement
| Income Statement | For the Years ended December 31, | % Change | ||||||||||||||||||
| (Colombian Pesos in millions) | 2016 | 2015 | 2014 | 2016/2015 | 2015/2014 | |||||||||||||||
| Revenue | 48,485,561 | 52,347,271 | 65,971,888 | (7.4 | ) | (20.7 | ) | |||||||||||||
| Cost of Sales | 34,251,423 | 36,994,516 | 42,975,128 | (7.4 | ) | (13.9 | ) | |||||||||||||
| Gross Profit | 14,234,138 | 15,352,755 | 22,996,760 | (7.3 | ) | (33.2 | ) | |||||||||||||
| Operating Expenses | 4,400,843 | 5,356,715 | 6,243,166 | (17.8 | ) | (14.2 | ) | |||||||||||||
| Impairment of non-current assets | 928,747 | 7,864,875 | 2,304,567 | (88.2 | ) | 241.3 | ||||||||||||||
| Operating Income | 8,904,548 | 2,131,165 | 14,449,027 | 317.8 | (85.3 | ) | ||||||||||||||
| Finance results, net | (1,175,367 | ) | (7,663,104 | ) | (3,510,669 | ) | (84.7 | ) | 118.3 | |||||||||||
| Share of profit of companies | 61,345 | (46,687 | ) | 166,070 | (231.4 | ) | (128.1 | ) | ||||||||||||
| Income before income tax | 7,790,526 | (5,578,626 | ) | 11,104,428 | (239.6 | ) | (150.2 | ) | ||||||||||||
| Income tax | (4,543,046 | ) | (710,353 | ) | (5,434,855 | ) | 539.5 | (86.9 | ) | |||||||||||
| Net Income (loss) | 3,247,480 | (6,288,979 | ) | 5,669,573 | (151.6 | ) | (210.9 | ) | ||||||||||||
| Net Income (loss) attributable to: | ||||||||||||||||||||
| Company’s shareholders | 2,447,881 | (7,193,859 | ) | 5,046,517 | (134.0 | ) | (242.6 | ) | ||||||||||||
| Non-controlling interest | 799,599 | 904,880 | 623,056 | (11.6 | ) | 45.2 | ||||||||||||||
| Net Income (loss) | 3,247,480 | (6,288,979 | ) | 5,669,573 | (151.6 | ) | (210.9 | ) | ||||||||||||
| Income Statement | For the Years ended December 31, | % Change | ||||||||||||||||||
| (Colombian Pesos in millions) | 2018 | 2017 | 2016 | 2018/2017 | 2017/2016 | |||||||||||||||
| Revenue | 68,603,872 | 55,954,228 | 48,485,561 | 22.6 | 15.4 | |||||||||||||||
| Cost of sales | 41,184,379 | 36,908,325 | 34,251,423 | 11.6 | 7.8 | |||||||||||||||
| Gross Profit | 27,419,493 | 19,045,903 | 14,234,138 | 44.0 | 33.8 | |||||||||||||||
| Operating expenses | 4,592,445 | 4,185,186 | 4,400,843 | 9.7 | (4.9 | ) | ||||||||||||||
| Impairment of non-current assets | 368,634 | (1,311,138 | ) | 928,747 | (128.1 | ) | (241.2 | ) | ||||||||||||
| Operating Income | 22,458,414 | 16,171,855 | 8,904,548 | 38.9 | 81.6 | |||||||||||||||
| Finance results, net | (2,010,375 | ) | (2,495,731 | ) | (1,175,367 | ) | (19.4 | ) | 112.3 | |||||||||||
| Share of profit of companies | 165,836 | 93,538 | 61,345 | 77.3 | 52.5 | |||||||||||||||
| Income before income tax | 20,613,875 | 13,769,662 | 7,790,526 | 49.7 | 76.7 | |||||||||||||||
| Income tax | (8,258,485 | ) | (5,800,268 | ) | (4,543,046 | ) | 42.4 | 27.7 | ||||||||||||
| Net Income (loss) | 12,355,390 | 7,969,394 | 3,247,480 | 55.0 | 145.4 | |||||||||||||||
| Net income (loss) attributable to: | ||||||||||||||||||||
| Company’s shareholders | 11,381,386 | 7,178,539 | 2,447,881 | 58.5 | 193.3 | |||||||||||||||
| Non-controlling interest | 974,004 | 790,855 | 799,599 | 23.2 | (1.1 | ) | ||||||||||||||
| Net Income (loss) | 12,355,390 | 7,969,394 | 3,247,480 | 55.0 | 145.4 | |||||||||||||||
| 4.5.1.1Total Revenues |
Table 45 – Third-Party Revenues by Business Segment
The following table sets forth our principal sources of third-party revenues by business segment for the years ended December 31, 2016, 20152018, 2017 and 2014.2016. An explanation of how we classify our operations into business segments is included in Section 4.5.24.5.1.8 below.
| 2016 | 2015 | 2014 | % Change Sales Revenues | |||||||||||||||||||||||||||||||||||||||||
Revenue by segment | Volume (barrels equivalent) | Average price U.S. dollars/ barrels | Sales revenues (Colombian Pesos in millions) | Volume (barrels equivalent) | Average price U.S. dollars/ barrels | Sales revenues (Colombian Pesos in millions) | Volume (barrels equivalent) | Average price U.S. dollars/ barrels | Sales revenues (Colombian Pesos in millions) | 2016/2015 | 2015/2014 | |||||||||||||||||||||||||||||||||
| Local crude oil | 5,288,631 | 35.0 | 553,666 | 4,904,765 | 38.5 | 491,279 | 8,202,886 | 74.7 | 1,213,718 | 12.7 | (59.5 | ) | ||||||||||||||||||||||||||||||||
| Foreign crude oil | 159,311,257 | 35.7 | 17,278,579 | 178,581,520 | 44.0 | 21,181,265 | 176,233,111 | 87.9 | 30,835,510 | (18.4 | ) | (31.3 | ) | |||||||||||||||||||||||||||||||
| Trading of crude oil | - | - | - | 17,526,239 | – | 1,309,196 | 17,977,861 | – | 1,486,060 | (100.0 | ) | (11.9 | ) | |||||||||||||||||||||||||||||||
| Natural gas local | 27,543,046 | 23.6 | 1,988,336 | 30,831,442 | 21.8 | 1,845,345 | 30,218,758 | 22.3 | 1,346,625 | 7.7 | 37.0 | |||||||||||||||||||||||||||||||||
| Foreign natural gas | 931,754 | 20.9 | 58,809 | 2,906,034 | 23.6 | 182,950 | 6,726,072 | 31.0 | 423,461 | (67.9 | ) | (56.8 | ) | |||||||||||||||||||||||||||||||
| Other income(1) | 1,288,736 | 647,942 | 3,558,621 | – | 659,178 | 2,925,769 | – | 597,671 | (1.7 | ) | 10.3 | |||||||||||||||||||||||||||||||||
| Exploration and production sales | 194,363,424 | 20,527,332 | 238,308,621 | 25,669,213 | 242,284,457 | 35,903,045 | (20.0 | ) | (28.5 | ) | ||||||||||||||||||||||||||||||||||
| Local refined products | 106,047,637 | 54.9 | 17,771,166 | 102,475,029 | 67.1 | 18,806,063 | 94,736,264 | 111.2 | 20,952,495 | (5.5 | ) | (10.2 | ) | |||||||||||||||||||||||||||||||
| Foreign refined products | 51,843,743 | 40.4 | 6,330,648 | 26,357,160 | 48.8 | 3,535,666 | 29,762,138 | 92.5 | 5,431,828 | 79.1 | (34.9 | ) | ||||||||||||||||||||||||||||||||
| Other income(1) | - | - | 92,210 | – | – | 115,137 | – | – | 227,881 | (19.9 | ) | (49.5 | ) | |||||||||||||||||||||||||||||||
| Refining and petrochemicals | 157,891,380 | 24,194,024 | 128,832,189 | 22,456,866 | 124,498,402 | 26,612,204 | 7.7 | (15.6 | ) | |||||||||||||||||||||||||||||||||||
| Transportation services | - | - | 3,764,205 | – | 4,221,192 | - | 3,456,639 | (10.8 | ) | 22.1 | ||||||||||||||||||||||||||||||||||
| Transportation and logistics | - | - | 3,764,205 | – | 4,221,192 | - | 3,456,639 | (10.8 | ) | 22.1 | ||||||||||||||||||||||||||||||||||
| Total sales | 352,254,804 | 48,485,561 | 367,140,810 | 52,347,271 | 366,782,859 | 65,971,888 | (7.4 | ) | (20.7 | ) | ||||||||||||||||||||||||||||||||||
| Crude oil | 164,599,888 | 35.7 | 17,832,245 | 201,012,524 | 43.9 | 22,981,740 | 202,413,858 | 87.3 | 33,535,288 | (22.4 | ) | (31.5 | ) | |||||||||||||||||||||||||||||||
| Natural gas | 28,474,800 | 23.5 | 2,047,145 | 33,737,476 | 22.0 | 2,028,295 | 36,944,830 | 23.9 | 1,770,086 | 0.9 | 14.6 | |||||||||||||||||||||||||||||||||
| Refined products | 159,180,116 | 50.1 | 24,101,814 | 132,390,810 | 63.4 | 22,341,729 | 127,424,171 | 106.8 | 26,384,323 | 7.9 | (15.3 | ) | ||||||||||||||||||||||||||||||||
| Other | - | 4,504,357 | – | – | 4,995,507 | – | – | 4,282,191 | (9.8 | ) | 16.7 | |||||||||||||||||||||||||||||||||
| Total sales | 352,254,804 | 48,485,561 | 367,140,810 | 52,347,271 | 366,782,859 | 65,971,888 | (7.4 | ) | (20.7 | ) | ||||||||||||||||||||||||||||||||||
Table 46 – Third-Party Revenues by Business Segment
| 2018 | 2017 | 2016 | Change Sales Revenues (%) | |||||||||||||||||||||||||||||||||||||||||
| Revenue by segment | Volumen (barrels equivalent) | Average price US dollars / barrels | Sales revenues (Colombian Pesos in millions) | Volume (barrels equivalent) | Average price US dollars / barrels | Sales revenues (Colombian Pesos in millions) | Volume (barrels equivalent) | Average price US dollars / barrels | Sales revenues (Colombian Pesos in millions) | 2018/2017 | 2017/2016 | |||||||||||||||||||||||||||||||||
| Local Crude oil | 2,919,416 | 60.8 | 550,479 | 6,629,362 | 46.5 | 909,871 | 5,288,631 | 35.0 | 553,666 | (39.5 | ) | 64.3 | ||||||||||||||||||||||||||||||||
| Foreign Crude oil | 143,208,235 | 63.2 | 26,898,737 | 151,619,346 | 47.8 | 21,426,666 | 159,311,257 | 35.7 | 17,278,579 | 25.5 | 24.0 | |||||||||||||||||||||||||||||||||
| Natural gas local | 28,065,889 | 22.5 | 1,885,846 | 26,998,537 | 22.8 | 1,815,754 | 27,543,046 | 23.6 | 1,988,336 | 3.9 | (8.7 | ) | ||||||||||||||||||||||||||||||||
| Foreign natural gas | 530,945 | 17.7 | 27,899 | 618,022 | 17.7 | 32,303 | 931,754 | 20.9 | 58,809 | (13.6 | ) | (45.1 | ) | |||||||||||||||||||||||||||||||
| Other income(1) | 3,216,650 | - | 749,939 | 3,412,568 | 819,726 | 1,288,736 | 647,942 | (8.5 | ) | 26.5 | ||||||||||||||||||||||||||||||||||
Exploration and production sales | 177,941,135 | 30,112,900 | 189,277,835 | 25,004,320 | 194,363,424 | 20,527,332 | 20.4 | 21.8 | ||||||||||||||||||||||||||||||||||||
| Local refined products | 108,781,359 | 81.9 | 26,354,549 | 106,891,163 | 67.2 | 21,187,091 | 106,047,637 | 54.9 | 17,771,166 | 24.4 | 19.2 | |||||||||||||||||||||||||||||||||
| Foreign refined products | 41,577,284 | 68.6 | 8,485,932 | 38,268,394 | 53.2 | 6,005,556 | 51,843,743 | 40.4 | 6,330,648 | 41.3 | (5.1 | ) | ||||||||||||||||||||||||||||||||
| Foreign Crude oil | - | - | - | 341,366 | 53.0 | 52,397 | - | - | - | (100.0 | ) | - | ||||||||||||||||||||||||||||||||
| Other income(1) | - | - | 107,467 | - | 98,315 | - | - | 92,210 | 9.3 | �� | 6.6 | |||||||||||||||||||||||||||||||||
Refining and petrochemicals | 150,358,643 | 34,947,948 | 145,500,923 | 27,343,359 | 157,891,380 | 24,194,024 | 27.8 | 13.0 | ||||||||||||||||||||||||||||||||||||
| Transportation services | - | 3,543,024 | - | 3,606,549 | - | - | 3,764,205 | (1.8 | ) | (4.2 | ) | |||||||||||||||||||||||||||||||||
Transportation and logistics | - | - | 3,543,024 | - | - | 3,606,549 | - | - | 3,764,205 | (1.8 | ) | (4.2 | ) | |||||||||||||||||||||||||||||||
| Total sales | 328,299,778 | 68,603,872 | 334,778,758 | 55,954,228 | 352,254,804 | - | 48,485,561 | 22.6 | 15.4 | |||||||||||||||||||||||||||||||||||
| Crude Oil | 146,127,651 | 63.2 | 27,449,216 | 158,590,074 | 47.8 | 22,388,934 | 164,599,888 | 35.7 | 17,832,245 | 22.6 | 25.6 | |||||||||||||||||||||||||||||||||
| Natural gas | 28,596,834 | 22.4 | 1,913,745 | 27,616,559 | 22.7 | 1,848,057 | 28,474,800 | 23.5 | 2,047,145 | 3.6 | (9.7 | ) | ||||||||||||||||||||||||||||||||
| Refined products | 153,575,293 | 77.3 | 35,590,420 | 148,572,125 | 62.7 | 28,012,373 | 159,180,116 | 50.1 | 24,101,814 | 27.1 | 16.2 | |||||||||||||||||||||||||||||||||
Transportation services and others | - | 3,650,491 | - | 3,704,864 | - | 4,504,357 | (1.5 | ) | (17.8 | ) | ||||||||||||||||||||||||||||||||||
| Total sales | 328,299,778 | 68,603,872 | 334,778,758 | 55,954,228 | 352,254,804 | 48,485,561 | 22.6 | 15.4 | ||||||||||||||||||||||||||||||||||||
| (1) | In the case of the exploration and production segment, other income corresponds to services and sales of refined products (mainly LPG and asphalt) allocated to our exploration and production segment. In the case of the refining and petrochemicals segment, other income corresponds to industrial services. |
In 2016,2018, total revenues decreasedincreased by 7.4%22.6% as compared to 2015,2017, primarily as a result of: (i) a COP$6,456,91712,898,392 million decreaseincrease in revenues mainly due to the 18.6%32.2%, or US$8.215.4 per barrel reductionincrease of our average crude oil basket price, which in turn was primarily the result of the better performance of the Brent crude benchmark price and the 23.3%, or US$14.6 per barrel increase, of our average refined products basket price, which in turn was primarily due to strengthening of diesel prices, and (ii) a COP$1,572,854 million decrease in revenues attributable to the decrease in our sales volume and lower services provided by our transportations and logistics segment. This decrease was partially offset by the 11.2% devaluation0.2% depreciation of the Colombian Peso against the U.S. dollar, from an average exchange rate of COP$2,746.47/US$2,951.15 /US$1.00 in 20152017 to an average exchange rate of COP$3,053.42/2,956.55/US$1.00 in 2016,2018, resulting in an increase in sales revenue from exports, which represented an increase of COP$4,168,061297,937 million. This increase was partially offset by: (i) a COP$407,261 million revenue decrease attributable to the decrease in our sales volume explained below and (ii) a COP$139,424 decrease in services revenue from our transportations and logistics segment, primarily due to the resolution of the disagreement regarding the P135 Project tariffs leading to lower tariffs, which was partially offset by higher volumes transported through the San Fernando – Apiay system and the expansion of the P135 Project.
The decrease of our sales volume in 2018 as compared to 2017 was the result of (i) the 7.9%, or 12.5 mbe, decrease in our crude sales volume was primarily the result of lower crude exports due to a greater allocation of domestic crudes to supply Reficar in order to replace imports. This decrease was partially offset by (i) the 3.4%, or 5.0 mbe, increase in refined products volumes due to greater refining throughput and (ii) the 3.5%, or 1.0 mbe, increase in natural gas sales volume, primarily due to greater demand and active incremental sales.
In 2017, total revenues increased by 15.4% as compared to 2016, primarily as a result of a COP$10,971,709 million increase in revenues mainly due to the 33.9%, or US$12.1 per barrel increase of our average crude oil basket price and a smaller discount of Ecopetrol’s average crude oil basket price from international prices. This increase was partially offset by: (i) a COP$1,894,819 million decrease in revenues attributable to the decrease in our sales volume and a COP$261,200 decrease in services provided by our transportations and logistics segment and (ii) the 3.35% appreciation of the Colombian Peso against the U.S. dollar, from an average exchange rate of COP$3,053.42/US$1.00 in 2016 to an average exchange rate of COP$2,951.15/US$1.00 in 2017, resulting in a decrease in sales revenue from exports, which represented a decrease of COP$1,347,023 million.
The decrease of our sales volume in 20162017 as compared to 20152016 was the result of (a)(i) the 18.1%3.7%, or 36.46 mbe, decrease in our crude sales volume caused mainly by lower crude exports due to production decline, reduced purchases by third parties and lower availabilitya greater allocation of crudedomestic crudes to supply Reficar in order to replace imports, (ii) the 6.7%, or 10.7 mbe, decrease in refined products volumes due to its use for feedstocklower exports of diesel, primarily due to: (a) our strategy of focusing on allocating higher volumes to the domestic market to supply local demand and replace imports which resulted in lower cost of sales and better gross margin, (b) lower exports of fuel oil, and (c) a decrease in production at Reficar,the Barrancabermeja refinery as a result of reliance on more efficient alternative sources, and (b)(iii) the 15.6%3%, or 5.30.86 mbe, decrease in natural gas sales volume due to continued lower thermal demand as a result of the endno effect of the “El Niño” weather phenomenon and the termination of our sales contract to Venezuela on June 30, 2015. This decrease in sales volume was partially offset by the 20.2%, or 26.8 mbe, increase in sales of refined products given the increase of operations at Reficar and higher demand due to the growththat ended in the numbermiddle of motor vehicles in Colombia.2016.
| 78 |
In 2015, total revenues decreased by 20.7% as compared to 2014, primarily as a result of: (i) a COP$27,847,772 million, decrease in revenues mainly due to the 49.7%, or US$43.4 per barrel reduction of our average crude oil basket price. This decrease was partially offset by (i) the 37.28% devaluation of the Colombian Peso against the U.S. dollar, from an average exchange rate of COP$2,000.68/US$1 in 2014 to an average exchange rate of COP$2,746.47/US$1 in 2015, resulting in an increase in sales revenue from exports as well as in services provided by our transportation and logistics segment, which combined represented an upturn of COP$13,312,094 million and (ii) COP$882,873 million increase in revenues which was attributable to increase our sales volume.
The increase4.5.1.2Cost of our sales volume in 2015 as compared to 2014 was mainly the result of the 3.9%, or 4.97 mbe, increase in our refined products sales volume, which in turn was primarily the result of the 8.2% increase in local sales of refined products given higher demand caused mainly by the increase in the number of vehicles in Colombia, the higher consumption of diesel for energy generation at thermal power plants due to warmer weather caused by the El Niño climate phenomenon and supplying the border area with Venezuela due to that country’s decision to temporarily close its border with Colombia; partially offset by lower exports of fuel oil, as a result of the difficulties in transporting these products to port by means of the Rio Magdalena due to the reduced flow from this river. This increase in sales volume was partially offset by the 56.8%, or 3.8 mbe, decrease in natural gas exports due to the termination of our Venezuela sales contract on June 30, 2015 and the natural decline in production at the Guajira field.Sales
Our cost of sales was principally affected by the factors described below. See Note 26 Cost of sales24 to our consolidated financial statements for more detail.
Cost of sales in 20162018 was COP$34,251,42341,184,379 million, representing a COP$2,743,0934,276,054 million (7.4%) decreaseor 11.6% increase as compared to 2015,2017, primarily as a result of the following factors:
| · | A COP$ |
| · | A COP$700,715 million increase in maintenance cost and contracted services, primarily due to: (i) additional costs for community management and well integrity and (ii) services contracted for water treatment, workover campaigns, surface maintenance, as well as costs associated with higher production and the increase in the throughput of our refineries. |
| · | A COP$477,829 million increase in inventory consumption associated with higher level of sales volumes in 2018 compared to 2017. |
| · | A COP$290,590 million increase in labor costs, which is primarily the result of: (i) the recognition of employee benefits under the new collective bargaining agreement, (ii) a 4.4% salary increase in 2018 and (iii) an increase in the number of employees. |
| · | A COP$177,158 million increase in the cost of processing materials and operating supplies due to an increase in our operational activities. |
The factors mentioned above were partially offset by:
| · | A COP$512,341 million decrease in depreciation, amortization and depletion charges due to (i) an increase in hydrocarbon proved developed reserves in 2018 as compared to 2017, which in turn led to a decrease in depreciation expenses. This decrease was partially offset by (i) higher production levels associated with the results of our drilling campaign, and (ii) increase in our level of capital expenditures. |
| · | A COP$83,493 million decrease in other minor items. |
Cost of sales in 2017 was COP$36,908,325 million, representing a COP$2,656,902 million or 7.8% increase as compared to 2016, primarily as a result of the following factors:
| · | A COP$1,439,366 million increase in the purchase costs of crude oil, natural gas and refined products, which were purchased for sales and, in the case of crude oil, for refining, which was primarily the result of (i) higher average purchase prices due to the COP$4,322,867 million increase in international benchmark prices for crude oil, natural gas and refined products, and (ii) increased crude oil imports required at Reficar for its operations. This increase was partially offset by (i) a COP$ |
| · | A COP$ |
| · | A COP$ |
The factors mentioned above were partially offset by a a) COP$784,266 million increase in the amortization, depletion and depreciation of property, plant and equipment in connection with the start-up of the Reficar units and capitalization of major maintenance costs at the Barrancabermeja refinery and b) a COP$70,515 million decrease in other minor items.
Cost of sales in 2015 was COP$36,994,516 million, representing a COP$5,980,612 million (13.9%) decrease as compared to 2014, primarily as a result of the following factors:
| · | A COP$ |
| · | A COP$ |
The factors mentioned above were partially offset by a COP$341,228231,222 million increase in inventories and an increase in unit costs associated with the amortization, depletionincrease of the Brent price of crude oils and depreciationproducts.
4.5.1.3Operating Expenses before impairment of property, plantnon-current assets effects
Operating expenses and equipment, primarilyselling, general and administrative expenses before taking into account the impairment of non-current assets amounted to COP$4,592,445 million in 2018, a COP$407,259 million or 9.7% increase as compared to 2017, mainly as a result of higher investments in the Castilla, Chichimene,following factors (see Notes 25 and Rubiales fields.26 to our consolidated financial statements for more detail).
| · | A COP$463,160 million decrease in other income due to the acquisition of an additional 11.6% interest at the K2 field in the Gulf of Mexico, which generated a gain due to the increase in the book value of the asset above the price paid for the additional interest. This non-cash gain is the result of the fair value valuation of the interest acquired, reflecting a price increase between the date of the deal and the price outlook by the end of 2017, among other factors. |
| · | A COP$188,304 million increase in general expenses due to the negative impact in our midstream segment of attacks by third parties and higher expenses incurred in respect of environmental incidents in our upstream segment. |
| · | A COP$133,828 million decrease in other income due to the sale of the following fields in 2017: Sogamoso, Río Zulia, Río de Oro and Puerto Barco, Santana, Nancy Maxine Burdine and Valdivia Almagro. |
| · | A COP$45,439 million increase in exploratory expenses as a result of a (i) higher seismic activity and (ii) the recognition of spending on exploratory activity mainly at the León 1, León 2, Bonifacio, Huron and Payero wells in 2018. |
This increase was partially offset by:
| · | A COP$214,563 million decrease in taxes mainly due to the elimination of the wealth tax since 2018. |
| · | A COP$72,318 million decrease in expenses related to our gas pipeline availability BOMT contracts with Transgas that terminated in August 2017. |
Operating expenses and selling, general and administrative expenses before taking into account the impairment of non-current assets, amounted to COP$4,400,8434,185,186 million in 2016,2017, a COP$ 955,872215,657 million (17.8%)or 4.9% decrease as compared to 2015,2016, mainly as a result of the following factors (see Notes 2725 and 2926 to our consolidated financial statements for more detail).
| · | A COP$ |
| · | A COP$ |
| · | A COP$122,427 million increase in other income due to the sale of the following fields in 2017: Sogamoso, Río Zulia, Río de Oro and Puerto Barco, Santana, Nancy Maxine Burdine and Valdivia Almagro. |
This decrease was partially offset by:
| · | A COP$ |
| · | A COP$ |
Operating expenses and selling, general and administrative expenses before taking into account the impairment of our non-current assets amounted to COP$5,356,715 million in 2015, a COP$886,451 million (14.2%) decrease as compared to 2014, mainly as a result of the following factors:
This decrease was partially offset by a COP$628,813 million increase in taxes mainly due to the wealth tax applicable for year 2015, as no accrual was made for wealth tax expenses in 2014.
Each of our operating segments bears the costs and expenses incurred for product use and marketing and each segment assumes administrative expenses and all non-operational transactions related to its activity. Discussion of operating expenses by business segment is included in the sectionFinancial Review—Operating Results—Consolidated Results of Operations—Segment Performance and Analysis.
4.5.1.4Impairment of non-current assets
The impairment of our non-current assets includes expenses (recovery)(or recovery) of impairment of property, plant and equipment and natural resources, investments in companies, goodwill and goodwill.other non-current assets. The Company is exposed to certain future risks derived mainly from variations in: a)(i) oil prices b)outlook, (ii) refining margins and profitability, c)(iii) cost profile, d)(iv) investment and maintenance e)expenses, (v) amount of recoverable reserves, f)(vi) market and country risk assessments reflected onin the discount rate, g)and (vii) changes in domestic and international regulations, among others.
Any change in the foregoing variables used to calculate the recoverable amount of a non-current asset can have a material effect on the recognition of either losses or recovery of impairment charges. For example,charges in the profit or loss statement. In our business segments highly sensitive variables can include among others: (i) in the exploration and production segment, is highly sensitive to variationvariations of the hydrocarbon prices whileoutlook; (ii) in the refining segment, is highly sensitive to changes in product prices and raw materials in the international market, thecrude oil prices, discount rate, given the leveraging, the refining margins, changes in environmental regulations, and the cost structure and the level of capital expenditures.expenditures; (iii) in the transportation and logistics segment, changes in tariffs regulation and volumes transported. (See Notes 3.2, 4.12 17 and 2816 to our consolidated financial statements for more detail). Impairment
In 2018, we recognized impairment losses of non-current assets amountedof COP$368,634 million as compared to a COP$1,311,138 million net reversal of impairment of non-current assets in 2017 and impairment losses of COP$928,747 million in 2016, COP$7,864,875 in 2015 and COP$2,304,567 in 2014.2016. These impairments are ana non-cash accounting effect that doesand consequently do not involve any disbursement or cash inflow. Further, any cumulative impairment amount of resources and they arenon-current assets is susceptible to reversion when the fair value of the asset exceeds its book value. On the contrary, in the event that the book value exceeds the fair value of the asset, an additional impairment expense could be recognized.
WeAs mentioned above, in 2018, Ecopetrol recognized a smaller impairment losses, net of non-current assets of COP$368,634 million, which corresponds to the net result of:
| · | An impairment of non-current assets in the refining and petrochemicals segment, primarily due to adjustments in market expectations with respect to the impact of implementation of IMO regulations on projected margins for Reficar’s refined products, (ii) a decrease in the short-term outlook for the ethanol prices given a global over-supply of ethanol, (iii) downward updates to Bioenergy’s near-term agricultural outputs and (iv) an increase in the discount rate used for Reficar and Bioenergy, reflecting updated macroeconomic conditions. These negative impacts were partially offset by the commencement of the stabilization period at both Reficar and Bioenergy as well as tax benefits associated with Law 1942, 2018. |
| · | An impairment of non-current assets in the transportation and logistics segment, primarily the result of a decrease in the forecast of the volume to be transported by the southern transportation unit and an increase in investment needs to mitigate the operative risk of our transportation systems. |
| · | A reversal of impairment of non-current assets in the exploration and production segment primarily due to an improved short- term hydrocarbon price outlook, incorporation of new reserves and technical and operational information variables. |
The partial reversal of the impairment recorded in 20162017 is primarily the result of an improved hydrocarbon prices outlook, incorporation of new reserves, Ecopetrol’s crude oil basket price discounts as compared to 2015 mainly by the variation in estimations of future prices which includeICE Brent crude price, favorable refining margins outlook, market conditions affecting the current scenarios of oil quota agreements of OPECdiscount rate and the impact of changes in specifications issued by the Marpol (abbreviation of marine pollution) agreement on crude and fuels with high sulfur content. Additionally, the impairment recognized in 2016 included the effect oftechnical operational adjustments to the variables observed during Reficar’s stabilization period and new ethanol prices affecting Bioenergy.capacity, among other factors.
The impairmentsimpairment losses recognized in 2015 and 20142016 were mainly due to lower estimates of the existing lowoutlook for oil prices given the oil price environment which resultedduring those years, operational variables in a reduction in forecasted crude oil pricesthe exploration and an increase inproduction and refining segments, market and country risk which had beenassessments reflected in the discount rate, as well asand a reduction in the amount of recoverable reserves. reserves, among others.
For more information regarding impairment by segment, see the sectionFinancial Review—Operating Results—Consolidated Results of Operations—Segment Performance and Analysis.
Financial4.5.1.5Finance Results, Net
Finance results, net, mainly includes the exchange rate gains or losses, and interest expense, yields and interest from our investments and non-current liabilities financial costs (asset retirement obligation and post-benefits plan) and results from our hedging operations..
Finance results, net, amounted to a loss of COP$1,175,3672,010,375 million in 20162018 as compared to a loss of COP$7,663,1042,495,731 million in 2015.2017. This decrease in loss was mainly due to:
| · | The positive impact |
| · | A COP$84,265 million decrease in financial costs related to long term obligations mainly due to a lower interest rate on our asset retirement obligation. |
| · | A COP$13,420 million increase in interest expenses, primarily the result of premiums paid in respect of prepayments of debt in 2018 which will generate interest savings in the first half of 2019, which was partially offset by lower interest expenses given (i) use of cash surpluses to pre-pay foreign currency-denominated loans totaling US$2,006 million and local loans totaling the equivalent of US$440 million in 2018 and (iii) a decrease in interest on local currency-denominated loans with a lower interest rate indexed to the Consumer Price Index (CPI). |
| 82 |
| · | A COP$47,802 million increase in losses related to other minor financial items. |
The adoptionFinance results, net, amounted to a loss of COP$2,495,731 million in 2017 as compared to a loss of COP$1,175,367 million in 2016. This increase in loss was mainly due to:
| · | The negative impact (COP$970,916 million) resulting from the 0.56% appreciation of the Colombian Peso against the U.S. dollar on our U.S. dollar net asset position. In 2017 our exchange rate gain was COP$5,514 million, as compared to a gain of COP$976,430 million in 2016. |
| · | A COP$688,664 million decrease in financial income corresponding to the reversal of a provision we had set aside in 2016 relating to a litigation concerning Santiago de las Atalayas (the “Comuneros”). See below and Note 27 to our consolidated financial statement for more detail. |
| · | A COP$39,814 million increase in losses related to other minor financial items. |
This increase in our financial loss was partially offset by: (i) the use of cash flow and net investment hedge accounting, in October 2015 and the hedging of our net investment in June 2016which has allowed us to neutralize, overall, the effect of the exchange rate fluctuation over 88%on 71.2% of the U.S. dollar debt of Ecopetrol S.A., since exchange rate changes are recognized under other comprehensive income within equity.
This decreaseequity, (ii) the efficient allocation of debt within the companies that make up the Ecopetrol Group, thereby achieving an approximately zero net position in our financial loss was partially offset byU.S. dollars as of December 31, 2017, and (iii) a COP$996,406379,030 million increasedecrease in interest expenses as a result ofof: (i) the recognitionuse of Reficar’s interest expenses which, upcash surpluses to 2015, had been capitalized (ii) the aggregatepre-pay foreign currency-denominated loans totaling US$1,925 million in June 2017 and US$475 million international loans we entered into in February and May 2016 and the US$500 million international bond we issued in June 2016, and (iii) the negative effect the Colombian Peso had on our exchange rate on interest due on our foreign debt.
Finance results, net, amounted to a loss of COP$7,663,104 million in 2015 as compared to a loss of COP$3,510,669 million in 2014. This increase in loss was mainly due to:
This increase in our financial loss was partially offset by (i) a COP$110,600 million gain resulting from the sale of shares in Empresa de Energía de Bogotá and dividends received from equity instrumentsDecember 2017 and (ii) a COP$40,748 million decrease in other minor financial expenditures.interest on local currency-denominated loans with a lower interest rate indexed to the Consumer Price Index (CPI) and a decrease in interest on capital payments.
For more details on our financial income and expenses see Note 30 – Finance results, net27 to our consolidated financial statements.statements for more details.
Income taxes amounted to COP$8,258,485 million in 2018, COP$5,800,268 million in 2017 and COP$4,543,046 million in 2016, COP$710,353 million in 2015 and COP$5,434,855 in 2014.2016. The above is equivalent to an effective tax rate of 58.3%40.1%, 12.7%42.1% and 48.9%58.3% in 2018, 2017 and 2016, 2015 and 2014, respectively.
The increase in the effective tax rate from 2015 to 2016 was mainly due to: i) lower recovery of deferred tax asset, ii) the effect of the adjustment in deferred tax resulting from the application of the Colombian tax reform described above, and iii) the recognition of the presumptive tax on subsidiaries reporting tax losses.
The decrease in the effective tax rate from 20142017 to 20152018 was mainly due to: (i) foreignthe positive impact of Law 1943, 2018 that led to higher deferred asset taxes, primarily at Reficar and Bioenergy, given the lower presumptive income rate of 0% starting in 2021, which will allow them to offset higher tax losses from previous years; (ii) the 300 basis points nominal tax decrease as a consequence of the 2016 tax reform; and (iii) an increase in the contribution of our income from Reficar, which is taxed at a lower nominal rate of 15%. This decrease was partially offset by (i) a non-deductible expense effect, primarily due to exploratory activity at Ecopetrol América Inc.’s León 1 and 2 wells and (ii) exchange rate effects on tax bases for companies with the U.S. dollar as their functional currency but with profit or tax losses in Colombian pesos, which required them to recognize a deferred taxes according to IAS 12.41 between the carrying amount of non-monetary assets in their financial statements and a related adjustment for foreign currency translation, (ii) an adjustmenttheir respective tax bases converted from Colombian pesos to U.S dollars using the exchange rate on December 31, 2018.
The decrease in the effective tax rate from 2016 to 2017 was mainly due to: (i) the better financial performance of entities whosethe exploration and production segment, (ii) the reduction of losses at Reficar and Ecopetrol America Inc, which also resulted in lower tax rate differed from that of Ecopetrol S.A.rates and (iii) the implementationreduction of a nondeductiblethe wealth tax rate from 1% in 2015.2016 to 0.4% in 2017.
See Note 10 –Taxes to our consolidated financial statements.statements for more details.
4.5.1.7Net Income (Loss) Attributable to Owners of Ecopetrol
As a result of the foregoing, in 2018, net income attributable to owners of Ecopetrol was COP$11,381,386, in 2017, net income attributable to owners of Ecopetrol was COP$7,178,539 million whereas and, in 2016, net income attributable to owners of Ecopetrol was COP$2,447,881 million whereas, in 2015, net loss attributable to owners of Ecopetrol was COP$7,193,859 million and, in 2014, net income attributable to owners of Ecopetrol was COP$5,046,517 million.
4.5.1.8Segment Performance and Analysis
In this section, including the tables below, we present our financial information by segment: Exploration and Production, Refining and Petrochemicals and Transportation and Logistics. See the sectionBusiness Overview for a description of each segment.
The following tables present our revenues and net income by business segment for the years ended December 31, 2016, 20152018, 2017 and 2014:2016:
Table 4647 – Revenues by Business Segment
| Year ended December 31, | % Change | Year ended December 31, | % Change | |||||||||||||||||||||||||||||||||||||
| 2016 | 2015 | 2014 | 2016/2015 | 2015/2014 | 2018 | 2017 | 2016 | 2018/2017 | 2017/2016 | |||||||||||||||||||||||||||||||
| (Colombian Pesos in millions) | (Colombian Pesos in millions) | |||||||||||||||||||||||||||||||||||||||
| Exploration and Production | 28,221,210 | 31,732,611 | 45,155,191 | (11.1 | ) | (29.7 | ) | 50,372,764 | 36,494,934 | 28,221,210 | 38.0 | 29.3 | ||||||||||||||||||||||||||||
| Third parties | 20,527,332 | 25,669,213 | 35,903,045 | (20.0 | ) | (28.5 | ) | 30,112,900 | 25,004,320 | 20,527,332 | 20.4 | 21.8 | ||||||||||||||||||||||||||||
| Local crude oil | 553,666 | 491,279 | 1,213,718 | 12.7 | (59.5 | ) | 550,479 | 909,871 | 553,666 | (39.5 | ) | 64.3 | ||||||||||||||||||||||||||||
| Foreign crude oil | 17,278,579 | 21,181,265 | 30,835,510 | (18.4 | ) | (31.3 | ) | 26,898,737 | 21,426,666 | 17,278,579 | 25.5 | 24.0 | ||||||||||||||||||||||||||||
| Trading of crude oil | - | 1,309,196 | 1,486,060 | (100.0 | ) | (11.9 | ) | |||||||||||||||||||||||||||||||||
| Natural gas local | 1,988,336 | 1,845,345 | 1,346,625 | 7.7 | 37.0 | 1,885,846 | 1,815,754 | 1,988,336 | 3.9 | (8.7 | ) | |||||||||||||||||||||||||||||
| Foreign natural gas | 58,809 | 182,950 | 423,461 | (67.9 | ) | (56.8 | ) | 27,899 | 32,303 | 58,809 | (13.6 | ) | (45.1 | ) | ||||||||||||||||||||||||||
| Other income | 647,942 | 659,178 | 597,671 | (1.7 | ) | 10.3 | 749,939 | 819,726 | 647,942 | (8.5 | ) | 26.5 | ||||||||||||||||||||||||||||
| Inter-segment net operating revenues | 7,693,878 | 6,063,398 | 9,252,146 | 26.9 | (34.5 | ) | 20,259,864 | 11,490,614 | 7,693,878 | 76.3 | 49.3 | |||||||||||||||||||||||||||||
| Refining and Petrochemicals | 24,823,714 | 23,245,676 | 27,172,300 | 6.8 | (14.5 | ) | 37,011,373 | 28,644,016 | 24,823,714 | 29.2 | 15.4 | |||||||||||||||||||||||||||||
| Third parties | 24,194,024 | 22,456,866 | 26,612,204 | 7.7 | (15.6 | ) | 34,947,948 | 27,343,359 | 24,194,024 | 27.8 | 13.0 | |||||||||||||||||||||||||||||
| Local refined products | 17,771,166 | 18,806,063 | 20,952,495 | (5.5 | ) | (10.2 | ) | 26,354,549 | 21,187,091 | 17,771,166 | 24.4 | 19.2 | ||||||||||||||||||||||||||||
| Foreign refined products | 6,330,648 | 3,535,666 | 5,431,828 | 79.1 | (34.9 | ) | 8,485,932 | 6,005,556 | 6,330,648 | 41.3 | (5.1 | ) | ||||||||||||||||||||||||||||
| Foreign crude oil | - | 52,397 | - | (100.0 | ) | - | ||||||||||||||||||||||||||||||||||
| Other income | 92,210 | 115,137 | 227,881 | (19.9 | ) | (49.5 | ) | 107,467 | 98,315 | 92,210 | 9.3 | 6.6 | ||||||||||||||||||||||||||||
| Inter-segment net operating revenues | 629,690 | 788,810 | 560,096 | (20.2 | ) | 40.8 | 2,063,425 | 1,300,657 | 629,690 | 58.6 | 106.6 | |||||||||||||||||||||||||||||
| Transportation and Logistics | 10,648,776 | 10,844,550 | 8,343,934 | (1.8 | ) | 30.0 | 11,354,167 | 10,598,064 | 10,648,776 | 7.1 | (0.5 | ) | ||||||||||||||||||||||||||||
| Third parties | 3,764,205 | 4,221,192 | 3,456,639 | (10.8 | ) | 22.1 | 3,543,024 | 3,606,549 | 3,764,205 | (1.8 | ) | (4.2 | ) | |||||||||||||||||||||||||||
| Inter-segment net operating revenues | 6,884,571 | 6,623,358 | 4,887,295 | 3.9 | 35.5 | 7,811,143 | 6,991,515 | 6,884,571 | 11.7 | 1.6 | ||||||||||||||||||||||||||||||
| Eliminations of consolidations | (15,208,139 | ) | (13,475,566 | ) | (14,699,537 | ) | 12.9 | (8.3 | ) | (30,134,432 | ) | (19,782,786 | ) | (15,208,139 | ) | 52.3 | 30.1 | |||||||||||||||||||||||
| Total revenues | 48,485,561 | 52,347,271 | 65,971,888 | (7.4 | ) | (20.7 | ) | 68,603,872 | 55,954,228 | 48,485,561 | 22.6 | 15.4 | ||||||||||||||||||||||||||||
Total revenues by segment include exports and local sales to third-parties and inter-segment sales. See the sectionFinancial Review—Operating Results—Consolidated Results of Operations—Total Revenues for prices and volumes to third parties.
Table 4748 – Operating and Net Income by Business Segment
| Year ended December 31, | % Change | Year ended December 31, | % change | |||||||||||||||||||||||||||||||||||||
| Net income by segment | 2016 | 2015 | 2014 | 2016/2015 | 2015/2014 | |||||||||||||||||||||||||||||||||||
| 2018 | 2017 | 2016 | 2018/2017 | 2017/2016 | ||||||||||||||||||||||||||||||||||||
| (Colombian Pesos in millions) | (Colombian Pesos in millions) | |||||||||||||||||||||||||||||||||||||||
| Exploration and Production | 1,322,370 | (5,851,619 | ) | 5,089,841 | (123 | ) | (215 | ) | ||||||||||||||||||||||||||||||||
| Operating Income | 15,899,337 | 8,061,484 | 2,912,307 | 97 | 177 | |||||||||||||||||||||||||||||||||||
| Net income attributable to owners | 9,930,519 | 3,820,501 | 1,322,370 | 160 | 189 | |||||||||||||||||||||||||||||||||||
| Refining and Petrochemicals | (1,823,020 | ) | (4,016,050 | ) | (1,627,705 | ) | (55 | ) | 147 | |||||||||||||||||||||||||||||||
| Operating Income | (757,793 | ) | 1,362,934 | (595,712 | ) | (156 | ) | (329 | ) | |||||||||||||||||||||||||||||||
| Net income attributable to owners | (1,973,075 | ) | 358,859 | (1,823,020 | ) | (650 | ) | (120 | ) | |||||||||||||||||||||||||||||||
| Transportation and Logistics | 2,960,449 | 2,819,759 | 1,758,777 | 5 | 60 | |||||||||||||||||||||||||||||||||||
| Eliminations of consolidations | (11,918 | ) | (145,949 | ) | (174,396 | ) | (92 | ) | (16 | ) | ||||||||||||||||||||||||||||||
| Net Income attributable to owners of Ecopetrol S.A. | 2,447,881 | (7,193,859 | ) | 5,046,517 | (134 | ) | (243 | ) | ||||||||||||||||||||||||||||||||
| Operating Income | 7,317,513 | 6,748,047 | 6,589,251 | 8 | 2 | |||||||||||||||||||||||||||||||||||
| Net income attributable to owners | 3,424,234 | 2,999,978 | 2,960,449 | 14 | 1 | |||||||||||||||||||||||||||||||||||
| Eliminations in consolidation | ||||||||||||||||||||||||||||||||||||||||
| Operating Income | (643 | ) | (610 | ) | (1,298 | ) | 5 | (53 | ) | |||||||||||||||||||||||||||||||
| Net income attributable to owners | (292 | ) | (799 | ) | (11,918 | ) | (63 | ) | (93 | ) | ||||||||||||||||||||||||||||||
| Ecopetrol consolidated | ||||||||||||||||||||||||||||||||||||||||
| Operating Income | 22,458,414 | 16,171,855 | 8,904,548 | 39 | 82 | |||||||||||||||||||||||||||||||||||
| Net income attributable to owners | 11,381,386 | 7,178,539 | 2,447,881 | 59 | 193 | |||||||||||||||||||||||||||||||||||
4.5.1.9Exploration and Production Segment Results
In 2016,2018, exploration and production segment sales were COP$28,221,21050,372,764 million, compared to COP$31,732,61136,494,934 million in 2015.2017. In 2016,2018, our segment sales decreasedincreased by 11.1%38.0% as compared with 20152017 mainly as a result of:
| · |
| · |
In 2015,2017, exploration and production segment sales were COP$31,732,61136,494,934 million, compared to COP$45,155,19128,221,210 million in 2014.2016. In 2015,2017, our segment sales decreasedincreased by 29.7 %29.3% as compared with 20142016 mainly as a result of:
| · |
| · |
Cost of sales affecting our exploration and production segment isare mainly related to: (i) the amortization and depletion of our production assets, (ii) contracted services in partnership contracts and (iii) the costs related to maintenance, operational services, electric power, projects and labor in the exploration and production segment. In addition, this segment’s costs are impacted by the purchases of crude oil from ANH and third parties, naphtha for dilution and by transportation services.
In 2016,2018, the cost of sales for this segment decreasedincreased by 10.6%22.5% as compared with 2015, due to the net effect of:
In 2015, the cost of sales for this segment decreased by 8% as compared with 2014,2017, due to the net effect of:
| · | Fixed costs increasing by |
| · | Variable costs increasing by 28.0%, or COP$ |
In 2017, the cost of sales for this segment increased by 14.5% as compared with 2016, due to the net effect of:
| · | Fixed costs increasing by 16.1%, or COP$1,115,851 million, in 2017 as compared to 2016, mainly due to (i) an increase in contracted services, maintenance and operating materials, which included preventative surface maintenance activities at our production facilities and well services as a strategy to mitigate natural decline rates and (ii) an increase in the costs of hydrocarbon transportation services as a result of |
| · | Variable costs |
| 86 |
In 2016,2018, operating expenses before impairment of non-current assets decreased increased by 70.1% in 201630.9% as compared to 2015,2017, primarily as a result of (i) lowerthe bargain purchase in our acquisition of an additional stake in the K2 field in 2017, (ii) the sale of the following fields in 2017: Sogamoso, Río Zulia, Río de Oro and Puerto Barco, Santana, Nancy Maxine Burdine and Valdivia Almagro, (iii) the recognition of exploratory activity at Ecopetrol America Inc.’s León 1 and 2 wells and Hocol’s Bonifacio, Hurón and Payero wells in 2018, (iv) an increase in operation expenses related to the Lizama’s well environmental incident that occurred in the first half of 2018. This increase was partially offset by (i) the elimination of the wealth tax since 2018 and (ii) a decrease in exploratory activity at the Kronos-1, Parmer-1, Warrior 2, Lunera-1, Brama-1, Molusco-1, Godric, Dumbo and Pollera wells recognized in 2017.
In 2017, operating expenses before impairment of non-current assets increased by 7.8% in 2017 as compared to 2016, primarily as a result of (i) higher expenses related to our exploratory activity as we engaged in lessmore seismic activity and exploratory drilling, (ii) minor commissions, fees, freight and services as a result of the savings obtained in the implementation of our transformation plan, and (iii) a lower wealth tax. This decrease was partially offset by an increase in labor expenses due to the implementation of the voluntary retirement plan.
In 2015, operating expenses before impairment of non-current assets decreased by 23.9% in 2015 as compared to 2014, primarily as a result of (i) lowerrecorded expenses related to our exploratory activity asat the Kronos-1, Parmer-1, Warrior 2, Lunera-1, Brama-1, Molusco-1, Godric, Dumbo and Pollera wells, (ii) the termination in 2016 of the deferred income amortization we engagedhad been recognizing since 2007 for the advance payment by the Ministry of Finance and Public Credit of the obligations under Ecogas, in less seismic activity and exploratory drilling, (ii) a decrease in commissions, fees, freight and services as a result of cost savings related to our transformation program, and (iii) the recovery of provisions for litigation relatedrelation to the paymentBuilt, Operate and Transfer contracts (BOMT’s) for the construction, operation, maintenance and transfer of an electric-power-generation contribution by Ecopetrol S.A. and compensation to third parties for infringement of the free competition clause in the Garcero association contract.gas pipelines. This increase was partially offset by (i) increased income due to the acquisition of an additional 11.6% interest at the K2 field in the Gulf of Mexico which generated a gain due to the increase in the Colombianbook value of the asset above the value paid for the additional interest and (ii) the reduction of the wealth tax.tax rate from 1% in 2016 to 0.4% in 2017.
The net reversal of impairment of non-current assetsrecognized in the exploration and production segment in 2016,2018, which totaled COP$785,940 million in 2018 as compared to COP$183,718 million in 2017, increased by 327.8 % as compared to 2017 mainly due to due to the incorporation of new reserves, improved short-term hydrocarbon price outlook and improvements in technical operational capacity.
The net reversal of impairment of non-current assets recognized in the exploration and production segment in 2017 totaled COP$183,718 million as compared to an impairment loss of COP$196,448 million in 2016 as compared to COP$4,504,497 million in 2015, decreased by 95.6% as compared to 2015 mainly due to variation in estimations2016. The net reversal of future prices which include the current scenarios of oil quota agreements of OPEC and the impact of changes on specifications issued by the Marpol (abbreviation of marine pollution) agreement on crude and fuels with high sulfur content (See Note 17.1 to our consolidated financial statements for more detail).
The increased impairment charges for non-current assets in 2015, which totaled COP$4,504,496 million as compared to COP$965,607 million in 2014, was primarily due to the existing lowincreased value of offshore oil price environment, which resulted in a reduction in forecasted crude oil prices andfields, partially offset by an increase in market and country risk, which was reflected in the discount rate, as wellimpairment of onshore fields, both as a reduction inresult of calculating their valuation taking into account market variables, reserves, price spreads as compared to the amount of recoverable reserves. The most significant cash generation units impacted by the impairments were the following fields: in Colombia, Chichimene, Tibú, CP09, Apiay, LlanitoICE Brent price, and La Hochaavailable technical and in the Gulf of Mexico, K2 and Dalmatian (see Note 17.1 to our consolidated financial statements for more details).operational information.
The segment recorded net income attributable to owners of Ecopetrol of COP$1,322,3709,930,519 million in 20162018 as compared to net lossincome attributable to owners of Ecopetrol of COP$5,851,6193,820,501 million in 20152017 and net income attributable to owners of Ecopetrol of COP$5,089,8411,322,370 million in 2014.2016.
Lifting and Production Costs
The aggregate average production cost, on a Colombian Peso basis, has decreasedincreased to COP$20,99327,782 per boe during 20162018 from COP$21,73223,684 per boe during 2015, primarily due to:
As2017. On a result of the above-mentioned factors,dollar basis, our aggregate average production cost on a Colombian Peso basis, decreased in 2016 as comparedincreased to 2015. On a dollar basis, it decreased to US$6.889.40 per boe in 20162018 from US$7.928.02 per boe in 2015 also2017, due to an 11.21%a 0.18% depreciation of the average exchange rate of the Colombian Peso against the U.S. dollar in 2016.2018.
The aggregate average lifting cost, on a Colombian Peso basis, has decreasedincreased to COP$19,79925,614 per boe during 20162018 from COP$20,308 per boe22,585 during 2015, primarily due to:
As a result of the above-mentioned factors, our aggregate average lifting cost, on a Colombian Peso basis, decreased in 2016 as compared to 2015.2017. On a dollar basis, it decreasedincreased to US$6.498.66 per boe in 20162018 from US$7.407.65 per boe in 20152017 also due partially to an 11.21%the 0.18% depreciation of the average exchange rate of the Colombian Peso against the U.S. dollar in 2016.2018.
The abovementioned increases were primarily due to:
| · | An increase in energy costs, primarily due to higher prices in liquid fuels purchased for electric generation in our fields (diesel, fuel oil no. 4 and reduced crude) and an increase in unregulated tariffs. |
| · | An increase in costs due to subsoil maintenance, primarily due to an increase in the number and complexity of well interventions and services, mainly to support and improve our basic production curve. |
| · | An increase in costs of services due to a 2% increase in crude volumes and an 8% increase in water production in fields of direct and associated operation. |
| · | Higher water volumes which augmented energy consumption and fluid treatment utilized for injection techniques, disposal and recovery projects. |
| 87 |
| · | An increase in others operational costs as per field support and logistics services. |
The difference between the aggregate average lifting cost and aggregate average production cost is that lifting costs docost does not include the costs related to consumption of hydrocarbons by ushydrocarbon self-consumption required in ourthe production process or that Ecopetrol soldthe deliveries we make to our refineries and natural gas liquid plants.
The following table sets forth crude oil and natural gas average sales prices, the aggregate average lifting costs and aggregate average unit production cost for the years ended December 31, 2016, 20152018, 2017 and 2014.2016.
Table 4849 – Crude Oil and Natural Gas Average Prices and Costs
| 2016 | 2015 | 2014 | 2018 | 2017 | 2016 | |||||||||||||||||||
| Crude Oil Average Sales Price (U.S. dollars per barrel)(1) | 35.7 | 43.9 | 87.3 | 63.2 | 47.8 | 35.7 | ||||||||||||||||||
| Crude Oil Average Sales Price (COP$ per barrel)(1) | 108,337 | 118,115 | 173,769 | 187,845 | 141,175 | 108,337 | ||||||||||||||||||
| Natural Gas Average Sales Price (U.S. dollars per barrel equivalent) | 23.5 | 22.0 | 23.9 | 22.4 | 22.7 | 23.5 | ||||||||||||||||||
| Natural Gas Average Sales Price (COP$ per barrel equivalent) | 71,893 | 60,120 | 47,912 | 66,922 | 66,919 | 71,893 | ||||||||||||||||||
| Aggregate Average Unit Production Costs (U.S. dollars per boe)(2) | 6.88 | 7.92 | 12.43 | 9.40 | 8.02 | 6.88 | ||||||||||||||||||
| Aggregate Average Unit Production Cost (COP$ per boe)(2) | 20,993 | 21,732 | 24,872 | 27,782 | 23,684 | 20,993 | ||||||||||||||||||
| Aggregate Average Lifting Costs (U.S. dollars per boe)(3)(4)(5) | 6.49 | 7.40 | 11.29 | 8.66 | 7.65 | 6.49 | ||||||||||||||||||
| Aggregate Average Lifting Costs (COP$ per boe)(3)(4) (5) | 19,799 | 20,308 | 22,581 | 25,614 | 22,585 | 19,799 | ||||||||||||||||||
| (1) | Corresponds to our average sales price on a consolidated basis. |
| (2) | Unit production costs correspond to consolidated average costs on total production volumes net of royalties. Production costs do not include costs related to transport, commercialization and administrative expenses. |
| (3) | Lifting costs per barrel are calculated based on total production (excluding production tests and discovered undeveloped fields), which are net of royalties, and correspond to our lifting costs on a consolidated basis. |
| (4) | The cost indicator is calculated by using the cost of production (does not include costs related to hydrocarbons consumption by Ecopetrol in the production process, such as by our refineries and natural gas liquid plants) and dividing by the net produced volume (excluding royalties) as the denominator. |
| (5) | As a result of the evaluation of control over companies under IFRS, Ecopetrol does not consolidate Savia Perú and Equion. |
4.5.1.10Transportation and Logistics Segment Results
In 2016,2018, ourtransportation and logistics segment sales were COP$10,648,77611,354,167 million compared to COP$10,844,55010,598,064 million in 2015.2017. The 1.8% decrease7.1% increase in 20162018 as compared with 20152017 was mainly due to (i) higher volumes of crude oil transported by our pipelines which was primarily due to reversal cycles through the Bicentenario pipeline, the startup of the San Fernando-Apiay System and the expansion of the P135 Project, (ii) an 11.3%increase in the volume of refined products transported mainly due to the increase in production at Barrancabermeja and Reficar, (iii) the positive effect on our U.S. dollar-indexed transportation fees resulting from the depreciation of the Colombian peso against the U.S. dollar. This increase was partially offset by a decrease in revenue due to the resolution of the disagreement regarding the P135 Project tariffs, leading to lower tariffs.
In 2017, our transportation and logistics segment sales were COP$10,598,064 million compared to COP$10,648,776 million in 2016. The 0.5% decrease in 2017 as compared with 2016 was mainly due to (i) a 5% decrease in the volume of crude oil transported by our pipelines, which was primarily due to the production decrease at the national level in spite of (i)and (ii) the positivenegative effect on our U.S. dollar-indexed transportation fees resulting from the devaluationappreciation of the Colombian Peso against the U.S. dollar and (ii)dollar. This decrease was almost offset by a 3.7%1.9% increase in the volume of refined products transported primarily due to the increase in demand for refined products in Colombia and the elimination of restrictions in the Pozos Colorados - Galán-Sebastopol system to meet the demand for fuel in the country’s interior and the start-up of Reficar.n system. Sales to third parties decreased in 20162017 as compared to 20152016 primarily due to the fact that the segment received income from the transportation services to Pacific RubialesFrontera Energy for its participation in the Rubiales field, and once the field returned to us in July 2016, these services were recognized as inter-segment sales.
| 88 |
In 2015, our transportation and logistics segment sales were COP$10,844,550 million compared to COP$8,343,934 million in 2014. This 30% increase in 2015 as compared with 2014 was mainly due to higher volume of crude oil transported by the Ocensa, Caño Limón Coveñas and Oleoducto Transandino pipelines due to the decline in the number of attacks on our infrastructure and the positive effect on our U.S. dollar-indexed transportation fees resulting from the devaluation of the Colombian Peso against the U.S. dollar.
Thecost of sales for our transportation and logistics segment is mainly related to: (i) project costs associated with the maintenance of transportation networks and (ii) operating costs related to these systems, including the costs of labor, energy, fuels and lubricants and others.
The cost of sales amounted to COP$3,349,7913,402,087 million in 20162018 as compared to COP$3,744,4223,271,835 million in 2015.2017. The cost of sales for this segment increased by 4.0% in 2018 as compared with 2017 mainly due to (i) an increase in costs associated with higher volumes transported, primarily due to the reasons described above and (ii) increased consumption of materials, supplies and depreciation resulting from to the start of the San Fernando – Apiay system at Cenit since January 2018 and the expansion of the P135 Project since July 2017.
The cost of sales amounted to COP$3,271,835 million in 2017 as compared to COP$3,349,791 million in 2016. The cost of sales for this segment decreased by 10.5%2.3% in 20162017 as compared with 20152016 mainly due to a decrease in costs associated with maintenance, operating supplies and materials due to the continuity of our efficiency program to optimize our operating costs. This decrease was partially offset by (i) an increase in material processing costs needed for power generation in three new pumping stations to operate Ocensa’s P135 project and (ii) an increase in depreciation due to a higher levelresulting from the start of investments in the segment.
The cost of sales amounted to COP$3,744,422 million in 2015 and COP$3,941,052 million in 2014. The cost of sales for this segment decreased by 5% in 2015 as compared with 2014 mainly due to a decrease in costs associated with maintenance and operating supplies and materials. This decrease was partially offset by an increase in depreciation and amortization due to our increased investments in this segment.
In 2016,operating expenses before the impairment of non-current assets increased by 30.7% as compared to 2015 due to a recovery of environmental provisions in 2015, no similar recoveries in 2016 and an increase in labor costs as a result of the implementation of the voluntary retirement plan. This increase was partially offset by lower wealth and industry taxes.P135.
In 2015,2018, operating expenses before the impairment of non-current assets decreased by 16.2%27.1% as compared to 20142017 due to decreased expenses related to social investmentto: (i) a reversal of a provision we had set aside in respect of tariff dispute we were having in connection with the P135 Project and security agreements, and more stable operations due to a decrease in repairs(ii) the elimination of our transportation systems.wealth tax since 2018. This decrease was partially offset by (i) the Colombian wealth tax implemented in 2015 and, (ii) increased depreciation and amortization.higher expenses associated with attacks on our infrastructure by third parties.
TheIn 2017, operating expenses before the impairment of non-current assets decreased by 15.1% as compared to 2016 due to lower administrative expenses mainly as a result of the consolidation of administration areas within the segment and a decrease in taxes because of the reduction of the wealth tax rate discussed previously.
The impairment losses of non-current assets recognized in the segment in 2016 which2018, totaled COP$169,870 million in 2018 as compared to an impairment recovery of COP$59,455 million in 2017. The difference in impairment from a reversal in 2017 to a loss in 2018 was primarily the result of a decrease in the forecast of the volume to be transported by the southern cash generating unit and an increase in investment needs to mitigate the operative risk of our transportation systems.
The impairment recovery of non-current assets recognized in the segment in 2017, totaled COP$59,455 million in 2017 as compared to an impairment recovery of COP$41,062 million in 2016. The increase in the impairment recovery in 2016 as comparedwas due to COP$81,388 million expense in 2015, decreased by 150.5% as compared to 2015 mainly by the incorporation,inclusion, in the assessment of the recovery amount of this segment’s assets, of flows associated towith the San Fernando - Apiay system projectPort of Tumaco that positively affects the recoverable amount of the Llanos transportation line, partially offset by an increase in impairment of assets related to the southern transportation line.cash generating unit (See Note 17.316.3 to our consolidated financial statements for more detail).
The increased impairment charges for non-current assets in 2015, which totaled COP$81,388 million as compared to a COP$1,121 million recovery of impairment in 2014 was primarily due to Colombia’s hydrocarbon production curves, based on the crude oil price environment and pipeline transportation rates (see Note 17.3 to our consolidated financial statements).
The segment recorded net income attributable to owners of Ecopetrol of COP$2,960,4493,424,234 million in 20162018 as compared to net income of COP$2,819,7592,999,978 million in 20152017 and COP$1,758,7772,960,449 million in 2014.2016.
4.5.1.11Refining and Petrochemicals Segment Results
In 2016,2018, therefining and petrochemical segment sales were COP$24,823,71437,011,373 million compared to COP$23,245,67628,644,016 million in 2015.2017. In 2016,2018, sales of refined products and petrochemicals increased by 6.8%29.2% as compared with 2015,2017, mainly due toto: (i) an increase in the volume of domestic and export sales mainly in mid-distillates due to the startup of operations at Reficar. This increase was partially offset by a decrease or our average products basket price due to the decreaseincrease in the international priceprices and (ii) increased sales volumes, primarily of crude oil.medium distillates, and gasoline in Colombia and international markets, due to higher refining throughput and positive operating performance at our refineries.
In 2015,2017, the refining and petrochemical segment sales were COP$23,245,67628,644,016 million compared to COP$27,172,30024,823,714 million in 2014.2016. In 2015,2017, sales of refined products and petrochemicals decreasedincreased by 14.5%15.4% as compared with 2014,2016, mainly due to:to an increase of our average products basket price due to the increase in the international prices. This increase was partially offset by (i) a decrease in exports of fuel oil primarily due to reduced production at the international priceBarrancabermeja refinery as a result of fuelsreliance on more efficient alternative sources and stabilization of the coker unit at the Cartagena Refinery and (ii) a decrease in foreign sales volumesexports of fuel oildiesel due to our commercial strategy of focusing on selling to the low water level in the Rio Magdalena. This decrease was partially offset by (i) an increase in the volume of domestic salesmarket due to increased local demand for fuel resulting from an increased numberbetter commercial conditions, replacing lace imports of vehicles and the closure of Colombia’s border with Venezuela that led to higher diesel demand and (ii) an increase in intercompany sales due to higher volumes of diluent sold to our exploration and production segment.such products.
| 89 |
Thecost of sales for our refined products and petrochemicals segment is mainly related to the purchase of crude oil and natural gas for our refineries, imported crude oil and products to substitute for the loss of production due to the closure of Reficar as the new refinery was being built for most of 2014 and 2015,supply local demand, feedstock transportation services, services contracted for maintenance of the refineryrefineries and the amortization and depreciation of refining assets. Cost of sales amounted COP$35,658,753 million in 2018, compared to COP$26,855,395 million in 2017 and COP$22,843,987 million in 2016, compared to COP$20,758,808 million in 2015 and COP$25,537,228 million in 2014.2016.
In 2016,2018, the cost of sales for this segment increased 10%32.8% as compared with 2015,2017, principally due to the operation of Reficar’s units in 2016 which led to (i) an increase in purchases of crude oil purchases through import and inter-segment transactions as Reficar required a special raw material or ‘diet’ during the stabilization and performance testing period which increased production cost,at higher international benchmark prices, (ii) higher volumes purchase of crude oil for use by our refineries due to higher throughput, (iii) an increase in cost of transportation associated with higher production in our refineries. This increase was partially offset by: (i) lower imports of products primarily medium distillates and gasolines as a result of higher production at Barrancabermeja Reficar and (ii) lower imports of light crude used at the depreciationCartagena Refinery as a result of Reficar’s units (iii) inventory consumption that had beenthe substitution of such crude, which resulted in stocka more cost-effective crude slate for the Cartagena Refinery.
In 2017, the cost of sales for this segment increased 18% as compared with 2016, principally due to (i) an increase in December 2015,purchases of crude oil at increased international benchmark prices and (iv)(ii) higher costsvolumes of imports of crude oil and inter-segment purchases of crude oil for services contracted, materials of process, maintenance and electrical power.the Cartagena Refinery. This increase was partially offset by lower imports of productsother fuels, especially diesel and the excellent operational performance of the Barrancabermeja Refinery.
In 2015, the cost of sales for this segment decreased 18.7% as compared with 2014, principally due to lower raw material costs, which corresponded to the decrease in international oil prices and lower operating costs as a result of cost optimization at the Barrancabermeja Refinery. This decrease was partially offset by higher imports of gasoline, due to increased local demand for fuel resulting from an increased numberthe use of vehicles andproducts produced by the closure of Colombia’s border with Venezuela.Cartagena Refinery rather than imported products.
In 2016,operating expenses before the impairment of non-current assets increased by 27.3% as compared to 2015, due to an increase in labor expenses related to our voluntary retirement plan in 2016 and other expenses related to the start-up of operations at Reficar.
In 2015,2018, operating expenses before the impairment of non-current assets increaseddecreased by 23%24.6% as compared to 2014,2017, due to higher levelsstabilization expenses of investment for the Reficar modernization project, the Colombian wealth tax implementedCartagena Refinery which was reflected in 2015lower maintenance expenses, contracted services and the increase in other expenses related to the start-up of operations at Reficar.general expenses.
TheIn 2017, operating expenses before the impairment of non-current assets decreased by 17.2% as compared to 2016, due to a decrease of stabilization expenses of the Cartagena Refinery and a decrease in taxes because of the reduction of the wealth tax rate.
The impairment losses of non-current assets recognized in the segment in 2016,2018, which totaled COP$984,704 million in 2018, as compared to a net reversal of impairment of COP$1,067,965 million in 2017, is primarily the result of: (i) adjustments in market expectations with respect to the impact of implementation of IMO regulation on projected margins for the Cartagena Refinery’s refined products, (ii) a decrease in the short-term outlook for the ethanol prices given a global over-supply of ethanol, (iii) downward updates to Bioenergy’s near-term agricultural outputs and (iv) an increase in the discount rate used for Reficar and Bioenergy, reflecting updated macroeconomic conditions. These negative impacts were partially offset by the commencement of the stabilization period at both Reficar and Bioenergy as well as tax benefits associated with Law 1942, 2018.
The net reversal of impairment of non-current assets recognized in the segment in 2017, which totaled COP$1,067,965 million in 2017 as compared to an impairment loss of COP$773,361 million in 2016, decreased as compared to COP$3,278,993 million2016 as a result of (i) a net reversal of the impairment of Reficar as a result of an improved outlook in 2015, decreased by 76.4% as compared to 2015. The 2016 scenario incorporated the refining margins that includedue to the effectanticipated effects of the ratification of Marpol which goes into effect in 2016 compared2020, (ii) a lower discount rate resulting from the application of WACC methodology and (iii) operational and financial optimization due to 2015,the stabilization of the refinery. This reversal was partially offset by Bioenergy’s impairment related to the effectchange of adjustmentthe project start date, the process of stabilization of the industrial plant, the updating of operational variables based on that observed during Reficar’s stabilization period and new ethanol prices on Bioenergy’s impairment (see Note 17.2 to our consolidatedthe financial statements). expenses of the Barrancabermeja refinery’s modernization project, which is currently postponed.
As mentioned earlier, the refining segment is highly sensitive to changes in product prices and raw materialsfeedstock in the international market, the discount rate, given the leveraging, the refining margins, changes in environmental regulations and cost structure and the level of capital expenditures.
The increased impairment charges for non-current assets in 2015, which totaled COP$3,278,993 million in 2015 as compared to COP$1,340,086 million in 2014 was recorded by the Cartagena Refinery due to the current low oil price environment, which resulted in a reduction in expected refining margins in the coming years, and an increase in market and country risk, which has been reflected in the discount rate (see Note 17.2 to our consolidated financial statements).
The gross margin in 2016 was 8%, compared to 10.7% in 2015. The decrease in the gross margin was explained principally by decreased operational activity during the period of stabilization and testing of Reficar.
The gross margin in 2015 was 10.7%, compared to 6% in 2014. The increase in the gross margin was explained principally by decrease in the oil price (feedstock) compared to the decrease in fuel prices (output).
The refining and petrochemicals segment recorded net loss attributable to owners of Ecopetrol of COP$1,823,0201,973,075 million in 20162018, as compared to a net income to owners of Ecopetrol of COP$358,859 million in 2017, and a net loss attributable to owners of Ecopetrol of COP$4,016,0501,823,020 million in 2015 and COP$1,627,705 million in 2014.2016.
4.6Liquidity and Capital Resources
Our principal sourcessource of liquidity in 2016 were2018 was cash flows from our operations amounting to COP$14,232,940 million, and cash flows from financing activities, mainly from the proceeds of our net movement of indebtedness, which totaled COP$ 1,444,72322,469,194 million.
Our principalmain uses of cash in 20162018 were (i) COP$5,837,47711,363,077 in debt payments through the pre-payment of local and foreign currency-denominated loans totaling the equivalent of US$2,446 million in 2018 and amortizations to capital and interest payments, (ii) COP$8,460,426 million in capital expenditures, which included investments in property, plant and equipment, and natural and environmental resources and (ii) COP$5,446,507 in investment of liquidity surpluses in portfolios,intangibles, (iii) dividend payments for the fiscal year 2015 amounting to COP$1,712,2984,427,701 million, which included the last installment ofincludes dividends to the majority shareholder relating to fiscal year 20142017 for COP$690,1773,659,373 million and the payment of dividends to non-controlling interest in 2016 for COP$1,022,121768,328 million.
On January 29, 2016, we entered into an international credit agreement for an aggregate amount of US$175 million with The Bank of Tokyo-Mitsubishi UFJ, Ltd. The credit agreement has a term of five years, repayable with a 2.5 year grace period on principalFor more information regarding our debt, see the sectionFinancial Review—Financial Indebtedness and interest, payable semi-annually at a rate of Libor plus 145 basis points.Other Contractual Obligations.
On February 23, 2016, we entered into a bilateral commercial loan agreement with Bancolombia S.A. for COP$990 billion (approximately US$330 million at the representative exchange rate4.6.1Review of as of December 31, 2016). This loan agreement had a term of 8 years and a 2-year grace period on principal, with interest payable semiannually at a rate of DTF TA plus 560 basis points. Ecopetrol prepaid this loan in full with excess liquidity in October 2016.Cash Flows
On May 16, 2016, we entered into a bilateral commercial loan agreement with Export Development Canada, an export promotion agency of the Canadian Government for US$ 300 million. This loan agreement has a term of five years, with interest payable semi-annually at rate of six-month Libor + 140 basis points.
On June, 2016, we issued US$500 million (COP$1,500 billion according to the COP$/US$ exchange rate as of December 31, 2016) aggregate principal amount of our SEC-registered 5.875% notes due 2023. The notes were listed on the NYSE.
Cash from operating activities
Net cash provided by operating activities increased by 21.9%32.4% in 20162018 as compared to 2015,2017, mainly as a result of (i) lower working capital needs mainly due to the higher oil prices observed at the end of 2016 versus the end of 2015, (ii) a 4%31.9% increase in our operational income before depreciation, depletion and amortization (DD&A) and impairment of non-current assets resulting from a decreaseprimarily due to (i) higher hydrocarbon production levels, (ii) an increase in our costsrefining throughput, (iii) our continued strategy of replacing imports of crude oil and operational expenses (before DD&Arefined products with domestic production, (iv) the commencement of operations of the San Fernando – Apiay project and impairment) due toexpansion of the P135 Project in our savings generated by the midstream segment, (v) cost efficiencies from our transformation plan.plan and (vi) a favorable price environment. This increase was partially offset by (i) the decrease in international prices of crude oil during 2016, and (ii)higher working capital needs mainly due to an increase in incomeaccounts receivable from the FEPC and the payment in advance of the capital gains tax paid by the transportation and logistics segment due in 2019 pursuant to the better results in 2015.Decree 2146, 2018.
Net cash provided by operating activities decreasedincreased by 35.6%19.3% in 20152017 as compared to 2014,2016, mainly as a result of:of (i) a 33.2% decrease32.7% increase in our grossoperational income resulting from the decrease in international pricesbefore depreciation, depletion and amortization (DD&A) and impairment of crude oil during 2015non-current assets and (ii) higher operating expenses due to the Colombian wealth tax implementedefficiency gains and paid in 2015.cost-savings generated by our corporate strategy. This decreaseincrease was partially offset by a decrease(i) higher working capital needs mainly due to increase in income tax paidaccounts receivable from the FEPC and commercial receivable accounts and (ii) an increase in our costs due to the decreaseeffect of recovery in international crude oil prices on our purchases and an increase in maintenance activities, contracted services and operating supply needs associated with an increase in our income before tax for the year and lower working capital needs due to a decrease in inventories, trade receivables and accounts payable.operational activities.
Cash used in investing activities
In 2016,2018, net cash used in investing activities increased by 98.9% as compared to 2017, mainly as a result of: (i) a 38.5% increase in investments in capital expenditures, which was driven mainly by drilling in the Castilla and La Cira Infantas fields and the B3 module of the Rubiales field and (ii) a 249.4% increase in our investment portfolio as a result of excess liquidity.
In 2017, net cash used in investing activities decreased by 26.8%53.3% as compared to 2015,2016, mainly as a result of:of a 110.4% decrease in our investment portfolios as a result of pre-payments of foreign currency-denominated loans totaling US$2,400 million in 2017. This decrease was partially offset by (i) a 62.4% decreased investments in capital expenditures due to the effect of decreasing oil prices and the end of the Reficar modernization project, and (ii) additional cash proceeds from the sale of our investmentsshares in Empresa de Energía de Bogotá and Interconexion Electrica S.A,, which totaled COP$966,71556,930 million in the aggregate. This decrease was partially offset by increased investments of our excess liquidityaggregate and (ii) a 4.6% increase in our investment portfolios, which in turn resulted from the savings we achieved and the recovery of the price of oil during the second half of 2016.
In 2015, net cash used in investing activities decreased by 2.4% as compared to 2014, mainly as a result of: (i) a decrease in the amount of dividends we received from associates and joint ventures companies (ii) slightly larger investments in capital expenditures, which was driven mainly relating toby the Reficar modernization project andreactivation of activity in our drilling campaigns, primarily in the Castilla Chichimene and Rubiales fields, the development of improved recovery projects in fields such as La Cira and (iii) a lower net cash contribution from purchaseChichimene, and sale of fixed income investments. This decrease was partially offset by cash proceeds from the sale of our investmentan increase in Empresa de Energia de Bogotá, which totaled COP$613,998 million.exploration activities.
Cash used in financing activities
Net cash used in financing activities increased by 98.5%23.7% in 2016,2018, as compared to 2015,2017, due to a decrease in cash from borrowings(i) prepayments of COP$5,151,937local and foreign currency-denominated loans totaling the equivalent of US$2,446 million which was partially offset by a decrease in dividends payments of COP$3,781,099 million in 2016 as compared to 2015.US$2,400 million in prepayments of foreign currency-denominated loans made in 2017 and (ii) an increase in dividend payments to the shareholders of Ecopetrol of COP$2,713,712 million and in dividend payments made by certain of our subsidiaries to their non-controlling shareholders of COP$209,342 million.
| 91 |
Net cash used in financing activities decreasedincreased by 81%362% in 2015,2017, as compared to 2014,2016, due to (i) prepayments of foreign currency-denominated loans totaling US$2,400 million and (ii) an increase in dividend payments to the shareholders of Ecopetrol of COP$255,484 million in 2017 as compared to 2016, which was partially offset by a COP$7,023,166463,135 million decrease in dividend payments which was partially offsetmade by an increase in borrowing and interest paymentscertain of COP$1,069,146 million in 2015 as comparedour subsidiaries to 2014, which in turn was due to the US$1,925 million international loan we entered into in February 2015 and the US$1,500 million international bond we issued in June 2015.their non-controlling shareholders.
Our consolidated capital expenditures in 2016, 20152018, 2017 and 20142016 were COP$5.8 trillion,8,460,426 million, COP$15.5 trillion6,107,506 million and COP$15.6 trillion,5,837,477 million, respectively. These investments were distributed by business segment on average, for the past three years as follows: 61.2%73.0% for the exploration and production segment, 22.1%12.5% for refining and petrochemicals and 16.7%14.5% for the transportation and logistics segment. See Note 34.1.231.3 to our consolidated financial statements for more detail about capital expenditures by segment.
Our investment plan approved for 2017 totals2019 is a range of between US$3,500 million and US$4,000 million. The investments will be distributed approximately as follows: 81%81.0% for exploration and production, 10%11.0% for refining, and petrochemicals, 8% forand transportation and logistics, and 1%8.0% for other investments.
The resources required for the investment plan willcan be funded through internal cash generation with no need to raise additional net financing.
In 2018, we paid dividends for the fiscal year ended December 31, 2017 amounting to COP$3,659,373 million to Ecopetrol’s shareholders, including the Nation, and dividends paid to non-controlling shareholders of our subsidiaries totaling COP$768,328 million.
In 2017, we paid dividends for the fiscal year ended December 31, 2016 amounting to COP$945,661 million to Ecopetrol’s shareholders, including the Nation, and dividends paid to non-controlling shareholders of our subsidiaries totaling COP$558,986 million.
In 2016, we paid the last installment of dividends relating to our2014 net income to the Nation offor COP$690,177 million and our transportation and logistics’logistics subsidiaries paid dividends to their non-controlling shareholdershareholders for COP$1,022,121 million. Given the net loss we reported in 2015,
On March 29, 2019, our shareholders at the ordinary general shareholder’s meeting did not approveGeneral Shareholders Assembly approved a distribution of dividends for 2015.
On March 31, 2017, our shareholders at the ordinary general shareholders’ meeting approved dividends for the fiscal year ended December 31, 20162018 amounting to COP$945,6849,251,256 million, or COP$23225 per share, based on the number of outstanding shares as of December 31, 2016.2018. Of the total dividends that will be paid, COP$169 per share corresponds to an ordinary dividend pursuant to our current dividend policy and COP$56 per share corresponds to an extraordinary dividend given the strong operational results and robust cash position of the Company in 2018. The dividend payment was paidapproved to be made in one installment for the minority shareholders of Ecopetrol on April 28, 2017.25, 2019 and three installments for the Nation, the first to be paid on April 25, 2019, the second to be paid on June 25, 2019 and the final installment to be paid on September 25, 2019.
4.7Summary of Differences between Internal Reporting (Colombian IFRS and IFRS)
We prepare our interim and annual statutory financial information in accordance with our internal reporting policies, which follow Colombian IFRS and differ in certain significant aspects from IFRS. The following table sets forth our consolidated net income and equity for years ended December 31, 2016, 20152018, 2017 and 2014,2016, in accordance with Colombian IFRS and IFRS:
| 92 |
Table 4950 – Consolidated Net Income and Equity
| For the year ended December 31, | ||||||||||||||||||||
| (Colombian Pesos in millions) | % Change | |||||||||||||||||||
| 2016 | 2015 | 2014 | 2016/2015 | 2015/2014 | ||||||||||||||||
| Net income attributable to owners of Ecopetrol (IFRS) | 2,447,881 | (7,193,859 | ) | 5,046,517 | (134.0 | ) | (242.6 | ) | ||||||||||||
| Cash flow hedge for future company exports | (494,604 | ) | 2,140,553 | – | (123.1 | ) | N/A | |||||||||||||
| Exchange rate effects on tax bases – Deferred tax | (388,568 | ) | 1,065,580 | 678,983 | (136.5 | ) | 56.9 | |||||||||||||
| Net income Attributable to owners of Ecopetrol (Colombian IFRS) | 1,564,709 | (3,987,726 | ) | 5,725,500 | (139.2 | ) | (169.6 | ) | ||||||||||||
| Net Equity (IFRS) | 43,560,501 | 43,100,963 | 48,534,228 | 1.1 | (11.2 | ) | ||||||||||||||
| Cash flow hedge for future company exports | (39,803 | ) | (74,259 | ) | – | (46.4 | ) | N/A | ||||||||||||
| Exchange rate effects on tax bases – Deferred tax | 1,799,020 | 2,205,064 | 998,440 | (18.4 | ) | 120.9 | ||||||||||||||
| Net Equity (Colombian IFRS) | 45,319,718 | 45,231,768 | 49,532,668 | 0.2 | (8.7 | ) | ||||||||||||||
| For the year ended December 31, | % Change | |||||||||||||||||||
| 2018 | 2017 | 2016 | 2018/2017 | 2017/2016 | ||||||||||||||||
| (Colombian Pesos in millions) | ||||||||||||||||||||
| Net income attributable to owners of Ecopetrol (IFRS) | 11,381,386 | 7,178,539 | 2,447,881 | 58.5 | 193.3 | |||||||||||||||
| Cash flow hedge for future company exports | (471,314 | ) | (366,048 | ) | (494,604 | ) | 28.8 | (26.0 | ) | |||||||||||
| Exchange rate effects on tax bases – Deferred tax | 646,333 | (192,079 | ) | (388,568 | ) | (436.5 | ) | (50.6 | ) | |||||||||||
| Net income Attributable to owners of Ecopetrol (Colombian IFRS) | 11,556,405 | 6,620,412 | 1,564,709 | 74.6 | 323.1 | |||||||||||||||
| Net Equity (IFRS) | 57,107,780 | 48,215,699 | 43,560,501 | 18.4 | 10.7 | |||||||||||||||
| Cash flow hedge for future company exports | (20,792 | ) | (29,258 | ) | (39,803 | ) | (28.9 | ) | (26.5 | ) | ||||||||||
| Exchange rate effects on tax bases – Deferred tax | 2,217,450 | 1,594,864 | 1,799,020 | 39.0 | (11.3 | ) | ||||||||||||||
| Net Equity (Colombian IFRS) | 59,304,438 | 49,781,305 | 45,319,718 | 19.1 | 9.8 | |||||||||||||||
As noted above, certain differences exist between our net income and equity as determined in accordance with our internal reporting policies, which follow Colombian IFRS, which are used for management reporting purposes, as presented in the business segment information, and our net income and equity as determined under IFRS, as presented in our consolidated financial statements.
The primary differences between Colombian IFRS and IFRS as they apply to our results of operations are summarized below:
Cash flow hedge for future company exports. In September 2015, in order to hedge the effect of exchange rate volatility on Ecopetrol’s foreign currency debt, Ecopetrol’s Board of Directors approved a cash flow hedge for future crude oil exports. According to IAS 39 – Financial Instruments, Ecopetrol implemented this hedge beginning on October 1, 2015, the date on which it formally completed the related hedging documentation.
Under Colombian IFRS, theContaduria General de la NaciónAccounting Office of the Nation (CGN for its acronym in Spanish) issued Resolution 509, which allows companies to apply hedge accounting for non-derivative financial instruments from any date within the transition period or the first period of application of International Accounting Standards in Colombia, even if such company has not yet formally documented the hedging relationship, the objective or the risk management strategy. Under these rules, Ecopetrol applied cash flow hedge accounting from January 1, 2015 in its financial statements under Colombian IFRS.
As a result of this accounting policy differences,difference, for the year ended December 31, 2016,2018, our net income as reported under IFRS was COP$494,604471,314 million higher than our net income as reported under Colombian IFRS.
Exchange rate effects on tax bases – Deferred tax. According to IAS 12.41, companies with a U.S. dollar functional currency and profit or tax loss in Colombian Pesos are required to recognize deferred taxes attributable to the difference between the carrying amounts of non-monetary assets in their financial statements and their respective tax bases converted from Colombian Pesos to U.S. dollars using the exchange rate on the closing date. The effect of the temporary difference is charged to profit and losses without a cash outflow expected in the future. Under local accounting principles (The General Accounting Office opinion No. 20162000000781 dated January 18, 2016), the result attributable to the aforementioned difference in accounting policies does not generate any deferred taxes.
Ecopetrol’s functional currency is the Colombian Peso and it consolidates some subsidiaries whose functional currency is the U.S. dollar but who settled their taxes in Colombian Pesos. As a result of the application of paragraph 41 – IAS 12, such subsidiaries are required to calculate deferred taxes under IFRS.
As a result of this accounting policy difference, for the year ended December 31, 2016,2018, our net income attributable to owners of Ecopetrol as reported under IFRS was COP$388,568 646,333million higherlower than our net income attributable to owners of Ecopetrol as reported under Colombian IFRS.
The application of IAS12.41 also generated adjustments to our goodwill and investments in companies impairments of COP$22,030 million in 2018, COP$61,893 million in 2017 and COP$86,781 million in 2016 and COP$418,872 million in 2015 in connection with our purchase of subsidiaries whose functional currency is the U.S. dollar as well as adjustments to our revenue from the equity method of COP$11,316 million in 2018, COP$60,748 million in 2017 and COP$71,056 million in 2016 and COP$81,808 million in 2015 in connection with our associates and joint ventures whose functional currency is the U.S. dollar.
As a result of these accounting policy differences described above, for the year ended December 31, 2016,2018, we reported net income attributable to the owners of Ecopetrol under IFRS of COP$11,381,386 million as opposed to a net income attributable to the owners of Ecopetrol of COP$11,556,405 million reported under Colombian IFRS for the same period. For the year ended December 31, 2017, these same accounting differences led us to report net income attributable to the owners of Ecopetrol under IFRS of COP$7,148,539 million as opposed to a net income attributable to the owners of Ecopetrol of COP$6,620,412 million reported under Colombian IFRS for the same period. For the year ended December 31, 2016, these same accounting differences led us to report net income attributable to the owners of Ecopetrol under IFRS of COP$2,447,881 million as opposed to a net income attributable to the owners of Ecopetrol of COP$1,564,709 million reported under Colombian IFRS for the same period. For the year ended December 31, 2015, these same accounting differences led us to report a net loss under IFRS of COP$7,193,859 million as opposed to a net loss of a COP$3,987,726 million reported under Colombian IFRS for the same period.
4.8 Financial Indebtedness and Other Contractual Obligations
As of December 31, 2016,2018, we had outstanding consolidated indebtedness of COP$52.233.2 trillion, which corresponded primarily to the following long-term transactions:
Table 5051 – Consolidated Financial Indebtedness
| Company | Type | Initial Date | Original Amount | Maturity | Interest Rate | Amortization | ||||||||||
| Ecopetrol S.A. | Bonds | |||||||||||||||
| September 18, 2013 | US$1,300 million | September 18, 2023 | 5.875 | % | Bullet | |||||||||||
| September 18, 2013 | US$850 million | September 18, 2043 | 7.375 | % | Bullet | |||||||||||
| May 28, 2014 | US$2,000 million | May 28, 2045 | 5.875 | % | Bullet | |||||||||||
| September 16, 2014 | US$1,200 million | January 16, 2025 | 4.125 | % | Bullet | |||||||||||
| June 26, 2015 | US$1,500 million | June 26, 2026 | 5.375 | % | Bullet | |||||||||||
| June 15, | US$500 | September 18, 2023 | 5.875 | % | ||||||||||||
| Bullet | ||||||||||||||||
| December 1, 2010 | COP$479,900 million | December 1, 2020 | Floating | Bullet | ||||||||||||
| December 1, 2010 | COP$284,300 million | December 1, 2040 | ||||||||||||||
| Floating | Bullet | |||||||||||||||
| August 27, 2013 | COP$168,600 million | August 27, 2023 | Floating | Bullet | ||||||||||||
| August 27, 2013 | COP$347,500 million | August 27, 2028 | Floating | Bullet | ||||||||||||
| August 27, 2013 | COP$262,950 million | August 27, 2043 | Floating | Bullet | ||||||||||||
| Bank | December 20, 2025 | Floating | Semi-annual | |||||||||||||
| ECAs | December 30, 2011** | US$2,650 million | December 20, 2027 | Fixed | Semi-annual | |||||||||||
| December 30, 2011** | US$100 million | December 20, 2027 | Floating | Semi-annual | ||||||||||||
| US$ | ||||||||||||||||
| Semi-annual | ||||||||||||||||
| US$ | ||||||||||||||||
| December 20, 2027 | Floating | Semi-annual | ||||||||||||||
| Ocensa | Bond | May 7, 2014 | US$500 million | May 7, 2021 | 4.000 | % | Bullet | |||||||||
| Oleoducto Bicentenario | Bank Loan | July 5, 2012 | COP$ | July 5, 2024 | Floating | Quarterly | ||||||||||
| ODL | Bank | August 1, 2013 | COP$ | August 1, 2020 | Floating | Quarterly | ||||||||||
* Reopening of bond due to 2023.
** Bank loans refinanced from their original conditions.Debt originally obtained by Reficar for the Refinery modernization and voluntarily assumed by Ecopetrol.
| 94 |
The long term debt transactions executed in 2016 werebalance for the end of 2018 is explained as follows:
| · | On |
| · | On |
| · | On |
| · | On |
| · | On December 27, 2018, Ecopetrol redeemed all of its outstanding 7.625% notes due July 23, 2019 in an aggregate principal amount of |
Ecopetrol did not incur any short-term or long-term bank loans or bonds in 2018.
Contractual Obligations
We enter into various commitments and contractual obligations that may require future cash payments. The following table summarizes our contractual obligations as of December 31, 2016.2018.
Table 5152 – Our Contractual Obligations
| COP$ in millions | Payments due by period | Payments due by period | ||||||||||||||||||||||||||||||||||||||
| Contractual obligations | Total | Less than 1 year | 1 to 3 years | 3 to 5 years | More than 5 years | Total | Less than 1 year | 1 to 3 years | 3 to 5 years | More than 5 years | ||||||||||||||||||||||||||||||
| Employee Benefit Plan | 26,365,279.0 | 1,125,105.0 | 2,322,451.0 | 2,420,570.0 | 20,497,153.0 | 30,269,275 | 1,281,826 | 2,657,497 | 2,755,849 | 23,574,103 | ||||||||||||||||||||||||||||||
| Contract Service Obligations | 5,991,167.1 | 2,378,785.4 | 2,407,447.8 | 429,061.3 | 775,872.7 | 3,951,217 | 1,453,298 | 1,609,737 | 412,396 | 475,786 | ||||||||||||||||||||||||||||||
| Operating Lease Obligations | 652,681.2 | 190,875.0 | 157,100.1 | 118,815.1 | 185,891.0 | 407,664 | 96,976 | 116,620 | 86,154 | 107,914 | ||||||||||||||||||||||||||||||
| Natural Gas Supply Agreements | 2,107,163.5 | 229,202.5 | 495,130.2 | 395,420.0 | 987,410.9 | 363,735 | 109,927 | 99,440 | 0 | 154,368 | ||||||||||||||||||||||||||||||
| Purchase Obligations | 1,318,087.2 | 624,323.3 | 571,858.9 | 74,385.0 | 47,520.0 | 1,653,507 | 80,698 | 1,525,351 | 8,092 | 39,366 | ||||||||||||||||||||||||||||||
| Energy Supply Agreements | 795,408.8 | 97,418.0 | 155,820.8 | 121,267.0 | 420,902.9 | 848,790 | 153,205 | 172,200 | 70,347 | 453,038 | ||||||||||||||||||||||||||||||
| Capital Expenditures | 621,571.7 | 423,021.94 | 169,321.7 | 29,228.1 | - | 556,157 | 397,522 | 130,214 | 28,421 | 0 | ||||||||||||||||||||||||||||||
| Build, Operate, Maintain and Transfer Contracts (BOMT) | 576,758.8 | 65,155.9 | 114,724.0 | 113,351.5 | 283,527.4 | 665,759 | 64,748 | 123,481 | 129,283 | 348,247 | ||||||||||||||||||||||||||||||
| Capital (Finance) Lease Obligations | 381,838.6 | 254.1 | 23,649.2 | 40,011.2 | 317,924.1 | 454,631 | 55,087 | 80,812 | 63,353 | 255,379 | ||||||||||||||||||||||||||||||
| Financial Sector Debt | 20,162,033.8 | 1,333,129.9 | 3,181,732.0 | 9,712,744.3 | 5,934,427.7 | 10,071,534 | 1,576,597 | 2,906,067 | 2,886,955 | 2,701,915 | ||||||||||||||||||||||||||||||
| Bonds | 30,909,787.0 | 138,700.0 | 5,672,263.5 | 1,980,255.0 | 23,118,568.5 | 25,986,306 | 64,995 | 3,542,961 | 5,388,600 | 16,989,750 | ||||||||||||||||||||||||||||||
| Total | 89,881,776.78 | 6,605,971.01 | 15,271,499.17 | 15,435,108.32 | 52,569,198.28 | 72,228,575 | 5,334,879 | 12,964,380 | 11,829,450 | 45,099,866 | ||||||||||||||||||||||||||||||
The table does not include the contractual obligations of Equion, Savia and Ecodiesel, which do not consolidate within the Ecopetrol’s Group.
4.9 Off Balance Sheet Arrangements
As of December 31, 2016,2018, we did not have off-balance sheet arrangements of the type that is required to be disclosed under Item 5.E of Form 20-F.
4.10 Trend Analysis and Sensitivity Analysis
Trend Analysis
Ongoing Trends
Ecopetrol updated its 2020 Business Plan on September 29, 2016. ThisFebruary 26, 2019. See sectionOur Corporate Strategy—Business Plan is based on three fundamental pillars: i) protection of cash and cost efficiency; ii) strict capital discipline; and iii) growth in reserves and production; these pillars will strengthen the Company’s financial sustainability and afford it opportunities for both organic and inorganic growth, generating value and profitability for its shareholders.
According to this business plan, during 2017 the Company will continue to pursue its transformation to ensure operational and financial sustainability. Ecopetrol has named Phase 3.0a discussion of the business Transformation plan “Ecopetrol’s New Frontier”. It will focus on opening up new markets; multi-year fields development plans; improved return on assets; attracting and retaining the best human talent; committing ourselves to integrity, safe operations, environment consciousness and joint prosperity with communities in which we operate and execute projects.
We believe that our strategy of diversifying our export destinations and sales under term contracts with fixed discounts to reference prices will help to mitigate the impact of the current crude oversupply over the spread of our export basket. We forecast a discount between US$9 and US$10 per barrel compared to ICE Brent crude in 2017.
Furthermore, with the full operation of all units of Reficar since 2016 and shifting from stabilization to optimization, Ecopetrol’s trade balance is expected to continue improving due to the reduction of gasoline imports and incremental exports of fuels. Reficar’s fuels production is expected to continue being allocated primarilytrends recognized in the domestic market, with a surplus to be exported.development of that plan.
Adding reserves and maintaining the pace of production are the Company’s focus. The exploration campaign will be focused in regions of high prospectivity. Investment in exploration will rise from US$ 282 million to US$ 650 million, thus increasing offshore wells from one to six and onshore wells from five to 11 from 2016 to 2017. Enhanced recovery will continue to leverage additional reserves in mature fields.
We stress that a strong cash position allows us to assess opportunities for inorganic growth of Ecopetrol ‘s reserves.
The Company expects to continue the divestment program and expects to receive during 2017 between US$500 and US$1,000 million. The Company is in the process of carrying out the sale of non-strategic assets and shareholdings, such as Propilco, its remaining shares in Empresa de Energía de Bogota and minor production fields.
In order to preserve its investment grade ratings, the Company seeks to maintain financial sustainability and adequate levels of indebtedness. In 2016 international bonds were issued totaling US$ 500 million and commercial loans were entered into totaling US$ 475 million. Going forward, and according with the assumptions of the business plan, the Company does not foresee the issuance of new debt or short-term financing.
The Company will continue monitoring oil price scenarios to make the proper decisions and take preventive actions to ensure financial sustainability in 2017 such as: prioritization of investments associated with regulatory commitments and project completion, temporary closing of producing assets with negative margins, redefining and prioritizing maintenance activities and additional austerity measures related to administrative expenses, sponsorships and labor recruitment.
Sensitivity Analysis
Sensitivity Analysis of Reserves
The following table provides information about the sensitivity analysis conducted on our oil and gas reserves as of December 31, 2016,2018, taking into account ICE Brent crude oil prices that reasonably reflect management’s view of crude oil prices given prevailing market conditions.
Table 5253 – Sensitivity Analysis of Reserves
Oil and NGL (million barrels) | Natural Gas (bcf) | Total Oil and Gas (Mmboe) | Oil and NGL (million barrels) | Natural Gas (bcf) | Total Oil and Gas (Mmboe) | |||||||||||||||||||
| Reserves as of December 31, 2016 | 1,033 | 3,218 | 1,598 | |||||||||||||||||||||
| Reserves as of December 31, 2018 | 1,200 | 3,002 | 1,727 | |||||||||||||||||||||
| Sensitivity Scenario | 1,182 | 3,252 | 1,752 | 1,155 | 2,958 | 1,674 | ||||||||||||||||||
| Difference (million barrels) | 149 | 34 | 154 | (45 | ) | (44 | ) | (53 | ) | |||||||||||||||
| Difference (%) | 14.4 | 1 | 9.6 | (4 | )% | (1 | )% | (3 | )% | |||||||||||||||
The conversion rate used is 5,700 cf = 1 boe.
Assumptions for the Sensitivity Analysis of Reserves
| · | The sensitivity of the ICE Brent price index is forecasted to average US$ |
| · | The base scenario on which our sensitivity analysis is made corresponds to our oil, NGL and natural gas reserves, as of December 31, |
| · | Other variables such as the operating costs, capital costs and portfolio price |
Sensitivity Analysis of our Results
The following table provides information about the sensitivity of our results as of December 31, 2016,2018, due to variations of US$1 in the price of ICE Brent crude and of 1% in the COP$/US$ exchange rate.
| 96 |
Table 5354 – Results of Reserves’ Sensitivity Analysis Results
| Income Statement 2016 | Income Statement Case ICE Brent(1) | Difference Between Real 2016 and Case ICE Brent | Income Statement Case TRM(2) | Difference Between Real 2016 and | Income Statement 2018 | Income | Difference Between Real 2018 and Case ICE Brent | Income | Difference Between Real 2018 and Case TRM | |||||||||||||||||||||||||||||||
| (COP$ in billions) | (COP$ in billions) | |||||||||||||||||||||||||||||||||||||||
| Revenue | 48,485,56 | 49,398,37 | 912,81 | 48,931,98 | 446,42 | 68,603.87 | 69,602.13 | 998.26 | 69,324.68 | 720.81 | ||||||||||||||||||||||||||||||
| Cost of sales | 34,251,42 | 34,606,79 | 355,37 | 34,472,25 | 220,83 | 41,184.38 | 41,560.55 | 376.17 | 41,514.49 | 330.11 | ||||||||||||||||||||||||||||||
| Gross Income | 14,234,14 | 14,791,58 | 557,44 | 14,459,73 | 225,60 | 24,419.49 | 28,041.58 | 622.09 | 27,810.19 | 390.70 | ||||||||||||||||||||||||||||||
| Operating expenses | 4,400,84 | 4,400,84 | - | 4,400,84 | - | 4,592.45 | 4,592.45 | - | 4,592.45 | - | ||||||||||||||||||||||||||||||
| Impairment of non-current assets | 928,75 | 928,75 | - | 928,75 | - | 368.63 | 368.63 | - | 368.63 | - | ||||||||||||||||||||||||||||||
| Operating income | 8,904,55 | 9,461,99 | 557,44 | 9,130,14 | 225,60 | 22,458.41 | 23,080.50 | 622.09 | 22,849.11 | 390.70 | ||||||||||||||||||||||||||||||
| Finance results, net | (1,175,37 | ) | (1,175,37 | ) | - | (1,175,37 | ) | - | (2,010.38 | ) | (2,010.38 | ) | - | (2,010.38 | ) | - | ||||||||||||||||||||||||
| Share of profit of associates and joint ventures | 61,35 | 61,35 | - | 61,35 | - | 165.84 | 165.84 | - | 165.84 | - | ||||||||||||||||||||||||||||||
| Income before income tax | 7,790,53 | 8,347,97 | 557,44 | 8,016,12 | 225,60 | 20,613.87 | 21,235.96 | 622.09 | 21,004.57 | 390.70 | ||||||||||||||||||||||||||||||
| Income Tax | (4,543,05 | ) | (4,868,12 | ) | (325,07 | ) | (4,674,60 | ) | (131,56 | ) | (8,258.49 | ) | (8,507.71 | ) | (249.23 | ) | (8,415.01 | ) | (156.52 | ) | ||||||||||||||||||||
| Net Income | 3,247,48 | 3,479,85 | 232,37 | 3,341,52 | 94,04 | 12,355.38 | 12,728.25 | 372.86 | 12,589.56 | 234.18 | ||||||||||||||||||||||||||||||
| (1) | ICE Brent = US$ |
| (2) | Exchange rate (TRM) = COP$ |
Assumptions for the Sensitivity Analysis of our Results
| · | Our sensitivity analysis is based on the Consolidated Statement of Profit or Loss for |
| · | The sensitivity of the ICE Brent price index is in reference to an increase of US$1 per barrel of crude oil in the average ICE Brent reference price based on a 365-day year for |
| · | The sensitivity of our results to changes in the exchange rate is in reference to a 1% average depreciation of the Colombian Peso against the U.S. dollar during |
| · | The income tax for each of our sensitivity analyses (price of ICE Brent and COP$/US$ exchange rate) is estimated using the effective corporate tax rate of |
The table below sets forth the line items that are being affected by the variation on the reference prices or the average exchange rate.
Table 5455
VARIATION ON ICE BRENT REFERENCE | VARIATION ON AVERAGE EXCHANGE RATE | |
| ||
| Sales of crude oil | Sales of crude oil | |
| Sales of refined products | Sales of refined products | |
| Sales of natural gas | Sales of natural gas | |
| COST OF SALES | ||
| Local purchases from business partners | Local purchases from business partners | |
| Local purchases of hydrocarbons from the ANH | Local purchases of hydrocarbons from the ANH | |
| Local purchases of natural gas | Local purchases of natural gas | |
| Imports of products | Imports of products |
| 97 |
| 5. | Risk Review |
The risks discussed below could have a material adverse effect, separately or in combination, on our business’s operating results, cash flows, liquidity and financial condition. Investors should carefully consider these risks.
5.1.1 Risks Related to Our Business
This section describes the most significant potential risks to our business.
Our crude oil and natural gas reserve estimates involve some degree of uncertainty and may prove to be incorrect over time, which could adversely affect our ability to generate revenue.
Reserves estimates are prepared using generally accepted geological and engineering evaluation methods and procedures. Estimates are based on geological, topographical and engineering facts. Actual reserves and production may vary materially from estimates shown in this annual report, and downward revisions in our reserve estimates could lead to lower future production which could affect our results of operations and financial condition.
Hydrocarbon reserves presented in this annual report were calculated in accordance with SEC regulations. As required by those regulations, reserves were valued based on the unweighted average of closing prices for the first day of each month in the 12-month periods ended December 31, 2016, 20152018, 2017 and 2014,2016, as well as other conditions in existence at those dates. The average of closing prices of ICE Brent crude oil for the first day of each month in the 12-month period was US$101.80 per barrel in 2014, US$55.57 per barrel in 2015 and US$44.49 per barrel in 2016. Mainly as a result of the pronounced fall2016, US$54.93 per barrel in hydrocarbon prices between 20142017 and 2015,US$72.20 per barrel in 2018. In 2017, the Company recognized a reductionan increase in oil and gas proven reserves of 11% in 20154% as compared to 2014,2016, to 1,8491,659 mmboe in 20152017 from 2,0841,598 mmboe in 2014.2016. In 2016,2018, the Company recognized a reductionan increase in oil and gas proven reserves of 14% in 20164% as compared to 2015,2017, to 1,5981,727 mmboe in 20162018 from 1,8491,659 mmboe in 20152017. For more information, see the sectionBusiness Overview—Exploration and Production—Reserves.Reserves.
Furthermore, at least once a year, or more frequently if the circumstances require, the Company ascertains whether there are signsindicators of impairment to its assets or cash-generating units (CGUs) due to the difference between the carrying amount of such assets or CGUs as opposedagainst to their recoverable amounts, using reasonable assumptions, based on internal and external factors, which reflect market conditions. The recoverable amount is calculatedconsidered to be the higher of the fair value less costs of disposal and value in use, based on the free cash flow method, discounted at the weighted average capital cost (WACC). Whenever the recoverable amount of an asset or CGU is lower than its net carrying amount, such amount is reduced to its recovery amount, recognizing a loss for impairment as an expense in the consolidated statement of profit or loss. External and internal sources of information may indicate that an impairment loss recognized for an asset, other than goodwill, may no longer exist or may have decreased, in this case, the reversal is recognized as an impairment recovery in the consolidated statement of profit or loss.
Impairment charges forIn 2018, Ecopetrol recognized an impairment loss, net of non-current assets in 2016 amountedof COP$368,634 million, which corresponds to COP$928,747 million before taxes as athe net result of the evaluation of the recoverable amount of the assets value which includes the variation in estimations of future prices under the current scenarios of OPEC’s oil quota agreements and the impact resulting from changes on specifications issued by the International Marine Organization agreement regarding marine pollution, Marpol, on crude and fuels with high sulfur content. For additional information about this impairment charges,see Notes 14, 17 and 28 to our consolidated financial statements.of:
| · | An impairment of non-current assets in the refining and petrochemicals segment, primarily due to (i) adjustments in market expectations with respect to the impact of implementation of IMO regulations on projected margins for Reficar’s refined products (ii) a decrease in the short-term outlook for the ethanol prices given a global over-supply of ethanol, (iii) downward updates to Bioenergy’s near-term agricultural outputs and (iv) an increase in the discount rate used for Reficar and Bioenergy, reflecting updated macroeconomic conditions. These negative impacts were partially offset by the commencement of the stabilization period at both Reficar and Bioenergy as well as tax benefits associated with Law 1942, 2018. |
| · | An impairment of non-current assets in the transportation and logistics segment, primarily the result of a decrease in the forecast of the volume to be transported by the southern transportation unit and an increase in investment needs to mitigate the operative risk of our transportation systems. |
| 98 |
| · | A reversal of impairment of non-current assets in the exploration and production segment, primarily due to an improved short-term hydrocarbon price outlook, incorporation of new reserves and technical and operational information variables. |
Any significant change in estimates and judgments could have a material effect on the quantity and present value of our proved reserves and subsequently on the recognition or recovery of impairment charges. Changes to estimations of reserves are applied prospectively to the amounts of depreciation, depletion and amortization charged and, consequently, the carrying amounts of exploration and production assets.
In order to assess the possible impact of current expected oil price scenarios and market conditions, as well as of further developments driven by the economic environment for the oil and gas industry, the Company has performed a sensitivity analysis over its proved reserve balance as of December 31, 2016.2018. Based on these calculations, assuming an average price per barrel of ICE Brent crude oilprice of US$55 per barrel in 2017, US$60 per barrel in 2018, US$6567 per barrel in 2019, US$7071 per barrel in 2020, and US$7569 per barrel for later years,in 2021, and between US$66 and US$71 onwards, Ecopetrol could recognize an increasea decrease in oil and gas proved reserves of approximately 9.6%3%. This analysis takes into account Ecopetrol’s estimates and expectations regarding the main assumptions used in its proven reserve calculation, which final actual result may fluctuate and differ substantially from those provided herein due to several factors outside of the control of the Company. For additional information see the sectionFinancial Review—Trend Analysis and Sensitivity Analysis.
Moreover,On the contrary, any downwardupward revision in our estimated quantities of proved reserves would indicate lowerhigher future production volumes, which could result in higherlower expenses for depreciation, depletion and amortization for properties to which we apply the units of production method for calculating these expenses. These higherlower expenses, and any lowerhigher revenues as a result of actual production volumes and realized prices, could adversely impactbenefit our results of operations and financial condition.
Achieving our long-term growth depends on our ability to execute our strategic plan — specifically, the discovery andand/or successful development of additional reserves.
Our long-term growth objectives depend largely on our ability to develop the reserves recovery potential associated with existing fields and to discover and/or acquire new reserves, and in turn developingdevelop them successfully and improving the recovery factor in our mature oil fields.successfully. Our exploration activities expose us to the inherent geological and drilling risks including the risk of not discovering commercially viable crude oil or natural gas reserves;reserves, and the risk that some exploratory wells initially budgeted for may be drilled at a later stage or not be drilled at all. Despite the effort we make to control costs associated with drilling, these are often uncertain, and numerous factors beyond our control may cause drilling operations to be curtailed, delayed or cancelled.
Our ability to add and develop reserves also depends on our capacity to structurally reduce costs to maintain the profitability of oil fields already being exploited without compromising infrastructure integrity and HSE performance.
Additionally, our strategy includes the exploration and development of unconventional reservoirs in Colombia, by using fracking technology. However, the implementation of this strategy depends, among others, on the final outcome of the regulatory framework affecting this technology currently being discussed in Colombia, obtaining the requisite environmental license required for the exploratory phase (including pilot wells) to begin and the results of these pilot projects. In February 2019, a commission of experts appointed by the Colombian government submitted its non-binding recommendation to advance in the pilot testing phase with the previous necessary steps to assure effective monitoring, control and communication of the pilot program development to stakeholders. See the sectionBusiness Plan. However, we cannot assure you that unconventional reservoirs in Colombia will be able to be exploited.
If we are unable to achieve expected recovery factors in our existing fields, or successfully discover and develop additional reserves, or if we do not acquire properties having proved reserves, our reserves portfolio will decline. Failure to secure additional reserves may impede us from achieving or maintaining production targets, and may have a negative impact on our results of operations and financial condition.
See the sectionStrategy and Market Overview—Our Corporate Strategy for a discussion of our strategic plan.
| 99 |
Our business depends substantially on international prices for crude oil and refined products. The prices for these products are volatile; a sharp decrease could adversely affect our business prospects and results of operations.
In 2016,2018, in Ecopetrol, approximately 91.7%95% of the revenues came from sales of crude oil, natural gas and refined products and 91% of the total volume sold of these products iswas indexed to international reference prices or benchmarks such as ICE Brent. Consequently, fluctuations in those international indexes have a direct effect on our financial condition and results of operations.
Prices of crude oil, natural gas and refined products have traditionally fluctuated as a result of a variety of factors including, among others, competition within the international oil and natural gas industry;industry, long-term changes in the demand for crude oil (as further explained below), natural gas and refined products;products, the economic policies in the United States, China and the European Union;Union, regulatory changes;changes, changes in global supply, such as the current oversupply of crude oil; inventory levels;levels, changes in the cost of capital;capital, adverse or favorable economic conditions;conditions, global financial crises; development ofcrises, substitute sources of energy, development of new technologies;technologies, global and regional economic and political developments in the Organization of the Petroleum Exporting Countries, (OPEC);, the willingness and ability of the OPEC and its members to set production levels;levels, local and global demand and supply for crude oil, refined products and natural gas;gas, trading activity in oil and natural gas, which thereby affects their respective margins;margins, derivative financial instruments related to oil and gas; development or availability of alternative fuels; weather conditions;conditions, natural events or disasters;disasters, and terrorism and global conflict. In 2016After experiencing gradual recovery during the impactfirst half of an oversupplied market was put to test, as OPEC changed its traditional controlling2018 and reaching a peak in October, Brent suffered a downward rally in the latter part of 2018. The outlook of weaker economic growth for 2019 and a mismatch of supply and demand of crude played a fundamental role for this trend. See the sectionStrategy and letMarket Overview for a discussion of the market find its own balance. The price of crude oil may also fluctuate due to changes in demand. For example, Brexit’s impact on crude oil demand for 2017 is expected to be moderate, the Petroleum Industry Research (PIRA Energy Group) estimates a short-term impact of US$2 per barrel on crude oil due to a reduction between 100-200 KBD in demand for gasoline, middle distillates and other products.overview.
When crude oil, refined products and natural gas prices are low, we earn less revenue and we generate lower cash flow and less income. Conversely, when crude oil, refined product and natural gas prices are high, we earn more and generate a larger amount of cash and net income. During 2016,2018, our crude oil basket price was US$35.763.2 per barrel versus US$43.9 per barrel47.8 in 2015;2017, the refined product basket price was US$50.177.3 per barrel versus US$63.462.7 per barrel in 2015;2017; and the natural gas price was US$23.522.4 per barrel equivalent in 20162018 versus US$22.022.7 per barrel equivalent in 2015.2017. However, it is important to consider that the margin on refined products can result either in higher or lower margins due to a change in price of crude the same way gas prices can be impacted by local conditions, such as local demand and weather conditions.
Impairment charges forIn 2018, we had an impairment of non-current assets of COP$368,634 million compared to the COP$1,311,138 million net reversal of the impairment of non-current assets in 2016 amounted to2017 and the impairment of non-current assets of COP$928,747 million before taxes as a resultin 2016. These impairments are an accounting effect that does not involve any inflow of resources and they are susceptible to reversion when the fair value of the evaluation of the recoverable amount of the assets’ value which includes the variation in estimations of future prices under the current scenarios of OPEC’s oil quota agreements and the impact resulting from changes on specifications issued by the International Marine Organization agreement regarding marine pollution, Marpol, on crude and fuels with high sulfur content.asset is below its book value. For additional information about this impairment charges,,see Notes 14, 17the sectionFinancial Review—Operating Results—Consolidated Results of Operations—Impairment of non-current assets and 28Note 16 to our consolidated financial statements.
A reduction of international crude oil prices could also result in a delay or a change in our capital expenditure plan, in particular delaying exploration and development activities, thereby delaying the development of reserves and affecting future cash flows. In order to maintain a profitable operation and preserve the cash flow of the Company at certain oil price levels, some of our producing fields may have to be closed or their operations temporarily suspended which would affect our production levels and expected revenues.
Changes in the Colombian Peso/U.S. dollar exchange rate could have an adverse effect on our financial condition and results of operations given the amount of U.S. dollar denominated debt held by the company and the fact that most of our revenues isare derived from sales of products quoted in or with reference to U.S. dollars.
Most of our revenues are derived from sales of products quoted in or with reference to U.S. dollars. Therefore when the Colombian Peso depreciates against the U.S. dollar, our revenues converted into Colombian Pesos, increase. Conversely, when the Colombian Peso appreciates against the U.S. dollar, our revenues decrease.
On the other hand, imported goods, oil services and the debt, which is mainly denominated in U.S. dollars, become less expensive when the Colombian Peso appreciates against the U.S. dollar and more expensive when the Colombian Peso depreciates against the U.S. dollar.
| 100 |
As of December 31, 20162018 our U.S. dollar-denominated total debt was US$15.210.5 billion, which we recognize in our consolidated financial statements at its amortized cost, which corresponds to the present value of cash flows, discounted at the effective interest rate. Out of this total, US$129.7 billion relate to Ecopetrol S.A., whose functional currency is the Colombian Peso. Therefore, when the Colombian Peso depreciates against the U.S. dollar, Ecopetrol S.A. is exposed to an exchange rate loss. In contrast, when the Colombian Peso appreciates against the U.S. dollar, Ecopetrol S.A.isS.A. is exposed to an exchange rate gain. Some of the Group’s affiliates have the U.S. dollar as functional currency and are not exposed to a material exchange rate risk resulting from fluctuations in the Colombian Peso against the U.S. dollar. On the asset side, when the financial statements of the Group are consolidated, the exchange rate differential of the affiliates’ assets and liabilities whose functional currency is the U.S. dollar is recognized directly in the equity, as part of the other comprehensive income.
The Company adopted hedge accounting as part of its risk management strategy, using two types of natural hedges with its U.S. dollar debt as a financial instrument: i) cash flow hedge for exports of crude oil and ii) hedge of a net investment in a foreign operation. As a result of the implementation of both hedges, 88%, or $10.5 billion,US$6,500 million of Ecopetrol S.A.’s debt in U.S. dollars as of December 31, 2018, was designated as a hedge. With the adoption of hedge accounting, the effect of the volatility of the foreign exchange rate on the hedged portion of the debt is recognized directly in equity, as part of other comprehensive income. The remaining portion of Ecopetrol S.A.’s U.S. dollar-denominated debt as well as the financial assets and liabilities denominated in foreign currency continues to be exposed to the fluctuation in the exchange rate.
The U.S. dollar/Colombian Peso exchange rate has fluctuated during the last several years. On average, the Colombian Peso depreciated 7.05% against the U.S. dollar in 2014, 37.28% in 2015 and 11.18% in 2016.2016, appreciated 3.35% in 2017 and depreciated 0.18% in 2018. Additionally, as of December 31, 2018, the Colombian Peso depreciated 8.91%, as of December 31, 2017, the Colombian Peso appreciated 0.56% and as of December 31, 2016, the Colombian Peso appreciated 4.72%, but depreciated as of December 31, 2015 and 2014, 31.64% and 24.17%, respectively,in each case from year-end exchange in the previous year. In addition, given the performance of interest rates in the U.S., crude oil prices in the next few years and political uncertainty surrounding the United States of America following the recent presidential election and the unpredictability in the economic performance of some developed countries,Colombia, there is no clear view of how the U.S. dollar and the Colombian peso will behave in the medium to long-term. Given that markets are dealing with a great deal of uncertainty, it is expected that U.S. dollar movements will remain difficult to forecast, as the U.S. currency will respond immediately to any new opportunities for or challenges to the U.S. economy.forecast.
A future depreciation in the exchange rate of the Colombian Peso against the U.S. dollar may affect our financial results when converted into Colombian Pesos, given our current net position in U.S. dollars, the fact that most of our revenues are collected in U.S. dollars and the portion of our U.S. dollar debt that is not designated as hedge instrument and the future debt we may acquire. Please see our sensitivity analysis on our results of operation to exchange rate fluctuations in the sectionFinancial Review—Effect of Taxes, Exchange Rate Variation, Inflation and the Price of Oil on our Results—Exchange Rate Variationand in Note 31.228.1 to our consolidated financial statements.
Increased competition from local and foreign oil companies may have a negative impact on our ability to gain access to additional crude oil and natural gas reserves in Colombia and abroad.
We must bid for exploration blocks offered by the ANH in Colombia and similar authorities in other countries, which means we compete under the same conditions as other domestic and foreign oil and gas companies, and receive no special treatment. Our ability to obtain access to potential fields also depends on our ability for evaluating and selecting potential opportunities and to adequately bid for such opportunities.
We are also exposed to international competition as a result of our international exploratory activities. Currently, we are exploring in Brazil, Mexico and the US Gulf of Mexico, where we both partner and compete with other oil and gas companies operating in those locations.
If we are unable to adequately compete with local and foreign oil companies, or if we cannot enter into joint ventures with market players having high potential exploration projects, our exploration activities may be limited. This could reduce our market share and, in turn, adversely affect our financial condition.
| 101 |
If operational risks to which we are exposed in Colombia or overseas materialize, the health and safety of our workforce, the local community and the environment may be affected. In addition, we may suffer a disruption or shutdown of our operational activities.
Our exploration, production, refining and transportation activities in Colombia and in the foreign countries in which we operate are subject to industry-specific operating risks, some of which, despite our internal procedures and adherence to industry best practices, are beyond our control. Our operations may be curtailed, delayed or cancelled due to adverse or abnormal weather conditions, natural disasters, blockages in the communities in which we operate, equipment failures or accidents, oil or natural gas spills or leaks, shortages or delays in the availability or in the delivery of equipment, delays or cancellation of environmental licenses or other government authorizations or judicial decisions, fires, explosions, blow-outs, surface cratering, pipeline failures, theft and damage to our transportation infrastructure, sabotage, terrorist attacks and criminal activities.
Some of our operations in Colombia and abroad could be conducted in remote and uninhabited locations whichthat involve health and safety risks that could affect our workforce. By our own Company policy and practices, as well as under Colombian law and international industrial safety regulations, we are required to have health and safety practices that minimize risks and health issues faced by our workforce. Failure to comply with health and safety regulations in the jurisdictions where we operate may lead to investigations by health officials that could result in lawsuits or fines.
We may be required to incur in additional costs and expenses to allocate funds to industrial safety and health compliance under Colombian law and international industrial safety regulations. Additionally, if any operational incident occurs that affects local communities and ethnic communities in nearby areas, we will need to incur in additional costs and expenses in order to return affected areas to normality and to compensate for any damages we may cause. These additional costs may have a negative impact on the profitability of the projects we may decide to undertake.
The occurrence of any of these operating risks could result in substantial losses or slowdowns to our operations, including injury to our employees, malfunction or destruction of property, equipment and infrastructure, clean-up responsibilities, third-party liability claims, government investigations and imposition of fines, withdrawal of environmental licenses and other government permits, suspension or shutdown of our activities and loss of revenue. The occurrence of any of these events may have a material adverse effect on our financial condition and results of operations.
Our involvement in deep-water drilling either as direct operator or in conjunction with our business partners involves risks and costs, which may be out of our control.
Our deep-water drilling activities present severe risks, such as the risk of spills, explosions on platforms and drilling operations, and natural disasters. The occurrence of any of these events or other incidents could result in personal injuries, loss of life, severe environmental damage with the resulting containment, clean-up and repair expenses, equipment damage and liability in civil and administrative proceedings. Heightened risks and costs associated with deep-water drilling may have a negative effect on our results of operations and financial condition and in our reputation.
See the sectionBusiness Overview—Exploration and Production—Exploration Activities—Exploration Activities Outside of ColombiaProductionfor a summary of our current deep-water drilling activities.
As a result of the oil spill in the Macondo field operated by British PetroleumBP in the U.S. Gulf Coast in April 2010, significant concerns regarding the safety of deep-water drilling have been raised and, as a result, applicable regulations in various countries have changed. More stringent government regulation may result in increased costs and longer exploration and development timeframes for our deep-water drilling operations and consequently could adversely affect our results of operations and financial condition.
We are exposed to the credit, political and regulatory risks of our customers and any material nonpayment or nonperformance by our key customers could adversely affect our cash flow and results of operations.
Some of our customers may experience financial problems that could have a significant negative effect on their creditworthiness. Severe financial problems encountered by our customers could limit our ability to collect amounts owed to us, or to enforce the performance of obligations owed to us under contractual arrangements. In addition, many of our customers finance their activities through their cash flows from operations, short and long term debt or equity.
| 102 |
The combination of decreasing cash flows as a result of declines in commodity prices, a reduction in borrowing bases under reserve-based credit facilities and the lack of availability of debt or equity may result in a significant reduction of our customers’ liquidity and limit their ability to make payments or perform their obligations to us.us according to their contractual terms.
Furthermore, some of our customers may be highly leveraged and subject to their own operating expenses. Therefore, the risk we face in doing business with these customers may increase. Other customers may also be subject to regulatory changes, which could increase the risk of defaulting on their obligations to us. FinancialWe also could have disagreements with customers regarding tariffs, excusable events, or other aspects of our commercial relations that could lead to contract breaches by our clients. See Note 28.2 to our consolidated financial statements for more details.
Such financial problems experienced by our customers or deterioration in our relations with our customers could result in the impairment of our assets, a decrease in our operating cash flows and may also reduce or curtailrestrict our customers’ future use of our products and services, which may have an adverse effect on our revenues and our ability to make payments under our existing debt obligations.
Our ability to access the credit and capital markets on favorable terms to obtain funding to refinance our debt maturities may be limited due to the deterioration of these markets, any change to our credit ratings and the authorizations we need before incurring any financial indebtedness.
In recent years, particularly during the last quarter of 2015 and the first quarter of 2016, due to significant decrease in oil prices, domestic and global financial markets and economic conditions have been weak and volatile and have contributed significantly to a substantial deterioration in the credit markets. A new financial crisis, remaining volatility in prices in the oil and gas sector, the spread in protectionist policies in the United StatessStates, China and Europe, the lack of consensus among OPEC members, the political uncertainty in the region, the discovery of corruption by governments and private companies in emerging markets and further geopolitical disruptions in the Middle East, which could involve developed countries, which in turn could worsen risk perception with respect to the emerging markets, or the occurrence of any of the risks described in the sectionRisk Review—Risk Factors—Risks Related to Colombia’s Political and Regional Environment could also make it more difficult for us and our subsidiaries to access international and local capital markets and finance our operations and potentially refinance our debt maturities on terms acceptable to us. These conditions, along with significant write-offs in the financial services sector and the re-pricing of credit risk, can make it difficult for us to obtain funding for our capital needs on favorable terms. Access to credit and capital markets is also dependent on our credit ratings, which are mainly determined by our financial and operational strength, oil and gas market conditions and the support that could be provided by the Colombian government. On January 18, 2016, our senior unsecured debt ratings were downgraded to Baa3 from Baa2 by Moody’s Investors Service, and Standard & Poor’s (S&P) and Fitch Ratings revised our outlook from stable to negative on January 29 and July 26, 2016, respectively. We cannot assure that our credit ratings will continue for any given period of time or that the ratings will not be further lowered or withdrawn. An assigned rating may be raised or lowered depending, among other things, on the respective rating agency’s assessment of our financial strength. In addition, a downgrade in the rating of the Republic of Colombia could also trigger a downgrade on our ratings as our rating is capped by the rating of the Republic of Colombia and the implicit support that can potentially be provided to the Company. On February 16, 2016, S&P revised23, 2018, despite the outlookdowngrade of the Republic of Colombia, Moody’s maintained our long term international credit rating and outlook. On June 27, 2018, S&P maintained our long-term corporate credit rating at BBB- and our outlook at stable. On July 16, 2018, Moody’s upgraded our BCA (Baseline Credit Assessment) to negative. While on March 14, 2017,ba1 from ba3 and maintained our long term international credit rating at Baa3 and outlook at stable. On December 6, 2018, Fitch Ratings upgradedmaintained our outlook from negative to stable following the upgrade from the Republic of Colombia from negative to stable also in March 2017, welong term international credit rating at BBB stable. We cannot offer any assurance that our credit rating will continue.
As a result of these factors, we may be forced to revise the timing and scope of our capital projects as necessary to adapt to existing market and economic conditions, downgrades to our credit ratings or to access the financial markets on terms less favorable, therefore negatively affecting our results of operations and financial condition.
In addition, under applicable regulation, the Government, through the Ministry of Finance and Public Credit and the favorable opinion of the National Planning Department, must authorize all indebtedness of state-owned entities and government-controlled companies through a majority equity stake. Consequently, excluding our foreign subsidiaries or those subsidiaries in which we hold minority interest, most of our indebtedness must be previously authorized by the Colombian Ministry of Finance and Public Credit and the National Planning Department. As such, our indebtedness is subject to the Government’s time frames and policies, and we cannot guarantee that such authorizations would be granted in a timely fashion or granted at all.
We may be exposed to increases in interest rates, thereby increasing our financial costs.
We may incur debt locally and in the international capital markets and, consequently, may be affected by changes in prevailing interest rates. If market interest rates increase, our financing expenses may increase, which could have an adverse effect on our results of operations and financial condition. Interest rates in the United States may continue rising due to Federal Reserve’s monetary policy, which is looking for economic activity expansion at a moderate pace, labor market conditions strengthening and inflation stability to 2% over the medium term.
| 103 |
As of December 31, 2016,2018, approximately 31%13.9%, or a principal of US$5.41,569 billion (COP$16.25.1 trillion), of our total indebtedness consisted of floating rate debt. If market interest rates rise, our financing expenses will increase, which could have an adverse effect on our results of operations and financial condition. In addition, as we refinance our existing debt in the coming years, the mix of our indebtedness may change, specifically as it relates to the ratio of fixed to floating interest rates, the ratio of short-term to long-term debt, and the currencies in which our debt is denominated in or indexed to. We cannot assure you that such changes will not result in increased financing expenses borne by us. Finally, as we incur new debt in the future to fund our capital projects or inorganic acquisitions, the prevailing interest rates and spreads at any specific time could be less favorable in terms of cost when compared to our previous financing transactions, which could adversely affect our financial condition and results of operations.
Our current and planned investments and exploration activities outside Colombia are exposed to political and economic risks.
As part ofWe began exploration activities outside Colombia in 2006 through our strategic plan, weBrazilian subsidiary, Ecopetrol Óleo e Gás do Brasil Ltda. We operate through business partners, subsidiaries or affiliates outside of Colombia. We currently have investments, joint ventures and subsidiaries incorporated in Peru, Brazil, Mexico, Bermuda, Panama, the Cayman Islands, Switzerland, Germany, Spain, the United Kingdom and the United States, and we are analyzing investments in other countries. In connection with making investments, we are and will be subject to risks related to economic and political conditions and governmental economic actions. We cannot predict the positions of foreign governments relating to the oil and gas industry, land tenure, protection of private property, environmental standards, regulation or taxation; nor can we assure you that future governments will maintain policies favorable to foreign investment or repatriation of capital.
We began exploration activities outside Colombia in 2006 through our Brazilian subsidiary, Ecopetrol Óleo e Gás do Brasil Ltda. Our foreign subsidiaries have subsequently entered into a number of joint venture exploration agreements with regional and international oil companies to explore acreage in Brazil and the U.S. Gulf Coast. We have limited experience exploring outside Colombia. We Additionally, we may face new and unexpected risks involving environmental and other legal requirements beyond those we currently experience.
The results of operations and financial condition of our subsidiaries in these countries also may be adversely affected not only by risks associated with hydrocarbon exploration and production, but also by fluctuations in their local economies, political instability and government actions, including: the imposition of price controls, the imposition of restrictions on hydrocarbon exports, fluctuation of local currencies against the Colombian Peso, the nationalization of oil and gas reserves, increases in export and income tax rates for crude oil and oil products, and unilateral (governmental) institutional and contractual changes, including controls on investments and limitations on new projects.
Any of these conditions occurring could disrupt or terminate our operations, causing our development activities to be curtailed or terminated in these areas, or our production to decline;decline, limit our ability to pursue new opportunities;opportunities, affect the recoverability of our assets;assets, or cause us to incur additional costs or delay the timeline of our projects.
Our future performance depends on the successful development and deployment of new technologies and the knowledge to apply and improve them.
Technology, knowledge and innovation are essential to our business, especially for reductions to our operating costs and improvements in processes related to the production, refining and transportation of heavy crude oil and the exploitation of mature fields, and reductions in our operating cost.fields. If we do not develop the right technology, ordo not secure access to required third-party technology, fail to deploy the right technology, do not obtain the expertise to operate newour deployed technology or to improve our processes, do not have access to, or do not deploy the knowledge necessary to apply and improve such technology effectively, the executionachievement of our corporate goals, our profitability and our earnings may be adversely affected. In the case of our recovery program, we not only depend on the successful developmentselection, adaptation, demonstration and deployment of newappropriate technologies but also in the reservoir response of the reservoir to the application of thisthese recovery technology.technologies.
Our performance could be negatively affected by a deficiency in leadership capacity and lack of key skilled employees.
As the oil and gas industry faces an increasing number of challenges, the ability to react quickly to these challenges has become a key factor in achieving efficiency, profitability, growth and sustainability. Our ability to achieve these goals can be negatively affected by a deficiency in leadership capacity and a lack of key skilled employees that can execute our business strategy with competency, creativity and determination.
| 104 |
Our operations may not be able to keep pace with the increasing domestic demand for natural gas.
According to the Colombian Energy and Gas Regulatory Commission (CREG)CREG Resolution 114 of 2017, former Resolution 089 of 2013, a supplier ofthe natural gas market is a physical market, which means that suppliers must possess sufficient economically viable natural gas reserves before executing a natural gas delivery contractcomply with a customer. In the long term, we mayquantities agreed in their contracts. Hence, Ecopetrol will not be able to keep up with increasingor increase its market participation unless the Company increases its natural gas reserves as local demand for natural gas if demand outpaces the rate of growth of our natural gas supply, especially because of the decline of our main fields. As a result, we may lose market share, which may negatively impact our financial condition and results of operations.grows.
Additionally, we are currently party to a number of national gas supply contracts that have firm gas commitments. If we are unable to deliver natural gas to these clients as a result of cuts in operations, delays in the completion of projects relating to our production facilities or the acceleration of the decline in our gas production, among other reasons, we may be required to compensate our customers for our failure to supply natural gas. In 2016, we paid a penalty due to a cut in operations that occurred on October 12, 2016. This cut was caused by an operational failure in the ignition system of the Guajira B compression train, which caused an unavailability of gas supply, which in turn affected gas demand in a portion of the industrial and thermal sectors.
Delays in the start of new projects could result in penalties imposed on us by our clients. Although we did not pay penalties due to delays in the start of new projects in 2016,2018, we cannot assure you that in the future we will not be subject to additional monetary fines which can in turn affect our financial condition and results of operations.
We depend on others for the construction and availability of natural gas transportation infrastructure for the transport of our gas, which may limit our ability to develop new or existing fields or lead to the deterioration of related assets and may not allow us to recover the cost of capital invested in natural gas discoveries.
We are prohibited by law from holding more thanEcopetrol S.A. can only hold up to 25% of the equity of any natural gas transportation company.company according to Article 5 of CREG Resolution 057 of 1996. Therefore, there can be no assurance that the transportation infrastructure necessary to transport natural gas from the fields to distribution points and our customers will be built by third parties or that if built there will be sufficient capacity available to us for the exploitation of new natural gas discoveries or the development of existing fields. The failure to commercially exploit new or existing discoveries may result in impairment of the related assets and our inability to recover the capital expenditures invested to make these natural gas discoveries. As a result, we may be required to enter into agreements with natural gas transportation companies on terms that are not favorable to us.
For example, we have developed natural gas reserves in the Cusiana and Cupiagua fields, but transportation capacity to deliver gas from these fields is currently limited. Although there are projects under development that will eliminate this limitation, in 2018, we can offer no assurance that they will prove successful.
Our operations have and may continue tocould be affected by reactions of labor unions, social organizations, communities and contractors to Colombia’s political and social environment, environmental and climate change concerns and organizational changes and other management decisions.changes.
Due to the volatility of the marketsColombia’s political and the existing low oil pricesocial environment, we haveemerging environmental and will continue to undertake measures to enhance operating cost efficiency. Such measures involveclimate change concerns and organizational changes, in cost structure, downsizing our staff (including direct and indirect employees), and budget cuts, among others. Unions, contractors and social organizations in the communities where we have operations, communities in general, contractors and unions, may have in the pastreactions and may continue to oppose such measures causing work stoppages or decreasing productivity,present their demands through social movements, which could have an adverse effect on our operations and financial condition.
In addition, our currentOn July 1, 2018, a new collective bargaining agreement has been in effect since 2014 and hasbecame effective for a term of fivefour and half years, expiring June 30, 2018. There will be no changes to these terms until 2018; therefore, we do not expect any adverse reactions from our labor unions relating to this matter. However, weon December 31, 2022. We cannot assure you that we will not experience strikes or labor unrest in the future.
Our activities may be interrupted or affected by external factors, such as abnormal weather conditions and natural disasters.
We are exposed to several risks that may partially interrupt our activities. They include fires or explosions, natural disasters, criminal acts and acts of terror, malfunction of pipelines and emission of toxic substances.
Also, the effects of climate change could create impacts and losses in any part of our business operations, for instance, as the result of increase in the intensity of the “La Niña” and “El Niño” climate phenomena, causing floods and drought periods, increased temperature and rising sea levels.
The “El Niño” climate phenomenon is characterized by (i) a lack of rainfall, which limits the amount of water necessary for the development of various activities of the company, and (ii) increased temperatures, which could have a direct impact on our workers’worker’s health given an increased occurrence of heat waves and the increased occurrence of epidemics and diseases.diseases and (iii) potential negative impact on energy supply. The “La Niña” climate phenomenon is characterized by increased rainfall, which can generate (i) landslides that threaten pipeline infrastructure and limit road transportation and (ii) flooding, which could limit operations in our production fields and facilities.
| 105 |
As a result, our activities could be significantly affected or even paralyzed. These risks could result in property damage, loss of revenue, loss of life, pollution and harm to the environment, among others. If any of these occur, we may be exposed to economic sanctions, damages, fines or penalties in addition to the costs required to repair or remediate the related damage. These costs, fines and penalties may adversely affect our financial condition and results of operations.
Our operations, including our activities in areas classified as indigenous reserves and Afro-Colombian lands, are subject to opposition from members of various communities.
We currently carry out and plan to carrycontinue carrying out activities in areas classified by the Government as indigenous reserves (resguardos) and Afro-Colombian lands (territorios colectivos).lands. In order to undertake these activities, we must first comply with the previous consultation process, set forth by Colombian law. These consultation processes are part of the administrative procedures for obtaining environmental licenses to start our projects, works or activities in areas belonging to ethnic communities. In addition, consultations can be seen as a potential instrument to involve communities in the decision of developing extracting industry and infrastructure projects in their territories. Generally, these consultation processes last between six months to one year depending on the community expectations, but may be significantly delayed if we cannot reach an agreement with the communities. We strive to be respectful of the Constitution and laws and the autonomy of indigenous and Afro-descendant communities, and we therefore do not enter their territories until we have reached an agreement with them.
Our activities are subject to opposition, including protests by various communities, and even in areas in which the previous consultation process does not apply. Recently, through popular consultation, some communities have voted against the development of extractive industry projects. Any such similar situation may affect our future projects.
In recent years, indigenous communities have been claiming their ancestral territories and requesting recognition on previously closed consultation processes. We may be exposed to operational restrictions as a result of the opposition of these communities.
No certainty can be given that we will be able to reach an agreement with the different communities opposed to our operations or that such communities will participate in consultation processes if available. We may be exposed to similar delays due to opposition from local communities in other countries where we carry out our activities.
We have made significant investments in acquisitions and we may not realize the expected value.
We have acquired interests in several companies in Colombia and abroad. See the sectionBusiness Overview—Our Corporate Structure. Obtaining the expected benefits of the acquisitions will depend, in part, on our ability to (i) obtain the expected results of operations and financial condition from these acquisitions, (ii) manage disparatedifferent sets of assets and operations and integrate distinct corporate cultures, (iii) manage our objectives as a corporate group, and (iv) institute our corporate governance rules as well as other factors beyond our control such as (v) the economic and regulatory environment in countries in which we have made acquisitions as well as all other risks affecting the oil and (vi) crude oil prices.gas industry. These efforts may not succeed. Our failure to successfully obtain the expected results from our acquisitions could adversely affect our financial condition and results of operations.
We might be required to provide additional financial support to Bioenergy and Reficarour subsidiaries in spite of the recent completion of their projectsColombia or abroad.
Reficar raised US$3.5 billion through a limited-recourse project financing in which Ecopetrol S.A. provided both construction support and debt service guarantee and was also the sponsor of the financing. If Reficar experiences any situation that might affect the fulfillment of its financial obligations, Ecopetrol S.A. must provide financial support to Reficar, through capitalizations, subordinated loans or even the assumption of the debt. These situations might be related, but are not limited to, labor productivity, failure of the upgraded refinery to reach the expected performance level in terms of the quality of products and/or volumes produced. See the sectionBusiness Overview—Refining and Petrochemicals—Refining—Reficar.
Also, Bioenergy’s ethanol plant, that was financed with COP$123 billion through bilateral loans for its agricultural component and COP$382 billion through an infrastructure leasing for its industrial component, may also meet situations such as social unrest, strikes or other operational difficulties that could negatively impact its operation and financial results. Although currently Ecopetrol is not the sponsor and has not provided financing guarantees to Bioenergy,any of its subsidiaries, some additional financial support at any point in time might be needed to assure the stabilizationlong term viability of the project.such subsidiaries when exposed to unexpected conditions or results.
Any situation that could affect the operations of theseour subsidiaries, particularly for those that recently entered into operations, such as Bioenergy, may have a negative impact on their profitability as well as on their ability to pay their debt,liabilities, which in turn could adversely affect our financial condition and results of operations.
| 106 |
Ongoing Colombian StatecontrolState control entities investigations regarding our subsidiaries Reficar and Bioenergy could adversely affect us.
Ecopetrol is a corporation majority owned by the Colombian Government that administers public resources and Reficar and Bioenergy are subsidiaries of Ecopetrol. Ecopetrol’s employees have a statutory responsibility to ensure the proper use of public resources. Reficar and Bioenergy’s employees also have a duty for proper management of public resources. The conduct of Ecopetrol, Bioenergy and Reficar’s employees are generally subject to the control and supervision of the Colombian State control entities. See the sectionRisk Review—Legal Proceedings and Related Matters for additional information.
The investigations concerning Reficar and Bioenergy that are described in the sectionRisk Review—Legal Proceedings and Related Mattersremain ongoing. Because these actions are in their early stages, it is still not possible to estimate the duration, scope or results of these investigations or related inquiries and requests for information by Colombian State control entities. While we are cooperating fully with both cases, adverse developments in connection with these investigations, including any expansion of the scope of the investigations, could negatively impact us and could divert the efforts and attention of our management team from our ordinary business operations.
As described in the sectionRisk Review—Legal Proceedings and Related Matters, the Prosecutor’s Office is conducting a confidential investigation regarding Reficar’s expansion and modernization project. On April 27, 2017, the Prosecutor’s Office announced its intention to pursue charges against eight individuals, including five past officers of Reficar or Ecopetrol, for the alleged crimes of document forgery, illegal interest in the execution of agreements, misappropriation of public funds and unjust enrichment. The Prosecutor’s Office has not yet made public the factual basis for such charges, and accordingly we are not in a position to predict the outcome of the Prosecutor’s Office’s investigation or the disposition of any charges that the Prosecutor’s Office may bring.
In connection with this investigation or any other investigation carried out by any other authority, there can be no assurance that we will not be required to pay penalties, or incur in additional costs and expenses andor expose us or our employees to sanctions and lawsuits, any of which could adversely impact our reputation and, in turn, could have adverse effects on our financial condition and results of operations. See sectionSeeRisk Review- Review—Legal and Regulatory Risk - Risk—We may incur losses and spend time and money defending pending lawsuits and arbitrations and responding to administrative investigations.
Our results may be affected by the performance of our suppliers, our business partners or their third-party service providers, as manyproviders.
Some of our suppliers may face financial or operational problems that could led them to a breach of their obligations settled under contractual arrangements. Other suppliers may also be subject to regulatory changes or sanctions that could increase the risk of defaulting on their obligations to us, which could have an adverse effect on our operations and financial condition.
In addition, some of our operations are executed under joint venture agreements.
Many of our operationsand projects are performed through joint ventures or other contractual arrangements with our business partners.partners or third party service providers. Consequently, we depend on the performance of our business partners.partners or third party service providers. The poor performance of any of them, especially in those projects in which we do not act as operator, could negatively impact oilthe execution of projects and natural gas production,operating performance, which in turn could have a negative impact on our results of operations and financial condition. We are exposed to the risk of not finding business partners with the appropriate skills and performance we require for our projects. We are also indirectly exposed to supply agreements and other third-party services contracted by our business partners acting as operators under joint venture agreements.
Our insurance policies do not cover all liabilities and may not be available for all risks.
Our insurance policies do not cover all liabilities, and insurance may not be available for all risks. There can be no assurance that incidents will not occur in the future, that insurance will adequately cover the entire scope or extent of our losses or that we will not be found liable in connection with claims arising from these and other events, which could adversely affect our financial condition and results of operations.
A failure in our information technology systems or cyber security attacks may adversely affect our financial results.
We depend on the reliability and security of our information technology systems to conduct certain exploration, development and production activities, process financial records and operating data communicationand communicate with our employees and business partners, and for many other activities related to our business. Our information technology systems may fail or have other significant shortcomings due to operational system flaws or employee misuse, tampering or manipulation. In addition, we may become the target of cyber-attacks or information security breaches that could result in the unauthorized release, gathering, monitoring, misuse, loss or destruction of proprietary and other information. Any of these occurrences could disrupt our business, result in potential liability or reputational damage or otherwise have an adverse effect on our financial results.
During 2016,2018, our internal cyber security systems identified severaland contained cyber security attacks such as brute force login attacks designed to identify valid credential in IT infrastructuremalware, phishing and seventeen ransomware attacks-only onedenial of them with data loss (low level confidentiality) at Ecopetrol S.A.-Our platforms also identifiedservice. In total, we had 20 critical incidents during the year and controlled certain malware events and SQL injection attacks.
Althoughalthough we have not experienced any material losses relating to failure of our information technology systems or cyber incidents, there can be no assurance that we will not suffer such losses in the future.
| 107 |
We are exposed to behaviors incompatible with our ethics and compliance standards.
Given the large number of contracts that we are a party to in Colombia and abroad with local and foreign suppliers, the geographic distribution of our operations and the great variety of actors that we interact within the course of business, we are subject to the risk that our employees, contractors, or any person having relations with us may misappropriate our assets, manipulate our assets or information or engage in money laundering or the financing of terrorism, for such person’s personal or business advantage. Our systems for identifying and monitoring these risks may not be effective to fully mitigate them in all situations. Such acts may result in material financial losses or reputational harm to the Company.
The reliability and capacity of national power supply systems may affect or limit the continuity of our operations or limit growth.
Our average energy consumption in 20162018 was 6,9487,138 GWh/year, of which 65%66% was supplied through self-generation, and the remaining 35%34% through power grid. Our demand is 10.5% of the total energy demand in Colombia.
SeveralOur self-generation is subject to fuel availability. In addition, several producing fields are connected to the national transmission system and depend on its expansion and reliability to keep steady production levels and to accommodate future growth.levels. The national electricity market is volatile due to changes in hydrology and availability of fuels (natural gas, diesel etc.);, bringing uncertainty to prices. If energy were to become unavailable or difficult to obtain, our results of operation and the grid expansion projects which are executed by power distribution contractors have experienced delays due to licenses and limited execution capability. To mitigate these risk the Ecopetrol Group decided to centralize the management of power sources and uses in order to optimize the energy availability, quality and cost, for the short, medium and long term. While the intention is to enhance system reliability by timely execution of electrical projects and to launch energy efficiency programs in all of our segments, we cannot offer any assurance that we will prove successful.financial condition could be adversely affected.
Rising water production levels may affect or constrain our crude oil production.
During 2016, we2018, Ecopetrol produced approximately 9.3613.8 million barrels of water per day. Taking into account the nature of our reservoirs, the water production levels to be managed by the Company may increase in the future. In order to achieve our oil and gas production goals and to avoid any production restrictions going forward, we will need to secure the required capacity to manage water levels. Factors that may trigger a possible constraint in our crude oil production due to the rising water production levels are: (i) ineffective project management of the required facilities, (ii) the Company’s and its partners’ ability to timely obtain the environmental permits related to water management, (iii) social and community interactions that could affect the development and operation of these projects, and (iv) the availability of capital to execute the required projects.
5.1.2 Risks Related to Colombia’s Political and Regional Environment
This section discusses potential risks related to our extensive operations in Colombia.
The Colombian government could seize or expropriate Ecopetrol’s assets under certain circumstances.circumstances for fair compensation.
Pursuant to Articles 58 and 59 of the Colombian constitution, the Government can exercise its eminent domain powers in respect of Ecopetrol’sprivate property assets in the event such action is deemed by the Government to be required in order to protect public interests. According to Law 388 of 1997, eminent domain powers may be exercised through: (i) an ordinary expropriation proceeding, (expropiación ordinaria o judicial), or (ii) an administrative expropriation (expropiación administrativa).expropriation. In all cases we would be entitled to a fair compensation for the expropriated assets. Also, as a general rule, compensation must be paid before the asset is effectively expropriated. However, the compensation may be lower than the price for which the expropriated asset could be sold in a free-market sale or the value of the asset as part of an ongoing business. The aforementioned Article 59 of the Colombian constitution establishes an expropriation for war reasons, (expropiación en caso de guerra), which does notrequire that compensation be paid before expropriation but can only be executed on a temporary basis.
Colombia has experienced internal security issues that have had or could have a negative effect on the Colombian economy and on us.
Colombia has experienced internal security issues, primarily due to the activities of guerrillas, paramilitary groups, drug cartels and criminal bands known asBacrim. From time to time, guerrillas target crude oil and multi-purpose pipelines, including the Oleoducto Transandino, Caño Limón-Coveñas and Oleoducto Bicentenario pipelines, and other related infrastructure disrupting our activities and those of our business partners.
| 108 |
During 2016,2018, the attacks against our pipeline infrastructure decreasedincreased by 35%66% in relation to 2015 (802017 (63 attacks in 20152017 compared with 52105 attacks in 2016), however they were strategically targeted and more severe.2018). In 2019, there have been 20 attacks to date. This situation especially affected the infrastructure located in Nariño,the following departments: Norte de Santander, Arauca and Norte de SantanderNariño and the following pipelines: Caño Limón Coveñas and Transandino. During the first quarter of 2017, 29 attacks against the infrastructure of the Caño Limon – Coveñas system have taken place, impacting our operations in this pipeline and resulting in deferred crude oil production of 603 thousand barrels. On several occasions, guerillaGuerilla attacks have resulted in unscheduled shutdowns of our transportation systems in order to repair or replace sections of pipelines or production facilities that have been damaged andwith deferral of production in certain fields, as well as caused us to undertake environmental remediation. For example, these attacks led to a deferred productionof 11,102 barrels in 2018. This represented a decrease from 2017 (when similar attacks led to a deferred production of 1.6 million barrels) due to the transportation of the crude from the Caño Limón field through the Bicentenario pipeline infrastructure managed by Ecopetrol S.A., thefrom Banadia in Arauca to Araguaney in Casanare. However, we cannot offer any assurance that we will continue to ensure such transportation through alternate routes.
The direct cost of repair pipeline infrastructurerepairs due to terrorist attacks and illicit taps in 20162018 was approximately COP$41.7153 billion (US$13.947 million, with a 3,000.71 Colombian Peso/U.S. dollarCOP$3,249.75/1.00 US exchange rate as of December 31, 2016)2018). Also,Additionally, these attacks have resulted in certain of our production was impacted by approximately 3,215 bpd duecustomers requesting the early termination of their transport agreements. We are currently disputing such terminations. See Note 21.4 to events related to attacks on our infrastructure that limitedconsolidated financial statements for further information.
Likewise, the theft of refined products and crude oil, resulting from security issues, may impact our production. Guerrilla groupsoperating and other illegal armed groups also attacked natural gas transportation infrastructure that have affected our natural gas productionfinancial results in the past. future. Theft of refined products, decreased from approximately 34.9 boed in 2017 to approximately 21 boed in 2018. Theft of crude oil decreased from approximately 1,883 bod in 2017 to approximately 1,324 bod in 2018.
These activities and their possible escalation and the effects associated with them have had, and may have in the future, a negative impact on the Colombian economy or on us, which may affect our customers, employees, assets or the environment, with resulting containment, clean-up and repair expenses.
Likewise, theft of refined products and crude oil, resulting from security issues, may impact our results in the future. Theft of refined products, which reached a peak of approximately 7,270 bpd in 2002, was reduced to approximately 28.5 bpd in 2016. The theft of crude oil increased from approximately 646 bpd in 2015 to approximately 1,830 bpd in 2016.
Despite the peace agreement between the Colombian government and the FARC and the ongoing peace negotiation process attempts with the National Liberation Army (the ELN), some illegal and terrorist activities of guerrilla groups or their members may continuecontinue.
On November 30, 2016, the Colombian Congress approved a peace agreement between the Colombian government and the Revolutionary Armed Forces of Colombia, or FARC. Currently, the Colombian government is in the process of gradually integrating FARC members into civilian life.
On the other hand, the National Liberation Army, or ELN, an insurgency guerrilla group, has increased its actions against the Colombian security forces and the critical infrastructure of the Nation, in recent months, which we believe is an attempt to show its presence and influence in some regions and put pressure on the ongoingto resume peace negotiations which formally began in February 2016. In February 2017, the public dialogue phase began in Quito, Ecuador. These dialogues were interrupted as a result of the terrorist attacks carried out by the ELN since January 2018. In April 2018, the Colombian Government decided to resume the dialogue, due to the suspension of ELN terrorist actions during the electoral period in March 2018.
The new Colombian President Ivan Duque took office in August 2018 and set the following conditions for the continuation of dialogue with the ELN: the suspension of terrorist activities and the release of hostages.
DespiteHowever, following the progress made withterrorist attack by ELN against the FARC andNational Police Academy (Escuela de Policía General Santander) on January 17, 2019, the ongoing negotiationsColombian Government decided to suspend dialogue with the ELN indefinitely.
It is expected that some guerrillaguerilla groups, such as the ELN, may continue their illegal and terrorist activities, including attacks on our infrastructure, resulting in a deterioration of Colombia’s national security and our assets, which consequently may negatively impactingimpact our operating results.
There have been certain events in Colombia and abroad, which have resulted in political tensions between Colombia and some of its neighboring countries.
Diplomatic relationsThere have been certain events in Colombia and abroad, which have resulted in political tensions between Colombia and some of its neighboring countries,countries.
| 109 |
In particular, the economic, political and social crisis in particular Venezuela have been tense in the past. Although relations with Venezuela have stabilizedis having a severe impact on Colombia’s economy and improved with Colombia’s current administration, economic differences between Colombia and Venezuela, mainly due to Venezuela’s current public disorder and internal political tension,social situation. This situation could affect ourthe countries’ diplomatic relations, impact border towns and cities, accelerate Venezuelan migration flow into Colombia, affect our borderline operations and therefore may have a negative impact on Colombia’s economy and general security situation.situation as well as in our operating results.
Companies operating in Colombia, including us, are subject to the prevailing economic conditions and the investment climate in Colombia, which may be less stable than the prevailing economic conditions and investment climate in developed countries.
Market prices of securities issued by Colombian companies, including us, are subject to the prevailing economic conditions in Colombia. A large portion of our assets and operations are located in Colombia and most of our sales are currently derived from our crude oil and natural gas production and the production of our refineries located in Colombia. Accordingly, our financial condition and results of operations depend to a significant extent on macroeconomic and political conditions prevailing from time to time in Colombia and on the exchange rates between the Colombian Peso and the U.S. dollar.
If the perception of improved overall security in Colombia deteriorates or if the investment climate worsens, the Colombian economy may face lower growth rates than the ones posted recently, which could negatively affect our financial condition and results of operations. Furthermore, the market price of our shares and American Depositary Shares, or ADSs, may be adversely affected by changes in governmental policies, particularly those affecting economic growth, exchange rates, interest rates, inflation and taxes. The Government has changed monetary, fiscal, taxation, labor and other policies over time and has thus influenced the performance of the Colombian economy. We have no control over the extent and timing of government intervention and policies.
Colombian political and economic conditions have a direct impact on our business and may have a material adverse effect on us.
Colombia’s economic policies may have direct impact on our companyCompany as well as market conditions, the prices of securities and our ability to access national and international capital markets. Our financial condition and results of operations may be adversely affected by the following factors, among others, and the Government’s response to such factors: exchange rate movements; inflation; exchange control policies; price instability; interest rates; liquidity of domestic capital and lending markets; tax policy; regulatory policy for the oil and gas industry, including pricing policy; and other political, diplomatic, social and economic developments in or affecting Colombia.
Uncertainty over whether the Government will implement changes in policy or regulations that may affect any of the factors mentioned above or other factors in the future may lead to economic uncertainty in Colombia and increase the volatility of the Colombian securities market and securities issued abroad by Colombian companies.
The administration of President Iván Duque took office in August 2018. Any changes in the ruling government, oil and gas or investment regulations and policies or a shift in political attitudes in Colombia are beyond our control.
Developments and the perception of risk in other countries, especially emerging market countries, may adversely affect the market price of Colombian securities, including our ADSs.
Securities issued by Colombian companies may be affected by economic and market conditions in other countries, including other Latin American and emerging market countries. Although economic conditions in Latin American countries and in other emerging market countries may differ significantly from economic conditions in Colombia, investors’ reactions to developments in these other countries may have an adverse effect on the market value of securities of Colombian issuers and our ability to access capital markets.
Due to past financial crises in several emerging market countries (such as the Asian financial crisis of 1997, the Russian financial crisis of 1998 and the ArgentineArgentinean financial crisis of 2001), the world financial crisis of 2008 and the recent sovereign debt crises in certain European countries, investors may view investments in emerging markets with heightened caution. In the past, as a result of crises in other countries, flows of investments into Colombia have been reduced. Crises in other countries, especially in emerging market countries, may hamper investor enthusiasm for securities of Colombian issuers. If Latin America experiences a new slow-down or if the price for securities of Latin American issuers falls, the price for our ADSs could follow this trend and could be adversely affected, as could our ability to access domestic or international capital markets.
The Ministry of Mines and Energy has not calculated or liquidated the corresponding Net Positions for Ecopetrol as refiner and/or importer and for each fuel (gasoline and motor fuel oil) to be recognized by the FEPC to Ecopetrol for the second half of 2016
| 110 |
Under current Colombian regulations, the Ministry of Mines and Energy is required to periodically (initially by quarters, now twice a year) calculate and liquidate each refiner and/or importer of fuel’s Participation Differential (i.e. this arise when the international parity price is lower than the reference price established by the Ministry of Mines and Energy), leading to a “Net Position”. However due to changes in law and the Ministry methodologies we have still not received the calculations or liquidations for the second semester of 2016.
We do not know and we cannot anticipate the terms and conditions that will be established by the Ministry of Mines and Energy for future liquidations. For more information regarding the FEPC, see the sectionBusiness Overview—Applicable Laws and Regulations—Regulation of Refining and Petrochemical Activities—Regulation Concerning Production and Prices.
New or higher taxes resulting from changes in tax regulations or the interpretation thereof in Colombia could adversely affect our results of operations and financial condition.
New tax laws and regulations, and uncertainties in the interpretation with respect to existing and future tax policies pose risks to us. In recent years, the Colombian Congress and tax authorities have imposed and subsequently eliminated additional taxes such as theImpuesto sobre la Renta para la Equidad Income Tax for Equality (“CREE surtax”CREE”), and the wealth tax, and enacted modifications to taxes related to financial transactions, income, value added tax (“VAT”), and taxes on net worth. In addition, in December 2016, pursuant to Law 1819, the Colombian Congress enacted a new tax reform, which became effective in 2017. Furthermore, in December 2018, pursuant to Law 1943, the Colombian Congress enacted a tax reform (the Financing Law), which became effective as of January 1, 2019 modifies the Colombian income tax regime. For a description of taxes affecting our results of operations and financial condition in 2016,2018, see the sectionFinancial Review—Effect of Taxes, Exchange Rate Variation, Inflation and the Price of Oil on Our Results—Taxes. Changes in tax-related laws and regulations, and interpretations thereof, can affect tax burdens by increasing tax rates and fees, creating new taxes, limiting tax deductions, and eliminating tax-based incentives and non-taxed income. In addition, tax authorities and tax courts may interpret tax regulations differently than we do, which could result in tax litigation and associated costs and penalties.
Until recently,2016, for Colombian income tax purposes, dividends that were distributed from profits taxed at the corporate level were not taxed or subject to withholding tax at the shareholder level. However, beginning in 2017, dividends paid to non-resident shareholders are subject to a withholding tax. TheUntil 2018, the withholding tax rates applicable to dividends paid to non-resident shareholders are:were: (i) a 5% dividend tax on dividends distributed from profits taxed at the corporate level;level, with certain exceptions; and (ii) a 35% withholding tax rate on dividends distributed from profits not taxed at the corporate level; and (iii)level plus an additional 5% dividend tax rate after applying the initial 35% withholding tax rate. As of January 1, 2019, the withholding tax rates applicable to dividends paid to non-resident shareholders are: (i) a 7.5% dividend tax on dividends distributed from profits taxed at the corporate level (except that dividends paid to non-resident shareholders out of profits taxed at the corporate level prior to and including December 31, 2016, are not subject to this tax); and (ii) 33% withholding tax rate on dividends distributed from profits not taxed at the corporate level (32% for 2020, 31% for 2021 and 30% as of 2022), plus an additional 7.5% dividend tax after applying the initial 33% withholding tax rate. Tax treaty rules might also apply on dividend distributions when a shareholder is a resident in a country that has executed a tax treaty with Colombia.Colombia and reduce or eliminate the applicable taxes if the applicable requirements are met.
5.1.3 Legal and Regulatory Risks
This section discusses potential legal and regulatory risks to Ecopetrol, including the risk of having to comply with new laws and regulations.
Our operations are subject to extensive regulation.
The Colombian hydrocarbons industry is subject to extensive regulation and supervision by the Government and regulatory agencies in matters including the award of exploration and production blocks by the ANH, the imposition of specific drilling and exploration obligations, restrictions on production, price controls, capital expenditures, liquidation of the Net Position of each refiner or importer with respect to the FEPC and required divestments. Existing regulation applies to virtually all aspects of our operations in Colombia and abroad. The commercialization activities of some of our products also face extensive regulation. Such regulation is subject to change by the applicable regulator affecting our ability to commercialize our products. See the sectionBusiness Overview—Applicable Laws and Regulations.
The terms and conditions of the agreements with the ANH under which we explore and produce crude oil and natural gas generally reflect negotiations with the ANH and other governmental authorities and may vary by fields, basins and hydrocarbons discovered.
We are required, as are all oil companies undertaking exploratory and production activities in Colombia, to pay a percentage of our production to the Government as royalties. The Colombian Congress has modified the royalty program for crude oil and natural gas production several times in the last 20 years, as it has modified the regime regulating new contracts entered into with the Government. In the future, the Colombian Congress may once again amend royalty payment levels for new contracts and such changes could have an adverse effect on our future exploration and production in Colombia. See the sectionBusiness Overview—Applicable Laws and Regulations—Regulation of Exploration and Production Activities—Business Regulation—Royaltiesfor a description of the current royalty scheme.
| 111 |
Our operations in Colombia are subject to extensive national, state and local environmental regulations. Environmental rules and regulations are applicable to our exploration, production, refining, transportation, supply and marketing activities, as well as the biofuels we produce. These regulations establish, among other things, quality standards for hydrocarbon products, air emissions and greenhouse gases, water discharges and waste disposal, soil remediation, water pollution and the general storage, handling, transportation and treatment of hydrocarbons in Colombia. Currently, all exploratory drilling projects drilling in areas that do not yet have a license must undergo an environmental impact assessment and must receive an environmental license from the governmental agency responsible for awarding environmental licenses, the Environmental License National Agency or ANLA. Environmental authorities with jurisdiction over our activities routinely inspect our crude oil fields, refineries and other production sites, and they may decide to open investigations or sanction proceedings, which may result in the imposition of fines, restrictions on operations or other sanctions in connection with potential non-compliance with environmental laws.
We are also subject to control and monitoring by the regional autonomous corporations (CAR), which are regional environmental authorities that grant permits for the use and exploitation of natural resources, establish compensation measures for the use of these resources, and perform monitoring, control and impose sanctions function.as result of investigations.
If we fail to comply with any of these national or regional environmental regulations, or authorities, we could be subject to administrative and criminal penalties, including warnings, fines or closure orders of our facilities. Any such criminal penalty would be imposed on the legal representatives of the Company, including any legal representative, director or worker who participated or failed to take action related to the activities that lead to environmental damage. See the sectionBusiness Overview—Applicable Laws and Regulations—Regulation of Exploration and Production Activities—Business Regulation—Environmental Licensing and Prior Consultation.
Environmental regulation has become more stringent in Colombia in recent years. As a result, our operating costs have increased in order to comply with these new technical environmental requirements as well as the need to strengthen our specialized team in charge of environmental compliance in project and operations. If environmental laws continue to impose additional costs on us, we may need to reduce our investments on strategic projects in order to allocate funds to environmental compliance. We are also exposed to delays in obtaining environmental licenses from ANLA, which can lead to cost overruns or to changes in our investment plans. These additional costs may have a negative impact on the profitability of the projects we intend to undertake or may make them economically unattractive, in turn having a negative impact on our results of operations and financial condition.
WeSome of the companies in the business group perform exploratory activities outside of Colombian territory. As such, such companies are subject to foreign environmental regulations for the exploratory activities conducted by usthe business group outside of Colombia. Failure to comply with foreign environmental regulations may result in investigations by foreign regulators, which could lead to fines, warnings or temporary suspensions of our operations, which could have a negative impact on ourin the consolidated financial conditionstatements and results of operations.operations of the group.
In addition, the companies of the business group conducting upstream activities outside Colombia may be subject to foreign health, safety and environmental regulations. Foreign health and safety regulations may be more severe than those established under Colombian law and, therefore, we may be required to make additional investments to comply with those regulations.
Under certain of our credit agreements, we are under an obligation to comply with international environmental standards established by our lenders or by multilateral institutions. Failure to comply with such environmental standards could result in an event of default under the relevant credit agreements that we, or our subsidiaries, have entered into, which would affect our financial condition. For instance, the credit facility executed by Reficar for the financing of its expansion and modernization project includes an obligation to comply with the U.S.-Exim Environmental Procedures and Guidelines and the Organization for Economic Co-operation and Development (OECD) Common Approaches on Environment and Officially Supported Export Credits, and a credit agreement executed by Ecopetrol S.A. to finance purchases of U.S. goods and services requires Ecopetrol S.A. to comply with the U.S.-Exim Environmental Procedures and Guidelines.
In addition, we may be subject to foreign health and safety and environmental regulations for our upstream activities conducted outside Colombia. Foreign health and safety regulations may be more severe than those established under Colombian law and, therefore, we may be required to make additional investments to comply with those regulations.
| 112 |
We may incur losses and spend time and money defending pending lawsuits and arbitrations and responding to administrative investigations.
We are currently a party to several legal proceedings filed against us. We are also subject to labor-related lawsuits filed by current and former employees in connection with pension plans and retirement benefits. For example, asAs of December 31, 2016,2018, Ecopetrol S.A. was a party to 2,7744,681 legal proceedings relating to civil, administrative, environmental, tax, and labor claims, of which 3,279 were filed against us in the Colombian courts and arbitration tribunals and of which 341 met the accounting threshold for an accrual provision. Additionally, Ecopetrol S.A.’s subsidiaries were a party to 1,136 legal proceedings relating to civil, administrative, environmental, tax, and labor claims filed against them of which 86 met the accounting threshold for386 had an accrual provision. We allocate substantial amounts of money and time to defend against these claims, in which the claimants often seek substantial sums of money as well as other remedies. See Note 23– Accrued liabilities and provisions21 to our consolidated financial statements and see the sectionRisk Review—Legal Proceedings and Related Matters. In addition, in accordance with Colombian law, we and our employees are subject to surveillance and investigations by certain administrative control entities in Colombia, which are intended to determine whether public funds have been misused, mismanaged or misappropriated or whether they have been used in compliance with applicable law. Such investigations may divert the attention of management and subject the Company to reputational risk and increase difficulties in retaining talent. See the sectionRisk Review—Legal Proceedings and Related Matters.
5.1.4 Risks Related to Our ADSs
This section discusses potential risks associated with an investment in our American Depository Shares (as opposed to our common shares) by investors outside Colombia.
Holders of our ADSs may encounter difficulties in protecting their interests.
Holders of our ADSs do not have the same voting rights as holders of our common shares. As set forth in the amended and restated deposit agreement, dated September 16, 2008,December 29, 2017, among Ecopetrol S.A., JP Morgan Chase Bank, N.A., as depositary (the “Depositary”), and all holders from time to time of our American Depositary Receipts (the(as amended and restated, the “Deposit Agreement”), holders of our ADSs may instruct our current depositary, JP Morgan Chase Bank, N.A.,the Depositary, to vote on shareholder matters prior to a shareholders’ meeting. Colombia
Colombian law doesis not however, require Ecopetrolclear about the need to request proxies from existing shareholders. Thus, shareholdersholders of our ADSs may not become aware of some matters in time to instruct the depositaryDepositary to vote their shares.
The Deposit Agreement provides holders of our ADSs with the right to instruct the depositaryDepositary to vote common shares separately. The viabilityHowever, holders of this contractual provisionour ADRs should be aware that in Colombia, it is unclear. This is because regulatory agencies have advanced inconsistent positions regardinguncertain whether a depositorydepositary must vote all common shares of a Colombian corporation in an American Depositary Receipt, or ADR, program in the same manner as a single block or may vote them separately. GoingAccordingly, if either the custodian or the Depositary are not able to vote the common shares (including the right to receive common shares in the form of ADRs) deposited under the Deposit Agreement and any other securities, cash or property from time to time held by the Depositary in respect or in lieu of deposited common shares (the “Deposited Securities”) separately, all such Deposited Securities shall be voted based on the majority vote of the voting instructions timely received from holders of ADRs. In the case of such single block voting, all holders of ADRs, including holders of ADRs for which no voting instructions are timely received and holders of ADRs with voting instructions contrary to the voting instructions of a majority of the Deposited Securities timely received, should be aware that the Deposited Securities shall all be voted as a single block and that the voting instructions of such holders of ADRs will be deemed given in the manner stated above.
The Depositary will not itself exercise any voting discretion in respect of any Deposited Securities. The holders of our ADRs will be solely responsible for any exercise of the voting rights of the Deposited Securities represented by the ADRs if such vote is made pursuant to the procedures described in the Deposit Agreement. Holders of ADRs are strongly encouraged to forward their voting instructions as soon as possible as voting instructions will not be deemed received until such time as the ADR department responsible for proxies and voting has received such instructions, notwithstanding that such instructions may have been physically received by the Depositary, prior to such time.
| 113 |
In the future, the Colombian regulatory authorities may changeclarify their interpretation as to how the voting rights should be exercised by ADS holders of our ADSs, and such possible interpretation could adversely affect the value of the common shares and ADSs.
Our ADSs holders may be subject to restrictions on foreign investment in Colombia.
Colombia’s International Investment Statute (the set of rules and regulations which govern the foreign exchange market and the transactions thereto, which include Decree 1068 of 2015, Resolution 81 of 20002018 and External Circular No. DCIN 83 issued by the Colombian Central Bank among others) regulates the manner in which non-Colombian residents can invest in Colombia and participate in the Colombian securities market. Among other requirements, Colombian law requires foreign investors to register certain foreign exchange transactions with the Colombian Central Bank and outlines the necessary procedures to authorize certain types of foreign investments. Colombian law requires that certain foreign exchange transactions, including international investment in foreign currency between Colombian residents and non-Colombian residents, must be made through the foreign exchange market, either through authorized foreign exchange market intermediaries.intermediaries or compensation accounts, which are regular bank accounts held abroad by Colombian residents and registered with the Colombian Central Bank. Any income or expenses under our American Depositary Receipt, or ADR program must be made through the foreign exchange market.
Investors acquiring our ADRs are not required to register with the Colombian Central Bank directly, as they will benefit from the registration to be obtained by the custodian for our common shares underlying the ADRs in Colombia. If investors in ADRs choose to surrender their ADRs and withdraw common shares, they must register their investment with the Colombian Central Bank in the common shares as a portfolio investment through their local representative, which may be a brokerage firm, trust company or investment management companies supervised by the Superintendence of Finance (Superintendencia Financiera de Colombia).Finance. Investors will only be allowed to transfer dividends abroad after their foreign investment registration procedure with the Colombian Central Bank has been completed. Investors withdrawing common shares could incur expenses and/or suffer delays in the application process. The failure of a non-resident investor to report or register foreign exchange transactions with the Colombian Central Bank relating to investments in Colombia on a timely basis may prevent the investor from remitting dividends abroad, or result in the initiation of an investigation and in the imposition of fines. In the future, the Government, the Colombian Congress or the Colombian Central Bank may amend Colombia’s International Investment Statute or the foreign investment rules, which could result in more restrictive rules and could negatively affect trading of our ADSs.
Colombia currently has a free convertibility system. If a more restrictive convertibility system is implemented, the depositaryDepositary may experience difficulties when converting Colombian Peso amounts into U.S. dollars to remit dividend payments. Also, currently Colombia has a floating exchange rate system that might be subject to change in the future. See the sectionShareholder Information—Exchange Controls and Limitations.
Holders of our ADSs may not be able to effect service of process on us, our directors or executive officers within the United States, which may limit your recovery in any foreign judgment you obtain against us.
We are a mixed economy company organized under the laws of Colombia. In addition, most of the members of our Board of Directors (“Directors”) and executive officers reside outside the United States. All or a substantial portion of our assets and the assets of these persons are located outside of the United States. As a result, it may not be possible for you to effect service of process within the United States upon us or these persons or to enforce judgments against us or them in U.S. courts obtained in such courts predicated upon the civil liability provisions of the U.S. federal securities laws. Colombian courts determine whether to enforce a U.S. judgment predicated on the U.S. securities laws through a procedural system known asexequatur. For a description of these limitations, see the sectionShareholder Information—Enforcement of Civil Liabilities.
The protections afforded to minority shareholders in Colombia are different from those in the United States, and may be difficult to enforce.
Under Colombian law, the protections afforded to minority shareholders are different from those in the United States. In particular, the legal framework with respect to shareholder disputes is substantially different under Colombian law than U.S. law and there are different procedural requirements for commencing shareholder lawsuits, such as shareholder derivative suits. As a result, it may be more difficult for our minority shareholders to enforce their rights against us or our Directors or controlling shareholder than it would be for shareholders of a U.S. company.
| 114 |
ADRs do not have the same tax treatment as other equity investments in Colombia.
Although ADRs represent Ecopetrol’s common shares, for Colombian tax purposes, ADRs are securities different from their underlying assets. Therefore, ADR holders are not entitled to the tax treatment granted to holders of the common shares. Such tax treatment includes, among others, those benefits relating to dividends and to profits derived from sale of Colombian common shares. For further information, see the sectionShareholder Information—Taxation—Colombian Tax Considerations.
Judgments of Colombian courts with respect to our ADSs will be payable only in Colombian Pesos.
If proceedings are brought in the courts of Colombia seeking to enforce the rights of ADS holders of common shares, we will be required to discharge our obligation amounts in Colombian Pesos. Colombian law provides that an obligation in Colombia to pay amounts denominated in foreign currency may only be satisfied in Colombian currency at the Representative Market Exchange Rate of the date the judgment is obtained, and such amounts are then adjusted to reflect exchange rate variations through the effective payment date.
The relative volatility and illiquidity of the Colombian securities markets may substantially limit our investors’ ability to sell our ADSs at the price and time they desire.
Investing in securities that are traded in emerging markets, such as Colombia, often involves greater risk when compared with other world markets, and these investments are generally considered to be more speculative in nature.
The Colombian securities market is substantially smaller, less liquid, more concentrated and can be more volatile than other securities markets in the United States. As of December 31, 2016,2018, the Colombian Stock Exchange (Bolsa de Valores de ColombiaI,or “BVC”(“BVC”) had a market capitalization of approximately COP$311,384339,653 billion (US$103,770 million104.52 billion using the closing rate for 2016)2018), a 12% increase7% decrease when compared with the amount at the end of 2015,2017, a daily average trading volume of approximately COP$194,116147,031 million (US$64.6945.24 million, using the average exchange rate for 2016)2018), a 42%6% increase when compared with the volume in 2015.2017. By comparison, the New York Stock Exchange (the “NYSE”) had a market capitalization of US$19.625.7 trillion as of December 31, 2016,2018, and a daily trading volume of approximately US$68.971.8 billion in 2016.2018.
As of December 31, 2016,2018, our shares represented the highest market capitalization of the BVC accounting for as of 7.6%14.54% of the total COLCAP index, which reflects the price volatility of the 20 most-liquid stocks.
Given the current ownership structure of our shares, it may be difficult for you to purchase large quantities of shares from a single shareholder. We cannot assure you that a liquid trading market for our ADSs will develop or, if developed, that it will be maintained. Without a liquid trading market, the ability of investors in our ADSs to sell them at the desired price and time could be substantially limited.
We are not required to disclose as much information to investors as a U.S. issuer is required to disclose.
We are subject to the reporting requirements of the Superintendence of Finance and the BVC.BVC - (Colombian Stock Exchange). The corporate disclosure requirements that apply to us may not be equivalent to the disclosure requirements that apply to a U.S. issuer and, as a result, you may receive less interim information about us than you would receive from a U.S. issuer.
5.1.5 Risks Related to the Controlling Shareholder
Our controlling shareholder’s interests may be different from those of ourcertain minority shareholders.
Colombian Law 1118 of 2006 requires the Nation to maintain the majority of our outstanding capital stock. The Nation currently holds 88.49% of our outstanding capital stock, making it our controlling shareholder. The Nation as our controlling shareholder has majority voting rights at the shareholders’ meetingGeneral Shareholders Assembly to elect the members of our Board of Directors. The NationDirectors and may propose and approve decisions that aremay be in its own interest and in furtherance of its own economic and political interests that domay not necessarily benefit minority shareholders.
| 115 |
Our controlling shareholder may approve dividends at the ordinary general shareholders’ meeting,General Shareholders Assembly, notwithstanding the interest of certain minority shareholders, in an amount that results in us having to reduce our capital expenditures or increase our debt levels, thereby negatively affecting our prospects, results of operations and financial condition. See the sectionShareholder Information—Dividend Policy.
Additionally, given our controlling shareholder’s interests, itshareholder may undertake projects, approve decisions or make announcements about its intentions related to its holding of our capitalthe Company’s stock, which may not be in our best interest or in the best interest of our minority shareholders, including holders of our ADSs, and could impactaffect the price of our shares or ADSs.
5.2.1 Managing Risk through Our Internal Control System
Under the leadership of the Vice-Presidency of Compliance, Ecopetrol S.A. consolidated its internal control systems into ana unified system that integrates the best practices called for by the Committee of Sponsoring Organizations of the Treadway Commission (COSO 2013), Sarbanes–Oxley Act (SOX), governance and management of enterprise IT (COBIT), Enterprise Risk Management (ERM) and our ethics and compliance rules, with the aim of establishing an integrated management system for all control components;components, thereby allowing us to strengthen all of our control system.
The main purpose of the Ecopetrol S.A.’s Internal Control System is to provide reasonable assurance regarding the achievement of all of the Company’s objectiveobjectives relating to operations, strategy, reporting and compliance, through the appropriate risks management and ensuring the effectiveness of its controls. The system performance is systematically monitored by the Board of Directors semiannually.Directors.
Ecopetrol S.A.’s Internal Control System is aligned to the Company’s strategy and business processes and gives responsibility to all employees to manage risk, to maintain the effectiveness of controls, to report incidents andin order to preventively correct possible deficiencies and to ensure continuous improvementprovide reasonable assurance of processes.achieving corporate objectives and goals.
The risk management component of our Internal Control System is in charge of identifying events or situations that may affect our defined objectives, assessing and prioritizing them to implement the most appropriate response. This component has been designed and implemented across the organization, with a two-level focus: Enterprise Risk and Processes Risks.
| (i) | Enterprise Risks: Are those risks that are directly associated with the business strategy plan of the Company and are systematically monitored by the Management |
| (ii) | Processes Risks: Are those risks that tend to identify potential failures in the activities related to our core and support business processes that drive us to achieve our |
Our risk management approach is based aroundon the risk management cycle, consisting in five main stages: planning, identifying, evaluating, treatment and monitoring risks, as well as communication across all stages. This cycle is supported in three pillars of risk management: culture, organizational structure and normative and management tools.
Three of our most important tools within the risk management component are:
| (i) | Risk Assessment Methodology: In order to properly prioritize mitigation, treatment and monitoring efforts of risk management at the process level, a standardized methodology was established to assess inherent and residual risk levels. The risk level (Very High, High, Medium, Low or None) is obtained from the combination of the consequences (impacts) and the probability of occurrence of those consequences. According with the level of risk, action plans for management and mitigation are defined. |
| 116 |
| (ii) | Mitigation Plans: Each year, |
| (iii) | Monitoring Indicators: As part of the monitoring stage of the risk management cycle, Ecopetrol has implemented Key Risk Indicators (KRIs) which are metrics used to provide early signals of increasing risk exposures. These signals constitute information for |
Ecopetrol has also defined guidelines and minimum requirements to implementimplemented an Internal Control System, framework for its subsidiaries. These guidelines provide different classifications according to three important variables: the size of the organizational structure, the scope of SOX and the asset value of each subsidiary. The classification of each subsidiary determines the scope of implementation (Basic, Intermediate and Complete) of our Internal Control System.which includes its subsidiaries. Under those guidelines, each subsidiary must implement and report the performance of its performance to its enterprise management committee, audit committee, or board of directors (or whoever is acting on their behalf). In addition, they have to report it annuallyInternal Control System to Ecopetrol S.A. Toto ensure compliance with the above measures, and the subsidiaries have methodological support from Ecopetrol S.A. when it is requested. Ecopetrol S.A. also performs preventive monitoring in selected subsidiaries to assure all the components and principles of their Internal Control Systems are present and operating.
5.2.2 Managing Information Security and Cybersecurity
Ecopetrol S.A. has a dedicated management team focused on information security issues such as risk analysis, treatment of information, safe information management practices and classification of critical business information, control systems compliance and effectiveness of available information security technologies, all of which are articulated with the ERM system at the enterprise level.
Ecopetrol S.A. has included cybersecurity risk as one of the key enterprise risks. Based on that, a working group formed in 2014, coordinated by the information securitycybersecurity area with the participation of industrial control systems specialists, has been understanding the new challenges of cybersecurity risk;risk, developing activities to identify and protect critical digital assets and its security threats. assets.
During 2016,2018, Ecopetrol S.A., as a NOC (National Oil Company), reportedprovided updates to the Cyber Defense Command Unit (Comando Conjunto Cibernético, an(an entity under the control of the Colombian Ministry of Defense) the first basic inventory of its critical cybernetic infrastructure to bethat was included in the classified catalogue of national critical cybernetic infrastructure.
Although Ecopetrol S.A. is still at an early stage of managing itsEcopetrol’s cybersecurity risks, the working group has developed some activities in orderteam established a plan to advance incontinue the incorporation of cybersecurity practices to enhance the awareness about these risks at an operational level and adjust current information security practices considering the new cyberthreatcyber-threat context. Likewise, as a result of this process, we are currently incorporatingcontinuing the incorporation of elements relative to management of the cyber security threat, including among others, policies, cybersecurity insurance coverage, and specialized monitoring and control mechanisms.mechanisms, vulnerability management and cybersecurity insurance coverage, among others.
Currently, Ecopetrol S.A. has incorporated a Security Operations Center service, which enhances ourin order to enhance the ability to foresee and identify trends in attacks in Ecopetrol S.A.’s information technology infrastructure and to monitor Ecopetrol’s reputation on the internet.
While there were cyber-attacks during 2018, there were no material effects on processes, equipment, products, services, relationships with customers or suppliers, competitive conditions or critical information. Ecopetrol S.A. does not have any current proceedings that relate to cybersecurity issues.
Furthermore, during 2018, the internal audit department conducted an audit on cybersecurity processes with an emphasis on the exploration area and follow up on our prior enhancement plans. As a result of such audit, an action plan was established to be implemented in 2019. The primary goal of the plan is to reinforce our cybersecurity strategy and refine certain technical components of our cybersecurity program.
In connection therewith, Ecopetrol updated its cybersecurity risk profile and its cybersecurity strategy, by naming the management team of the Cybersecurity unit to oversee information technology, operational technology and activities at the Ecopetrol Group level. In addition, the Cybersecurity unit was placed within the Digital Vice Presidency, reporting directly to senior management.
Ecopetrol adopted the ONG-C2M2 (Oil & Gas - Cybersecurity Capability Maturity Model) as a framework to manage its cybersecurity profile. Finally, Ecopetrol updated its cybersecurity policies and cyber-incidents response procedure.
We are exposed to certain risks associated with the nature of our operations and the financial instruments we use. Among the risks that affect our financial assets, liabilities and expected future cash flows are changes in commodity prices, currency exchange rates, interest rates and the credit quality of our counterparties.
Commodity price risk is associated with our day-to-day operations as we export and import crude oil, natural gas and refined products. We occasionally use hedges to partially protect our financial results from price fluctuations taking into account that part of our financial exposure under purchase contracts for crude oil and refined products depends on international oil prices. We believe that the risk of such exposure is partially naturally hedged since we are an integrated group (with operations in the upstream, midstream and downstream segments) and either export crude oil at international market prices or sell refined products at prices that are correlated to international market prices. We do not use derivative financial instruments for speculative or profit-generating purposes.
Currency risk arises in our operations given the fact that most of our revenues are derived from sales of products quoted in or with reference to U.S. dollars. Therefore when the Colombian Peso depreciates against the U.S. dollar, our revenues converted into Colombian Pesos increase. Conversely, when the Colombian Peso appreciates against the U.S. dollar, our revenues decrease. On the other hand, imported goods, oil services and the debt, which is mainly denominated in U.S. dollars, become less expensive when the Colombian Peso appreciates against the U.S. dollar and more expensive when the Colombian Peso depreciates against the U.S. dollar.
As of December 31, 20162018 our U.S. dollar-denominated total debt was US$15.210.5 billion, which we recognize in our consolidated financial statements at its amortized cost, which corresponds to the present value of cash flows, discounted at the effective interest rate. Out of this total, US$129.7 billion relate to Ecopetrol S.A., whose functional currency is the Colombian Peso. Therefore, when the Colombian Peso depreciates against the U.S. dollar, Ecopetrol S.A. is exposed to an exchange rate loss. In contrast, when the Colombian Peso appreciates against the U.S. dollar, Ecopetrol S.A. is exposed to an exchange rate gain. Some of the Ecopetrol Group’s subsidiaries have the U.S. dollar as functional currency and are not exposed to a material exchange rate risk resulting from fluctuations in the Colombian Peso against the U.S. dollar. On the asset side, when the financial statements of the Group are consolidated, the exchange rate differential of the subsidiaries’ assets and liabilities whose functional currency is the U.S. dollar is recognized directly in equity, as part of other comprehensive income.
Taking previous considerations into account, Ecopetrol seeks to identify and manage currency risk in a comprehensive manner, using an integrated analysis of natural hedges in order to benefit from the correlation between income or investments in a foreign operationsoperation and debt denominated in foreign currency. In addition, the risk management strategy of the Company may involve the use of financial derivative instruments, and non-derivative financial instruments. On October 1, 2015, Ecopetrol S.A. adopted hedge accounting asAs a part of its risk management strategy, using the natural hedge between exports and dollar-denominated debt.debt, on October 1, 2015, US$5.4 billion of Ecopetrol S.A.’s debt in U.S. dollars was designated as hedge instrument of its future export sales for the period 2015 – 2023. On June 8, 2016, Ecopetrol S.A. continued its hedge accounting strategy, using the natural hedge between some of its foreign investments and its dollar-denominated debt in an amount of US$5.2 billion. As of December 31, 2018, the outstanding value of the natural accounting hedges was US$6.5 billion. The remaining portion 12% of Ecopetrol S.A.’sour dollar-denominated debt, as well as the financial assets and liabilities denominated in foreign currency continue to be exposed to the fluctuation of the exchange rate, which means that an appreciation of the Colombian peso against the U.SU.S. dollar could generate a loss if companies whose functional currency is the Colombian peso have an active net position in U.S. dollars or a gain if they have a net liability position in U.S. dollars. Conversely, a depreciation of the Colombian peso against the U.S. dollar could generate a gain if companies whose functional currency is the Colombian peso have a net active position in U.S. dollars or a loss if they have a net liability position in U.S. dollars. Finally, the Company maintains enough cash in Colombian pesos and U.S. dollars to meet its expenses in each currency (see Note 4.1.5 to our financial statements for further explanation of theour accounting policy and Note 31.228.1 for details of the hedge accounting adopted). With the adoption of hedge accounting, the effect of volatility of foreign exchange rate on the effective hedged portion of the debt is recognized directly in equity, as part of other comprehensive income. Our hedge management strategy is completely focused on our accounting, reason why the ultimate effect will only be determined when the hedge operations come to an end. Nevertheless, it is important to bear in mind that for Ecopetrol S.A’sS.A.’s cash flow, the effect of the Colombian peso appreciation against the U.SU.S. dollar is positive given the fact that we habitually convert our income in foreign currency to Colombian pesos.
Interest rate risk arises from our exposure to changes in interest rates mainly as a result of the issuances of floating rate debt linked to LIBOR, DTF and CPI (with a participation of 18.9%4.6%, 8.2%5.0% and 3.5%4.2%, respectively, of the nominal debt balance as of December 31, 2016)2018). Thus, volatility in interest rates may affect the fair value of and cash flows related to our investments and floating rate debt. In 2016,2018, our analysis of credit risk events and global financial markets drove us to decide not to hedge interest rate risk. Nevertheless, our treasurycapital markets office continuously monitors the performance of interest rates and the effect of interest rates on our financial statements.
The trust funds linked to Ecopetrol S.A.’s pension obligations (PAP) are also exposed to changes in interest rates, as they include fixed- and floating-rate instruments that are mark to market. This exposure is continuously monitored by our treasury office given the potential impact volatility may have on our financial results. The treasury office’s information is gathered from reports provided by the asset managers. These reports refer to regulatory limits as well as market, credit and liquidity risks. The investment guidelines with respect to the PAPs are issued by the Colombian regulation for pension funds, as stipulated in the Decree 9411833 of 20022016 and Decree 18611913 of 2012,2018, where it is indicated that they have to follow the same regime as the regular obligatory pension funds in their moderate (i.e.(i.e., neither conservative nor aggressive) portfolio. For further information regarding the trust funds linked to the pension obligations of the company, see Note 22.220.2 Plan assets to our consolidated financial statements.
Finally, counterparty risk is the potential probability that a borrower or counterparty defaults on any obligation. In our case, we are exposed to this risk as we invest in different financial instruments and receive letters of credit in order to mitigate our exposure with our commercial counterparties. We manage this risk through an analysis of an issuer’sby monitoring and analyzing the counterparty’s creditworthiness, stock price behavior, spreads on credit default swaps, and the probability of default.default, among others.
Investment Guidelines
Ecopetrol S.A.
Following the promulgation of Decree 1525 of 2008, which provides general rules on investments for public entities, Ecopetrol S.A.’s management established guidelines for our investment portfolios. These guidelines determine that investments in Ecopetrol S.A.’s U.S. dollar portfolio are generally limited to investments of our excess cash in fixed-income securities issued by entities rated A or higher in the long term and A1/P1/F1 or higher in the short term (international scale) by Standard & Poor’s Ratings Services, Moody’s Investors Service or Fitch Ratings. In addition, Ecopetrol S.A. may also invest in securities issued or guaranteed by the U.S. government or Colombian government, without regard to the ratings assigned to such securities. In Ecopetrol S.A.’s Colombian Peso portfolio, it must invest our excess cash in fixed-income securities of issuers rated AAA in the long term, and F1+/BRC1+ in the short term (local scale) by Fitch Ratings Colombia or BRC Standard & Poor’s. In addition, Ecopetrol S.A. may also invest in securities issued or guaranteed by the Colombian government without rating restrictions.
In orderOn December 2018, Ecopetrol S.A.’s management approved an update to diversify riskthe investment guidelines applicable for both U.S. Dollars and Colombian Pesos, that has been effective since January 1, 2019. The guidelines were updated in our Colombian Peso portfolio, Ecopetrol S.A. does not invest more than 10%light of the excess of cash in one specific issuer. Infollowing: the case of our U.S. dollar portfolio, it does not invest more than 5%current reality of the excessfinancial markets, alignment with the practices of cash in one specific issuercomparable companies in the short term (upoil sector, the Ecopetrol Group’s current corporate structure and the need to one year), or 1% inhave a larger investment universe with the long term.objective of generating higher returns on resources with an acceptable level of risk. The primary changes are:
| · | Both the Ecopetrol S.A. U.S. Dollar portfolio and the Colombian Peso portfolio may be invested in fixed income securities issued by entities with a rating equal to or greater than Ecopetrol S.A’s credit risk rating, but which at all times must be a minimum of investment grade as rated by any of the internationally recognized rating agencies (Standard & Poor's Moody's, and Fitch Ratings). |
Ecopetrol S.A.’s investment portfolio in U.S. dollars is segmented into four tranches, each one matching our liquidity needs. The working capital tranche is calculated taking into account our cash flow needs for the next 60 days. The liquidity tranche is calculated as the contingent cash flow needs over the working capital, taking into account the development of capital expenditures related to projects. The asset liability tranche is built to match our long-term debt. The investment tranche includes the remaining amount of the total portfolio after deducting the amounts pertaining to the above mentioned tranches and after subtracting the Colombian Peso portfolio.
Ecopetrol S.A.’s investment portfolio in Colombian Pesos is segmented in two tranches, each one matching our liquidity needs. The first tranche is calculated taking into account our cash flow needs for the next 30 days, and the second tranche is built for investment purposes.
| · | In order to diversify risk in both our U.S. Dollar and Colombian Peso portfolios, Ecopetrol S.A.’s management will determine short and long term limits by issuer and issuance based on internal analyzes and external risk ratings. |
5.3 Legal Proceedings and Related Matters
We are a party to various legal proceedings in the ordinary course of business. Other than the proceedings disclosed in this annual report, we are not involved in any pending (or, to our knowledge, threatened) litigation or arbitration proceeding that we believe will have a material adverse effect on our Company. Other legal proceedings that are pending against or involve us and our subsidiaries are incidental to the conduct of our and their business. We believe that the ultimate disposition of such other proceedings individually or in an aggregate basis will not have a material adverse effect on our consolidated financial condition or results of operations.
As of December 31, 2016,2018, Ecopetrol S.A. was a party to 27744,681 legal proceedings relating to civil, administrative, environmental, tax and labor claims, of which 3,279 were filed against us in the Colombian courts and arbitration tribunals, of which 341386 had an accrual provision. We allocate sufficient amounts of money and time to defend these claims. Historically, we have been successful in defending lawsuits filed against us. Other than the environmental administrative proceedings described in the last paragraph of this section, based on the advice of our legal advisors, it is reasonable to assume that the litigation procedures brought against us will not materially affect our financial position or solvency regardless of the outcome. See Note 23 – Accrued liabilities and provisions21 to our consolidated financial statements included in this annual report for a discussion of our legal proceedings.
Caño Limón – Coveñas Crude Oil Pipeline Spill
On December 11, 2011, the Caño Limón-Coveñas oil pipeline ruptured and caused the spill of approximately 3,267 barrels of crude oil into the Iscala creek, which connects with the Pamplonita River that provides water to the city of Cúcuta. The incident did not cause any fatalities or injuries.
A class action lawsuit has been filed against Ecopetrol S.A. and against employees of the company, and the First Administrative Court of Cucuta has jurisdiction to conduct the case, which is in the probatory stage.
The Regional Environmental authority of Norte de Santander, or CoporacióCorporación Autónoma Regional de la Frontera Nororiental (CORPONOR) has filed a lawsuit against Ecopetrol at the First Administrative Court of CucutaNorte de Santander claiming for (i) the environmental loss caused by the incident and (ii) for compensation costs relating to the environment damage for approximately COP$33 billion. Ecopetrol’s legal counsel filed to dismiss the lawsuit on June 2, 2014, based on three grounds: (i) there is no proof of environmental loss, (ii) CORPONOR does not have the authority to file this lawsuit and (iii) CORPONOR’s petition for direct compensation is not the proper legal action according to the applicable procedural rules. Currently this lawsuit is in probatorythe evidentiary stage.
Ecopetrol and national and local authorities are developingconvened to develop a project for the developmentconsisting of an alternative to the water supply in the intake of the aqueduct in Cúcuta, which was approved by theThe Company’s Board of Directors in December 2011 approved the participation of Ecopetrol in the project as part of the strengthening of its contingency plans and its relationship with its stakeholders. Currently local authorities are attemptingOn November 10, 2017, the relevant parties entered into an agreement with the purpose of building the alternative water supply at a cost of approximately COP$385 billion. According to acquire the necessary economic resources foragreement Ecopetrol will be in charge of the construction of the above mentioned infrastructure. As of the date of this annual report, Ecopetrol has awarded one construction contract. For the initial segment of the project and Ecopetrola second construction contract for a subsequent segment is soon to be awarded. The corresponding auditing contract has finalized the basic and detailed engineering.also been awarded.
BT Energy Challenger
On October 22, 2014, we were served with a class action suit against us seeking monetary damages of approximately COP$7.4 trillion related to an incident that occurred on August 21, 2014, during the loading operations of the BT Energy Challenger vessel. The claimants alleged possible damage to the port area of Ecopetrol’s terminal in Coveñas, as well as of marine and submarine areas and beaches that form the geographical area of the Morrosquillo Gulf. This allegation is currently under investigation by the Harbor Master of Coveñas. Ecopetrol filed a motion requesting the judge to require the claimants to amend their claim to more precisely set forth the facts and evidence it believes establishes Ecopetrol’s liability.
| 120 |
On March 3, 2015, Ecopetrol filed its statement of defense arguing the exclusive fault of a third party. On October 20, 2015, the Court denied a class action of more than 100 informal traders in the region because there is no common identity with the initial class (hotel employees). However, during 2016 the Sucre Administrative Tribunal accepted another 12081,208 informal traders and fishermen as claimants.
On March 10, 2017, a mandatory conciliatory hearing was held in order to seek an agreement but it failed.
In January 2018, a judicial order was declared unsuccessful.issued to commence the evidence gathering process, a decision which was objected by the parties.
In September 2018, all the ordered statements were made, the evidentiary stage was finalized and the parties filed their final closing briefs. As of the date of this annual report the case remained pending.
PetroTiger
As highlighted in previous 20-F and 6-K filings, on January 6, 2014, the United States Department of Justice (DOJ) announced the unsealing of charges against two former co-chief executive officers (CEOs) and the former general counsel of PetroTiger Ltd. (PetroTiger), alleging, among other things, violations of the U.S. Foreign Corrupt Practices Act (FCPA) and conspiracy to commit violations of the FCPA and money laundering in connection with payments made to an Ecopetrol employee. By the time of the DOJ announcement, that employee no longer worked at the Company. The DOJ alleged the payments were made to secure Ecopetrol’s approval for PetroTiger’s entry into an oil services contract with Mansarovar Energy Colombia Ltd. Ecopetrol participated in the Mansarovar project as non-operating partner in a joint operating agreement. Also on January 6, 2014, the DOJ announced that the general counsel of PetroTiger had pled guilty on November 8, 2013, to one count of conspiracy to violate the FCPA and to commit wire fraud. One of the charged former co-CEOs pleaded guilty on February 18, 2014, to the same charge. On May 9, 2014, the DOJ charged the other former co-CEO with conspiracy to violate the anti-bribery provisions of the FCPA, conspiracy to commit wire fraud, conspiracy to launder money, and substantive FCPA anti-bribery and money laundering violations. On June 15, 2015, that co-CEO pleaded guilty to conspiracy to violate the FCPA.
After the DOJ unsealed its charges on January 6, 2014, Ecopetrol filed a complaint the same month, jointly with the Transparency Secretariat of the Presidency of the Republic, to Colombia’s Attorney General’s office requesting the investigation of individuals who may have been involved in the wrongdoing related to the Mansarovar contract. Colombian authorities initiated a proceeding related to PetroTiger, and on March 11, 2015, arrested four current Ecopetrol employees and two former Ecopetrol employees related to their investigation of the Mansarovar project and five other contracts involving PetroTiger and Ecopetrol. To date, four investigations of the control entities investigations are ongoing. Throughout 2016, Colombiacontinue in course. During 2017 and 2018 to date, Colombian authorities issued several judgmentshave resolved an appeal confirming the conviction of a former Ecopetrol employee and another person involved in connectionthe case but not linked with former PetroTiger directors, a retired employee ofEcopetrol. Likewise, another appeal submitted by Ecopetrol and other persons involved.the Prosecutor’s Office is in progress in a case in which a former Ecopetrol employee was acquitted.
Ecopetrol has responded to information requests from the DOJ and Colombian authorities in connection with their investigations of PetroTiger. Ecopetrol has been designated with the formal status of victim in the local Colombian proceedings. It has terminated the employment of the four charged individuals who were Ecopetrol employees at the time of the arrests. Ecopetrol has concluded an internal investigation and has not identified any new issues relating to PetroTiger.
Salgar-Cartago Multipurpose Pipeline Spill
On December 23, 2011 our Salgar-Cartago pipeline ruptured. Internal and external experts believe this incident occurred as a result of creep movement of soil caused by severe weather conditions, causing the soil surrounding the pipeline to exert strong pressure on the pipeline and rupture it. As of the date of this annual report, 13there are eight lawsuits related to this incident are active for anwith possible damages of approximately worth of COP$16.27.7 billion.
Class action of the AWA Indigenous Community
On April 2, 2018, a class action lawsuit was filed against Ecopetrol and CENIT by the Inda Guacaray and Inda Sabaleta reservations of the AWA Indigenous community who claim damages to their communities by environmental contamination and damage to natural resources that the defendants supposedly caused by act or omission during various environmental incidents. In August 2018 Ecopetrol answered the complaint. The parties are currently waiting for the evidentiary stage to start.
Although the plaintiffs did not clearly determine the amount of their claims, Ecopetrol and the National Agency for Legal Defense (Agencia Nacional de Defensa Jurídica del Estado or ANDJE) have initially calculated the amount to be up to COP$358,201,371,800.
Environmental Administrative Proceedings
As of December 2016,2018, Ecopetrol S.A. was party to 209218 environmental administrative proceedings, of which 193206 were initiated before 2015,2018, and 1612 during 2016.2018. During 2016,2018, six proceedings were concluded, in fourtwo of them we were subject to monetary fines through Resolutions Corporinoquía Resolution 200.41-16-0551 of May 3, 2016, Corporinoquía Resolution 200.41-16-0873200.36.18.0999 of July 18, 2016, Cam Resolution 213416, 2018 and 200.36.18-1028 of July 25, 2016 and Corpoamazonía Resolution 1162 of September 9, 2016.17, 2018. However, these four proceedings wereanother proceeding was suspended due to the replenishment of resources. It is not possible for us to determine whether the pending proceedings could have a material effect on Ecopetrol.
Reficar Investigations
EcopetrolReficar is a corporationwholly owned subsidiary of Ecopetrol. According to Colombian regulations, Ecopetrol’s and Reficar’s employees are considered public servants, and as such can be held liable for negligent use or management of public resources. In this context, given that Ecopetrol is majority owned by the Colombian Government that administers public resources and Reficar is a wholly owned subsidiary of Ecopetrol. Ecopetrol’s employees have a statutory responsibility to ensure the proper use of public resources. Reficar’s employees also have a duty for proper management ofEcopetrol, Ecopetrol and Reficar administer public resources.
The conduct of Ecopetrol’sAs a result, Ecopetrol and Reficar’sReficar employees are generally subject to the control and supervision of the following control entities, among others:
| · | The Office of the Comptroller General (Contraloría General de la República) |
| · | The Attorney General’s Office (Procuraduría General de la Nación) |
| · | The Prosecutor’s Office (Fiscalía General de la Nación) |
The following are the most significant investigations and proceedings carried out by the aforementioned state entities:
| 1. | The Office of the Comptroller General’s investigations and proceedings |
As a result
| 1.1 | Because of the modifications of the schedule and budget related to Reficar’s expansion and modernization project (the “Project”), the Office of the Comptroller General initiated a special audit investigation of the Project in 2016 and delivered a final report to Reficar on December 5, 2016. The report made 36 findings most of which were related to increased costs compared to budget for services, labor and materials. As required, on January 18, 2017, Reficar submitted an action plan exposing and addressing the 36 findings in the following areas: (i) contract management, (ii) supervision of engineering standards contracted with third parties, and (iii) documentation of the control, reporting and monitoring mechanisms of subcontracts. |
| 122 |
| 1.2 | As a result of the findings described above, on March 10, 2017, the Office of the Comptroller General opened actions for financial responsibility (proceso de responsabilidad fiscal) against 36 individuals and the six companies involved in the Project, including former members of Ecopetrol’s Board of Directors, former members of Reficar’s Board of Directors, former employees of Ecopetrol, and former employees of Reficar, as well as Chicago Bridge & Iron Company N.V., CBI - Chicago Bridge & Iron company (CB&I) Americas Ltd., Chicago Bridge & Iron Company CB&I UK Limited, CBI Colombiana S.A., Foster Wheeler USA Corporation and Process Consultants Inc. |
These actions were initiated based on the Office of the General Comptroller initiated a special audit investigationGeneral’s theory that lower than expected profitability at Reficar could have been caused by (i) modifications to the schedule and, (ii) the increase of the Project in 2016 and delivered a final report to Reficar on December 5, 2016. The report made 36 findings most of which were related to increased costs compared to budget for services, labor and materials. As required, on January 18, 2017, Reficar submitted an action plan exposing and addressing the 36 findings in the following areas: (i) contract management, (ii) supervision of engineering standards contracted with third parties, and (iii) documentation of the control, reporting and monitoring mechanisms of subcontracts.Project.
As a result of the findings described aboveOn June 5, 2018, the Office of the Comptroller General split the initial proceeding in two. The first one is related to the increase of the Project’s budget and the second one is related to the modifications in the Project’s schedule.
Regarding the first proceeding, on June 5, 2018, the Office of the Comptroller recently opened actionsGeneral issued charges for financial responsibility (proceso de responsabilidad fiscal)fiscal) against 36(i) 15 individuals, and the six companies involved in the Project, including current and former members of Ecopetrol’s Board of Directors;which include former members of Reficar’s Board of Directors;Directors, a current and former employeesemployee of Ecopetrol;Ecopetrol, and former employees of Reficar, as well as against (ii) Chicago Bridge & Iron Company N.V., CBI - Chicago Bridge & Iron company (CB&I) Americas Ltd., Chicago Bridge & Iron Company CB&I UK Limited, CBI Colombiana S.A., Foster Wheeler USA Corporation and Process Consultants Inc. The current members of Ecopetrol’s boardInc, and senior management subject to these proceedings are Juan Carlos Echeverry Garzón, Chief Executive Officer; and Joaquín Moreno Uribe, Horacio Ferreira and Mauricio Cárdenas Santamaríthe following insurance companies, Compañía all of them members of the Board of Directors. These actions pertain to an eventual reduction of the value of state assets due to Aseguradora de Fianzas S.A, CHUBB de Colombia, Compañía lower than expected profitability at Reficarde Seguros S.A., Mapfre Seguros, as a result of the modifications of the schedule and budget of the project.
third parties with joint liability.
On JanuaryAs for the other 21 individuals initially investigated in 2017, the Office of the Comptroller General Comptroller initiated another special auditclosed the investigations. Therefore, as of the date of this annual report, no current or former member of Ecopetrol’s Board of Directors was charged in Reficar. the first proceeding relating to the increase in the Project’s budget.
As of the date of this annual report, no charges have been issued in the audit issecond proceeding relating to the modifications in the Project’s schedule.
While the content and status of the proceedings remains confidential, we can report that Reficar and several of its preliminary stage.employees have cooperated with and provided the information required by the department of the Office of the Comptroller General in charge of leading the proceedings.
As of the date of this annual report, Reficar has no liability under these proceedings.
The Attorney General’s Office currently has two ongoing investigations relating toOn February 2, 2018, the Project: (i) the first, initiated in 2012 against members of Reficar’s Board of Directors at the time, as well as certain current and former officers of Reficar; and (ii) a more recent investigation regarding delays in the completionLegal Accounts Commission of the Project, focusing onNational House of Representatives of the roleRepublic of currentColombia informed Reficar that the House of Representatives decided, through Resolution No. 2713, that it would not close the General Budget and former officersTreasury Account and the National Balance Sheet for the 2016 fiscal year, since the 2016 Financial Statements of Ecopetrol, as well as current and former membersseveral state entities, among them Reficar, had received a negative opinion from the Office of Ecopetrol’s Board of Directors.the Comptroller General. Pursuant to Resolution No. 2713, Colombian control entities were ordered to initiate the corresponding disciplinary, fiscal and/or criminal investigations.
The Prosecutor’s Office is conducting a confidential investigation. In connection therewith, on April 27, 2017,On February 6, 2019, the Prosecutor’s Office announced in a press release its intention to pursue chargesLegal Accounts Commission of the National House of Representatives of the Republic of Colombia informed Reficar that the House of Representatives decided, through Resolution No. 3135, that it would not close the General Budget and Treasury Account and the National Balance Sheet for the alleged crimes2017 fiscal year, since the 2017 Financial Statements of document forgery, illegal interestseveral state entities, among them Reficar, had received a negative opinion from the Office of the Comptroller General. Pursuant to Resolution No. 3135, Colombian control entities were ordered to initiate the corresponding disciplinary, fiscal and/or criminal investigations.
| 123 |
In respect of the special audits mentioned in the execution of agreements, misappropriation of public fundssections 1.3 and unjust enrichment against: (i) four former executives and officials of Ecopetrol and Reficar (ii) one current employee of Ecopetrol who was assigned to work in Reficar between 2012 and 2016, (iii) two executives of CB&I and (iv) Reficar’s statutory auditor from 2013-2015. According to the announcement the total amount involved in the alleged charges is estimated at COP 610 billion pesos (equivalent to approximately US$ 209 million at the Representative Exchange Rate1.4 above, as of May 26,the date of this annual report, Reficar has no knowledge of any procedural action carried out by any of the Colombian control entities regarding the disciplinary, fiscal and/or criminal investigations ordered neither by the Resolution No. 2713 nor by the Resolution No. 3135.
| 1.5 | In January 2019, the Office of the Comptroller General initiated a financial audit in Reficar. The final report is expected to be submitted on May 2019. |
Reficar’s external auditors issued an unqualified opinion on Reficar’s financial position as of December 31, 2016, 2017 and 2018. As of COP 2,911.66 per US$).the date of this annual report, such auditors have not informed Reficar that there has been any change to their opinion.
The Ecopetrol and Reficar executives and officials are: Orlando José Cabrales Martínez (Reficar CEO, 2009-12); Reyes Reinoso Yañez (Reficar CEO, 2012-16), current employee of Ecopetrol; Felipe Laverde Concha (Reficar General Counsel, 2009-March 2017); Pedro Alfonso Rosales Navarro (Ecopetrol Downstream Executive Vice President, 2008-15); and Nicolás Isaksson Palacios (Reficar Lead Legal Counsel, 2013-January 2017).
The Prosecutor’s Office has not yet made public the factual basis for such charges, and accordingly we are not in a position to predict the outcome of the Prosecutor’s Office’s investigation or the disposition of any charges that the Prosecutor’s Office may bring. As of the date of this annual report, to the best of Ecopetrol’s knowledge, the financial statements continue to fairly represent the financial and operational condition of the Company in all material aspects and its internal controls remain effective.
| 2. | The Attorney General’s Office investigations: |
In
Reficar has been officially informed that the press release, the Prosecutor’sAttorney General’s Office also announced that in order to conclude the next phases of thecurrently has five ongoing investigation related to among others, the selectionProject.
Regarding one of these five investigations, on September 12, 2017, the Attorney General’s Office issued a list of charges against certain former members of Reficar’s Board of Directors, as well as certain former officers of Reficar. The charges were related to the failure to fulfill some of their duties as administrators and/or for acting “ultra vires” in the exercise of their functions against: (i) Javier Genaro Gutiérrez (Ecopetrol CEO, 2007-2015); (ii) Felipe Laverde (Reficar General Counsel, 2009-March 2017); (iii) Pedro Rosales (Ecopetrol Downstream Executive Vice President, 2008-2015); (iv) Diana Constanza Calixto (Ecopetrol Head of the strategic partner,Corporate Finance Unit, 2009-2014) and (v) Reyes Reinoso Yañez (Reficar CEO, 2012-2016). The Attorney General’s Office closed the exitcase against the rest of Glencorethe members of Reficar’s Board of Directors and the selectionrest of the contractor, it would be interviewing executivesformer officers of Ecopetrol, Reficar, GlencoreReficar.
The specific content and status of the supervisory joint venture conformedremaining four ongoing investigations remains confidential.
| 3. | The Prosecutor’s Office investigations: |
The Prosecutor’s Office has been conducting the following legal proceedings:
| 3.1 | Between July 25 and August 2, 2017, the Prosecutor’s Office indicted the following individuals with charges, the majority of which are related to offenses against the public administration and illegal interest in the execution of agreements: (i) Orlando José Cabrales Martínez (Reficar CEO, 2009-2012); (ii) Reyes Reinoso Yañez (Reficar CEO, 2012-2016); (iii) Felipe Laverde Concha (Reficar General Counsel, 2009-March 2017); (iv) Pedro Alfonso Rosales Navarro (Ecopetrol Downstream Executive Vice President, 2008-2015); (v) Masoud Deidehban (CBI Executive Project Director); (vi) Phillip Asherman (CBI CEO) and (vii) Carlos Lloreda (Reficar’s statutory auditor from 2013-2015.) The arraignment hearing began on May 30, 2018, and as of the date of this annual report has not yet concluded. |
The Prosecutor’s Office has already made public the factual basis for such charges, which is based on the theory that: (i) executing a cost reimbursable engineering, procurement and construction contract (EPC) and not a lump sum agreement favored CBI interests, and (ii) executing special invoicing procedures (MOA –Memorandum of Agreement and PIP –Project Invoicing Procedure) with CBI allowed the payments of unreasonable amounts not duly verified by Foster Wheeler USA Corporation and Process Consultants Inc.Corporation. The defense attorneys have not yet had an opportunity to present their case against such facts in a court of law.
| 124 |
In connection with the Prosecutor’s Office press release, on
On May 9, 2017, theEcopetrol’s Audit and Risk Committee of the Board of Directors retained a U.S.-based outside law firm to commence a third-party investigation into the matters set forth in the Prosecutor’s Office announcement. The results were presented in December 2017 to Ecopetrol’s Audit and Risk Committee. This investigation concluded that to date there has been no evidence of possible unlawful acts that affect Ecopetrol’s internal control over the financial reporting of the Company, on the allegations made by the Prosecutor’s Office.
| 3.2 | On October 22 and 23, 2018, the Prosecutor’s Office indicted the following individuals with charges related to improper management and obtaining false public documents: Javier Genaro Gutiérrez Pemberthy (Ecopetrol CEO, 2007-2015), Reyes Reinoso Yánez (Reficar CEO, 2012-2016), Pedro Alfonso Rosales Navarro (Ecopetrol Downstream Executive Vice President, 2008-2015), and Diana Constanza Calixto Hernández (Ecopetrol Head of the Corporate Finance Unit, 2009-2014). As of the date of this annual report, the arrangement hearing has not yet taken place. |
| 3.3 | On March 18, 2019, the Prosecutor’s Office issued a public statement in which it announced that on April 25, 2019 it was going to indict the following individuals, in an indictment hearing that has not yet taken place, with charges related to entering into agreements without compliance with legal requirements: Orlando José Cabrales Martínez (Reficar CEO, 2009-2012) and Felipe Castilla (Reficar CEO, 2009). |
Considering the current stage of these legal proceedings, we are not in a position to predict the outcome of the Prosecutor’s Office’s investigation or the disposition of any of the charges brought by the Prosecutor’s Office.
Ecopetrol and Reficar have cooperated closely and extensively with the control entities in furthering their investigations and will continue to monitor the status and development of these investigations.
| 4. | Arbitration Tribunal |
In March 2016, Reficar filed a Request for Arbitration before the International Chamber of Commerce (the “ICC”), against Chicago Bridge & Iron Company N.V., CB&I (UK) Limited, and CBI Colombiana S.A. with respect(jointly, “CB&I”) concerning a dispute related to the Engineering, Procurement, and Construction ContractAgreements entered into by and between Reficar and CB&I for the expansion of the Cartagena Refinery in Cartagena, Colombia. Reficar is the Claimant in the ICC arbitration proceeding and seeks no less than US$2 billion in damages plus lost profits from CB&I. profits.
On May 25, 2016, CB&I filed an answerits Answer to the Request for Arbitration and counterclaim ofCounterclaim for approximately USD $213US$106 million and COP$324,052 million. On June 27, 2016, Reficar filed its reply to CB&I’s counterclaim denying any liability toand disputing the declarations and relief requested by CB&I. On April 28, 2017, Reficar submitted its Non-Exhaustive Statement of Claim and CB&I submitted its Statement of Counterclaim. Counterclaim increasing its claims to approximately US$116 million and COP$387,558 million. On March 16, 2018, CB&I submitted its Exhaustive Statement of Counterclaim further increasing its claims to approximately US$129 million and COP$432,303 million (including in each case interest).
The ICC proceedingdate for the filing of the Third Written Submission is currently in its preliminary stageto be set by the Arbitral Tribunal and the oral hearing is scheduled for ato begin in April 2020. After the hearing, in October 2018. Thethe Tribunal will analyze the parties’ arguments to render its final decision on Reficar’s and CB&I’s claims. Until then, the outcome of these actionsthis arbitration is unknown.
Bioenergy Special Audit
The Office of the Comptroller General, Comptroller, in exercise of its fiscal monitoring duties and authority as set forth in Article 267 of the Political Constitution, and the law, has undertaken audits of the performance of the Bioenergy S.AS.A.S. and Bioenergy Zona Franca S.A.S. investments.
| 125 |
On February 6, 2017 the Office of the Comptroller General Comptroller initiated a Special Intervention (Special Audit) in order to evaluate the use of public funds in the project carried out by Bioenergy Zona Franca S.A.S. and Bioenergy S.A. The Company is cooperatingOn July 10, 2017 the Office of the Comptroller General issued its final report with 15 findings related to: (i) acquisition, lease payments and the use of agricultural lands, (ii) loss of profits due to the project’s delay; and (iii) execution of contracts related with the oversightbuilding, commissioning and control entitiesstart-up of the industrial plant and has respondedthe agricultural component of the project. On December 28, 2018, Bioenergy completed all of the activities set forth in the remediation plan to address the information requirements that have been requested to date.15 findings.
As of the date of this annual report, the Office of the Comptroller General had initiated a financial audit of Bioenergy’s financial statements for the year ended December 31, 2018.
| 6. | Shareholder Information |
6.1 Shareholders’ General Assembly
Our Shareholders’ General Assembly was held on March 31, 201729, 2019 and the following matters were approved:
| · | The plan for distribution of the Company’s profits, which establishes the distribution of an ordinary dividend per share of |
| · |
| · | Appointment of Ernst & Young as external auditor of Ecopetrol for fiscal year |
| · | The new composition of the Board of Directors for |
Non Independent DirectorsNon-Independent Directors::
Independent Directors:
| · | Esteban Piedrahita Uribe |
| Carlos Gustavo Cano Sanz (nominated by the minority shareholders with the greatest share participation) |
In 2016,2018, the Board of Directors approved as a dividend policy under which we are to distributeconsisting of the ordinary distribution of between 40% and 60% of the adjusted net income beforeof the effectCompany of impairmenteach fiscal year. For this purpose, the Board of non-current assets (net of taxes) atDirectors shall assess overall delivery against the corporate group level. This policy cannot exceedCompany’s financial targets, as well as the maximum amount to be distributedmacroeconomic environment, projected cash requirements for delivering on our Business Plan and should keepstrategy, while maintaining appropriate financial flexibility in keeping the Company’s debt metrics in line with an investment grade rating. The policy does not preclude the distribution of extraordinary dividends above the 40% to 60% range, under exceptional circumstances and with due consideration of the above criteria. The maximum amount to be distributed is the profits available to shareholders (net income after release and appropriation for legal, fiscal and occasional reserves).
Pursuant to Colombian law, dividend distribution to our shareholders must be approved by a 78% majority of the shares represented in the corresponding shareholders’ meeting.General Shareholders Assembly. In the absence of this special majority, at least 50% of the net profits must be distributed.
On March 29, 2019, our shareholders at the ordinary General Shareholders Assembly approved an ordinary dividend of 60% of our net income or COP$169 per share (within the dividend policy of 40% and 60% of net income), for the fiscal year ended December 31, 2018 and an extraordinary dividend of 20% of our net income or COP$56 per share, given our strong operational and robust cash position in 2018,for a total dividend per share of COP$225. On March 23, 2018, our shareholders at the ordinary General Shareholders Assembly approved an ordinary dividend of 55% of our net income for the fiscal year ended December 31, 2017. On March 31, 2017, our shareholders at the ordinary general shareholders’ meetingGeneral Shareholders Assembly approved an ordinary dividend of 40% of our net income before the impairment of non-current assets (net of taxes) for the fiscal year ended December 31, 2016. Given that the fiscal year ended December 31, 2015 resulted in a net loss for Ecopetrol S.A., our shareholders at the Ordinary General Stockholder MeetingShareholders Assembly held on March 31, 2016, approved that there was no distribution of profits for the fiscal year ended December 31, 2015. Pursuant to Article 456 of the Code of Commerce the Company absorbed the net loss for the fiscal year ended December 31, 2015 through its legal reserve. In 2014 and 2015, the shareholders approved the distribution of 80.1% and 70% of 2013 and 2014 net income, respectively. See the sectionFinancial Review—Liquidity and Capital Resources—Dividends.
Ecopetrol S.A. is required to have legal reserves equal to 50% of its subscribed capital. If the legal reserves are less than 50% of subscribed capital, we will contribute 10% of net income to our legal reserves every year until our legal reserves meet the required level.
Starting onOn August 2010, our ADSs began trading on the Toronto Stock Exchange (“TSX”) under the symbol “ECP.” On February 17, 2016, we announced the application for voluntary delisting from the Toronto Stock Exchange after in an ordinary meeting held on January 27, 2016, during whichfollowing the Board of Directors made theDirectors’ decision to delist from the TSX. ThisThe decision was based on the Board of Director’s assessment of, among other factors, the limited trading activity of our ADRs in Canada, a liquid market for our ADRs on the NYSE and for our ordinary shares on the local Colombian Stock Exchange (Bolsa de Valores de Colombia), both of which enable interested investors to acquire a participation in Ecopetrol S.A.among other factors. The time and administrative efforts associated with maintaining the listing of the ADRs on the TSX were also taken into account. On March 2, 2016, Ecopetrol’s ADRsour ADR’s were officially delisted from the TSX. AfterOn December 7, 2017, we applied to the Alberta Securities Commission and the Ontario Securities Commission to cease our reporting requirements, due to our delisting fromprocess. On September 4, 2018, we announced that effective August 29, 2018, we had ceased to be a reporting issuer in each of the TSX, theprovinces of Alberta and Ontario and hence were no longer a reporting issuer in any jurisdiction in Canada. Accordingly, Ecopetrol no longer has any continuous disclosure obligations in Canada. The ADRs have continued to trade on the NYSE and the ordinary shares have continued to trade in the Colombian stock market. Therefore, the Company continues to be subject to United States, as well as Colombian, reporting and corporate governance obligations.
The following table sets forth reported high and low closing prices in Colombian Pesos for our shares and the reported average daily trading volume of our shares on the BVC for the periods indicated. The table also sets forth information on the trading price of our shares in Colombian Pesos and U.S. dollars, as well as the average trading volume.
Table 55 – Shares Traded on the Bolsa de Valores de Colombia
| Shares Traded on the BVC | ||||||||||||||||||||
| Colombian Pesos per share | U.S. dollars per share(1) | Average number of shares traded | ||||||||||||||||||
| High | Low | High | Low | Per day | ||||||||||||||||
| 2012 | 5,850 | 4,200 | 3.3236 | 2.1619 | 8,396,801 | |||||||||||||||
| 2013 | 5,710 | 3,695 | 3.2091 | 1.8992 | 7,018,859 | |||||||||||||||
| 2014 | 4,030 | 1,815 | 2.0556 | 0.7546 | 8,222,596 | |||||||||||||||
| 2015 | 2,305 | 1,090 | 0.8402 | 0.3973 | 10,109,301 | |||||||||||||||
| 2016 | 1,465 | 881 | 0.4802 | 0.2888 | 13,077,105 | |||||||||||||||
| Most recent quarters | ||||||||||||||||||||
| First quarter 2015 | 2,305 | 1,800 | 0.9335 | 0.7289 | 12,054,021 | |||||||||||||||
| Second quarter 2015 | 2,085 | 1,625 | 0.8337 | 0.6497 | 10,056,874 | |||||||||||||||
| Third quarter 2015 | 1,675 | 1,285 | 0.5706 | 0.4377 | 9,516,211 | |||||||||||||||
| Fourth quarter 2015 | 1,515 | 1,090 | 0.4953 | 0.3563 | 8,805,595 | |||||||||||||||
| First quarter 2016 | 1,425 | 881 | 0.4386 | 0.2712 | 17,971,092 | |||||||||||||||
| Second quarter 2016 | 1,465 | 1,220 | 0.4892 | 0.4074 | 14,267,136 | |||||||||||||||
| Third quarter 2016 | 1,410 | 1,170 | 0.4786 | 0.3971 | 10,403,945 | |||||||||||||||
| Fourth quarter 2016 | 1,385 | 1,240 | 0.4593 | 0.4112 | 9,760,236 | |||||||||||||||
| First quarter 2017 | 1,415 | 1,290 | 0.4842 | 0.4414 | 10,004,466 | |||||||||||||||
| Most recent six months | ||||||||||||||||||||
| November 2016 | 1,330 | 1,240 | 0.4276 | 0.3987 | 10,179,339 | |||||||||||||||
| December 2016 | 1,385 | 1,305 | 0.4602 | 0.4336 | 8,629,345 | |||||||||||||||
| January 2017 | 1,415 | 1,360 | 0.4811 | 0.4624 | 8,948,342 | |||||||||||||||
| February 2017 | 1,395 | 1,310 | 0.4844 | 0.4549 | 11,907,449 | |||||||||||||||
| March 2017 | 1,350 | 1,290 | 0.4588 | 0.4384 | 9,282,601 | |||||||||||||||
| April 2017 | 1,400 | 1,340 | 0.4865 | 0.4656 | 13,581,125 | |||||||||||||||
| May 2017 (through May 26, 2017) | 1,480 | 1,335 | 0.5054 | 0.4559 | 18,112,368 | |||||||||||||||
The following table sets forth reported high and low closing prices in U.S. dollars for our ADSs and the average daily trading volume of our ADSs on the NYSE for the periods indicated. The table also sets forth information on the trading price of our ADSs in U.S. dollars, as well as the average trading volume.
Table 56 – Shares Traded on the New York Stock Exchange
| ADSs Traded on NYSE | ||||||||||||
U.S. dollars per ADS(1) | Average number of ADSs Traded per | |||||||||||
| High | Low | day | ||||||||||
| 2012 | 67.48 | 44.52 | 551,410 | |||||||||
| 2013 | 63.80 | 37.93 | 464,193 | |||||||||
| 2014 | 41.16 | 14.77 | 603,083 | |||||||||
| 2015 | 19.80 | 6.50 | 960,193 | |||||||||
| 2016 | 10.04 | 5.40 | 1,160,901 | |||||||||
| Most recent quarters | ||||||||||||
| First quarter 2015 | 19.80 | 13.89 | 1,083,162 | |||||||||
| Second quarter 2015 | 17.48 | 12.85 | 809,096 | |||||||||
| Third quarter 2015 | 12.72 | 8.28 | 915,918 | |||||||||
| Fourth quarter 2015 | 10.63 | 6.50 | 937,078 | |||||||||
| First quarter 2016 | 9.22 | 5.40 | 1,559,605 | |||||||||
| Second quarter 2016 | 10.04 | 7.89 | 1,257,883 | |||||||||
| Third quarter 2016 | 9.80 | 7.83 | 914,424 | |||||||||
| Fourth quarter 2016 | 9.37 | 7.85 | 926,722 | |||||||||
| First quarter 2017 | 9.67 | 8.60 | 986,373 | |||||||||
| Most recent six months | ||||||||||||
| November 2016 | 8.80 | 7.85 | 1,042,780 | |||||||||
| December 2016 | 9.25 | 8.58 | 866,147 | |||||||||
| January 2017 | 9.56 | 9.28 | 984,122 | |||||||||
| February 2017 | 9.67 | 9.01 | 1,118,084 | |||||||||
| March 2017 | 9.33 | 8.60 | 879,525 | |||||||||
| April 2017 | 9.72 | 9.06 | 1,210,834 | |||||||||
| May 2017 (through May 26, 2017) | 10.24 | 8.97 | 1,307,921 | |||||||||
Registration and Transfer of Shares
Under Colombian law, transfers of shares must be registered on the issuer’s stock ledger. Only those holders registered on the stock ledger are considered by law as shareholders. Ecopetrol’s shares are in electronic form, other than those shares held by the Nation, which are in physical form.
Transfers of electronic shares evidenced in electronic formis required to be negotiated through the ColombiaColombian Stock Exchange. In Colombia, only the relevant stockbrokers calledsociedades comisionistas de bolsa are authorized to make the transferstransfer of shares through the ColombiaColombian Stock Exchange. The transferstransfer of shares areis registered in the Centralized Security Deposit (Depósito Centralizado de Valores) or DECEVAL, through the relevant stockbrokers. DECEVAL records the share transfer on its systems, in order to make the corresponding registration in the issuer stock ledger.
| 127 |
Under Colombian legislation, if a transfer of shares forhas a value equivalent to or higher than 66,000 UVR (the UVR was COP$ 242.4513260.6658 as of December 31, 2016)2018) it must be made through the BVC if the shares are registered with the BVC. Otherwise, shareholders can freely negotiate a transfer of shares.
Nevertheless, pursuant to Decree 2555 of 2010 article 6.15.1.1.2 the following transfers are not required to be executedperformed through the BVC:
| · | Transfers between shareholders who are considered to be the same beneficial owner; |
| · |
| · | Repurchases of shares by the issuer; |
| · | Property delivered in lieu of payment, or payment of money or other valuable property, different than the amount owed or demanded, in exchange for the |
| · |
| · |
| · |
| · | Any other transaction specifically authorized by the Superintendence of Finance to take place outside the BVC. |
For the purposes described above, multiple transfer transactions made within one hundred twenty (120) calendar days, between the same parties on shares of the same issuer and under similar conditions, are treated asconsidered a single transfer.
6.4 Ecopetrol ADR Program Fees
Fees and Charges That a Holder of Our ADSs May Have to Pay, Either Directly or Indirectly
JPMorgan Chase Bank, N.A., our Depositary, may charge each person to whom ADSs are issued, including, without limitation, issuances against deposits of shares, issuances in respect of share distributions, rights and other distributions, issuances pursuant to a stock dividend or stock split declared by us or issuances pursuant to a merger, exchange of securities or any other transaction or event affecting the ADSs or deposited securities,Deposited Securities, and each person surrendering ADSs for withdrawal of deposited securitiesDeposited Securities in any manner permitted by the Deposit Agreement or whose ADRsADSs are cancelled or reduced for any other reason, US$5.00 for each 100 ADS (or any portion thereof) issued, delivered, reduced, cancelled or surrendered, as the case may be. The Depositary may sell (by public or private sale) sufficient securities and property received in respect of a share distribution, rights and/or other distribution prior to such deposit to pay such charge.
The Depositary collects its fees for issuance and cancellation of ADSs directly from investors depositing common shares or surrendering ADSs for the purpose of withdrawal or from intermediaries acting for them. The Depositary collects fees for making distributions to investors by deducting those fees from the amounts distributed or by selling a portion of distributable property to pay the fees. The Depositary may collect its annual fee for Depositary services by deduction from cash distributions, or by directly billing investors, or by charging the book-entry system accounts of participants acting for them. The Depositary may generally refuse to provide services to any holder until the fees and expenses owing by such holder for those services or otherwise are paid.
| 128 |
The following additional charges may be incurred by ADS holders of ADRs, by any party depositing or withdrawing common shares or by any party surrendering ADSs and/or to whom ADSs are issued (including, without limitation, issuance pursuant to a stock dividend or stock split declared by us or an exchange of stock regarding the ADRs or the deposited securitiesDeposited Securities or a distribution of ADSs), whichever is applicable:
| · | A fee of |
| · | A fee for the distribution of securities (or the sale of securities in connection with a distribution), such fee being in an amount equal to the fee for the execution and delivery of ADSs which would have been charged as a result of the deposit of such securities (treating all such securities as if they were common shares) but which securities or the net cash proceeds from the sale thereof are instead distributed by the Depositary to those holders of ADRs entitled thereto; |
| · |
| · |
| · | Stock transfer or other taxes and other governmental charges; |
| · | SWIFT, cable, telex and facsimile transmission and delivery charges incurred at the request of a holder of ADRs; |
| · | Transfer or registration fees for the registration of transfer of Deposited Securities on any applicable register in connection with the deposit or withdrawal of Deposited Securities; and |
| · | In connection with the conversion of foreign currency into U.S. dollars, the Depositary shall deduct out of such foreign currency the fees, expenses and other charges charged by it or the Depositary’s agent (which may be a division, branch or affiliate) so appointed in connection with such conversion. The Depositary and/or the Depositary’s agent may act as principal for such conversion of foreign currency. Such charges may at any time and from time to time be changed by agreement between us and the Depositary. |
We will pay all other charges and expenses of the Depositary and any agent of the Depositary (except the custodian) pursuant to agreements from time to time between us and the Depositary. The fees described above may be amended from time to time.
Fees and Other Direct and Indirect Payments Made by the Depositary to Us
Our Depositary has agreed to reimburse us for certain expenses we incur that are related to establishment and maintenance of the ADR program, including investor relations expenses and exchange application and listing fees. In 2014, reimbursements were made in the amount of approximately US$3,093,346 for expenses related to investor relations activities. In 2015, reimbursements were made in the amount of approximately US$2,069,202 for expenses related to investor relations activities. In 2016, reimbursements were made in the amount of approximately US$2,366,395 for expenses related to investor relations activities. In 2017, reimbursements were made in the amount of approximately US$2,220,290 for expenses related to investor relations activities. In 2018, reimbursements were made in the amount of approximately US$2,062,050 for expenses related to investor relations activities.
6.5.1 Colombian Tax Considerations
The following is a general description of the Colombian tax considerations for investments in common shares in Colombia or for the purchase of ADSs, in a foreign securities market. This description is based on applicable law in effect as of the date of this annual report is issued, which may be subject to changes.
Prospective purchasers of common shares or ADSs should consult their own tax advisors for a detailed analysis of the tax consequences in Colombia, resulting from the acquisition, ownership and disposition of common shares or ADSs.
General Rules
Colombian entities and individuals who are deemed to be residents within the Colombian national territory for Colombian tax purposes are subject to Colombian income tax on their worldwide income. Foreign entities and individuals as well as their permanent establishments in Colombia, who are not deemed to be residents in Colombia, for tax purposes are subject to income tax in Colombia only with respect to their national-sourceColombian-source income, which is generally defined as income obtained from (i) the rendering of services inside Colombian territory, (ii) the exploitation of tangible and intangible assets in Colombia, and (iii) the sale of tangible or intangible assets that are located inside Colombian territory at the time of the salesale. Double taxation treaties signed by Colombia, if applicable, may provide for special regulations regarding income tax.taxation. Until 2018, foreign residents deriving income through a permanent establishment were subject to Colombian income tax on the Colombian source income attributable to their permanent establishment only. As of 2019, foreign tax residents deriving income through a permanent establishment will be subject to Colombian income tax on their global source income attributable to their permanent establishment in Colombia.
Dividends paid by Colombian companies, as well as profits distributed by branches/permanent establishments of foreign entities, are deemed as a dividend and as Colombian income. However, whether they are taxed or notthe applicable tax depends on an imputation system set forth in articles 48 and 49 of the Colombian Tax Code (hereinafter “CTC”). AccordingFor more information related to this system,the Colombian dividends are taxable when paid out of non-taxed profits, in which case a 35% withholding applies when paidtax regime, seeRisk Factors—Risks Related to non-resident shareholders. Conversely, they are non-taxable when paid out of taxed profits.Colombia’s Political and Regional Information.
One of the novelties introduced by lawAs mentioned above, Law 1819 of December 29 of 2016 (the “Tax Reform”) was the creation ofcreated a new dividends tax that applies on all dividend distributions to Colombian individuals or to any type of non-resident shareholder, absent any specific treaty or exception.exception, regardless that dividends are paid from taxed or non-taxed profits. According to the Tax Reform,aforementioned law, dividend payments made to foreign shareholders will beout of profits accrued at the corporate level as of 2017 were subject to a 5% withholding. This newThat rate was subsequently modified by Law 1943 of 2018, which increased it to 7.5% and extended dividend taxation to intercompany dividends between Colombian resident companies (with certain exceptions).
From fiscal year 2019 onwards, a withholding tax will only apply toon dividends paid from profits accruedapplies as from fiscal year 2017.follows:
| (i) | For resident companies and non-resident shareholders (companies and individuals): (i) a 7.5% dividend tax on dividends distributed from profits taxed at the corporate level (except that dividends paid to non-resident shareholders out of profits taxed at the corporate level prior to and including December 31, 2016, are not subject to this tax); and (ii) 33% withholding tax rate on dividends distributed from profits not taxed at the corporate level (32% for 2020, 31% for 2021 and 30% as of 2022), plus an additional 7.5% dividend tax after applying the initial 33% withholding tax rate. |
| (ii) | For Colombian individuals: dividend income in excess of 300 UVT are taxed at a 15% rate. |
Note that the dividend tax will applyapplies simultaneously with the aforementioned imputation system. Accordingly, dividends paid from non-taxed profits will bewere subject to a 35% withholding for income tax, andplus an additional 5% dividend tax on the balance. This means that the overall burden in this scenario iswas 38.25% (e.g.(e.g. $100 *35% = $35, plus $65 * 5% = $3.25). As for taxable year 2019, dividends paid from non-taxed profits are subject to a 33% withholding for income tax (32% for 2020, 31% for 2021 and 30% as of 2022), and an additional 7.5% dividend tax on the balance. In this case, the combined tax rate is approximately 38.025% (e.g. $100 *33% = $33, plus $67 * 7.5% = $5.025).
| 130 |
Relief or reduced tax rates may apply under an applicable treaty to avoid double taxation, but the application of any such rules must be analyzed on a case-by-case basis.
For Colombian tax purposes, an individual is considered to be a Colombian resident when he/she meets any of the following criteria:
| (i) | He/she remains in Colombia continuously or discontinuously for more than 183 calendar days within any given 365-consecutive-day term; |
| (ii) | He/she is related to the Colombian government’s foreign service or to individuals who are in the Colombian government’s foreign service and who, by virtue of the Vienna Conventions on diplomatic and consular relations, are exempted from taxes during the time of their service; or |
| (iii) | He/she is a Colombian national and: |
| - | Has a spouse or permanent companion, or dependent children, who are tax residents in Colombia, or |
| - | 50% or more of his or her total income is Colombian source income, or |
| - | 50% or more of his or her assets are managed in Colombia, or |
| - | 50% or more of his or her assets are deemed to be located or possessed in Colombia, or |
| - | Has failed to provide proof of residency in another country (different from Colombia) upon previous official request by the Colombian tax office, or |
| - | He/she has a tax residency in a country considered by the Colombian government to be a low tax jurisdiction or a tax haven. |
Law 1739 of 2014 clarifies that Colombian nationals who meet any of the following requirements will not be deemed as tax residents:
| If more than 50% of his or her annual income has its source in the jurisdiction where he or she is domiciled and whose country of domicile is not Colombia. |
| If more than 50% of his/her assets are located in the jurisdiction where he or she is domiciled and whose country of domicile is not Colombia. |
For purposes of Colombian taxation, an entity is deemed to be a “national” or a “Colombian entity” and, therefore, subject to taxation in Colombia on its worldwide income, if it meets any of the following criteria:
| (i) | It has its place of effective management, in Colombia during the corresponding year or taxable period; |
| (ii) | It has its main domicile in the Colombian territory; or |
| (iii) | It has been incorporated in Colombia, in accordance with Colombian laws. |
Pursuant to the Colombian Tax Code, a foreign company or non-resident individual has a permanent establishment in Colombia when said company or individual performs activities in Colombia through: (1) a fixed place of business (i.e.(i.e., branches, factories or offices), or (2) an individual who is not an independent agent empowered to execute agreements on behalf of the foreign company. As noted above, until 2018 permanent establishments arewere considered Colombian taxpayers in connection with their Colombian source income. As of fiscal year 2019, foreign residents deriving income through a Colombian permanent establishment are subject to Colombian income tax on the Colombian-sourceworldwide income and Colombian-source taxable gains attributedattributable to saidthe Colombian permanent establishment. A foreign company or entity will not be deemed to have a permanent establishment by the sole fact that it acts through a broker or any other independent agent. In addition, passive-income generating activities, such as dividends, royalties and interests, typically do not qualify as entrepreneurial and are not deemed to create permanent establishments.establishments.
| 131 |
Tax Treatment of a Non-Colombian Entity and a Non-Resident Individual of Colombia Who Purchases an ADS in a Foreign Securities Market
Dividends
As a general rule, dividends paid to foreign companies, foreign entities or non-resident individuals who are investing in ADSs which underlying assets are Colombian shares are treated as Colombian-source income and are thus subject to Colombian income tax.
To avoid double taxation, dividends paid by Colombian entities are not subject to income tax at the shareholder level when they are paid out of corporate profits that have been previously taxed at the corporate level. As of taxable yearFor fiscal years 2017 and 2018, a withholding tax on dividends iswas triggered for dividends paid to non-resident shareholders. Withholding tax rates on dividends varieswere as follows: (i) a 5% dividend tax for dividends distributed out of profits already taxed at the company´scompany’s level; (ii) 35% withholding tax rate for dividends distributed out of profits that were not taxed at the company´scompany’s level, plus an additionala 5% dividend tax rate after having applied and deducted the initial 35% withholding. AsNote that dividends paid to non-resident shareholders out of fiscal year 2017, for Colombian individuals, dividends will beprofits taxed between 5% and 10% depending on the dividend amount. Profits that did not pay tax at the corporate level would be subject to a 35% withholding tax at the time of distribution. In this case, the base amountuntil December 31, 2016, are not subject to the aforementioned 5% dividend tax would beor any other income tax. As of 2019, the remaining amount after the 35% withholding tax. Dividends tax will berates applicable to profits generated as of 2017. Finally, dividends paid to local corporationsresident companies and non-resident shareholders (companies and individuals) are: (i) a 7.5% dividend tax on dividends distributed from profits taxed at the corporate level (except that dividends paid to non-resident shareholders out of profits taxed at the corporate level prior to and including December 31, 2016, are not subject to this tax.tax); and (ii) 33% withholding tax rate on dividends distributed from profits not taxed at the corporate level (32% for 2020, 31% for 2021 and 30% as of 2022), plus an additional 7.5% dividend tax after applying the initial 33% withholding tax rate.
FurtherFurthermore to the above, the applicable withholding tax rate for an entitynon-resident entities or a non-resident individualindividuals whose investment qualifies as portfolio investments (i.e., investing through a Foreign Funds Administration Account (FFAA)- FFAA) will be taxed upon distribution by means of a withholding tax mechanism. In this case, pursuant to Article 18-1 of the Colombian Tax Code, the applicable withholding tax rate on taxable dividends is 25%, since its investment qualifies as portfolio investments and the dividends that are distributed by the Colombian entity are not taxed at the corporate level (assumingassuming that the dividends cannot be attributed to a permanent establishment in Colombia belonging to the shareholder).shareholder and were not subject to taxation at the corporate level. The abovementioned 5% dividend tax (7.5% from 2019 onwards) applies on the balance of dividends to be distributed to the shareholder investing through an FFAA, or on the gross amount in such cases the dividend is paid out of profits that were subject to taxation at the corporate level. These foreign shareholders subject to this withholding tax are not required to file an income tax return in Colombia.
In addition to the above, the new dividend tax will apply at a 5% rate.
Taxation of Capital Gains from the Sale of ADSs
Capital gains obtained from the sale of ADSs by non-Colombian entities, Colombian individuals who are non-residents in Colombia and foreign non-resident individuals, are not subject to income tax in Colombia, as such sale does not generate Colombian-source income to the extent that the ADSs are not deemed to be sourced in Colombia.
If the holder of the ADSs who is a non-resident entity, a Colombian individual who is not a resident in Colombia or a foreign non-resident individual, decides to surrender the ADSs and withdraw the underlying common shares, it is arguable that such transaction does not generate a capital gain subject to income tax in Colombia. However, different interpretations may be adopted by the Colombian Tax Authorities on this matter.
Tax Treatment in Colombia of a Non-Colombian Entity and a Non-Resident Individual of Colombia Who Purchases Ecopetrol’s Shares in Colombia’s Securities Market
Dividends
As a general rule, dividends paid to foreign companies, foreign entities, or to non-resident individuals in Colombia, who are investing in Colombian shares directly or through a FFAA, are treated as national-source income; thus, they are subject to Colombian income tax.
To avoid double taxation, dividends are not subject to income tax at the shareholder level when they are paid out of corporate profits that have been previously taxed at the corporate level. However, as of taxable yearfor 2017 and 2018, a withholding tax on dividends iswas triggered for dividends paid to non-resident shareholders. Withholding tax rates on dividends variesvaried as follows: (i) 5% dividend tax for dividends distributed out of profits already taxed at the company´s level;company’s level (except that dividends paid to non-resident shareholders out of profits taxed at the corporate level prior to and including December 31, 2016, are not subject to this tax); and (ii) 35% withholding tax rate for dividends distributed out of profits not taxed at the company´s level, plus an additional 5%company’s level. As of 2019, the withholding tax rates applicable to dividends paid resident companies and non-resident shareholders (companies and individuals) are: (i) a 7.5% dividend tax rate after having applied and deducted the initial 35% withholding. As of fiscal year 2017, for Colombian individuals,on dividends will bedistributed from profits taxed between 5% and 10% depending on the dividend amount. Profits that did not pay tax at the corporate level would be subject to a 35% withholding tax at the time of distribution. In this case, the base amount subject to the dividend tax would be the remaining amount after the 35% withholding tax. Dividends tax will be applicable to profits generated as of 2017. Finally,(except that dividends paid to local corporationsnon-resident shareholders out of profits taxed at the corporate level prior to and including December 31, 2016, are not subject to this tax.
For fiscal year 2017 if the shareholder is a non-resident entity or a non-resident individual investing directly, it will be taxed upon distribution, by means of thetax); and (ii) 33% withholding tax mechanism, provided that its investment does not qualify as portfolio investments andrate on dividends that are distributed arefrom profits not taxed at the corporate level. In this case, dividends will be subject to a 35%level (32% for 2020, 31% for 2021 and 30% as of 2022), plus an additional 7.5% dividend tax after applying the initial 33% withholding tax.tax rate.
Non-resident entities or non-resident individuals will be taxed upon distribution by means of the withholding tax mechanism, provided that their investments qualify as portfolio investments (i.e.(i.e., investing through a FFAA) and dividends that are distributed by the Colombian entity are not taxed at the corporate level. In this case, pursuant to Article 18-1 of the Colombian Tax Code, the applicable withholding tax rate is 25%, assuming that the dividends cannot be attributed to a permanent establishment in Colombia belonging to the shareholder. These foreign shareholders subject to this withholding tax are not required to file an income tax return in Colombia. This treatment was modified by Law 1943/2018. See sectionFinancial Review—Taxes.
In addition to the above, the new dividend tax will apply at a 5% rate. This treatment was modified by Law 1943 of 2018 (7.5% from 2019 onwards). See sectionFinancial Review—Taxes.
Taxation of Capital Gains for the Sale of Shares
Pursuant to Article 36-1 of the Colombian Tax Code, capital gains derived from the sale of shares listed on the BVC and owned by the same beneficial owner, are deemed as non-taxable income in Colombia, provided that the shares sold during the same taxable year do not represent more than 10% of the outstanding shares of the listed company. Pursuant to Article 18Section 1.6.1.13.2.19 of Regulatory Decree 26341625 of 2012,2016, sellers of shares are not required to file an income tax return for the transfer of securities that are listed in the National Registry of Securities and Issuers (Registro Nacional de Valores y Emisores) as long as the foreign investment is treated as a portfolio investment according to article 3 of Decree 2080 of 2000.2000 (currently compiled in Article 2.17.2.2.1.2 of Decree 1068 of 2015) and the abovementioned 10% threshold is not surpassed.
If the above-mentionedabovementioned requirements are not met, the capital gain obtained in the sale of shares is subject to income tax or capital gains tax, under the following rules:
| · | The gain or loss arising therefrom will be the difference between the sale price and the tax basis of the shares. As a general rule, the tax basis of shares is equal to the price paid for such shares (i.e., cost of acquisition). |
| · | The applicable tax rate and the withholding tax rate have to be determined on a case-by-case basis. Generally, if the shares have been owned for at least two years, the profits from the sale will qualify as capital gains taxable at 10% |
Tax Treatment of Non-Residents Who Purchase Ecopetrol’s Shares in the BVC Market and Exchange Them for ADSs
Dividends
Payment of dividends by Colombian entities to foreign companies, foreign entities or to non-resident individuals who are investing in ADSs which underlying assets are Colombian shares or in Colombian shares directly are subject to the tax treatment described above.
Taxation on Capital Gains for the Sale of Shares
If the holder of the Colombian shares is a non-resident entity, a Colombian individual who is not a resident in Colombia or a foreign non-resident individual, and such holder decides to exchange such common shares for ADSs, it is arguable that such transaction should not generate a capital gain subject to income tax in Colombia. However, different interpretations may be adopted by the Colombian tax authorities on this matter. For instance, assuming that the exchange of securities is treated as a sale of Ecopetrol’s shares, the seller would be subject to the tax treatment described above in connection with the taxation of capital gains for the sale of shares. Absent any specific rules or regulations addressing this specific situation, a case-by-case analysis would be necessary.
| 6.5.2 | U.S. Federal Income Tax Consequences |
This summary describes the principal U.S. federal income tax consequences of the ownership and disposition of common shares or ADSs, but it does not purport to be a comprehensive description of all of the U.S. tax consequences that may be relevant to a decision to hold or dispose of common shares or ADSs. This summary applies only to purchasers of common shares or ADSs who will hold the common shares or ADSs as capital assets for U.S. federal income tax purposes and does not apply to special classes of holders such as dealers in securities or currencies, holders whose functional currency is not the U.S. dollar, holders of ten percent10% or more of our shares (taking into account shares held directly or through depositary arrangements)arrangements by vote or by value), tax-exempt organizations, financial institutions, holders liable for the alternative minimum tax, securities traders who elect to account for their investment in common shares or ADSs on a mark-to-market basis, partnerships or other pass-through entities or arrangements and investors therein, insurance companies, U.S. expatriates, persons that purchase or sell common shares or ADSs as part of a wash sale for tax purposes, and persons holding common shares or ADSs in a hedging transaction or as part of a straddle, conversion or other integrated transaction for U.S. federal income tax purposes. The statements regarding U.S. tax law set forth in this summary isare based on the Internal Revenue Code of 1986, as amended, which we call the “Code,” its legislative history, existing and proposed U.S. Treasury regulations, published rulings and court decisions, all as in force on the date of this annual report, and changes to such law subsequent to the date of this annual report may affect the tax consequences described herein (possibly with retroactive effect). This summary is also based in part on the representations of the Depositary and the assumption that each obligation in the Deposit Agreement and any related agreement will be performed in accordance with its terms.
Each holder is encouraged to consult such holder’s tax advisor concerning the overall tax consequences to it, including the consequences under laws other than U.S. federal income tax laws, of an investment in common shares or ADSs.
In this discussion, references to a “U.S. Holder” are to a beneficial owner of a common share or an ADS that is for U.S. federal income tax purposes (1) an individual citizen or resident of the United States, (2) a corporation, or any other entity taxable as a corporation, organized under the laws of the United States, any state thereof or the District of Columbia, (3) an estate whose income is subject to U.S. federal income tax regardless of its source, or (4) a trust if (i) a United States court can exercise primary supervision over the trust’s administration and one or more United States persons are authorized to control all substantial decisions of the trust or (ii) it has in effect a valid election under applicable U.S. Treasury regulations to be treated as a U.S. person.
For U.S. federal income tax purposes, holders of ADSs generally will generally be treated as owners of the common shares represented by such ADSs.
This discussion does not address any aspect of U.S. federal taxation other than U.S. federal income taxation (such as the estate and gift tax or the Medicare tax on net investment income). Holders of common shares or ADSs should consult their own tax advisor regarding the U.S. federal, state and local and other tax consequences of owning and disposing of common shares and ADSs in their particular circumstances.
| 134 |
Distributions on Common Shares or ADSs
A distribution to U.S. Holders made by us of cash or property with respect to common shares or ADSs generally will be treated as a dividend for U.S. federal income tax purposes to the extent paid out of our current or accumulated earnings and profits (as determined under U.S. federal income tax principles). Distributions in excess of our current or accumulated earnings and profits, as determined for U.S. federal income tax purposes, will be treated first as a tax-free return of capital reducing such U.S. Holder’s adjusted tax basis in the common shares or ADSs. Any distribution in excess of such adjusted tax basis will be treated as capital gain and will be either long-term or short-term capital gain depending upon whether the U.S. Holder held the common shares or ADSs for more than one year. Distributions of additional common shares or ADSs to U.S. Holders that are part of a pro rata distribution to all of our shareholders generally will not be subject to U.S. federal income tax. We do not maintain calculations of our earnings and profits under U.S. federal income tax principles, and, therefore, except as described in the previous sentence, U.S. Holders should expect that any distributions generally will be reported as dividends for U.S. federal income tax purposes. As used below, the term “dividend” means a distribution that constitutes a dividend for U.S. federal income tax purposes.
The amount of any distribution will include the amount of any Colombian tax withheld on the amount distributed, and the amount of a distribution paid in Colombian Pesos will be measured by reference to the exchange rate for converting Colombian Pesos into U.S. dollars in effect on the date the distribution is received by the Depositary (or by a U.S. Holder in the case of a holder of common shares) regardless of whether the payment is in fact converted into U.S. dollars. If the Depositary (or U.S. Holder in the case of a holder of common shares) does not convert such Colombian Pesos into U.S. dollars on the date it receives them, generally, any gain or loss resulting from currency exchange fluctuations during the period from the date the dividend payment is included in income to the date the payment is converted into U.S. dollars will be treated as ordinary income or loss and will not be eligible for the special tax rate applicable to qualified dividend income (as discussed below). The gain or loss generally will be income or loss from sources within the United States for foreign tax credit limitation purposes. Dividends paid by us will not be eligible for the dividends received deduction allowed to corporations under the Code.
If you are a non-corporate U.S. Holder, dividends that constitute qualified dividend income will be taxable to you at the preferential rates applicable to long-term capital gains, provided that you meet certain holding requirements. Dividends paid on the ADSs will be treated as qualified dividend income if (1) the ADSs are readily tradable on an established securities market in the United States and (2) we were not, in the year prior to the year in which the dividend was paid, and are not, in the year in which the dividend is paid, a passive foreign investment company (PFIC). The ADSs are listed on the New York Stock Exchange, and will qualify as readily tradable on an established securities market in the United States, soas long as they are so listed. Based on our audited financial statements and relevant market and shareholder data, we believe that we were not treated as a PFIC for U.S. federal income tax purposes with respect to our 20162018 taxable year. In addition, based on our audited financial statements and our current expectations regarding the value and nature of our assets, the sources and nature of our income, and relevant market and shareholder data, we do not anticipate becoming a PFIC for the 20172019 taxable year. However, this conclusion is a factual determination that is made annually and thus may be subject to change. Based on existing guidance, it is not clear whether dividends received with respect to the common shares will be treated as qualified dividends. In addition, the U.S. Treasury has announced its intention to promulgate rules pursuant to which holders of ADSs or common shares and intermediaries through whom such securities are held will be permitted to rely on certifications from issuers to treat dividends as qualified for tax reporting purposes. Because such procedures have not yet been issued, it is not clear whether we will be able to comply with them. Holders of ADSs and common shares should consult their own tax advisers regarding the availability of the reduced dividend tax rate in the light of the considerations discussed above and their own particular circumstances.
A U.S. Holder will be entitled, subject to a number of complex limitations and conditions, to claim a U.S. foreign tax credit in respect of any Colombian income taxes withheld on dividends received on common shares or ADSs. U.S. Holders who do not elect to claim a credit for any foreign income taxes paid during the taxable year may instead claim a deduction in respect of such Colombian income taxes, provided the U.S. Holder elects to deduct (rather than credit) all foreign income taxes for that year. Dividends received with respect to the common shares or ADSs will be treated as foreign source income, subject to various classifications and other limitations. For the purposes of the U.S. foreign tax credit limitations, the dividends paid with respect to our common shares or ADSs generally will generally constitute “passive category income” for most U.S. Holders. The rules relating to computing foreign tax credits or deducting foreign income taxes are extremely complex, and U.S. Holders are urged to consult their own independent tax advisers regarding the availability of foreign tax credits with respect to any Colombian income taxes withheld.
| 135 |
Sale, Exchange or Other Taxable Dispositions of Common Shares or ADSs
A U.S. Holder generally will recognize capital gain or loss upon the sale, exchange or other taxable disposition of common shares or ADSs in an amount equal to the difference between the U.S. dollar value of the amount realized on the sale, exchange or other taxable disposition of the common shares or ADSs and the U.S. Holder’s adjusted tax basis, determined in U.S. dollars, in the common shares or ADSs. Any gain or loss will be long-term capital gain or loss if the common shares or ADSs have been held for more than one year. Certain non-corporate U.S. Holders (including individuals) may be eligible for preferential rates of U.S. federal income tax in respect of long-term capital gains. The deductibility of capital losses is subject to limitations under the Code.
If you are a U.S. Holder of common shares or ADSs, the initial tax basis of your common shares or ADSs will be the U.S. dollar value of the Colombian Peso-denominated purchase price determined on the date of purchase. If the common shares or ADSs are treated as traded on an “established securities market,” a cash basis U.S. Holder, or, if it elects, an accrual basis U.S. Holder, will determine the dollar value of the cost of such common shares or ADSs by translating the amount paid at the spot rate of exchange on the settlement date of the purchase. Such an election by an accrual basis U.S. Holder must be applied consistently from year to year and cannot be revoked without the consent of the Internal Revenue Service (“IRS”). If you convert U.S. dollars to Colombian Pesos and immediately use that currency to purchase common shares or ADSs, such conversion generally will not result in taxable gain or loss to you.
With respect to the sale or exchange of common shares or ADSs, the amount realized generally will be the U.S. dollar value of the payment received determined on (1) the date of receipt of payment in the case of a cash basis U.S. Holder and (2) the date of disposition in the case of an accrual basis U.S. Holder. If the common shares or ADSs are treated as traded on an “established securities market,” a cash basis taxpayer, or, if it elects, an accrual basis taxpayer, will determine the U.S. dollar value of the amount realized by translating the amount received at the spot rate of exchange on the settlement date of the sale.
Deposits and withdrawals of common shares in exchange for ADSs, and of ADSs for common shares, generally will not result in the realization of gain or loss for U.S. federal income tax purposes.
Backup Withholding and Information Reporting
In general, dividends on common shares or ADSs, and payments of the proceeds of a sale, exchange or other taxable disposition of common shares or ADSs, paid within the United States, by a U.S. payor through certain U.S.-related financial intermediaries to a U.S. Holder are subject to information reporting and may be subject to backup withholding at a current rate of 28%24%, unless the holder (1) establishes that it is a corporation or other exempt recipient or (2) with respect to backup withholding, provides an accurate taxpayer identification number and certifies that it is a U.S. person and that no loss of exemption from backup withholding has occurred.
Backup withholding is not an additional tax. The amount of any backup withholding tax from a payment to a U.S. Holder will be allowed as a credit against the U.S. Holder’s U.S. federal income tax liability, provided that the required information is timely furnished to the IRS. A U.S. Holder generally may obtain a refund of any amounts withheld under the backup withholding rules that exceed its U.S. federal income tax liability by timely filing a refund claim with the IRS.
U.S. Tax Considerations for Non-U.S. Holders
A holder or beneficial owner of common shares or ADSs that is not a U.S. Holder for U.S. federal income tax purposes (a “non-U.S. Holder”) generally will not be subject to U.S. federal income or withholding tax on dividends received on common shares or ADSs, unless the dividends are “effectively connected” with the non-U.S. Holder’s conduct of a trade or business within the United States. In such a case, a non-U.S. Holder generally will be taxed in the same manner as a U.S. Holder. In the case of “effectively connected” dividends received by a corporate non-U.S. Holder, the corporate non-U.S. Holder may, under certain circumstances, be subject to an additional “branch profits tax” at a 30% rate.
| 136 |
A non-U.S. Holder of common shares or ADSs will not be subject to U.S. federal income or withholding tax on gain realized on the sale of common shares or ADSs, unless (i) the gain is “effectively connected” with the non-U.S. Holder’s conduct of a trade or business in the United States or (ii) in the case of gain realized by an individual non-U.S. Holder, the non-U.S. Holder is present in the United States for 183 days or more in the taxable year of the sale and certain other conditions are met. In the case of “effectively connected” gains realized by a corporate non-U.S. Holder, the corporate non-U.S. Holder may, under certain circumstances, be subject to an additional “branch profits tax” at a 30% rate.
Although non-U.S. Holders generally are exempt from backup withholding and information reporting requirements, a non-U.S. Holder may be required to comply with certification and identification procedures in order to establish its exemption from information reporting and backup withholding.
| 6.6 | Exchange Controls and Limitations |
Payments in foreign currency with respect to certain foreign exchange transactions including international investments between Colombian residents and non-Colombian residents must be conducted through the foreign exchange market. Therefore, any foreign currency income or expense under the ADRs must be completed through the appropriate channels of the foreign exchange market. Transactions conducted through the foreign exchange market are made at market rates freely negotiated with authorized foreign exchange intermediaries (local banks, financial corporations, administrators and others). As ofSince September 25, 1999, the Colombian foreign exchange regime is structured under the system of free flotation of the exchange rate, whereby market forces determine the level of exchange rate from time to time.
Foreign portfolio investments must be made through authorized foreign exchange investment management companies. Only brokerage firms, trust companies and investment management companies, subject to the inspection and supervision of the Superintendence of Finance, are allowed to make investments in the local Colombian market on behalf of foreign investors. Such brokerage firms, trust companies and investment management companies also act as the foreign investors’ local representatives for tax and foreign exchange purposes.
Colombian law provides that the Colombian Central Bank may intervene in the foreign exchange market at its own discretion at any time (i.e.(i.e., it may limit the remittance of dividends whenever the international reserves fall below an amount equal to three months of imports). Additionally, from time to time, the Colombian government introduces amendments to the International Investment Statute. Hence, we cannot assure you that the Colombian Central Bank will not intervene in the future imposing restrictions to the free convertibility system currently applicable in Colombia. See the sectionRisk Review—Risk Factors—Risks Related to Colombia’s Political and Regional Environment.
Registration of Foreign Investment Represented in Underlying Shares
Colombia’s International Investment Statute and the regulations issued by the Colombian Central Bank, which have been amended from time to time through related decrees and regulations, govern the manner in which non-Colombian resident entities and individuals can invest in Colombia and participate in the Colombian securities markets. Among other requirements, the International Investment Statute and Colombian Central Bank regulations mandate registration of foreign investment transactions with the Colombian Central Bank and specify procedures to authorize and administer such foreign investment transactions. Additionally, pertinent information related to foreign investment transactions must be updated on a regular basis (yearly or monthly, depending on the type of information).
Under the International Investment Statute and Colombian Central Bank regulations, the failure of a foreign investor to report or register with the Colombian Central Bank foreign exchange transactions relating to investments in Colombia on a timely basis may (i) prevent the investor from obtaining remittance rights, (ii) constitute an exchange control infraction and (iii) result in financial sanctions.
| 137 |
Notwithstanding the regulations described above, foreign investors who acquire ADRs are not required to directly register this investment with Colombian authorities. Holders of ADRs will benefit from the registration to be obtained by the local custodian for our common shares underlying the ADRs in Colombia. Such registration allows the custodian to convert dividends and other distributions with respect to the common shares into foreign currency and remit the proceeds abroad. If investors in ADRs choose to surrender their ADRs and withdraw common shares, they must retain an administrator, who will act as a local representative for the investments, and register their investments in common shares as a portfolio investment through said local representative. The local representative is the brokerage firm, trust company or investment management company that acts on behalf of the holders of the ADRs in Colombia, and the request for registration is made by them.
Colombian residents who acquire ADRs and either receive profits from this investment, surrender their ADRs or liquidate their investment in ADRs must register these operations with the Colombian authorities and comply with applicable regulations through its Colombian brokerage firm.
In obtaining its own foreign investment registration, an investor who surrenders its ADRs and sells common shares may incur expenses and/or suffer delays in the application process. Investors would only be allowed to transfer dividends abroad or transfer funds received as distributions relating to our common shares after their foreign investment registration procedure with the Colombian Central Bank has been completed. In addition, the depositary’sDepositary’s foreign investment registration may also be adversely affected by future legislative changes, but its rights to transfer dividends abroad or profits arising from distributions relating to our common shares must be maintained according to Colombian law and foreign investment treaties entered into by Colombia in force at the time of the registration of the investment, except when Colombia’s international reserves fall below an amount equivalent to three months’ worth of imports. Prospective purchasers of common shares or ADSs should consult their own foreign exchange advisors.
| 6.7 | Exchange Rates |
On May 26, 2017,April 1, 2019, the Representative Market Exchange Rate was COP$2,911.663,174,79 per US$1.00. The Federal Reserve Bank of New York does not report a noon-buying rate for Colombian Pesos. TheSuperintendencia Financiera, or Superintendence of Finance, calculates the Representative Market Exchange Rate based on the weighted averages of the buy and sell foreign exchange rates quoted daily by foreign exchange rate market intermediaries including financial institutions for the purchase and sale of U.S. dollars. The Superintendence of Finance also calculates the Representative Market Exchange Rate for each month for purposes of preparing financial statements and converting amounts in foreign currency to Colombian Pesos.
The following table sets forth the high, low, average and period-end exchange rate for Colombian Peso/U.S. dollar Representative Market Exchange Rate for each of the last five years and for the last six months.
Table 57 – Colombian Peso/U.S. dollar Representative Market Exchange Rate
| Exchange Rates | ||||||||||||||||
| High | Low | Average | Period-End | |||||||||||||
| 2012 | 1,942.70 | 1,754.89 | 1,798.23 | 1,768.23 | ||||||||||||
| 2013 | 1,952.11 | 1,758.45 | 1,868.90 | 1,926.83 | ||||||||||||
| 2014 | 2,446.35 | 1,846.12 | 2,000.68 | 2,392.46 | ||||||||||||
| 2015 | 3,356.00 | 2,360.58 | 2,746.47 | 3,149.47 | ||||||||||||
| 2016 | 3,434.89 | 2,833.78 | 3,053.42 | 3,000.71 | ||||||||||||
| Most recent six months | ||||||||||||||||
| November 2016 | 3,187.97 | 2,984.78 | 3,106.40 | 3,165.09 | ||||||||||||
| December 2016 | 3,085.60 | 2,964.56 | 3,009.53 | 3,000.71 | ||||||||||||
| January 2017 | 3,000.71 | 2,908.53 | 2,944.65 | 2,936.66 | ||||||||||||
| February 2017 | 2,921.90 | 2,851.98 | 2,881.68 | 2,896.27 | ||||||||||||
| March 2017 | 3,004.43 | 2,880.24 | 2,943.49 | 2,880.24 | ||||||||||||
| April 2017 | 2,944.31 | 2,837.90 | 2,872.82 | 2,944.31 | ||||||||||||
| May 2017 (through May 26, 2017) | 2,967.44 | 2,873.22 | 2,929.30 | 2,911.66 | ||||||||||||
Source: Superintendence of Finance for historical data.Banco de la República, or the Colombian Central Bank, for averages.
| 6.8 | Major Shareholders |
Major Shareholders
The following table sets forth the names of our major shareholders, and the number of shares and the percentage of outstanding shares owned by them at March 31, 2017:2019:
Table 5856 – Major Shareholders
| At March 31, 2017 | At March 31, 2019 | |||||||||||||||
| Shareholders | Number of shares | % Ownership | Number of shares | % Ownership | ||||||||||||
| Nation(1) – Ministry of Finance and Public Credit | 36,384,788,817 | 88.49 | 36,384,788,417 | 88.49 | ||||||||||||
| Public float | 4,731,905,873 | 11.51 | 4,731,906,273 | 11.51 | ||||||||||||
| Total | 41,116,694,690 | 100.00 | 41,116,694,690 | 100.00 | ||||||||||||
| (1) | Includes |
All our common shares have identical voting rights.
As of March 31, 2017, 1.8%February 25, 2019, the registration date of our annual general shareholders’ meeting, 2.7% of our common shares were held of record in the form of American Depository Shares. As of March 31, 2017,Shares, we had 4137 registered holders, and as of February 23, 2017 we had 11,97020,749 beneficiaries of common shares, or ADSs representing common shares, in the United States.
| 138 |
Changes in the Capital of the Company
There are no conditions in our bylaws governing changes in our capital stock that are more stringent than those required under Colombian law, with the exception that the Nation must hold a minimum of 80% in any stock issuance undertaken under Law 1118 of our capital stock at all times.2006.
| 6.9 | Enforcement of Civil Liabilities |
We are a Colombian company. Most of our Directors and executive officers and some of the experts named in this annual report reside outside the United States. All or a substantial portion of our assets and the assets of these persons are located outside of the United States. As a result, it may not be possible for you to affect service of process within the United States upon us or these persons who are residents in Colombia or to enforce against us or these persons who are residents in ColombiajudgmentsColombia judgments in U.S. courts obtained in such courts predicated upon the civil liability provisions of the U.S. federal securities laws. Colombian courts will enforce a U.S. judgment predicated on the U.S. securities laws through a procedural system known under Colombian Law as “exequatur.” The Colombian Supreme Court will enforce a foreign judgment, without reconsideration of the merits only if the judgment satisfies the requirements set forth in Articles 605 through 607 of Law 1564 of 2012 (Código General del Proceso) which entered into force on January 1, 2016, pursuant toAcuerdoNo. PSAA15-10392, of October 1, 2015, issued by the Colombian Superior Council of the Judiciary (Consejo Superior de la Judicatura),as follows:
| · | A treaty exists between Colombia and the country where the judgment was granted relating to the recognition and enforcement of foreign judgments or, in the absence of such treaty, there is reciprocity in the recognition of foreign judgments between the courts of the relevant jurisdiction and the courts of Colombia; |
| · | The foreign judgment does not relate to “in rem rights” vested in assets that were located in Colombia at the time the suit was filed; |
| · | The foreign judgment does not contravene or conflict with Colombian laws relating to public order other than those governing judicial procedures; |
| · | The foreign judgment, in accordance with the laws of the country where it was rendered, is final and is not subject to appeal; |
| · | A duly legalized copy of the judgment (together with an official translation into Spanish if the judgment is issued in a foreign language) has been presented to the Supreme Court of Colombia; |
| · | The foreign judgment does not refer to any matter upon which Colombian courts have exclusive jurisdiction; |
| · | No proceeding is pending in Colombia with respect to the same cause of action, and no final judgment has been awarded in any proceeding in Colombia on the same subject matter and between the same parties; |
| · | In the proceeding commenced in the foreign court that issued the judgment, the defendant is served in accordance with the laws of such jurisdiction and in a manner reasonably designated to give the defendant an opportunity to defend against the action; and |
| · | The legal requirements pertaining to the exequatur proceedings have been |
The United States and Colombia do not have a bilateral treaty providing for automatic reciprocal recognition and enforcement of judgments in civil and commercial matters. The Colombian Supreme Court has in the past accepted that reciprocity exists when it has been proven that either a U.S. court has enforced a Colombian judgment or that a U.S. court would enforce a foreign judgment, including a judgment issued by a Colombian court. However, such enforceability decisions are considered by Colombian courts on a case-by-case basis.
| 139 |
Proceedings for enforcement of a money judgment by attachment or execution against any assets or property located in Colombia are within the exclusive jurisdiction of Colombian courts, and such proceedings are conducted in Spanish. All parties affected by a foreign judgment in exequatur proceedings must be summoned to the exequatur proceedings in accordance with the rules that apply to the Colombian courts. In the course of such proceedings, both the plaintiff and the defendant are afforded the opportunity to request that evidence be collected in connection with the requirements listed above. In addition, before the judgment is rendered, each party may file final allegations in support of such party’s position regarding the above-mentionedabovementioned requirements.
Assuming that a foreign judgment complies with the standards set forth in the preceding paragraphs and the absence of any condition referred to above that would render a foreign judgment not subject to recognition under Colombian law, such foreign judgment would be enforceable in Colombia in an enforcement proceeding under the laws of Colombia, provided that the Colombian Supreme Court has previously granted exequatur upon the foreign judgment.
| 7. | Corporate Governance |
Since 2004, Ecopetrol S.A. has voluntarily adopted transparency, governance and control practices to facilitate corporate governance in order to generate confidence among stakeholders and ensure the sustainability of its business.
The corporate governance practices at Ecopetrol S.A.:
| · |
| · |
| · |
| · |
| · |
Updating the Corporate Governance Model
At the beginning of 2018, at the request of the Board of Directors of Ecopetrol, we initiated an update of the corporate governance model of the Ecopetrol Group. The project, which is still underway, aims for a clearer and agile governing framework and decision-making process that underpins the Ecopetrol Group’s strategy.
The project has been led by the Secretary General’s Office of Ecopetrol, in accordance with a best practices benchmark approach and the strategic aspirations of the Ecopetrol Group. The Board of Directors of Ecopetrol, the Executive Team, and the CEO’s of each Ecopetrol Group company have participated in its guidance and design. The updated governance model will come into effect during 2019.
Statement of the Nation as Majority Shareholder
Ecopetrol’s majority shareholder (the Nation, represented by the Ministry of Finance and Public Credit), is unilaterally committed to protect the interests of the minority shareholders in the following topics:
| · | Composition of Board of Directors: including in its list of candidates a Representative for hydrocarbon producing departments operated by Ecopetrol and a Representative for the minority shareholders, who will be chosen by the 10 shareholders with the largest stock participations. |
According to corporate governance practices recommended by the OECD, an organization to which Colombia is in the process of access,has been a member since 2018, the National Government begun to implementimplemented the practice of reducing the participation of Directors with a ministerial level in Ecopetrol’s Board of Directors. Thus,Therefore, in 2017 in the ordinary Shareholders’ Assembly,2018 the National Government nominated onlytwo (2) non-independent Directors and in 2019 will nominate one (1) non-independent Director, withneither of which has a ministerial level and in 2018 no director of ministerial rank will be nominated.rank.
| 140 |
| · | Dividend policy: guaranteeing the right of each shareholder to receive his pro rata dividends in accordance with Colombian law. |
| · | Issues not included in the agenda of extraordinary meetings of the General Shareholders Assembly: permitting a vote on those initiatives submitted by one or more shareholders representing at least 2% of the subscribed shares of the company. |
| · | Asset disposal: ensuring that any asset disposal of an amount equal or higher than 15% of the stock exchange capitalization of Ecopetrol is discussed and decided by the General Shareholders’ |
| 7.1 | Bylaws |
The Bylaws of Ecopetrol S.A. are contained in Public Deed No. 5314 of December 14, 2007, issued by the Second Notary of Bogotá; amended by Public Deed No. 560 of May 23, 2011, issued by the Notary Forty- SixForty-Six of Bogotá, Deed No. 666 of May 7, 2013, issued by the Notary Sixty-Five of Bogotá, and Deed No. 1049 of May 19, 2015, issued by the Notary Second of Bogotá, and Deed No. 0685 of May 2, 2018, issued by the Notary Twenty of Bogotá. In addition, the bylaws were recently amended in the ordinary meeting of the General Shareholders Assembly held on March 29, 2019. The text of the amended bylaws is yet to be recorded in public deed and registered before the mercantile registry, which in Colombia is the Chamber of Commerce. An English translation of the amended bylaws is included as Exhibit 1.1 to this annual report.
This summary does not purport to be complete and is qualified by reference to our bylaws, which are filed as an exhibit to this annual report. For a description of the provisions of our bylaws relating to our Board of Directors and its committees, see the sectionsCorporate Governance—Board of Directors—Board Practices and—Corporate Governance—Board of Directors—Board Committees.
General Shareholder’s Meeting of Shareholders
Shareholders’ meetings may be ordinary or extraordinary. Ordinary meetings will take place in our legal domicile located in Bogota,Bogotá, Colombia, within the first three months following the end of each fiscal year, on the day and at the time set forth in the notice for the general shareholders’ meeting.General Shareholders Assembly. The call for the general shareholders’ meetingGeneral Shareholders Assembly is published on the Ecopetrol S.A. website and in a newspaper of wide circulation 30 calendar days prior to the date on which the meeting will take place and on the Sunday previous to the meeting, must be published at Ecopetrol S.A.’s website www.ecopetrol.com.co. The call for the general shareholders’ meeting is also sent electronically to shareholders.
In the ordinary general shareholders’ meeting,General Shareholders Assembly, our Board of Directors and the external auditor are appointed and our annual financial statements, profit distribution, audit and management reports, including our corporate governance report and sustainability report, and any other matter provided under applicable law or our corporate bylaws are approved.
Extraordinary meetings of shareholders may be called by our Board of Directors, by our president or chief executive officer, by our external auditor, or by shareholders holding at least 5% of the shares outstanding, or when unforeseen or urgent needs of the Company require it. Calls to extraordinary meetings should be made at least 15 calendar days prior to the date of the meeting, with the exception of the case where the Law requires a greater time between the summons and the meeting. Such a call is published on the Ecopetrol S.A. website and in a newspaper of wide circulation. The meeting notice must specify the agenda for the meeting.
The required quorum for both ordinary and extraordinary meetings is a plural number of shareholders representing 50% plus one of the subscribed sharesshareholders entitled to vote and decisions are approved with a majority of the members present. This quorum is exempted in the case of “second-call meetings,” which may take place when a meeting fails to obtain the required quorum and is called within a period between 10 business days and 30 business days from the first date, in which case decisions may be adopted by a majority of the shares present regardless of the number represented.
| 141 |
Decisions made at ordinary and extraordinary shareholders’ meeting must be approved by a plural number of shareholders representing the majority of the shares present. Colombian law requires supermajorities in the following cases:
| · | The vote of at least 70% of the shares present and entitled to vote at the ordinary shareholders’ meeting is required to approve the issuance of stock not subject to preemptive rights; |
| · | The vote of at least 78% of the shares represented entitled to vote is required to approve the distribution of the annual net profits. In the absence of this special majority, at least 50% of the net profits must be distributed. If the sum of all legal reserves (statutory, legal and optional) exceeds the amount of the outstanding capital, the Company must distribute at least 70% of the annual net profits; |
| · | The vote of at least 80% of the shares represented is required to approve the payment of dividends in shares; and |
| · | The vote of 100% of the outstanding and issued shares is required to replace a vacancy on the Board of Directors without applying the electoral quotient system. |
Shareholders may be represented by proxies, provided that the proxy: (1) is in writing (faxes and electronic documents are valid), (2) specifies the name of the representative, (3) specifies the date or time of the meeting for which the proxy is given and (4) includes other information specified by the applicable law. Proxies granted abroad do not require legalization or an apostille.
During our ordinary annual shareholders’ meeting, our employees and Directors are only allowed to represent their own shares, unless they act as legal representatives.
Preference Rights and Restrictions Attaching to Our Shares
We have only one class of stock without special rights or restrictions (ordinary shares). Our shareholders do not have any type of preemptive rights.
Under Commercial Colombian law, our shareholders have the following economic privileges and voting rights:
| · |
| · |
| · |
| · |
| · |
| · |
Our bylaws and corporate governance code provide additional rights to our minority shareholders. These rights include:
| · | Sale of Assets. For a ten-year period counted from the date of subscription of the declaration of the Nation dated |
| 142 |
| · | Candidate List. Pursuant to our bylaws and Law 1118 of 2006, the Nation will include in its candidate list for election of members of the Board of Directors one member selected by the departments that produce hydrocarbons. In addition, pursuant to the declaration of the Nation dated |
| · | Extraordinary Meetings. Our bylaws |
| · | Investor Attention Office. Ecopetrol has an investor attention office, a specialized unit responsible for receiving complaints from our shareholders. Pursuant to our bylaws, shareholders holding at least 5% of the total number of shares outstanding may request that the investor attention office conduct a special audit, provided that such audit does not hinder the day-to-day operations of the Company, of the following documents: the income statement; the proposal for the distribution of profits; the report of the Board of Directors as to the economic and financial status of our Company; the report from our general counsel as to the legal status of our Company; and the report from the independent auditors. Special audits cannot be made of documents that contain scientific, technological or statistical information of our Company, or agreement that gives us competitive and economic advantages over our competitors, or in respect of any document related to intellectual property. Shareholders also have the right to propose good corporate governance recommendations to the office for the protection of investors. |
| · | Others. Pursuant to our bylaws, shareholders holding at least 5% of the total number of shares outstanding may propose recommendations to our Board of Directors pertaining to the management of our Company. Any shareholder may file a written petition to our Board of Directors to investigate corporate governance violations that the shareholder believes to have been committed. |
Amendments to Rights and Restrictions to Shares
We have only one class of stock and it has no special rights or restrictions (ordinary shares). Our shareholders do not have any type of preemptive rights. The rights given to our shareholders by law are described in our bylaws and may only be modified through an amendment to the law.
The additional rights given to our minority shareholders in our bylaws and corporate governance code may only be modified through an amendment of those internal documents.
Limitations on the Rights to Hold Securities
There are no limitations in our bylaws or Colombian law on the rights of Colombian residents or foreign investors to own the shares of our Company, or on the right to hold or exercise voting rights with respect to those shares, except in cases of legal representation and except that the Nation must hold a minimum of 80% of our capital stock at all times.
Restrictions on Change of Control Mergers, AcquisitionsSpin-offs or Corporate RestructuringTransformations of the Company
Under Colombian law and our bylaws, the general shareholders’ meetingGeneral Shareholders Assembly has full authority to approve any corporate restructuring, including any mergers, acquisitionsspin-offs or spin-offs.transformations, subject to compliance of applicable law. Corporate restructurings are also subject to the requirement that the Nation must hold a minimum of 80% of our common stock at all times. So long asin any issuance of stock pursuant to Law 1118 of 2006 is in effect, there cannot be any restructuring that result in a change of control of our Company.2006.
| 143 |
Ownership Threshold Requiring Public Disclosure
The Corporate Governance Code, Title III, Chapter 1, Section 5, states: Identification of Major Shareholders. The shareholding composition of the Company, indicating at least the twenty (20) people with the greatest number of shares, is disclosed on Ecopetrol’s website atwww.ecopetrol.com.co. Colombian securities regulations set forth the obligation to disclose any material event orhecho relevante. Any transfer of shares equal or greater than 5% of our capital stock, or any legal entity or individual acquiring a percentage of shares that would make him the beneficial owner of 5% or more of our capital stock, is a material event, and therefore, must be disclosed to the Superintendence of Finance. The regulation includes other criteria in order to identify when to report a material event other than the situations described in the previous sentence.
External Auditor
Pursuant to our bylaws, ourthe external auditor shall notwill be appointed for more than five consecutive one-year terms by us. However, an external auditorperiods of two (2) years and may be reelected consecutively for two (2) periods, and it may once again be hired again after two terms have passed sinceone (1) period away from the conclusion of its last term of appointment.position. At the ordinary general shareholders’ meetingGeneral Shareholders Assembly on March 31, 2017,29, 2019, the shareholders appointed Ernst & Young as external auditor of Ecopetrol for the fiscal year 2017.2019.
| 7.2 | Code of Ethics and Conduct |
We have adopted arecently updated our code of ethics and conduct, which complies with applicable U.S.considers, as ethical principles of the organization, the integrity, responsibility, respect and Colombian law.commitment to life. Our code of ethics and conduct also states that we must comply with the provisions contained in the applicable national and international laws in the countries where we have operations, including the U.S. and Colombia.
In our code, we define the guidelines for the following aspects: conflict of interest; ethical conflict; prohibition of bribery and violations of the FCPA; Integrity in accounting; prevention of money laundering and financing of terrorism; gifts, amenities and hospitalities; protection and use of resources; information management and security; social responsibility and respect for human rights; whistleblowing channel; and examples of ethical behaviors.
Our code of ethics and conduct applies to our Board of Directors, our Chief Executive Officer, our Chief Financial Officer, principal accounting officer, persons performing similar functions and in general to all of the other employees of the company and its affiliates.
All of our agreements with suppliers or third parties include a provision relating to compliance with applicable anti-bribery and anti-corruption regulations. These agreements also require our suppliers and third parties to accept our Code of Ethics and Conduct and our compliance manuals.
Our code of ethics is available on our website at http:at:https://www.ecopetrol.com.co/especiales/codigoEtica_/index.html.
If we amend the provisions of our code of ethics or if we grant any waiver of such provisions, we will disclose such amendment or waiver on our website at the same address.wps/portal/web_es/ecopetrol-web/corporate-responsibility/ethics-and-compliance/code-of-ethics
| 7.3 | Board of Directors |
The current Board of Directors, elected at the General Shareholders Ordinary Meeting held on March 23, 2018, will serve until the new members of the Board, elected on March 29, 2019 have been duly registered before the mercantile registry, which in Colombia is the Chamber of Commerce, on April 10, 2019.
The current Board of Directors is composed as follows:
Non-independent members:
| · | Director of State Shareholdings from the Ministry of Finance and Public Credit, Currently Camilo Barco |
| · | Claudia González |
Independent members:
| · | Mauricio Cabrera Galvis |
| · | Jaime Ardila Gómez (as financial-accounting expert) |
| 144 |
| · | Carlos Cure Cure |
| · | Joaquín Moreno Uribe |
| · | Jorge Londoño Saldarriaga |
| · | Hernando Ramírez Plazas (postulated by the oil producing departments in which Ecopetrol operates) |
| · | Carlos Gustavo Cano Sanz (postulated by ten (10) minority shareholders with major shareholding) |
The business experience of each of the Directors named above can be found in our annual report on form 20-F for the year ended December 31, 2017, available at:https://www.sec.gov/Archives/edgar/data/1444406/000114420418021353/0001144204-18-021353-index.htm.
The information below sets forth the names and business experience of each of our currentthe Directors elected at the shareholders’ ordinary meetingGeneral Shareholders Ordinary Meeting held on March 31, 201729, 2019 for terms of one yeara two-year term beginning on that date, as of the date hereof:April 10, 2019:
MinisterGermán Eduardo Quintero Rojas (43) has served as Managing Director of Fogafin, President of the National Hydrocarbons Agency, General Secretary and Advisor to the Ministry of Trade, Industry and Tourism, and General Secretary of the Ministry of Mines and Energy. He has been an advisor to the General Secretary of the Office of the President of the Republic of Colombia, General Secretary of the Ministry of Internal Affairs, General Director and General Secretary of Acción Fiduciaria S.A., and Head of the Legal Office of the Ministry of Finance and Public Credit, Mauricio Cárdenas SantamaríCredit. Mr. Quintero is a (54)is the Minister of Finance and Public Credit since September, 2012. He was the Minister of Mines and Energy of Colombialawyer from September 26, 2011 to September 3, 2012. He has served as Senior Fellow and Director at the Latin America Initiative of the Brookings InstitutionSergio Arboleda University, with studies in Washington D.C. Previously, Mr. Cárdenas served as Executive Director of Fundación para la Educación Superior y el Desarrollo (FEDESARROLLO), CEO of Empresa de Energía Eléctrica de Bogotá, Minister of Economic Development, Minister of Transport, and Director of the National Planning Agency of Colombia. Mr. Cárdenas holds a B.A. and master degree in economics from the University AndesAdministrative Law and a Ph.D.degree from Javeriana Pontifical University. He also carried out studies in economicsa Doctorate in Administrative Law from theSan Pablo CEU University of Berkeley, California. In 2001, Mr. CárdenasMadrid, from where he was a visiting scholar at Harvard University’s Center for International Development. Mr. Cárdenas has also served asdoctorate candidate. To date, he is a member of the board of directors of various organizations, including the Latin Americanat Fiduciaria La Previsora S.A., Central de Inversiones S.A. and Caribbean Economic Association (LACEA), University Andes and the Colombia Stock Exchange (BVC). Currently he is a Director of Banco de la República.Gecelca S.A. E.S.P. Mr. CárdenasQuintero has served as a Directornon-independent member of Ecopetrol´sEcopetrol’s Board of Directors since March 27, 2008.29, 2019. Currently, Mr. CárdenasQuintero is a non-independent Directormember of Ecopetrol´s Board.Ecopetrol’s Board of Directors as the General Secretary of the Ministry of Finance and Public Credit.
Mauricio Cabera Galvis (65)Orlando Ayala Lozano (62) has 40 years of experience in the global technology industry, 25 years of which he spent working for Microsoft in Seattle, Washington, where he served in a number of managerial positions, including Vice President for the Intercontinental Region, covering all countries of the southern hemisphere region, Executive World Vice President for Sales, Marketing and Support, and World President for Emerging Markets. Before joining Microsoft, he worked for NCR Corp., where he held the position of Sales Director for NCR Mexico and Senior Product Manager in Dayton, Ohio. His studies include the Information Systems Administration program at Jorge Tadeo Lozano University in Bogotá in 1981, with a Doctorate Honoris Causa granted by the same university in 1998, where he is member of the Management Board. Mr. Ayala was honored by the Antioquia newspaper El Colombiano with its 18th annual “Exemplary Colombian Citizen Living Abroad” award in 2013. Mr. Ayala is currently an independent director of the Executive Council of Centene Corp. (CNC). Currently, Mr. Ayala serves as an independent member of Ecopetrol’s Board of Directors and also serves as an international consultant and speaker on matters of leadership and technology trends.
Luis Guillermo Echeverri Vélez (61) has over 20 years of experience in the development, marketing, promotion and conducting of international business, imports and exports, the formulation and implementation of public and corporate policies, the development and implementation of conventional projects and information technology ventures, strategic planning, the financing of public and private projects and raising cooperation funds. He served as Executive Director of the Inter-American Development Bank, the Inter-American Investment Corporation and the Multilateral Investment Fund on behalf of the governments of Colombia, Peru and Ecuador. He was CEO of Trade Winds Network Inc., a company he also founded, and was Director and Founder of Amarilas.com. He served as Commercial Attaché in Colombia’s diplomatic mission to the US and as Director of Proexport’s Miami Regional Office. Mr. Echeverri is an attorney who graduated from the firm Cabrera & Bedoya Investment Bankers.Bolivarian Pontifical University of Medellín, and earned a Master’s degree in Agricultural Economics from Cornell University, New York. Mr. Echeverri is an advisor in international businesses and has successfully led business initiatives and processes involving change, and methodological and technological innovation and implementation in companies of various sizes and large organizations. He is currently a member of the Boards of Directors of the Chamber of Commerce of Bogota, Telefonica, Pragma, Colmedica and Aliansalud. Currently, Mr. Echeverri is an independent member of Ecopetrol’s Board of Directors.
| 145 |
Juan Emilio Posada Echeverri (60) has been Presidenta director of the FES Foundationcompanies Puerto Brisa S.A., Grupo Fast S.A. and Banco de Occidente.Fast Colombia S.A.S. – VivaAir (formerly VivaColombia); Founder and CEO of Stratis Ltda. and Corporate Director-in-Chief of Synergy Aerospace. He has served as DirectorChairman of INCORBANK S.A.Avianca, Alianza Summa (Avianca-Aces-Sam) and Aces S.A and is currently serving as Public Credit Director inExecutive Chairman of the Finance and Public Credit MinistryBoard of Colombia. He has been Technical ViceDirectors of Táximo Ltd., President of the Banking AssociationBoard of Colombia and HeadDirectors of Direktio S.A.S., member of the Global Programming UnitBoard of the National Planning Department. He was DeanDirectors of the FacultyGrupo Odinsa S.A. (infrastructure multi-latina affiliate of EconomicsGrupo Argos), of the Universidad ExternadoSociedad Hotelera Tequendama S.A. (7 hotels in Colombia) and Computec Outsourcing de Colombia and an economist in the Western Hemisphere Department of the International Monetary Fund.Documentos S.A. He holds a degree in PhilosophyBusiness Administration from the Universidad JaverianaEAFIT University in Medellín, with an MBA from Pace University in New York and holds a Master’s Degreedegree in EconomicsInternational Financial Law from Universidad de los Andes. He attended the Ph.D. program at the London School of Economics. He is also a Directormember of Industrias de Licoresthe Advisory Councils of Grupo Empresarial del Valle, Clínica DIME, ASTORGA and Fabricato. Mr. Cabrera has served as a Director of Ecopetrol’s Board since March 31, 2017. Currently Mr. Cabrera is an independent Director of Ecopetrol´s Board.
Yesid Reyes Alvarado (58)has been a professor at the Universities Externado, Libre, Santo Tomás, Autónoma of Madrid and Los Andes. He has acted as Associate Judge in the Tribunal Superior de BogotáSector Defensa (GESED), Consejo SuperiorDisán S.A., C.I. Flores de la Judicatura, Supreme CourtCampiña (producer and Constitutional Court. He has also been a columnist for the newspaper El Espectador. He served as Ministerexporter of Justicefresh flowers), of YPO Gold Colombia (global network of CEO’s) and LawNT3 (developers of Colombia during august 2014 to April 2016.real estate projects). He is currently DirectorPresident of the Center for Research in Philosophy and Law at the University Externado. Mr. Reyes holds a degree in law and a specialization and Master in Criminal, Criminological and Criminalistics Sciences in the same university. He holds a PhD in Law from the University AutónomaBoard of Madrid and had a research fellowship in Alexander von Humboldt Stiftug at the UniversityDirectors of Bonn (Germany). Mr. Reyes has served as a Director of Ecopetrol’s Board since September 14, 2016. Currently Mr. Reyes is an independent Director of Ecopetrol’s Board.
Ana Milena López Rocha (36) serves as the Director of Public Credit and National Treasury at the Colombian Ministry of Finance since April 2015. She was a Partner at asset manager Newfoundland Capital Management and an external advisor to Fiduciaria Alianza and Alianza Valores. She held leadership positions at Sociedades Bolivar S.A. and J.P. Morgan Chase Bank. Ms. López holds a B.A. in Economics from Harvard University and a Master´s Degree in Business from Columbia Business School. She isFundación Plan, a member of the Board of Directors of Interconexión Eléctrica S.A. E.S.P. - (ISA)Plan International Brazil, a member of the Nominations and Financiera de Desarrollo Nacional. Ms. López has servedGovernment Committee of the global assembly for Plan International Inc. and is a part of the International Advisory Board of Polimath Ventures. Currently, Mr. Posada serves as a Directoran independent member of Ecopetrol’s Board since September 14, 2016. Currently Ms. López is a non-independent Director of Ecopetrol´s Board.Directors.
Jaime Ardila Gómez (61)Sergio Restrepo Isaza (57)was president of General Motors for South America and has held various positions within General Motors. Among these, he actedserved in the Bancolombia Group as Vice President for BrazilCapital Markets and Mercosur; CFOExecutive Vice President for Latin America, AfricaCorporate Development. He initiated his professional career at Corporación Financiera Corfinsura, where he held the positions of Company President, Vice President for Investment Banking and the Middle East; CEOVice President for Investments and Managing Director in Argentina; CEO and Managing Director in COLMOTORES, CEO and Managing Director in Ecuador; Omnibus BB, CFO in Chile; and Treasurer in Mexico, among others.International. He also served as Managing Director in Colombian Operations for N.M Rothschild and Sons and Secretary General of the Ministry of Industry and Trade in Colombia. Mr. Ardila holds several boards including Cementos Argos, Compañía B.A. in economics from the University of Bogota Jorge Tadeo Lozano and a master degree in economics from the London School of Economics. He is a member of the Board of Directors of Goldman Sachs BDC, Accenture, Council of the Americas and the Chamber of Commerce of Brazil. Mr. Ardila has served as a Director of Ecopetrol’s Board since March 31, 2016. Currently Mr. Ardila is an independent Director of Ecopetrol´s Board.
Carlos Alfredo Cure Cure (72)was Ambassador ofNacional de Chocolates, Conavi, Asobancaria, Bolsa de Valores de Colombia, to Venezuela. He was CEO of BavariaConglomerado Financiero Internacional Banagrícola S.A., Suramericana Asset Management SUAM and several others in the largest brewery in Colombia. He also served as an advisor to the Board of the Olympic Group S.A. and member of the Board of Avianca S.A. (Colombia’s national airline).He acted as deputy financial manager of Cementos del Caribe, CEO of Cementos Toluviejo and CEO of Astilleros Unión Industrial.community sector. Mr. Cure holdsRestrepo graduated with a degree in Civil EngineeringBusiness Administration from the NationalEAFIT University of Medellin. Mr. Cure has served asMedellín, with a Director of Ecopetrol´s Board since September 5, 2015. Currently Mr. Cure is an independent Director of Ecopetrol´s Board.
Joaquín Moreno Uribe (68)earned amaster’s degree in civil engineeringBusiness Administration from Universidad IndustrialStanford University in California. He is currently a partner at Exponencial Banca de SantanderInversión S.A.S., a member and completed a The Advanced Management Program (AMP) at The Harvard University Business School. Mr. Moreno worked initially as Director for Constructions and Engineering of Urbanas, in Bucaramanga, Colombia. He then joined the Royal Dutch/Shell Group of companies for more than 33 years. His career with Shell included various positions at technical, managerial and leadership levels, in different sectorschairman of the Oil & Gas Industries (Upstream and Downstream), Chemicals, Metals and Coal. He worked in different countries in America and Europe, including several appointments at regional, global and corporate levels at the Headquartersboards of directors of the RDSBIOS SAS Group in London and The Hague. Mr. Moreno has also served as Country Chairman and President for Shell in Mexico,Duratex S.A. Colombia, and Venezuela, as well as Regional CEO for the Northern Latin American Region. On his return to Colombia, he was appointed by the Presidency of the Country, as High Presidential Commissioner –Ad Honorem- in charge of coordinating the reconstruction of the areas affected by the heavy rain season and floods of early 2005, in the Region of Santander and Northern Santander. Mr. Moreno has been a member of the boards of directors of various localOdinsa S.A., Consorcio Financiero and international companies, as well as educational and leadership institutions and initiatives. Mr. Moreno has served as a Director of Ecopetrol´s Board since March 27, 2008.Coquecol. Currently, Mr. Moreno isRestrepo serves as an independent Directormember of Ecopetrol´s Board.Ecopetrol’s Board of Directors.
Horacio Ferreira Rueda (47)Santiago Perdomo Maldonado (61) is an executive leader with more than 20has over 30 years of internationalsenior management experience in the oil industry. His knowledge and expertise stem from positionsColombian banking industry, including as CEO and President of an oilfield services company in Houston, TX to application of state of art technologies in the oil industry.Banco Colpatria, Scotiabank Group. He has ledbeen a member of various boards of directors at Colombian and executed numerous reservoir engineeringLatin American companies in a range of economic sectors, such as finance and mining and agriculture, including Bladex, Deceval, CESA, the Asociación Nacional de Empresarios de Colombia (ANDI), and the Asociación Nacional de Instituciones Financieras (ANIF), and he was a founding member of the Colombian Institute of Corporate Governance. Mr. Perdomo holds a degree in Business Administration from the CESA School of Advanced Studies in Administration. He is currently Executive Director of the Colpatria Group and a member of the Boards of Directors of Scotiabank Perú, Colfondos and Mineros S.A. Currently, Mr. Perdomo serves as an independent member of Ecopetrol’s Board of Directors.
Esteban Piedrahita Uribe (47) previously served as General Director of the National Planning Department, advisor for the President, Senior Specialist for the Inter-American Development Bank and as an economics editor of the magazine Semana, among other positions. He has served on the boards of directors of Banco Agrario, Metrocali, Amalfi S.A. Carvajal Educación and Alianza Valores. Mr. Piedrahita graduated with a degree in Economics from Harvard University and earned a master’s degree in Philosophy and the History of Science from the London School of Economics and Political Science. Mr. Piedrahita currently serves as President of the Chamber of Commerce of Cali. He is currently a member of the Boards of Directors of Cementos Argos and Centro de Eventos Valle del Pacífico, as well as a member of the Executive Council of Fedesarrollo. Currently, Mr. Piedrahita serves as an independent member of Ecopetrol’s Board of Directors.
Hernando Ramírez Plazas (65) has held positions at Universidad Surcolombiana as Dean of the Faculty of Engineering, Academic Vice-Principal, Principal, and Professor. He has worked at the National Institute of Health and at the Ministry of Health. He had a role as an external evaluator for Colciencias in technology development and innovation projects in the Americas, Europe, Africa, Middle Eastarea of natural gas. Additionally, he has acted as a trainer in gas issues for production personnel at Canacol Energy Inc., and Far Easthe currently provides professional services to Comfamiliar Huila. Mr. Ramirez is a chemical engineer who graduated from Universidad Nacional de Colombia, with a master’s degree in Public Health from the same university, and has conducted researcha specialization in optimization of multiphase meters, underbalanced reservoir engineering, real time reservoir and production analysis, reservoir simulation and waterflood techniques with horizontal wells. He holds a BS in PetroleumGas Engineering from Universidad América, master and doctoral degrees in Petroleum Engineering from Texas A&M University and a business graduate degree in Management of International Corporations from Texas A&M University.de Zulia (Venezuela). Mr. FerreiraRamírez has served as a Director of Ecopetrol´s Board, nominated by the hydrocarbon producing provinces of Colombia, since January 23, 2014. Currently Mr. Ferreira is an independent Director in Ecopetrol’s Board of Ecopetrol´sDirectors, since March 23, 2018. Currently, Mr. Ramírez serves as an independent member of Ecopetrol’s Board nominated by the hydrocarbon producing provinces of Colombia.Directors.
Carlos Gustavo Cano Sanz (70)(72) currently serves as Professor inhas been President of the Master of Corporate Finance at CESA. He wasColombian Agriculture Association (SAC), Founder and Director of Banco de la República from February 4, 2005 to January 31, 2017.Corporación Colombia Internacional (CCI), President of the Agrarian Fund, and President of the newspaper El Espectador. He was Minister of Agriculture between August 7, 2002 and February 3, 2005.2005 and Co-Director of Banco de la República between February 4, 2005 and January 31, 2017. He served as an external consultant to the Alternative Development and Competitiveness for the Andean Region from 1999 to 2002. He represented Colombia at the Inter-American Institute for Cooperation on Agriculture (IICA) from 1997 to 1999. He acted as President of COMUNICAN S.A. from 1996 to 1997, Caja Agraria from 1995 to 1996 and Sociedad de Agricultores de Colombia (SAC) from 1990 to 1991. He was General Manager of the National Federation of Rice Growers (FEDEARROZ) and the Agroindustrial Complex of Tolima S.A. (CATSA). Mr. Cano is an Economist from the University of LosUniversidad de los Andes in Bogotá with a mastermaster’s degree in Economics from the University of Lancaster England. He hasin England and a postgraduate degree in Government, Business and International Economics from Harvard University in Boston and fromundertook further postgraduate studies at the InstituteInstituto de Alta Dirección Empresarial (INALDE) of Higher Business Management (INALDE)Bogotá. He has served ascurrently teaches in the Master of Corporate Finance program at CESA University and in the Business School at Universidad de los Andes. He is a member of various boardsthe Superior Council of directors, including the ComisióEAFIT University of Medellín, Nacional de Crédito Agropecuario, FINAGRO, Banco Agrario, ICA, CORPOICA, the National Coffee GrowersConsultative Committee among others. He doesn’t serve as a Directorfor Agriculture of joint-stock company.Bancolombia, and the Group on Earth Observations Global Water Sustainability (GEOGLOWS) in the United States. Mr. Cano has served as aan independent Director ofin Ecopetrol’s Board nominated by the minority shareholders with the greatest share participation,of Directors, since March 31, 2017. Currently, Mr. Cano isserves as an independent Directormember of Ecopetrol´sEcopetrol’s Board nominated by the minority shareholders with the greatest share participation.of Directors.
| 7.3.1 | Board Practices |
Our Board of Directors is composed of nine members and is responsible for, among other things, establishing our general business policies. The majority of the Board of Directors must be independent, and must be elected pursuant to the criteria set out in paragraph two, Article 44, Law 964, 2005, and in accordance with the procedure determined in Decree 3923, 2006, or any other provisions that regulate, amend, replace or add such regulations. In addition, pursuant to our bylaws and in accordance with the procedures described therein, our majority shareholder must include, in its list of candidates for the last two seats in the Board of Directors, the name of one individual jointly proposed by departments that produce hydrocarbons and one individual jointly proposed by the ten minority shareholders with the highest equity participation. According to Colombian law, the members of the Board of Directors must be elected by the shareholders’ meetingGeneral Shareholders Assembly in accordance with a proportional representation system similar to cumulative voting (through an electoral quota voting system). The number of votes required to fill each position is calculated by dividing the number of possible votes by the number of open board positions. The members of the Board of Directors may be elected without an electoral quota voting system when there is unanimity. Pursuant to our bylaws, (i) positions on our Board of Directors are elected for a one-year term, and the positions are filled either by person or by position. Members ofposition, (ii) at least three members appointed for a specific period must be nominated for the Board mayfollowing period, and (iii) beginning in 2019, Directors will be reelected indefinitely.elected for a two-year term. Currently, we have one Director appointed by his position: The General Secretary of the MinisterMinistry of Finance and Public Credit. Our current Directors were elected at the ordinary shareholders’ meetingGeneral Shareholders Assembly held on March 31, 2017. Directors29, 2019. Members of the Board may be removed without cause at any moment by a majority of the shareholders present at a general shareholders’ meeting.reelected indefinitely.
Our CEO is appointed by the Board of Directors and haswill have at least two alternates. The CEO is elected for a two-year term, may be reelected indefinitely and freely removed prior to the expiration of his term. In accordance with our bylaws, the Board of Directors must evaluate the annual performance of the CEO, and such results must be published in Ecopetrol’s web page or in an alternative media vehicle.
The compensation of our Directors is set exclusively by the shareholders at the general shareholders’ meeting.General Shareholders Assembly. Directors are compensated for attending board meetings and committee meetings. A Board meeting requires a quorum of at least five members and decisions are approved with a majority of the Directors present. In the practice a consensus decision making operates in the Board.
Under Colombian law, a director or executive officer must abstain from participating in any transaction that may result in a conflict of interest or that involves competitioncompeting with the company, unless authorized at a general shareholders’ meeting.General Shareholders Assembly. The general shareholders may approve or reject the transaction giving rise to the conflict of interest with the vote of the majority of the shares present at the shareholders’ meeting.General Shareholders Assembly. If the director or executive officer who has the conflict is a shareholder, his or her vote must be excluded. We disclose the number of conflicts of interest of our employees, executive officers and Directors in our annual reports.
Neither our bylaws nor our corporate governance code provide a retirement age for our Directors. Under our bylaws, there is no requirement for a person to have a minimum number of shares to be elected as a Director. Colombian law provides that Directors willing to sell or purchase shares in our Company need prior authorization from the entire Board of Directors. Colombian law does not impose any limitation as to the number of shares that may be acquired by a Director.
| 147 |
| 7.3.2 | Board Committees |
Pursuant to our bylaws, our Board of Directors has fourthe ability to constitute the committees it considers necessary. The Board of Directors currently has five committees (audit and risk committee, corporate governance and sustainability committee, compensation and nomination committee, business committee and businessHSE (health, security and environment) committee), which. These committees establish guidelines, set specific actions and evaluate and submit proposals designed to improve performance in the areas under their supervision and control. TheseThe committees are comprised of members of the Board of Directors who are also appointed by the members of the Board of Directors and thesame members. The chairman of each of the committees must be an independent Director. In addition to applicable regulations, the committees also have their own specific regulations that establish their purposes, duties and responsibilities.
Table 6557 – Composition of committees of the Board of Directors as of April 20, 2017March 29, 2019
| Audit and Risk Committee | Compensation and Nomination Committee*** | |||
| Jaime Ardila Gomez * | ||||
Jorge Londoño* | Claudia González | |||
| Joaquin Moreno Uribe* | Carlos Cure Cure | |||
| Hernando Ramírez | Joaquín Moreno Uribe
| |||
| Carlos Gustavo Cano Sanz |
|
| ||
| Business Committee | |||
| Claudia González ** | Joaquín Moreno Uribe**** | |||
| Director General of State Owned Enterprises of the Ministry of Finance and Public Credit
| Director General of State Owned Enterprises of the Ministry of Finance and Public Credit **** | |||
| Carlos Cure Cure** | Jaime Ardila Gómez **** | |||
| Jaime Ardila Gómez ** | Carlos Cure Cure**** | |||
| Mauricio Cabrera Galvis** | Mauricio Cabrera Galvis**** | |||
| Jorge Londoño** | Claudia González **** | |||
| Carlos Gustavo Cano Sanz
| Jorge Londoño**** | |||
| Hernando Ramírez | ||||
| HSE Committee | Carlos Gustavo Cano Sanz | |||
| Carlos Gustavo Cano Sanz | ||||
| Hernando Ramírez | ||||
| Joaquín Moreno Uribe***** | ||||
| Mauricio Cabrera Galvis***** | ||||
| Jaime Ardila Gómez***** |
| * | Not elected to the Board of Directors at the General Shareholders Ordinary Meeting on March 29, 2019. Replacement will be elected to the Audit and Risk Committee after this annual report. |
| ** | Not elected to the Board of Directors at the General Shareholders Ordinary Meeting on March 29, 2019. Replacement will be elected to the Corporate Governance and Sustainability Committee after this annual report. |
| *** | None of the members of this Committee were elected to the Board of Directors at the General Shareholders Ordinary Meeting on March 29, 2019. Replacement will be elected to the Compensation and Nomination Committee after this annual report. |
| **** | Not elected to the Board of Directors at the General Shareholders Ordinary Meeting on March 29, 2019. Replacement will be elected to the Business Committee after this annual report. |
| ***** | Not elected to the Board of Directors at the General Shareholders Ordinary Meeting on March 29, 2019. Replacement will be elected to the HSE Committee after this annual report. |
| 148 |
Audit and Risk Committee
Our audit and risk committee, which must be comprised of at least three members, all of them independent Directors, is our highest internal control body and provides support to our Board of Directors on risk, accounting and financial matters. It is in charge of guaranteeing the design, implementation and supervision of our internal control over financial reporting. It also ratifies the annual hydrocarbons reserves report and provides support for our Board on analyzing topics related to financial matters, risks, control environment and the assessment of the Company’s internal and external auditors.
All committee members are required to be knowledgeable in accounting matters and at least one of them is required to be an expert in financial and accounting matters.
Our Board of Directors has determined that Jaime Ardila Gómez qualifies as an “audit committee financial expert,”expert” and he is independent under the definition of “independent” applicable to us under the rules of the NYSE.
The audit and risk committee approves on a case-by-case basis any engagement of our external independent auditors to provide services different than those related to auditing our financial statements. Occasionally, theThe audit and risk committee will have no doubtreviews that thesethe additional services do not compromiseaffect the external auditor’s independence. When in doubt, the committee will request the opinion of the internal auditor.
Compensation and Nomination Committee
Our compensation and nomination committee, which must be comprised of at least three members, including at least one independent director, provides general guidelines for the selection and compensation of our executive officers and employees.
Corporate Governance and Sustainability Committee
Our corporate governance and sustainability committee, which must be comprised of at least three members, including at least one independent director, makes proposals to our Board of Directors to ensure and supervise the fulfillment of our good corporate governance and sustainability practices in accordance with our corporate governance code.
Business Committee
Our business committee, which must be comprised of at least five members, including at least one independent Director, assists our Board in analyzing potential business ventures. Based on its delegation of power, the committee studies and analyzes capital expenditure policies, major investment projects, strategy, new business and other matters that would help us move forward in our efforts toward the consolidation of our strategy. The primary criteria used in the committee’s decision-making process are the optimization of our portfolio and the proper allocation of our resources.
HSE Committee (Health, Safety and Environment)
Our HSE Committee, which must be comprised of at least three members, the majority of which must be independent, supports the management of the Board of Directors in respect of the monitoring and management of risks associated with the health and safety of our employees, contractors and partners, as well as the performance of the Ecopetrol Group’s environmental management.
| 7.4 | Compliance with NYSE Listing Rules |
The following is a summary of the significant differences between our corporate governance practices and those required for U.S. companies under the NYSE listing standards.
NYSE Standards | Our Corporate Governance Practices | |
Director Independence | ||
| The majority of the board of directors must be independent. §303A.01. “Controlled companies,” which would include Ecopetrol if we were a U.S. issuer, are exempt from this requirement. A controlled company is one in which more than 50% of the voting power is held by an individual, group or another company, rather than the public. §303A.00. | Pursuant to our bylaws, the majority of the Board of Directors must be independent. As of the date of this annual report, we have |
| 149 |
| NYSE Standards | Our Corporate Governance Practices | |
| Executive Sessions | ||
| The non-management directors of each listed company must meet at regularly scheduled executive sessions without management. §303A.03. | A comparable rule does not exist under Colombian law. Except for our audit and risk committee, our Board of Directors does not meet without management. | |
| Nominating/Corporate Governance and Sustainability Committee | ||
| A nominating/corporate governance and sustainability committee composed entirely of independent directors is required. The committee must have a charter specifying the purpose, duties and evaluation procedures of the committee. §303A.04. “Controlled companies” are exempt from these requirements. §303A.00. | Colombian law does not require the establishment of a nominating and a corporate governance and sustainability committee composed entirely of independent directors. Pursuant to our | |
| Compensation Committee | ||
| A compensation committee composed entirely of independent directors is required, which must evaluate and approve executive officer compensation. The committee must have a charter specifying the purpose, duties and evaluation procedures of the committee. §303A.05. “Controlled companies” are exempt from this requirement. §303A.00. | Colombian law does not require the establishment of a compensation committee composed entirely of independent directors. Pursuant to our |
|
| |
Audit and Risk Committee | ||
| An audit committee with a minimum of three independent directors satisfying the independence and other requirements of Rule 10A-3 under the Exchange Act and the more stringent requirements under the NYSE standards is required. §§303A.06 and 303A.07. | According to Law 964 of 2005, Colombian companies that are authorized to issue securities by the Superintendence of Finance must have an audit committee that satisfies the requirements of Law 964 of 2005, including its minimum number of members, independence criteria and audit related duties. Our audit and risk committee is composed entirely of independent Directors, and the committee meets the requirements of Law 964 of 2005 and Rule 10A-3 under the Exchange Act. | |
| Equity Compensation Plans | ||
| Equity compensation plans and all material revisions thereto require shareholder approval, subject to limited exemptions. §§303A.08 and 312.03. | Under Colombian law, no similar right to vote on equity compensation plans and material revisions thereto is given to shareholders. We do not give our shareholders the right to vote on equity compensation plans and material revisions thereto. |
| 150 |
| NYSE Standards | Our Corporate Governance Practices | |
| Corporate Governance Guidelines | ||
| Listed companies must adopt and disclose corporate governance guidelines. §303A.09. | The Superintendence of Finance recommends the adoption of corporate governance guidelines to all Colombian issuers. According to Superintendence of Finance Circular No. 028, 2014, the adoption of corporate governance guidelines is voluntary. Listed companies must annually publish a corporate governance survey comparing their corporate governance standards with those recommended by the Superintendence of Finance. Our corporate governance code and our survey of the adoption of Colombian practices are available on our website athttp://www.ecopetrol.com.co. | |
| Code of Ethics for Directors, Officers and Employees | ||
| Corporate governance guidelines and a code of business conduct and ethics is required, with disclosure of any waiver for directors or executive officers. The code must contain compliance standards and procedures that will facilitate the effective operation of the code. §303A.10. | We have adopted a code of ethics which complies with applicable U.S. and Colombian law. Our code of ethics applies to our chief executive officer, chief financial officer, principal accounting officer, persons performing similar functions and to all of the employees, members of the Board of Directors, suppliers, and contractors of Ecopetrol S.A. and its corporate group. Our code of ethics is available on our website athttp:// |
| 7.5 | Management |
The following presents information concerning our executive officers and senior management. Unless otherwise noted, the majority of these individuals are Colombian citizens.
Executive Officers
Juan Carlos Echeverry (54)Felipe Bayon Pardo (53)has served as the Chief Executive Officer of Ecopetrol Colombia’s National Oil Company, since April 2015. From 2010 to 2012, he was Colombia’s Minister of Finance. During his mandate, four international publications (The Banker, América Economía, Emerging Markets, and Institutional Investor) awarded him as Best Finance Minister of the Americas.September 2017. Prior to his current role,being appointed Chief Executive Officer, Mr. Echeverry represented Colombia in the Board of Directors of the Inter–American Development Bank (Washington D.C.). He alsoBayón served as Dean of Economics at University of the Andes (Bogotá). From 2000 to 2002 he was the Director of Economic Planning of Colombia. In 2002, Mr. Echeverry founded Econcept, a Bogotá based economics and business consultancy, and was partner of Global Source, a New York based consultancy. He is the author of several books about the Colombian economy and co-author of publications focusing on developing economies. Mr. Echeverry received a Ph.D. in Economics from New York University, a graduate studies degree in International Economics from Kiel Institute of the World Economy and B.A. in Economics from the University of the Andes (Bogotá).
Felipe Bayon Pardo (51) has served as the Executive Vice-PresidentChief Operating Officer of Ecopetrol sincefrom February 2016.2016 to September 2017. Mr. Bayon holds a degree in Mechanical Engineering from the Universidad de Los Andes (Bogotá). He has over 2527 years of experience in the oil and gas industry. For more than 20 years, he worked at BP plc, most recently as Senior Vice-President of BP America and Head of Global Deepwater Response. From 2005 to 2010, he was the Regional President of BP Southern Cone (South America), and prior to 2005 he worked in BP’s headquarters as Chief of Staff to the Upstream CEO and Head of the Executive Office for Exploration and Production. He began his career in 1995 in BP Colombia, as a Project Engineer, where he held various positions until becoming Vice-President of Operations in Colombia. Prior to this, he worked for Shell.
MaríAlberto Consuegra Granger (58) has served as Chief Operating Officer of Ecopetrol since March 1, 2019. Prior to being appointed as Chief Operating Officer, he was deputy CEO of Cenit S.A.S., Ecopetrol’s midstream subsidiary, since February 2018 and Vice-President of Supply and Services of Ecopetrol S.A. since August 2016. Mr. Consuegra holds a Fernanda Suárez (42)degree in Civil Engineering from Universidad de Cartagena and a master’s degree in Pavements and Construction Management from Texas A&M University. Before joining Ecopetrol, he was Vice-President of Exploration and Production at Equion Energia Limited, where he also served as the Vice-President for Projects and Production during the 2011 – 2016 period. Mr. Consuegra began his professional career in 1984 by working for Morrison Knudsen International as a contract coordinator during the construction of the Cerrejon project. In 1993 he joined Ecopetrol S.A., working in the Projects Group, and then went to BP Exploration, where he worked for 16 years, first as a contract coordinator, then as procurement and contract manager, then human resource manager for the Andean area, and finally as leader of the Colombian Performance Unit until end of 2010.
| 151 |
Jaime Caballero Uribe (44) has served as the Chief Financial Officer of Ecopetrol since August 2015. Ms. Suárez2018. Mr. Caballero has over 20 years of international experience in the oil and gas sector. He joined the Ecopetrol Group in 2016 and was the Chief Financial Officer for the Downstream Segment prior to his appointment as the Ecopetrol Group CFO. Previously, his experience includes 17 years at BP, where he held leadership positions in North and South America, Africa and Europe, and most recently as Regional CFO for Brazil, Uruguay, Colombia and Venezuela. Mr. Caballero holds a law degree from Universidad de los Andes (Bogotá), an MBA in Energy Business from Fundação Getulio Vargas (Rio de Janeiro) and has completed executive programs in advanced financial management from Duke University and the Wharton School of Business.
Management Team
Jorge Elman Osorio Franco (57) has served as the Development and Production Vice-President of Ecopetrol since March 1, 2019. Prior to his appointment as Development and Production Vice-President, he served as Regional Development and Production Vice-President since June 2017. He holds a degree in Chemical Engineering from the National University of Colombia and has over 30 years of experience in engineering, projects and operations in the oil and gas industry. He spent 24 years of his career at BP, where he served as Operations Manager, Senior Operations Manager in Major Projects, Technical Director and Operations Excellence Director, among other leadership positions including managerial positions in Colombia, Trinidad & Tobago and Indonesia.
Jorge Arturo Calvache Archila (59)has served as Vice-President of Exploration since February 1, 2019. He has more than 30 years of experience. He has served in companies such as Shell and Hocol, where he led exploration projects in the Netherlands, the United States and Colombia. Mr. Calvache holds a degree in Geology from Universidad Nacional, a master’s degree in Geophysics from the same university, and studied Management at Universidad de Los Andes.
Rubén Darío Moreno Rojas (54)has served as Vice-President of Transport Operations and Maintenance since March 1, 2019. Prior to his appointment as Vice-President of Transport Operations and Maintenance, he served as deputy Vice-President of Transport Operations and Maintenance since April 2018. He has a 30-year career at Ecopetrol S.A., where he has held several managerial positions in the Vice-Presidency of Transportation as Operations Manager, Technical Superintendent, Head of Maintenance and Head of Operations. Mr. Moreno holds a degree in Electronic Engineering from Universidad Antonio Nariño and an Executive MBA from Universidad la Sabana.
Rodrigo Andres Dalle Fiore (40)has served as Development Vice-President since March 2019. Prior to his appointment as Development Vice-President, he served as Development General Manager (A), Reservoir Development Strategy Manager (A) and Enhanced Oil Recovery Manager at Ecopetrol. He has over 14 years of international experience in the oil and gas sector. Prior to joining Ecopetrol, he was Operations Manager at Bridas Corp (Colombia) and Productions and Operations Manager at Pan American Energy (Argentina). Mr. Dalle Fiore holds a degree in Chemical Engineering from the National University of Córdoba – Argentina, a specialization in Oil & Gas Reservoirs from the U.N.P.S.J.B. Comodoro Ridavia, Chubut Argentina and a specialization in Gas and Oil Technologies at the Technologic Institute of Buenos Aires (ITBA) - Buenos Aires, Argentina.
Tomas Hernandez (64) has served as Vice-President of Refining and Industrial Processes in Ecopetrol since February 2016. He has over 39 years of multinational experience in the field of oil and gas sector. He has worked as Business Manager at Chevron’s Pascagoula refinery in the United States, General Manager for Marketing Operations for Chevron Texaco in Latin America and Africa-Europe-Pakistan Regions and has spent over 20 years in managerial positions in various refineries at Chevron. Prior to joining Ecopetrol, he was Deputy Upgrader Manager at Petropiar, a non-operated joint venture in which Chevron holds a 30% interest. Mr. Hernandez graduated from the University of Missouri – Rolla (University of Science and Technology Missouri) in 1978 with a Bachelor of Science degree in chemical engineering.
Jurgen Gerardo Loeber Rojas (61)has served as the Projects & Engineering Vice-President of Ecopetrol since May 2016. Mr. Loeber holds a degree in Business Administration from CESA“Universidad del Norte” and a master’s degreespecialization in Policy Management from Georgetown University. Ms. SuárezProject Management. He joined the Army Corps of Engineers as reserve officer and reached the rank of captain. He has 20over 30 years of experience in the publicoil and private sectors. She gas industry. He began his career in 1985 in Exxon as financial analyst. From 1992 to 2001, he worked for BP in various countries as project manager, construction manager and project control engineer. For the last 10 years, he worked at Equion Limited (formerly BP Exploration Colombia) as Project Director. From 2001 to 2006, he was Project Director for Wood Group Colombia.
| 152 |
Pedro Fernando Manrique Gutierrez (54)has held various positionsserved as Commercial and Marketing Vice-President since April 2017. Mr. Manrique holds a bachelor’s degree in these sectors, including DirectorElectrical Engineering from the Universidad Industrial de Santander, Colombia. He has a master’s degree in Industrial and Systems Engineering from the University of Public CreditFlorida and National Treasury at Ministryan MBA from the IE Business School in Madrid, Spain. Mr. Manrique has 27 years of Finance and Public Creditexperience in the Treasury Department, Investment Chief Officeroil and gas industry. He previously was the Commercial and Business Planning Manager for Chevron Latin America in Caracas, Venezuela. At Chevron, he also served as Commercial and Business Development Manager in Chevron Colombia in Bogotá, Colombia. During his career he also worked for Enron Energy Services as Risk Manager at Porvenirtheir headquarters in Houston, Texas. He has also served as a member of the Leadership Team of Chevron Latin America and as a member of the national operations council of natural gas in Colombia, among many other high-level positions at Citibank, ABN AMRO and Bank of America. She has served on the board of directors for ISA, Isagen, XM, FEN, Cenit, among others.responsibilities.
Hector Manosalva Rojas (57)(54) has served as CEO of Cenit S.A.S., Ecopetrol’s midstream subsidiary, since March 1, 2019. He joined Ecopetrol in 1986 and hasprior to his appointment as CEO of Cenit, he served as Vice-President for Development and Production since July 2014. Mr. Manosalva holds a degree in Petroleum Engineering from the Universidad de America (Bogotá), completed post-graduate studies in finance at the Universidad EAFIT and Executive Management at the Universidad de los Andes. Over the course of his career at Ecopetrol, Mr. Manosalva has held various positions, including Executive Vice-President for Production and Exploration, Vice-President of Production, Production Manager of the Central Region, President of Colombia’s Advisor for Safety and Security of National Energy Infrastructure, Director of HSE and Corporate Social Responsibility, Production Manager of the Southern Region and Head of the Production Planning Division. Mr. Manosalva holds a degree in Petroleum Engineering from the Universidad de America (Bogotá) and postgraduate degrees in Finance at the Universidad EAFIT and Executive Management at the Universidad de los Andes.
Max Torres (59)Juan Manuel Rojas Payán (47)has served as Exploration Vice-President for Strategy and New Business since September 2014. Mr. Torres holdsAugust 2018. Prior to his appointment as Vice-President for Strategy and New Business, he served as Corporate Manager for New Business since 2016. He graduated with a B.S. degree in GeologyEconomics from Universidad Nacionalde los Andes and holds two master’s degrees in Public Policy from Harvard University and in Economics from Universidad de los Andes. He was previously Vice-Minister of Tucumán in ArgentinaMines and an M.S. in Stratigraphy from Georgia State University. He has more than 28 yearsEnergy, Chief Executive Officer of experience in oilBridas Corporation, Manager of New Business at Pan American Energy, and gas exploration and production and is a proven world class oil and gas finder and a championDirector of Latin American oil and gas exploration. Among his many professional accomplishments, Mr. Torres was directly responsible for the 16 Tcfg Perla gas field discovery in Venezuela, the 275 Tcfg super giant Galkynysh gas field discovery in Turkmenistan, as well asEnergy at Sideco Americana/Socma, among other oil and gas discoveries. Prior to joining Ecopetrol, Mr. Torres worked at Repsol from 1997 to 2013 as Exploration Director for Europe and the Middle East, Exploration Director for Europe and Africa and Exploration Director for Latin America.
positions.
Rafael Espinosa (49)
Marly Aracelly Castillo Areiza (41)has served as Vice-President of TransportationTransformation since September 2016. Mr. Espinosa holds a bachelor’s degreeJanuary 2019. Ms Castillo helped launch and develop the transformation program in Civil Engineering from Universidad Santo Tomas in Colombia and a MBA from University of the Andes (Bogotá). He has worked for Ecopetrol for the last 23 years and has held various positions within the company, including Operations and Maintenance General Manager, Pipelines Manager, Central Operation Superintendent, Chief of Operations Department, Plant Coordinator, Pipeline Maintenance Engineer and Community Relationships Engineer.
Rafael Guzman (50) joined Ecopetrol in 2010 and has served as Technical Vice-President since May 2013. Mr. Guzman holds a B.S. degree in Petroleum Engineering from Universidad America in Colombia (1995), a M.S. in Petroleum Engineering and a PhD in Petroleum Engineering with minor in Mathematics both from Stanford University. Mr. Guzman has been with Ecopetrol since October 2010, where hejoining in 2009. Ms. Castillo has held several positions as regional production manager. Prior to that, Mr. Guzman worked with ENI17 years of experience in managerial positionsthe public and private sectors in Europestrategy and Latin America.
Luisa Fernanda Lafaurie (56)has served as Cenit’s Chief Executive Officer since September 2016.performance mesurement. Ms. LafaurieCastillo holds a degree in Economics from the Universidad Javeriana with a Master’s Degree in Business Administration and a DegreeSanto Tomás, Bogotá, completed post-graduate studies in Finance at the Universidad Externado and Senior Management from Los Andes University (Bogotá). Ms. Lafaurie has accumulated extensive experience inan MBA at the energy sector, both in the public and private sector, serving as Minister of Mines and Energy (2001-2002) and Deputy Minister of Mines and Energy (1998-2000), and in the private sector as an external advisor to mining and fuel distributors companies. She was a founding member of Sumatoria, a firm where she worked as an advisor on corporate strategies and business issues. As chief executive officer of HJDK (2009-2013), German Efromovich´s business group in Colombia, Ms. Lafaurie led the development of hospitality and agribusiness companies. She was also an advisor for the Synergy Group corporations in Colombia with the exception of Avianca. Ms. Lafaurie worked at Carbocol (1985-1996) and has served as a member of the board of different companies such as Ocensa, Ecopetrol, Carbocol, Minercol, Ecogas, ISA, Almacenes Exito, ISAGEN, and Conconcreto in Colombia, and CTEEP in Brazil. Currently, she is member of the board of directors of Avianca, FinancieraUniversidad de Desarrollo Nacional (FDN), Emgesa, Ocensa and Oleoducto Bicentenario.
Tomas Hernandez (62) has served as Vice-President of Refining and Industrial Processes since February 2016. He has over 37 years of international experience in the oil and gas sector. He has served as Business Manager at Chevron’s Pascagoula refinery in the United States, General Manager for Marketing Operations for Chevron Texaco in Latin America and Africa-Europe-Pakistan Regions and has spent over 20 years in managerial positions in various refineries at Chevron.los Andes. Prior to joining Ecopetrol, he was Deputy Upgrader Managershe worked on academy and research at Petropiar,the School of Management at the Universidad de los Andes as a joint ventureconsultant and teacher. Ms Castillo has published two books: “Valuation of projects through real options” and “Measurement Customer Value,” in which Chevron participates. Mr. Hernandez holdsaddition to other case studies that focus on a degree in Chemical Engineering from the Universitydiversity of Missouri – Rolla (University of Science and Technology Missouri).
Jürgen Loeber (59) has served as the Projects & Engineering Vice-President of Ecopetrol since May 2016. Mr. Loeber holds a degree in Business Administration from Universidad del Norte and specialization in Project Management. He joined the Army Corps of Engineers as reserve officer and reached a captain rank. He has over 30 years of experiencemanagement dilemmas in the Oil & Gas industry. Forareas of leadership, organizational change and strategy. Ms. Castillo will be the last 10 years, he worked at Equion Limited (formerly BP Exploration Colombia) as Project Director. From 2001 to 2006, he was Project Director for Wood Group Colombia. From 1992 to 2001 he worked for BP in various countries as project manager, construction manager and project control engineer. He began his career in 1985 in Exxon as financial analyst.
Pedro Manrique (52) was named Commercial and Marketing Vice President as of April 2017. Mr. Manrique holds a bachelor’s degree in Electrical Engineering from the Industrial University of Santander, Colombia. He has a Master’s degree in Industrial and Systems Engineering from the University of Florida and an MBA from the IE Business School in Madrid, Spain. Mr. Manrique has 27 years of experience in the oil and gas industry. His previous position was as the Commercial and Business Planning Manager for Chevron Latin America, in Caracas, Venezuela. At Chevron he also served as Commercial and Business Development Manager in Chevron Colombia based in Bogotá, Colombia. During his career he also worked Enron Energy Services as Risk Manager, out of their headquarter offices in Houston, Texas. He has also served as member of the Leadership Team of Chevron Latin America and as member of the national operations council of natural gas in Colombia, among many other responsibilities.
Carlos Alberto Vargas Medina (47) has served as Vice-President of Transformation since December 2015. Mr. Vargas holds a degree in Petroleum Engineering from America University. He has 23 years of experience acrossuntil June 17, 2019, upon which Orlando Díaz Montoya will assume the integrated oil and gas value chain with a focus in drilling and well interventions and an expertise in exploration, appraisal, development and production onshore and offshore wells. He has held management positions in the United Kingdom, Argentina, Bolivia and Colombia, where he has developed key skills in strategy, performance management systems, risks management, HSE and integration of multicultural and multidisciplinary teams. Prior to taking his current position, he was the Vice-President of Drilling and Completions at Equion.position.
Fernán Ignacio Bejarano Arias (60)(63)has served as Vice-President of Legal Affairs and General Counsel at Ecopetrol since March 2016. Mr. Bejarano Arias holds a bachelor’s degree in Law from Universidad Javeriana in Bogotá and an LLM from the American University (Washingtonin Washington D.C.). In his more than thirty years of professional experience, he has been a partner at the law firms of Estudios Palacios Lleras S.A, Bejarano Cárdenas y Ospina y Asociados Ltda and OPEBSA Compañía de Abogados S.A.S. and has worked for several years atin important positions in the public sector, such as the Vice-Minister of Foreign Affairs, Secretary of the Monetary Board, Secretary of the Board of Directors of the Banco de la República (Colombian Central Bank), Office of Legal Affairs Counselor at the Presidency of the Republic of Colombia, and Vice-President of Legal Affairs and General Counsel at Corporación Finaciera Colombiana. Mr. Bejarano Arias has been a professor at the Faculty of Law of the Universidad Javeriana, and has been an arbitrator before the Center for Arbitration and Conciliation of the Bogotá Chamber of Commerce.
| 153 |
Mónica Jiménez González (43) has served as Secretary General of Ecopetrol S.A. since July 2016. Ms. Jiménez holds a law degree from University of the Andes (Bogotá) and has practiced as a foreign lawyer in Canada. She holds a post-graduate degree in Civil and State Responsibility from the Universidad Externado de Colombia and a Master of Science in Development Studies from the London School of Economics and Political Science. Ms. Jimenez has practiced in Colombia and Canada on matters related to corporate social responsibility, cross-border transactions, and corporate law, and has acted as counsel and tribunal secretary in complex international commercial and investment arbitrations. She lived in Canada for 13 years, during which time she worked as a lawyer in a boutique law firm that specialized in international law and then in a major Canadian law firm in Vancouver, BC. Ms. Jimenez is also a Member of the International Court of Arbitration of the International Chamber of Commerce (ICC).
María Juliana AlbáAlban Durán (41)(43)has served as Compliance Vice-President and Compliance Officer since July 2015. Ms. Alban holds a law degree from Universidad Sergio Arboleda with a specialization in Commercial and Financial Law from the same institution. SinceBeginning in 2007, Ms. Alban haspreviously worked in the Attorney General’s Office (Procuraduría General de la Nación) as Attorney General for State Contracts, General Secretary and Chief of Legal Office, among other positions within the institution.
Alejandro Arango (57)Lopez (59)has served as Vice-President of Human Resources at Ecopetrol S.A. since October 2014. He has more than 20 years of professional experience around the world and has worked as a Vice-President of Human Resources at Banco Santander in Colombia and as Human Resources Director of the Consumer Finance Division, Strategy Division and Cards Division at Banco Santander in Spain. Mr. Arango has also served as Human Resources Director for the Asia Pacific region at Banco Santander in Hong Kong and as a Global Human Resources Division T&O, among others. Mr. Arango holds a degree in Strategic Marketing from CESA School of Business, and a bachelor’s degree in Theology from the Universidad Hochschule Sankt Georgen (Frankfurt) and a bachelor’s degree in Philosophy from Javeriana University.
AndrésAndres Eduardo Mantilla (46)Zarate (48) has served as the Director of the Colombian Petroleum Institute of Ecopetrol, the technology development center of the company, since September 2013. He holds a degree in Petroleum Engineering from Universidad Industrial de Santander, Colombia, a Master of Science degree in Petroleum Engineering from Stanford University, and a Ph.D. in Geophysics from Stanford University. His professional work includes the leadership and management of oil and gas technology development, demonstration and implementation teams. He had previously worked for Ecopetrol holding various positions between 1994 and 2006. Before rejoining Ecopetrol in 2013, he worked for BP Colombia, Marathon Oil Company and Maersk Oil. During his professional career, he has had exposure to exploration and production projects and the evaluation of new ventures in Colombia, the Gulf of Mexico, the North Sea, West Africa, South America and the Middle East.
Eduardo Uribe Botero (57)Aníbal Fernández de Soto Camacho (40)has served as Vice-President of Sustainable Development and Environmentalat Ecopetrol since August 2015. Mr. UribeSeptember 2018. He is a lawyer who specializes in Economics from Los Andes University, and holds a master’s degree in Agricultural EngineeringPolitical Action, Institution-Building and Citizen Participation from CaldasFrancisco Vitoria University and Rey Juan Carlos I University, Madrid-Spain. Educated in government affairs and public policies, Mr. Fernández de Soto served as an advisor of the Government and Congress of the Republic, as well as for management of political projects and as a master’srepresentative of science in Soil Chemistry and a Ph.D. in Fertility and Management of Tropical Soils. He has over 25 years of experiencethe private sector in the private and public sectors. In 1994, he was appointed the first Vice-Minister of the Environment in Colombia. In recent years hetrade field. He has served as a strategic, environmentalDeputy Minister for Policy and social advisor to companies and organizationsInternational Affairs in the fieldsMinistry of hydrocarbons, mining, energy, forestry, environmentalDefense, Deputy Minister for Rural Development in the Ministry of Agriculture, Deputy Minister for Participation and agribusiness throughRights Equality in the consulting firm Optim Consulting.Ministry of Internal Affairs, and Director of Security in the Ministry for Post-Conflict. In the private sector, he was executive director of the Chamber of Beverage Industry of ANDI,Corporación Pensamiento Siglo XXI andFundación Democracia y Libertad.
Alberto Consuegra Granger (57)Carlos Andrés Santos Nieto (42)has served as Vice-President of Supply and Services since August 2016.7, 2018. Prior to his appointment as Vice-President of Supply and Services, he was Procurement and Supply Chain Manager at Ecopetrol. Mr. ConsuegraSantos is an Economist from Universidad Externado de Colombia and holds a postgraduate degree in Civil EngineeringInternational Economics from Cartagena Universitythe same institution and a college diploma course in Advanced Negotiations from Universidad CESA, and has a master’s degreecompleted other negotiations training provided by BP in PavementsColombia, Alaska and Construction Management from Texas A&M University. His latest position was Vice-President of ExplorationLondon. Prior to joining the Company, he served as Offshore Business Unit General Manager in Coremar Group and Production atProcurement & Supply Chain Manager Drilling, Wells, Subsurface and Offshore in Equion Energia Limited where he(Former BP Exploration Colombia). He also served as the Vice-PresidentLatin America Procurement Sourcing Manager for ProjectsMerck Sharp & Dhome and Production. Alberto began his professional careerProcurement & Supply Chain Manager Specialist for Quala Colombia S.A. He has held various positions within BP as PSCM Drilling & Wells Category Lead, Iraq SPU in 1984 by working for Morrison Knudsen International as a contract coordinator during the construction of the Cerrejon project. In 1993 he joined Ecopetrol, workingLondon, PSCM Market Intelligence Lead & Deflation Project Lead in the project group, afterwards, he went on to BP Exploration, where he worked for 16 years starting as a contract coordinator, then as procurementAlaska, PSCM Specialist D&W in Alaska, PSCM Specialist O&M in Colombia, PSCM Commercial Analyst in Colombia and contract manager, then human resource manager for the Andean area, and finally as leader of the Colombian Performance Unit.PSCM Specialist Business Support in Colombia.
Mónica Jiménez González (41)Ernesto Gutiérrez de Piñeres (45) has served as Secretary General of Ecopetrol SADigital Vice-President since July 2016. Ms. Jiménez holdsOctober 2018. Mr. Gutierrez de Piñeres is a law degreeSystems Engineer and Information Systems Management Specialist from University of Norte de Barranquilla, and holds an Executive MBA from Los Andes University. He has more than 19 years of experience as Director and Manager (CIO) of information technology areas in different multinational companies on multiple industry sectors, leading and developing high performance teams in Colombia, USA, Central and South America. Mr. Gutierrez de Piñeres is an executive with experience in transforming technology areas into business partners and generators of value for the Andes (Bogotá)organizations through technology-based innovation, team development and has been allowed to practice as a foreign lawyer in Canada. She holds a post-graduate degree in Civiltechnology strategies that leverage corporate strategy and State Responsibility from the Universidad Externado de Colombia and a Master of Science in Development Studies from the London School of Economics and Political Science (LSE). Before studying abroad, Ms. Jimenez worked as a lawyer at a Colombian law firm and then as lawyer advising the Minister and the Deputy Minister of Defense of Colombia in matters related to international law. Prior to returning to Colombia, she lived in Canada for 13 years, time during which she worked as a lawyer in a boutique law firm specialized in international law and then, in a major Canadian law firm in Vancouver, BC.competitive business.
None of our Directors, Executive Officers or executive officersmembers of senior management has any familial relationship with any Director, Executive Officer or executive officer.member of senior management.
| 7.6 | Compensation of Directors and Management |
Based on a resolution adopted at our annual shareholders’ meeting in 2012, compensation for Directors’ attendance in person at meetings of the Board of Directors and/or committee meetings increased from the equivalent of four to six minimum monthly wage salaries, which totals approximately COP$4.14.9 million for 20162019 and COP$3.94.6 million for 2015. Fees2018. See Note 29.1 to our consolidated financial statements for attendance at virtual meetings are set at 50% of the in-person meeting fee.more details.
The total compensation paid to our Directors, executive officers and senior management active as of December 31, 20162018 during 20162018 amounted to COP$13,901 million.23.73 billion. This includes amounts paid to certain of our Directors, executive officers and senior management pursuant to a bonus plan under which such persons are entitled to receive contingent compensation based on our company results for each full year. The contingent compensation ranges from 0% to 150% of each person’s base compensation based on our company performance.
Only one member of our executive officersmanagement team is eligible to receive pension and retirement benefits from us. The total amount set asiderecorded as of December 31, 2018 to provide pension and retirement benefits amounted to our eligible executive officers totals COP$4,6745,491 million.
| 7.7 | Share Ownership of Directors and Executive Officers |
No individual Director or executive officer beneficially owns more than 1% of our outstanding shares.
Table 59 –The following Directors and executive officers own shares of Ecopetrol:
| Director | Shares | % | ||||||
| Joaquín Moreno Uribe | 127,988 | 0.0003113 | % | |||||
| Mauricio Cárdenas Santamaría | 2,000 | 0.0000049 | % | |||||
| Juan Carlos Echeverry Garzón | 33,420 | 0.0000813 | % | |||||
Table 58 – Executive Officers owning Ecopetrol’s shares
| Executive Officer | Shares | % | ||||||
| Héctor Manosalva | 49,380 | 0.0001201 | % | |||||
| Rafael Espinosa Rozo | 7,200 | 0,0000175 | % |
| Executive Officer | Shares(1) | % | ||||||
| Felipe Bayón Pardo | 8,418 | 0.00002 | % | |||||
| Jaime Eduardo Caballero Uribe | 30,000 | 0.00007 | % | |||||
(1) As of March 28, 2019.
Under Colombian law, all of our shareholders have the same economic privileges and voting rights.
| 7.8 | Controls and Procedures |
Disclosure Controls and Procedures
As required by Rules 13a-15(e) and 15d-15(e) under the Securities Exchange Act of 1934, as of December 31, 2016,2018, we evaluated the design and effectiveness of our financial disclosure controls and procedures under the supervision and participation of our management, including our Chief Executive Officer and Chief Financial Officer. There are inherent limitations to the effectiveness of any system of disclosure controls and procedures, including the possibility of human error and the circumvention or overriding of the controls and procedures. Accordingly, even if effective, disclosure controls and procedures can only provide reasonable assurance of achieving their control objectives.
Based upon this evaluation, our Chief Executive Officer and Chief Financial Officer concluded that as of the end of the period covered by this annual report, our disclosure controls and procedures were effective to provide reasonable assurance that the information required to be disclosed in the reports that we file and submit under the Securities Exchange Act of 1934 is recorded, summarized and reported as and when required and is accumulated and communicated to our management, including our Chief Executive Officer and Chief Financial Officer, or persons performing similar functions, as appropriate to allow timely decisions regarding required disclosure.
| 155 |
Management’s Annual Report on Internal Control over Financial Reporting
Our management is responsible for establishing and maintaining adequate internal control over financial reporting as defined in Rules 13a-15(f) and 15(d)-15(f) under the Securities Exchange Act of 1934. Our internal control over financial reporting is a process designed under the supervision of our Chief Executive Officer and Chief Financial Officer, and affectedmonitored by our board of directors, management and other personnel, to provide reasonable assurance regarding the reliability of financial reporting and the preparation of our financial statements for external reporting purposes in accordance with generally accepted accounting principles, and it includes those policies and procedures that:
| · | pertain to the maintenance of records that, in reasonable detail, accurately and fairly reflect transactions and dispositions of our assets; |
| · | provide reasonable assurance that transactions are recorded as necessary to permit preparation of financial statements in accordance with generally accepted accounting principles, and that receipts and expenditures are being made only in accordance with authorization of our management and directors; and |
| · | provide reasonable assurance regarding prevention or timely detection of unauthorized acquisition, use or disposition of our assets that could have a material effect on our financial statements. |
Because of its inherent limitations, internal control over financial reporting may not prevent or detect misstatements. Therefore, effective control over financial reporting cannot, and does not, provide absolute assurance of achieving our control objectives. Also, projection of any evaluation of the effectiveness of the internal controls to future periods is subject to the risk that controls may become inadequate because of changes in conditions or that the degree of compliance with the policies or procedures may deteriorate.
As of the year ended December 31, 2016,2018, our management conducted an assessment of the effectiveness of our internal control over financial reporting in accordance with the criteria established in the publication “Internal Control – Integrated Framework (2013),”, issued by the Committee of the Sponsoring Organizations of the Treadway Commission, as well as the rules set by the SEC in its Final Rule “Management’s Report on Internal Control Over Financial Reporting and Certification of Disclosure in Exchange Act Periodic Reports.”
Based on the assessment performed, management concluded that our internal control over financial reporting was effective as of the end of the period covered by this annual report.
The effectiveness of our internal control over financial reporting has been audited by Ernst & Young Audit S.A.S., an independent registered public accounting firm, as stated in their audit report accompanying our consolidated financial statements.
Audit and Non-Audit Fees
Our consolidated financial statements for the fiscal yearyears ended December 31, 2018, 2017 and 2016 were audited by Ernst & Young Audit S.A.S. Our consolidated financial statements for the fiscal years ended December 31, 2015 were audited by PricewaterhouseCoopers Ltda.
The following table sets forth the fees billed to us by Ernst & Young Audit S.A.S. during the fiscal yearyears ended December 31, 2016.2018 and December 31, 2017.
Table 6059 – Fees Billed to us by Ernst & Young Audit S.A.S.
| As of December 31, | ||||||||
| 2018 | 2017 | |||||||
(in millions of Colombian Pesos, excluding 19% value added tax) | ||||||||
| Audit fees | 11,742 | 10,946 | ||||||
| Audit-related fees | 19 | 167 | ||||||
| Tax fees | 71 | 135 | ||||||
| All other fees | – | – | ||||||
| Total | 11,832 | 11,248 | ||||||
Audit Fees. The audit fees listed in the table above are the aggregated fees billed by Ernst & Young Audit S.A.S. in connection with their audits of our annual consolidated financial statements (IFRS), interim consolidated financial statements (under IFRS), statutory audits of Ecopetrol S.A. and its consolidated subsidiaries and some of its associate entities (under local GAAP) and review of periodic documents filed with the SEC. In addition, these audit fees include fees related to our independent auditors’ audits of our internal controls over financial reporting.
Audit-related Fees. The audit-related fees listed in the table above are the fees billed by Ernst & Young Audit S.A.S. in connection with their agreed-upon procedures of our variable compensation bonus system and its review procedures in connection with the offering document related to the SEC-registered bonds we reopened in 2016.
Tax Fees. TheFor 2018 the tax fees listed in the table above correspond to (i) advising some subsidiariesa conceptual analysis for a subsidiary about the tax consequences associated with new or proposed legislation and (ii) rendering advice to some subsidiariesbased on the likely tax consequences of proposed transactions andeconomic models prepared by the appropriate methods of structuring and reporting.subsidiary.
The following table sets forth the fees billed to us by PricewaterhouseCoopers Ltda. during the fiscal year ended December 31, 2015.
Table 61 – Fees Billed to us by PricewaterhouseCoopers Ltda.
Audit Fees. The audit fees listed in the table above are the aggregated fees billed by PricewaterhouseCoopers Ltda. in connection with their audits of our annual consolidated financial statements (IFRS), interim consolidated financial statements (under IFRS), subsidiary audits (under local GAAP) and review of periodic documents filed with the SEC. In addition, these audit fees include fees related to our independent auditors’ audits of our internal controls over financial reporting.
Audit-related Fees. The audit-related fees listed in the table above are the fees billed by PricewaterhouseCoopers Ltda. in connection with their agreed-upon procedures of our variable compensation bonus system as well as the audit of the joint operation agreement of ECP Oil and Gas Germany GmbH.
Tax Fees. The tax fees listed in the table above correspond to (1) assisting some subsidiaries in the preparation and filing of appropriate tax returns with the tax authorities (including electronic filings), (2) advising some subsidiaries about the tax consequences associated with new or proposed legislation and (3) rendering advice to some subsidiaries on the likely tax consequences of proposed transactions and the appropriate methods of structuring and reporting.
Changes in Internal Control over Financial Reporting
There were no changes made in our internal control over financial reporting during the year ended December 31, 20162018 that have materially affected or are reasonably likely to materially affect the Company’s internal controls over financial reporting.
Attestation Report of the Registered Public Accounting Firm
Ernst & Young Audit S.A.S.’s attestation report on our internal control over financial reporting is included in their audit report accompanying our consolidated financial statements. SeeReport of Independent Registered Public Accounting Firm to the consolidated financial statements.
Significant Changes
For a description of significant events since December 31, 2016,2018, please see Note 36 – Subsequent eventsto32 to our consolidated financial statements.
| 8. | Financial Statements |
Ecopetrol S.A.
Consolidated Financial Statements
At December 31, 2018 and 2017 and for three years ended December 31, 2018, 2017 and 2016
Ecopetrol S. A.
Consolidated Financial Statements
At December 31, 2016 and 2015 and for three years ended December 31, 2016, 2015 and 2014Index
Index
| Exhibit 2 – Conditions of the most significant loans | F-108 | ||
ReportReport of Independent Registered Public Accounting Firm
TheTo the Shareholders and the Board of Directors and Shareholders of Ecopetrol S.A. and subsidiaries
Opinion on the Financial Statements
We have audited the accompanying consolidated statementstatements of financial position of Ecopetrol S.A. and subsidiaries(the Company) as of December 31, 20162018 and 2017, the related consolidated statements of profit or loss, other comprehensive income, changes in equity, and cash flows, for each of the yearthree years in the period ended December 31, 2016. These financial statements are2018, and the responsibility of the Company’s management. Our responsibility is to express an opinion on these financial statements based on our audit.
We conducted our audit in accordance with the standards of the Public Company Accounting Oversight Board (United States). Those standards require that we planrelated notes and perform the audit to obtain reasonable assurance about whether the financial statements are free of material misstatement. An audit includes examining, on a test basis, evidence supporting the amounts and disclosures in the financial statements. An audit also includes assessing the accounting principles used and significant estimates made by management, as well as evaluating the overall financial statement presentation. We believe that our audit provide a reasonable basis for our opinion.
schedules listed in exhibits 1 and 2 (collectively referred to as the consolidated financial statements). In our opinion, the consolidated financial statements referred to above present fairly, in all material respects, the consolidated financial position of Ecopetrol S.A. and subsidiariesthe Company at December 31, 2016,2018 and 2017, and the consolidated results of theirits operations and theirits cash flows for each of the yearthree years in the period ended December 31, 2016,2018, in conformity with International Financial Reporting Standards as issued by the International Accounting Standards Board.
We also have audited, in accordance with the standards of the Public Company Accounting Oversight Board (United States) (PCAOB), Ecopetrol S.A. and its subsidiaries’the Company's internal control over financial reporting as of December 31, 2016,2018, based on criteria established in Internal Control-Integrated Framework issued by the Committee of Sponsoring Organizations of the Treadway Commission “(2013(2013 framework)” and our report dated May 30, 2017April 5, 2019 expressed an unqualified opinion thereon.
/s/ Ernst & Young Audit S.A.S.
Bogota, Colombia
May 30, 2017Basis for Opinion
These financial statements are the responsibility of the Company‘s management. Our responsibility is to express an opinion on the Company‘s financial statements based on our audits. We are a public accounting firm registered with the PCAOB and are required to be independent with respect to the Company in accordance with the U.S. federal securities laws and the applicable rules and regulations of the Securities and Exchange Commission and the PCAOB.
We conducted our audits in accordance with the standards of the PCAOB. Those standards require that we plan and perform the audit to obtain reasonable assurance about whether the financial statements are free of material misstatement, whether due to error or fraud. Our audits included performing procedures to assess the risks of material misstatement of the financial statements, whether due to error or fraud, and performing procedures that respond to those risks. Such procedures included examining, on a test basis, evidence regarding the amounts and disclosures in the financial statements. Our audits also included evaluating the accounting principles used and significant estimates made by management, as well as evaluating the overall presentation of the financial statements. We believe that our audits provide a reasonable basis for our opinion.
| /s/ Ernst & Young Audit S.A.S. | |
| We have served as the Company‘s auditor since 2016. | |
| Bogota, Colombia | |
| April 5, 2019 |
ReportReport of Independent Registered Public Accounting Firm
TheTo the Shareholders and the Board of Directors and Shareholders of Ecopetrol S.A. and subsidiaries
Opinion on Internal Control over Financial Reporting
We have audited Ecopetrol S.A. and subsidiaries’’ internal control over financial reporting as of December 31, 2016,2018, based on criteria established in Internal Control—Integrated Framework issued by the Committee of Sponsoring Organizations of the Treadway Commission “(2013(2013 framework)” (the COSO criteria). In our opinion, Ecopetrol, S.A. (the Company) maintained, in all material respects, effective internal control over financial reporting as of December 31, 2018, based on the COSO criteria.
We also have audited, in accordance with the standards of the Public Company Accounting Oversight Board (United States) (PCAOB), the consolidated statements of financial position of the Company as of December 31, 2018 and subsidiaries’2017, the related consolidated statements of profit or loss, comprehensive income, changes in equity and cash flows for each of the three years in the period ended December 31, 2018, and the related notes and financial statement schedules listed in exhibits 1 and 2, and our report dated April 5, 2019 expressed an unqualified opinion thereon.
Basis for Opinion
The Company’s management is responsible for maintaining effective internal control over financial reporting and for its assessment of the effectiveness of internal control over financial reporting included in the accompanying Management’s Annual Report on Internal Control over Financial Reporting. Our responsibility is to express an opinion on the Ecopetrol S.A. and subsidiaries’Company’s internal control over financial reporting based on our audit. We are a public accounting firm registered with the PCAOB and are required to be independent with respect to the Company in accordance with the U.S. federal securities laws and the applicable rules and regulations of the Securities and Exchange Commission and the PCAOB.
We conducted our audit in accordance with the standards of the Public Company Accounting Oversight Board (United States).PCAOB. Those standards require that we plan and perform the audit to obtain reasonable assurance about whether effective internal control over financial reporting was maintained in all material respects.
Our audit included obtaining an understanding of internal control over financial reporting, assessing the risk that a material weakness exists, testing and evaluating the design and operating effectiveness of internal control based on the assessed risk, and performing such other procedures as we considered necessary in the circumstances. We believe that our audit provides a reasonable basis for our opinion.
Definition and Limitations of Internal Control Over Financial Reporting
A company’s internal control over financial reporting is a process designed to provide reasonable assurance regarding the reliability of financial reporting and the preparation of financial statements for external purposes in accordance with generally accepted accounting principles. A company’s internal control over financial reporting includes those policies and procedures that (1) pertain to the maintenance of records that, in reasonable detail, accurately and fairly reflect the transactions and dispositions of the assets of the company; (2) provide reasonable assurance that transactions are recorded as necessary to permit preparation of financial statements in accordance with generally accepted accounting principles, and that receipts and expenditures of the company are being made only in accordance with authorizations of management and directors of the company; and (3) provide reasonable assurance regarding prevention or timely detection of unauthorized acquisition, use, or disposition of the company’s assets that could have a material effect on the financial statements.
Because of its inherent limitations, internal control over financial reporting may not prevent or detect misstatements. Also, projections of any evaluation of effectiveness to future periods are subject to the risk that controls may become inadequate because of changes in conditions, or that the degree of compliance with the policies or procedures may deteriorate.
In our opinion, Ecopetrol S.A. and subsidiaries maintained, in all material respects, effective internal control over financial reporting as of December 31, 2016, based on the COSO criteria.
We also have audited, in accordance with the standards of the Public Company Accounting Oversight Board (United States), the consolidated statements of financial position of Ecopetrol S.A. and subsidiaries as of December 31, 2016 and the related consolidated statements of profit or loss, other comprehensive income, changes in equity and cash flows for the year ended December 31, 2016 of Ecopetrol S.A. and subsidiaries and our report dated May 30, 2017 expressed an unqualified opinion thereon.
/s/ Ernst & Young Audit S.A.S.
Bogota, Colombia
May 30, 2017
| /s/ Ernst & Young Audit S.A.S. | |
| Bogota, Colombia | |
| April 5, 2019 |
Report of Independent Registered Public Accounting FirmEcopetrol S.A.
To the Board of Directors
And Shareholders of Ecopetrol S. A.
In our opinion, the accompanying consolidatedConsolidated statement of financial position and the related consolidated statement of profit and loss, other comprehensive income, changes in equity and cash flows present fairly, in all material respects, the financial position of Ecopetrol S. A. and its subsidiaries (the ¨Company¨) at December 31, 2015, and the results of their operations and their cash flows for each of the two years in the period ended December 31, 2015 in conformity with International Financial Reporting Standards as issued by the International Accounting Standards Board. These financial statements are the responsibility of the Company’s management. Our responsibility is to express an opinion on these financial statements based on our audits. We conducted our audits of these statements in accordance with the standards of the Public Company Accounting Oversight Board (United States). Those standards require that we plan and perform the audit to obtain reasonable assurance about whether the financial statements are free of material misstatement. An audit includes examining, on a test basis, evidence supporting the amounts and disclosures in the financial statements, assessing the accounting principles used and significant estimates made by management, and evaluating the overall financial statement presentation. We believe that our audits provide a reasonable basis for our opinion.
As discussed in Note 2.8 to the consolidated financial statements, the Company has elected to change the manner in which it presents dry wells in the consolidated statements of cash flows in 2016.
/s/ PricewaterhouseCoopers Ltda.
Bogotá, Colombia
April 28, 2016, except for the change in the manner in which the company presents dry wells in the consolidated statements of cash flows in 2016 as discussed in Note 2.8 to the consolidated financial statements, as to which the date is May 30, 2017.
Consolidated statements of financial position
(Figures expressed inIn millions of Colombian pesos)
| As of December 31, | ||||||||||
| Notes | 2016 | 2015 | ||||||||
| Assets | ||||||||||
| Current assets | ||||||||||
| Cash and cash equivalents | 6 | 8,410,467 | 6,550,450 | |||||||
| Trade and other receivables, net | 7 | 4,212,701 | 3,427,412 | |||||||
| Inventories, net | 8 | 3,841,901 | 3,057,958 | |||||||
| Other financial assets | 9 | 5,315,537 | 329,227 | |||||||
| Tax assets | 10 | 1,129,098 | 4,501,734 | |||||||
| Equity instruments measured at fair value | 11 | 51,610 | 913,488 | |||||||
| Other current assets | 12 | 1,035,632 | 1,090,324 | |||||||
| 23,996,946 | 19,870,593 | |||||||||
| Assets held for sale | 13 | 132,216 | 242,745 | |||||||
| Total current assets | 24,129,162 | 20,113,338 | ||||||||
| Non-current assets | ||||||||||
| Investments in associates and joint ventures | 14 | 1,552,694 | 1,931,934 | |||||||
| Trade and other receivables, net | 7 | 729,410 | 584,571 | |||||||
| Property, plant and equipment | 15 | 62,328,502 | 65,105,073 | |||||||
| Natural and environmental resources | 16 | 22,341,047 | 24,043,297 | |||||||
| Intangibles | 18 | 272,132 | 388,051 | |||||||
| Deferred tax assets | 10 | 5,726,961 | 8,239,472 | |||||||
| Other financial assets | 9 | 1,371,358 | 1,256,152 | |||||||
| Goodwill | 19 | 1,159,922 | 1,159,922 | |||||||
| Other non-current assets | 12 | 826,736 | 766,380 | |||||||
| Total non-current assets | 96,308,762 | 103,474,852 | ||||||||
| Total assets | 120,437,924 | 123,588,190 | ||||||||
| Liabilities | ||||||||||
| Current liabilities | ||||||||||
| Loans and borrowings | 20 | 4,126,203 | 4,573,620 | |||||||
| Trade and other payables | 21 | 6,854,363 | 7,757,277 | |||||||
| Provisions for employee benefits | 22 | 1,974,496 | 1,392,266 | |||||||
| Tax liabilities | 10 | 2,130,940 | 2,803,559 | |||||||
| Accrued liabilities and provisions | 23 | 821,954 | 653,497 | |||||||
| Other financial liabilities | - | 101,319 | ||||||||
| Other liabilities | 439,274 | 144,441 | ||||||||
| 16,347,230 | 17,425,979 | |||||||||
| Liabilities related to assets held for sale | 13 | 40,128 | 17,628 | |||||||
| Total current liabilities | 16,387,358 | 17,443,607 | ||||||||
| Non-current liabilities | ||||||||||
| Loans and borrowings | 20 | 48,095,824 | 48,649,718 | |||||||
| Trade and other payables | 21 | 23,893 | 6 | |||||||
| Provisions for employee benefits | 22 | 3,901,082 | 2,459,849 | |||||||
| Deferred tax liabilities | 10 | 3,118,650 | 6,026,050 | |||||||
| Accrued liabilities and provisions | 23 | 5,095,916 | 5,423,850 | |||||||
| Other non-current liabilities | 254,700 | 484,147 | ||||||||
| Total non-current liabilities | 60,490,065 | 63,043,620 | ||||||||
| Total liabilities | 76,877,423 | 80,487,227 | ||||||||
| Equity | ||||||||||
| Ecopetrol shareholders’ equity | 24 | 42,026,858 | 41,225,908 | |||||||
| Non-controlling interests | 1,533,643 | 1,875,055 | ||||||||
| Total equity | 43,560,501 | 43,100,963 | ||||||||
| Total liabilities and equity | 120,437,924 | 123,588,190 | ||||||||
| As of December 31, | ||||||||||||
| Note | 2018 | 2017 | ||||||||||
| Assets | ||||||||||||
| Current assets | ||||||||||||
| Cash and cash equivalents | 6 | 6,311,744 | 7,945,885 | |||||||||
| Trade and other receivables, net | 7 | 8,194,243 | 6,098,918 | |||||||||
| Inventories, net | 8 | 5,100,407 | 4,601,396 | |||||||||
| Other financial assets | 9 | 5,321,098 | 2,967,878 | |||||||||
| Current tax assets | 10 | 1,031,307 | 625,374 | |||||||||
| Other assets | 11 | 1,020,428 | 880,425 | |||||||||
| 26,979,227 | 23,119,876 | |||||||||||
| Assets held for sale | 51,385 | 104,140 | ||||||||||
| Total current assets | 27,030,612 | 23,224,016 | ||||||||||
| Non–current assets | ||||||||||||
| Investment in associates and joint ventures | 12 | 1,844,336 | 1,330,460 | |||||||||
| Trade and other receivables, net | 7 | 755,574 | 777,132 | |||||||||
| Property, plant and equipment | 13 | 62,799,983 | 61,404,374 | |||||||||
| Natural and environmental resources | 14 | 23,075,450 | 21,308,265 | |||||||||
| Intangible assets | 15 | 410,747 | 380,226 | |||||||||
| Deferred tax assets | 10 | 3,879,427 | 4,016,161 | |||||||||
| Other financial assets | 9 | 2,826,717 | 3,565,847 | |||||||||
| Goodwill | 17 | 1,159,922 | 1,159,922 | |||||||||
| Other assets | 11 | 860,730 | 681,009 | |||||||||
| Total non–current assets | 97,612,886 | 94,623,396 | ||||||||||
| Total assets | 124,643,498 | 117,847,412 | ||||||||||
| Liabilities | ||||||||||||
| Current liabilities | ||||||||||||
| Loans and borrowings | 18 | 4,019,927 | 5,144,504 | |||||||||
| Trade and other payables | 19 | 8,945,790 | 6,968,207 | |||||||||
| Provisions for employee benefits | 20 | 1,816,882 | 1,829,819 | |||||||||
| Current tax liabilities | 10 | 1,751,300 | 2,005,688 | |||||||||
| Accrued liabilities and provisions | 21 | 814,409 | 558,828 | |||||||||
| Other liabilities | 476,314 | 339,565 | ||||||||||
| Total current liabilities | 17,824,622 | 16,846,611 | ||||||||||
| Non–current liabilities | ||||||||||||
| Loans and borrowings | 18 | 34,042,718 | 38,403,331 | |||||||||
| Trade and other payables | 19 | 30,522 | 29,469 | |||||||||
| Provisions for employee benefits | 20 | 6,789,669 | 6,502,475 | |||||||||
| Deferred tax liabilities | 10 | 1,337,943 | 1,333,280 | |||||||||
| Accrued liabilities and provisions | 21 | 6,939,603 | 5,978,621 | |||||||||
| Other liabilities | 570,641 | 537,926 | ||||||||||
| Total non–current liabilities | 49,711,096 | 52,785,102 | ||||||||||
| Total liabilities | 67,535,718 | 69,631,713 | ||||||||||
| Equity | 22 | |||||||||||
| Subscribed and paid in capital | 25,040,067 | 25,040,067 | ||||||||||
| Additional paid in capital | 6,607,699 | 6,607,700 | ||||||||||
| Reserves | 5,138,895 | 2,177,869 | ||||||||||
| Other comprehensive income | 8,380,761 | 7,399,015 | ||||||||||
| Retained earnings | 9,970,492 | 5,210,302 | ||||||||||
| Equity attributable to owners of parent | 55,137,914 | 46,434,953 | ||||||||||
| Non–controlling interest | 1,969,866 | 1,780,746 | ||||||||||
| Total equity | 57,107,780 | 48,215,699 | ||||||||||
| Total liabilities and equity | 124,643,498 | 117,847,412 | ||||||||||
Consolidated statementsstatement of profit or loss
(Figures expressed inIn millions of Colombian pesos, except for the net earnings (loss) per share, which are expressed in Colombian pesos)
| For the years ended December 31, | ||||||||||||||
| Notes | 2016 | 2015 | 2014 | |||||||||||
| Sales revenue | 25 | 48,485,561 | 52,347,271 | 65,971,888 | ||||||||||
| Cost of sales (before impairment of non-current assets) | 26 | 34,251,423 | 36,994,516 | 42,975,128 | ||||||||||
| Gross profit (excluding impairment) | 14,234,138 | 15,352,755 | 22,996,760 | |||||||||||
| Administration expenses | 27 | 1,923,268 | 1,700,985 | 1,031,035 | ||||||||||
| Operation and project expenses | 27 | 2,751,687 | 4,034,268 | 5,520,325 | ||||||||||
| Impairment of non-current assets | 28 | 928,747 | 7,864,875 | 2,304,567 | ||||||||||
| Other operating income and (expenses), net | 29 | (274,112 | ) | (378,538 | ) | (308,194 | ) | |||||||
| Operating income | 8,904,548 | 2,131,165 | 14,449,027 | |||||||||||
| Financial result, net | 30 | |||||||||||||
| Financial income | 1,311,743 | 621,924 | 399,818 | |||||||||||
| Financial expenses | (3,463,540 | ) | (2,718,414 | ) | (1,640,294 | ) | ||||||||
| Foreign exchange gain (loss), net | 976,430 | (5,566,614 | ) | (2,270,193 | ) | |||||||||
| (1,175,367 | ) | (7,663,104 | ) | (3,510,669 | ) | |||||||||
| Share of profit (loss) of associates and joint ventures | 14 | 61,345 | (46,687 | ) | 166,070 | |||||||||
| Income before income tax expense | 7,790,526 | (5,578,626 | ) | 11,104,428 | ||||||||||
| Income tax expense | 10 | (4,543,046 | ) | (710,353 | ) | (5,434,855 | ) | |||||||
| Net income (loss) for the period | 3,247,480 | (6,288,979 | ) | 5,669,573 | ||||||||||
| Net income (loss) attributable to: | ||||||||||||||
| Company’s shareholders | 2,447,881 | (7,193,859 | ) | 5,046,517 | ||||||||||
| Non-controlling interests | 799,599 | 904,880 | 623,056 | |||||||||||
| 3,247,480 | (6,288,979 | ) | 5,669,573 | |||||||||||
| Earnings (loss) per share (basic and diluted) | 24.6 | 59.5 | (175.0 | ) | 122.7 | |||||||||
| For the years ended December 31, | ||||||||||||||||
| Note | 2018 | 2017 | 2016 | |||||||||||||
| Sales revenue | 23 | 68,603,872 | 55,954,228 | 48,485,561 | ||||||||||||
| Cost of sales | 24 | (41,184,379 | ) | (36,908,325 | ) | (34,251,423 | ) | |||||||||
| Gross profit | 27,419,493 | 19,045,903 | 14,234,138 | |||||||||||||
| Administrative expenses | 25 | (1,653,858 | ) | (1,764,524 | ) | (1,923,268 | ) | |||||||||
| Operations and project expenses | 25 | (2,903,132 | ) | (2,926,065 | ) | (2,751,687 | ) | |||||||||
(Impairment loss) impairment reversal of long–lived assets, net | 16 | (368,634 | ) | 1,311,138 | (928,747 | ) | ||||||||||
| Other operating (expenses) income, net | 26 | (35,455 | ) | 505,403 | 274,112 | |||||||||||
| Operating income | 22,458,414 | 16,171,855 | 8,904,548 | |||||||||||||
| Financial results, net | 27 | |||||||||||||||
| Finance income | 1,129,563 | 1,159,356 | 1,311,743 | |||||||||||||
| Finance expenses | (3,512,161 | ) | (3,660,601 | ) | (3,463,540 | ) | ||||||||||
| Foreign exchange gain | 372,223 | 5,514 | 976,430 | |||||||||||||
| (2,010,375 | ) | (2,495,731 | ) | (1,175,367 | ) | |||||||||||
| Share of profits of associates and joint ventures | 12 | 165,836 | 93,538 | 61,345 | ||||||||||||
| Profit before income tax expense | 20,613,875 | 13,769,662 | 7,790,526 | |||||||||||||
| Income tax expense | 10 | (8,258,485 | ) | (5,800,268 | ) | (4,543,046 | ) | |||||||||
| Net profit for the year | 12,355,390 | 7,969,394 | 3,247,480 | |||||||||||||
| Net profit attributable to: | ||||||||||||||||
| Owners of parent | 11,381,386 | 7,178,539 | 2,447,881 | |||||||||||||
| Non–controlling interest | 974,004 | 790,855 | 799,599 | |||||||||||||
| 12,355,390 | 7,969,394 | 3,247,480 | ||||||||||||||
| Basic and diluted earnings per share | COP$ | 276.8 | COP$ | 174.6 | COP$ | 59.5 | ||||||||||
Consolidated statementsstatement of other comprehensive income
(Figures expressed inIn millions of Colombian pesos)
| For the years ended December 31, | ||||||||||||||
| Notes | 2016 | 2015 | 2014 | |||||||||||
| Net income (loss) of the year | 3,247,480 | (6,288,979 | ) | 5,669,573 | ||||||||||
| Other comprehensive income | ||||||||||||||
| Items that may be reclassified subsequently to profit or loss (net of tax): | ||||||||||||||
| Unrealized gain (loss) on hedges: | ||||||||||||||
| Cash flow hedge for future exports | 31 | 461,424 | (217,291 | ) | - | |||||||||
| Hedge of a net investment in a foreign operation | 31 | (155,359 | ) | - | - | |||||||||
| Cash flow hedge with derivative instruments | 31 | 33,869 | (60,083 | ) | - | |||||||||
| Gain (loss) on equity instruments measured at fair value | 11 | 126,205 | (106,911 | ) | 76,435 | |||||||||
| Realized gain on proceeds from sales of equity instruments measured at fair value | (68,497 | ) | (19,405 | ) | - | |||||||||
| Foreign currency translation | (925,981 | ) | 5,979,644 | 3,398,374 | ||||||||||
| (528,339 | ) | 5,575,954 | 3,474,809 | |||||||||||
| Items that will not be reclassified subsequently to profit or loss (net of tax): | ||||||||||||||
| Remeasurement (loss) gain on defined benefit plans | (1,153,442 | ) | 1,404,602 | 743,793 | ||||||||||
| Others (losses) gains | (46,826 | ) | 58,643 | - | ||||||||||
| (1,200,268 | ) | 1,463,245 | 743,793 | |||||||||||
| Other comprehensive income | (1,728,607 | ) | 7,039,199 | 4,218,602 | ||||||||||
| Total comprehensive income | 1,518,873 | 750,220 | 9,888,175 | |||||||||||
| Attributable to: | ||||||||||||||
| Ecopetrol shareholders | 784,658 | (328,604 | ) | 9,114,221 | ||||||||||
| Non-controlling interests | 734,215 | 1,078,824 | 773,954 | |||||||||||
| 1,518,873 | 750,220 | 9,888,175 | ||||||||||||
| For the years ended December 31, | ||||||||||||
| 2018 | 2017 | 2016 | ||||||||||
| Net profit for the year | 12,355,390 | 7,969,394 | 3,247,480 | |||||||||
| Other comprehensive income | ||||||||||||
| Other comprehensive income that may be reclassified to profit or loss in subsequent periods (net of taxes): | ||||||||||||
| Unrealized gain (loss) on hedges: | ||||||||||||
| Cash flow hedge for future exports (Note 28.1.2) | (533,374 | ) | (84,837 | ) | 461,424 | |||||||
| Hedge of a net investment in a foreign operation (Note 28.1.3) | (971,954 | ) | 57,997 | (155,359 | ) | |||||||
| Cash flow hedge with derivative instruments (Note 28.1.4) | (52,174 | ) | 35,768 | 33,869 | ||||||||
| Equity instruments measured at fair value: | ||||||||||||
| Unrealized (loss) gain | - | (7,828 | ) | 126,205 | ||||||||
| Realized loss | - | – | (68,497 | ) | ||||||||
| Foreign currency translation | 2,599,242 | (257,147 | ) | (925,981 | ) | |||||||
| 1,041,740 | (256,047 | ) | (528,339 | ) | ||||||||
| Other comprehensive income that will not to be reclassified to profit or loss in subsequent periods (net of taxes): | ||||||||||||
| Remeasurement loss on defined benefit plans (Note 20.1) | (4,290 | ) | (1,548,043 | ) | (1,153,442 | ) | ||||||
| Other losses | - | (11,817 | ) | (46,826 | ) | |||||||
| (4,290 | ) | (1,559,860 | ) | (1,200,268 | ) | |||||||
| Other comprehensive income (loss) for the year, net of tax | 1,037,450 | (1,815,907 | ) | (1,728,607 | ) | |||||||
| Total comprehensive income for the year, net of tax | 13,392,840 | 6,153,487 | 1,518,873 | |||||||||
| Comprehensive income attributable to: | ||||||||||||
| Owners of parent | 12,363,132 | 5,353,778 | 784,658 | |||||||||
| Non–controlling interest | 1,029,708 | 799,709 | 734,215 | |||||||||
| 13,392,840 | 6,153,487 | 1,518,873 | ||||||||||
Consolidated statementsstatement of changes in equity
(Figures expressed inIn millions of Colombian pesos)
| Notes | Subscribed and paid-in capital | Additional paid-in capital | Reserves (1) | Other comprehensive income | Retained earnings (1) | Equity attributable to Company’s shareholders | Non- controlling interests | Total equity | Attributable to owners of parent | |||||||||||||||||||||||||||||||||||||||||||||||||||||||||||||
| Balance as of December 31, 2015 | 25,040,067 | 6,607,699 | 5,546,570 | 10,846,004 | (6,814,432 | ) | 41,225,908 | 1,875,055 | 43,100,963 | |||||||||||||||||||||||||||||||||||||||||||||||||||||||||||||
| Net income | - | - | - | - | 2,447,881 | 2,447,881 | 799,599 | 3,247,480 | ||||||||||||||||||||||||||||||||||||||||||||||||||||||||||||||
| Note | Subscribed and paid– in capital | Additional paid–in capital | Reserves | Other comprehensive income | Retained earnings | Total | Non– controlling interest | Total equity | ||||||||||||||||||||||||||||||||||||||||||||||||||||||||||||||
| Balance as of December 31, 2017 | 25,040,067 | 6,607,700 | 2,177,869 | 7,399,015 | 5,210,302 | 46,434,953 | 1,780,746 | 48,215,699 | ||||||||||||||||||||||||||||||||||||||||||||||||||||||||||||||
| Net profit | – | – | – | – | 11,381,386 | 11,381,386 | 974,004 | 12,355,390 | ||||||||||||||||||||||||||||||||||||||||||||||||||||||||||||||
| Dividends declared | (1,029,612 | ) | (1,029,612 | ) | 22.4 | – | – | – | – | (3,659,386 | ) | (3,659,386 | ) | (840,626 | ) | (4,500,012 | ) | |||||||||||||||||||||||||||||||||||||||||||||||||||||
| Legal reserve used to offset previous year loss | 24 | - | - | (3,869,907 | ) | - | 3,869,907 | - | - | - | ||||||||||||||||||||||||||||||||||||||||||||||||||||||||||||
| Appropriation of reserves, net | - | - | (117,819 | ) | - | 117,819 | - | - | - | – | – | 2,961,026 | – | (2,961,026 | ) | – | – | – | ||||||||||||||||||||||||||||||||||||||||||||||||||||
| Other movements | (23,637 | ) | (23,637 | ) | (6,086 | ) | (29,723 | ) | – | (1 | ) | – | – | (784 | ) | (785 | ) | 38 | (747 | ) | ||||||||||||||||||||||||||||||||||||||||||||||||||
| Other comprehensive income | ||||||||||||||||||||||||||||||||||||||||||||||||||||||||||||||||||||||
| Other comprehensive income: | ||||||||||||||||||||||||||||||||||||||||||||||||||||||||||||||||||||||
| Gain (loss) on hedging instruments: | ||||||||||||||||||||||||||||||||||||||||||||||||||||||||||||||||||||||
| Cash flow hedge for future exports | 31 | - | - | - | 461,424 | - | 461,424 | - | 461,424 | – | – | – | (533,374 | ) | – | (533,374 | ) | – | (533,374 | ) | ||||||||||||||||||||||||||||||||||||||||||||||||||
| Hedge of a net investment in a foreign operation | 31 | - | - | - | (155,359 | ) | - | (155,359 | ) | - | (155,359 | ) | – | – | – | (971,954 | ) | – | (971,954 | ) | – | (971,954 | ) | |||||||||||||||||||||||||||||||||||||||||||||||
| Cash flow hedge with derivative instruments | - | - | - | 24,546 | - | 24,546 | 9,323 | 33,869 | – | – | – | (37,904 | ) | – | (37,904 | ) | (14,270 | ) | (52,174 | ) | ||||||||||||||||||||||||||||||||||||||||||||||||||
| Net fair value gain on equity instruments measured at fair value | 11 | - | - | - | 57,708 | - | 57,708 | - | 57,708 | |||||||||||||||||||||||||||||||||||||||||||||||||||||||||||||
| Foreign currency translation | - | - | - | (811,345 | ) | - | (811,345 | ) | (114,636 | ) | (925,981 | ) | – | – | – | 2,529,268 | – | 2,529,268 | 69,974 | 2,599,242 | ||||||||||||||||||||||||||||||||||||||||||||||||||
| Actuarial valuation losses | 22 | - | - | - | (1,153,442 | ) | - | (1,153,442 | ) | - | (1,153,442 | ) | ||||||||||||||||||||||||||||||||||||||||||||||||||||||||||
| Other movements | - | - | - | (46,826 | ) | - | (46,826 | ) | - | (46,826 | ) | |||||||||||||||||||||||||||||||||||||||||||||||||||||||||||
| Balance as of December 31, 2016 | 25,040,067 | 6,607,699 | 1,558,844 | 9,222,710 | (402,462 | ) | 42,026,858 | 1,533,643 | 43,560,501 | |||||||||||||||||||||||||||||||||||||||||||||||||||||||||||||
| Remeasurement loss on defined benefit plans | – | – | – | (4,290 | ) | – | (4,290 | ) | – | (4,290 | ) | |||||||||||||||||||||||||||||||||||||||||||||||||||||||||||
| Balance as of December 31, 2018 | 25,040,067 | 6,607,699 | 5,138,895 | 8,380,761 | 9,970,492 | 55,137,914 | 1,969,866 | 57,107,780 | ||||||||||||||||||||||||||||||||||||||||||||||||||||||||||||||
| Notes | Subscribed and paid-in capital | Additional paid-in capital | Reserves (1) | Other comprehensive income | Retained earnings (1) | Equity attributable to Company’s shareholders | Non- controlling interests | Total equity | ||||||||||||||||||||||||||
| Balance as of December 31, 2014 | 10,279,175 | 6,607,612 | 17,963,370 | 3,980,749 | 8,192,040 | 47,022,946 | 1,511,282 | 48,534,228 | ||||||||||||||||||||||||||
| Net income (loss) | - | - | - | - | (7,193,859 | ) | (7,193,859 | ) | 904,880 | (6,288,979 | ) | |||||||||||||||||||||||
| Dividends declared | 24 | - | - | - | - | (5,468,521 | ) | (5,468,521 | ) | (715,051 | ) | (6,183,572 | ) | |||||||||||||||||||||
| Appropriation of reserves, net | - | - | 2,344,095 | (2,344,095 | ) | - | ||||||||||||||||||||||||||||
| Capitalization of reserves | 14,760,895 | - | (14,760,895 | ) | - | - | - | - | - | |||||||||||||||||||||||||
| Other movements | (3 | ) | 87 | - | - | 3 | 87 | - | 87 | |||||||||||||||||||||||||
| Other comprehensive income | ||||||||||||||||||||||||||||||||||
| Loss on hedging instruments: | ||||||||||||||||||||||||||||||||||
| Cash flow hedge for future exports | 31 | - | - | - | (217,291 | ) | - | (217,291 | ) | - | (217,291 | ) | ||||||||||||||||||||||
| Cash flow hedge with derivative instruments | - | - | - | (43,590 | ) | - | (43,590 | ) | (16,493 | ) | (60,083 | ) | ||||||||||||||||||||||
| Net fair value (loss) on equity instruments measured at fair value | 11 | - | - | - | (126,316 | ) | - | (126,316 | ) | - | (126,316 | ) | ||||||||||||||||||||||
| Foreign currency translation | - | - | - | 5,789,207 | - | 5,789,207 | 190,437 | 5,979,644 | ||||||||||||||||||||||||||
| Actuarial valuation gains | 22 | - | - | - | 1,404,602 | - | 1,404,602 | - | 1,404,602 | |||||||||||||||||||||||||
| Other movements | - | - | - | 58,643 | - | 58,643 | - | 58,643 | ||||||||||||||||||||||||||
| Balance as of December 31, 2015 | 25,040,067 | 6,607,699 | 5,546,570 | 10,846,004 | (6,814,432 | ) | 41,225,908 | 1,875,055 | 43,100,963 | |||||||||||||||||||||||||
(1) For comparative purposes, the initial balances of reserves and accumulated profits were reclassified, without changing the equity attributable to the shareholders of Ecopetrol. See note 2.8.
| Attributable to owners of parent | ||||||||||||||||||||||||||||||||||||
| Note | Subscribed and paid– in capital | Additional paid–in capital | Reserves | Other comprehensive income | Retained earnings | Total | Non– controlling interest | Total equity | ||||||||||||||||||||||||||||
| Balance as of December 31, 2016 | 25,040,067 | 6,607,699 | 1,558,844 | 9,222,710 | (402,462 | ) | 42,026,858 | 1,533,643 | 43,560,501 | |||||||||||||||||||||||||||
| Net profit | – | – | – | – | 7,178,539 | 7,178,539 | 790,855 | 7,969,394 | ||||||||||||||||||||||||||||
| Dividends declared | 22.4 | – | – | – | – | (945,684 | ) | (945,684 | ) | (551,494 | ) | (1,497,178 | ) | |||||||||||||||||||||||
| Appropriation of reserves, net | – | – | 619,025 | – | (619,025 | ) | – | – | – | |||||||||||||||||||||||||||
| Other movements | – | 1 | – | 2 | (1,066 | ) | (1,063 | ) | (48 | ) | (1,111 | ) | ||||||||||||||||||||||||
| Other comprehensive income: | ||||||||||||||||||||||||||||||||||||
| Gain (loss) on hedging instruments | ||||||||||||||||||||||||||||||||||||
| Cash flow hedge for future exports | – | – | – | (84,837 | ) | – | (84,837 | ) | – | (84,837 | ) | |||||||||||||||||||||||||
| Hedge of a net investment in a foreign operation | – | – | – | 57,997 | – | 57,997 | – | 57,997 | ||||||||||||||||||||||||||||
| Cash flow hedge with derivative instruments | – | – | – | 25,984 | – | 25,984 | 9,784 | 35,768 | ||||||||||||||||||||||||||||
| Loss on equity instruments measured at fair value | – | – | – | (7,828 | ) | – | (7,828 | ) | – | (7,828 | ) | |||||||||||||||||||||||||
| Foreign currency translation | – | – | – | (255,153 | ) | – | (255,153 | ) | (1,994 | ) | (257,147 | ) | ||||||||||||||||||||||||
| Remeasurement loss on defined benefit plans | – | – | – | (1,548,043 | ) | – | (1,548,043 | ) | – | (1,548,043 | ) | |||||||||||||||||||||||||
| Other movements | – | – | – | (11,817 | ) | – | (11,817 | ) | – | (11,817 | ) | |||||||||||||||||||||||||
| Balance as of December 31, 2017 | 25,040,067 | 6,607,700 | 2,177,869 | 7,399,015 | 5,210,302 | 46,434,953 | 1,780,746 | 48,215,699 | ||||||||||||||||||||||||||||
Ecopetrol S.A.
Consolidated statementsstatement of changes in equity
(Figures expressed inIn millions of Colombian pesos)
| Notes | Subscribed and paid- in capital | Additional paid-in capital | Reserves (1) | Other comprehensive income | Retained earnings (1) | Equity attributable to Company’s shareholders | Non- controlling interests | Total equity | ||||||||||||||||||||||||||
| Balance as of January 1st, 2014 | 10,279,175 | 6,607,540 | 15,300,725 | (86,956 | ) | 16,498,512 | 48,598,996 | 1,265,573 | 49,864,569 | |||||||||||||||||||||||||
| Net income | - | - | - | - | 5,046,517 | 5,046,517 | 623,056 | 5,669,573 | ||||||||||||||||||||||||||
| Dividends declared | 24 | - | - | - | - | (10,690,342 | ) | (10,690,342 | ) | (516,331 | ) | (11,206,673 | ) | |||||||||||||||||||||
| Appropriation of reserves, net | 24 | - | - | 2,662,645 | - | (2,662,645 | ) | - | - | - | ||||||||||||||||||||||||
| Other movements | - | 72 | - | - | (2 | ) | 70 | (11,914 | ) | (11,844 | ) | |||||||||||||||||||||||
| Other comprehensive income | ||||||||||||||||||||||||||||||||||
| Net fair value gain (loss) on equity instruments measured at fair value | 11 | - | - | - | 76,435 | - | 76,435 | - | 76,435 | |||||||||||||||||||||||||
| Foreign currency translation | - | - | - | 3,247,477 | - | 3,247,477 | 150,898 | 3,398,375 | ||||||||||||||||||||||||||
| Actuarial valuation gains | 22 | - | - | - | 743,793 | - | 743,793 | - | 743,793 | |||||||||||||||||||||||||
| Balance as of December 31, 2014 | 10,279,175 | 6,607,612 | 17,963,370 | 3,980,749 | 8,192,040 | 47,022,946 | 1,511,282 | 48,534,228 | ||||||||||||||||||||||||||
(1) For comparative purposes, the initial balances of reserves and accumulated profits were reclassified, without changing the equity attributable to the shareholders of Ecopetrol. See note 2.8.
| Attributable to owners of parent | ||||||||||||||||||||||||||||||||||||
| Note | Subscribed and paid–in capital | Additional paid–in capital | Reserves | Other comprehensive income | Retained earnings | Total | Non– controlling interest | Total equity | ||||||||||||||||||||||||||||
| Balance as of December 31, 2015 | 25,040,067 | 6,607,699 | 5,546,570 | 10,846,004 | (6,814,432 | ) | 41,225,908 | 1,875,055 | 43,100,963 | |||||||||||||||||||||||||||
| Net profit | – | – | – | – | 2,447,881 | 2,447,881 | 799,599 | 3,247,480 | ||||||||||||||||||||||||||||
| Dividends declared | (1,029,612 | ) | (1,029,612 | ) | ||||||||||||||||||||||||||||||||
| Legal reserve used to offset previous year loss | – | – | (3,869,907 | ) | – | 3,869,907 | – | – | – | |||||||||||||||||||||||||||
| Appropriation of reserves, net | – | – | (117,819 | ) | – | 117,819 | – | – | – | |||||||||||||||||||||||||||
| Other movements | – | – | – | – | (23,637 | ) | (23,637 | ) | (6,086 | ) | (29,723 | ) | ||||||||||||||||||||||||
| Other comprehensive income | ||||||||||||||||||||||||||||||||||||
| Gain (loss) on hedging instruments: | ||||||||||||||||||||||||||||||||||||
| Cash flow hedge for future exports | – | – | – | 461,424 | – | 461,424 | – | 461,424 | ||||||||||||||||||||||||||||
| Hedge of a net investment in a foreign operation | – | – | – | (155,359 | ) | – | (155,359 | ) | – | (155,359 | ) | |||||||||||||||||||||||||
| Cash flow hedge with derivative instruments | – | – | – | 24,546 | – | 24,546 | 9,323 | 33,869 | ||||||||||||||||||||||||||||
| Net fair value gain on equity instruments measured at fair value | – | – | – | 57,708 | – | 57,708 | – | 57,708 | ||||||||||||||||||||||||||||
| Foreign currency translation | – | – | – | (811,345 | ) | – | (811,345 | ) | (114,636 | ) | (925,981 | ) | ||||||||||||||||||||||||
| Remeasurement loss on defined benefit plans | – | – | – | (1,153,442 | ) | – | (1,153,442 | ) | – | (1,153,442 | ) | |||||||||||||||||||||||||
| Other movements | – | – | – | (46,826 | ) | – | (46,826 | ) | – | (46,826 | ) | |||||||||||||||||||||||||
| Balance as of December 31, 2016 | 25,040,067 | 6,607,699 | 1,558,844 | 9,222,710 | (402,462 | ) | 42,026,858 | 1,533,643 | 43,560,501 | |||||||||||||||||||||||||||
Consolidated statementsstatement of cash flows
(Figures expressed inIn millions of Colombian pesos)
| For the years ended December 31, | ||||||||||||||
| Note | 2016 | 2015 | 2014 | |||||||||||
| Cash flow provided by operating activities: | ||||||||||||||
| Net income (loss) for the period | 3,247,480 | (6,288,979 | ) | 5,669,573 | ||||||||||
| Adjustments to reconcile net income (loss) to cash provided by operating activities: | ||||||||||||||
| Income tax | 10 | 4,543,046 | 710,353 | 5,434,855 | ||||||||||
| Depreciation, depletion and amortization | 15,16,18 | 7,607,000 | 6,770,358 | 6,417,207 | ||||||||||
| Foreign exchange loss | 30 | (976,430 | ) | 5,566,614 | 2,270,193 | |||||||||
| Finance costs recognised in profit or loss | 3,345,515 | 2,396,445 | 1,405,331 | |||||||||||
| Dry wells | 2.8 - 16 | 342,691 | 1,266,440 | 1,563,384 | ||||||||||
| Loss on disposal of non-current assets | 78,990 | 59,932 | 231,899 | |||||||||||
| Impairment of assets | 1,003,140 | 7,856,177 | 2,381,413 | |||||||||||
| Fair value (gain) loss on financial assets valuation | (59,593 | ) | (109,673 | ) | 135,427 | |||||||||
| (Gain) loss on share of profit of associates and joint ventures | 14 | (61,345 | ) | 46,687 | (166,070 | ) | ||||||||
| (Gain) on sale of equity instruments measured at fair value | (47,129 | ) | (72,339 | ) | - | |||||||||
| Realized foreign exchange cash flow hedges | 25 | (33,074 | ) | (7,646 | ) | - | ||||||||
| Net changes in operating assets and liabilities | - | |||||||||||||
| Accounts and notes receivable | (1,400,583 | ) | 751,031 | 1,507,923 | ||||||||||
| Inventories | (217,198 | ) | (183,231 | ) | 610,843 | |||||||||
| Accounts payable | (619,131 | ) | (2,202,808 | ) | (322,819 | ) | ||||||||
| Taxes payable | 2,547,232 | (1,964,995 | ) | (3,124,887 | ) | |||||||||
| Labor obligations | (11,677 | ) | (206,444 | ) | (259,043 | ) | ||||||||
| Estimated liabilities and provisions | (827,153 | ) | (216,939 | ) | (146,499 | ) | ||||||||
| Other assets | 118,523 | 654,960 | (653,196 | ) | ||||||||||
| Income tax paid | (4,347,364 | ) | (3,148,028 | ) | (4,819,169 | ) | ||||||||
| Net cash provided by operating activities | 14,232,940 | 11,677,915 | 18,136,365 | |||||||||||
| Cash flows from investing activities: | ||||||||||||||
| Investment in property, plant and equipment | 15 | (3,646,929 | ) | (8,548,933 | ) | (8,923,568 | ) | |||||||
| Investment in natural and environmental resources | 2.8 - 16 | (2,121,295 | ) | (6,856,761 | ) | (6,601,680 | ) | |||||||
| Additions to intangibles | 18 | (69,253 | ) | (112,255 | ) | (112,018 | ) | |||||||
| Proceeds from sales of equity instruments measured at fair value | 11 | 966,715 | 613,998 | - | ||||||||||
| (Purchases) sales of other financial assets | (5,446,507 | ) | 1,208,898 | 1,313,837 | ||||||||||
| Interest received | 386,001 | 293,507 | 286,527 | |||||||||||
| Dividends received | 437,803 | 423,856 | 720,217 | |||||||||||
| Proceeds from sales of property, plant and equipment | 109,896 | 166,211 | 184,424 | |||||||||||
| Net cash used in investing activities | (9,383,569 | ) | (12,811,479 | ) | (13,132,261 | ) | ||||||||
| Cash flows from financing activities: | ||||||||||||||
| Proceeds from borrowings | 4,594,640 | 10,985,933 | 9,094,818 | |||||||||||
| Repayment of borrowings | (3,149,917 | ) | (4,903,592 | ) | (2,693,104 | ) | ||||||||
| Interest paid | (2,495,446 | ) | (1,981,127 | ) | (1,231,392 | ) | ||||||||
| Capitalizations | - | 3 | 41 | |||||||||||
| Dividends paid | 24 | (1,712,298 | ) | (5,493,400 | ) | (12,516,566 | ) | |||||||
| Net cash used in financing activities | (2,763,021 | ) | (1,392,183 | ) | (7,346,203 | ) | ||||||||
| Exchange difference in cash and cash equivalents | (226,333 | ) | 1,458,019 | 1,155,187 | ||||||||||
| Net increase (decrease) in cash and cash equivalents | 1,860,017 | (1,067,728 | ) | (1,186,912 | ) | |||||||||
| Cash and cash equivalents at the beginning of the year | 6 | 6,550,450 | 7,618,178 | 8,805,090 | ||||||||||
| Cash and cash equivalents at the end of the year | 8,410,467 | 6,550,450 | 7,618,178 | |||||||||||
| Non-cash transactions | ||||||||||||||
| Capitalization of reserves | - | 14,760,895 | - | |||||||||||
| Payment of income tax through offset of recoverable balances | 656,121 | 894,451 | - | |||||||||||
| For the years ended December 31, | ||||||||||||||||
| Note | 2018 | 2017 | 2016 | |||||||||||||
| Cash flow provided by operating activities: | ||||||||||||||||
| Net profit for the period | 12,355,390 | 7,969,394 | 3,247,480 | |||||||||||||
| Adjustments to reconcile the net profit to net cash provided by operating activities: | ||||||||||||||||
| Income tax expense | 10 | 8,258,485 | 5,800,268 | 4,543,046 | ||||||||||||
| Depreciation, depletion and amortization | 13,14,15 | 7,704,850 | 8,281,347 | 7,607,000 | ||||||||||||
| Foreign exchange loss | 27 | (372,223 | ) | (5,514 | ) | (976,430 | ) | |||||||||
| Finance cost of loans and borrowings | 27 | 2,399,414 | 2,385,994 | 2,765,024 | ||||||||||||
| Finance cost of post–employment benefits and abandonment costs | 27 | 668,782 | 753,047 | 580,491 | ||||||||||||
| Dry wells | 14 | 898,924 | 898,264 | 342,691 | ||||||||||||
| (Gain) loss on disposal of non–current assets | 75,835 | 26,686 | 78,990 | |||||||||||||
| Loss (gain) on acquisition of interests in joint operations | 30.3 | 12,065 | (451,095 | ) | – | |||||||||||
| Loss on impairment of short–term assets | 136,044 | 30,600 | 74,393 | |||||||||||||
| Impairment loss (impairment reversal) of long–lived assets | 16 | 368,634 | (1,311,138 | ) | 928,747 | |||||||||||
| Gain on fair value adjustment of financial assets | (92,906 | ) | (104,706 | ) | (59,593 | ) | ||||||||||
| Share of profit of associates and joint ventures | 12 | (165,836 | ) | (93,538 | ) | (61,345 | ) | |||||||||
| Net gain on the sale of assets held for sale | – | (166,389 | ) | – | ||||||||||||
| Gain on sale of equity instruments measured at fair value | – | (13,236 | ) | (47,129 | ) | |||||||||||
| Hedge ineffectiveness | 35,239 | 8,918 | – | |||||||||||||
| Realized foreign exchange cash flow hedges | 23 | (128,404 | ) | (160,772 | ) | (33,074 | ) | |||||||||
| Income tax paid | (6,650,116 | ) | (4,217,303 | ) | (4,347,364 | ) | ||||||||||
| Net change in operational assets and liabilities: | ||||||||||||||||
| Trade and other receivables | (2,039,161 | ) | (2,189,473 | ) | (1,400,583 | ) | ||||||||||
| Inventories | (448,135 | ) | (323,626 | ) | (217,198 | ) | ||||||||||
| Trade and other payables | 1,355,175 | 21,417 | (619,131 | ) | ||||||||||||
| Tax assets and liabilities | (1,413,915 | ) | (493,533 | ) | 2,547,232 | |||||||||||
| Provisions for employee benefits | (181,060 | ) | (227,384 | ) | (11,677 | ) | ||||||||||
| Provisions and contingencies | (89,345 | ) | 104,135 | (827,153 | ) | |||||||||||
| Other assets and liabilities | (218,542 | ) | 451,263 | 118,523 | ||||||||||||
| Net cash generated by operating activities | 22,469,194 | 16,973,626 | 14,232,940 | |||||||||||||
| Cash flow from investing activities: | ||||||||||||||||
| Investment in property, plant and equipment | 13 | (3,302,929 | ) | (2,363,283 | ) | (3,646,929 | ) | |||||||||
| Investment in natural and environmental resources | 14 | (5,051,828 | ) | (3,426,405 | ) | (2,121,295 | ) | |||||||||
| Acquisition of interests in joint operations | - | (141,950 | ) | – | ||||||||||||
| Acquisitions of intangibles | 15 | (105,669 | ) | (175,868 | ) | (69,253 | ) | |||||||||
| (Purchases) sales of other financial asset | (843,612 | ) | 564,754 | (5,446,507 | ) | |||||||||||
| Interests received | 383,624 | 405,562 | 386,001 | |||||||||||||
| Dividends received | 108,991 | 270,136 | 437,803 | |||||||||||||
| Proceeds from sales of assets held for sale | – | 159,041 | – | |||||||||||||
| Proceeds from sales of equity instruments measured at fair value | – | 56,930 | 966,715 | |||||||||||||
| Proceeds from sales of property, plant and equipment | 92,620 | 267,324 | 109,896 | |||||||||||||
| Net cash used in investment activities | (8,718,803 | ) | (4,383,759 | ) | (9,383,569 | ) | ||||||||||
| Cash flow used in financing activities: | ||||||||||||||||
| Proceeds from borrowings | 517,747 | 444,827 | 4,594,640 | |||||||||||||
| Repayment of borrowings | (9,270,262 | ) | (9,007,340 | ) | (3,149,917 | ) | ||||||||||
| Interest payments | (2,610,562 | ) | (2,696,979 | ) | (2,495,446 | ) | ||||||||||
| Dividends paid | (4,427,701 | ) | (1,504,647 | ) | (1,712,298 | ) | ||||||||||
| Net cash used in financing activities | (15,790,778 | ) | (12,764,139 | ) | (2,763,021 | ) | ||||||||||
| Exchange difference in cash and cash equivalents | 406,246 | (290,310 | ) | (226,333 | ) | |||||||||||
| Net (decrease) increase in cash and cash equivalents | (1,634,141 | ) | (464,582 | ) | 1,860,017 | |||||||||||
| Cash and cash equivalents at the beginning of the year | 7,945,885 | 8,410,467 | 6,550,450 | |||||||||||||
| Cash and cash equivalent at the end of the year | 6 | 6,311,744 | 7,945,885 | 8,410,467 | ||||||||||||
Non-cash transactions | ||||||||||||||||
| Offsetting of income tax through the use of balances in favor | – | – | 656,121 | |||||||||||||
Ecopetrol S.A.
Notes to Consolidated Financial Statementsthe consolidated financial statements
(Figures expressed in millions of Colombian pesos, unless otherwise stated)
| 1. | Reporting entity |
Ecopetrol S.A. (“Ecopetrol”) is a mixed economy company, withof a commercial nature, formedincorporated in 1948 in Bogotá – Colombia, headquartersparent company of the Ecopetrol Business Group. Its corporate purpose is to developconduct commercial or industrial activities arising from or related to the exploration, exploitation, production, refining, transportation, storage, distribution and sellingcommercialization of hydrocarbons and their by-productsderivatives and associated products, on its owndirectly or through its subsidiaries (hereafter “Ecopetrol”, the “Company” or Ecopetrol(collectively referred to as “Ecopetrol Business Group)Group”).
An 11.51% of Ecopetrol S.A.’s shares are publicly traded on the Stock Exchanges of Colombia and New York, USA and Lima, Peru.York. The remaining shares (88.49% of the total outstanding shares) are owned by the Colombian Ministry of Finance and Public Credit.
The address of the main office of Ecopetrol S.A. is Bogotá – Colombia, Carrera 13 No. 36 -– 24.
| 2. | Basis |
| 2.1 | Statement of compliance and authorization of |
TheseThe consolidated financial statements of Ecopetrol and its subsidiaries as of December 31, 2018 and 2017 and for the years ended on December 31, 2016, 20152018, 2017 and 20142016 have been prepared in accordance with International Financial Reporting Standards (IFRS) and their interpretations,, as issued by the International Accounting Standards Board (IASB). The Ecopetrol Business Group adopted IFRS starting January 1, 2015, with a transition date of January 1, 2014.
Accounting policies described in Note 4 have been applied consistently in all periods.years presented.
These consolidated financial statements were approved and authorized for issuance by Ecopetrol’s Managementthe Board of Directors of Ecopetrol on May 30, 2017.April 5, 2019.
| 2.2 | Basis for consolidation |
The consolidated financial statements were prepared by consolidating all companies set out in Exhibit 1, which are those whereover which Ecopetrol exercises direct or indirect control. Control is achieved when the Company:Ecopetrol Business Group:
| a) |
| b) |
| c) |
| d) |
Subsidiaries are consolidated from the date on which control is obtained until the date that such control ceases, using consistent accounting policies.ceases.
All inter-companyinter–company assets and liabilities, equity, income, expenses and cash flows relating to transactions between entities of the Ecopetrol Business Group were eliminated on consolidation. Unrealized losses are also eliminated. Non-controllingNon–controlling interest represents the proportion of profit, other comprehensive income and net assets in subsidiaries that are not attributable to Ecopetrol’sEcopetrol shareholders.
Ecopetrol S.A.
Notes to Consolidated Financial Statementsthe consolidated financial statements
(Figures expressed in millions of Colombian pesos, unless otherwise stated)
In 2015, the Board of Directors of Ecopetrol S.A authorized the creation of a Colombian company indirectly wholly owned by Ecopetrol S.A. This Company will develop offshore activities in Colombia, which the company currently carries out as operator and non-operator, and take advantage of the benefits of Decree 2682/14, “pursuant to which the conditions and requirements are established for declaring the existence of Permanent Offshore Free Trade Zones”. At December 31, 2015, the legal proceedings were pending to formalize the establishment of the subsidiary.
The following are the subsidiaries that were incorporated in 2016:the years indicated:
2018
| Ecopetrol |
2017
| § | Esenttia Resinas del Perú SAC: wholly–owned subsidiary whose corporate purpose is the commercialization of polypropylene resins and |
| 2.3 | Measurement basis |
The consolidated financial statements have been prepared on a historical cost basis, except for financial assets and liabilities that are measured at fair value through profit or loss and / and/or throughchanges in other comprehensive income at the end of each reporting period, as explained in the accounting policies included below.
Historical cost is generally based on fair value of the consideration given in exchange for goods and services.services.
The fair value is the price that would be received from selling an asset or that would be paid for transferring a liability among market participants, in an orderly transaction, on the date of measurement. When estimating the fair value, the Ecopetrol Business Group uses assumptions that market participants would use for pricing an asset or liability at current market conditions, including risk assumptions.
| 2.4 | Functional and presentation currency |
The functional currency of each group’s company is determined in relation to the main economic environment where they operate. The consolidated financial statements are presented in Colombian pesos,Pesos, which is the Group’sEcopetrol’s functional and presentation currency. For each Ecopetrol Business Group entity its functional currency is determined based of the main economic environment where it operates.
The statementstatements of profit or loss and statement of cash flows of subsidiaries with functional currencies different from Ecopetrol’sEcopetrol S.A.’s functional currency are translated at the exchange rates on the dates of the transaction or atbased on the monthly average exchange rate. Assets and liabilities are translated at the closing rate, and other equity items are translated at exchange rates at the time of the transaction. All resulting exchange differences are recognized in other comprehensive income. UponOn disposal of all or significant part of an interest in a subsidiary, the portion offoreign operation, the cumulative translation adjustment related to the companyparticular foreign operation is recognized in the consolidated statement ofreclassified to profit or loss.
The financial statements are presented in Colombian pesos rounded up to the closest million unit (COP 000,000) except when otherwise indicated.
Ecopetrol S.A.
Notes to Consolidated Financial Statements
(Figures expressed in millions of Colombian pesos, unless otherwise stated)
| 2.5 | Foreign currency |
InTransactions in foreign currencies are initially recorded by the preparation of the financial statements of Ecopetrol transactions in currencies other than the Company’sBusiness Group’s entities at their respective functional currency are recognizedspot rates at the rates of exchange prevailing at the date of the transactions. At the end of each reporting period, monetarytransactions date. Monetary items denominated in foreign currencies are translated at the functional currency spot rates prevailing at the period end and variations presentedreporting date. Differences arising on settlement or translation or monetary items are recognized in profit or loss, in financial results, net, except those resulting from the conversion of loans and borrowings designated as cash flow hedges or net investment in a business abroad,foreign operation hedge, which are recognized in other comprehensive income within equity. When the hedged item affects the financial results, exchange differences accumulated in equity are reclassified to the consolidated statement of profit or loss as part of operating results.
Ecopetrol S.A.
Notes to the operating result.consolidated financial statements
(Figures expressed in millions of Colombian pesos, unless otherwise stated)
Non-monetaryNon–monetary items carriedmeasured at fair value that are denominated in a foreign currenciescurrency are translated using the exchange rates prevailing aton the date when the fair value wasis determined.
Net investment in foreign operations includes equity financing and long-term inter-company loans for which settlement is neither planned nor likely to occur in the foreseeable future. The exchange differences derived from thegain or loss arising on translation of net investmentnon–monetary items measured at fair value is treated in a foreign operation are accumulatedline with the recognition of the gain or loss on the change in fair value of the other comprehensive income.item.
| 2.6 | Classification of assets and liabilities as current and |
InThe Ecopetrol Business Group presents assets and liabilities in the consolidated statement of financial position based on whether assets are classified as current or non–current.
An asset or liability is classified as current when:
| · | It is expected to be realized or intended to be sold or consumed (or expected to be settled, in the case of liabilities) in the ordinary course of business; |
| · | Held mainly for the purpose of trading; |
| · | Expected to be realised (or to be settled, in the case of liabilities) within twelve months after the reporting perior; or |
| · | In the case of the assets, it is cash or a cash equivalent, unless restricted from being exchanged or used to settle a liability for at least twelve months after the reporting period ; or |
| · | In the case of a liabilities, there is no unconditional right to defer settlement of the liability for at least twelve months after the reporting period. |
Other assets and liabilities are classified in accordance with their maturities between as non–current.
Deferred tax assets and liabilities are classified as non–current those with maturity equal to or less than twelve months,assets and non-current, those with maturity exceeding twelve months.liabilities.
| 2.7 | Earnings |
Basic earnings (loss) per share is calculated by dividing the profit for the year attributable to ordinary equity holders of Ecopetrol S.A., the parent company, by the weighted average number of ordinary shares outstanding during the year. There is no potential dilution of shares.
Ecopetrol S.A.
Notes to Consolidated Financial Statements
(Figures expressed in millions of Colombian pesos, unless otherwise stated)
| December 31, 2015 as previously reported | Reclassifications | December 31, 2015 as adjusted | ||||||||||
| Cash provided by operating activities: | ||||||||||||
| Dry wells | - | 1,266,440 | 1,266,440 | |||||||||
| Total cash provided by operating activities | 10,411,475 | 1,266,440 | 11,677,915 | |||||||||
| Cash provided by operating activities:: | ||||||||||||
| Investment in natural and environmental resources | (5,590,321 | ) | (1,266,440 | ) | (6,856,761 | ) | ||||||
| Total cash used in investing activities | (11,545,039 | ) | (1,266,440 | ) | (12,811,479 | ) | ||||||
| Cash and cash equivalents at the end of the year | 6,550,450 | - | 6,550,450 | |||||||||
| December 31, 2014 as previously reported | Reclassifications | December 31, 2014 as adjusted | ||||||||||
| Cash provided by operating activities: | ||||||||||||
| Dry wells | - | 1,563,384 | 1,563,384 | |||||||||
| Total cash provided by operating activities | 16,572,981 | 1,563,384 | 18,136,365 | |||||||||
| Cash provided by operating activities: | ||||||||||||
| Investment in natural and environmental resources | (5,038,296 | ) | (1,563,384 | ) | (6,601,680 | ) | ||||||
| Total cash used in investing activities | (11,568,877 | ) | (1,563,384 | ) | (13,132,261 | ) | ||||||
| Cash and cash equivalents at the end of the year | 7,618,178 | - | 7,618,178 | |||||||||
| 3. | Significant estimates and accounting judgments |
The preparation of the consolidated financial statements requires estimates from Company management to quantify somemake judgements, estimates and assumptions that affect the reported amounts of assets, liabilities, sales revenues, costs and commitments recognized in the financial statements. These estimates have been madestatements and the accompanying disclosures. The Ecopetrol Business Group based on the best available data for realized facts. Uncertainty on theits assumptions and estimationsestimates on parameters available when these consolidated financial statements were prepared. Uncertainty about these assumptions and estimates could result intoin outcomes that required a material future changes that could affectadjustment to the valuecarrying amount of assets or liabilities. The changes to suchliabilities affected in future periods. Changes in estimates are recognizedadjusted prospectively in a prospective manner during the period in which the estimate is reviewed.revised.
TheIn the process of applying the Ecopetrol Business Group’s accounting policies, management has made the following are accounting judgments and estimates withwhich have the most significant effect for preparingimpact on the amounts recognized in the consolidated financial statements:
| 3.1 | Oil and |
Measurements relating to depreciation, depletion, amortization, impairmentHydrocarbon reserves are estimates of the amount of hydrocarbons that can be economically and asset abandonment obligations are determined, in part, based onlegally extracted from the Company's estimated reserves ofEcopetrol Business Group’s oil and natural gas. Reserves estimation is an inherently complex process and it involves professional judgments.
gas properties.
Ecopetrol S.A.
Notes to Consolidated Financial Statementsthe consolidated financial statements
(Figures expressed in millions of Colombian pesos, unless otherwise stated)
The reserves estimation is conductedperformed annually atas of December 31 in accordance with the United States Securities and Exchange Commission (SEC) definitions and rules set forth in Rule 4-10(a)4–10(a) of SEC Regulation S-XS–X and the disclosure guidelines contained in the SEC final rule -– Modernization of Oil and Gas Reporting.
As required by current regulations, the future estimated date inon which a field will no longer produce for economic reasons, is based on actual costs and average of crude prices (calculated as the arithmetical average of prices on the first day of the past 12 months). The estimated date for end of production will affect the amount of reserves, unless the prices have been defined by contractual agreements; therefore, if the prices and costs change from one year to the other,next, the proved reserves estimate also changes. Generally, our proveproved reserves decrease as prices go down and increase when prices go up.
Reserves estimation is an inherently complex process and it involves professional judgments. Reserves estimations are prepared using geological, technical and economic factors, including projections of future production rates, oil prices, engineering data and lengthduration and amount of future investments, withand they imply a certain degree of uncertainty. These estimations reflect the regulatory and market conditions existing on the date of reporting, which could significantly differ from other conditions during the year or in future periods. Any changes in regulatory and/or market conditions and assumptions could materially affect the reserves estimation.
Impact of oil reserves and natural gas in depreciation and depletion
Changes in estimates of provedto estimations for proven developed reserves may affect the carrying amounts of exploration and production assets, natural resources and environment, goodwill, liabilities for dismantling and depreciation, depletion and amortization. With all other variables remaining unchanged, a decrease in estimated provedproven reserves would increase, prospectively, depreciation, depletion and amortization expenses,costs, while an increase in reserves would reduce depreciation and amortization expenses, as depreciation, depletion and amortization charges are calculated using the units of production method.
Information about the carrying amounts of exploration and production assets and the amounts charged to income, including depreciation, depletion and amortization, is presented in Notes 1513 and 16.14.
| 3.2 |
The CompanyManagement uses its professional judgment in assessing the existence of evidence of an impairment loss or reversal, based on internal and external factors. If
When an indicator of impairment indicators exist, Company estimatedor reversal of a prior periods impairment exists, the Ecopetrol Business Group estimates the recoverable amount of the cash generating units (CGU), which is considered to be the highergreater of the fair value less costs of disposal and the value in use.
The assessments require the use of estimates and assumptions, including:such as, among other factors: (1) Estimationestimation of the volumes and market value of oil and natural gas reserves; (2) production profiles for oilfields and the future production of refined and chemicalpetrochemical products; (3) investments, taxes and future costs; (4) useful life of assets; (5) future prices, andlong–term prices; (6) the discount rate, which is revised annually and determined as the weighted average cost of capital (WACC),; and (7) changes in environmental regulation, among other factors.regulation. The recoverable amount is compared to the carrying amount of the asset, or the cash generating unit, to determinate ifthus determining whether the asset is impaired.impaired or if the impairment recognized in prior periods should be reversed.
A previously recognized impairment loss is reversed only if there has been a change in the assumptions used to determine the assets or in the CGU’s recoverable amount since the last impairment loss was recognized. The reversal is limited so that the carrying amount of an asset or CGU, other than goodwill, does not exceed either its recoverable amount, or the carrying amount that would have been determined (net of amortization or depreciation) had no impairment loss been recognized for the asset or CGU in prior periods.
Ecopetrol S.A.
Notes to the consolidated financial statements
(Figures expressed in millions of Colombian pesos, unless otherwise stated)
Future oil price assumptions are estimated at current market conditions. Expected production volumes, which comprise provedproven unproved, probable and unprovedpossible reserves are used for impairment testing because management believes this to be the most appropriate indicator of expected future cash flows, which would also be considered by market participants. Reserves estimates are inherently imprecise and subject to risk and uncertainty. Furthermore, projections about unproved volumes are based on information that is necessarily less robust than thatwhat is available for mature reservoirs.
Changes inThese estimates and judgments mayassumptions are subject to risk and uncertainty. Therefore, there is a possibility that changes in circumstances will impact these projections, which may also impact the recoverable amount of the cash generating units and, as a consequence,assets and/or CGUs, hence, may also impactaffect the recognition of an impairment loss or recoverythe reversal of assetprior period impairment
amounts.
Ecopetrol S.A.
Notes to Consolidated Financial Statementsthe consolidated financial statements
(Figures expressed in millions of Colombian pesos, unless otherwise stated)
| 3.3 | Exploration and evaluation costs |
The application of the Ecopetrol Business Group’s accounting policy for exploration and evaluation costs requires judgment in order to determine whether future economic benefits are likely, either from future exploitation or sale, or whether activities have not reached a stage which permits a reasonable assessment of the existence of reserves. Certain exploration and evaluation costs are initially capitalized when it is expected that an economicallycommercially viable extraction operation can be established.reserves will result. The CompanyEcopetrol Business Group uses its professional judgment of future events and circumstances and makes estimates in order to annually assess annually the generation of future economic benefits for extracting the oil resources, as well as technical and commercial analyses to confirm intentits intention of continuing their development. Changes regarding available information, such as drilling success level or changes in the project'sproject’s economics, production costs, and investment levels, and others,as well as other factors, may result in capitalized exploration drilling costs being recognized as a cost in profit or loss for the period. Since 2016,The expenses for dry wells are treated as investmentis included in operating activities in the consolidated statement of cash flows.
3.4 Determination of cash generating units (CGU)
| 3.4 | Determination of cash generating units (CGU) |
The allocation of assets in cash generating units requires significant judgment, as well as interpretationsassessments regarding the integration betweenamong assets, the existence of active markets, and similar exposure to market risk, shared infrastructure, and the way in which management monitors the operations. See Note 4.12 - Impairment in the value–impairment of non–financial assets for more information.
| 3.5 |
According to environmental and oil regulations, the Company must recognizeEcopetrol Business Group is required to bear the costs for the abandonment of oil extraction and transportation facilities, which include the cost of plugging and abandoning wells, dismantling facilities, and environmental remediation in the affected areas.
The estimatedEstimated abandonment and dismantling costs of dismantling and abandonment of these facilities are recorded in the functional currency of each company at the time of the installation of assets. The estimated obligation created for the abandonmentassets and dismantling are subject to annual reviews and adjusted to reflect the best available estimation due to technological changes, political, economic, and environmental and security issues, as well as relationships with stakeholders.reviewed annually.
The determination ofcalculations for these estimations isare complex and involve significant judgmentjudgments by Management, such asManagement. The ultimate decommissioning costs are uncertain and cost estimates can vary in response to many factors, including changes to relevant legal requirements, the emergence of new restoration techniques or experience at other production sites. The expected timing, extent and amount of expenditure may also change, for example, in response to changes in internal cost projections, of costs, changes in reserve estimates, future inflation rates and discount rates. The CompanyEcopetrol Business Group considers that the abandonment and dismantling costs are reasonable, based on the experience of the Ecopetrol Business Group and market conditions; nevertheless, significant variations in external factors used for the calculation of the estimation could significantly impact the amounts recorded in the financial statements.
| 3.6 | Pension plan and other benefits |
The calculationdetermination of expenses, liabilities and adjustments relating to pension plans and other defined retirement benefits requiresmakes it necessary for management to use its judgment in the application of actuarial assumptions usedmade in suchthe actuarial calculation. The actuarial assumptions include estimates regarding future mortality, retirement, changes in compensation and discount rate in order to reflect the time value of money, over time, in addition to the rate of return on the plan'splan’s assets. Due to the complexity ofin the valuation of these variables, as well as the long termtheir long-term nature, the obligations that are definedestimated amounts are quite sensitive to any change ofin these assumptions.
These assumptions are reviewed on an annual basis for purposes of actuarial valuations and may differ materially from actual results due to changingchanges in economic and market conditions, regulatory events,changes, judicial rulings, higher or lower retirement rates, or longer or shorter life expectancies among employees. The calculation of pension bonds is maintained for compliance with the Company's pension obligations, in accordance with current regulations.
Ecopetrol S.A.
Notes to Consolidated Financial Statementsthe consolidated financial statements
(Figures expressed in millions of Colombian pesos, unless otherwise stated)
| 3.7 | Goodwill impairment |
The Company
In December of each year, the Ecopetrol Business Group performs an annual impairment test ofon goodwill to assess if itits carrying amount is recoverable. Goodwillis allocated to each of the cash-generating units (or groups of cash generating units) expecting to benefit from the synergies of the combination.may be impaired.
The determination of the recoverable valueamount is described in noteNote 4.12, and its calculation requires assumptions and estimations.estimates. The CompanyEcopetrol Business Group considers that the assumptions and estimations used are reasonable and supportable based on the current market conditions and are aligned to the risk profile of the related assets. However, if different assumptions and estimations may beare used, which wouldthey could lead to different results. Valuation models used to determine fair value are sensitive to changes in the underlying assumptions. For example, sales volumes and prices that will be paid for the purchase of raw materials are assumptions that may vary in the future. Adverse changes in any of these assumptions could lead to the recognition of goodwill impairment.
| 3.8 | Litigation |
The CompanyEcopetrol Business Group is subject to claims forrelating to regulatory and arbitration proceedings, tax assessments and other claims arising in the ordinarynormal course of business. Management evaluates these claims based on their nature, the likelihood that they materialize and the amounts involved, to decide on any changes to the amounts accruedrecognized and/or disclosed in the financial statements.
This analysis, which may require considerable judgment, includes the assessment of current legal proceedings brought against the CompanyEcopetrol Business Group and claims not yet initiated. A provision is recognized when the CompanyEcopetrol Business Group has a present obligation as a result ofderived from a past event, it is probablelikely that an outflow of resources embodyingof economic benefits will be required to settle the obligation, and a reliable estimate can be made of the amount of the obligation.such obligation can be made.
| 3.9 | Taxes |
Calculation of the income tax provision requires interpretation of the tax law in the jurisdictions where the Ecopetrol Business Group operates. Significant judgment is required to determine estimates for income tax on taxable profits and to evaluate the recoverability of deferred tax assets, which isare based on estimates of future taxable income and the ability to generate sufficient resultstaxable income during the periods in which such deferred taxes are deductible. Liabilities for deferred taxes are recorded in accordance with estimates of net assets that in the future will notcould be tax deductible.used or deduct.
To the extent that actual future cash flows and taxable income differ significantly from the estimates, the Company's capacity recover recordedEcopetrol Business Group’s ability to realize the deferred tax assets recorded could be affected.
Additionally,Furthermore, changes in tax rules could limit the capacity of the CompanyEcopetrol Business Group to obtain tax deductions in future years, as well as the recognition of new potentialtax liabilities resulting from questioningauditing conducted by the reviews of tax authorities.
Tax positions used implytaken involve a thorough evaluationassessment by Management, and these are reviewed and adjusted in response to situations such as expiryexpiration in applicationthe applicability of laws, closing of tax audits, additional disclosures caused by any legal issue or a court decision relatedrelevant to a particular tax issue. The Company createsEcopetrol Business Group records provisions based on the estimation of aestimated potential adverse decisionliabilities that could be derived from a tax audit. The amount of these provisions depends on factors such as previous experience in tax audits and different interpretations of tax rules by tax paying entities and tax authorities.legislation. The actual results may differ from recorded amounts.the estimates recorded.
| Hedge accounting |
The process of identifying hedging relationships between hedged items and the underlying instruments (derivative and non–derivative, such as long–term, foreign currency–denominated debt), and their corresponding effectiveness, requires the use of judgment by management. The Ecopetrol Business Group periodically monitors the alignment between its hedge instruments and its risk management policy.
Ecopetrol S.A.
Notes to Consolidated Financial Statementsthe consolidated financial statements
(Figures expressed in millions of Colombian pesos, unless otherwise stated)
The process of identifying hedge relations among hedging elements and instruments (derivative and non-derivative such as long term debt in foreign currency), and the related effectiveness requires management judgment. The Company periodically assesses alignment between identified hedges and its risk management policy.
| 4. | Accounting policies |
The accounting policies indicated below have been applied consistently applied infor all the periods presented, unless otherwise indicated.presented.
| 4.1 | Financial instruments |
A financial instrument is any contract that gives rise to a financial asset of one entity and a financial liability or equity instrument of another entity.
The classification of financial instruments depends on the nature and purpose for which the financial assets or liabilities were acquired and is determined at the time of initial recognition. Financial assets and financial liabilities are initially measured at their fair value.
Transaction costs that are directly attributable to the acquisition or issue of financial assets and financial liabilities (other than financial assets and financial liabilities at fair value through profit or loss) are added to or deducted from the fair value of the financial assets or financial liabilities, as appropriate, on initial recognition. Transaction costs directly attributable to the acquisition of financial assets or financial liabilities at fair value through profit or loss are recognized immediately in the statement of profit or loss.
FinancialAll financial assets with changes in profit or loss and other comprehensive income are statedinitially recorded at fair value. Financial instruments such as, loansLoans and trade receivables, other receivables and financial assets held-to-maturityheld–to–maturity are statedmeasured subsequently measured at amortized cost using the effective interest method.
AvailableEquity investments available for sale equity investments that do not have a market quotedquotation price and for which fair value cannot be reliably measured are measured at cost less any loss for impairment identified at the end of each reporting period.
FairMeasurements at fair value measurement
Fair value is the price that would be received to sell an asset or paid to transfer a liability in an orderly transaction between market participants at the measurement date. The fair value measurement is based on the presumption that the transaction to sell the asset or transfer the liability takes place either in the principal market forof the asset or liability or in the absence of a principal market in the most advantageous market for the asset or liability.
The fair value of an asset or a liability is measured using the assumptions that market participants would use when pricing the asset or liability, assuming that market participants act in their economic best interest.
A fair value measurement of a non-financial asset takes into account a market participant's ability to generate economic benefits by using the asset in its highest and best use or by selling it to another market participant that would use the asset in its highest and best use.
The Group uses valuation techniques that are appropriate in the circumstances and for which sufficient data are available to measure fair value, maximizing the use of relevant observable inputs and minimizing the use of unobservable inputs.
All assets and liabilities for which fair value is measured or disclosed in the financial statements are categorizedclassified within the fair value hierarchy,following scale, based on the lowest level input that is significant to the fair value measurement as a whole, as follows::
| · | Level 1: Quoted (unadjusted) market prices in active markets for identical assets |
| · | Level 2: |
| For derivative contracts for which a quoted market price is not available, fair value estimations are generally determined using models and other valuation methods, the key inputs for which include future prices, volatility estimates, price correlation, counterparty credit risk and market liquidity, as appropriate. For other assets and liabilities, fair value estimations are generally based on the net present value of expected future cash. |
| · | Level 3: |
Ecopetrol S.A.
Notes to Consolidated Financial Statements
(Figures expressed in millions of Colombian pesos, unless otherwise stated)
Effective interest rate method
The effective interest rate method is a method of calculating the amortized cost of a financial instrument and accounting of income or financial cost over the relevant period. The effective interest rate is the discount rate that exactly discounts estimated future cash receipts or payments (including all fees, transaction costs and other premiums or discounts) through the expected life of the financial instrument (or, when appropriate, at a shorter period), to the net carrying amount on initial recognition.
Ecopetrol S.A.
Notes to the consolidated financial statements
(Figures expressed in millions of Colombian pesos, unless otherwise stated)
Impairment
The Company assesses, at each reporting date, whetherEcopetrol Business Group evaluates if there is objective evidence that a financial asset or a groupofgroup of financial assets isare impaired. Financial assets are assessedevaluated for the impairment indicators at the end of each reporting period. Financial assets are considered to be impaired when there is objective evidence that, as a result of one or more events that occurred after initial recognition, the estimated future cash flows of the asset have been affected. For financial assets measured at amortized cost, the amount of the impairment loss recognized is the difference between the asset’s carrying amount and the present value of estimated future cash flows, discounted at the financial asset’s original effective interest rate.
De-recognition of financial assets and liabilities
Ecopetrol derecognizes a financial asset only upon expiration of the contractual rights to receive cash flows from the financial asset or, when it has transferred its rights to receive cash flows from the asset or has assume an obligation to pay the received cash flows in full without material delay to a third party and either (a) it has transferred substantially all the risks and rewards inherent in the ownership of the financial asset or (b) it has neither transferred nor retained substantially all the risks and rewards of the asset, but has transferred control of the asset.
When the Company neither transfer nor retain substantially all the risks and rewards of the asset nor transferred control of the asset, the Company continues recognizing the transferred asset, to the extent of it continuing involvement, and also recognizes an associated liability.
| 4.1.1 | Cash and cash equivalents |
Cash and cash equivalents include cash on hand, financial investments that are highly liquid, bank deposits and at banks and short-term investmentsspecial funds with original maturity dates of 90ninety days or less which are subject to an insignificant risksrisk of changes in value.
| 4.1.2 | Financial assets |
The Companyclassification of financial assets at initial recognition depends on the financial asset’s contractual cash flow characteristics and the Group’s business model for managing them. With the exception of trade receivables that do not contain a significant financing component or for which the Ecopetrol Business Group has applied the practical expedient, the Ecopetrol Business Group initially measures a financial asset at its fair value plus, in the case of a financial asset not at fair value through profit or loss, transaction costs. Trade receivables that do not contain a significant financing component or for which the Ecopetrol Business Group has applied the practical expedient are measured at the transaction price determined under IFRS 15.
The Ecopetrol Business Group classifies its financial assets in the following categories:
a) Financial assets measured at fair value through profit or loss
Financial assets at fair value through profit or loss are financial assets held for trading and financial assets designated at the time of the initial recognition at fair value through profit or loss. Financial assets are classified as held for trading if they are acquired to be sold or repurchased in the short term. Financial assets at fair value through profit or loss are carried at fair value with net changes in fair value recognized in the statement of profit or loss.
These are equity instruments of other non-controlled and non-strategic companies not allowing for any type of control or material influence thereon and where the Company management is not intended to negotiate with them in the short-term. These instrumentsThey are recognized forat their fair value and unrealized losses or gains are recognized in other comprehensive income. The sales revenues received by these equity instruments are recognized as financial sales revenues in the period results.
|
Atprofits arising at the time of sale or recognition of losses for impairment in its value, the cumulative adjustment for valuation in the other comprehensive income and the profit or loss in salere–measurement are recognized in the statement of profit or loss.
b) Financial assets measured at fair value with changes in other comprehensive income
These are equity instruments of other non–controlled and non–strategic companies not allowing for any type of control or significant influence thereon and where the Ecopetrol Business Group’s management does not intend to negotiate with them in the short term. These investments are recorded at their fair value and unrealized gains or losses are recognized in other comprehensive income and credited to the available for sale reserve until the investment is derecognized, at which time, the cumulative gain or loss is recognized in other operating income, or the investment is determined to be impaired, when the cumulative loss is reclassified from the available to sale reserve to the statement of profit or loss.
c) Financial assets at amortized cost
Loans and receivables are non-derivativenon–derivative financial assets with fixed or determinable payments that are not quoted in an active market. Loans and receivables, are classified as current, except when their maturity is longer than twelve months as of the date of the statement of financial position, in which case they are classified as non-current. Loans and receivables, including trade and other receivables, are measured initially measured at fair value and subsequentlythen at amortized cost using the effective interest rate method, less impairment.
Ecopetrol S.A.
Notes to the consolidated financial statements
(Figures expressed in millions of Colombian pesos, unless otherwise stated)
Loans to employees are initially recognizedrecorded using the present value of the future cash flows, discounted at the current market rate for similar loans. If the interest rate is less than the current market rate, fair value will be less than the amount of the loan. This difference is recorded as a benefit to employees.
This category is the most relevant to the Group. The Group measures financial assets at amortized cost if both of the following conditions are met:
| § | The financial asset is held within a business model with the objective to hold financial assets in order to collect contractual cash flows |
| § | The contractual terms of the financial asset give rise on specified dates to cash flows that are solely payments of principal and interest on the principal amount outstanding |
Financial assets at amortized cost are subsequently measured using the effective interest (EIR) method and are subject to impairment. Gains and losses are recognized in profit or loss when the asset is derecognized, modified or impaired.
The Group’s financial assets at amortized cost includes trade receivables, other receivables, loan to an associate, and loan to employees. For loan to employees if the interest rate is less than the current market rate, fair value will be less than the amount of the loan. This difference is recorded as a benefit to employees.
De–recognition of financial assets
The Ecopetrol Business Group derecognizes a financial asset only upon the expiration of the contractual rights to the cash flows of the asset or, when it has transferred its rights to receive such cash flows or has assumed the obligation to pay the cash flows received in full without material delay to a third party and (a) it has transferred substantially all the risks and benefits inherent in the ownership of the financial asset or (b) it has neither transferred nor retained substantially all the risks and benefits of the asset, but has transferred control of the asset.
When the Ecopetrol Business Group does neither transfer nor retain substantially all the risks and benefits of the asset or transfer control of the asset, the Ecopetrol Business Group continues to recognize the transferred asset, to the extent of its continuing participation, and it also recognizes the associated liability.
| 4.1.3 | Financial liabilities |
Financial liabilities correspond to the financing obtained by the CompanyEcopetrol Business Group through bank credit facilities and bonds, accounts payable to suppliers and creditors.
Bank credit facilities and bonds (this is the category most relevant to the Group) are initially recognized at their fair value, net of directly attributable transactions costs incurred. The difference between the amount receivedcost. After initial recognition, interest–bearing credit facilities and its nominal value is recognized in the results of the period during the time of amortization of the financial obligation,bonds are subsequently measured at amortized cost, using the effective interest rate (EIR) method. The effective interest method amortization is included as a financial expense in the statement of profit or loss. Gains and losses are recognized in profit or loss when the liabilities are derecognized as well as through the EIR amortization process. Amortized cost is calculated by taking into account any discount or premium on acquisition and fees or costs that are an integral part of the EIR. The EIR amortization is included as finance costs in the statement of profit or loss.
Accounts payable to suppliers and creditors are short short–term financial liabilities recorded at their nominal value, whichsince it does not significantly differ significantly from their fair value.
Derecognition
A financial liability is derecognized when the obligation underspecified in the liabilitycontract is discharged or cancelled or expires. When an existing financial liability ishas been replaced by another from the same lender, onunder substantially different terms, or the terms of an existing liability are substantially modified, such an exchange or modification is treated as the derecognitionde–recognition of the original liability and the recognized as a new liability. The difference inbetween the respective carrying amounts is recognized in the statement of profit or loss.
| 4.1.4 | Derivative financial instruments and hedging activities |
Financial derivative instruments are initially recognized in the statement of financial position as assets or liabilities and are measured at fair value on the date theon which a derivative contract is entered into and are subsequently measuredremeasured at fair value. Changes in the fair value of derivatives are recognized as gaingains or losslosses in the statement of profit or loss, except for the effective portion of cash flow hedges, which is recognizerecognized in other comprehensive income and later reclassified to profit or loss when the hedge item affects profit or loss.
The profit or lossChanges in fair value of derivative contracts, neither qualified norwhich do not qualify or are not designated as hedges, including forward salecontracts for the purchase and purchase contractssale of commodities in tradingunder negotiation for physical delivery or physical receivingreceipt of the commodity are registeredrecorded in profit or loss.
EmbeddedDerivatives embedded in the host contract are accounted for as separate derivatives in contracts that do not yet require being recognized at fair value and that are not directly related to the host contract in terms of economicsif their economic characteristics and risks are separated from theirnot closely related to those of the host contractcontracts and recognizedthe host contracts are not held for trading or designated at fair value; associated gains and lossesvalue through profit or loss. These embedded derivatives are measured at fair value with changes in fair value recognized in profit or loss.
|
| 4.1.5 | Hedging operations |
For purposepurposes of hedge accounting, hedges are classified as:
| § |
| § |
At the inception of a hedge relationship, the CompanyGroup formally designates and documents the hedge relationship to which it wishes to apply hedge accounting including the relationship between the hedging instrument and the hedged item, the risk management objectivesobjective and strategy to perform hedging transactions. Furthermore, suchfor undertaking the hedge. Such hedges are expected to be highly effective in achieving offsetting changes in fair value or cash flows and are assessed on an ongoing basis to determine thatwhether they actually have been highly effective throughout the financial reporting periods for which they were designated.
Ecopetrol S.A.
Hedging instruments are classified as non-current assets or liabilities when their expiration is more than 12 months fromNotes to the statementconsolidated financial statements
(Figures expressed in millions of financial position date,Colombian pesos, unless otherwise they are classified as current assets or liabilities.stated)
| 4.1.5.1 | Cash flow hedge |
The effective portion of the gain or loss on the hedging instrument is recognized in other comprehensive income,Other Comprehensive Income (OCI) in the cash flow hedge reserve, while any ineffective portion is recognized immediately in the statement of profit or loss, in the net financial results line item.loss.
The amounts previously recognizedaccumulated in other comprehensive incomeOCI are transferred to profit or loss. Whenaccounted for, depending on the nature of the underlying hedged transaction. If the hedged item istransaction subsequently results in the recognition of a non-financial asset or liability,item, the amounts previously recognizedamount accumulated in other comprehensive income are transferredequity is removed from the separate component of equity and included in the initial cost or other carrying amount of the cost of the non-financialhedged asset or liability.
If the hedging instrument expires or is sold, terminated or exercised without replacement or rollover, or if itits designation as a hedge is revoked or when the hedge no longer meets the criteria for hedge accounting, any cumulative gain or loss previously recognized in other comprehensive income remains separately in equity until the forecast transaction occurs is recognized in the consolidated statement of profit or loss. When it is no longer expected that the initially hedged transaction occurs, any profit or loss accumulated in equity is immediately recognized in profit or loss.will occur.
Ecopetrol designates long long–term loans as hedging instrumentinstruments for theirits exposure to the exchange risk in future oil exports. See Note 3128 for further information.
| 4.1.5.2 | Hedge of |
Hedges of a net investment in a foreign operation, including a hedge of a monetary item that is accounted for as part of the net investment, are accounted for in a way similar to the cash flow hedges.
Gains or losses on of the hedging instrument relatedrelating to the effective portion of the hedge are recognized in other comprehensive income,as OCI while any gains or losses relating to the ineffective portion are recognized in the statement of profit or loss. CumulativeOn disposal of the foreign operation, the cumulative value of any such gains or losses recorded in equity is transferred to the statement of profit or loss when the foreign subsidiary is partially or totally disposed of.loss.
|
Ecopetrol uses long allocates long–term loans as a hedge ofhedging instruments for its exposure to foreign exchange risk on its investment in subsidiaries whose functional currency is the U.S. dollar. See Note 3128 for further information.
| 4.2 | Inventories |
Inventories are stated at the lower of cost and net realizable value.
Inventories mainly comprise crude oil, fuels and petrochemicals and consumable inventories (spares and supplies).p.
The cost of crude oil is the production costs, including transportation costs.
The crudecost required to bring thea pipeline into working order, is treated as part of the related pipeline.
The cost of other inventories is determined based on the weighted average cost method, which includes acquisition costs (deducting commercial discounts, rebates and other similar items), transformation, and other costs incurred to bring inventory to their current location and condition, such as transportation costs.
Consumable inventories (spares and supplies) are recognized as inventory and then charged to expense, maintenance or project to the extent that such items are consumed.
Ecopetrol estimates the net realizable value of inventories at the end of the period. When the circumstances that previously caused inventories to be written down below cost no longer exist, or when there is clear evidence of an increase in the net realizable value because of a change in economic circumstances, the amount of the write-downwrite–down is reversed.Thereversed. The reversal cannot be greater than the amount of the original write-down,write–down, so that the new carrying amount will always be the lower of the cost and the revised net realizable value.
Ecopetrol S.A.
Notes to the consolidated financial statements
(Figures expressed in millions of Colombian pesos, unless otherwise stated)
| 4.3 | Related parties |
Related parties are considered those in which one party has the ability to control, or has joint control of the other, or exercises significant influence over the other party in making financial or operational decisions, or is a member of key management personnel (or close relative of a member). The Company has considered asEcopetrol Business Group considers related parties to be associates, joint ventures, key management executives, entities managing resources for payment of employee post-employmentpost–employment benefit plans and some relevant transactions with Colombian government entities for the purposes of certain relevant transactions, such as the purchase of hydrocarbons and the fuel price stabilization fund. See note 4.16.fund (see Note 29 – Related parties).
| 4.3.1 | Investments in associates |
An associate is an entity over which the Ecopetrol Business Group has significant influence but not control. Significant influence is the power to participate in the financial and operatingoperational policy decisions of the investee, but it is not control or joint control over those policies. Generally, these entities are those in which the Ecopetrol Business Group holds an equity interest is maintained fromwith voting rights of 20% to 50% of the voting rights.. See Exhibit I - –Consolidated companies, associates and joint ventures for further details..details.
Investments in associates are accounted for using the equity method. Under the equitythis method, the investment in an associate is initially recognized at cost. The carrying amount of the investment is adjusted to recognize changes in associates includes goodwill identified onthe Ecopetrol Business Group’s share of net assets of the associate since the acquisition whichdate. Goodwill related to the associate is included in the carrying amount of the investment and it is not tested for impairment separately.
|
The Company'sEcopetrol Business Group’s share of the results of operations of the associate is recognized in the consolidated statement of profit or loss. Any changeschange in other comprehensive income is recognized in other comprehensive income of the associates is recognized in the Company’s other comprehensive income.Ecopetrol Business Group.
After application of the equity method, the CompanyEcopetrol Business Group determines if it is necessary to recognize an impairment loss on its investment in its associate. At each reporting date, the CompanyThe Ecopetrol Business Group determines whether there is objective evidence that the investment in the associate is impaired. If there is such evidence, the Company calculates the amount of the impairment is calculated as the difference between the recoverable amount of the associate and its carrying value, and then recognizes the lossimpairment is recognized in the consolidated statement of profit or loss.
When necessary, the CompanyEcopetrol Business Group makes adjustments to the accounting policies of associates to ensure consistency with the policies adopted by the Company. In addition,Ecopetrol Business Group. Additionally, the equity method of these companies is measured on their most recent financial statements.
| 4.3.2 | Joint ventures |
A joint venture is a type of joint arrangement whereby two or morethe parties that have joint control of the arrangement have rights to the net assets of the joint arrangement. Joint control exists only when decisions about the relevant activities require unanimous consent of the parties sharing such control. The accounting treatment for the recognition of joint ventures is the same as investments in associates.
| 4.4 | Joint operations |
A joint operation is a type of joint arrangement whereby the parties that have joint control of the arrangement have rights to the assets and obligations for the liabilities, relating to the arrangement.
Joint operation contracts are entered into between Ecopetrol and third parties in order to share risk, secure capital, maximize operating efficiency and optimize the recovery of reserves. In these joint operations, one party is designated as the operator to execute the expense and investment budgetoperations and report to partners according to their participationparticipating interests. Furthermore,Likewise, each party takes its share of the produced hydrocarbons (crude oil or gas) produced, according to their production share.share in production.
When Ecopetrol participates as a non-operatornon–operator partner, it records the assets, liabilities, sales revenues, cost of sales and expenses based on the operator’s report. When Ecopetrol is the direct operator of joint venture contracts, it records its percentage of assets, liabilities, sales revenues, costs and expenses, based on the operators' report. When Ecopetrol is the direct operatorparticipation of the joint venture contracts, it records its percentage of the assets, liabilities, sales revenues, costs and expenses, based on each partner’s participation interestspartner in the items corresponding to assets, liabilities, expenses,sales revenues, costs and sales revenues.expenses.
Ecopetrol S.A.
Notes to the consolidated financial statements
(Figures expressed in millions of Colombian pesos, unless otherwise stated)
When the Ecopetrol Business Group acquires or increases its participation in a joint operation in which the activity constitutes a business combination, such transaction is recorded applying the acquisition method in accordance with IFRS 3 – Business combination. The acquisition cost is the sum of the consideration transferred, which corresponds to the fair value, on the date of acquisition of the assets transferred and the liabilities incurred. Any transaction cost related to the acquisition or increased share in the joint operation that constitutes a business combination is recognized in the consolidated statement of profit or loss.
The excess of the sum of the consideration transferred and the amount paid in the operation is recognized as goodwill. If the result is in an excess value of the net assets acquired over the amount paid in the operation, the difference is recognized as income in the consolidated statement of profit or loss on the date of recognition of the transaction.
| 4.5 |
Non-currentNon–current assets are classified as held for sale if their carrying values will be recovered principally through a sale transaction rather than through continued use. Non-currentNon–current assets are classified as held for sale only when the sale is highly probable within one year from the classification date of classification and the asset (or group of assets) is available for immediate sale in its present condition. These assets are measured at the lower of their carrying amount and fair value less related disposal costs.costs of disposal.
|
| 4.6 | Property, plant and equipment |
Recognition and measurement
Property, plant and equipment are stated at cost less accumulated depreciation and accumulated impairment losses. Tangible components related to natural and environmental resources are part of property, plant and equipment.
The initial cost of an assets comprises its purchase price or construction cost, including import duties and non-refundablenon–refundable purchase taxes, any costs directly attributable to bringing the asset into operation, costs of employee benefits arising directly from the construction or acquisition, borrowing costs incurred that are attributable to the acquisition and construction of qualifying assets and the initial estimate of the costs of dismantling and abandonment of the item.
Spare parts and servicing equipment are recorded as inventories and recognized as an expense as they are used. Major spare parts and stand-bystand–by equipment that the entity expects to use during more than one period are recognized as property, plant and equipment.
Any gain or loss arising from the disposal of a property, plant and equipment item is recognized in profit or loss of the period.
Subsequent disbursements
TheySubsequent disbursements correspond to all payments to be made on existing assets in order to increase or extend the initial expected useful life, increase productivity or productive efficiency, allow for significant reduction of operating costs, increase the level of reserves in exploration or production areas or replace a part or component of an asset that is considered critical for the operation.
The costs of repair, conservation and maintenance of a day to day nature are expensed whenas incurred. However, disbursements related to major maintenance are capitalized.
Depreciation
Property, plant and equipment is depreciated using the straight-linestraight–line method, except for those associated with exploration and production activities which are depreciated using the units-of-productionunits–of–production method. Technical useful lives are updated annually considering factors such as: additions or improvements (due to parts replacement or critical components for the asset’s operation), technological advances, obsolescence and other factors; the effect of this change is recognized from the period in which it was executed. Depreciation of an asset starts when it is ready to be used.
Ecopetrol S.A.
Notes to the consolidated financial statements
(Figures expressed in millions of Colombian pesos, unless otherwise stated)
Useful lives are determined based on the period over which an asset is expected to be available for use, physical exhaustion, technical or commercial obsolescence and legal limits or restrictions over the use of the asset.
The estimated useful life are as follows:of assets fluctuates in the following ranges:
Plant and equipment | |
| Buildings | |
| Other |
Land is recorded separately from buildings and facilities and they areit is not subject to depreciation.
Depreciation methods and useful lives are reviewed annually and adjusted if appropriate.
|
| 4.7 | Natural and environmental resources |
Recognition and measurement
Ecopetrol uses the successful efforts method to account for exploration and production of crude oil and gas activities, following the provisions of IFRS 6 – Exploration for the evaluation of mineral resources.
Exploration costs
Acquisition and exploration costs are recorded as exploration and evaluation assets until the determination of whether the exploration drilling is successful or not; if determined to be unsuccessful, all costs incurred are recognized as expenses in the consolidated statement of profit or loss.
Exploration costs are those incurred with the objective of identifying areas that are considered to have prospects of containing oil and gas reserves, including geological and geophysical, seismic costs, viability, and others, which are recognized as expenses when incurred. Furthermore, disbursements associated with the drilling of exploratory wells and those related to stratigraphic wells of an exploratory nature are charged as assets until it is determined if they are commercially viable; otherwise, they are expensed in the consolidated statement of profit or loss as as dry wells expense. Other expenditures are recognized as expenses when incurred.
An exploration and evaluation asset shallis no longer be classified as such when the technical feasibility and commercial viability of extracting a mineral resource are demonstrable. Exploration and evaluation assets shall beare reclassified to the natural and environmental resources account after being assessed for impairment, and any impairment loss recognised, before reclassification.impairment.
All capitalized costs are subjected to technical and commercial revisions at least once a year to confirm continuity to developthe evaluation and produce suchexploration efforts continue on the fields; otherwise, these costs are transferredwritten off through to profit or loss.
Exploration costs are net of the revenues obtained from the sale of crude oil during the extensive testing period, net of cost of sales, since they are considered necessary to complete the asset.
Development Costscosts
Development costs correspond to those costs incurred to obtain access to proved reserves and to provide facilities for extracting, treating, gathering and storing. When a project is approved for development, the accumulatedcorresponding capitalized acquisition and exploration costs isare classified as natural and environmental resources and costs subsequent to the exploration phase are capitalized as development costs of the properties that contain such natural resources. All development costs are capitalized, including drilling costs of unsuccessful development wells.
Ecopetrol S.A.
Notes to the consolidated financial statements
(Figures expressed in millions of Colombian pesos, unless otherwise stated)
Production costs
Production costs are those incurred to operate and maintain productive wells, and are part of the corresponding equipment and facilities. The productionProduction activity includes extraction of oil and gas to the surface, its gathering, treatment and processing as well as storage in the field. Production costs are expenses recorded in the consolidated statement of profit andor loss as incurred unless they add oil and gas reserves, in which case they are capitalized.
Production and support equipment is recognized at cost and is part of property, plant and equipment subject to depreciation.
Capitalized costs also include decommissioning, dismantling, retiring and restoration costs, as well as the estimated cost of future environmental obligations. The estimation includes plugging and abandonment costs, facility dismantling and environmental recovery of areas and wells. Changes arising in new abandonment liability estimations and environmental remediation are capitalized in the carrying amount of the related asset.
|
Depletion
Depletion of natural and environmental resources is determined using the unit-of-productionunit–of–production method per field, using proved developed reserves as a base. Amortization factorsbase, except in limited exceptional cases that require greater judgment by Management to determine a better amortization factor of future economic benefits over the useful life of the asset. Depreciation rates are reviewed annually, based on the reserve reportreserves reports and the impact of any changes of such factors on the amortization is recognized prospectively in the financial statements.
Reserves are auditedindependently estimated by internationally recognized external consultants and approved by the Company’sEcopetrol’s Board of Directors. Proved reserves consist of the estimated quantities of crude oil and natural gas demonstrated with reasonable certainty by geological and engineering data to be recoverable in future years from known reserves under existing economic and operating conditions, that is, at the prices and costs that apply at the date of the estimation.
Impairment
Assets associated to exploration, evaluation and production are subject to review for possible impairment in their recoverablecarrying amount. See notesNotes 3.2 – —Asset impairment (recovery) and 4.12 - —Impairment in the value of assets.non–financial assets.
| 4.8 | Capitalization of borrowing costs |
Borrowing costs related to the acquisition, construction or production of a qualifying asset that requires a substantial period of time to get ready for its intended use are capitalized as part of the cost of such asset when it is probable that future economic benefits associated with the item will flow to the CompanyEcopetrol Business Group and costs can be measured reliably. Other borrowing costs are recognized as finance costs in the period in which they are incurred.costs. Projects that have been suspended but that the CompanyEcopetrol Business Group intends to continue to pursue their developingdevelopment in the future, are not considered qualifying assets for the purpose of capitalization of borrowing costs.
| 4.9 |
Intangible assets with a defined useful life, which were acquired separately, are stated at cost less accumulated amortization and any impairment loss. Intangible assets are amortized under the straight straight–line method, over their estimated useful lives. The estimated useful lives and amortization method are revised at the end of each reporting period; any change in the estimates is recognized on a prospective basis.
The disbursements in relation to research activities are expensed as incurred.
| 4.10 | Goodwill |
Goodwill is initially measured at cost (being the excess of the aggregate of the consideration transferred and the amount recognisedrecognized for non-controlling interestsnon–controlling interest and any previous interest held over the net identifiable assets acquired and liabilities assumed). After initial recognition goodwill is measured at cost less any accumulated impairment loss. Goodwill is not amortized but annually tested for impairment.impairment annually.
Ecopetrol S.A.
Notes to the consolidated financial statements
(Figures expressed in millions of Colombian pesos, unless otherwise stated)
| 4.11 | Leases |
Leases are classified as finance leases whenever the terms of the lease transfer substantially all the risks and rewards of ownership. All other leases are classified as operating leases.
Assets held under finance leases, when Ecopetrol is the lessee, are recognized in the consolidated statement of financial position at an amount equal to the fair value of the leased asset or, if lower, the present value of the minimum lease payment. These assets are depreciated over the asset'sasset’s useful life. When there is no reasonable certainty that the company will obtain ownership of the asset at the end of the contract, the leased assets are depreciated in the shortest period between the asset estimated useful life and the lease term.
|
The corresponding liability to the lessor is included in the consolidated statement of financial position as a finance lease obligation, in the loans and financing line item.
Lease payments are apportioned between financial charges and reduction of lease liabilities in order to achieve a constant rate of interest on the liability remaining balance. Interest expenses areexpense is recognized immediately in the statement of profit or loss.
Operating lease payments are recognized as an expense on a straight-linestraight–line basis over the lease term, except where another systematic prorating basis is more representative of the time pattern of economic benefits from the lease. Contingent rentals arising under operating leases are recognized as an expense in the period in which they are incurred.
| 4.12 | Impairment |
In order to evaluate the recoverable amount ofif any tangible andor intangible assets are impaired, Ecopetrol compares theits carrying amount with its recoverable amount at the end of each reporting period or earlier, if there is any indicator that an asset may be impaired.
In order to make an
For purposes of impairment analysis,testing, the assets are grouped into cash generating units (CGU), provided that those assets individually considered do not generate cash inflows that, to a greater extent, are independent from those generated by other assets or CGUs. The groupgrouping of assets in different CGUs requires the exercise of professional judgment and the consideration, among other parameters, of the business segments. In this sense, in the segment of Exploration and Production segment, each CGU corresponds to each one of the different contractual areas commonly called “fields”;“fields;” by exception, in those cases in whichwhere the cash inflows generated by several fields are interdependent onfrom each other, those fields are grouped into a single CGU. In the case of the Refining and Petrochemicals, segment, the CGU´s correspondeach CGUs corresponds to each one of the refineries and companies in this segment of the groupEcopetrol Business Group and for the segment of Transportation segment; each pipeline system is taken asconsidered an independent CGU.
The recoverable amount of the asset is the higher amount of the fair value less costs of disposal or its value in use. If the recoverable amount of an asset (or of a CGU) is lower than its net carrying amount, such amount (or that of the CGU) is reduced to its recoverable amount, recognizing aan impairment loss for impairment of value in the results of the period.profit or loss.
The fairFair value less costs of disposal will be greateris usually higher than the value in use for the asset’s in the production segment due to use of the value in use methodology has some significant restrictions included in the estimation of future cash flows, as the following:such as: a) future capital expenses that improve the CGU performance, which could result in expected increase of net cash flows, and b) items before taxes that reflect specific business risks, resulting onin a higher discount rate.. The recoverable amount of assets in the business segments is the highest between the fair value less costs of disposal and value in use.rate.
The fairFair value less costs of disposal is determined as the sum of the future discounted cash flows adjusted to the estimated risk. The estimations of expected future cash flows used in the evaluationassessment of impairment of the assets are made with projectionsinclude estimates of futures commodity prices, supply and demand estimations, and the margins of the products. In case of assets or cash generating units engaged in the evaluation and exploration of reserves, proved, probable and possible reserves are considered, with a risk factor associated to them also being considered.
The calculations are verified withFair value less costs of disposal, as described above, is compared to valuation multiples and quoted prices of stockshares in companies comparable to Ecopetrol.Ecopetrol, in order to determine if it is reasonable.
Once aWhen an impairment loss for impairment of value has beenis recorded, future amortization expense isexpenses are calculated on the basis of the adjusted recoverable amount. Impairment losses may be reversedrecovered only if the reversalrecovery is related to a change in estimations used after theimpairment loss for impairment was recognized. These reversals shallrecoveries do not exceed the carrying amount of the assets net of depreciation or amortization that would have been determined if neither thesuch impairment had evernot been recognized, nor the recoverable amount on the date of assessment of the impairment.recognized.
|
In the reclassification of any non-current asset to assets held-for-sale, theThe carrying amount of thesenon–current assets reclassified as assets held–for–sale is revisedcompared to its fair value less costs of disposal. No other provision for depreciation, depletion or amortization is recorded if the fair value less costs of disposalsale is lower than the carrying amount.
Ecopetrol S.A.
Notes to the consolidated financial statements
(Figures expressed in millions of Colombian pesos, unless otherwise stated)
| 4.13 | Provisions and contingent liabilities |
Provisions are recognized when the Ecopetrol Business Group has a current obligation (legal or implied)constructive) as a result of a past event, it is probable that Ecopetrol will be required to settle the obligation, and a reliable estimation can be made of the amount of the obligation. Where applicable, they are recorded at present value, using a rate reflecting the liabilityrisk specific risk.to the liability.
DisbursementsFuture environmental decommissioning costs related to the conservation of the environment for current or future operations, are accounted for as expenses or assets, as the case may be. DisbursementsExpenditures related to past operations of the past that do not contribute to the obtaining of current or future income,benefits, are charged to expenses.expensed as incurred.
The creationrecognition of these provisions coincides with the identification of an obligation related to environmental remediation and Ecopetrol has adequateuses available information to determine a reasonable estimation of the related cost.
Contingent liabilitiesProvisions for which a negative outcome is assessed as possible are not recognized but are subject to disclosuredisclosed in the explanatory Notes whenever the outflow of resources is possible;notes; including those for which valuesthe amount cannot be estimated.
Whenever expectedIf there is an expectation that the provision iswill be reimbursed, either in whole or in part, for example by virtue of an insurance contract, the reimbursement isamounts expected to be reimbursed are recognized as a separate asset only in cases in whichwhen such reimbursement is almost certain. The expense corresponding to any provision is presented in the profit or loss statement in the line that best reflects the nature of the provision, net of any related reimbursement, to the extent that it is almost certain.
If the effect of the time value of money is significant, the provisions are discounted using the current market rate before taxes reflecting, as applicable, the liability specific risks. When recognizing the discount, the increase of the provision resulting from time elapsed is recognized as financial cost in the profit or loss statement.
Asset retirement obligation
Liabilities associated towith the retirement of assets are recognized when there are current obligations, either legal or implied,constructive, related to the abandonment and dismantling of wells, facilities, pipelines, buildings and equipment.
The obligation is usually acquiredrecorded when the assets are installed or when the surface or the environment are altered at the operating sites. These liabilities are recognizedcalculated using the discounted cash flow method, at allusing a pre–tax rate before taxes reflecting current market evaluations of aconditions similar risk liabilityliabilities and considering the economic limits of the field or the useful life of the respective asset. When it is not possible to determine a reliable estimation in the period in which the obligation originates, a provision is recognized when there is sufficientenough information available to make the best estimation.
The carrying amount of the provision is reviewed and adjusted annually considering changes in the variablesassumptions used for its estimation, using a rate that reflects the liabilityrisk specific risk.to the liability. Any change in the present value of the estimated expenditure is reflected as an adjustment to the provision and the corresponding property, plant and equipment and natural and environmental resources. When a decrease in the asset retirement obligation related to a producing asset exceeds the carrying amount of the asset, the excess is recognisedrecognized in the Consolidatedconsolidated statement of profit or loss. The financial costincrease in the provision due to the passage of updating these liabilitiestime is recognized in results for the period as a financial expense.
|
| 4.14 | Income tax and other taxes |
Income tax expense is comprised of income tax payable for the period (including, income tax and income tax for equality -– CREE, as appropriate) and the effect of deferred taxes in each period.
Current income taxes are recognized in income except when they relate to items recognized in other comprehensive income, in which case the corresponding tax effect is also recognized in equity.other comprehensive income. Income tax assets and liabilities are presented separately in the Consolidated Statementconsolidated statement of Financial Positionfinancial position, except where there is a right of set-offsetoff within fiscal jurisdictions and an intention to settle such balances on a net basis.
Income tax is paid by each legal entity and not on a consolidated basis.
| 4.14.1 | Current income tax |
The CompanyEcopetrol Business Group determines the provision for income tax based on the highest amount between taxable income and presumptive income (the minimum estimated amount of taxable profit on which the law expects to quantify and collect the income tax)taxes). Taxable income differs from profit before tax as reported in the consolidated statement of profit or loss, because of: items of income or expense that are taxable or deductible in other periods, special taxable deductions, tax losses and income and line items measured that, according to applicable tax laws in each jurisdiction, are considered nontaxable or nondeductible.
Ecopetrol S.A.
Notes to the consolidated financial statements
(Figures expressed in millions of Colombian pesos, unless otherwise stated)
| 4.14.2 | Deferred income tax |
Deferred tax is accounted for according toprovided using the liability method. Deferred tax assets and liabilities are recognizedmethod for future tax consequences attributable totemporary differences between the carrying amounts of existing assets and liabilities in the consolidated financial statements and their respective tax bases. A deferred tax liability is recognized for all taxable temporary differences. A deferred tax asset is recognized for all deductible temporary differences and for all accumulated tax losses, to be amortized, insofar asif there is a reasonable expectation that the CompanyEcopetrol Business Group will havegenerate future tax profits withagainst which it may offset such temporary differences.they will be used.
Deferred taxes on assets and liabilities are calculated based on the tax rates that will be appliedare expected to taxable incomeapply during the years in which temporary differences between the carrying amounts and tax bases are expected to be reversed.
The carrying amount of a deferred tax asset is subject to review at the end of each reporting period, and it is reduced to the extent it is estimatedno longer probable that therethe corresponding legal entity will not begenerate enough future taxable profit that allows the total or partial recovery of theto realize such deferred tax asset.
ConsolidatedIn the statement of financial position, deferred tax is calculatedassets are reflected net and as the sum of thean offset against deferred tax liabilities, depending on the overall tax position in a particular jurisdiction and on the individual financial statements of the companies of the Ecopetrol Business Group adjusted by deferred taxes on business combinations, inter-company transactions or other adjustments at a consolidated level.same taxable entity.
Deferred taxes are not recognized when they arise in the initial recognition of an asset or liability in a transaction (except in a business combination) and at the time of the transaction, doesdo not affect the accounting or tax profit, or in respect of the taxes on the possible future distribution of accumulated profits of subsidiaries or investments accounted for by the equity method, if at the time of the distribution it may be controlled by Ecopetrol and it is probable that the retained earnings will be reinvested by the Ecopetrol Business Group companies and, therefore, will not be distributed to Ecopetrol.
| 4.14.3 | Other taxes |
The CompanyEcopetrol Business Group recognizes in profit or loss the costs and expenses related to other taxes than the income tax, such as the wealth tax, which is determined based on the tax equity, the industry and commerce tax on income obtained in the municipalities for performance of commercial, industrial and service activities, and the transport tax on volumes loaded in the transport systems. Taxes are calculated in accordance with current tax regulations. For more details, see Note 10.
|
| 4.15 | Employee benefits |
Salaries and benefits for Ecopetrol staffof the Ecopetrol’s employees are governed by the Colombian Collective Labor (Agreement 01 of 1977), and, by the Colombian Substantive Labor Code. In addition to the legally mandated benefits determined by labour laws, employees are entitled to fringe benefits which are subject to the place of work, type of work, length of service, and basic salary. An annual interest of 12% is recognized on accumulated severance amounts for each employee, and the payment of compensationscompensation is provided for when special circumstances arise resulting in the non-voluntarynon–voluntary termination of the contract, without justjustified cause, and in periods other than the probationary period.
Ecopetrol belonged to the special pension regime under which allowancespension liabilities are a Company’sEcopetrol’s responsibility and not a Pension Fund’spension fund’s responsibility. However, Law 797 of January 29, 2003 and Legislative Act 001 of 2005 determined that Ecopetrol will no longer belong to the said regime and that from thereonthat point on employees would be part of the General Pension Regime. Consequently, allowances forpension obligations related to employees pensioned until July 31, 2010 are still Ecopetrol’s responsibility. Likewise, these employeesEmployees are entitled to such pension bonus if they worked with Ecopetrol prior to January 29, 2003, but whose labor agreement expired without renewal before that date.
All labor benefits of employees who joined the CompanyEcopetrol before 1990 are Ecopetrol’s responsibility, without the involvement of any social security entity or institution. TheService cost of health services for the employee and his/her relatives registered with the CompanyEcopetrol is determined by means of a mortality table, prepared based on facts occurring during the year.
Ecopetrol S.A.
Notes to the consolidated financial statements
(Figures expressed in millions of Colombian pesos, unless otherwise stated)
For employees who joined Ecopetrol after the Company subsequent to the entry into effect of Act 50 of 1990 the Companywent in effect, Ecopetrol makes periodic contributions for severance payments, pensions and labor risks to the respective funds.
In 2008, Ecopetrol partially commutedsettled the value corresponding to monthly pension payments from its pension liabilities, transferring such liabilities and their underlying amounts to pension-related autonomous equitiespension funds (PAP, for its acronym in Spanish). The funds transferred, and returns on those funds, cannot be redirected, nor can they can be returned to the CompanyEcopetrol Business Group, until all of the pension obligations have been fulfilled. The commutedsettled obligation covers allowances and pension bonds payments; while health and education remainsremained under the labor liability in chargeresponsability of Ecopetrol.
Employee-benefitsEmployee benefits are divided into four groups comprised as follows:
a) Short–term employee benefits and post–employment defined benefits:
Benefits to employees in the short term mainly correspond to those which payment will be made in the term of twelve months following the closing of the period in which the employees have rendered their services. These mainly include salaries, severance payments, vacation, bonuses and other benefits.
Post-employmentPost–employment benefits of defined contributions plans correspond to the periodic payments for severance, pensions and labor risk payments that the CompanyEcopetrol Business Group makes to the respective funds that assume these obligations in their entirety.
The above benefits are recognized as an expense with an associated liability after deducting any already paid amounts.
b) Post–employment defined benefit plans:
|
In the defined benefits plan, the CompanyEcopetrol Business Group provides the benefits agreed to current and former employees and assumes the actuarial and investment risks.
The following benefits are classified as long-termlong–term defined benefit plans recognized in the financial statements according to the calculations of an independent actuary:
| · | Pensions |
| · | Pension bonds |
| · | Health |
| · | Educational plan |
| · | Retroactive severances |
Liabilities recognized in the statement of financial position inwith respect ofto these benefit plans are determined base on the present value of the defined benefit obligation at the date of the statement of financial position less the fair value of plan assets.
The defined benefit obligation is calculated annually by independent actuaries using the projected credit unit method, which takes into account employees’ years of service and, for pensions, average or final pensionable remuneration. This obligation is discounted at its present value using interest rates of high-qualityhigh–quality government bonds denominated in the currency in which the benefits will be paid and of a duration consistent with the plan obligations.
These actuarial calculations involve several assumptions that could differ from the events that will effectively take place in the future. Said assumptions include the determination of thea discount rate, future salary increases, mortality rates and future pension increase.increases. Because of the complexity of the calculation, the underlying assumptions and long-termlong–term nature of these plans, the obligations for defined benefits are extremely sensitive to changes in assumptions. All key variablesassumptions are revised at the closeend of the reported period.
WhenIn determining the appropriate discount rate, in absence of a broad high quality bond market, Management considers interest rates corresponding to the class B TES bonds issued by the Colombian Government as its best reference, at an appropriate discount rate with maturities extrapolated in line with the term expected for each benefit plan. The mortality rate is based on the particular country’s rate, whichthe latest version of which is the RV08 mortality table published in resolution 1555 of October 2010. The future salary and pension increases are linked to the country'scountry’s future inflation rates. Note 22 - –Provisions for employee benefits provides further details on key assumptions used.
Ecopetrol S.A.
Notes to the consolidated financial statements
(Figures expressed in millions of Colombian pesos, unless otherwise stated)
The amounts recognized in the consolidated statement of profit or loss related to employees defined benefit plans are comprised mainly by service cost and the net interest.financial expense. Service cost includes mainly the increase in present value of the benefit obligation during the period (current service cost) and the amount resulting from a new benefit plan. Plan amendments corresponds to changes in benefits and are usually recognized when all legal and regulatory approvals have been obtained and the effects have been conveyed to the employees involved. The net interestfinancial expense is calculated using the net liability for defined benefits as compared with the yield curve of the discount rate at the beginning of each year for each plan. The net defined benefit liabilityobligation or asset resulting from actuarial profits and losses, the asset ceiling effect and the asset profitability, excluding the value of recognized in the consolidated statement of profit or loss, are recognized in other comprehensive income.
There is no service cost for the pension plan of employees because in their capacity as pensioners there is no service time to which the pension benefit can be charged; in other words, the benefit is 100% cost and is not in the cumulative stage.
When the plan assets exceed the gross obligation, the recognized asset is limited to the lower of the surplus in the defined benefits plan and the ceiling of assets determined using a discount rate based on Colombian Government bonds.
(a) Others long-term benefits
|
Other long-term benefit isOthers long–term benefits include the five-yearfive–year term bonus which also considered in the actuarial calculation. This benefit is a cash bond that accumulates annually and is paid every five years to employees. The CompanyEcopetrol Business Group recognizes in the consolidated statement of profit or loss the service cost, the net financial cost and the adjustment to the obligation of the defined benefit plan.
(b) Termination benefits
Termination benefits are recognized only when a detailed plan exists for such process and there is no possibility to withdraw the offer. The CompanyEcopetrol Business Group recognizes a liability and an expense for termination benefits at the earliest date between the date when the offer of such benefits cannot be withdrawn and the date when the restructuring costs are recognized.
| 4.16 | Revenue from contracts with customers |
SalesThe Ecopetrol Business Group’s business is based on three principal sources of revenue from contracts with customers: 1) sales of crude oil and natural gas, 2) services associated with the transport of hydrocarbons, and 3) sales of refined products, petrochemicals and biofuels. Revenue from contracts with customers is recognized when control of the goods or services are transferred to the customer at amount that reflects the timeconsideration that the Ecopetrol Business Group expects to be entitled in exchange for those goods or services.
Sales of crude oil and natural gas
Revenue from sales of crude oil and natural gas is recognized upon transfer of titlecontrol to the buyer, including risksthis generally occurs when the product is physically transferred into a vessel, pipe or other delivery methods.
For some natural gas supply contracts with a replacement period, a distinction is made between quantities of gas consumed and rewardsnot consumed in order to recognize the respective revenue or liability relating to quantities that will be requested in the future. Once the customer claims such natural gas, the revenue is recognized.
Services associated with hydrocarbons transport
Revenue from transport services is recognized when the service is provided to the customer and there are no contractual conditions that prevent recognition of ownership. the revenue. Ecopetrol Business Group companies is the principal in providing these services.
Ship/ Take-or-Pay contracts for the sale of refined products, storage and transport specify minimum quantities of products or services for which a customer will pay, even if the latter does not receive them or use them (“deficient quantities”). Although the Ecopetrol Business Group expects customers to recover all deficient quantities to which they are contractually entitled, any load revenue received related to temporary shortfalls that will be offset in a future period will be deferred and that amount recognized as revenue in the event any of the following scenarios occurs:
Ecopetrol S.A.
Notes to the consolidated financial statements
(Figures expressed in millions of Colombian pesos, unless otherwise stated)
a)The customer exercises its right to deficient volumes or services, or
b) The possibility is remote that the customer will exercise its right to deficient volumes or services.
Refined products and biofuels
In the case of refined products, petrochemicals and petrochemical products, salesbiofuels, such as fuel oil, asphalt, polyethylene, LPG and propane and gasoline, etc., revenue is recognized when the products are shipped and delivered by the refinery andrefinery; subsequently, they are adjusted in accordance withfor price changes, when dealingin the case of products with regulated price products. Salesprices.
In other cases, Ecopetrol Business Group recognize revenue from transportation services is recognized when products are transported and deliveredsatisfies the performance obligation, giving rise to the buyer in accordance with sale terms. In all other cases, sales revenue is recognized at the time it is earned and a true,certain, probable and quantifiable right to demand its payment arises.payment.
Under current regulations,local regulation, Ecopetrol and Refinería de Cartagena S.A., sellsells regular gasoline and mid-distillatesACPM in Colombia at a regulated price.
In accordance with Decree 1068 of 2015, the Ministry of Mines and Energy calculates semi-annuallysemiannually and settles Ecopetrol’s net position to be stabilized for each fuel by the Fuel Price Stabilization Fund (FEPC, for its acronym in Spanish). The net position is calculated by adding all differentialscorresponds to the sum of the spreads throughout the six-month period andsemester, the result is anof which will be the amount in Colombian pesos in favor of the Company and chargeablecharged to the resources of the FEPC. The differential is calculated ascorresponds to the product between the volume reported by the Company at the time of sale multiplied byand the difference between the international parity price and the regulated price. The internationalreference price, the parity price isbeing that which corresponds to the daily priceprices of gasolinethe motor and diesel oilgasoline observed during the month, expressed in pesos, referenced to the Gulf of the respective month in Colombian pesos, indexed to the United States of America Gulf market, calculated in accordance withby applying Resolution 18 0522 of 2010, and the reference price is the Producer Price referenceIncome defined by the Ministry of Mines and Energy.Energy for these purposes. Therefore, this difference representsdifferential constitutes a highergreater or lowerlesser value of sale sales revenuesrevenue for Ecopetrol.
According to the risk profiles, the Ecopetrol andRefineríBusiness Group manages advance payment systems for some of its contracts with customers.
Significant financing component
Generally payments received from customers are short term. Using the practical expedient in IFRS 15, the Group does not adjust the promised amount of consideration for the effects of a de Cartagenasignificant financing component if it expects, at contract inception, that the period between the transfer of the promised good or service to the customer and when the customer pays for that good or service will be one year or less.
Variable considerations
Upon fulfillment of the obligations set forth in agreements with customers, via delivery of the product or provision of the service, variable components of the transaction price may exist, such as the exchange rate for crude exports or international price fluctuations. In these cases, the Ecopetrol Business Group will make its best estimate of the transaction price that reflects the goods and services transferred to customers.
Agreements signed with customers do not include variable considerations like rebates, refunds or discounts.
Non-cash considerations
Agreements signed in the Ecopetrol Business Group does not consider non-cash transactions.
Customer advances
These correspond to contractual obligations in which the Ecopetrol Business Group receives advances from customers. These advances by customers form part of the policies and risk assessment defined by the Business Group.
Ecopetrol S.A.
Notes to the consolidated financial statements
(Figures expressed in millions of Colombian pesos, unless otherwise stated)
| 4.17 | Costs and expenses |
Costs and expenses are presented according to their nature; they are detailed in the related disclosures in cost of sales, and administrative, operating, projects and other associated expenses.
| 4.18 |
The financialFinance income and expenses include mainly: a) cost of interestborrowings costs on loans and financing, except for those that are capitalized as part of theon qualifying asset, cost, b) valuation of profitsgains and losses on changes in fair value of financial instruments measured at fair value with changes inthrough profit or loss, c) currency exchange differences of financial assets and liabilities, except for debt instruments designated as hedging instruments, d) interest expenses for financial updatingas a result of long discounting long–term liabilities (abandonment costs and pension liabilities), e) dividends derived from equity instruments measured at fair value with changes in other comprehensive income.
Ecopetrol S.A.
(Figures expressed in millions of Colombian pesos, unless otherwise stated) |
| 4.19 | Information by business segment |
Ecopetrol presents the respective disclosures relativeinformation related to its business segments in its consolidated financial statements in accordance with paragraph 4 of IFRS 8 -– Operation segments.
The operationoperations of the Ecopetrol Business Group isare performed through three business segments: 1) Exploration and production,Production, 2) Transport and logistics,Logistics and 3) Refining, petrochemicalPetrochemical and biofuels. This segmentation isBiofuels. Segments are determined based on management of objectives and corporate strategic plan,plans, considering that these businesses: (a) are engaged in differentialdifferent commercial activities, which generate sales revenuesrevenue and incur costs and expenses; (b) the operational results are revised regularly by the Group'sEcopetrol Business Group’s Governance that makes operational decisions to allocate resources to the various segments and assess their performance; and (c) there is differentiated financial information available. Internal transfers represent sales to inter-companyinter–company segments and are registeredrecorded and presented at market prices.
| Exploration and production |
| Transport and |
| Refining, petrochemicals and |
See information by segments in Note 31.
Ecopetrol S.A. Notes to the consolidated financial statements (Figures expressed in millions of Colombian pesos, unless otherwise stated)
|
| 5. |
The following rules,new and amended standards and interpretations that are issued, but not yet effective, up to the date of issuance of the Ecopetrol Business Group’s financial statements are disclosed below. The Ecopetrol Business Group intends to adopt these new and amendmentsamended standards and interpretations, if applicable, when they become effective.
- IFRS 16 “Leases: was issued in January 2016 and replaces IAS 17“Leases”, IFRIC 4“Determining whether an Agreement contains a lease” SIC-15“Operational leases – Incentives” and SIC-27,“Evaluating the Substance of Transactions involving the Legal Form of a Lease”. IFRS 16 sets out the principles for the recognition, measurement, presentation and disclosure of leases and requires lessees to account for all leases under a single on-balance sheet model similar to the accounting for finance leases under IAS 17. The standard includes two recognition exemptions for lessees - leases of “low value” assets (e.g., personal computers) and short-term leases (i.e., lease with a lease term of 12 months or less). At the commencement date of a lease, a lessee will recognize a liability to make lease payments (i.e., lease liability) and an asset representing the right to use the underlying asset during the lease term (i.e., the right-to-use asset). Lessees will be required to separately recognize interest expense on the lease liability and the depreciation expense on the right-of-use asset.
Lessees will be also required to remeasure the lease liability upon the occurrence of certain events (e.g., a change in lease term, a change in future lease payments resulting from a change in an index or rate used to determine those payments). The lessee will generally recognize the amount of the remeasurement of the lease liability as an adjustment to the right-of-use asset.
Lessor accounting under IFRS 16 is substantially unchanged from today’s accounting under IAS 17. Lessors shall continue to classify all leases using the same classification principle as in IAS 17 and distinguish between two types of leases: operating and financial leases.
IFRS 16, which is effective for annual periods beginning on or after January 1, 2019, requires lessees and lessors to make more extensive disclosures than under IAS 17.
Transition to IFRS 16
Ecopetrol Business Group will adopt IFRS 16 as of January 1, 2019, using a modified retrospective approach on contracts previously identified as leases under IAS 17 and IFRIC 4.
The Ecopetrol Business Group will elect to use the exemptions proposed by the IASB are applicablestandard on lease contracts for which the lease terms ends within 12 months as of the date of initial application, and lease contracts for which the underlying asset is of low value (e.g., computers, mobile telephones, printers, photocopiers, etc.).
During 2018 the Ecopetrol Business Group has performed an assessment of the impact IFRS 16 upon initial application and concluded that it will not have a significant impact in its consolidated financial statements.
Leases in which Ecopetrol Business Group is a lessee
Ecopetrol Business Group will recognize right-of-use assets and a lease liability, currently accounted for as operating leases, primarily on the following leased assets:
| § | Lands |
| § | Vehicles |
| § | Power plants |
| § | Water treatment plants |
| § | Helicopters |
Ecopetrol S.A.
Notes to yearly periods commencingthe consolidated financial statements
(Figures expressed in millions of Colombian pesos, unless otherwise stated)
Prior to the adoption of IFRS 16, Ecopetrol Business Group, recognized operating lease expenses on a straight-line basis during the lease term. Upon application of IFRS 16, Ecopetrol Business Group will instead recognize a depreciation charge on the right-of-use asset and a financial expense related to the lease liability.
Based on currently available information, upon application of IFRS 16, the Ecopetrol Business Group estimates it will recognize a right-to-use asset for approximately COP$430,000 as of January 1, 20172019, and thereon:a lease liability for the same amount, which are not considered material. The actual impact upon adoption could be different.
| - |
| - | IFRS |
This new standard is applicable to all entities and will derogate all previous standards on sales revenue recognition.
| - |
When there is uncertainty regarding treatment of the capital gains tax, the Company must determine whether it considers each uncertain tax treatment separately or in combination with one or more other uncertain tax treatments based on the focus that best predicts resolution of the uncertainty. Ecopetrol will re-assess a decision or estimate required by this interpretation if the facts and circumstances on which the decision or estimate was based change, or as a result of new information affecting the decision or estimate.
Additionally, upon assessing whether and how an uncertain tax treatment affects determination of the tax gain (tax loss), tax bases, unused tax losses, unused tax credits and tax rates, an entity will assume that a tax authority will inspect the amounts it is entitled to examine and have complete knowledge of all related information when those reviews are carried out.
This interpretation must be applied for years starting January 1, 2019.
| - | Annual Improvements to the IFRS |
| § | IFRS 1 - First-time adoption of International Financial Reporting Standards: Elimination of short-term exemptions for entities that adopt IFRS Standards for the first time. |
| § | IFRS 12 - Information to be disclosed on stakes in other entities. Clarification of the scope of the regulation. |
| § | IAS 28 - Investments in related companies and |
| - | Amendments to IAS |
Ecopetrol is not expectingS.A.
Notes to adopt the aforementioned standards before their date of implementation. The impact from these standards is being evaluated by Company Management, particularly IFRS 16, which could affect the recognition of assets and liabilities in the financial situation statement, as well as the recognition of lease charges in the profit or loss of the period.
There are no new or amended standards or interpretation adopted in 2016 that had a material impact on the consolidated financial statements.
(Figures expressed in millions of Colombian pesos, unless otherwise stated) |
| - | Amendments to IFRS 9 - Prepayment Features with Negative Compensation. Changes to IFRS 9 allow companies to measure financial assets canceled in advance with negative offset to amortized cost or reasonable value, through another comprehensive result if a specific condition is met, instead of doing so at reasonable value with gain or loss. |
| - | Annual Improvements to IFRS Standards 2015–2017 Cycle: |
| § | Amendments to IAS 12 – Capital Gains Tax: Consequences to the capital gains tax of payments for financial instruments classified as net equity. |
| § | Amendments to IAS 23 - Loan costs. Loan costs subject to compounding. |
| § | Amendments to IFRS 3 – Business combinations and changes to IFRS 11 – Joint agreements. Stakes previously held in a joint venture. |
| 5.2 | Impact of the adoption of new regulations (IFRS 16) |
IFRS 16 “Leases” was issued in January 2016 and replaces IAS 17 “Leases,” IFRIC 4 “Determination as to whether an agreement contains a lease contract,” SIC-15 “Operational leases – Incentives” and SIC-27 “Assessment of the share of transactions that legally involve a lease.”
Ecopetrol S.A.
Notes to the consolidated financial statements
(Figures expressed in millions of Colombian pesos, unless otherwise stated)
The new accounting policies are subject to change until the Ecopetrol Business Group presents its first financial statements under IFRS 16 in 2019.
| 6. | Cash and cash equivalents |
The balance of cashCash and cash equivalents atdetails as of December 31, 20162018 and 20152017 is comprised as follows:
| 2016 | 2015 | |||||||
| Banks and corporations | 3,319,465 | 4,483,900 | ||||||
| Short-term investments | 5,090,048 | 2,065,731 | ||||||
| Cash | 954 | 819 | ||||||
| 8,410,467 | 6,550,450 | |||||||
| 2018 | 2017 | |||||||
| Banks | 4,511,078 | 5,484,981 | ||||||
| Short–term investments | 1,799,597 | 2,459,438 | ||||||
| Cash | 1,069 | 1,466 | ||||||
| 6,311,744 | 7,945,885 | |||||||
As of December 31, 2016, it includes2018, cash and cash equivalents balance included COP$92,331 and COP$96,758 as of December 31, 2017, of restricted cash for COP$114,206 (2015 - COP$108,348), intendedto be used exclusively for the exclusive payment of loans principal and interest on loans contractedobtained by Oleoducto Bicentenario and Oleoducto de los Llanos. The use of short-termshort–term financial investments depends on the liquidity requirementsneeds of the Company.Ecopetrol Business Group.
The fair value of cash and cash equivalents approximates their carrying amountbook value due to their short-term nature and their high liquidity.short–term nature.
The average return on cash and cash equivalents as offor the year ended December 31, 20162018 was 3.5% (2015 - 2.6%approximately 3% (2017 – 4.2%).
The following table reflects the credit quality of issuers and counterpartiesof investments included in transactions involving cash and cash equivalents is describedequivalents:
Rating | 2018 | 2017 | ||||||
| AAA | 3,092,236 | 2,807,170 | ||||||
| BBB | 1,305,037 | - | ||||||
| A1 | 907,453 | 2,922,714 | ||||||
| BRC1+ | 470,623 | 1,152,593 | ||||||
| F1+ | 222,454 | - | ||||||
| A-2 | 147,186 | 27,350 | ||||||
| AA | 107,520 | - | ||||||
| F1 | 48,566 | 896,231 | ||||||
| Aa3 | - | 99,029 | ||||||
| Aa2 | - | 27,868 | ||||||
| F2 | - | 180 | ||||||
| Other | 10,669 | 12,750 | ||||||
| 6,311,744 | 7,945,885 | |||||||
See credit risk policy in Note 31.3 – Credit risk.28.2.2
Ecopetrol S.A.
Notes to the consolidated financial statements
(Figures expressed in millions of Colombian pesos, unless otherwise stated)
| 7. | Trade and other receivables, net |
The balance of trade and other receivables, net of provision allowance for doubtful accounts, is comprised as follows atas of December 31, 20162018 and 2015:2017:
| 2016 | 2015 | |||||||
| Current | ||||||||
| Customers | ||||||||
| Foreign | 1,366,322 | 1,126,511 | ||||||
| Domestic | 1,180,577 | 1,731,547 | ||||||
| Fuel price stabilization fund (1) | 1,203,811 | 155,789 | ||||||
| Related parties (Note 32) | 97,730 | 64,724 | ||||||
| Industrial services | 60,025 | 34,987 | ||||||
| Employee loans (2) | 42,407 | 50,667 | ||||||
| Other | 261,829 | 263,187 | ||||||
| Total current | 4,212,701 | 3,427,412 | ||||||
| Non-current | ||||||||
| Employee loans (2) | 425,468 | 432,450 | ||||||
| Related parties (Note 32) | 170,121 | - | ||||||
| Fuel price stabilization fund (1) | 77,510 | 77,510 | ||||||
| Other | 56,311 | 74,611 | ||||||
| Total non-current | 729,410 | 584,571 | ||||||
| 2018 | 2017 | |||||||
| Current | ||||||||
| Customers | ||||||||
| Foreign | 2,404,531 | 2,052,829 | ||||||
| Domestic | 1,512,821 | 1,533,058 | ||||||
| Fuel price stabilization fund(1) | 3,828,691 | 2,256,312 | ||||||
| Industrial services | 154,152 | 26,223 | ||||||
| Accounts receivable from employees | 78,459 | 34,461 | ||||||
| Related parties (Note 29) | 23,480 | 23,013 | ||||||
| Other | 192,109 | 173,022 | ||||||
| 8,194,243 | 6,098,918 | |||||||
| Non–current | ||||||||
| Accounts receivable from employees | 470,609 | 484,504 | ||||||
| Related parties (Note 29) | 117,824 | 154,810 | ||||||
| Other | 167,141 | 137,818 | ||||||
| 755,574 | 777,132 | |||||||
| (1) | Accounts receivable from the Ministry of Finance and Public Credit, arising from the differences between the international parity price of regular motor gasoline and diesel |
|
The following shows the changes in the allowance for doubtful accounts related to tradefor the year ended December 31, 2018 and other receivables, provisioned in full, at December 31:2017:
| 2016 | 2015 | 2018 | 2017 | 2016 | ||||||||||||||||
| Opening balance | 160,406 | 245,114 | 170,016 | 144,329 | 160,406 | |||||||||||||||
| Additions (recovery) of allowances | 19,438 | (74,378 | ) | |||||||||||||||||
| Accounts receivable write-off and uses | (35,515 | ) | (10,330 | ) | ||||||||||||||||
| Additions, net | 107,725 | 35,229 | 19,438 | |||||||||||||||||
| Accounts receivable write–off and uses | (9,087 | ) | (9,542 | ) | (35,515 | ) | ||||||||||||||
| Closing balance | 144,329 | 160,406 | 268,654 | 170,016 | 144,329 | |||||||||||||||
| 8. | Inventories, net |
The balance of Inventories,inventories, net allowances for losses, as of a provision at December 31, 20162018 and 20152017 is comprised as follows:
| 2016 | 2015 | 2018 | 2017 | |||||||||||||
| Crude | 1,557,267 | 1,007,275 | ||||||||||||||
| Crude oil | 1,958,572 | 1,836,363 | ||||||||||||||
| Fuels and petrochemicals | 1,270,870 | 1,487,217 | 1,524,548 | 1,481,777 | ||||||||||||
| Materials for the production of goods | 1,013,764 | 563,466 | 1,617,287 | 1,283,256 | ||||||||||||
| Total | 3,841,901 | 3,057,958 | ||||||||||||||
| 5,100,407 | 4,601,396 | |||||||||||||||
The following shows a breakdownis the changes of the changes inallowances for losses for the provisions for inventories:years ended December 31, 2018 and 2017:
| 2016 | 2015 | 2018 | 2017 | 2016 | ||||||||||||||||
| Opening balance | 198,539 | 151,997 | 194,507 | 265,435 | 198,539 | |||||||||||||||
| Additions (recoveries), net | 41,957 | 53,205 | ||||||||||||||||||
| (Reversals) additions, net | (115,778 | ) | 9,134 | 41,957 | ||||||||||||||||
| Foreign currency translation | 50,053 | 13,670 | 9,717 | (4,266 | ) | 50,053 | ||||||||||||||
| Uses | (25,114 | ) | (20,333 | ) | (1,508 | ) | (75,796 | ) | (25,114 | ) | ||||||||||
| Closing balance | 265,435 | 198,539 | 86,938 | 194,507 | 265,435 | |||||||||||||||
Ecopetrol S.A.
Notes to the consolidated financial statements (Figures expressed in millions of Colombian pesos, unless otherwise stated) |
| 9. | Other financial assets |
The balance of other financial assets atas of December 31, 20162018 and 20152017 is comprised as follows:
| 2016 | 2015 | 2018 | 2017 | |||||||||||||
| Assets measured at fair value through profit or loss | ||||||||||||||||
| Investment portfolio – Local currency | 2,519,311 | 385,992 | ||||||||||||||
| Investment portfolio – Foreign currency | 4,116,987 | 1,189,667 | ||||||||||||||
| Investment Portfolio – Local currency | 3,389,869 | 3,310,338 | ||||||||||||||
| Investment Portfolio – Foreign currency | 4,754,369 | 3,194,287 | ||||||||||||||
| 6,636,298 | 1,575,659 | 8,144,238 | 6,504,625 | |||||||||||||
| Assets measured at amortized cost | 4,152 | 9,364 | 3,577 | 3,636 | ||||||||||||
| Hedging instruments | 46,445 | 356 | - | 25,464 | ||||||||||||
| Total | 6,686,895 | 1,585,379 | ||||||||||||||
| 8,147,815 | 6,533,725 | |||||||||||||||
| Current | 5,315,537 | 329,227 | 5,321,098 | 2,967,878 | ||||||||||||
| Non-current | 1,371,358 | 1,256,152 | ||||||||||||||
| Non–current | 2,826,717 | 3,565,847 | ||||||||||||||
| 6,686,895 | 1,585,379 | 8,147,815 | 6,533,725 | |||||||||||||
The average return on investmentsof the investment portfolio in Colombian pesos and USU.S. dollars portfolio was 8.1% (2015 - 5.5%approximately 5.4% (2017 – 7.4%) and 0.8% (2015 - 0.5%approximately 2.1% (2017 – 1. 1%), respectively. The credit quality of issuers and counterparties in transactions involving the other financial assets is described in Note 31.3 – Credit risk.
TheChanges in fair value measured isare recognized againstin financial result (see note 30)results (Note 27).
| 9.1 | Restrictions |
As of December 31, 2016,2018 and 2017, there were no resource of the investment portfolio was restricted. As of December 31, 2015, COP$699,832 related to the Santiago de las Atalayas process were restricted.
On November 6, 2016, through the Ministries of Mines and Energy and Finance and Public Credit the termination of Ecopetrol's condition as sequester in the process for nullity and re-establishment of rights filed against the Comuneros de Santiago de las Atalayas was confirmed. In view of the foregoing, theinvestments with restricted resources related to this case belong to Ecopetrol (see Note 23.3 - Provisions and contingencies, for further information).use.
| 9.2 | Maturity |
The following are the maturities of other financial assets atas of December 31, 20162018 and 2015:2017:
| 2016 | 2015 | 2018 | 2017 | |||||||||||||
| Up to 1 year | 5,315,537 | 329,227 | 5,321,098 | 2,967,878 | ||||||||||||
| 1 - 2 years | 838,786 | 739,337 | ||||||||||||||
| 2 - 5 years | 497,204 | 470,375 | ||||||||||||||
| 1 – 2 years | 1,847,241 | 1,588,145 | ||||||||||||||
| 2 – 5 years | 823,425 | 1,817,558 | ||||||||||||||
| > 5 years | 35,368 | 46,440 | 156,051 | 160,144 | ||||||||||||
| 6,686,895 | 1,585,379 | 8,147,815 | 6,533,725 | |||||||||||||
| 9.3 | Fair value |
The classificationfollowing is the balance of other financial assets atby fair value corresponding to the investment portfolio ishierarchy level as follows atof December 31, 20162018 and 2015:2017:
| 2016 | 2015 | |||||||
| Level 1 | 25,066 | 975,262 | ||||||
| Level 2 | 6,611,232 | 600,397 | ||||||
| 6,636,298 | 1,575,659 | |||||||
|
| 2018 | 2017 | |||||||
| Level 1 | 372,636 | 317,912 | ||||||
| Level 2 | 7,771,602 | 6,186,713 | ||||||
| 8,144,238 | 6,504,625 | |||||||
There were no transfers between hierarchy levels duringfor the years 2016ended December 31, 2018 and 2015.2017.
The securities comprising Ecopetrol'sEcopetrol’s portfolio are valued on a daily basis pursuantaccording to the provisionsinstructions issued by the Financial Superintendence of Colombia. To this end, the Company uses the information provided by theauthorized entities authorized for this purpose,is used, which collectincludes data from active markets. For cases in which market data is not available, other directly or indirectly observable data is used.
For dollar-denominatedU.S. dollar–denominated investments, thefair value is based on information provider isreleased by Bloomberg, while for investments denominated in Colombian pesos, fair value is provided by Infovalmer, an entity authorized by the Financial Superintendence of Colombia.Colombia to provide this service.
Ecopetrol S.A.
Notes to the consolidated financial statements
(Figures expressed in millions of Colombian pesos, unless otherwise stated)
ForWithin the investment valuation hierarchy process, of establishing levels of the fair value for investments, in addition to the information used for valuation, other relevant aspects are also taken into account, such as the issuerissuer’s rating, investment rating and issuerthe risk analysis of the issuer performed by the Ecopetrol thus making it possible to establish the appropriate hierarchy level for investments.Business Group.
| 9.4 | Credit rating |
The following table reflects the credit quality of the issuers of other financial assets measured at fair value through profit or loss:
| 2018 | 2017 | |||||||
| A1 | 3,148,043 | 1,149,606 | ||||||
| AAA | 3,105,894 | 3,175,727 | ||||||
| BRC1+ | 611,905 | - | ||||||
| F1+ | 353,175 | - | ||||||
| AA- | 455,584 | 233,668 | ||||||
| AA+ | 193,747 | 1,067,989 | ||||||
| A+ | 161,160 | 175,767 | ||||||
| A | 80,334 | 300,179 | ||||||
| AA | 15,430 | - | ||||||
| BBB+ | 18,731 | - | ||||||
| BBB | - | 21,835 | ||||||
| BBB- | - | 378,939 | ||||||
| No rating available | 235 | 915 | ||||||
| 8,144,238 | 6,504,625 | |||||||
See credit risk policy in Note 28.2.2
| 10. | Taxes |
| 10.1 | Current tax assets and |
The balance at December 31, 2016 and 2015 of current tax assets and tax liabilities as of December 31, 2018 and 2017 is comprised as follows:
| 2018 | 2017 | |||||||
| Current tax assets | ||||||||
| Income tax(1) | 765,399 | 165,437 | ||||||
| Credit tax balance(2) | 54,350 | 234,410 | ||||||
| Other taxes | 211,558 | 225,527 | ||||||
| 1,031,307 | 625,374 | |||||||
| Current tax liabilities | ||||||||
| Income tax(1) | 1,065,688 | 1,305,011 | ||||||
| National tax and surcharge on gasoline | 141,408 | 136,706 | ||||||
| Carbon tax | 48,520 | 51,383 | ||||||
| Other taxes(3) | 495,684 | 512,588 | ||||||
| 1,751,300 | 2,005,688 | |||||||
| 2016 | 2015 | |||||||
| Current tax assets | ||||||||
| Income tax | 308,868 | 3,403,190 | ||||||
| Credit tax balance (1) | 598,140 | 1,098,544 | ||||||
| Other taxes | 222,090 | - | ||||||
| Total | 1,129,098 | 4,501,734 | ||||||
| Current tax liabilities | ||||||||
| Income tax | 1,478,294 | 2,120,398 | ||||||
| National tax on gasoline and surtax on gasoline | 324,402 | 314,723 | ||||||
| Other taxes (2) | 328,244 | 368,438 | ||||||
| Total | 2,130,940 | 2,803,559 | ||||||
| (1) |
| (2) |
| (3) | Mainly includes VAT payable balances, industry and commerce tax |
Income tax asset is related with prepayments made byEcopetrol S.A.
Notes to the group companies which cannot be offset with the income tax liability because they are generated by different companies.consolidated financial statements
(Figures expressed in millions of Colombian pesos, unless otherwise stated)
| 10.2 | Income tax |
The currentIn December 2016, the Colombian Congress adopted Law 1819, which introduced more changes to the Colombian tax regulationssystem, applicable to Ecopetrol forbeginning in 2017 including the taxable year 2016 establish that:following aspects:
| b) | An income tax surtax for profits above COP$800 million is set which will be 6% for 2017 and 4% for 2018. |
| c) | The income tax for tax free trade zone users will increase from 15% to 20% in 2017. The tax rate of |
| d) | The presumptive income rate will increase from 3% to 3.5% from 2017. Tax losses accumulated until December 31, 2016 |
|
On December 23, 2014, through Law 1739, a surtax on income for equality - CREE was established for the years 2015, 2016, 2017 and 2018, which is applicable for taxpayers with taxable base above COP$800 million, at rates of 5%, 6%, 8% and 9% per year, respectively.
For taxable year 2016, the Ecopetrol Group has companies that measure taxes at the ordinary income tax rate of 40%. Companies in free trade zones are subject to tax at 15%, some have taxable income calculated based on presumptive income, as explained above, and others with foreign income are taxed at the respective foreign income tax rates.
| f) | Depreciation and amortization methods and annual percentages are limited to the established in the tax rule and depends on the type of asset. For example, machinery and equipment depreciate at 10%, infrastructure (including pipelines) at 2.22% and vehicles and computers at 20%, among others. |
| g) | The cost of acquisition of exploration rights, geology and geophysic (G&G), exploratory drilling, etc., is capitalized for tax purposes until the technical and commercial feasibility of extracting the resource is achieved. |
| h) | Tax losses may be offset against ordinary net income obtained in the following 12 taxable years. |
| i) | Refinería de Cartagena, Bioenergy, Ecopetrol |
The impact ofIn 2018, tax losses in the Bioenergy and Bioenergy Zona Franca with respect towithout a deferred tax is mentionedbase expiration date amount to COP$4,078,439 with a deferred tax of COP$792,452, attributable to the Refinería de Cartagena, and COP$47,803 attributable to Bioenergy.
Ecopetrol S.A.
Notes to the consolidated financial statements
(Figures expressed in this Note under the chapter titled "Deferred Tax on Income".millions of Colombian pesos, unless otherwise stated)
Effective for the year 2015, in accordance with that provided for in Law 1739 of December 2014, tax losses and minimal CREE base surplus can be offset with future income originated in the income tax for equality - CREE, considering the same rules set out for income and supplementary taxes.In accordance with article 290 of Law 1819 of 2016, the presumptive income surplus and minimal base surplus generated before 2017 on income tax and CREE that have not been offset, are subject for offsetting to the application of a formula contained in said article and subject to the term established in article 189 of the Tax Code.
The Colombian government issued Law 1819 of 2016 (Structural Tax Reform), whereby it is established that companies can offset tax losses originated on or after 2017 with ordinary net income to be obtained in the next twelve (12) taxable periods. Reficar and Bioenergy ZF, as they entered into a legal stability agreement that included offsetting tax losses, do not have time limits and are not subject to this restriction insofar as the contract is still in force.
Statute of limitation oflimitations on review of tax returns
Tax returns may be reviewed by the tax authorities within the next 5for 6 years following the filing date and/or amendment, considering thatif the returns reflected tax losses.
According to law 1819 the general rule extended from 2 to 3 yearsStarting 2017, the statute of limitationlimitations covering tax returns is 3 years as of tax returns. Tax returns extemporarilythe date of expiration or as of the filing date, when these have been filed will have a 3 yearextemporaneously. With respect to transfer pricing, the statute of limitations fromis 6 years.
With respect to tax returns with favorable balances, the day the tax return was filed. The statute of limitations for income tax returns subject to the transfer pricing regime is 6 years. Tax returns with balances in favor, the statute of limitation will be 3 years starting fromas of the filing date whenof the offsetrequest for refunds or refund request is filed. Taxoffsetting.
With regard to tax returns in which tax losses are originated,carried forward, these will have abe considered determined after 6 years counted as of their filing date. With respect to tax returns where tax losses are calculated, the statute of limitation period oflimitations will be 12 years which will be extended to 15 yearsand if the losses are offsetcarried forward within the last 2 years of the 12 12–year period.period, the statute of limitations will be extended up to 3 additional years from the year of offsetting.
Tax returns in which tax losses are offset will have a 6-year statute of limitation period.
|
Presumptive income
The taxable income of the tax payer cannot be lower than 3% of its net equity as of December 31 of immediately preceding taxable period. As of the year 2017, it will be at a rate of 3.5%.
Income tax expense
The following table showsis a breakdowndetail of the income tax recognized in profit or loss for the years ended December 31, 2016, 20152018, 2017 and 2014:2016:
| 2016 | 2015 | 2014 | 2018 | 2017 | 2016 | |||||||||||||||||||
| Current income tax | 4,517,336 | 3,510,546 | 6,389,978 | 7,539,093 | 5,108,549 | 4,376,706 | ||||||||||||||||||
| Deferred income tax | 25,710 | (2,800,193 | ) | (955,123 | ) | 783,136 | 472,772 | 25,710 | ||||||||||||||||
| Income tax expense | 4,543,046 | 710,353 | 5,434,855 | |||||||||||||||||||||
Adjustments to prior years’ current and deferred tax | (63,744 | ) | 218,947 | 140,630 | ||||||||||||||||||||
| Income tax expenses | 8,258,485 | 5,800,268 | 4,543,046 | |||||||||||||||||||||
Reconciliation of the income tax expenseexpenses
The reconciliation between the income tax expenseexpenses and the tax determined based on the officialstatutory tax rate applicable to the CompanyEcopetrol Business Group in Colombia is as follows:
| 2016 | 2015 | 2014 | ||||||||||
| Net income (loss) before income tax | 7,790,526 | (5,578,626 | ) | 11,104,428 | ||||||||
| Statutory rate | 40 | % | 39 | % | 34 | % | ||||||
| Income tax at statutory rate | 3,116,210 | (2,175,664 | ) | 3,775,506 | ||||||||
| ETR reconciliation items: | ||||||||||||
| Effect in changes in tax rates and effect in tax base (CREE) | 807,989 | 2,063,782 | (151,244 | ) | ||||||||
| Non deductible wealth tax | 229,375 | 253,422 | (21,233 | ) | ||||||||
| Foreign currency translation and exchange difference | (234,316 | ) | 310,657 | 609,130 | ||||||||
| Prior year taxes | 140,630 | (21,233 | ) | |||||||||
| Non deductible expenses | 486,300 | 251,246 | 378,218 | |||||||||
| Valuation of investments | - | 48,129 | 922,028 | |||||||||
| Non taxable income | (3,142 | ) | (19,986 | ) | (17,352 | ) | ||||||
| Others | - | - | (60,198 | ) | ||||||||
| Income tax calculated | 4,543,046 | 710,353 | 5,434,855 | |||||||||
| Current | 4,517,336 | 3,510,546 | 6,389,978 | |||||||||
| Deferred | 25,710 | (2,800,193 | ) | (955,123 | ) | |||||||
| 4,543,046 | 710,353 | 5,434,855 | ||||||||||
| 2018 | 2017 | 2016 | ||||||||||
| Net income before income tax | 20,613,875 | 13,769,662 | 7,790,526 | |||||||||
| Statutory rate | 37 | % | 40 | % | 40 | % | ||||||
| Income tax at statutory rate | 7,627,134 | 5,507,865 | 3,116,210 | |||||||||
| ETR reconciliation items: | ||||||||||||
| Foreign currency translation and exchange difference | 751,210 | (186,787 | ) | (234,316 | ) | |||||||
| Effect Leon well (Ecopetrol America Inc.) | 281,912 | – | – | |||||||||
| Effect in changes in tax rates and tax base | 172,352 | 186,588 | 807,989 | |||||||||
| Non–deductible expenses | 56,061 | 211,042 | 486,300 | |||||||||
| Non–deductible wealth tax | – | 85,872 | 229,375 | |||||||||
| Prior years’ current and deferred tax | (63,744 | ) | 218,947 | 140,630 | ||||||||
| Non–taxable income | (78,303 | ) | (47,509 | ) | (3,142 | ) | ||||||
| Impairment of long–term assets | (128,461 | ) | (175,750 | ) | – | |||||||
| Effect of tax reform | (359,676 | ) | – | – | ||||||||
| Income tax calculated | 8,258,485 | 5,800,268 | 4,543,046 | |||||||||
| Current | 7,416,038 | 5,076,692 | 4,517,336 | |||||||||
| Deferred | 842,447 | 723,576 | 25,710 | |||||||||
| 8,258,485 | 5,800,268 | 4,543,046 | ||||||||||
The effective tax rate (ETR) as of December 31, 2018 is 40.1% (2017 - 42.1% and 2016 was- 58.3% (2015: 12.7%). The increasedecrease compared to the previous year is mainlymostly due to the following:following concepts: a) The effectDecrease in the nominal rate 40% in 2017 to 37% in 2018; b) improvement of the increaseresults before taxes of unrecognizedthe Ecopetrol Business Group; c) Effect for tax reform d) Adjustment for differential taxable bases; e) adjustment for differential tax rates of the Ecopetrol Business Group different from the nominal 37%, with a rate lower than the nominal rate; f) application of a lower rate for the long-term amortizable deferred tax assets on tax carryforwards in the group that accordingasset; and g) elimination of wealth tax.
Ecopetrol S.A.
Notes to the consolidated financial projections will not be able to be recoveredstatements
(Figures expressed in a predictable future, and b) the increase in non-deductible expenses due to the amendmentmillions of the 2015 income tax.Colombian pesos, unless otherwise stated)
Income and supplementary tax returns for taxable years 2011, 2012, to2014, 2015, 2016 and 2017 and CREE of the taxable years 20132014, 2015 and 2016 of Ecopetrol Business Group companies are subject to 2015 are open toacceptance and review in accordance withby the applicable statute of limitations. The auditing of those tax returns may result in additional taxes, or interest, or penalties which could give rise to administrative proceedings with applicable authorities. Management of the Ecopetrol Business Group Companiescompanies considers that the amounts accountedrecognized as a liability for the taxtaxes payable isare supported by taxthe regulations, doctrine and case law regulations and official opinion in orderapplicable to address any legal claim that could be requested by theeventually filed with respect to such years. The Ecopetrol Business Group's strategy is not making tax authority. The strategy's Company is do not takedecisions based on aggressive or risk taxless-assured positions that could put into question theseits tax returns.
Deferred income tax
The following is the detail of the deferred tax balance as of December 31, 2018 and 2017:
| 2018 | 2017 | |||||||
| Deferred tax assets | 3,879,427 | 4,016,161 | ||||||
| Deferred tax liabilities | (1,337,943 | ) | (1,333,280 | ) | ||||
| Net deferred income tax | 2,541,484 | 2,682,881 | ||||||
The deferred income tax assets and liabilities as of December 31, 2018 and 2017, is as follows:
| 2018 | 2017 | |||||||
| Deferred tax assets (liabilities) | ||||||||
| Provisions (1) | 1,994,762 | 1,840,988 | ||||||
| Employee benefits(2) | 1,161,860 | 1,373,561 | ||||||
| Loss carry forwards (3) | 1,002,062 | 611,766 | ||||||
| Accounts payable | 1,193,098 | 208,618 | ||||||
| Accounts receivable | 79,591 | 94,864 | ||||||
| Property plant and equipment and Natural and environmental resources(4) | (2,304,140 | ) | (1,006,299 | ) | ||||
| Goodwill | (404,394 | ) | (408,932 | ) | ||||
| Investments and derivative instruments | (170,960 | ) | (49,258 | ) | ||||
| Others | (10,395 | ) | 17,573 | |||||
| 2,541,484 | 2,682,881 | |||||||
| Deferred tax assets | 3,879,427 | 4,016,161 | ||||||
| Deferred tax liabilities | (1,337,943 | ) | (1,333,280 | ) | ||||
| 2,541,484 | 2,682,881 | |||||||
| The most representative item corresponds to the asset retirement obligation (ARO). |
| (2) | Actuarial calculations for health, retirement pensions, education, pension bonds and other benefits to |
| (3) | The increase is because of the tax reform that allows a greater recognition of deferred tax on tax losses and excess presumptive income in Refinería de Cartagena mainly. |
| (4) | For tax purposes, natural and environmental resources and property, plant and equipment have a useful life and a depreciation and amortization calculation methodology different from those determined as per international accounting standards, within this item occasional gains of 10% is included, corresponding to lands. The main variation corresponds to the tax rate reduction from 33% to 30%. |
Ecopetrol S.A.
Notes to the consolidated financial statements
(Figures expressed in millions of Colombian pesos, unless otherwise stated)
The following is the detail of the deferred tax assets (liabilities), net for the years ended December 31, 2018 and 2017:
| Property plant and equipment and Natural resources | Provisions | Employee benefits | Loss carry forwards | Accounts payable | ||||||||||||||||
| As of December 31, 2016 | (220,315 | ) | 1,875,965 | 656,997 | 477,808 | 311,607 | ||||||||||||||
| Recognized in profit or loss | (785,984 | ) | (34,977 | ) | (22,818 | ) | 133,958 | (102,989 | ) | |||||||||||
| Recognized in OCI | – | – | 739,382 | – | – | |||||||||||||||
| As of December 31, 2017 | (1,006,299 | ) | 1,840,988 | 1,373,561 | 611,766 | 208,618 | ||||||||||||||
| Recognized in profit or loss | (1,297,841 | ) | 153,774 | (178,160 | ) | 390,296 | 984,480 | |||||||||||||
| Recognized in OCI | – | – | (33,541 | ) | – | – | ||||||||||||||
| As of December 31, 2018 | (2,304,140 | ) | 1,994,762 | 1,161,860 | 1,002,062 | 1,193,098 | ||||||||||||||
| Goodwill | Borrowings and other financial liabilities | Accounts receivable | Investments and derivative instruments and Others | Total | ||||||||||||||||
| As of December 31, 2016 | (345,288 | ) | (113,497 | ) | 133,840 | (168,806 | ) | 2,608,311 | ||||||||||||
| Recognized in profit or loss | (63,644 | ) | 113,497 | (38,976 | ) | 78,357 | (723,576 | ) | ||||||||||||
| Recognized in OCI | – | – | – | 58,764 | 798,146 | |||||||||||||||
| As of December 31, 2017 | (408,932 | ) | – | 94,864 | (31,685 | ) | 2,682,881 | |||||||||||||
| Recognized in profit or loss | 4,538 | – | (15,273 | ) | (884,261 | ) | (842,447 | ) | ||||||||||||
| Recognized in OCI | – | – | – | 734,591 | 701,050 | |||||||||||||||
| As of December 31, 2018 | (404,394 | ) | – | 79,591 | (181,355 | ) | 2,541,484 | |||||||||||||
The Ecopetrol Business Group offsets assets and liabilities for deferred taxes only if it has a legally enforceable right to offset current tax liabilities and assets; and in the case of deferred tax on assets and liabilities, to the extent that they also correspond to income taxes required by the same tax jurisdiction and the same tax authority.
Deferred tax assets related to the tax losses generated by the subsidiaries Bioenergy S.A. Ecopetrol Costa Afuera and Andean Chemicals Ltd for an amount of COP$70,393, and excess presumptive income of Bioenergy SA, Ecopetrol Costa Afuera, Hocol Petroleum Company, Andean for an amount of COP$31,863 were not recognized, as Management believes it is not likely that these deferred tax assets would be recoverable in the short term.
Deferred tax assets have been recognized for an amount of COP$1,002,063 related to excesses of presumptive income and the accumulated tax losses of Refinería de Cartagena amount to COP$948,671 and Bioenergy Zona Franca S.A.S. amount to COP$53,392, as management expects these amounts will be realized in future periods.
The recognition of this deferred tax asset is supported with the tax projections and the elimination of presumptive income from the year 2021, contemplated in Law 1943/2018.
In accordance with the tax regulation applicable until December 31, 2016, excess presumptive income and minimum base excesses generated before 2017 in income and supplementary taxes and in income tax for equality – (CREE, as its acronym in Spanish) respectively, they may be compensated with the ordinary taxable income obtained by each Company within the following five years, using for this purpose, the formula established the article 290 of law 1819/ 2016.
Ecopetrol S.A.
Notes to the consolidated financial statements
(Figures expressed in millions of Colombian pesos, unless otherwise stated)
Deferred income tax
The balance at December 31, 2016 and 2015 of deferred taxes is comprised as follows:
| 2016 | 2015 | |||||||
| Deferred tax asset | 5,726,961 | 8,239,472 | ||||||
| Deferred tax liability | 3,118,650 | 6,026,050 | ||||||
| Total deferred income tax | 2,608,311 | 2,213,422 | ||||||
Deferred tax is measured at the tax rates that are expected to be applied to temporary differences when they reverse, using taxrates enacted or substantively enacted at the reporting date.
The table below shows an analysis of the Company´s deferred tax assets and liabilities:
| 2016 | 2015 | |||||||
| Deferred tax assets | ||||||||
| Property, plant and equipment and Natural and environmental resources (1) | 2,185,792 | 4,094,250 | ||||||
| Provisions | 1,875,964 | 1,867,461 | ||||||
| Employee benefits (2) | 656,997 | - | ||||||
| Loss carry forwards | 477,808 | 238,193 | ||||||
| Accounts payable | 311,646 | 726,256 | ||||||
| Borrowings and other financial liabilities | - | 986,689 | ||||||
| Accounts receivable | 135,092 | 17,927 | ||||||
| Others (3) | 83,662 | 308,696 | ||||||
| Total | 5,726,961 | 8,239,472 | ||||||
| 2016 | 2015 | |||||||
| Deferred tax liabilities | ||||||||
| Property, plant and equipment and Natural and environmental resources (1) | 2,406,106 | 3,888,751 | ||||||
| Goodwill | 345,288 | 262,291 | ||||||
| Borrowings and other financial liabilities | 113,497 | 1,527,501 | ||||||
| Others (3) | 253,759 | 347,507 | ||||||
| Total | 3,118,650 | 6,026,050 | ||||||
|
The movements of deferred income tax for the years ended December 31, 2016 and 2015 is as follows:
Deferred tax assets:
| Property, plant and equipment and natural resources | Provisions | Employee benefits | Tax losses | Accounts payable | Accounts receivable | Borrowings and other financial obligations | Others | Total | ||||||||||||||||||||||||||||
| December 31, 2014 | 1,007,559 | 1,814,433 | 352,720 | 227,078 | 111,300 | 113,889 | 268,210 | 350,227 | 4,245,416 | |||||||||||||||||||||||||||
| Recognized in deferred income tax expense | 3,086,691 | 53,028 | 370,863 | 11,115 | 614,956 | (95,962 | ) | 718,479 | (41,531 | ) | 4,717,639 | |||||||||||||||||||||||||
| Recognized in other comprehensive income | - | - | (723,583 | ) | - | - | - | - | - | (723,583 | ) | |||||||||||||||||||||||||
| December 31, 2015 | 4,094,250 | 1,867,461 | - | 238,193 | 726,256 | 17,927 | 986,689 | 308,696 | 8,239,472 | |||||||||||||||||||||||||||
| Recognized in deferred income tax expense | (1,908,458 | ) | 8,503 | 40,300 | 239,615 | (414,610 | ) | 117,165 | (986,689 | ) | 18,282 | (2,885,892 | ) | |||||||||||||||||||||||
| Recognized in other comprehensive income | - | - | 616,697 | - | - | - | - | (243,316 | ) | 373,381 | ||||||||||||||||||||||||||
| December 31, 2016 | 2,185,792 | 1,875,964 | 656,997 | 477,808 | 311,646 | 135,092 | - | 83,662 | 5,726,961 | |||||||||||||||||||||||||||
Deferred tax liabilities:
| Property, plant and equipment and natural resources | Goodwill | Financial obligations | Others | Total | ||||||||||||||||
| December 31, 2014 | 2,933,009 | 473,293 | 571,105 | 190,737 | 4,168,144 | |||||||||||||||
| Recognized in deferred income tax expense | 1,074,825 | (211,002 | ) | 788,797 | 264,826 | 1,917,446 | ||||||||||||||
| Recognized in other comprehensive income | - | - | 167,599 | - | 167,599 | |||||||||||||||
| Foreign exchange | (119,083 | ) | - | - | (108,056 | ) | (227,139 | ) | ||||||||||||
| December 31, 2015 | 3,888,751 | 262,291 | 1,527,501 | 347,507 | 6,026,050 | |||||||||||||||
| Recognized in deferred income tax expense | (1,482,645 | ) | 82,997 | (1,414,004 | ) | (46,530 | ) | (2,860,182 | ) | |||||||||||
| Foreign exchange | - | - | - | (47,218 | ) | (47,218 | ) | |||||||||||||
| Recognized in other comprehensive income | - | - | - | - | - | |||||||||||||||
| December 31, 2016 | 2,406,106 | 345,288 | 113,497 | 253,759 | 3,118,650 | |||||||||||||||
Deferred tax assets and liabilities are offset if there is a legally enforceable right to offset current tax liabilities and assets, andthey relate to taxes levied by the same tax authority on the same taxable entity, or on different tax entities, but they intend to settlecurrent tax liabilities and assets on a net basis or their tax assets and liabilities will be realized simultaneously.
In accordance with the current tax law losses generated in income and supplementary taxes and/or income tax for equality - CREE before 2017 must be offset with the net income obtained in 2017 and subsequent periods, taking into account the formula set out in article 290 of Law 1819 of 2016. Tax losses determined must not be tax re-adjusted.
Starting in 2017 companies can offset tax losses obtained in the current period, with taxable income generated through the next 12 taxable periods, following the attainment of said tax losses, without prejudice of the period's presumptive income.
The asset for deferred tax related to tax losses generated by Bioenergy S.A. and Bioenergy Zona Franca were written off in 2016 because, even though they can be offset in the long term, Management concluded that it is not likely that the asset deferred tax related to such tax losses would be recoverable in the short term. If the Ecopetrol Group could have recognized the deferred tax asset that was not recognized the income for the period ended on December 31, 2016 would have increased by COP$83,595.
|
As per Colombian tax law, excess of presumptive income can be carried forward for 5 years. As of December 31, 2016, Ecopetrol Group has unrecognized deferred tax assets on cumulative excess of presumptive income of COP 49,155, which expires between 2017 and 2020.The Deferred tax assets have not been recognized in respect of these carryforwards, as they may not be used to offset taxable profits in the Group.
In accordance with tax provisions applicable until December 31, 2016 the surplus of presumptive income and minimal base generated before 2017 in income and supplementary taxes and in the income tax for equality - CREE, respectively, can be offset with ordinary net income obtained by the Company in the next five years, using for such purpose the formula set out in number 6, article 290 of law 1819 of 2016.
The movements of deferred income tax for the years ended December 31, 20162018 and 20152017 are as follows:
| 2016 | 2015 | |||||||
| Opening balance | 2,213,422 | 77,272 | ||||||
| Deferred tax recognized in profit or loss | (25,710 | ) | 2,800,193 | |||||
| Deferred tax recognized in other comprehensive income (a) | 420,599 | (664,043 | ) | |||||
| Closing balance | 2,608,311 | 2,213,422 | ||||||
| 2018 | 2017 | 2016 | ||||||||||
| Opening balance | 2,682,881 | 2,608,311 | 2,213,422 | |||||||||
| Deferred tax recognized in profit or loss(a) | (842,447 | ) | (723,576 | ) | (25,710 | ) | ||||||
| Deferred tax recognized in other comprehensive income(b) | 701,050 | 798,146 | 420,599 | |||||||||
| Closing balance | 2,541,484 | 2,682,881 | 2,608,311 | |||||||||
| (a) | This amount includes deferred income tax and adjustments to prior years’. |
| (b) | The following is the |
| December 31, 2016 | Pre-tax | Deferred tax | After tax | |||||||||
| Actuarial valuation gains (losses) | 1,770,139 | (616,697 | ) | 1,153,442 | ||||||||
| Cash flow hedging for future crude oil exports | (757,469 | ) | 296,047 | (461,422 | ) | |||||||
| Derivative financial instruments | (56,448 | ) | 22,579 | (33,869 | ) | |||||||
| Others | - | (47,217 | ) | (47,217 | ) | |||||||
| 956,222 | (345,288 | ) | 610,934 | |||||||||
| December 31, 2018 | Pre–tax | Deferred Tax | After tax | |||||||||
| Actuarial valuation gains (losses) | (29,250 | ) | 33,540 | 4,290 | ||||||||
| Cash flow coverage for crude exports | 2,258,734 | (701,231 | ) | 1,557,503 | ||||||||
| Other | – | (33,359 | ) | (33,359 | ) | |||||||
| 2,229,484 | (701,050 | ) | 1,528,434 | |||||||||
| December 31, 2015 | Pre-tax | Deferred tax | After tax | |||||||||
| Actuarial valuation gains (losses) | (2,128,184 | ) | 723,582 | (1,404,602 | ) | |||||||
| Cash flow hedging for future crude oil exports | 344,836 | (127,545 | ) | 217,291 | ||||||||
| Derivative financial instruments | 100,134 | (40,051 | ) | 60,083 | ||||||||
| Others | - | 108,057 | 108,057 | |||||||||
| (1,683,214 | ) | 664,043 | (1,019,171 | ) | ||||||||
| December 31, 2017 | Pre–tax | Deferred Tax | After tax | |||||||||
| Actuarial valuation gains (losses) | 2,251,656 | (739,382 | ) | 1,512,274 | ||||||||
| Cash flow coverage for crude exports | 80,896 | (54,056 | ) | 26,840 | ||||||||
| Other | 12,119 | (4,708 | ) | 7,411 | ||||||||
| 2,344,671 | (798,146 | ) | 1,546,525 | |||||||||
| December 31, 2016 | Pre-tax | Deferred tax | After tax | |||||||||
| Actuarial valuation gains (losses) | 1,770,139 | (616,697 | ) | 1,153,442 | ||||||||
| Cash flow hedging for future crude oil exports | (537,353 | ) | 220,596 | (316,757 | ) | |||||||
| Derivative financial instruments | (56,804 | ) | 22,722 | (34,082 | ) | |||||||
| Other | - | (47,220 | ) | (47,220 | ) | |||||||
| 1,175,982 | (420,599 | ) | 755,383 | |||||||||
Deferred tax assets (liabilities) not recognized
As of December 31, 2018, deferred tax assets are not recognized on the difference between the accounting and tax basis associated with the investments in associates and joint ventures of Ecopetrol (Base: COP$2,981,901 million - Tax: COP$298,190 million), as the Ecopetrol Business Group does not have any intention to sell any of these investments in the foreseeable future.
| 10.3 | Other taxes |
| 10.3.1 | Tax on dividends |
The newDividends related to profits generated from the year ended December 31, 2017, will be subject to withholding at a rate of 5%. Further, if the earnings against which the dividends are distributed were not subject to corporate tax, said dividends are taxable by the income tax applicable during the distribution period (for 2018 the rate is 35%). In this scenario, the 5% tax on dividends will be applicable to foreign companies and entities on profits generated starting 2017.the distributed amount, once it is reduced with the 35% income tax rate.
DividendsThe non-taxed dividends that the Company will be taxed at 5%. For Colombian individuals the rate would be up to 10%. Profits that didreceive will not pay tax at the corporate level, would be subject to a 35% withholding tax atdue to the timeexpress provision of distribution. In this case, the distribution, after being reduced byregulation that establishes the 35% withholding tax, woulddividends that are distributed within the business groups duly registered with the Chamber of Commerce and decentralized entities, they will not be subject to the retention at the source for this concept.
There are no effects on income tax related to dividend tax. Dividends tax will be applicablepayments made by the Company to profits generated asits shareholders during 2018 and 2017.
Ecopetrol S.A.
Notes to the consolidated financial statements
(Figures expressed in millions of 2017.Colombian pesos, unless otherwise stated)
| 10.3.2 | Transfer prices |
According to the Colombian Taxpayers carrying out operationstax law, income taxpayers who enter into transactions with related parties or related parties located abroadin foreign jurisdictions and in free trade zones or with residents located in jurisdictions considered tax havens, are requiredobliged to submitdetermine their ordinary and extraordinary income for purposes of the disclosureincome and supplementary tax, its costs and deductions, considering for these operations the arm's length principle.
Ecopetrol submitted its transfer pricing informative return of transactions with related parties. For these taxpayers it is necessary to preparefor the 2017 taxable year and maintainits corresponding supporting documentation, only for those types of operations, ifas well as the annual amount accumulated in the relevant tax year exceeds ten thousand units of taxable value units (10.000 UVT) (For 2016: COP$ 29,753).
|
The Companies are required to file their transfer pricing informationcountry by country notification for the taxable year 2015years 2016 and 2017 and the related supporting documents.master file for the year 2017, in accordance with current tax regulations.
For fiscal year 20162018, the transactions performed with foreign economically related parties in foreign jurisdictions, as well as the business conditions for suchunder which said operations were carried out and theirthe general structure, did not vary significantly as comparedwith respect to the previous year. For this reason, it is possible to infer that these transactions were carried out in accordance with the previous year.arm's length principle. It is estimated that no adjustmentsthere will be requiredno need for adjustments derived from the analysis of transfer pricing in 2016prices for 2018, which imply amendments ofchanges in the income provision of the taxable year 2016.2018.
| 10.3.3 | Value added tax (VAT) |
General VAT rate increased from 16% in 2016 tois 19% and a differential rate of 5% for certain goods and services is maintained. The modification on the general rate is effective from January 1st, 2017.
VAT taxable event is expanded to all goods in general, including intangible goods (related to intellectual property) and real estate property (unless provided otherwise).
Fixed assets are still not levied with VAT, except for real estate property for residential use, automobile and other fixed assets sold on the ordinary course of business in the name and on behalf of third parties. For this purposes, real estate has been excluded unless the value of the first sale is higher than 26.800 tax value unit (“UVT” by its acronyms in Spanish), approximately COP $854 million, which will be taxed at a 5% rate.
Unless expressly excluded, services rendered from abroad will be levied with VAT. The assignment of rights is included as a form of service.
Periods for filing VAT returns and payments will be only two, bimonthly and quarterly. The statute of limitations for the request of VAT credit tax balance is increased to three bimonthly periods following the period of causation.
| 10.3.4 | Wealth tax |
Law 1739 of 2014 stablishedestablished the wealth tax (“impuesto a la riqueza”) for natural and legal persons whose possession as of January 1, 2015 exceeds COP$1,000. The taxable base for legal persons is the years 2015-2018. According tovalue of the Law, entities that own wealth in Colombia –exceedinggross equity owned as of January 1, 2015, 2016, and 2017 minus the limits established to be considered taxpayers, this is COP$ 1,000 million- havecurrent liabilities outstanding at the obligation to file and pay the wealth tax.same dates.
The applicable rate will depend on the taxable base of each tax payertaxpayer and the value paid value will not be deductible nor discountable onor deductible in the income tax and supplementary taxes forcomplementary or in the income tax for equalityequity - CREE, nor can they be offsetcompensated with these nor anyor with other taxes.
In 2016,For the year 2018 and following, there is no wealth tax, in the case of domestic companies. During 2017, the tax on wealth paid by the Ecopetrol Business Group amounted to COP$569,756,226,778, which was recognized as an expense infor the period (2015 - COP$649,800).year.
Ecopetrol S.A. Notes to the consolidated financial statements (Figures expressed in millions of Colombian pesos, unless otherwise stated) |
The balance atGovernment issued the Law 1943/2018, which makes numerous changes to the Colombian tax rules. The Tax Reform reduces the corporate income tax (CIT) rate from 33% in 2018 to 32% for 2020, 31% for 2021 and 30% for 2022 and onwards.
The presumptive income tax rate (i.e., an alternative tax based on a percentage of the net equity of the last year) is reduced from 3.5% to 1.5% in 2019 and 2020 and 0% for 2021 and onwards.
The thin capitalization rule ratio is modified from 3:1 (which includes all debt that generates interest with local and foreign entities, related or unrelated) to a 2:1 ratio that only considers debt transactions involving related local and foreign parties (including back-to-back transactions involving foreign third parties).
Ecopetrol S.A.
Notes to the consolidated financial statements
(Figures expressed in millions of Colombian pesos, unless otherwise stated)
Dividend tax
The Tax Reform increases the dividend tax on distributions to foreign nonresident entities and individuals from 5% to 7.5%. In addition, the Tax Reform establishes a 7.5% dividend tax on distributions between Colombian companies. The tax will be charged only on the first distribution of dividends between Colombian entities and may be credited against the dividend tax due once the ultimate Colombian company makes a distribution to its shareholders (nonresident shareholders (entities or individuals) or to Colombian individual residents). The dividend tax on local distributions does not apply if the Colombian companies are part of a registered economic group, or the distribution is to a Colombian entity qualifying for the new Colombian holding company (CHC) regime.
Normalization tax
The Tax Reform establishes a tax amnesty to “normalize” (i) unreported assets; or (ii) nonexistent liabilities that were included on a tax return. The amnesty will apply only for 2019 (25 September 2019 is the due date for filing the normalization tax). The applicable tax rate is 13% of the value of the unreported assets or nonexistent liabilities. For money that is repatriated to Colombia before December 31, 20162019, and 2015 of equity instruments measured at fair valuekept in the country for two years, the tax rate is comprised as follows:reduced to 6.5%. The normalization tax has a far-reaching scope and applies to assets in private foundations, assets in trusts, insurance with savings components, investment funds and other fiduciary business activities.
| 2016 | 2015 | |||||||
| Empresa de Energía de Bogotá (1) | 51,522 | 478,618 | ||||||
| Interconexión Eléctrica S.A (2) | - | 434,870 | ||||||
| Other | 88 | - | ||||||
| 51,610 | 913,488 | |||||||
Value Added Tax (VAT)
ForConcerning VAT, changes have been made to the periodlist of authorizationgoods and December 31, 2016 services excluded from VAT as set forth in Articles 424, 426 and 476 of the Tax Code, adding Article 437 to the Tax Code, with regard to guidelines on compliance with formal duties concerning VAT by service providers abroad, and it has been noted that VAT withholding may be up to 50% of the tax amount, subject to regulation by the National Government. The VAT rate remains at 19%.
Tax procedure
With regards to procedure, changes have been made: (i) declarations for withholding at source which, that being inefficient, will be enforceable, (ii) electronic notification of administrative actions; (iii) payment of the entire amount covered by a statement of objections to avoid delinquent interest at the current rate plus two points; and (iv) elimination of the extension of enforcement to three (3) additional years to offset tax losses.
Additionally, an audit benefit was included for fiscal years 2019 to 2020. Under this benefit, private settlement by taxpayers of income tax and supplements that increase net income tax by a minimum of at least 30% or 20% over the net income tax of the immediately preceding year shall be considered firm for six (6) or twelve (12) months, respectively after the date of presentation if not notified of a deadline for correction or special requirement, or a special deadline or provisional settlement, provided that the return is filed timely and the payment is made within the established deadlines.
The above benefit does not apply to: (i) taxpayers who enjoy tax benefits due to their location in a specified geographic region; (ii) if it is demonstrated that declared withholdings at source are non-existent; (iii) if the net income tax is less than 71 UVT (COP$2,433,170). The deadline stipulated in this law does not extend to declarations of withholdings at source nor to the sales tax, which shall be established by the general regulation.
Ecopetrol soldS.A.
Notes to the consolidated financial statements
(Figures expressed in three auctions 95.5%millions of its equity share equivalent to 602,632,965 shares for COP$1,067,313 as follows:Colombian pesos, unless otherwise stated)
In December 2016, the Council of Ministers approved a one extension for the terms of the alienation program, period in which Ecopetrol expects to sell the remaining 28,465,035 shares it holds.
The proceeds from the sale of these shares have been used to finance the Company's investment plan.
The movement of non-current assets held for sale at December 31, 2016 and 2015 is as follows:
| 2016 | 2015 | |||||||
| Opening balance | 913,488 | 1,581,466 | ||||||
| Fair value adjustments | 126,205 | (106,911 | ) | |||||
| Proceeds from sales of shares | (966,715 | ) | (613,998 | ) | ||||
| (Loss) gain on sale of shares (1) | (21,368 | ) | 52,931 | |||||
| Closing balance | 51,610 | 913,488 | ||||||
|
These equity instruments are measured at fair value with changes in fair value recorded in the other comprehensive income. Its hierarchy level is 1 using the price quoted in the Stock Exchange of Colombia as a reference.
| Other assets |
The balance atas of December 31, 20162018 and 20152017 of other assets is comprised as follows:
| 2016 | 2015 | |||||||
| Current | ||||||||
| Partners in joint operations | 735,032 | 431,523 | ||||||
| Advanced payments to contractors and suppliers | 151,871 | 370,269 | ||||||
| Prepaid expenses | 140,606 | 226,842 | ||||||
| Related parties (Note 32) | 7,135 | 28,668 | ||||||
| Other advances and agreements | 988 | 33,022 | ||||||
| Total current | 1,035,632 | 1,090,324 | ||||||
| Non-current | ||||||||
| Abandonment and pension funds (1) | 312,423 | 274,938 | ||||||
| Employee benefits | 187,969 | 91,625 | ||||||
| Judicial deposits and attachments | 140,338 | 146,701 | ||||||
| Trust funds (2) | 87,602 | 125,720 | ||||||
| Advances and deposits | 63,402 | 18,405 | ||||||
| Other assets | 35,002 | 108,991 | ||||||
| Total non-current | 826,736 | 766,380 | ||||||
| 2018 | 2017 | |||||||
| Current | ||||||||
| Partners in joint operations(1) | 519,460 | 583,656 | ||||||
| Advanced payments to contractors and suppliers | 221,767 | 103,762 | ||||||
| Prepaid expenses | 191,168 | 115,866 | ||||||
| Related parties (Note 29) | 19,214 | 7,716 | ||||||
| Other assets | 68,819 | 69,425 | ||||||
| 1,020,428 | 880,425 | |||||||
| Non–current | ||||||||
| Abandonment and pension funds(2) | 392,084 | 323,621 | ||||||
| Employee benefits | 213,645 | 202,012 | ||||||
| Trust funds | 147,471 | 32,748 | ||||||
| Advanced payments and deposits | 61,556 | 74,225 | ||||||
| Judicial deposits and attachments | 43,137 | 43,248 | ||||||
| Other assets | 2,837 | 5,155 | ||||||
| 860,730 | 681,009 | |||||||
| (1) | Corresponds to the net amount of cash calls and cutbacks generated in relation to the operations carried out with partners through Exploration and Production (E&P) contracts, Technical Evaluations (TEA) contracts and agreements entered in to with the National Hydrocarbons Agency (ANH), as well as through association contracts and other types of contracts. |
| (2) | Corresponds to Ecopetrol’s share in trusts established to support |
At the close of 2015, the pension resources managed byFiduciaria Bancolombia (equivalent to COP$342,951, from the termination of the Cravo Norte Partnership agreement with Occidental de Colombia) were returned to Ecopetrol S.A., since the pension obligation arising from such agreement is supported by the pension trusts described in note 22 - Provisions for employee benefits.
|
At December 31, 2016, the balance of assets classified as non-current assets held for sale amounted to COP$132,216 and it was comprised of:
The balance of related liabilities as of December 31, 2016 amounts to COP$40,128 and corresponds mainly to abandonment costs and environmental commitments of these assets.
Assets held for sale at December 31, 2015 for COP$242,745 and its related liabilities for COP$17,628 corresponded to fields La Hocha and La Cañada, owned by Hocol S.A., on which the sale was abandoned in 2016 because the offer did not meet economic expectations.
|
| Investments in associates and joint ventures |
The balance at December 31, 2016 and 2015 ofdetails on the investments in associates and joint ventures is as follows:
| 2016 | 2015 | |||||||
| Investments in joint ventures | ||||||||
| Equion Energía Limited | 1,156,430 | 1,430,206 | ||||||
| Offshore International Group (1) | 937,938 | 1,097,929 | ||||||
| Ecodiesel Colombia S.A. | 39,525 | 37,161 | ||||||
| 2,133,893 | 2,565,296 | |||||||
| Less impairment: | ||||||||
| Equion Energía Limited | (253,683 | ) | (172,528 | ) | ||||
| Offshore International Group | (577,053 | ) | (530,350 | ) | ||||
| 1,303,157 | 1,862,418 | |||||||
| Investments in associates | ||||||||
| Invercolsa S.A. | 243,156 | 61,503 | ||||||
| Serviport S.A. | 5,255 | 8,490 | ||||||
| Sociedad Portuaria Olefinas | 1,126 | 649 | ||||||
| 249,537 | 70,642 | |||||||
| Less impairment: Serviport S.A. | - | (1,126 | ) | |||||
| 249,537 | 69,516 | |||||||
| 1,552,694 | 1,931,934 | |||||||
The detail of the investments,participations, economic activity, domicile,address, area of operationoperations and financial information of the investments in joint ventures and associates is showncan be found in Exhibit I.1.
| 12.1 | Composition and movements |
| 2018 | 2017 | |||||||
| Investment in joint ventures | ||||||||
| Equion Energy Limited | 1,364,933 | 1,057,466 | ||||||
| Offshore International Group | 727,194 | 845,325 | ||||||
| Ecodiesel Colombia SA | 41,304 | 38,383 | ||||||
| 2,133,431 | 1,941,174 | |||||||
| Less impairment: | ||||||||
| Equion Energy Limited | (187,636 | ) | (296,427 | ) | ||||
| Offshore International Group | (346,121 | ) | (539,465 | ) | ||||
| 1,599,674 | 1,105,282 | |||||||
| Investments in associates | ||||||||
| Invercolsa S.A. | 243,294 | 223,963 | ||||||
| Serviport S.A. | 11,212 | 9,905 | ||||||
| Sociedad Portuaria de Oleofinas y Derivados S.A. | 1,368 | 1,214 | ||||||
| 255,874 | 235,082 | |||||||
| Less impairment: Serviport S.A. | (11,212 | ) | (9,904 | ) | ||||
| 244,662 | 225,178 | |||||||
| 1,844,336 | 1,330,460 | |||||||
Ecopetrol S.A.
Notes to the consolidated financial statements
(Figures expressed in millions of Colombian pesos, unless otherwise stated)
The following is the movement of these investments:investments in associates and joint ventures:
For the year ended December 31, 2018:
| Associates | Joint ventures | Total | ||||||||||
| Opening balance | 225,178 | 1,105,282 | 1,330,460 | |||||||||
| Effects of equity method through: | ||||||||||||
| Profit or loss | 105,908 | 59,928 | 165,836 | |||||||||
| Other comprehensive income | 1,731 | 135,831 | 137,562 | |||||||||
| Dividends declared | (86,847 | ) | (3,503 | ) | (90,350 | ) | ||||||
| Impairment (Note 16.1.2) | (1,308 | ) | 302,136 | 300,828 | ||||||||
| Closing balance | 244,662 | 1,599,674 | 1,844,336 | |||||||||
For the year ended December 31, 2017:
| Associates | Joint ventures | Total | ||||||||||
| Opening balance | 249,537 | 1,303,157 | 1,552,694 | |||||||||
| Effects of equity method through: | ||||||||||||
| Profit or loss | 46,669 | 46,869 | 93,538 | |||||||||
| Other comprehensive income | – | (14,752 | ) | (14,752 | ) | |||||||
| Dividends declared | (61,124 | ) | (224,837 | ) | (285,961 | ) | ||||||
| Impairment (Note 16.1.2) | (9,904 | ) | (5,155 | ) | (15,059 | ) | ||||||
| Closing balance | 225,178 | 1,105,282 | 1,330,460 | |||||||||
For the year ended December 31, 2016:
| Associates | Joint ventures | Total | Associates | Joint ventures | Total | |||||||||||||||||||
| Opening balance | 69,516 | 1,862,418 | 1,931,934 | 69,516 | 1,862,418 | 1,931,934 | ||||||||||||||||||
| Effects of equity method through: | ||||||||||||||||||||||||
| Profit or loss | 48,299 | 13,046 | 61,345 | 48,299 | 13,046 | 61,345 | ||||||||||||||||||
| Other comprehensive income | 173,772 | (49,127 | ) | 124,645 | 173,772 | (49,127 | ) | 124,645 | ||||||||||||||||
| Dividends declared | (42,050 | ) | (384,787 | ) | (426,837 | ) | (42,050 | ) | (384,787 | ) | (426,837 | ) | ||||||||||||
| Impairment | - | (127,858 | ) | (127,858 | ) | |||||||||||||||||||
| Impairment (Note 16.1.2) | - | (127,858 | ) | (127,858 | ) | |||||||||||||||||||
| Reclassifications | - | (10,535 | ) | (10,535 | ) | - | (10,535 | ) | (10,535 | ) | ||||||||||||||
| Closing balance | 249,537 | 1,303,157 | 1,552,694 | 249,537 | 1,303,157 | 1,552,694 | ||||||||||||||||||
| 12.2 | Restrictions on investments |
Regarding the legal process related to the shares of Inversiones de Gases de Colombia S.A. acquired by Fernando Londoño in 1997, Ecopetrol as of the date of this report exercises rights over 11.59% (of the 20.11% that was acquired by Fernando Londoño) and Arrendadora Financiera Internacional Bolivariana (AFIB) exercises them over 8.52%, participation that was protected by the Constitutional Court through an action for the protection of a fundamental right and that are in judicial discussion in the ordinary process, at the place of cassation.
Ecopetrol S.A. Notes to the consolidated financial statements (Figures expressed in millions of Colombian pesos, unless otherwise stated) |
For the year ended December 31, 2015:
| Associates | Joint ventures | Total | ||||||||||
| Opening balance | 64,710 | 2,325,479 | 2,390,189 | |||||||||
| Effects of equity method through: | ||||||||||||
| Profit or loss | 45,988 | (92,675 | ) | (46,687 | ) | |||||||
| Other comprehensive income | - | 508,968 | 508,968 | |||||||||
| Dividends declared | (41,182 | ) | (291,210 | ) | (332,392 | ) | ||||||
| Impairment | - | (588,144 | ) | (588,144 | ) | |||||||
| Closing balance | 69,516 | 1,862,418 | 1,931,934 | |||||||||
Investments in associates and joint ventures are recorded under the equity method. Ecopetrol evaluates if such investments were impaired during the period, and assesses if there is objective evidence of a potential impairment, particularly for companies that were acquired with goodwill.
As a result, the Company recognized impairment expense in the value of its investments in companies at December 31, as follows:
| 2016 | 2015 | 2014 | ||||||||||
| Equion Energía Limited | 81,155 | 172,528 | - | |||||||||
| Offshore International Group | 46,703 | 415,616 | 114,734 | |||||||||
| Total | 127,858 | 588,144 | 114,734 | |||||||||
The main assumptions used for determining the fair value less costs to sell of the investments, which perform hydrocarbon exploration and production activities, include:
The impairment recognized in 2015 was caused mostly by the adverse economic context of the hydrocarbon industry, which translated into the reduction of oil price forecast and increase in the market and country risks reflected on the discount rate. For 2016, despite of better forecasts for long term oil prices, the Company recognized an additional impairment in the investment in the Offshore International Group and Equion for the return to local authorities of low-prospectively exploration blocks, high geological risk and low economic viability with respect to a new price scenario.
|
The number of shares held by Ecopetrol in Invercolsa S.A. has been subjected to a legal dispute with another shareholder of this company. The Courts decided in favor of Ecopetrol through ruling of 2011, whereby it was determined that 324 million shares, equivalent to 11.58% of Invercolsa’s social capital should be returned to Ecopetrol. The Ecopetrol’s equity share in said company is 43.35%. The dividends paid in relation with the shares returned to Ecopetrol are also subject to controversy, as well as the ownership of the shares that represent 8.53% of Invercolsa. At December 31, 2016, the settlement of these claims is still pending.
|
| Additional information about associates and joint ventures |
The balancefollowing is the breakdown of assets, liabilities and results of most relevantthe two main investments in associates and joint ventures, atEquion Energy Limited and the Offshore International Group, as of December 31, 20162018 and 2015 is comprised as follows:2017:
| 2016 | 2015 | 2018 | 2017 | |||||||||||||||||||||||||||||
| Equion Energía Limited | Offshore International Group | Equion Energía Limited | Offshore International Group | Equion Energy Limited | Offshore International Group | Equion Energy Limited | Offshore International Group | |||||||||||||||||||||||||
| Statement of financial position | ||||||||||||||||||||||||||||||||
| Current assets | 712,078 | 317,700 | 854,445 | 310,677 | 2,083,614 | 354,959 | 909,927 | 289,618 | ||||||||||||||||||||||||
| Non-current assets | 1,406,510 | 1,693,947 | 2,114,689 | 2,089,841 | ||||||||||||||||||||||||||||
| Non–current assets | 484,336 | 1,523,549 | 955,849 | 1,568,395 | ||||||||||||||||||||||||||||
| Total assets | 2,118,588 | 2,011,647 | 2,969,134 | 2,400,518 | 2,567,950 | 1,878,508 | 1,865,776 | 1,858,013 | ||||||||||||||||||||||||
| Current liabilities | 417,203 | 147,090 | 549,281 | 477,611 | 550,933 | 221,606 | 430,130 | 192,513 | ||||||||||||||||||||||||
| Non-current liabilities | 170,527 | 671,577 | 352,182 | 409,946 | ||||||||||||||||||||||||||||
| Non–current liabilities | 77,331 | 885,410 | 98,835 | 657,746 | ||||||||||||||||||||||||||||
| Total liabilities | 587,730 | 818,667 | 901,463 | 887,557 | 628,264 | 1,107,016 | 528,965 | 850,259 | ||||||||||||||||||||||||
| Equity | 1,530,858 | 1,192,980 | 2,067,671 | 1,512,961 | 1,939,686 | 771,492 | 1,336,811 | 1,007,754 | ||||||||||||||||||||||||
| Other complementary information | ||||||||||||||||||||||||||||||||
| Cash and cash equivalents | 300,689 | 22,224 | 340,797 | 25,760 | 185,762 | 96,592 | 170,618 | 32,490 | ||||||||||||||||||||||||
| Financial obligations, short-term | 328,497 | 21,408 | 423,132 | 337,506 | ||||||||||||||||||||||||||||
| Financial obligations, long-term | 309 | 356,353 | 751 | 33,025 | ||||||||||||||||||||||||||||
| Current financial liabilities | 3,176 | 95,633 | 2,256 | 97,960 | ||||||||||||||||||||||||||||
| Non–current financial liabilities | – | 137,708 | 2,921 | 214,259 | ||||||||||||||||||||||||||||
| 2018 | 2017 | 2016 | ||||||||||||||||||||||
| Equion Energy Limited | Offshore International Group | Equion Energy Limited | Offshore International Group | Equion Energy Limited | Offshore International Group | |||||||||||||||||||
| Statement of profit or loss | ||||||||||||||||||||||||
| Sales revenue | 1,490,177 | 653,054 | 1,213,692 | 393,210 | 1,204,301 | 379,811 | ||||||||||||||||||
| Costs | (755,656 | ) | (585,192 | ) | (793,999 | ) | (508,461 | ) | (969,318 | ) | (502,107 | ) | ||||||||||||
| Administrative expenses and others | 29,136 | (353,010 | ) | 12,188 | (103,340 | ) | (44,810 | ) | (221,238 | ) | ||||||||||||||
| Financial income (expenses) | (3,659 | ) | (21,227 | ) | 2,373 | (20,264 | ) | 59,143 | (12,010 | ) | ||||||||||||||
| Income tax | (338,487 | ) | (16,594 | ) | (180,546 | ) | 60,575 | 30,199 | 107,507 | |||||||||||||||
| Financial year results | 421,511 | (322,969 | ) | 253,708 | (178,280 | ) | 279,515 | (248,037 | ) | |||||||||||||||
| Other comprehensive results | 1,095,090 | – | 913,728 | – | 935,847 | – | ||||||||||||||||||
| Other complementary information | ||||||||||||||||||||||||
| Dividends paid to the Ecopetrol Business Group | – | – | 217,075 | – | 375,035 | – | ||||||||||||||||||
| Depreciation and amortization | 511,615 | 243,601 | 557,970 | 232,953 | 678,488 | 228,250 | ||||||||||||||||||
| 2016 | 2015 | |||||||||||||||
| Equion Energía Limited | Offshore International Group | Equion Energía Limited | Offshore International Group | |||||||||||||
| Statement of profit or loss | ||||||||||||||||
| Sales revenue | 1,204,301 | 379,811 | 1,218,796 | 463,660 | ||||||||||||
| Costs | (969,318 | ) | (502,107 | ) | (958,467 | ) | (654,095 | ) | ||||||||
| Administration and other expenses | (44,810 | ) | (221,238 | ) | (74,258 | ) | (128,895 | ) | ||||||||
| Financial income (expenses) | 59,143 | (12,010 | ) | 37,970 | (8,528 | ) | ||||||||||
| Income tax | 30,199 | 107,507 | (209,221 | ) | 90,294 | |||||||||||
| Net income for the period | 279,515 | (248,037 | ) | 14,820 | (237,564 | ) | ||||||||||
|
Included below, thereThis is a reconciliation of equity betweenof the most significant participationsinvestments and the carrying amount of investments atas of December 31:
| 2016 | 2015 | 2018 | 2017 | |||||||||||||||||||||||||||||
| Equion Energía Limited | Offshore International Group | Equion Energía Limited | Offshore International Group | Equion Energy Limited | Offshore International Group | Equion Energy Limited | Offshore International Group | |||||||||||||||||||||||||
| Equity of the associate | 1,530,858 | 1,192,980 | 2,067,671 | 1,512,961 | ||||||||||||||||||||||||||||
| Equity of the joint venture | 1,939,686 | 771,492 | 1,336,811 | 1,007,754 | ||||||||||||||||||||||||||||
| % of Ecopetrol’s ownership | 51 | % | 50 | % | 51 | % | 50 | % | 51 | % | 50 | % | 51 | % | 50 | % | ||||||||||||||||
| Ecopetrol’s ownership | 780,738 | 596,490 | 1,054,513 | 756,482 | 989,240 | 385,746 | 681,773 | 503,877 | ||||||||||||||||||||||||
| Additional value of the investment | 375,693 | 341,448 | 375,693 | 226,713 | 375,693 | 341,448 | 375,693 | 341,448 | ||||||||||||||||||||||||
| Less Impairment expense | (253,684 | ) | (577,053 | ) | (172,528 | ) | (415,616 | ) | ||||||||||||||||||||||||
| Impairment | (187,636 | ) | (346,121 | ) | (296,427 | ) | (539,465 | ) | ||||||||||||||||||||||||
| Carrying amount of the investment | 902,747 | 360,885 | 1,257,678 | 567,579 | 1,177,297 | 381,073 | 761,039 | 305,860 | ||||||||||||||||||||||||
Ecopetrol S.A. Notes to the consolidated financial statements (Figures expressed in millions of Colombian pesos, unless otherwise stated) |
| Property, plant and equipment |
The following shows a breakdown of the changes in property, plant and equipment and its depreciation and impairment for the years ended December 31, 20162018 and 2015:2017:
| Plant and equipment | Pipelines, networks and lines | Work in progress (1) | Buildings | Lands | Other | Total | ||||||||||||||||||||||
| Cost | ||||||||||||||||||||||||||||
| Balance at December 31, 2015 | 37,360,222 | 26,856,085 | 11,015,010 | 6,479,356 | 4,068,951 | 3,653,798 | 89,433,422 | |||||||||||||||||||||
| Additions/capitalizations | 1,457,547 | 1,383,352 | (107,181 | ) | 360,596 | 41,202 | 511,413 | 3,646,929 | ||||||||||||||||||||
| (Decrease) increase in abandonment costs | (84,780 | ) | (78,712 | ) | - | - | - | 6,137 | (157,355 | ) | ||||||||||||||||||
| Capitalized interest | - | - | 205,662 | - | - | 37,116 | 242,778 | |||||||||||||||||||||
| Exchange differences capitalized | - | - | 8,639 | - | - | - | 8,639 | |||||||||||||||||||||
| Disposals | (158,193 | ) | (21,814 | ) | (16,031 | ) | (12,540 | ) | 713 | (15,455 | ) | (223,320 | ) | |||||||||||||||
| Foreign currency translation | (42,870 | ) | (298,750 | ) | (1,629,613 | ) | (9,832 | ) | (69,878 | ) | 12,416 | (2,038,527 | ) | |||||||||||||||
| Other (reclassifications) (2) | 4,076,350 | 1,247,621 | (4,602,080 | ) | 94,177 | (146,768 | ) | (722,986 | ) | (53,686 | ) | |||||||||||||||||
| Balance at December 31, 2016 | 42,608,276 | 29,087,782 | 4,874,406 | 6,911,757 | 3,894,220 | 3,482,439 | 90,858,880 | |||||||||||||||||||||
| Accumulated depreciation and impairment | ||||||||||||||||||||||||||||
| Balance at December 31, 2015 | (13,469,749 | ) | (8,572,373 | ) | (19,566 | ) | (1,698,791 | ) | (13,689 | ) | (554,181 | ) | (24,328,349 | ) | ||||||||||||||
| Depreciation expense | (1,869,604 | ) | (1,426,659 | ) | - | (392,294 | ) | - | (102,621 | ) | (3,791,178 | ) | ||||||||||||||||
| Impairment (Note 17) | (659,223 | ) | 33,048 | (3,270 | ) | 57,157 | 24,067 | (13,517 | ) | (561,738 | ) | |||||||||||||||||
| Disposals | 121,382 | 14,022 | - | 7,021 | 15 | 11,524 | 153,964 | |||||||||||||||||||||
| Foreign currency translation | 272,582 | 138,611 | 38,904 | 12,658 | - | 8,007 | 470,762 | |||||||||||||||||||||
| Other (reclassifications) (2) | 92,617 | (152,203 | ) | (278,665 | ) | (74,229 | ) | (37,245 | ) | (24,114 | ) | (473,839 | ) | |||||||||||||||
| Balance at December 31, 2016 | (15,511,995 | ) | (9,965,554 | ) | (262,597 | ) | (2,088,478 | ) | (26,852 | ) | (674,902 | ) | (28,530,378 | ) | ||||||||||||||
| Net balance at December 31, 2016 | 27,096,281 | 19,122,228 | 4,611,809 | 4,823,279 | 3,867,368 | 2,807,537 | 62,328,502 | |||||||||||||||||||||
| Plant and equipment | Pipelines, networks and lines | Work in progress(1) | Buildings | Lands | Other | Total | ||||||||||||||||||||||
| Cost | ||||||||||||||||||||||||||||
| Balance as of December 31, 2017 | 42,561,894 | 32,000,049 | 3,866,318 | 7,618,586 | 3,839,355 | 2,806,696 | 92,692,898 | |||||||||||||||||||||
| Additions/capitalizations | 1,196,520 | 944,797 | 993,817 | 147,005 | 14,909 | 5,881 | 3,302,929 | |||||||||||||||||||||
| Increase in abandonment costs | 85,580 | 209,028 | - | - | - | - | 294,608 | |||||||||||||||||||||
| Capitalized financial interests (2) | 48,351 | 34,399 | 14,853 | 14,350 | 6,703 | 5,316 | 123,972 | |||||||||||||||||||||
| Exchange differences capitalized | 4,107 | 2,922 | 1,262 | 1,219 | 569 | 451 | 10,530 | |||||||||||||||||||||
| Disposals | (135,468 | ) | (112,171 | ) | (14,723 | ) | (11,997 | ) | (9,763 | ) | (56,734 | ) | (340,856 | ) | ||||||||||||||
| Foreign currency translation | 2,324,744 | 849,868 | 32,585 | 100,091 | 124,903 | 55,983 | 3,488,174 | |||||||||||||||||||||
| Transfers (3) | 388,641 | 420,391 | (269,409 | ) | (16,976 | ) | 7,900 | 28,209 | 558,756 | |||||||||||||||||||
| Balance as of December 31, 2018 | 46,474,369 | 34,349,283 | 4,624,703 | 7,852,278 | 3,984,576 | 2,845,802 | 100,131,011 | |||||||||||||||||||||
| Accumulated depreciation and impairment losses | ||||||||||||||||||||||||||||
| Balance as of December 31, 2017 | (14,779,973 | ) | (12,461,626 | ) | (553,420 | ) | (2,668,562 | ) | (39,522 | ) | (785,421 | ) | (31,288,524 | ) | ||||||||||||||
| Depreciation expense | (2,008,348 | ) | (1,465,429 | ) | - | (347,510 | ) | - | (123,792 | ) | (3,945,079 | ) | ||||||||||||||||
| (Losses) recoveries of impairment (Nota 16) | (752,534 | ) | (311,080 | ) | 55,979 | (64,279 | ) | 5,220 | (16,591 | ) | (1,083,285 | ) | ||||||||||||||||
| Disposals | 116,225 | �� | 84,217 | - | 8,996 | - | 40,957 | 250,395 | ||||||||||||||||||||
| Foreign currency translation | (677,901 | ) | (313,311 | ) | - | (27,782 | ) | - | (23,804 | ) | (1,042,798 | ) | ||||||||||||||||
| Transfers (3) | 117,115 | (310,561 | ) | - | (23,386 | ) | - | (4,905 | ) | (221,737 | ) | |||||||||||||||||
| Balance as of December 31, 2018 | (17,985,416 | ) | (14,777,790 | ) | (497,441 | ) | (3,122,523 | ) | (34,302 | ) | (913,556 | ) | (37,331,028 | ) | ||||||||||||||
| Net balance as of December 31, 2017 | 27,781,921 | 19,538,423 | 3,312,898 | 4,950,024 | 3,799,833 | 2,021,275 | 61,404,374 | |||||||||||||||||||||
| Net balance as of December 31, 2018 | 28,488,953 | 19,571,493 | 4,127,262 | 4,729,755 | 3,950,274 | 1,932,246 | 62,799,983 | |||||||||||||||||||||
| (1) | The balance of work in progress |
| (2) | Financial interests are capitalized based on the weighted average rate of borrowing costs. See Note 18 - Loans and financing. |
| (3) | Transfers corresponds mainly to: i) recognition of financial leasing contracts, ii) transfers from natural resources and the environment. |
Guarantees
The Esperanza 1 and 2 farms were pledged as guarantee for the loan obtained by Bioenergy S.A.S. for the financing of the project (see Note 18.6 – Guarantees and covenants).
Ecopetrol S.A.
Notes to the consolidated financial statements
(Figures expressed in millions of Colombian pesos, unless otherwise stated)
| Plant and equipment | Pipelines, networks and lines | Work in | Buildings | Lands | Other | Total | ||||||||||||||||||||||
| Cost | ||||||||||||||||||||||||||||
| Balance as of December 31, 2016 | 42,608,276 | 29,087,782 | 4,874,406 | 6,911,757 | 3,894,220 | 3,482,439 | 90,858,880 | |||||||||||||||||||||
| Additions/capitalizations | 904,854 | 876,940 | (102 | ) | 363,836 | 14,631 | 203,124 | 2,363,283 | ||||||||||||||||||||
| Increase in abandonment costs | 51,619 | 105,097 | – | – | – | – | 156,716 | |||||||||||||||||||||
| Capitalized financial interests | 38,847 | 33,875 | 8,501 | 6,941 | 1,027 | 20,113 | 109,304 | |||||||||||||||||||||
| Exchange differences capitalized | 2,636 | 2,299 | 577 | 471 | 70 | 672 | 6,725 | |||||||||||||||||||||
| Disposals | (67,326 | ) | (56,147 | ) | (26,991 | ) | (6,539 | ) | (23 | ) | (2,727 | ) | (159,753 | ) | ||||||||||||||
| Foreign currency translation | (136,501 | ) | (49,800 | ) | (13,302 | ) | (4,904 | ) | (7,850 | ) | (3,394 | ) | (215,751 | ) | ||||||||||||||
| Transfers(2) | (840,511 | ) | 2,000,003 | (976,771 | ) | 347,024 | (62,720 | ) | (893,531 | ) | (426,506 | ) | ||||||||||||||||
| Balance as of December 31, 2017 | 42,561,894 | 32,000,049 | 3,866,318 | 7,618,586 | 3,839,355 | 2,806,696 | 92,692,898 | |||||||||||||||||||||
| Accumulated depreciation and impairment losses | ||||||||||||||||||||||||||||
| Balance as of December 31, 2016 | (15,511,995 | ) | (9,965,554 | ) | (262,597 | ) | (2,088,478 | ) | (26,852 | ) | (674,902 | ) | (28,530,378 | ) | ||||||||||||||
| Depreciation expense | (1,996,614 | ) | (1,479,792 | ) | – | (416,698 | ) | – | (106,878 | ) | (3,999,982 | ) | ||||||||||||||||
| Recovery (losses) for impairment (Note 16) | 1,014,613 | 316,360 | (372,804 | ) | 11,538 | (7,794 | ) | 16,006 | 977,919 | |||||||||||||||||||
| Disposals | 54,244 | 13,464 | – | 807 | – | 2,583 | 71,098 | |||||||||||||||||||||
| Foreign currency translation | 15,166 | 32,729 | – | 3,929 | – | 3,802 | 55,626 | |||||||||||||||||||||
| Transfers(2) | 1,644,613 | (1,378,833 | ) | 81,981 | (179,660 | ) | (4,876 | ) | (26,032 | ) | 137,193 | |||||||||||||||||
| Balance as of December 31, 2017 | (14,779,973 | ) | (12,461,626 | ) | (553,420 | ) | (2,668,562 | ) | (39,522 | ) | (785,421 | ) | (31,288,524 | ) | ||||||||||||||
| Net balance as of December 31, 2016 | 27,096,281 | 19,122,228 | 4,611,809 | 4,823,279 | 3,867,368 | 2,807,537 | 62,328,502 | |||||||||||||||||||||
| Net balance as of December 31, 2017 | 27,781,921 | 19,538,423 | 3,312,898 | 4,950,024 | 3,799,833 | 2,021,275 | 61,404,374 | |||||||||||||||||||||
| (1) | The balance of work in progress as of December 31, 2017, mainly includes investments |
| (2) |
Ecopetrol S.A.
Notes to the consolidated financial statements (Figures expressed in millions of Colombian pesos, unless otherwise stated) |
| Plant and equipment | Pipelines, networks and lines | Work in progress (1) | Buildings | Lands | Other | Total | ||||||||||||||||||||||
| Cost | ||||||||||||||||||||||||||||
| Balance at December 31, 2014 | 16,109,035 | 19,938,115 | 24,009,694 | 5,199,417 | 3,614,237 | 3,135,873 | 72,006,371 | |||||||||||||||||||||
| Additions | 2,720,120 | 2,213,663 | 2,446,904 | 755,565 | 112,972 | 299,709 | 8,548,933 | |||||||||||||||||||||
| Increase (decrease) in abandonment costs | 242,815 | (115,608 | ) | 14,184 | - | - | - | 141,391 | ||||||||||||||||||||
| Capitalized interest | - | - | 553,061 | - | - | - | 553,061 | |||||||||||||||||||||
| Exchange differences capitalized | - | - | 110,485 | - | - | - | 110,485 | |||||||||||||||||||||
| Disposals | (94,227 | ) | (187,964 | ) | (32,842 | ) | (5,060 | ) | (9,786 | ) | (70,445 | ) | (400,324 | ) | ||||||||||||||
| Foreign currency translation | 5,093,932 | 2,526,312 | 159,154 | 258,070 | 354,898 | 190,381 | 8,582,747 | |||||||||||||||||||||
| Other (reclassifications) | 13,288,547 | 2,481,567 | (16,245,630 | ) | 271,364 | (3,370 | ) | 98,280 | (109,242 | ) | ||||||||||||||||||
| Balance at December 31, 2015 | 37,360,222 | 26,856,085 | 11,015,010 | 6,479,356 | 4,068,951 | 3,653,798 | 89,433,422 | |||||||||||||||||||||
| Accumulated depreciation and Impairment | ||||||||||||||||||||||||||||
| Balance at December 31, 2014 | (7,446,991 | ) | (6,071,305 | ) | (1,209,229 | ) | (1,146,453 | ) | (70,332 | ) | (397,054 | ) | (16,341,364 | ) | ||||||||||||||
| Depreciation expense | (1,168,864 | ) | (1,300,687 | ) | - | (329,396 | ) | - | (124,309 | ) | (2,923,256 | ) | ||||||||||||||||
| Impairment (Nota 17) | (2,787,539 | ) | (584,736 | ) | (509,195 | ) | (161,431 | ) | (13,689 | ) | (88,164 | ) | (4,144,754 | ) | ||||||||||||||
| Disposals | 75,305 | 90,389 | - | 4,208 | - | 64,283 | 234,185 | |||||||||||||||||||||
| Foreign currency translation | (219,358 | ) | (481,180 | ) | (404,872 | ) | (37,259 | ) | - | (10,491 | ) | (1,153,160 | ) | |||||||||||||||
| Other (reclassifications) | (1,922,302 | ) | (224,854 | ) | 2,103,730 | (28,460 | ) | 70,332 | 1,554 | - | ||||||||||||||||||
| Balance at December 31, 2015 | (13,469,749 | ) | (8,572,373 | ) | (19,566 | ) | (1,698,791 | ) | (13,689 | ) | (554,181 | ) | (24,328,349 | ) | ||||||||||||||
| Net balance at December 31, 2015 | 23,890,473 | 18,283,712 | 10,995,444 | 4,780,565 | 4,055,262 | 3,099,617 | 65,105,073 | |||||||||||||||||||||
The balance for projects in progress at December 31, 2015, primarily consists of investments for development projects in the Castilla, Rubiales and Chichimene fields as well as projects to modernize the Barrancabermeja refinery and the industrial services master plan.
|
| Natural and environmental resources |
The following shows a breakdownis the movement of the changes in Natural and environmentalnatural resources and its depletionamortization and impairment for the years ended December 31, 20162018 and 2015. The depletion method used is units of production.2017:
| Oil and gas investments | Asset retirement cost | Exploration and evaluation (1) | Total | |||||||||||||
| Cost | ||||||||||||||||
| Balance at December 31, 2015 | 44,148,353 | 1,762,374 | 6,189,142 | 52,099,869 | ||||||||||||
| Additions/capitalizations | 3,045,474 | 10,391 | (934,570 | ) | 2,121,295 | |||||||||||
| Increase (decrease) in abandonment costs | - | 566,213 | (4,062 | ) | 562,151 | |||||||||||
| Disposals | (26,548 | ) | (37,942 | ) | (121,032 | ) | (185,522 | ) | ||||||||
| Dry wells (2) | - | - | (342,691 | ) | (342,691 | ) | ||||||||||
| Capitalized interest | - | - | 98,431 | 98,431 | ||||||||||||
| Capitalized exchange differences | - | - | 7,259 | 7,259 | ||||||||||||
| Foreign currency translation | (352,766 | ) | (8,049 | ) | (103,728 | ) | (464,543 | ) | ||||||||
| Other (reclassifications) | 264,583 | 11,928 | 29,375 | 305,886 | ||||||||||||
| Balance at December 31, 2016 | 47,079,096 | 2,304,915 | 4,818,124 | 54,202,135 | ||||||||||||
| Accumulated depletion and impairment | ||||||||||||||||
| Balance at December 31, 2015 | (26,874,774 | ) | (1,181,798 | ) | - | (28,056,572 | ) | |||||||||
| Depletion expense | (3,496,998 | ) | (208,769 | ) | - | (3,705,767 | ) | |||||||||
| Impairment (Note 17) | (239,151 | ) | - | - | (239,151 | ) | ||||||||||
| Disposals | 26,320 | 37,942 | - | 64,262 | ||||||||||||
| Foreign currency translation | 218,898 | 5,171 | - | 224,069 | ||||||||||||
| Others | (104,710 | ) | (43,219 | ) | - | (147,929 | ) | |||||||||
| Balance at December 31, 2016 | (30,470,415 | ) | (1,390,673 | ) | - | (31,861,088 | ) | |||||||||
| Net balance at December 31, 2016 | 16,608,681 | 914,242 | 4,818,124 | 22,341,047 | ||||||||||||
| Oil investments | Asset retirement cost | Exploration and evaluation(1) | Total | |||||||||||||
| Cost | ||||||||||||||||
| Balance as of December 31, 2017 | 50,183,858 | 2,215,263 | 4,508,808 | 56,907,929 | ||||||||||||
| Additions/capitalizations | 3,579,982 | (27,839 | ) | 1,499,685 | 5,051,828 | |||||||||||
| Acquisition of interests in joint operations (2) | (12,065 | ) | - | - | (12,065 | ) | ||||||||||
| Increase in abandonment costs | - | 733,609 | 34,063 | 767,672 | ||||||||||||
| Disposals | (79 | ) | (2,080 | ) | (87,953 | ) | (90,112 | ) | ||||||||
| Dry wells (3) | (1,563 | ) | - | (897,361 | ) | (898,924 | ) | |||||||||
| Capitalized financial interests (4) | 70,186 | - | 6,675 | 76,861 | ||||||||||||
| Exchange differences capitalized | 5,961 | - | 567 | 6,528 | ||||||||||||
| Foreign currency translation | 773,678 | 24,574 | 75,203 | 873,455 | ||||||||||||
| Transfers | (663,917 | ) | (24,381 | ) | (333,687 | ) | (1,021,985 | ) | ||||||||
| Balance as of December 31, 2018 | 53,936,041 | 2,919,146 | 4,806,000 | 61,661,187 | ||||||||||||
| Accumulated amortization and impairment losses | ||||||||||||||||
| Balance as of December 31, 2017 | (34,014,963 | ) | (1,584,701 | ) | - | (35,599,664 | ) | |||||||||
| Depletion expense | (3,471,803 | ) | (196,286 | ) | - | (3,668,089 | ) | |||||||||
| Recovery (losses) for impairment (Nota 16) | 414,208 | (106 | ) | - | 414,102 | |||||||||||
| Disposals | 79 | - | - | 79 | ||||||||||||
| Foreign currency translation | (563,229 | ) | (19,080 | ) | - | (582,309 | ) | |||||||||
| Transfers | 829,041 | 21,103 | - | 850,144 | ||||||||||||
| Balance as of December 31, 2018 | (36,806,667 | ) | (1,779,070 | ) | - | (38,585,737 | ) | |||||||||
| Net balance as of December 31, 2017 | 16,168,895 | 630,562 | 4,508,808 | 21,308,265 | ||||||||||||
| Net balance as of December 31, 2018 | 17,129,374 | 1,140,076 | 4,806,000 | 23,075,450 | ||||||||||||
| (1) | The balance of oil investments in progress includes mainly investments made in the Purple Angel, Tayrona and unconventional hydrocarbons projects. In the developing fields, the most representative correspond to Castilla, Chichimene pilot and CPO09 re sanction. |
| (2) | Adjustment in the acquisition value of the participation of MCX Exploration USA LLC (see note 30.3). |
| (3) | Includes dry wells: 1) Ecopetrol America Inc: Leon 2) Hocol: Payero, Bonifacio, Pegaso-1 and Ocelote. |
| (4) | Borrowing costs are capitalized at the weighted average rate of borrowing costs. See Note 18 - Loans and financing. |
Ecopetrol S.A.
Notes to the consolidated financial statements
(Figures expressed in millions of Colombian pesos, unless otherwise stated)
| Oil investments | Asset retirement cost | Exploration and | Total | |||||||||||||
| Cost | ||||||||||||||||
| Balance as of December 31, 2016 | 47,079,096 | 2,304,915 | 4,818,124 | 54,202,135 | ||||||||||||
| Additions/capitalizations | 2,422,203 | 59,345 | 944,857 | 3,426,405 | ||||||||||||
| Acquisition of interests in joint operations (Note 30.3) | 141,950 | – | – | 141,950 | ||||||||||||
| Adjustment to fair value of participation in joint operations(Note 30.3) | 451,095 | – | – | 451,095 | ||||||||||||
| Increase (decrease) in abandonment costs | 224 | (143,241 | ) | 25,935 | (117,082 | ) | ||||||||||
| Disposals | (38,072 | ) | (629 | ) | (214,850 | ) | (253,551 | ) | ||||||||
| Dry wells(2) | – | – | (898,264 | ) | (898,264 | ) | ||||||||||
| Capitalized financial interests | 72,395 | – | 9,952 | 82,347 | ||||||||||||
| Exchange differences capitalized | 4,913 | – | 675 | 5,588 | ||||||||||||
| Foreign currency translation | (62,446 | ) | (573 | ) | (14,504 | ) | (77,523 | ) | ||||||||
| Transfers(3) | 112,500 | (4,554 | ) | (163,117 | ) | (55,171 | ) | |||||||||
| Balance as of December 31, 2017 | 50,183,858 | 2,215,263 | 4,508,808 | 56,907,929 | ||||||||||||
| Accumulated amortization and impairment losses | ||||||||||||||||
| Balance as of December 31, 2016 | (30,470,415 | ) | (1,390,673 | ) | – | (31,861,088 | ) | |||||||||
| Depletion expense | (3,979,179 | ) | (194,140 | ) | – | (4,173,319 | ) | |||||||||
| Recovery (losses) for impairment (Note 16) | 376,934 | – | – | 376,934 | ||||||||||||
| Disposals | 37,808 | 290 | – | 38,098 | ||||||||||||
| Foreign currency translation | 42,114 | 245 | – | 42,359 | ||||||||||||
| Transfers(3) | (22,225 | ) | (423 | ) | – | (22,648 | ) | |||||||||
| Balance as of December 31, 2017 | (34,014,963 | ) | (1,584,701 | ) | – | (35,599,664 | ) | |||||||||
| Net balance as of December 31, 2016 | 16,608,681 | 914,242 | 4,818,124 | 22,341,047 | ||||||||||||
| Net balance as of December 31, 2017 | 16,168,895 | 630,562 | 4,508,808 | 21,308,265 | ||||||||||||
| (1) | The balance of exploration and evaluation includes mainly |
| (2) | Includes mainly dry wells in operation of: 1) Ecopetrol |
| (3) | Corresponds mainly to transfers |
|
| Oil and gas investments | Asset retirement cost | Exploration and evaluation (1) | Total | |||||||||||||
| Cost | ||||||||||||||||
| Balance at December 31, 2014 | 37,168,922 | 1,895,149 | 6,114,019 | 45,178,090 | ||||||||||||
| Additions/capitalizations | 5,776,253 | 9,520 | 1,070,988 | 6,856,761 | ||||||||||||
| Decrease in abandonment costs | - | (139,670 | ) | - | (139,670 | ) | ||||||||||
| Disposals | (13,475 | ) | - | (56,962 | ) | (70,437 | ) | |||||||||
| Dry wells (2) | - | - | (1,266,440 | ) | (1,266,440 | ) | ||||||||||
| Capitalized interest | - | - | 191,365 | 191,365 | ||||||||||||
| Capitalized exchange differences | - | - | 39,416 | 39,416 | ||||||||||||
| Foreign currency translation | 1,031,595 | 6,299 | 272,890 | 1,310,784 | ||||||||||||
| Other (reclassifications) | 185,058 | (8,924 | ) | (176,134 | ) | - | ||||||||||
| Balance at December 31, 2015 | 44,148,353 | 1,762,374 | 6,189,142 | 52,099,869 | ||||||||||||
| Accumulated depletion and impairment | ||||||||||||||||
| Balance at December 31, 2014 | (20,223,671 | ) | (833,755 | ) | - | (21,057,426 | ) | |||||||||
| Depletion expense | (3,424,212 | ) | (300,650 | ) | - | (3,724,862 | ) | |||||||||
| Impairment (Note 17) | (2,865,077 | ) | - | - | (2,865,077 | ) | ||||||||||
| Disposals | 9,040 | - | - | 9,040 | ||||||||||||
| Foreign currency translation | (356,815 | ) | (61,432 | ) | - | (418,247 | ) | |||||||||
| Others | (14,039 | ) | 14,039 | - | - | |||||||||||
| Balance at December 31, 2015 | (26,874,774 | ) | (1,181,798 | ) | - | (28,056,572 | ) | |||||||||
| Net balance at December 31, 2015 | 17,273,579 | 580,576 | 6,189,142 | 24,043,297 | ||||||||||||
|
Accounting for suspended exploratory wells
The following table shows the classification by ages,age, from the completion date, of the exploratory wells that are suspended as of December 31, 2016, 20152018, 2017 and 2014:
| 2016 | 2015 | 2014 | ||||||||||
| Between 1 and 3 years | 611,682 | 490,184 | 416,687 | |||||||||
| Between 3 and 5 years | 197,997 | 100,316 | 25,703 | |||||||||
| More than 5 years | 153,552 | 161,392 | 41,621 | |||||||||
| Total suspended exploratory wells | 963,231 | 751,892 | 484,011 | |||||||||
| No. of projects exceeding 1 year | 24 | 59 | 42 | |||||||||
| Wells under 1 year of suspended | 90,486 | 280,801 | 259,932 | |||||||||
It corresponds mainly to exploratory wells of Ecopetrol, OIG and Hocol.2016:
| 2018 | 2017 | 2016 | ||||||||||
| Between 1 and 3 years(a) | 496,871 | 600,767 | 1,300,874 | |||||||||
| Between 3 and 5 years(b) | 375,371 | 791,261 | 197,997 | |||||||||
| More than 5 years(c) | 273,764 | 250,219 | 153,552 | |||||||||
| Total suspended exploratory wells | 1,146,006 | 1,642,247 | 1,652,423 | |||||||||
| Number of projects exceeding 1 year | 24 | 24 | 24 | |||||||||
| Wells under 1 year of suspension | 9,511 | 2,480 | 528,313 | |||||||||
| As of December 2018, suspended exploratory wells correspond mainly to Ecopetrol: Purple Angel, Caronte and discovery wells of Ecopetrol America Inc: Warrior 1. As of December 31, 2017 suspended exploratory wells correspond mainly to discovery wells of Ecopetrol America Inc: Leon 2 and Warrior 1, which were under evaluation. |
| (b) | For 2018, the balance corresponds mainly to wells of Ecopetrol S.A.: Orca 1, Tiribita 1A and Tiribita 3, which are under evaluation. |
Notes
| (c) | Correspond mainly to |
Ecopetrol S.A.
Notes to the consolidated financial statements
(Figures expressed in millions of Colombian pesos, unless otherwise stated)
| 15. | Intangible assets |
The following is the movement of intangibles and their amortization and impairment for the years ended December 31, 2018 and 2017:
| Licenses and software | Other | Total | ||||||||||
| Cost | ||||||||||||
| Balance as of December 31, 2017 | 960,556 | 168,552 | 1,129,108 | |||||||||
| Acquisitions | 69,442 | 36,227 | 105,669 | |||||||||
| Disposals | (46,007 | ) | (5,643 | ) | (51,650 | ) | ||||||
| Foreign currency translation | 25,339 | 2,955 | 28,294 | |||||||||
| Transfers | 6,390 | (4,808 | ) | 1,582 | ||||||||
| Balance as of December 31, 2018 | 1,015,720 | 197,283 | 1,213,003 | |||||||||
| Accumulated amortization | ||||||||||||
| Balance as of December 31, 2017 | (665,415 | ) | (83,467 | ) | (748,882 | ) | ||||||
| Amortization of the period | (75,818 | ) | (15,864 | ) | (91,682 | ) | ||||||
| Disposals | 46,004 | 5,546 | 51,550 | |||||||||
| Foreign currency translation | (20,501 | ) | (184 | ) | (20,685 | ) | ||||||
| Transfers | 3,401 | 4,042 | 7,443 | |||||||||
| Balance as of December 31, 2018 | (712,329 | ) | (89,927 | ) | (802,256 | ) | ||||||
| Net balance as of December 31, 2017 | 295,141 | 85,085 | 380,226 | |||||||||
| Net balance as of December 31, 2018 | 303,391 | 107,356 | 410,747 | |||||||||
| Useful life | <5 years | <7 years | ||||||||||
| Licenses and software | Other | Total | ||||||||||
| Cost | ||||||||||||
| Balance as of December 31, 2016 | 784,320 | 138,982 | 923,302 | |||||||||
| Acquisitions | 169,545 | 6,323 | 175,868 | |||||||||
| Disposals | (9,469 | ) | – | (9,469 | ) | |||||||
| Foreign currency translation | (1,414 | ) | (92 | ) | (1,506 | ) | ||||||
| Transfers | 17,574 | 23,339 | 40,913 | |||||||||
| Balance as of December 31, 2017 | 960,556 | 168,552 | 1,129,108 | |||||||||
| Accumulated amortization | ||||||||||||
| Balance as of December 31, 2016 | (583,680 | ) | (67,490 | ) | (651,170 | ) | ||||||
| Amortization of the period | (89,216 | ) | (18,830 | ) | (108,046 | ) | ||||||
| Disposals | 8,744 | – | 8,744 | |||||||||
| Foreign currency translation | 979 | – | 979 | |||||||||
| Transfers | (2,242 | ) | 2,853 | 611 | ||||||||
| Balance as of December 31, 2017 | (665,415 | ) | (83,467 | ) | (748,882 | ) | ||||||
| Net balance as of December 31, 2016 | 200,640 | 71,492 | 272,132 | |||||||||
| Net balance as of December 31, 2017 | 295,141 | 85,085 | 380,226 | |||||||||
| Useful life | <5 years | <7 years | ||||||||||
| (1) | Corresponds mainly to easements. |
Ecopetrol S.A.
Notes to the consolidated financial statements
(Figures expressed in millions of Colombian pesos, unless otherwise stated)
| 16. | Impairment of non-financial assets |
As mentioned in Note 4.12, each year the Ecopetrol Business Group assesses whether there is an indication that an asset or cash–generating unit may be impaired or if impairment losses recognized in previous periods should be reversed (except for goodwill impairment losses).
The impairment of non–financial assets includes property, plant and equipment and natural resources, investments in companies, goodwill and other non–current assets. The Ecopetrol Business Group is exposed to future risks derived mainly from variations in: (i) the estimate of future oil prices, (ii) refining margins and profitability, (iii) cost profile, (iv) investments and maintenance expenses, (v) amounts of recoverable reserves, (vi) market and country risk assessments reflected in the discount rate and (vii) changes in domestic and international regulations, among others.
Any changes in the above estimates used to calculate the recoverable amount of a non–current asset can have a material impact on the recognition impairment losses or reversals (other than goodwill impairment losses)in the profit or loss. Highly sensitive significant estimates affecting each business segments, among others include: (i) in the exploration and production segment, variations of recoverable hydrocarbon estimates, changes in projected realization prices and discount rate; (ii) in the refining segment, changes in finished products and crude oil prices, discount rate, refining margins, changes in environmental regulations, cost structure and the level of capital expenditures; and (iii) in the transport and logistics segment, changes in regulated tariffs and transported volumes.
Based on the impairment tests conducted by the Ecopetrol Business Group, the following are the impairment (losses) or reversals for the years ended on December 31, 2018, 2017 and 2016 are presented:
| (Impairment loss) reversal of impairment by segment | 2018 | 2017 | 2016 | |||||||||
| Exploration and Production | 785,940 | 183,718 | (196,448 | ) | ||||||||
| Refining and Petrochemicals | (984,704 | ) | 1,067,965 | (773,361 | ) | |||||||
| Transport and Logistics | (169,870 | ) | 59,455 | 41,062 | ||||||||
| (368,634 | ) | 1,311,138 | (928,747 | ) | ||||||||
| Recognized in: | ||||||||||||
| Property, plant and equipment (Note 13) | (1,083,285 | ) | 977,919 | (561,738 | ) | |||||||
| Natural resources (Note 14) | 414,102 | 376,934 | (239,151 | ) | ||||||||
| Investment in joint ventures and associates (Note 12) | 300,828 | (15,059 | ) | (127,858 | ) | |||||||
| Other non–current assets | (279 | ) | (28,656 | ) | – | |||||||
| (368,634 | ) | 1,311,138 | (928,747 | ) | ||||||||
| 16.1 | Exploration and production |
The impairment (loss) reversal of assets of the Exploration and Production segment for the years ended December 31 of 2018, 2017 and 2016 is as follows:
| 2018 | 2017 | 2016 | ||||||||||
| Oilfields | 483,803 | 188,873 | (68,590 | ) | ||||||||
| Investment in joint ventures (Note 12) | 302,136 | (5,155 | ) | (127,858 | ) | |||||||
| Other | 1 | – | – | |||||||||
| 785,940 | 183,718 | (196,448 | ) | |||||||||
| 16.1.1 | Oilfields |
In 2018, based on new market variables, incorporation of new reserves, Ecopetrol’s crude oil basket price discounts as compared to the ICE Brent crude price, available technical and operational information, there was a partial reversal of an impairment recognized in previous years for the oil fields that operate in Colombia Casabe, Provincia, Underriver, Tisquirama and Orito and in fields operated abroad Gunflint and K2, and an impairment mainly in Tibú and Dina Norte fields.
In 2017, based on new market variables, incorporation of new reserves, Ecopetrol’s crude oil basket price discounts as compared to the ICE Brent crude price, available technical and operational information, there was a partial reversal of an impairment recognized in previous years for the oil fields that operate in Colombia CPO09, Casabe and Oripaya and in fields operated abroad Gunflint Dalmatian and K2, and an impairment in the Tibú, Underriver, Provincia and Orito fields, mainly.
Ecopetrol S.A.
Notes to the consolidated financial statements
(Figures expressed in millions of Colombian pesos, unless otherwise stated)
In accordance with that mentioned in section 4.12 of the accounting policies every year the Company assesses if there are any indications of impairment in its assets or cash generating units.
The Company is exposed to certain future risks derived from variations in: a) oil prices, b) refining margins and profitability, c) cost profile, d) investment and maintenance, e) amount of recoverable reserves, f) market and country risk reflected on the discount rate, g) changes in domestic and international regulations, etc. Any change in the foregoing variables to calculate the recoverable amount can have a material effect on the recognition or recovery of impairment charges. For example, the exploration and production segment is highly sensitive to variation of hydrocarbon prices, while the refining segment is highly sensitive to the discount rate given the leveraging of said segment as well as the refining margins.
Based on impairment tests conducted by the Company, the following impairment losses (reversals) were recorded for the years ended on December 31, 2016, 2015 and 2014:
| 2016 | 2015 | 2014 | ||||||||||
| Impairment (recovery) | ||||||||||||
| Exploration and production | 68,590 | 3,649,451 | 853,179 | |||||||||
| Refining and petrochemicals | 773,361 | 3,278,993 | 1,336,158 | |||||||||
| Transportation and logistics | (41,062 | ) | 81,387 | 496 | ||||||||
| 800,889 | 7,009,831 | 2,189,833 | ||||||||||
| Recognized in: | ||||||||||||
| Property, plant and equipment (Note 15) | 561,738 | 4,144,754 | 1,491,809 | |||||||||
| Natural resources (Note 16) | 239,151 | 2,865,077 | 694,720 | |||||||||
| Intangibles (Note 18) | - | - | 3,304 | |||||||||
| 800,889 | 7,009,831 | 2,189,833 | ||||||||||
The expense (recovery) for impairment of assets of the exploration and production segment for the years ended December 31, 2016, 2015 and 2014 comprises:
2016
Cash-generating unit | Carrying amount | Recoverable amount | Impairment loss (reversal) | |||||||||
| Fields in Colombia | ||||||||||||
| Expense | 5,258,265 | 4,902,943 | 1,117,020 | |||||||||
| Recovery | 17,502,391 | 36,704,807 | (1,090,434 | ) | ||||||||
| Fields abroad | ||||||||||||
| Expense | 688,895 | 647,272 | 42,004 | |||||||||
| 68,590 | ||||||||||||
2015
| Cash-generating unit | Carrying amount | Recoverable Amount | Impairment loss (reversal) | |||||||||
| Fields in Colombia | 10,323,500 | 7,645,665 | 2,430,923 | |||||||||
| Fields abroad | 1,242,979 | 24,451 | 1,218,528 | |||||||||
| 3,649,451 | ||||||||||||
2014
| Cash-generating unit | Carrying amount | Recoverable Amount | Impairment loss (reversal) | |||||||||
| Fields in Colombia | 4,186,400 | 5,581,870 | 841,937 | |||||||||
| Fields abroad | 477,484 | 466,242 | 11,242 | |||||||||
| 853,179 | ||||||||||||
|
In 2016, as a result of revising the expectedrevision of prospective oil prices in the long term, oil prices it was identified that some impairments recognized in previous years for oil fields shouldcould be reversed.recovered due to an improved future price scenarios. The main fields foron which there was a recovery of impairment reversal were mainly Chichimene, Caño Sur, Apiay and Llanito. On the other hand,Similarly, the new technical information and operational aspects that gave rise to changes in investment levels resultedcaused an impairment in the recognition of an impairment charge in Casabe, Tibú, Gunflint and Niscota fields.fields, mainly.
The following is the breakdown of oilfields impairment losses or reversals for the years ended December 31, 2018, 2017 and 2016:
2018
| Cash generating units | Carrying amount | Recoverable amount | (Impairment loss) reversal | |||||||||
| Oil fields in Colombia | ||||||||||||
| Reversal | 19,156,326 | 50,462,080 | 689,665 | |||||||||
| Loss | 764,808 | 405,421 | (359,387 | ) | ||||||||
| Fields operated abroad | ||||||||||||
| Reversal | 1,810,618 | 2,719,086 | 157,709 | |||||||||
| Loss | 184,375 | 180,191 | (4,184 | ) | ||||||||
| 483,803 | ||||||||||||
2017
| Cash generating units | Carrying amount | Recoverable amount | (Impairment loss) reversal | |||||||||
| Oil fields in Colombia | ||||||||||||
| Loss | 2,172,747 | 1,588,207 | (584,540 | ) | ||||||||
| Reversal | 13,229,212 | 23,906,828 | 298,210 | |||||||||
| Fields operated abroad | ||||||||||||
| Reversal | 748,510 | 1,324,010 | 475,203 | |||||||||
| 188,873 | ||||||||||||
2016
| Cash generating units | Carrying amount | Recoverable amount | (Impairment loss) reversal | |||||||||
| Oil fields in Colombia | ||||||||||||
| Loss | 5,258,265 | 4,902,943 | (1,117,020 | ) | ||||||||
| Reversal | 17,502,391 | 36,704,807 | 1,090,434 | |||||||||
| Fields operated abroad | ||||||||||||
| Loss | 688,895 | 647,272 | (42,004 | ) | ||||||||
| (68,590 | ) | |||||||||||
The grouping of assets to determine the CGUs is consistent as compared to the prior periods.
Ecopetrol S.A.
Notes to the consolidated financial statements
(Figures expressed in millions of Colombian pesos, unless otherwise stated)
The assumptions used in the model to determine the recoverable amounts include:amount include the following:
| The fair value less |
For 2015, the estimated prices were US$40/barrel for the short term reaching US$60 in the medium and long term. Prices were based on information provided by specialized market analysts and management analysts.
| – | The real discount rate determined as the average weighted cost of capital (WACC) and it corresponds to 7.46% (2017–8.17% and 2016 – 7.9% and 8.9%). |
The aggregation
| – | Oil price – Brent: the forecasts include US$81.4/barrel for the first year, US$67.6/barrel for the medium term and US$71.4/barrel for the long term. In 2017, the assumptions taken US$52.9/barrel for 2018, US$72.5/barrel average for the next six years and US$81.9/barrel as of 2030. In 2016, the assumptions made used a price of US$56.8/barrel in 2017, US$67.9/barrel average for the medium term and US$80/barrel in the long term. International oil price projections were carried out by an independent agency specializing in oil and gas, taking into account the current scenarios of oil quota agreements of the OPEC (Organization of Petroleum Exporting Countries) and the impact of the changes in specifications issued by the international agreement to prevent pollution by ships (Marpol) as of the year 2020 on crude and fuels with high sulfur content. |
| 16.1.2 | Investments in joint ventures |
Investments in joint ventures in the Exploration and Production segment are recorded using the equity method of assets to identifyaccounting. Ecopetrol evaluates if there is objective evidence that indicate that the CGU's is consistent as compared tofair value of such investments has deteriorated in the prior period.period, especially those for which goodwill has been recorded.
In 2015, the impairment expense was caused mostly by the adverse economic context of the hydrocarbon industry, which translated intoAs a decrease in the oil price forecast and increase in the market and country risks reflectedresult, Ecopetrol recognized an (impairment loss) or reversal on the discount rate and the reduction oncarrying value as of December 31, as follows:
| 2018 | 2017 | 2016 | ||||||||||
| Equion Energy Limited | 108,791 | (42,744 | ) | (81,155 | ) | |||||||
| Offshore International Group | 193,345 | 37,589 | (46,703 | ) | ||||||||
| 302,136 | (5,155 | ) | (127,858 | ) | ||||||||
The significant assumptions used to determine the recoverable amount of reserves. The most representative cash generating units impactedthese investments are consistent with those described in the previous section, except for the foregoing factors wereuse of a discount rate in real terms in 2018 for Offshore International Group of 8.92% (2017 – 8.61% and 2016 – 8.0%).
In 2018, the oil fields operated at domestic level: Casabe, Chichimene, Tibú, CP09, Apiay, Llanito and La Hocha and the fieldsmarket showed an improvement in the Gulfcrude oil and gas production forecast. Operational performance and technical evolution have contributed to strengthening future cash flows that, in turn, contributed to the reversal of Mexico K2the impairment charged recognized in previous years for Offshore International Group and Dalmatian.Equion Energy.
In 2017, because of new market variables, new reserves, price differentials against reference indicators and available technical and operational information, there was a recovery of an impairment recognized in previous years for Offshore International Group and Equion Energy.
For 2016, in spite of better forecasts of oil prices in the long term, there was an additional impairment in the investment in the Offshore International Group for the reversion to local authorities of some low-prospective success exploration blocks, high geological risk, and low economic viability with respect to a new price scenario.
Ecopetrol S.A.
Notes to the consolidated financial statements
(Figures expressed in millions of Colombian pesos, unless otherwise stated)
| Refining and |
AssetsThe Cash Generating Units with an (expense for) recovery of impairment in the refiningRefining and petrochemicals segmentPetrochemical Segment for the years ended December 31, 2018, 2017 and 2016 2015 and 2014 comprises:include:
2018
Cash–generating units | Carrying amount | Recoverable amount | (Impairment loss) | |||||||||
| Refinería de Cartagena | 23,411,058 | 22,640,761 | (770,297 | ) | ||||||||
| Bioenergy | 774,343 | 560,882 | (213,461 | ) | ||||||||
| Other | 946 | – | (946 | ) | ||||||||
| (984,704 | ) | |||||||||||
2017
Cash–generating units | Carrying amount | Recoverable amount | (Impairment loss) | |||||||||
| Refinería de Cartagena | 20,578,412 | 22,012,710 | 1,434,298 | |||||||||
| Refinería de Barrancabermeja (projects) | 1,172,773 | 898,786 | (273,987 | ) | ||||||||
| Bioenergy | 757,741 | 665,395 | (92,346 | ) | ||||||||
| 1,067,965 | ||||||||||||
2016
Cash–generating units | Carrying amount | Recoverable | Impairment loss | |||||||||
| Refinería de Cartagena | 21,672,367 | 21,206,515 | (465,852 | ) | ||||||||
| Bioenergy | 925,955 | 618,446 | (307,509 | ) | ||||||||
| (773,361 | ) | |||||||||||
The grouping of assets to determine the CGUs is consistent with prior periods.
| Cash-generating unit | Carrying amount | Recoverable amount | Expense for impairment | |||||||||
| Refinería de Cartagena | 21,672,367 | 21,206,515 | 465,852 | |||||||||
| Bioenergy | 925,955 | 618,446 | 307,509 | |||||||||
| 22,598,322 | 21,824,961 | 773,361 | ||||||||||
| Refinería de Cartagena |
|
2015
| Cash-generating unit | Carrying amount | Recoverable amount | Expense for impairment | |||||||||
| Refinería de Cartagena | 26,561,335 | 23,335,096 | 3,226,240 | |||||||||
| Bioenergy | 642,139 | 589,386 | 52,753 | |||||||||
| 27,203,474 | 23,924,482 | 3,278,993 | ||||||||||
2014
| Cash-generating unit | Carrying amount | Recoverable amount | Expense for impairment | |||||||||
| Refinería de Cartagena | 18,794,568 | 17,469,140 | 1,325,428 | |||||||||
| Otros menores | 100,311 | 89,581 | 10,730 | |||||||||
| 18,894,879 | 17,558,721 | 1,336,158 | ||||||||||
Refinería de Cartagena
The recoverable amount forof the Refinería de Cartagena was calculated based on theits fair value less costcosts of disposal, with levelwhich is higher than its value in continued use. The fair value less costs of hierarchy 3, which corresponds todisposal of the futureRefinería de Cartagena was determined based on cash flows discounted after taxes.taxes that are derived from business plans approved by the Ecopetrol Business Group’s management, which are developed based on market prices provided by a third-party expert, which considers long–term macroeconomic variables and fundamental supply and demand assumptions for crude oil and refined products. The fair value hierarchy is 3.
The significant assumptions used in the model to determine the recoverable amountsamount included: a) an average(i) a gross refining margin of US$18.9/barrel (2015 - US$17.5), determined by specialists of market participants; b) adjustments associated with effects of the stabilization period; c)crude oil feedstock and products price outlook provided by an independent third-party expert; (ii) an actual discount rate of 6.3% (2015 - 7.2% and 20146.48% (2017 – 7.1%6.00%) determined under the WACC methodology; and d) extension of(iii) current conditions andor benefits, or similar, as industryan industrial user of goods and services inof the free trade zone and during the termvalidity of the license.license; (iv) level of costs and long–term operating expenses in line with international refinery standards of similar configuration and conversion capacity; (v) refinery throughput and production; and (vi) level of continued investment.
It is important to mention that the refining business is highly sensitive to the volatility of the margins and the macroeconomic variables implicit in the determination of the discount rate, therefore, any change in these assumptions could potentially result in significant variations in the determination of impairment losses or reversal amounts.
Ecopetrol S.A.
Notes to the consolidated financial statements
(Figures expressed in millions of Colombian pesos, unless otherwise stated)
The impairment recorded for 2018 is explained by: i) an adjustment in market expectations in relation to the impact that the implementation of the MARPOL regulation will have on margins of refined products, ii) the differential of light and heavy crudes that serve as raw material; and iii) fundamental macroeconomic changes that increased the discount rate used for the valuation of Reficar's assets, mainly associated with the increase in the risk-free rate and higher market risk premiums. Improvements in operational and commercial inputs associated to the refinery optimization as well as the tax effects of the “Financing Law” (tax reform) partially offset the effects of the macroeconomic variables.
In 2017, we recorded a partial reversal of the impairment recorded in previous periods primarily as a result of: (a) an improved outlook in refining margins due to the ratification of the implementation of the International Convention for the Prevention of Pollution from Ships (Marpol) starting in 2020; (b) a lower discount rate resulting from the application of WACC methodology; and (c) operational and financial optimizations identified as part of the stabilization of the refinery.
In 2016, there iswe recorded an impairment loss generatedcaused mostly by adjustment of operational variables based on what was observed data during the stabilization period, partially offset by a lower discount rate and better refining margins.
The impairment expense in 2015 was caused mostly by the adverse economic context of the hydrocarbon industry, which translated into reduction of the refining market expectations in coming years, an increase country and market risk that was reflected on the discount rate.
Bioenergy
| 16.2.2 | Bioenergy |
The recoverable amount forof Bioenergy was calculated based on the fair value in use,less the costs of disposal level, which is greater than the fair value less cost of disposalin use and corresponds to the future cash flows discounted before taxes.after taxes on profit. The fair value hierarchy is 3.
The significant assumptions used in the model to determine the recoverable amount included: a)(a) forecast of ethanol prices based on projections made by home officeGroup specialists; (b) expected agricultural and b)operational yields; and (c) a 6.7%6.97% discount rate in actualreal terms (2015(2017 – 6.8% in actual terms)6.23%) determined under the WACC methodology.
In 2018, impairment is presented due to: i) a lower prospect of short-term ethanol prices, associated with imports from abroad in an environment of global over-supply of ethanol, ii) updating of agricultural variables in the short term, iii) an increase in the discount rate used for the valuation in line with fundamentals of the market. These impacts were partially offset by the updating of operating variables associated with the stabilization and tax effects of the "Financing Law".
In 2017 and 2016, and 2015, the Companywe recorded an impairment loss mainly due to mainly by the updating the dates of start of operations of the start dateproject, the stabilization process of operationsthe industrial plant and the changes in product price projections.the operational variables and ethanol prices.
In 2016,During 2018, the Refinería de Barrancabermeja Modernization Project, which is currently suspended, was evaluated and there waswere no indications that implied the recognition of additional impairment.
During 2017, an impairment recovery forloss of COP$273,987 was recognized on the transport and logistics segment for COP$41,062 (2015 - COP$81,387 and 2014 - COP$496 of impairment expense)Refinería de Barrancabermeja, mainly by the incorporation of flows associatedrelated to the San Fernando - Apiay system project that affectswrite off of certain management and financial capitalized balances associated with the recoverable amountsuspension of the Llanos transport line, offset with greatermodernization project of the Refinery. This suspension is in response to capital discipline criteria implemented to ensure the growth and financial sustainability of Ecopetrol S.A. and the Ecopetrol Business Group in the adverse context that the hydrocarbons sector experienced in previous years. This project is being assessed within the Ecopetrol Business Group’s strategic plan therefore any impairment on the southern transport line. loss recognized in previous years may be subject to recovery.
| 16.3 | Transport and Logistics |
The recoverable amount of these assets was determined based on its fair value lesswith costs of disposal, costs with level of hierarchy 3, which corresponds to discounted cash flows based on the hydrocarbon production curves and ratesrefined products transport curves. The fair value hierarchy is 3.
The assumptions used in the model to determine the recoverable value included: i) the tariffs regulated by the Ministry of Mines and Energy and the Energy and Gas RegulatingRegulation Commission - CREG. TheCREG, ii) the actual discount rate used in the valuation was 4.98% (20155.60% (2017 - 5.9%5.00%) and 2014 -7.2%).iii) transport volume projections based on the end of year results for 2018 and the long-term volumetric transport program from 2019 onwards.
Ecopetrol S.A.
Notes to the consolidated financial statements
(Figures expressed in millions of Colombian pesos, unless otherwise stated)
In 2018, the main impairment recorded was COP$167,917, corresponding to the systems of the Southern Cash Generating Unit (CGU), composed of the Tumaco Port and the TransAndino Pipeline (OTA) and its afferent pipelines, the Mansoyá - Orito Pipeline (OMO), San Miguel - Orito (OSO), and Churuyaco- Orito (OCHO). This value was generated mainly by a decrease in the volume projections for the southern systems, and an increase in the need for maintenance capex to reduce the operational risk of the transport systems.
In 2017, there was a recovery of an impairment for the Transportation and Logistics segment for COP$59,455, mainly in Oleoducto del Sur, which includes, among others, the Trans Andino Pipeline. The recovery was due to the inclusion of the Port of Tumaco in that generating unit. The recovery of COP$41,062 in 2016 was caused mainly by the incorporation of crude oil throughput associated with the San Fernando – Apiay system, which affects the recoverable amount of Los Llanos transport line, but was offset by the impairment of the Oleoducto del Sur.
|
The following shows a breakdown of the changes in Intangibles and their amortization for the years ended December 31, 2016 and 2015:
| Licenses and software | Other intangibles (1) | Total | ||||||||||
| Cost | ||||||||||||
| Balance at December 31, 2015 | 733,115 | 244,063 | 977,178 | |||||||||
| Additions | 63,560 | 5,693 | 69,253 | |||||||||
| Disposals | (29,099 | ) | �� | - | (29,099 | ) | ||||||
| Foreign currency translation | (9,359 | ) | (149 | ) | (9,508 | ) | ||||||
| Reclassifications | 26,103 | (110,625 | ) | (84,522 | ) | |||||||
| Balance at December 31, 2016 | 784,320 | 138,982 | 923,302 | |||||||||
| Accumulated amortization | ||||||||||||
| Balance at December 31, 2015 | (533,784 | ) | (55,343 | ) | (589,127 | ) | ||||||
| Amortization expense | (81,913 | ) | (28,142 | ) | (110,055 | ) | ||||||
| Disposals | 29,097 | - | 29,097 | |||||||||
| Foreign currency translation | 8,527 | 1 | 8,528 | |||||||||
| Reclassifications | (5,607 | ) | 15,994 | 10,387 | ||||||||
| Balance at December 31, 2016 | (583,680 | ) | (67,490 | ) | (651,170 | ) | ||||||
| Net balance at December 31, 2016 | 200,640 | 71,492 | 272,132 | |||||||||
| Useful life | <5 years | <7 years | ||||||||||
| Licenses and software | Other intangibles (1) | Total | ||||||||||
| Cost | ||||||||||||
| Balance at December 31, 2014 | 575,535 | 127,519 | 703,054 | |||||||||
| Additions | 107,815 | 4,440 | 112,255 | |||||||||
| Disposals | (615 | ) | - | (615 | ) | |||||||
| Foreign currency translation | 53,242 | - | 53,242 | |||||||||
| Reclassifications | (2,862 | ) | 112,104 | 109,242 | ||||||||
| Balance at December 31, 2015 | 733,115 | 244,063 | 977,178 | |||||||||
| Accumulated amortization | ||||||||||||
| Balance at December 31, 2014 | (425,357 | ) | (32,545 | ) | (457,902 | ) | ||||||
| Amortization expense | (66,043 | ) | (24,196 | ) | (90,239 | ) | ||||||
| Disposals | 309 | 23 | 332 | |||||||||
| Foreign currency translation | (41,318 | ) | - | (41,318 | ) | |||||||
| Reclassifications | (1,375 | ) | 1,375 | - | ||||||||
| Balance at December 31, 2015 | (533,784 | ) | (55,343 | ) | (589,127 | ) | ||||||
| Net balance at December 31, 2015 | 199,331 | 188,720 | 388,051 | |||||||||
| Useful life | <5 years | <7 years | ||||||||||
|
| Goodwill |
The balance atas of December 31, 20162018 and 20152017 of Goodwill fromgoodwill in acquisitions of controlled companies is comprised as follows:subsidiaries was:
| 2016 | 2015 | |||||||
| Transportation and logistics | ||||||||
| Oleoducto Central S.A. | 683,496 | 683,496 | ||||||
| Exploration and production | ||||||||
| Hocol Petroleum Limited | 537,598 | 537,598 | ||||||
| Refining and petrochemicals | ||||||||
| Andean Chemical Limited | 127,812 | 127,812 | ||||||
| Propilco S.A. | 108,137 | 108,137 | ||||||
| 1,457,043 | 1,457,043 | |||||||
| Less: Impairment loss of Hocol Petroleum Ltd | (297,121 | ) | (297,121 | ) | ||||
| Total | 1,159,922 | 1,159,922 | ||||||
| 2018 | 2017 | |||||||
| Transport and Logistics | ||||||||
| Oleoducto Central S.A. | 683,496 | 683,496 | ||||||
| Exploration and Production | ||||||||
| Hocol Petroleum Ltd. | 537,598 | 537,598 | ||||||
| Refining and Petrochemicals | ||||||||
| Andean Chemical Ltd | 127,812 | 127,812 | ||||||
| Propilco S.A. | 108,137 | 108,137 | ||||||
| 1,457,043 | 1,457,043 | |||||||
| Less impairment Hocol Petroleum Ltd. | (297,121 | ) | (297,121 | ) | ||||
| 1,159,922 | 1,159,922 | |||||||
AtAs of December 31, 2016,2018 and 2017, the CompanyEcopetrol Business Group assessed the recoverability of the carrying value of goodwill generated in the acquisition of controlled companies.subsidiaries. The recoverable amount was determined based on the fairrealization value less costcosts of disposal using the present value of future cash flows for each of the companies acquired. Future cash flows was based onacquired with goodwill. The source of information used the financial projections of each company derived from the business plans approved by management, which were developed based on long term macro-economiclong-term macroeconomic factors such as price curves and margins and fundamental assumptions of supply and demand. As a result of the analysis, the CompanyEcopetrol Business Group did not identify any goodwill impairment.
In 2015, given the adverse economic environment faced by the hydrocarbon sector the Company was exposed to certain future risks such as a further decline in oil prices, lower refining margins, lower profit margins, changes in cost profiles, changes in levels of capital expenditures and maintenance, a reduction in recoverable reserves amount, and an increase in market and country risk that is reflected in a higher discount rate. Any significant change in the estimates and judgments used to calculate these variables can have a material effect on the recognition of goodwill impairment charges. Different variables have different impact on segments. For example, the Exploration and Production segment is highly sensitive to the price of hydrocarbons, while the Refining segment is highly sensitive to the discount rate given the leverage in that segment. As a result, at December 31, 2015 the company recognized a goodwill impairment of COP$266,900 in Hocol Petroleum Limited, due mainly from the current adverse economic context faced by the hydrocarbon sector. Regarding goodwill allocated to the Transportation and Logistics Segment and the Refining and Petrochemicals Segment Ecopetrol did not identify the need to recognize any goodwill impairment.
Ecopetrol S.A.
Notes to the consolidated financial statements (Figures expressed in millions of Colombian pesos, unless otherwise stated) |
| Loans and borrowings |
Exhibit 2 details the main conditions of the most significant loans of the Business Group.
| Composition of loans and borrowings |
The balancebalances of the loans and financing, which are recorded at amortized cost, as of December 31, 20162018 and 2015 is comprised as follows:2017:
| Weighted average effective interest rate at December 31, 2016 / 2015 | 2016 | 2015 | ||||||||
| Local currency | ||||||||||
| Bonds | 8.6% / 9.8% | 2,008,203 | 1,960,695 | |||||||
| Syndicated loan | 9.5% / 7.7% | 3,828,329 | 4,226,454 | |||||||
| Commercial loans and other | 9.1% / 7.9% | 905,266 | 945,331 | |||||||
| Total local currency | 6,741,798 | 7,132,480 | ||||||||
| Foreign currency | ||||||||||
| Bonds | 6.0% / 6.1% | 29,310,165 | 29,121,535 | |||||||
| Commercial loan-Refinería de Cartagena | 4.1% / 4.1% | 7,988,678 | 9,107,938 | |||||||
| Other commercial loans | 2.9% / 2.1% | 7,945,693 | 7,101,195 | |||||||
| Other (1) | 235,693 | 760,190 | ||||||||
| Total foreign currency | 45,480,229 | 46,090,858 | ||||||||
| Total loans and borrowings | 52,222,027 | 53,223,338 | ||||||||
| Less short-term | 4,126,203 | 4,573,620 | ||||||||
| Total long-term | 48,095,824 | 48,649,718 | ||||||||
Weighted average effective interest rate as of December 31 | 2018 | 2017 | ||||||||||
| 2018 | 2017 | |||||||||||
| Local currency | ||||||||||||
| Bonds | 8.0% | 8.9% | 1,568,034 | 1,692,471 | ||||||||
| Syndicated loan | 7.9% | 8.7% | 1,439,590 | 3,307,950 | ||||||||
| Other (1) | 7.6% | 7.7% | 1,041,151 | 978,795 | ||||||||
| 4,048,775 | 5,979,216 | |||||||||||
| Foreign currency | ||||||||||||
| Bonds | 5.7% | 6.1% | 25,599,996 | 29,166,594 | ||||||||
| Commercial loans – Refinería de Cartagena (2) | 4.4% | 4.3% | 7,352,002 | 7,401,781 | ||||||||
| Commercial loans | - | 4.3% | - | 528,815 | ||||||||
| Loans from related parties (Note 29) | 2.5% | 1.5% | 855,135 | 259,760 | ||||||||
| Other (1) | 3.1% | - | 206,737 | 211,669 | ||||||||
| 34,013,870 | 37,568,619 | |||||||||||
| 38,062,645 | 43,547,835 | |||||||||||
| Current | 4,019,927 | 5,144,504 | ||||||||||
| Non–current | 34,042,718 | 38,403,331 | ||||||||||
| 38,062,645 | 43,547,835 | |||||||||||
| (1) | Includes financial leasing and debt in connection with build, operation, maintenance and transfer (BOMT) contracts. |
| 18.2 | Main movements |
The main financing operations during 2016 and 2015 were as follows:Local currency
Bonds –
| - | On August 6, 2018, Ecopetrol made the advance payment of the total syndicated loan held in 2013 with local banks, whose amortization was expected until the year 2025. The total amount to be paid is COP$1,430,333 million, for the concept of capital plus interests. |
| - | On August 27, 2018, the local 5 year series bond issued in 2013 became due. The total nominal amount paid was COP$120,950. |
Foreign currency
| - | On |
| - | On July 6 and 25, 2018, Ecopetrol S.A. made the advance payment of |
| - |
Ecopetrol S.A.
Commercial loansNotes to the consolidated financial statements
(Figures expressed in millions of Colombian pesos, unless otherwise stated)
| On |
|
For the acquisition of the above credits, no guarantees have been granted due to the support of the Colombian Government through the Ministry of Finance and Public Credit.
Other
During 2016, the Company fully paid the short-term remittances financed in dollars with domestic banks for the payment of imports that were in effect as of December 31, 2015 in the amount of US$203 million with a financing rate of Libor + 65 basis points.
|
The following table details the main characteristics of the most significant loans of the Ecopetrol Business Group at December 31, 2016:
Initial amount at original currency | Balance at December 31, | Principal | Interest | ||||||||||||||||||||||||
| Type | Company | Starting date | Currency | (millions) | 2016 | 2015 | Maturity | Interest rate | payment | payment | |||||||||||||||||
| Dec-10 | COP $ | 138,700 | 138,700 | 138,700 | dec-17 | Floating | Bullet* | Semi-annually | |||||||||||||||||||
| Dec-10 | COP $ | 479,900 | 479,900 | 479,900 | dec-20 | Floating | Bullet | Semi-annually | |||||||||||||||||||
| Dec-10 | COP $ | 284,300 | 284,300 | 284,300 | dec-40 | Floating | Bullet | Semi-annually | |||||||||||||||||||
| Bonds in | Ecopetrol S.A | Aug-13 | COP $ | 120,950 | 120,950 | 120,950 | aug-18 | Floating | Bullet | Semi-annually | |||||||||||||||||
| local-currency | Aug-13 | COP $ | 168,600 | 168,600 | 168,600 | aug-23 | Floating | Bullet | Semi-annually | ||||||||||||||||||
| Aug-13 | COP $ | 347,500 | 347,500 | 347,500 | aug-28 | Floating | Bullet | Semi-annually | |||||||||||||||||||
| Aug-13 | COP $ | 262,950 | 262,950 | 262,950 | aug-43 | Floating | Bullet | Semi-annually | |||||||||||||||||||
| Syndicated loan | Ecopetrol S.A. | May-13 | COP $ | 1,839,000 | 1,736,833 | 1,839,000 | may-25 | Floating | Semi-annually | Semi-annually | |||||||||||||||||
| in local-currency | Oleoducto Bicentenario | Jul-12 | COP $ | 2,100,000 | 1,549,625 | 1,717,625 | jul-24 | Floating | Quarterly | Quarterly | |||||||||||||||||
| ODL Finance S.A. | Aug-13 | COP $ | 800,000 | 480,000 | 608,000 | aug-20 | Floating | Quarterly | Quarterly | ||||||||||||||||||
| Jul-09 | US$ | 1,500 | 1,500 | ** | 1,500 | jul-19 | Fixed | Bullet | Semi-annually | ||||||||||||||||||
| Sep-13 | US$ | 350 | 350 | ** | 350 | sep-18 | Fixed | Bullet | Semi-annually | ||||||||||||||||||
| Sep-13 | US$ | 1,300 | 1,800 | ** | 1,300 | sep-23 | Fixed | Bullet | Semi-annually | ||||||||||||||||||
| Sep-13 | US$ | 850 | 850 | 850 | sep-43 | Fixed | Bullet | Semi-annually | |||||||||||||||||||
| Bonds in foreign | Ecopetrol S.A. | May-14 | US$ | 2,000 | 2,000 | ** | 2,000 | may-45 | Fixed | Bullet | Semi-annually | ||||||||||||||||
| currency | Sep-14 | US$ | 1,200 | 1,200 | ** | 1,200 | may-25 | Fixed | Bullet | Semi-annually | |||||||||||||||||
| Jun-15 | US$ | 1,500 | 1,500 | ** | 1,500 | jun-26 | Fixed | Bullet | Semi-annually | ||||||||||||||||||
| Jun-16 | US$ | 500 | 500 | ** | - | aug-23 | Fixed | Bullet | Semi-annually | ||||||||||||||||||
| Oleoducto Central S.A. | May-14 | US$ | 500 | 500 | ** | 500 | may-21 | Fixed | Bullet | Semi-annually | |||||||||||||||||
| Refinería de | Dec-11 | US$ | 2,747 | 2,177 | 2,394 | dec-27 | Fixed | Semi-annually | Semi-annually | ||||||||||||||||||
| Cartagena S.A. | Dec-11 | US$ | 310 | 246 | 270 | dec-27 | Floating | Semi-annually | Semi-annually | ||||||||||||||||||
| Dec-11 | US$ | 440 | 374 | 402 | dec-25 | Floating | Semi-annually | Semi-annually | |||||||||||||||||||
| Mar-13 | US$ | 245 | 171 | ** | 196 | jul-23 | Floating | Semi-annually | Semi-annually | ||||||||||||||||||
| Commercial loans | Mar-13 | US$ | 151 | 66 | ** | 105 | jul-19 | Floating | Semi-annually | Semi-annually | |||||||||||||||||
| in foreign currency | Ecopetrol S.A. | Feb-15 | US$ | 1,925 | 1,925 | ** | 1,925 | feb-20 | Floating | Bullet | Semi-annually | ||||||||||||||||
| Feb-16 | US$ | 175 | 175 | - | feb-21 | Floating | Semi-annually | Semi-annually | |||||||||||||||||||
| May-16 | US$ | 300 | 300 | - | may-21 | Floating | Bullet | Semi-annually | |||||||||||||||||||
* Bullet: Nominal value is fully paid on the maturity date.
** Loans designated as hedging instrument (see Note 31).
|
| Maturity of loans and borrowings |
The following isare the maturity profilematurities of loans and borrowing as of December 31, 2016:2018:
| Up to 1 year | 1 - 5 years | 5-10 years | > 10 years | Total | ||||||||||||||||
| Local currency | ||||||||||||||||||||
| Bonds | 312,207 | 955,204 | 357,015 | 383,777 | 2,008,203 | |||||||||||||||
| Commercial loans | 793,743 | 2,375,023 | 659,563 | - | 3,828,329 | |||||||||||||||
| Others | 58,952 | 333,372 | 339,009 | 173,933 | 905,266 | |||||||||||||||
| Total local currency | 1,164,902 | 3,663,599 | 1,355,587 | 557,710 | 6,741,798 | |||||||||||||||
| Foreign currency | ||||||||||||||||||||
| Bonds | 1,648,707 | 10,956,507 | 12,133,576 | 4,571,375 | 29,310,165 | |||||||||||||||
| Commercial loan Refinería de Cartagena | 875,734 | 3,549,216 | 3,472,379 | 91,349 | 7,988,678 | |||||||||||||||
| Other commercial loans | 371,804 | 7,450,587 | 123,302 | - | 7,945,693 | |||||||||||||||
| Other | 65,056 | 114,226 | 56,411 | - | 235,693 | |||||||||||||||
| Total foreign currency | 2,961,301 | 22,070,536 | 15,785,668 | 4,662,724 | 45,480,229 | |||||||||||||||
| Total | 4,126,203 | 25,734,135 | 17,141,255 | 5,220,434 | 52,222,027 | |||||||||||||||
Up to 1 year (1) | 1 - 5 years | 5-10 years | > 10 years | Total | ||||||||||||||||
| Local currency | ||||||||||||||||||||
| Bonds | 116,693 | 842,514 | 362,446 | 246,381 | 1,568,034 | |||||||||||||||
| Syndicated loan | 406,582 | 1,033,008 | - | - | 1,439,590 | |||||||||||||||
| Commercial loans and other | 120,069 | 491,781 | 270,920 | 158,381 | 1,041,151 | |||||||||||||||
| 643,344 | 2,367,303 | 633,366 | 404,762 | 4,048,775 | ||||||||||||||||
| Foreign currency | ||||||||||||||||||||
| Bonds | 1,374,390 | 10,605,708 | 8,664,732 | 4,955,166 | 25,599,996 | |||||||||||||||
| Commercial loans – Refinería de Cartagena | 1,116,370 | 4,061,541 | 2,174,091 | - | 7,352,002 | |||||||||||||||
| Other | 885,823 | 136,574 | 39,475 | - | 1,061,872 | |||||||||||||||
| 3,376,583 | 14,803,823 | 10,878,298 | 4,955,166 | 34,013,870 | ||||||||||||||||
| 4,019,927 | 17,171,126 | 11,511,664 | 5,359,928 | 38,062,645 | ||||||||||||||||
| Includes short–term credit and the current portion of long–term debt, as applicable. |
The following are the maturities of loans and borrowing as of December 31, 2017:
| Up to 1 year (1) | 1–5 years | 5–10 years | > 10 years | Total | ||||||||||||||||
| Local currency | ||||||||||||||||||||
| Bonds | 253,172 | 742,512 | 322,956 | 373,831 | 1,692,471 | |||||||||||||||
| Syndicated loan | 739,348 | 2,009,420 | 559,182 | – | 3,307,950 | |||||||||||||||
| Other | 98,729 | 415,599 | 308,121 | 156,346 | 978,795 | |||||||||||||||
| 1,091,249 | 3,167,531 | 1,190,259 | 530,177 | 5,979,216 | ||||||||||||||||
| Foreign currency | ||||||||||||||||||||
| Bonds | 2,651,174 | 9,948,238 | 12,018,813 | 4,548,369 | 29,166,594 | |||||||||||||||
| Commercial loans – Refinería de Cartagena | 958,918 | 3,635,848 | 2,807,015 | – | 7,401,781 | |||||||||||||||
| Commercial loans | 153,873 | 315,849 | 59,093 | – | 528,815 | |||||||||||||||
| Other | 289,290 | 119,014 | 63,125 | – | 471,429 | |||||||||||||||
| 4,053,255 | 14,018,949 | 14,948,046 | 4,548,369 | 37,568,619 | ||||||||||||||||
| 5,144,504 | 17,186,480 | 16,138,305 | 5,078,546 | 43,547,835 | ||||||||||||||||
| (1) | Includes short–term credit and the current portion of long–term debt, as applicable. |
Ecopetrol S.A.
Notes to the consolidated financial statements
(Figures expressed in millions of Colombian pesos, unless otherwise stated)
| 18.4 | Breakdown by type of interest rate and currency |
| 2016 | 2015 | |||||||
| Local - currency | ||||||||
| Fixed interest rate | 299,472 | 19,410 | ||||||
| Floating interest rate | 6,442,326 | 7,113,070 | ||||||
| 6,741,798 | 7,132,480 | |||||||
| Foreign currency | ||||||||
| Fixed interest rate | 35,719,486 | 36,994,095 | ||||||
| Floating interest rate | 9,760,743 | 9,096,763 | ||||||
| 45,480,229 | 46,090,858 | |||||||
| Total loans and borrowings | 52,222,027 | 53,223,338 | ||||||
The following is the breakdown of loans and borrowing by type of interest rate as of December 31, 2018 and 2017:
| 2018 | 2017 | |||||||
| Local currency | ||||||||
| Fixed rate | 252,224 | 143,156 | ||||||
| Floating rate | 3,796,551 | 5,836,060 | ||||||
| 4,048,775 | 5,979,216 | |||||||
| Foreign currency | ||||||||
| Fixed rate | 31,432,667 | 35,062,742 | ||||||
| Floating rate | 2,581,203 | 2,505,877 | ||||||
| 34,013,870 | 37,568,619 | |||||||
| 38,062,645 | 43,547,835 | |||||||
LocalThe interest on the bonds in national currency loans and borrowings at floating rates are mainlyis indexed to the CPI (Consumer Price Index) and bank loans and variable rate leasing in Colombian pesos are indexed to the DTF (Fixed Term Deposit). TheDeposits) and IBR (Banking Reference Indicator), plus a differential. Interest on loans in foreign currency loans and borrowings at floating rates are indexed mainly to Liboris calculated based on the LIBOR rate plus a spread.spread and the interests of the other types of debt are at a fixed rate.
| Loans designated as hedging |
As of December 31, 2016 the Company2018, Ecopetrol S.A. designated US$10,5126,500 million (2017 – US$8,532 million) of foreign currency debt as a hedging instrument;instrument, of which US$5,312 million correspond to the cash flow hedge for future crude exports and US$5,200 million is used to hedge investmentsthe net investment in subsidiariesforeign operations with the US dollar as their functional currency.currency, and US$1,300 million is used to hedge the cash flows of future crude oil exports. See Note 31 - 28 –Risk management for further information..
|
| Guarantees and covenants |
For financingFinancing obtained directly by Ecopetrol S.A. in the capital markets which correspond to issuance of local and foreign bonds that, are not guaranteed due to the supporthas no guarantees granted or financial covenant restrictions.
Until December 13, 2017, product of the Colombian Government through the Ministryvoluntary assumption of Finance and Public Credit.
international credit held by Refinería de Cartagena (Reficar) carried out an international commercial loan for US$3,497 millionS.A. on the part of Ecopetrol SA, in its capacity as sponsor, restrictions applied in relation to finance the expansion project of Cartagena Refinery in 2011. This operation imposes restrictions on Reficar’s debt ratio, except for certain conditions expressly set out in contracts about working capital needs. Regarding the financial covenants Reficar is requiredcommitments to maintain a minimum service coverage ratio of minimum debt servicerate of 1.35: 1 debt at certain timespoints in the life of the loan’s life. This subsidiary is in compliance with all covenants and debt commitmentsloan by Refinería de Cartagena SA, as of December 31, 2016.
Underwell as the same transaction Reficar entered intoobligation to have a commercial trust and Securitya depositary and Depositary Agreementsecurity contract to receive the resources of the new refinery to meetfulfill specific purposes such as operating expenses, interest and others.
In the caseThe following is a summary of financing obtained by Oleoducto Bicentenario S.A.S. for the constructioncertain restrictions contained in certain other loan instruments of the project and startup of the pipeline the creation of a main fund was established to manage the funds for the payment of the syndicated loan.Ecopetrol’s subsidiaries:
| The loan entered into by Oleoducto de los Llanos is guaranteed with the economic rights of the ship–or–pay transportation agreements with Frontera Energy Corp and also includes certain restrictions regarding capital contributions and asset disposal. |
| – | The syndicated loan entered into by Oleoducto Bicentenario requires that this subsidiary maintain an established relationship of leverage and solvency and cash flow / service to the debt. |
| – | The loan entered into by Bioenergy with Bancolombia is guaranteed with the La Esperanza 1 and 2 farms and there are certain restrictions on the variation of direct or indirect ownership by Ecopetrol S.A. in this subsidiary. |
Ecopetrol S.A.
Notes to the consolidated financial statements
(Figures expressed in millions of Colombian pesos, unless otherwise stated)
| 18.7 | Fair value of loans |
The fair value of the loans and borrowings is COP$52,109,43838,305,674 and COP$49,668,11945,781,317 as of December 31, 20162018 and 2015,2017, respectively.
Loans are recorded in the financial statements at their amortized cost, which is the financial amount of initial recognition less principal repayments, plus or minus the cumulative amortization using the effective interest method of any difference between that initial amount and the maturity amount.
For fair value measurement, bonds and local currency securitiesbonds were valued using Infovalmer'sInfovalmer reference prices, while for dollar-denominated bonds the Bloomberg methodology was used as the source.in U.S. dollars were valued using Bloomberg. With regard to the other financial obligations for which there is no market benchmark, a discount to present value technique was used. These rates incorporate market risk through some benchmarkbenchmarks (Libor, DTF)FTD) and the Company'sEcopetrol Business Group’s credit risk (spread).
| Movement of net financial debt |
The following is the movement of net financial debt as of December 31, 2018, 2017 and 2016:
Cash and equivalents | Other financial assets | Loans and borrowings | Net financial debt | |||||||||||||
| Balance as of December 31, 2016 | 8,410,467 | 6,686,895 | (52,222,027 | ) | (37,124,665 | ) | ||||||||||
| Cash flow | (174,272 | ) | (564,755 | ) | 11,259,492 | 10,520,465 | ||||||||||
| Exchange difference: | ||||||||||||||||
| Recognized in profit or loss | (290,310 | ) | 208,394 | 147,993 | 66,077 | |||||||||||
| Recognized in other comprehensive income | – | – | 70,958 | 70,958 | ||||||||||||
| Financial cost registered to projects | – | – | (203,964 | ) | (203,964 | ) | ||||||||||
| Financial income (expense) recognized in profit or loss | – | 104,706 | (2,385,994 | ) | (2,281,288 | ) | ||||||||||
| Foreign currency translation | – | 39,628 | (76,171 | ) | (36,543 | ) | ||||||||||
| Other movements that do not generate cash flow | – | 58,857 | (138,122 | ) | (79,265 | ) | ||||||||||
| Balance as of December 31, 2017 | 7,945,885 | 6,533,725 | (43,547,835 | ) | (29,068,225 | ) | ||||||||||
| Cash flow | (2,040,387 | ) | 843,612 | 11,363,077 | 10,166,302 | |||||||||||
| Exchange difference: | ||||||||||||||||
| Recognized in profit or loss | 406,246 | 920,609 | (816,840 | ) | 510,015 | |||||||||||
| Recognized in other comprehensive income | – | - | (2,165,569 | ) | (2,165,569 | ) | ||||||||||
| Financial cost registered to projects | – | - | (217,891 | ) | (217,891 | ) | ||||||||||
| Financial income (expense) recognized in profit or loss | – | 92,906 | (2,399,414 | ) | (2,306,508 | ) | ||||||||||
| Foreign currency translation | – | (245,958 | ) | (203,446 | ) | (449,404 | ) | |||||||||
| Other movements that do not generate cash flow | – | 2,921 | (74,727 | ) | (71,806 | ) | ||||||||||
| Balance as of December 31, 2018 | 6,311,744 | 8,147,815 | (38,062,645 | ) | (23,603,086 | ) | ||||||||||
Ecopetrol S.A. Notes to the consolidated financial statements (Figures expressed in millions of Colombian pesos, unless otherwise stated) |
| Trade and other payables |
The balance at December 31, 2016 and 2015 of trade and other payables, as of December 31, 2018 and 2017, is comprised as follows:follows:
| 2016 | 2015 | 2018 | 2017 | |||||||||||||
| Suppliers | 4,687,353 | 4,979,932 | 6,878,510 | 5,088,957 | ||||||||||||
| Partners’ advances | 864,971 | 675,527 | 874,010 | 880,420 | ||||||||||||
| Withholding tax | 379,194 | 346,578 | 246,867 | 376,169 | ||||||||||||
| Related parties (Note 29) | 116,418 | 129,520 | ||||||||||||||
| Insurance and reinsurance | 211,883 | 121,555 | ||||||||||||||
| Agreements in transport contracts | 210,196 | 91,324 | ||||||||||||||
| Deposits received from third parties | 209,570 | 571,577 | 49,158 | 25,523 | ||||||||||||
| Related parties (Note 32) | 114,420 | 87,463 | ||||||||||||||
| Agreements in transport contracts | 111,899 | 33,735 | ||||||||||||||
| Insurance and reinsurance | 110,530 | 118,338 | ||||||||||||||
| Dividends payable | 11,193 | 693,878 | 84,657 | 3,723 | ||||||||||||
| Various creditors | 389,126 | 250,255 | 304,613 | 280,485 | ||||||||||||
| 6,878,256 | 7,757,283 | 8,976,312 | 6,997,676 | |||||||||||||
| Current | 8,945,790 | 6,968,207 | ||||||||||||||
| Non–current | 30,522 | 29,469 | ||||||||||||||
| 8,976,312 | 6,997,676 | |||||||||||||||
| Current | 6,854,363 | 7,757,277 | ||||||||||||||
| Non-current | 23,893 | 6 | ||||||||||||||
| 6,878,256 | 7,757,283 | |||||||||||||||
| (1) |
| Corresponds to the value of |
The carrying amount of trade accounts and other accounts payable approximates their fair value due to its short-termtheir short–term nature.
| Provisions for |
The following are the balances of provisions for employee benefits as of December 31, 20162018 and 2015:2017:
| 2016 | 2015 | |||||||
| Post-employment benefits | ||||||||
| Healthcare | 4,475,540 | 3,593,428 | ||||||
| Pension | 531,596 | (262,182 | ) | |||||
| Education | 333,379 | 535,356 | ||||||
| Bonds | (191,338 | ) | (483,876 | ) | ||||
| Other | 67,945 | 41,263 | ||||||
| Termination benefits - Voluntary retirement plan | 161,796 | - | ||||||
| 5,378,918 | 3,423,989 | |||||||
| Welfare benefits and salaries payable | 423,360 | 353,285 | ||||||
| Other post-employment benefits | 73,300 | 74,841 | ||||||
| Total | 5,875,578 | 3,852,115 | ||||||
| Current | 1,974,496 | 1,392,266 | ||||||
| Non-current | 3,901,082 | 2,459,849 | ||||||
| 5,875,578 | 3,852,115 | |||||||
| 2018 | 2017 | |||||||
| Post–employment benefits | ||||||||
| Healthcare | 5,507,784 | 5,367,005 | ||||||
| Pension | 1,452,322 | 1,327,859 | ||||||
| Education | 479,945 | 502,260 | ||||||
| Bonds | 331,064 | 348,442 | ||||||
| Other plans | 82,576 | 77,636 | ||||||
| Termination benefits – Voluntary retirement plan | 137,859 | 155,286 | ||||||
| 7,991,550 | 7,778,488 | |||||||
| Social benefits and salaries | 521,802 | 485,939 | ||||||
| Other employee benefits | 93,199 | 67,867 | ||||||
| 8,606,551 | 8,332,294 | |||||||
| Current | 1,816,882 | 1,829,819 | ||||||
| Non–current | 6,789,669 | 6,502,475 | ||||||
| 8,606,551 | 8,332,294 | |||||||
Ecopetrol S.A. Notes to the consolidated financial statements (Figures expressed in millions of Colombian pesos, unless otherwise stated) |
The following table shows the movement in liabilities and assets, net of post-employment benefits and termination benefits, atas of December 31, 20162018 and 2015:2017:
| Pension and pension bonds (1) | Healthcare, Education and others | Total | Pension and bonds (1) | Other | Total | |||||||||||||||||||||||||||||||||||||||||||
| 2016 | 2015 | 2016 | 2015 | 2016 | 2015 | 2018 | 2017 | 2018 | 2017 | 2018 | 2017 | |||||||||||||||||||||||||||||||||||||
| Employee benefits liabilities | ||||||||||||||||||||||||||||||||||||||||||||||||
| Liabilities for employee benefits | ||||||||||||||||||||||||||||||||||||||||||||||||
| Opening balance | 10,435,546 | 11,559,018 | 4,170,047 | 5,515,809 | 14,605,593 | 17,074,827 | 14,147,464 | 12,463,433 | 6,105,432 | 5,041,133 | 20,252,896 | 17,504,566 | ||||||||||||||||||||||||||||||||||||
| Current service cost | - | - | 53,771 | 53,095 | 53,771 | 53,095 | – | – | 77,373 | 52,164 | 77,373 | 52,164 | ||||||||||||||||||||||||||||||||||||
| Past service cost | - | - | 164,271 | - | 164,271 | - | – | – | 50,489 | – | 50,489 | – | ||||||||||||||||||||||||||||||||||||
| Interest expense | 876,076 | 839,716 | 337,844 | 395,977 | 1,213,920 | 1,235,693 | 888,583 | 872,524 | 377,923 | 350,060 | 1,266,506 | 1,222,584 | ||||||||||||||||||||||||||||||||||||
| Actuarial losses (gains) | 1,915,767 | (1,252,017 | ) | 616,834 | (1,490,315 | ) | 2,532,601 | (2,742,332 | ) | |||||||||||||||||||||||||||||||||||||||
| Paid benefits | (763,956 | ) | (711,171 | ) | (301,634 | ) | (304,519 | ) | (1,065,590 | ) | (1,015,690 | ) | ||||||||||||||||||||||||||||||||||||
| Actuarial (gains) losses | (56,655 | ) | 1,621,184 | (27,651 | ) | 1,012,205 | (84,306 | ) | 2,633,389 | |||||||||||||||||||||||||||||||||||||||
| Benefits paid | (847,449 | ) | (809,677 | ) | (371,448 | ) | (350,130 | ) | (1,218,897 | ) | (1,159,807 | ) | ||||||||||||||||||||||||||||||||||||
| Closing balance | 12,463,433 | 10,435,546 | 5,041,133 | 4,170,047 | 17,504,566 | 14,605,593 | 14,131,943 | 14,147,464 | 6,212,118 | 6,105,432 | 20,344,061 | 20,252,896 | ||||||||||||||||||||||||||||||||||||
| Plan assets | ||||||||||||||||||||||||||||||||||||||||||||||||
| Opening balance | 11,181,604 | 11,657,629 | - | - | 11,181,604 | 11,657,629 | 12,471,163 | 12,123,175 | 3,245 | 2,473 | 12,474,408 | 12,125,648 | ||||||||||||||||||||||||||||||||||||
| Return on assets | 950,704 | 849,556 | - | - | 950,704 | 849,556 | 780,494 | 848,677 | 170 | 385 | 780,664 | 849,062 | ||||||||||||||||||||||||||||||||||||
| Change in the effect of the asset ceiling | 379,884 | (329,825 | ) | - | - | 379,884 | (329,825 | ) | ||||||||||||||||||||||||||||||||||||||||
| Paid benefits | (771,528 | ) | (711,432 | ) | 2,406 | - | (769,122 | ) | (711,432 | ) | ||||||||||||||||||||||||||||||||||||||
| Actuarial gains (losses) | 382,511 | (284,324 | ) | 67 | - | 382,578 | (284,324 | ) | ||||||||||||||||||||||||||||||||||||||||
| Contributions to funds | – | – | 21,971 | 22,465 | 21,971 | 22,465 | ||||||||||||||||||||||||||||||||||||||||||
| Benefits paid | (847,449 | ) | (809,677 | ) | (21,526 | ) | (22,078 | ) | (868,975 | ) | (831,755 | ) | ||||||||||||||||||||||||||||||||||||
| Actuarial (losses) gains | (55,651 | ) | 308,988 | 94 | – | (55,557 | ) | 308,988 | ||||||||||||||||||||||||||||||||||||||||
| Closing balance | 12,123,175 | 11,181,604 | 2,473 | - | 12,125,648 | 11,181,604 | 12,348,557 | 12,471,163 | 3,954 | 3,245 | 12,352,511 | 12,474,408 | ||||||||||||||||||||||||||||||||||||
| Net post-employment benefits liability (asset) | 340,258 | (746,058 | ) | 5,038,660 | 4,170,047 | 5,378,918 | 3,423,989 | |||||||||||||||||||||||||||||||||||||||||
| Net post–employment benefits liability | 1,783,386 | 1,676,301 | 6,208,164 | 6,102,187 | 7,991,550 | 7,778,488 | ||||||||||||||||||||||||||||||||||||||||||
| (1) | There is no |
|
The following table shows the movement in resultsprofit and loss and in other comprehensive income as of December 31, 20162018, 2017 and 2015:2016:
| 2016 | 2015 | 2018 | 2017 | 2016 | ||||||||||||||||
| Recognized in profit or loss | ||||||||||||||||||||
| Interest expense, net | 485,842 | 373,522 | 259,266 | |||||||||||||||||
| Current service cost | 53,771 | 53,095 | 77,373 | 52,164 | 53,771 | |||||||||||||||
| Past service cost | 164,271 | - | 50,489 | – | 164,271 | |||||||||||||||
| Interest expense, net | 263,216 | 386,137 | ||||||||||||||||||
| Remedies | 503 | 13,889 | – | |||||||||||||||||
| 481,258 | 439,232 | 614,207 | 439,575 | 477,308 | ||||||||||||||||
| Recognized in other comprehensive income | ||||||||||||||||||||
| Education and severance | 45,509 | (203,779 | ) | 175,259 | ||||||||||||||||
| Pension and pension bonds | 1,003 | (1,312,195 | ) | (1,533,256 | ) | |||||||||||||||
| Termination benefits – Voluntary retirement plan | 93 | (3 | ) | 67 | ||||||||||||||||
| Healthcare | (792,093 | ) | 1,359,631 | (17,356 | ) | (794,535 | ) | (792,093 | ) | |||||||||||
| Pension and pension bonds | (1,533,256 | ) | 967,693 | |||||||||||||||||
| Education and severance | 175,259 | 130,684 | ||||||||||||||||||
| Termination benefits | 67 | - | ||||||||||||||||||
| Change in the effect of the asset ceiling | 379,884 | (329,824 | ) | |||||||||||||||||
| Change in the effect of asset ceiling | – | – | 379,884 | |||||||||||||||||
| (1,770,139 | ) | 2,128,184 | 29,249 | (2,310,512 | ) | �� | (1,770,139 | ) | ||||||||||||
| Deferred tax | 616,697 | (723,582 | ) | (33,539 | ) | 762,469 | 616,697 | |||||||||||||
| Other comprehensive income, net of taxes | (1,153,442 | ) | 1,404,602 | |||||||||||||||||
| (4,290 | ) | (1,548,043 | ) | (1,153,442 | ) | |||||||||||||||
Ecopetrol S.A.
Notes to the consolidated financial statements
(Figures expressed in millions of Colombian pesos, unless otherwise stated)
| Plan assets |
Plan assets are represented in the resources provided to Pension Trusts,held by pension trusts for payment of the pension liabilities relating to the obligationsobligations. Payments for monthly pension payments and bonds; that pertaining to health and education post–employment benefits is under the responsibility of Ecopetrol.Ecopetrol’s responsibility. The destination of trust resources and its yields cannot be changed or returned to the CompanyEcopetrol Business Group until all pension obligations have been fulfilled.
The following is the composition by investment type is comprised as follows at December 31, 2016 and 2015:
| 2016 | 2015 | |||||||
| Bonds issued by the Colombian Government | 4,410,326 | 4,099,067 | ||||||
| Bonds of private entities | 2,880,958 | 3,405,440 | ||||||
| Other bonds of public entities | 693,061 | 790,601 | ||||||
| Bonds of foreign entities | 622,817 | 300,181 | ||||||
| Variable yield | 305,052 | 278,716 | ||||||
| Other local currency | 2,910,083 | 2,257,655 | ||||||
| Other foreign currency | 300,878 | 429,828 | ||||||
| Fair value of plan assets | 12,123,175 | 11,561,488 | ||||||
| Less asset ceiling | - | (379,884 | ) | |||||
| 12,123,175 | 11,181,604 | |||||||
The yield onof the plan assets of pension and pension bonds by type of investment as of December 31, 2016 was 11.60% (4.96% - 2015). The credit quality2018 and 2017:
| 2018 | 2017 | |||||||
| Bonds issued by the national government | 4,307,972 | 4,349,400 | ||||||
| Bonds of private entities | 2,910,071 | 2,967,030 | ||||||
| Other local currency | 2,219,634 | 2,340,825 | ||||||
| Other public bonds | 1,014,663 | 1,149,200 | ||||||
| Variable yield | 653,828 | 605,380 | ||||||
| Bonds of foreign entities | 554,685 | 558,920 | ||||||
| Other foreign currency | 691,658 | 503,653 | ||||||
| 12,352,511 | 12,474,408 | |||||||
47.4% of issuers and counterparties in transactions involving plan assets is describedare classified as level 1 in Note 31.3 – Credit risk.
The following is the fair value hierarchy ofwhere prices for the plan assets are directly observable on actively traded markets, and 52.6% are classified as of December 31, 2016level 2 (46.0% and 2015:54.0% for 2017, respectively).
| 2016 | 2015 | |||||||
| Level 1 | 5,604,643 | 3,876,386 | ||||||
| Level 2 | 6,518,532 | 7,685,102 | ||||||
| 12,123,175 | 11,561,488 | |||||||
The fair value of thelevel 2 plan assets is calculated using prices quoted in the relevant assets’ market. The CompanyEcopetrol Business Group obtains these prices through reliable financial data suppliersproviders recognized in Colombia or abroad depending on the investment.
|
For the securities issued in local currency, the fair value of the plan assets is calculated using information published by Infovalmer, a price supplier of prices authorized by the SuperintendencyFinancial Superintendence of Finance.Colombia. According to its methodology, prices may beare calculated based on market information aton the valuation date or estimated based on historicfrom historical inputs in accordance withaccording to the criteria established for the calculation of each of the prices.
The fair valueaverage price is calculated based on the most representative market of the transactions carried out through electronic platforms approved and supervised by the regulator.
TheOn the other hand, the estimated price is calculated for investments that do not reflect sufficientenough information to estimate an average market price, replicating the quoted prices for similar assets or prices obtained through stock broker quotes.quotes from brokers. This estimated price is also given by Infovalmer as a result of the application of robust methodologies approved by the financial regulator and widely used by the financial sector.
The following table reflects the credit quality of the issuers and counterparties in assets held by the autonomous pension funds:
| 2018 | 2017 | |||||||
| AAA | 4,683,190 | 4,870,932 | ||||||
| Nation | 4,364,188 | 4,471,274 | ||||||
| AA+ | 860,905 | 690,391 | ||||||
| BBB- | 426,743 | 192,636 | ||||||
| BAA3 | 310,788 | 45,699 | ||||||
| F1+ | 249,361 | 230,321 | ||||||
| BBB | 193,579 | 246,795 | ||||||
| BRC1+ | 89,211 | 118,008 | ||||||
| BBB+ | 86,040 | 159,103 | ||||||
| A | 62,754 | 39,048 | ||||||
| AA- | 60,382 | 18,770 | ||||||
| AA | 28,367 | 58,234 | ||||||
| BAA1 | 21,395 | 5,296 | ||||||
| A3 | 17,075 | 29,098 | ||||||
| BAA2 | - | 371,972 | ||||||
| Other qualifications | 55,768 | 50,784 | ||||||
| No rating available | 842,765 | 876,047 | ||||||
| 12,352,511 | 12,474,408 | |||||||
See credit risk policy in Note 28.2.
Ecopetrol S.A.
Notes to the consolidated financial statements
(Figures expressed in millions of Colombian pesos, unless otherwise stated)
| Actuarial assumptions |
The following are the actuarial assumptions used in determining the present value of defined employee benefit obligations atused for the actuarial calculations as of December 31, 20162018 and 2015:2017:
| 2016 | Pension | Bonds | Healthcare | Education | Other benefits (1) | |||||||||||||||||||||||||||||||||||
| 2018 | Pension | Bonds | Health | Education | Other benefits(1) | |||||||||||||||||||||||||||||||||||
| Discount rate | 7.25 | % | 7.00 | % | 7.25 | % | 6.50 | % | 6.67 | % | 6.75 | % | 6.50 | % | 7.00 | % | 6.75 | % | 5.87 | % | ||||||||||||||||||||
| Salary growth rate | N/A | N/A | N/A | N/A | 4.25 | % | N/A | N/A | N/A | N/A | 5.10% / 4.70 | % | ||||||||||||||||||||||||||||
| Expected inflation rate | 3.00 | % | 3.00 | % | 3.00 | % | 3.00 | % | 3.00 | % | 3.00 | % | 3.00 | % | 3.00 | % | 3.00 | % | 3.00 | % | ||||||||||||||||||||
| Pension growth rate | 3.00 | % | N/A | N/A | N/A | N/A | 3.00 | % | N/A | N/A | N/A | N/A | ||||||||||||||||||||||||||||
| Cost trend | ||||||||||||||||||||||||||||||||||||||||
| Short-term rate | N/A | N/A | 3.00 | % | 4.00 | % | N/A | |||||||||||||||||||||||||||||||||
| Long-term rate | N/A | N/A | 4.00 | % | 4.00 | % | N/A | |||||||||||||||||||||||||||||||||
| Short–term rate | N/A | N/A | 7.00 | % | 4.00 | % | N/A | |||||||||||||||||||||||||||||||||
| Long–term rate | N/A | N/A | 4.00 | % | 4.00 | % | N/A | |||||||||||||||||||||||||||||||||
| 2015 | Pension | Bonds | Healthcare | Education | Other benefits (1) | |||||||||||||||||||||||||||||||||||
| 2017 | Pension | Bonds | Health | Education | Other benefits(1) | |||||||||||||||||||||||||||||||||||
| Discount rate | 8.50 | % | 8.50 | % | 8.50 | % | 7.75 | % | 8.00 | % | 6.50 | % | 6.25 | % | 6.50 | % | 5.50 | % | 5.51 | % | ||||||||||||||||||||
| Salary growth rate | 4.25 | % | N/A | N/A | N/A | 4.25 | % | N/A | N/A | N/A | N/A | 4.75% / 4.25 | % | |||||||||||||||||||||||||||
| Expected inflation rate | 3.00 | % | 3.00 | % | 3.00 | % | 3.00 | % | 3.00 | % | 3.00 | % | 3.00 | % | 3.00 | % | 3.00 | % | 3.00 | % | ||||||||||||||||||||
| Pension growth rate | 3.00 | % | N/A | N/A | N/A | N/A | 3.00 | % | N/A | N/A | N/A | N/A | ||||||||||||||||||||||||||||
| Cost trend | ||||||||||||||||||||||||||||||||||||||||
| Short-term rate | N/A | N/A | 3.50 | % | 4.00 | % | N/A | |||||||||||||||||||||||||||||||||
| Long-term rate | N/A | N/A | 4.00 | % | 4.00 | % | N/A | |||||||||||||||||||||||||||||||||
| Short–term rate | N/A | N/A | 6.00 | % | 4.00 | % | N/A | |||||||||||||||||||||||||||||||||
| Long–term rate | N/A | N/A | 4.00 | % | 4.00 | % | N/A | |||||||||||||||||||||||||||||||||
N/A: Not applicable for this benefit.
| (1) | Weighted average |
The cost trend is the projected increase for the initial year, which includes the expected inflation rate.
The mortality table used for allthe calculations was ´Valid Annuitants”that of ‘Valid Annuitant’ for men and women based on the experience gained for the period 2005-20082005–2008 of the Colombian Social Security Institute – ISS.Institute.
|
| Maturity of benefit obligation |
The cash flowflows required for post-employment benefits liability is comprised as follows:payment of post–employment obligations are the following:
| Period | Pension and pension bonds | Other benefits | Total | Pension and bonds | Other benefits | Total | ||||||||||||||||||
| 2017 | 794,566 | 330,539 | 1,125,105 | |||||||||||||||||||||
| 2018 | 820,364 | 328,351 | 1,148,715 | |||||||||||||||||||||
| 2019 | 842,858 | 330,878 | 1,173,736 | 914,959 | 366,866 | 1,281,825 | ||||||||||||||||||
| 2020 | 864,392 | 333,292 | 1,197,684 | 939,158 | 373,953 | 1,313,111 | ||||||||||||||||||
| 2021 | 886,464 | 336,423 | 1,222,887 | 962,651 | 381,734 | 1,344,385 | ||||||||||||||||||
| 2022-2025 | 4,877,784 | 1,672,066 | 6,549,850 | |||||||||||||||||||||
| 2022 | 973,491 | 387,940 | 1,361,431 | |||||||||||||||||||||
| 2023 | 996,864 | 397,555 | 1,394,419 | |||||||||||||||||||||
| 2024 - 2028 | 5,434,882 | 2,104,259 | 7,539,141 | |||||||||||||||||||||
Ecopetrol S.A.
Notes to the consolidated financial statements
(Figures expressed in millions of Colombian pesos, unless otherwise stated)
| Sensitivity analysis |
The following sensitivity analysis below has been determined based on reasonablyshows the effect of such possible changes ofon the respective assumptions occurring at the end of the reporting period,obligation for defined benefits, while keeping allthe other assumptions constant, as constant, atof December 31, 2016:2018:
| Pension | Pension bonds | Healthcare | Education | Other benefits | ||||||||||||||||
| Discount rate | ||||||||||||||||||||
| -50 basis points | 12,278,122 | 894,404 | 4,785,817 | 345,279 | 235,987 | |||||||||||||||
| +50 basis points | 10,996,917 | 815,680 | 4,197,636 | 329,870 | 224,749 | |||||||||||||||
| Inflation rate | ||||||||||||||||||||
| -50 basis points | 10,946,122 | 814,065 | - | - | 161,456 | |||||||||||||||
| +50 basis points | 12,330,307 | 895,826 | - | - | 167,152 | |||||||||||||||
| Salary growth rate | ||||||||||||||||||||
| -50 basis points | - | - | - | - | 62,511 | |||||||||||||||
| +50 basis points | - | - | - | - | 69,633 | |||||||||||||||
| Cost trend | ||||||||||||||||||||
| -50 basis points | - | - | 4,198,775 | 330,360 | - | |||||||||||||||
| +50 basis points | - | - | 4,782,280 | 344,700 | - | |||||||||||||||
The Company conducted a sensitivity analysis related to the interest rate variation on plan assets. See section 30 – Risk management.
| Pension | Bonds | Health | Education | Other benefits | ||||||||||||||||
| Discount rate | ||||||||||||||||||||
| –50 basis points | 13,896,668 | 1,030,073 | 5,907,754 | 500,234 | 229,859 | |||||||||||||||
| +50 basis points | 12,449,997 | 956,984 | 5,152,929 | 461,725 | 219,178 | |||||||||||||||
| Inflation rate | ||||||||||||||||||||
| –50 basis points | 12,395,671 | 955,640 | N/A | N/A | 139,854 | |||||||||||||||
| +50 basis points | 13,951,861 | 1,031,197 | N/A | N/A | 143,807 | |||||||||||||||
| Salary growth rate | ||||||||||||||||||||
| –50 basis points | N/A | N/A | N/A | N/A | 78,849 | |||||||||||||||
| +50 basis points | N/A | N/A | N/A | N/A | 86,509 | |||||||||||||||
| Cost trend | ||||||||||||||||||||
| –50 basis points | N/A | N/A | 5,155,141 | 461,296 | N/A | |||||||||||||||
| +50 basis points | N/A | N/A | 5,902,319 | 500,566 | N/A | |||||||||||||||
| Voluntary retirement plan |
In August 2016, the CompanyEcopetrol Business Group offered a voluntary retirement plan to 200 employees who met certain criteria. As of December 31, 2018, 2017 and 2016, 137 employees were part of the plan, with a corresponding cost of COP$161,796.137,859 (2017 – COP$155,286 and 2016 – COP$161,796). This plan includes benefits such as monthly income, education and health benefits until the date on which the employee is granted their retirement pension.
|
| Accrued liabilities and provisions |
The following shows aBelow is the breakdown of the changes in the different categories of accrued liabilitiesprovisions and provisions for the years endedcontingencies as of December 31, 20162018 and 2015:2017:
| Asset retirement obligation | Litigations | Comuneros provision | Environmental contingencies and others | Total | ||||||||||||||||
| Balance at December 31, 2015 | 4,452,369 | 99,798 | 702,486 | 822,694 | 6,077,347 | |||||||||||||||
| Increase in abandonment costs | 404,797 | - | - | - | 404,797 | |||||||||||||||
| Additions (recoveries) | 18,285 | 44,120 | (702,486 | ) | (74,312 | ) | (714,393 | ) | ||||||||||||
| Uses | (68,460 | ) | (4,585 | ) | - | (31,218 | ) | (104,263 | ) | |||||||||||
| Financial cost | 317,448 | - | - | (173 | ) | 317,275 | ||||||||||||||
| Foreign currency translation | (14,703 | ) | (355 | ) | - | (2,759 | ) | (17,817 | ) | |||||||||||
| Transfers (1) | (45,076 | ) | 70,954 | - | (70,954 | ) | (45,076 | ) | ||||||||||||
| Balance at December 31, 2016 | 5,064,660 | 209,932 | - | 643,278 | 5,917,870 | |||||||||||||||
| Current | 330,057 | 146,767 | - | 345,130 | 821,954 | |||||||||||||||
| Non-current | 4,734,603 | 63,165 | - | 298,148 | 5,095,916 | |||||||||||||||
| Total | 5,064,660 | 209,932 | - | 643,278 | 5,917,870 | |||||||||||||||
Asset retirement obligation | Litigation | Environmental contingencies and others | Total | |||||||||||||
| Balance as of December 31, 2017 | 5,527,324 | 182,966 | 827,159 | 6,537,449 | ||||||||||||
| Increase in abandonment costs | 1,062,280 | - | - | 1,062,280 | ||||||||||||
| Additions | 71,015 | 61,851 | 174,780 | 307,646 | ||||||||||||
| Uses | (182,130 | ) | (114,647 | ) | (100,215 | ) | (396,992 | ) | ||||||||
| Financial costs | 186,518 | - | - | 186,518 | ||||||||||||
| Foreign currency translation | 54,610 | (2,368 | ) | 10,983 | 63,225 | |||||||||||
| Transfers | (342 | ) | 143 | (5,915 | ) | (6,114 | ) | |||||||||
| Balance as of December 31, 2018 | 6,719,275 | 127,945 | 906,792 | 7,754,012 | ||||||||||||
| Current | 549,678 | 88,623 | 176,108 | 814,409 | ||||||||||||
| Non-current | 6,169,597 | 39,322 | 730,684 | 6,939,603 | ||||||||||||
| 6,719,275 | 127,945 | 906,792 | 7,754,012 | |||||||||||||
| Asset retirement obligation | Litigations | Comuneros provision | Environmental contingencies and others | Total | ||||||||||||||||
| Balance at December 31, 2014 | 4,281,107 | 299,551 | 551,497 | 705,916 | 5,838,071 | |||||||||||||||
| Additions (recoveries) | (60,813 | ) | (188,962 | ) | 150,989 | 188,701 | 89,915 | |||||||||||||
| Uses | (84,333 | ) | (10,791 | ) | - | (74,876 | ) | (170,000 | ) | |||||||||||
| Financial cost | 238,876 | - | - | 2,417 | 241,293 | |||||||||||||||
| Foreign currency translation | 89,793 | - | - | 5,905 | 95,698 | |||||||||||||||
| Transfers (1) | (12,261 | ) | - | - | (5,369 | ) | (17,630 | ) | ||||||||||||
| Balance at December 31, 2015 | 4,452,369 | 99,798 | 702,486 | 822,694 | 6,077,347 | |||||||||||||||
| Current | 195,858 | 85,364 | - | 372,275 | 653,497 | |||||||||||||||
| Non-current | 4,256,511 | 14,434 | 702,486 | 450,419 | 5,423,850 | |||||||||||||||
| Total | 4,452,369 | 99,798 | 702,486 | 822,694 | 6,077,347 | |||||||||||||||
Asset retirement obligation | Litigation | Environmental contingencies and others | Total | |||||||||||||
| Balance as of December 31, 2016 | 5,064,660 | 209,932 | 643,278 | 5,917,870 | ||||||||||||
| Increase in abandonment costs | 39,634 | – | – | 39,634 | ||||||||||||
| Additions (reversals) | 110,587 | (19,185 | ) | 106,532 | 197,934 | |||||||||||
| Uses | (66,469 | ) | (7,742 | ) | (19,613 | ) | (93,824 | ) | ||||||||
| Financial costs | 379,891 | – | (367 | ) | 379,524 | |||||||||||
| Foreign currency translation | (979 | ) | (39 | ) | 718 | (300 | ) | |||||||||
| Transfers (1) | – | – | 96,611 | 96,611 | ||||||||||||
| Balance as of December 31, 2017 | 5,527,324 | 182,966 | 827,159 | 6,537,449 | ||||||||||||
| Current | 199,824 | 159,881 | 199,123 | 558,828 | ||||||||||||
| Non–current | 5,327,500 | 23,085 | 628,036 | 5,978,621 | ||||||||||||
| 5,527,324 | 182,966 | 827,159 | 6,537,449 | |||||||||||||
| (1) | Mainly includes transfers to liabilities associated with assets held for sale. |
Ecopetrol S.A.
Notes to the consolidated financial statements
(Figures expressed in millions of Colombian pesos, unless otherwise stated)
Asset retirement obligation | Litigation | Comuneros provision | Environmental contingencies and others | Total | ||||||||||||||||
| Balance as of December 31, 2015 | 4,452,369 | 99,798 | 702,486 | 822,694 | 6,077,347 | |||||||||||||||
| Increase in abandonment costs | 404,797 | - | - | - | 404,797 | |||||||||||||||
| Additions (reversals) | 18,285 | 44,120 | (702,486 | ) | (74,312 | ) | (714,393 | ) | ||||||||||||
| Uses | (68,460 | ) | (4,585 | ) | - | (31,218 | ) | (104,263 | ) | |||||||||||
| Financial costs | 317,448 | - | - | (173 | ) | 317,275 | ||||||||||||||
| Foreign currency translation | (14,703 | ) | (355 | ) | - | (2,759 | ) | (17,817 | ) | |||||||||||
| Transfers (1) | (45,076 | ) | 70,954 | - | (70,954 | ) | (45,076 | ) | ||||||||||||
| Balance as of December 31, 2016 | 5,064,660 | 209,932 | - | 643,278 | 5,917,870 | |||||||||||||||
| Current | 330,057 | 146,767 | - | 345,130 | 821,954 | |||||||||||||||
| Non-current | 4,734,603 | 63,165 | - | 298,148 | 5,095,916 | |||||||||||||||
| 5,064,660 | 209,932 | - | 643,278 | 5,917,870 | ||||||||||||||||
| (1) | Mainly includes transfers to liabilities associated with assets held for sale. |
| Asset retirement obligation |
AssetThe estimated liability for asset retirement obligation costs corresponds to the Company's future obligation that the Ecopetrol Business Group to restore environmental conditions into a mannerlevel similar to thosethat existing prior tobefore the start of projects or activities, as described in section 3.5.Note 3.5 – Abandonment and dismantling costs of fields and other facilities. As long-termthese relate to long–term obligations, this liability is estimated by projecting the expected future payments and discounting at present value with a rate referencedindexed to the Company'sEcopetrol Business Group’s financial obligations, taking into account the temporalitytemporariness and risks of this obligation. The weighted average discount rate atrates used in the estimate of the obligation as of December 31, 2016 was 7.80% (2015 - 7.28%)2018 were: Exploration and Production 3.54%, Transportation and Logistics 3.69% and Refining and Petrochemicals 3.84%. For 2017, the equivalent real discount rates were: Production 3.34%, Transportation 3.43% and Refining 3.77%.
|
The following is a summary of the main legal proceedings recognized in the consolidated statement of financial position, whosewhere the expectation of loss expectations are highlyis probable and could imply an outflow of resources atas of December 31, 20162018 and 2015:2017:
| Claims | 2016 | 2015 | ||||||
| Provision for payment of premium to update the Legal Stability Contract with the Ministry of Finance and Public Credit, generated by the increased investment in the expansion project. | 59,528 | 54,181 | ||||||
| Settlement before the Procuraduría General de la Nación with the firms Acciona Infraestructura S.A. y Mantenimiento y Montajes S.A., on August 18, 2016. | 44,986 | - | ||||||
| Litigation with Schrader Camargo, supplier for Reficar | 17,003 | 17,003 | ||||||
| Damage to third parties caused by hydrocarbon easement in a property near toRefinería de Cartagena. | 11,019 | 11,019 | ||||||
| Lawsuit by the Sincco consortium for damage related to contractual conditions for the modernization project at the product filling station at the Barrancabermeja industrial complex. | 5,347 | 5,347 | ||||||
| Damage to third parties caused by a spill of oil owned by Ecopetrol during a car accident in the Raizal rural district in Cundinamarca. | 3,500 | 3,500 | ||||||
| Labor proceeding in 2007 for recalculation of salaries and benefits based on the collective agreement for 232 contractors of Ecopetrol. In the last quarter of 2015 the claimant filed a request for settlement for a new amount of COP$9,338. In 2016 the ruling issued was favorable to Ecopetrol. | 10 | 9,338 | ||||||
| Proceedings | 2018 | 2017 | ||||||
| Controversy for breach of contract with the firms Consulting Group and Industrial Consulting S.A.S., with Refinería de Cartagena. | 15,541 | - | ||||||
| Damages to third parties due to hydrocarbon easement in a property close to Refinería de Cartagena. | 11,019 | 11,019 | ||||||
| Lawsuit filed by a group of people who claim to be victims of the incident in Machuca, Municipality of Segovia - Antioquia against Oleoducto Central S.A. - Ocensa | 9,410 | 9,410 | ||||||
| Provision for the payment of the 2016 legal stability contract premium with the Ministry of Finance and Public Credit, in Refinería de Cartagena – Payment made in 2018 | - | 64,104 | ||||||
| Litigation with Schrader Camargo, supplier of Refinería de Cartagena. In 2018, a payment agreement was reached. | - | 17,003 | ||||||
On November 8, 2016, the Ministry of Mines and Energy concluded that the amounts being held were not royalties and therefore not due to the Comuneros. The amounts belonged to Ecopetrol and therefore Ecopetrol recovered the provision it had been recognizing in its financial statements relating to this dispute.
In accordance with the foregoing, the resources held by Ecopetrol are their property without any claim or discussion to date regarding ownership title thereof. On November 8, 2016, the amount of the controversy added up to COP$688,664 originated mostly from the valuation and financial yields of the fund where the resources were deposited. The reversal of this provision was recognized in the net financial results of the period ending December 31, 2016.
| Environmental contingencies and others |
These are mainlycorrespond to contingencies for environmental incidents and obligations related to environmental compensation obligationsand mandatory investment of 1% for the use and impactof, exploitation of or effect on natural resources within the frameworkimposed by national, regional and local environmental authorities. Mandatory investment of environmental authorizations and 1% mandatory investment foris based on the use of water taken directly from natural sources pursuant to that provided for in accordance with the provisions of Law 99 of 1993, articleArticle 43, and Decree 1900 of 2006, Decree 2099 of 2017 and 075 and 1120 of 2018 in relation withto the projects that Ecopetrol projectsdevelops in Colombia.
Ecopetrol S.A.
Notes to the region. On December 22, 2016,consolidated financial statements
(Figures expressed in millions of Colombian pesos, unless otherwise stated)
The Colombian Government through the Ministry of the Environment and Sustainable Development, issued Decreein December 2016 and in January 2017 the Decrees 2099 whereby it amendedand 075, which modify the Single Regulatory Single Decree of the environment and sustainable development sector, Decree 1076 of 2015, related to theirthe mandatory investment for the use of water taken directly from natural sources;sources.
The main changes established by these decrees were related to the Companyareas and lines of investment and the basis for settlement of the obligations. Similarly, June 30, 2018 was declared the maximum date to modify investment plans that were underway.
On June 30, 2017, Ecopetrol filed with the National Environmental Licensing Authority (ANLA) certain investment plans to meet the 1% mandatory investment based on the new decrees, relative to investment lines, maintaining the settlement base of Decree 1900.
As of December 31, 2018, the provision for the 1% mandatory investment for the use of water was estimated based on the parameters established in Decree 1076 of 2015. The Ecopetrol Business Group is currentlyin the process of analyzing the impact derived from its implementation.of the applicability of the changes set out in the aforementioned decrees.
|
| Contingencies |
Oleoducto Central S.A. - Ocensa
In 2017, Oleoducto Central Ocensa. S.A. (Ocensa) recognized a provision to address a probable loss from the potential outcome of the arbitration process filed by Frontera Energy Colombia Corp., Colombia Branch (Frontera); this arbitration process concluded on July 12, 2018 as a result of the Arbitral Court’s approval of the reconciliation agreement achieved by the parties, pursuant to which the standard transport rate was revised along with the monetary conditions of the transport agreements entered into July 29, 2014 for expanded capacity resulting from the P135 Project, in turn extending its effects from July 1, 2017 (effective date of the transport agreements). On July 12, 2018, the parties entered into the corresponding addenda to the current transport agreements, reflecting the changes contained in the approved reconciliation agreement.
Similarly, for Project P135 carriers that accepted the binding offer extended by Ocensa with regard to the principles of Resolution No. 72146 of 2014, a transaction agreement has been entered into along with the respective additional provisions amending the transport agreements, under identical or equivalent conditions as those contained in the reconciliation agreement and addenda with Frontera. Concerning the arbitral proceeding convened by Vitol Colombia C.I. S.A.S., the parties have requested, by mutual consent, that the Arbitral Court terminate the proceeding as a result of the settlement agreement reached on July 23, 2018. This request was accepted by the Court at the hearing of August 8, 2018, thus concluding the arbitral process.
The reconciliation and settlement agreements entered into established the obligation of the carriers to cease their current administrative or legal actions and refrain from filing new claims in the future.
As a result, Ocensa reconciled and adjusted the accounts receivable and payable that were held between the parties and the credit notes were issued to reflect the balances in favor of the senders. This recognition in the financial statements generated a movement of the provision and its corresponding effect on other operating income of COP COP$56,122, in addition to the decrease in income from ordinary activities as of June 30th because of the issued credit notes.
Oleoducto Bicentenario de Colombia S.A.S.
During July 2018 the carriers Frontera Energy Colombia Corp. (“Frontera”), Canacol Energy Colombia S.A.S. (“Canacol”) and Vetra Exploración y Producción Colombia S.A.S. (“Vetra” and, together with Frontera and Canacol, the “Carriers”) sent letters to Oleoducto Bicentenario de Colombia S.A.S. (“Bicentenario”) alleging they were early termination rights under the Ship-or-Pay Transport Agreements entered by each of them and Bicentenario in 2012 (the “Transport Agreements”). Bicentenario has rejected the terms of the letters, noting that there is no option for early termination and reiterating to the Carriers that the Transport Agreements are current and therefore the Carriers must fullfill their obligations under the Transport Agreements in a timely fashion.
Ecopetrol S.A.
Notes to the consolidated financial statements
(Figures expressed in millions of Colombian pesos, unless otherwise stated)
Under Bicentenario’s understanding that the Transport Agreements remain current and that the Carriers are in violation of their obligations under such agreements, Bicentenario declared the Carriers delinquent because of their failure to pay for transport service under the aforementioned agreements. Consequently, Bicentenario executed the standby letters of credit posted as guarantee for the Transport Agreements.
On October 19, 2018, Bicentenario notified Frontera of the existence of a “Dispute” pursuant to Clause 20 of the respective Transport Agreement and moved to the party dispute settlement stage as provided for in such clause. Such discussions ended without an agreement on December 19, 2018. On January 28, 2019, Bicentenario filed an Arbitration Claim against Frontera in accordance with the arbitration clause of the Transportation Agreement to claim any compensation, indemnification or other restitution deriving from the alleged early termination of said agreements.
Similarly, on November 1, 2018, Bicentenario notified Vetra and Canacol of the existence of a “Dispute” pursuant to Clause 20 of the respective Transport Agreement and moved to the party dispute settlement stage as provided for in each such respective clause. Such discussions ended without agreement on March, 2019.
As of the date of these financial statements, Bicentenario continues evaluating its options under the Transport Agreements and the Shareholders Agreement (Acuerdo Marco de Inversión) in order to guarantee compliance and claim any compensation, indemnification or other restitution deriving from the alleged early termination of said agreements and any other contractual breaches by the Carriers.
Cenit Transporte y Logística de Hidrocarburos S.A.S.
During July 2018, the carriers Frontera, Vetra and Canacol (“carriers”) sent notifications to Cenit Transporte y Logística de Hidrocarburos SAS (“Cenit”) alleging they were exercising their early termination right under the Ship-or-Pay Crude Oil Transport Agreements (SoP agreements) entered among each of them and Cenit for the transportation of crude oil through the Caño Limón – Coveñas pipeline (owned by Cenit).
In response to the alleged termination of SoP Agreements, CENIT issued letters stating that the alleged event which would have given the carriers early termination rights had not occurred as provided for in Clause 13.3 and other clauses of the aforementioned SoP agreements. In the same letters, CENIT stated that it would continue invoicing and charging for the transport services as stipulated in the SoP agreements, since they remain in force, and therefore, Carriers must fulfill their contractual obligations.
In November, 2018, CENIT filed an arbitration demand against Frontera Energy Group pleadging that SoP Agreements are in full force and effect, that Frontera is obliged to comply its terms and conditions and, therefore, is obliged to pay transportation tariffs as agreed in the SoP agreements. In similar terms an arbitration demand was also filed against Vetra and the same will occur against Canacol.
Ecopetrol S.A.
Notes to the consolidated financial statements
(Figures expressed in millions of Colombian pesos, unless otherwise stated)
| 21.5 | Legal proceedings not |
The following is a summary of the main contingent liabilities that have not been recognized in the statement of financial position sinceas, according to the evaluations performedmade by Company’s internal and external advisors their occurrenceof the Ecopetrol Business Group, the expectation of loss is not probable atas of December 31, 20162018 and 2015:2017:
| Claims | 2016 | 2015 | ||||||
| Income tax for taxable year 2010 of Hocol - Rejections related to: a) Special production on productive fixed assets related to unsuccessful exploratory wells. b) Deduction of disbursements related to geology, geophysics and seismic, which must be capitalized and amortized. | 197,824 | 197,824 | ||||||
| Income tax for taxable year 2011 of Hocol - Rejections related to: a) Special production on real productive fixed assets related to unsuccessful exploratory wells. b) Deduction of disbursements related to geology, geophysics and seismic, which must be capitalized and amortized. | 147,091 | 147,091 | ||||||
| On March 14, 2016, a lawsuit was filed for default in settling the contract between Konidol and Ecopetrol, which gave rise to excess costs in the maintenance contract. | 62,131 | - | ||||||
| Indemnity to third parties for damage caused by hydrocarbon spills during a tanker truck accident on the Villeta - Guaduas road. | 43,333 | 43,333 | ||||||
| Recalculation of legal and extralegal social benefits on cash paid for the benefit of saving incentives. | 16,562 | 16,562 | ||||||
| Claim to Ecopetrol for legal actions filed against Cepsa as the operator of the Association contract for excess costs in current contracts. | 10,608 | - | ||||||
| Default by Ecopetrol in fulfilling contractual terms of the civil works project with the contractor Edgar Gómez Lucena y Asociados Ltda. | 10,000 | 10,000 | ||||||
Transfers of the electric energy sector for electric power self–generation, pursuant to Law 142 of 1994. In 2016 there was a second instance ruling that was favorable to Ecopetrol. | - | 219,944 | ||||||
|
| Proceedings | 2018 | 2017 | ||||||
| Administrative and patrimonial responsibility for terrorist attack perpetuated in 2015 against the TransAndino Pipeline. | 500,000 | - | ||||||
| Action of group that claim damages derived from the pollution caused by the attack on the TransAndino pipeline in 2015. | 358,201 | - | ||||||
| Environmental damages for terrorist attack perpetuated in 2015 against the Transandino pipeline. | 209,220 | 209,220 | ||||||
| Breaking of the economic and financial balance with contractor for the construction of transport system. | 110,266 | 110,266 | ||||||
| Breach of contract and recognition of salary readjustments and other claims related to an engineering service provider. | 85,198 | - | ||||||
| On March 14, 2016, a claim was filed for breach in the settlement of the contract between Konidol and Ecopetrol, which generated cost overruns in the maintenance contract. | 62,131 | 62,131 | ||||||
| Salary readjustments to the values established by Ecopetrol for personnel related to a contract signed with a third party for the assembly and construction of surface facilities for production and exploration projects. | 60,313 | 60,313 | ||||||
| Contractual imbalance with a technical maintenance provider. | 51,429 | - | ||||||
| Contractual imbalance with a third party that provides assembly and construction services for surface facilities for exploration and production projects. | 35,741 | - | ||||||
| Contractual imbalance with a third party in connection with road connection works. | 31,679 | 31,679 | ||||||
| Breach of certain obligations agreed in contract with supplier for the construction and assembly of tanks. | 31,213 | - | ||||||
| Contractual controversial with a third party in relation to seismic program acquisition and processing service. | 30,000 | 30,000 | ||||||
Included below, thereThe following is a detailbreakdown of the majorEcopetrol Business Group’s principal contingent assets, contingencies of which occurrencewhere the associated contingent gain is possible at December 31, 2016 and 2015:likely, but not certain:
| Claims | 2016 | 2015 | ||||||
| Default in fulfilling the pipe purchase order subscribe to with Daewoo International Corp. | 21,232 | 21,232 | ||||||
| Public lighting tax in the municipality of Barrancabermeja for the years 2003 to 2005. | 17,490 | - | ||||||
| Nullity of administrative act issued by the DIAN, which ordered a special contribution for public works contracts. | 13,214 | 13,214 | ||||||
| Nullity of resolution 113 of 1971 of the Presidency of Colombia, whereby the subsurface property titles were transferred to private parties known with the names of Santiago de las Atalayas and Pueblo Viejo de Cusiana. In 2016, the lawsuit ended in favor of Ecopetrol, making it clear that the sequestered cash is the property of Ecopetrol. | - | 175,000 | ||||||
| Nullity of administrative act that ordered a special contribution for public works contracts. In 2016, there was a first instance ruling that is partially favorable to the claims of Ecopetrol. | 2 | 14,956 | ||||||
| Proceedings | 2018 | 2017 | ||||||
| Claim by Ecopetrol for differences in the settlement of additional income due to high prices. | 286,331 | - | ||||||
| Disagreement regarding the interpretation and application of the staggered production clause. | 98,031 | - | ||||||
| Non-compliance with the association contract in relation to reimbursement of administrative costs and other claims. | 43,007 | 40,711 | ||||||
| In 2015, the administrator of the Agreements signed with a Corporation filed a criminal complaint for the alleged falsification of a document. Ecopetrol is a victim in the process. | 32,000 | 32,000 | ||||||
| Failure to comply with the pipe purchase order, the physical characteristics of the coating do not correspond to those contracted. | 21,232 | 21,232 | ||||||
| Contractual controversy by others for the maintenance of some production fields. | 13,449 | - | ||||||
Refinería de Cartagena S.A.
OnIn March 8, 2016, Reficar presentedfiled a requestRequest for Arbitration before the International Chamber of Commerce (ICC)(the “ICC”), against Chicago Bridge & Iron Company NV,N.V., CB&I (UK) Limited, and CBI Colombiana S.A. (collectively, "CB&I"(jointly, “CB&I”) concerning a dispute related to the contract for the construction, procurementEngineering, Procurement, and engineeringConstruction Agreements entered into by and between Reficar and CB&I for the expansion ofRefinería de the Cartagena Refinery in Cartagena, Colombia. Reficar is the claimantClaimant in the ICC arbitration process of the ICC and requests at leastseeks no less than US$2 billion from CB&I. in damages plus lost profits.
On May 25, 2016, CB&I filed a counterclaim ofits Answer to the Request for Arbitration and Counterclaim for approximately US$213106 million and COP$324,052 million. On June 27, 2016, Reficar answered this requestfiled its reply to CB&I’s counterclaim denying any responsibility. and disputing the declarations and relief requested by CB&I. On April 28, 2017, CB&I submitted its Statement of Counterclaim increasing its claims to approximately US$116 million and COP$387,558 million. On March 16, 2018, CB&I submitted its Exhaustive Statement of Counterclaim further increasing its claims to approximately US$129 million and COP$432,303 million (including in each case interest).
The International Chamberdate for the filing of Commerce processthe Third Written Submission is currently in its preliminary stageto be set by the Arbitral Tribunal and athe oral hearing is scheduled for October 2018.to begin in April 2020. After the hearing, the Tribunal will analyze the parties’ arguments to render its final decision on Reficar’s and CB&I’s claims. Until then, the outcome of this arbitration is unknown.
Ecopetrol S.A.
(Figures expressed in millions of Colombian pesos, unless otherwise stated) |
| Investigations of control entities |
Reficar
| 1. | The Office of the Comptroller General’s investigations and proceedings |
| 1.1 | Because of the modifications of the schedule and budget related to Reficar’s expansion and modernization project (the “Project”), the Office of the Comptroller General initiated a special audit investigation of the Project in 2016 and delivered a final report to Reficar on December 5, 2016. The report made 36 findings most of which were related to increased costs compared to budget for services, labor and materials. As required, on January 18, 2017, Reficar submitted an action plan exposing and addressing the 36 findings in the following areas: (i) contract management, (ii) supervision of engineering standards contracted with third parties, and (iii) documentation of the control, reporting and monitoring mechanisms of subcontracts. |
| 1.2 | As a result of the findings described above, on March 10, 2017, the Office of the Comptroller General opened actions for financial responsibility (proceso de responsabilidad fiscal) against 36 individuals and the six companies involved in the Project, including former members of Ecopetrol’s Board of Directors, former members of Reficar’s Board of Directors, former employees of Ecopetrol, and former employees of Reficar, as well as Chicago Bridge & Iron Company N.V., CBI - Chicago Bridge & Iron company (CB&I) Americas Ltd., Chicago Bridge & Iron Company CB&I UK Limited, CBI Colombiana S.A., Foster Wheeler USA Corporation and Process Consultants Inc. |
These actions were initiated based on the Office of the Comptroller General’s theory that lower than expected profitability at Reficar could have been caused by (i) modifications to the schedule and, (ii) the increase of the budget for the Project.
On June 5, 2018, the Office of the Comptroller General split the initial proceeding in two. The first one is related to the increase of the Project’s budget and the second one is related to the modifications in the Project’s schedule.
Regarding the first proceeding, on June 5, 2018, the Office of the Comptroller General issued charges for financial responsibility (proceso de responsabilidad fiscal) against (i) 15 individuals, which include former members of Reficar’s Board of Directors, a current employee of Ecopetrol, and former employees of Reficar, as well as against (ii) Chicago Bridge & Iron Company N.V., CBI - Chicago Bridge & Iron company (CB&I) Americas Ltd., Chicago Bridge & Iron Company CB&I UK Limited, CBI Colombiana S.A., Foster Wheeler USA Corporation and Process Consultants Inc, and the following insurance companies, Compañía Aseguradora de Fianzas S.A, CHUBB de Colombia, Compañía de Seguros S.A., Mapfre Seguros, as third parties with joint liability.
As for the other 21 individuals initially investigated in 2017, the Office of the Comptroller General closed the investigations. Therefore, as of the date of these financial statements, no current or former member of Ecopetrol’s Board of Directors was charged in the first proceeding relating to the increase in the Project’s budget.
As of the date of these financial statements, no charges have been issued in the second proceeding relating to the modifications in the Project’s schedule.
While the content and status of the proceedings remains confidential, we can report that Reficar and several of its employees have cooperated with and provided the information required by the department of the Office of the Comptroller General in charge of leading the proceedings.
As of the date of these financial statements, Reficar has no liability under these proceedings.
Ecopetrol S.A.
Notes to the consolidated financial statements
(Figures expressed in millions of Colombian pesos, unless otherwise stated)
| 1.3 | In January 2017, the Office of the Comptroller General initiated a special audit in Reficar and delivered a final report to Reficar on July 12, 2017. In this report the Office of the Comptroller General concluded that, in their opinion, Reficar’s 2016 Financial Statements do not reasonably represent, in all important aspects, the entity’s financial position as of December 31, 2016. |
On February 2, 2018, the Legal Accounts Commission of the National House of Representatives of the Republic of Colombia informed Reficar that the House of Representatives decided, through Resolution No. 2713, that it would not close the General Budget and Treasury Account and the National Balance Sheet for the 2016 fiscal year, since the 2016 Financial Statements of several state entities, among them Reficar, had received a negative opinion from the Office of the Comptroller General. Pursuant to Resolution No. 2713, Colombian control entities were ordered to initiate the corresponding disciplinary, fiscal and/or criminal investigations.
| 1.4 | In December 2017, the Office of the Comptroller General initiated a special audit in Reficar and submitted a final report to Reficar on May 18, 2018. In this report the Office of the Comptroller General concluded that, in their opinion, Reficar’s 2017 Financial Statements do not reasonably represent, in all important aspects, the entity’s financial position as of December 31, 2017. |
On February 6, 2019, the Legal Accounts Commission of the National House of Representatives of the Republic of Colombia informed Reficar that the House of Representatives decided, through Resolution No. 3135, that it would not close the General Budget and Treasury Account and the National Balance Sheet for the 2017 fiscal year, since the 2017 Financial Statements of several state entities, among them Reficar, had received a negative opinion from the Office of the Comptroller General. Pursuant to Resolution No. 3135, Colombian control entities were ordered to initiate the corresponding disciplinary, fiscal and/or criminal investigations.
In respect of the special audits mentioned in sections 1.3 and 1.4 above, as of the date of these financial statements, Reficar has no knowledge of any procedural action carried out by any of the Colombian control entities regarding the disciplinary, fiscal and/or criminal investigations ordered neither by the Resolution No. 2713 nor by the Resolution No. 3135.
| 1.5 | In January 2019, the Office of the Comptroller General initiated a financial audit in Reficar. The final report is expected to be submitted on May 2019. |
Reficar’s external auditors issued an unqualified opinion on Reficar’s financial position as of December 31, 2016, 2017 and 2018. As of the date of these financial statements, such auditors have not informed Reficar that there has been any change to their opinion.
As of the date of these financial statements, to the best of Ecopetrol’s knowledge, the financial statements continue to fairly represent the financial and operational condition of the Company in all material aspects and its internal controls remain effective.
| 2. | The Attorney General’s Office investigations: |
Reficar has been officially informed that the Attorney General’s Office currently has five ongoing investigation related to the Project.
Regarding one of these five investigations, on September 12, 2017, the Attorney General’s Office issued a list of charges against certain former members of Reficar’s Board of Directors, as well as certain former officers of Reficar. The charges were related to the failure to fulfill some of their duties as administrators and/or for acting “ultra vires” in the exercise of their functions against: (i) Javier Genaro Gutiérrez (Ecopetrol CEO, 2007-2015); (ii) Felipe Laverde (Reficar General Counsel, 2009-March 2017); (iii) Pedro Rosales (Ecopetrol Downstream Executive Vice President, 2008-2015); (iv) Diana Constanza Calixto (Ecopetrol Head of the Corporate Finance Unit, 2009-2014) and (v) Reyes Reinoso Yañez (Reficar CEO, 2012-2016). The Attorney General’s Office closed the case against the rest of the members of Reficar’s Board of Directors and the rest of the former officers of Reficar.
The specific content and status of the remaining four ongoing investigations remains confidential.
Ecopetrol S.A.
Notes to the consolidated financial statements
(Figures expressed in millions of Colombian pesos, unless otherwise stated)
| 3. | The Prosecutor’s Office investigations: |
The Prosecutor’s Office has been conducting the following legal proceedings:
| 3.1 | Between July 25 and August 2, 2017, the Prosecutor’s Office indicted the following individuals with charges, the majority of which are related to offenses against the public administration and illegal interest in the execution of agreements: (i) Orlando José Cabrales Martínez (Reficar CEO, 2009-2012); (ii) Reyes Reinoso Yañez (Reficar CEO, 2012-2016); (iii) Felipe Laverde Concha (Reficar General Counsel, 2009-March 2017); (iv) Pedro Alfonso Rosales Navarro (Ecopetrol Downstream Executive Vice President, 2008-2015); (v) Masoud Deidehban (CBI Executive Project Director); (vi) Phillip Asherman (CBI CEO) and (vii) Carlos Lloreda (Reficar’s statutory auditor from 2013-2015.) The arraignment hearing began on May 30, 2018, and as of the date of these financial statements has not yet concluded. |
The Prosecutor’s Office has already made public the factual basis for such charges, which is based on the theory that: (i) executing a cost reimbursable engineering, procurement and construction contract (EPC) and not a lump sum agreement favored CBI interests, and (ii) executing special invoicing procedures (MOA –Memorandum of Agreement and PIP –Project Invoicing Procedure) with CBI allowed the payments of unreasonable amounts not duly verified by Foster Wheeler USA Corporation. The defense attorneys have not yet had an opportunity to present their case against such facts in a court of law.
On May 9, 2017, Ecopetrol’s Audit and Risk Committee retained a U.S.-based outside law firm to commence a third-party investigation into the matters set forth in the Prosecutor’s Office announcement. The results were presented in December 2017 to Ecopetrol’s Audit and Risk Committee. This investigation concluded that to date there has been no evidence of possible unlawful acts that affect Ecopetrol’s internal control over the financial reporting of the Company, on the allegations made by the Prosecutor’s Office.
| 3.2 | On October 22 and 23, 2018, the Prosecutor’s Office indicted the following individuals with charges related to improper management and obtaining false public documents: Javier Genaro Gutiérrez Pemberthy (Ecopetrol CEO, 2007-2015), Reyes Reinoso Yánez (Reficar CEO, 2012-2016), Pedro Alfonso Rosales Navarro (Ecopetrol Downstream Executive Vice President, 2008-2015), and Diana Constanza Calixto Hernández (Ecopetrol Head of the Corporate Finance Unit, 2009-2014). As of the date of these financial statements, the arrangement hearing has not yet taken place. |
| 3.3 | On March 18, 2019, the Prosecutor’s Office issued a public statement in which it announced that on April 25, 2019 it was going to indict the following individuals, in an indictment hearing that has not yet taken place, with charges related to entering into agreements without compliance with legal requirements: Orlando José Cabrales Martínez (Reficar CEO, 2009-2012) and Felipe Castilla (Reficar CEO, 2009). |
Considering the current stage of these legal proceedings, we are not in a position to predict the outcome of the Prosecutor’s Office’s investigation or the disposition of any of the charges brought by the Prosecutor’s Office.
Ecopetrol and Reficar have cooperated closely and extensively with the control entities in furthering their investigations and will continue to monitor the status and development of these investigations.
| 22. | Equity |
The main components of equity are comprised as follows:detailed below:
| Subscribed and |
Ecopetrol’s authorized capital amounts to $36,540,000, and is comprised of 60,000,000,000 ordinary shares, of which 41,116,694,690 of such shares have been subscribed represented byare outstanding, and 11.51% (4,731,905,873(4,731,906,273 shares) of natural and non-government entitiesare held privately and 88.49% (36,384,788,817(36,384,788,417 shares) are held by Government entities.the Colombian Government. The value of the reserve shares amounts to $11,499,933 comprised byof 18,883,305,310 shares. AtAs of December 31, 20162018 and 2015,2017, subscribed and paid-inpaid–in capital amounts to $25,040,067. There are no potentially dilutive instruments.
On March 26, 2015, the General Stockholders’ Meeting approved the capitalization of occasional reserves of Ecopetrol S.A. for COP$14,760,893 through the mechanism of increasing the face value. This capitalization of reserves did not modify materially the number of ordinary shares registered.shares.
| Additional |
ItAdditional paid–in capital mainly corresponds to: (i) surplus with respect to its nominal value derivedshare premium from the sale of shares uponEcopetrol Business Group’s capitalization in 2007, for $4,457,997,COP$4,457,997, (ii) $31,377COP$31,377 share premium from the value generated by the processplacement of placing the shares on the secondary market, arising from the calling of guarantees from debtors in arrears, according to the provisions of Article 397 of the Code of Commerce, (iii) to the surplus over nominal value arisingshare premium from the sale of shares awarded in the second round,capitalization, which took place in September 2011, in the amount of $2,118,468,COP$2,118,468, and (iv) Additional paid-inadditional paid–in capital receivablereceivables for $(143)COP$(143).
24.3 Equity reservesEcopetrol S.A.
Notes to the consolidated financial statements
(Figures expressed in millions of Colombian pesos, unless otherwise stated)
| 22.3 | Equity reserves |
The balancefollowing is the composition of the Ecopetrol Business Group’s reserves as of December 31, 2018 and 2017:
| 2018 | 2017 | |||||||
| Legal reserve | 2,088,192 | 1,426,151 | ||||||
| Fiscal and statutory reserves | 509,081 | 512,632 | ||||||
| Occasional reserves(1) | 2,541,622 | 239,086 | ||||||
| 5,138,895 | 2,177,869 | |||||||
The movement of equity reserves is comprised as follows atthe following for the years ended December 31, 20162018 and 2015:2017:
| 2016 | 2015 | |||||||
| Legal reserve | 1,269,680 | 5,139,587 | ||||||
| Fiscal and statutory reserves | 289,164 | 405,660 | ||||||
| Occasional reserves | - | 1,323 | ||||||
| Total | 1,558,844 | 5,546,570 | ||||||
| 2018 | 2017 | |||||||
| Opening balance | 2,177,869 | 1,558,844 | ||||||
| Release of reserves | (751,718 | ) | (289,164 | ) | ||||
| Allocation to reserves | 3,712,744 | 908,189 | ||||||
| Closing balance | 5,138,895 | 2,177,869 | ||||||
| (1) | Occasional reserves |
The following shows the balance and a breakdownAs of the changes in equity reserves at December 31, 2016 and 2015:
| 2016 | 2015 | |||||||
| Opening balance | 5,546,570 | 17,963,370 | ||||||
| Appropriation of reserves, net | (117,819 | ) | 2,344,095 | |||||
| Legal reserve used to offset previous year loss (Note 24.4) | (3,869,907 | ) | - | |||||
| Capitalization of occasional reserves | - | (14,760,895 | ) | |||||
| Closing balance | 1,558,844 | 5,546,570 | ||||||
Legal reserve
The Colombian Code of Commerce establishes the appropriation obligation of 10%2018, occasional reserves correspond to allocation of net income to the legal reserves until the legal reserves are equal to 50% of the subscribed capital. The legal reserve can be used to offset losses or for distribution in the event of a Company’s liquidation.
|
Occasional reserves
This corresponds to the appropriation of earnings orderedas approved by the shareholders at the Stockholders’ meetingMeeting to carry out new explorations and future investments, as well as unrealized profits between group companies. On March 26, 2015, the Stockholders’ Meeting approved, afterstrategic growth. As of December 31, 2017, the appropriation of the occasional reserves of the 2014 period, the capitalization of occasional reserves for $14,760,895 through the mechanism of face value increase.
Tax and mandatory reserves
The Colombian tax regime contemplates the appropriation of the period’s profits equivalent to 70% when the value of the depreciation deduction for tax purposes exceeds the accounting depreciation. This reserve may be releasedcorrespond to the extent that the depreciations subsequently accounted exceed those annually claimed for tax purposes or the assets that generated the higher value deducted are sold.
In addition, Decree 2336establishment of 1995 set out the obligation to establish a reserve for valuation of investments. The profits generated at the closing of the accounting period as a consequence of the application of special valuation systems at market prices and that have not been made on behalf of the Company, will be taken to a reserve.new explorations.
| Retained earnings and |
The following shows the balance and a breakdown of the changesEcopetrol Business Group distributes dividends based on its separate annual financial statements, prepared under International Financial Reporting Standards accepted in retained earnings at December 31, 2016 and 2015:Colombia (NCIF, by its acronym in Spanish).
| 2016 | 2015 | |||||||
| Opening balance | (6,814,432 | ) | 8,192,040 | |||||
| Profit (loss) attributable to owners of Ecopetrol’s shareholders | 2,447,881 | (7,193,859 | ) | |||||
| Appropriation of reserves | 117,819 | (2,344,095 | ) | |||||
| Legal reserve used to offset previous year loss (1) | 3,869,907 | |||||||
| Dividends declared (1) | - | (5,468,521 | ) | |||||
| Other movements | (23,637 | ) | 3 | |||||
| Closing balance | (402,462 | ) | (6,814,432 | ) | ||||
The Ordinary General Shareholders’ Meeting, of Shareholders held on March 31, 2016,29, 2019, approved the proposal for profit distribution which established that there would be nofor 2018 and set the distribution of dividends at COP$9,251,256.
The Ordinary General Shareholders’ Meeting, held on March 23, 2018, approved the profit distribution for 2017 and set the year 2015, given the net loss occurred in that year; in addition, the shareholders voted to use the legal reserve to offset this loss, as permitted by the Article 456distribution of the Colombian Code of Commerce. The amount of losses offset with the legal reserve once releases and tax and mandatory appropriations amounted to $ 3,869,907.dividends at COP$3,659,386. Dividends paid in 20162018 attributable to non-controllingthe shareholders of subsidiariesEcopetrol S.A. amounted to COP$1,022,121.
On3,659,373 (2017 - COP$945,661) and those of the results of 2014 the General Stockholders Meeting approved the distribution of an ordinary dividend per share of COP$133. In June, 2015 the Company paid the minority stockholders COP$629,344 and COP$4,149,000 to majority stockholders. Dividends declared to the majority shareholder in 2015 payable at December 31, 2015 amountednon-controlling interest to COP$690,177 and were fully paid during the first quarter of 2016. Dividends paid in 2015 attributable to non-controlling shareholders of subsidiaries amounted to768,328 (2017 – COP$715,053.558,986).
|
| Other comprehensive income attributable to owners of |
The following is a breakdownthe composition of the other comprehensive income attributable to the shareholders of the parent, Ecopetrol S.A., net of tax at December 31, 2016 and 2015:tax:
| 2016 | 2015 | 2018 | 2017 | 2016 | ||||||||||||||||
| Foreign currency translation | 10,412,499 | 7,883,231 | 8,138,382 | |||||||||||||||||
| Cash flow hedge with derivative instruments | (30,962 | ) | 6,942 | (19,042 | ) | |||||||||||||||
| Cash flow hedges for future exports (Note 28.1.2) | (374,079 | ) | 159,295 | 244,131 | ||||||||||||||||
| Actuarial gain on defined benefit plans | 994,953 | 2,148,395 | (557,381 | ) | (553,091 | ) | 994,953 | |||||||||||||
| Gain (loss) on equity instruments measured at fair value (1) | 7,828 | (49,881 | ) | |||||||||||||||||
| Cash flow hedges for future exports | 244,131 | (217,291 | ) | |||||||||||||||||
| Hedge of a net investment in a foreign operation | (155,359 | ) | - | |||||||||||||||||
| Cash flow hedge with derivative instruments | (19,042 | ) | (43,590 | ) | ||||||||||||||||
| Hedge of a net investment in a foreign operation (Note 28.1.3) | (1,069,316 | ) | (97,362 | ) | (155,359 | ) | ||||||||||||||
| Gain on equity instruments measured at fair value | – | – | 7,828 | |||||||||||||||||
| Others | 11,817 | 58,643 | – | – | 11,817 | |||||||||||||||
| Foreign currency translation | 8,138,382 | 8,949,728 | ||||||||||||||||||
| 9,222,710 | 10,846,004 | 8,380,761 | 7,399,015 | 9,222,710 | ||||||||||||||||
| 2018 | 2017 | 2016 | ||||||||||
| Profit attributable to Ecopetrol’s shareholders | 11,381,386 | 7,178,539 | 2,447,881 | |||||||||
| Weighted average number of outstanding shares | 41,116,694,690 | 41,116,694,690 | 41,116,694,690 | |||||||||
| Net basic earnings per share (Colombian pesos) | COP$ | 276.8 | COP$ | 174.6 | COP$ | 59.5 | ||||||
Ecopetrol S.A.
Notes to the consolidated financial statements
(Figures expressed in millions of Colombian pesos, unless otherwise stated)
| 2016 | 2015 | |||||||
| Profit (loss) attributable to Ecopetrol’s shareholders | 2,447,881 | (7,193,859 | ) | |||||
| Weighted average number of outstanding shares | 41,116,694,690 | 41,116,694,690 | ||||||
| Net basic earnings (loss) per share (basic and diluted -Colombian pesos) | 59.5 | (175.0 | ) | |||||
There is no potential dilution of shares.
|
| Sales revenue from contracts with customers |
The following is athe breakdown of sales revenue for the years ended December 31, 2016, 20152018, 2017 and 2014:2016:
| 2016 | 2015 | 2014 | 2018 | 2017 | 2016 | |||||||||||||||||||
| National sales | ||||||||||||||||||||||||
| Mid-distillates | 8,553,503 | 10,215,224 | 11,983,455 | |||||||||||||||||||||
| Gasoline | 6,092,739 | 6,128,208 | 6,394,422 | |||||||||||||||||||||
| Services | 4,043,284 | 4,435,274 | 3,778,073 | |||||||||||||||||||||
| Mid–distillates | 11,586,192 | 9,590,326 | 8,553,503 | |||||||||||||||||||||
| Gasoline and turbo fuels | 7,952,852 | 6,990,187 | 6,092,739 | |||||||||||||||||||||
| Transport services | 3,531,404 | 3,589,553 | 3,817,991 | |||||||||||||||||||||
| Natural gas | 1,988,336 | 1,845,345 | 1,346,625 | 1,885,846 | 1,815,754 | 1,988,336 | ||||||||||||||||||
| Plastic and rubber | 724,708 | 724,392 | 667,563 | 822,367 | 833,982 | 724,708 | ||||||||||||||||||
| L.P.G. and propane | 405,869 | 335,494 | 426,450 | |||||||||||||||||||||
| Crude | 553,666 | 491,279 | 1,213,718 | |||||||||||||||||||||
| LPG and propane | 574,639 | 509,619 | 405,869 | |||||||||||||||||||||
| Crude oil | 550,479 | 909,871 | 553,666 | |||||||||||||||||||||
| Fuel oil | 509,482 | 354,058 | 148,248 | |||||||||||||||||||||
| Asphalts | 340,400 | 461,188 | 459,072 | 335,426 | 275,803 | 340,400 | ||||||||||||||||||
| Aromatics | 282,545 | 217,418 | 186,228 | |||||||||||||||||||||
| Polyethylene | 270,887 | 167,348 | 203,959 | |||||||||||||||||||||
| Services | 239,410 | 283,799 | 225,293 | |||||||||||||||||||||
| Other income gas contracts | 156,031 | 188,195 | 271,337 | |||||||||||||||||||||
| Other products | 994,645 | 988,346 | 1,001,321 | 489,507 | 280,226 | 184,873 | ||||||||||||||||||
| 23,697,150 | 25,624,750 | 27,270,699 | 29,187,067 | 26,006,139 | 23,697,150 | |||||||||||||||||||
| Recognition of price differential (1) | 1,048,022 | 441,871 | 485,409 | 3,835,533 | 2,229,953 | 1,048,022 | ||||||||||||||||||
| 24,745,172 | 26,066,621 | 27,756,108 | 33,022,600 | 28,236,092 | 24,745,172 | |||||||||||||||||||
| Foreign sales | ||||||||||||||||||||||||
| Crude | 17,278,579 | 21,181,265 | 30,835,510 | |||||||||||||||||||||
| Crude oil | 26,898,737 | 21,479,063 | 17,278,579 | |||||||||||||||||||||
| Diesel | 3,050,839 | 1,213,740 | 1,604,498 | |||||||||||||||||||||
| Fuel oil | 2,158,539 | 2,166,469 | 3,921,703 | 2,053,594 | 1,982,408 | 2,158,539 | ||||||||||||||||||
| Trading of crude | - | 1,309,196 | 1,486,060 | |||||||||||||||||||||
| Diesel | 1,594,945 | 81,982 | 179,738 | |||||||||||||||||||||
| Gasoline and turbo fuels | 1,782,194 | 1,223,994 | 1,046,758 | |||||||||||||||||||||
| Plastic and rubber | 1,171,342 | 1,096,730 | 975,282 | 1,268,582 | 1,169,101 | 1,171,342 | ||||||||||||||||||
| Gasoline and turbo fuel | 1,046,758 | 93,125 | 127,090 | |||||||||||||||||||||
| Cash flow hedge for future exports – Reclassification to profit or loss (Note 31.2.1) | 33,074 | 7,646 | - | |||||||||||||||||||||
| Natural gas | 27,899 | 32,303 | 58,809 | |||||||||||||||||||||
| LPG and propane | 20,212 | 15,631 | 8,568 | |||||||||||||||||||||
| Cash flow hedge for future exports – Reclassification to profit or loss (Note 28.1.2) | 128,404 | 160,772 | 33,074 | |||||||||||||||||||||
| Other products | 457,152 | 344,237 | 690,397 | 350,811 | 441,124 | 380,222 | ||||||||||||||||||
| 23,740,389 | 26,280,650 | 38,215,780 | 35,581,272 | 27,718,136 | 23,740,389 | |||||||||||||||||||
| Total sales revenue | 48,485,561 | 52,347,271 | 65,971,888 | |||||||||||||||||||||
| 68,603,872 | 55,954,228 | 48,485,561 | ||||||||||||||||||||||
| (1) | Corresponds to the application of Decree |
Sales by geographic areas
OperatingThe following are the sales revenue by geographic areas is comprised as followsarea for the years ended December 31, 2016, 20152018, 2017 and 2014:2016:
| 2016 | % | 2015 | % | 2014 | % | |||||||||||||||||||
| Colombia | 24,745,172 | 51.0 | % | 26,066,621 | 49.8 | % | 27,756,108 | 42.1 | % | |||||||||||||||
| United States of America | 11,956,967 | 24.7 | % | 11,921,720 | 22.8 | % | 14,977,109 | 22.7 | % | |||||||||||||||
| Asia | 2,717,414 | 5.6 | % | 6,123,593 | 11.7 | % | 13,416,506 | 20.3 | % | |||||||||||||||
| Europe | 2,945,951 | 6.1 | % | 3,981,926 | 7.6 | % | 5,915,190 | 9.0 | % | |||||||||||||||
| Central America and Caribbean | 3,551,894 | 7.3 | % | 3,366,978 | 6.4 | % | 3,049,688 | 4.6 | % | |||||||||||||||
| South America and others | 2,568,163 | 5.3 | % | 886,433 | 1.7 | % | 857,287 | 1.3 | % | |||||||||||||||
| Total | 48,485,561 | 100 | % | 52,347,271 | 100 | % | 65,971,888 | 100 | % | |||||||||||||||
|
| 2018 | % | 2017 | % | 2016 | % | |||||||||||||||||||
| Colombia | 33,022,600 | 48.1 | % | 28,236,092 | 50.5 | % | 24,745,172 | 51.0 | % | |||||||||||||||
| United States | 14,765,674 | 21.5 | % | 12,532,932 | 22.4 | % | 11,956,967 | 24.7 | % | |||||||||||||||
| Asia | 12,271,225 | 17.9 | % | 6,136,796 | 11.0 | % | 2,717,414 | 5.6 | % | |||||||||||||||
| Central America and the Caribbean | 4,449,033 | 6.5 | % | 6,070,565 | 10.8 | % | 3,551,894 | 7.3 | % | |||||||||||||||
| South America and others | 2,968,038 | 4.3 | % | 1,947,226 | 3.5 | % | 2,568,163 | 5.3 | % | |||||||||||||||
| Europe | 1,127,302 | 1.6 | % | 1,030,617 | 1.8 | % | 2,945,951 | 6.1 | % | |||||||||||||||
| 68,603,872 | 100 | % | 55,954,228 | 100 | % | 48,485,561 | 100 | % | ||||||||||||||||
Concentration of customers
During 20162018, Organización Terpel accountedS.A. represented 14.0% of sales revenue for 14.4% of total sales in the period (2015 -(2017 – 14.3% and 2016 – 14.4% and 2014 - 13.7%). No; no other customer hasrepresented more than 10% of total consolidated sales. There wasis no exposure that affectsrisk of the Ecopetrol Business Group's financial positionsituation being affected by a potential loss of Ecopetrol if the Company lost the client. The commercial relationship with this customer is for the sale of refinerefined products and transportation service. Salesservices.
Ecopetrol S.A.
Notes to this customer are recognized by the Refining and Petrochemical and transportation and logistics Segments. Organizacion Terpel, is leader thanks to its networkconsolidated financial statements
(Figures expressed in millions of petrol stations and industrial sales strategy and in the aviation segment.Colombian pesos, unless otherwise stated)
| Cost of sales |
The following is the detail of cost of sales per function for the years ended December 31, 2016, 2015 and 2014:
| 2016 | 2015 | 2014 | 2018 | 2017 | 2016 | |||||||||||||||||||
| Variable costs | ||||||||||||||||||||||||
| Imported products (1) | 12,049,477 | 12,935,878 | 13,264,700 | 11,809,529 | 11,637,419 | 12,049,477 | ||||||||||||||||||
| Depreciation, depletion and amortization | 5,333,245 | 5,166,455 | 5,114,053 | |||||||||||||||||||||
| Hydrocarbon purchases - ANH (2) | 3,178,199 | 3,741,010 | 6,630,309 | |||||||||||||||||||||
| Purchases of hydrocarbons – ANH (2) | 5,667,567 | 4,338,576 | 3,178,199 | |||||||||||||||||||||
| Depreciation, amortization and depletion | 5,064,518 | 5,765,186 | 5,333,245 | |||||||||||||||||||||
| Purchases of crude in association and concession | 1,517,829 | 1,928,938 | 3,293,594 | 3,820,746 | 2,240,704 | 1,517,829 | ||||||||||||||||||
| Hydrocarbons transportation services | 783,307 | 1,380,733 | 1,548,115 | |||||||||||||||||||||
| Processing materials | 608,535 | 366,454 | 349,953 | |||||||||||||||||||||
| Electric power | 618,675 | 424,920 | 408,248 | |||||||||||||||||||||
| Gas royalties in cash | 478,332 | 481,029 | 399,752 | |||||||||||||||||||||
| Process materials | 968,884 | 889,122 | 608,535 | |||||||||||||||||||||
| Hydrocarbon transport services | 696,964 | 665,714 | 783,307 | |||||||||||||||||||||
| Electric energy | 662,297 | 561,424 | 618,675 | |||||||||||||||||||||
| Purchases of other products and gas | 519,884 | 703,163 | 1,021,327 | 632,509 | 488,056 | 519,884 | ||||||||||||||||||
| Taxes and contributions (3) | 441,207 | 449,959 | 478,332 | |||||||||||||||||||||
| Services contracted in associations | 305,326 | 563,032 | 612,013 | 260,207 | 195,689 | 305,326 | ||||||||||||||||||
| Others | (432,694 | ) | (322,547 | ) | 98,904 | (186,087 | ) | (663,916 | ) | (432,694 | ) | |||||||||||||
| 24,960,115 | 27,369,065 | 32,740,968 | 29,838,341 | 26,567,933 | 24,960,115 | |||||||||||||||||||
| Fixed costs | ||||||||||||||||||||||||
| Depreciation and amortization | 2,050,739 | 1,433,263 | 1,144,437 | 2,555,176 | 2,366,849 | 2,050,739 | ||||||||||||||||||
| Maintenance | 1,998,128 | 2,334,130 | 2,646,832 | 2,260,984 | 2,038,970 | 1,998,128 | ||||||||||||||||||
| Labor cost | 1,571,511 | 1,542,701 | 1,369,654 | |||||||||||||||||||||
| Labor costs | 2,105,803 | 1,815,213 | 1,571,511 | |||||||||||||||||||||
| Services contracted | 1,796,354 | 1,414,056 | 1,083,176 | |||||||||||||||||||||
| Services contracted in associations | 1,260,470 | 1,415,422 | 1,674,322 | 1,040,221 | 1,008,336 | 1,260,470 | ||||||||||||||||||
| Services contracted | 1,083,176 | 1,301,094 | 1,578,918 | |||||||||||||||||||||
| Taxes and contributions | 391,032 | 461,624 | 607,494 | |||||||||||||||||||||
| Materials and operating supplies | 565,601 | 468,205 | 333,258 | |||||||||||||||||||||
| Taxes and contributions (3) | 393,690 | 343,505 | 391,032 | |||||||||||||||||||||
| Hydrocarbon transport services | 261,237 | 333,671 | 157,463 | |||||||||||||||||||||
| General costs | 383,842 | 461,994 | 441,718 | 366,972 | 551,587 | 445,531 | ||||||||||||||||||
| Materials and operating supplies | 333,258 | 435,238 | 500,934 | |||||||||||||||||||||
| Hydrocarbons transportation services | 157,463 | 147,733 | 74,976 | |||||||||||||||||||||
| Non-capitalized project costs | 61,689 | 92,252 | 194,875 | |||||||||||||||||||||
| 9,291,308 | 9,625,451 | 10,234,160 | 11,346,038 | 10,340,392 | 9,291,308 | |||||||||||||||||||
| 34,251,423 | 36,994,516 | 42,975,128 | 41,184,379 | 36,908,325 | 34,251,423 | |||||||||||||||||||
| (1) |
| (2) | Corresponds |
| (3) | Includes gas royalties paid and carbon tax. |
| (4) | Corresponds to the |
|
The following is the detail of administration, operation and project expenses, according to their function, for the years ended December 31, 2016, 20152018, 2017 and 2014:2016:
| 2016 | 2015 | 2014 | 2018 | 2017 | 2016 | |||||||||||||||||||
| Administration expenses | ||||||||||||||||||||||||
| Administrative expenses | ||||||||||||||||||||||||
| General expenses | 911,645 | 723,341 | 556,563 | |||||||||||||||||||||
| Labor expenses | 662,258 | 624,424 | 657,051 | |||||||||||||||||||||
| Taxes (1) | 663,889 | 730,841 | 102,028 | 39,117 | 362,963 | 663,889 | ||||||||||||||||||
| Labor expenses | 657,051 | 491,748 | 463,836 | |||||||||||||||||||||
| General expenses and other | 556,563 | 393,971 | 410,288 | |||||||||||||||||||||
| Depreciation and amortization | 45,765 | 84,425 | 54,883 | 40,838 | 53,796 | 45,765 | ||||||||||||||||||
| 1,923,268 | 1,700,985 | 1,031,035 | 1,653,858 | 1,764,524 | 1,923,268 | |||||||||||||||||||
| Operation and project expenses | ||||||||||||||||||||||||
| Exploration expenses | 728,590 | 1,584,249 | 2,576,294 | |||||||||||||||||||||
| Operations and project expenses | ||||||||||||||||||||||||
| Exploration costs | 1,387,379 | 1,341,940 | 728,590 | |||||||||||||||||||||
| Taxes (1) | 433,506 | 324,223 | 286,331 | |||||||||||||||||||||
| Commissions, fees, freights and services | 568,513 | 878,259 | 1,244,045 | 466,862 | 471,657 | 568,513 | ||||||||||||||||||
| Corporate projects | 301,854 | 456,159 | 269,495 | |||||||||||||||||||||
| Taxes | 286,331 | 348,871 | 449,824 | |||||||||||||||||||||
| Labor expenses | 278,383 | 309,021 | 266,362 | 316,386 | 310,947 | 278,383 | ||||||||||||||||||
| Fee for regulatory entities | 98,794 | 63,470 | 87,325 | |||||||||||||||||||||
| Depreciation and amortization | 177,252 | 86,215 | 103,834 | 44,318 | 95,516 | 177,252 | ||||||||||||||||||
| Maintenance | 147,197 | 181,630 | 241,313 | 50,846 | 122,273 | 147,197 | ||||||||||||||||||
| Fee for regulatory entities | 87,325 | 77,909 | 108,263 | |||||||||||||||||||||
| Various | 176,242 | 111,955 | 260,895 | |||||||||||||||||||||
| Others | 105,041 | 196,039 | 478,096 | |||||||||||||||||||||
| 2,751,687 | 4,034,268 | 5,520,325 | 2,903,132 | 2,926,065 | 2,751,687 | |||||||||||||||||||
| (1) |
Ecopetrol S.A.
Notes to the consolidated financial statements
(Figures expressed in millions of Colombian pesos, unless otherwise stated)
The detail of non-current assets impairment charges for the years ended December 31, 2016, 2015 and 2014 is as follows:
| 2016 | 2015 | 2014 | ||||||||||
| Property, plant and equipment and Intangibles (Note 17) | 561,738 | 4,144,754 | 1,495,113 | |||||||||
| Natural and environmental resources (Note 17) | 239,151 | 2,865,077 | 694,720 | |||||||||
| Investments in associates and joint ventures (Note 14.2) | 127,858 | 588,144 | 114,734 | |||||||||
| Goodwill (Note 19) | - | 266,900 | - | |||||||||
| 928,747 | 7,864,875 | 2,304,567 | ||||||||||
|
| Other operating (expenses) income, |
The following is the detail of other operating income and (expenses)or expenses for the years ended December 31, 2016, 20152018, 2017 and 2014:2016:
| 2016 | 2015 | 2014 | ||||||||||
| Deferred income BOMT's (1) | 211,768 | 193,197 | 140,372 | |||||||||
| Recovery of provisions for litigation | 112,999 | 205,879 | 203,688 | |||||||||
| Compensation received | 17,790 | 29,848 | 24,648 | |||||||||
| Profit (loss) on sale of materials and property, plant and equipment | (82,200 | ) | 6,744 | (111,378 | ) | |||||||
| Current assets impairment expense (2) | (98,739 | ) | (2,858 | ) | (24,784 | ) | ||||||
| Gas pipeline availability under BOMT’s contracts (1) | (125,077 | ) | (124,957 | ) | (102,916 | ) | ||||||
| Other income (expenses), net | 237,571 | 70,685 | 178,564 | |||||||||
| 274,112 | 378,538 | 308,194 | ||||||||||
| 2018 | 2017 | 2016 | ||||||||||
| (Expense) reversal of provisions for litigations | (68,398 | ) | (72,408 | ) | 112,999 | |||||||
| Expense for gas pipeline availability BOMT contracts(1) | - | (72,318 | ) | (125,077 | ) | |||||||
| Impairment loss of short–term assets | (105,692 | ) | (68,800 | ) | (98,739 | ) | ||||||
| (Loss) profit on sale of assets | (93,601 | ) | 40,227 | (82,200 | ) | |||||||
| (Loss) gain on acquisition of interests in joint operation (Note 30.3) | (12,065 | ) | 451,095 | – | ||||||||
| Compensation received | – | – | 17,790 | |||||||||
| Deferred income BOMT contracts(2) | – | – | 211,768 | |||||||||
| Other income | 244,301 | 227,607 | 237,571 | |||||||||
| (35,455 | ) | 505,403 | 274,112 | |||||||||
| (1) | Corresponds to the services rendered in connection with the BOMT |
| Corresponds to the amortization of the deferred income recognized by Ecopetrol in 2007 for the advance payment made by the Ministry of Finance and Public Credit of the obligations by Ecogas, in relation to the BOMT contracts for the construction, operation, maintenance and transfer of gas pipelines, signed between Ecopetrol and Transgas de Occidente, Centragas and Gases de Boyacá and Santander S.A. in 1997. The amortization of this deferred income ended in December 2016. |
| 27. | Financial result, net |
The following is the detail of financial results net for the years ended December 31, 2016, 20152018, 2017 and 2014:2016:
| 2016 | 2015 | 2014 | ||||||||||
| Financial income | ||||||||||||
| Resources from Santiago de las Atalayas (1) | 688,664 | - | - | |||||||||
| Yield and interest | 386,001 | 293,507 | 286,527 | |||||||||
| Valuation of financial assets | 136,715 | 164,614 | 57,807 | |||||||||
| Gain on sale of available-for-sale assets | 47,129 | 72,339 | - | |||||||||
| Gain on valuation of derivatives | 42,865 | - | 2,282 | |||||||||
| Dividends | 10,369 | 91,464 | 53,202 | |||||||||
| 1,311,743 | 621,924 | 399,818 | ||||||||||
| Financial expenses | ||||||||||||
| Interest (2) | (2,765,024 | ) | (1,768,618 | ) | (754,276 | ) | ||||||
| Financial cost of other liabilities (3) | (580,491 | ) | (627,827 | ) | (651,055 | ) | ||||||
| Other financial expenses | (67,786 | ) | (45,614 | ) | (36,410 | ) | ||||||
| Expense from financial assets | (48,997 | ) | (167,869 | ) | (57,640 | ) | ||||||
| Loss on valuation of derivatives | (1,242 | ) | (108,486 | ) | (140,913 | ) | ||||||
| (3,463,540 | ) | (2,718,414 | ) | (1,640,294 | ) | |||||||
| Foreign exchange gain (loss), net (4) | 976,430 | (5,566,614 | ) | (2,270,193 | ) | |||||||
| Financial result, net | (1,175,367 | ) | (7,663,104 | ) | (3,510,669 | ) | ||||||
| 2018 | 2017 | 2016 | ||||||||||
| Finance income | ||||||||||||
| Results from financial assets and others | 745,571 | 739,148 | 136,715 | |||||||||
| Yields and interests | 383,624 | 405,562 | 386,001 | |||||||||
| Gain on sale of equity instruments | – | 13,236 | 47,129 | |||||||||
| Resources from Santiago de las Atalayas(1) | – | – | 688,664 | |||||||||
| Other financial income | 368 | 1,410 | 53,234 | |||||||||
| 1,129,563 | 1,159,356 | 1,311,743 | ||||||||||
| Finance expenses | ||||||||||||
| Interest(2) | (2,399,414 | ) | (2,385,994 | ) | (2,765,024 | ) | ||||||
| Financial cost of other liabilities(3) | (668,782 | ) | (753,047 | ) | (580,491 | ) | ||||||
| Results from financial assets | (381,445 | ) | (481,308 | ) | (48,997 | ) | ||||||
| Other financial expenses | (62,520 | ) | (40,252 | ) | (69,028 | ) | ||||||
| (3,512,161 | ) | (3,660,601 | ) | (3,463,540 | ) | |||||||
| Foreign exchange gain (loss), net | 372,223 | 5,514 | 976,430 | |||||||||
| Financial result, net | (2,010,375 | ) | (2,495,731 | ) | (1,175,367 | ) | ||||||
| (1) |
| (2) |
| (3) | Includes the financial |
Ecopetrol S.A.
Notes to the consolidated financial statements
(Figures expressed in millions of Colombian pesos, unless otherwise stated)
|
| Risk management |
| Exchange rate risk |
The Ecopetrol Business Group operates mainly in Colombia and makes sales in the local and international markets, for that reason, it is exposed to exchange rate risk, which arises from various foreign currency exposures due to commercial transactions and assets and liabilities denominated in foreign currency. The impact of exchange rate fluctuations, especially the Colombian peso/U.S. dollar exchange rate, has been material in previous years. To mitigate this risk, the Ecopetrol Business Group’s risk management strategy involves the use of non–derivative financial instruments related to cash flow hedges for future exports and net investment of foreign operations to minimize exchange rate risk exposure.
The U.S. dollar/Colombian peso exchange rate has fluctuated over the last few years. As of December 31, 2018, the Colombian peso depreciated 8.9%. The closing rates were COP$3,249.75, COP$2,984.00 and COP$3,000.71 for 2018, 2017 and 2016, respectively.
When the Colombian peso appreciates in relation to the U.S. dollar, export sales revenue decreases when converted to Colombian pesos; by contrast, imported goods, operating costs and interest on foreign debt denominated in U.S. dollars become less expensive. Conversely, when the Colombian peso depreciates, export revenues, when translated to Colombian pesos, increase and imports and servicing of the external debt become more expensive.
The following table sets out the carrying amount for financial assets and liabilities with exchange exposure denominated as of December 31, 2018 and 2017:
| (in US$Million) | 2018 | 2017 | ||||||
| Cash and cash equivalents | 514 | 1,203 | ||||||
| Other financial assets | 2,138 | 1,072 | ||||||
| Trade receivables and payables, net | (202 | ) | (7 | ) | ||||
| Loans and borrowings | (9,689 | ) | (12,590 | ) | ||||
| Other assets and liabilities, net | 63 | - | ||||||
| Net liability position | (7,176 | ) | (10,322 | ) | ||||
Of the total net liability position, US$(335) million correspond to net liabilitiesin dollars with exchange exposure of companies with Colombian peso as functional currency and a net amount of US$(341) million correspond to monetary assets and liabilities with exchange exposure of companies whose functional currency is different from Colombian peso; for both cases valuation is recognized in profit or loss. The balance of loans and borrowings includes non-derivative hedging instruments of Ecopetrol for US$(6,500), for which valuation is recognized in other comprehensive income, within the equity.
| 28.1.1 | Sensitivity analysis for exchange rate risk |
The Ecopetrol Business Group’s risk management strategy involves the use of non-derivative financial instruments related to cash flow hedges for future exports and hedges of a net investment in a foreign operation in order to minimize exposure to currency rate risk, which is detailed below.
The following is the effect of a change of 1% and 5% in the exchange rate of the Colombian peso as compared with the U.S. dollar, on the balance of financial assets and liabilities denominated in foreign currency as of December 31, 2018:
| Scenario / Variation in the exchange rate | Effect on income before taxes (+/–) | Effect on other comprehensive income (+/–) | |||||||
| 1 | % | (10,887 | ) | 222,315 | |||||
| 5 | % | (54,433 | ) | 1,111,577 | |||||
The sensitivity analysis only includes financial assets and liabilities in foreign currency at the closing date.
Ecopetrol S.A.
Notes to the consolidated financial statements
(Figures expressed in millions of Colombian pesos, unless otherwise stated)
| 28.1.2 | Cash flow hedge for future exports |
Ecopetrol is exposed to foreign exchange risk given that a significant percentage of its income from crude oil exports is denominated in U.S. dollars. In recent years, the Ecopetrol Business Group has acquired long–term debt for investment activities in the same currency in which it expects to receive the cash flow of its export sales revenues. This situation creates a natural hedge relationship due to the fact that the risks generated by the foreign exchange difference of export sales revenues when booked in Ecopetrol’s functional currency (Colombian pesos) are naturally hedged with the foreign exchange variances of the long–term debt, in line with the Ecopetrol Business Group’s risk management strategy.
With the objective of presenting in the financial statements, the effect of the existing natural hedge between exports and debt, understanding that the exchange rate risk materializes when the exports are made, on October 1, 2015, the Board of Directors designated the sum of US$5,440 million of Ecopetrol’s foreign currency debt as a hedge instrument of future revenue from crude oil exports, for the period 2015–2023, in accordance with IAS 39 – Financial instruments.
The following is the movement of foreign currency debt designated as a non–derivative hedging instrument for the years ended December 31, 2018 and 2017:
| (US$Million) | 2018 | 2017 | ||||||
| Hedging instrument at the beginning of the period | 3,332 | 5,312 | ||||||
| Reassignment of hedging instruments | 3,366 | 1,803 | ||||||
| Realization of exports | (3,366 | ) | (1,803 | ) | ||||
| Capital payments(1) | (2,032 | ) | (1,980 | ) | ||||
| Hedging instrument at the end of the period | 1,300 | 3,332 | ||||||
| (1) | On December 27, 2018, Ecopetrol S.A. paid in advance the entire 10-year international bond issued in 2009, whose nominal value was USD$1,500 million. Equally, on June 30, 2017, Ecopetrol prepaid the entire outstanding balance of the international syndicated loan whose nominal value was US$1,925 million and original maturity date was in February 2020. |
The following is the movement of accumulated foreign currency gains and losses in respect of the cash flow hedge recognized in other comprehensive income for the years ended December 31, 2018, 2017 and 2016:
| 2018 | 2017 | 2016 | ||||||||||
| Opening balance | (159,295 | ) | (244,131 | ) | 217,291 | |||||||
| Exchange difference | 704,871 | 15,933 | (724,395 | ) | ||||||||
| Reclassification to profit or loss | 128,404 | 160,772 | (33,074 | ) | ||||||||
| Ineffectiveness | (35,617 | ) | (9,247 | ) | – | |||||||
| Deferred income tax | (264,284 | ) | (82,622 | ) | 296,047 | |||||||
| Closing balance | 374,079 | (159,295 | ) | (244,131 | ) | |||||||
The expected reclassification of the cumulative exchange rate difference in other comprehensive income to the profit or loss statement, is as follows:
| Year | Before taxes | Taxes | After taxes | |||||||||||
| 2019 | (375,261 | ) | 123,836 | (251,425 | ) | |||||||||
| 2020 | (45,940 | ) | 15,160 | (30,780 | ) | |||||||||
| 2021 | (48,203 | ) | 15,907 | (32,296 | ) | |||||||||
| 2022 | (48,203 | ) | 15,907 | (32,296 | ) | |||||||||
| 2023 | (34,878 | ) | 7,596 | (27,282 | ) | |||||||||
| (552,485 | ) | 178,406 | (374,079 | ) | ||||||||||
Ecopetrol S.A.
Notes to the consolidated financial statements
(Figures expressed in millions of Colombian pesos, unless otherwise stated)
| 28.1.3 | Hedge of a net investment in a foreign operation |
The Board of Directors approved the application of net investment hedge accounting from June 8, 2016. The measure is intended to reduce the volatility of non–operating income due to exchange rate variations. The net investment hedge will be applied on a portion of the Ecopetrol Business Group’s investments in foreign operations, in this case on investments in subsidiaries which have the U.S. dollar as their functional currency, using a portion of the Ecopetrol Business Group’s U.S. dollar denominated debt as the hedging instrument.
Ecopetrol S.A. has designated its net investments in Ocensa, Ecopetrol America Inc., Hocol Petroleum Ltd. (HPL) and Reficar as hedged items and as a hedging instrument and US$5,200 million of the Ecopetrol Business Group’s U.S. dollar debt as a hedging instrument.
Ecopetrol S.A.
Notes to the consolidated financial statements
(Figures expressed in millions of Colombian pesos, unless otherwise stated)
The following is the movement of accumulated foreign currency gains and losses in respect of the net investment hedge recognized in other comprehensive income for the years ended December 31, 2018, 2017 and 2016:
| 2018 | 2017 | 2016 | ||||||||||
| Opening balance | 97,362 | 155,359 | – | |||||||||
| Exchange difference | 1,381,900 | (86,892 | ) | 231,879 | ||||||||
| Ineffectiveness | 378 | 329 | – | |||||||||
| Deferred income tax | (410,324 | ) | 28,566 | (76,520 | ) | |||||||
| Closing balance | 1,069,316 | 97,362 | 155,359 | |||||||||
| 28.1.4 | Hedging with derivatives to minimize currency risk |
The Ecopetrol Business Group carries out forward hedging operations using the non–delivery modality, for mitigating the volatility of the exchange rate in the cash flow required for operations of its subsidiary, Ocensa, whose functional currency is the US dollar. The forward hedging instruments are used to enable setting sales prices in U.S. dollars, mitigating the foreign exchange variation given Ocensa’s obligations relative to operational cost and tax payments are payable in Colombian pesos. The accounting policy applicable to this operation is described in the Note 4.1.5.1.
As of December 31, 2018, there are forward contracts with a net short position for US$332 million (2017 – US$325 million) with maturities between January and December 2019.
The impact on the statement of profit or loss for the settlement of these hedges amounted to COP$80,636 (2017 – COP$99,971) and the amount recognized in the other comprehensive income was a loss of COP$(52,174) (2017 COP$35,768 and 2016 COP$33,869).
| 28.1.5 | Commodity price risk |
Ecopetrol´sEcopetrol’s business depends substantially onis significantly impacted by international prices for crude oil and refined products. The prices for these products are volatile and drastic changes couldadversely affect the CompanyEcopetrol Business Group business prospects and results of operationsoperations.
A large proportion of Ecopetrol´sEcopetrol’s sales revenues come from sales of crude oil, natural gas and refined products. These products are indexed to international reference prices such as the Brent Index.index. Consequently, fluctuations in those international indexes have a direct effect on the financial condition and Company´sGroup’s results of operations.
Prices of crude oil, natural gas and refined products have historically fluctuated as a result of a variety of factors including, among others, competition within the oil and natural gas industry; changes in international prices of natural gas and refined products; long-term changes in the demand for crude oil, natural gas and refined products; regulatory changes; changes in the cost of capital; adverse economic conditions; transactions in derivative financial instruments related to oil and gas and development or availability of alternative fuels.
The Ecopetrol Business Group has a policy approved by the Board of Directors that allows it to use derivative financial instruments in the organized market over the counter (OTC) market to cover itself from the risk of price fluctuations of crude oil and refined products associated towith physical transactions. The CompanyEcopetrol Business Group has established appropriate processes to handle risk thatwhich include constant monitoring of physical and financial marketmarkets to identify risks in order to subsequently prepare and execute hedging strategies.
Ecopetrol does not regularly use derivative instruments to hedge exposures to sales or purchase price risks. The impact of the settlement of the price hedges made during the yearsin 2016 and 2015 haswas not been material and were executedwas made as hedging instruments to mitigate risk at different price indices to the benchmark of the Company'sEcopetrol Business Group's international trade strategy on exports of crude and imports of products.
As of December 31,In 2018 and 2017, hedging transactions were not carried out with derivative instruments. In 2016, and 2015then outstanding price hedges were fully settled in full, with an impact on the result of the period of COP$3,181 and COP$4,141, respectively.3,181.
Ecopetrol S.A.
Notes to the consolidated financial statements
(Figures expressed in millions of Colombian pesos, unless otherwise stated)
The group mainly operates in Colombia and makes sales in the local and international markets. For this reason, it is exposed to the exchange rate risk that arises from various foreign currency exposures due tocommercial transactions and assets and liabilities held in foreign currency.The impact of fluctuations in exchange rates, especially the Pesos/US$rate, on operations has been material.
The US$/pesos exchange rate has fluctuated over the last few years. The peso depreciated by an average of 11.2% and 37.3% in 2016 and 2015, respectively; on the other hand, the closing exchange rates were COP$3,000.71, COP$3,149.47 and COP$2,392.46 as of December 31, 2016, 2015 and 2014, respectively.
When the Colombian peso appreciates in comparison with the U.S. dollar export sales revenue decrease when translated into COP. However, imported goods, the oil services and interest on external debt denominated in U.S. dollars, become less expensive. Conversely, when the Colombian peso depreciates in comparison with the U.S. dollar sales revenues from exports, when translated into COP, increase, and imports and external debt service become more expensive.
The following table sets out the carrying values for financial assets and liabilities denominated in foreign currencies at December 31, 2016 and 2015:
| 2016 | 2015 | |||||||
| US$ Million | ||||||||
| Cash and cash equivalents | 1,916 | 970 | ||||||
| Other financial assets | 1,367 | 381 | ||||||
| Trade receivables and payables, net | (282 | ) | (546 | ) | ||||
| Loans and borrowings | (15,172 | ) | (14,634 | ) | ||||
| Net liability position | (12,171 | ) | (13,829 | ) | ||||
|
Of the total net liability position US$2,878 million relates to financial assets and liabilities for companies that have the Colombian peso as their functional currency whose value has affected results for the financial year. Likewise, US$(15,049) million of the net position relates to monetary assets and liabilities for group companies that have the dollar as their functional currency and non-derivate hedging instruments from Ecopetrol whose value is recognized in other comprehensive income.
The Company’s risk management strategy involves the use of non-derivative financial instruments related to cash flow hedges for future exports and hedges of a net investment in a foreign operation, in order to minimize exposure to currency rate risk, which is detailed below.
Ecopetrol is exposed to foreign exchange risk given that a high percentage of its crude export sales revenues are denominated in U.S. dollars. In recent years, the Company has acquired long-term debt for investment activities in the same currency that projects receiving the cash flow of its export sales revenues. This situation creates a natural hedge relationship due to the fact that the risks generated by the foreign exchange difference of export sales revenues to Ecopetrol´s functional currency (Colombian pesos) are naturally hedged with the foreign exchange valuation risks of the long-term debt in U.S. dollars, aligned with the company’s risk management strategy.
With the objective of presenting in the financial statements the effect of the mentioned natural hedge between exports and debt, understanding that the exchange rate risk materializes when the exports are made, on October 1, 2015, the Board of Directors designated US$5,440 million of Ecopetrol’s debt as hedge instrument of its future export sales for the period 2015- 2023, in accordance with IAS 39 – Financial instruments: recognition and measurement.
Hedge accounting records the impact of foreign exchange gains/losses on the hedging instrument on statement of profit or loss effectively at the time of realization of the hedged risk. For this to happen, every month when the foreign currency debt is translated to Colombian pesos at the closing exchange rate, the effects on foreign exchange differences are recognized as part of the other comprehensive income. Once the hedged operation occurs and sales revenue is recognized, the cumulative exchange differences held within in other comprehensive income is reclassified to profit or loss statement, impacting operating income and EBITDA.
The following shows the movement of this non-derivative hedging instrument at December 31, 2016 and 2015:
| (US$ Million) | 2016 | 2015 | ||||||
| Hedging instrument at the beginning of the period | 5,376 | 5,376 | ||||||
| Reassignment of hedging instruments | 870 | 277 | ||||||
| Realized exports | (870 | ) | (277 | ) | ||||
| Capital payments | (64 | ) | - | |||||
| Hedging instrument at the end of the period | 5,312 | 5,376 | ||||||
|
The following is the movement in the other comprehensive income as of December 31:
| 2016 | 2015 | |||||||
| Opening balance | 217,291 | - | ||||||
| Exchange difference on hedging instruments | (724,395 | ) | 352,482 | |||||
| Reclassification to profit or loss | (33,074 | ) | (7,646 | ) | ||||
| Deferred income tax | 296,047 | (127,545 | ) | |||||
| Closing balance | (244,131 | ) | 217,291 | |||||
The expected reclassification of exchange differences accumulated in other comprehensive income to profit or loss,setting the exchange rate at COP$3000.71 is as follows:
| Year | Peso equivalents | Income tax | Net | |||||||||
| 2017 | 102,454 | (41,838 | ) | 60,616 | ||||||||
| 2018 | 117,447 | (47,960 | ) | 69,487 | ||||||||
| 2019 | 102,307 | (41,778 | ) | 60,529 | ||||||||
| 2020 | 33,981 | (13,876 | ) | 20,105 | ||||||||
| 2021 | 16,847 | (6,880 | ) | 9,967 | ||||||||
| 2022 | 16,847 | (6,880 | ) | 9,967 | ||||||||
| 2023 | 22,750 | (9,290 | ) | 13,460 | ||||||||
| 412,633 | (168,502 | ) | 244,131 | |||||||||
The Board of Directors approved the application of hedge accounting of net investment from June 8, 2016. The measure seeks to reduce the volatility of non-operating income due to the exchange difference. The hedge of a net investment applies to a portion of the investments the Company has in foreign currency, in this case in subsidiaries with the US dollars as their functional currency, using as hedging instrument a portion of the Company’s debt denominated in US dollars.
Ecopetrol designated as hedged items net investments in Ocensa, Ecopetrol America Inc., Hocol Petroleum Ltd. (HPL) and Reficar; and as a hedging instrument a portion of its debt denominated in US dollars in a total amount equivalent to US $5,200 million.
From the implementation to the date of this report this hedge has been effective.
Gain on exchange difference of these debts net of taxes recognized in the other comprehensive income at December 31, 2016, was COP$155,359.
The Company carries out forwards hedging operations using the Non-Delivery modality whose purpose is mitigating the volatility of the exchange rate in the cash flow required for operations of its subsidiary Ocensa, whose functional currency is US dollars. The forward hedging instruments used enable setting the sale price in US dollars, seeking to counteract the effects from devaluation or revaluation at the time in which Ocensa monetizes the resources necessary to fulfill its monthly or specific obligations relative to operational cost and tax payments, which are payable in Colombian pesos.
As of December 31, 2016 there are forwards contracts with a net short position of US $323 million (2015 - US $387). The impact on the income statement resulting from the liquidation of these hedges amounting to COP$42,865 of profit (2015- COP$86,914 of loss) and the amount recognized on the other comprehensive income was COP$33,869 of profit (2015 – COP$60,083 of loss).
|
The following table shows the impact that a variation of 1% and 5% in the exchange rate of the Colombian peso vs the US dollar would have on the assets and liabilities held in such currency at December 31, 2016:
Scenario/ | Effect on income before taxes (+/-) | Effect on other comprehensive income (+/-) | ||||||||
| 1% | 86,363 | 451,577 | ||||||||
| 5% | 431,813 | 2,257,884 | ||||||||
The sensitivity analysis includes only monetary assets and monetary liabilities held in foreign currency at the closing date.
| Credit risk |
Credit risk is the risk that the CompanyEcopetrol Business Group may suffer financial losses as a consequence of the breach of contractsdefault of: (a) payments by its clients for purchase andthe sale of crude oil, gas, refined and petrochemical products and transportation services, in addition to theor services; (b) financial institutions in which it keeps investments, or the(c) by counterparties with which it has contracted derivative financial instruments.
Credit risk for customers
| 28.2.1 | Credit risk for customers |
In performance of the saleselling process of crude oil, gas, refined and petrochemical products and transportationpetrochemicals, and transport services, the CompanyEcopetrol Business Group may be exposed to credit risk in the event that customers fail to comply withfulfill their payment obligations. RiskThe Ecopetrol Business Group’s risk management strategy has designed mechanisms and procedures that have permitted the Companyaim to minimize the probability of materializationsuch events, thus safeguarding the Company’sEcopetrol Business Group’s cash flow.
The CompanyEcopetrol Business Group performs a continuous analysis of the financial strength of its counterparties, which implies their classificationby classifying them according to their risk level and financial supportsguarantees in the event of a cessationdefault of payments. In addition, a constant monitoring is made ofSimilarly, the Ecopetrol Business Group continuously monitors national and international market conditions in order to establishfor early alerts of major changes that may have an impact on the timely payment of obligations from customers of the Company.Ecopetrol Business Group.
For the bad debts, anAllowances for loan losses are set by individual analysis is performed that allow to analyze the situation of each customer and thus define the applicable allowance to be established, such as age of receivables.customer’s situation. The group carries out theEcopetrol Business Group performs administrative and legal actions necessaryrequired to recover amounts past due accounts receivable as well as the recognition ofand charges interest offrom customers who do notthat fail to comply with payment policies.
The business groupEcopetrol does not have a significant concentrationsconcentration of credit risk. The following is theAn aging analysis of aging of customerthe accounts receivable portfolio in arrears, but not impaired, atas of December 31, 20162018 and 2015:2017 is as follows:
| 2016 | 2015 | |||||||
| Less than 3-month overdue | 179,008 | 71,791 | ||||||
| Between 3- and 6- month overdue | 14,275 | 4,862 | ||||||
| More than 6-month overdue | 103,574 | 116,849 | ||||||
| Total | 296,857 | 193,502 | ||||||
| 2018 | 2017 | |||||||
| Less than 3 months overdue | 157,608 | 65,354 | ||||||
| Between 3 and 6 months overdue | 41,263 | 1,131 | ||||||
| More than 6 months overdue | 93,657 | 79,688 | ||||||
| 292,528 | 146,173 | |||||||
Ecopetrol S.A.
Notes to the consolidated financial statements
(Figures expressed in millions of Colombian pesos, unless otherwise stated)
| Credit quality of resources in financial assets |
|
Credit quality of resources in financial assets
Following the promulgation of Decree 1525 of 2008, which provides general rules on investments for public entities, Ecopetrol’s management established guidelines for our investment portfolios. These guidelines determine that investments in Ecopetrol’s U.S. dollar portfolio are generally limited to investments of our excess cash in fixed-incomefixed–income securities issued by entities rated A or higher in the long term and A1/P1/F1 or higher in the short term (international scale) by Standard & Poor’s Ratings Services, Moody’s Investors Service or Fitch Ratings.
In addition, Ecopetrol S.A. may also invest in securities issued or guaranteed by the U.S. government or Colombian government, without regard to the ratings assigned to such securities. In Ecopetrol’s pesoColombian Peso portfolio, it must invest our excess cash excess in fixed-incomefixed–income securities of issuers rated AAA in the long term, and F1+/BRC1+ in the short term (local scale) by Fitch Ratings Colombia or BRC Standard & Poor’s. In addition, Ecopetrol may also invest in securities issued or guaranteed by the Colombian government without rating restrictions.
In order to diversify risk in our pesoColombian Peso portfolio, Ecopetrol does not invest more than 10% of the excess of cash in one specific issuer. In the case of our U.S. dollar portfolio, it does not invest more than 5% of the excess of cash in one specific issuer in the short term (up to 1one year), or 1% in the long term. The CompanyEcopetrol Business Group has complied with this policypolicy.
Ecopetrol’s investment portfolio in U.S. dollars is segmented into four tranches, each one matching our liquidity needs. The working capital tranche is calculated taking into account our cash flow needs for the next 60 days. The liquidity tranche is calculated as the contingent cash flow needs over the working capital, taking into account the development of December 31,2016capital expenditures related to projects. The asset liability tranche is built to match our long-term debt. The investment tranche includes the remaining amount of the total portfolio after deducting the amounts pertaining to the above mentioned tranches and 2015.after subtracting the Colombian Peso portfolio.
Ecopetrol’s investment portfolio in Colombian Pesos is segmented in two tranches, each one matching our liquidity needs. The first tranche is calculated taking into account our cash flow needs for the next 30 days, and the second tranche is built for investment purposes.
The tables below reflects the credit qualityrating of issuers and counterparties in transactions involving financial instruments at December 31, 2016is disclosed in Note 6 – Cash and 2015:cash equivalents, Note 9 – Other financial assets and Note 20 – Provisions for employees’ benefits.
| Cash and cash equivalents | Other financial assets | Plan assets | ||||||||||||||||||||||
| Credit quality | 2016 | 2015 | 2016 | 2015 | 2016 | 2015 | ||||||||||||||||||
| AAA | 3,198,394 | 581,303 | 1,858,665 | 1,130,216 | 9,077,893 | 7,597,462 | ||||||||||||||||||
| F1+ | 2,188,471 | 3,696,327 | 1,636,039 | 217,493 | 416,439 | 43,351 | ||||||||||||||||||
| A1 | 1,466,015 | - | 3,060,660 | - | - | - | ||||||||||||||||||
| F1 | 545,872 | 1,247,398 | - | 48,919 | - | - | ||||||||||||||||||
| F2 | 409,717 | 421,084 | - | - | - | - | ||||||||||||||||||
| BRC 1+ | 312,290 | 120,217 | - | - | 309,282 | 221,257 | ||||||||||||||||||
| Prime-2 | 78,989 | - | - | - | - | - | ||||||||||||||||||
| A1+ | 73,470 | 294,931 | - | - | - | - | ||||||||||||||||||
| F3 | 37,172 | - | - | - | - | - | ||||||||||||||||||
| Prime-3 | 32,748 | 31,862 | - | - | - | - | ||||||||||||||||||
| B | 144 | - | - | - | - | - | ||||||||||||||||||
| AA+ | - | - | 50,192 | - | 470,944 | 661,604 | ||||||||||||||||||
| AA | - | - | 5,289 | - | 79,750 | 68,481 | ||||||||||||||||||
| AA- | - | - | 3,730 | - | 34,197 | 55,077 | ||||||||||||||||||
| A | - | - | - | - | 4,175 | 4,682 | ||||||||||||||||||
| BBB+ | - | - | - | - | 193,835 | 196,815 | ||||||||||||||||||
| BBB | - | - | - | 125,936 | 150,808 | 388,586 | ||||||||||||||||||
| BBB- | - | - | - | - | 23,237 | 1,569,850 | ||||||||||||||||||
| BB+ | - | - | - | - | - | 28,999 | ||||||||||||||||||
| BB | - | - | - | - | - | 22,572 | ||||||||||||||||||
| CCC | - | - | - | - | 489 | 1,035 | ||||||||||||||||||
| A- | - | - | - | - | 9,111 | - | ||||||||||||||||||
| A+ | - | - | - | - | 8,841 | - | ||||||||||||||||||
| A3 | - | - | - | - | 61,325 | - | ||||||||||||||||||
| AA3 | - | - | - | - | 14,385 | - | ||||||||||||||||||
| BA2 | - | - | - | - | 3,006 | - | ||||||||||||||||||
| BA3 | - | - | - | - | 12,802 | - | ||||||||||||||||||
| BAA1 | - | - | - | - | 5,274 | - | ||||||||||||||||||
| BAA2 | - | - | - | - | 141,940 | - | ||||||||||||||||||
| BAA3 | - | - | - | - | 131,993 | - | ||||||||||||||||||
| BB- | - | - | - | - | 11,001 | - | ||||||||||||||||||
| BRC1 | - | - | - | - | 7,710 | - | ||||||||||||||||||
| BRC2+ | - | - | - | - | 5,763 | - | ||||||||||||||||||
| CC | - | - | - | - | 734 | - | ||||||||||||||||||
| SP1+ | - | - | - | - | 7,013 | - | ||||||||||||||||||
| VRR1+ | - | - | - | - | 55,821 | - | ||||||||||||||||||
| Unrated | 67,185 | 157,328 | 72,320 | 62,815 | 885,407 | 701,717 | ||||||||||||||||||
| Total | 8,410,467 | 6,550,450 | 6,686, 895 | 1, 585,379 | 12,123,175 | 11,561,488 | ||||||||||||||||||
|
| Interest rate risk |
Interest rate risk arises from Ecopetrol’s exposure to changes in interest rates because the groupEcopetrol Business Group has investments in fixed floating-rateand floating–rate instruments in Ecopetrol’s investment portfolio and issuances ofhas issued floating rate debt linked to LIBOR, DTF and IPCCPI interest rates. Thus, interest rate volatility may affect the fair value and cash flows related toof the Company'sEcopetrol Business Group’s investments and the financial expense of floating rate loans and financing.
As of December 31, 2018, 17% (2017, 19% and 2016, and 2015 31%) of the Ecopetrol Business Group’s indebtedness has ais linked to floating rate.interest rates. As a result, if the market interest rate risesrates rise, financing costsexpenses will increase, which could have an adverse effect on the results of operations.
Ecopetrol controls the exposure to interest rate risk by establishing limits to its effectiveexposure duration, Value at Risk -– VAR andtracking errorerror..
Autonomous equities linked to Ecopetrol’s pension obligations are also exposed to changes in interest rates, as they include fixed and floating rate instruments that are marked to market. Colombian regulation for pension funds, as stipulated in the Decree 941 of 2002 and Decree 1861 of 2012, indicates that they have to follow the same regime as the regular obligatory pension funds in their moderate portfolio.
Ecopetrol S.A.
Notes to the consolidated financial statements
(Figures expressed in millions of Colombian pesos, unless otherwise stated)
The following table provides information about the sensitivity of Company´sthe Ecopetrol Business Group’s results and other comprehensive income for the next 12 months to variations in interest rate of 100 basis points:
| Financial liabilities | Financial assets | Plan assets | ||||||||||
| Variation in interest rate | (Financial expenses) | (Financial income) | (Other comprehensive income) | |||||||||
| + 100 basis points | 321,000 | 40,670 | 376,255 | |||||||||
| - 100 basis points | (245,568 | ) | (40,670 | ) | (383,158 | ) | ||||||
| Effect on profit or loss (+/–) | Effect on Other Comprehensive Income (+/–) | |||||||||||
| Financial assets | Financial Liabilities | Plan assets | ||||||||||
| +100 basis points | (71,123 | ) | 240,711 | (513,699 | ) | |||||||
| –100 basis points | 71,123 | (94,062 | ) | 527,058 | ||||||||
SensitivityA sensitivity analysis of discount rates on pension plansplan assets and liabilities is showndisclosed in the Note 2220 – Provisions for employeeemployees’ benefits.
F-88
Ecopetrol S.A.
Notes to the consolidated financial statements
(Figures expressed in millions of Colombian pesos, unless otherwise stated)
| Liquidity risk |
The ability to access the capital necessary to finance the Company´sEcopetrol Business Group’s investment plans on acceptable terms can be limited due to deterioration in market conditions. A newglobal financial crisis could worsen the risk perception in the emerging markets.
Risks related to Colombia’sEvents impacting the political and regional environment of Colombia, could also make it more difficult for our subsidiaries to access the international capital markets. These conditions, alongtogether with potential significant write-offslosses in the financial services sector and the re-pricing ofchanges in credit risk canassessments, may make it difficult to obtain funding for capital needsfinancing on favorable terms. As a result, wethe Ecopetrol Business Group may be forced to revisereview the timingopportunity and scope of these projectsits investment plans as necessary, to adapt to existing market and economic conditions, or access the financial markets onunder less favorable terms, less favorable; therefore,thereby negatively affecting the Company´sEcopetrol Business Group’s results of operations and financial condition.position.
Liquidity risk is managed in accordance with the Company´sEcopetrol Business Group’s policies aimed at ensuring that there are sufficient net funds to meet the Company'sEcopetrol Business Group’s financial commitments within its maturity schedules with no additional costs. The main method for the measurement and monitoring of liquidity is cash flow forecasting.
During 2018, the Ecopetrol Business Group used US$2,446 million equivalents (2017 – US$2,400 million) as part of its liquidity surpluses to prepay part of its debts with original maturities between 2019 and 2025. The details of these movements are described in Note 18 – Loans and borrowings.
The following is a summary of the maturity of financial liabilities atas of December 31, 2016.2018. The amounts disclosed in the table are the contractual undiscounted cash flows. The payments in foreign currency were restated taking a constant exchange rate of $ 3,000.71 Colombian pesosCOP$3,249.75 per U.S. dollar. Consequently, these amounts may not reconcile with the amounts disclosed on the consolidated statement of financial position:
| Up to 1 year | 1-5 years | 5-10 years | > 10 years | Total | ||||||||||||||||
| Loans (principal and interests) | 4,268,060 | 29,965,353 | 25,736,624 | 20,589,796 | 80,559,833 | |||||||||||||||
| Trade and other accounts payable | 6,854,363 | 23,893 | - | - | 6,878,256 | |||||||||||||||
| Total | 11,122,423 | 29,989,246 | 25,736,624 | 20,589,796 | 87,438,089 | |||||||||||||||
|
| Up to 1 year | 1–5 years | 5–10 years | > 10 years | Total | ||||||||||||||||
| Loans (payment of principal and interest) | 3,570,843 | 16,093,120 | 20,942,328 | 19,300,708 | 59,906,999 | |||||||||||||||
| Trade and other payables | 8,945,790 | 30,522 | – | – | 8,976,312 | |||||||||||||||
| Total | 12,516,633 | 16,123,642 | 20,942,328 | 19,300,708 | 68,883,311 | |||||||||||||||
| Capital management |
The main objective of Ecopetrol’s Capital Managementthe capital management of the Ecopetrol Business Group is to ensure a financial structure that will optimizeoptimizes the Company’s cost of capital, maximizemaximizes the returnsrate of return to its shareholders and allows access to financial markets at a competitive cost to cover financing needs that support an investment grade credit rating profile.
Net financial debt is financing needs.calculated by taking short–term and long–term loans and borrowings less cash and cash equivalents and investments in securities as of December 31 of each year. The level of leverage is calculated as the ratio between net financial debt and the sum of equity and net financial debt. The following is the information of these indicators as of December 31, 2018 and 2017:
| 2018 | 2017 | |||||||
| Loans and borrowings (Note 18) | 38,062,645 | 43,547,835 | ||||||
| Cash and cash equivalents (Note 6) | (6,311,744 | ) | (7,945,885 | ) | ||||
| Other financial assets (Note 9) | (8,147,815 | ) | (6,533,725 | ) | ||||
| Net financial debt | 23,603,086 | 29,068,225 | ||||||
| Equity (Note 22) | 57,107,780 | 48,215,699 | ||||||
| Leverage | 29.24 | % | 37.61 | % | ||||
The leverage index atmovement of the relevant periodsnet financial debt is comprised as follow at December 31, 2016 and 2015:detailed in Note 18.8.
| 2016 | 2015 | |||||||
| Loans and borrowings (Note 20) | 52,222,027 | 53,223,338 | ||||||
| Cash and cash equivalents (Note 6) | (8,410,467 | ) | (6,550,450 | ) | ||||
| Other financial assets not restricted (Note 9) | (6,686,895 | ) | (885,547 | ) | ||||
| Net financial debt | 37,124,665 | 45,787,341 | ||||||
| Equity (Note 24) | 43,560,501 | 43,100,963 | ||||||
| Leverage (1) | 46.01 | % | 51.51 | % | ||||
F-89
Ecopetrol S.A.
Notes to the consolidated financial statements (Figures expressed in millions of Colombian pesos, unless otherwise stated) |
| Related parties |
Balances with associated companiesassociates and joint ventures as of December 31, 20162018 and 20152017 are as follows:
| Accounts receivable | Other assets | Accounts payable | Loans | |||||||||||||
| Joint ventures | ||||||||||||||||
| Equion Energía Limited | 97,601 | 7,135 | 89,666 | 30,644 | ||||||||||||
| Ecodiesel Colombia S.A. | 129 | - | 20,765 | - | ||||||||||||
| Offshore International Group (1) | 170,121 | - | - | - | ||||||||||||
| Associates | ||||||||||||||||
| Serviport S.A. | - | - | 3,989 | - | ||||||||||||
| Balance at December 31, 2016 | 267,851 | 7,135 | 114,420 | 30,644 | ||||||||||||
| Accounts receivable | Accounts receivable – Loans | Other assets | Accounts payable | Loans | Other liabilities | |||||||||||||||||||
| Joint Ventures | ||||||||||||||||||||||||
| Equion Energy Limited(1) | 22,958 | – | 19,214 | 87,079 | 855,135 | 67 | ||||||||||||||||||
| Ecodiesel Colombia S.A. | 522 | – | – | 23,857 | – | 1 | ||||||||||||||||||
| Offshore International Group Inc.(2) | – | 117,824 | – | – | – | – | ||||||||||||||||||
| Associates | ||||||||||||||||||||||||
| Serviport S.A. | – | – | – | 5,482 | – | – | ||||||||||||||||||
| Balance as of December 31, 2018 | 23,480 | 117,824 | 19,214 | 116,418 | 855,135 | 68 | ||||||||||||||||||
| Current | 23,480 | – | 19,214 | 116,418 | 855,135 | 68 | ||||||||||||||||||
| Non–current | – | 117,824 | – | – | – | – | ||||||||||||||||||
| 23,480 | 117,824 | 19,214 | 116,418 | 855,135 | 68 | |||||||||||||||||||
| (Note 7) | (Note 7) | (Note 11) | (Note 19) | (Note 18) | ||||||||||||||||||||
| Accounts receivable | Other assets | Accounts payable | Loans | Accounts receivable | Accounts receivable – Loans | Other assets | Accounts payable | Loans | Other liabilities | |||||||||||||||||||||||||||||||
| Joint ventures | ||||||||||||||||||||||||||||||||||||||||
| Equion Energía Limited | 64,583 | 28,668 | 62,861 | 45,913 | ||||||||||||||||||||||||||||||||||||
| Joint Ventures | ||||||||||||||||||||||||||||||||||||||||
| Equion Energy Limited(1) | 4,010 | – | 7,716 | 101,472 | 259,760 | 7 | ||||||||||||||||||||||||||||||||||
| Ecodiesel Colombia S.A. | - | - | 22,243 | - | 362 | – | – | 22,228 | – | – | ||||||||||||||||||||||||||||||
| Offshore International Group Inc.(2) | – | 154,810 | – | – | – | – | ||||||||||||||||||||||||||||||||||
| Associates | ||||||||||||||||||||||||||||||||||||||||
| Invercolsa S.A. | 18,641 | – | – | – | – | – | ||||||||||||||||||||||||||||||||||
| Serviport S.A. | 141 | - | 2,359 | - | – | – | – | 5,820 | – | – | ||||||||||||||||||||||||||||||
| Balance at December 31, 2015 | 64,724 | 28,668 | 87,463 | 45,913 | ||||||||||||||||||||||||||||||||||||
| Balance as of December 31, 2017 | 23,013 | 154,810 | 7,716 | 129,520 | 259,760 | 7 | ||||||||||||||||||||||||||||||||||
| Current | 23,013 | – | 7,716 | 129,520 | 259,760 | 7 | ||||||||||||||||||||||||||||||||||
| Non–current | – | 154,810 | – | – | – | – | ||||||||||||||||||||||||||||||||||
| 23,013 | 154,810 | 7,716 | 129,520 | 259,760 | 7 | |||||||||||||||||||||||||||||||||||
| (Note 7) | (Note 7) | (Note 11) | (Note 19) | (Note 18) | ||||||||||||||||||||||||||||||||||||
(1) The accounts receivable correspond to a loan granted to Offshore International Group Inc. for US $57 million in April 2016, at an interest rate of 4.99% payable semi-annually from 2017 and maturing in 2021.Loans with related parties:
| (1) | Deposits held by Equion in Capital AG for a nominal value of USD$263 million (2017 – USD$77 millon), with a three-month Libor rate + 1.92% (2017 - 1.44%). |
| (2) | Loan granted by Ecopetrol S.A. to Savia Perú S.A. (subsidiary of Offshore International Group) for US$57 million in 2016, with an interest rate of 4.99% payable semiannually from 2017 and maturating in 2021. The balance in nominal value of this loan as of December 31, 2018 is USD$35 million (2017 – USD$49 million). |
The amounts outstanding are not guaranteed and will be settled in cash. No expense has been recognized in the current period or in priorprevious periods with respect to uncollectible or doubtful accounts related to the amounts owed by related parties.
Ecopetrol S.A.
Notes to the consolidated financial statements
(Figures expressed in millions of Colombian pesos, unless otherwise stated)
The main transactions with related entitiesparties for the years ended December 31, 2016, 20152018, 2017 and 20142016 are detailed as follows:
| 2016 | 2015 | 2014 | ||||||||||||||||||||||
| Sales and services | Purchases and others | Sales and services | Purchases and others | Sales and services | Purchases and others | |||||||||||||||||||
| Joint ventures | ||||||||||||||||||||||||
| Equion Energía Limited | 491,698 | 418,618 | 515,968 | 190,158 | 908,357 | 79,264 | ||||||||||||||||||
| Ecodiesel Colombia S.A. | 5,744 | 265,584 | 7,245 | 267,647 | 3,840 | 220,834 | ||||||||||||||||||
| Offshore International Group | 6,285 | - | - | - | - | - | ||||||||||||||||||
| Associates | ||||||||||||||||||||||||
| Serviport S.A. | - | 24,572 | - | - | - | - | ||||||||||||||||||
| Total | 503,727 | 708,774 | 523,213 | 457,805 | 912,197 | 300,098 | ||||||||||||||||||
The dividends received by these companies are listed in Note 14 - Investments in companies.
|
| 2018 | 2017 | 2016 | ||||||||||||||||||||||
| Sales and services | Purchases and others | Sales and services | Purchases and others | Sales and services | Purchases and others | |||||||||||||||||||
| Joint Ventures | ||||||||||||||||||||||||
| Equion Energy Limited | 67,002 | 846,284 | 425,881 | 598,636 | 491,698 | 418,618 | ||||||||||||||||||
| Ecodiesel Colombia S.A | 6,860 | 267,498 | 6,583 | 259,269 | 5,744 | 265,584 | ||||||||||||||||||
| Offshore International Group | 2,386 | – | 15,188 | – | 6,285 | – | ||||||||||||||||||
| Associates | ||||||||||||||||||||||||
| Serviport S.A. | – | – | – | – | – | 24,572 | ||||||||||||||||||
| 76,248 | 1,113,782 | 447,652 | 857,905 | 503,727 | 708,774 | |||||||||||||||||||
Based on a resolution adopted atIn accordance with the annualapproval given by the shareholders’ meeting in 2012, compensation paid to directors isfor attending the equivalentmeetings of the Board of Directors and/or committees increased from four to six minimum legal monthly wage salaries which totalsin force, or approximately COP $3,870,000 pesosto COP$4,687,000 for 20152018, from COP$4,426,000 for 2017 and COP $4,140,000 pesosCOP$4,140,000 for 2016. Fees for attendance at virtual meetings are set atFor non–face–to–face sessions, 50% of the face-to-face meeting fee.quota for face–to–face meetings is set. The members of the Board of Directors isdo not subjecthave any kind of variable remuneration. The amount paid in 2018 for compensation to any variable remuneration.The amount canceled in 2016 for fees tomembers of the Board membersof Directors amounted to COP$1,253 (2015 -2,152 (2017 – COP$1,238)1,877 and 2016 – COP$1,253).
The total compensation paid to Directors executive officers and senior management during the year endedas of December 31, 20162018, amounted to COP$13,901 (2015 -21,580 (2017 – COP$6,690)20,669 and 2016 – COP$13,901). The Directors are not eligible to receive pension and retirement benefits. The total amount set asidereserved as of December 31, 20162018, to provide pension and retirement benefits to our eligible executive officers amounted to COP$4,674 (2015 -5,491 (2017 – COP$10,341)5,401 and 2016 – COP$4,674).
As of December 31, 2016, the following2018, key management executivesofficers owned less than 1% of the outstanding shares of Ecopetrol S.A. as follows:
Key management | % | Shares | |
| <1% | |||
| <1% | |||
| <1% | |||
| Rafael Espinosa Rozo | <1% | ||
The administration and management of resources for payment of Ecopetrol'sEcopetrol’s pension obligations are managed by autonomous pension autonomous equities (PAP,funds (PAPs, by its acronym in Spanish) which serve as guarantee and payment source. These funds were established in compliance withsources. In 2008, Ecopetrol S.A. received the provisions of decree 2153 of 1999 which authorized as of December 31, 2008 partial commutation ofauthorization to partially commute the value corresponding to monthly payments, bonusesbonds and contributions,quotas, transferring said obligations and money supportingthe monies that support them to autonomous patrimonies of a pensional nature.pension nature, in accordance with the requirements of Decree 1833 of 2016.
As of December 31,Since November 2016, the entities managing thesethat administer the resources were:are: Fiduciaria Bancolombia, Fiduciaria de Occidente and Consorcio Ecopetrol PAAC (comprisedPACC (formed by Fiduciaria La Previsora, Fiduciaria Bancoldex, Fiduciaria AgrariaFiduagraria and Fiduciaria Central).
These entitiesfiduciaries will manage the pension resources for a five-year term (2016 - 2021)period of five years (2016-2021) and as considerationcompensation they receive a remuneration with fixed and variable components, which is calculatedthe latter are settled on the gross yieldyields of the portfolios and are charged to manage resources.the resources administered.
F-91
Ecopetrol S.A.
Notes to the consolidated financial statements
(Figures expressed in millions of Colombian pesos, unless otherwise stated)
| Government related parties |
The Colombian Government holds control ofcontrols Ecopetrol with a stock ownership of 88.49%. The most significant transactions with governmental entities are comprised as follows:
| Purchase of oil |
BecauseBy nature of the business, nature the CompanyEcopetrol Business Group has a direct relationship with ANH, an entity which operates under the rules of the Ministry of Mines and Energy, rules, of whichwhose objective is to manage the oil and gas reserves and resources owned by the Colombian Nation.
|
Ecopetrol purchases the crude oil that the ANH receives from all producers in Colombia at the prices set in accordance with a jointly established formula, which reflects the export sale prices (crude oils and products), adjustment to theadjusted for API gravity quality, sulfur content, transportation rates from the wellhead to the ports of Coveñas and Tumaco, refining process cost and a commercialization rate. This contract was extended to June 30, 2018.January 31, 2020.
AtFrom December 2013 the CompanyEcopetrol Business Group commercialized, on behalf of the ANH, the natural gas received by the latter in kind from the producers. Since January 2014, ANH receives thehas received royalties in cash for the production of natural gas.
The purchase value of oil and gas from AHNANH is detailed in Note 26 -24 – Cost of sales.
Additionally Ecopetrol, like other oil companies, takes part in "rounds"“rounds” for the allocation of exploration blocks in Colombia without implying special treatment for Ecopetrol on account of it being an entity whose majority shareholder is the Ministry of Finance.Colombian Government.
| Price differential |
Regular gasoline and diesel sale prices are regulated by the National Government. In this case, there are differentials between the volume reported by the Colombian companies at the time of the sale and the difference between the international parity price and the benchmarkregulated price actually charged, where the parity price is that corresponding to the daily motorprice of gasoline and diesel prices observed duringoil of the month.respective month in Colombian pesos, indexed to the United States of America Gulf market, calculated in accordance with Resolution 18 0522 of 2010 and the Producer Price reference defined by the Ministry of Mines and Energy. These differentials may be in favor or against the producers. The value of this differential is detailed in Note 25 -23 – Sales revenue from contracts with customers and Note 7 – Trade and other receivables, net.
| National Tax and Customs Direction |
Ecopetrol, just like any other company in Colombia, has tax obligations that it must comply with in respect of this entity and Ecopetrol does not have any other kind of association or commercial relationship with it.the National Tax and Customs Direction. For more information see Note 10 – Taxes.
| Comptroller General of the Republic |
Ecopetrol, just like any other state entity in Colombia, is obliged to comply with the requirements set out by this control entitythe Comptroller General of the Republic and make an annual payment to this entity on account of a maintenance fee. Ecopetrol does not have any other kind of association or commercial relationship with this entity.
F-92
Ecopetrol S.A. Notes to the consolidated financial statements (Figures expressed in millions of Colombian pesos, unless otherwise stated) |
| Joint operations |
The CompanyEcopetrol Business Group carries out exploration and production operations through Exploration and Production (E&P) Contracts, Technical Evaluation (TEA) Contracts and Agreements signed with the National Hydrocarbons Agency or ANH, as well as through Partnership Contracts and other types of contracts. The main joint operations in 20162018 are as follows:
Contracts in which Ecopetrol is not the operator:
| 30.1 | Contracts in which Ecopetrol is not the operator |
| Partners | Contract | Type | % Participation | Geographic area of operations | |||||
| Occidental Andina LLC | Chipirón Harvest Cravo Rondón | Production | 30–40% 30% 50% 50% | Colombia | |||||
| Chevron Petroleum | Guajira | Production | 57% | Colombia | |||||
| Mansarovar Energy Colombia Ltd | Nare | Production | 50% | Colombia | |||||
| Quifa | Production | Colombia | |||||||
| Equion | Piedemonte | Production | 50% | Colombia | |||||
| Perenco Colombia Limited | Casanare Corocora Estero Garcero Orocúe | Production | 64% 56% 89% 76% 63% | Colombia | |||||
| ONGC Videsh Limited | Exploration | 50% | Offshore | ||||||
| Petrobras, Repsol & Statoil | Tayrona | Exploration | 30% | Offshore | |||||
| Repsol & Statoil | TEA GUA | Exploration | 50% | Offshore | |||||
| Anadarko | Fuerte Norte | Exploration | 50% | ||||||
| Offshore | |||||||||
| Shell | Deep Rydberg/Aleatico | Exploration | 29% | Gulf of Mexico | |||||
| Repsol – Leon | Leon | Exploration | 40% | Gulf of Mexico | |||||
| Gulf of Mexico | |||||||||
| Murphy Oil | Production | 30% | Gulf of Mexico | ||||||
| Anadarko | K2 | Production | 21% | Gulf of Mexico | |||||
| Equion Energia Limited | Niscota | Production | 20% | Colombia | |||||
| CNOOC – British Petroleum | Pau Brasil | Exploration | 20% | Brazil | |||||
| Chevron | CE–M–715_R11 | Exploration | 50% | Brazil | |||||
PC Carigali Mexico Operations S.A. de C.V. (Petronas) | CNH-R02-L01-A6.CS/2017 | Exploration | 50% | Mexico | |||||
| Petroleos Mexicanos (PEMEX) | CNH-R02-L01-A8.CS/2017 | Exploration and production | 50% | Mexico |
F-93
|
TerminationEcopetrol S.A.
Notes to the consolidated financial statements
(Figures expressed in millions of Rubiales and Pirirí contractsColombian pesos, unless otherwise stated)
Since July 1, 2016 Ecopetrol took over the direct operation of the Rubiales field, which up to that date had been operated by Pacific Rubiales Energy. Upon termination of the contract Ecopetrol received the assets from said operation and the obligations associated with the BOMT contracts for US$46 million.
| 30.2 | Contracts in which Ecopetrol is the operator |
Termination ofTauramena association agreement
On July 3, 2016, the Tauramena Association Agreement was terminated and for this reason, Ecopetrol began to operate directly the Cusiana field, Casanare. Since its commercialization in 1993 it was operated first by BP and then by Equion. Cusiana represents for Ecopetrol a 98% participation in the Unified Exploitation Plan (PEU) of the field, while Equión and Emerald will maintain both 2%.
Contracts in which Ecopetrol is the operator:
| Partners | Contract | Type | % Participation | Geographic area of operations | ||||||
| ExxonMobil Exploration Colombia | VMM29 CR2 C62 | Exploration | 50% | Colombia | ||||||
| Talisman Colombia Oil | CPO9 | Exploration | 55% | Colombia | ||||||
| ONGC Videsh Limited Colombia Branch | Exploration | 50% | Colombia | |||||||
| CPVEN Sucursal Colombia | VMM32 | Exploration | 51% | Colombia | ||||||
| Shell | CR4 | Exploration | 50% | Colombia | ||||||
| SK Innovation Co Ltd. | San Jacinto | Exploration | 70% | Colombia | ||||||
| Repsol Exploración Colombia S.A. | Catleya | Exploration | 50% | Colombia | ||||||
| Emerald Energy PLC Suc. Colombia | Cardon | Exploration | 50% | Colombia | ||||||
| CPO9 | Production | 55% | Colombia | |||||||
| Occidental Andina LLC | La Cira Infantas Teca | Production | 82% | Colombia | ||||||
Colombia | ||||||||||
| Ramshorn International Limited | Guariquies I | Production | 50% | Colombia | ||||||
| Equion | Cusiana | Production | 98% | Colombia | ||||||
| Perenco Oil And Gas | ||||||||||
| San Jacinto | Production | 18% | Colombia | |||||||
| Cepsa Colombia | San Jacinto Rio Paez | Production | 18% | Colombia | ||||||
| Total Colombia | Mundo Nuevo | Exploration | 15% | Colombia | ||||||
| Talisman Oil & Gas | Mundo Nuevo | Exploration | 15% | Colombia | ||||||
| Lewis | Clarinero | Exploration | 50% | Colombia | ||||||
| Maurel & Prom Suramerica | CPO17 | Exploration | 50% | Colombia | ||||||
| Equion | Alto Magdalena Pipeline | OAM | 45% | Colombia | ||||||
| Emerald Energy | Alto Magdalena Pipeline | OAM | 45% | Colombia | ||||||
| Frontera Energy | Alto Magdalena Pipeline | OAM | 45% | Colombia | ||||||
| ONGC Videsh Limited | Block RC–9 Contract– Caribbean Round No. 37–2007 | Exploration | 50% | Colombia | ||||||
| JX Nippon | FAZ–M–320_R11 | Exploration | 70% | Brazil | ||||||
| Ecopetrol | Potiguar | Exploration | 100% | Brazil |
F-94
Ecopetrol S.A. Notes to the consolidated financial statements (Figures expressed in millions of Colombian pesos, unless otherwise stated) |
| Relevant operations during the period |
During 2018 and 2017, the following significant events occurred in respect of our joint operations contracts:
| (a) | Agreement to acquire 10% of the Saturno Block |
In December 2018, the Ecopetrol Business Group entered into an agreement with Shell and Chevron for a 10% interest in the Saturno block, located in the central region of the Santos basin, which was allocated to Shell and Chevron on September 28, 2018 in the Fifth Pre-Salt Round held by the Brazilian National Oil, Natural Gas and Biofuels Agency (ANP).
This deal is subject to approval by the Brazilian Ministry of Mines and Energy and the ANP. Once the respective approvals are forthcoming, the partners’ shares of the block will be the following: Ecopetrol 10%, Shell (operating partner) 45% and Chevron 45%.
| (b) | Acquisition of interests in joint operations |
On December 11, 2017, Ecopetrol América Inc. acquired the 11.6% interest in the K2 oil field in the Gulf of Mexico MCX Exploration USA LLC (“MCX”), increasing its share from 9.2% to 20.8%.
The acquisition of MCX’s interest was recognized in accordance with policy 4.4 Joint Operations. To determine the fair value of the assets acquired and liabilities assumed, the income approach model was used, using the discounted cash flow and market data to determine the fair values of oil and gas properties. This model incorporated future commodity prices, estimated volumes of oil and gas reserves, future developments, operating costs, future abandonment and packing costs and a risk adjusted discount rate.
The fair value of the consideration transferred in the operation was US$47.6 million (COP$141,950), the fair value of the net assets acquired was US$198.4 million before deferred taxes (US$146 million net of deferred taxes) with recognition of a gain of US$150.8 million before deferred taxes (US$98 million after deferred taxes) in the period’s statement of profit or loss (equivalent to COP$451,095 before deferred taxes), mainly due to the transaction price being fixed before the closing date of the transaction and the fair value of the net identifiable assets acquired having increased during the interim period.
Transaction costs incurred in the operation amounted to US$0.2 million, recognized in profit or loss for 2017.
During 2018, the Final Settlement Statement was made for COP$12,065 (US COP$4.2 million) recognized as an adjustment to the fair value of interests in joint operations.
F-95
Ecopetrol S.A.
Notes to the consolidated financial statements
(Figures expressed in millions of Colombian pesos, unless otherwise stated)
| 31. |
TheA description of the Ecopetrol Business Group’s business segments can be seenis in noteNote 4.19 – Information by business segment.
| Statement of profit or loss |
The following segment information is reported based on the information used by the Board of Directors as the top body to make strategic and operational decisions of these business segments. The performance of the segments are based primarily on an analysis of income, costs, expenses and results for the period generated by each segment which are regularly monitored.
The information disclosed in each segment is presented net of transactions between the Ecopetrol Business Group companies.
The following presentsBelow are the consolidated statementstatements of profit or loss by segment for the years ended December 31, 2016, 20152018, 2017 and 2014:2016:
| For the year ended on December 31, 2018 | ||||||||||||||||||||
| Exploration and Production | Refining and Petrochemicals | Transport and Logistics | Eliminations | Total | ||||||||||||||||
| Third–party sales | 30,112,900 | 34,947,948 | 3,543,024 | - | 68,603,872 | |||||||||||||||
| Inter–segment sales | 20,259,864 | 2,063,425 | 7,811,143 | (30,134,432 | ) | - | ||||||||||||||
| Total sales revenue | 50,372,764 | 37,011,373 | 11,354,167 | (30,134,432 | ) | 68,603,872 | ||||||||||||||
| Fixed costs | (8,871,709 | ) | (3,204,791 | ) | (2,805,516 | ) | 3,535,979 | (11,346,037 | ) | |||||||||||
| Variable costs | (23,367,475 | ) | (32,453,962 | ) | (596,571 | ) | 26,579,666 | (29,838,342 | ) | |||||||||||
| Cost of sales | (32,239,184 | ) | (35,658,753 | ) | (3,402,087 | ) | 30,115,645 | (41,184,379 | ) | |||||||||||
| Gross profit | 18,133,580 | 1,352,620 | 7,952,080 | (18,787 | ) | 27,419,493 | ||||||||||||||
| Administrative expenses | (889,293 | ) | (443,880 | ) | (320,498 | ) | (187 | ) | (1,653,858 | ) | ||||||||||
| Operation and project expenses | (1,993,054 | ) | (668,177 | ) | (263,104 | ) | 21,203 | (2,903,132 | ) | |||||||||||
| Impairment of non–current assets | 785,940 | (984,704 | ) | (169,870 | ) | - | (368,634 | ) | ||||||||||||
| Other operating income and expenses, net | (137,836 | ) | (13,652 | ) | 118,905 | (2,872 | ) | (35,455 | ) | |||||||||||
| Operating income (expenses) | 15,899,337 | (757,793 | ) | 7,317,513 | (643 | ) | 22,458,414 | |||||||||||||
| Financial result, net | ||||||||||||||||||||
| Financial income | 1,099,893 | 147,689 | 110,898 | (228,917 | ) | 1,129,563 | ||||||||||||||
| Financial expenses | (2,038,312 | ) | (1,295,528 | ) | (407,589 | ) | 229,268 | (3,512,161 | ) | |||||||||||
| Foreign exchange gain (loss), net | 868,479 | (517,410 | ) | 21,154 | - | 372,223 | ||||||||||||||
| (69,940 | ) | (1,665,249 | ) | (275,537 | ) | 351 | (2,010,375 | ) | ||||||||||||
| Share of profits of associates and joint ventures | 135,265 | 27,730 | 2,841 | - | 165,836 | |||||||||||||||
| Income before tax | 15,964,662 | (2,395,312 | ) | 7,044,817 | (292 | ) | 20,613,875 | |||||||||||||
| Income tax | (6,096,591 | ) | 420,224 | (2,582,118 | ) | - | (8,258,485 | ) | ||||||||||||
| Net profit (loss) for the period | 9,868,071 | (1,975,088 | ) | 4,462,699 | (292 | ) | 12,355,390 | |||||||||||||
| Profit (loss) attributable to: | ||||||||||||||||||||
| Group owners of parent | 9,930,519 | (1,973,075 | ) | 3,424,234 | (292 | ) | 11,381,386 | |||||||||||||
| Non–controlling interest | (62,448 | ) | (2,013 | ) | 1,038,465 | - | 974,004 | |||||||||||||
| 9,868,071 | (1,975,088 | ) | 4,462,699 | (292 | ) | 12,355,390 | ||||||||||||||
| Supplementary information | ||||||||||||||||||||
| Depreciation, depletion and amortization | 5,248,364 | 1,307,216 | 1,149,270 | – | 7,704,850 | |||||||||||||||
Ecopetrol S.A.
Notes to the consolidated financial statements
(Figures expressed in millions of Colombian pesos, unless otherwise stated)
| For the year ended on December 31, 2017 | ||||||||||||||||||||
| Exploration and Production | Refining and Petrochemicals | Transport and Logistics | Eliminations | Total | ||||||||||||||||
| Third–party sales | 25,004,320 | 27,343,359 | 3,606,549 | – | 55,954,228 | |||||||||||||||
| Inter–segment sales | 11,490,614 | 1,300,657 | 6,991,515 | (19,782,786 | ) | – | ||||||||||||||
| Total sales revenue | 36,494,934 | 28,644,016 | 10,598,064 | (19,782,786 | ) | 55,954,228 | ||||||||||||||
| Fixed costs | 8,055,925 | 2,886,745 | 2,637,604 | (3,239,880 | ) | 10,340,394 | ||||||||||||||
| Variable costs | 18,254,159 | 23,968,650 | 634,231 | (16,289,109 | ) | 26,567,931 | ||||||||||||||
| Cost of sales | 26,310,084 | 26,855,395 | 3,271,835 | (19,528,989 | ) | 36,908,325 | ||||||||||||||
| Gross profit | 10,184,850 | 1,788,621 | 7,326,229 | (253,797 | ) | 19,045,903 | ||||||||||||||
| Administrative expenses | 781,386 | 516,501 | 466,669 | (32 | ) | 1,764,524 | ||||||||||||||
| Operation and project expenses | 2,070,916 | 965,457 | 142,847 | (253,155 | ) | 2,926,065 | ||||||||||||||
| Impairment of non–current assets | (183,718 | ) | (1,067,965 | ) | (59,455 | ) | – | (1,311,138 | ) | |||||||||||
| Other operating income and expenses, net | (545,218 | ) | 11,694 | 28,121 | – | (505,403 | ) | |||||||||||||
| Operating income (expenses) | 8,061,484 | 1,362,934 | 6,748,047 | (610 | ) | 16,171,855 | ||||||||||||||
| Financial result, net | ||||||||||||||||||||
| Financial income | 1,062,393 | 164,006 | 106,659 | (173,702 | ) | 1,159,356 | ||||||||||||||
| Financial expenses | (2,288,576 | ) | (1,110,874 | ) | (434,664 | ) | 173,513 | (3,660,601 | ) | |||||||||||
| Foreign exchange gain (loss), net | (101,030 | ) | 163,992 | (57,448 | ) | – | 5,514 | |||||||||||||
| (1,327,213 | ) | (782,876 | ) | (385,453 | ) | (189 | ) | (2,495,731 | ) | |||||||||||
| Share of profits of associates and joint ventures | 120,786 | 15,245 | (42,493 | ) | – | 93,538 | ||||||||||||||
| Income before tax | 6,855,057 | 595,303 | 6,320,101 | (799 | ) | 13,769,662 | ||||||||||||||
| Income tax | (3,034,556 | ) | (238,625 | ) | (2,527,087 | ) | – | (5,800,268 | ) | |||||||||||
| Net profit (loss) for the period | 3,820,501 | 356,678 | 3,793,014 | (799 | ) | 7,969,394 | ||||||||||||||
| Profit (loss) attributable to: | ||||||||||||||||||||
| Group owners of parent | 3,820,501 | 358,859 | 2,999,978 | (799 | ) | 7,178,539 | ||||||||||||||
| Non–controlling interest | – | (2,181 | ) | 793,036 | – | 790,855 | ||||||||||||||
| 3,820,501 | 356,678 | 3,793,014 | (799 | ) | 7,969,394 | |||||||||||||||
| Supplementary information | ||||||||||||||||||||
| Depreciation, depletion and amortization | 5,981,294 | 1,188,871 | 1,111,182 | – | 8,281,347 | |||||||||||||||
| For the year ended December 31, 2016 | ||||||||||||||||||||
| Exploration and Production | Refining and Petrochemicals | Transportation and Logistics | Eliminations | Total | ||||||||||||||||
| Third–party sales | 20,527,332 | 24,194,024 | 3,764,205 | – | 48,485,561 | |||||||||||||||
| Inter–segment sales | 7,693,878 | 629,690 | 6,884,571 | (15,208,139 | ) | – | ||||||||||||||
| Total sales revenue | 28,221,210 | 24,823,714 | 10,648,776 | (15,208,139 | ) | 48,485,561 | ||||||||||||||
| Fixed cost | 6,940,074 | 2,458,745 | 2,861,269 | (2,968,780 | ) | 9,291,308 | ||||||||||||||
| Variable cost | 16,032,574 | 20,385,242 | 488,522 | (11,946,223 | ) | 24,960,115 | ||||||||||||||
| Cost of sales | 22,972,648 | 22,843,987 | 3,349,791 | (14,915,003 | ) | 34,251,423 | ||||||||||||||
| Gross profit | 5,248,562 | 1,979,727 | 7,298,985 | (293,136 | ) | 14,234,138 | ||||||||||||||
| Administrative expenses | 832,266 | 574,413 | 516,884 | (295 | ) | 1,923,268 | ||||||||||||||
| Operation and projects expenses | 1,656,960 | 1,206,718 | 180,353 | (292,344 | ) | 2,751,687 | ||||||||||||||
| Impairment of non–current assets | 196,448 | 773,361 | (41,062 | ) | – | 928,747 | ||||||||||||||
| Other operating income and expenses, net | (349,419 | ) | 20,947 | 53,559 | 801 | (274,112 | ) | |||||||||||||
| Operating income (expenses) | 2,912,307 | (595,712 | ) | 6,589,251 | (1,298 | ) | 8,904,548 | |||||||||||||
| Financial result, net | ||||||||||||||||||||
| Financial income | 983,472 | 46,469 | 61,373 | 220,429 | 1,311,743 | |||||||||||||||
| Financial expenses | (2,017,641 | ) | (952,006 | ) | (262,844 | ) | (231,049 | ) | (3,463,540 | ) | ||||||||||
| Foreign exchange gain (loss), net | 923,573 | 94,715 | (41,858 | ) | – | 976,430 | ||||||||||||||
| (110,596 | ) | (810,822 | ) | (243,329 | ) | (10,620 | ) | (1,175,367 | ) | |||||||||||
| Share of profit of associates and joint ventures | 39,397 | 22,785 | (837 | ) | – | 61,345 | ||||||||||||||
| Income before tax | 2,841,108 | (1,383,749 | ) | 6,345,085 | (11,918 | ) | 7,790,526 | |||||||||||||
| Income tax | (1,518,738 | ) | (446,595 | ) | (2,577,713 | ) | – | (4,543,046 | ) | |||||||||||
| Net profit (loss) for the period | 1,322,370 | (1,830,344 | ) | 3,767,372 | (11,918 | ) | 3,247,480 | |||||||||||||
| Income attributable to: | ||||||||||||||||||||
| Group owners of parent | 1,322,370 | (1,823,020 | ) | 2,960,449 | (11,918 | ) | 2,447,881 | |||||||||||||
| Non–controlling interest | – | (7,324 | ) | 806,923 | – | 799,599 | ||||||||||||||
| 1,322,370 | (1,830,344 | ) | 3,767,372 | (11,918 | ) | 3,247,480 | ||||||||||||||
| Supplementary information | ||||||||||||||||||||
| Depreciation, depletion and amortization | 5,482,827 | 1,145,780 | 978,393 | – | 7,607,000 | |||||||||||||||
F-97
Ecopetrol S.A. Notes to the consolidated financial statements (Figures expressed in millions of Colombian pesos, unless otherwise stated) |
| For the year ended December 31, 2016 | ||||||||||||||||||||
| Exploration and production | Refining and petrochemicals | Transportation and logistics | Eliminations | Total | ||||||||||||||||
| Third-party sales | 20,527,332 | 24,194,024 | 3,764,205 | - | 48,485,561 | |||||||||||||||
| Inter-segment sales | 7,693,878 | 629,690 | 6,884,571 | (15,208,139 | ) | - | ||||||||||||||
| Total sales revenue | 28,221,210 | 24,823,714 | 10,648,776 | (15,208,139 | ) | 48,485,561 | ||||||||||||||
| Fixed cost | 6,940,074 | 2,458,745 | 2,861,269 | (2,968,780 | ) | 9,291,308 | ||||||||||||||
| Variable cost | 16,032,574 | 20,385,242 | 488,522 | (11,946,223 | ) | 24,960,115 | ||||||||||||||
| Cost of sales | 22,972,648 | 22,843,987 | 3,349,791 | (14,915,003 | ) | 34,251,423 | ||||||||||||||
| Gross profit | 5,248,562 | 1,979,727 | 7,298,985 | (293,136 | ) | 14,234,138 | ||||||||||||||
| Administration expenses | 832,266 | 574,413 | 516,884 | (295 | ) | 1,923,268 | ||||||||||||||
| Operation and projects expenses | 1,656,960 | 1,206,718 | 180,353 | (292,344 | ) | 2,751,687 | ||||||||||||||
| Impairment of non-current assets | 196,448 | 773,361 | (41,062 | ) | - | 928,747 | ||||||||||||||
| Other operating income and expenses, net | (349,419 | ) | 20,947 | 53,559 | 801 | (274,112 | ) | |||||||||||||
| Operating income | 2,912,307 | (595,712 | ) | 6,589,251 | (1,298 | ) | 8,904,548 | |||||||||||||
| Financial result, net | ||||||||||||||||||||
| Financial income | 983,472 | 46,469 | 61,373 | 220,429 | 1,311,743 | |||||||||||||||
| Financial expenses | (2,017,641 | ) | (952,006 | ) | (262,844 | ) | (231,049 | ) | (3,463,540 | ) | ||||||||||
| Foreign exchange gain (loss), net | 923,573 | 94,715 | (41,858 | ) | - | 976,430 | ||||||||||||||
| (110,596 | ) | (810,822 | ) | (243,329 | ) | (10,620 | ) | (1,175,367 | ) | |||||||||||
| Share of profit of associates | 39,397 | 22,785 | (837 | ) | - | 61,345 | ||||||||||||||
| Income before tax | 2,841,108 | (1,383,749 | ) | 6,345,085 | (11,918 | ) | 7,790,526 | |||||||||||||
| Income tax | (1,518,738 | ) | (446,595 | ) | (2,577,713 | ) | - | (4,543,046 | ) | |||||||||||
| Net income for the period | 1,322,370 | (1,830,344 | ) | 3,767,372 | (11,918 | ) | 3,247,480 | |||||||||||||
| Income attributable to: | ||||||||||||||||||||
| Company’s shareholders | 1,322,370 | (1,823,020 | ) | 2,960,449 | (11,918 | ) | 2,447,881 | |||||||||||||
| Non-controlling interests | - | (7,324 | ) | 806,923 | - | 799,599 | ||||||||||||||
| 1,322,370 | (1,830,344 | ) | 3,767,372 | (11,918 | ) | 3,247,480 | ||||||||||||||
| Supplementary information | ||||||||||||||||||||
| Depreciation, depletion and amortization | 5,482,827 | 1,145,780 | 978,394 | - | 7,607,001 | |||||||||||||||
|
| For the year ended December 31, 2015 | ||||||||||||||||||||
| Exploration and production | Refining and petrochemicals | Transportation and logistics | Eliminations | Total | ||||||||||||||||
| Third-party sales | 25,669,213 | 22,456,866 | 4,221,192 | - | 52,347,271 | |||||||||||||||
| Inter-segment sales | 6,063,398 | 788,810 | 6,623,358 | (13,475,566 | ) | - | ||||||||||||||
| Total Revenue | 31,732,611 | 23,245,676 | 10,844,550 | (13,475,566 | ) | 52,347,271 | ||||||||||||||
| Fixed costs | 7,208,632 | 1,902,797 | 3,304,815 | (2,790,793 | ) | 9,625,451 | ||||||||||||||
| Variable costs | 18,500,240 | 18,856,011 | 439,607 | (10,426,793 | ) | 27,369,065 | ||||||||||||||
| Cost of sales | 25,708,872 | 20,758,808 | 3,744,422 | (13,217,586 | ) | 36,994,516 | ||||||||||||||
| Gross income | 6,023,739 | 2,486,868 | 7,100,128 | (257,980 | ) | 15,352,755 | ||||||||||||||
| Administration expenses | 731,626 | 451,250 | 518,109 | - | 1,700,985 | |||||||||||||||
| Operation and projects expenses | 2,969,723 | 1,155,301 | 157,596 | (248,352 | ) | 4,034,268 | ||||||||||||||
| Impairment of non-current assets | 4,504,497 | 3,278,993 | 81,388 | 7,864,878 | ||||||||||||||||
| Other operating income and expenses, net | (399,954 | ) | 122,595 | (101,182 | ) | - | (378,541 | ) | ||||||||||||
| Operating income | (1,782,153 | ) | (2,521,271 | ) | 6,444,217 | (9,628 | ) | 2,131,165 | ||||||||||||
| Finance results, net | ||||||||||||||||||||
| Financial income | 536,121 | 135,622 | 86,568 | (136,387 | ) | 621,924 | ||||||||||||||
| Financial expenses | (1,774,090 | ) | (451,906 | ) | (492,485 | ) | 67 | (2,718,414 | ) | |||||||||||
| Foreign exchange gain (loss), net | (4,798,741 | ) | (949,176 | ) | 181,303 | - | (5,566,614 | ) | ||||||||||||
| (6,036,710 | ) | (1,265,460 | ) | (224,614 | ) | (136,320 | ) | (7,663,104 | ) | |||||||||||
| Share of profit of companies | (70,407 | ) | 23,187 | 533 | - | (46,687 | ) | |||||||||||||
| Income before tax | (7,889,270 | ) | (3,763,544 | ) | 6,220,136 | (145,948 | ) | (5,578,626 | ) | |||||||||||
| Income tax | 2,037,650 | (257,256 | ) | (2,490,747 | ) | - | (710,353 | ) | ||||||||||||
| Net income (loss) for the period | (5,851,620 | ) | (4,020,800 | ) | 3,729,389 | (145,948 | ) | (6,288,979 | ) | |||||||||||
| Income attributable to: | ||||||||||||||||||||
| Owners of the Company | (5,851,620 | ) | (4,016,050 | ) | 2,819,759 | (145,948 | ) | (7,193,859 | ) | |||||||||||
| Non-controlling interests | - | (4,750 | ) | 909,630 | - | 904,880 | ||||||||||||||
| (5,851,620 | ) | (4,020,800 | ) | 3,729,389 | (145,948 | ) | (6,288,979 | ) | ||||||||||||
| Supplementary information | ||||||||||||||||||||
| Depreciation, depletion and amortization | 5,318,587 | 570,033 | 881,738 | - | 6,770,358 | |||||||||||||||
|
| For the year ended December 31, 2014 | ||||||||||||||||||||
| Exploration and production | Refining and petrochemicals | Transportation and logistics | Eliminations | Total | ||||||||||||||||
| Third-party sales | 35,903,045 | 26,612,204 | 3,456,639 | - | 65,971,888 | |||||||||||||||
| Inter-segment sales | 9,252,146 | 560,096 | 4,887,295 | (14,699,537 | ) | - | ||||||||||||||
| Total Revenue | 45,155,191 | 27,172,300 | 8,343,934 | (14,699,537 | ) | 65,971,888 | ||||||||||||||
| Fixed costs | 6,788,549 | 1,888,558 | 3,538,797 | (1,981,744 | ) | 10,234,160 | ||||||||||||||
| Variable costs | 21,139,234 | 23,648,670 | 402,255 | (12,449,191 | ) | 32,740,968 | ||||||||||||||
| Cost of sales | 27,927,783 | 25,537,228 | 3,941,052 | (14,430,935 | ) | 42,975,128 | ||||||||||||||
| Gross income | 17,227,408 | 1,635,072 | 4,402,882 | (268,602 | ) | 22,996,760 | ||||||||||||||
| Administration expenses | 335,432 | 354,221 | 341,523 | (141 | ) | 1,031,035 | ||||||||||||||
| Operation and projects expenses | 4,288,108 | 1,039,695 | 380,940 | (188,418 | ) | 5,520,325 | ||||||||||||||
| Impairment of non-current assets | 965,607 | 1,340,086 | (1,121 | ) | - | 2,304,572 | ||||||||||||||
| Other operating income and expenses, net | (285,821 | ) | 12,490 | (36,643 | ) | 1,775 | (308,199 | ) | ||||||||||||
| Operating income | 11,924,082 | (1,111,420 | ) | 3,718,183 | (81,818 | ) | 14,449,027 | |||||||||||||
| Finance results, net | ||||||||||||||||||||
| Financial income | 251,902 | 113,237 | 127,262 | (92,583 | ) | 399,818 | ||||||||||||||
| Financial expenses | (837,510 | ) | (306,174 | ) | (496,615 | ) | 5 | (1,640,294 | ) | |||||||||||
| Foreign exchange gain (loss), net | (2,243,938 | ) | (309,449 | ) | 283,194 | - | (2,270,193 | ) | ||||||||||||
| (2,829,546 | ) | (502,386 | ) | (86,159 | ) | (92,578 | ) | (3,510,669 | ) | |||||||||||
| Share of profit of companies | 154,816 | 11,254 | - | - | 166,070 | |||||||||||||||
| Income before tax | 9,249,352 | (1,602,552 | ) | 3,632,024 | (174,396 | ) | 11,104,428 | |||||||||||||
| Income tax | (4,159,511 | ) | (29,251 | ) | (1,246,093 | ) | - | (5,434,855 | ) | |||||||||||
| Net income for the period | 5,089,841 | (1,631,803 | ) | 2,385,931 | (174,396 | ) | 5,669,573 | |||||||||||||
| Income attributable to: | ||||||||||||||||||||
| Owners of the Company | 5,089,841 | (1,627,705 | ) | 1,758,777 | (174,396 | ) | 5,046,517 | |||||||||||||
| Non-controlling interests | - | (4,098 | ) | 627,154 | - | 623,056 | ||||||||||||||
| 5,089,841 | (1,631,803 | ) | 2,385,931 | (174,396 | ) | 5,669,573 | ||||||||||||||
| Supplementary information | ||||||||||||||||||||
| Depreciation, depletion and amortization | 5,172,743 | 548,539 | 695,925 | - | 6,417,207 | |||||||||||||||
|
| Sales by product |
The sales by product offor each of the segmentssegment are detailed below for the years ended December 31, 2016, 20152018, 2017 and 2014:2016:
| For the year ended December 31, 2016 | ||||||||||||||||||||||||||||||||||||||||
| Exploration and production | Refining and petrochemicals | Transportation and logistics | Eliminations | Total | For the year ended on December 31, 2018 | |||||||||||||||||||||||||||||||||||
| Exploration and Production | Refining and Petrochemicals | Transport and Logistics | Eliminations | Total | ||||||||||||||||||||||||||||||||||||
| Local sales | ||||||||||||||||||||||||||||||||||||||||
| Med-distillates | - | 8,553,503 | - | - | 8,553,503 | |||||||||||||||||||||||||||||||||||
| Mid–distillates | 725 | 11,662,476 | - | (77,009 | ) | 11,586,192 | ||||||||||||||||||||||||||||||||||
| Gasoline and turbo fuel | - | 6,465,939 | - | (373,200 | ) | 6,092,739 | - | 9,690,113 | - | (1,737,261 | ) | 7,952,852 | ||||||||||||||||||||||||||||
| Services | 73,247 | 41,736 | 10,572,170 | (6,643,869 | ) | 4,043,284 | ||||||||||||||||||||||||||||||||||
| Transport service | 37,279 | 36,321 | 11,089,012 | (7,631,208 | ) | 3,531,404 | ||||||||||||||||||||||||||||||||||
| Natural gas | 2,383,323 | 11,763 | - | (406,750 | ) | 1,988,336 | 2,535,658 | - | - | (649,812 | ) | 1,885,846 | ||||||||||||||||||||||||||||
| Plastic and rubber | - | 724,708 | - | - | 724,708 | - | 822,367 | - | - | 822,367 | ||||||||||||||||||||||||||||||
| L.P.G. and propane | 90,783 | 319,644 | - | (4,558 | ) | 405,869 | ||||||||||||||||||||||||||||||||||
| Crude oil | 5,284,554 | - | - | (4,730,888 | ) | 553,666 | ||||||||||||||||||||||||||||||||||
| Asphalts | 31,277 | 309,123 | - | - | 340,400 | |||||||||||||||||||||||||||||||||||
| Crude | 20,142,527 | - | - | (19,592,048 | ) | 550,479 | ||||||||||||||||||||||||||||||||||
| LPG and propane | 245,875 | 329,569 | - | (805 | ) | 574,639 | ||||||||||||||||||||||||||||||||||
| Fuel oil | 20,391 | 489,091 | - | - | 509,482 | |||||||||||||||||||||||||||||||||||
| Asphats | 26,406 | 309,020 | - | - | 335,426 | |||||||||||||||||||||||||||||||||||
| Aromatics | - | 186,228 | - | - | 186,228 | - | 282,545 | - | - | 282,545 | ||||||||||||||||||||||||||||||
| Oil fuel | 1,382 | 146,866 | - | - | 148,248 | |||||||||||||||||||||||||||||||||||
| Polyethylene | - | 270,887 | - | - | 270,887 | |||||||||||||||||||||||||||||||||||
| Services | 103,522 | 190,612 | 265,059 | (319,783 | ) | 239,410 | ||||||||||||||||||||||||||||||||||
| Other income gas contracts | 156,031 | - | - | - | 156,031 | |||||||||||||||||||||||||||||||||||
| Other products | 424,952 | 669,568 | 75,793 | (510,144 | ) | 660,169 | 11,484 | 604,530 | - | (126,507 | ) | 489,507 | ||||||||||||||||||||||||||||
| 8,289,518 | 17,429,078 | 10,647,963 | (12,669,409 | ) | 23,697,150 | 23,279,898 | 24,687,531 | 11,354,071 | (30,134,433 | ) | 29,187,067 | |||||||||||||||||||||||||||||
| Recognition of price differential | - | 1,048,022 | - | - | 1,048,022 | - | 3,835,533 | - | - | 3,835,533 | ||||||||||||||||||||||||||||||
| 8,289,518 | 18,477,100 | 10,647,963 | (12,669,409 | ) | 24,745,172 | 23,279,898 | 28,523,064 | 11,354,071 | (30,134,433 | ) | 33,022,600 | |||||||||||||||||||||||||||||
| Foreign sales | ||||||||||||||||||||||||||||||||||||||||
| Crude | 19,516,197 | - | - | (2,237,618 | ) | 17,278,579 | 26,898,737 | - | - | - | 26,898,737 | |||||||||||||||||||||||||||||
| Oil fuel | - | 2,158,539 | - | - | 2,158,539 | |||||||||||||||||||||||||||||||||||
| Med-distillates | 1,594,945 | - | - | 1,594,945 | ||||||||||||||||||||||||||||||||||||
| Diesel | - | 3,050,839 | - | - | 3,050,839 | |||||||||||||||||||||||||||||||||||
| Fuel oil | - | 2,053,594 | - | - | 2,053,594 | |||||||||||||||||||||||||||||||||||
| Gasoline and turbo fuels | - | 1,782,194 | - | - | 1,782,194 | |||||||||||||||||||||||||||||||||||
| Plastic and rubber | - | 1,171,342 | - | - | 1,171,342 | - | 1,268,582 | - | - | 1,268,582 | ||||||||||||||||||||||||||||||
| Gasoline and turbo fuel | 1,046,758 | - | - | 1,046,758 | ||||||||||||||||||||||||||||||||||||
| Natural gas | 350,685 | - | - | (291,875 | ) | 58,810 | 27,899 | - | - | - | 27,899 | |||||||||||||||||||||||||||||
| L.P.G. and propane | 6,342 | 2,225 | - | - | 8,567 | |||||||||||||||||||||||||||||||||||
| Cash flow hedging – Reclassification to profit or loss | 33,074 | - | - | - | 33,074 | |||||||||||||||||||||||||||||||||||
| LPG and propane | 20,212 | - | - | - | 20,212 | |||||||||||||||||||||||||||||||||||
| Cash flow hedge for future exports – Reclassification to profit or loss | 128,404 | - | - | - | 128,404 | |||||||||||||||||||||||||||||||||||
| Other products | 25,395 | 363,250 | 814 | 316 | 389,775 | 17,614 | 333,101 | 96 | - | 350,811 | ||||||||||||||||||||||||||||||
| 19,931,693 | 6,337,059 | 814 | (2,529,177 | ) | 23,740,389 | 27,092,866 | 8,488,310 | 96 | - | 35,581,272 | ||||||||||||||||||||||||||||||
| Total sales revenue | 28,221,211 | 24,814,159 | 10,648,777 | (15,198,586 | ) | 48,485,561 | ||||||||||||||||||||||||||||||||||
| 50,372,764 | 37,011,374 | 11,354,167 | (30,134,433 | ) | 68,603,872 | |||||||||||||||||||||||||||||||||||
Ecopetrol S.A. Notes to the consolidated financial statements (Figures expressed in millions of Colombian pesos, unless otherwise stated) |
| For the year ended on December 31, 2017 | ||||||||||||||||||||||||||||||||||||||||
| Exploration and production | Refining and petrochemicals | Transportation and logistics | Eliminations | Total | Exploration and Production | Refining and Petrochemicals | Transport and Logistics | Eliminations | Total | |||||||||||||||||||||||||||||||
| Local sales | ||||||||||||||||||||||||||||||||||||||||
| Med-distillates | 25,782 | 10,206,599 | - | (17,157 | ) | 10,215,224 | ||||||||||||||||||||||||||||||||||
| Gasoline | - | 6,464,661 | - | (336,453 | ) | 6,128,208 | ||||||||||||||||||||||||||||||||||
| Mid–distillates | 1,334 | 9,588,992 | - | - | 9,590,326 | |||||||||||||||||||||||||||||||||||
| Gasoline and turbo fuel | - | 8,052,289 | - | (1,062,102 | ) | 6,990,187 | ||||||||||||||||||||||||||||||||||
| Transport service | 41,157 | 41,998 | 10,277,921 | (6,771,523 | ) | 3,589,553 | ||||||||||||||||||||||||||||||||||
| Natural gas | 2,540,233 | 4 | - | (724,483 | ) | 1,815,754 | ||||||||||||||||||||||||||||||||||
| Plastic and rubber | - | 833,982 | - | - | 833,982 | |||||||||||||||||||||||||||||||||||
| Crude | 11,668,529 | - | - | (10,758,658 | ) | 909,871 | ||||||||||||||||||||||||||||||||||
| LPG and propane | 199,796 | 309,823 | - | - | 509,619 | |||||||||||||||||||||||||||||||||||
| Fuel oil | 14,758 | 339,300 | - | - | 354,058 | |||||||||||||||||||||||||||||||||||
| Asphats | 34,834 | 240,969 | - | - | 275,803 | |||||||||||||||||||||||||||||||||||
| Aromatics | - | 217,418 | - | - | 217,418 | |||||||||||||||||||||||||||||||||||
| Polyethylene | - | 167,348 | - | - | 167,348 | |||||||||||||||||||||||||||||||||||
| Services | 118,812 | 198,369 | 10,822,078 | (6,703,985 | ) | 4,435,274 | 140,227 | 179,912 | 319,776 | (356,116 | ) | 283,799 | ||||||||||||||||||||||||||||
| Natural gas | 2,198,284 | - | - | (352,939 | ) | 1,845,345 | ||||||||||||||||||||||||||||||||||
| Crude oil | 5,847,368 | - | - | (5,356,089 | ) | 491,279 | ||||||||||||||||||||||||||||||||||
| Diesel and asphalts | 49,583 | 411,605 | - | - | 461,188 | |||||||||||||||||||||||||||||||||||
| Plastic and rubber | - | 724,392 | - | - | 724,392 | |||||||||||||||||||||||||||||||||||
| L.P.G. and propane | 154,201 | 190,346 | - | (9,053 | ) | 335,494 | ||||||||||||||||||||||||||||||||||
| Other income gas contracts | 188,195 | - | - | - | 188,195 | |||||||||||||||||||||||||||||||||||
| Other products | 262,906 | 1,070,725 | 22,472 | (367,757 | ) | 988,346 | 11,107 | 379,023 | - | (109,904 | ) | 280,226 | ||||||||||||||||||||||||||||
| 8,656,936 | 19,266,697 | 10,844,550 | (13,143,433 | ) | 25,624,750 | 14,840,170 | 20,351,058 | 10,597,697 | (19,782,786 | ) | 26,006,139 | |||||||||||||||||||||||||||||
| Recognition of price differential | - | 441,871 | - | - | 441,871 | - | 2,229,953 | - | - | 2,229,953 | ||||||||||||||||||||||||||||||
| 8,656,936 | 19,708,568 | 10,844,550 | (13,143,433 | ) | 26,066,621 | 14,840,170 | 22,581,011 | 10,597,697 | (19,782,786 | ) | 28,236,092 | |||||||||||||||||||||||||||||
| Foreign sales | ||||||||||||||||||||||||||||||||||||||||
| Crude | 21,495,762 | - | - | (314,497 | ) | 21,181,265 | 21,426,666 | 52,397 | - | - | 21,479,063 | |||||||||||||||||||||||||||||
| Diesel | - | 1,213,740 | - | - | 1,213,740 | |||||||||||||||||||||||||||||||||||
| Fuel oil | - | 2,166,469 | - | - | 2,166,469 | - | 1,982,408 | - | - | 1,982,408 | ||||||||||||||||||||||||||||||
| Trading of crude | 1,309,196 | 1,309,196 | ||||||||||||||||||||||||||||||||||||||
| Gasoline and turbo fuels | - | 1,223,994 | - | - | 1,223,994 | |||||||||||||||||||||||||||||||||||
| Plastic and rubber | - | 1,169,101 | - | - | 1,169,101 | |||||||||||||||||||||||||||||||||||
| Natural gas | 233,500 | - | - | (50,550 | ) | 182,950 | 32,303 | - | - | - | 32,303 | |||||||||||||||||||||||||||||
| Gasoline and turbo fuel | 27,756 | 65,369 | - | - | 93,125 | |||||||||||||||||||||||||||||||||||
| Diesel | - | 81,982 | - | - | 81,982 | |||||||||||||||||||||||||||||||||||
| Plastic and rubber | - | 1,096,730 | - | - | 1,096,730 | |||||||||||||||||||||||||||||||||||
| Cash flow hedging – Reclassification to profit or loss | 7,646 | - | - | - | 7,646 | |||||||||||||||||||||||||||||||||||
| Other products and services | 1,815 | 126,558 | - | 32,914 | 161,287 | |||||||||||||||||||||||||||||||||||
| LPG and propane | 15,631 | - | - | - | 15,631 | |||||||||||||||||||||||||||||||||||
| Cash flow hedge for future exports – Reclassification to profit or loss | 160,772 | - | - | - | 160,772 | |||||||||||||||||||||||||||||||||||
| Other products | 19,392 | 421,365 | 367 | - | 441,124 | |||||||||||||||||||||||||||||||||||
| 23,075,675 | 3,537,108 | - | (332,133 | ) | 26,280,650 | 21,654,764 | 6,063,005 | 367 | - | 27,718,136 | ||||||||||||||||||||||||||||||
| Total revenue | 31,732,611 | 23,245,676 | 10,844,550 | (13,475,566 | ) | 52,347,271 | ||||||||||||||||||||||||||||||||||
| 36,494,934 | 28,644,016 | 10,598,064 | (19,782,786 | ) | 55,954,228 | |||||||||||||||||||||||||||||||||||
Ecopetrol S.A.
Notes to the consolidated financial statements
(Figures expressed in millions of Colombian pesos, unless otherwise stated)
| Exploration and production | Refining and petrochemicals | Transportation and logistics | Eliminations | Total | ||||||||||||||||
| Local sales | ||||||||||||||||||||
| Med-distillates | 1,241 | 11,982,214 | - | - | 11,983,455 | |||||||||||||||
| Gasoline | - | 6,979,197 | - | (584,775 | ) | 6,394,422 | ||||||||||||||
| Services | 245,798 | 152,267 | 8,324,753 | (4,944,745 | ) | 3,778,073 | ||||||||||||||
| Natural gas | 1,580,941 | - | - | (234,316 | ) | 1,346,625 | ||||||||||||||
| Crude oil | 9,487,864 | - | - | (8,274,146 | ) | 1,213,718 | ||||||||||||||
| Diesel and asphalts | 46,336 | 412,736 | - | - | 459,072 | |||||||||||||||
| Plastic and rubber | - | 667,563 | - | - | 667,563 | |||||||||||||||
| L.P.G. and propane | 181,806 | 248,578 | - | (3,934 | ) | 426,450 | ||||||||||||||
| Other products | 102,696 | 812,510 | 19,181 | 66,934 | 1,001,321 | |||||||||||||||
| 11,646,682 | 21,255,065 | 8,343,934 | (13,974,982 | ) | 27,270,699 | |||||||||||||||
| Recognition of price differential | 485,409 | - | - | 485,409 | ||||||||||||||||
| 11,646,682 | 21,740,474 | 8,343,934 | (13,974,982 | ) | 27,756,108 | |||||||||||||||
| Foreign sales | ||||||||||||||||||||
| Crude | 31,524,915 | - | - | (689,405 | ) | 30,835,510 | ||||||||||||||
| Fuel oil | - | 3,921,703 | - | - | 3,921,703 | |||||||||||||||
| Trading of crude | 1,486,060 | 1,486,060 | ||||||||||||||||||
| Natural gas | 439,076 | - | - | (15,615 | ) | 423,461 | ||||||||||||||
| Gasoline and turbo fuel | - | 127,090 | - | - | 127,090 | |||||||||||||||
| Diesel | - | 179,738 | - | - | 179,738 | |||||||||||||||
| Plastic and rubber | - | 975,282 | - | - | 975,282 | |||||||||||||||
| Other products and services | 58,458 | 228,013 | - | (19,535 | ) | 266,936 | ||||||||||||||
| 33,508,509 | 5,431,826 | - | (724,555 | ) | 38,215,780 | |||||||||||||||
| Total revenue | 45,155,191 | 27,172,300 | 8,343,934 | (14,699,537 | ) | 65,971,888 | ||||||||||||||
|
| For the year ended on December 31, 2016 | ||||||||||||||||||||
| Exploration and Production | Refining and Petrochemicals | Transport and Logistics | Eliminations | Total | ||||||||||||||||
| Local sales | ||||||||||||||||||||
| Mid–distillates | - | 8,553,503 | - | - | 8,553,503 | |||||||||||||||
| Gasoline and turbo fuel | - | 6,465,939 | - | (373,200 | ) | 6,092,739 | ||||||||||||||
| Transport service | 73,247 | 41,736 | 10,283,338 | (6,580,330 | ) | 3,817,991 | ||||||||||||||
| Natural gas | 2,383,323 | 11,763 | - | (406,750 | ) | 1,988,336 | ||||||||||||||
| Plastic and rubber | - | 724,708 | - | - | 724,708 | |||||||||||||||
| Crude | 5,284,554 | - | - | (4,730,888 | ) | 553,666 | ||||||||||||||
| LPG and propane | 90,783 | 319,643 | - | (4,557 | ) | 405,869 | ||||||||||||||
| Fuel oil | 1,382 | 146,866 | - | - | 148,248 | |||||||||||||||
| Asphats | 31,277 | 309,123 | - | - | 340,400 | |||||||||||||||
| Aromatics | - | 186,228 | - | - | 186,228 | |||||||||||||||
| Polyethylene | 20 | 203,939 | - | - | 203,959 | |||||||||||||||
| Services | 133,429 | 152,028 | 301,088 | (361,252 | ) | 225,293 | ||||||||||||||
| Other income gas contracts | 271,337 | - | - | - | 271,337 | |||||||||||||||
| Other products | 20,165 | 313,603 | 63,537 | (212,432 | ) | 184,873 | ||||||||||||||
| 8,289,517 | 17,429,079 | 10,647,963 | (12,669,409 | ) | 23,697,150 | |||||||||||||||
| Recognition of price differential | - | 1,048,022 | - | - | 1,048,022 | |||||||||||||||
| 8,289,517 | 18,477,101 | 10,647,963 | (12,669,409 | ) | 24,745,172 | |||||||||||||||
| Foreign sales | ||||||||||||||||||||
| Crude | 17,266,094 | - | - | 12,485 | 17,278,579 | |||||||||||||||
| Diesel | - | 1,604,498 | - | - | 1,604,498 | |||||||||||||||
| Fuel oil | - | 2,158,539 | - | - | 2,158,539 | |||||||||||||||
| Gasoline and turbo fuels | - | 1,046,758 | - | - | 1,046,758 | |||||||||||||||
| Plastic and rubber | - | 1,171,342 | - | - | 1,171,342 | |||||||||||||||
| Natural gas | 58,809 | - | - | - | 58,809 | |||||||||||||||
| LPG and propane | 6,343 | 2,225 | - | - | 8,568 | |||||||||||||||
| Cash flow hedge for future exports – Reclassification to profit or loss | 33,074 | - | - | - | 33,074 | |||||||||||||||
| Other products | 2,567,372 | 363,252 | 813 | (2,551,215 | ) | 380,222 | ||||||||||||||
| 19,931,692 | 6,346,614 | 813 | (2,538,730 | ) | 23,740,389 | |||||||||||||||
| 28,221,209 | 24,823,715 | 10,648,776 | (15,208,139 | ) | 48,485,561 | |||||||||||||||
| Capital expenditures by |
The following are the investments amounts of investments made by each segment for the years ended December 31, 2016, 20152018, 2017 and 2014:2016:
| 2018 | Exploration and Production | Refining and Petrochemicals | Transport and Logistics | Total | ||||||||||||
| Property, plant and equipment | 2,071,604 | 702,247 | 529,078 | 3,302,929 | ||||||||||||
| Natural and environmental resources | 5,051,828 | - | - | 5,051,828 | ||||||||||||
| Intangibles | 56,755 | 20,203 | 28,711 | 105,669 | ||||||||||||
7,180,187 | 722,450 | 557,789 | 8,460,426 | |||||||||||||
| 2016 | Exploration and production | Refining and petrochemicals | Transportation and logistics | Total | ||||||||||||||||||||||||||||
| 2017 | Exploration and Production | Refining and Petrochemicals | Transport and Logistics | Total | ||||||||||||||||||||||||||||
| Property, plant and equipment | 1,208,464 | 1,099,850 | 1,338,615 | 3,646,929 | 927,282 | 606,749 | 829,252 | 2,363,283 | ||||||||||||||||||||||||
| Natural and environmental resources | 2,121,295 | - | - | 2,121,295 | 3,568,355 | – | – | 3,568,355 | ||||||||||||||||||||||||
| Intangibles | 53,774 | 10,274 | 5,205 | 69,253 | 154,155 | 4,941 | 16,772 | 175,868 | ||||||||||||||||||||||||
| 3,383,533 | 1,110,124 | 1,343,820 | 5,837,477 | 4,649,792 | 611,690 | 846,024 | 6,107,506 | |||||||||||||||||||||||||
| 2015 | Exploration and production | Refining and petrochemicals | Transportation and logistics | Total | ||||||||||||
| Property, plant and equipment | 2,460,975 | 3,590,279 | 2,497,679 | 8,548,933 | ||||||||||||
| Natural and environmental resources ( Note 2.8) | 6,856,761 | - | - | 6,856,761 | ||||||||||||
| Intangibles | 69,126 | 18,494 | 24,635 | 112,255 | ||||||||||||
| 9,386,862 | 3,608,773 | 2,522,314 | 15,517,949 | |||||||||||||
| 2014 | Exploration and production | Refining and petrochemicals | Transportation and logistics | Total | ||||||||||||||||||||||||||||
| 2016 | Exploration and Production | Refining and Petrochemicals | Transport and Logistics | Total | ||||||||||||||||||||||||||||
| Property, plant and equipment | 3,556,536 | 3,730,289 | 1,636,743 | 8,923,568 | 1,208,464 | 1,099,850 | 1,338,615 | 3,646,929 | ||||||||||||||||||||||||
| Natural and environmental resources (Note 2.8) | 6,601,680 | - | - | 6,601,680 | ||||||||||||||||||||||||||||
| Natural and environmental resources | 2,121,295 | – | – | 2,121,295 | ||||||||||||||||||||||||||||
| Intangibles | 26,610 | 10,636 | 74,772 | 112,018 | 53,774 | 10,274 | 5,205 | 69,253 | ||||||||||||||||||||||||
| 10,184,826 | 3,740,925 | 1,711,515 | 15,637,266 | 3,383,533 | 1,110,124 | 1,343,820 | 5,837,477 | |||||||||||||||||||||||||
F-100
Ecopetrol S.A. Notes to the consolidated financial statements (Figures expressed in millions of Colombian pesos, unless otherwise stated) |
Ecopetrol business group enter into various commitments and contractual obligations that may require future cash payments. The details of the commitments and contractual obligations can be found in section 4.8 Financial Review - Financial Indebtedness and Other Contractual Obligations.
| Subsequent events |
No events subsequent to the date of approval of these Consolidated Financial Statements have been presented.
The Prosecutor’s Office has not yet made public the factual basis for such charges, and accordingly we are not in a position to predict the outcome of the Prosecutor’s Office investigation or the disposition of any charges that the Prosecutor’s Office may bring. Given the early stage of the investigation, it is not possible to assess the probability of any other consequences that might impact the financial statements, such as additional provisions, fines, legal costs, disallowance of tax deductions that may impact the recognition of tax reserves or the carrying amount of deferred tax assets or any other impact that is not known at the present time.
|
| Supplemental information on oil and gas producing activities (unaudited) |
The information in this note is referred to as “unaudited” as a means of clarifying that it is not covered by the audit opinion of the independent registered public accounting firm that has audited and reported on the “Consolidated Financial Statements”.Statements.”
In accordance with the requirements of the United States Securities and Exchange Commission (SEC), Rule 4–10(a) of Regulation S–X, Release 33-8879,33–8879, Accounting Standards Codification 932 and the ASU- 2010-03ASU– 2010–03 “Oil and Gas reserve Estimation and Disclosures” rule, this section provides supplemental information on oil and gas exploration and producing activities of the Company.Ecopetrol Business Group. The information included in sections a)(a) to c)(c) provides historical cost information pertaining to costs incurred in exploration, property acquisitions and development, capitalized costs and results of operations. The information included in sections d)(d) and e)(e) presents information on Ecopetrol’s estimated net proved reserve quantities, standardized measure of estimated discounted future net cash flows related to proved reserves and changes in estimated discounted future net cash flows.
The following information corresponds to Ecopetrol’s oil and gas producing activities as of December 31 2016, 20152018, 2017 and 2014,2016, and includes information related to the Company’sEcopetrol Business Group’s consolidated subsidiaries, as well as its investments the joint ventures Equion Energía Limited and Offshore International Group. The oil and gas exploration and production activities of these two joint ventures are immaterial, as such the corresponding information has not been disclosed separately.
Under the SEC final rule optional disclosure of possible and probable reserves is allowed but, the CompanyEcopetrol Business Group opted not to do so. Ecopetrol estimated its reserves without considering non-traditionalnon–traditional resources.
| Capitalized costs relating to oil and gas exploration and production activities |
| December 31, | ||||||||||||||||||||||||
| 2016 | 2015 | 2014 | 2018 | 2017 | 2016 | |||||||||||||||||||
| Natural and environmental properties | 47,097,475 | 45,789,713 | 40,356,524 | 53,752,436 | 48,129,595 | 47,097,475 | ||||||||||||||||||
| Wells, equipment and facilities – property, plant and equipment | 29,931,039 | 21,822,897 | 17,839,350 | 29,416,081 | 30,405,565 | 29,931,039 | ||||||||||||||||||
| Construction in progress | 6,855,832 | 9,145,198 | 8,110,401 | |||||||||||||||||||||
| Exploration and production projects | 8,463,584 | 6,632,812 | 6,855,832 | |||||||||||||||||||||
| Accumulated depreciation, depletion and amortization | (49,714,944 | ) | (39,743,147 | ) | (32,003,657 | ) | (55,689,222 | ) | (51,791,897 | ) | (49,714,944 | ) | ||||||||||||
| Net capitalized costs | 34,169,402 | 37,014,661 | 34,302,618 | |||||||||||||||||||||
| Net capitalized cost | 35,942,879 | 33,376,075 | 34,169,402 | |||||||||||||||||||||
It includes information of the explorationExploration and productionProduction segment subsidiaries.subsidiaries and joint ventures.
In accordance with IAS 37, costs capitalized to natural and environmental properties include provisions for asset retirement obligations amountingof COP$1,076,116, COP$598,125 and COP$766,909 COP$580,575during 2018, 2017 and COP$1,061,392 during 2016, 2015 and 2014, respectively.
| Costs incurred in oil and gas exploration and developed activities |
Costs incurred are summarized below and include both amounts expensed and capitalized in the corresponding period.
| Year ended December 31 | ||||||||||||
| 2016 | 2015 | 2014 | ||||||||||
| Acquisition of Proved properties | - | - | 16,747 | |||||||||
| Acquisition of unproved properties (1) | - | 357,772 | 263,057 | |||||||||
| Exploration costs | 852,097 | 1,012,264 | 2,036,526 | |||||||||
| Development costs | 2,190,426 | 8,018,131 | 8,189,239 | |||||||||
| Total costs incurred | 3,042,523 | 9,388,167 | 10,505,569 | |||||||||
| 2018 | 2017 | 2016 | ||||||||||
| Acquisition of proved properties(1) | – | 591,875 | – | |||||||||
| Acquisition of unproved properties(2) | 81,295 | 164,180 | – | |||||||||
| Exploration costs | 1,197,946 | 1,095,588 | 852,097 | |||||||||
| Development costs | 6,346,276 | 3,599,385 | 2,190,426 | |||||||||
| 7,625,517 | 5,451,028 | 3,042,523 | ||||||||||
| (1) |
| On September 2018, Ecopetrol Oleo e Gas do Brasil acquired the 20% interest in the Pau Brasil oil field in the Basin of Santos. As of December 2017, the investments were mainly made by Ecopetrol América Inc. in offshore exploration projects of the Warrior and Rydberg wells. |
F-101
|
Ecopetrol S.A.
Notes to the consolidated financial statements
(Figures expressed in millions of Colombian pesos, unless otherwise stated)
| Results of operations for oil and gas exploration and production activities |
The Company’sEcopetrol Business Group’s results of operations from oil and gas exploration and production activities for the years ended December 31, 2016, 20152018, 2017 and 20142016 are as follows:
| 2016 | 2015 | 2014 | ||||||||||
| Net revenues | ||||||||||||
| Sales | 21,322,662 | 26,039,708 | 36,678,579 | |||||||||
| Transfers | 7,734,195 | 5,692,902 | 8,476,612 | |||||||||
| Total | 29,056,857 | 31,732,610 | 45,155,191 | |||||||||
| Production cost (1) | 5,785,950 | 6,006,563 | 6,457,013 | |||||||||
| Depreciation, depletion and amortization (2) | 6,123,914 | 9,887,331 | 6,129,538 | |||||||||
| Other production costs (3) | 12,370,540 | 14,457,836 | 16,406,789 | |||||||||
| Exploration expenses (4) | 730,393 | 1,586,940 | 2,590,778 | |||||||||
| Other expenses (5) | 1,488,143 | 2,711,274 | 2,478,563 | |||||||||
| Total | 26,498,940 | 34,649,944 | 34,062,681 | |||||||||
| Income before income tax | 2,557,918 | (2,917,333 | ) | 11,092,510 | ||||||||
| Income tax expenses | (1,367,357 | ) | (371,376 | ) | (5,428,674 | ) | ||||||
| Results of operations for producing activities | 1,190,561 | (3,288,709 | ) | 5,663,836 | ||||||||
| 2018 | 2017 | 2016 | ||||||||||
| Net revenues | ||||||||||||
| Sales | 39,633,866 | 29,823,565 | 21,322,662 | |||||||||
| Transfers | 11,794,014 | 7,518,216 | 7,734,195 | |||||||||
| 51,427,880 | 37,341,781 | 29,056,857 | ||||||||||
| Production costs(1) | 8,337,413 | 6,535,794 | 5,785,950 | |||||||||
| Depreciation, depletion and amortization(2) | 5,591,774 | 6,349,382 | 5,927,466 | |||||||||
| Other production costs(3) | 18,918,275 | 14,066,593 | 12,370,540 | |||||||||
| Exploration expenses(4) | 1,387,463 | 1,342,952 | 730,393 | |||||||||
| Other expenses(5) | 1,036,983 | 882,743 | 1,684,590 | |||||||||
| 35,271,908 | 29,177,464 | 26,498,939 | ||||||||||
| Income before income tax expense | 16,155,972 | 8,164,317 | 2,557,918 | |||||||||
| Income tax expense | (6,303,251 | ) | (3,678,955 | ) | (1,367,357 | ) | ||||||
| Results of operations for exploration and production activities | 9,852,721 | 4,485,362 | 1,190,561 | |||||||||
| (1) | Production costs are lifting costs incurred to operate and maintain productive wells and related equipment and facilities including costs such as operating labor, materials, supplies, and fuel consumed in operations and the costs of operating natural gas liquids plants. In addition, |
| (2) | In accordance with IAS 37 the expense related to asset retirement obligations that were recognized during |
| (3) | Corresponds to transportation costs and naphtha that are not part of the |
| (4) | Exploration expenses include the costs of geological and geophysical activities, as well as the |
| (5) | Corresponds to administration and marketing expenses. |
During 2018, 2017 and 2016, 2015 and 2014 , the CompanyEcopetrol Business Group transferred approximately 17.7%22.9%, 17.9%20.1% and 18.8%17.7%, respectively, of its crude oil and gas production; (percentages based on the value sales in Colombian pesos) to intercompany business units. Based on volume thoseThose transfers were 51.8%, 48.4% and 46.1%, 37.4%respectively, of crude oil and 38.8%, respectivelygas production volume (including Reficar).
The intercompany transfers were performedrealized at market prices.
|
| Reserve information |
The Ecopetrol Business Group follows international standards for estimating, classifying and reporting reserves framed under SEC definitions. The process is led byCorporate Reserve Management of Ecopetrol, Upstream Management and the Reserves Department which submitsVice-Presidency of Development and Production, present the reportreserves balance to the Board of Directors for approval.
The reserves were auditedestimated at a level of 99% by 2 specialized auditing companies:firms: DeGolyer and MacNaughton and Ryder Scott Company.Company, Gaffney Cline & Associates and Sproule International Limited. According to these certifications the reserves report complies with the content and guidelines set forth in Rule 4-104–10 of Regulation S-XS–X issued by the United States SEC.
The following information relates to the net proven reserves owned by the Ecopetrol Business Group in 2016, 20152018, 2017 and 2014,2016, and corresponds to the official reserves statements prepared by the Company:Ecopetrol Business Group:
Ecopetrol S.A.
Notes to the consolidated financial statements
(Figures expressed in millions of Colombian pesos, unless otherwise stated)
| 2016 | 2015 | 2014 | 2018 | 2017 | 2016 | |||||||||||||||||||||||||||||||||||||||||||||||||||||||||||||||||||
| Oil | Gas | Total | Oil | Gas | Total | Oil | Gas | Total | Oil | Gas | Total | Oil | Gas | Total | Oil | Gas | Total | |||||||||||||||||||||||||||||||||||||||||||||||||||||||
| (Mbls) | (Gpc) | (Mbe) | (Mbls) | (Gpc) | (Mbe) | (Mbls) | (Gpc) | (Mbe) | (Mbls) | (Gpc) | (Mbe) | (Mbls) | (Gpc) | (Mbe) | (Mbls) | (Gpc) | (Mbe) | |||||||||||||||||||||||||||||||||||||||||||||||||||||||
| Proved reserves: | ||||||||||||||||||||||||||||||||||||||||||||||||||||||||||||||||||||||||
| Opening balance | 1,239 | 3,479 | 1,849 | 1,465 | 3,529 | 2,084 | 1,434 | 3,068 | 1,972 | 1,088 | 3,254 | 1,659 | 1,033 | 3,218 | 1,598 | 1,239 | 3,479 | 1,849 | ||||||||||||||||||||||||||||||||||||||||||||||||||||||
| Revisions of previous estimates (1) | (50 | ) | (23 | ) | (54 | ) | (64 | ) | 225 | (25 | ) | 154 | 666 | 270 | 121 | (4 | ) | 121 | 124 | 294 | 175 | (50 | ) | (23 | ) | (54 | ) | |||||||||||||||||||||||||||||||||||||||||||||
| Improved recovery | 11 | 1 | 11 | 16 | 3 | 17 | 33 | - | 34 | 128 | 4 | 129 | 72 | 4 | 73 | 11 | 1 | 11 | ||||||||||||||||||||||||||||||||||||||||||||||||||||||
| Purchases | - | - | - | 3 | 2 | 4 | – | – | – | |||||||||||||||||||||||||||||||||||||||||||||||||||||||||||||||
| Extensions and discoveries | 22 | 25 | 27 | 24 | - | 24 | 41 | 59 | 51 | 54 | 18 | 57 | 44 | – | 43 | 22 | 25 | 27 | ||||||||||||||||||||||||||||||||||||||||||||||||||||||
| Production | (189 | ) | (264 | ) | (235 | ) | (202 | ) | (278 | ) | (251 | ) | (197 | ) | (264 | ) | (243 | ) | (191 | ) | (270 | ) | (239 | ) | (188 | ) | (264 | ) | (234 | ) | (189 | ) | (264 | ) | (235 | ) | ||||||||||||||||||||||||||||||||||||
| Closing balance | 1,033 | 3,218 | 1,598 | 1,239 | 3,479 | 1,849 | 1,465 | 3,529 | 2,084 | 1,200 | 3,002 | 1,727 | 1,088 | 3,254 | 1,659 | 1,033 | 3,218 | 1,598 | ||||||||||||||||||||||||||||||||||||||||||||||||||||||
| Proved developed reserves: | ||||||||||||||||||||||||||||||||||||||||||||||||||||||||||||||||||||||||
| Opening balance | 913 | 3,176 | 1,470 | 1,042 | 3,284 | 1,618 | 933 | 2,663 | 1,400 | 818 | 3,158 | 1,372 | 779 | 3,131 | 1,329 | 913 | 3,176 | 1,470 | ||||||||||||||||||||||||||||||||||||||||||||||||||||||
| Closing balance | 779 | 3,131 | 1,329 | 913 | 3,176 | 1,470 | 1,042 | 3,284 | 1,618 | 883 | 2,882 | 1,389 | 818 | 3,158 | 1,372 | 779 | 3,131 | 1,329 | ||||||||||||||||||||||||||||||||||||||||||||||||||||||
| Proved undeveloped reserves: | ||||||||||||||||||||||||||||||||||||||||||||||||||||||||||||||||||||||||
| Opening balance | 326 | 303 | 379 | 423 | 245 | 466 | 501 | 405 | 572 | 270 | 96 | 287 | 254 | 87 | 269 | 326 | 303 | 379 | ||||||||||||||||||||||||||||||||||||||||||||||||||||||
| Closing balance | 254 | 87 | 269 | 326 | 303 | 379 | 423 | 245 | 466 | 317 | 119 | 338 | 270 | 96 | 287 | 254 | 87 | 269 | ||||||||||||||||||||||||||||||||||||||||||||||||||||||
| (1) |
TheFor additional information about the changes in Proved Reserves and the process for estimating reserves, see section 3.4.3 – Business Overview Business – Exploration and Production – Reserves contains additional information of the process of estimating reserves and main explanations about the changes in Proved Reserves.
| Standardized measure of discounted future net cash flows relating to proved oil and gas quantities and changes therein |
The standardized measure of discounted future net cash flows related to the above proved crude oil and natural gas reserves is calculated in accordance with the requirements of ASU 2010-03.2010–03. Estimated future cash inflows from production under SEC requirements are computed by applying unweighted arithmetic average of the first-day-of-the-monthfirst–day–of–the–month for oil and gas price to year-endyear–end quantities of estimated net proved reserves.reserves, with cost factors based on those at the end of each year, currently enacted tax rates and a 10% annual discount factor. In our view, the information so calculated does not provide a reliable measure of future cash flows from proved reserves, nor does it permit a realistic comparison to be made of one entity with another because the assumptions used cannot reflect the varying circumstances within each entity. In addition, a substantial but unknown proportion of future real cash flows from oil and gas production activities is expected to derive from reserves which have already been discovered, but which cannot yet be regarded as proved.
| 2016 | 2015 | 2014 | 2018 | 2017 | 2016 | |||||||||||||||||||
| Future cash inflows | 140,458,230 | 176,865,586 | 310,138,127 | 275,046,421 | 182,114,282 | 140,458,230 | ||||||||||||||||||
| Future costs | ||||||||||||||||||||||||
| Production | (60,705,779 | ) | (76,363,169 | ) | (107,629,865 | ) | (90,176,326 | ) | (70,159,534 | ) | (60,705,779 | ) | ||||||||||||
| Development | (12,005,835 | ) | (16,498,118 | ) | (23,504,455 | ) | (21,945,453 | ) | (14,860,992 | ) | (12,005,835 | ) | ||||||||||||
| Income tax expenses | (15,400,000 | ) | (30,052,830 | ) | (60,366,272 | ) | ||||||||||||||||||
| Income taxes | (41,102,015 | ) | (23,660,328 | ) | (15,400,000 | ) | ||||||||||||||||||
| Future net cash flow | 52,346,616 | 53,951,469 | 118,637,535 | 121,822,627 | 73,433,428 | 52,346,616 | ||||||||||||||||||
| 10% annual discount for estimated timing of cash flows | (18,221,004 | ) | (19,117,422 | ) | (43,604,395 | ) | ||||||||||||||||||
| Standardized measure of discounted future net cash flows | 34,125,612 | 34,834,047 | 75,033,140 | |||||||||||||||||||||
| 10% discount factor | (35,518,187 | ) | (22,216,583 | ) | (18,221,004 | ) | ||||||||||||||||||
| Standardized measure of discounted net cash flows | 86,304,440 | 51,216,845 | 34,125,612 | |||||||||||||||||||||
Ecopetrol S.A.
Notes to the consolidated financial statements (Figures expressed in millions of Colombian pesos, unless otherwise stated) |
The following are the principal sources of change in the standardized measure of discounted net cash flows in 2016, 20152018, 2017 and 2014:2016:
| 2016 | 2015 | 2014 | ||||||||||
| Net change in sales and transfer prices and in production (lifting) cost related to future production | 3,603,876 | (50,472,025 | ) | 12,924,167 | ||||||||
| Changes in estimated future development costs | (4,767,340 | ) | 592,529 | (10,987,031 | ) | |||||||
| Sales and transfer of oil and gas produced during the period | (23,270,907 | ) | (25,726,047 | ) | (38,698,178 | ) | ||||||
| Net change due to extensions and discoveries | 154,352 | (93,190 | ) | (902,356 | ) | |||||||
| Net change due to purchase and (sales) of minerals in place | (83,450 | ) | - | - | ||||||||
| Net change due to revisions in quantity estimates | (2,570,103 | ) | (985,217 | ) | 18,866,518 | |||||||
| Previously estimated development costs incurred during the period | 5,042,697 | 10,769,369 | 8,702,964 | |||||||||
| Accretion of discount | 5,423,781 | 11,321,221 | 11,018,459 | |||||||||
| Timing and other | 6,394,404 | (4,381,037 | ) | 2,103,078 | ||||||||
| Net change in income taxes | 9,364,255 | 18,775,304 | (1,254,706 | ) | ||||||||
| Aggregate change in the Standardized measure of discounted future net cash flows for the year | (708,435 | ) | (40,199,093 | ) | 1,772,915 | |||||||
|
| 2018 | 2017 | 2016 | ||||||||||
| Net change in sales and transfer prices and in production cost (lifting) related to future production | 79,632,263 | 26,918,170 | 3,603,876 | |||||||||
| Changes in estimated future development costs | (13,141,340 | ) | (1,978,913 | ) | (4,767,340 | ) | ||||||
| Sales and transfer of oil and gas produced, net of production costs | (43,090,467 | ) | (30,805,987 | ) | (23,270,907 | ) | ||||||
| Net change due to extensions, discoveries and improved recovery (1) | 8,496,249 | 3,226,852 | 326,854 | |||||||||
| Net change due to purchase and sales of minerals in place | - | 211,777 | (83,450 | ) | ||||||||
| Net change due to revisions in quantity estimates | 10,163,131 | 9,090,882 | (2,570,103 | ) | ||||||||
| Previously estimated development costs incurred during the period | 12,505,421 | 3,482,570 | 5,042,697 | |||||||||
| Accretion of discount | 6,771,897 | 4,416,512 | 5,423,781 | |||||||||
| Timing and other (1) | (13,633,228 | ) | 8,991,981 | 6,221,902 | ||||||||
| Net change in income taxes | (12,616,331 | ) | (6,462,611 | ) | 9,364,255 | |||||||
| Aggregate change in the standardized measure of discounted future net cash flows for the year | 35,087,595 | 17,091,233 | (708,435 | ) | ||||||||
(1)For comparative purposes, figures as of December 2017 and 2016 were reclassified.
Ecopetrol S.A.
Notes to the consolidated financial statements
(Figures expressed in millions of Colombian pesos, unless otherwise stated)
Exhibit 1 -– Consolidated subsidiaries, associates and joint ventures
Consolidated subsidiary companies associates(1/2)
| Company | Functional currency | Ownership interest Ecopetrol | Activity | Country/ Domicile | Geographic area of operations | Equity | Profit (loss) of the year | Total assets | Total liabilities | ||||||||||||||||||
| Refinería de Cartagena S.A.S. | U.S. dollar | 100 | % | Refining of hydrocarbons, commercialization and distribution of products | Colombia | Colombia | 17,075,400 | (1,479,448 | ) | 26,251,879 | 9,176,479 | ||||||||||||||||
| Cenit Transporte y Logística S.A.S. | Colombian peso | 100 | % | Storage and transport by pipelines of hydrocarbons | Colombia | Colombia | 14,566,611 | 3,566,742 | 16,343,576 | 1,776,965 | |||||||||||||||||
| Oleoducto Central S. A. - Ocensa | U.S. dollar | 72.65 | % | Transportation by crude oil pipelines | Colombia | Colombia | 3,431,369 | 1,976,554 | 6,550,710 | 3,119,341 | |||||||||||||||||
| Ecopetrol Global Energy S.L.U | U.S. dollar | 100 | % | Investment vehicle | Spain | Spain | 2,777,401 | (757,450 | ) | 2,777,806 | 405 | ||||||||||||||||
| Hocol Petroleum Limited - HPL | U.S. dollar | 100 | % | Investment vehicle | Bermuda | Bermuda | 2,602,760 | 210,443 | 2,602,852 | 92 | |||||||||||||||||
| Ecopetrol América Inc. | U.S. dollar | 100 | % | Exploration and exploitation of hydrocarbons | United States | United States | 2,571,983 | (603,957 | ) | 3,015,656 | 443,673 | ||||||||||||||||
| Hocol S.A. | U.S. dollar | 100 | % | Exploration, exploitation and production of hydrocarbons | Cayman Islands | Colombia | 1,843,876 | 208,026 | 2,709,974 | 866,098 | |||||||||||||||||
| Propilco S.A. | U.S. dollar | 100 | % | Production and commercialization of polypropylene resin | Colombia | Colombia | 1,515,393 | 165,670 | 2,024,401 | 509,008 | |||||||||||||||||
| Ecopetrol Capital AG | U.S. dollar | 100 | % | Collection of surpluses from, and providing funds to, companies of the Ecopetrol Business Group. | Switzerland | Switzerland | 1,493,572 | 129,343 | 6,544,222 | 5,050,650 | |||||||||||||||||
| Andean Chemicals Ltd. | U.S. dollar | 100 | % | Investment vehicle | Bermuda | Bermuda | 1,183,536 | (376,664 | ) | 1,184,667 | 1,131 | ||||||||||||||||
| Oleoducto Bicentenario de Colombia S.A.S. | Colombian peso | 55.97 | % | Transportation by crude oil pipelines | Colombia | Colombia | 1,243,689 | 495,107 | 3,464,898 | 2,221,209 | |||||||||||||||||
| Oleoducto de los Llanos Orientales S. A. - ODL | Colombian peso | 65 | % | Transportation by crude oil pipelines | Panama | Colombia | 1,083,479 | 416,347 | 1,887,076 | 803,597 | |||||||||||||||||
F-105
Ecopetrol S.A.
Notes to the consolidated financial statements
(Figures expressed in millions of Colombian pesos, unless otherwise stated)
Consolidated subsidiaries (2/2)
| Company | Functional currency | Ownership interest Ecopetrol | Activity | Country/ Domicile | Geographic area of operations | Equity | Profit (loss) of the year | Total assets | Total liabilities | ||||||||||||||||||
| Black Gold Re Ltd. | U.S. dollar | 100 | % | Reinsurer for companies of the Ecopetrol Business Group | Bermuda | Bermuda | 691,710 | 28,303 | 905,207 | 213,497 | |||||||||||||||||
| Oleoducto de Colombia S.A. – ODC | Colombian peso | 73 | % | Transportation by crude oil pipelines | Colombia | Colombia | 382,937 | 265,460 | 593,387 | 210,450 | |||||||||||||||||
| Bioenergy S.A. | Colombian peso | 99.35 | % | Production of biofuels | Colombia | Colombia | 170,227 | (308,331 | ) | 249,155 | 78,928 | ||||||||||||||||
| COMAI - Compounding and Masterbatching Industry | Colombian peso | 100 | % | Manufacture of polypropylene compounds and masterbatches | Colombia | Colombia | 149,876 | 122,537 | 202,175 | 52,299 | |||||||||||||||||
| Ecopetrol Oleo é Gas do Brasil Ltda. | Brazilian real | 100 | % | Exploration and exploitation of hydrocarbons | Brazil | Brazil | 125,745 | (70,052 | ) | 140,372 | 14,627 | ||||||||||||||||
| Bioenergy Zona Franca S.AS. | Colombian peso | 99.35 | % | Production of biofuels | Colombia | Colombia | 100,297 | (202,061 | ) | 530,651 | 430,354 | ||||||||||||||||
| Ecopetrol del Perú S.A. | U.S. dollar | 100 | % | Exploration and exploitation of hydrocarbons | Peru | Peru | 51,888 | (1,353 | ) | 55,715 | 3,827 | ||||||||||||||||
| ECP Hidrocarburos de México S.A. de CV | U.S. dollar | 100 | % | Offshore exploration | Mexico | Mexico | 25,836 | (80,845 | ) | 42,907 | 17,071 | ||||||||||||||||
| Ecopetrol Costa Afuera S.A.S. | Colombian peso | 100 | % | Offshore exploration | Colombia | Colombia | 12,505 | (4,427 | ) | 31,520 | 19,015 | ||||||||||||||||
| Esenttia Resinas del Perú SAC | U.S. dollar | 100 | % | Commercialization polypropylene resins and masterbatches | Peru | Peru | 4,694 | 404 | 26,517 | 21,823 | |||||||||||||||||
| Ecopetrol Energía S.A.S E.S.P. | Colombian peso | 100 | % | Energy supply service | Colombia | Colombia | 3,414 | 414 | 45,953 | 42,539 | |||||||||||||||||
| Ecopetrol Germany Gmbh (***) | U.S. dollar | 100 | % | Exploration and exploitation of hydrocarbons | Germany | Angola | 2,277 | (254 | ) | 2,632 | 355 | ||||||||||||||||
*** Company in liquidation process.
Ecopetrol S.A.
Notes to the consolidated financial statements
(Figures expressed in millions of Colombian pesos, unless otherwise stated)
Associated companies and joint ventures
Consolidated subsidiaries
| Company | Functional currency | Ownership interest Ecopetrol | Activity | Country/ Domicile | Geographic area of operations | Equity | Profit (loss) of the year | Total assets | Total liabilities | ||||||||||||||||||
| Associates | |||||||||||||||||||||||||||
| Invercolsa S.A. (1) | Colombian peso | 43 | % | Holding with investments in transportation and distribution companies of natural gas and LPG in Colombia | Colombia | Colombia | 510,116 | 240,949 | 560,536 | 50,420 | |||||||||||||||||
| Serviport S.A. (2) | Colombian peso | 49 | % | Services for the support of loading and unloading of oil ships, supply of equipment, technical inspections and load measurements | Colombia | Colombia | 22,882 | 2,862 | 67,222 | 44,340 | |||||||||||||||||
| Sociedad Portuaria Olefinas y Derivados S.A. (1) | Colombian peso | 50 | % | Construction, use, maintenance and administration of port facilities, ports, private docks | Colombia | Colombia | 3,173 | 308 | 6,145 | 2,972 | |||||||||||||||||
| Joint ventures | |||||||||||||||||||||||||||
| Equion Energía Limited | U.S. dollar | 51 | % | Exploration, exploitation and production of hydrocarbons | United Kingdom | Colombia | 1,939,686 | 421,511 | 2,567,950 | 628,264 | |||||||||||||||||
| Offshore International Group | U.S. dollar | 50 | % | Exploration, exploitation and production of hydrocarbons | United States | Peru | 771,492 | (322,969 | ) | 1,878,508 | 1,107,016 | ||||||||||||||||
| Ecodiesel Colombia S.A. | Colombian peso | 50 | % | Production, commercialization and distribution of biofuels and oleochemicals | Colombia | Colombia | 82,608 | 12,846 | 119,991 | 37,383 | |||||||||||||||||
| (1) | Information available as of November 30, 2018. |
| (2) | Information available as of September 30, 2018. |
F-107
Ecopetrol S.A.
Notes to the consolidated financial statements
(Figures expressed in millions of Colombian pesos, unless otherwise stated)
| Company | Functional currency | Ownership interest Ecopetrol | Activity | Shared interest | Country/ Domicile | Geographic area of operations | Net equity | Income (loss) for the period | |||||||||
| Ecopetrol Global Energy S.L.U | U.S. Dollar | 100% | Investment vehicle | Ecopetrol America Inc., Ecopetrol Oleo & Gas do Brazil Ltda., Ecopetrol del Perú S. A.,ECP Oil and Gas Germany GmbH Gmbh, Refinería de Cartagena S. A., Bioenergy S. A. | Spain | Spain | 2,727,352 | (380,156 | ) | ||||||||
| Ecopetrol Oleo é Gas do Brazil Ltda. | Real | 100% | Hydrocarbon exploration and explotation | Sociedad Portuaria de Oleofinas y Derivados, Propileno del Caribe S. A | Brazil | Brazil | 27,617 | (50,849 | ) | ||||||||
| Ecopetrol del Perú S. A. | U.S. Dollar | 100% | Hydrocarbon exploration and explotation | - | Peru | Peru | 51,523 | (2,847 | ) | ||||||||
| Ecopetrol América Inc. | U.S. Dollar | 100% | Hydrocarbon exploration and explotation | Ecopetrol Perú S.A., Ecopetrol Oleo é Gas do Brazil Ltda., Propileno del Caribe S. A, Sociedad Portuaria de Oleofinas y Derivados | United States of America | United States of America | 2,645,772 | (298,055 | ) | ||||||||
| Black Gold Re Ltd. | U.S. Dollar | 100% | Reinsurer of Ecopetrol and its subsidiaries | - | Bermuda | Bermuda | 581,901 | 36,808 | |||||||||
| ECP Oil and Gas Germany GmbH | U.S. Dollar | 100% | Hydrocarbon exploration and explotation | - | Germany | Angola | 2,476 | (27,530 | ) | ||||||||
| Hocol Petroleum Limited | U.S. Dollar | 100% | Investment vehicle. | Hocol S. A. | Bermuda | Bermuda | 2,267,217 | (15,627 | ) | ||||||||
| Hocol S.A | U.S. Dollar | 100% | Hydrocarbon exploration and explotation | ODC, Oleoducto Bicentenario | Cayman Islands | Colombia | 1,563,126 | 659 |
Exhibit 2 – Conditions of the most significant loans
|
| Company | Functional currency | Ownership interest Ecopetrol | Activity | Shared interest | Country/ Domicile | Geographic area of operations | Net equity | Income (loss) for the period | |||||||||
| Andean Chemicals Ltd. | U.S. Dollar | 100% | Investment vehicle | Bioenergy S. A., Refinería de Cartagena, Propileno del Caribe S. A. y Comai S.A. | Bermuda | Bermuda | 4,857,372 | (1,564,731 | ) | ||||||||
| Refinería de Cartagena S. A. | U.S. Dollar | 100% | Hydrocarbons refining, marketing and distribution | - | Colombia | Colombia | 6,969,793 | (2,205,876 | ) | ||||||||
| Propileno del Caribe Propilco S. A. | U.S. Dollar | 100% | Production and marketing of polypropylene resin | Comai S. A., Refinería de Cartagena., Bioenergy S. A., Sociedad Portuaria Oleofinas y Derivados | Colombia | Colombia | 1,195,760 | 191,060 | |||||||||
| COMAI - Compounding and Masterbatching Industry | Colombian peso | 100% | Manufacturing of polypropylene compounds and master batches for a wide range of uses | Refinería de Cartagena., Bioenergy S. A., Zona franca de Cartagena S.A , Sociedad Portuaria del Dique | Colombia | Colombia | 131,227 | 103,888 | |||||||||
| Bioenergy S. A. | Colombian peso | 98.46% | Biofuels production | Bioenergy Zona Franca S. A., Amandine Holdings Corp. y Los Arces Group Corp. | Colombia | Colombia | 313,824 | (475,294 | ) | ||||||||
| Bioenergy Zona Franca S. A. | Colombian peso | 98.46% | Biofuels production | - | Colombia | Colombia | 251,185 | (362,102 | ) | ||||||||
| Amandine Holdings Corp. | Colombian peso | 98.46% | In a winding-up process | - | Panama | Panama | 6,657 | - | |||||||||
| Los Arces Group Corp. | Colombian peso | 98.46% | In a winding-up process | - | Panama | Panama | 5,100 | - | |||||||||
| Cenit S.A.S. | Colombian peso | 100% | Storage and transportation through hydrocarbon pipelines | Oleoducto Bicentenario, Ocensa, ODC, ODL, Sento S.A.S, Serviport | Colombia | Colombia | 10,767,210 | 2,915,342 |
|
| Company | Functional currency | Ownership interest Ecopetrol | Activity | Shared interest | Country/ Domicile | Geographic area of operations | Net equity | Income (loss) for the period | |||||||||
| Oleoducto Central S. A. - Ocensa | U.S. Dollar | 72.65% | Pipeline transportation of crude oil | - | Colombia | Colombia | 2,446,722 | 1,779,134 | |||||||||
| ODL S. A. | Colombian peso | 65% | Pipeline transportation of crude oil | - | Panama | Colombia | 1,044,369 | 341,362 | |||||||||
| Oleoducto de Colombia S. A. – ODC | Colombian peso | 73% | Pipeline transportation of crude oil | - | Colombia | Colombia | 288,734 | 237,787 | |||||||||
| Oleoducto Bicentenario de Colombia SAS | Colombian peso | 55.97% | Pipeline transportation of crude oil | - | Colombia | Colombia | 945,026 | 440,371 | |||||||||
| Ecopetrol Capital AG | U.S. Dollar | 100% | Financing, liquidation of funding for companies, groups or any business or related activity | - | Switzerland | Switzerland | 1,098,981 | 143,805 | |||||||||
| Ecopetrol Global Capital SLU | Euro | 100% | Investment vehicle | - | Spain | Spain | 31 | (53 | ) | ||||||||
| Ecopetrol Costa Afuera S.A.S. | Colombian peso | 100% | Offshore exploration | - | Colombia | Colombia | 7,954 | (1,834 | ) | ||||||||
| Sento S.A.S. | Colombian peso | 100% | Investments in hydrocarbon transportation business | ODC | Colombia | Colombia | 21,453 | 10,918 |
|
| Class of credit | Company | Initial date | Expiry date | Currency | Disbursement | Outstanding balance Dec 31, 2018 | Outstanding balance Dec 31, 2017 | Typo de interest | Amortization of the principal | Payment of interest | ||||||||||||||||
| dec-10 | dec-20 | COP | 479,900 | 479,900 | 479,900 | Floating | Bullet | Half-yearly | ||||||||||||||||||
| dec-10 | dec-40 | COP | 284,300 | 284,300 | 284,300 | Floating | Bullet | Half-yearly | ||||||||||||||||||
| Bonds, domestic | Ecopetrol S.A. | aug-13 | aug-23 | COP | 168,600 | 168,600 | 168,600 | Floating | Bullet | Half-yearly | ||||||||||||||||
| currency | aug -13 | aug-28 | COP | 347,500 | 347,500 | 347,500 | Floating | Bullet | Half-yearly | |||||||||||||||||
| aug -13 | aug-43 | COP | 262,950 | 262,950 | 262,950 | Floating | Bullet | Half-yearly | ||||||||||||||||||
| Local currency syndicated | Oleoducto Bicentenario ODL - Oleoducto de los | jul-12 | jul-24 | COP | 2,100,000 | 1,191,050 | 1,373,750 | Floating | Quarterly | Quarterly | ||||||||||||||||
| loan | Llanos Orientales S.A. | aug -13 | aug-20 | COP | 800,000 | 224,000 | 352,000 | Floating | Quarterly | Quarterly | ||||||||||||||||
| sep-13 | sep-23 | USD | 1,300 | ** | 1,300 | 1,300 | Fixed | Bullet | Half-yearly | |||||||||||||||||
| sep-13 | sep-43 | USD | 850 | 850 | 850 | Fixed | Bullet | Half-yearly | ||||||||||||||||||
| Bonds, foreign | Ecopetrol S.A. | may-14 | may-45 | USD | 2,000 | 2,000 | 2,000 | Fixed | Bullet | Half-yearly | ||||||||||||||||
| currency | sep-14 | may-25 | USD | 1,200 | 1,200 | 1,200 | Fixed | Bullet | Half-yearly | |||||||||||||||||
| jun-15 | jun-26 | USD | 1,500 | 1,500 | 1,500 | Fixed | Bullet | Half-yearly | ||||||||||||||||||
| jun-16 | sep-23 | USD | 500 | 500 | 500 | Fixed | Bullet | Half-yearly | ||||||||||||||||||
| Oleoducto Central S.A. | may-14 | may-21 | USD | 500 | 500 | 500 | Fixed | Bullet | Half-yearly | |||||||||||||||||
| International | dec-17 | dec-27 | USD | 2,001 | 1,742 | 1,941 | Fixed | Half-yearly | Half-yearly | |||||||||||||||||
| commercial credits - | dec-17 | dec-27 | USD | 76 | 66 | 73 | Floating | Half-yearly | Half-yearly | |||||||||||||||||
| Refinería de | Ecopetrol S.A. | dec-17 | dec-27 | USD | 73 | 63 | 71 | Fixed | Half-yearly | Half-yearly | ||||||||||||||||
| Cartagena | dec-17 | dec-27 | USD | 159 | 138 | 154 | Floating | Half-yearly | Half-yearly | |||||||||||||||||
| dec-17 | dec-25 | USD | 359 | 321 | 344 | Floating | Half-yearly | Half-yearly | ||||||||||||||||||
Associates and joint ventures
| Company | Functional currency | Ownership interest Ecopetrol | Activity | Country/ Domicile | Geographic area of operations | Net equity | Income (loss) for the period | ||||||||
| Associates | |||||||||||||||
| Invercolsa S.A. (*) | Colombian peso | 43.35% | Investment in companies of transport and distribution of natural gas and L.P.G. in Colombia | Colombia | Colombia | 560,915 | 111,997 | ||||||||
| Serviport S.A. | Colombian peso | 49% | Services for oil-vessel loading and unloading support; supply of equipment; technical inspections and loading | Colombia | Colombia | 18,259 | 877 | ||||||||
| Sociedad Portuaria Olefinas y Derivados S.A. (*) | Colombian peso | 50% | Construction, use, maintenance, adaptation and administration of ports and private or public docks facilities | Colombia | Colombia | 2,669 | 469 | ||||||||
| Joint ventures | |||||||||||||||
| Equion Energía Limited | U.S. Dollar | 51% | Hydrocarbon exploration, exploitation and production | United Kingdom | Colombia | 1,530,858 | 279,515 | ||||||||
| Ecodiesel Colombia S.A. | Colombian peso | 50% | Production, commercialization and distribution of biofuels and oleo chemicals | Colombia | Colombia | 79,050 | 24,176 | ||||||||
| Offshore International Group | U.S. Dollar | 50% | Hydrocarbon exploration, exploitation and production | United States of America | Peru | 1,192,980 | (248,037 | ) |
(*) Information available** Financial debt designated as of November 30, 2016.hedging instrument (see Note 28.1).
| 9. | Signature Page |
SIGNATURES
The registrant hereby certifies that it meets all of the requirements for filing on Form 20-F and that it has duly caused and authorized the undersigned to sign this annual report on its behalf.
| Ecopetrol S.A. | |||
| By: | /s/ | ||
| Name: | Felipe Bayón Pardo | ||
| Title: | Chief | ||
| By: | /s/ | ||
| Name: | Jaime Caballero Uribe | ||
| Title: | Chief | ||
Dated: April 5, 2019
| 10. | Exhibits |
| 12.2 | Section 302 Certification of the Chief Financial Officer. | |
| 13.1 | Section 906 Officer Certification. | |
| Consent of Ernst & Young Audit S.A.S. | ||
| 23.2 | Consent of Ryder Scott LP. | |
| 23.3 | Consent of Sproule International Limited. | |
| 23.4 | Consent of DeGolyer and MacNaughton. | |
| 23.5 | Consent of Gaffney, Cline & Associates. | |
| 99.1 | Third-Party Reserve Report of Ryder Scott Company, L.P. | |
| 99.2 | Third-Party Reserve Report of Sproule International Limited. | |
| 99.3 | Third-Party Reserve Report of DeGolyer and MacNaughton. | |
| 99.4 | Third-Party Reserve Report of Gaffney, Cline & Associates. | |
| 101.INS | XBRL Instance Document | |
| 101.SCH | XBRL Taxonomy Extension Schema Document | |
101.CAL 101.DEF | XBRL Taxonomy Extension Calculation Linkbase Document XBRL Taxonomy Extension Labels Linkbase Document | |
| 101.PRE | XBRL Taxonomy Extension Presentation Linkbase Document |
| 11. | Cross-reference to Form 20-F |
| Sections | ||||
| Item 1. | Identity of Directors, Senior Management and Advisers | N/A | ||
| Item 2. | Offer Statistics and Expected Timetable | N/A | ||
| Item 3. | Key Information | |||
| A. Selected Financial Data | 1.3 | |||
| B. Capitalization and Indebtedness | N/A | |||
| C. Reasons for the Offer and Use of Proceeds | N/A | |||
| D. Risk Factors | 5.1 | |||
| Item 4. | Information on the Company | Note 1 to the consolidated financial statements | ||
| A. History and Development of the Company | 2.1; 3.1; Note 1 to the consolidated financial statements | |||
| B. Business Overview | 2; 3.3 – 3.9; 4.5.1 | |||
| C. Organizational Structure | 3.2 | |||
| D. Property, Plants and Equipment | 3.4 – 3.6; 4.6.2; Notes | |||
| E. Oil and Gas Disclosures | 3.3 – 3.6; Notes | |||
| Item 4A. | Unresolved Staff Comments | None | ||
| Item 5. | Operating and Financial Review and Prospects | |||
| A. Operating Results | 3.8; 4; 5.1; 5.2 | |||
| B. Liquidity and Capital Resources | 2.1; 4.6; 4.8; Consolidated statements of cash flow and Notes 9, | |||
| C. Research and development, Patents and Licenses, etc. | 3.7; Note | |||
| D. Trend Information | 4.10 | |||
| E. Off-Balance Sheet Arrangements | 4.9 | |||
| F. Tabular Disclosure of Contractual Obligations | 4.8 | |||
| G. Safe Harbor | 1.2 |
| Item 6. | Directors, Senior Management and Employees | |||
| A. Directors and Senior Management | 7.3; 7.5 | |||
| B. Compensation | 7.6; Notes 4, | |||
| C. Board Practices | 7.3 | |||
| D. Employees | 3.12 | |||
| E. Share Ownership |
| ||||
| Item 7. | Major Shareholders and Related Party Transactions | |||
| A. Major Shareholders | 6.3; 6.8; 7.7 | |||
| B. Related Party Transactions | 3.10; Note | |||
| C. Interests of Experts and Counsel | N/A | |||
| Item 8. | Financial Information | |||
| A. Consolidated Statements and Other Financial Information | 4; 5.3; 6.2; 8 | |||
| B. Significant Changes | 7.8; Note | |||
| Item 9. | The Offer and Listing | |||
| A. Offer and Listing Details | 6.3 | |||
| B. Plan of Distribution | N/A | |||
| C. Markets | 6.3 | |||
| D. Selling Shareholders | N/A | |||
| E. Dilution | N/A | |||
| F. Expenses of the Issue | N/A | |||
| Item 10. | Additional Information | |||
| A. Share Capital | N/A | |||
| B. Memorandum and Articles of Association | 7.1 | |||
| C. Material Contracts | 3.4.4; 4.8; Exhibits 4.1 – | |||
| D. Exchange Controls | 5.1.4; 6.6 | |||
| E. Taxation | 4.2.1; 6.5; Note 10 to the consolidated financial statements | |||
| F. Dividends and Paying Agents | N/A | |||
| G. Statements by Experts | N/A | |||
| H. Documents On Display | 1.1 | |||
| I. Subsidiary Information | N/A | |||
| Item 11. | Quantitative and Qualitative Disclosures About Market Risk | 4.10; 5.1.1; 5.2.1; 5.2.3; Note | ||
| Item 12. | Description of Securities Other than Equity Securities | |||
| A. Debt Securities | N/A | |||
| B. Warrants and Rights | N/A | |||
| C. Other Securities | N/A | |||
| D. American Depositary Shares | 6.4 | |||
| Item 13. | Defaults, Dividend Arrearages and Delinquencies | None | ||
| Item 14. | Material Modifications to the Rights of Security Holders and Use of Proceeds | None | ||
| Item 15. | Controls and Procedures | 5.2; 7.8 | ||
| Item 16A. | Audit Committee Financial Expert | 7.3.2 | ||
| Item 16B. | Code of Ethics | 7.2; 7.4 | ||
| Item 16C. | Principal Accountant Fees and Services | 7.8 | ||
| Item 16D. | Exemptions from the Listing Standards for Audit Committees | N/A | ||
| Item 16E. | Purchases of Equity Securities by the Issuer and Affiliated Purchases | N/A | ||
| Item 16F. | Changes in Registrant’s Certifying Accountant | 7.8 | ||
| Item 16G. | Corporate Governance | 7.4 | ||
| Item 16H. | Mine Safety Disclosure | N/A | ||
| Item 17. | Financial Statements | N/A | ||
| Item 18. | Financial Statements | 8 | ||
| Item 19. | Exhibits | 10 |