
UNITED STATES
SECURITIES AND EXCHANGE COMMISSION
Washington, D.C. 20549
FORM 20-F
FORM 20-F
(Mark One)
| REGISTRATION STATEMENT PURSUANT TO SECTION 12(b) OR (g) OF THE SECURITIES EXCHANGE ACT OF 1934 |
OR
| x | ANNUAL REPORT PURSUANT TO SECTION 13 OR 15(d) OF THE SECURITIES EXCHANGE ACT OF 1934 |
For the fiscal year ended December 31, 20182020
OR
| TRANSITION REPORT PURSUANT TO SECTION 13 OR 15(d) OF THE SECURITIES EXCHANGE ACT OF 1934 |
for the transition period from to
OR
| SHELL COMPANY REPORT PURSUANT TO SECTION 13 OR 15(d) OF THE SECURITIES EXCHANGE ACT OF 1934 |
Date of event requiring this shell company report
Commission file number 33-65728
SOCIEDAD QUIMICA Y MINERA DE CHILE S.A.
(Exact name of Registrant as specified in its charter)
CHEMICAL AND MINING COMPANY OF CHILE INC.
(Translation of Registrant’s name into English)
CHILE
(Jurisdiction of incorporation)
El Trovador 4285, 6th floor, Santiago, Chile +56 2 2425 2000
(Address of principal executive offices)
Gerardo Illanes +56 2 2425-2485, gerardo.illanes@sqm.com, El Trovador 4285, 6th floor, Santiago, Chile
(Name, Telephone, E-mail and/or Facsimile Number and Address of Company Contact Person)
Securities registered or to be registered, pursuant to Section 12(b) of the Act:
| Title of each class | Trading Symbol(s) | Name of each exchange on which registered | |
| Series B common shares, in the form of American Depositary Shares each representing one Series B share | SQM | New York Stock Exchange | |
Securities registered or to be registered pursuant to Section 12(g) of the Act:
None
Securities for which there is a reporting obligation pursuant to Section 15(d) of the Act:
None
None
Indicate the number of outstanding shares of each of the issuer’s classes of capital stock or common stock as of the close of business covered by the annual report.
Series A Common Shares 142,819,552
Series B Common Shares 120,376,972
Indicate by check mark if the registrant is a well-known seasoned issuer, as defined in Rule 405 of the Securities Act. Yes x No ¨o
If this report is an annual or transition report, indicate by check mark if the registrant is not required to file reports pursuant to Section 13 or 15(d) of the Securities Exchange Act of 1934. Yes ¨o No x
Indicate by check mark whether the registrant (1) has filed all reports required to be filed by Section 13 or 15(d) of the Securities Exchange Act of 1934 during the preceding 12 months (or for such shorter period that the registrant was required to file such reports), and (2) has been subject to such filing requirements for the past 90 days. Yes x No ¨o
Indicate by check mark whether the registrant has submitted, electronically every Interactive Data File required to be submitted pursuant to Rule 405 of Regulation S-T during the preceding 12 months (or for such shorter period that the registrant was required to submit such files). Yes x No ¨o
Indicate by check mark whether the registrant is a large accelerated filer, an accelerated filer, a non-accelerated filer, or an emerging growth company. See the definitions of “large accelerated filer,” “accelerated filer,” and “emerging growth company” in Rule 12b-2 of the Exchange Act.
Large accelerated filer x Accelerated filer ¨o Non-accelerated filer ¨o Emerging growth company ¨o
If an emerging growth company that prepares its financial statements in accordance with U.S. GAAP, indicate by check mark if the registrant has elected not to use the extended transition period for complying with any new or revised financial accounting standards † provided pursuant to Section 13(a) of the Exchange Act. ¨o
† The term “new or revised financial accounting standard” refers to any update issued by the Financial Accounting Standards Board to its Accounting Standards Codification after April 5, 2012.
Indicate by check mark whether the registrant has filed a report on and attestation to its management’s assessment of the effectiveness of its internal control over financial reporting under Section 404(b) of the Sarbanes-Oxley Act by the registered public accounting firm that prepared or issued its audit report.x
Indicate by check mark which basis of accounting the registrant has used to prepare the financial statements included in this filing:
| U.S. GAAP | International Financial Reporting Standards as issued by the International Accounting Standards Board x | Other |
If “Other” has been checked in response to the previous question indicate by check mark which financial statement item the registrant has elected to follow. Item 17 ¨o Item 18 ¨o
If this is an annual report, indicate by check mark whether the registrant is a shell company (as defined in Rule 12b-2 of the Exchange Act). Yes ¨o No x
Indicate the number of outstanding shares of each of the issuer’s classes of capital stock or common stock as of the close of business covered by the annual report.
Page
| EXHIBIT 1.1 | |||
| EXHIBIT | |||
| EXHIBIT 8.1 | |||
| EXHIBIT 12.1 | |||
| EXHIBIT 12.2 | |||
| EXHIBIT 13.1 | |||
| EXHIBIT 13.2 | |||
| EXHIBIT 23.1 | |||
| EXHIBIT 23.2 | |||
| EXHIBIT 23.3 | |||
| EXHIBIT | |||
| EXHIBIT | |||
| EXHIBIT 99.2 | |||
| EXHIBIT 99.3 | |||
| EXHIBIT 99.4 | |||
iii
| i |
In this Annual Report on Form 20-F, except as otherwise provided or unless the context requires otherwise, all references to “we,” “us,” “Company” or “SQM” are to Sociedad Química y Minera de Chile S.A., an open stock corporation (sociedad anónima abierta) organized under the laws of the Republic of Chile, and its consolidated subsidiaries.
All references to “US$,” “U.S. dollars,” “USD” and “dollars” are to United States dollars, references to “pesos,” “CLP” and “Ch$” are to Chilean pesos, references to ThUS$ are to thousands of United States dollars, references to ThCh$ are to thousands of Chilean pesos and references to “UF” are toUnidades de Fomento. The UF is an inflation-indexed, peso-denominated unit that is linked to, and adjusted daily to reflect changes in, the previous month’s Chilean consumer price index. As of December 31, 2018,2020, UF 1.00 was equivalent to US$38.1940.89 and Ch$26,565.7929,066.58 according to the Chilean Central Bank (Banco Central de Chile). As of AprilMarch 1, 2019,2021, UF 1.00 was equivalent to US$40.6334.11 and Ch$27,565.76.29,294.68.
The Republic of Chile is governed by a democratic government, organized in fifteen regions plus the Metropolitan Region (surrounding and including Santiago, the capital of Chile). Our production operations are concentrated in northern Chile, specifically in the Tarapacá Region and in the Antofagasta Region.
We use the metric system of weights and measures in calculating our operating and other data. The United States equivalent units of the most common metric units used by us are as shown below:
1 kilometer equals approximately 0.6214 miles
1 meter equals approximately 3.2808 feet
1 centimeter equals approximately 0.3937 inches
1 hectare equals approximately 2.4710 acres
1 metric ton (“MT” or “metric ton”) equals 1,000 kilograms or approximately 2,205 pounds.
We are not aware of any independent, authoritative source of information regarding sizes, growth rates or market shares for most of our markets. Accordingly, the market size, market growth rate and market share estimates contained herein have been developed by us using internal and external sources and reflect our best current estimates. These estimates have not been confirmed by independent sources.
Percentages and certain amounts contained herein have been rounded for ease of presentation. Any discrepancies in any figure between totals and the sums of the amounts presented are due to rounding.
“assay values” Chemical result or mineral component amount contained by the sample.
“average global metallurgical recoveries” Percentage that measures the metallurgical treatment effectiveness based on the quantitative relationship between the initial product contained in the mine-extracted material and the final product produced in the plant.
“average mining exploitation factor” Index or ratio that measures the mineral exploitation effectiveness, based on the quantitative relationship between (in-situ mineral minus exploitation losses) / in-situ mineral.
“CAGR” Compound annual growth rate, the year over year growth rate of an investment over a specified period of time.
“cash and cash equivalents” The International Accounting Standards Board (IASB) defines cash and cash equivalents as short-term, highly liquid investments that are readily convertible to known amounts of cash and which are subject to an insignificant risk of changes in value.
“Controller Group” * A person or company or group of persons or companies that according to Chilean law, have executed a joint performance agreement, that have a direct or indirect share in a company’s ownership and have the power to influence the decisions of the company’s management.
| ii |
“Corfo” Production Development Corporation (Corporación de Fomento de la Producción), formed in 1939, a Chilean national organization in charge of promoting Chile’s manufacturing productivity and commercial development.
iv
“CMF” The Chilean Financial Market Commission. (La Comisión para el Mercado Financiero), formerly known as the Superintendence of Securities and Insurance (Superintendencia de Valores y Seguros or SVS).
“cut-off grade” The minimal assay value or chemical amount of some mineral component above which exploitation is economical.
“dilution” Loss of mineral grade because of contamination with barren material (or waste) incorporated in some exploited ore mineral.
“exploitation losses” Amounts of ore mineral that have not been extracted in accordance with exploitation designs.
“fertigation” The process by which plant nutrients are applied to the ground using an irrigation system.
“geostatistical analysis” Statistical tools applied to mining planning, geology and geochemical data that allow estimation of averages, grades and quantities of mineral resources and reserves.
“heap leaching” A process whereby minerals are leached from a heap, or pad, of ROM (run of mine) ore by leaching solutions percolating down through the heap and collected from a sloping, impermeable liner below the pad.
“horizontal layering” Rock mass (stratiform seam) with generally uniform thickness that conform to the sedimentary fields (mineralized and horizontal rock in these cases).
“hypothetical resources” Mineral resources that have limited geochemical reconnaissance, based mainly on geological data and sample assay values spaced between 500–1000 meters.
“Indicated Mineral Resource” See “Resources—Indicated Mineral Resource.”
“Inferred Mineral Resource” See “Resources—Inferred Mineral Resource.”
“industrial crops” Refers to crops that require processing after harvest in order to be ready for consumption or sale. Tobacco, tea and seed crops are examples of industrial crops.
“Kriging Method”A technique used to estimate ore reserves, in which the spatial distribution of continuous geophysical variables is estimated using control points where values are known.
“LIBOR” London Inter Bank Offered Rate.
“limited reconnaissance” Low or limited level of geological knowledge.
“Measured Mineral Resource” See “Resources—Measured Mineral Resource.”
“metallurgical treatment” A set of chemical and physical processes applied to the caliche ore and to the salar brines to extract their useful minerals (or metals).
“ore depth” Depth of the mineral that may be economically exploited.
“ore type” Main mineral having economic value contained in the caliche ore (sodium nitrate or iodine).
“ore” A mineral or rock from which a substance having economic value may be extracted.
“Probable Mineral Reserve” See “Reserves—Probable Mineral Reserve.”
“Proven Mineral Reserve” See “Reserves—Proven Mineral Reserve.”
“Reserves—Probable Mineral Reserve” ** The economically mineable part of an Indicated Mineral Resource and, in some circumstances, Measured Mineral Resource. The calculation of the reserves includes diluting of materials and allowances for losses which may occur when the material is mined. Appropriate assessments, which may include feasibility studies, have been carried out and include consideration of and modification by realistically assumed mining, metallurgical, economic, marketing, legal, environmental, social and governmental factors. These assessments demonstrate at the time of reporting that extraction is reasonably justified. A Probable Mineral Reserve has a lower level of confidence than a Proven Mineral Reserve.
| iii |
“Reserves—Proven Mineral Reserve” ** The economically mineable part of a Measured Mineral Resource. The calculation of the reserves includes diluting of materials and allowances for losses which may occur when the material is mined. Appropriate assessments, which may include feasibility studies, have been carried out and include consideration of and modification by realistically assumed mining, metallurgical, economic, marketing, legal, environmental, social and governmental factors. These assessments demonstrate at the time of reporting that extraction is reasonably justified.
v
“Resources—Indicated Mineral Resource” ** The part of a Mineral Resource for which tonnage, densities, shape, physical characteristics, grade and mineral content can be estimated with a reasonable level of confidence. The calculation is based on detailed exploration, sampling and testing information gathered through appropriate sampling techniques from locations such as outcrops, trenches and exploratory drill holes. The locations are too widely or inappropriately spaced to confirm geological continuity and/or grade continuity but are spaced closely enough for continuity to be assumed. An Indicated Mineral Resource has a lower level of confidence than a Measured Mineral Resource, but has a higher level of confidence than an Inferred Mineral Resource.
A deposit may be classified as an Indicated Mineral Resource when the nature, quality, amount and distribution of data are such as to allow the Competent Person, as that term is defined under Chilean Law No. 20,235, determining the Mineral Resource to confidently interpret the geological framework and to assume continuity of mineralization. Confidence in the estimate is sufficient to allow the appropriate application of technical and economic parameters and to enable an evaluation of economic viability.
“Resources—Inferred Mineral Resource” ** The part of a Mineral Resource for which tonnage, grade and mineral content can be estimated with a low level of confidence, by inferring them on the basis of geological evidence and assumed but not verified geological and/or grade continuity. The estimate is based on information gathered through appropriate sampling techniques from locations such as outcrops, trenches, pits, workings and drill holes, and this information is of limited or uncertain quality and/or reliability. An Inferred Mineral Resource has a lower level of confidence than an Indicated Mineral Resource.
“Resources—Measured Mineral Resource” ** The part of a Mineral Resource for which tonnage, densities, shape, physical characteristics, grade and mineral content can be estimated with a high level of confidence. The estimate is based on detailed exploration, sampling and testing information gathered through appropriate sampling techniques from locations such as outcrops, trenches and exploratory drill holes. The locations are spaced closely enough to confirm geological and/or grade continuity.
A deposit may be classified as a Measured Mineral Resource when the nature, quality, amount and distribution of data are such as to leave no reasonable doubt, in the opinion of the Competent Person, as that term is defined under Chilean Law No. 20,235, determining the Mineral Resource, that the tonnage and grade of the deposit can be estimated within close limits and that any variation from the estimate would not significantly affect potential economic viability. This category requires a high level of confidence in, and understanding of, the geology and controls of the mineral deposit. Confidence in the estimate is sufficient to allow the appropriate application of technical and economic parameters and to enable an evaluation of economic viability.
“Resources—Mineral Resource” ** A concentration or occurrence of natural, solid, inorganic or fossilized organic material in or on the Earth’s crust in such form or quantity and of such grade or quality that it has reasonable prospects for economically viable extraction. The location, quantity, grade, geological characteristics and continuity of a mineral resource are known, estimated or interpreted from specific geological, metallurgical and technological evidence.
“solar salts” A mixture of 60% sodium nitrate and 40% potassium nitrate used in the storage of thermo-energy.
“vat leaching” A process whereby minerals are extracted from crushed ore by placing the ore in large vats containing leaching solutions.
“waste” Rock or mineral which is not economical for metallurgical treatment.
“Weighted average age” The sum of the product of the age of each fixed asset at a given facility and its current gross book value as of December 31, 20182020 divided by the total gross book value of the Company’s fixed assets at such facility as of December 31, 2018.2020.
| * | The definition of a Controller Group that has been provided is the one that applied to the Company. Chilean law provides for a broader definition of a “controller group”, as such term is defined in Title XV of Chilean Law No. 18,045. |
| ** | The definitions we use for resources and reserves are based on those provided by the “Instituto de Ingenieros de Minas de Chile” (Chilean Institute of Mining Engineers). |
vi
| iv |
CAUTIONARY STATEMENT REGARDING FORWARD-LOOKING STATEMENTS
This Form 20-F contains statements that are or may constitute forward-looking statements within the meaning of the Private Securities Litigation Reform Act of 1995. These statements are not based on historical facts and reflect our expectations for future events and results. Words such as “believe,” “expect,” “predict,” “anticipate,” “intend,” “estimate,” “should,” “may,” “likely,” “could” or similar expressions may identify forward-looking information. These statements appear throughout this Form 20-F and include statements regarding the intent, belief or current expectations of the Company and its management, including but not limited to any statements concerning:
| · | trends affecting the prices and volumes of the products we |
| · | level of reserves, quality of the ore and brines, and production levels and yields; |
| · | our capital investment program and financing sources |
| · | our Sustainable Development Plan; |
| · | development of new |
| · | our business outlook, future economic performance, anticipated profitability, revenues, expenses, or other financial items; |
| · | the future impact of competition; and |
| · | regulatory changes. |
Such forward-looking statements are not guarantees of future performance and involve risks and uncertainties. Actual results may differ materially from those described in such forward-looking statements included in this Form 20-F, including, without limitation, the information under Item 4. Information on the Company, Item Number 5. Operating and Financial Review and Prospects and Item 11. Quantitative and Qualitative Disclosures About Market Risk. Factors that could cause actual results to differ materially include, but are not limited to:
| · | volatility of global prices for our products; |
| · | political, economic and demographic developments in certain emerging market countries, where we conduct a large portion of our business; |
| · | the impact of the global novel coronavirus (COVID-19) pandemic, including any new strain and any associated economic downturn on our future operating and financial performance; |
| · | changes in production capacities; |
| · | the nature and extent of future competition in our principal markets; |
| · | our ability to implement our capital expenditures program, including our ability to obtain financing when required; |
| · | changes in raw material and energy prices; |
| · | currency and interest rate fluctuations; |
| · | risks relating to the estimation of our reserves; |
| · | changes in quality standards or technology applications; |
| · | adverse legal, regulatory or labor disputes or proceedings; |
| · | changes in governmental regulations; |
| · | a potential change of control of our company; and |
| · | additional risk factors discussed below under Item 3. Key Information—Risk Factors. |
| v |
vii
Summary of Risk Factors
Risks Relating to our Business
| · | Our inability to extend or renew the mineral exploitation rights relating to the Salar de Atacama concession beyond their current expiration date in December 2030 could have a material adverse effect on our business, financial condition and results of operations. |
| · | Volatility of world lithium, fertilizer and other chemical prices and high raw materials and energy prices that increase cost of sales, production costs and potentially result in energy unavailability, as well as changes in production capacities, including new production of iodine, potassium nitrate or lithium from current or new competitors in the markets in which we operate or variations of our inventory levels for economic or operational reasons could affect our prices, business, financial condition and results of operations. |
| · | Our sales to emerging markets and expansion strategy expose us to risks related to economic conditions and trends in those countries as well as subject us to differing regulatory, tax and other regimes. |
| · | We have a capital expenditure program that is subject to significant risks and uncertainties. |
| · | Our reserve estimates are internally prepared and not subject to review by external geologists or an external auditing firm and could be subject to significant changes, which may have a material adverse effect on our business, financial condition and results of operations. |
| · | Chemical and physical properties of our products could adversely affect their commercialization. |
| · | Changes in technology or other developments could result in preferences for substitute products. |
| · | We are exposed to labor strikes and labor liabilities that could impact our production levels and costs. |
| · | We are and might be subject to new and upcoming labor laws and regulations in Chile and may be exposed to liabilities and potential costs for non-compliance. |
| · | Lawsuits and arbitrations could adversely impact us. |
| · | Environmental laws and regulations could expose us to higher costs, liabilities, claims and failure to meet current and future production targets and changes in regulations regarding, or any revocation or suspension of mining, port or other concessions or changes in water rights laws and other regulations could affect our business, financial condition and results of operations. |
| · | A significant percentage of our shares are held by two principal shareholder groups who may have interests that are different from that of other shareholders and of each other. Any change in such principal shareholder groups may result in a change of control of the Company or of its Board of Directors or its management, which may have a material adverse effect on our business, financial condition and results of operations. |
| · | Tianqi is a significant shareholder and a competitor of the Company, which could result in risks to free competition. |
| · | Our information technology systems may be vulnerable to disruption which could place our systems at risk from data loss, operational failure, or compromise of confidential information. |
| · | Recent international trade tensions could have a negative effect on our financial performance. |
| · | Outbreaks of communicable infections or diseases, or other public health pandemics, such as the outbreak of the novel coronavirus (COVID-19) currently being experienced around the world, have impacted and may further impact the markets in which we, our customers and our suppliers operate or market and sell products and could have a material adverse effect on our operations business, financial condition and results of operations. |
| · | If our stakeholders and other constituencies believe we fail to appropriately address sustainability and other environmental, social and governance (ESG) concerns it may adversely affect our business. |
| · | change can create physical risks and other risks that could adversely affect our business and operations and adverse weather conditions or significant changes in weather patterns could have a material adverse impact on our results of operations. |
Risks Relating to Financial Markets
| · | Currency fluctuations and risks associated with the discontinuation, reform or replacement of benchmark indices may have a negative effect on our financial performance. |
| · | We may be subject to risks associated with the discontinuation, reform or replacement of benchmark indices. |
| vi |
Risks Relating to Chile
| · | As we are a company based in Chile, we are exposed to political risks and civil unrest in Chile. |
| · | Changes to the Chilean Constitution could impact a wide range of rights, including mining rights, water rights and property rights generally, and could affect our business, financial condition and results of operations and the Chilean government could separately levy additional taxes on mining companies operating in Chile or declare lithium mining to be in the national interest, which could enable the expropriation of our lithium assets. |
| · | Legislation and growing case law regarding indigenous and tribal peoples might affect our development plans. |
| · | Chile has different corporate disclosure and accounting standards than those you may be familiar with in the United States. |
| · | Chile is located in a seismically active region. |
General Risks
| · | The price of our ADSs and the U.S. dollar value of any dividends will be affected by fluctuations in the U.S. dollar/Chilean peso exchange rate. |
| · | Developments in other emerging markets could materially affect the value of our ADSs and our shares. |
| · | The volatility and low liquidity of the Chilean securities markets could affect the ability of our shareholders to sell our ADSs. |
| · | Our share or ADS price may react negatively to future acquisitions, capital increases and investments. |
| · | ADS holders may be unable to enforce rights under U.S. securities laws. |
| · | As preemptive rights may be unavailable for our ADS holders, they have the risk of their holdings being diluted if we issue new stock. |
| · | If we were classified as a Passive Foreign Investment Company by the U.S. Internal Revenue Service, there could be adverse consequences for U.S. investors. |
| · | Changes in Chilean tax regulations could have adverse tax consequences for U.S. investors. |
| vii |
PART I
| ITEM 1. | IDENTITY OF DIRECTORS, SENIOR MANAGEMENT AND ADVISERS |
Not Applicable.applicable.
| ITEM 2. | OFFER STATISTICS AND EXPECTED TIMETABLE |
Not Applicable.applicable.
| ITEM 3. | KEY INFORMATION |
3.A. Selected Financial Data
The following table presents selected financial data as
Omitted at the Company’s option pursuant to amendments to Item 3.A of and for the years ended December 31, 2018, 2017, 2016, 2015, and 2014. The selected financial data should be read in conjunction with the Consolidated Financial Statements and notes thereto, “Item 5. Operating and Financial Review and Prospects” and other financial information included herein.Form 20-F effective February 10, 2021.
| For the years ended December 31, | ||||||||||||||||||||
| (in millions of US$)(1) | 2018 | 2017 | 2016 | 2015 | 2014 | |||||||||||||||
| Statement of income: | ||||||||||||||||||||
| Revenues | 2,265.8 | 2,157.3 | 1,939.3 | 1,728.3 | 2,014.2 | |||||||||||||||
| Cost of sales | (1,483.5 | ) | (1,394.8 | ) | (1,328.3 | ) | (1,185.6 | ) | (1,431.2 | ) | ||||||||||
| Gross profit | 782.3 | 762.5 | 611.0 | 542.7 | 583.0 | |||||||||||||||
| Other income(2) | 32.0 | 17.8 | 15.2 | 15.3 | 24.1 | |||||||||||||||
| Administrative expenses | (118.1 | ) | (101.2 | ) | (88.4 | ) | (86.8 | ) | (96.5 | ) | ||||||||||
| Other expenses by function(3)(4)(5)(6)(7)(8) | (36.9 | ) | (53.6 | ) | (82.5 | ) | (106.4 | ) | (64.3 | ) | ||||||||||
| Other gains (losses) | 6.4 | 0.5 | 0.7 | 3.8 | 4.4 | |||||||||||||||
| Net impairment gains on reversal (losses) on financial assets | 3.0 | (8.0 | ) | (7.2 | ) | (2.9 | ) | 13.2 | ||||||||||||
| Finance income | 22.5 | 13.5 | 10.1 | 11.6 | 16.1 | |||||||||||||||
| Finance expenses | (59.9 | ) | (50.1 | ) | (57.5 | ) | (69.9 | ) | (63.4 | ) | ||||||||||
| Equity income of associates and joint ventures accounted for using the equity method | 6.4 | 14.5 | 13.0 | 10.3 | 18.1 | |||||||||||||||
| Foreign currency exchange differences | (16.6 | ) | (1.3 | ) | 0.5 | (12.4 | ) | (16.5 | ) | |||||||||||
| Income before income tax expense(3) | 621.1 | 594.6 | 414.9 | 308.3 | 405.0 | |||||||||||||||
| Income tax expense(9) | (179.0 | ) | (166.2 | ) | (133.0 | ) | (83.8 | ) | (160.7 | ) | ||||||||||
| Profit for the year(3) (9) | 442.1 | 428.4 | 281.9 | 224.5 | 244.3 | |||||||||||||||
| Profit attributable to: | ||||||||||||||||||||
| Controlling interests(3) (9) | 439.8 | 427.7 | 278.3 | 220.4 | 236.9 | |||||||||||||||
| Non-controlling interests | 2.2 | 0.7 | 3.6 | 4.2 | 7.4 | |||||||||||||||
| Profit for the year(3) (9) | 442.1 | 428.4 | 281.9 | 224.6 | 244.3 | |||||||||||||||
| Basic earnings per share(10) | 1.67 | 1.63 | 1.06 | 0.84 | 0.90 | |||||||||||||||
| Basic earnings per ADS(11) | 1.67 | 1.63 | 1.06 | 0.84 | 0.90 | |||||||||||||||
| Dividends per share(12) (13) | 2.09 | 1.84 | 1.44 | 0.47 | 1.42 | |||||||||||||||
| Dividends per ADS(12) (13) (14) | 2.09 | 1.84 | 1.44 | 0.47 | 1.42 | |||||||||||||||
| Weighted average(10)(11)shares outstanding (000s) | 263,197 | 263,197 | 263,197 | 263,197 | 263,197 | |||||||||||||||
��
| As of December 31, | ||||||||||||||||||||
| (in millions of US$) | 2018 | 2017 | 2016 | 2015 | 2014 | |||||||||||||||
| Balance sheet data: | ||||||||||||||||||||
| Total assets | 4,268.1 | 4,296.2 | 4,218.0 | 4,643.8 | 4,663.7 | |||||||||||||||
| Total liabilities | 2,130.3 | 2,048.8 | 1,910.8 | 2,243.4 | 2,371.1 | |||||||||||||||
| Total equity | 2,137.8 | 2,247.5 | 2,307.3 | 2,400.4 | 2,292.5 | |||||||||||||||
| Equity attributable to controlling interests | 2,085.5 | 2,187.8 | 2,246.1 | 2,339.8 | 2,232.6 | |||||||||||||||
| Equity attributable to non-controlling interest | 52.3 | 59.6 | 61.2 | 60.6 | 59.9 | |||||||||||||||
| Capital stock | 477.4 | 477.4 | 477.4 | 477.4 | 477.4 | |||||||||||||||
3.B. Capitalization and Indebtedness
Not applicable.
3.C. Reasons for the Offer and Use of Proceeds
Not applicable.
3.D. Risk Factors
Our operations are subject to certain risk factors that may affect SQM’s business, financial condition, cash flows, or results of operations. In addition to other information contained in this Annual Report on Form 20-F, you should carefully consider the risks described below. These risks are not the only ones we face. Additional risks not currently known to us or that are known but that we currently believe are not significant may also affect our business operations. Our business, financial condition, cash flows or results of operations could be materially affected by any of these risks.
Risks Relating to our Business
We could be subjectOur inability to numerous risks as a result of legal proceedings and deferred prosecution agreements with U.S. and Chilean governmental authorities in relation to certain payments made by SQM betweenextend or renew the tax years 2009 and 2015.
In 2015, the Chilean Internal Revenue Service (Servicio de Impuestos Internos or “SII”) and the Chilean Public Prosecutor brought a number of criminal and administrative proceedings following investigations related to the payment of invoices by SQM and its subsidiaries SQM Salar S.A. (“SQM Salar”) and SQM Industrial S.A., for services that may not have been properly supported or that may not have been necessary to generate corporate income, against (i) Patricio Contesse G., the Company’s former CEO whose employment was terminated in May 2015, (ii) Mr. Contesse and the Company’s then-current CEO, Patricio de Solminihac, as well as the then-current CFO (now CEO), Ricardo Ramos, in their capacities as the Company’s tax representatives and (iii) five then-current and former members of the Company’s Board of Directors. All the claims against Messrs. de Solminihac and Ramos were subsequently dismissed. The lawsuits against Mr. Contesse continue and the five Board members are appealing the fines of approximately US$36,000 imposed on each of them. For a further discussion of these lawsuits, see “Item 8.A.7. Legal Proceedings.”
On October 14, 2015, two class action complaints then pending against the Company, our former CEO and then-current CEO and CFO, alleging violations of the U.S. securities laws in connection with the subject matter of the investigations described above, were consolidated into a single action in the United States District Court for the Southern District of New York. On November 13, 2015, our former CEO and then-current CEO and CFO were voluntarily dismissed from the case without prejudice. On January 15, 2016, the lead plaintiff filed a consolidated class action complaint exclusively against the Company. On January 10, 2018, the lead plaintiff filed a motion to certify a class consisting of all persons who purchased SQM American Depositary Shares (“ADS”) between June 30, 2010 and March 18, 2015, and such motion remains pending before the court. For more information on the consolidated class action, see “Item 8.A.7 Legal Proceedings.”
During 2015, the ad-hoc committee of the Board of Directors (the “ad-hoc Committee”) established in February 2015 to conduct an internal investigation into the matters that were the subject of the SII and Chilean Public Prosecutor investigation also conducted an investigation into whether the Company faced possible liability under the Foreign Corrupt Practices Act (“FCPA"). The ad-hoc Committee engaged its own U.S. separate counsel, which presented a report to the Board of Directors on December 15, 2015.
Following the presentation by the ad-hoc Committee of its findings to the Board of Directors, the Company voluntarily shared the findings of the ad-hoc Committee investigation with authorities in Chile and the U.S. (including the U.S. Securities and Exchange Commission (“SEC”) and the U.S. Department of Justice (“DOJ”)).
On January 13, 2017, the Company and the DOJ reached agreement on the terms of a Deferred Prosecution Agreement (“DPA”) that would resolve the DOJ’s inquiry, based on alleged violations of the books and records and internal controls provisions of the Foreign Corrupt Practices Act. Among other terms, the DPA called for the Company to pay a monetary penalty of US$15,487,500, and engage a compliance monitor for a term of two (2) years. Upon successful completion of the three (3) year term of the DPA, all charges against the Company will be dismissed. On the same date, the SEC agreed to resolve its inquiry through an administrative cease and desist order, arising out of the alleged violations of the same accounting provisions of the FCPA. Among other terms, the SEC order called for the Company to pay an additional monetary penalty of US$15 million.
On January 26, 2018, the Eighth Lower Criminal Court of Santiago approved a deferred prosecution agreement proposed by the Chilean Public Prosecutor relating to SQM and its subsidiaries, SQM Salar and SQM Nitratos S.A., to suspend an investigation against these entities related to potential corruption issues and responsibility for the lack of supervision and management. Under the deferred prosecution agreement, SQM, SQM Salar and SQM Nitratos S.A., have not admitted responsibility in the matter subject to the investigation but agreed to pay an aggregate amount of (i) Ch$900,000,000 to the Chilean government, and (ii) Ch$1,650,000,000 to various charitable organizations. As of January 26, 2018, these amounts were equivalent to approximately US$1.5 million and US$2.8 million, respectively. In addition, the companies have agreed to provide the Chilean Public Prosecutor with a report on the enhancements to their compliance program, implemented in recent years, with special emphasis on the incorporation of best practices in various jurisdictions. On August 17, 2018, the Eighth Lower Criminal Court of Santiago considered the conditions and decided to terminate the legal process. See “Item 8.A.7 Legal Proceedings.”
In the event that the applicable regulatory authorities believe that the terms of the DPA or the deferred prosecution agreement with the Chilean Public Prosecutor are not complied with, it is possible that such regulatory authorities may reinstate the suspended proceedings against us and may bring further action against us, including in the form of additional inquiries or legal proceedings. Responding to our regulators’ inquiries and any future civil, criminal or regulatory inquiries or proceedings diverts our management’s attention from day-to-day operations. Additionally, expenses that may arise from responding to such inquiries or proceedings, our review of responsive materials, any related litigation or other associated activities may continue to be significant. Current and former employees, officers and directors may seek indemnification, advancement or reimbursement of expenses from us, including attorneys’ fees, with respect to the current inquiry or future proceedings related to this matter. The occurrence of any of the foregoing or adverse determination in litigation or other proceedings or similar actions could materially and adversely affect our business, financial condition, cash flows, results of operations and the prices of our securities.
Legal challenges to the amendments of the Lease Agreement and the Project Agreementmineral exploitation rights relating to the Salar de Atacama concession, if successful, or failure to comply with the requirements of either agreement,upon which our business is substantially dependent, beyond their current expiration date in December 2030 could have a material adverse effect on our business, financial condition and results of operations.
Our subsidiary SQM Salar S.A. (“SQM Salar”), as leaseholder, holds exclusive and temporary rights over theto exploit mineral resources in an area covering approximately 140,000 hectares of land in the Salar de Atacama in northern Chile, of which SQM Salar is entitled to exploit the mineral resources in 81,920 hectares.Chile. These rights are owned by Corfo, a Chilean government entity, and leased to SQM Salar pursuant to (i) a 1993 lease agreement over mining exploitation concessions between SQM Salar and Corfo, a Chilean government entityas amended from time to time (the “Lease Agreement”), and (ii) the Salar de Atacama project agreement between Corfo and SQM Salar, as amended from time to time (the “Project Agreement”). Corfo may not unilaterally amend the Lease Agreement or the Project Agreement. The Lease Agreement establishes thatprovides for SQM Salar is responsible for makingto (i) make quarterly lease payments to Corfo maintainingbased on product sales from leased mining properties and annual contributions to research and development, to local communities, to the Antofagasta Regional Government and to the municipalities of San Pedro de Atacama, María Elena and Antofagasta, (ii) maintain Corfo’s rights over the mining exploitation concessions and making(iii) make annual payments to the Chilean government for such concession rights. The Lease Agreement expires on December 31, 2030. Furthermore, under the regulations of the Chilean Nuclear Energy Commission (Comisión Chilena de Energía Nuclear or “CCHEN”), we were originally limited to 180,100 tons of total lithium metallic equivalent (958,672 tons of lithium carbonate equivalent) extraction in the aggregate for all periods. On January 17, 2018, Corfo and our subsidiaries SQM Potasio S.A. and SQM Salar reached an agreement (the “Corfo Arbitration Agreement”) to (i) terminate the previously disclosed arbitration proceedings between Corfo and SQM Salar, which, among other things, sought early termination of the Lease Agreement and (ii) amend the Lease Agreement and the Project Agreement. As part of the agreement to amend the Lease Agreement, Corfo authorized an increase of the production and sales of lithium products produced in the Salar de Atacama up to 349,553 metric tons of lithium metallic equivalent (1,860,670 tons of lithium carbonate equivalent), which is in addition to the approximately 64,816 metric tons of lithium metallic equivalent (345,015 tons of lithium carbonate equivalent) remaining from the originally authorized amount. The amendments of the Lease Agreement and the Project Agreement required under Chilean law the issuance of the applicable resolutions of the Office of the Controller General of the Republic (Contraloría General de la República) and the CCHEN, which were issued.
| 1 |
Our business is substantially dependent on the exploitation rights under the Lease Agreement and the Project Agreement, since all of our products originating from the Salar de Atacama are derived from our extraction operations under the Lease Agreement. For the year ended December 31, 2018,2020, revenues related to products originating from the Salar de Atacama represented 44%33% of our consolidated revenues, consisting of revenues from our potassium business line and our lithium and derivatives business line for the period. As of December 31, 2018,2020, only 1210 years remain on the term of the Lease Agreement and we had extracted approximately 23%28% of the total permitted accumulated extraction and sales limit of lithium under the increased lithium extraction and sales limits.
These agreements expire in 2030 and establish a seriesAlthough we expect to begin the process of obligations with which SQM Salar must comply. A serious failure to comply with these obligations may jeopardizediscussing the extension or renewal of the mineral exploitation rights under the agreements and the continuity of our operations in the Salar de Atacama. WhileAtacama under the Lease Agreement and Project Agreement with Corfo well in advance of the December 2030 expiration date, we believe that we have taken the appropriate precautions to ensure compliance with the obligations and conditions in the agreements, there can be no assurancecannot assure you that we will be ablesuccessfully reach an agreement with Corfo to maintain such compliance, whichextend or renew our mineral exploitation rights beyond 2030. Any negotiation with Corfo for an extension or renewal could jeopardize the continued benefits to usinvolve renegotiation of any or all of the agreementsterms and could have a material adverse effect on our business, financial condition and results of operations.
On February 15, 2018 and February 16, 2018, the Atacamenos Indigenous Organization (Consejo de Pueblos Atacamenos) initiated legal actions challenging the amendmentsconditions of the Lease Agreement and Project Agreement, including, among other things, the Project Agreement. The legal actions are pending beforelithium and potassium extraction and sales limits, the Supreme Court of Chile. See “Item 8.A.7 Legal Proceedings.”lease payment rates and calculations, or other payments to Corfo.
In the event the amendmentsthat we are not able to extend or renew the Lease Agreement andbeyond the Project Agreement under the Corfo Arbitration Agreement are successfully challenged, or the CCHEN authorization for the increased extraction is revoked, there can be no assurance that we will not reach the lithium extraction limit referred to above prior to thecurrent expiration of the termdate of the Lease Agreement. In such event,Agreement in 2030, we would then be unable to continue extraction of lithium and potassium under the Lease Agreement, which could have a material adverse effect on our business, financial condition and results of operations.
Our market reputation, commercial dealings or the price of our securities could be adversely affected by the negative outcome of certain proceedings against certain former members of our Board and certain other named defendants.
On September 10, 2013, the CMF issued a press release disclosing it had instituted certain administrative proceedings (the “Cascading Companies Proceedings”) against (i) Julio Ponce Lerou (who was the Chairman of the Board and a director of the Company until April 24, 2015), (ii) Patricio Contesse Fica, who was a director of the Company until April 24, 2015 and was later re-elected as a director on April 27, 2018, and is the son of Patricio Contesse González (who was the Company’s CEO until March 16, 2015), and (iii) other named defendants. The Company has been informed that Mr. Ponce and persons related to him beneficially owned 32% of SQM’s total shares as of December 31, 2018. See “Item 6.E. Share Ownership.” The CMF alleged breaches of Chilean corporate and securities laws in connection with acts performed by entities with direct or indirect share ownership interests in SQM (the “Cascading Companies”). The allegations made in connection with the Cascading Companies Proceedings do not relate to the Company’s operations, nor do they relate to any acts or omissions of the Company or any of its directors, officers or employees in their capacities as such.
In connection with the Cascading Companies Proceedings, the CMF alleged the existence of a scheme involving the named defendants whereby, through a number of transactions occurring between 2008 and 2011, the Cascading Companies allegedly sold securities of various companies, at below-market prices to companies related to Mr. Ponce and other named defendants. These companies allegedly subsequently sold such securities after a lapse of time, in most cases back to the Cascading Companies, at prices higher than the purchase price. The CMF alleged violations by the defendants of a number of Chilean corporate and securities laws in furtherance of the alleged scheme.
On January 31, 2014, the CMF added a number of Chilean financial institutions and asset managers, and certain of their controlling persons, executives or other principals, as named defendants to the Cascading Companies Proceedings. On September 2, 2014, the CMF issued a decision imposing an aggregate fine against all of the defendants of UF 4.0 million (approximately US$174 million as of December 31, 2018), including a fine against Mr. Ponce of UF 1.7 million (approximately US$74 million as of December 31, 2018) and a fine against Mr. Contesse Fica of UF 60,000 (approximately US$2.6 million as of December 31, 2018). The defendants are currently challenging the CMF administrative decision before Chilean courts.
The High Complexity Crimes Unit (Unidad de Delitos de Alta Complejidad) of the Metropolitan District Central Northern Attorney’s Office (Fiscalía Metropolitana Centro Norte) is also investigating various criminal complaints filed against various parties to the Cascading Companies Proceedings. The SII requested payment of taxes by the Cascading Companies, and the Cascading Companies filed a complaint with the tax courts.
If, for any reason, the Company is unable to differentiate itself from the named defendants, such failure could have a material adverse effect on the Company’s market reputation and commercial dealings. Furthermore, we cannot assure you that a non-appealable ruling in connection with the Cascading Companies Proceedings or the investigations of the High Complexity Crimes Unit or the SII that is adverse to Mr. Ponce or Mr. Contesse Fica will not have a material adverse effect on our market reputation, commercial dealings and the price of our securities.
We identified a material weakness in our internal controls over payments directed by the office of the former Chief Executive Officer.
In the past, our management determined that the Company did not maintain effective control over payments directed by the office of the former CEO. This determination was reported in our annual report for the year ended December 31, 2014 on Form 20-F, filed with the SEC on May 18, 2015.
We believe we have taken the necessary steps to remediate the identified material weakness and enhance our internal controls. However, any failure to maintain effective internal control over financial reporting could (i) result in a material misstatement in our financial reporting or financial statements that would not be prevented or detected, (ii) cause us to fail to meet our reporting obligations under applicable securities laws or (iii) cause investors to lose confidence in our financial reporting or financial statements, the occurrence of any of which could materially and adversely affect our business, financial condition, cash flows, results of operations and the prices of our securities.
Volatility of world lithium, fertilizer and other chemical prices and changes in production capacities could affect our business, financial condition and results of operations.
The prices of our products are determined principally by world prices, which, in some cases, have been subject to substantial volatility in recent years. World lithium, fertilizer and other chemical prices constantly vary depending upon the relationship between supply and demand at any given time. Supply and demand dynamics for our products are tied to a certain extent to global economic cycles and have been impacted by circumstances related to such cycles. Furthermore, the supply of lithium, certain fertilizers, or other chemical products, including certain products that we provide, varies principally depending on the production of the major producers, (including us) and their respective business strategies.
World prices of potassium-based fertilizers (including some of our specialty plant nutrients and potassium chloride) fluctuated as a result of the broader global economic and financial conditions. During the second half of 2013, potassium prices declined as a result of an unexpected announcement made by the Russian company Uralkali (“Uralkali”) that it was terminating its participation in Belarus Potash Corporation (“BPC”). As a result of the termination of Uralkali’s participation in BPC, there was increased price competition in the market. In 2018, the average price for our potassium chloride and potassium sulfate business line was approximately 14% higher than in 2017. Our sales volumes for this business line were approximately 38% lower in 2018 compared to 2017. We cannot assure you that potassium-based fertilizer prices and sales volumes will not decline in the future.
Iodine prices followed an upward trend beginning at the end of 2008 and continuing through 2012, reaching an average price of approximately US$53 per kilogram in 2012, over 40% higher than average prices in 2011. During the following years, supply growth outpaced demand growth, causing a decline in iodine prices. We obtained an average price for iodine of approximately US$24 per kilogram in 2018, approximately 23% more than average prices obtained in 2017. We cannot assure you that iodine prices or sales volumes will not continue to decline in the future.
In 2018, lithium demand continued to grow creating tight market conditions and increasing prices by 26% compared to 2017, driven mostly by an increase in demand related to battery use. During the second half of 2018, lithium supply increased, and prices slightly decreased in the fourth quarter. We cannot assure you that lithium prices and sales volumes will not decline in the future.
We expect that prices for the products we manufacture will continue to be influenced, among other things, by worldwide supply and demand and the business strategies of major producers. Some of the major producers (including us) have increased or decreased production and have the ability to increase or decrease production.
Since we sell our products worldwide, with Asia, Europe and North America constituting our main markets, border closures, decrease in commercial activity and difficulties and disruptions in the supply chains in the markets in which we operate as a result of COVID-19 could materially affect our business. We believe the impact on demand growth in the markets in which we sell our products, our sales volumes and our average prices will depend on the duration of COVID-19 in the various regions in which we operate, the efficiency of the measures implemented to contain the spread of COVID-19 in each country and relevant fiscal incentives that may be implemented in such jurisdictions to promote economic recovery. Most, if not all, of these factors are currently evolving on a rapid basis and we are currently unable to predict with certainty the full potential magnitude of the impacts of the COVID-19 pandemic on forecasts of market demand or our estimates of our sales volumes and average sale prices.
As a result of the above, the prices of our products may be subject to substantial volatility. High volatility or a substantial decline in the prices or sales volumes of one or more of our products could have a material adverse effect on our business, financial condition and results of operations.
| 2 |
Our sales to emerging markets and expansion strategy expose us to risks related to economic conditions and trends in those countries.
We sell our products in more than 110than110 countries around the world. In 2018,2020, approximately 34%44% of our sales were made in emerging market countries: 8% in Latin America (excluding Chile); 8%12% in Africa and the Middle East (excluding Israel); 8%9% in Chile and 11%14% in Asia and Oceania (excluding Australia, Japan, New Zealand, South Korea and Singapore). In note 26.6 ofNote 23.1 to our consolidated financial statements, we reported revenues from Chile, Latin America and the CarribeanCaribbean and Asia and others of US$1.31.0 billion. We expect to expand our sales in these and other emerging markets in the future. In addition, we may carry out acquisitions or joint ventures in jurisdictions in which we currently do not operate, relating to any of our businesses or to new businesses in which we believe we may have sustainable competitive advantages. The results of our operations and our prospects in other countries in which we establish operations will depend, in part, on the general level of political stability, and economic activity and policies in those countries.countries as well as the duration of COVID-19 in the various regions in which we operate, the efficiency of the measures implemented to contain the spread of COVID-19 in each country and relevant fiscal incentives that may be implemented in such jurisdictions to promote economic recovery. Future developments in the political systems or economies of these countries or the implementation of future governmental policies in those countries, including the imposition of withholding and other taxes, restrictions on the payment of dividends or repatriation of capital, the imposition of import duties or other restrictions, the imposition of new environmental regulations or price controls or changes in relevant laws or regulations, could have a material adverse effect on our business, financial condition and results of operations in those countries.
Our inventory levels may vary for economic or operational reasons.
In general, economic conditions or operational factors can affect our inventory levels. Higher inventories carry a financial risk due to increased need for cash to fund working capital and could imply an increased risk of loss of product. At the same time, lower levels of inventory can hinder the distribution network and process, thus impacting sales volumes. There can be no assurance that inventory levels will remain stable. These factors could have a material adverse effect on our business, financial condition and results of operations.
Our measures to minimize our exposure to bad debt may not be effective and a significant increase in our accounts receivable coupled with the financial condition of customers may result in losses that could have a material adverse effect on our business, financial condition and results of operations.
Potentially negative effects of global economic conditions on the financial condition of our customers may include the extension of the payment terms of our accounts receivable and may increase our exposure to bad debt. While we have implemented certain safeguards, such as using credit insurance, letters of credit and prepayment for a portion of sales, to minimize the risk, we cannot assure you that such safeguards will be effective and a significant increase in our accounts receivable coupled with the financial condition of customers may result in losses that could have a material adverse effect on our business, financial condition and results of operations.
New production of iodine, potassium nitrate or lithium from current or new competitors in the markets in which we operate could adversely affect prices.
In recent years, new and existing competitors have increased the supply of iodine, potassium nitrate and lithium, which has affected prices for boththose products. Further production increases could negatively impact prices. There is limited information on the status of new iodine, potassium nitrate or lithium production capacity expansion projects being developed by current and potential competitors and, as such, we cannot make accurate projections regarding the capacities of possible new entrants into the market and the dates on which they could become operational. If these potential projects are completed in the short term, they could adversely affect market prices and our market share, which, in turn, could have a material adverse effect on our business, financial condition and results of operations.
We have a capital expenditure program that is subject to significant risks and uncertainties.
Our business is capital intensive. Specifically, the exploration and exploitation of reserves, mining and processing costs, the maintenance of machinery and equipment and compliance with applicable laws and regulations require substantial capital expenditures. We must continue to invest capital to maintain or to increase our exploitation levels and the amount of finished products we produce. For example, we have a US$1.9 billion investment plan for the years 2021-2024. The plan will allow us to expand our operations of lithium, iodine and nitrate by accessing natural resources both in the Salar de Atacama and caliche ore deposits in Chile as well as through the 50,0000 metric ton Mt. Holland lithium hydroxide project in Western Australia (a joint venture that we are developing with our partner Wesfarmers). The plan also aims to increase our mining capacity while protecting the environment, reduce operational costs and increase our annual production capacity of nitrates and iodine to meet expected growth in those markets.
| 3 |
Mining industry development projects typically require a number of years and significant expenditures before production can begin. Such projects could experience unexpected problems and delays during development, construction and start-up.
Our decision to develop a project typically is based on the results of feasibility studies, which estimate the anticipated economic returns of a project. The actual project profitability or economic feasibility may differ from such estimates as a result of any of the following factors, among others: changes in tonnage, grades and metallurgical characteristics of ore or other raw materials to be mined and processed; estimated future prices of the relevant products; changes in customer demand; higher construction and infrastructure costs; the quality of the data on which engineering assumptions were made; higher production costs; adverse geotechnical conditions; availability of adequate labor force; availability and cost of water and energy; availability and cost of transportation; fluctuations in inflation and currency exchange rates; availability and terms of financing; and potential delays relating to social and community issues.
In addition, we require environmental permits for our new projects. Obtaining permits in certain cases may cause significant delays in the execution and implementation of new projects and, consequently, may require us to reassess the related risks and economic incentives.
This may require modifying our operations to incorporate the use of seawater and updating our mining equipment and operational centers.
We cannot assure you that we will be able to maintain our production levels or generate sufficient cash flow, that the proposed US$1.1 billion capital increase approved by our shareholders on January 22, 2021 will be successful or that we will have access to sufficient investments, loans or other financing alternatives, to continue our activities at or above present levels, or that we will be able to implement our projects or receive the necessary permits required for them in time. If the capital increase is not successful, it may affect our ability to grow and maintain our leading world position in the lithium, potassium nitrate, iodine and thermo-solar salts markets. Any or all of these factors may have a material adverse effect on our business, financial condition and results of operations.
High raw materials and energy prices could increase our production costs and cost of sales, and energy may become unavailable at any price.
We rely on certain raw materials and various energy sources (diesel, electricity, liquefied natural gas, fuel oil and others) to manufacture our products. Purchases of energy and raw materials we do not produce constitute an important part of our cost of sales, approximately 14%16% in 2018.2020. In addition, we may not be able to obtain energy at any price if supplies are curtailed or otherwise become unavailable. To the extent we are unable to pass on increases in the prices of energy and raw materials to our customers or we are unable to obtain energy, our business, financial condition and results of operations could be materially adversely affected.
Our reserve estimates are internally prepared and not subject to review by external geologists or an external auditing firm and could be subject to significant changes, which may have a material adverse effect on our business, financial condition and results of operations.
Our caliche ore mining reserve estimates and our Salar de Atacama brine mining reserve estimates are prepared by our own geologists and hydrogeologists and are not subject to reviewauthentication by external geologists or an external auditing firm. However, our reserve estimates in the Salar de Atacama were reviewed by qualified persons and this information is presented to Corfo. In the past, our reserve estimates in the Salar de Atacama were also reviewed by the Superior Council for Scientific Investigations (Consejo Superior de Investigaciones Científicas) or CSIC, and this information was presented to CCHEN. Estimation methods involve numerous uncertainties as to the quantity and quality of the reserves, and reserve estimates could change upwards or downwards. A downward change in the quantityour estimates and/or quality of our reserves could affect future volumes and costs of production and therefore have a material adverse effect on our business, financial condition and results of operations.
Quality standards in markets in which we sell our products could become stricter over time.
| 4 |
In the markets in which we do business, customers may impose quality standards on our products and/or governments may enact stricter regulations for the distribution and/or use of our products. As a result, if we cannot meet such new standards or regulations, we may not be able to sell our products. In addition, our cost of production may increase in order to meet any such newly imposed or enacted standards or regulations. Failure to sell our products in one or more markets or to important customers could materially adversely affect our business, financial condition and results of operations.
Chemical and physical properties of our products could adversely affect their commercialization.
Since our products are derived from natural resources, they contain inorganic impurities that may not meet certain customer or government standards. As a result, we may not be able to sell our products if we cannot meet such requirements. In addition, our cost of production may increase in order to meet such standards. Failure to meet such standards could materially adversely affect our business, financial condition and results of operations if we are unable to sell our products in one or more markets or to important customers in such markets.
Our business is subject to many operating and other risks for which we may not be fully covered under our insurance policies.
Our facilities and business operations in Chile and abroad are insured against losses, damage or other risks by insurance policies that are standard for the industry and that would reasonably be expected to be sufficient by prudent and experienced persons engaged in businesses similar to ours.
We may be subject to certain events that may not be covered under our insurance policies, which could have a material adverse effect on our business, financial condition and results of operations. Additionally, as a result of major earthquakes and unexpected rains and flooding in Chile, as well as other natural disasters worldwide, conditions in the insurance market have changed and may continue to change in the future, and as a result, we may face higher premiums and reduced coverage, which could have a material adverse effect on our business, financial condition and results of operations.
Changes in technology or other developments could result in preferences for substitute products.
Our products, particularly iodine, lithium and their derivatives, are preferred raw materials for certain industrial applications, such as rechargeable batteries and liquid-crystal displays (LCDs). Changes in technology, the development of substitute products or other developments could adversely affect demand for these and other products which we produce. In addition, other alternatives to our products may become more economically attractive as global commodity prices shift. Any of these events could have a material adverse effect on our business, financial condition and results of operations.
We are exposed to labor strikes and labor liabilities that could impact our production levels and costs.
Over 93%92% of our employees are employed in Chile, of which approximately 65%67% were represented by 2220 labor unions as of December 31, 2018.2020. As in past years, we renegotiatedof December 31, 2020, 13 collective bargaining agreements with 14 unions, achievinghad been renegotiated in advance, leaving the anticipated renegotiation of 17 collective bargaining agreements by December 31, 2018, one year before the expiration of the agreements. The 17 collective bargaining agreements wereremaining seven to be renegotiated for the next three years as of that date.during 2021. We are exposed to labor strikes and illegal work stoppages by both our own employees and our independent contractors’ employees that could impact our production levels.levels in both our own plants and our independent contractors’ plants. If a strike or illegal work stoppage occurs and continues for a sustained period of time, we could be faced with increased costs and even disruption in our product flow that could have a material adverse effect on our business, financial condition and results of operations.
Chilean Law No. 20,123, known
We are and might be subject to new and upcoming labor laws and regulations in Chile and may be exposed to liabilities and potential costs for non-compliance.
We are subject to recently enacted and might be subject to new local labor laws and regulations that govern, among other things, the relationship between us and our employees and will be subject to new labor bills currently under discussion in the national congress, mainly as the Subcontracting Law, provides that when a serious workplace accident occurs, the company in chargeresult of the workplace must haltimpact of the global novel coronavirus (COVID-19) pandemic as well as to the economic and political volatility and civil unrest in Chile beginning in October and November 2019. There have been changes and proposed changes to various labor laws which include, but are not limited to, modifications related to teleworking, inclusion of workers with disabilities, minimum wage, unemployment insurance benefits, employee and employer relationships, pensions, profit sharing, regular work at the site where the accident took place until authorities from either the National Geologyhours and Mining Service (Servicio Nacional de Geología y Minería or “Sernageomin”), the Labor Board (Dirección del Trabajo or “Labor Board”), or the National Health Service (Servicio Nacional de Salud), inspect the site and prescribe the measures such company must takeother matters related to minimize the risk of similar accidents taking place in the future. Work may not be resumed until the applicable company has taken the prescribed measures, and the period of time before work may be resumed may last for a number of hours, days, or longer. The effects of this lawCOVID-19.
Any changes to regulations to which we are subject could have a material adverse effect on our business, financial condition and results of operations.
On September 8, 2016, Chilean Law No. 20,940 was published and modified the Labor Code by introducing, among other things, changes to the formation of trade unions, the election of inter-company union delegates, the presence of women on union boards, anti-union practices and related sanctions, and collective negotiations. Due to these changes to the labor regulations, we may face an increase in our expenses that may have a significant adverse effect on our business, financial condition and results of operations.
Lawsuits and arbitrations could adversely impact us.
We are party to a range of lawsuits and arbitrations involving different matters as described in Note 22.1 ofto our Consolidated Financial Statements and “Item 8.A. Legal Proceedings.” Although we intend to defend our positions vigorously, our defense of these actions may not be successful and responding to such lawsuits and arbitrations diverts our management’s attention from day-to-day operations. Adverse judgments or settlements in these lawsuits may have a material adverse effect on our business, financial condition and results of operations. In addition, our strategy of being a world leader includes entering into commercial and production alliances, joint ventures and acquisitions to improve our global competitive position. As these operations increase in complexity and are carried out in different jurisdictions, we may be subject to legal proceedings that, if settled against us, could have a material adverse effect on our business, financial condition and results of operations.
We have operations in multiple jurisdictions with differing regulatory, tax and other regimes.
We operate in multiple jurisdictions with complex regulatory environments that are subject to different interpretations by companies and respective governmental authorities. These jurisdictions may have different tax codes, environmental regulations, labor codes and legal framework, which adds complexity to our compliance with these regulations. Any failure to comply with such regulations could have a material adverse effect on our business, financial condition and results of operations.
| 5 |
Environmental laws and regulations could expose us to higher costs, liabilities, claims and failure to meet current and future production targets.
Our operations in Chile are subject to national and local regulations relating to environmental protection. In accordance with such regulations, we are required to conduct environmental impact studies or statements before we conduct any new projects or activities or significant modifications of existing projects that could impact the environment or the health of people in the surrounding areas. We are also required to obtain an environmental license for certain projects and activities. The Chilean Environmental Evaluation Service (Servicio de Evaluación Ambiental) evaluates environmental impact studies submitted for its approval. The public, government agencies or local authorities may review and challenge projects that may adversely affect the environment, either before these projects are executed or once they are operating, if they fail to comply with applicable regulations. In order to ensure compliance with environmental regulations, Chilean authorities may impose fines up to approximately US$9 million per infraction, revoke environmental permits or temporarily or permanently close facilities, among other enforcement measures.
Chilean environmental regulations have become increasingly stringent in recent years, both with respect to the approval of new projects and in connection with the implementation and development of projects already approved, and we believe that this trend is likely to continue. Given public interest in environmental enforcement matters, these regulations or their application may also be subject to political considerations that are beyond our control.
We regularly monitor the impact of our operations on the environment and on the health of people in the surrounding areas and have, from time to time, made modifications to our facilities to minimize any adverse impact. Future developments in the creation or implementation of environmental requirements or their interpretation could result in substantially increased capital, operation or compliance costs or otherwise adversely affect our business, financial condition and results of operations.
The success of our current investments at the Salar de Atacama and Nueva Victoria is dependent on the behavior of the ecosystem variables being monitored over time. If the behavior of these variables in future years does not meet environmental requirements, our operation may be subject to important restrictions by the authorities on the maximum allowable amounts of brine and water extraction. For example, on December 13, 2017, the First Environmental Court of Antofagasta ordered the temporary and partial closure of certain water extraction wells located in the Salar de Llamara. These wells allow the Company to extract approximately 124 liters per second of water, almost 15% of the water used in the Company´s operations in the First Region of Chile for iodine and nitrate production. In October 2018, the First Environmental Court of Antofagasta accepted the Company’sour claim, and dismissed the restrictions without prejudice. It is possible that third parties could seek to reinstate these restrictions in the future. On December 26, 2019, the First Environmental Court of Antofagasta ruled that the environmental compliance plan presented by SQM Salar S.A. with respect to the Salar de Atacama and approved by the Chilean Environmental Authority (Superintendencia del Medio Ambiente) or SMA, in January 2019 did not comply with certain proposed measures of the completeness and efficiency requirements of the Chilean environmental legislation.
SQM Salar S.A. has proposed to the SMA a new environmental compliance plan, which is currently subject to review. We believe that the new proposed environmental compliance plan, safeguards the protection of the environment and is evaluating all courses of action available under applicable law with respect to this ruling.
Our future development depends on our ability to sustain future production levels, which requires additional investments and the submission of the corresponding environmental impact studies or statements. If we fail to obtain approval or required environmental licenses, our ability to maintain production at specified levels will be seriously impaired, thus having a material adverse effect on our business, financial condition and results of operations.
In addition, our worldwide operations are subject to international and other local environmental regulations. Since environmental laws and regulations in the different jurisdictions in which we operate may change, we cannot guarantee that future environmental laws, or changes to existing environmental laws, will not materially adversely impact our business, financial condition and results of operations.
Our water supply could be affected by geological changes or climate change.
Our access to water may be impacted by changes in geology, climate change or other natural factors, such as wells drying up or reductions in the amount of water available in the wells or rivers from which we obtain water, that we cannot control. Any such change may have a material adverse effect on our business, financial condition and results of operations.
Any loss of key personnel may materially and adversely affect our business.
Our success depends in large part on the skills, experience and efforts of our senior management team and other key personnel. The loss of the services of key members of our senior management or employees with critical skills could have a negative effect on our business, financial condition and results of operations. If we are not able to attract or retain highly skilled, talented and qualified senior managers or other key personnel, our ability to fully implement our business objectives may be materially and adversely affected.
A significant percentage of our shares are held by two principal shareholder groups who may have interests that are different from that of other shareholders and of each other. Any change in such principal shareholder groups may result in a change of control of the Company or of its Board of Directors or its management, which may have a material adverse effect on our business, financial condition and results of operations.
As of December 5, 2018,31, 2020, two principal shareholder groups held in the aggregate 55.77%57.86% of theour total outstanding shares, of SQM, including a majority of our Series A common shares, and have the power to elect sevensix of our eight directors. The interests of the two principal shareholder groups may in some cases differ from those of other shareholders and of each other.
OneAs of December 31, 2020, one principal shareholder group is Sociedad de Inversiones Pampa Calichera S.A. and its related companies, Inversiones Global Mining Chile Limitada and Potasios de Chile S.A. (together, the Pampa Group, as defined in “Item 7.A. Major Shareholders”“Pampa Group”), which currently ownsowned approximately 32% of the total outstanding shares of SQM. As reported to the CMF by Inversiones TLC SpA, a subsidiary of Tianqi Lithium Corporation (“Tianqi”), on December 5, 2018, Inversiones TLC SpA currently owns 25.86% of the total shares of SQM.
Until November 30, 2 018,2018, the CMF considered the Pampa Group the controller of SQM. On this date, the CMF determined that in accordance with the distribution of the shares of SQM, “the Pampa Group does not exert decisive power over the management of the Company, and is therefore not considered a controlling shareholder”. The CMF could change its decision in the future if circumstances change. See “Item 7.A. Major Shareholders”.
Nutrien (formerly PCS before the merger with Agrium Inc. on January 1, 2018) was one of the principal shareholders of the Company. On June 1, 2018, Nutrien sold its Series B shares of SQM, representing 7.66% of the total shares of SQM, held through Inversiones El Boldo Limitada, Inversiones PCS Chile Limitada and Inversiones RAC Chile, in a bookbuild auction process (subasta de libro de ordenes) on the Santiago Stock Exchange..On December 5, 2018, Inversiones TLC SpA, a subsidiary of Tianqi Lithium Corporation (“Tianqi”), acquired the Series A shares of SQM held by Nutrien through Inversiones El Boldo Limitada, Inversiones PCS Chile Limitada and Inversiones RAC Chile, representing 23.77% of the total shares of SQM. Tianqi currently owns 23.77% of the total outstanding shares of SQM.
The divestiture by the Pampa Group or Tianqi, or potential changes in the circumstances that have led to the determination of the CMF related to the controller status of the shareholders of the Company, or a combination thereof, may have a material adverse effect on our business, financial condition and results of operations.
Tianqi is a significant shareholder and a competitor of the Company, which can increase thecould result in risks of competition.to free competition
Tianqi is a competitor in the lithium business, and as a result of the number of SQM shares that itsit owns, of the Company, it has the right to choose up to three Board members. Under Chilean law, the Company iswe are restricted in itsour ability to decline to provide information about the Company,us, which may include competitively sensitive information, to a director of the Company.our company. On August 27, 2018, Tianqi and the Chilean antitrust regulator, (thethe Chilean National Economic Prosecutor’s Office (Fiscalía Nacional Económica), or FNE, for its initials in Spanish), entered into an extrajudicial settlement agreement, under which certain restrictive measures were implemented in order to (i) maintain the competitive conditions of the lithium market, (ii) mitigate the risks described in the agreement and (iii) limit Tianqi’s access to certain information of the Company and its subsidiaries, which areis defined as “sensitive information” under the agreement, were implemented.agreement.
During the approval process of the extrajudicial agreement before the FNE, the Companywe expressed itsour concerns regarding the measures contained in the extrajudicial agreement since, in the Company’s opinion, the measures (i) it could not effectively resolve the risks that Tianqi and the FNE have sought to mitigate, (ii) they are not correctly orientedsufficient to avoid the access to the Company’sour “sensitive information” that, in the possession of a competitor, could harm the Companyus and the proper functioning of the market and (iii) it could contradict the Corporation Law in Chile.Chilean Corporations Act.
| 7 |
The presence of a shareholder which is at the same time a competitor of the Companyours and the right of this competitor to choose Board members could generate risks to free competition and/or increase the risks of an investigation of free competition against the Company,us, whether in Chile or in other countries, all of which could have ana material adverse material effect inon our business.business, financial condition and results of operations.
Our information technology systems may be vulnerable to disruption which could place our systems at risk from data loss, operational failure, or compromise of confidential information.
We rely on various computer and information technology systems, and on third party developers and contractors, in connection with our operations, including two networks that link our principal subsidiaries to our operating and administrative facilities in Chile and other parts of the world and ERP software systems, which are used mainly for accounting, monitoring of supplies and inventories, billing, quality control, research activities, and production process and maintenance control. In addition, we use Cloudcloud technologies, which allows us to support new business processes relatedand respond quickly and at low cost to changing conditions in our business and of the Internet of Things (IoT) and Advanced Analytics, which allow us to collect information enabling us to advance the predictive short-term and medium-term analysis of our production process and its possible automation in the long term.markets. Our information technology systems are susceptible to disruption, damage or failure from a variety of sources, including errors by employees or contractors, computer viruses, cyber-attacks, misappropriation of data by outside parties, and various other threats. We have taken certain measures to identify and mitigate these risks including conducting a cybersecurity review and initiating process automation and digitalization projects at various sites with the object of reducing operational risk and improving security and operational efficiency, which also includes modernization of existing information technology infrastructure and communications systems. However, we cannot guarantee that due to the increasing sophistication of cyber-attacks our systems will not be compromised and because we do not maintain specialized cybersecurity insurance, our insurance coverage for protection against cybersecurity risk may not be sufficient. During the 2020, and as a result of the Covid-19 pandemic we renewed the perimeter security platform, implemented security updates and applications through the cloud, and the remote network access platform was strengthened and a plan to raise awareness of best practices in the use of telework was also provided. Cybersecurity breaches could result in losses of assets or production, operational delays, equipment failure, inaccurate recordkeeping, or disclosure of confidential information, any of which could result in business interruption, reputational damage, lost revenue, litigation, penalties or additional expenses and could have a material adverse effect on our business, financial condition and results of operations.
Recent international trade tensions could have a negative effect on our financial performance.
Economic conditions in China, an important market for the Company, are sensitive to global economic conditions. The global financial markets have experienced significant disruptions in the past, including the recent international trade disputes and tariff actions announced by the United States, China and certain other countries. The U.S. government has imposed significant tariffs on Chinese goods, and Chinese government has, in turn, imposed tariffs on certain goods manufactured in the United States. There is no assurance that the list of goods impacted by additional tariffs will not be expanded or the tariffs will not be increased materially. We are unable to predict how China or U.S. government policy, in particular, the outbreak of a trade war between China and the United States and additional tariffs on bilateral imports, may continue to impact global economic conditions. If the list of goods is further expanded or the tariff is further increased, global economic conditions of both countries could be impacted, and growth in demand for lithium or other commodities could decrease, which may have a material adverse effect on our business, financial condition and results of operations.
Outbreaks of communicable infections or diseases, or other public health pandemics, such as the outbreak of the novel coronavirus (COVID-19) currently being experienced around the world, have impacted and may further impact the markets in which we, our customers and our suppliers operate or market and sell products and could have a material adverse effect on our operations business, financial condition and results of operations.
Disease outbreaks and other public health conditions, such as the global outbreak of COVID-19 currently being experienced, in markets in which we, our customers and our suppliers operate, could have a significant negative impact on our revenues, profitability and business. Due to the COVID-19 outbreak, there has been a substantial curtailment and disruption of business activities around the world. These curtailments and disruptions include: manufacturing and other work stoppages, factory and other business closings, slowdowns or delays; restrictions and limitations placed on workers and factories, including quarantines and other limitations on the ability to travel and return to work; shortages and delays in production or shipment of products or raw materials; and border closures. In response to the spread of COVID-19, the Chilean government closed its borders for entry by non-resident foreigners for an extended period of time, prohibited the docking of cruise ships at Chilean ports, from time to time imposed quarantines on certain regions of Chile and imposed a nationwide curfew. These measures have not materially impacted imports or exports to or from Chile. However, we have seen some impacts related to the shipment of products in and out of various other countries and regions, which could further negatively impact our ability to ship products to customers and receive supplies from suppliers. Furthermore, the COVID-19 outbreak could disrupt the supply chain for materials we need to implement the planned expansions of our production capacity.
As a precaution, our management has implemented several measures to help reduce the speed at which COVID-19 may spread in our Company, including measures to mitigate the spread in the workplace, significant reductions in employee travel and a mandatory quarantine for people who have arrived from high-risk destinations, in consultation with governmental and international health organization guidelines, and will continue to implement measures consistent with the evolving COVID-19 situation. While these measures have been implemented to reduce the risk of the spread of the virus in our facilities, there can be no assurance that these measures will reduce or limit the impact of COVID-19 on our operations, business, financial condition or results of operations. Our operations could be stopped as a result of, among other reasons, regulatory restrictions or a significant outbreak of the virus among our staff, which could prevent employees from reporting to shifts.
While the global impacts of the COVID-19 pandemic are constantly changing, international financial markets have reflected the uncertainty associated with the slowdown of the global economy and the potential impact if businesses, workers, customers and others are prevented or restricted from conducting business activities due to quarantines, business closures or other restrictions imposed by businesses or governmental authorities in response to the COVID-19 outbreak. An economic downturn could affect demand for the products of our customers by their end-users and, in turn, demand from our customers for our products.
If our stakeholders and other constituencies believe we fail to appropriately address sustainability and other environmental, social and governance (ESG) concerns it may adversely affect our business.
In October 2020, we announced our sustainable development plan, which includes voluntarily expanding our monitoring systems, promoting better and more profound conversations with neighboring communities and becoming carbon neutral and reducing water by 65% and brine extraction by 50%. We also announced a goal of obtaining international certifications and participating in international sustainability indices which we consider essential for a sustainable future.
While we are dedicated to our efforts related to sustainability, if we fail to address appropriately all relevant stakeholders’ concerns in connection with ESG criteria, we may face opposition, which could negatively affect our reputation, delay operations, or lead to litigation threats or actions. If we do not maintain our reputation with key stakeholders and constituencies and effectively manage these sensitive issues, they could adversely affect our business, results of operations, and financial condition.
Climate change can create physical risks and other risks that could adversely affect our business and operations and adverse weather conditions or significant changes in weather patterns could have a material adverse impact on our results of operations.
The impact of climate change on our operations and our customers’ operations remains uncertain, but the physical effects of climate change could have an adverse effect on us and our customers as experts believe that climate change may be associated with more extreme weather conditions. These effects could include, but may not be limited to, changes in regional weather patterns, including drought and rainfall levels, water availability, sea levels, storm patterns and intensities and temperature levels, including increased volatility in seasonal temperatures via excessively hot or cold temperatures. These extreme weather conditions could vary by geographic location.
Severe climate change could have an adverse effect on our costs, production, or sales, especially with respect to our solar operations in the Salar de Atacama, which require hot, arid summer weather conditions. Prolonged periods of precipitation or cooler weather during the evaporation season could reduce evaporation rates, leading to decreases in our production levels. Similarly, changes in hydrology could affect brine levels, impacting our mineral harvesting process. The occurrence of these climate events at our solar operations could lead to decreased production levels, increased operating costs and require us to make significant additional capital expenditures.
Weather conditions have historically caused volatility in the agricultural industry (and indirectly in our results of operations) by causing crop failures or significantly reduced harvests, which can adversely affect application rates, demand for our plant nutrition products and our customers’ creditworthiness. Weather conditions can also lead to a reduction in farmable acres, flooding, drought or wildfires, which could also adversely impact growers’ crop yields and the uptake of plant nutrients, reducing the need for application of plant nutrition products for the next planting season which could result in lower demand for our plant nutrition products and negatively impact the prices of our products.
Any prolonged change in weather patterns in our markets, as a result of climate change or otherwise, could have a material adverse impact on the results of our operations.
| 9 |
Risks Relating to Financial Markets
Currency fluctuations may have a negative effect on our financial performance.
We transact a significant portion of our business in U.S. dollars, and the U.S. dollar is the currency of the primary economic environment in which we operate. In addition, the U.S. dollar is our functional currency for financial statement reporting purposes. A significant portion of our costs, however, is related to the Chilean peso. Therefore, an increase or decrease in the exchange rate between the Chilean peso and the U.S. dollar would affect our costs of production. The Chilean peso has been subject to large devaluations and revaluations in the past and may be subject to significant fluctuations in the future. As of December 31, 2018,2020, the Chilean peso exchange rate was Ch$694.77710.95 per U.S. dollar, while as of December 31, 2017,2019 the Chilean peso exchange rate was Ch$614.75748.74 per U.S. dollar. The Chilean peso therefore depreciatedappreciated against the U.S. dollar by 13.0%5.0% in 2018.2020. As of AprilMarch 1, 2019,2021, the Observed Exchange Rate was Ch$678.53719.91 per U.S. dollar.
As an international company operating in several other countries, we also transact business and have assets and liabilities in other non-U.S. dollar currencies, such as, among others, the Euro, the South African rand, the Mexican peso, the Chinese yuan, the Thai baht and the Brazilian real.
As a result, fluctuations in the exchange rates of such foreign currencies to the U.S. dollar may have a material adverse effect on our business, financial condition and results of operations.
Interest rate fluctuations may have a material impact on our financial performance
As of December 31, 2018, we had US$70 million of outstanding short and long-term debt bearing interest based on LIBOR. A relative increase in the rate could materially impact our business, financial condition and results of operations.
We may be subject to risks associated with the discontinuation, reform or replacement of benchmark indices.
Interest rate, foreign exchange rate and other types of indices which are deemed to be “benchmarks” are the subject of increased regulatory scrutiny and may be discontinued, reformed or replaced. For example, in 2017, the U.K. Financial Conduct Authority announced that it will no longer persuade or compel banks to submit rates for the calculation of the London interbank offered rate (“LIBOR”) benchmark after 2021. This announcement indicates that the continuation of LIBOR on the current basis cannotreform will, and will not be guaranteed after 2021, and it appears likely that LIBOR will be discontinued or modified by 2021. This and other future reforms may, cause benchmarks to be different than they have been in the past, or to disappear entirely, or have other consequences which cannot be fully anticipated which introduces a number of risks for our business. These risks include (i) legal risks arising from potential changes required to document new and existing transactions; (ii) financial risks arising from any changes in the valuation of financial instruments linked to benchmark rates; (iii) pricing risks arising from how changes to benchmark indices could impact pricing mechanisms on some instruments; (iv) operational risks arising from the potential requirement to adapt IT systems, trade reporting infrastructure and operational processes;] and (v) conduct risks arising from the potential impact of communication with customers and engagement during the transition period. TheVarious replacement benchmarks, and the timing of and mechanisms for implementation have not yet been confirmedare being considered. The transition away from LIBOR to risk-free reference rates (RFRs) requires financial firms to make a variety of internal changes, for example updating front-and back-office systems, retraining staff and redesigning processes, as well as potentially modifying or renegotiating potentially thousands of LIBOR-linked contracts. All banks and other financial market participants must eliminate their dependence on LIBOR by central banks.this date if they are to avoid disruption when the publication of LIBOR ceases. Although as of December 31, 20182020 we had approximately US$70 million short- and long-term debt that use a LIBOR benchmark, it is not currently possible to determine whether, or to what extent, any such changes would affect us. However, the discontinuation or reformation of existing benchmark rates or the implementation of alternative benchmark rates may have a material adverse effect on our business, results of operations, financial condition and prospects.results of operations.
Risks Relating to Chile
As we are a company based in Chile, we are exposed to Chilean political risks.risks and civil unrest in Chile.
Our business, results of operations, financial condition and prospectsresults of operations could be affected by changes in policies of the Chilean government, other political developments in or affecting Chile, legal changes in the standards or administrative practices of Chilean authorities or the interpretation of such standards and practices, over which we have no control. The Chilean government has modified, and has the ability to modify, monetary, fiscal, tax, social and other policies in order to influence the Chilean economy or social conditions. We have no control over government policies and cannot predict how those policies or government intervention will affect the Chilean economy or social conditions, or, directly and indirectly, our business, financial condition and results of operations. Changes in policies involving exploitation of natural resources, taxation and other matters related to our industry may adversely affect our business, financial condition and results of operations.
We are exposed to economic and political volatility and civil unrest in Chile. Changes in social, political, regulatory and economic conditions or in laws and policies governing foreign trade, manufacturing, development and investment in Chile, as well as crises and political uncertainties in Chile, could adversely affect economic growth in Chile. In October and November 2019, Chile experienced riots and widespread mass demonstrations in Santiago and other major cities in Chile, triggered by an increase in public transportation fares in the city of Santiago, which involved violence and significant property damage and caused commercial disruptions throughout the country. As a result, on October 18, 2019 the Chilean government declared a 15-day period state of emergency and imposed a nighttime curfew in the greater Santiago region and other cities. The state of emergency has since been lifted and the Chilean government has introduced several social reforms, including (i) an immediate 20% increase in government-subsidized pensions; (ii) new insurance programs to cover catastrophic illnesses and medication; (iii) a guaranteed minimum monthly income for wage earners of Ch$350,000 (approximately US$460.95), with the difference between such guaranteed minimum monthly income and the minimum monthly wage (Ch$301,000) to be borne by the Chilean government; (iv) the reversal of a previously announced 9.2% price increase in energy tariffs; and (v) a 40% income tax bracket for individuals earning over Ch$15.0 million (approximately US$19,755.04) a month, increased from 35%. In addition, President Piñera announced a pay cut for members of the Chilean Congress and the highest-paid civil servants and replaced eight ministers of his government. On November 15, 2019, representatives of Chile’s leading political parties agreed to hold a referendum, allowing Chileans to vote on whether to replace the Chilean Constitution. In November 2020, a referendum was held to vote on two matters: (i) whether a new constitution should be enacted and (ii) if so, whether a constituent convention should be comprised of an elected mixed assembly of current Congress members and newly elected persons or entirely comprised of newly-elected citizens. This referendum resulted in strong support for convening a fully elected Constitutional Convention to draft Chile’s new constitution. The election of the members of this convention will be held in April 2021. Each new article of the Constitution would have to be approved by two thirds of the convention. The Constitutional Convention will have approximately one year, starting in April 2021, to complete the draft of the Constitution. An exit referendum with compulsory participation will then be held to ratify the new Constitution.
The long-term effects of this social unrest are hard to predict, but could include slower economic growth, which could adversely affect our profitability and prospects.
| 11 |
Changes to the Chilean Constitution could impact a wide range of rights, including mining rights, water rights and property rights generally, and could affect our business, financial condition and results of operations.
In response to the riots and mass demonstrations that occurred during October and November 2019, the Chilean government held a national referendum in November 2020 which decided that a new Chilean Constitution would be drafted by a special constituent assembly comprised entirely of citizens elected for that task (“Elected Citizens”). As decided in the referendum, all Elected Citizens are to be elected in April 2021 and the draft Chilean Constitution will be presented by the drafters in September or December 2021 (depending on whether an extension is requested) for approval by the citizens of Chile in May or August 2022 (depending on whether an extension is requested). It is expected that the final draft of the new Chilean Constitution will be submitted to a public referendum for approval. The existing Chilean Constitution has been in place since 1980 and any new Chilean Constitution could change the political situation of Chile, potentially changing a wide range of rights, including mining rights, water rights and property rights generally, which could affect the Chilean economy and the business outlook for the country generally and our business, financial condition and results of operations in particular.
Changes in regulations regarding, or any revocation or suspension of ourmining, port or other concessions could negatively affect our business.
Any changes to regulations to which we are subject or adverse changes to our concession rights, or a revocation or suspension of our concessions, could have a material adverse effect on our business, financial condition and results of operations.
Changes in mining or port concessions could affect our operating costs.
We conduct our mining operations, including brine extraction, under exploitation and exploration concessions granted in accordance with provisions of the Chilean constitutionConstitution and related laws and statutes. Our exploitation concessions essentially grant a perpetual right (with the exception of the rights granted to SQM Salar with respect to the Salar de Atacama concessions under the Lease Agreement described above, which expires in 2030) to conduct mining operations in the areas covered by the concessions, provided that we pay annual concession fees. Our exploration concessions permit us to explore for mineral resources on the land covered thereby for a specified period of time and to subsequently request a corresponding exploitation concession. Any changes to the Chilean Constitution with respect to the exploitation and exploration of natural resources and concessions granted as a result of the proposed Constitutional referendum could materially adversely affect our existing exploitation and exploration concessions or our ability to obtain future concessions and could have a material adverse effect on our business, financial condition and results of operations.
We also operate port facilities at Tocopilla, Chile, for the shipment of products and the delivery of raw materials pursuant to maritime concessions, which have been granted under applicable Chilean laws and are normally renewable on application, provided that such facilities are used as authorized and annual concession fees are paid.
Any significant adverse changes to any of these concessions, any changes to regulations to which we are subject or adverse changes to our other concession rights, or a revocation or suspension of any of our concessions, could have a material adverse effect on our business, financial condition and results of operations.
Changes in water rights laws and other regulations could affect our operating costs.business, financial condition and results of operations.
We hold water use rights that are key to our operations. These rights were obtained from the Chilean Water Authority (Dirección General de Aguas) for supply of water from rivers and wells near our production facilities, which we believe are sufficient to meet current operating requirements. However, the Chilean Water Rights Code (Código de Aguas or the “Water Code”) is subject to changes, which could have a material adverse impact on our business, financial condition and results of operations. For example, a series of bills are currently being discussed atby the Chilean National Congress that seek to desalinate seawater for use in mining production processes, amend the Mining Code for water use in mining operations, amend the PoliticalChilean Constitution on water and introduce changes to the regulatory framework governing the terms of inspection and sanction of water. As a result, the amount of water that we can actually use under our existing rights may be reduced or the cost of such use could increase. In addition, any changes to the Chilean Constitution with respect to water rights as a result of the proposed Constitutional referendum could restrict our access to water required for our production operations and materially adversely affect our existing operations or our ability to expand our operations in the future. These and potential future changes to the Water Code, the Chilean Constitution or other relevant regulations could have a material adverse effect on our business, financial condition and results of operations.
| 12 |
The Chilean National Congress is considering a draft bill that declares lithium mining to be in the national interest, which if passed in its current form, could enable the expropriation of our lithium assets.
The Chilean National Congress is currently processing a bill, bulletin 10,638-08, which “Declares the exploitation and commercialization of lithium and Sociedad Química y Minera de Chile S.A. to be of national interest.” The purpose of this bill is to enable the potential expropriation of our assets, or our lithium operations in general. The bill is subject to further discussion in the Chilean National Congress, which includes several possible changes to its current wording. We cannot guarantee that the bill will not eventually be approved by the Chilean National Congress, nor that its final wording will not refer to us or our lithium operations. If the bill is approved as currently drafted, it could have a material adverse effect on our business, financial condition and results of operations.
The Chilean government could levy additional taxes on corporationsmining companies operating in Chile.
In Chile, there is a royalty tax that is applied to mining activities developed in the country.
On September 29, 2014, Law No. 20,780 was published (as amended by Law No. 20,899, The Chilean National Congress is currently processing a bill, bulletin 12,093-08, which proposes to institute a royalty fee of 3% on the “Tax Reform”), introducing significantvalue of extracted minerals. The bill is subject to further discussion in the Chilean National Congress, which includes several possible changes to its current wording. We cannot guarantee that the Chilean taxation system and strengthening the powers of the SII to control and prevent tax avoidance. Subsequently, on February 8, 2016, Law No. 20,899 that simplifies the income tax system and modifies other legal tax provisions was published. As a result of these reforms, open stock corporations like SQM are subject to the partially integrated shareholder tax regime (sistema parcialmente integrado). The corporate tax rate applicable to us increased to 25.5% in 2017 and increased to the maximum rate of 27% in 2018.
Under the partially integrated shareholder taxation regime, shareholders bear the tax on dividends upon payment, but theybill will onlynot eventually be permitted to credit against such shareholder taxes a portion of the Chilean corporate tax paid by us on our earnings, unless the shareholder is resident in a country with a tax treaty in force with Chile. In that case, 100% of the Chilean corporate tax paid by us may be credited against the final taxes at the shareholder level.
As a result, foreign shareholders resident in a non-treaty jurisdiction will be subject to a higher effective tax rate than residents of treaty jurisdictions. There is a temporary rule in effect from January 1, 2017 through December 31, 2019 that treaty jurisdictions for this purpose will include jurisdictions with tax treaties signed with Chile prior to January 1, 2017, whether or not such treaties are in force. This is currently the status of the treaty signed between Chile and United States. After December 31, 2019, if no treaty is in effect, shareholders in those jurisdictions will be subject to a higher effective tax rate.
The Tax Reform tax increase prompted a US$52.3 million increase in our deferred tax liabilities as of December 31, 2014. In accordance with IAS 12, the effects generated by the change in the income tax rate approved by the Tax Reform on income and deferred taxes were applied to the income statement. For purposes of the Company’s statutory consolidated financial statements filed with the CMF, in accordance with the instructions issued by the CMF in its circular 856 of October 17, 2014, the effects generated by the change in the income tax rate were accounted for as retained earnings. The amount charged to equity as of December 31, 2014 was US$52.3 million, thereby giving rise to a difference of US$52.3 million in profit for the year and income tax expense as presented in the Company’s 2014 audited consolidated financial statements in its annual report on Form 20-F compared with profit and income tax expense as presented in the Company’s 2014 statutory consolidated financial statements filed with the CMF.
In addition, in August 2018, a tax reform bill was presented in the Chilean congress, which proposes to reverse the current coexistence of two alternative tax regimes established in the Tax Reform by going back to a fully integrated system with a 100% credit of the corporate tax against individual or foreign entity taxes. Additionally, this tax reform bill seeks to modernize and provide more certainty with respect to the current tax system. For example,National Congress. If the bill proposes to modernize the current ledgers system and to include tax deductions for certain ordinary course business disbursements that are a part of, but not directly associated with, an entity’s primary business activities. Asis approved as currently proposed, we do not expect any material adverse effect on our business from this reform bill. However, we cannot offer any assurance that there will not be additional changes made to the tax bill that would negatively affect our business, results of operations or financial condition.
In addition, the Tax Reform may have other material adverse effects on our business, financial condition and results of operations. Likewise, we cannot assure you that the manner in which the Royalty Law (as defined below) or the corporate tax rate are interpreted and applied will not change in the future. The Chilean government may decide to levy additional taxes on mining companies or other corporations in Chile. Such changesdrafted, it could have a material adverse effect on our business, financial condition and results of operations.
Ratification of the International Labor Organization’s Convention 169 concerning indigenous and tribal peoples might affect our development plans.
Chile, a member of the International Labor Organization (“ILO”), has ratified the ILO’s Convention 169 (the “Indigenous Rights Convention”) concerning indigenous and tribal people. The Indigenous Rights Convention established several rights for indigenous people and communities. Among other rights, the Indigenous Rights Convention states that (i) indigenous groups should be notified and consulted prior to the development of any project on land deemed indigenous, although veto rights are not mentioned, and (ii) indigenous groups have, to the extent possible, a stake in benefits resulting from the exploitation of natural resources in indigenous land. The extent of these benefits has not been defined by the Chilean government. The Chilean government has addressed item (i) above through Supreme Decree No. 66, issued by the Social Development Ministry. This decree requires government entities to consult indigenous groups that may be directly affected by the adoption of legislative or administrative measures, and it also defines criteria for the projects or activities that must be reviewed through the environmental evaluation system that also require such consultation. To the extent that the new rights outlined in the IndigenousIgndigenous Rights Convention become laws or regulations in Chile, judicial interpretations of the convention of those laws or regulations could affect the development of our investment projects in lands that have been defined as indigenous, which could have a material adverse effect on our business, financial condition and results of operations. The Chilean Supreme Court has consistently held that consultation processes must be carried out in the manner prescribed by Indigenous Rights Convention.
The consultation process may cause delays in obtaining regulatory approvals, including environmental permits, as well as public opposition by local and/or international political, environmental and ethnic groups, particularly in environmentally sensitive areas or in areas inhabited by indigenous populations. Furthermore, the omission of the consultation process when required by law may result in the revocation or annulment of regulatory approvals, including environmental permits already granted.
| 13 |
Consequently, operating projects may be affected since the omission of the consultation process, when required by law, could lead to public law annulment actions pursuing the annulment of the environmental permits granted.
However, this risk frequently arises during the environmental assessment phase when the environmental permits are to be obtained. In such scenario, affected parties may take several legal actions to declare null or void the environmental permits that omitted the consultation process, and in some cases, courts have overturned environmental approvals in which consultation was not made as prescribed in the Indigenous Rights Convention.
We are subject to Chilean and international anti-corruption, anti-bribery, anti-money laundering and international trade laws. Failure to comply with these laws could adversely impactIf the Indigenous Rights Convention affects our business and operations.
We are required to be in compliance with all applicable laws and regulations in Chile and internationally with respect to anti-corruption, anti-money laundering, receipt of stolen property, sanctions and other regulatory matters, including the FCPA. Although we and our subsidiaries maintain policies and processes intended to comply with these laws, we cannot ensure that these compliance policies and processes will prevent intentional, reckless or negligent acts committed by our officers or employees.
If we or our subsidiaries fail to comply with any applicable anti-corruption, anti-bribery, receipt of stolen property or anti-money laundering laws, we and our officers and employees may be subject to criminal, administrative or civil penalties and other remedial measures, whichdevelopment plans, it could have a material adverse effectseffect on our and our subsidiaries’ business, financial condition and results of operations. Any investigation of potential violations of anti-corruption, anti-bribery or anti-money laundering laws by governmental authorities in Chile or other jurisdictions could result in an inability to prepare our consolidated financial statements in a timely manner. This could adversely impact our reputation, ability to access the financial markets and ability to obtain contracts, assignments, permits and other government authorizations necessary to participate in our and our subsidiaries’ industry, which, in turn, could have adverse effects on our and our subsidiaries’ business, results of operations and financial condition.
Chile has different corporate disclosure and accounting standards than those you may be familiar with in the United States.
Accounting, financial reporting and securities disclosure requirements in Chile differ in certain significant respects from those required in the United States. Accordingly, the information about us available to you will not be the same as the information available to holders of notessecurities issued by a U.S. company. In addition, although Chilean law imposes restrictions on insider trading and price manipulation, applicable Chilean laws are different from those in the United States, and the Chilean securities markets are not as highly regulated and supervised as the U.S. securities markets.
Chile is located in a seismically active region.
Chile is prone to earthquakes because it is located along major fault lines. The most recent majorDuring 2017-2020, Chile has experienced several earthquakes in Chile, which occurred in April 2017 in the Valparaiso region and in December 2016 in Chiloe Island, had a magnitude of 6.9 and 7.6, respectively,over 6.0 on the Richter scale. There were also earthquakes in 2015, 2014 and 2010the past decade that caused substantial damage to some areas of the country. Chile has also experienced volcanic activity. A major earthquake or a volcanic eruption could have significant negative consequences for our operations and for the general infrastructure, such as roads, rail, and access to goods, in Chile. Although we maintain industry standard insurance policies that include earthquake coverage, we cannot assure you that a future seismic or volcanic event will not have a material adverse effect on our business, financial condition and results of operations.
Risks Relating to our Shares and to our ADSs
The price of our ADSs and the U.S. dollar value of any dividends will be affected by fluctuations in the U.S. dollar/Chilean peso exchange rate.
Chilean trading in the shares underlying our ADSs is conducted in Chilean pesos. The depositary for our ADSs will receive cash distributions that we make with respect to the shares in Chilean pesos. The depositary will convert such Chilean pesos to U.S. dollars at the then prevailing exchange rate to make dividend and other distribution payments in respect of ADSs. If the value of the Chilean peso falls relative to the U.S. dollar, the value of the ADSs and any distributions to be received from the depositary will decrease.
Developments in other emerging markets could materially affect the value of our ADSs and our shares.
The Chilean financial and securities markets are, to varying degrees, influenced by economic and market conditions in other emerging market countries or regions of the world. Although economic conditions are different in each country or region, investor reaction to developments in one country or region can have significant effects on the securities of issuers in other countries and regions, including Chile and Latin America. Events in other parts of the world may have a material effect on Chilean financial and securities markets and on the value of our ADSs and our shares.
| 14 |
The prices of securities issued by Chilean companies, including banks, are influenced to varying degrees by economic and market considerations in other countries. We cannot assure you that future developments in or affecting the Chilean economy, including consequences of economic difficulties in other markets, will not materially and adversely affect our business, financial condition or results of operations.
We are exposed to risks related to the weakness and volatility of the economic and political situation in Asia, the United States, Europe, other parts of Latin America and other nations. Although economic conditions in Europe and the United States may differ significantly from economic conditions in Chile, investors’ reactions to developments in these other countries may have an adverse effect on the market value of securities of Chilean issuers.
If these, or other nations’ economic conditions deteriorate, the economy in Chile, as both a neighboring country and a trading partner, could also be affected and could experience slower growth than in recent years, with possible adverse impact on our borrowers and counterparties.
Chile has considerable economic ties with China, the United States and Europe. In 2020, approximately 37.2% of Chile’s exports went to China, mainly copper. China’s economy has grown at a strong pace in recent times, but a slowdown in economic activity in China may affect Chile’s GDP and export growth as well as the price of copper, which is Chile’s main export. Chile exported approximately 14.0% of total exports to the United States and 8.8% to Europe in 2020.
Chile was recently involved in international litigation with Bolivia regarding maritime borders. We cannot assure you that crises and political uncertainty in other Latin American countries will not have an adverse effect on Chile, the price of our securities or our business.
The volatility and low liquidity of the Chilean securities markets could affect the ability of our shareholders to sell our ADSs.
The Chilean securities markets are substantially smaller, less liquid and more volatile than the major securities markets in the United States. The volatility and low liquidity of the Chilean markets could increase the price volatility of our ADSs and may impair the ability of a holder to sell our ADSs or to sell the shares underlying our ADSs into the Chilean market in the amount and at the price and time the holder wishes to do so.
Our share or ADS price may react negatively to future acquisitions, divestitures, capital increases and investments.
As world leaders in our core businesses, part of our strategy is to look for opportunities that will allow us to consolidate and strengthen our competitive position in jurisdictions in which we currently do not operate. Pursuant to this strategy, we may carry out acquisitions or joint ventures relating to any of our businesses or to new businesses in which we believe we may have sustainable competitive advantages. We may also seek to strengthen our leadership position in our core businesses through divestitures of certain assets or stakes in subsidiaries that we believe will allow us to concentrate our efforts on our core businesses. Depending on our capital structure at the time of suchany acquisitions or joint ventures, we may need to raise significant debt and/or equity which will affect our financial condition and future cash flows. We may also carry out capital increases in order to raise capital for our capital plan. In addition, any divestitures we effect may not result in strengthening our position in our core businesses as anticipated. Any change in our financial condition could affect our results of operations and negatively impactingimpact our share or ADS price.
ADS holders may be unable to enforce rights under U.S. securities laws.
Because we are a Chilean company subject to Chilean law, the rights of our shareholders may differ from the rights of shareholders in companies incorporated in the United States, and ADS holders may not be able to enforce or may have difficulty enforcing rights currently in effect under U.S. federal or state securities laws.
| 15 |
Our Companycompany is an open stock corporation incorporated under the laws of the Republic of Chile. Most of our directors and officers reside outside the United States, principally in Chile. All or a substantial portion of the assets of these persons are located outside the United States. As a result, if any of our shareholders, including holders of our ADSs, were to bring a lawsuit against our officers or directors in the United States, it may be difficult for them to effect service of legal process within the United States upon these persons. Likewise, it may be difficult for them to enforce judgments obtained in United States courts based upon the civil liability provisions of the federal securities laws in the United States against them in the United States.
In addition, there is no treaty between the United States and Chile providing for the reciprocal enforcement of foreign judgments. However, Chilean courts have enforced judgments rendered in the United States, provided that the Chilean court finds that the United States court respected basic principles of due process and public policy. Nevertheless, there is doubt as to whether an action could be brought successfully in Chile in the first instance on the basis of liability based solely upon the civil liability provisions of the United States federal securities laws.
As preemptive rights may be unavailable for our ADS holders, they have the risk of their holdings being diluted if we issue new stock.
Chilean laws require companies to offer their shareholders preemptive rights whenever issuing new shares of capital stock so shareholders can maintain their existing ownership percentage in a company. If we increase our capital by issuing new shares, a holder may subscribe for up to the number of shares that would prevent dilution of the holder’s ownership interest.
If we issue preemptive rights, United States holders of ADSs would not be able to exercise their rights unless a registration statement under the Securities Act were effective with respect to such rights and the shares issuable upon exercise of such rights or an exemption from registration were available. We cannot assure holders of ADSs that we will file a registration statement or that an exemption from registration will be available. We may, in our absolute discretion, decide not to prepare and file such a registration statement. IfAlthough in connection with the pending capital increase approved by our shareholders on January 22, 2021, we expect to file a registration statement that would permit holders of ADSs to exercise preemptive rights, if our ADS holders were unable to exercise their preemptive rights because we did not file a registration statement, the ADS depositary bank would attempt to sell their rights and distribute the net proceeds from the sale to them, after deducting the depositary’s fees and expenses. If the depositary could not sell the rights, they would expire and have no further value and holders of ADSs would not realize any value from them. In either case, ADS holders’ equity interests in us would be diluted in proportion to the increase in our capital stock.
If we were classified as a Passive Foreign Investment Company by the U.S. Internal Revenue Service, there could be adverse consequences for U.S. investors.
We believe that we were not classified as a Passive Foreign Investment Company (“PFIC”) for 2018.2020. Characterization as a PFIC could result in adverse U.S. tax consequences to you if you are a U.S. investor in our shares or ADSs. For example, if we (or any of our subsidiaries) are a PFIC, our U.S. investors may become subject to increased tax liabilities under U.S. tax laws and regulations and will become subject to burdensome reporting requirements. The determination of whether or not we (or any of our subsidiaries or portfolio companies) are a PFIC is made on an annual basis and will depend on the composition of our (or their) income and assets from time to time. See “Item 10.E. Taxation—Material United States Tax Considerations.”
Changes in Chilean tax regulations could have adverse consequences for U.S. investors.
Currently cash dividends paid by us to foreign shareholders are subject to a 35% Chilean withholding tax. When the Company pays a corporate income tax on the income from which the dividend is paid, known as a “First Category Tax”, a credit for all or a portion of the full amount of the First Category Tax, depending on the jurisdiction of the foreign shareholder, effectively reduces the rate of Withholding Tax. Foreign shareholders resident in a jurisdiction with a tax treaty in force with Chile will be credited with 100% of the Chilean corporate tax paid by us against the final taxes at the shareholder level. Foreign shareholders resident in a non-treaty jurisdiction will be subject to a higher effective tax rate on dividends because only a portion of the Chilean corporate tax paid by us will be credited against the final taxes at the shareholder level. There is a temporary rule in effect since January 1, 2017, which has been extended to December 31, 2026, that provides that treaty jurisdictions for this purpose will include jurisdictions with tax treaties signed with Chile prior to January 1, 2020, even if such treaties are not in force. This is currently the status of the treaty signed between the United States and Chile.
Additionally, pursuant to the current social and political agenda, it is expected that the Chilean Government, based on a report prepared on January 2021 by a commission of experts, will introduce a new tax reform bill aimed at limiting tax exemptions and/or preferential tax treatments contained in the Chilean tax legislation, such as the exemption on capital gains arising from the sale of shares that are publicly traded and have a high presence in the stock exchange.
Changes in Chilean tax regulations could have adverse consequences for U.S. investors. See “Item 3.D. Risk Factors—Risks Relating to Chile—The Chilean Government Could Levy Additional Taxes on Corporations Operating in Chile” and “Item 10.E. Taxation—Material Chilean Tax Considerations.”
General Risk Factors
Our measures to minimize our exposure to bad debt may not be effective and a significant increase in our accounts receivable coupled with the financial condition of customers may result in losses that could have a material adverse effect on our business, financial condition and results of operations.
Potentially negative effects of global economic conditions on the financial condition of our customers may include the extension of the payment terms of our accounts receivable and may increase our exposure to bad debt. While we have implemented certain safeguards, such as using credit insurance, letters of credit and prepayment for a portion of sales, to minimize the risk, we cannot assure you that such safeguards will be effective and a significant increase in our accounts receivable coupled with the financial condition of customers may result in losses that could have a material adverse effect on our business, financial condition and results of operations.
Quality standards in markets in which we sell our products could become stricter over time.
In the markets in which we do business, customers may impose quality standards on our products and/or governments may enact stricter regulations for the distribution and/or use of our products. As a result, if we cannot meet such new standards or regulations, we may not be able to sell our products. In addition, our cost of production may increase in order to meet any such newly imposed or enacted standards or regulations. Failure to sell our products in one or more markets or to important customers could materially adversely affect our business, financial condition and results of operations.
Our business is subject to many operating and other risks for which we may not be fully covered under our insurance policies.
Our facilities and business operations in Chile and abroad are insured against losses, damage or other risks by insurance policies that are standard for the industry and that would reasonably be expected to be sufficient by prudent and experienced persons engaged in businesses similar to ours.
We may be subject to certain events that may not be covered under our insurance policies, which could have a material adverse effect on our business, financial condition and results of operations. Additionally, as a result of major earthquakes and unexpected rains and flooding in Chile, as well as other natural disasters worldwide, conditions in the insurance market have changed and may continue to change in the future, and as a result, we may face higher premiums and reduced coverage, which could have a material adverse effect on our business, financial condition and results of operations.
| 17 |
Our water supply could be affected by geological changes or climate change.
Our access to water may be impacted by changes in geology, climate change or other natural factors, such as wells drying up or reductions in the amount of water available in the wells or rivers from which we obtain water, that we cannot control. The use of seawater for future or current operations could increase our operating costs. Any such change may have a material adverse effect on our business, financial condition and results of operations.
Any loss of key personnel may materially and adversely affect our business.
Our success depends in large part on the skills, experience and efforts of our senior management team and other key personnel. The loss of the services of key members of our senior management or employees with critical skills could have a negative effect on our business, financial condition and results of operations. If we are not able to attract or retain highly skilled, talented and qualified senior managers or other key personnel, our ability to fully implement our business objectives may be materially and adversely affected.
We are subject to Chilean and international anti-corruption, anti-bribery, anti-money laundering and international trade laws. Failure to comply with these laws could adversely impact our business, financial condition and results of operations.
We are required to be in compliance with all applicable laws and regulations in Chile and internationally with respect to anti-corruption, anti-money laundering and other regulatory matters, including the FCPA. Although we and our subsidiaries maintain policies and processes intended to comply with these laws, we cannot ensure that these compliance policies and processes will prevent intentional, reckless or negligent acts committed by our officers or employees.
If we or our subsidiaries fail to comply with any applicable anti-corruption, anti-bribery, anti-money laundering or other similar laws, we and our officers and employees may be subject to criminal, administrative or civil penalties and other remedial measures, which could have material adverse effects on our and our subsidiaries’ business, financial condition and results of operations. Any investigation of potential violations of anti-corruption, anti-bribery or anti-money laundering laws by governmental authorities in Chile or other jurisdictions could result in an inability to prepare our consolidated financial statements in a timely manner. This could adversely impact our reputation, ability to access the financial markets and ability to obtain contracts, assignments, permits and other government authorizations necessary to participate in our and our subsidiaries’ industry, which, in turn, could have adverse effects on our and our subsidiaries’ business, financial condition and results of operations.
| ITEM 4. | INFORMATION ON THE COMPANY |
4.A. History and Development of the Company
Historical Background
Sociedad Química y Minera de Chile S.A. is an open stock corporation organized under the laws of the Republic of Chile. We were constituted by public deed issued on June 17, 1968 by the Notary Public of Santiago, Mr. Sergio Rodríguez Garcés. Our existence was approved by Decree No. 1,164 of June 22, 1968 of the Ministry of Finance, and we were registered on June 29, 1968 in the Registry of Commerce of Santiago, on page 4,537 No. 1,992. Our headquarters is located at El Trovador 4285, Fl. 6, Las Condes, Santiago, Chile. Our telephone number is +56 2 2425-2000. We are legally referred to by our full name Sociedad Química y Minera de Chile S.A. as well as commercially by the abbreviated name “SQM.” Our Website is www.sqm.com. The information contained on or linked from our website is not included as part of, or incorporated by reference into this report. The SEC maintains a website that contains reports, proxy and information statements, and other information regarding issuers that file electronically with the SEC, such as our company, at www.sec.gov.
| 18 |
Commercial exploitation of the caliche ore deposits in northern Chile began in the 1830s, when sodium nitrate was extracted from the ore for use in the manufacturing of explosives and fertilizers. By the end of the nineteenth century, nitrate production had become the leading industry in Chile, and the country was the world’s leading supplier of nitrates. The accelerated commercial development of synthetic nitrates in the 1920s and the global economic depression in the 1930s caused a serious contraction of the Chilean nitrate business, which did not recover significantly until shortly before the Second World War. After the war, the widespread commercial production of synthetic nitrates resulted in a further contraction of the natural nitrate industry in Chile, which continued to operate at depressed levels into the 1960s.
We were formed in 1968 through a joint venture between Compañía Salitrera Anglo Lautaro S.A. (“Anglo Lautaro”) and Corfo, a Chilean government entity. Three years after our formation, in 1971, Anglo Lautaro sold all of its shares to Corfo, and we were wholly owned by the Chilean government until 1983. In 1983, Corfo began a process of privatization by selling our shares to the public and subsequently listing such shares on the Santiago Stock Exchange. By 1988, all of our shares were publicly owned. Our ADSs have traded on the NYSE under the ticker symbol “SQM” since 1993. Each ADS represents one Series B common share. We accessed international capital markets for the issuance of additional ADSs in 1995 and 1999.
Since our inception, we have produced nitrates and iodine, which are obtained from the caliche ore deposits in northern Chile. In 1985, we began to use heap leaching processes to extract nitrates and iodine, and in 1986 we started to produce potassium nitrate at our Coya Sur facility. Between 1994 and 1999, we invested approximately US$300 million in the development of the Salar de Atacama project in northern Chile, which has enabled us to produce potassium chloride, lithium carbonate, lithium hydroxide, potassium sulfate and boric acid.
From 2000 through 2004, we principally consolidated the investments carried out in the preceding five years. We focused on reducing costs and improving efficiencies throughout the organization. In addition, in 2001, we signed a commercial distribution agreement with the Norwegian company Yara International ASA, in order to take advantage of cost synergies in the Specialty Plant Nutrition business line.
Starting in 2005, we began strengthening our leadership position in our core businesses through a combination of capital expenditures and advantageous acquisitions and divestitures. Our acquisitions have included the Kemira Emirates Fertiliser Company (“Kefco”) in Dubai in 2005 and the iodine business of Royal DSM N.V. (“DSM”) in 2006. We also entered into a number of joint ventures, including a joint venture with Migao Corporation (“Migao”), signed in 2008, for the production of potassium nitrate, and SQM VITAS, our joint venture with the French Roullier Group. Pursuant to the latter joint venture, in 2010, we launched a new line of soluble phosphate products, and in 2012 we built new plants for the production of water-soluble fertilizers in Brazil (Candeias), Peru and South Africa (Durban). We also sold: (i) Fertilizantes Olmeca, our former Mexican subsidiary, in 2006, (ii) our stake in Impronta S.R.L., our former Italian subsidiary, in 2007 and (iii) our former butyllithiumbutyl lithium plant located in Houston, Texas, in 2008. These sales allowed us to concentrate our efforts on our core products.
TheOur capital expenditure program has allowed us to add new products to our product lines and increase the production capacity of our existing products. In 2005, we started production of lithium hydroxide at a plant in the Salar del Carmen, near the city of Antofagasta in the north of Chile. In 2007, we completed the construction of a new prilling and granulating plant for nitrates in Coya Sur. In 2011, we completed expansions of our lithium carbonate capacity, achieving 48,000 metric tons of capacity per year. Since 2010, we have continued to expand our production capacity of potassium products in our operations in the Salar de Atacama. In 2011, we completed the construction of a new potassium nitrate facility in Coya Sur, increasing our overall production capacity of potassium nitrate by 300,000 metric tons per year. In 2013, we completed expansions in the production capacity of our iodine plants in Nueva Victoria. Our capital expenditure program also includes exploration for metallic minerals. Our exploration efforts have led to discoveries that in some cases may result in sales of the discovery and the generation of royalty income in the future. Within this context, in 2013 we sold our royalty rights to the Antucoya mining project to Antofagasta Minerals.
| 19 |
In 2014, we invested in the development of new extraction sectors and production increases in both nitrates and iodine at Nueva Victoria, reaching an approximate production capacity (including the Iris facility) of 8,500 metric tons per year of iodine at the facility.
In 2015, we focused on increasing the efficiency of our operations. Within this context, we announced a plan to restructure our iodine and nitrate operations. In an effort to take advantage of our highly efficient production facilities at our Nueva Victoria site, we decided to suspend the mining and nitrate operations and reduce iodine production at our Pedro de Valdivia site. During 2017, we increased our iodine production capacity at Nueva Victoria to approximately 10,000 metric tons per year. We continued expanding in 2018, and today, including Pedro de Valdivia and Nueva Victoria, our current effective iodine capacity is approximately 14,000 metric tons per year.
In 2016, we entered into a 50/50 joint venture with Lithium Americas to develop the Minera Exar lithium project in Caucharí-Olaroz in the Jujuy province of Argentina. WeOur interest was sold to Ganfeng Lithium Netherlands Co., BV in 2018. Ganfeng is responsible for a US$50 million deferred payment to us if certain sales goals are met by the project. In 2016, we also made a capital contribution of US$20 million to Elemental Minerals Limited (“Elemental Minerals”), an Australian based company whose main assets are various potassium deposits in the Republic of Congo. We invested approximately US$20 million in exchange for 18% of the company, and a right of first refusal for approximately 20% of the total potash production of Elemental Minerals. Following this transaction at the end of 2016, Elemental Minerals changed its name to Kore Potash Limited. The State General Reserve Fund of Oman contributedinvested US$20 million. These investments are not included in the capital expenditure program amounts discussed in the section below. These investments were carried out with internal financing. In 2018, SQM Potasio sold to Ganfeng Lithium Netherlands Co., BV (Ganfeng) its entire shareholding and irrevocable contributions in the Minera Exar project joint venture (“Exar”). Exar has paid SQM Potasio all outstanding loans it received from the company; and Exar has paid SQM for the services rendered to Exar during the project's development stage. SQM received cash of US$87.5 million for its joint venture interest in Exar, and Gangfeng is responsible for a US$50 million deferred payment to SQM if certain sales goals are met by the project.
In 2017, we continued to expand our operations outside Chile and, together with our subsidiary SQM Australia Pty, we entered into an agreement to acquire 50% of the assets of the MountMt. Holland lithium project in Western Australia. We entered into a 50/50 unincorporated joint operationventure with Kidman Resources Limited (“Kidman”), with respect to the MtMt. Holland Lithium Project,lithium project, to design, construct and operate a mine, concentrator and refinery to produce approximately 45,000 metric tons of lithium hydroxide per year. Kidman retained the exclusive right to exploit gold within the project area. SQM Australia Pty committed to pay a price of US$70110 million for the 50% of the MtMt. Holland assets, which was split into an initial payment of US$1525 million and a deferred payment of US$ 5587.5 million, both payments subject to certain conditions precedent. SQM Australia Pty paid an additional (i) US$10 million as part of the initial payment, and (ii) US$30 million once the deferred payment took place. All payments subject to conditions under the purchase agreement with Kidman were executed by December 2018. These investments are not included in the capital expenditure program amounts discussed in the section below. These investments were carried out with internal financing.
On September 23, 2019, Wesfarmers Limited (“Wesfarmers”) acquired all the issued ordinary shares in Kidman, becoming a 50% partner in the Mt. Holland lithium project in the joint venture with SQM Australia Pty.
In September 2020, in the Salar de Atacama, we began a self-assessment process, which is the first step in the Initiative for Responsible Mining Assurance’s (“IRMA”) rigorous responsible mining certification process.
In October 2020, we announced our Sustainable Development Plan, which includes voluntarily expanding our monitoring systems, promoting better and more meaningful conversations with neighboring communities, becoming carbon neutral and reducing water by 65% and brine extraction by 50%. As part of this plan, we also set a goal to obtain international certifications and participate in international sustainability indices.
| 20 |
In November 2020, we were accepted into the Dow Jones Sustainability Chile and the Dow Jones Sustainability MILA Pacific Alliance Indices.
On December 13, 2018,February 16, 2021, our Board approved the Ministerinvestment of approximately US$700 million for Mines and Petroleum in Western Australia granted Kidman the exemption from relevant expenditure requirements in relation to mining tenementsour 50% share of the Mountdevelopment costs of the Mt. Holland lithium hydroxide project that were subject to exemption objections.in the joint venture with Wesfarmers.
Capital Expenditure Program
We regularly review different opportunities to improve our production methods, reduce costs, increase production capacity of existing products and develop new products and markets. Additionally, significant capital expenditures are required every year in order to sustain our production capacity. We are focused on developing new products in response to identified customer demand, as well as new products that can be derived as part of our existing production or other products that could fit our long-term development strategy. Our capital expenditures in Chile have been mainly related to the organic growth and sustainability of our business, including the construction of new facilities and the renovation of plants and equipment. From 2016,In 2020, we began to invest in lithium projects outside Chile, starting withalso worked on the Minera Exar project in Argentina and continuing with Mount Holland project in Australia in 2017. In 2018, we sold our stake in Minera Exar and continued the developmentexpansion of the Mount Holland project. We also expanded our lithium carbonate and lithium hydroxide capacity in Chile, reaching capacity 70,000which we believe will reach 120,000 metric tons per year.and 21,500 metric tons respectively by the end of 2021. We also began expansions related to the mining and production facilities of nitrates and iodine in Chile.
Our capital expenditures for the years ended December 31, 2018, 20172020, 2019 and 20162018 were as follows:
| (in millions of US$) | 2018 | 2017 | 2016 | 2020 | 2019 | 2018 | ||||||||||||||||||
| Capital expenditures | 244.7 | 142.1 | 131.3 | 322.2 | 321.3 | 244.7 | ||||||||||||||||||
During 2020, we had total capital expenditures of US$322.2 million, a decrease compared to the US$450 million that was originally expected as a result in the delay of the purchasing of equipment. Our 2020 capital expenditure is primarily related to:
| · | Capacity expansion projects related to the increase of our lithium carbonate production from 70,000 metric tons per year to 120,000 metric tons per year in Chile; |
| · | Capacity expansion of lithium hydroxide production from 13,500 metric tons per year to 21,500 metric tons per year in Chile; |
| · | Optimization projects related to potassium nitrate production plants in Coya Sur; and |
| · | General maintenance of all production units in order to ensure the fulfillment of production and sales targets. |
During 2019, we had total capital expenditures of US$321.3 million, primarily related to:
| · | Capacity expansion projects related to the completion of the increase of our lithium carbonate production to 70,000 metric tons per year and the commencement of our lithium carbonate expansion project to reach 120,000 metric tons per year. |
| · | Capacity expansion of lithium hydroxide production from 13,500 metric tons per year to 21,500 metric tons per year in Chile; |
| · | Investments to increase iodine capacity to 14,800 metric tons per year in the Nueva Victoria mine; and |
| · | Capacity expansion and optimization projects related to potassium nitrate production plants II, III and IV in Coya Sur. |
| 21 |
During 2018, we had total capital expenditureexpenditures of US$244.7 million, primarily related to:
| · | Capacity expansion projects related to increasing lithium carbonate production to 70,000 metric tons per year and lithium hydroxide production to 13,500 metric tons per year in Chile; |
| · | Investments to increase iodine capacity to 14,000 metric tons per year in the Nueva Victoria mine; |
| · | Capacity expansion project related to potassium nitrate production plants III and IV in Coya Sur; and |
| · | General maintenance of all production units and the Port of Tocopilla in order to ensure the fulfillment of production and sales targets. |
During 2017, we had totalWe believe that our capital expenditures of US$142.1 million, primarily related to:
During 2016, we had total capital expenditures of US$131.3 million, primarily related to:
The Board of Directors has approved a capital expenditure framework for 2019 of2021 could reach approximately US$360500 million focused on the maintenance of our production facilities in order to strengthen our ability to meet our production goals and to increase our production capacity, primarily related to lithium carbonate and lithium hydroxide capacity expansionexpansions and nitrates and iodine capacity in Chile and development of our lithium project in Australia. We expect our installed capacity of lithium carbonate and lithium hydroxide in Chile to reach approximately 120,000 and 21,500 metric tons respectively by the endsecond half of 2020,2021, an increase of 50,000 metric tons of lithium carbonate and of 8,000 metric tons of lithium hydroxide compared to our current capacityeffective capacity. We will also begin the development and purchase of 70,000 metric tons. From that point, we will continue to work to reach an installed capacity of 180,000 metric tonslong-lead time equipment in Chile inconnection with the future. The capital expenditure associated with this expansion is expected to be in the range of approximately US$4,000 per ton. We expect to complete the feasibility study related to the MountMt. Holland lithium project in Australia in the second half of 2019, at which time we believe we will have a better estimate associated with the capital expenditure and costs of the project.
We do not expect that our 2019 capital investment program will require external financing. However, we always have the option to access capital markets in order to optimize our financial position.Western Australia.
4.B. Business Overview
The Company
We believe that we are the world’s largest producer of potassium nitrate and iodine and one of the world´s largest lithium producers. We also produce specialty plant nutrients, iodine derivatives, lithium derivatives, potassium chloride, potassium sulfate and certain industrial chemicals (including industrial nitrates and solar salts). Our products are sold in overapproximately 110 countries through our worldwide distribution network, with 92%91% of our sales in 20182020 derived from countries outside Chile.
Our products are mainly derived from mineral deposits found in northern Chile. We mine and process caliche ore and brine deposits. The caliche ore in northern Chile contains the only known nitrate and iodine deposits in the world and is the world’s largest commercially exploited source of natural nitrates. The brine deposits of the Salar de Atacama, a salt-encrusted depression in the Atacama Desert in northern Chile, contain high concentrations of lithium and potassium as well as significant concentrations of sulfate and boron.
From our caliche ore deposits, we produce a wide range of nitrate-based products used for specialty plant nutrients and industrial applications, as well as iodine and iodine derivatives. At the Salar de Atacama, we extract brines rich in potassium, lithium, sulfate and boron in order to produce potassium chloride, potassium sulfate, lithium solutions and bischofite (magnesium chloride). We produce lithium carbonate and lithium hydroxide at our plant near the city of Antofagasta, Chile, from the solutions brought from the Salar de Atacama. We market all of these products through an established worldwide distribution network.
Our products are divided into six categories: specialty plant nutrients; iodine and its derivatives; lithium and its derivatives; potassium chloride and potassium sulfate; industrial chemicals and other commodity fertilizers. Specialty plant nutrients are premium fertilizers that enable farmers to improve yields and the quality of certain crops. Our main specialty fertilizer is potassium nitrate, which is used primarily in high-value crops. Iodine and its derivatives are mainly used in the X-ray contrast media and biocides industries and in the production of polarizing film, which is an important component in LCD screens. Lithium and its derivatives are mainly used in batteries, greases and frits for production of ceramics. Potassium chloride is a commodity fertilizer that is produced and sold by us worldwide. Potassium sulfate is a specialty fertilizer used primarily in crops such as vegetables, fruits and industrial crops. Industrial chemicals have a wide range of applications in certain chemical processes such as the manufacturing of glass, explosives and ceramics, and, more recently, industrialceramics. Industrial nitrates are also being used in concentrated solar power plants as a means for energy storage. In addition, we complement our product portfolio of plant nutrients through the buying and selling of other commodity fertilizers for use mainly in Chile.Chile and around the world.
| 22 |
For the year ended December 31, 2018,2020, we had revenues of US$2,265.81,817.2 million, gross profit of US$782.3482.9 million and profit attributable to controlling interests of US$439.8164.5 million. Our worldwide market capitalization as of December 31, 20182020 was approximately US$10.111.0 billion.
Specialty Plant Nutrition: We produce four main types of specialty plant nutrients:nutrients which offer nutritional solutions for fertigation, direct soil and foliar fertilizer applications: potassium nitrate, sodium nitrate, sodium potassium nitrate and specialty blends. We also sell other specialty fertilizers including third party products. All of these specialty plant nutrientsproducts are used in either solid or liquid form mainly on high value crops such as vegetables, fruitsfruit, flowers and flowers. Our nutrientssome vegetables. These fertilizers are widely used in crops that employuse modern agricultural techniques such as hydroponics, green housing,greenhouses and crops with foliar application and fertigation (where(in the latter case, the fertilizer is dissolved in water prior tobefore irrigation) and foliar application. According to the type of use or application, our products are primarily marketed under the following brands: UltrasolR(fertigation), QropR (open field application), SpeedfolR (foliar application) and AllganicR (organic farming).
Specialty plant nutrients have certain advantages over commodity fertilizers, such as rapid and effective absorption (without requiring nitrification), superior water solubility, increased soil pH (which reduces soil acidity) and low chloride content. One of the most important products in this business line is potassium nitrate, which is sold in crystalline or prill form, allowing for multipledifferent application methods. Crystalline potassium nitrate products are ideal for application by fertigation and foliar sprays,applications, and potassium nitrate prills are suitable for direct soil applications.
We have developed brands for marketing according to the different applications and uses of our products. Our main brands are: UltrasolR (fertigation), QropR (soil application), SpeedfolR (foliar application) and AllganicR (organic agriculture).
The new needs of more sophisticated customers demand that the industry provide integrated solutions rather than individual products. Our products, including customized specialty blends that meet specific needs along with the agronomic service provided, allow us to create plant nutrition solutions that add value to crops through higher yields and better qualitybetter-quality production. Because our products are derived from natural nitrate compounds or natural potassium brines, they have certain advantages over synthetically produced fertilizers, includingfertilizers. One of the advantages of our products is the presence of certain beneficial trace elements, which makes them more attractive tovaluable for customers who prefer products of natural origin. As a result, specialty plant nutrients are sold at a premium price compared to commodity fertilizers.
Iodine and its Derivatives:We believe that we are the world’s leading producer of iodine and iodine derivatives, which are used in a wide range of medical, pharmaceutical, agricultural and industrial applications, including x-ray contrast media, polarizing films for LCD and LED, antiseptics, biocides and disinfectants, in the synthesis of pharmaceuticals, electronics, pigments and dye components.
Lithium and its Derivatives: We are a leading producer of lithium carbonate, which is used in a variety of applications, including electrochemical materials for batteries used in electric vehicles, portable computers, tablets, cellular telephones and electronic apparatus, frits for the ceramic and enamel industries, heat-resistant glass (ceramic glass), air conditioning chemicals, continuous casting powder for steel extrusion, pharmaceuticals and lithium derivatives. We are also a leading supplier of lithium hydroxide, which is primarily used as an input for the lubricating greases industry and for certain cathodes for high energy capacity batteries.
Potassium:We produce potassium chloride and potassium sulfate from brines extracted from the Salar de Atacama. Potassium chloride is a commodity fertilizer used to fertilize a variety of crops including corn, rice, sugar, soybean and wheat. Potassium sulfate is a specialty fertilizer used mainly in crops such as vegetables, fruits and industrial crops.
| 23 |
Industrial Chemicals: We produce and sell three industrial chemicals: sodium nitrate, potassium nitrate and potassium chloride. Sodium nitrate is used primarily in the production of glass, explosives, and metal treatment.treatment, metal recycling and the production of insulation materials, among other uses. Potassium nitrate is used in the manufacturing of specialty glass, and it is also an important raw material for the production of frits for the ceramics, enamel industries, metal treatment and enamel industries.pyrotechnics. Solar salts, a combination of potassium nitrate and sodium nitrate, are used as a thermal storage medium in concentrated solar power plants. Potassium chloride is a basic chemical used to produce potassium hydroxide, and it is also used as an additive in oil drilling as well as in food processing, among other uses. We market our industrial chemicals using the following brands: QSodiumNitrate™,QPotassiumNitrate™, and QPotassiumChloride™.
Other Products and Services:We also sell other fertilizers and blends, some of which we do not produce. We are the largest company that produces and distributes the three main potassium sources: potassium nitrate, potassium sulfate and potassium chloride.
The following table shows the percentage breakdown of our revenues for 2018, 20172020, 2019 and 20162018 according to our product lines:
| 2018 | 2017 | 2016 | 2020 | 2019 | 2018 | |||||||||||||||||||
| Specialty Plant Nutrition | 35 | % | 32 | % | 32 | % | 39 | % | 37 | % | 35 | % | ||||||||||||
| Iodine and Derivatives | 14 | % | 12 | % | 12 | % | 18 | % | 19 | % | 14 | % | ||||||||||||
| Lithium and Derivatives | 32 | % | 30 | % | 27 | % | 21 | % | 26 | % | 32 | % | ||||||||||||
| Potassium | 12 | % | 18 | % | 21 | % | 12 | % | 11 | % | 12 | % | ||||||||||||
| Industrial Chemicals | 5 | % | 6 | % | 5 | % | 9 | % | 5 | % | 5 | % | ||||||||||||
| Other | 2 | % | 2 | % | 3 | % | 2 | % | 2 | % | 2 | % | ||||||||||||
| Total | 100 | % | 100 | % | 100 | % | 100 | % | 100 | % | 100 | % | ||||||||||||
Business Strategy
Our business strategySQM is to be a global company with people committed to excellence, dedicated to the extraction of mineralsthat develops and selectively integrated in the production and sale ofproduces diverse products for theseveral industries essential for human development (e.g., food,progress, such as health, technology). This strategy was built onnutrition, renewable energy and technology through innovation and technological development. We aim to maintain our leading world position in the following five principles:lithium, potassium nitrate, iodine and thermo-solar salts markets by:
| · |
| · |
| · |
| · |
We are a dynamic company. In pursuit of our objectives, we expect to acquire and develop projects and interests that are consistent with our existing and new businesses, either alone or with joint venture partners. We may also divest or sell-down interests that we have acquired to deploy funds for other investments or other purposes in pursuit of our objectives or to adjust risk or diversify our asset base.
We are a company built and managed by a culture based on excellence, safety, sustainability and integrity. We work every day to expand this culture through the attraction, retention and development of talent as well encouraging an inclusive and diverse work environment ensuring the unique knowledge and innovation needed to sustain our business. We strive for safe and accident-free operations by promoting conduct that favors the physical safety and psychological well-being of everyone who works directly and indirectly with the Company.
We position ourselves as leaders in sustainability and commit to a sustainable future where we constantly work to responsibly manage natural resources, protect human rights, care for the environment, form close and trusting relationships with our neighboring communities and create value. Within these communities, we support projects and activities with a focus on education, business development, and protection of the environment and historical heritage. We create value for our clients through established commercial models and the production and development of differentiated products that respond to their industry and market specific needs, constantly creating and providing a sustainable improvement in the quality of life. We will continue to create value for all of our stakeholders through responsible management of natural resources, sustainable expansion projects and improvement of our existing operations, with a focus on minimizing our environmental impacts by reducing our carbon, energy and water footprints and working together with our shareholders, employees, customers, suppliers and communities.
These principles are based on the following key concepts:
We have identified market demand in each of our major product lines, both within our existing customer base and in new markets, for existing products and for additional products that can be produced from our natural resources. To take advantage of these opportunities, we have developed specific strategies for each of our product lines.
Specialty Plant Nutrition
Our strategy in our specialty plant nutrition business is to: (i) leverage the advantages of our specialty products over commodity-type fertilizers; (ii) selectively expand our business by increasing our sales of higher margin specialty plant nutrients based on potassium and natural nitrates, particularly soluble potassium nitrate and specialty blends; (iii) pursue investment opportunities in complementary businesses to enhance our product portfolio, increase production, reduce costs, and add value to the marketing of our products; (iv) develop new specialty nutrient blends produced in our mixing plants that are strategically located in or near our principal markets in order to meet specific customer needs; (v) focus primarily on the markets where we can sell our plant nutrients in soluble and foliar applications in order to establish a leadership position; (vi) further develop our global distribution and marketing system directly and through strategic alliances with other producers and global or local distributors; (vii) reduce our production costs through improved processes and higher labor productivity so as to compete more effectively and (viii) supply a product with consistent quality according to the specific requirements of our customers.
Iodine and its Derivatives
Our strategy in our iodine business is to: (i) reach and maintain a sufficient market share of the iodine market in order to optimize the use of our available production capacity; (ii) encourage demand growth and promote new iodine uses; (iii) participate in iodine recycling projects through the Ajay-SQM Group (“ASG”); (iv) reduce our production costs through improved processes and higher productivity in order to compete more effectively and (v) supply a product with consistent quality according to the requirements of our customers.
Lithium and its Derivatives
Our strategy in our lithium business is to: (i) strategically allocate our sales of lithium carbonate and lithium hydroxide; (ii) encourage demand growth and promote new lithium uses; (iii) selectively pursue opportunities in the lithium derivatives business by creating new lithium compounds; (iv) reduce our production costs through improved processes and higher productivity in order to compete more effectively; (v) supply a product with consistent quality according to the requirements of our customers andcustomers; (vi) diversify our operations geographically and jurisdictionally.jurisdictionally; and (vii) diversifying our asset base or adjusting risk by acquiring new projects and interests (either alone or with joint venture partners), divesting existing projects or selling down our interests in projects.
Potassium
Our strategy in our potassium business is to: (i) offer a portfolio of potassium products, including potassium sulfate, potassium chloride and other fertilizers, to our traditional markets; (ii) have flexibility to offer crystalized (standard) or granular (compacted) form products according to market requirements; (iii) focus on markets where we have logistical advantages and synergies with our specialty plant nutrition business and (iv) supply a product with consistent quality according to the specific requirements of our customers.
Industrial Chemicals
Our strategy in our industrial chemical business is to: (i) maintain our leadership position in the industrial nitrates market as well as increase our supply of potassium chloride in markets where we have natural advantages;market; (ii) encourage demand growth in different applications as well as exploring new potential applications; (iii) becomeposition ourselves as a long-term, reliable supplier for the thermal storage industry, maintaining close relationships with R&D programs;programs and industrial initiatives; (iv) reduce our production costs through improved processes and higher productivity in order to compete more effectively and (v) supply a product with consistent quality according to the requirements of our customers.
New Business Ventures
We constantly evaluate opportunities that are consistent with our existing and new businesses. We seek to acquire interests in projects both inside and outside of Chile where we believe we have sustainable competitive advantages, and we hope to continue doing so in the future.
In addition, we are actively conducting exploration for metallic minerals in the mining properties we own. If such minerals are found, we may decide to exploit, sell or enter into an association to extract these resources. Our exploration efforts are currently focused on the layer of bedrock that lies beneath the caliche ore that we use as the primary raw material in the production of iodine and nitrates. This bedrock has significant potential for metallic mineralization, particularly copper and gold. A significant portion of our mining properties are located in the Antofagasta region of Chile, where many large copper producers operate.
We have an in-house geological exploration team that explores the area directly, identifying drilling targets and assessing new prospects. In 2018,2020, the team identified eightsix new targets and confirmed mineralization in fourseveral of the targets, using its own truck-mounted drill rigs.targets. The number of perforated meters reached 32,86233,523 meters and were made withused four machines of which three were internal and the other external.owned by us. We also have a metal business development team that works to engage partners interested in investing in metal exploration within our mining properties. As of December 31, 2018,2020, we had sixfive option agreements in place with five companies, including small juniorfour mining companies and private equity firms and large mining companies.firms. We have entered into an exploration and purchase option agreement with a private Chilean company for an area of interest. We are participatingparticipated in the formation of two joint ventures as a result of exercising an option agreement with a junior mining company.
Main Business Lines
Specialty Plant Nutrition
In 2018,2020, specialty plant nutrients revenues increaseddecreased to US$781.8701.7 million, representing 34.5%38.6% of our total revenues for that year. We believe that we are the world’s largest producer of potassium nitrate. We estimate that our 2020 sales volume represented approximately 51% of the total global potassium nitrate used for all applications, remaining flat with our sales volume in 2019. We estimate that our sales accounted for approximately 56%48% of global potassium nitrate sales for all applicationsagricultural uses by volume in 2018, an increase from 53% in 2017.2020. During 2018,2020, the agricultural potassium nitrate market increased by approximately 7%.5% when compared to 2019. These estimates do not include potassium nitrate produced and sold locally in China, only Chinese net imports and exports.
In addition to potassium nitrate, we produce the following specialty plant nutrients: sodium nitrate, sodium potassium nitrate and specialty blends (containing various combinations of nitrogen, phosphate and potassium and generally known as “NPK blends”).
Our specialty plant nutrients have specific characteristics that increase productivity and enhance quality when used on certain crops and soils. Our specialty plant nutrientsThe products have significant advantages for certain applications over commodity fertilizers based on other sources of nitrogen and potassium, such as urea and potassium chloride.
OurThe advantages of our specialty plant nutrients advantages are:include that they:
| · | are fully water soluble, allowing their more efficient use in hydroponics, fertigation, foliar applications and other advanced agricultural techniques thus |
| · | are chloride-free, which prevents |
| · | provide nitrogen in nitric form, thereby allowing crops to absorb nutrients faster than they absorb |
| · | do not release hydrogen after application, thereby avoiding increased soil acidity; |
| · | possess trace elements, which promote disease resistance in plants; and |
| · | are more attractive to customers who prefer products of natural origin. |
| 26 |
Specialty Plant Nutrition: Market
The target market for our specialty plant nutrients includes producers of high-value crops such as vegetables, fruits, industrial crops, flowers, cotton and others. Furthermore, we sell specialty plant nutrients to producers of chloride-sensitive crops. Since 1990, the international market for specialty plant nutrients has grown at a faster rate than the international market for commodity-type fertilizers. This is mostly due to: (i) the application of new agricultural technologies such as fertigation and hydroponics, and the increasing use of greenhouses; (ii) the increase in the cost of land and the scarcity of water, which has forced farmers to improve their yields and reduce water use; and (iii) the increase in demand for higher quality crops, such as fruits and vegetables.crops.
Over the last ten years, the compound annual growth rate for vegetable production per capita was 3%, while the compound annual growth rate for the world population was closer to 1%.
Worldwide scarcity of water and arable land drives the development of new agricultural techniques to maximize the use of these resources. IrrigationA good example of this is the more efficient use of water through irrigation, which has grown at an average annual rate of 1% during the last 20 years (a pace similar to population growth). However, micro irrigationMicro-irrigation, which results in even more efficient use of water, has grown at 10% per year over the same period. Micro irrigationMicro-irrigation systems, which include drip irrigation and micro-sprinklers, are the most efficient forms of technical irrigation. These applications require fully water-soluble plant nutrients. Our nitrate-based specialty plant nutrients are fully soluble in water and provide nitrogen in nitric form, which helps crops absorb these nutrients faster than they absorb urea- or ammonium-based fertilizers, facilitating a more efficient application of nutrients to the plant and thereby increasing the crop’s yield and improving its quality.
The ratiolowest global share of micro irrigation tohectares under micro-irrigation over total irrigated hectares is in Asia, iswith a figure of approximately 3%, the lowest ratio of any region in the world.. This represents a high potential for micro irrigation,the introduction of micro-irrigation in that region, which is reflected in the high growth rates in Asia in recent years.
Potassium nitrate in China is an important market in China, although currently its demand is largely fulfilled by domestic producers. DemandTotal demand of potassium nitrate in Asian countries totals approximately 400,000 to 420,000 metric tons, of which approximately 130,000 metric tons is related toneeded for the tobacco industry and approximately 120,000 metric tons is related to the horticulture business. Of the total, between 20,00015,000 and 30,00035,000 metric tons of potassium nitrate are imports.
Specialty Plant Nutrition: Our Products
Potassium nitrate, sodium potassium nitrate, and specialty blends are higher margin products derived from, or consisting of,that use sodium nitrate and they are all producedas a feedstock. These products can be manufactured in crystallized or prilled form. Specialty blends are produced using our own specialty plant nutrients and other components at blending plants operated by us or our affiliates and related companies in Brazil, Chile, China, Italy, Mexico, the Netherlands, Peru, South Africa, Spain, and the United States, Mexico, the United Arab Emirates, South Africa, Turkey, China, India, Thailand, Brazil, Spain, the Netherlands and Peru.States.
The following table shows our sales volumes of and revenues from specialty plant nutrients for 2018, 20172020, 2019 and 2016:2018:
| 2018 | 2017 | 2016 | ||||||||||
| Sales volumes(Th. MT) | ||||||||||||
| Sodium nitrate | 25.0 | 26.7 | 24.4 | |||||||||
| Potassium nitrate and sodium potassium nitrate | 673.4 | 601.4 | 475.8 | |||||||||
| Specialty blends(1) | 242.5 | 209.0 | 213.5 | |||||||||
| Other specialty plant nutrients(2) | 141.6 | 129.1 | 127.2 | |||||||||
| Total revenues(in US$ millions) | 781.8 | 697.3 | 623.9 | |||||||||
| 2020 | 2019 | 2018 | ||||||||||
| Sales volumes (Th. MT) | ||||||||||||
| Sodium nitrate | 25.6 | 30.2 | 25.0 | |||||||||
| Potassium nitrate and sodium potassium nitrate | 575.2 | 617.4 | 673.4 | |||||||||
| Specialty blends (1) | 271.3 | 238.9 | 242.5 | |||||||||
| Other specialty plant nutrients (2) | 164.4 | 155.3 | 141.6 | |||||||||
| Total revenues (in US$ millions) | 701.7 | 723.9 | 781.8 | |||||||||
| (1) | Includes Yara’s products sold pursuant to our commercial agreement. |
| (2) | Includes trading of other specialty fertilizers. |
In 2018,2020, our specialty plant nutrients revenues increaseddecreased to US$781.8701.7 million, representing 35%39% of our total revenues for that year and a 12.1% increase3.1% decrease from US$697.3723.9 million in specialty plant nutrients revenues in 2017.2019. Prices increaseddecreased approximately 0.07%2.6% in 2018.2020.
Depending on the systems used to apply specialty nutrients, fertilizers can be classified as specialty field fertilizers or water-soluble fertilizers.
Specialty field fertilizers are applied directly to the soil, manually or in a mechanized fashion. Their high solubility levels, lack of chloride and absence of acidic reactions make them particularly advantageous for tobacco, potatoes, coffee, cotton, and a wide range ofcertain fruits and vegetables.
Water-soluble fertilizers are specialty nutrients that are delivered to the crops using modern irrigation systems. As these systems feature refined technology, the products used in them must be highly soluble, rich in nutrients, free of impurities and insoluble substances, and with a low salinity index. The leading nutrient in this segment is potassium nitrate, whose optimal balance of nitric nitrogen and chloride-free potassium (the two macronutrients most needed by plants) make it an indispensable source of nutrition for crops that use modern irrigation systems.
Potassium nitrate is widely known to be a vital component in foliar feeding applications, where usage is recommended in order to stave off nutritional deficiencies before the first symptoms appear, correct any deficiencies that arise and prevent physiological stress. This nutrient also helps promote a suitable balance between fruit production and/or growth, and plant development, particularly in crops with physiological disorders.
Foliar feeding with potassium nitrate can have beneficial effects:
| · | when soil chemistry limits nutrient solubility and availability (pH, organic matter, type and percentage of clay); |
| · | when nutrient absorption through the roots is limited as a result of conditions that hamper root growth (temperature, moisture, oxygen and loss of soil structure); |
| · | when the plant’s |
| · | when nutrient mobility is limited, such as when plants flower before the leaf growth phase, imposing limiting factors on xylem nutrient transport; and |
| · | to achieve rapid recovery from leaf stress caused by climatic conditions, soil conditions and irrigation management. |
Another benefit of our potassium nitrate is that, according to a 2014 study by the consulting firm Arthur D. Little Benelux, our production process generates up to 40% less greenhouse gases compared to other major potassium nitrate producers in the world.
SQM has consolidated a product portfolio of over 200 specialty fertilizer blends, including topthe development of brands such as Ultrasol®, for fertigation; Qrop®, for application to the soil; Speedfol®, for foliar feeding and Allganic® for organic crops.
In recent years, we have added several products to our portfolio such as QropTMKS was added to our portfolio of specialty field fertilizers in 2015. This product was developed by our research2015 and development team and is an improvement to existing products. It is more physically stable and is not required to be transported as hazardous cargo, which means it can be soldUltrasolution K® in other markets.2018.
| 28 |
During 2017, we worked on the restructuring ofWe have restructured the Qrop products portfolio:portfolio to include a chloride-free line for direct application to the soil with a variety of specialized formulas and unique mixtures, which make these products highly accurate and quickly available for the plant.
In 2018, we launched new products to the market, such as the Ultrasol® K line in the United States. Ultrasol® K will address Ultrasolution K® addresses the need for potassium-free chloride and a nitrate safe for handling in the liquid fertilizer market, opening new opportunities for SQM in in the cultivation of almonds and strawberries, in which water quality and efficiency are very important.
Other products developed by our research and development team during 2020 include Ultrasoline®, Ultrasol K Acid®, ProP® and Prohydric®. Ultrasoline® is a new product that, together with potassium nitrate, incorporates iodine, an essential element for plants, allowing better root growth, optimal photosynthesis and better tolerance to oxidative stress, among other advantages.
Specialty Plant Nutrition: Marketing and Customers
In 2018,2020, we sold our specialty plant nutrients in approximately 100102 countries and to more than 7601,100 customers. OneNo customer represented more than 10% of our specialty plant nutrition revenues during 2018, representing approximately 23% of our total specialty plant nutrition revenues,2020, and our ten largest customers accounted in the aggregate for approximately 49%33% of revenues during that period. No supplier accounted for more than 10% of the costs of sales for this business line.
The table below shows the geographical breakdown of our revenues:
| Revenues breakdown | 2018 | 2017 | 2016 | |||||||||
| North America | 31 | % | 33 | % | 33 | % | ||||||
| Europe | 25 | % | 25 | % | 18 | % | ||||||
| Central and South America (excluding Chile) | 10 | % | 10 | % | 11 | % | ||||||
| Asia and Others | 34 | % | 31 | % | 37 | % | ||||||
| Revenues breakdown | 2020 | 2019 | 2018 | |||||||||
| North America | 35 | % | 34 | % | 31 | % | ||||||
| Europe | 21 | % | 21 | % | 26 | % | ||||||
| Chile | 14 | % | 15 | % | 14 | % | ||||||
| Central and South America (excluding Chile) | 10 | % | 11 | % | 10 | % | ||||||
| Asia and Others | 20 | % | 20 | % | 19 | % | ||||||
We sell our specialty plant nutrition products outside Chileglobally mainly through our own worldwide network of representativecommercial offices and through our distribution affiliates.distributors.
We maintain inventory of our specialty plant nutrients in our commercial offices in theour main markets of the Americas, Asia, Europe, the Middle East and Africa in order to facilitate prompt deliveries to customers. In addition, we sell specialty plant nutrients directly to some of our large customers. Sales are made pursuant to spot purchase orders andor short-term contracts.
As part of our marketing strategy, we provide technical and agronomical assistance and support to our clients. We have specific knowledge resulting from extensive research and numerous studies conducted by our agronomical teams in close contact with producers throughout the world. The solid agronomical knowledge is key for the development of specific formulas and hydroponic and fertirrigationfertigation nutritional plans, which allows us to provide expert advice for producing crops that meet high quality standards for the most efficient markets and in the most environmentally challenging conditions.
By working closely with our customers, we are able to identify their needs for new products and a possible existence of higher-value-added markets. Our specialty plant nutrients are used on a wide variety of crops, particularly value-added crops, where the use of our products enables our customers to increase yields and achieve a premium price for their own products.
Our customers are located in both the northern and southern hemispheres.diverse latitudes. Consequently, we do not believe there are any seasonal or cyclical factors that can materially affect the sales of our specialty plant nutrients.
Specialty Plant Nutrition: Joint Ventures and Agreements
Consistent with our business strategy, we regularly evaluate opportunities to expand in our current core businesses, including our specialty plant nutrition business, or within new businesses in which we believe we may have sustainable competitive advantages. We evaluate potential acquisitions, joint ventures and alliances with companies both within and outside of Chile, including in other emerging markets.
In May 2008, we signed a joint venture agreement with Migao for the production and distribution of specialty plant nutrients in China. Through the joint venture, Sichuan SQM-Migao Chemical Fertilizers Co., Ltd., we constructed a potassium nitrate plant with a production capacity of 40,000 metric tons per year. The plant began operating in January 2011.
In May 2009, our subsidiary Soquimich European Holdings entered into an agreement with Coromandel Fertilizers Ltd. to create a joint venture, Coromandel SQM Private Limited, for the production and distribution of water soluble fertilizers in India. The agreement established a 50⁄50 joint venture. As part of the agreement, a new 15,000 metric ton facility was constructed in the city of Kakinada to produce water soluble NPK grade fertilizers. This new facility began operating in January 2012.
In December 2009, we signed an agreement with the French Roullier Group to form the joint venture SQM Vitas FZCO. This agreement joins two of the largest companies in the businesses of specialty plant nutrition, specialty animal nutrition and professional hygiene. Peru, Brazil and Dubai are the main focus markets of this joint venture. As part of the agreement, our phosphate plant located in Dubai became part of this joint venture.
Between 2010 and 2012, we continued to expand our production capacity of potassium products in our operations in the Salar de Atacama. In 2011, we completed the construction of a new potassium nitrate facility in Coya Sur, increasing our overall production capacity of potassium nitrate by 300,000 metric tons.
In 2012, SQM Vitas FZCO. started the construction of new plants in Brazil (Candeias), Peru and South Africa (Durban) for the production of water soluble fertilizers containing different relative amounts of nitrogen, phosphorus and potassium, and at times, smaller amounts of other chemicals. The Candeias Industrial Complex plant in Brazil began operating in March 2012 and has a production capacity of 25,000 metric tons per year.
In 2013, the operations of SQM Vitas Spain began in Spain with a water soluble NPK fertilizer plant that has a production capacity of 15,000 metric tons per year. In 2016, this operation became fully controlled by SQM.
In 2015, an asset transfer agreement, that was signed in December 2014 between Plantacote B.V. and Plantacote N.V., entered into effect. As a result of this agreement, the business and Plantacote® brand were transferred to the new company Plantacote N.V., but with no changes to the business or the Controlled Release Fertilizer project. SQM continues to hold a 50% ownership stake in the company.
In 2015, SQM Vitas South Africa, was acquired by Roulliers and the production facilities in Durban were transferred to SQM Africa Pty Ltd.
In 2016, we began operating soluble specialty plant nutrient production facilities through our joint ventures in Peru. SQM Vítas Perú S.A.C. and the Netherlands, Plantacote N.V. P.E. Netherlands. In addition, a new logistics terminal was opened in the port of Terneuzen in the Netherlands.
In 2017, three new offices started their operations in Imbituba, Rio Grande and Sao Paulo, Brazil, SQM Vitas Brazil Agroindustria, importação e exporação ltda.
In May 2018, our we began operating a new joint venture, Pavoni & C. Spa with Pavoni, one of the largest specialty fertilizer companies in Italy. The main objective of this business is to improve the nutritional efficiency of crops, the existing fertigation, the quality of fertilizers and their applications, as well as extend the use of fertigation (from microirrigation).
In 2018, our new office and storage facility in Pamira, managed by SQM Colombia SAS near the Port of Buenaventura in Colombia became operational. The new office was set up to meet the growing needs of customers in the Colombian market, especially those who grow roses and ornamental plants, coffee, bananas and fruit through a complete portfolio of soluble fertilizers and Qrop mixes.
In 2018, we sold our interest in the Charlee SQM Thailand Co. Ltd. joint venture.
In 2018, the production activities of the SQM Vitas FZCO ceased due to changes in the expiry of the lease with the port authorities.
Specialty Plant Nutrition: Fertilizer Sales in Chile
We market specialty plant nutrients in Chile through our subsidiary Soquimich Comercial S.A. (“SQMC”).
| 29 |
SQMC is one of the main players in the Chilean market, offering a wide range of products developed specifically for the crops grown in the country which require specialty plant nutrients.
SQMC sells local products as well as products imported from different countries around the world.
All contracts and agreements between SQMC and its foreign suppliers of fertilizers contain standard and customary commercial terms and conditions. SQMC has been able to obtain adequate supplies of these products with good pricing conditions.
SQMC’s total sales reached US$147118 million and US$133128 million in 20182020 and 2017,2019, respectively. During 2018,2020, no client represented more than 10% of the sales of the Company. According to the customs information related to fertilizers, the market participation of fertilizers imported directly by SQMC during 20182020 was approximately 13%22%.
Specialty Plant Nutrition: Competition
The principal means of competition in the sale of potassium nitrate are product quality, customer service, location, logistics, agronomic expertise and price.
We believe that we are the world’s largest producer of sodium nitrate and potassium nitrate for agricultural use. Our sodium nitrate products compete indirectly with specialty and commodity-typecommodity substitutes, which may be used by some customers instead of sodium nitrate depending on the type of soil and crop to which the product will be applied. Such substitute products include calcium nitrate, ammonium nitrate and calcium ammonium nitrate.
In the potassium nitrate market, our largest competitor is Haifa Chemicals Ltd. (“Haifa”), in Israel, which is a subsidiary of Trans Resources International Inc. We estimate that sales of potassium nitrate by Haifa accounted for approximately 13%18% of total world sales during 20182020 (excluding sales by Chinese producers to the domestic Chinese market). Haifa had production issues during 2017 and is currently operating at its 50% capacity (one plant). Our sales accounted for approximately 56%48% of global potassium nitrate sales by volume for the period.
ACF, another Chilean producer,proucer, mainly oriented to iodine production, has produced potassium nitrate from caliche ore and potassium chloride since 2005. Kemapco, a Jordanian producer owned by Arab Potash, produces potassium nitrate in a plant located close to the Port of Aqaba, Jordan. In addition, there are several potassium nitrate producers in China, the largest of which are Yuantong and Migao. Most of the Chinese production is consumed by the Chinese domestic market.
In Chile, our products mainly compete with imported fertilizer blends that use calcium ammonium nitrate or potassium magnesium sulfate. Our specialty plant nutrients also compete indirectly with lower-priced synthetic commodity-type fertilizers such as ammonia and urea, which are produced by many producers in a highly price-competitive market. Our products compete on the basis of advantages that make them more suitable for certain applications as described above.
Iodine and its Derivatives
We believe that we are the world’s largest producer of iodine. In 2018,2020, our revenues from iodine and iodine derivatives amounted to US$325.0334.7 million, representing 14.3%18.4% of our total revenues in that year. We estimate that our sales accounted for approximately 36%28% of worldglobal iodine sales by volume in 2018.2020.
Iodine: Market
Iodine and iodine derivatives are used in a wide range of medical, agricultural and industrial applications as well as in human and animal nutrition products. Iodine and iodine derivatives are used as raw materials or catalysts in the formulation of products such as X-ray contrast media, biocides, antiseptics and disinfectants, pharmaceutical intermediates, polarizing films for LCD and LED screens, chemicals, organic compounds and pigments. Iodine is also added in the form of potassium iodate or potassium iodide to edible salt to prevent iodine deficiency disorders.
| 30 |
X-ray contrast media is the leading application of iodine, accounting for approximately 23% of demand. Iodine’s high atomic number and density make it ideally suited for this application, as its presence in the body can help to increase contrast between tissues, organs, and blood vessels with similar X-ray densities. Other applications include pharmaceuticals, which we believe account for 13% of demand; LCD and LED screens, 12%; iodophors and povidone-iodine, 9%; animal nutrition, 8%; fluoride derivatives, 7%; biocides, 6%; nylon, 4%; human nutrition, 3%4% and other applications, 15%14%.
During 2018,2020, iodine demand grew at a similar rate as in 2017, reaching 36,300was impacted significantly due to the economic crisis caused by Covid-19, with total global demand decreasing by approximately 9% to 33,200 metric tons. Although more traditionalthe decrease in demand occurred across product lines, two uses of iodine had growth compared to 2019: the use of povidone-iodine grew atby 6%, and the same rate asuse of iodine for human nutrition grew by 1%. It is expected that the majority of iodine applications will begin to recover demand during the previous year, new applications such as carbon energy plants emission control industries and demand growth related to the LED and LCD market resulted higher demand for iodine and derivatives.course of 2021.
Iodine: Our Products
We produce iodine in our Nueva Victoria plant, near Iquique, and our Pedro de Valdivia plant, close to María Elena. We have a total effective production capacity of approximately 14,00014,800 metric tons per year of iodine, including the Iris plant, which is located close to the Nueva Victoria plant.
Through ASG, we produce organic and inorganic iodine derivatives. ASG was established in the mid-1990s and has production plants in the United States, Chile and France. ASG is one of the world’s leading inorganic and organic iodine derivatives producer.
Consistent with our business strategy, we are constantly working on the development of new applications for our iodine-based products, pursuing a continuing expansion of our businesses and maintaining our market leadership.
We manufacture our iodine and iodine derivatives in accordance with international quality standards and have qualified our iodine facilities and production processes under the ISO-9001:2008ISO 9001:2015 program, providing third party certification of the quality management system and international quality control standards that we have implemented.
The following table shows our total sales volumes and revenues from iodine and iodine derivatives for 2018, 20172020, 2019 and 2016:2018:
| 2018 | 2017 | 2016 | ||||||||||
| Sales volumes(Th. MT) | ||||||||||||
| Iodine and derivatives | 13.3 | 12.7 | 10.2 | |||||||||
| Total revenues(in US$ millions) | 325.0 | 252.1 | 231.1 | |||||||||
| 2020 | 2019 | 2018 | ||||||||||
| Sales volumes (Th. MT) | ||||||||||||
| Iodine and derivatives | 9.7 | 12.7 | 13.3 | |||||||||
| Total revenues (in US$ millions) | 334.7 | 371.0 | 325.0 | |||||||||
Our revenues increaseddecreased to US$325.0334.7 million in 20182020 from US$252.1371.0 million in 2017.2019. This increasedecrease was primarily attributable to the increase in iodinelower sales volume and higher pricesvolumes during 2018.2020. Average iodine prices were more than 22.6%18.9% higher in 20182020 than in 2017.2019. Our sales volumes increased 5.1%decreased 24.1% in 2018, outpacing global iodine demand growth.2020.
Iodine: Marketing and Customers
In 2018,2020, we sold our iodine products in approximately 5247 countries to approximately 283250 customers, and most of our sales were exports. FourTwo customers each accounted for more than 10% of our iodine revenues in 2017.2020. These fourtwo customers accounted for approximately 53%42% of revenues, and our ten largest customers accounted in the aggregate for approximately 77% of revenues. No supplier accounted for more than 10% of the cost of sales of this business line.
| 31 |
The following table shows the geographical breakdown of our revenues:
| Revenues breakdown | 2018 | 2017 | 2016 | |||||||||
| North America | 26 | % | 25 | % | 25 | % | ||||||
| Europe | 34 | % | 31 | % | 36 | % | ||||||
| Central and South America (excluding Chile) | 2 | % | 0 | % | 0 | % | ||||||
| Asia and Others | 38 | % | 43 | % | 38 | % | ||||||
| Revenues breakdown | 2020 | 2019 | 2018 | |||||||||
| North America | 27 | % | 24 | % | 26 | % | ||||||
| Europe | 42 | % | 33 | % | 34 | % | ||||||
| Chile | 0 | % | 0 | % | 0 | % | ||||||
| Central and South America (excluding Chile) | 3 | % | 2 | % | 2 | % | ||||||
| Asia and Others | 27 | % | 40 | % | 37 | % | ||||||
We sell iodine through our own worldwide network of representative offices and through our sales, support and distribution affiliates. We maintain inventories of iodine at our facilities throughout the world to facilitate prompt delivery to customers. Iodine sales are made pursuant to spot purchase orders or within the framework of supply agreements. Supply agreements generally specify annual minimum and maximum purchase commitments, and prices are adjusted periodically, according to prevailing market prices.
Iodine: Competition
The world’s main iodine producers are based in Chile, Japan and the United States. Iodine is also produced in Russia, Turkmenistan, Azerbaijan, Indonesia and China.
Iodine is produced in Chile using a unique mineral known as caliche ore, whereas in Japan, the United States, Russia, Turkmenistan, Azerbaijan, and Indonesia, producers extract iodine from underground brines that are mainly obtained together with the extraction of natural gas and petroleum. In China, iodine is extracted from seaweed.
Five Chilean companies accounted for approximately 59%55% of total global sales of iodine in 2018,2020, including SQM, with approximately 36%28%, and four other producers accounting for the remaining 23%27%. The other Chilean producers are:are Atacama Chemical S.A. (Cosayach), controlled by the Chilean holding company Inverraz S.A.; ACF Minera S.A., owned by the Chilean family Urruticoechea;Urruticoechea family; Algorta Norte S.A., a joint venture between ACF Minera S.A. and Toyota Tsusho; and Atacama Minerals, recently acquiredwhich is owned by Chinese company Tewoo.
We estimate that eight Japanese iodine producers accounted for approximately 29%28% of global iodine sales in 2018,2020, including recycled iodine.
We estimate that iodine producers in the United States (one of which is owned by Toyota Tsusho and another is owned by Ise Chemicals Ltd., both of which are Japanese companies) accounted for nearly 5% of world iodine sales in 2018.2020.
Iodine recycling is a growing trend worldwide. Several producers have recycling facilities where they recover iodine and iodine derivatives from iodine waste streams.
We estimate the 17%19% of the iodine supply comecomes from iodine recycling. Through ASG or alone, we are also actively participating in the iodine recycling business using iodinated side-streams from a variety of chemical processes in Europe and the United States.
The prices of iodine and iodine derivative products are determined by market conditions. World iodine prices vary depending upon, among other things, the relationship between supply and demand at any given time. Iodine supply varies primarily as a result of the production levels of the iodine producers (including us) and their respective business strategies. Our annual average iodine sales prices increased to approximately US$2435 per kilogram in 2018, higher than2020, from the average sales prices of approximately US$29 per kilogram observed in 2017.2019.
| 32 |
Demand for iodine varies depending upon overall levels of economic activity and the level of demand in the medical, pharmaceutical, industrial and other sectors that are the main users of iodine and iodine-derivative products. Certain substitutes for iodine are available for certain applications, such as antiseptics and disinfectants, which could represent a cost-effective alternative to iodine depending on prevailing prices.
The main factors of competition in the sale of iodine and iodine derivative products are reliability, price, quality, customer service and the price and availability of substitutes. We believe we have competitive advantages compared to other producers due to the size and quality of our mining reserves and the available production capacity. We believe our iodine is competitive with that produced by other manufacturers in certain advanced industrial processes. We also believe we benefit competitively from the long-term relationships we have established with our largest customers.
Lithium and its Derivatives
In 2018,2020, our revenues from lithium sales amounted to US$734.8383.4 million, representing 32.4%21.1% of our total revenues. We believe we are one of the world’s largest producers of lithium carbonate and lithium hydroxide, and we estimate that our sales volumes accounted for approximately 17%19% of the global lithium chemicals sales volumes.
Lithium: Market
The lithium market can be divided into (i) lithium minerals for direct use (in which market SQM does not participate directly), (ii) basic lithium chemicals, which include lithium carbonate and lithium hydroxide (as well as lithium chloride, from which lithium carbonate may be made), and (iii) inorganic and organic lithium derivatives, which include numerous compounds produced from basic lithium chemicals (in which market SQM does not participate directly).
Lithium carbonate and lithium hydroxide are principally used to produce the cathodes for rechargeable batteries, taking advantage of lithium’s extreme electrochemical potential and low density. Batteries are the leading application for lithium, accounting for approximately 65%75% of total lithium demand, including batteries for electric vehicles, which accounted for approximately 36%54% of total lithium demand.
There are many other applications both for basic lithium chemicals and lithium derivatives, such as lubricating greases (approximately 7%5% of total lithium demand), heat-resistant glass (ceramic glass) (approximately 5% of total lithium demand), chips for the ceramics and glaze industry (approximately 3%2% of total lithium demand), chemicals for air conditioning (approximately 2%1% of total lithium demand), and many others, including air treatment systems, pharmaceutical synthesis and metal alloys.
Lithium’s main properties, which facilitate its use in this range of applications, are that it:
| · | is the lightest solid metal and element at room temperature; |
| · | is low density; |
| · | has a low coefficient of thermal expansion; |
| · | has high electrochemical potential; and |
| · | has a high specific heat capacity. |
| 33 |
During 2018,2020, lithium chemicals demand increased by approximately 27%6%, reaching approximately 269,000330,000 metric tons. We expect applications related to energy storage to continue driving demand in the coming years.
Lithium: Our Products
We produce lithium carbonate at our Salar del Carmen facilities, near Antofagasta, Chile, from highly concentrated lithium chloride produced in the Salar de Atacama, as a by-product of the potassium chloride production.Atacama. The annual production capacity of our lithium carbonate plant at the Salar del Carmen is now 70,000 metric tons per year. InWe are in the future, we plan to increaseprocess of increasing our production capacity to 180,000 metric tons per year. We believe that the technologies we use, together with the high concentrations of lithium and the characteristics of the Salar de Atacama, such as high evaporation rate and concentration of other minerals, allow us to be one of the lowest cost producers worldwide.
We also produce lithium hydroxide at the same plant at the Salar del Carmen, next to the lithium carbonate operation. The lithium hydroxide facility has a production capacity of 13,500 metric tons per year and is onewe are in the process of increasing this production capacity to 30,000 metric tons per year. In addition, in February 2021 our Board approved the investment for our 50% share of the largest plantsdevelopment costs in the world.Mt. Holland lithium project in our joint venture with Wesfarmers, which we expect will have a total production capacity of 50,000 metric tons.
The following table shows our total sales volumes and revenues from lithium carbonate and its derivatives for 2018, 20172020, 2019 and 2016:2018:
| 2018 | 2017 | 2016 | ||||||||||
| Sales volumes(Th. MT) | ||||||||||||
| Lithium and derivatives | 45.1 | 49.7 | 49.7 | |||||||||
| Total revenues(in US$ millions) | 734.8 | 644.6 | 514.6 | |||||||||
| 2020 | 2019 | 2018 | ||||||||||
| Sales volumes (Th. MT) | ||||||||||||
| Lithium and derivatives | 64.6 | 45.1 | 45.1 | |||||||||
| Total revenues (in US$ millions) | 383.4 | 505.7 | 734.8 | |||||||||
Our revenues in 20182020 were US$734.8383.4 million, a 14.0% increase24.2% decrease from US$644.6505.7 million in 2017,2019, due to significantly higherlower prices during the year. The average price for 20182020 was approximately 25.6% higher47.1% lower than the average price in 2017.2019.
Lithium: Marketing and Customers
In 2018,2020, we sold our lithium products in approximately 42 countries to approximately 160187 customers, and most of our sales were to customers outside of Chile. Two customers eachOne customer accounted for more than 10% of our lithium revenues in 2018,2020, accounting for approximately 30%12% of our lithium revenues. Our ten largest customers accounted in the aggregate for approximately 74%58% of revenues. No supplier accounted for more than 10% of the cost of sales of this business line. We make lease payments to Corfo which are associated with the sale of different products produced in the Salar de Atacama, including lithium carbonate, lithium hydroxide and potassium chloride. See Note 24.2 to our consolidated financial statements for the disclosure of lease payments made to Corfo for all periods presented.
The following table shows the geographical breakdown of our revenues:
| Revenues breakdown | 2018 | 2017 | 2016 | |||||||||
| North America | 9 | % | 7 | % | 8 | % | ||||||
| Europe | 14 | % | 14 | % | 19 | % | ||||||
| Central and South America (excluding Chile) | 1 | % | 1 | % | 1 | % | ||||||
| Asia and Others | 76 | % | 79 | % | 73 | % | ||||||
| Revenues breakdown | 2020 | 2019 | 2018 | |||||||||
| North America | 7 | % | 9 | % | 9 | % | ||||||
| Europe | 13 | % | 15 | % | 14 | % | ||||||
| Chile | 0 | % | 0 | % | 0 | % | ||||||
| Central and South America (excluding Chile) | 0 | % | 1 | % | 0 | % | ||||||
| Asia and Others | 80 | % | 75 | % | 76 | % | ||||||
We sell lithium carbonate and lithium hydroxide through our own worldwide network of representative offices and through our sales, support and distribution affiliates. We maintain inventories of these products at our facilities throughout the world to facilitate prompt delivery to customers. Sales of lithium carbonate and lithium hydroxide are made pursuant to spot purchase orders or within the framework of supply agreements. Supply agreements generally specify annual minimum and maximum purchase commitments, and prices are adjusted periodically, according to prevailing market prices. In December 2020, we signed a nine-year sales contract with LG Energy Solution for up to 55,000 metric tons of lithium carbonate equivalent.
Lithium: Competition
Lithium is produced mainly from two sources: (i) concentrated brines and (ii) minerals. During 2018,2020, the main lithium brines producers were Chile, Argentina and China, while the main lithium mineral producers were Australia and China. With total sales of approximately 45,10064,600 metric tons of lithium carbonate equivalent (LCE),and hydroxide, SQM’s market share of lithium chemicals was approximately 17%19% in 2018.2020. One of our main competitors is Albemarle Corporation (“Albemarle”), which produces lithium carbonate and lithium chloride in Chile and the United States, along with lithium derivatives in the United States, Germany, Taiwan and China, with a market share of approximately 28%22%. Albemarle also owns 49% of Talison Lithium Pty Ltd. (“Talison”), an Australian company, that is the largest producer of concentrated lithium minerals in the world, based in Western Australia. The remaining 51% of Talison is owned by Sichuan Tianqi Lithium IndustriesCorp. (“Tianqi”), a Chinese company producing basic lithium chemicals in China from concentrated lithium minerals. Talison sells a part of its concentrated lithium mineral production to the direct use market, but most of its production, representing approximately 26%21% of total lithium chemical demand, is converted into basic lithium chemicals in China by Tianqi and Albemarle. Currently, Tianqi is planning to begin production at its lithium hydroxide plant in Australia, which is expected to be operational during 2021. Tianqi is also a significant shareholder of ours, holding approximately 25.86% of our shares. Albemarle plans to begin production at its lithium hydroxide plant in Australia in late 2021.
Another important competitor is FMCLivent Corporation (“FMC”Livent”), with an estimated market share of approximately 7%6%. FMCLivent has production facilities in Argentina through Minera del Altiplano S.A., where it produces lithium chloride and lithium carbonate. In addition, FMCLivent produces lithium derivatives in the United States, and in the United Kingdom.Kingdom and China. Orocobre Ltd. is also, based in Argentina, and produces lithium carbonate, reachingwith a market share of approximately 4%3%.
Australia is an important source of concentrated lithium minerals. InSince 2018, two producers have doubled their production of concentrated mineral, which is then converted into lithium chemicals in China. One of these producers is a joint venture between Ganfeng Lithium Co. (“Ganfeng”) and Mineral Resources Ltd in the Mt. Marion project. Galaxy Resources Ltd. is another important producer with operations in Mt. Cattlin. Additionally, three new players began shipping concentrated lithium minerals in 2018, Pilbara Minerals and(which recently acquired Altura Mining,Mining), both producingproduce from the Pilgangoora deposit, and Alliance Mineral Assets Ltd., producing from the Bald Hill deposit. In addition, there were at least ten other companies producing lithium in China from brines or minerals in 2018.2020.
We believe that lithium production will continue to increase in the near future, balancing the explosive growth in demand.response to an increase in demand growth. A number of new projects to develop lithium deposits has been announced recently. Some of these projects are already in the advanced stages of development and others could materialize in the medium term.
| 34 |
Potassium
In 2018,2020, our potassium chloride and potassium sulfate revenues amounted to US$267.5209.3 million, representing 11.8%11.5% of our total revenues and a 29.5%1.3% decrease compared to 2017,2019, as a result of reduced sales volumes.decreased average prices. We estimate that we accounted for less than 2%approximately 1% of global sales of potassium chloride in 2018.2020.
We produce potassium chloride by extracting brines from the Salar de Atacama that are rich in potassium chloride and other salts.
Potassium is one of the three macronutrients that a plant needs to develop. Although potassium does not form part of a plant’s structure, it is essential to the development of its basic functions. Potassium chloride is the most commonly used potassium-based fertilizer. It is used to fertilize crops that can tolerate relatively high levels of chloride, and to fertilize crops that are grown under conditions with sufficient rainfall or irrigation practices that prevent chloride from accumulating to excess levels in the rooting systems of the plant.
Some benefits that may be obtained through the use of potassium are:
| · | increased yield and quality; |
| · | increased production of proteins; |
| · | increased photosynthesis; |
| · | intensified transport and storage of assimilates; |
| · | prolonged and more intense assimilation period; |
| · | improved water efficiency; |
| · | regulated opening and closure of stomata; and |
| · | synthesis of lycopene. |
Potassium chloride is also an important component for our specialty plant nutrition product line, where it is used as a raw material to produce potassium nitrate.
Since 2009, our effective end product capacity has increased to over 2 million metric tons per year, granting us improved flexibility and market coverage.
Potassium: Market
During the last decade, growth in demand for potassium chloride, and for fertilizers in general, has been driven by several key factors, such as a growing world population, higher demand for protein-based diets and less arable land. All of these factors contribute to fertilizer demand growth as a result of efforts to maximize crop yields and use resources more efficiently. For the last ten years, the compound annual growth for the global potassium chloride market was approximately 1-2%1 to 2%. We estimate that demand totaled approximately 66increased 3 million metric tons in 2018, an increase from 642020, reaching approximately 67 million metric tons in 2017.tons.
According to studies prepared by the International Fertilizer Industry Association, cereals account for approximately 45% of world potassium consumption, including corn (14%), rice (13%) and wheat (3%). Oilseeds, predominantly soybeans and palm oil, represent approximately 16% of total potassium demand. Fruits and vegetables account for approximately 22% of world potassium demand, and sugar crops account for close to 7%.
Potassium: Our Products
Potassium chloride differs from our specialty plant nutrition products because it is a commodity fertilizer and contains chloride. We offer potassium chloride in two grades: standard and compacted. Potassium sulfate is considered a specialty fertilizer and we offer this product in soluble grades.
| 35 |
The following table shows our sales volumes of and revenues from potassium chloride and potassium sulfate for 2018, 20172020, 2019 and 2016:2018:
| 2018 | 2017 | 2016 | ||||||||||
| Sales volumes(Th. MT) | ||||||||||||
| Potassium chloride and potassium sulfate | 831.8 | 1,344.3 | 1,534.7 | |||||||||
| Total revenues(in US$ millions) | 267.5 | 379.3 | 403.3 | |||||||||
| 2020 | 2019 | 2018 | ||||||||||
| Sales volumes (Th. MT) | ||||||||||||
| Potassium chloride and potassium sulfate | 726.7 | 597.3 | 831.8 | |||||||||
| Total revenues (in US$ millions) | 209.3 | 212.2 | 267.5 | |||||||||
Our revenues in 20182020 were US$267.5209.3 million, a 29.5%1.3% decrease from US$379.3212.2 million in 2017,2019, due to significantly lower sales volumesprices during the year. Our sales volumes in 20182020 were approximately 38.1% lower21.7% higher than sales volumes reported last year as we focused on maximizing our yields of lithium in the Salar de Atacama.year.
Potassium: Marketing and Customers
In 2018,2020, we sold potassium chloride and potassium sulfate to approximately 475509 customers in over 58approximately 41 countries. There were noNo individual customers that eachcustomer accounted for more than 10% of our revenues of potassium chloride and potassium sulfate in 2018.2020. We estimate that our ten largest customers accounted in the aggregate for approximately 47%38% of such revenues. One supplier accounted for more than 10% of the cost of sales of this business line, accounting for approximately 20%11% of the cost of sales for the business line. We make lease payments to Corfo which are associated with the sale of different products produced in the Salar de Atacama, including lithium carbonate, lithium hydroxide and potassium chloride. See Note 24.2 to our consolidated financial statements for the disclosure of lease payments made to Corfo for all periods presented.
The following table shows the geographical breakdown of our revenues:
| Revenues breakdown | 2018 | 2017 | 2016 | |||||||||
| North America | 19 | % | 18 | % | 20 | % | ||||||
| Europe | 17 | % | 19 | % | 20 | % | ||||||
| Central and South America (excluding Chile) | 30 | % | 38 | % | 38 | % | ||||||
| Asia and Others | 34 | % | 25 | % | 22 | % | ||||||
| Revenues breakdown | 2020 | 2019 | 2018 | |||||||||
| North America | 19 | % | 20 | % | 19 | % | ||||||
| Europe | 14 | % | 13 | % | 17 | % | ||||||
| Chile | 11 | % | 13 | % | 10 | % | ||||||
| Central and South America (excluding Chile) | 35 | % | 31 | % | 30 | % | ||||||
| Asia and Others | 21 | % | 23 | % | 24 | % | ||||||
Potassium: Competition
We estimate that we accounted for less than 3%approximately 1% of global sales of potassium chloride in 2018.2020. Our main competitors are Nutrien, (formerly PCS), Uralkali, Belaruskali and Mosaic. We estimate that in 2018, PCS accounted for approximately 20% of global sales, Uralkali accounted for approximately 18% of global sales,2020, Belaruskali accounted for approximately 18% of global sales, Nutrien accounted for approximately 19% of global sales, Uralkali accounted for approximately 16% of global sales, and Mosaic accounted for approximately 15%14% of global sales.
In the potassium sulfate market, we have several competitors, of which the most important are K+S KALI GmbH (Germany), Tessenderlo Chemie (Belgium) and Great Salt Lake Minerals Corp. (United States). We estimate that these three producers account for approximately 30% of its worldwide production of potassium sulfate. SQM is no longer in the potassium sulfate market with own production.
Industrial Chemicals
In 2018,2020, our revenues from industrial chemicals were US$108.3160.6 million, representing approximately 4.8%8.8% of our total revenues for that year. We estimate that our market share in the industrial potassium nitrate market was approximately 34% for 2018.
In addition to producing sodium and potassium nitrate for agricultural applications, we produce different grades of these products, including prilled grades, for industrial applications. The different grades differ mainly in their chemical purity. We enjoy certain operational flexibility producing industrial nitrates, because they are produced from the same process as their equivalent agricultural grades, needing only an additional step of purification. We may, with certain constraints, shift production from one grade to the other depending on market conditions. This flexibility allows us to maximize yields and to reduce commercial risk.
| 36 |
In addition to producing industrial nitrates, we produce, market and sell industrial-grade potassium chloride.
Industrial Chemicals: Market
Industrial sodium and potassium nitrates are used in a wide range of industrial applications, including the production of glass, ceramics and explosives, charcoal briquettes,metal recycling, insulation materials, metal treatments, together withthermal solar and various chemical processes.
In addition, this product line has also experienced growth from the use of industrial nitrates as thermal storage in concentrated solar power plants (commonly known as “CSP”). Solar salts for this specific application contain a blend of 60% sodium nitrate and 40% potassium nitrate by weight ratio and are used as a storage and heat transfer medium. Unlike traditional photovoltaic plants, these new plants use a “thermal battery” that contains molten sodium nitrate and potassium nitrate, which store the heat collected during the day. The salts are heated up during the day, while the plants are operating under direct sunlight, and at night they release the solar energy that they have captured, allowing the plants to operate even during hours of darkness. Depending on the power plant technology, solar salts are also used as a heat transfer fluid in the plant system and thereby make CSP plants even more efficient, increasing their output and reducing the Levelized Cost of Electricity (LCOE).
Experts believe that CSPs playWe see a critical role ingrowing trend for the CSP application as a result of its economical long duration electricity gridstorage. The thermal storage of CSP plants helps to improve the stabilization and manageability due to their inherentof the electricity grid. Like all large scale storage capability. Nevertheless,power generation plants, such large installationsCSP power plants are capital intensive and are strongly influenced by the generation mix in each country. Therefore, fluctuations inrequire a relatively long development period.
We supply solar salts demand are unavoidable in terms of quantity and timing. In 2017, we suppliedto CSP projects around the world. In 2020, we sold approximately 160,000 metric tons of solar salts to supply a CSP project in South Africa, Morocco, Kuwait and Israel totalingthe Middle East. We expect to supply over 88,000400,000 metric tons.tons to this project between 2020-2022. In 2018,addition, we further supplied CSP plants reaching 47,000believe there are ten major projects currently under development worldwide that we believe we could supply between 2020-2025. As a result, we expect our sales volumes of this product to surpass 1 million metric tons.tons during the 2020-2025 period.
We are also experiencing a growing interest in using solar salts in thermal storage solutions not related to CSP technology. Due to their proven performance, solar salts are being tested in industrial heat processes and heat waste solutions. These new applications may open new opportunities to thefor solar salts uses in the near future.
Industrial-grade potassium chloride is usedfuture, such as an additive in oil drilling as well as in food processing, among other applications.retrofitting coal plants.
Industrial Chemicals: Our Products
The following table shows our sales volumes of industrial chemicals and total revenues for 2018, 20172020, 2019 and 2016:2018:
| 2018 | 2017 | 2016 | ||||||||||
| Sales volumes(Th. MT) | ||||||||||||
| Industrial chemicals | 135.9 | 167.6 | 128.9 | |||||||||
| Total revenues(in US$ millions) | 108.3 | 135.6 | 104.1 | |||||||||
| 2020 | 2019 | 2018 | ||||||||||
| Sales volumes (Th. MT) | ||||||||||||
| Industrial chemicals | 225.1 | 123.5 | 135.9 | |||||||||
| Total revenues (in US$ millions) | 160.6 | 94.9 | 108.3 | |||||||||
Revenues for industrial chemicals decreasedincreased to US$160.6 million in 2020 from US$135.694.9 million in 2017 to US$108.3 million in 2018,2019, as a result of lowerhigher sales volumes of solar salts in this business line. Sales volumes in 2018 decreased 18.9%2020 increased 82.3% compared to sales volumes reported last year.
| 37 |
Industrial Chemicals: Marketing and Customers
We sold our industrial nitrate products in approximately 54 countries in 20182020 to approximately 293268 customers. One customer accounted for more than 10% of our revenues of industrial chemicals in 2018,2020, accounting for approximately 28%69%, and our ten largest customers accounted in the aggregate for approximately 56%79% of such revenues. No supplier accounted for more than 10% of the cost of sales of this business line. We make lease payments to CORFO which are associated with the sale of different products produced in the Salar de Atacama, including lithium carbonate, lithium hydroxide and potassium chloride. See Note 24.2 to our consolidated financial statements for the disclosure of lease payments made to CORFO for all periods presented.
The following table shows the geographical breakdown of our revenues for 2018, 20172020, 2019 and 2016:2018:
| Revenues breakdown | 2018 | 2017 | 2016 | 2020 | 2019 | 2018 | ||||||||||||||||||
| North America | 25 | % | 19 | % | 24 | % | 15 | % | 29 | % | 25 | % | ||||||||||||
| Europe | 16 | % | 21 | % | 14 | % | 7 | % | 16 | % | 16 | % | ||||||||||||
| Chile | 3 | % | 42 | % | 4 | % | ||||||||||||||||||
| Central and South America (excluding Chile) | 11 | % | 7 | % | 9 | % | 3 | % | 7 | % | 11 | % | ||||||||||||
| Asia and Others | 48 | % | 53 | % | 54 | % | 72 | % | 6 | % | 43 | % | ||||||||||||
We sell ourOur industrial chemical products are marketed mainly through our own worldwide network of representative offices, representatives and through our sales and distribution affiliates.distributors. We maintain updated inventories of our different gradesstocks of sodium nitrate and potassium nitrate, products atclassified according to graduation, to facilitate prompt dispatch from our facilities in Europe, North America, South Africa, Asia and South America to achieve prompt deliveries to customers. Our Research and Development department, together with our foreign affiliates, provides technicalwarehouses. We provide support to our customers and continuously workswork with them to develop new products orand applications for our products.
Industrial Chemicals: Competition
We believe that we are one of the leadingworld's largest producers of industrial sodium nitrate and potassium nitratenitrate. In 2020, our estimated market share by volume for industrial uses. In the case ofpotassium nitrate was 73% and for industrial sodium nitrate we estimate that our sales represented close to 41% of worldwas 44% (excluding domestic demand in 2018 (excluding internal demand for China and India, for which we believe reliable estimates are not available)India).
Our competitors are mainly based in Europe and Asia, producing sodium nitrate as a by-product of other production processes. In refined grade sodium nitrate, BASF AG, (“BASF”), a German corporation, and several producers in China and Eastern Europe are highly competitive in the European and Asian markets.competitive. They produce industrial sodium nitrate as a by-product of other production processes. Our industrial sodium nitrate products also compete indirectly with substitute chemicals, including sodium carbonate, sodium sulfate, calcium nitrate and ammonium nitrate, which may be used in certain applications instead of sodium nitrate and are available from a large number of producers worldwide.
Our main competitor in the industrial potassium nitrate business is Haifa, which we estimate had a market share of 19%.16% for 2020. We estimate that our market share was approximately 34%73% for 2018.2020. Other competitors are mostly based in China.
Producers of industrial sodium nitrate and industrial potassium nitrate compete in the market for industrial sodium and potassium nitratemarketplace based on reliability,attributes such as product quality, delivery reliability, price, and customer service. We believe that we are a low-cost producer ofOur operation offers both products at high quality and with low cost. In addition, our operation is flexible, allowing us to produce industrial or agricultural nitrates, maximizing our yields and reducing commercial risk. In addition, with certain restrictions, we are able to produce high quality products.adapt production from one grade to another depending on market needs.
In the industrial potassium chloride market, we are a relatively small producer, mainly focused on supplying regional needs.
| 38 |
In the solar salts business, we believe we have been the market leader since we started selling to commercial projects in 2007. Our competitors include Haifa, which is a potassium nitrate supplier, and BASF, which is a sodium nitrate supplier.
Other Products
A large partSQM also receives income from the commercialization of our other revenue is related to fertilizer trading, usually commodities.third-party fertilizers (specialty and commodity). These fertilizers are traded in large volumes worldwide.worldwide and are used as raw material for our specialty mixes or to complement our product portfolio. We have developed a trade,commercial management, supply, flexibility and inventory management businesscapabilities that allowsallow us to respond quickly and effectivelyadapt to the changing fertilizer market in which we operate and profit onobtain profits from these trades.transactions.
Production Process
Our integrated production process can be classified according to our natural resources:
| · | caliche ore deposits, which contain nitrates, iodine and potassium; and |
| · | brines from the Salar de Atacama, which contain potassium, lithium, sulfate, boron and magnesium. |
Caliche Ore Deposits
Caliche ore deposits are located in the First and Second Regions in northern Chile. During 2018,2020, our mining operations concentrated in the firstFirst Region where we mainly worked in the mining sector Tente en el Aire and in the mining sectorsectors Nueva Victoria Oeste. MiningOeste, Norte and Sur. The Second Region mining operations at the Pampa Blanca site, the El Toco mine (which is part of the María Elena site) and the Pedro de Valdivia site were suspended in March 2010, November 2013 and November 2015, respectively, in an effort to optimize our production facilities with lower production costs.
Caliche ore is found under a layer of barren overburden in seams with variable thickness from twenty centimeters to four meters, and with the overburden varying in thickness between half a meter and two meters.
Before proper mining begins, the exploration stage is carried out, including complete geological reconnaissance, sampling and drilling caliche ore to determine the quality and characteristics of each deposit.deposit and treatability tests are performed at a pilot plant. Drill-hole samples are properly identified and tested at our chemical laboratories. With the exploration information on a closed grid pattern of drill holes, the ore evaluation stage provides information for mine planning purposes. Mine planning is done on a long-term basis (ten years), medium-term basis (three to five years) and short-term basis (one year). Once all of this information has been compiled, detailed planning for the exploitation of the mine takes place.
The mining process generally begins with bulldozers first breaking and then removing the overburden in the mining area. This process is followed by an inspection and review of the drill holes before production drilling and blasting occurs to break the caliche seams. Front-end loaders and bulldozers load the ore onto off-road trucks, which take it to the leaching heaps to be processed.
During 2018,2020, SQM continued running various testsworked with atwo continuous mining equipment replacingsystems to replace the drilling and blasting process for mining some of the caliche ore and obtaining a smaller ore size (under 6 ½ inches) that allows a better metallurgical recovery. The tests will continue into 2019.
The run of mine ore is loaded in heaps and leached with water to produce concentrated solutions containing iodine, nitrate and potassium. These solutions are then sent to plants where iodine is extracted through both solvent-extraction and blow out processes. The remaining solutions are subsequently sent to solar evaporation ponds where the solutions are evaporated and salts rich in nitrate and potassium are produced. These concentrated salts are then sent to Coya Sur where they are used to produce potassium nitrate and sodium nitrate.
| 39 |
During 2018,2020, the Pedro de Valdivia site generated solutions produced by leaching the mine tailings. These solutions are treated at the iodide plant at Pedro de Valdivia. After iodide is obtained, the remaining solutions, which are rich in nitrate and potassium, are sent to the solar evaporation ponds at Coya Sur in order to be used in the production of potassium nitrate.
Caliche Ore-Derived Products
Caliche ore-derived products are:are sodium nitrate, potassium nitrate, sodium potassium nitrate and iodine.
Sodium Nitrate
During 2018,2020, sodium nitrate for both agricultural and industrial applications was produced by inventory generated at the Pedro de Valdivia facility and subsequently processed at the Coya Sur plants. The production at the Pedro de Valdivia facility, until November 2015, generated approximately 700,000 tons of inventory. As of December 2018, we had approximately 160,000 tons of crystallized sodium nitrate in inventory, which will provide us with enough sodium nitrate to produce finished nitrates for approximately one year. For subsequent production, we are developing the project of adapting the available crystallization plants at Coya Sur to be able to produce sodium nitrate usingfrom nitrate salts from our Nueva Victoria facility,mining operations at Sur Viejo and fed to our new crystallization plant located in Coya Sur, which should be completedbegan operating in December 2019.
Crystallized sodium nitrate is an intermediate product that is subsequently processed further at the Coya Sur production plants to produce sodium nitrate, potassium nitrate and sodium potassium nitrate in different chemical and physical forms, including crystallized and prilled products. Finally, the products are transported by truck to our port facilities in Tocopilla for shipping to customers and distributors worldwide.
Potassium Nitrate
Potassium nitrate is produced at our Coya Sur facility using a production process developed in-house. The brines generated by the leaching process at Pedro de Valdivia are pumped to Coya Sur’s solar evaporation ponds for a nitrate concentration process. After the nitrate concentration process, the brine is pumped to a conversion plant where potassium salts from the Salar de Atacama and nitrate and potassium salts produced at Nueva Victoria or Coya Sur are added. A chemical reaction begins, transforming sodium nitrate into potassium nitrate and discarding formed sodium chloride. This brine is pumped to a crystallization plant, which crystallizes the potassium nitrate by cooling it at atmospheric pressure and separating it from the liquid by centrifuge.
Our current potassium nitrate production capacity at Coya Sur is approximately 1,300,000 metric tons per year. SinceDuring 2020, we worked on several initiatives to improve productivity, including the endcommencement of 2013, we have been working with external advisors to implement the “lean” methodconstruction of manufacturinga new magnesium abatement plant in ourSur Viejo which will allow for high content potassium nitrate plants. We achieved complete implementation of this method of manufacturing during 2015. The improvements we have achieved have enabled us to reduce costs, improve energy consumption, increase the production ofsalt recovery from potassium nitrate and decrease our accident rates. This method is based on increasing the involvement of our workers in decision-making, and strengthening the leadership of our production supervisors. The goal is to identify opportunities to improve the production process and reduce waste on an ongoing basis.
During 2018, new operational improvements have been achieved by significantly integrating the production process of the Coya Sur facilities, allowing new increases in production capacity without major investments and improving the use of raw materialssalts from the Salar de Atacama and Nueva Victoria.Atacama. This plant will begin the commissioning process in mid-2021. We also began the removal of magnesium in nitrates from Pedro de Valdivia by using high sulfate salts from Pampa Blanca that allow for improved nitrate recovery during the evaporation ponds process.
The potassium nitrate produced at Coya Sur is transported to Tocopilla for shipping and delivery to customers and distributors. All potassium nitrate produced in crystallized or prilled form at Coya Sur has been certified by TÜV-Rheinland under the quality standard ISO 9001:2015.
Sodium Potassium Nitrate
Sodium potassium nitrate is a mixture of approximately two parts sodium nitrate per one part potassium nitrate. We produce sodium potassium nitrate at our Coya Sur prilling facilities using standard, non-patented production methods we have developed. Crystallized sodium nitrate is supplied together with the crystallized potassium nitrate to the prilling plant where it is mixed producing sodium potassium nitrate, which is then melted and prilled. The prilled sodium potassium nitrate is transported to Tocopilla for bulk shipment to customers.
The production process for sodium potassium nitrate is basically the same as that for sodium nitrate and potassium nitrate. With certain production restraints and following market conditions, we may supply sodium nitrate, potassium nitrate or sodium potassium nitrate, either in prilled or crystallized form.
| 40 |
The sodium nitrate and potassium nitrate produced at Coya Sur areis transported to Tocopilla for shipping and delivery to customers and distributors. All potassium nitrate produced in crystallized or prilled form at Coya Sur has been certified by TÜV-Rheiland under the quality standard ISO 9001:2008.
Iodine and Iodine Derivatives
During 2018,2020, we produced iodine at our facilities at Nueva Victoria (including the Iris facility) and Pedro de Valdivia. Iodine is extracted from solutions produced by leaching caliche ore.
As in the case of nitrates, the process of extracting iodine from the caliche ore is well established, but variations in the iodine and other chemical contents of the treated ore and other operating parameters require a high level of know-how to manage the process effectively and efficiently.
The solutions resulting from the leaching of caliche ore carry iodine in iodate form. Part of the iodate solution is reduced to iodide using sulfur dioxide, which is produced by combusting (burning) sulfur. The resulting iodide is combined with the rest of the untreated iodate solution to release elemental iodine in low concentrations. The iodine is then extracted from the aqueous solutions and concentrated in iodide form using a solvent extraction and stripping plant in the Pedro de Valdivia and Nueva Victoria facilities and using a blow out plant in Iris.the Iris facility. The concentrated iodide is oxidized to metallic iodine, which is then refined through a smelting process and prilled. We have obtained patents in the United States and Chile (Chilean patent number 47,080) for our iodine prilling process.
Prilled iodine is tested for quality control purposes, using international standard procedures that we have implemented. It is then packed in 20 to 50 kilogram50-kilogram drums or 350 to 700 kilogram maxibags350-to-700-kilogram maxi bags and transported by truck to Antofagasta, Mejillones, or Iquique for export. Our iodine and iodine derivatives production facilities have qualified under the ISO-9001:2008ISO 9001:2015 program, providing third-party certification—by TÜV-Rheiland—V-Rheinland—of the quality management system. The last recertification process was approved in February 2011. Iodine from the Iris plant was certified under ISO-9001:2008 in April 2012.November 2020.
Our total iodine production in 20182020 was 11,25512,118 metric tons: 8,8429,362 metric tons from Nueva Victoria, 1,3681,250 metric tons from Iris, and 1,0461,506 metric tons from Pedro de Valdivia. Nueva Victoria is also equipped to toll iodine from iodide delivered from our other facilities. We have the flexibility to adjust our production according to market conditions. Following the production facility restructuring at Pedro de Valdivia and Nueva Victoria, along with the ramp-up of our new iodide plant in Nueva Victoria, our total current effective production capacity at our iodine production plants is approximately 14,00014,800 metric tons per yearyear. During 2020, we continued the development of the Tente en el Aire project, progressing with making necessary environmental notices and obtaining permits required by governmental authorities. This project expects to incorporate the use of 900 liters per second of seawater, increasing the mine area by more than 40,000 hectares and allowing for increased in production in the project’s first stage of 3,000 tons of iodine and 250,000 tons of nitrate salts.
We use a portion of the iodine we produce to manufacture inorganic iodine derivatives, which are intermediate products used for manufacturing agricultural and nutritional applications, at facilities located near Santiago, Chile. We also produce inorganic and organic iodine derivative products together with Ajay, which purchases iodine from us. In the past, we have primarily sold our iodine derivative products in South America, Africa and Asia, while Ajay and its affiliates have primarily sold their iodine derivative products in North America and Europe.
In September 2010, CONAMA, currently known as the Chilean Environmental Evaluation Service, approved the environmental study of our Pampa Hermosa project in the Tarapacá Region of Chile. This environmental permit allows for an increase in the production capacity of our Nueva Victoria operations to 11,000 metric tons of iodine per year and to produce up to 1.2 million metric tons of crystallized nitrates, mine up to 37 million metric tons of caliche per year and use new water rights of up to 666.2665.7 liters per second. In Iris, we are approved for 2,000 metric tons of iodine production per year, with an annual extraction of caliche ore up to 6.48 million metric tons per year. In recent years, we have made investments in order to increase the water capacity in the Nueva Victoria operations from two water sources approved by the environmental study of Pampa Hermosa, expand the capacity of solar evaporation ponds, and implement new areas of mining and collection of solutions. Our current production capacity at Nueva Victoria is approximately 12,50013,000 metric tons per year of iodine (including the Iris operations) and 900,0001,000,000 metric tons per year of nitrates. Additional expansions may be implemented from time to time in the future, depending on market conditions.
| 41 |
Salar de Atacama Brine Deposits
The Salar de Atacama, located approximately 250210 kilometers east of Antofagasta, is a salt-encrusted depression in the Atacama Desert, within which lies an underground deposit of brines contained in porous sodium chloride rock fed by an underground inflow from the Andes mountains.mountains, which is the result of millions of years of climatic and tectonic impacts. Brines are pumped from depths of 1.515 to 60150 meters below surface, through a field of wells that are located in the Salar de Atacama, distributed in areas authorized for exploitation, and which contain relatively high concentrations of potassium, lithium, sulfates boron and other minerals.
The brines are estimated to cover a surface of approximately 2,800 square kilometers and contain commercially exploitable deposits of potassium, lithium, sulfates and boron. Concentrations vary at different locations throughout the Salar de Atacama. Our mining exploitation rights to the Salar de Atacama are pursuant to the Lease Agreement, which expires in 2030. The Lease Agreement, as amended in January 2019 by the Corfo Arbitration Agreement,2018, permits the CCHEN Chilean Nuclear Energy Commission (Comisión Chilena de Energía Nuclear) to establish a total accumulated production and sales limit of up to 349,553 metric tons of lithium metallic equivalent (1,860,670 tons of lithium carbonate equivalent), which is in addition to the approximately 64,816 metric tons of lithium metallic equivalent (345,015 tons of lithium carbonate equivalent) remaining from the originally authorized amount. See “Item 3.D. Risk Factors” and “Item 8.A.7 Legal Proceedings.”
For the year ended December 31, 2018,2020, revenues related to products originating from the Salar de Atacama represented 44%33% of our consolidated revenues, consisting of revenues from our potassium business line and our lithium and derivatives business line for the period. All of our products originating from the Salar de Atacama are derived from our extraction operations under the Lease Agreement. As of December 31, 2018,2020, only 1210 years remain on the term of the Lease Agreement.
Products Derived from the Salar de Atacama Brines
The products derived from the Salar de Atacama brines are:are potassium chloride, potassium sulfate, potassium salts, lithium chloride solutions, lithium carbonate, lithium hydroxide, lithium chloride,salts, potassium sulfate, boric acid, sodium chloride and bischofite (magnesium chloride).
Potassium Chloride
We use potassium chloride in the production of potassium nitrate. Production of our own supplies of potassium chloride provides us with substantial raw material cost savings. We also sell potassium chloride to third parties, primarily as a commodity fertilizer.
In order to produce potassium chloride, brines from the Salar de Atacama are pumped to solar evaporation ponds. Evaporation of the water contained in the brine, results in a crystallized mixture of salts with various content levels of potassium, sodium and magnesium. In the first stage of the precipitation,evaporation process, sodium chloride salts (halite) precipitate, they are then harvested and removed; these salts are nothave the potential to be used in the productioncopper mining process. In the second stage of the evaporation process, ofthe remaining brine from the first stage is transferred to other products. After further evaporation theponds where potassium chloride salts together with sodium and potassiumchloride (sylvinite) precipitate, these salts are harvested and then sent for treatment at one of the wet potassium chloride plants where potassium chloride is separated by a grinding, flotation, and filtering process. In the final evaporation stage, salts containing magnesium are harvested and eventually can be treated at one of the cold leach plants where magnesium is removed. PotassiumPart of the potassium chloride is transported approximately 300 kilometers to our Coya Sur facilities via a dedicated truck transport system, where it is used in the production of potassium nitrate. We sellThe use of potassium chloride salts as a raw material in Coya Sur allows us to capture significant savings, as it allows us to use potassium salts with different qualities and to avoid buying and importing potassium chloride from external sources.
| 42 |
The remainder of the potassium chloride produced at the Salar de Atacama is shipped to our port in excess of our needsTocopilla in either crystalized (standard) or granular (compacted) form and then shipped and sold as a commodity fertilizer to third parties. All of our potassium-relatedpotassium chloride-related plants in the Salar de Atacama currently have a nominal production capacity in excess of up to 2.6 million metric tons per year. Actual production capacity depends on volume, metallurgical recovery ratesquality and performance of the salts used in the process and quality of the mining resources pumped from the Salar de Atacama.
The by-products ofbrine that remain in the potassium chloride production process are (i) solutions remainingevaporation pond system after removal of the sodium chloride and potassium chloride generates a concentrated lithium chloride solution, which areis used to produce lithium carbonate (as described below) and generates salts rich in magnesium chloride (bischfite) as described below, with the excess amount not required for lithium carbonate production being reinjected into the Salar de Atacama; (ii) sodium chloride, which is similar to the surface material of the Salar de Atacama and is deposited at sites near the production facility and (iii) other salts containing magnesium chloride.a by-product.
Lithium CarbonateChloride Solution and Lithium ChlorideCarbonate
After the production and precipitation of the potassium chloride salts, a portion of the solutions remaining is sent to additional solar concentrationevaporation ponds adjacent to the potassium concentrationevaporation ponds. At this stage, the solution is concentratedpurified and purifiedconcentrated by precipitation to remove impurities it may still contain, including calcium, sulfate, potassium, sodium and magnesium.magnesium, reaching a lithium concentration level of approximately 6%. Next is the process of concentration and purification of the remaining concentrated solution of lithium chloride, which is transported by truck to the Salar del Carmen production facility located near Antofagasta, approximately 230195 kilometers fromsoutheast of the Salar de Atacama. At this plant, the solution is further purified and treated with sodium carbonate to produce lithium carbonate, which is dried and then, if necessary, compacted and finally packaged for shipment. shipment to customers.
The production capacity of our lithium carbonate facility atsince the end of 2018, following an expansion project was2019 has been 70,000 metric tons per year. We are now beginning the preparation for the further expansionexpanding lithium carbonate capacity to 180,000reach 120,000 metric tons per year in the future.during 2021.
Future production will depend on the actual volumes and quality of the lithium solutions sent by the Salar de Atacama operations, as well as prevailing market conditions. Our future production will also be subject to the extraction limit described in the Lease Agreement mentioned above. See “—Salar de Atacama Brine Deposits” and “Item 8.A.7 Legal Proceedings.”
Our lithium carbonate production quality assurance program has been certified by TÜV-Rheiland under ISO 9001 since 2005 and specificallyV-Rheinland under ISO 9001:2015 since September 2018.
Lithium Hydroxide
Lithium carbonate is sold to customers, and we also use it as a raw material for our lithium hydroxide production, which started operations at the end of 2005. We currently have two lithium hydroxide plants, one of which entered into operations at the end of 2018, and have a total production capacity of 13,500 metric tons per year. These plants are located in the Salar del Carmen, adjacent to our lithium carbonate operations.
In the production process, lithium carbonate is reacted with a lime solution to produce lithium hydroxide brine and calcium carbonate salt. The calcium carbonate salt which is filteredremoved from the process by filtration and piled in reservoirs. Thethe lithium hydroxide solutionbrine is stored in ponds. The brine is then evaporated in a multiple effectmulti-effect evaporator and crystallized to produce the lithium hydroxide which is filtered,then dried and packaged for shipment to customers.
During 2019 and 2020, we moved forward on an expansion plan which will allow us to produce an additional 8,000 metric tons per year of lithium hydroxide, reaching a total capacity of 21,500 metric tons per year. We believe we will reach this capacity level by the end of 2021.
Our lithium hydroxide production quality assurance program has been certified by TÜV-Rheiland under ISO 9001 since 2007 and specificallyV-Rheinland under ISO 9001:2015 since September 2018.
Potassium Sulfate and Boric Acid
Approximately 12 kilometers northeast of the potassium chloride facilities at the Salar de Atacama, we use the brines from the Salar de Atacama to produce potassium sulfate, potassium chloride (as a by-product of the potassium sulfate process) and, depending on market conditions, boric acid. The plant is located in an area of the Salar de Atacama where high sulfate and potassium concentrations are found in the brines to produce potassium sulfate. The brine is pumped to solar evaporation ponds, where sodium chloride salts are precipitated, harvested and put into piles. After further evaporation, the sulfate and potassium salts precipitate in different concentrations and are harvested and sent for processing to the potassium sulfate plant. Potassium sulfate is produced using flotation, concentration and reaction processes, after which it is crystallized, filtered, dried, classified and packaged for shipment.
Production capacity for the potassium sulfate plant is approximately 340,000 metric tons per year, of which approximately 95,000 metric tons correspond to potassium chloride obtained as a byproductby-product of the potassium sulfate process. This capacity is part of the total nominal plant capacity of 2.6 million metric tons per year. In our dual plant complex, we may switch, to some extent, between potassium chloride and potassium sulfate production. Part of the pond system in this area is also used to process potassium chloride brines extracted from the low sulfate concentration areas found in the Salar de Atacama. Depending on the conditions for the optimization of the deposit operation and/or market conditions, potassium sulfate production can be modified to produce potassium chloride.
The principal by-products of the production of potassium sulfate are: (i) non-commercial sodium chloride, which is deposited at sites near the production facility and (ii) remaining solutions, which are re-injected into the Salar de Atacama or returned to the evaporation ponds. The principal by-products of the boric acid production process are remaining solutions that are treated with sodium carbonate to neutralize acidity and then are reinjected into the Salar de Atacama.
Raw Materials
The main raw material that we require in the production of nitrate and iodine is caliche ore, which is obtained from our surface mines. The main raw material in the production of potassium chloride, lithium carbonate and potassium sulfate is the brine extracted from our operations at the Salar de Atacama.
Other important raw materials are sodium carbonate (used for lithium carbonate production, and for the neutralization of iodine solutions), sulfuric acid, kerosene, anti-caking and anti-dust agents, ammonium nitrate (used for the preparation of explosives in the mining operations), woven bags for packaging our final products, electricity acquired from electric utilities companies, and liquefied natural gas and fuel oil for heat generation. Our raw material costs (excluding caliche ore and salar brines and including energy) represented approximately 14%16% of our cost of sales in 2018.2020.
WeSince 2017, we have been connected to the northern powercentral grid, in Chile, which currently supplies electricity to mostthe majority of cities and industrial facilitiesindustries in northern Chile, since April 2000.Chile. We have several electricity supply agreements signed with major producers in Chile, which are within the contract terms. Our electricity needs are primarily covered by the Electrical Energy Supply Agreement that we entered into with AES Gener S.A. on December 31, 2012. Pursuant to the terms of the Electrical Energy Supply Agreement, we are required to purchase an amount of electricity that exceeds the amount that we estimate we will need for our operations. The excess amount is sold at marginal cost, which could result in a material loss for us.
For the supply of liquefied natural gas, in 2013 and 2014 we had a contract with Solgas. For 2015, 2016 2017 and 2018, we executed supply contracts with Enel Chile S.A. as with Solgas, primarily to serve our operations at the Salar del Carmen and Coya Sur.
For our supply of liquefied natural gas, we maintain a five-year contract with Engie, which was executed in 2019. In addition, we have a supply of liquefied petroleum gas (LPG) from Lipigas in the Salar del Carmen and the Salar de Atacama.
We obtain ammonium nitrate, sulfuric acid, kerosene and soda ash from several large suppliers, mainly in Chile and the United States, under long-term contracts or general agreements, some of which contain provisions for annual revisions of prices, quantities and deliveries. Diesel fuel is obtained under contracts that provide fuel at international market prices.
We believe that all of our contracts and agreements with third-party suppliers with respect to our main raw materials contain standard and customary commercial terms and conditions.
Water Supply
We hold water rights for the supply of surface and subterranean water near our production facilities. The main sources of water for our nitrate and iodine facilities at Pedro de Valdivia, María Elena and Coya Sur are the Loa and San Salvador rivers, which run near our production facilities. Water for our Nueva Victoria and Salar de Atacama facilities is obtained from wells near the production facilities. In addition, we buy water from third parties for our production processes at the Salar del Carmen lithium carbonate and lithium hydroxide plants, and we also purchase potable water from local utility companies. We have not experienced significant difficulties obtaining the necessary water to conduct our operations.
Government Regulations
Regulations in Chile Generally
We are subject to the full range of government regulations and supervision generally applicable to companies engaged in business in Chile, including labor laws, social security laws, public health laws, consumer protection laws, tax laws, environmental laws, free competition laws, and securities laws. These include regulations to ensure sanitary and safety conditions in manufacturing plants.
We conduct our mining operations pursuant to judicial exploration concessions and exploitation concessions granted pursuant to applicable Chilean law. Exploitation concessions essentially grant a perpetual right (with the exception of the Salar de Atacama rights, which have been leased to us until 2030) to conduct mining operations in the areas covered by such concessions, provided that annual concession fees are paid. Exploration concessions permit us to explore for mineral resources on the land covered thereby for a specified period of time, and to subsequently request a corresponding exploitation concession.
Under Law No. 16,319 that created the CCHEN,Chilean Nuclear Energy Commission (Comisión Chilena de Energía Nuclear), or “CCHEN”, we have an obligation to the CCHEN regarding the exploitation and sale of lithium from the Salar de Atacama, which prohibits the use of lithium for nuclear fusion. In addition, CCHEN has imposed quotas that limit the total tonnage of lithium authorized to be sold.sold, along with other conditions.
We also hold water use rights granted by the respective administrative authorities and which enable us to have a supply of water from rivers or wells near our production facilities sufficient to meet our current operating requirements. See “Item 3.D. Risk Factors—Risks Relating to Chile—Changes to the Chilean Constitution could impact a wide range of rights, including mining rights, water rights and property rights generally, and could affect our business, results of operations and financial condition.” and “—Changes in water rights laws and other regulations could affect our operating costs.” The Chilean Constitution, the Water Code and related regulations are subject to change, which could have a material adverse impact on our business, financial condition and results of operations.
| 45 |
We operate port facilities at Tocopilla, Chile for the shipment of products and the delivery of raw materials in conformity with maritime concessions, which have been granted by the respective administrative authority. These concessions are normally renewable on application, provided that such facilities are used as authorized and annual concession fees are paid.
In 2005, Law No. 20,026, known as the Law to Establish a Specific Tax on Mining Activity” (Ley que Establece un Impuesto Específico a la Actividad Minera or the “Royalty Law”), established a royalty tax to be applied to mining activities developed in Chile. In 2010, modifications were made to the law and taxes were increased.
In 2012, new modifications to the tax laws were enacted to set the corporate tax rate at 20% for companies like SQM.
On September 29, 2014, Law No. 20,780the Tax Reform was published, (the “Tax Reform”), introducing significant changes to the Chilean taxationtax system and strengthening the powers of the SIIChilean Internal Revenue Service to control and prevent tax avoidance. Subsequently,evasion. Then, on February 8, 2016, Law No. 20,899 that simplifieswas published which “Simplifies the income tax systemIncome Tax System and modifies other legal tax provisionsPerfects Other Legal Tax Provisions”. Subsequently, on February 24, 2020, Law No.21,210 was published.published, which “Modernizes the Tax Legislation”. As a result of these reforms, open stock corporations, likesuch as SQM, are subject to the partially integrated shareholder tax regime (sistema parcialmente integrado).general rules. The corporate tax rate applicablethat applies to us increased gradually from 20% to 25.5% in 2017, and to the maximum rate of 27% in 2018.
The Tax Reform tax increase prompted a US$52.3 million increase in our deferred tax liabilities as of December 31, 2014. In accordance with IAS 12, the effects generated by the change in the income tax rate approved by the Tax Reform on income and deferred taxes were applied to the income statement. For purposes of the Company’s statutory consolidated financial statements filed with the CMF, in accordance with the instructions issued by the CMF in its circular 856 of October 17, 2014, the effects generated by the change in the income tax rate were accounted for as retained earnings. The amount charged to equity as of December 31, 2014 was US$52.3 million, thereby giving rise to a difference of US$52.3 million in profit for the year and income tax expense as presented in the Company’s 2014 audited consolidated financial statements in its annual report on Form 20-F compared with profit and income tax expense as presented in the Company’s 2014 statutory consolidated financial statements filed with the CMF.
The Chilean government may again decide to levy additional taxes on mining companies or other corporations in Chile, and such taxes could have a material adverse impact on our business, financial condition and results of operations.
We are also subject to the Chilean Labor Code and the Subcontracting Law, which are overseen by the Labor Authority (Dirección del Trabajo), the National Geology and Mining Service (Servicio Nacional de Geología y Minería or “Sernageomin”), and the National Health Service. Recent changes to these laws and their application may have a material adverse effect on our business, financial condition and results of operations. See “Item 3.D. Risk Factors—Risks Relating to Our Business—We are exposed to labor strikes and labor liabilities that could impact our production levels and costs.”
In addition, we are subject to Law No. 20,393, which establishes criminal liability for legal entities, for the crimes of (a) asset laundering, (b) financing terrorism and (c) bribery. Potential sanctions for violations under this law could include (i) fines, (ii) loss of certain governmental benefits during a given period, (iii) a temporary or permanent bar against the corporation executing contracts with governmental entities, and (iv) dissolution of corporation.
Finally, weWe are governed bysubject to the Securities Law and Law No. 18,046 on Corporations (Ley de Sociedades Anónimas or the “Chilean Corporations Act”), which regulates corporate governance.governance of public companies. Specifically, the Chilean Corporations Act regulates, among other things, independent director requirements, disclosure obligations to the general public and to the CMF, as well as regulations relating to the use of inside information, the independence of external auditors, and procedures for the analysis of transactions with related parties. See “Item 6.C. Board Practices” and “Item 7.B. Related Party Transactions.”
On March 2, 2021, the congress approved a bill to strengthen the financial market in Chile, which includes the following provisions: (a) Amends Law 18,045 (Securities Market Law), mainly in the following matters: (i) a prohibition was established for directors, managers, administrators and principal executives of an issuer of publicly offered securities, as well as their relatives, to carry out transactions on securities issued by the issuer, within thirty days prior to the disclosure of the latter's quarterly or annual financial statements; (ii) regulates the interconnection of stock exchanges; (iii) increased the penalties of article 59 and modified, expanded and added criminalized conducts; (iv) established that the information provided to investors or the general public containing recommendations to acquire, maintain or dispose of publicly offered securities, or that implies the definition of target prices, must comply with the requirements established by the CMF; (b) Amends Law 18. 046 (Corporations Law), mainly in the following matters: (i) it adds, as a presumption of guilt of directors, the approval of related party transactions in contravention of the applicable rules; (ii) it modifies rules applicable to independent directors and the directors' committee; and (iii) it modifies the rules for approval of related party transactions for open corporations; (c) Regulates in detail the provision of investment advisory services, which will be subject to the supervision of the CMF and those who habitually provide investment advisory services must be previously registered in the Register maintained for this purpose by the CMF and may only provide services while they are registered in it. This regulation will become effective ninety days after the CMF issues the general rule. Such regulation shall be issued within twelve months after the publication of this law; (d) It amends DL 3500 (Pension System), mainly regarding changes to the regulation of pension advisory services. This regulation will become effective on the first business day of the third month following the publication of this law; (e) Amends DFL 251 (Insurance Companies, Corporations and Stock Exchanges) and creates the consultation system; (f) Amends Law 19,913 (Financial Analysis Unit), especially in procedural matters; (g) Amends DL 3,538 (CMF), mainly in the following matters: (i) penalties for audited persons are increased, from a ceiling of UF 15,000 to UF 100,000, in both cases, with the possibility of increasing it five times in case of recidivism; and (ii) the figure of the "Anonymous Whistleblower" is created for collaboration with investigations; (h) Amends the Commercial Code, mainly in insurance matters; (i) Amends Law 18,010 (Money Lending Operations), mainly in the following matters: (i) establishes that default interest may not be applied jointly or additionally, on the same amount, with any other interest and its capitalization is prohibited; and (ii) establishes that the entities supervised by the CMF, including massive fund placement entities, may charge commissions with respect to money credit operations to the extent that such commissions comply with the requirements, rules and conditions established by the CMF through General Rule and, in any case, to the extent that they correspond to consideration for real and effectively rendered services. Commissions that do not comply with the requirements shall be considered interest. In addition, the regulations shall establish objective criteria for the determination of commissions, which must be calculated based on the cost of rendering the service. The general rule to be issued by the CMF shall be issued within twelve months following the publication of this law, without prejudice to the date determined therein for its entry into force. Please note that this bill to strengthen the financial market in chile was approved by the Congress, but it has not been yet enacted nor published in the Official Gazette.
There are currently no material legal or administrative proceedings pending against us except as discussed under “Item 8.A.7 Legal Proceedings”, in Note 22.122 to our Consolidated Financial Statements and below under “Safety, Health and Environmental Regulations in Chile.”
Safety, Health and Environmental Regulations in Chile
Our operations in Chile are subject to both national and local regulations related to safety, health and environmental protection. In Chile, the main regulations on these matters that are applicable to us are the Mine Health and Safety Act of 1989 (Reglamento de Seguridad Minera or the “Mine Health and Safety Act”), the Health Code (Código Sanitario), the Health and Basic Conditions Act of 1999 (Reglamento sobre Condiciones Sanitarias y Ambientales Básicas en los Lugares de Trabajoor the “Health and Basic Conditions Act”), the Subcontracting Law, and the Environmental Law of 1994, amended in 2010 (Ley sobre Bases Generales del Medio Ambiente or the “Environmental Law”) and Law No.16744 of the Labor Code relating to workplace accidents and occupational diseases (“Law No. 16744”).
Health and safety at work are fundamental aspects in the management of mining operations, which is why we have made constant efforts to maintain good health and safety conditions for the people working at our mining sites and facilities. In addition to the role played by us in this important matter, the Chilean government has a regulatory role, enacting and enforcing regulations in order to protect and ensure the health and safety of workers. The Chilean government, acting through the Ministry of Labor and Social Security, Ministry of Health, and the Sernageomin, performs health and safety inspections at the mining sites and oversees mining projects, among other tasks, and it has exclusive powers to enforce standards related to environmental conditions and the health and safety of the people performing activities related to mining.
The regulations set in Law No. 16744 and the Mine Health and Safety Act protectsprotect workers and nearby communities againstfrom health and safety hazards,hazards. The Health and it provides for enforcement of the law where compliance has not been achieved. OurBasic Conditions Act along with our Internal Mining Standards (Reglamentos Internos Mineros) establish our obligationguidelines to maintain a workplace where safety and health risks are managed appropriately. We are subject to the general provisions of the Health and Basic Conditions Act, our own internal standards and the provisions of the Mine Health and Safety Act. In the event of non-compliance, the Ministry of Health and particularly the Sernageominrelevant regulatory bodies are entitled to use their enforcement powers to ensure compliance with the law.
In November 2011, the Ministry of Mining enacted Law No. 20,551 that Regulates the Closure of Mining Sites and Facilities (Ley que Regula el Cierre de Faenas e Instalaciones Mineras). This statute entered in force in November 2012 and required all mining sites to present or update their closure plans as of November 2014. SQM has fulfilled this requirement for all of its mining sites and facilities. The main requirements of the law are related to disclosures to the Sernageomin regarding decommissioning plans for each mining site and its facilities, along with the estimated cost to implement such plans. The mining site closure plans are approved by Sernageomin and the corresponding financial assurances are subject to approval by the CMF. In both cases, SQM has received the requisite approvals. During 2020, any required closure plans were updated and presented to Sernageomin in accordance with required deadlines.
The new and modified Chilean Environmental Law defines the Ministry of the Environment as the governmental agency responsible for coordinating and supervising environmental issues. The Environmental Assessment Service is responsible for reviewing environmental assessments of new projects or significant modifications of existing ones, and the decision to grant or reject environmental permits rests with the Environmental Assessment Commission. On the other hand, the Superintendence for the Environment is responsible for supervising environmental performance during the construction, operation and closure of the projects that have been evaluated for environmental permits, and it is also responsible for enforcing compliance with prevention and atmospheric decontamination plans. The Environmental Law also promotes citizen participation in project evaluation and implementation, providing more opportunities for observations or objections to be made during the environmental evaluation process. Annually, the Superintendence for the Environment audits a sample of approved projects to verify compliance with the environmental permits, and it may pursue fines or sanctions if applicable, which can be challenged in the Environmental Court.
We continuously monitor the impact of our operations on the environment and on the health of our employees and other persons who may be affected by such operations. We have made modifications to our facilities in an effort to eliminate any adverse impacts. Also, over time, new environmental standards and regulations have been enacted, which have required minor adjustments or modifications of our operations. We anticipate that additional laws and regulations will be enacted over time with respect to environmental matters. There can be no assurance that future legislative or regulatory developments will not impose new restrictions on our operations. We are committed to continuously improving our environmental performance through our Environmental Management System (“EMS”),. We strive to be leaders in sustainability at a national and international level. In 2020, we began the ISO 14.001 certification process for our operations in the Salar de Atacama and Salar del Carmen. This certification is being overseen by TÜV-Rheinland. We participate in voluntary evaluations with companies such as Ecovadis and seek international certifications such as the Responsible Conduct certification from the Chilean Industrial Chemicals Association, which applies to our operations at Nueva Victoria, and the Protect&Sustain & Sustain certification from the International Fertilizer Association, which applies to our operations at Coya Sur, the Salar de Atacama, Tocopilla, Antofagasta and Santiago. In September 2020, in the Salar de Atacama, we began a self-assessment process, which is the first step in IRMA’s rigorous responsible mining certification process.
| 47 |
We have submitted and will continue to submit several environmental impact assessment studies related to our projects to the governmental authorities. We require the authorization of these submissions in order to maintain and to increase our production capacity.
International Regulations
We are subject to complex regulatory requirements in the various jurisdictions in which we operate, including the following:following implemented during 2020:
At the end of 2018, theThe European Parliament, the Council of Member States of theUnion’s European Union and the European Commission agreed to a new regulation for fertilizers. The new European regulation reduces the maximum content limit of perchlorates in inorganic fertilizer with macronutrients, such as the potassium nitrate sold by us, to 0.005%. In addition to this limit, the regulation incorporates maximum levels of other pollutants, such as heavy metals, and establishes a new procedure – called a conformity assessment – to be undertaken prior to the commercialization of fertilizers in Europe. The fertilizers that we sell contain less than 0.005% of perchlorate; however, the Food Chain Security unit of the General Health and Consumer Affairs CouncilSafety Authority initiated a revision of the perchlorate limits in food that have been in force and effect since June 2015, following2015. On May 20, 2020, the European Food Safety Authority’s (“EFSA”) evaluation of human exposure toCommission adopted Regulation (EU) 2020/685 which sets out limits for perchlorate in foodcertain foods. Regulation (EU) 2020/685 did not alter the previously established limit of 50 parts-per-million for perchlorate in fertilizer (as set forth in Regulation (EU) 2019/1102), and thus will allow our fertilizer products to be sold in drinkable water. We expect a new definitionthe European Union without issue.
In addition, Regulation (EU) 2017/542 came into force in the European Union, pursuant to which SQM notified the European Union’s Poison Notification Centre (PCN) of the new limits of perchlorates in food in the near term.
Under the requirements of Regulation (EC) No. 1907/2006, the records ofclassification and labelling information for 83 mixtures from our specialty plant nutrition and potassium nitrate and sodium nitrate were updated according to the latest format IUCLID. In turn, during the year 2018, ten new registrations were made corresponding to the substancesbusiness lines sold by our three European subsidiaries.
On March 12, 2019, Australia approved the new subsidiary SQM International. The strategyIndustrial Chemicals (General) Rules 2019, which regulates the import and production of industrial chemicals and replaces the current regulations. This new regulation which entered into force on July 1, 2020, establishes the import requirements for chemical substances for the implementationproduct and the importer. It applies to iodine imports by SQM Oceania in Australia. The SQM Oceania registry for the importation of iodine was updated under “Industrial Chemicals (General) Rules 2019”, in June 2020 and before the deadline of July 1, 2020.
On May 25, 2019, Japan updated its standards for classification and labeling of chemical products (JIS Z 7252: 2019 and 7253: 2019) to certify them with the sixth version of the requirementsUN-GHS. This update has a transition period of three years and will require review of safety data sheets and labeling of the Article 45products that SQM sells in Japan, in 2020-2021. The process of Regulation (EC) No. 1272/2008 was defined,reviewing Safety Data Sheets and labeling of the products that SQM markets in Japan began, under the JIS Z 7252: 2019 & 7253: 2019 standards, which has a deadline until May 2022. The safety sheets were updated in February 2021 and the Toxicological Information Centers mustlabels will be informed about the composition of hazardous mixtures priorupdated to their commercialization. For this implementation, an internal numerical code was developed for the identification of all the fertilizer mixtures sold by SQM Europe and SQM Iberian.December 2021.
In August 2017, United States Environmental Protection Agency (“US-EPA”) published the Inventory Notification (Active-Inactive) Requirements regulation under the Toxic Substances Control Act which established that as of February 7, 2018, SQM North America Corp. must provide information with respect to all chemical substances imported into the United States during 2006-2016. In January 2018, this notification was made, and all substances sold are listed as active, which has been reported to customers who have requested it. In the United States, SQM North America re-certified before the Organic Materials Review Institute all products sold by it2020 in this market.
In South Korea, SQM registered sodium nitratewe began the registration process for three products under the K-REACH standard,regulations, using an Exclusive Representative in order to facilitate the regulatory compliance of our customers in this market. AtAdditionally, with the endestablishment of December 2018, an amendmentSQM’s commercial office in Seoul, South Korea in 2020, the Korean Chemical Management Association (KCMA) was notified of all products to be imported from our lithium and iodine business lines. In 2021, we will begin the K-REACH regulation was passed, pursuant to whichprocess of providing the respective competent authorities, including the Korean Ministry of Labor and Employment, with safety data sheets for all chemical substances are subject to registration. SQM is evaluating the regulatory change, which applies to four SQM products currently sold in South Korea establishingunder the necessary alliances to facilitate compliance with this new requirement, which considers as a first stage a pre-notification in June 2019.K-OSHA regulations.
On August 8, 2018, Normative Instruction No. 39 became effectiveIn 2020 in Brazil, establishing definitions, requirements, specifications, guarantees, product registrations, authorizations, packaging, fertilizer product labels, mineral fertilizer tolerances, among others, repealing Normative Instruction No. 46China, we completed the standardization of 2016the registration of all of our lithium, iodine and defining new requirements for exports to Brazil.nitrate products.
During 2018, the Ecuadorian Agricultural Quality Assurance Agency (AGROCALIDAD) made two modifications (resolutions 031 of March 2018 and 0218 of December 2018) to the general regulations for the registration and control of fertilizers. As a result of both modifications,the occurrence of Brexit in 2020, the chemical regulations set forth in EU REACH (Registration, Evaluation, Authorisation and restriction of Chemicals) were brought into United Kingdom law on January 1, 2021 and entitled UK REACH. SQM Ecuador hadwill be required to adapt its fertilizercomplete a second registration process for products sold in the United Kingdom. We are currently preparing the relevant survey and labeling processes.expect to complete the pre-registration process in 2021.
The openingIn compliance with the Technical Regulation of SQM Colombia during 2018 opened a new challenge for the processingEurasian Economic Union on Safety of newChemical Products (TR EAEU 041/2017), also known as Eurasia REACH (Eurasia’s equivalent to EU REACH), in 2020 we reported all direct agricultural and industrial products, and also fertilizer registrations. Currently, eight products are registered and work is being done on the definitionmixtures, of all of our business lines sold in the newEurasian Economic Union, which includes Russia. With this reporting, we are not required to register under TR EAEU 041/2017.
In December 2020, we completed the pre-registration of all of our products sold in Turkey in compliance with the deadline under Turkey’s “KKDIK” (Turkey’s equivalent to be registered.EU REACH).
In October 2020, we provided an updated notification of all of our products sold in the United States under the TSCA-CDR regulations before the United States Environmental Protection Agency.
On October 9, 2018, NOM-018-STPS-2015 onNovember 27, 2020, Chilean Customs issued exempt resolution No. 3421, pursuant to which Chile’s lithium export control procedures have been modified to include the Harmonized System for the identificationexport of lithium carnalite, lithium sulfate and communication of hazards and risks by hazardous chemical substances in the workplace came into effect in Mexico. SQM Mexico has implemented this regulation in all its productive tasks, in the Safety Data Sheets and in the labeling of applicable products.lithium phosphate.
Research and Development, Patents and Licenses
See “Item 5.C. Research and Development, Patents and Licenses.”
| 49 |
4.C. Organizational Structure
All of our principal operating subsidiaries are essentially wholly-owned,wholly owned, except for SQMC, which is approximately 61% owned by us and whose shares are listed and traded on the Santiago Stock Exchange, and Ajay SQM Chile S.A., which is 51% owned by us. The following is a summary of our main subsidiaries as of December 31, 2018. For a list of all our consolidated subsidiaries, see Note 2.5 to our Consolidated Financial Statements.2020.
| Principal subsidiaries | Activity | Country of Incorporation | SQM Beneficial Ownership Interest (Direct/Indirect) | |||||
| SQM Nitrates S.A. | Extracts and sells caliche ore to subsidiaries and affiliates of SQM | Chile | 100 | % | ||||
| SQM Industrial S.A. | Produces and markets SQM’s products directly and through other subsidiaries and affiliates of SQM | Chile | 100 | % | ||||
| SQM Salar S.A. | Exploits the Salar de Atacama to produce and market SQM’s products directly and through other subsidiaries and affiliates of SQM | Chile | 100 | % | ||||
| SQM Potasios S.A. | Produces and markets SQM’s products directly and through other subsidiaries and affiliates of SQM | Chile | 100 | % | ||||
| Servicios Integrates de Transitos y Transferencias S.A. (SIT) | Owns and operates a rail transport system and also owns and operates the Tocopilla port facilities | Chile | 100 | % | ||||
| Orcoma Estudios SPA | Holds permits and studies of the Orcoma Project | Chile | 100 | % | ||||
| Orcoma SPA | Holds environmental permits and mining tenement of the Orcoma Project | Chile | 100 | % | ||||
| Sociedad Contractual Minera Bufalo | Mining exploration | Chile | 100 | % | ||||
| RS Agro Chemical Trading Corporation A.V.V. | A finance vehicle | Aruba | 100 | % | ||||
| Soquimich Comercial S.A. | Markets SQM’s specialty plant nutrition products domestically and imports fertilizers for resale in Chile | Chile | 61 | % | ||||
| Ajay-SQM Chile S.A. | Produces and markets SQM’s iodine and iodine derivatives | Chile | 51 | % | ||||
| Sales and distribution subsidiaries in the United States, Argentina, Belgium, Brazil, China, Colombia, Ecuador, Mexico, Peru, South Africa, Spain, and other locations. | Market SQM’s products throughout the world | Various | ||||||
| 50 |
For a list of all our consolidated subsidiaries, see Note 8 to our Consolidated Financial Statements.
4.D. Property, Plant and Equipment
We carry out our operations through the use of mining rights, production facilities and transportation and storage facilities. Discussion of our mining rights is organized below according to the geographic location of our mining operations. Our caliche ore mining interests are located throughout the valley of the Tarapacá and Antofagasta regions of northern Chile (in a part of the country known as “el Norte Grande”). From caliche ore, we produce products based on nitrates and iodine, and caliche also contains concentrations of potassium. Our mining interests in the brine deposits of the Salar de Atacama are found within the Atacama Desert, in the eastern region of el Norte Grande. From these brines we primarily produce products based on potassium, sulfate, lithium and boron.lithium.
The map below shows the location of our principal mining operations and the exploitation and exploration mining concessions that have been granted to us, as well as the mining properties that we lease from Corfo:
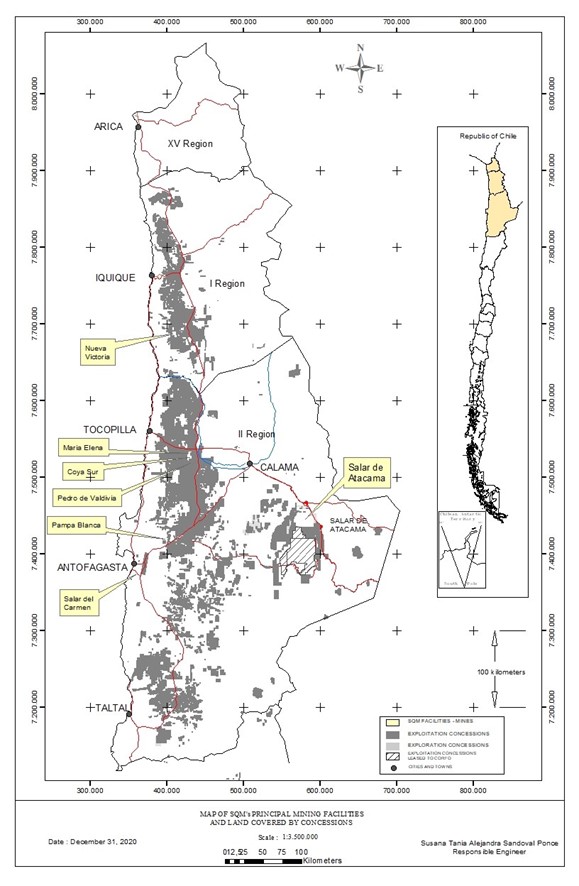
| 52 |
Mining Concessions
Mining Concessions for the Exploration and Exploitation of Caliche Ore Mining Resources
We hold our mining rights pursuant to mining concessions for exploration and exploitation of mining resources that have been granted pursuant to applicable law in Chile:
| (1) | “Mining Exploitation Concessions”: entitle us to use the land in order to exploit the mineral resources contained therein on a perpetual basis, subject to annual payments to the Chilean government; and |
| (2) | “Mining Exploration Concessions”: entitle us to use the land in order to explore for and verify the existence of mineral resources for a period of two years, at the expiration of which the concession may be extended one time only for two additional years, if the area covered by the concession is reduced by half. We may alternatively request an exploitation concession in respect of the area covered by the original exploration concession, which must be made within the timeframe established by the original exploration concession. |
A Mining Exploration Concession is generally obtained for purposes of evaluating the mineral resources in a defined area. If the holder of the Mining Exploration Concession determines that the area does not contain commercially exploitable mineral resources, the Mining Exploration Concession is usually allowed to lapse. An application also can be made for a Mining Exploitation Concession without first having obtained a Mining Exploration Concession for the area involved.
As of December 31, 2018,2020, the surface area covered by Mining Exploitation Concessions that have been granted in relation to the caliche resources of our mining sites is approximately 573,599558,562 hectares. In addition, as of December 31, 2018,2020, the surface area covered by Mining Exploration Concessions in relation to the caliche resources of our mining sites is approximately 1,700400 hectares. We have not requested additional mining rights.
Mining Concessions for the Exploitation of Brines at the Salar de Atacama
As of December 31, 2018,2020, our subsidiary SQM Salar held exclusive rights to exploit the mineral resources in an area covering approximately 140,000 hectares of land in the Salar de Atacama in northern Chile, of which SQM Salar is only entitled to exploit the mineral resources in 81,920 hectares. These rights are owned by Corfo and leased to SQM Salar pursuant to the Lease Agreement. Corfo cannot unilaterally amend the Lease Agreement, and the rights to exploit the resources cannot be transferred. The Lease Agreement establishes thatprovides for SQM Salar is responsible for makingto (i) make quarterly lease payments to Corfo accordingbased on product sales from leased mining properties and annual contributions to specified percentagesresearch and development, to local communities, to the Antofagasta Regional Government and to the municipalities of the value of production of minerals extracted from the SalarSan Pedro de Atacama, brines, maintainingMaría Elena and Antofagasta, (ii) maintain Corfo’s rights over the Mining Exploitation Concessions and making(iii) make annual payments to the Chilean government for such concession rights. The Lease Agreement was entered into in 1993 and expires on December 31, 2030.
Under the terms of the Project Agreement, Corfo has agreed that it will not permit any other person to explore, exploit or mine any mineral resources in the approximately 140,000 hectares area of the Salar de Atacama mentioned above. The Project Agreement expires on December 31, 2030.
SQM Salar holds an additional 236,842239,942 hectares of constituted Mining Exploitation Concessions in areas near the Salar de Atacama, which correspond to mining reserves that have not been exploited. SQM Salar also holds Mining Exploitation Concessions that are in the process of being granted covering 3,9001,430 hectares in areas near the Salar de Atacama.
In addition, as of December 31, 2018,2020, SQM Salar held Mining Exploration Concessions covering approximately 22,1008,200 hectares and had applied for additional Mining Exploration Concessions of approximately 2,6008,700 hectares. Exploration rights are valid for a period of two years, after which we can (i) request a Mining Exploitation Concession for the land, (ii) request an extension of the Mining Exploration Concession for an additional two years (the extension only applies to a reduced surface area equal to 50% of the initial area) or (iii) allow the concession to expire.
According to the terms of the Lease Agreement, with respect to lithium production, the CCHEN established a total accumulated extraction limit set as amended by the Corfo Arbitration Agreement in January 2018, up to 349,553 metric tons of lithium metallic equivalent (1,860,670 tons of lithium carbonate equivalent), which is in addition to the approximately 64,816 metric tons of lithium metallic equivalent (345,015 tons of lithium carbonate equivalent) remaining from the originally authorized amount in the aggregate for all periods while the Lease Agreement is in force. As of December 31, 2018,2020, only 1210 years remain on the term of the Lease Agreement. See “Item 3.D. Risk Factors” and “Item 8.A.7 Legal Proceedings.”
Concessions Generally
As of December 31, 2018,2020, approximately 97%98% of SQM’s mining interests were held pursuant to Mining Exploitation Concessions and 3%1% pursuant to Mining Exploration Concessions. Of the Mining Exploitation Concessions, approximately 97% already have been granted pursuant to applicable Chilean law, and approximately 3% are in the process of being granted. Of the Mining Exploration Concessions, approximately 87%8|% already have been granted pursuant to applicable Chilean law, and approximately 13%19% are in the process of being granted.
In 2018,2020, we made payments of US$8.26.5 million to the Chilean government for Mining Exploration and Exploitation Concessions, including the concessions we lease from Corfo. These payments do not include the payments we made directly to Corfo pursuant to the Lease Agreement, according to the percentages of the sales price of products produced using brines from the Salar de Atacama.
The following table shows the Mining Exploitation and Exploration Concessions held by SQM, including the mining properties we lease from Corfo, as of December 31, 2018:2020:
| Exploitation Concessions | Exploration Concessions | Total | Exploitation Concessions | Exploration Concessions | Total | |||||||||||||||||||||||||||||||||||||||||||
| Region of Chile | Total Number | Hectares | Total Number | Hectares | Total Number | Hectares | Total Number | Hectares | Total Number | Hectares | Total Number | Hectares | ||||||||||||||||||||||||||||||||||||
| Region I | 2,803 | 525,946 | 47 | 16,200 | 2,850 | 542,146 | 2,863 | 539,131 | 5 | 1,000 | 2,868 | 540,131 | ||||||||||||||||||||||||||||||||||||
| Region II | 8,807 | 2,320,527 | 125 | 53,100 | 8,932 | 2,373,627 | 8,864 | 2,322,904 | 133 | 46,800 | 8,997 | 2,369,704 | ||||||||||||||||||||||||||||||||||||
| Region III and others | 441 | 99,885 | 40 | 11,400 | 481 | 111,285 | 477 | 107,988 | 2 | 400 | 479 | 108,388 | ||||||||||||||||||||||||||||||||||||
| Total | 12,051 | 2,946,358 | 212 | 80,700 | 12,363 | 3,027,058 | 12,204 | 2,970,023 | 140 | 48,200 | 12,344 | 3,018,223 | ||||||||||||||||||||||||||||||||||||
The majority of the Mining Exploitation Concessions held by SQM were requested primarily for non-metallic mining purposes. However, a small percentage of our Mining Exploration Concessions were requested for metallic mining purposes. The annual payment to the Chilean government for this group of concessions is higher.
Geological studies over mining properties that were requested primarily for non-metallic mining purposes may show that the concession area is of interest for metallic mining purposes, in which case we must inform the Sernageomin, indicating that the type of substance contained by such Mining Concessions has changed, for purposes of the annual payment for these rights.
Caliche: Facilities and Reserves
Caliche: Facilities
During 2018, caliche ore2020, our mining operations were focusedconcentrated in the first region of Chile, and our Nueva Victoria mine was exploited at two sites:First Region where we mainly worked in the mining sector Tente en el Aire and Oeste.in the mining sectors Nueva Victoria Norte. In November 2015, the mining and nitrate operations at Pedro de Valdivia were suspended, and iodine production was reduced at the Pedro de Valdivia site, in order to take advantage of the highly efficient production facilities at Nueva Victoria. Operations at the Pampa Blanca site were suspended in 2010, and heap leaching operations at the María Elena site were suspended in October 2013, although iodine processing continued until 2017.
Nueva Victoria
| Nueva Victoria |
The Nueva Victoria mine and facilities are located 140 kilometers southeast of Iquique and are accessible by highway. Since 2007, the Nueva Victoria mine includes the mining properties Soronal, Mapocho and Iris. At this site, we use caliche to produce salts rich in nitrates and iodine, through heap leaching and the use of solar evaporation ponds. The main production facilities at this site include the operation centers for the heap leaching process, the iodide and iodine plants at Nueva Victoria and Iris and the evaporation ponds at the Sur Viejo sector of the site. The areas currently being mined are located approximately 425 kilometers northeast of Nueva Victoria. Solar energy and electricity are the primary sources of power for this operation.
Pampa Blanca
| Pampa Blanca |
The mining facilities at Pampa Blanca, which is located 100 kilometers northeast of Antofagasta, have been suspended since March 2010. At this site, we used caliche to produce nitrates and iodine through heap leaching and the use of solar evaporation ponds. The main production facilities at this site included the operation centers for the heap leaching system and the iodide plant. Electricity was the primary source of power for this operation.
Pedro de Valdivia
| Pedro de Valdivia |
The Pedro de Valdivia mine and facilities are located 170 kilometers northeast of Antofagasta and are accessible by highway. At this site, we used caliche to produce nitrates and iodine through vat leaching and solar evaporation ponds. The main production facilities at this site include the crushing, vat leaching, fines processing, nitrate crystallization plant, and iodide and iodine plants. In November 2015, the mining and nitrate operations at Pedro de Valdivia were suspended, and iodine production was reduced. Electricity, natural gas and fuel oil are the primary sources of power for this operation.
María Elena
| María Elena |
The María Elena mine and facilities, named El Toco, are located 220 kilometers northeast of Antofagasta and are accessible by highway. Until February 2010, caliche was used at this facility to produce nitrates and iodine through vat leaching. Subsequently, these facilities were equipped to produce nitrates and iodine through the use of heap leaching and solar evaporation ponds. Heap leaching operations at this site were suspended in October 2013. During 2017, we continued to produce solutions rich in iodine and nitrates by leaching the mine tailings. which were treated at the iodide plant at María Elena, and subsequently the prilled iodine is produced at Pedro de Valdivia. This process was discontinued at the end of 2017.
Caliche: Reserves
Our in-house staff of geologists and mining engineers prepares our estimates of caliche ore reserves. The Proven and Probable Reserve figures presented below are estimates and may be subject to modifications due to natural factors that affect the distribution of mineral grades, which would, in turn, modify the recovery of nitrate and iodine. Therefore, no assurance can be given that the indicated levels of recovery of nitrates and iodine will be realized.
We estimate ore reserves based on evaluations, performed by engineers and geologists, of assay values derived from sampling of drill-holes and other openings. Drill-holes have been made at different space intervals in order to recognize mining resources. Normally, we start with 400x400 meters and then we reduce spacing to 200x200 meters, 100x100 meters and 50x50 meters. The geological occurrence of caliche ore is unique and different from other metallic and non-metallic minerals. Caliche ore is found in large horizontal layers at depths ranging from one to four meters and has an overburden between zero and two meters. This horizontal layering is a natural geological condition and allows the Company to estimate the continuity of the caliche bed based on surface geological reconnaissance and analysis of samples and trenches. Mineral resources can be calculated using the information from the drill-hole sampling.
A Mineral Resource is a concentration or occurrence of natural, solid, inorganic or fossilized organic material in or on the Earth’s crust in such form or quantity and of such grade or quality that it has reasonable prospects for economic extraction. The location, quantity, grade, geological characteristics and continuity of a mineral resource are known, estimated or interpreted from specific geological, metallurgical and technological evidence.
A Measured Resource is the part of a Mineral Resource for which tonnage, densities, shape, physical characteristics, grade and mineral content can be estimated with a high level of confidence. The estimate is based on detailed exploration, sampling and testing information gathered through appropriate sampling techniques from locations such as outcrops, trenches, and exploratory drill holes.
An Indicated Mineral Resource is the part of a Mineral Resource for which tonnage, densities, shape, physical characteristics, grade and mineral content can be estimated with a reasonable level of confidence. The estimate is based on detailed exploration, sampling and testing information gathered through appropriate sampling techniques from locations such as outcrops, trenches and exploratory drill holes.
According to our experience in caliche ore, the grid pattern drill-holes with spacing equal to or less than 100 meters produce data on the caliche resources that is sufficiently defined to consider them Measured Resources and then, adjusting for technical, economic and legal aspects, as Proven Reserves. These reserves are obtained using the Kriging Method and the application of operating parameters to obtain economically profitable reserves.
Similarly, the information obtained from detailed geologic work and samples taken from grid pattern drill-holes with spacing equal to or less than 200 meters can be used to determine Indicated Resources. By adjusting such Indicated Resources to account for technical, economic and legal factors, it is possible to calculate Probable Reserves. Probable Reserves are calculated by using a polygon-based methodology and have an uncertainty or margin of error greater than that of Proven Reserves. However, the degree of certainty of Probable Reserves is high enough to assume continuity between points of observation.
Proven Reserves are the economically mineable part of a Measured Resource. The calculation of the reserves includes the application of mining parameters including maximum overburden, minimum thickness of caliche ore, stripping ratio, cutoff grade and application of dilution factors to the grade values. Appropriate assessments, including pre-feasibility studies or feasibility studies, have been carried out and include consideration of metallurgical, economic, marketing, legal, environmental, social and governmental factors. These assessments demonstrate at the time of reporting that extraction is reasonably justified.
Probable Reserves are the economically mineable part of an Indicated Resource and in some cases a Measured Resource. The calculation of the reserves includes the application of mining parameters including maximum overburden, minimum thickness of caliche ore, stripping ratio, cutoff grade and application of dilution factors to the grade values. Appropriate assessments, including pre-feasibility studies, have been carried out or are in process and include consideration of metallurgical, economic, marketing, legal, environmental, social and governmental factors. These assessments demonstrate at the time of reporting that extraction is reasonably justified.
The estimates of Proven Reserves of caliche ore at each of our mines as of December 31, 20182020 are set forth below. The Company holds 100% of the concession rights for each of these mines.
| Mine | Proven Reserves (1) (millions of metric tons) | Nitrate Average Grade (percentage by weight) | Iodine Average Grade (parts per million) | Cutoff Grade Average for Mine (2) | Proven Reserves (1) (millions of metric | Nitrate Average (percentage by | Iodine Average (parts per million) | Cutoff Grade Average for Mine (2) | ||||||||||||||||||||
| Pedro de Valdivia | 109.0 | 7.1 | % | 377 | Nitrate 6.0 % | 91.9 | 6.9 | % | 424 | Nitrate 6.0 % | ||||||||||||||||||
| María Elena | 83.3 | 7.2 | % | 436 | Iodine 300 ppm | 83.3 | 7.2 | % | 436 | Iodine 300 ppm | ||||||||||||||||||
| Pampa Blanca | 54.7 | 5.7 | % | 538 | Iodine 300 ppm | 54.7 | 5.7 | % | 538 | Iodine 300 ppm | ||||||||||||||||||
| Nueva Victoria | 280.6 | 6.4 | % | 423 | Iodine 300 ppm | 279.6 | 5.6 | % | 439 | Iodine 300 ppm | ||||||||||||||||||
In addition, the estimates of our Probable Reserves of caliche ore at each of our principal mines as of December 31, 2018,2020, are as follows:
| Mine | Probable Reserves (3) (millions of metric tons) | Nitrate Average Grade (percentage by weight) | Iodine Average Grade (parts per million) | Cutoff Grade (2) | Probable (millions of | Nitrate Average Grade (percentage by weight) | Iodine Average (parts per million) | Cutoff Grade (2) | ||||||||||||||||||||
| Pedro de Valdivia | 334.7 | 7.3 | % | 421 | Nitrate 6.0 % | 240.9 | 6.2 | % | 414 | Nitrate 6.0 % | ||||||||||||||||||
| María Elena | 148.8 | 7.2 | % | 381 | Iodine 300 ppm | 148.8 | 7.2 | % | 381 | Iodine 300 ppm | ||||||||||||||||||
| Pampa Blanca | 464.6 | 5.7 | % | 540 | Iodine 300 ppm | 535.5 | 5.3 | % | 497 | Iodine 300 ppm | ||||||||||||||||||
| Nueva Victoria | 1,020.7 | 5.3 | % | 421 | Iodine 300 ppm | |||||||||||||||||||||||
| Nueva Victoria (including Pampa Orcoma) | 989.7 | 5.2 | % | 421 | Iodine 300 ppm | |||||||||||||||||||||||
| (1) | The Proven Reserves set forth in the table above are shown before losses related to exploitation and mineral treatment. Proven Reserves are affected by mining exploitation methods, which result in differences between the estimated reserves that are available for exploitation in the mining plan and the recoverable material that is finally transferred to the leaching vats or heaps. The average mining exploitation factor for each of our different mines ranges between 80% and 90%, whereas the average global metallurgical recoveries of processes for nitrate and iodine contained in the recovered material vary between 60% and 70%. |
| (2) | The cutoff grades for the Proven and Probable Reserves vary according to the objectives of each mine. These amounts correspond to the averages of the different areas. |
| (3) | Probable Reserves can be expressed as Proven Reserves using a conversion factor, only for purposes of obtaining a projection to be used for long-term planning purposes. On average, this conversion factor is higher than 60%, depending on geological conditions and caliche ore continuity, which vary from mine to mine (Pedro de Valdivia 60%, María Elena 50%, Pampa Blanca 70% and Nueva Victoria 60%). |
The complete technical supporting documentation for the information set forth in the table above is contained in the report “Methodology, Procedure, and Classification of SQM’s Nitrate and Iodine Resources and Reserves for the Year 2018,” was prepared for each mine by the geologist Vladimir Tejerina and other engineering professionals employed by SQM and validated by Mr. Sergio AlarcónMs. Marta Aguilera and Mr. Orlando Rojas.Marco Lema.
Mr. Sergio AlarcónMs. Marta Aguilera is a geologist with more than 3035 years of experience in the field. HeShe is currently employed by SQM as a Senior Geologist inConsultant for the Mining Production area. Mr. AlarcónMs. Aguilera is a Competent Person (Persona Competente), as that term is defined under Chilean Law No. 20,235, known as the Law that Regulates the Position of Competent Persons and Creates the Qualifying Committee for Competencies in Mining Resources and Reserves (Ley que Regula la Figura de las Personas Competentes y Crea la Comisión Calificadora de Competencias de Recursos y Reservas Mineras or “Competent Person Law”). She is registered under No. 163 in the Public Registry of Competent Persons in Mining Resources and Reserves in accordance with the Competent Person Law and related regulations. She has worked as a geologist with both metallic and non-metallic deposits, with vast experience in the latter.
Mr. Marco Lema is a civil mining engineer with more than 35 years of experience. He works for SQM as Superintendent of Geology and Engineering in the mining production area. Mr. Lema is a Competent Person (Persona Competente), as that term is defined under Chilean Law No. 20,235, known as the Law that Regulates the Position of Competent Persons and Creates the Qualifying Committee for Competencies in Mining Resources and Reserves (Ley que Regula la Figura de las Personas Competentes y Crea la Comisión Calificadora de Competencias de Recursos y Reservas Mineras or “Competent Person Law”). He is registered under No. 164 in the Public Registry of Competent Persons in Mining Resources and Reserves in accordance with the Competent Person Law and related regulations. He has worked as a geologist with bothexperience working on metallic and non-metallic deposits, with vast experience in the latter.mine deposits.
Mr. Orlando Rojas is a civil mining engineer and independent consultant. He is Partner and Chief Executive Officer of the company EMI-Ingenieros y Consultores S.A., whose offices are located at Los Domínicos No 7772, Las Condes, Santiago, Chile. He is a member of the Institute of Mining Engineers and is registered under No. 118 in the Public Registry of Competent Persons in Mining Resources and Reserves in accordance with the Competent Person Law and related regulations. He has worked as a mining engineer for 40 years since graduating from university, including more than 34 years working on estimates for reserves and resources.
Copies of the certificates of qualified competency issued by the Chilean Mining Commission are attached hereto as Exhibits 99.1 and 99.2.
The proven and probable reserves shown above are the result of the evaluation of approximately 23.38%18.5% of the total caliche-related mining property of our Company. However, we have explored more intensely the areas in which we believe there is a higher potential of finding high-grade caliche ore minerals. The remaining 77.62%81.5% of this area has not been explored or has had limited reconnaissance, which is not sufficient to determine the potential and hypothetical resources. In 2018,2020, we did not carry out basic reconnaissance of new mining properties. With respect to detailed explorations, in 2018,2020, we carrieddid not carry out recategorizations of indicated resources in Tente en el Aire sectors, totaling 1,658 hectares, which is still in process.resources. Our 20192021 exploration program includes the exploration of the Tente en el Aire section,sector, which totals 658 hectares, and the basic study of 4,1104,100 hectares of the Hermosa Norte sector.Mina Oeste and Tente en el Aire Oeste sectors. The reserves shown in these tables are calculated based on properties that are not involved in any legal disputes between SQM and other parties.
Caliche ore is the key raw material used in the production of iodine, specialty plant nutrients and industrial chemicals. The following gross margins for the business lines specified were calculated on the same basis as cut off grades used to estimate our reserves. We expect costs to remain relatively stable in the near future.
| 2018 | 2017 | 2016 | 2020 | 2019 | 2018 | |||||||||||||||||||||||||||||||||||||
| Gross Margin | Price | Gross Margin | Price | Gross Margin | Price | Gross Margin | Price | Gross Margin | Price | Gross Margin | Price | |||||||||||||||||||||||||||||||
| Iodine and Derivatives | 33 | % | US$24/kg | 21 | % | US$20/kg | 17 | % | US$28/kg | 50 | % | US$35/kg | 38 | % | US$29/kg | 33 | % | US$24/kg | ||||||||||||||||||||||||
| Specialty Plant Nutrition | 22 | % | US$722/ton | 20 | % | US$722/ton | 23 | % | US$784/ton | 23 | % | US$677/ton | 21 | % | US$695/ton | 22 | % | US$722/ton | ||||||||||||||||||||||||
| Industrial Chemicals | 33 | % | US$797/ton | 32 | % | US$809/ton | 35 | % | US$770/ton | 26 | % | US$713/ton | 33 | % | US$768/ton | 33 | % | US$797/ton | ||||||||||||||||||||||||
We maintain an ongoing program of exploration and resource evaluation on the land surrounding our production mines, and other sites for which we have the appropriate concessions.
Brines from the Salar de Atacama: Facilities and Reserves
Salar de Atacama: Facilites
Salar de Atacama
Our facilities at the Salar de Atacama are located 208210 kilometers to the east of the city of Antofagasta and 188190 kilometers to the southeast of the city of María Elena. At this site we use brines extracted from the salar to produce potassium chloride, potassium sulfate, boric acid, magnesium chloride salts (bishofite) and lithium chloride solutions, which are subsequently sent to our lithium carbonate plant at the Salar del Carmen for processing. The main production plants at this site include the potassium chloride flotation plants (MOP-H I and II), the potassium carnallite plants (PC I and PC I extension), the potassium sulfate flotation plant (SOP-H), the boric acid plant (ABO), the potassium chloride drying plant (Dual Plant or MOP-S), the potassium chloride compacting plant (MOP-G)(MOP-G3), the potassium sulfate drying plant (SOP-S) and the potassium sulfate compacting plant (SOP-G). Solar energy is the primary energy source used for the Salar de Atacama operations.
Salar de Atacama: Reserves
Our in-house staff of hydrogeologists and geologists prepares our estimates of the reserve base of potassium, sulfate, lithium and boron dissolved in brines at the Salar de Atacama. We have exploitation concessions through Corfo covering an area of 81,920 hectares, in which we have carried out geological exploitation, brine sampling and geostatistical analysis. We estimate that our proven and probable reserves as of December 31, 2018, based on law, geological exploitation, brine sampling and geostatistical analysis up to a depth of 300 meters of our total exploitation concessions,2020 are as follows:
Proven Reserves (1) (millions of metric tons) | Probable Reserves (1) (millions of metric tons) | Total Reserves (millions of metric tons) | ||||||||||
| Potassium (K+)(2) | 46.1 | 42.0 | 88.1 | |||||||||
| Sulfate (SO4-2)(3) | 39.0 | 45.2 | 84.2 | |||||||||
| Lithium (Li+)(4) | 4.56 | 3.99 | 8.55 | |||||||||
| Boron (B3+)(5) | 1.38 | 1.46 | 2.84 | |||||||||
Proven Reserves (1) (millions of metric tons) | Probable Reserves (1) (millions of metric tons) | Total Reserves (millions of metric tons) | ||||||||||
| Potassium (K+) (2) | 56.2 | 32.8 | 89.0 | |||||||||
| Sulfate (SO4-2) (3) | 42.9 | 31.7 | 74.6 | |||||||||
| Lithium (Li+) (4) | 6.0 | 3.1 | 9.1 | |||||||||
| Boron (B3+) (5) | 1.6 | 1.0 | 2.7 | |||||||||
| (1) | Metric tons of potassium, sulfate, lithium and boron considered in the proven and probable reserves are shown before losses from evaporation processes and metallurgical treatment. The recoveries of each ion depend on both brine composition and the process applied to produce the desired commercial products. |
| (2) | Recoveries for potassium vary from |
| (3) | Recoveries for sulfate vary from 27% to 45%. |
| (4) | Recoveries for lithium vary from |
| (5) | Recoveries for boron vary from 28% to 32%. |
The information set forth in the table above was validated in March 2019February 2021 by Messrs. Álvaro HenríquezAndrés Fock and Orlando Rojas using information that was prepared by SQM’s hydrogeologists, geologists and engineers and external advisors.
Mr. HenríquezFock is a geologist with more than 1516 years of experience in the field of mining hydrogeology. He is currently employed by SQMWSP as Superintendent of Hydrogeology, in the Salar Hydrogeology department.a Geologist. He is a Competent Person and is registered under No. 226 in the Public Registry of Competent Persons in Mining Resources and Reserves, in accordance with the Competent Person Law. As a hydrogeologist in Chile and abroad, he has evaluated multiple brine-based projects and has experience evaluating resources and reserves.
Mr. Orlando Rojas is a civil mining engineer and independent consultant. He is Partner and Chief Executive Officer of EMI-Ingenieros y Consultores S.A., whose offices are located at Los Domínicos No 7772, Las Condes, Santiago, Chile. He is a member of the Institute of Mining Engineers and is registered under No. 118 in the Public Registry of Competent Persons in Mining Resources and Reserves in accordance with the Competent Person Law and related regulations. He has worked as a mining engineer for 40 years since graduating from university, including more than 34 years working on estimates for reserves and resources.
Copies of the certificates of qualified competency issued by the Chilean Mining Commission for Mr. RojasFock and Mr. HenríquezRojas are attached hereto as Exhibit 99.299.3 and 99.3.99.4.
The cutoff grade for lithium extraction is set at 0.05% Li. The cost of the process is competitive in the market despite a small cost increase due to the expansions in the evaporation area (to reach the required Li concentration) and to the use of additives to maintain the quality of the brine that is used to feed the plant.
A cutoff grade of 1.0% K is used in the calculation, considering a low margin scenario using only MOP-S as and using diluted brine with higher levels of contaminants as the raw material and with recovery yields of approximately 47%53%, which is on the lower end of the range. In this scenario, considering current market conditions and market conditions from recent years, the production cost of MOP production is still competitive.competitive.
| 59 |
The proven and probable reserves are based on production experience, drilling, brine sampling and geo-statistic reservoir modeling in order to estimate brine volumes and their composition. We calculate the reserve base, which is the volume of brine effectively drainable or exploitable in each evaluation unit, by building a three-dimensional block model. The following variables are used to populate the model:
| · | Porosity: obtained from measurements of drainable porosity and effectiveness in core rocks, test pumping data, geophysical records and changes in the level of the brine. The volume of brine is estimated on the basis of the interpolation of the on-site porosity data. |
| · | Grades:The brine concentration chemistry of the brine measured in the ponds is subjected to an exploratory data analysis and a variographic analysis, in order to determine the chemical populations in the Salar. Subsequently, the grades are interpolated using the Kriging method. |
Based on the chemical characteristics, and the volume of brine, we determine the number of metric tons for each of the chemical ions being evaluated. Reserve classification is finally achieved by using geostatistical criteria and hydrogeological knowledge of the units that have been explored, as an indicator between proven and probable reserves. In order to carry out a quantitative evaluation of the lithium and potassium reserves, the Salar Hydrogeology Management used a tool, a numerical model of groundwater flow and transport, which allows evaluating the evolution of the reservoir over time when stressed with different mining extraction plans. This model is calibrated annually and is used for the projection and optimization of the brine supply in the short (2 years) and medium (5 years) term in the Salar de Atacama.
Proven reserves are defined as hydrogeological units with proven historical brine yield production, and a quality and piezometric brine monitoring network to control brine evolution over time. and that they have a monitoring network to control the chemical and piezometric evolution of the brine over time. Probable reserves are concentrated in those hydrogeological units identified with exploration data that support the continuity of the resource and its extraction capacity by pumping, but without historical brine production.
Probable reserves and inferred resources are being continually explored in order to be able to reclassify them as proven reserves and indicated or measured resources, respectively. This exploration includes systematic packer testing, chemical brine sampling and long-term pilot production pumping tests.
We consider chemical parameters to determine the process to be applied to the brines. These parameters are used to estimate potential restrictions on production yields, and the economic feasibility of producing such commercial products as potassium chloride, potassium sulfate, lithium carbonate and boric acid is determined on the basis of the evaluation.
Complementing the reserves information, SQM has an environmental impact assessment (RCA 226/06) which defines a maximum brine extraction until the end of the Lease Agreement (December 31, 2030).
Considering the authorized maximum net brine production rates we have performed hydrogeological simulations using numeric flowunder (RCA 226/06) and transport models to estimate changes in the volume and quality of the brine during the life of the project, considering the ponds infrastructure projected and existing on January 1, 2019. According to these simulations,a voluntary extraction under RCA 226/06, a total of 1.24492 million cubic meters of brine is expected to be extracted from the producing wells, corresponding to 1.05 million metric tons of lithium and 14.9lithium. Considering the voluntary reduction plan announced by SQM during 2020, a total of 342 million metric tonscubic meters of potassiumbrine will be extracted from the producing wells.wells, corresponding to 0.82 million metric tons of lithium. On the other hand, the proven and probable in situ base reserve, in situ, within the authorized area of environmental extraction area (RCA 226/06), corresponds to 4.331,533 million cubic meters of brine, corresponding to 5.3 million metric tons of lithium, and 30.4 million metric tons of potassium, enoughsufficient to satisfy the demand ofin both cases (RCA 226/06 and the Voluntary Extraction Reduction Plan) for the project until the end of the concession.
Brines from the Salar de Atacama are the key raw material used in the production of potassium chloride and potassium sulfate, and lithium and its derivatives. The following gross margins for the business lines specified were calculated on the same basis as cut off grades used to estimate our reserves. We expect costs to remain relatively stable in the near future.
| 2018 | 2017 | 2016 | 2020 | 2019 | 2018 | |||||||||||||||||||||||||||||||||||||
| Gross Margin | Price | Gross Margin | Price | Gross Margin | Price | Gross Margin | Price | Gross Margin | Price | Gross Margin | Price | |||||||||||||||||||||||||||||||
| Potassium Chloride and Potassium Sulfate | 19 | % | US$322/ton | 17 | % | US$282/ton | 11 | % | US$263/ton | 11 | % | US$288/ton | 17 | % | US$355/ton | 19 | % | US$322/ton | ||||||||||||||||||||||||
| Lithium and Derivatives | 57 | % | US$16,289/ton | 71 | % | US$12,970/ton | 66 | % | US$10,362/ton | 23 | % | US$5,931/ton | 39 | % | US$11,212/ton | 57 | % | US$16,289/ton | ||||||||||||||||||||||||
Other Production Facilities
Coya Sur
The Coya Sur site is located approximately 15 kilometers south of María Elena, and production activities undertaken there are associated with the production of potassium nitrate and finished products. The main production plants at this site include four potassium nitrate plants with a total capacity of 1,300,000 metric tons per year. There are also five production lines for crystallized nitrates, with a total capacity of 1,200,000 metric tons per year, and a prilling plant with a capacity of 360,000 metric tons per year. The potassium nitrate produced at Coya Sur is an intermediate product that is used as a raw material for the production of finished products (crystallized nitrates and prilled nitrates). Therefore, the production capacities listed above are not independent of one another and cannot be added together to obtain an overall total capacity. Natural gas is the main source of energy for our Coya Sur operation.
Salar del Carmen
The Salar del Carmen site is located approximately 1415 kilometers to the east of Antofagasta. The production plants at this facility include the lithium carbonate plant, with a production capacity of 70,000 metric tons per year, and the lithium hydroxide plant, with a production capacity of 13,500 metric tons per year. Electricity and natural gas are the main sources of energy for our Salar del Carmen operation.
The following table provides a summary of our production facilities as of December 31, 2018:2020:
| Facility | Type of Facility | Approximate (hectares)(1) | Nominal Production Capacity (thousands of metric tons/year) | Weighted Average Age (years)(2) | Gross Book Value (millions of US$) (2) | |||||||||||
| Coya Sur(3) (4) | Nitrates production | 1.518 | Potassium nitrate: 1,300 Crystallized nitrates: 1,200 Prilled nitrates: 360 | 5.0 | 571.7 | |||||||||||
| María Elena(5) (6) | Nitrates and iodine production | 35.830 | Nitrates: n/a Iodine: 1.6 Prilled nitrates: 300 | 13.8 | 424.0 | |||||||||||
| Nueva Victoria(5) (7) | Concentrated nitrate salts and iodine production | 47.492 | Iodine: 13.0 | 6.6 | 523.7 | |||||||||||
| Pampa Blanca(5) (7) (8) | Concentrated nitrate salts and iodide production | 10.441 | Nitrates: n/a Iodine: n/a | 10.5 | 7.1 | |||||||||||
| Pedro de Valdivia(3) (9) | Nitrates and iodine production | 253.880 | Nitrates: n/a Iodine: 3.2 | 13.6 | 226.3 | |||||||||||
| Salar de Atacama(3) (10) | Potassium chloride, potassium sulfate, lithium chloride, and boric acid production | 35.911 | Potassium chloride: 2,680 Potassium sulfate: 245 Boric acid: 15 | 10.8 | 1,554.1 | |||||||||||
| Salar del Carmen, Antofagasta(3) | Lithium carbonate and lithium hydroxide production | 126 | Lithium carbonate: 70 Lithium hydroxide: 13.5 | 8.7 | 304.3 | |||||||||||
| Tocopilla(11) | Port facilities | 22 | - | 12.2 | 172.8 | |||||||||||
| Facility | Type of Facility | Approximate (hectares) (1) | Nominal Production (thousands of metric | Weighted (years) (2) | Gross Book (millions of US$) | |||||||||||
| Coya Sur (3) (4) | Nitrates production | 1.518 | Potassium nitrate: 1,300 Crystallized nitrates: 1,200 Prilled nitrates: 360 | 7.03 | 638.7 | |||||||||||
| María Elena (5) (6) | Nitrates and iodine production | 35.830 | Nitrates: n/a Iodine: 1.6 Prilled nitrates: 300 | 15.95 | 415.9 | |||||||||||
| Nueva Victoria (5) (7) | Concentrated nitrate salts and iodine production | 47.492 | Iodine: 13.0 | 6.36 | 573.2 | |||||||||||
| Pampa Blanca (5) (7) (8) | Concentrated nitrate salts and iodide production | 10.441 | Nitrates: n/a Iodine: n/a | 1.94 | 8.1 | |||||||||||
| Pedro de Valdivia (3) (9) | Nitrates and iodine production | 253.880 | Nitrates: n/a Iodine: 3.2 | 14.70 | 229.6 | |||||||||||
| Salar de Atacama (3) (10) | Potassium chloride, potassium sulfate, lithium chloride, and boric acid production | 35.911 | Potassium chloride: 2,680 Potassium sulfate: 245 Boric acid: 15 | 11.52 | 1,581.8 | |||||||||||
| Salar del Carmen, Antofagasta (3) | Lithium carbonate and lithium hydroxide production | 126 | Lithium carbonate: 70 Lithium hydroxide: 13.5 | 5.98 | 422.0 | |||||||||||
| Tocopilla (11) | Port facilities | 22 | - | 13.22 | 167.9 | |||||||||||
| (1) | Approximate size considers both the production facilities and the mine for María Elena, Nueva Victoria, Pampa Blanca, Pedro de Valdivia and the Salar de Atacama. Mining areas are those authorized for exploitation by the environmental authority and/or Sernageomin. |
| (2) | Weighted average age and gross book value correspond to production facilities, excluding the mine, for María Elena, Nueva Victoria, Pampa Blanca, Pedro de Valdivia and the Salar de Atacama. |
| (3) | Includes production facilities and solar evaporation ponds. During 2019, we began to work on the expansion of discard deposit area of the new lithium hydroxide plant and accumulation ponds. |
| (4) | The potassium nitrate produced at Coya Sur is an intermediate product that is used as a raw material for the production of finished products (crystallized nitrates and prilled nitrates). Therefore, the production capacities listed above are not independent of one another and cannot be added together to obtain an overall total capacity. |
| (5) | Includes production facilities, solar evaporation ponds and leaching heaps. |
| (6) | Operations at the El Toco mine at María Elena were suspended in November 2013. |
| (7) | The nominal production capacity for iodine considers the capacity of our plants. The effective capacity is |
| (8) | Operations at Pampa Blanca were suspended in March 2010. |
| (9) | In November 2015, the mining and nitrate operations at Pedro de Valdivia were suspended, and iodine production was reduced at the Pedro de Valdivia site, in order to take advantage of the highly efficient production facilities at Nueva Victoria. |
| (10) | Potassium chloride and potassium sulfate are produced in a dual plant, and the production capacity for each of these products depends on the production mix. |
| (11) | The Tocopilla port facilities were originally constructed in 1961 and have been refurbished and expanded since that time. |
The railway line that runs between our Coya Sur production facilities and our Tocopilla port facilities was damaged in August 2015 as a result of storms in the north of Chile. The train is not currently operating and as a consequence, we have replaced the train with trucks to ship products from Coya Sur. Detailed engineering studies were performed to assess the damage of the railway. During the third quarter of 2016, the report was completed; it concluded that the cost and time needed to repair the railway at this time is not economical in the short and medium term. As a result of this determination, the Company wrote-off the assets related to the train. We do not believe it will materially impact future sales volumes or transportation costs.
We consider the condition of our principal plant and equipment to be good, with the exception of the railway line.
We directly or indirectly through subsidiaries own, lease or hold concessions over the facilities at which we carry out our operations. Such facilities are free of any material liens, pledges or encumbrances, and we believe they are suitable and adequate for the business we conduct in them.
| 62 |
Extraction Yields
The following table shows certain operating data relating to each of our mines for 2018, 20172020, 2019 and 2016:2018:
| (in thousands, unless otherwise stated) | 2018 | 2017 | 2016 | |||||||||
| Pedro de Valdivia(1) | ||||||||||||
| Metric tons of ore mined | – | – | – | |||||||||
| Average grade nitrate (% by weight) | – | – | – | |||||||||
| Iodine (parts per million (ppm)) | – | – | – | |||||||||
| Metric tons of crystallized nitrate produced | – | – | – | |||||||||
| Metric tons of iodine produced | 1.0 | 0.9 | 0.6 | |||||||||
| Maria Elena(2) | ||||||||||||
| Metric tons of ore mined | – | – | – | |||||||||
| Average grade nitrate (% by weight) | – | – | – | |||||||||
| Iodine (ppm) | – | – | – | |||||||||
| Metric tons of crystallized nitrate produced | – | – | – | |||||||||
| Metric tons of iodine produced | – | – | 0.2 | |||||||||
| Coya Sur(3) | ||||||||||||
| Metric tons of crystallized nitrate produced | 699 | 613 | 573 | |||||||||
| Pampa Blanca(2) | ||||||||||||
| Metric tons of ore mined | – | – | – | |||||||||
| Iodine (ppm) | – | – | – | |||||||||
| Metric tons of iodine produced | – | – | – | |||||||||
| Nueva Victoria | ||||||||||||
| Metric tons of ore mined | 42,753 | 36,383 | 29,902 | |||||||||
| Iodine (ppm) | 461 | 458 | 454 | |||||||||
| Metric tons of iodine produced | 10.2 | 8.8 | 7.7 | |||||||||
| Salar de Atacama(4) | ||||||||||||
| Metric tons of lithium carbonate produced | 50.4 | 45 | 44 | |||||||||
| Metric tons of potassium chloride and potassium sulfate and potassium salts produced | 1,505 | 1,881 | 2,045 | |||||||||
| (in thousands, unless otherwise stated) | 2020 | 2019 | 2018 | |||||||||
| Pedro de Valdivia(1) | ||||||||||||
| Metric tons of ore mined | – | – | – | |||||||||
| Average grade nitrate (% by weight) | – | – | – | |||||||||
| Iodine (parts per million (ppm)) | – | – | – | |||||||||
| Metric tons of crystallized nitrate produced | – | – | – | |||||||||
| Metric tons of iodine produced | 1.5 | 1.4 | 1.0 | |||||||||
| Maria Elena (2) | ||||||||||||
| Metric tons of ore mined | – | – | – | |||||||||
| Average grade nitrate (% by weight) | – | – | – | |||||||||
| Iodine (ppm) | – | – | – | |||||||||
| Metric tons of crystallized nitrate produced | – | – | – | |||||||||
| Metric tons of iodine produced | – | – | – | |||||||||
| Coya Sur (3) | ||||||||||||
| Metric tons of crystallized nitrate produced | 935 | 771 | 699 | |||||||||
| Pampa Blanca (2) | ||||||||||||
| Metric tons of ore mined | – | – | – | |||||||||
| Iodine (ppm) | – | – | – | |||||||||
| Metric tons of iodine produced | – | – | – | |||||||||
| Nueva Victoria | ||||||||||||
| Metric tons of ore mined | 43,420 | 42,196 | 42,753 | |||||||||
| Iodine (ppm) | 452 | 465 | 461 | |||||||||
| Metric tons of iodine produced | 10.6 | 10.7 | 10.2 | |||||||||
| Salar de Atacama (4) | ||||||||||||
| Metric tons of lithium carbonate produced | 72.2 | 62.3 | 50.4 | |||||||||
| Metric tons of potassium chloride and potassium sulfate and potassium salts produced | 1,476 | 1,049 | 1,505 | |||||||||
| (1) | In November 2015, mining and nitrate operations at Pedro de Valdivia were suspended, and iodine production was reduced at the Pedro de Valdivia site, in order to take advantage of the highly efficient production facilities at Nueva Victoria. |
| (2) | Operations at the Pampa Blanca mine and María Elena were suspended in March |
| (3) | Includes production at Coya Sur from treatment of nitrates solutions from María Elena and Pedro de Valdivia, nitrate salts from pile treatment at Nueva Victoria, and net production from NPT, or technical grade potassium nitrate, plants. |
| (4) | Lithium carbonate is extracted at the Salar de Atacama and processed at our facilities at the Salar del |
| 63 |
Transportation and Storage Facilities
The transportation of our products is carried out by trucks that are operated by dedicated third parties through long-term contracts. Furthermore, we own port and storage facilities for the transportation and management of finished products and consumable materials.
Our main centers for the production and storage of raw materials are the Nueva Victoria, Coya Sur and Salar de Atacama facilities. Other facilities include chemical plants for the finished products of lithium carbonate and lithium hydroxide at the Salar del Carmen plant. The Port of Tocopilla terminal, which we own, has a surface area of approximately 22 hectares and is the principal facility for the storage and shipment of our bulk products and packaged potassium chloride (MOP) and nitrates.
The nitrate finished products are produced at our Coya Sur facilities and then transported via trucks to the Port of Tocopilla terminal where they are stored and shipped eitherin bulk or packaged (polypropylenein polypropylene bags, polyethylene or polypropylene FIBC big bags) orbags. The latter can also be transported and stored in bulk. an alternative port (Mejillones) for later shipment.
The potassium chloride is produced at our Salar de Atacama facilities and we transport it by truck, either to the Port of Tocopilla terminal, or the Coya Sur facility.facility or the alternative Port of Mejillones for its shipment. The product transported to Coya Sur is an intermediate product that is used as a raw material for the production of potassium nitrate. On the other hand, theThe product transported to the Port of Tocopilla is a final product that will be shipped or transported to the client or affiliate. The nitrate raw material of nitrate for the production of potassium nitrate in Coya Sur is currently produced at Nueva Victoria and the remaining raw material is provided from historical stock stored in Coya Sur that was produced at the Pedro de Valdivia facility when it was operating. This raw material is obtained from the processing of caliche that is extracted from our mines.Victoria.
The lithium chloride solution, which contains a high concentration of boron, produced at our Salar de Atacama facilities, is transported to the lithium carbon plant in the Salar del Carmen area where the finished lithium carbonate is produced. Part of the lithium carbonate is provided to the adjacent lithium hydroxide plant where the finished lithium hydroxide is produced. These two products are packed in packaging of distinct characteristics (polyethylenesuch as polyethylene bags, multi-layer or polypropylene FIBC big bags),bags, stored within the same facilities and secured in roofed storerooms. Thereafter, they are consolidated into containers that are transported by trucks to a transit warehouse or directly to port terminals for their subsequent shipment. The port terminals used are currently suited to receive container ships and are situated in Antofagasta, Mejillones and Iquique.
Iodine obtained from the same caliche used for the production of nitrates, is processed, packaged and stored exclusively in the Pedro de Valdivia and Nueva Victoria facilities. The packaging used for iodine are drums and polypropylene FIBC big bags with an internal polyethylene bag and oxygen barrier, which at the time of transportation are consolidated into containers and sent by truck to port terminals suited for their management, principally located in Antofagasta, Mejillones and Iquique. Thereafter, they are sent to distinct markets by container ship or by truck to Santiago where iodine derivatives are produced in the Ajay-SQM Chile plants.
The Port of Tocopilla terminal facilities are located approximately 186 kilometers north of Antofagasta, approximately 124 kilometers west of María Elena and Coya Sur and 372 kilometers to the west of Salar de Atacama. Our affiliate, Servicios Integrales de Tránsitos y Transferencias S.A. (SIT), operates facilities for the shipment of products and the delivery of certain raw materials based on renewable concessions granted by Chilean regulatory authorities, provided that the facilities are used in accordance with the authorization granted and we pay an annual concession fee. The Port of Tocopilla terminal facilities include a truck weighing machine that confirms product entry into the port and transfers the product to distinct storage zones, a piezometer within the shipping system to carry out bulk product loaded onto ships, and a crane with a 40 ton capacity for the loading of sealed product onto ships.ships and a nitrate mixing facility.
| 64 |
The storage facilities consist of a system of six silos, with a total storage capacity of 55,000 metric tons, and a mixed storage area of open storehouses with a total storage capacity of approximately 250,000 metric tons. In addition, to fulfill future storage needs, we will continue to make investments in accordance with the investment plan outlined by management. The products are also put into bags at the Port of Tocopilla terminal facilities where the bagging capacity is established by two bag packaging machines, one for sacks and polypropylene FIBC big bags and one for FFS polyethylene. The products that are packaged in Tocopilla may be subsequently shipped at the same port or may also be consolidated into trucks or containers for its subsequent dispatch to clients by land or sea through containers from other ports, principally located in Antofagasta, Mejillones and Iquique.
For the transportation of bulk product, the transportation belt system extends across the coastline to deliver products directly to the hatches of bulk cargo ships. The nominal load capacity of this shipping system is 1,200 tons per hour. The transportation of packaged product is carried out utilizing the same bulk cargo ships using trailers without motors located in the dock and loaded by a crane with a 40 ton capacity from the Port of Tocopilla terminal. Thereafter, they are towed and unloaded using ship cranes to the respective warehouses.
We normally contract bulk cargo ships to transfer the product from the Port of Tocopilla terminal to our hubs around the world or to clients directly, who, in certain instances, use their own contracted vessels for delivery.
Tocopilla processes related to the reception, handling, storage and shipment of bulk/packaged nitrates produced at Coya Sur are certified by the third-party organization TÜV-RheilandV-Rheinland under the quality standard ISO 9001:2008.2015.
Computer System
In addition to the above-listed facilities, we operate varies computer and information systems linking our principal subsidiaries to our operating and administrative facilities throughout Chile, and other parts of the world, via two networks.world. The computer and information system is used mainly for finance, accounting, human resources, monitoring of supplies and inventories, billing, quality control, research activities and production process and maintenance control. The mainframe computing system is located at our offices in Santiago.Santiago and our Chilean and international subsidiaries are interconnected with each other, through data links.
In addition, we have Cloudcloud technologies, which allow us to support new business processes related to IoT (Internet of Things) and Advanced Analytics and enables the business to respond quickly and at low cost to changing conditions of theour business and of the market.
An Advanced Analytical pilot was carried out in one of our production plants, which allowed to us to collect information to allow us to advance the predictive short-term and medium-term analysis and possible automation in the long term.
A cyber security review is being carried out to highlight possible risks and mitigate them. Process automationthem, including raising awareness among our users related to best process and digitalization projects were initiated at various sites, such as the Port of Tocopilla, with the objective of reducing operational risk, and improving security and operational efficiency, which also includes a modernization of current IT infrastructure and existing communications.computational use practices.
None.
| ITEM 5. | OPERATING AND FINANCIAL REVIEW AND PROSPECTS |
The information in this Item 5 should be read in conjunction with the Company’s Consolidated Financial Statements and the notes thereto included elsewhere in this Annual Report.
Since January 1, 2010, theThe Company’s Consolidated Financial Statements have been prepared in accordance with the International Financial Reporting Standards as published by the International Accounting Standards Board (IASB).
| 65 |
CRITICAL ACCOUNTING POLICIES AND ESTIMATES
Critical accounting policies are defined as those that are reflective of significant judgments and uncertainties, which would potentially result in materially different results under different assumptions and conditions.
We believe that our critical accounting policies applied in the preparation of our Audited Consolidated Financial Statements are limited to those described below. It should be noted that in many cases, IFRS specifically dictates the accounting treatment of a particular transaction, limiting management’s judgment in their application. There are also areas in which management’s judgment in selecting available alternatives would not produce materially different results.
TradeUseful lives of property, plant and Other Accounts Receivableequipment and intangible assets
TradeProperty, plant and equipment and intangible assets, other accounts receivable relate to non-derivative financialthan goodwill, are recorded at acquisition cost. Property, plant and equipment and intangible assets with fixed payments that can be determined anddefinite useful lives are not quoted in any active market. These arise from sales operations involving products and/depreciated or services that we sell directly to our customers that were considered financial instruments measured at amortized cost, in accordance with the guidelines of IFRS 9.on a straight-line basis over their estimated useful lives.
TheseAccounting for long-lived assets are initially recognized at their fair value (which is equivalent to their face value, discounting implicit interestand intangible assets involves the use of estimates for installment sales) and subsequently at amortized cost according todetermining the effective interest rate method less a provision for impairment loss. When the face valueuseful lives of the account receivable does not significantly differ from its fair value, it is recognized at face value.assets over which they are to be depreciated or amortized. We applybelieve that the IFRS 9 simplified approachestimates we make to measuringdetermine an asset’s useful life are “critical accounting estimates” because they require our management to make estimates based on current facts and past experience and take into consideration the expected credit losses which uses a lifetime expected loss allowance for all trade receivables.
Previously, under IAS 39, an allowance for impairment loss is established for trade accounts receivable when there is objective evidence that we will not be able to collect all the amounts owed to us according to the original terms of accounts receivable. The Company calculates the allowance for doubtful accounts corresponding to receivables that are not guaranteed or insured as a functionphysical life of the delays that may occur inasset, the collection of such accounts.
Implicit interest in installment sales is recognized as interest income when interest is accrued over the term of the sale.
Income tax
Corporate income taxpotential for the year is determined as the sum of current taxes from the different consolidated companies.
Current taxes are based on the application of the various types of taxes attributable to taxable income for the year.
Differences between the book value of assetstechnological obsolescence, and liabilities and their tax basis generate the balance of deferred tax assets or liabilities, which are calculated using the tax rates expected to be applicable when the assets and liabilities are realized.
In conformity with current Chilean tax regulations, the provision for corporate income tax and taxes on mining activity is recognized on an accrual basis, presenting the net balances of accumulated monthly tax provisional payments for the fiscal period and associated credits. The Company operates and recognizes sales in countries other than Chile, and is subject to different tax regimes. These tax implications do not have a material impact on our effective tax rate.
The balances of these accounts are presented in current income taxes recoverable or current taxes payable, as applicable.
Tax on companies and variations in deferred tax assets or liabilities that are not the result of business combinations are recorded in the statement of income accounts or equity accounts in the consolidated statement of financial position, considering the origin of the gains or losses which have generated them.
At each reporting period, the carrying amount of deferred tax assets was reviewed and reduced to the extent where there would not be sufficient taxable income to allow the recovery of all or a portion of the deferred tax assets. Likewise, as of the date of the consolidated financial statements, deferred tax assets are evaluated and recognized if it is more likely than not that future taxable income will allow for recovery of the deferred tax asset.
With respect to deductible temporary differences associated with investments in subsidiaries, associated companies and interest in joint ventures, deferred tax assets are recognized solely provided that it is more likely than not that the temporary differences will be reversed in the near future and that there will be taxable income with which they may be used.
The deferred income tax related to entries directly recognized in equity is recognized with an effect on equity and not with an effect on profit or loss.
Deferred tax assets and liabilities are offset if there is a legally receivable right of offsetting tax assets against tax liabilities and the deferred tax is related to the same tax entity and authority.regulations.
Inventories
The Company measures inventories at the lower of production cost and net realizable value. The cost price of finished products and work in progress includes the direct cost of materials and, when applicable, labor costs, the depreciation of goods that are involved in the production process, the indirect costs incurred in transforming raw materials into finished products, and general expenses incurred in carrying inventories to their current location and conditions. The method used to determine the cost of inventories is the weighted average monthly cost and the average cost ofby warehouse storage.or storage center.
Commercial discounts, rebates obtained, and other similar entries are deducted when determining the acquisition price.
The net realizable value represents the estimate of the sales price, less all the estimated costs involved in making the finished product and the costs that will be incurred in the commercialization, sales, and distribution processes.
The Company conducts an evaluation of the net realizable value of inventories at the end of each year, recording an estimate with a charge to profit or loss when the inventory costs exceed the realizable value. This estimate is made for all the finished and intermediate products in the Company’s inventory. The valuation of obsolete, impaired or slow-moving products relates to their estimated net realizable value.
Determination of volume for certain product in progress and finished product is based on topography measures and technical studies that cover the different variables (density for bulk inventories and density and porosity for the remaining stock, among others), as well as the related allowances.
In the case of finished and work in progress products, the Company makes four types of provisions which are reviewed quarterly:
| a) | Provision associated with a lower value of existence: This is directly identified with the product that generates it and consist of three types: (i) provision for lower realization value, which corresponds to the difference between the cost of inventory of products , intermediate or finished, with the sale price less the costs necessary to bring them to the same state and location as the product with which it is compared; (ii) provision for uncertain future use that corresponds to the value of those products in process that are not likely to be used in sales according to the Company's long-term plans; and (iii) product reprocessing costs due to its current specification making its sale not feasible. |
The provisions for uncertainties in the technical specifications for the Company’s stocks of finished goods and work in progress have been made based on a technical study which covers the different variables that affect products in stock (such as density and humidity). This study is updated periodically to include new measurement technologies and the results from previous financial periods.
| b) | Provision associated with physical differences in inventory: A provision is made for differences that exceed the tolerance considered in the respective inventory process (periodical and annual physical inventories are conducted for production units in Chile and the port of Tocopilla and for commercial offices, it is based on the last zero count obtained, but in general there is a physical inventory at least once a year). These differences are recognized immediately. |
| c) | Potential errors in the determination of stocks: The Company has an algorithm that is reviewed at least annually and that corresponds to different percentages assigned to each inventory according to the product, location, complexity in measurement, rotation and mechanisms of associated control. |
| d) | Provisions made by commercial offices: Corresponds to historical percentages that are adjusted to the extent that zero count is achieved, in accordance with normal inventory management. |
Inventories of raw materials, supplies, materials and partssupplies for production are recorded at acquisition cost. Cyclical inventories are performed in warehouses, as well as general inventories every three years, Differences are recognized when detected. The company has a provision that makes quarterly calculations from percentages associated with each type of material (classification by warehouse and rotation), these percentages use the lower of acquisition costvalue resulting from deterioration or market value. The acquisition costobsolescence as well as potential losses. This provision is calculated according toreviewed at least annually, and considers the average acquisition price method. Nonetheless, an estimate is made for each financial period of the potential lower value of that proportion ofhistorical profit and loss obtained in the inventory that consists of obsolete, defective or slow-moving materials. This provision reduces the value of the Company’s raw materials, supplies, materials and parts.processes.
Obligations related to staff severance indemnities and pension commitments
Our obligations with respect to our employees are established in collective bargaining agreements and individual employment contracts. In the case of certain employees in the United States, our obligations are established through a pension plan, which was terminated in 2002.
These obligations are valued using an actuarial calculation that considers factors such as mortality rate, employee turnover, interest rates, retirement dates, effects related to increases in employees’ salaries, as well as the effects on variations in services derived from variations in the inflation rate.
Actuarial losses and gains that may be generated by variations in previously defined obligations are directly recorded in profit or loss for the year.
Actuarial losses and gains originating from deviations between the estimate and the actual behavior of actuarial hypotheses or in the reformulation of established actuarial hypotheses are recorded in equity.
Actuarial losses and gains are directly recorded in profit or loss for the year.
The discount rate used for calculating obligations outside the United States was 4.6%3.7% and 5.1%3.7% for the periods ended as of December 31, 20182020 and 2017,2019, respectively.
The Company’s subsidiary SQM North America has established pension plans for its retired employees that are calculated by measuring the projected obligation using a net salary progressive rate net of adjustments for inflation, mortality and turnover assumptions, deducting the resulting amounts at present value using a 3.75%4.0% interest rate for 20182020 and 4.50%4.0% for 2017.2019. The net balance of this obligation is presented under the “Provisions for employee benefits, non-current” line item.
Mining development costs
Mine exploration costs and stripping costs to maintain production of mineral resources extracted from operating mines are considered variable production costs and are included in the cost of inventory produced during the period. Mine development costs at new mines, and major development costs at operating mines outside existing areas under extraction that are expected to benefit future production, are capitalized under “other long-term assets” and amortized using a units-of-production method over the associated proven and probable reserves. We determine our proven and probable reserves based on drilling, brine sampling and geostatistical reservoir modeling in order to estimate mineral volume and composition.
All other mine exploration costs, including expenses related to low grade mineral resources rendering reserves that are not economically exploitable, are charged to the statement of income in the period in which they are incurred.
Asset value impairment
We assessconduct impairment tests on intangible assets with indefinite useful lives and goodwill on an annual basis, any impairment on the value of buildings,or more frequently if events or changes in circumstances indicate that they might be impaired. Other non-current assets, including property, plant and equipment and intangible assets goodwill and investments accounted for using the equity method of accounting in accordance with IAS 36 “Impairment of Assets.” Assets to which this method applies are:
Assetsdefinite useful life, are reviewed for impairment as to the existencewhenever events or changes in circumstances of any indicationindicate that the carrying value is lower than the recoverable amount. If such an indication exists, the asset recoverable amount is calculated in order to determine the extent of the impairment, if any. In the event that the asset does not generate any cash flows independent from other assets, we determine the recoverable amount of the cash generating unit to which this asset belongs according to the corresponding business segment (specialty plant nutrients, iodine and derivatives, lithium and derivatives, potassium, industrial chemicals and other products and services.)
We conduct impairment tests on intangible assets and goodwill with indefinite useful lives on an annual basis and every time there is indication of impairment. If the recoverable value of an asset is estimated at an amount lower than its carrying value, the latter decreases to its recoverable amount.
The results of the impairment tests the Company has performed on its primary intangible assets with indefinite useful lives and goodwill demonstrated that there was no need for the Company to make any accounting adjustments to such assets. These impairment tests were performed using conservative scenarios. For more information, see Note 13.114.1 to our Consolidated Financial Statements.
We have recognized impairment events derived from the following:
As a result of the rain storms that affected the Tocopilla Zone at the beginning of August 2015, SQM S.A. confirmed the existence of damages in several zones in the railway between the sites Coya Sur and Tocopilla. SQM has performed several internal and external studies with the purpose of determining the costs and terms necessary to repair the damages in the railway.
Consequently, SQM has adjusted the value of the assets associated with the railway (fixed equipment, facilities and rolling equipment), which has translated into a charge of approximately US$32 million which are reflected in the line other expenses by function in the consolidated statement of income for 2016.
On September 22, 2015, the Company decided to close the mining operations at the Pedro de Valdivia site and a portion of such site’s industrial operations. This decision has been made because the Company has continued to increase its production capacity of iodine and nitrate salts in its industrial mining operations at the Nueva Victoria site and has reduced its production costs to meet sales forecasts and increase its current worldwide market share in the iodine market. The Company recognized the impairment effect of US$58 million in the consolidated statement of income for 2015.
Financial derivatives and hedging transactions
Derivatives are recognized initially at fair value as of the date on which the derivatives contract is signed and, they are subsequently assessed at fair value. The method for recognizing the resulting gain or loss depends on whether the derivative has been designated as an accounting hedge instrument and, if so, it depends on the type of hedging, which may be as follows:
At the beginning of the transaction, the Company documents the relationship that exists between hedging instruments and those items hedged, as well as their objectives for risk management purposes and the strategy to conduct different hedging operations.
The Company also documents its evaluation both at the beginning and at the end of each period if the derivatives used in hedging transactions are highly effective to offset changes in the fair value or in cash flows of hedged items.
The fair value of derivative instruments used for hedging purposes is shown in Note 13.3 (hedging assets and liabilities) to our Consolidated Financial Statements. Changes in the cash flow hedge reserve are classified as a non-current asset or liability if the remaining expiration period of the hedged item is more than 12 months, and as a current asset or liability if the remaining expiration period of the entry is less than 12 months.
Derivatives that are not designated or do not qualify as hedging derivatives are classified as current assets or liabilities, and changes in the fair value are directly recognized through profit or loss.
Changes in the fair value of derivatives that are designated and qualify as fair value hedges are recorded in profit or loss, together with any changes in the fair value of the hedged asset or liability that are attributable to the hedged risk. The gain or loss relating to the effective portion of interest rate swaps that hedge fixed rate borrowings is recognized in profit or loss within finance costs, together with changes in the fair value of the hedged fixed rate borrowings attributable to interest rate risk. The gain or loss relating to the ineffective portion is recognized in profit or loss within other income or other expenses. If the hedge no longer meets the criteria for hedge accounting, the adjustment to the carrying amount of a hedged item for which the effective interest method is used is amortized to profit or loss over the period to maturity using a recalculated effective interest rate.
The portion of the derivative instruments used to mitigate cash flow fluctuations related to sales revenue or expenses is recognized in gross margin as a cost or undistributed revenue. The accrued portion of these instruments is recognized in other income or expenditure.
Contingencies
The amount recognized as a provision, including legal, contractual or constructive and other exposures or obligations, is the best estimate of the consideration required to settle the related liability, including any related interest charges, taking into account the risks and uncertainties surrounding the obligation. In addition, contingencies will only be resolved when one or more future events occur or fail to occur. Therefore, the assessment of contingencies inherently involves the exercise of significant judgment and estimates of the outcome of future events.events, the likelihood of loss being incurred and when determining whether a reliable estimate of the loss can be made. The Company assesses its liabilities and contingencies based upon the best information available, relevant tax laws and other appropriate requirements.
If we are unable to rationally estimate the obligation or concluded no loss is probable but it is reasonably possible that a loss may be incurred, no provision is recorded but disclosed in the notes to the Consolidated Financial Statements.
5.A. Operating Results
Introduction
The following discussion should be read in conjunction with the Company’s Consolidated Financial Statements. Certain calculations (including percentages) that appear herein have been rounded.
Our Consolidated Financial Statements are prepared in accordance with IFRS standards and prepared in U.S. dollars. The U.S. dollar is the primary currency in which we operate.
We operate as an independent corporation. Nonetheless we are a “controlled corporation,” as that term is defined under Chilean law. See “Item 7.A. Major Shareholders.”
Overview of Our Results of Operations
We divide our operations into the following business lines:
| · | the production and sale of specialty plant nutrients; |
| · | the production and sale of iodine and its derivatives; |
| · | the production and sale of lithium and its derivatives; |
| · | the production and sale of potassium, including potassium chloride and potassium sulfate; |
| 68 |
| · | the production and sale of industrial chemicals, principally industrial nitrates and solar salts; and |
| · | the purchase and sale of other commodity fertilizers for use primarily in Chile. |
We sell our products through three primary channels: our own sales offices, a network of distributors and, in the case of our fertilizer products, through Yara International ASA’s (“Yara”) distribution network in countries where its presence and commercial infrastructure are larger than ours. Similarly, in those markets where our presence is larger, both our specialty plant nutrients and Yara’s are marketed through our offices.
Factors Affecting Our Results of Operations
Our results of operations substantially depend on:
| · | trends in demand for and supply of our products, including global economic conditions, which impact prices and sales volumes; |
| · | efficient operations of our facilities, particularly as some of them run at production capacity; |
| · | our ability to accomplish our capital expenditures program in a timely manner; |
| · | the levels of our inventories; |
| · | trends in the exchange rate between the U.S. dollar and Chilean peso, as a significant portion of the cost of sales is in Chilean pesos, and trends in the exchange rate between the U.S. dollar and the euro, as a significant portion of our sales is denominated in euros; and |
| · | energy, logistics, raw materials, labor and maintenance costs. |
Impact of Foreign Exchange Rates
We transact a significant portion of our business in U.S. dollars, which is the currency of the primary economic environment in which we operate and is our functional and presentation currency for financial reporting purposes. A significant portion of our costs is related to the Chilean peso as most of our operations occur in Chile, and therefore an increase or decrease in the exchange rate between the Chilean peso and the U.S. dollar affects our costs of production. Additionally, as an international company operating in Chile and several other countries, we transact a portion of our business and have assets and liabilities in Chilean pesos and other non-U.S. dollar currencies, such as the euro, the South African rand and the Mexican peso. As a result, fluctuations in the exchange rate of such currencies to the U.S. dollar may affect our financial condition and results of operations. See Note 28 to our Consolidated Financial Statements.consolidated financial statements.
We monitor and attempt to balance our non-U.S. dollar assets and liabilities position, including through foreign exchange contracts and other hedging instruments, to minimize our exposure to foreign exchange rate risk. As of December 31, 2018,2020, for hedging purposes we had open contracts to buy U.S. dollars and sell euros for approximately US$15.3255.80 million (EUR13.3(EUR45.25 million) and to sell South African rand for approximately US$17.0627.11 million (ZAR240.5(ZAR 410.50 million), as well as forward exchange contracts to sell U.S. dollars and buy Chilean pesos for US$108.061.25 million (Ch$75,03545,135 million). OfAll of the UF11.5UF 10.95 million outstanding bonds issued in the Chilean market UF 8.5 million were hedged with cross-currency swaps to the U.S. dollar for approximately US$348434 million as of December 31, 2018.2020.
In addition, we had open forward exchange contracts to buy U.S. dollars and sell Chilean pesos to hedge our time deposits in Chilean pesos for approximately US$348181 million (Ch$241,944143,897 million).
| 69 |
The following table shows our revenues (in millions of US$) and the percentage of revenues accounted for by each of our product lines for each of the periods indicated:
| 2018 | 2017 | 2016 | 2020 | 2019 | 2018 | |||||||||||||||||||||||||||||||||||||||||||
| % | US$ | % | US$ | % | US$ | % | US$ | % | US$ | % | US$ | |||||||||||||||||||||||||||||||||||||
| Specialty plant nutrition | 35 | % | 781.8 | 32 | % | 697.3 | 32 | % | 623.9 | 39 | % | 701.7 | 37 | % | 723.9 | 35 | % | 781.8 | ||||||||||||||||||||||||||||||
| Iodine and derivatives | 14 | % | 325.0 | 12 | % | 252.1 | 12 | % | 231.1 | 18 | % | 334.7 | 19 | % | 371.0 | 14 | % | 325.0 | ||||||||||||||||||||||||||||||
| Lithium and derivatives | 32 | % | 734.8 | 30 | % | 644.6 | 27 | % | 514.6 | 21 | % | 383.4 | 26 | % | 505.7 | 32 | % | 734.8 | ||||||||||||||||||||||||||||||
| Potassium | 12 | % | 267.5 | 18 | % | 379.3 | 21 | % | 403.3 | 12 | % | 209.3 | 11 | % | 212.2 | 12 | % | 267.5 | ||||||||||||||||||||||||||||||
| Industrial chemicals | 5 | % | 108.3 | 6 | % | 135.6 | 5 | % | 104.1 | 9 | % | 160.6 | 5 | % | 94.9 | 5 | % | 108.3 | ||||||||||||||||||||||||||||||
| Other products and services | 2 | % | 48.5 | 2 | % | 48.5 | 3 | % | 62.2 | 2 | % | 27.6 | 2 | % | 36.0 | 2 | % | 48.5 | ||||||||||||||||||||||||||||||
| Total | 100 | 2,265.8 | 100 | 2,157.3 | 100 | 1,939.3 | 100 | 1,817.2 | 100 | 1,1943.7 | 100 | 2,265.8 | ||||||||||||||||||||||||||||||||||||
The following table shows certain financial information of the Company (in millions of US$) for each of the periods indicated, as a percentage of revenues:
| Year Ended December 31, | ||||||||||||||||||||||||
| 2018 | 2017 | 2016 | ||||||||||||||||||||||
| (in millions of US$) | US$ | % | US$ | % | US$ | % | ||||||||||||||||||
| Revenues | 2,265.8 | 100.0 | 2,157.3 | 100.0 | 1,939.3 | 100.0 | ||||||||||||||||||
| Cost of sales | (1,483.5 | ) | 65.5 | (1,394.8 | ) | 64.7 | (1,328.3 | ) | 68.5 | |||||||||||||||
| Gross profit | 782.3 | 34.5 | 762.5 | 35.3 | 611.0 | 31.5 | ||||||||||||||||||
| Other income(1) | 32.0 | 1.4 | 17.8 | 0.8 | 15.2 | 0.8 | ||||||||||||||||||
| Administrative expenses | (118.1 | ) | 5.2 | (101.2 | ) | 4.7 | (88.4 | ) | 4.6 | |||||||||||||||
| Other expenses(2)(3)(4)(5) | (36.9 | ) | 1.6 | (53.6 | ) | 2.5 | (82.5 | ) | 4.3 | |||||||||||||||
| Net impairment gains or reversal (losses) of financial assets | 3 | - | (8 | ) | - | (7.2 | ) | - | ||||||||||||||||
| Other gains (losses) | 6.4 | 0.3 | 0.5 | 0.0 | 0.6 | 0.0 | ||||||||||||||||||
| Finance income | 22.5 | 1.0 | 13.5 | 0.6 | 10.1 | 0.5 | ||||||||||||||||||
| Finance expenses | (59.9 | ) | 2.6 | (50.1 | ) | 2.3 | (57.5 | ) | 3.0 | |||||||||||||||
| Equity income of associates and joint ventures accounted for using the equity method | 6.4 | 0.3 | 14.5 | 0.7 | 13.0 | 0.7 | ||||||||||||||||||
| Foreign currency exchange differences | (16.6 | ) | 0.7 | (1.3 | ) | 0.1 | 0.4 | 0.0 | ||||||||||||||||
| Income before income tax expense(2)(3) | 621.0 | 27.4 | 594.6 | 27.6 | 414.9 | 21.4 | ||||||||||||||||||
| Income tax expense | (179.0 | ) | 7.9 | (166.2 | ) | 7.7 | (133.0 | ) | 6.9 | |||||||||||||||
| Profit attributable to: | ||||||||||||||||||||||||
| Controlling interests(2)(3) | 439.8 | 19.4 | 427.7 | 19.8 | 278.3 | 14.3 | ||||||||||||||||||
| Non-controlling interests | 2.2 | 0.1 | 0.7 | 0.0 | 3.6 | 0.2 | ||||||||||||||||||
| Profit for the year(2)(3) | 442.1 | 19.5 | 428.4 | 19.9 | 281.9 | 14.5 | ||||||||||||||||||
| Year Ended December 31, | ||||||||||||||||||||||||
| 2020 | 2019 | 2018 | ||||||||||||||||||||||
| (in millions of US$) | US$ | % | US$ | % | US$ | % | ||||||||||||||||||
| Revenues | 1,817.2 | 100.0 | 1,943.7 | 100.0 | 2,265.8 | 100.0 | ||||||||||||||||||
| Cost of sales (1) | (1,334.3 | ) | 73.4 | (1,383.6 | ) | 71.2 | (1,485.6 | ) | 65.6 | |||||||||||||||
| Gross profit | 482.9 | 26.6 | 560.1 | 28.8 | 780.2 | 34.4 | ||||||||||||||||||
| Other income (2) | 26.9 | 1.5 | 18.2 | 0.9 | 32.0 | 1.4 | ||||||||||||||||||
| Administrative expenses | (107.0 | ) | 5.9 | (117.2 | ) | 6.0 | (118.1 | ) | 5.2 | |||||||||||||||
| Other expenses (3)(4) | (99.6 | ) | 5.5 | (26.0 | ) | 1.3 | (36.9 | ) | 1.6 | |||||||||||||||
| Net impairment gains or reversal (losses) of financial assets | 4.7 | 0.7 | (1.1 | ) | - | 3 | - | |||||||||||||||||
| Other gains (losses) | 0.5 | 0.3 | 0.4 | 0.5 | 6.4 | 0.3 | ||||||||||||||||||
| Finance income | 13.7 | 0.8 | 26.3 | 1.4 | 22.5 | 1.0 | ||||||||||||||||||
| Finance expenses | (82.2 | ) | 4.5 | (76.9 | ) | 4.0 | (57.8 | ) | 2.6 | |||||||||||||||
| Equity income of associates and joint ventures accounted for using the equity method | 8.9 | 0.5 | 9.8 | 0.5 | 6.4 | 0.3 | ||||||||||||||||||
| Foreign currency exchange differences | (4.4 | ) | 0.2 | (2.2 | ) | 0.1 | (16.6 | ) | 0.7 | |||||||||||||||
| Income before income tax expense (2) | 238.5 | 13.1 | 390.6 | 20.1 | 621.0 | 27.4 | ||||||||||||||||||
| Income tax expense | (70.2 | ) | 3.9 | (110.0 | ) | 5.7 | (179.0 | ) | 7.9 | |||||||||||||||
| Profit attributable to: | ||||||||||||||||||||||||
| Controlling interests (2) | 164.5 | 9.1 | 278.1 | 14.3 | 439.8 | 19.4 | ||||||||||||||||||
| Non-controlling interests | 3.8 | 0.2 | 2.5 | 0.1 | 2.2 | 0.1 | ||||||||||||||||||
| Profit for the year (2) | 168.4 | 9.3 | 280.6 | 14.4 | 442.1 | 19.5 | ||||||||||||||||||
| (1) | Cost of sales includes the payment obligations under lease contract with Corfo, which includes quarterly lease payments based on product sales from leased mining properties and since 2018, annual contributions to research and development, to local communities, to the Antofagasta Regional Government and to the municipalities of San Pedro de Atacama, María Elena and Antofagasta. The expenses related to Corfo were US$74.4 million in 2020, US$143.9 million in 2019 and US$183.0 million in 2018. |
| (2) | Other income for 2018 includes pre-tax income of US$14.5 million related to the sale of our interest in the Minera Exar S.A. lithium project in Argentina. |
| (3) |
| As a result of the adoption of IFRS 9, a reclassification was made to present gains on reversal (losses) separately from other expenses as function. |
| (4) | Other expenses for |
| 70 |
Results of Operations – 20182020 compared to 20172019
Revenues
Revenues increaseddecreased by 5.0%6.5% to US$2,265.81,817.2 million in 20182020 from US$2,157.31,943.7 million in 2017.2019. The main factors that caused the increasedecrease in revenues and variations in different product lines are described below.
Lithium and Derivatives
LithiumRevenues from lithium and derivatives revenues increased 14.0%totaled US$383.4 million during the year ended December 31, 2020, a decrease of 24.2% compared to the US$734.8505.7 million in 2018 from US$644.6 million in 2017.for the year ended December 31, 2019. Set forth below are sales volume data for the specified years:
| (in Th. MT) | 2018 | 2017 | % Change | 2020 | 2019 | % Change | ||||||||||||||||||
| Lithium and derivatives | 45.1 | 49.7 | -9 | % | 64.6 | 45.1 | 43 | % | ||||||||||||||||
The lithiumDuring 2020, we believe total market continued its strong growth in 2018, with total lithium demand increasing by over 27% according to our estimates. Supply did not keep the same pace, and therefore market conditions remained tight.reached 330,000 metric tons. Our sales volumes decreasedincreased significantly compared to 2019, and our average prices fell over 47%. The decrease in 2018lithium price was a result of lower than expected demand growth, which we believe was a slight 1-2% increase in 2020 when compared to 2017 as a result of the delayed completion and ramp-up of our plant expansion to 70,000 metric tons, which took approximately five weeks more than anticipated mainly due to the calibration and fine tuning of some of the new components. During this period, the plant produced approximately 4,000 MT less battery grade product than originally anticipated.2019.
Average prices in this business line increased 25.6%decreased 47.1% in 20182020 compared to average prices during 2017,2019, reaching almostapproximately US$16,300/5,900/MT compared to average prices of approximately US$13,000/11,200/MT in 2017.2019.
Specialty Plant Nutrition
SpecialtyRevenues from the specialty plant nutrition revenues increased 12.1%business line for the year ended December 31, 2020 totaled US$701.7 million, a decrease of 3.1% compared to US$781.8723.9 million in 2018 from US$697.3 million in 2017. reported for the year ended December 31, 2019.
Set forth below are sales volume data for the specified years by product category in this product line:
| (in Th. MT) | 2018 | 2017 | % Change | 2020 | 2019 | % Change | ||||||||||||||||||
| Potassium nitrate and sodium potassium nitrate | 673.4 | 601.4 | 12 | % | 575.2 | 617.4 | -7 | % | ||||||||||||||||
| Specialty blends | 242.5 | 209.0 | 16 | % | 271.3 | 238.9 | 14 | % | ||||||||||||||||
| Other specialty plant nutrients (*) | 141.6 | 129.1 | 10 | % | 164.4 | 155.3 | 6 | % | ||||||||||||||||
| Sodium nitrate | 25.0 | 26.7 | -6 | % | 25.6 | 30.2 | -15 | % | ||||||||||||||||
* Includes trading of other specialty fertilizers.
We sell various products withinIn the specialty plant nutrition business line, and most of our specialty fertilizers are sold as either field fertilizers or water soluble fertilizers. Our sales volumes in this business line increased 12.0% in 2018 compared to 2017 primarily due topotassium nitrate market, demand growth and limitedgrew approximately 5% in 2020. Our average prices fell as a result of increased supply from our competitors.to meet this increased demand, about 3% less in 2020 than average prices reported in 2019.
Average prices in the specialty plant nutrition business line were US$722/677/MT in 2018, the same as2020, a decrease of 2.6% compared to average prices of US$695/MT reported in 2017.2018.
Iodine and Derivatives
IodineRevenues from sales of iodine and derivatives revenues increased 28.9%during the year ended December 31, 2020 were US$334.7 million, a decrease of 9.8% compared to US$325.0371.0 million in 2018 from US$252.1 million in 2017. generated for the year ended December 31, 2019.
Set forth below are sales volume data for the specified years:
| (in Th. MT) | 2018 | 2017 | % Change | 2020 | 2019 | % Change | ||||||||||||||||||
| Iodine and derivatives | 13.3 | 12.7 | 5 | % | 9.7 | 12.7 | -24 | % | ||||||||||||||||
OurLower iodine revenues were the result of decreased sales volumes during 2020 compared to 2019. Average prices in thisthe business line increased by approximately 5.1%18.9%, reaching US$35/kilogram in 2018 when2020 compared to 2017, primarily as a result of higher demand and increased average prices.
Average prices during 2018 increased over 22.6% compared to 2017, reaching US$24/kilogram.29/kilogram in 2019.
Potassium
Potassium chloride and potassium sulfate revenues decreased 29.5% to US$267.5 million in 2018 from US$379.3 million in 2017. Set forth below are sales volume data for the specified years:year ended December 31, 2020 totaled US$209.3 million, a 1.3% decrease compared to the US$212.2 million reported for the year ended December 31, 2019.
| (in Th. MT) | 2018 | 2017 | % Change | 2020 | 2019 | % Change | ||||||||||||||||||
| Potassium chloride and potassium sulfate | 831.8 | 1,344.3 | -38 | % | 726.7 | 597.3 | -3 | % | ||||||||||||||||
Our revenuesIn 2020, we believe that the potassium chloride market reached approximately 67 million metric tons. Revenues in the potassium chloride and potassium sulfate business line during 2020 were impacted by reducedlower average prices when compared to 2019, which were mostly offset by higher sales volumes in 2018. As anticipated,the business line. Our sales volumes decreased over 38% during 2018 as a result of our production limitations as we focused our production efforts in the Salar de Atacama on increasing lithium yields. Furthermore, as a result of environmental compliance plan that was approved by the Chilean Environmental Authority (SMA) at the end of the year, we are temporarily extracting less brine than we had in the past. as we focused our production efforts in the Salar de Atacama on increasing lithium yields. Thefor potassium chloride demand increased an additional 2 millionand potassium sulfate reached almost 730k metric tons in 2018, reaching almost 66 million metric tons. As result, potash prices increased slightly during the year. Average prices in the potassium chloride and potassium sulfate business line increaseddecreased approximately 14%19% during 20182020 when compared to 2017,2019, reaching US$322/288/MT.
Industrial Chemicals
Industrial chemicals revenues decreased 20.1%for the year ended December 31, 2020 reached US$160.6 million, a 69.3% increase compared to US$108.394.9 million in 2018 from US$135.6 million in 2017. for the year ended December 31, 2019.
Set forth below are sales volume data for the specified years by product category:
| (in Th. MT) | 2018 | 2017 | % Change | 2020 | 2019 | % Change | ||||||||||||||||||
| Industrial chemicals | 135.9 | 167.6 | -19 | % | 225.1 | 123.5 | 82 | % | ||||||||||||||||
RevenuesOur higher revenues in industrial chemicals reflected higher sales volumes in the industrial chemicals business line decreased as a resultline. We reported sales of lower sales volumes. These lower sales volumes were primarily related to decreased sales volumesover 160,000 metric tons of solar salts which totaled 47,000 metric tons thisduring year, in line withslightly higher than our estimated volumes for the year, but lower than the 88,000 metric tons sold in 2017.original estimates.
Other Products and Services
Revenues from sales of other commodity fertilizers and other income was the samewere US$27.6 million in 2018 and 2017, reaching2020, a decrease of 23.4% compared to US$48.5 million.36.0 million of revenues in 2019.
Cost of Sales
Our overall cost of sales increased 6.3%decreased 3.8% to US$1,483.51,334.3 million in 2018,2020, which represented 65.5%73.5% of revenues, from US$1,394.31,383.6 million in 2017,2019, which represented 64.7%71.2% of revenues. The main factors that caused the increasedecrease in cost of sales and variations in different product lines are described below.
| 71 |
Lithium and Derivatives
Lithium and derivatives cost of sales increased 67.5%decreased 3.0% to US$316.9297.0 million in 20182020 from US$189.2306.3 million in 2017,2019, primarily as a result of higher lease payments to Corfo, and operating our production plant at full capacityoptimal levels for the majority of the year. The average cost
Our costs of sales in therelated to our lithium and derivatives business line was US$6,100.4/MT influctuate with our price of lithium as a result of our 2018 an increaseamendment of almost 60.2% from US$3,807.8/MT in 2017.
Thethe lease agreement signed in January 2018,with Corfo. This agreement includes important amendments to the lease agreement and project agreement signed between CORFOCorfo and SQM in 1993. The main modifications became effective on April 10, 2018 and requires an increase in the lease payments by increasing the lease rates associated with the sale of the different products produced in the Salar de Atacama, including lithium carbonate, lithium hydroxide and potassium chloride. In regard toFor lithium carbonate, the former rate of 6.8% on FOB sales was changed to the following structure of progressive rates based on the final sale price (See Note 25.224.2 for the disclosure of lease payments made to CORFOCorfo for all periods presented.):
| Price US$/MT Li2CO3 | Lease payment rate | |||
| $0 - $4,000 | 6.8 | % | ||
| $4,000 - $5,000 | 8.0 | % | ||
| $5,000 - $6,000 | 10.0 | % | ||
| $6,000 - $7,000 | 17.0 | % | ||
| $7,000 - $10,000 | 25.0 | % | ||
| Over US$10,000 | 40.0 | % | ||
Specialty Plant Nutrition
Specialty plant nutrition cost of sales increased 10.4%decreased 6.3% to US$613.3537.8 million in 20182020 from US$555.4573.8 million in 2017,2019, as a result of increased sales volumes in 2018.lower costs per ton of potassium nitrate The average cost of sales in the specialty plant nutrition business line was US$546/519/MT in 2018,2020, lower than US$575/551/MT in 2017.2019.
Iodine and Derivatives
Iodine and derivatives cost of sales increased 8.9%decreased 26.9% to US$217.5168.5 million in 20182020 from US$199.8230.5 million in 2017, as a result of increased sales volumes in 2018.2019. The average cost of sales in the iodine and derivatives business line was US$15.4/17.5/kilogram in 2018,2020, a decrease of 2.6%3.6% from US$15.8/18.1/kilogram in 2017.2019.
Potassium
Potassium cost of sales decreased 30.7%increased 6.1% to US$217.4187.0 million in 20182020 from US$313.7176.2 million in 2017,2019, as a result of decreasedincreased sales volumes. The average cost of sales in the potassium business line was US$236.4/257/MT in 2018,2020, a slight decrease from US$233.3/295/MT in 2017.2019.
Industrial Chemicals
Industrial chemicals cost of sales decreased 20.5%increased 87.3% to US$73.0119.1 million in 20182020 from US$91.863.6 million in 2017,2019, as a result of decreasedincreased sales of solar salts.volumes in the business line. The average cost of sales in the industrial chemicals business line was US$518.1/529/MT in 2018, a decrease2020, an increase of 5.4%2.5% from US$547/515/MT in 2017. This decrease in cost was a result of a change in product mix.2019.
Gross Profit
Gross profit increased 2.6%decreased 13.8% to US$782.3482.9 million in 2018,2020, which represented 34.5%26.6% of revenues, from US$762.5560.1 million in 2017,2019, which represented 35.3%28.8% of revenues. As discussed above, this increasedecrease is attributable to the increasedecrease in revenues as a result of significantly higherlower lithium prices and higherlower sales volumes of specialty plant nutrients and iodine and derivatives.
| 72 |
Other Income
Other income increased 79.8%47.6% to US$32.026.9 million in 2018,2020, which represented 1.4%1.5% of revenues, from US$17.818.2 million in 2017,2019, which represented 0.8%0.9% of revenues. Other income for 2018 included pre-tax income of US$14.5 million related to the sale of our interest in the Minera Exar S.A. lithium project in Argentina. As a percentage of revenues, other income remained very similar between 2018 and 2017.
Administrative Expenses
Administrative expenses increased 16.7%decreased 8.7% to US$118.1107.0 million in 2018,2020, which represented 5.2%5.9% of revenues, from US$101.2117.2 million in 2017,2019, which represented 4.7%6.0% of revenues, due to increased revenues.
Other Expenses
Other expenses decreased 44.9%increased 283.2% to US$33.999.6 million in 2018,2020, which represented 1.5%5.5% of revenues, from US$61.626.0 million in 2017,2019, which represented 2.9%1.3% of revenues. This decrease was primarily attributable to a charge of approximately US$20.4 million related to payment made by our subsidiary SQM Salar S.A. to Corfo after entering into the Corfo Arbitration Agreement and accounted for in our 2017 consolidated financial statements.
Other Gains (Losses)
Other gains increased tolosses were US$6.45.3 million in 2018,2020, compared to losses of US$0.4 million in 2019, which represented 0.28% of revenues, from US$0.5 million in 2017, which represented 0.03%0.02% of revenues.
Finance Income
Finance income increased 66.9%decreased 47.8% to US$22.513.7 million in 2018,2020, which represented 1.0%0.8% of revenues, from US$13.526.3 million in 2017,2019, which represented 0.6%1.4% of revenues, due to higherlower interest rates earned on our investments and higher investmentslower investment volumes during 2018.2020.
Finance Expenses
Finance expenses increased 19.5%6.8% to US$59.982.2 million in 2018,2020, which represented 2.6%4.5% of revenues, from US$50.176.9 million in 2017,2019, which represented 2.3%4.0% of revenues, due to increased levels of debt that we had outstanding during 2018.2020.
Equity Income of Associates and Joint Ventures Accounted for Using the Equity Method
Equity income of associates and joint ventures accounted for using the equity method decreased 56.1%8.7% to US$6.48.9 million in 2018,2020, which represented 0.3%0.5% of revenues, from US$14.59.8 million in 2017,2019, which represented 0.7%0.5% of revenues.
Foreign Currency Exchange Differences
Losses from foreign currency exchange differences amounted to US$16.64.4 million in 2018,2020, which represented 0.7%0.2% of revenues, compared with a loss of US$1.32.2 million in 2017,2019, which represented 0.1% of revenues. A significant portion of our costs is related to the Chilean peso as most of our operations occur in Chile. Because the U.S. dollar is our functional currency, we are subject to currency fluctuations. We seek to mitigate this impact through an active hedging program. During 2018,2020, the Chilean peso depreciated 13.2%appreciated 5.0% against the U.S. dollar.
Profit Before Taxes
Profit before taxes increaseddecreased by US$26.4152.1 million, or 4.4%38.9%, to US$621.0238.5 million in 20182020 from US$594.6390.6 million in 2017.2019. This increasedecrease was primarily attributable to increasedecrease in revenues by US$108.5 million, a decrease in other expenses by US$27.7 million and an increase in other income by US$14.2126.5 million, partially offset by an increasea decrease in cost of sales by US$88.747.5 million and an increasea decrease in administrative expenses by US$17.010.7 million, as described above.
| 73 |
Income Tax Expense
Income tax expenses increased 7.7%decreased 36.2% to US$179.070.2 million in 2018,2020, representing an effective tax rate of 28.8%29.4%, compared to US$166.2110.0 million in 2017,2019, representing an effective tax rate of 27.9%28.2%. The effective Chilean corporate tax rate was 25.5%27.0% during 20172020 and increased to 27% during 2018.2019 The difference between the statutory and effective tax rates was primarily due to a decrease related to tax effect of tax rates outside Chile and non-deductible expenses as detailed in the Note 30.329.3 to our Consolidated Financial Statements.
Profit for the Year
Profit for the year increased 3.2%decreased 40.0% to US$442.1168.4 million in 20182020 from US$428.4280.6 million in 2017,2019, primarily due to higherlower average prices in the lithium business line higher specialty plant nutrient sales volumes, and higher average prices andlower sales volumes in the iodine business line. These factors offset the impact of the lower sales volumes of potassium chloride.
Results of Operations – 20172019 compared to 20162018
Revenues
Revenues increased by 11.2% to US$2,157.3 million in 2017 from US$1,939.3 million in 2016. The main factors that caused the increase in revenues and variations in different product lines are described below.
Specialty Plant Nutrition
Specialty plant nutrition revenues increased 11.8% to US$697.3 million in 2017 from US$623.9 million in 2016. Set forth below are sales volume dataFor a discussion of the comparison of our results of operations for the specifiedfiscal years by product category in this product line:
| (in Th. MT) | 2017 | 2016 | % Change | |||||||||
| Potassium nitrate and sodium potassium nitrate | 601.4 | 475.8 | 26 | % | ||||||||
| Specialty blends | 209.0 | 213.5 | -2 | % | ||||||||
| Other specialty plant nutrients (*) | 129.1 | 127.2 | 2 | % | ||||||||
| Sodium nitrate | 26.7 | 24.4 | 10 | % | ||||||||
* Includes trading2019 and 2018, see “Part I, Item 5.A. Operating Results—Results of other specialty fertilizers.
We sell various products within the specialty plant nutrition business line, and mostOperations – 2019 compared to 2018” of our specialty fertilizers are sold as either field fertilizers or water soluble fertilizers. Our sales volumes in this business line increased 14.9% in 2017 compared to 2016 primarily due to demand growth and limited supply from our competitors.
Average prices in the specialty plant nutrition business line were US$722/MT in 2017, slightly lower than US$742/MT in 2016.
Iodine and Derivatives
Iodine and derivatives revenues increased 9.1% to US$252.1 million in 2017 from US$231.1 million in 2016. Set forth below are sales volume dataAnnual Report on Form 20-F for the specified years:
| (in Th. MT) | 2017 | 2016 | % Change | |||||||||
| Iodine and derivatives | 12.7 | 10.2 | 24 | % | ||||||||
Our sales volumes in this business line increased by approximately 24% compared to 2016, primarily as
a result of higher demand due to new applications of iodine in the specialty plastics and carbon energy plants emission control industries.
However, average prices during 2017 continued to face downward pressure. Our average price for thefiscal year was US$20/kilogram, a decrease of over 12% compared to 2016.
Lithium and Derivatives
Lithium and derivatives revenues increased 25.3% to US$644.6 million in 2017 from US$514.6 million in 2016. Set forth below are sales volume data for the specified years:
| (in Th. MT) | 2017 | 2016 | % Change | |||||||||
| Lithium and derivatives | 49.7 | 49.7 | 0 | % | ||||||||
The lithium market continued its strong growth in 2017, with total lithium demand increasing by nearly 17% according to our estimates. Supply did not keep the same pace, and therefore market conditions remained tight.
Average prices in this business line increased 25% compared to average prices during 2016, reaching almost US$13,000/MT compared to average prices of approximately US$10,400/MT in 2016.
Potassium
Potassium revenues decreased 5.9% to US$379.3 million in 2017 from US$403.3 million in 2016. Set forth below are sales volume data for the specified years:
| (in Th. MT) | 2017 | 2016 | % Change | |||||||||
| Potassium chloride and potassium sulfate | 1,344.3 | 1,534.7 | -12 | % | ||||||||
Our revenues in the potassium chloride and potassium sulfate business line were impacted by reduced sales volumes in 2017. As anticipated, sales volumes decreased over 12% during 2017 as we focused our production efforts in the Salar de Atacama on increasing lithium yields. The potassium chloride demand increased an additional 4 million metric tons in 2017, reaching almost 63 million metric tons. As result, potash prices increased slightly during the year. Average prices in the potassium chloride and potassium sulfate business line increased approximately 7.4% during 2017 when compared to 2016, reaching US$282/MT.
Industrial Chemicals
Industrial chemicals revenues increased 30.2% to US$135.6 million in 2017 from US$104.1 million in 2016. Set forth below are sales volume data for the specified years by product category:
| (in Th. MT) | 2017 | 2016 | % Change | |||||||||
| Industrial chemicals | 167.6 | 128.9 | 30 | % | ||||||||
Revenues in the industrial chemicals business line increased as a result of higher sales volumes. These higher sales volumes were primarily related to increased sales volumes of solar salts, which totaled almost 88,000 metric tons this year, in line with our estimated volumes for the year.
Other Products and Services
Revenues from sales of other commodity fertilizers and other income decreased 22% to US$48.5 million in 2017 from US$62.2 million in 2016, primarily due to reduced sales volumes.
Cost of Sales
Our overall cost of sales increased 5.0% to US$1,394.8 million in 2017, which represented 64.7% of revenues, from US$1,328.3 million in 2016, which represented 68.5% of revenues. The main factors that caused the increase in cost of sales and variations in different product lines are described below.
Specialty Plant Nutrition
Specialty plant nutrition cost of sales increased 16.2% to US$555.4 million in 2017 from US$478.1 million in 2016, as a result of increased sales volumes in 2017. The average cost of sales in the specialty plant nutrition business line was US$575/MT in 2017, slightly higher than US$569/MT in 2016.
Iodine and Derivatives
Iodine and derivatives cost of sales increased 4.4% to US$199.8 million in 2017 from US$191.3 million in 2016, as a result of increased sales volumes in 2017. The average cost of sales in the iodine and derivatives business line was US$16/kilogram in 2017, a decrease of almost 16% from US$19/kilogram in 2016. We believe that we are the lowest cost producer of iodine and the cost reduction achieved in 2017 is a result of concentrating all of our production in the modern and efficient production facilities at Nueva Victoria after the closure of Pedro de Valdivia plant.
Lithium and Derivatives
Lithium and derivatives cost of sales increased 7.8% to US$189.2 million in 2017 from US$175.6 million in 2016, primarily as result of higher lease payments to Corfo, and operating our production plant at full capacity. The average cost of sales in the lithium and derivatives business line was US$3,808/MT in 2017, an increase of almost 7.7% from US$3,536/MT in 2016.
Potassium
Potassium cost of sales decreased 12.7% to US$313.7 million in 2017 from US$359.5 million in 2016, as a result of decreased sales volumes. The average cost of sales in the potassium business line was US$233/MT in 2017, a slight decrease from US$234/MT in 2016.
Industrial Chemicals
Industrial chemicals cost of sales increased 36.2% to US$91.8 million in 2017 from US$67.4 million in 2015, as a result of increased sales of solar salts. The average cost of sales in the industrial chemicals business line was US$547/MT in 2017, an increase of 4.7% from US$523/MT in 2016. This increase in cost was a result of a change in product mix.
Gross Profit
Gross profit increased 24.8% to US$762.5 million in 2017, which represented 35.3% of revenues, from US$611.0 million in 2016, which represented 31.5% of revenues. As discussed above, this increase is attributable to the increase in revenues as a result of significantly higher lithium prices, higher sales volumes in specialty plant nutrition, iodine and derivatives, and solar salts. A reduction in cost of sales from 68.5% of 2016 revenues to 64.7% of 2017 revenues also contributed to an increase in gross profit.
Other Income
Other income increased 17.3% to US$17.8 million in 2017, which represented 0.8% of revenues, from US$15.2 million in 2016, which represented 0.8% of revenues. As a percentage of revenues, other income remained very similar between 2017 and 2016.
Administrative Expenses
Administrative expenses increased 14.4% to US$101.2 million in 2017, which represented 4.7% of revenues, from US$88.4 million in 2016, which represented 4.6% of revenues, due to increased revenues.
Other Expenses
Other expenses decreased 31.3% to US$61.6 million in 2017, which represented 2.9% of revenues, from US$89.7 million in 2016, which represented 4.6% of revenues. This decrease was primarily attributable to a one-time charge for impairment related to the closing of the train between Coya Sur and Tocopilla of approximately US$32.8 million and a charge of approximately US$30.5 million related to the Company's agreementended December 31, 2019 filed with the DOJ and the administrative cease and desist order issued by the SEC both in 2016. The decrease in other expenses seen in 2017 was partially offset by a charge of approximately US$20.4 million relating to payment made by our subsidiary SQM Salar S.A. to Corfo after entering into the Corfo Arbitration Agreement.
Other Gains (Losses)
Other gains (losses) decreased to a gain of US$0.5 million in 2017, which represented 0.03% of revenues, from a gain of US$0.7 million in 2016, which represented 0.04% of revenues.
Finance Income
Finance income increased 33.3% to US$13.5 million in 2017, which represented 0.6% of revenues, from US$10.1 million in 2016, which represented 0.5% of revenues, due to higher interest rates earned on our investments and higher investments volumes during the year.
Finance Expenses
Finance expenses decreased 12.8% to US$50.1 million in 2017, which represented 2.3% of revenues, from US$57.5 million in 2016, which represented 3.0% of revenues, due to decreased levels of debt that we had during 2017.
Equity Income of Associates and Joint Ventures Accounted for Using the Equity Method
Equity income of associates and joint ventures accounted for using the equity method increased 10.8% to US$14.5 million in 2017, which represented 0.7% of revenues, from US$13.0 million in 2016, which represented 0.7% of revenues.
Foreign Currency Exchange Differences
Losses from foreign currency exchange differences amounted to US$1.3 million in 2017, which represented 0.06% of revenues, compared with a profit of US$0.5 million in 2016, which represented 0.2% of revenues. A significant portion of our costs is related to the Chilean peso as most of our operations occur in Chile. Because the U.S. dollar is our functional currency, we are subject to currency fluctuations. We seek to mitigate this impact through an active hedging program. During 2017, the Chilean peso appreciated 8.0% against the U.S. dollar.
Profit Before Taxes
Profit before taxes increased by US$179.7 million, or 43.3%, to US$594.6 million in 2017 from US$414.9 million in 2016. This increase was primarily attributable to increase in revenues by US$218.0 million, a decrease in financial expenses by US$7.4 million and a decrease in other expenses by US$28.1 million, partially offset by an increase in cost of sales by US$66.5 million, each of the reasons described above.
Income Tax Expense
Income tax expenses increased 25.0% to US$166.2 million in 2017, representing an effective tax rate of 27.9%, compared to US$133.0 million in 2016, representing an effective tax rate of 32.0%. The effective Chilean corporate tax rate was 24.0% during 2016 and increased to 25.5% during 2017. The difference between the statutory and effective tax rates was primarily due to a decrease related to tax effect of tax rates outside Chile and non-deductible expenses as detailed in the Note 30.3 to our Consolidated Financial Statements.
Profit for the Year
Profit for the year increased 52.0% to US$428.4 million in 2017 from US$281.9 million in 2016, primarily as a result of significantly higher lithium prices and increased sales volumes in specialty plant nutrients, iodine and derivatives and industrial chemicals business lines.April 23, 2020.
5.B. Liquidity and Capital Resources
As of December 31, 2018,2020, we had US$868.8857.2 million of cash and cash equivalents and time deposits. In addition, as of December 31, 2018,2020, we had US$481478 million of unused uncommitted working capital credit lines.
Shareholders’ equity decreasedincreased to US$2,137.82,169.6 million as of December 31, 20182020 from US$2,247.52,134.5 million as of December 31, 2017.2019. Our ratio of total liabilities to total equity (including non-controlling interest) on a consolidated basis increased to 1.001.21 as of December 31, 20182020 from 0.911.19 as of December 31, 2017.2019.
We evaluate from time to time our cash requirements to fund capital expenditures, dividend payouts and increases in working capital, but we believe our working capital is sufficient for our present requirements. As debt requirements also depend on the level of accounts receivable and inventories, we cannot accurately determine the amount of debt we will require nor are our requirements typically seasonal.
The table below shows our cash flows for 2018, 20172020, 2019 and 2016:2018:
| (in millions of US$) | 2018 | 2017 | 2016 | 2020 | 2019 | 2018 | ||||||||||||||||||
| Net cash from operating activities | 524.8 | 758.3 | 633.7 | 182.2 | 427.0 | 524.8 | ||||||||||||||||||
| Net cash used in financing activities | (387.3 | ) | (411.9 | ) | (816.4 | ) | (94.1 | ) | 105.9 | (387.3 | ) | |||||||||||||
| Net cash from (used in) investing activities | (187.0 | ) | (248.1 | ) | 162.4 | (167.1 | ) | (485.5 | ) | (187.0 | ) | |||||||||||||
| Effects of exchange rate fluctuations on cash and cash equivalents | (24.9 | ) | 17.5 | 7.8 | (0.4 | ) | (14.9 | ) | (24.9 | ) | ||||||||||||||
| Net increase (decrease) in cash and cash equivalents | (74.4 | ) | 115.8 | (12.6 | ) | (79.4 | ) | (32.5 | ) | (74.4 | ) | |||||||||||||
We operate a capital-intensive business that requires significant investments in revenue-generating assets. Our past growth strategies have included purchasing production facilities and equipment and the improvement and expansion of existing facilities. Funds for capital expenditures and working capital requirements have been obtained from net cash from operating activities, borrowing under credit facilities and issuing debt securities.
The Board of Directors approved a
| 74 |
We believe that our capital expenditures plan for 2019 of2021 could reach approximately US$360500 million in connection with investments to be made in Chile and abroad. The 2019 capital investment program is primarily focused on the maintenance and expansion of our production facilities as well as investment in new projects. Our 2019 capital investment program does not require external financing but we evaluate from time to time whether to access capital markets in order to optimizestrengthen our financial position.ability to meet our production goals and to increase our production capacity, primarily related to lithium carbonate and lithium hydroxide capacity expansions and nitrates and iodine capacity in Chile and development of our lithium project in Australia. See “Item 4.A. History and Development of the Company—Capital Expenditure Program.”
Our other major use of funds is for dividend distributions. The Board of Directors approved payment of dividends of US$542 million and US$37045 million during 20182020 and 2017, respectively.US$278 million during 2019, in each case charged against the Company’s retained earnings in the applicable year. In addition, at the Extraordinary Shareholders’ Meeting held on September 29, 2020, a special dividend payment (dividendo eventual) of US$100 million (equivalent to US$0.37994 per share) charged against the Company’s retained earnings was approved (the “Special Dividend”). In the consolidated statement of cash flows, we reported dividends paid of US$550222 million and US$374330 million during 20182020 and 2017,2019, respectively. The difference in the amounts of dividends paid set forth in the consolidated statement of cash flows, and the amount approved by the Board, is due to the differences in the exchange rate. For a disclosure of our 20182020 dividend policy and payments, see “Item 8.A.8. Dividend Policy”.
The Dividend Policy proposalproposed dividend policy for 20192021 is expected to be announced at the Annual Shareholders’ Meeting to be held on April 25, 2019.23, 2021.
As of December 31, 2020, we had US$854.6 million of cash and cash equivalents and time deposits. In addition, as of December 31, 2020, we had US$478 million of unused uncommitted working capital credit lines. Our Net Financial Debt to Adjusted EBITDA ratio was 1.9x as of December 31, 2020. Our next debt maturity that will require a significant cash payment is scheduled to occur in April 2023. We believe that our capital expenditures related to maintenance will require approximately US$500 million during 2021. We believe that our capital expenditures related to maintenance will require approximately US$120 million during 2021.
Our future cash position could be impacted by, among other things, an operational shutdown, unforeseen expenses, a decreased ability of our customers to pay us for products or services or lower average prices or sales volumes in our business lines. Demand growth, sales volumes and average prices in our business lines could continue to be impacted by the COVID-19 pandemic, and therefore could have an impact on our cash position which could lead to a material adverse effect on our business, financial condition and results of operations. See “Item 3.D. Risk Factors”
Financing Activities
Our current ratio, defined as current assets divided by current liabilities, increased to 4.325.54 as of December 31, 20182020 from 3.293.45 as of December 31, 2017.2019. The following table shows key information about our outstanding long- and short-term debt as of December 31, 2018.2020.
| Debt Instrument(1) | Current Amount (ThUS$) | Non-Current Amount (ThUS$) | Interest Rate | Issue Date | Maturity Date | Amortization | ||||||||||||
| Bilateral loan — US$70 million | 3.98 | % | May 29, 2019 | May 29, 2023 | Bullet | |||||||||||||
| 5.50% Notes due 2020 — US$250 million | 2,288 | 249,869 | 5.50 | % | Apr. 21, 2010 | Apr. 21, 2020 | Bullet | |||||||||||
| 3.625% Notes due 2023 — US$300 million | 2,044 | 247,798 | 3.63 | % | Apr. 03, 2013 | Apr. 03, 2023 | Bullet | |||||||||||
| 4.375% Notes due 2025 — US$250 million | 4,215 | 297,994 | 4.38 | % | Oct. 28, 2014 | Jan. 28, 2025 | Bullet | |||||||||||
| Series H Bond — UF 4 million. | 3,617 | 157,312 | 4.90 | % | Jan. 05, 2009 | Jan. 05, 2030 | Semiannual, beginning in 2019 | |||||||||||
| Series O Bond — UF 1.5 million | 867 | 58,636 | 3.80 | % | Feb. 01, 2012 | Feb. 01, 2033 | Bullet | |||||||||||
| Series P Bond — UF 3 million | 1,772 | 118,927 | 3.25 | % | April 6, 2018 | Jan. 15, 2028 | Bullet | |||||||||||
| Series Q Bond — UF 3 million | 342 | 118,943 | 3.45 | % | Nov. 8, 2018 | Jun. 15, 2038 | Bullet | |||||||||||
| 75 |
(1) With the exception of the Series Q bond, UF denominated bonds are fully hedged to U.S. dollars with cross-currency swaps.
| Debt Instrument (1) | Current Amount (ThUS$) | Non-Current Amount (ThUS$) | Interest Rate | Issue Date | Maturity Date | Amortization | ||||||||||||
| Bilateral loan — US$70 million | 82 | 69,376 | 1.36 | % | May 29, 2019 | May 30, 2023 | Bullet | |||||||||||
| 3.63% Notes due 2023 — US$300 million | 2,044 | 299,219 | 3.63 | % | Apr. 03, 2013 | Apr. 03, 2023 | Bullet | |||||||||||
| 4.38% Notes due 2025 — US$250 million | 4,215 | 248,664 | 4.38 | % | Oct. 23, 2014 | Jan. 28, 2025 | Bullet | |||||||||||
| 4.25% Notes due 2029—US$450 million | 6,829 | 444,980 | 4.25 | % | May 7, 2019 | May 7, 2029 | Bullet | |||||||||||
| 4.25% Notes due 2050—US$400 million | 2,632 | 393,418 | 4.25 | % | Jan. 22, 2020 | Jan. 22, 2050 | Bullet | |||||||||||
| Series H Bond — UF 4 million. | 18,040 | 125,008 | 4.90 | % | Jan. 13, 2009 | Jan. 05, 2030 | Semiannual, beginning in 2019 | |||||||||||
| Series O Bond — UF 1.5 million | 880 | 60,430 | 3.80 | % | Apr. 04, 2012 | Feb. 01, 2033 | Bullet | |||||||||||
| Series P Bond — UF 3 million | 1,812 | 122,591 | 3.25 | % | Mar. 31, 2018 | Jan. 15, 2028 | Bullet | |||||||||||
| Series Q Bond — UF 3 million | 329 | 122,316 | 3.45 | % | Nov. 8, 2018 | Jun. 1, 2038 | Bullet | |||||||||||
| (1) | UF denominated bonds are fully hedged to U.S. dollars with cross-currency swaps. Nota 14.4 b y d |
As of December 31, 2018,2020, we had total financial debt of US$1,3301,899.5 million compared to US$1,0311,488.7 million as of December 31, 2017. Of the2019. The total short-term debt as of December 31, 20182020 was US$23.669.0 million, and as of December 31, 20172019 was US$220.3291.2 million.
As of December 31, 2018,2019, all of our long-term debt, including the current portion, was denominated in U.S. dollars, and with the exception of our Series Q Bonds, all our UF-denominated bonds were hedged with cross-currency swaps to the U.S. dollar.
The financial covenants related to our debt instruments include: (i) limitations on the ratio of total liabilitiesNFD to equity (including non-controlling interest) on a consolidated basis, and (ii) minimum production assets. We believe that the terms and conditions of our debt agreements are standard and customary.
The following table shows the maturities of our nominal long-term debt by year as of December 31, 20182020 (in millions of US dollars):
| Maturity | Amount | Amount | ||||||
| 2019 | 7.2 | |||||||
| 2020 | 264.4 | |||||||
| 2021 | 14.4 | 15 | ||||||
| 2022 | 14.4 | 15 | ||||||
| 2023 and thereafter | 1,025.8 | |||||||
| 2023 | 385 | |||||||
| 2024 | 15 | |||||||
| 2025 and thereafter | 1,488 | |||||||
| Total | 1,326.3 | 1,925 | ||||||
| (1) | Only the principal amount has been included. For the UF-denominated local bonds, the amounts presented reflect the real U.S. dollar obligation as of December 31, 2020 not including the effects of the cross-currency swaps that hedge these bonds to the U.S. dollar and which had, as of December 31, 2020, a market value of US$18.4 million in favor of SQM. |
| (2) | On January 22, 2020, we issued and sold US$400 million principal amount of senior secured notes to qualified institutional buyers in the United States under Rule 144A under the Securities Act, and to investors outside the United States under Regulation S under the Securities Act. These notes have an annual interest rate of 4.250% and mature in 2050 |
(1) Only theOn January 22, 2020, we issued and sold US$400 million principal amount has been included. Forof senior secured notes to qualified institutional buyers in the UF-denominated local bonds, the amounts presented reflect the real U.S. dollar obligation as of December 31, 2018 not including the effects of the cross-currency swaps that hedge these bonds toUnited States under Rule 144A under the U.S. dollarSecurities Act of 1933, as amended (the “Securities Act”), and which had, as of December 31, 2018, a market value of US$3.8 million against SQM.
On April 5, 2018, we placed and sold onto investors outside the Chilean stock marketUnited States under Regulation S under the Securities Act. These notes have an issue of Series P bonds for a total amount of UF 3,000,000 (approximately US$135 million). The Series P bonds (i) have a maturity date of January 15, 2028, (ii) will accrueannual interest at the rate of 3.25% per annum on the unpaid capital, expressed4.250% and mature in UF, from January 15, 2018 and (iii) have an early redemption option from April 5, 2018.2050.
On November 8, 2018, we placed and sold on the Chilean stock market an issue of Series Q bonds for a total amount of UF 3,000,000 (approximately US$123.6 million). The Series Q bonds have a: (i) maturity date of June 1, 2038, (ii) will accrue interest at a rate of 3.45% per annum on the unpaid capital, expressed in UF, from June 1, 2018 and (iii) have an early redemption option from November 8, 2018.
Environmental and Occupational Safety and Health Projects
We spent US$26.226.1 million on environmental, safety and health projects in 2018.2020. We have budgeted approximately US$23.030.5 million in 20192021 for environmental, safety and health projects. This amount forms part of the capital expenditure program discussed above.
Non-IFRS Financial Measures
This annual report makes reference to certain non-IFRS financial measures, namely EBITDA and adjusted EBITDA. These non-IFRS financial measures are not recognized measures under IFRS, do not have a standardized meaning prescribed by IFRS and are therefore unlikely to be comparable to similar measures presented by other companies. Rather, these measures are provided as additional information to complement IFRS measures by providing further understanding of the Company’s results of operations from management’s perspective. Accordingly, they should not be considered in isolation nor as a substitute for analysis of our financial information reported under IFRS.
EBITDA represents Profit for the Year + Depreciation and Amortization Expenses + Finance Costs + Income Tax and Adjusted EBITDA is defined as EBITDA – Other income – Other gains (losses) - Share of Profit of associates and joint ventures accounted for using the equity method + Other expenses by function + Net impairment gains on reversal (losses) of financial assets – Finance income – Currency differences. We have included EBITDA and adjusted EBITDA to provide investors with a supplemental measure of our operating performance.
We believe EBITDA and adjusted EBITDA are important supplemental measures of operating performance because it eliminates items that have less bearing on our operating performance and thus highlights trends in our core business that may not otherwise be apparent when relying solely on IFRS financial measures.
EBITDA and adjusted EBITDA have important limitations as analytical tools. For example, EBITDA and adjusted EBITDA do not reflect (a) our cash expenditures, or future requirements for capital expenditures or contractual commitments; (b) changes in, or cash requirements for, our working capital needs; (c) the significant interest expense, or the cash requirements necessary to service interest or principal payments, on our debt; and (d) tax payments or distributions to our parent to make payments with respect to taxes attributable to us that represent a reduction in cash available to us. Although we consider the items excluded in the calculation of non-IFRS measures to be less relevant to evaluate our performance, some of these items may continue to take place and accordingly may reduce the cash available to us. See also note 19.1 of the Consolidated Financial Statements.
We believe that the presentation of the non-IFRS financial measures described above is appropriate. However, these non-IFRS measures have important limitations as analytical tools, and you should not consider them in isolation, or as substitutes for analysis of our results as reported under IFRS. Because of these limitations, we primarily rely on our results as reported in accordance with IFRS and use EBITDA and adjusted EBITDA only supplementally.
| For the year ended December 31, 2018, 2017, 2016 | ||||||||||||
| 2018 | 2017 | 2016 | ||||||||||
| (ThUS$) | (ThUS$) | (ThUS$) | ||||||||||
| Profit for the Year | 442,063 | 428,417 | 281,924 | |||||||||
| (+) Depreciation and amortization expenses | 221,499 | 240,526 | 249,792 | |||||||||
| (+) Finance costs | 59,914 | 50,124 | 57,498 | |||||||||
| (+) Income tax | 178,975 | 166,173 | 132,965 | |||||||||
| EBITDA | 902,451 | 885.240 | 722,179 | |||||||||
| (-) Other income | 32,048 | 17,827 | 15,202 | |||||||||
| (-) Other gains (losses) | 6,404 | 543 | 679 | |||||||||
| (-) Share of Profit of associates and joint ventures accounted for using the equity method | 6,351 | 14,452 | 13,047 | |||||||||
| (+) Other Expenses by Function | 36,907 | 53,600 | 82,533 | |||||||||
| (+) Net impairment gains on reversal (losses) of financial assets | (2,967 | ) | 8,038 | 7,198 | ||||||||
| (-) Finance income | 22,533 | 13,499 | 10,129 | |||||||||
| (-) Currency differences | (16,597 | ) | (1,299 | ) | 460 | |||||||
| Adjusted EBITDA | 885,652 | 901,856 | 772,393 | |||||||||
| For the years ended December 31, | ||||||||||||
| 2020 | 2019 | 2018 | ||||||||||
| (ThUS$) | (ThUS$) | (ThUS$) | ||||||||||
| Profit for the Year | 168,359 | 280,603 | 442,063 | |||||||||
| (+) Depreciation and amortization expenses | 203,629 | 201,351 | 219,091 | |||||||||
| (+) Finance costs | 82,199 | 76,939 | 57,807 | |||||||||
| (+) Income tax | 70,179 | 110,019 | 178,975 | |||||||||
| EBITDA | 524,366 | 668,912 | 897,936 | |||||||||
| (-) Other income | 26,893 | 18,218 | 32,048 | |||||||||
| (-) Other gains (losses) | (5,313 | ) | (383 | ) | 6,404 | |||||||
| (-) Share of Profit of associates and joint ventures accounted for using the equity method | 8,940 | 9,786 | 6,351 | |||||||||
| (+) Other Expenses by Function | 99,612 | 25,995 | 36,907 | |||||||||
| (+) Net impairment gains on reversal (losses) of financial assets | 4,684 | (1,057 | ) | 2,967 | ||||||||
| (-) Finance income | 13,715 | 26,289 | 22,533 | |||||||||
| (-) Currency differences | (4,423 | ) | (2,169 | ) | (16,597 | ) | ||||||
| Adjusted EBITDA | 579,482 | 644,223 | 881,137 | |||||||||
5.C. Research and Development, Patents and Licenses, etc.
One of the main objectives of our research and development team is to develop new processes and products in order to maximize the returns obtained from the resources that we exploit. Our research is performed by three different units, whose research topics cover all of the processes involved in the production of our products, including chemical process design, phase chemistry, chemical analysis methodologies and physical properties of finished products.
Our research and development policy emphasizes the following: (i) optimizing current processes in order to decrease costs and improve product quality through the implementation of new technology, (ii) developing higher-margin products from current products through vertical integration or different product specifications, (iii) adding value to inventories and (iv) using renewable energy in our processes.
Our research and development activities have been instrumental in improving our production processes and developing new value-added products. As a result, new methods of extraction, crystallization and finishing products have been developed. Technological advances in recent years have enabled us to improve process efficiency for the nitrate, potassium and lithium operations, improve the physical quality of our prilled products and reduce dust emissions and caking by applying specially designed additives to our products handled in bulk. Our research and development efforts have also resulted in new, value-added markets for our products. One example is the use of sodium nitrate and potassium nitrate as thermal storage in solar power plants.
| 78 |
We have patented several production processes for nitrate, iodine and lithium products. These patents have been filed mainly in the United States, Chile and in other countries when necessary. The patents used in our production processes include Chilean patent No. 47,080 for iodine (production of spherical granules of chemicals that sublime), and Japanese patent No. 4,889,848 for nitrates (granular fertilizers) and patent Nos. 41,838 from Chile, 5393-B and 5391-B from Bolivia, AR001918B1 and AR001916B1 from Argentina and 5,676,916 and 5,939,038 from the U.S. for lithium (removal of boron from brines).
5.D. Trend Information
Our revenues increased 5.0%decreased 6.5% to US$2,265.81,817.2 million in 20182020 from US$2,157.31,943.7 million in 2017.2019. Gross profit increased 2.6% toreached US$782.3482.9 million (26.6% of revenues) in 2018, which represented 34.5%2020, lower than US$560.1 million (28.8% of revenues, from US$762.5 millionrevenues) recorded in 2017, which represented 35.3% of revenues.2019. Profit attributable to controlling interests increased 2.8%decreased 40.8% to US$439.8164.5 million in 20182020 from US$427.7278.1 million in 2017.2019.
In January 2020 the World Health Organization deemed COVID-19 a global pandemic. In March 2020, the Chilean Ministry of Health (Ministerio de Salud) declared a nationwide State of Emergency. In response to the spread of COVID-19, the Chilean government has closed its borders for entry by non-resident foreigners for a specified period of time, prohibited the docking of cruise ships at Chilean ports, imposed quarantines on certain neighborhoods of the capital of Santiago and other cities and imposed a nationwide curfew. These measures have not impacted imports or exports to or from Chile. However, while we did see some impacts related to the shipment of products in and out of various other countries and regions, particularly in the first half of 2020 with the information available today, we believe impacts related to operations and demand on our products will be minimally impacted by COVID-19 in 2021.
Our Board and management continue to constantly monitor the situation and the potential impact that this unprecedented event could have on SQM. As a precaution, our management has implemented several measures to help reduce the spread COVID-19 at SQM, including the following measures to mitigate the spread in the workplace: (i) flexible working day together with the incentive to work from home in those cases where this is possible, (ii) avoidance of crowds, seminars and large meetings in the Company´s offices and operating facilities, (iii) strengthening of personal hygiene protocols (use of hand sanitizer, masks, etc.) and sanitation in plants, cafeterias and offices, and (iv) significant reductions in domestic and international travel, along with mandatory quarantines for people who have arrived from high risk destinations. We will continue to implement measures consistent with the evolving COVID-19 situation, with reference to governmental and international health organization guidelines,
Revenues from lithium and derivatives totaled US$383.4 million during 2020, a decrease of 24.2% compared to the US$505.7 million in 2019. During 2020, our sales volumes were 43% higher than sales volumes reported in 2019. This was in line with our strategy to increase our market participation in an effort to expand and maintain our relationship with important customers in the lithium market.
During 2020, we believe total lithium market demand reached approximately 330,000 metric tons, a 6% growth compared to 2019, but lower than demand growth originally expected as a result of COVID-19. However, we believe that market demand during the second half of the year was significantly higher than market demand in the second half of 2019, mostly related to growth of electric vehicle sales volumes. We believe that electric vehicle sales growth during 2020 increased over 40% when compared to 2019, and this growth reached approximately 120% during the fourth quarter 2020 when compared to the same period in 2019. We expect this momentum to continue into 2021 and believe that lithium demand growth will reach almost 25% in 2021, and ultimately reach between 900,000 to 1 million metric tons in 2025. Given these strong market growth indicators, our installed capacity and the quality of our production, we believe that our 2021 sales volumes will increase, reaching more than 80,000 metric tons for the year.
During the fourth quarter of 2020, our average price reached just over US$5,300/metric ton, similar to the average price seen during the third quarter of the same year. We believe that this could be the bottom of the decreasing pricing trend and that we could see higher prices during the first half of 2021.
We saw lowerremain particularly optimistic about the long-term growth of the lithium market. For this reason, we expect to increase our lithium carbonate and lithium hydroxide capacity significantly in the coming year. We expect our installed capacity of lithium carbonate and lithium hydroxide in Chile to reach approximately 180,000 and 30,000 metric tons by the end of 2023. In addition, in February 2021 our Board approved the investment for our 50% share of the development costs in the Mt. Holland lithium project, our 50/50 joint venture with Wesfarmers, which we expect will have an initial production capacity of 50,000 metric tons of battery grade lithium hydroxide.
Revenues from sales of iodine and derivatives during 2020 were US$334.7 million, a decrease of 9.8% compared to US$371.0 million generated in 2019. Our sales volumes in the lithiumiodine business line decreased 24% in 2018 compared2020, but we saw prices remain stable throughout the year, hovering around US$35/kilogram. Average prices in 2020 were 19% higher than the average prices seen in 2019.
Iodine and derivative market growth is particularly sensitive to 2017 asthe trends in the medical industry, specifically X-ray contrast media, the pharmaceutical industry and the LCD polarizing market. As a result of delayed completionthe spread of ramp-upCOVID-19, non-essential medical services declined during 2020, and we saw demand related to these important markets decrease, leading to a total market decrease of about 9% when comparing 2020 to 2019. We believe we will see a significant recovery during 2021 as the impact of the pandemic fades away, mostly led by the X-ray contrast media, LCD and pharmaceutical markets and we hope to increase market share during the year. We have announced plans to increase our lithium carbonate plant expansion to 70,000 metric tons. The lithium market continued its strong growth in 2018, with total demand growth surpassing 27% according to our estimates. Average pricescapacity in this business line were 25.6% higherto ensure that we have appropriate capacity available to meet future demand needs.
Revenues from the SPN business line in 2018 when2020 totaled US$701.7 million, a decrease of 3.1% compared to average prices seen during 2017. New supply is entering the market, which could impact our ability to maintain this price premium$723.9 million reported in 2019. However, there are several lithium grades of different qualities available in the lithium market, and not all products are sold at the same price. We do not believe that all lithium supply entering the market is suitable for all customers. We will focus on providing a high-quality grade lithium to our customers in 2019. We will also rebuild some inventories this year, and as a result of this, we believe our sales volumes in 2019 could be slightly higher than sales volumes seen in 2018. Demand growth in 2018 and continuing into 2019 was led by demand related to batteries for electric vehicles. We believe that full electric vehicle penetration rates reached 2% in 2018, and this number is expected to over double in the next five years. Demand in 2019 is expected to be at least 20% greater than total demand in 2018.
Our2019.Our sales volumes in the specialty plant nutrition business line increased 12.0% in 20182020 were similar to sales volumes reported during 2019, decreasing slightly by 0.5%. Average prices in this business lines decreased approximately 3% in 2020 when compared to 2017,2019. In the potassium nitrate market, demand growth was approximately 5% in 2020. We believe that this market growth was not impacted significantly because the fertilizer industry in some geographical markets was deemed an essential industry during the COVID-19 outbreak. In 2021, we expect to see similar demand growth. We analyze the potassium nitrate market by assessing, among other things, arable land availability, global crop production, and localized irrigation rates As an integrated producer of potassium chloride and potassium nitrate, the higher prices of potassium chloride we are seeing in the market should not have a significant impact on our production cost, while at the same time, our consolidated distribution network should help insulate us from some of the higher cost of transportation we are seeing in the market. Consequently, even though we believe we are the lowest cost producer in this market, we believe our competitive position in this market should be stronger in 2021.
Potassium chloride and potassium sulfate revenues for 2020 totaled US$209.3 million, a 1.3% decrease compared to the US$212.2 million reported in 2019. Revenues in this business line during 2020 were impacted by lower average prices when compared to 2019, which were flat, increasingnot offset by a mere 0.07%. As a result of the higher sales volumes our revenues in this business line increased by 12.1%. Higher sales volumes seen during 2018 were due to demand growth and limited supply from our competitors. We sell various products within this business line, and most of our specialty fertilizers are sold as either field fertilizers or water soluble fertilizers. Our strategy in this business line has been to focus primarily on the water-soluble fertilizer market, which in general yields higher margins and has more growth potential.
Our sales volumes in the iodine business line increased 5.1%line. We believe that the potassium chloride market surpassed 67 million metric tons in 2018. We also saw2020, an increase of approximately 3 million metric tons compared to 2019. Average prices increasefor potassium chloride during 2018; we closed the fourth quarter of 2020 were about US$244/metric ton, flat when compared to the third quarter of 2020. During the first two months of 2021 we have seen higher prices, letting us believe we will see higher prices throughout the rest of the year given the demand growth expected for 2021.
In October 2020, we announced our Sustainable Development Plan, which included voluntarily expanding our monitoring systems, promoting better and more profound conversations with average pricesneighboring communities and becoming carbon neutral and reducing water use by 65% and brine extraction by 50%. The reduction of almost US$26/kg, exceedingbrine extraction described above will not have an impact on our original expectations. Average pricescapacity to produce potassium salts to feed our potassium nitrate production in 2018 were 22.6% higher than the average prices seen in 2017. IncreasedCoya Sur. However, it will have an impact on our sales volumes and higher prices resulted in an increase of 28.9% in our revenues for this business line. Accordingavailable to our estimates, the global iodine demand grew slightly in 2018 reaching almost 36,300 MT and we increased our market share to over 36%.
Our sales volumesthird parties, gradually decreasing them year by year. Although in the potassium business line decreased by 38.1% in 2018 comparedfirst years of brine extraction we expect to 2017. These lower sales volumes weresee a minor impact on the Company's gross margin (as a result of our production limitations as we focused our production efforts inaccumulated inventories among other factors), the Salar de Atacamaaverage impact over the next ten years on increasing lithium yields. Furthermore, as a resultthe gross margin will be between US$25 million and US$30 million per year due to lower volumes of environmental compliance plan that was approved by the Chilean Environmental Authority (SMA) in January 2019, at the end of the year, we are temporarily extracting less brine than we had in the past. We had previously announced that potassium chloride and potassium sulfate sales volumes could decrease significantlyavailable for sale.
| 80 |
Industrial chemicals revenues in 2019 when2020 reached US$160.6 million, a 69.3% increase compared to 2018, we now believe that sales volumes for 2019 will be below 500,000 metric tons. Average pricesUS$94.9 million in the potassium chloride and potassium sulfate business line increased approximately 14.0% during 2018 when compared to 2017, reaching US$322/MT. The higher prices reflected the stronger global demand for potassium chloride in 2018, reaching almost 66 million metric tons.
2019. Our sales volumes in the industrial chemicals product line decreased 18.9%increased 82% in 20182020 compared to 2017,2019, as a result of lowerhigher sales volumes of solar salts. Solar saltsOur solar salt sales depend on the rampvolumes were up of the concentrated solar power plants (CSP) projects and weover 230% in 2020 when compared to 2019 reaching 160,000 metric tons. We expect ourindustrial chemical sales volumes in 20192021 will increase again when compared to be approximately 50,0002020, as we continue the delivery of almost 200,000 metric tons very similar to the 47,000of solar salts in 2021 for a project requiring over 400,000 metric tons sold in 2018.tons.
5.E. Off-Balance Sheet Arrangements
We have not entered into any transactions with unconsolidated entities whereby we have financial guarantees, retained or contingent interests in transferred assets, derivative instruments or other contingent arrangements that would expose us to material continuing risks, contingent liabilities, or any other obligations arising out of a variable interest in an unconsolidated entity that provides financing, liquidity, market risk or credit risk support to us or that engages in leasing, hedging or research and development services with us.
5.F. Tabular Disclosure of Contractual Obligations
The following tables show our material expected obligations and commitments as of December 31, 20182020 (in millions of US dollars):
| Less Than | 1 - 3 | 3 - 5 | More Than | |||||||||||||||||||||||||||||||||||||
| Total | 1 year | years | years | 5 years | Less Than | 1 - 3 | 3 - 5 | More Than | ||||||||||||||||||||||||||||||||
| ThUS$ | ThUS$ | ThUS$ | ThUS$ | ThUS$ | Total | 1 year | years | years | 5 years | |||||||||||||||||||||||||||||||
| Financial liabilities(1) | 1,682.5 | 65.5 | 360.1 | 543.3 | 713.6 | 2,844 | 95 | 606 | 405 | 1,738 | ||||||||||||||||||||||||||||||
| Operating leases | 2,051 | 188.6 | 338.5 | 338.5 | 1,185 | |||||||||||||||||||||||||||||||||||
| Operating leases (2) | 776 | 71 | 159 | 156 | 390 | |||||||||||||||||||||||||||||||||||
| Lease obligations | 35 | 6 | 14 | 7 | 7 | |||||||||||||||||||||||||||||||||||
| Purchase commitments | 59.9 | 59.9 | - | - | - | 56 | 56 | - | - | - | ||||||||||||||||||||||||||||||
| Staff severance indemnities | 28.2 | - | - | - | 28.2 | 32 | - | - | - | 32 | ||||||||||||||||||||||||||||||
| Total contractual obligations and commitments | 3,821.2 | 314 | 698.6 | 881.8 | 1,926.8 | 3,446 | 230 | 724 | 572 | 1,920 | ||||||||||||||||||||||||||||||
(1) Include short-term and long-term financial liabilities with interest calculated based on the contractual agreements and considering the effect of hedging financial instruments.
| (1) | Include short-term and long-term financial liabilities with interest calculated based on the contractual agreements and considering the effect of hedging financial instruments. |
| (2) | The majority of operating leases is related to the Lease Agreement with Corfo. |
(2) The purchase commitments held by the Company are recognized as a liability when the services and goods are received by the Company.
| (3) | The purchase commitments held by the Company are recognized as a liability when the services and goods are received by the Company. |
5.G. Safe Harbor
The information contained in Items 5.E and 5.F contains statements that may constitute forward-looking statements. See “Cautionary Statement Regarding Forward-Looking Statements” in this Annual Report, for safe harbor provisions.
| ITEM 6. | DIRECTORS, SENIOR MANAGEMENT AND EMPLOYEES |
6.A. Directors and Senior Management
We are managed by our executive officers under the direction of our Board of Directors, which, in accordance with our By-laws, consists of eight directors, seven of whom are elected by holders of Series A common shares and one of whom is elected by holders of Series B common shares. The entire Board of Directors is regularly elected every three years at our Ordinary Shareholders’ Meeting. Cumulative voting is allowed for the election of directors. The Board of Directors may appoint replacements to fill any vacancies that occur during periods between elections. If a vacancy occurs, the entire Board must be elected or re-elected at the next regularly scheduled Ordinary Shareholders’ Meeting. Our Chief Executive Officer is appointed by the Board of Directors and holds office at the discretion of the Board. The Chief Executive Officer appoints our executive officers. There are regularly scheduled meetings of the Board of Directors once a month. Extraordinary meetings may be called by the Chairman when requested by (i) the director elected by holders of the Series B common shares, (ii) any other director with the assent of the Chairman or (iii) an absolute majority of all directors. The Board of Directors has a Directors’ Committee and its regulations are discussed below.
| 82 |
Each of the sixeight members of the current Board of Directors was elected for a three-year term at the Annual Ordinary Shareholders’ Meeting that took place on April 27, 2018. Between January 1, 2018 and April 27, 2018, Messrs. Eugenio Ponce L., Gerardo Jofré M. and Fernando Massu T. served as Board members. Between January 1, 2018 and January 24, 2018, Robert Kirkpatrick and Joanne Boyes served as Board members. On January 24, 2018, Mr. Darryl Stann was appointed as a director replacing Ms. Joanne Boyes. On February 19, 2018, Mr. Mark F. Fracchia was appointed as a director replacing Mr. Kirkpatrick. On December 5, 2018, Messrs. Stann and Fracchia presented to the Board of Directors their resignations from the positions as directors of SQM. As a result of the resignations of Mr. Stann and Mr. Fracchia, there are currently two vacancies on the Board, and pursuant to the Company’s By-laws, the entire Board of Directors will be elected at the next Annual General Shareholders’ Meeting on April 25, 2019 for new three-year terms.2019.
Our current directors are as follows:
| Name | Position and relevant experience | Current position held since | |||
| Alberto Salas M. | Chairman of the Board and Director. Mr. Salas earned a degree in Mining Civil Engineering from the Universidad de Chile and holds a post-graduate degree in Corporate Finance from Adolfo Ibáñez University, Chile. He is a Board member of Cia. Minera Valle Central, | April 2018 | |||
| Patricio Contesse F. | Vice Chairman of the Board and Director. Mr. Contesse is a lawyer with a degree from | April 2018 | |||
| Georges de Bourguignion A. | Director. Mr. de Bourguignon is an economist with a degree from the Pontificia Universidad Católica de Chile, where he was a professor, and | April | |||
| 2019 | |||||
| Hernán Büchi B. | Director. Mr. Büchi earned a degree in Civil Engineering from the Universidad de Chile. He served on the SQM Board of Directors for several years until April 2016, before rejoining in 2017. He is currently a Board member of Quiñenco S.A. and S.A.C.I. Falabella, among others. He is also Chairman of the Board of Directors of the Universidad del Desarrollo. | April 2017 |
| 83 |
| Name | Position and relevant experience | Current position held since |
| Laurence Golborne R. | Director. Mr. Golborne earned a degree in Industrial Civil Engineering from the Universidad Católica de Chile. He is a member of the Board of Ripley Corp. S.A., | April 2018 |
| Gonzalo Guerrero | Director. Mr. Guerrero | SADP. | April 2017 | ||
| Francisco Ugarte L. | Director. Mr. Ugarte is a lawyer with a degree from the Universidad Católica de Chile and LL.M. from the Faculty of Law of the University of Chicago. He is a partner at Carey y Cía Ltda, the largest law firm in Chile. Mr. Ugarte has vast experience working with international and Chilean financial companies and institutions in mergers and acquisitions, financing, capital and debt offerings and other corporate matters. Mr. Ugarte holds and has held management positions in several local companies, such as Bci Corredor de Bolsa, Votorantim Andina and Compañía Industrial El Volcán. | April 2019 | |||
| Robert J. Zatta | Director. | April 2019 |
| 84 |
Our current executive officers are as follows:
| Name | Position and relevant experience | Current position held since | ||
| Ricardo Ramos R. | Chief Executive Officer. Mr. Ramos earned an industrial engineering degree from the Pontificia Universidad Católica de Chile. In 1989, he joined SQM as Finance Advisor and served as Chief Financial Officer and Vice President of Corporate Services from 1994 until 2018, before assuming his current role in January 2019. | January 2019 | ||
| Gerardo Illanes G.(2) | Chief Financial Officer. Mr. Illanes earned an engineering degree from the Universidad Católica de Chile and a Master of Business Administration from Emory | October 2018 |
| Gonzalo Aguirre T. | General Counsel. Mr. Aguirre earned a degree in law from the Universidad Católica de Chile and a Master of Laws (LL.M) degree from Georgetown University Law Center. He joined SQM in April 2016 and has served as Legal Vice President since September 2016. Prior to joining SQM, he worked at SunEdison as Head of Legal for Latin America and at AES Gener, where he served as a counsel on corporate and project matters. Prior to his in-house experience, he worked for Carey y Cía Ltda, Paul Hastings LLP (as an international legal consultant) and Vial and Palma, where his practice focused on corporate and financial matters. He is admitted to practice in Chile and in Washington, D.C., as a special legal consultant. | September 2016 | ||
| Pablo Altimiras C. | Vice President of Lithium and Iodine Business. Mr. Altimiras earned an engineering degree and a Master of Business Administration from the Universidad Católica de Chile. In 2007, he joined SQM as Chief of Logistics Projects. In 2009, he was promoted to Regulatory Affairs Director. He was Business Development Vice Manager from 2010 to 2011 and Development and Planning Manager in 2012. In 2016, he became Vice President of Business Development and Planning. | In 2018, he started his current role in the Company. | October 2018 | |
| José Miguel Berguño C.(3) | Vice President of Operations, Nitrates and Iodine. Mr. Berguño earned an engineering degree and Master of Business Administration from the Universidad Católica de Chile. In 1998, he joined SQM as Planning Engineer. In 2001, he served as Supply Chain Manager, and in 2006 he was Human Resources Manager. From 2010 to 2011, he was the National Director of Science under the Minister of Labor. In 2012, he was Human Resources Manager for Vitamina Work Life. In 2013, he resumed his role as Supply Chain Manager at SQM, and in 2016 took on the position of Vice President of Human Resources and Performance. In 2019, he became Vice President of | March 2019 | ||
Frank Biot | Vice President of Nitrates and Potassium Business Mr. Biot earned a Master in Applied Economics from the University of Antwerp in Belgium and a Master of Business Administration from the Catholic University of Leuven. In 1984, he joined Nitrate Corporation of Chile Ltd. in London. In 1991, he was promoted to President of SQM Europe at SQM’s regional headquarters for Europe, Africa, Asia and Oceania. In 2000, he assumed the position of Commercial Vice President Specialty Plant Nutrition. In 2016 he was appointed Senior Vice President Fertilizers, Regulatory Affairs, Quality and Logistics. He is currently President of SQM EUROPE N.V. and President of SQM INTERNATIONAL N.V. | October 2018 |
| Name | Position and relevant experience | Current position held since |
| Carlos Díaz O. | Vice President of Operations, Potassium and Lithium. Mr. Díaz earned an engineering degree and a Master of Business Administration from the Pontificia Universidad Católica de Chile. In 1996, he joined SQM as Planning Engineer in the Sales Division. He was promoted to Planning Manager in 1998. In 2002, he assumed the position of Deputy Financial Manager of the Commercial Offices. In 2006, he became our Logistics Manager, and in 2019 he became Vice President of Operations, Potassium and Lithium. | March 2019 | ||
María Ignacia Lopez B. | Public Affairs Manager. Ms. Lopez earned a journalism degree and Master of Strategic and Digital Media Communications from the University of Finis Terrae. She has over 15 years of experience working as an executive for various communications agencies. Ms. Lopez joined SQM in her current position in 2019. | October 2019 | ||
| Natalia Pizarro G. | ||||
| ||||
| Francisco Sanchez V. | Risk Management and Compliance Officer. | April 2019 | ||
| Rodrigo Vera D. | Vice President of Mining Operations, Mr. Vera earned an engineering degree and a Master of Business Administration from the Pontificia Universidad Católica de Chile. In 1999, he joined SQM as Controlling Engineer for Nitrates and Iodine Operations. He was promoted to Head of Planning in 2002. In 2010, he assumed the position of Technical Manager. In 2016, he became Research and Environmental Manager for Nitrates and Iodine Operations, and in 2019 he became Senior Development Director for Potassium and Lithium Operations. In 2020, he assumed the position of Vice President of Mining Operations. | March 2020 |
| (1) | As of December 31, |
| (2) | As of December 31, |
| (3) | As of December 31, |
6.B. Compensation
At the Ordinary Shareholders’ Meeting held on April 27, 2018,23, 2020, shareholders approved the compensation for the Audit and Financial Risk Committee, Corporate Governance Committee and the Safety, Health and Environmental Committee.
During 2018,2020, directors were paid a monthly retainer fee, which was independent of attendance and the number of Board sessions. For the Chairman and the Vice Chairman, the fee amounted to UF 400800 and UF 700 per month.month respectively. For the remaining sevensix directors, the fee amounted to UF 350600 per month. In addition, the directors received variable compensation (in Chilean pesos) based on a profit-sharing program approved by the shareholders. Both the Chairman and the Vice Chairman received the equivalent of 0.12%0.09% of the total net profit that the Company obtained during the 20182020 fiscal year and each of the remaining six directors received the equivalent of 0.06%0.045% of the 20182020 total net profit of the Company.
In addition, during 2018,2020, members of the Directors’ Committee were paid UF 113200 per month, regardless of the number of sessions held by the Directors’ Committee. The members of the Directors’ Committee also received variable compensation (in Chilean pesos) based on a profit-sharing program approved by the shareholders. Each member of the Directors’ Committee received an amount equal to 0.02%0.015% of the total net profit that the Company obtained in 20182020 fiscal year.
| 86 |
During 2018,2020, the members of the Safety, Health and Environmental and the Corporate Governance Committees received UF 50100 per month, regardless of the number of sessions held.
During 2018,2020, the compensation paid to each of our directors who served on the Board of Directors during the year was as follows (amounts in Chilean pesos):
| SQM Board Meeting (CH$) | SQM Directors' Committee (CH$) | SQM Health, Safety and Environment Committee (CH$) | Corporate Governance Committee (CH$) | SQMC Meeting | Total (CH$) | |||||||||||||||||||
| Alberto Salas Muñoz | 76,419,796 | 21,588,591 | 0 | 0 | 0 | 98,008,387 | ||||||||||||||||||
| Patricio Contesse Fica | 66,867,323 | 0 | 9,552,476 | 0 | 0 | 76,419,799 | ||||||||||||||||||
| Joanne L. Boyes | 126,839,873 | 42,726,820 | 0 | 0 | 0 | 169,566,693 | ||||||||||||||||||
| Hernán Büchi Buc | 248,591,324 | 21,588,590 | 6,725,916 | 16,278,392 | 0 | 293,184,222 | ||||||||||||||||||
| Mark Fracchia | 121,751,455 | 0 | 0 | 9,552,476 | 0 | 131,303,931 | ||||||||||||||||||
| Laurence Golborne Riveros | 66,867,323 | 21,588,591 | 0 | 0 | 0 | 88,455,914 | ||||||||||||||||||
| Gonzalo Guerrero Yamamoto | 243,231,561 | 0 | 14,938,485 | 0 | 0 | 258,170,046 | ||||||||||||||||||
| Gerardo Jofré Miranda | 181,723,866 | 61,695,408 | 0 | 6,725,916 | 0 | 250,145,190 | ||||||||||||||||||
| Robert A. Kirkpatrick | 126,839,873 | 0 | 0 | 2,681,154 | 0 | 129,521,027 | ||||||||||||||||||
| Fernando Massu Taré | 176,339,126 | 59,676,130 | 0 | 0 | 0 | 236,015,256 | ||||||||||||||||||
| Luis Eugenio Ponce Lerou | 430,139,181 | 0 | 0 | 0 | 9,790,063 | 439,929,244 | ||||||||||||||||||
| Arnfinn F. Prugger | 248,591,321 | 0 | 16,278,392 | 0 | 0 | 264,869,713 | ||||||||||||||||||
| Darryl Stann | 121,751,455 | 18,968,836 | 0 | 13,597,238 | 0 | 154,317,529 | ||||||||||||||||||
| Total | 2,235,953,477 | 247,832,966 | 47,495,269 | 48,835,176 | 9,790,063 | 2,589,906,951 | ||||||||||||||||||
| SQM Board Meeting (Ch$) | SQM Directors’ Committee (Ch$) | SQM Health, Safety and Environment Committee (Ch$) | Corporate Governance Committee (Ch$) | Total (Ch$) | ||||||||||||||||
| Alberto Salas Muñoz | 584,095,422 | 122,203,028 | — | — | 706,298,450 | |||||||||||||||
| Patricio Contesse Fica | 546,814,736 | — | 37,280,686 | 37,280,686 | 621,376,108 | |||||||||||||||
| Georges de Bourguignon Arndt | 349,623,119 | 116,541,040 | — | — | 466,164,159 | |||||||||||||||
| Hernán Büchi Buc | 366,609,083 | — | — | 37,280,686 | 403,889,769 | |||||||||||||||
| Laurence Golborne Riveros | 366,609,083 | 122,203,028 | — | — | 488,812,111 | |||||||||||||||
| Gonzalo Guerrero Yamamoto | 349,623,119 | — | 34,449,692 | — | 384,072,811 | |||||||||||||||
| Francisco Ugarte Larrain | 349,623,119 | — | — | 34,449,692 | 384,072,811 | |||||||||||||||
| Robert J. Zatta | 349,166,885 | — | 34,373,653 | — | 383,540,538 | |||||||||||||||
| Total | 3,262,164,566 | 360,947,096 | 106,104,031 | 109,011,064 | 3,838,226,757 | |||||||||||||||
For the year ended December 31, 2018,2020, the aggregate compensation paid to our 123124 principal executives based in Chile was US$27.922.9 million. We do not disclose to our shareholders or otherwise make available to the public information as to the compensation of our individual executive officers.
We maintain incentive programs for our employees based on individual performance, company performance and short-term indicators. We provide executives with an annual and a long-term bonus plan. Their incentives are based on target achievement, individual contribution to the Company’s operating results, and the Company’s performance. SQM also operates a compensation plan designed to retain its executives by providing bonuses linked to the Company’s share price.
| 87 |
As of December 31, 2018,2020, we had a provision related to all of the incentive programs in the aggregate of US$28.932.2 million.
We do not maintain any pension or retirement programs for the members of the Board of Directors or our executive officers in Chile.
6.C. Board Practices
Information regarding the period of time each of SQM’s current Directors has served in his office is provided in the discussion of each member of the Board of Directors above in Item 6.A. Directors and Senior Managers.
The date of expiration of the term of the current Board of Directors is April 2021.2022. The contracts of our executive officers are indefinite. The current Board of Directors was elected at the previous Annual Ordinary Shareholders’ Meeting held on April 27, 2018 for three year terms expiring in April 2021. However, due to the resignations of two directors in December 2018, the entire Board of Directors will be elected at the next Annual General Shareholders’ Meeting on April 25, 2019 for three year terms expiring in April 2022.
The members of the Board of Directors are remunerated in accordance with the information provided above in Item 6.B. Compensation. There are no contracts between SQM, or any of its subsidiaries, and the members of the Board of Directors providing for benefits upon termination of their term.
Directors’ Committee – Audit Committee
As required by Chilean Law, during 2018,2020, we had a Directors’ Committee (Comité de Directores) composed of three Directors, which performs many of the functions of an audit committee. Under the NYSE corporate governance rules, the audit committee of a U.S. company must perform the functions detailed in the NYSE Listed Company Manual Rules 303A.06 and 303A.07. Non-U.S. companies are required to comply with Rule 303A.06 but are not required to comply with Rule 303A.07.
Between January 1, 2018 and January 24, 2018,Since April 25, 2019, our Directors’ Committee washas been comprised of three Directors: Mr. Gerardo Jofré M., Mr. Fernando Massu T.Messrs. Georges de Bourguignon Arndt, Laurence Golborne Riveros and Ms. Joanne L. Boyes. Messrs. Messrs. Jofré and Massu metAlberto Salas Muñoz. Each of the three members meets the NYSE independence and Chilean independence requirements for audit committee members. Ms. Boyes, who was an executive officerMr. Salas holds the position of Nutrien (formerly PCS prior to the merger with Agrium Inc. on January 1, 2018) met the Chilean independence requirements for Directors Committee members, but not the NYSE independence standards for audit committee members and during her service on our Directors’ Committee, served as an observer on audit committee matters. On January 24, 2018, Ms. Boyes resigned from her position as director of SQM. On the same day, Mr. Darryl Stann was appointed as a director, replacing Ms. Boyes.
Since April 27, 2018, our Directors’ Committee was comprised of three Directors Mr. Hernán Büchi B., Laurence Golborne R. and Alberto Salas M. EachChairman of the three members met the NYSE and Chilean independence requirements for audit committee members.Directors’ Committee.
During 2018,2020, the Directors’ Committee of SQM (the “Committee”) analyzed (i) the Company’s Unaudited Financial Statements and Reports; (ii) the Company’s Audited Financial Statements and Reports; (iii) the Reports and proposals of external auditors, accounts inspectors and independent risk rating agencies for the Company; (iv) the proposal to SQM’s Board of Directors about the external auditors and independent rating agencies that the Board could recommend to the respective shareholders’ meeting for their subsequent appointment; (v) the tax and other services, other than audit services, provided by the Company’s external auditors and its subsidiaries in Chile and abroad; (vi) the remuneration and compensation plans for the Company’s main executives; (vii) the informationCompany’s risk matrix; (viii) the activity related to the Company’s operations as referred to in Title XVI of the Corporations Act; (viii)Company's compliance program; (ix) the report on internal control of the Company and (ix)(x) the various matters referred to in the Chapter titled “Directors’ Committee” included in SQM’s Financial Statements at December 31, 2018.2020.
Regarding the above, the Committee:
| (a) | Examined the information regarding the financial statements of SQM for the |
| (b) |
| Proposed to the Company’s Board of Directors the names of the External Auditors and the Independent Credit Rating Agencies for SQM and the Company’s Board of Directors, in turn, suggested their appointment to the respective Annual Ordinary Shareholders Meeting of SQM. The Company’s Board of Directors approved said suggestions and the Shareholders’ Meeting also ratified them. |
| Examined and approved the remuneration system and the compensation plans for the Company’s employees and senior executives. |
| 88 |
The Committee also (i) authorized the contracting by the Company of various consulting services with PwC on non-audit related matters, (ii) reviewed the expenses of the Company's CEO, and (iii) reviewed the reports from the Company’s internal audit and risk and compliance areas.areas, and (iv) examined the information presented by the External Auditors.
Finally, theThe Committee issued the Annual Management Report referred to in Law No. 18,046.
During 2020, the Company did not enter into related party transactions which require to follow the requirements and procedures established in title XVI of the Corporations Law, therefore the Committee was not required to examine information regarding related party transactions, but did review a potential transaction that was not entered into by the Company.
On April 27, 2018,23, 2020, the Annual General Shareholders’ Meeting of SQM approved an operational budget for the Committee; the operational budget is equivalent to the sum of the annual remunerationremunerations of the members of the Committee.Committee and US$250,000. The activities carried out by the Committee, as well as the expenses incurred by it, are disclosed at the General Shareholders Meeting. During 2018, the Committee incurred expenses of approximately US$680,400 related to the advisory services of Internal Audit and SOX Audit.
Article 50 bis of the Chilean Corporations Act states that the Committee should consist of three Directors, of which at least one member should preferably be independent from the controller (i.e., any person or entity who “controls” the company for Chilean law purposes), if any, and that their functions be remunerated.
Comparative Summary of Differences in Corporate Governance Standards
The following table provides a comparative summary of differences in corporate governance practices followed by us under our home-country rules and those applicable to U.S. domestic issuers pursuant to Section 303A of the New York Stock Exchange (NYSE) Listed Company Manual.
Listed Companies that are foreign private issuers, such as SQM, are permitted to follow home country practices in lieu of the provisions of Section 303A, except such companies are required to comply with the requirements of Section 303A.06, 303A.11 and 303A.12(b) and (c).
| Section | NYSE Standards | SQM practices pursuant to Chilean Stock Exchange regulations |
| 303A.01 | Listed companies must have a majority of independent directors. | There is no legal obligation to have a majority of independent directors on the Boardbut, according to Chilean law, the Company’s directors cannot serve as executive officers. |
| 303A.02 | No director qualifies as “independent” unless the Board of Directors affirmatively determines that the director has no material relationship with the listed company (either directly or as a partner, shareholder or officer of an organization that has a relationship with the company). In addition, a director is not independent if: (i) The director is, or has been within the last three years, an employee of the listed company, or an immediate family member is, or has been within the last three years, an executive officer, of the listed company. (ii) The director has received, or has an immediate family member who has received, during any twelve-month period within the last three years, more than $120,000 in direct compensation from the listed company, other than director and committee fees and pension or other forms of deferred compensation for prior service (provided such compensation is not contingent in any way on continued service). (iii) (A) The director is a current partner or employee of a firm that is the listed company’s internal or external auditor; (B) the director has an immediate family member who is a current partner of such a firm; (C) the director has an immediate family member who is a current employee of such a firm and personally works on the listed company’s audit; or (D) the director or an immediate family member was within the last three years a partner or employee of such a firm and personally worked on the listed company’s audit within that time. (iv) The director or an immediate family member is, or has been with the last three years, employed as an executive officer of another company where any of the listed company’s present executive officers at the same time serves or served on that company’s compensation committee. (v) The director is a current employee, or an immediate family member is a current executive officer, of a company that has made payments to, or received payments from, the listed company for property or services in an amount which, in any of the last three fiscal years, exceeds the greater of $1 million, or 2% of such other company’s consolidated gross revenues.
| A director would not be considered independent if, at any time, within the last 18 months he or she: (i) Maintained any relationship of a relevant nature and amount with the company, with other companies of the same group, with its controlling shareholder or with the principal officers of any of them or has been a director, manager, administrator or officer of any of them; (ii) Maintained a family relationship with any of the members described in (i) above; (iii) Has been a director, manager, administrator or principal officer of non-profit organizations that have received contributions from (i) above;
(iv) Has been a partner or a shareholder that has had or controlled, directly or indirectly, 10% or more of the capital stock or has been a director, manager, administrator or principal officer of an entity that has provided consulting or legal services for a relevant consideration or external audit services to the persons listed in (i) above;
(v) Has been a partner or a shareholder that has had or controlled, directly or indirectly, 10% or more of the capital stock or has been a director, manager, administrator or principal officer of the principal competitor, supplier or clients.
|
| 89 |
| Section | NYSE Standards | SQM practices pursuant to Chilean Stock Exchange regulations |
| 303A.03 | The non-management directors must meet at regularly scheduled executive sessions without management.
| These meetings are not needed given that directors cannot serve as executive officers.
|
| 303A.04 | (a) Listed companies must have a nominating/corporate governance committee composed entirely of independent directors. |
(b) The nominating/corporate governance committee must have a written charter that addresses: (i) the committee’s purpose and responsibilities – which, at minimum, must be to: identify individuals qualified to become board members, consistent with criteria approved by the board, and to select, or to recommend that the board select, the director nominees for the next annual meeting of shareholders; develop and recommend to the board a set of corporate governance guidelines applicable to the corporation; and oversee the evaluation of the board and management; and (ii) an annual performance evaluation of the committee. | This committee is not required as such in the Chilean regulations. However, pursuant to Chilean regulations SQM has a Directors’ Committee (see Board practices above). | |
| 303A.05 | Listed companies must have a compensation committee composed entirely of independent directors, and must have a written charter
| This committee is not required as such in the Chilean regulations. Pursuant to Chilean regulations, SQM has a Directors’ Committee (see Board practices above) that is responsible for reviewing management’s compensation.
|
303A.06
| Listed companies must have an audit committee that satisfies the requirements of Rule 10A-3 of the Securities Exchange Act of 1934, as amended.
| This committee is not required as such in the Chilean regulations. Pursuant to Chilean regulations, SQM has a Directors’ Committee that performs the functions of an audit committee and that complies with the requirements of the NYSE corporate governance rules.
|
| 303A.07 | The audit committee is subject to requirements that are in addition to Section 303A.06. This includes, among others, the following requirements: the audit committee must have a minimum of three members; all audit committee members must satisfy requirements of independence; the audit committee must have a written charter; each listed company must have an internal audit functionto provide management with ongoing assistance of the company’s risk management process and the system of internal controls.
| Pursuant to Section 303A.00, SQM is not required to comply with requirements in 303A.07. Pursuant to Chilean Regulations SQM has a
|
| 90 |
| Section | NYSE Standards | SQM practices pursuant to Chilean Stock Exchange regulations |
| 303A.08 | Shareholders must have the opportunity to vote on all equity-compensation plans and material revisions thereto. | SQM does not have equity compensation plans. However, as mentioned in Item 6.B. Compensation, SQM does have a long-term cash bonus compensation plan. Directors and executives may only acquire SQM shares by individual purchases. The purchaser must give notice of such purchases to the Company and the Financial Market Commission.
|
| 303A.09 | Listed companies must adopt and disclose corporate governance guidelines.
| Chilean law does not require that corporate governance guidelines be adopted. Directors’ responsibilities and access to management and independent advisors are directly provided for by applicable law. Directors’ compensation is approved at the annual meeting of shareholders, pursuant to applicable law.
|
| 303A.10 | Listed companies must adopt and disclose a code of business conduct and ethics for directors, officers and employeesand promptly disclose any waivers of the code for directors or executive officers.
| Not required in the Chilean regulations. SQM has adopted and disclosed aCode of Business Conduct and Ethics, available at the Company’s website, www.sqm.com.
|
| 303A.11 | Listed foreign private issuers must disclose any significant ways in which their corporate governance practices differ from those followed by domestic companies under NYSE listed standards.
| Pursuant to 303A.11, this table shows a comparative summary of differences in corporate governance practices followed by SQM under Chilean regulations and those applicable to U.S. domestic issuers pursuant to Section 303A.
|
| 303A.12 | Each listed company CEO must (a) certify to the NYSE each year that he or she is not aware of any violation by the listed company of NYSE corporate governance listing standards; (b) promptly notify the NYSE in writing after any executive officer becomes aware of any non-compliance with any applicable provisions of Section 303A; and (c) submit an executed Written Affirmation annually to the NYSE. In addition, each listed company must submit an interim Written Affirmation as and when required by the interim Written Affirmation form specified by the NYSE. The annual and interim Written Affirmations must be in the form specified by the NYSE.
| Not required in the Chilean regulations. The CEO must only comply with Section 303A.12 (b) and (c). |
| 303A.13 | The NYSE may issue a public reprimand letter to any listed company that violates a NYSE listing standard. | Not specified in the Chilean regulations. |
| 91 |
6.D. Employees
As of December 31, 2018,2020, we had 5,2905,507 permanent employees, 353427 of whom were employed outside of Chile. The average tenure of our permanent employees is approximately 6.46.9 years.
| As of December 31, | As of December 31, | |||||||||||||||||||||||
| 2018 | 2017 | 2016 | 2020 | 2019 | 2018 | |||||||||||||||||||
| Employees in Chile | 4,937 | 4,630 | 4,535 | 5,080 | 5,274 | 4,937 | ||||||||||||||||||
| Employees outside of Chile | 353 | 291 | 216 | 427 | 467 | 353 | ||||||||||||||||||
| Total employees | 5,290 | 4,921 | 4,751 | 5,507 | 5,741 | 5,290 | ||||||||||||||||||
As of December 31, 2018, 65%2020, 67% of our permanent employees in Chile were represented by 2220 labor unions, which represent their members in collective negotiations with us. Compensation for unionized personnel is established in accordance with the relevant collective bargaining agreements. The terms of such agreements currently in effect are three years, and expiration dates of such agreements vary from agreement to agreement. Under these agreements, employees receive a salary according to a scale that depends upon job function. Unionized employees also receive certain benefits provided by law and certain benefits provided under the applicable collective bargaining agreement, which vary depending upon the terms of the collective agreement, such as scholarships, holiday bonuses and additional health death and disability benefits, among others.
In addition, we own all of the equity of Institución de Salud Previsional Norte Grande Limitada (“Isapre Norte Grande”), which is a health care organization that provides medical services primarily to our employees, and of Sociedad Prestadora de Servicios de Salud Cruz de Norte S.A. (“Prestadora”), which is a hospital in María Elena. We make contributions to Isapre Norte Grande and to Prestadora in accordance with Chilean laws and the provisions of our various collective bargaining agreements, but we are not otherwise responsible for their liabilities.
Non-unionized employees receive individually negotiated salaries, benefits provided for by law and certain additional benefits which we provide.
We provide housing and other facilities and services for employees and their families at the María Elena site.
We do not maintain any pension or retirement programs for our Chilean employees. Most workers in Chile are subject to a national pension law, adopted in 1980, which establishes a system of independent pension plans that are administered by the corresponding Pension Fund Administrator (“Sociedad Administradora de Fondos de Pensiones”). We have no liability for the performance of any of these pension plans or any pension payments to be made to our employees. We do, however, sponsor staff severance indemnities plans for our employees and employees of our Chilean subsidiaries whereby we commit to provide a lump sum payment to each employee at the end of his/her employment, whether due to death, termination, or resignation.
Over 93%92% of our employees are employed in Chile, of which approximately 65%67% were represented by 2220 labor unions as of December 31, 2018.2020. As of December 31, 2018, we concluded renegotiations of 172020, 13 collective bargaining agreements with 14 unions. As a result, these collective bargaining agreements werehad been renegotiated forin advance, leaving the duration of three years.remaining seven to be renegotiated during 2021. We are exposed to labor strikes and illegal work stoppages by both our own employees and our independent contractors’ employees that could impact our production levels.levels in both our own plants and our independent contractors’ plants. If a strike or illegal work stoppage occurs and continues for a sustained period of time, we could be faced with increased costs and even disruption in our product flow that could have a material adverse effect on our business, financial condition and results of operations.
6.E. Share Ownership
We do not grant stock options or other arrangements involving the capital of SQM to directors, managers or employees. For more information on the shareholdings of current directors and executive officers, see “Item 6. Directors, Senior Management and Employees—Directors and Senior Management.”
| ITEM 7. | MAJOR SHAREHOLDERS AND RELATED PARTY TRANSACTIONS |
7.A. Major Shareholders
The following table shows certain information concerning beneficial ownership of the Series A and Series B common shares of SQM as of AprilMarch 1, 20192021 with respect to each shareholder known by us to beneficially own more than 5% of the outstanding Series A or Series B common shares. The following information is derived from our records and reports filed by certain of the persons named below with the CMF and the Santiago Stock Exchange.
| Shareholder | Number of Series A shares beneficially owned | % Series A shares | Number of Series B shares beneficially owned | % Series B shares | % total shares | |||||||||||||||
| Inversiones TLC Spa(1) | 62,556,568 | 43.80 | % | — | — | 23.77 | % | |||||||||||||
| Sociedad de Inversiones Pampa Calichera S.A.(2) (3) | 44,894,152 | 31.43 | % | 9,593,154 | 7.97 | % | 20.70 | % | ||||||||||||
| The Bank of New York | — | — | 32,210,049 | 26.76 | % | 12.24 | % | |||||||||||||
| Potasios de Chile S.A.(3) | 18,179,147 | 12.73 | % | — | — | 6.91 | % | |||||||||||||
| Banco de Chile por Cuenta de Terceros No Residentes | 177,468 | 0.12 | % | 10,683,956 | 8.88 | % | 4.13 | % | ||||||||||||
| Inversiones Global Mining Chile Ltda.(3) | 8,798,539 | 6.16 | % | — | — | 3.34 | % | |||||||||||||
| Banco Itau Corbanca por Cuenta de Inversionistas Extranjeros | — | — | 8,365,633 | 6.95 | % | 3.18 | % | |||||||||||||
| Banco Santander por cuenta de Inversionistas por extranjeros | — | — | 7,509,618 | 6.24 | % | 2.85 | % | |||||||||||||
| BanChile Corredora de Bolsa S.A. | 544,845 | 0.38 | % | 4,138,919 | 3.44 | % | 1.78 | % | ||||||||||||
| Inversiones La Esperanza Chile Limitada | 3,711,598 | 2.60 | % | 46,500 | 0.04 | % | 1.43 | % | ||||||||||||
| Shareholder | Number of Series A shares beneficially owned | % Series A shares | Number of Series B shares beneficially owned | % Series B shares | % total shares | |||||||||||||||
| Inversiones TLC Spa(1) | 62,556,568 | 43.80 | % | 5,516,772 | 4.58 | % | 25.86 | % | ||||||||||||
| The Bank of New York | — | — | 55,313,349 | 45.95 | % | 21.02 | % | |||||||||||||
| Sociedad de Inversiones Pampa Calichera S.A. (2) (3) | 44,894,152 | 31.43 | % | 1,222,971 | 1.02 | % | 17.52 | % | ||||||||||||
| Potasios de Chile S.A. (3) | 18,179,147 | 12.73 | % | — | — | 6.91 | % | |||||||||||||
| Inversiones Global Mining Chile Ltda. (3) | 8,798,539 | 6.16 | % | — | — | 3.34 | % | |||||||||||||
| Banco Santander por cuenta de Inversionistas por extranjeros | — | — | 7,232,404 | 6.01 | % | 2.75 | % | |||||||||||||
| Banco de Chile por cuenta de terceros no residentes | 321 | 0.00 | % | 7,173,450 | 5.96 | % | 2.73 | % | ||||||||||||
| Banco de Chile por cuenta de State Street. | 1,290 | 0.00 | % | 7,135,933 | 5.93 | % | 2.71 | % | ||||||||||||
(1) |
(2) | Sociedad de Inversiones Pampa Calichera S.A (“Pampa Calichera”) is a publicly held corporation whose shares are traded on the Santiago Stock Exchange. Originally, the shareholders of Pampa Calichera were employees of SQM. Pampa Calichera was formed to hold the capital stock of SQM contributed by such employees or later acquired in the open market. |
(3) | SQM has been informed that, as of As of March 1, 2020, SQM did not have a Controller Group. |
As of April 1, 2019, SQM did not have a Controller Group. However, prior to April 30, 2018, Pampa Group and Kowa Group (as defined below) had a Joint Operation Agreement that was signed on December 21, 2006 and allowed Pampa Group and Kowa Group to have the status of Controller Group of SQM.
As of April 1, 2019, Kowa Holdings America Inc., Inversiones La Esperanza (Chile) Limitada, Kochi S.A., and Kowa Company Ltd. (together, the “Kowa Group”) are owners of 2.11% of all shares in SQM (consisting of 5,457,634 Series A shares and 96,500 Series B shares). See also Note 6.2 to our Consolidated Financial Statements.
On December 5, 2018, Inversiones TLC SpA, acquired the shares of Inversiones El Boldo Limitada, Inversiones PCS Chile Limitada and Inversiones RAC Chile, representing 23.77% of the total shares of SQM.The stake held by Nutrien (formerly PCS before the merger with Agrium) as of December 31, 2018 was 0%. The stake held by PCS as of December 31, 2016 and 2015 was 32.00% of SQM’s total shares.
Pampa Group Agreement
On December 18, 2017, in connection with the Corfo Arbitration Agreement, the companies that are part of the Pampa Group entered into an agreement for the benefit of Corfo (the “Pampa Group Agreement”), which, among other things, providesprovided for: (i) the termination of the Joint Operation Agreement with Kowa Holdings America Inc., Inversiones La Esperanza (Chile) Limitada, Kochi S.A., and Kowa Company Ltd. (together, the “Kowa Group”), as owners of 2.11% of SQM’s total shares, that allowed the Pampa Group with the Kowa Group to have the status of a controller group of SQM, and (ii) an agreement to not enter into any joint action with third parties that allows Pampa Group to acquire the status of sole controller or joint controller, as defined by article 97 of the Chilean Securities Market Law. The obligations set forth in clause (ii) expire on December 31, 2030. In addition, the Pampa Group Agreement also includes numerous provisions relating to corporate governance and control. The effectiveness of the obligations of the parties to the Pampa Group Agreement is subject to the execution of the amendments of the Lease Agreement and the Project Agreement and the obtainment of all approvals under Chilean Law. See “Item 3.D. Risk Factors” and “Item 8.A.7 Legal Proceedings.” Neither SQM nor any of its subsidiaries, including SQM Potasio S.A. and SQM Salar, is a party to the Pampa Group Agreement. Upon termination of the Joint Operation Agreement pursuant to the Pampa Group Agreement, the Pampa Group and the Kowa Group would cease to be a Controller Group.controller group.
On November 30, 2018, the CMF determined that in accordance with the distribution of the shares of SQM, “the Pampa Group does not exert decisive power over the management of the Company and is therefore not considered a controlling shareholder”. The CMF could change its decision in the future if circumstances change.
Tianqi SettlementExtrajudicial Agreement with the Chilean National Economic Prosecutor’s Office (the “FNE”)FNE
In August 2018, after an investigation by the FNE in connection with the proposed acquisition by Tianqi of 23.77% of the Company’s Series A shares, Tianqi and the FNE entered into an extrajudicial settlement agreement (the “Settlement“Extrajudicial Agreement”) which implemented certain restrictive measures in order to (i) maintain the competitive conditions of the lithium market, (ii) mitigate the risks described in the SettlementExtrajudicial Agreement and (iii) limit Tianqi’s access to certain information of the Company and its subsidiaries, which are defined as sensitive under the SettlementExtrajudicial Agreement (“Sensitive Information”) (collectively, the “Purpose”). Pursuant to the SettlementExtrajudicial Agreement, Tianqi agreed that, among other things:
| Tianqi will not nominate any of its directors, executives or employees to the SQM Board of Directors; |
| Tianqi and the directors nominated by it will not influence or intervene for the benefit of Tianqi and prejudice the interests of SQM; |
| The directors nominated by Tianqi will not participate nor will they be part of any committees, the management or other decision-making bodies related to lithium of SQM or of any companies controlled by SQM, unless nominated by independent directors; |
| Tianqi will inform the FNE of any agreement in the lithium market, with Albemarle and/or SQM, prior to its execution; |
| Tianqi will notify the FNE of any event from which it acquires control or decisive influence in SQM; |
| Tianqi will disassociate any director, executive or employee appointed by third parties, who assumes a position described above in SQM; |
| Tianqi will not request access to |
| The directors nominated by Tianqi will not disclose |
| The directors nominated by Tianqi will personally bind themselves to the obligations assumed by Tianqi with the FNE; and |
| Tianqi will report to the FNE the appointments and periodic compliance with its obligations. |
| 94 |
The restrictions will remain in place for a period of six years.
During the approval process for the SettlementExtrajudicial Agreement before the FNE, the Company expressed its concerns to the Chilean Antitrust Court regarding the measures contained in the SettlementExtrajudicial Agreement, including that (i) it could not effectively resolve the risks that Tianqi and the FNE sought to mitigate, (ii) the restrictions are not correctly oriented to avoid the access to Sensitive Information that, in the possession of a competitor, could damage the Company and the proper functioning of the market and (iii) it could contradict the Chilean Corporations Act (Law No. 18,046 on Corporations). The SettlementExtrajudicial Agreement was approved in October 2018 by the Chilean Antitrust Court. A copy of the SettlementExtrajudicial Agreement, in Spanish, has been made publicly available on the Company’s website atwww.sqm.com and is also available on the FNE’s website athttp://www.fne.gob.cl
The Company believes that approximately 96.05%56.14% of its Series A shares and 51.10%33.30% of its Series B shares were beneficially held in Chile as of AprilMarch 1, 2019.2021. Approximately 1,5211,456 record holders were in Chile as of AprilMarch 1, 2019.2021.
Series A and Series B common shares have the same economic rights (i.e., both series are entitled to share equally in any dividends declared on the outstanding stock) and voting rights at any shareholders meeting, whether ordinary or extraordinary, with the exception of the election of the Board, in which the Series A shareholders elect seven members and the Series B shareholders elect one member.
Additionally, Series B common shares cannot exceed 50% of SQM’s issued, subscribed and paid shares; shareholders of at least 5% of this Series may call an Ordinary or Extraordinary Shareholders’ Meeting; and the director elected by this Series may request an extraordinary Board meeting without the authorization of the Chairman of the Board. These conditions will remain in effect until 2043. Under our By-laws, the maximum individual voting power personally and/or in representation of other shareholders per Series is limited to 37.5% of the subscribed shares of each Series with voting rights and 32% of the total subscribed shares with voting rights, with any excess being deducted from the number of shares such shareholder may vote. To calculate these percentages, shares that belong to the voting shareholder’s related persons must be added. In addition, the director elected by the Series B shareholders cannot vote in the election of the Chairman of the Board if a tie vote has occurred in the prior voting process. As of AprilMarch 1, 2019,2021, there were 142,819,552 Series A common shares and 120,376,972 Series B common shares outstanding.
On May 17, 2018, an extraordinary shareholders’ meeting approved technical changes to the By-laws of SQM, as well as an amendment providing for a new “second transitory article” as follows:
“Throughout the period running from the date of the extraordinary shareholders’ meeting at which this transitory article is incorporated, and December 31, 2030, the restriction against voting on behalf of more than 37.5% of any series of shares in the Company, established in Article 31 hereof, shall be subject to the following exception, applicable only to the election of board members by means of Series A shares in the Company: If two or more persons, regardless of whether or not they are related parties to each other (the incoming shareholders), act prior to December 31, 2030 such as to acquire a sufficient number of Series A shares to allow them to hold voting powers for the selection of directors of the Company amounting to more than 37.5% of that series, then any registered shareholder or group of shareholders holding more than 37.5% of all Series A shares in the Company shall be entitled to vote for the selection of directors of the Company amounting to whichever is less, between a number of the Series A shares that are held (i) by existing shareholders as of that date, and (ii) by the incoming shareholders with voting rights. Similarly, if for any reason a registered shareholder in the Company as of the date hereof who holds more than 37.5% of Series A shares in the company between the date hereof and December 31, 2030, comes to hold more voting shares for the selection of directors of the Company than the votes allocated for holding 37.5% of said Series A shares, either through a joint action agreement with other shareholders, including existing shareholders, or by any other means, then any other shareholder or group of shareholders in the Company that is not a related party to the same and holds more than 37.5% of all voting Series A shares in the Company, including both existing and incoming shareholders, shall be entitled to vote for the selection of directors of the Company in accordance with whichever number of Series A shares in the Company is the lesser, between (i) the number held by this shareholder or group of shareholders, and (ii) the existing shareholder may have the capacity to vote in excess of the restriction amounting to 37.5% of said shares.”
Pampa Group and Tianqi Shareholders’ Agreement
On April 10, 2019, the Pampa Group and Inversiones TLC SpA, a subsidiary of Tianqi, entered into a shareholders’ agreement, with respect to certain corporate governance matters. The matters addressed by the shareholders’ agreement include: (i) the management of the business and affairs of the Company by the Board of Directors, (ii) the election of replacement directors in the event of resignation of any of the directors elected by each party’s nomineesparty to the Board of Directors as a director elected by the Series A, shareholders, (iii) election of certain of Tianqi’s director nomineesdirectors elected by Tianqi to the Company’s Directors’ Committee, Corporate Governance Committee and Safety, Health and Environmental Committee, (iv) access for Tianqi’s internal or external auditors to SQM’s management and internal and external auditors for purposes of fulfilling Tianqi’s accounting and disclosure obligations with respect to its investment in SQM, (v) support for having a bilingual (Spanish/English) translator attend all SQM Board and Committee meetings to assist directors who are not bilingual and (vi) support of the Company’s dividend policy for 2019, as proposed by the Board of Directors in March 2019 for approval at the 2019 annual ordinary shareholders’ meeting. The agreement has a term of one year. An English language copy of the agreement is included in an essential fact (hecho esencial)(hecho esencial) filing made by Sociedad de Inversiones Pampa Calichera S.A. with the CMF on April 11, 2019 and is available on the CMF’s website atwww.cmfchile.cl.
| 95 |
On March 26, 2020, the Pampa Group and Inversiones TLC SpA amended the shareholders’ agreement entered into on April 10, 2019 to (i) extend the term to the earliest of (A) our 2021 annual ordinary shareholders’ meeting or (B) written notice of termination given by the Pampa Group or Tianqi in the event that a director nominated by the non-notifying party ceases to serve as a director for any reason and (ii) to agree to support the Company’s 2020 dividend policy, as proposed by the Board of Directors for approval at the 2020 annual ordinary shareholders’ meeting. An English language copy of the amendment is included in an essential fact (hecho esencial) filing made by Sociedad de Inversiones Pampa Calichera S.A. with the CMF on March 26, 2020 and is available on the CMF’s website at www.cmfchile.cl.
7.B. Related Party Transactions
Title XVI of the Chilean Corporations Act regulates transactions with related parties for publicly held corporations and its related parties.
Articles 146 to 149 of the Chilean Corporations Act requires that our transactions with related parties (i) have as their purpose to contribute to SQM’s interests (ii) be on price, terms and conditions similar to those customarily prevailing in the market at the time of their approval and (iii) satisfy the requirements and procedures established by the Chilean Corporations Act. Violation of such articles may also result in administrative or criminal sanctions and civil liability may be sought by SQM, shareholders or interested third parties that suffer losses as a result of such violations.
In addition, article 89 of the Chilean Corporations Act requires that transactions between affiliates, subsidiaries or related parties of a closed-stock company, such as some of SQM’s main affiliates and subsidiaries, shall also be on terms similar to those customarily prevailing in the market. Directors and executive officers of companies that violate article 89 are liable for losses resulting from such violations.
With respect to SQM, operationstransactions with related parties include negotiations, proceedings, contracts or operationstransactions involving SQM and its directors, managers and officers, and their spouses and relatives, and other companies and persons connected to the abovementioned parties or mentioned in the By-laws or by the Directors’ Committee. Such operationstransactions may only be carried out if (i) their objective is to contribute to SQM’s interests and if their price, terms and conditions conform to prevailing market prices, terms and conditions at the time of their approval and (ii) they satisfy the requirements and procedures established by the Chilean Corporations Act. Such requirements include, among others:
| · |
| · | that the Board of Directors, excluding any Directors involved in the |
| · | that the grounds for the decision and for the exclusion be recorded in the respective minutes of the Board meeting; and |
| · | that the agreement and the names of the directors who approved the same be reported at the next shareholders’ meeting. Infractions will not affect the validity of the |
However, the Board of Directors may authorizehas authorized the following operationstransactions with related parties to be carried out without following such requirements and procedures, as long as such authorization is obtained in advance: (a) operationstransactions wherein the amount of the transaction is not significant or (b) operationstransactions that, according to the general policiespolicy on customary practices determined by the Board of Directors,transactions with related parties, are considered normal based on SQM’s business activities or (c) operationstransactions carried out between legal entities wherein SQM holds at least a 95% ownership interest in the counterpart.
Accounts receivable from and payable to related companies are stated in U.S. dollars and accrue no interest. Other than the above, transactions are made under terms and conditions that are similar to those offered to unrelated third parties. We further believe that we could obtain from third parties all raw materials now being provided by related parties that are not our affiliates. The provision of such raw materials by new suppliers could initially entail additional expenses.
In each case, terms and conditions vary depending on the transaction pursuant to which it was generated.
The Company regularly enters into business arrangements with related parties, principally its joint ventures and associates, which are described in Note 9 to our Consolidated Financial Statements.
7.C. Interests of Experts and Counsel
Not applicable.
| ITEM 8. | FINANCIAL INFORMATION |
8.A. Consolidated Statements and Other Financial Information
8.A.1See “Item 18. Financial Statements.”
8.A.2See “Item 18. Financial Statements.”
8.A.3See “Item 19. Exhibits—Index to Financial Statements—Reports of Independent Registered Public Accounting Firm.”
8.A.4Not applicable.
8.A.5Not applicable.
8.A.6 Export Sales
We derive most of our revenues from sales outside of Chile. The distribution of sales presented below reflects the location of the Company’s subsidiaries making such sales and does not necessarily reflect the final destination of the products sold.
The following is the composition of the consolidated sales for the periods ending on December 31, 2018, 20172020, 2019 and 2016:2018:
| Th. US$ | 2018 | 2017 | 2016 | 2020 | 2019 | 2018 | ||||||||||||||||||
| Foreign sales | 2,076,454 | 2,013,111 | 1,776,845 | 1,663,446 | 1,731,798 | 2,076,454 | ||||||||||||||||||
| Total sales | 2,265,803 | 2,157,323 | 1,939,323 | 1,817,919 | 1,943,655 | 2,265,803 | ||||||||||||||||||
| Foreign sales % | 91.6 | % | 93.3 | % | 91.6 | % | 91.5 | % | 89.1 | % | 91.6 | % | ||||||||||||
8.A.7 Legal Proceedings
Chilean InvestigationsDeferred Prosecution Agreement
The SII has conducted investigations related to the payment of invoices by SQM and its subsidiaries, SQM Salar and SQM Industrial S.A., for services that may not have been properly supported or that may not have been necessary to generate corporate income. The Chilean Public Prosecutor also has conducted related inquiries to determine whether such payments may be linked with alleged violations by SQM, these subsidiaries and public officials of political contribution or anti-corruption laws.
On February 26, 2015, SQM’s Board of Directors resolved to establish an ad-hoc Committee authorized to conduct an internal investigation relating to the issues that were the subject of the SII and the Chilean Public Prosecutor investigations and to retain such independent external advice as it deemed appropriate.
The ad-hoc Committee engaged its own lawyers from Chile and the U.S. and forensic accountants from the U.S. to assist with its internal review. The U.S. lawyers retained by the ad-hoc Committee were principally charged with reviewing the relevant facts and analyzing those facts against the requirements of the FCPA. The factual findings of the ad-hoc Committee, however, were ultimately shared with Chilean as well as U.S. authorities.
On March 16, 2015, the Board of Directors decided to terminate the employment contract of the Company’s then-current CEO, Patricio Contesse G. This followed his failure to cooperate with the ad-hoc Committee’s investigation relating to the issue that were the subject of the SII and the Chilean prosecutor investigations.
On March 20, 2015, the Company identified to the SII approximately US$11 million in payments of invoices that may not have been properly supported by services rendered or that may not qualify as tax expenses under the Chilean tax code. These payments originated from the office of the former CEO, Patricio Contesse G., during the six-year tax period from 2009 to 2014. As a result, the Company subsequently submitted amendments to its tax returns for the 2009 to 2014 tax years and thereafter paid taxes and interest relating to such amended returns totaling approximately US$7 million. On April 24, 2015, the Company announced that it had identified up to an additional US$2 million in payments by its subsidiary SQM Salar S.A. during the same six-year tax period that were also authorized by Mr. Contesse, the former CEO, and that may be deemed not properly supported by services rendered or that may not qualify as tax expenses under the Chilean tax code. Subsequently, SQM Salar S.A. filed amended tax returns and paid taxes and interest relating to such amended returns totaling approximately US$1.2 million. On August 14, 2015, the Company announced that it had identified to the SII approximately US$1.6 million in additional payments by SQM and its subsidiary SQM Industrial S.A. that may be deemed not properly supported by services rendered or that may not qualify as tax expenses under the Chilean tax code. SQM and SQM Industrial S.A. subsequently filed amended tax returns and, in early 2016, SQM Industrial S.A. paid taxes and interest relating to such amended returns totaling approximately US$0.3 million, and SQM paid taxes and interest relating to such amended returns totaling approximately US$1.3 million. The statute of limitations under Chilean law for tax claims is up to six years, during which period the former CEO, Mr. Contesse, had an annual discretionary budget covering the Company and its subsidiaries of approximately US$6 million.
On March 23, 2015, the SII, based on the Income Tax Law (Ley de Impuesto a La Renta)filed a criminal claim against the Company’s former CEO, Mr. Contesse, and the then-current CEO, Patricio de Solminihac, as well as the then-current CFO (now CEO), Ricardo Ramos, in their capacities as the Company’s tax representatives relating to part of the payments referred to above. Apart from the lawsuits and investigations that continue against the former CEO, Mr. Contesse, this and subsequent related similar claims filed by the SII against these officers and third parties have been dismissed by the Chilean Public Prosecutor.
On March 31, 2015, the CMF filed an administrative claim against five current or former members of the Board of Directors, alleging that they did not release information in a timely manner relating to the payments that are subject to the tax claim referred to above. On September 30, 2015, the CMF proceeded to fine the three current and the two former members of the Board of Directors UF1,000 each (approximately US$36,000). They are currently appealing this decision to the Chilean courts.
On April 30, 2015, the Chilean Public Prosecutor, after reviewing the claims filed by the SII, informed the Company’s former CEO, Mr. Contesse, that it was formally investigating allegations that he approved the payment of invoices that may not be properly supported by services rendered or that may not qualify as tax expenses under the Chilean tax code and in connection therewith made intentionally false or incomplete declarations or used fraudulent procedures designed to conceal or disguise the true amount of transactions or to circumvent taxes. If he is finally adjudicated responsible, the Company may also be subject to the payment of a fine by the Chilean Criminal Court totaling 50% to 300% of the taxes paid. The Company believes that there is no legal basis for these claims, and believes no provision is needed at this stage.
On May 11, 2015, the SII filed an additional criminal claim against the former CEO and the then-current CEO, Mr. de Solminihac, as well as the then-current CFO (now CEO), Mr. Ramos, in their capacities as the Company’s tax representatives alleging violations of the Chilean Inheritance and Donations Law (Ley sobre Impuesto a Las Herencias, Asignaciones y Donaciones). The claim states that the Company paid two invoices in 2009 and 2010 totaling approximately US$175,000 that are alleged to have been improperly supported. The claim states that these payments should have been classified as donations, and appropriate taxes should have been paid. These payments were accounted for in the amended tax returns filed with the SII. Subsequently, the SII filed a number of additional claims against these officers and third parties alleging violations of Chilean Tax Law and the Chilean Inheritance and Donations Law. The most recent of these criminal claims was filed by the SII on March 9, 2016. All of the claims against the then-current CEO, Mr. de Solminihac, and the then-current CFO (now CEO), Mr. Ramos, have been dismissed by the Chilean Public Prosecutor.
During 2015, the ad-hoc Committee that was established in February 2015 conducted an investigation into whether the Company faced possible liability under the FCPA. The ad-hoc Committee engaged its own separate counsel, Shearman & Sterling LLP, which presented a report to the Board of Directors on December 15, 2015.
Following the presentation by the ad-hoc Committee of its findings to the Board of Directors, the Company voluntarily shared the findings of the ad-hoc Committee investigation with authorities in Chile and the U.S. (including the SEC and the DOJ).
On January 13, 2017, the Company and the DOJ reached agreement on the terms of a DPA that would resolve the DOJ’s inquiry based on alleged violations of the books and records and internal controls provisions of the Foreign Corrupt Practices Act.Act in connection with certain payments made by SQM between the tax years 2009 to 2015 for services that may not have been properly supported or that may not have been necessarily to generate corporate income. Among other terms, the DPA callscalled for the Company to pay a monetary penalty of US$15,487,500 and engage a compliance monitor for a term of two (2) years. UponOn January 19, 2021, after successful completion of the three (3) year term of the DPA and the DOJ’s motion to dismiss, all charges against the Company would bewere dismissed. On the same date, the SEC agreed to resolve its inquiry through an administrative cease and desist order, arising out of the alleged violations of the same accounting provisions of the FCPA. Among other terms, the SEC order calls for the Company to pay an additional monetary penalty of US$15 million. These penalties were reflected in the Company’s 2016 consolidated financial statements. In the consolidated statement of cash flows, a payment of US$30 million made to the DOJ and SEC was presented in the line item Other payments related to operating activities.
On January 26, 2018, the Eight Lower Criminal Court of Santiago approved a deferred prosecution agreement proposed by the Chilean Public Prosecutor, relating to SQM and its subsidiaries SQM Salar and SQM Nitratos S.A., to suspend an investigation against these entities related to possible corruption issues and responsibility for the lack of supervision and management. Under the deferred prosecution agreement, SQM, SQM Salar and SQM Nitratos S.A., have not admitted responsibility in the matter subject to the investigation but agreed to pay an aggregate amount of (i) Ch$900,000,000 to the Chilean government, and (ii) Ch$1,650,000,000 to various charitable organizations. As of January 26, 2018, these amounts were equivalent to approximately US$1.5 million and US$2.8 million, respectively, and were accrued in the Company’s 2017 consolidated financial statements. In addition, the companies have agreed to provide the Chilean Public Prosecutor with a report on the enhancements to their compliance program, implemented in recent years, with special emphasis on the incorporation of best practices in various jurisdictions. On August 17, 2018, the Eighth Lower Criminal Court of Santiago considered the conditions and decided to terminate the legal process.
In the event that the applicable regulatory authorities believe that the terms of the DPA or the deferred prosecution agreement with the Chilean Public Prosecutor are not complied with, it is possible that such regulatory authorities may reinstate the suspended proceedings against us and may bring further action against us, including in the form of additional inquiries or legal proceedings. Responding to our regulators’ inquiries and any future civil, criminal or regulatory inquiries or proceedings diverts our management’s attention from day-to-day operations. Additionally, expenses that may arise from responding to such inquiries or proceedings, our review of responsive materials, any related litigation or other associated activities may continue to be significant. Current and former employees, officers and directors may seek indemnification, advancement or reimbursement of expenses from us, including attorneys’ fees, with respect to the current inquiry or future proceedings related to this matter.
Class Actions
SinceIn October 2015, a consolidated class action lawsuit has been pendingwas brought against the Company in the United States District Court for the Southern District of New York, alleging violations of the U.S. securities laws in connection with the subject matter of the investigations of the payments described above. The complaint allegesalleged that certain statements made by the Company, principally in the Company’s SEC filings and press releases, were materially false and/or misleading in violation of Section 10(b) of the Securities Exchange Act of 1934 (the “Exchange Act”) and Rule 10b-5 promulgated thereunder. Specifically, the complaint challenges certain of the Company’s statements concerning its compliance with applicable laws and regulations; the effectiveness of its internal controls; its adoption of a code of ethics consistent with SEC requirements; its revenues and taxes owed; and its compliance with applicable accounting standards. The complaint also allegesalleged that the Company made inadequate disclosures concerning the status of the Corfo litigation described below. The lead plaintiff seekssought damages of an undetermined amount to recover the economic losses allegedly suffered by the class as a result of the challenged statements.
On March 30, 2016, the Company filed a motion to dismiss the complaint under the doctrine offorum non conveniens or, alternatively, pursuant to Rules 9(b) and 12(b)(6) of the Federal Rules of Civil Procedure for failure to state a claim under Section 10(b) of the Exchange Act. Briefing on that motion to dismiss was completed on June 29, 2016. On March 28, 2017, the district court issued an opinion and order denying in part and granting in part the motion to dismiss. The district court denied the motion to dismiss under the doctrine offorum non conveniens; denied the motion to dismiss for failure to state a claim with respect to the statements concerning legal compliance, internal controls, and financial reporting and accounting; and granted the motion to dismiss for failure to state a claim with respect to the statements concerning the Company’s code of ethics and the status of the Corfo litigation.
On January 10, 2018, the lead plaintiff filed a motion to certify a class consisting of all persons who purchased SQM ADSs between June 30, 2010 and March 18, 2015, and such motion remains pending before the court.
Corfo Litigation
Our subsidiary SQM Salar holds exclusive and temporary exploitation rights to mineral resources in 81,920 hectares in the Salar de Atacama pursuant to (i) the Lease Agreement, and (ii) the Project Agreement. The mining exploitation concessions related to such rights are owned by Corfo and leased to SQM Salar in exchange for quarterly lease payments to Corfo based on specified percentages associated to the value of the products resulting from the minerals extracted from such concessions. For the year ended December 31, 2018, revenues related to products originating from the Salar de Atacama represented 44% of our consolidated revenues, consisting of revenues from our potassium business line and our lithium and derivatives business line for the period. All of our products originating from the Salar de Atacama are derived from our extraction operations under the Lease Agreement. As of December 31, 2018, only 12 years remain on the term of the Lease Agreement and we had extracted approximately 23% of the total permitted accumulated extraction and sales limit of lithium.
In May 2014, Corfo initiated an arbitration proceeding against SQM Salar alleging (i) SQM Salar had incorrectly applied the formulas to determine lease payments resulting in an underpayment to Corfo of at least US$8.9 million for 2009 through 2013 and (ii) SQM Salar had not complied with its obligation to protect the mining rights of Corfo by failing to construct or replace markers to delineate property lines. Based on the alleged breaches of the Lease Agreement, Corfo sought (i) at least US$8.9 million plus any other amount that may be due in respect of periods after 2013, (ii) early termination of the Lease Agreement, (iii) lease payments that would have been paid through 2030 as compensation for the early termination of the Lease Agreement and (iv) punitive damages (daño moral) equal to 30% of the contractual damages awarded.
In August 2016, Corfo initiated a second arbitration proceeding, demanding (i) the early termination of the Project Agreement signed between Corfo, SQM Potasio S.A., SQM Salar, and the Company, (ii) the dissolution of SQM Salar and (iii) the early termination of the Lease Agreement for alleged breaches of the Project Agreement. In addition, Corfo demanded SQM Salar return (i) the assets Corfo contributed to it under a condition subsequent, (ii) the OMA mining properties and the aquifers included in the Lease Agreement, (iii) the water rights granted to SQM Salar and (iv) the legal mining easements identified in the lawsuit. Finally, Corfo requested that the defendants pay damages as a result of the breaches alleged in the lawsuit.2015.
On January 17, 2018, Corfo, SQM Salar and SQM Potasio S.A. entered intoDecember 11, 2020, the Corfo Arbitration Agreement to (i) terminate the arbitration proceedings and (ii) amend the Lease AgreementCompany and the Project Agreement.lead plaintiff, the Council of the Borough of South Tyneside, acting in its capacity as the Administering Authority of the Tyne and Wear Pension Fund, filed before the United States District Court of the Southern District of New York a Stipulation of Settlement of the class action litigation. The agreementclass action settlement resolves the claims by class plaintiffs relating to amendalleged noncompliance with the Lease Agreement forsecurities laws and regulations in the Salar de Atacama concessionUnited States in connection with certain disclosures made by the Company. Pursuant to the Stipulation of Settlement, SQM paid US$62.5 million. The Stipulation of Settlement is subject to final approval by the court and the Project Agreement seeksfinal settlement hearing is expected to reflect, among other terms,take place during the following: (i) an increase in lease payments by increasing the lease rates associated with the salesecond quarter of the different products produced in the Salar de Atacama; (ii) a commitment by SQM Salar to contribute (a) between US$10.8 and US$18.9 million per year to research and development efforts, (b) between US$10 to US$15 million per year to the communities in close proximity to the Salar de Atacama, and (c) 1.7% of total annual sales of SQM Salar to regional development; (iii) the authorization by Corfo to increase the production and sales of lithium products produced in the Salar de Atacama up to 349,553 metric tons of lithium metallic equivalent (1,860,670 tons of lithium carbonate equivalent), which is in addition to the approximately 64,816 metric tons of lithium metallic equivalent (345,015 tons of lithium carbonate equivalent) remaining from the originally authorized amount; (iv) an obligation of SQM Salar to offer part of its lithium production (up to a maximum of 25%) at a preferential price to value-added producers that will potentially develop in Chile; (v) an obligation of SQM Salar to strengthen its corporate governance by incorporating various audit, environmental control and coordination mechanisms with Corfo, which shall be set forth in amendments to the By-laws of SQM Salar, including among others: (a) incorporating specific rules for the management of the company, including that two of the directors of SQM Salar are independent and meet the requirements established for independent directors of a public company and (b) requiring the Board of Directors of SQM Salar to designate a committee to monitor compliance with the Lease Agreement and the Project Agreement and to establish the regulations that will govern this committee and its functions; (vi) extensive regulation regarding the return of assets upon termination of the contracts and granting purchase options; and (vii) prohibitions against the sale of lithium brine extracted from leased mining concessions by the Company, SQM Salar and SQM Potasio S.A. These amendments were subject to the issuance of the applicable resolutions of the Office of the Comptroller General of the Republic (Contraloría General de la República) and the CCHEN.2021.
On February 15, 2018 and February 16, 2018, the Atacamenos Indigenous Organization (Consejo de Pueblos Atacamenos) initiated legal actions challenging the amendments of the Lease Agreement and the Project Agreement. The legal actions are pending before the Supreme Court of Chile.
SQMNA Litigation
In October 2010, the City of Pomona, California, named SQM North America Corporation (“SQMNA”) and SQM as defendants in an action filed in the California Superior Court for Los Angeles County.County (the “Pomona Case”). In this matter, the plaintiff seeks damages for alleged groundwater contamination from the use of defendant’sdefendants’ fertilizer products. The plaintiff subsequently withdrew its lawsuit against SQM. The case was removed to the U.S. District Court for the Central District of California and on June 10, 2015, the jury rejected the lawsuit against SQMNA, and the plaintiff filed an appeal which was granted by the Ninth Circuit Court of Appeals. The matter has beenwas then remanded to the District Court for a complete re-trial.retrial. On May 17, 2018, after a new trial in the District Court, a jury ruled in favor of SQMNA. On September 14, 2018, the plaintiff filed an appeal, which is pending resolution beforeand on February 6, 2020, the Ninth Circuit Court of Appeals.Appeals ordered a retrial before the District Court. The retrial before the District Court is scheduled for May 4, 2021.
In October 2010, the City of Lindsay, California, named SQM and SQMNA as defendants in an action filed in the California Superior Court for Tulare County. In this matter, the plaintiff seeks damages for alleged groundwater contamination from the use of defendant’sdefendants’ fertilizer products. This case was removed to the U.S. District Court for the Eastern District of California and is pending in the trial court. SQMNA and SQM (if it is legally served) intend to vigorously defend this action. The proceeding has been suspended, pending the outcome of the Pomona case.Case. SQMNA and SQM intend to vigorously defend this action.
| 98 |
Other Matters
In addition, various lawsuits, claims and proceedings, other than those specifically disclosed above, have been or may be instituted or asserted against the Company, relating to the conduct of the company’s business, including those pertaining to mining, civil, tort, commercial, labor and regulatory matters, among others. Although the outcome of other litigation cannot be predicted with certainty, and some lawsuits, claims or proceedings may be disposed of unfavorably to the Company, our management believes the disposition of such other pending matters will not have a material effect on the company’s business, financial condition, results of operations or cash flows.
8.A.8. Dividend Policy
As required by Chilean law and regulations, our dividend policy is decided upon from time to time by our Board of Directors and is announced at the Annual Ordinary Shareholders’ Meeting, which is generally held in April of each year. Shareholder approval of the dividend policy is not required. However, each year the Board must submit the declaration of the final dividend or dividends in respect of the preceding year, consistent with the then-established dividend policy, to the Annual Ordinary Shareholders’ Meeting for approval. As required by the Chilean Companies Act, unless otherwise decided by unanimous vote of the holders of issued shares, we must distribute a cash dividend in an amount equal to at least 30% of our consolidated net income for that year (determined in accordance with CMF regulations), unless and to the extent the Company has a deficit in retained earnings.
On March 28, 2018,25, 2020, the Board of Directors, agreed to recommend to the shareholders the payment of a definitive dividend representing 100% of the 20172019 net income and theincome. The dividend payment of a special dividend (dividendo eventual) of US$100 million to be charged against the retained earnings. These dividend payments werewas presented for consideration at the Annual General Shareholders’ Meeting held on April 27, 2018.23, 2020. The amount of the definitive dividend approved by shareholders at the Annual General Shareholders’ Meeting held on April 27, 201823, 2020 was US$1.625011.05668 per share; the amount of US$1.205330.80254 per share had to be deducted from the definitive dividend as it had been already paid in a form of interim dividends during 2018.2019. The balance, in the amount of US$0.419680.25414 per share, was paid and distributed to Company’s shareholders on May 10, 2018. The special7, 2020.
Our 2020 dividend approved by shareholderspolicy, as disclosed at theour 2020 Annual General Shareholders’ Meeting held on April 27, 2018, in23, 2020 and as modified after approval of the amount of US$0.37994 per shareSpecial Dividend, was paid and distributed to Company’s shareholders on May 10, 2018.as follows:
Our 2018a) Pay and distribute as a final dividend policy, as disclosed at our 2018 Annual General Shareholders’ Meeting held on April 27, 2018, was to payin favor of the respective shareholders, a percentage of our net income that is determined as per the following financial parameters:
(i) 100% of the 20182020 net income, when the following financial parameters are met: (a) that the total sum of cash and cash equivalent, and other current financial assets, (“Cash”) divided by the total sum of the current financial liabilities (“Current Financial Liabilities”) is equal to or greater than 2.5 times, and (b) the total sum of the total current liabilities and thetotal non-current liabilities, (“Total Liabilities”)excluding both cash and cash equivalents and other current financial assets, divided by the total sum of the equity (“Equity”) is equal to or less than 1.10.8 times.
(ii) 80% of the 20182020 net income, when the following financial parameters are met: (a) Cashthat the total current assets, divided by Current Financial Liabilitiesthe total sum of the total current financial liabilities is equal to or greater than 2.0 times, and (b) the total sum of the Total Liabilitiescurrent liabilities and total non-current liabilities, excluding both cash and cash equivalents and other current financial assets divided by the total Equityequity is equal to or less than 1.20.9 times.
(iii) 60% of the 20182020 net income, when the following financial parameters are met: (a) Cashthat the total current assets, divided by Current Financial Liabilitiesthe total sum of the total current financial liabilities is equal to or greater than 1.5 times, and (b) Total Liabilitiesthe total sum of the current liabilities and total non-current liabilities, excluding both cash and cash equivalents and other current financial assets divided by Equitythe total equity is equal to or less than 1.31.0 times.
(iv) If none of the foregoing financial parameters are met, the Company shall distribute and pay as a final dividend, and50% of the 2020 net income in favor of the respective shareholders 50%as a final dividend.
| 99 |
b) Pay and distribute only one interim dividend during 2020, which will be charged against the aforementioned final dividend and will be charged to the retained earnings reflected in the consolidated financial statements as of March 31, 2020, with the 2018 net income.percentage distributed to be determined per the financial parameters expressed in letter a) above.
On May 23, 2018,19, 2020, the Company's Board of Directors agreed to pay and distribute on June 15, 2018 an interim dividend of US$114 million, equivalent to US$0.432470.17092 per share, to be charged to the Company’s 2020 retained earnings, which was paid on June 11, 2020 in its Chilean peso equivalent using the official exchange rate as of May 29, 2020 (the “Interim Dividend”).
c) The Board of Directors will not approve the payment of other interim dividends charged against the 20182020 net income.
On August 22, 2018,d) At the ordinary general shareholders’ meeting that will be held in 2021, the Board of Directors agreedshall propose a final dividend pursuant to paythe percentages in financial parameters described in in letter a) above discounting the Special Dividend and distribute on September 12, 2018 an interim dividendInterim Dividend. If the amount is equal to or less than the amount of US$134 million, equivalent to US$0.50864 per share,the sum of the Special Dividend and the Interim Dividend, then no additional amount will be distributed and the Interim Dividend will be understood to be charged againstpaid as a definitive dividend. In any case, the 2018 net income.final dividend may not be less than the mandatory minimum dividend required to be paid in accordance with Chilean law or the Company bylaws.
On November 21, 2018,e) If there is an excess of net income in 2020, this may be retained by the BoardCompany and assigned or allocated for financing its own operations, to one or more investment projects of Directors agreed to pay and distribute on December 12, 2018 an interim dividendthe Company, notwithstanding a future distribution of US$84 million, equivalent to US$0.31726 per share, to bespecial dividends (dividendos eventuales) charged against the 2018 net income.
On March 27, 2019, the Board of Directors agreed to recommend to the shareholders the payment of a definitive dividend representing 100% of the 2018 net income. The payment of these dividends will be presented for consideration at the Annual General Shareholders’ Meeting held on April 25, 2019. Therefore, and subject to the approvalretained earnings previously approved at the shareholders’ meeting, or the Company shall pay a final dividendpossible and future capitalization of US$1.67111 per share to be charged against the 2018 net income. The amount of US$1.25837 per share must be deducted from the final dividend, as it was already paid in the form of interim dividends. The balance, in the amount of US$0.41274 per share shall be paid and distributed to Company´s shareholders, pending shareholders´ approval.
On March 27, 2019, the Board of Directors agreed to recommend to the shareholders the 2019 Dividend Policy. If approved, the Company will pay and distribute a percentageall or part of the net income per the following financial parameters:
If none of the foregoing financial parameters are met, the Company shall distribute and pay, as a final dividend, and in favor of the respective shareholders, 50% of the 2019 net income. The Company will distribute and pay if possible and during 2019, three interim dividends (dividendos provisorios) that will be charged against the aforementioned final dividend. These interim dividends will likely be paid during the month following the approval of the March, June, and September 2019 interim financial statements, respectively.latter.
The Special Dividend Policywas paid on October 8, 2020 in its Chilean peso equivalent using the official exchange rate as of September 29, 2020.
The dividend policy proposal for 20192021 is expected to be announced at the Annual Shareholders’ Meeting to be held on April 25, 2019.23, 2021.
We generally declare dividends in U.S. dollars (but may declare dividends in Chilean pesos) and pay such dividends in Chilean pesos. When a dividend is declared in U.S. dollars, the exchange rate to be used to convert the dividend into Chilean pesos is decided by the shareholders at the meeting that approves the dividend, which has usually been the Observed Exchange Rate on the date the dividend is declared. In the case of interim dividends, the exchange rate to be used is the Observed Exchange Rate published a minimum of five business days before the payment date.
The amount and timing for payment of dividends is subject to revision from time to time, depending upon our then current level of sales, costs, cash flow and capital requirements, as well as market conditions. Accordingly, there can be no assurance as to the amount or timing of declaration or payment of dividends in the future. Any change in dividend policy would ordinarily be effective for dividends declared in the year following adoption of the change, and a notice as to any such change of policy must be filed with Chilean regulatory authorities and would be publicly available information.
Dividends
| 100 |
Dividends
Each Series A common share and Series B common share is entitled to share equally in any dividends declared on the outstanding capital stock of SQM.
The following table shows the U.S. dollar equivalent of dividends per share and per ADS paid in each of the years indicated, based on the Observed Exchange Rate for the date on which the dividend was declared.
| Dividends | Per Share | Per ADS | ||||||||||
| Declared for the business year | Paid in | Ch$ | US$ | |||||||||
| n/a (eventual) | 2014 | 479.51 | 0.87387 | |||||||||
| 2014 (interim) | 2014 | 253.80 | 0.41493 | |||||||||
| 2014 | 2015 | 91.55 | 0.14811 | |||||||||
| 2015 (interim) | 2015 | 224.51 | 0.31915 | |||||||||
| 2015 | 2016 | 57.35 | 0.08581 | |||||||||
| n/a (eventual) | 2016 | 380.91 | 0.56992 | |||||||||
| 2016 (interim) | 2016 | 555.15 | 0.85487 | |||||||||
| 2016 | 2017 | 134.50 | 0.20248 | |||||||||
| 2017 (interim) | 2017 | 264.87 | 0.39222 | |||||||||
| 2017 (interim) | 2017 | 241.49 | 0.38432 | |||||||||
| 2017 (interim) | 2017 | 275.46 | 0.42879 | |||||||||
| 2017 | 2018 | 253.19 | 0.41968 | |||||||||
| n/a (eventual) | 2018 | 229.22 | 0.37994 | |||||||||
| 2018 | 2018 | 271.73 | 0.43247 | |||||||||
| 2018 | 2018 | 343.53 | 0.50864 | |||||||||
| 2018 | 2018 | 212.38 | 0.31726 | |||||||||
| Dividends | Per Share | Per ADS | ||||||||||
| Declared for the fiscal year | Paid in | Ch$ | US$ | |||||||||
| 2016 (interim) | 2016 | 555.15 | 0.85487 | |||||||||
| 2016 | 2017 | 134.50 | 0.20248 | |||||||||
| 2017 (interim) | 2017 | 264.87 | 0.39222 | |||||||||
| 2017 (interim) | 2017 | 241.49 | 0.38432 | |||||||||
| 2017 (interim) | 2017 | 275.46 | 0.42879 | |||||||||
| 2017 | 2018 | 253.19 | 0.41968 | |||||||||
| n/a (eventual) | 2018 | 229.22 | 0.37994 | |||||||||
| 2018 (interim) | 2018 | 271.73 | 0.43247 | |||||||||
| 2018 (interim) | 2018 | 343.53 | 0.50864 | |||||||||
| 2018 (interim) | 2018 | 212.38 | 0.31726 | |||||||||
| 2018 | 2019 | 277.70 | 0.41274 | |||||||||
| 2019 (interim) | 2019 | 215.25 | 0.30598 | |||||||||
| 2019 (interim) | 2019 | 192.19 | 0.26669 | |||||||||
| 2019 (interim) | 2019 | 190.39 | 0.22987 | |||||||||
| 2019 | 2020 | 217.67 | 0.25414 | |||||||||
| 2020 (interim) | 2020 | 138.91 | 0.17092 | |||||||||
| n/a (eventual) | 2020 | 297.95 | 0.37994 | |||||||||
Dividends payable to holders of ADSs will be paid net of conversion expenses of the Depositary and will be subject to Chilean withholding tax, currently imposed at the rate of 35% (subject to credits in certain cases).
As a general requirement, a shareholder who is not a resident of Chile must register as a foreign investor under one of the foreign investment regimes contemplated by Chilean law to have dividends, sale proceeds or other amounts with respect to its shares remitted outside Chile through the Formal Exchange Market. Under the Foreign Investment Contract, the Depositary, on behalf of ADR holders, will be granted access to the Formal Exchange Market to convert cash dividends from Chilean Pesos to U.S. dollars and to pay such U.S. dollars to ADS holders outside Chile net of taxes, and no separate registration of ADS holders is required.
8.B. Significant Changes
No significant change has occurred since the date of the financial statements set forth in Item 18.
| ITEM 9. | THE OFFER AND LISTING |
9.A. Offer and Listing Details
Our Series A shares and Series B shares are currently traded on the Santiago Stock Exchange, and the Bolsa Electrónica de Chile Bolsa de Valores S.A., (the Electronic Stock Exchange) under the trading symbols “SQM-A” and “SQM-B”, respectively. ADSs, each representing one share of our Series B shares are also traded on the New York Stock Exchange under the trading symbol “SQM”.
9.BPlan of Distribution
Not Applicable.
9.CMarkets
Our Series A shares and Series B shares have traded on the Santiago Stock Exchange and the Electronic Stock Exchange and also traded on the Valparaiso Stock Exchange until it ceased operations on October 8, 2018.The ADSs representing Series B shares have traded on the NYSE since September 20, 1993. The depositary bank for these ADSs is the Bank of New York Mellon.
9.D Selling Shareholders
Not applicable.
9.E Dilution
Not applicable.
9.F Expenses of the Issue
Not applicable.
| ITEM 10. | ADDITIONAL INFORMATION |
10.A. Share Capital
Not applicable.
10.B. Memorandum and Articles of Association
Sociedad Química y Minera de Chile S.A., headquartered at El Trovador No. 4285, 6th Floor, Santiago, Chile, is an open stock corporation organized under the laws of the Republic of Chile. The Company was constituted by public deed issued on June 17, 1968 by Mr. Sergio Rodríguez Garcés, Notary Public of Santiago. Its existence was approved by Decree No. 1,164 of June 22, 1968, of the Ministry of Finance, and it was registered on June 29, 1968, in the Business Registry of Santiago, on page 4,537 No. 1,992.
Corporate purposes
Our main purposes, which appear in article 4 of our By-laws, are to: (a) perform all kinds of chemical or mining activities and businesses and, among others, those related to researching, prospecting, extracting, producing, working, processing, purchasing, disposing of, and marketing properties, as applicable, of all metallic and non-metallic and fossil mining substances and elements of any type or nature, to be obtained from them or from one or more concessions or mining deposits, and in their natural or converted state, or transformed into different raw materials or manufactured or partially manufactured products, and of all rights and properties thereon; (b) manufacture, produce, work, purchase, transfer ownership, import, export, distribute, transport, and market in any way, all kinds of fertilizers, components, raw materials, chemical, mining, agricultural, and industrial products, and their by-products; (c) generate, produce, distribute, purchase, transfer ownership, and market, in any way, all kinds of electrical, thermal, geothermic or other type of power, and hydric resources or water rights in general; (d) request, manifest, claim, constitute, explore, work, lease, transfer ownership, and purchase, in any way, all kinds of mining concessions; (e) purchase, transfer ownership, and administer, in any way, any kind of telecommunications, railroads, ships, ports, and any means of transport, and represent and manage shipping companies, common carriers by water, airlines, and carries in general; (f) manufacture, produce, market, maintain, repair, assemble, construct, disassemble, purchase and transfer ownership, and in any way, any kind of electromechanical structure, and substructure in general, components, parts, spares, or parts of equipment, and machines, and execute, develop, advice, and market, any kind of electromechanical or smelting activities; (g) purchase, transfer ownership, lease, and market any kind of agro industrial and farm forestry activities, in any way (h) purchase, transfer ownership, lease, and market, in any way, any kind of urban or rural real estate; (i) render any kind of health services and manage hospitals, private clinics, or similar facilities; (j) construct, maintain, purchase, transfer ownership, and manage, in any way, any kind of roads, tunnels, bridges, water supply systems, and other required infrastructure works, without any limitation, regardless of whether they may be public or private, among others, to participate in bids and enter into any kind of contracts, and to be the legal owner of the applicable concessions; and (k) purchase, transfer ownership, and market, in any way, any kind of intangible properties such as stocks, bonds, debentures, financial assets, commercial papers, shares or rights in corporations, and any kind of bearer securities or instruments, and to administer such investments, acting always within the Investment and Financing Policies approved by the applicable General Shareholders Meeting. We may comply with the foregoing by acting ourselves or through or with other different legal entities or natural persons, within the country or abroad, with properties of our own or owned by third parties, and additionally, in the ways and territories, and with the aforementioned properties and purposes, we may also construct and operate industrial or agricultural facilities or installations; constitute, administer, purchase, transfer ownership, dissolve, liquidate, transform, modify, or form part of partnerships, institutions, foundations, corporations, or associations of any kind or nature; perform all actions, enter into all contracts, and incur in all obligations convenient or necessary for the foregoing; perform any business or activity related to our properties, assets, or patrimony, or with that of our affiliates, associated companies, or related companies; and render financial, commercial, technical, legal, auditing, administrative, advisory, and other pertinent services.
Directors
As stated in article 9 of the Company’s By-laws, the Company has eight Directors. One of the directors must be “independent” as such term is defined in article 50 bis of Law No. 18,046. Moreover, the possession of shares is not a condition necessary to become a director of the Company.
As stated in article 10 of the Company’s By-laws, the term of the directors is of three years and they can be reelected indefinitely; thus, there is no age limit for their retirement.
The Company’s By-laws, in articles 16 and 16 bis, essentially establish that the transactions in which a director has a material interest must comply with the provisions set forth in articles 136 and 146 to 149 of Law No. 18,046 and the applicable regulations of such Law.
The Board of Directors duties are remunerated, as stated in article 17 of the Company’s By-laws, and the amount of that compensation is fixed yearly by the Ordinary Shareholders’ Meeting. Therefore, directors can neither determine nor modify their compensation.
Directors cannot authorize Company loans on their behalf.
The Board of Directors must provide shareholders and the public with sufficient, reliable and timely information pertaining to the Company’s legal, economic and financial situation, as required by the Law or the CMF. The Board of Directors must adopt the appropriate measures in order to avoid the disclosure of such information to persons other than those persons who should possess such information as a result of their title, position or activity within the Company before such information is disclosed to shareholders and the public. The Board of Directors must treat business dealings and other information about the Company as confidential until such information is officially disclosed. No Director may take advantage of the knowledge about commercial opportunities that he has obtained through his position as Director.
Independent Directors and Directors Committee
According to Chilean Law, SQM must appoint at least one Independent Director and a Directors’ Committee, due to the fact that (a) the Company has a market capitalization greater than or equal to UF 1,500,000 and (b) at least 12.5% of the Company’s shares with voting rights are held by shareholders who, on an individual basis, control or possess less than 10% of such shares.
Persons who have not been involved in any of the circumstances described in the Law at any time during the preceding 18 months are considered independent. Candidates for the position of Independent Director must be proposed by shareholders representing 1% or more of the Company’s shares, at least 10 days prior to the date of the shareholders’ meeting that has been called in order to elect the Directors. No less than two days prior to the respective shareholders’ meeting, the candidate must provide the Chief Executive Officer with a sworn statement indicating that he: (a) accepts his candidacy for the position of Independent Director (b) does not meet any of the conditions that would prevent him from being the Independent Director (c) is not related to the Company, the other companies of the group to which the Company belongs, the controller of the Company, or any of the Company’s officers in such a way that would deprive a sensible person of a reasonable degree of autonomy, interfere with his ability to perform his duties objectively and effectively, generate a potential conflict of interest, or interfere with his independent judgment, and (d) assumes the commitment to remain independent as long as he holds the position of Director.
| 104 |
The Directors’ Committee shall have the following powers and duties: (a) to examine the reports of the external auditors, the balance sheet and other financial statements presented by the Company’s managers or liquidators to its shareholders and issue an opinion about the same prior to their submission for the approval of the shareholders (b) to propose to the Board of Directors the external auditors and risk rating agencies to be proposed to the shareholders at the respective shareholders’ meeting. In the event that an agreement cannot be reached, the Board of Directors shall formulate its own suggestion, and both options shall be submitted for shareholder consideration at such shareholders’ meeting (c) to examine the information relating to operations referred to in articles 146 to 149 of Law No. 18,046 and to prepare a report about such operations. A copy of such report shall be sent to the Board of Directors, and such report must be read at the Board Meeting called for the purpose of approving or rejecting the respective operation or operations (d) to examine the remuneration system and compensation plans for the Company’s management, officers and employees (e) to prepare an annual report on its activities, including its main recommendations to the shareholders (f) to inform the Board of Directors about whether or not it is advisable to hire the external audit firm to provide non-audit services where the audit firm is not prohibited from providing such services because the nature of the same could pose a threat to the audit firm’s independence, and (g) any other issues indicated in the Company’s By-laws or authorized by a shareholders’ meeting or the Board of Directors.
The Directors’ Committee shall be comprised of three members, with at least one independent member. In the event that more than three Directors have the right to form part of the Committee, these same Directors shall unanimously determine who shall make up the Committee. In the event that an agreement cannot be reached, the Directors who were elected with a greater percentage of votes by shareholders controlling or possessing less than 10% of the Company’s shares shall be given priority. If there is only one Independent Director, this Director shall name the other members of the Committee among the other Directors who are not independent. Such other members of the Committee shall have all of the rights associated with such position. The members of the Committee shall be compensated for their role. The amount of their remuneration shall be set annually at the General Shareholders’ Meeting, and it may not be less than the remuneration set for the Company Directors, plus an additional 1/3 of that amount. The General Shareholders’ Meeting shall determine a budget for the expenses of the Committee and its advisors. Such budget may not be less than the sum of the annual remunerations of the Committee members. The Committee may need to hire professional advisory services in order to carry out its duties in accordance with the abovementioned budget. The proposals made by the Committee to the Board of Directors that are not accepted by the latter must be reported to the shareholders’ meeting prior to the vote by shareholders on the corresponding matter or matters. In addition to the responsibilities that are associated with the position of Director, the members of the Committee are jointly and severally liable for any damages they cause in performing their duties as such to the shareholders and to the Company.
Shares
Dividends are annually distributed to the Series A and Series B shareholders of record on the fifth business day prior to the date for payment of the dividends. The By-laws do not specify a time limit after which dividend entitlement elapses, but Chilean regulations establish that after five years, unclaimed dividends are to be donated to the fire department.
Article 5 of the Company’s By-laws establishes that Series B shares may in no case exceed 50% of SQM’s issued, outstanding and paid stock. SQM Series B shares have a restricted right to vote as they can only elect one director of the Company, regardless of their capital stock’s share. Series B shares have the right to call for an Ordinary or Extraordinary Shareholders’ Meeting when the shareholders of at least 5% of the Series B issued shares request so and for an Extraordinary Board of Directors Meeting without the Chairman’s authorization when it is requested by the director elected by the shareholders of the Series B shares. Series A shares have the option to exclude the director elected by Series B shareholders from the voting process in which the Chairman of the Board is to be elected, if there is a tie in the first voting process. However, subject to the second transitory article of the Company’s By-Laws, articles 31 and 31 bis of the Company’s By-laws establish that in General Shareholders’ Meetings each shareholder will have a right to one vote for each share he owns or represents and (a) that no shareholder will have the right to vote for himself or on behalf of other shareholders of the same Series A or Series B shares representing more than 37.5% of the total outstanding shares with right to vote of each Series and (b) that no shareholder will have the right to vote for himself or on behalf of other shareholders representing more than 32% of the total outstanding shares with a right to vote, with any excess being deducted from the number of shares such shareholder may vote. In calculating a single shareholder’s ownership of Series A or B shares, the shareholder’s stock and those pertaining to third parties related to them are to be added.
The second transitory article provides as follows:
“Throughout the period running from the date of the extraordinary shareholders’ meeting at which this transitory article is incorporated, and December 31, 2030, the restriction against voting on behalf of more than 37.5% of any series of shares in the Company, established in Article 31 hereof, shall be subject to the following exception, applicable only to the election of board members by means of Series A shares in the Company: If two or more persons, regardless of whether or not they are related parties to each other (the incoming shareholders), act prior to December 31, 2030 such as to acquire a sufficient number of Series A shares to allow them to hold voting powers for the selection of directors of the Company amounting to more than 37.5% of that series, then any registered shareholder or group of shareholders holding more than 37.5% of all Series A shares in the Company shall be entitled to vote for the selection of directors of the Company amounting to whichever is less, between a number of the Series A shares that are held (i) by existing shareholders as of that date, and (ii) by the incoming shareholders with voting rights. Similarly, if for any reason a registered shareholder in the Company as of the date hereof who holds more than 37.5% of Series A shares in the company between the date hereof and December 31, 2030, comes to hold more voting shares for the selection of directors of the Company than the votes allocated for holding 37.5% of said Series A shares, either through a joint action agreement with other shareholders, including existing shareholders, or by any other means, then any other shareholder or group of shareholders in the Company that is not a related party to the same and holds more than 37.5% of all voting Series A shares in the Company, including both existing and incoming shareholders, shall be entitled to vote for the selection of directors of the Company in accordance with whichever number of Series A shares in the Company is the lesser, between (i) the number held by this shareholder or group of shareholders, and (ii) the existing shareholder may have the capacity to vote in excess of the restriction amounting to 37.5% of said shares.”
Article 5 bis of the Company’s By-laws establishes that no person may directly or by means of related third persons concentrate more than 32% of the Company’s total shares with right to vote.
Each Series A share and Series B share is entitled to share equally in the Company’s profits, i.e., they have the same rights on any dividends declared on the outstanding shares of SQM.
The Company By-laws do not contain any provision relating to (a) redemption provisions (b) sinking funds or (c) liability to capital calls by the Company.
As established in article 103 of Law No. 18,046, a company subject to the supervision of the CMF may be liquidated in the following cases:
(a) Expiration of the duration term, if any, as established in its By-laws;
(b) All the shares end up in the possession of one individual for more than ten continuous days;
(c) By agreement of an Extraordinary Shareholders Meeting;
(d) By abolition, pursuant to applicable laws, of the decree that authorized its existence;
(e) Any other reason contemplated in its By-laws.
| 106 |
Article 40 of the Company’s By-laws states that in the event of liquidation, the shareholders’ meeting will appoint a three-member receiver committee that will have the authority to carry out the liquidation process. Any surplus will be distributed equally among the shareholders.
The only way to change the rights of the holders of the SQM shares is by modifying its By-laws, which can only be carried out by an Extraordinary Shareholders’ Meeting, as established in article 28 of the Company By-laws.
Shareholders’ Meetings
Article 29 of the Company’s By-laws states that the call to a shareholders’ meeting, either Ordinary or Extraordinary, will be by means of a highlighted public notice that will be published at least three times, and on different days, in the newspaper of the legal address determined by the shareholders’ meeting, and in the way and under the conditions indicated by the regulations. Additionally, a notice will be sent by mail to each shareholder at least fifteen days prior to the date of the Meeting, which shall include a reference of the matters to be addressed at the meeting. However, those meetings with the full attendance of the shares with right to vote may be legally held, even if the foregoing formal notice requirements are not met. Notice of any shareholders’ meeting shall be delivered to the CMF at least fifteen days in advance of such meeting.
Any holder of Series A and/or Series B shares registered in the Company’s shareholder registry on the fifth business day prior to the date of the meeting will have a right to participate at that meeting
Article 67 of Law No. 18,046 provides that decisions made at Extraordinary Shareholders’ Meeting on the following matters require the approval of 2/3 of the outstanding shares with voting rights: (1) transformation or division of the Company and its merger with another company; (2) modification of the Company’s term of duration, if any; (3) early dissolution of the Company; (4) change of the corporate domicile; (5) capital decrease; (6) approval of contributions and estimation of non-cash assets; (7) modification of powers reserved for Shareholders Meetings or limitations on powers of the Board of Directors; (8) reduction in the number of members of the Board of Directors; (9) disposal of 50% or more of the Company’s assets; formulation or modification of any business plan exceeding the above percentage; disposal of 50% or more of an asset belonging to a subsidiary that represents at least 20% of the Company’s assets and disposal of shares of the referred subsidiary such that the parent company would lose its position as controller of the same; (10) method in which profits are distributed; (11) granting of real or personal guarantees as sureties for third-party obligations that exceed 50% of the Company assets, except for subsidiaries, in which case approval of the Board of Directors shall suffice; (12) acquisition of own shares as set forth in articles 27A and 27B of the said law; (13) other matters indicated in the By-laws; (14) amendment of the Company By-laws as a result of errors in the constitution process and amendments in the By-laws involving one or more of the matters stated in the preceding numbers; (15) forced sale of shares carried out by the controller who would acquire more than 95% of the Company’s shares in a tender offer, and (16) approval or ratification of proceedings or contracts with related parties in accordance with the provisions of articles 44 and 147 of Law No. 18,046.
Amendments to the By-laws that are intended to create, modify, defer or suspend preferential rights shall be approved by 2/3 of the shares of the affected Series.
The transformation of the Company, the merger of the same, the disposal of assets referred to in number (9) above, the constitution of guarantees set forth in number (11) above, the constitution of preferences or the increase, postponement or decrease of the existing preferences, the reparation of formal nullities incurred in the By-laws and the possession of more than 95% of the Company’s shares and other matters contemplated in the Law or in the By-laws, confer “withdrawal rights.”
Foreign
| 107 |
Shareholders Restrictions
There are no restrictions on ownership or share concentration, or limiting the exercise of the related right to vote, by local or foreign shareholders other than those discussed under Item 10.B. Memorandum and Articles of Association.“—Shares”
Change in Control
The Company By-laws provide that no shareholder may hold more than 32% of the Company’s shares, unless the By-laws are modified at an Extraordinary Shareholders’ Meeting. Moreover, on December 12, 2000, the Chilean Government published theLey de Oferta Pública de Acciones (“Public Share Offering Law”) or (OPA law) that seeks to protect the interests of minority shareholders of open stock corporations in transactions involving a change in control, by requiring that the potential new controller purchase the shares owned by the remaining shareholders either in total or pro rata. The law applies to those transactions in which the controlling party would receive a material premium price compared with the price that would be received by the minority shareholders.
There are three conditions that would make it mandatory to operate under the OPA law:
| 1) | When an investor wants to take control of a company’s stock. |
| 2) | When a controlling shareholder holds two-thirds of the company’s stock. If such shareholder buys one more share, it will be mandatory to offer to acquire the rest of the outstanding stock within 30 days of surpassing that threshold. |
| 3) | When an investor wants to take control of a corporation, which, in turn, controls an open stock corporation that represents 75% or more of the consolidated assets of the former corporation. |
Parties interested in taking control of a company must (i) notify the company of such intention in writing, and notify its controllers, the companies controlled by it, the CMF and the markets where its stocks are traded and (ii) publish a highlighted public notice in two newspapers of national circulation at least 10 business days prior to the date of materialization of the OPA.
Disclosure of Share Ownership
The Company’s By-laws do not provide for a minimum threshold at which share ownership must be disclosed.
Board Protocol for Presentation and Use of Sensitive Information
On December 5, 2018, the Company learned that Inversiones TLC SpA, a subsidiary of Tianqi, acquired 62,556,568 Series A shares of the Company, representing approximately 23.77% of the total shares issued by SQM. In connection with the acquisition, Tianqi entered into the Settlementand Extrajudicial Agreement with the FNE with respect to the implementation of certain measures to maintain competitive market conditions and mitigate any risks identified in the transaction, having as a fundamental principle the limitation of access to commercially sensitive information of SQM by Tianqi. For a description of the SettlementExtrajudicial Agreement, see “Item 7.A. Major Shareholders — Tianqi SettlementExtrajudicial Agreement with the Chilean National Economic Prosecutor Office (the ‘FNE’).FNE.” Before this acquisition, and after the approval of this transaction by the Chilean Antitrust Court, the Company’s Board of Directors deemed it necessary to adopt measures aimed at achieving the purpose of the SettlementExtrajudicial Agreement, avoiding greater points of contact between Sensitive Information and Tianqi, to complement the SettlementExtrajudicial Agreement. On January 23, 2019, the Board of Directors approved a protocol for the presentation and use of Sensitive Information (as defined in the SettlementExtrajudicial Agreement), which was amended on April 15, 2019 in response to comments received from the CMF. The protocol as currently in effect, among other things, (i) establishes that all of the Company’s directors, including those nominated or elected by a competitor shareholder, have the right under the Chilean Corporations Act to receive all of the Company’s information without restrictions, provided that any request for Sensitive Information made by a director outside of a Board meeting must be made in writing to the Company’s Chief Executive Officer, (ii) provides that the directors have the right to be informed fully and in all documents and at all timesamendment was subsequently approved by the Chief Executive Officer of everything related to the Company’s performance and (iii) provides that the Chief Executive Officer may not deny Sensitive Information to a director, nor information that has been treated or known in the subsidiaries of the Company, unless required by the FNE, the TDLC, the CMF or any other governmental or judicial authority with the legal power to request such information.Board on September 30, 2019.
| 108 |
10.C. Material Contracts
The Company, during the normal course of business, has entered into different contracts, some of which have been described herein, related to its production, commercial and legal operations. We believe all of these contracts are standard for this type of industry, and none of them is expected to have a material effect on the Company’s results of operations.
10.D. Exchange Controls
The Central Bank of Chile is responsible for, among other things, monetary policies and exchange controls in Chile. Appropriate registration of a foreign investment in Chile permits the investor access to the Formal Exchange Market. Foreign investments can be registered with the Foreign Investment Committee under Decree Law No. 600 of 1974, as amended, or can be registered with the Central Bank of Chile under the Central Bank Act, Law No 18,840 of October 1989. The Central Bank Act is an organic constitutional law requiring a “special majority” vote of the Chilean Congress to be modified. Effective January 1, 2016, Decree Law No. 600 was repealed by Article 9 of the 2014 Tax Reform. Therefore, foreign investments made on or after January 1, 2016 cannot be registered with the Foreign Investment Committee.
Our 1993, 1995 and 1998 capital increases were carried out under and subject to the then current legal regulations, whose summary is hereafter included:
AConvención Capítulo XXVI del Título I del Compendio de Normas de Cambios Internacionales or Compendium of Foreign Exchange Regulations of the Central Bank of Chile the “Foreign Investment Contract”, was entered into and among the Central Bank of Chile, our Company and the Depositary pursuant to Article 47 of the Central Bank Act and to Chapter XXVI of the Compendium of Foreign Exchange Regulations of the Central Bank of Chile, “Chapter XXVI,” which addresses the issuance of ADSs by a Chilean company. Absent the Foreign Investment Contract, under applicable Chilean exchange controls, investors would not be granted access to the Formal Exchange Market for the purposes of converting from Chilean pesos to U.S. dollars and repatriating from Chile amounts received in respect to deposited Series B shares, or Series B shares withdrawn from deposit on surrender of ADSs (including amounts received as cash dividends and proceeds from the sale in Chile of the underlying Series B shares and any rights arising therefrom). The following is a summary of the material provisions contained in the Foreign Investment Contract. This summary does not purport to be complete and is qualified in its entirety by reference to Chapter XXVI and the Foreign Investment Contract.
Under Chapter XXVI and the Foreign Investment Contract, the Central Bank of Chile has agreed to grant to the Depositary, on behalf of ADS holders, and to any investor not residing or not domiciled in Chile who withdraws Series B shares upon delivery of ADSs (such Series B shares being referred to herein as “Withdrawn Shares”) access to the Formal Exchange Market to convert Chilean pesos to U.S. dollars (and remit such U.S. dollars outside of Chile) in respect of the Withdrawn Shares, including amounts received as (a) cash dividends, (b) proceeds from the sale in Chile of Withdrawn Shares, or from shares distributed because of the liquidation, merger or consolidation of the Company, subject to receipt by the Central Bank of Chile of a certificate from the holder of such shares (or from an institution authorized by the Central Bank of Chile) that such holder’s residence and domicile are outside Chile and a certificate from a Chilean stock exchange (or from a brokerage or securities firm established in Chile) that such shares were sold on a Chilean Exchange, (c) proceeds from the sale in Chile of preemptive rights to subscribe for additional Series A and Series B shares, (d) proceeds from the liquidation, merger or consolidation of the Company and (e) other distributions, including without limitation those resulting from any recapitalization, as a result of holding Withdrawn Shares. Transferees of Withdrawn Shares will not be entitled to any of the foregoing rights under Chapter XXVI unless the Withdrawn Shares are redeposited with the Depositary. Investors receiving Withdrawn Shares in exchange for ADSs will have the right to redeposit such shares in exchange for ADSs, provided that the conditions to redeposit described hereunder are satisfied.
| 109 |
Chapter XXVI provided that access to the Formal Exchange Market in connection with dividend payments will be conditioned upon certification by the Company to the Central Bank of Chile that a dividend payment has been made and any applicable tax has been withheld. Chapter XXVI also provided that access to the Formal Exchange Market in connection with the sale of Withdrawn Shares or distributions thereon will be conditioned upon receipt by the Central Bank of Chile of certification by the Depositary that such shares have been withdrawn in exchange for ADSs and receipt of a waiver of the benefit of the Foreign Investment Contract with respect thereto until such Withdrawn Shares are redeposited.
Chapter XXVI and the Foreign Investment Contract provide that a person who brings certain types of foreign currency into Chile, including U.S. dollars, to purchase Series B shares with the benefit of the Foreign Investment Contract must convert it into Chilean pesos on the same date and has 5 banking business days within which to invest in Series B shares in order to receive the benefits of the Foreign Investment Contract. If such person decides within such period not to acquire Series B shares, he can access the Formal Exchange Market to reacquire foreign currency, provided that the applicable request is presented to the Central Bank within 7 banking business days of the initial conversion into Chilean pesos. Series B shares acquired as described above may be deposited for ADSs and receive the benefits of the Foreign Investment Contract, subject to receipt by the Central Bank of Chile of a certificate from the Depositary that such deposit has been effected and that the related ADSs have been issued and receipt by the Custodian of a declaration from the person making such deposit waiving the benefits of the Foreign Investment Contract with respect to the deposited Series B shares.
Access to the Formal Exchange Market under any of the circumstances described above is not automatic. Pursuant to Chapter XXVI, such access requires approval of the Central Bank of Chile based on a request presented through a banking institution established in Chile. The Foreign Investment Contract will provide that if the Central Bank of Chile has not acted on such request within seven banking days, the request will be deemed approved.
Under current Chilean law, foreign investments abiding by the Foreign Investment Contract cannot be changed unilaterally by the Central Bank of Chile. No assurance can be given, however, that additional Chilean restrictions applicable to the holders of ADSs, the disposition of underlying Series B shares or the repatriation of the proceeds from such disposition could not be imposed in the future, nor can there be any assessment of the duration or impact of such restrictions if imposed.
As of April 19, 2001, Chapter XXVI of Title I of theCompendio de Normas de Cambios Internacionales of the Central Bank of Chile was eliminated and new investments in ADSs by non-residents of Chile, are now governed by Chapter XIV of theCompendio de Normas de Cambios Internacionales of the Central Bank of Chile. This was made with the purpose of simplifying and facilitating the flow of capital to and from Chile. According to the new regulations, such investments must be carried out through Chile’s Formal Exchange Market and only reported to the Central Bank of Chile.
The Central Bank is also responsible for controlling incurrence of loan obligations to be paid from Chile and by a Chilean borrower to banks and certain other financial institutions outside Chile. Chapter XIV establishes what type of loans, investments, capital increases and foreign currency transactions are subject to the current Chapter XIV framework. Foreign currency transactions related to foreign loans must be performed through the Formal Exchange Market, and such transactions and the subsequent modifications of original loans must be properly informed to the Central Bank. Transactions prior to April 19, 2001, will continue to be regulated by the previous legal framework, except in cases where an express request has been presented to the Central Bank resigning previous rights to be regulated by the provisions of Chapter XIV. This summary does not purport to be complete and is qualified in its entirety by reference to the provisions of Chapter XIV.
As of December 31, 2018,2020, we had four series of bonds issued in the international markets under Rule 144A/Regulation S in the principal amounts of US$250 million, US$250 million, US$300 million and US$300450 million.
Any purchases of U.S. dollars in connection with payments on these loans will occur with the Formal Exchange Market. There can be no assurance, however, that restrictions applicable to payments in respect to the loans could not be imposed in the future, nor can there be any assessment of the duration or impact of such restrictions if imposed.
| 110 |
10.E. Taxation
Material Chilean Tax Considerations
The following describes the material Chilean income tax consequences of an investment in SQM ADSs by an individual who is not domiciled or resident in Chile or any legal entity that is not organized under the laws of Chile and does not have a permanent establishment located in Chile, a (“foreign holder”). This discussion is based upon Chilean income tax laws presently in force, including Ruling No. 324 (1990) of the Chilean Internal Revenue Service and other applicable regulations and rulings. The discussion is not intended as tax advice to any particular investor, which can be rendered only in light of that investor’s particular tax situation.
Under Chilean law, provisions contained in statutes such as tax rates applicable to foreign holders, the computation of taxable income for Chilean purposes and the manner in which Chilean taxes are imposed and collected may only be amended by another statute. In addition, the Chilean tax authorities issue rulings and regulations of either general or specific application and interpret the provisions of Chilean tax law. Chilean tax may not be assessed retroactively against taxpayers who act in good faith relying on such rulings, regulations and interpretations, but Chilean tax authorities may change said rulings, regulations and interpretations prospectively.
Cash Dividends and Other Distributions
On September 29, 2014, the Tax Reform was published, introducing significant changes to the Chilean taxation system and strengthening the powers of the SII to control and prevent tax avoidance. Subsequently, on February 8, 2016, Law No. 20,899 that simplifies the income tax system and modifies other legal tax provisions was published. On February 24, 2020, Law No. 21,210 to modernize the tax legislation was published. As a result of these reforms, open stock corporations like SQM are subject to the partially integrated shareholder tax regime (sistema parcialmente integrado).regime. The corporate tax rate applicable to us increased to 25.5% in 2017. It increased to a maximum rate of 27% in 2018.
Under the partially integrated shareholder taxation regime, shareholders bear the tax on dividends upon payment, but they will only be permitted to credit against such shareholder taxes a portion of the Chilean corporate tax paid by us on our earnings, unless the shareholder isearnings. Foreign shareholders resident in a countryjurisdiction with a tax treaty in force with Chile or signedwill be credited with Chile prior to January 1, 2017, whether or not in force. In that case, 100% of the Chilean corporate tax paid by us may be credited against the final taxes at the shareholder level.
As a result, foreignForeign shareholders resident in a non-treaty jurisdiction will be subject to a higher effective tax rate than residentson dividends because only a portion of treaty jurisdictions.the Chilean corporate tax paid by us will be credited against the final taxes at the shareholder level. There is a temporary rule in effect fromsince January 1, 2017 throughwhich has been extended to December 31, 20192026 that provides that treaty jurisdictions for this purpose will include jurisdictions with tax treaties signed with Chile prior to January 1, 2017, whether or not2020, even if such treaties are not in force. This is currently the status of the treaty signed between Chilethe United States and United States.Chile.
Cash dividends paid by the Company with respect to the shares, including shares represented by ADSs held by a U.S. Holder (as defined below), will be subject to a 35% Chilean withholding tax, which is withheld and paid by the Company (the “Withholding Tax”). The effective rate of Withholding Tax imposed on dividends attributed to 20182020 earnings of the Company and distributed during the same period was 20.99239%23.90411%.
| 111 |
Capital Gains
Gains from the sale or other disposition by a foreign holder of ADSs outside Chile will not be subject to Chilean taxation. The deposit and withdrawal of the shares in exchange for ADRs will not be subject to any Chilean taxes.
The tax basis of the shares received in exchange for ADSs (repatriation) will be the acquisition value of the shares. The Series B shares exchanged for ADSs are valued at the highest price at which they trade on the Chilean Stock Exchange on the date of the exchange or on either of the two business days preceding the exchange. Consequently, the conversion of ADSs into the shares and the immediate sale of such shares at a price equal to or less than the highest price for Series B shares on the Chilean Stock Exchange on such dates will not generate a gain subject to Chilean taxation.
Gain recognized on a sale or exchange of shares (as distinguished from sales or exchanges of ADSs representing such shares) will be subject to both the First Category Tax and the Withholding Tax if either (i) the foreign holder has held the shares for less than one year since exchanging the ADSs for the shares, (ii) the foreign holder acquired and disposed of the shares in the ordinary course of its business or as a regular trader of shares, or (iii) the foreign holder and the purchaser of the shares are related parties within the meaning of Chilean tax law. The amount of the First Category Tax may be credited against the amount of the Withholding Tax. In all other cases, gain on the disposition of the shares will be subject only to a capital gains tax, which is assessed at the same rate as the First Category Tax. Gain recognized in the transfer of common shares that have significant trading volumes in the stock exchange, however, is not subject to capital gains tax in Chile, provided that the common shares are transferred in a local stock exchange authorized by the CMF, within the process of a public tender of common shares governed by the Chilean Securities Market Act. Law No. 20,448 states that common shares must also have been acquired after April 19, 2001, either on a local stock exchange authorized by the CMF, within the referred process of public tender of a common shares governed by the Chilean Securities Market Act, in an initial public offering of common shares resulting from the formation of a corporation or a capital increase of the same, in an exchange of convertible securities subject to public offer, or in the redemption of mutual funds shares. According to Ruling No. 224 (2008) of the Chilean Internal Revenue Service, common shares received by exchange of ADRs are also considered as “acquired on a stock exchange” if the respective ADRs have been acquired on a foreign stock exchange authorized by the CMF (i.e., London Stock Exchange, New York Stock Exchange andBolsa de Valores de Madrid). Common shares are considered to have a high presence in the stock exchange when they: (a) are registered in the Securities Registry, (b) are registered in a Chilean Stock Exchange, (c) have an adjusted presence equal to or above 25%.
As of June 19, 2001, capital gains obtained in the sale of common shares that are publicly traded in a stock exchange are also exempt from capital gains tax in Chile when the sale is made by “foreign institutional investors” such as mutual funds and pension funds, provided that the sale is made in a local stock exchange authorized by the CMF, or in accordance with the provisions of the securities market law (Law 18,045). To qualify as foreign institutional investors, the referred entities must be formed outside of Chile, not have a domicile in Chile, and they must be an “investment fund” in according with the Chilean tax law.
Starting January 1, 2017, capital gains obtained in the sales of shares owned by foreign holders are subject to First Category Tax and Withholding Tax, and the First Category Tax serves as a credit in Chile to reduce the Withholding Tax. The exercise of pre-emptive rights relating to shares will not be subject to Chilean taxation. Any gain on the sale or assignment of pre-emptive rights relating to shares will be subject to both the First Category Tax and the Withholding Tax (the former being creditable against the latter).
| 112 |
Other Chilean Taxes
No Chilean inheritance, gift or succession taxes apply to the transfer or disposition of the ADSs by a foreign holder, but such taxes generally will apply to the transfer at death or by gift of the shares by a foreign holder. No Chilean stamp, issue, registration or similar taxes or duties apply to foreign holders of ADSs or shares.
Withholding Tax Certificates
Upon request, the Company will provide to foreign holders appropriate documentation evidencing the payment of Chilean withholding taxes.
Material U.S. Federal Income Tax Considerations
The following discussion summarizes the material U.S. federal income tax consequences to U.S. Holders (defined below) arising from ownership and disposition of the Series A shares and the Series B common shares, together the “shares”, and the ADSs. The discussion which follows is based on the U.S. Internal Revenue Code of 1986, as amended, the “Code,” the Treasury regulations promulgated thereunder, and judicial and administrative interpretations thereof, all as in effect and available on the date hereof. These authorities are subject to change, possibly with retroactive effect, which could affect the continued validity of this summary. In addition, the summary assumes that the depositary’s activities are clearly and appropriately defined so as to ensure that the U.S. federal income tax treatment of ADSs will be identical to the U.S. federal income tax treatment of the underlying shares.
The discussion that follows is not intended as tax advice to any particular investor and is limited to investors who will hold the shares or ADSs as “capital assets” within the meaning of Section 1221 of the Code and whose functional currency is the U.S. dollar. The summary does not address the tax treatment of holders that may be subject to special U.S. federal income tax rules, such as insurance companies, tax-exempt organizations, financial institutions, persons who are subject to the alternative minimum tax, persons who are broker-dealers in securities or foreign currency or dealers and traders in securities who use a mark-to-market method of tax accounting, persons who hold the shares or ADSs as a hedge against currency risks, as a position in a “straddle” for tax purposes, or as part of a conversion or other integrated transaction, persons holding our shares or ADSs in connection with a trade or business conducted outside of the U.S., partnerships or other entities classified as partnerships or other pass-through entities for U.S. federal income tax purposes or partners in such partnerships or entities, or persons who own (directly, indirectly or by attribution) 10% or more of the combined voting power of all classes of equity in the Company or 10% or more of the combined value of all classes of equity in the Company. PERSONS OR ENTITIES DESCRIBED ABOVE, INCLUDING PARTNERSHIPS HOLDING SHARES OR ADSs OR PARTNERS IN SUCH PARTNERSHIPS, SHOULD CONSULT THEIR OWN TAX ADVISORS AS TO THE PARTICULAR U.S. FEDERAL INCOME TAX CONSEQUENCES OF HOLDING AND DISPOSING OF SHARES OR ADSs.
For purposes of this summary, the term “U.S. Holder” means a beneficial owner of shares or ADSs that is, for U.S. federal income tax purposes, (a) an individual who is a U.S. citizen or resident, (b) a corporation or other entity taxable as a corporation created or organized under the laws of the U.S. or any political subdivision thereof, (c) an estate, the income of which is subject to U.S. federal income tax regardless of the source, or (d) a trust (i) that validly elects to be treated as a U.S. person for U.S. federal income tax purposes or (ii) if (A) a court within the U.S. is able to exercise primary supervision over the administration of the trust and (B) one or more U.S. persons have the authority to control all substantial decisions of the trust.
| 113 |
If a partnership (or any other entity treated as a partnership for U.S. federal income tax purposes) holds shares or ADSs, the tax treatment of the partnership and a partner in such partnership generally will depend on the status of the partner and the tax treatment of the partnership. Such a partner or partnership should consult its own tax advisor as to its consequences.
As of this date, there is currently no applicable income tax treaty in effect between the U.S.United States and Chile. However, in 2010, the U.S. and Chile signed an income tax treaty that will enter into force once the treaty is ratified by both countries. There can be no assurance that the treaty will be ratified by either country. The following summary assumes that there is no applicable income tax treaty in effect between the U.S. and Chile.
The discussion below does not address the effect of any U.S. state, local, estate or gift tax law or non-U.S. tax law or tax considerations that arise from rules of general application to all taxpayers on a U.S. Holder of the shares or ADSs. U.S. HOLDERS OF SHARES OR ADSs SHOULD CONSULT THEIR OWN TAX ADVISORS TO DETERMINE THE PARTICULAR CONSEQUENCES UNDER ANY SUCH LAW OF OWNING OR DISPOSING THE SHARES OR ADSs.
For purposes of applying U.S. federal income tax law, any U.S. Holder of an ADS generally will be treated as the owner of the underlying shares represented thereby. The U.S. Treasury has expressed concerns that parties to whom ADSs are released before shares are delivered to the depositary (pre-release) or intermediaries in the chain of ownership between beneficial owners and the issuer of the security underlying the ADSs may be taking actions that are inconsistent with the claiming of foreign tax credits for beneficial owners of depositary shares. Such actions would also be inconsistent with the claiming of the reduced tax rate, described below, applicable to dividends received by certain non-corporate beneficial owners. Accordingly, the analysis of the creditability of Chilean taxes, and the availability of the reduced tax rate for dividends received by certain non-corporate holders, each described below, could be affected by actions taken by such parties or intermediaries.
Cash Dividends and Other Distributions
The following discussion of cash dividends and other distributions is subject to the discussion below under “Passive Foreign Investment Company Rules.” Distributions received by a U.S. Holder on shares or ADSs, including the amount of any Chilean taxes withheld, other than certain pro rata distributions of shares to all shareholders, will constitute foreign-source income to the extent paid out of our current or accumulated earnings and profits (as determined for U.S. federal income tax purposes). Because we do not maintain calculations of our earnings and profits under U.S. federal income tax principles, it is expected that distributions generally will be reported to U.S. Holders as dividends. The amount of dividend income paid in Chilean pesos that a U.S. Holder will be required to include in income will equal the U.S. dollar value of the distributed Chilean peso, calculated by reference to the exchange rate in effect on the date the payment is received, regardless of whether the payment is converted into U.S. dollars on the date of receipt. If the dividend is converted into U.S. dollars on the date of receipt, a U.S. Holder will generally not be required to recognize foreign currency gain or loss in respect of the dividend income. A U.S. Holder may have foreign currency gain or loss if the dividend is converted into U.S. dollars after the date of its receipt, which would be ordinary income or loss and would be treated as income from U.S. sources for foreign tax credit purposes. Dividends will be included in a U.S. Holder’s income on the date of the U.S. Holder’s, or in the case of ADSs, the depositary’s, receipt of the dividend. Corporate U.S. Holders will not be entitled to claim the dividends-received deduction with respect to dividends paid by us.
Subject to certain exceptions for short-term and hedged positions, the discussion above regarding concerns expressed by the U.S. Treasury and the discussion below regarding rules intended to be promulgated by the U.S. Treasury, the U.S. dollar amount of dividends received by a noncorporate U.S. Holder in respect of our shares or ADSs generally will be subject to taxation at preferential rates if the dividends are “qualified dividends.” Dividends paid on our ADSs generally will be treated as qualified dividends if (i) our ADSs are readily tradable on an established securities market in the U.S. (ii) SQM was not, in the year prior to the year in which the dividend was paid, and is not, in the year in which the dividend is paid, a passive foreign investment company (“PFIC”) and (iii) the holder thereof has satisfied certain holding period requirements. Our ADSs are listed on the New York Stock Exchange and generally will qualify as readily tradable on an established securities market in the U.S. so long as they are so listed. We do not believe that we were a PFIC for U.S. federal income tax purposes with respect to our 20172020 taxable year. In addition, based on our current expectations regarding the value and nature of our assets, the sources and nature of our income, and relevant market and shareholder data, we do not anticipate becoming a PFIC for our 20182021 taxable year. However, because PFIC status depends upon the composition of a company’s income and assets and the market value of its assets from time to time, and because it is unclear whether certain types of our income constitute passive income for PFIC purposes, there can be no assurance that we will not be considered a PFIC for any current, prior or future taxable year. Based on existing guidance, it is not entirely clear whether dividends received with respect to our shares will be treated as qualified dividends, because our shares are not themselves listed on a U.S. exchange. In addition, the U.S. Treasury has announced its intention to promulgate rules pursuant to which holders of ADSs and intermediaries through whom such securities are held will be permitted to rely on certifications from issuers to establish that dividends are treated as qualified dividends. Because such procedures have not yet been issued, it is not clear whether we will be able to comply with them. A U.S. HOLDER SHOULD CONSULT ITS TAX ADVISORS TO DETERMINE WHETHER THE FAVORABLE RATE WILL APPLY TO DIVIDENDS IT RECEIVES AND WHETHER IT IS SUBJECT TO ANY SPECIAL RULES THAT LIMIT ITS ABILITY TO BE TAXED AT THIS FAVORABLE RATE.
The amount of a dividend generally will be treated as foreign-source dividend income to a U.S. Holder for foreign tax credit purposes. As discussed in more detail below under “—Foreign Tax Credits,” it is not free from doubt whether Chilean withholding taxes imposed on distributions on our shares or ADSs will be treated as income taxes eligible for a foreign tax credit for U.S. federal income tax purposes. If a Chilean withholding tax is treated as an eligible foreign income tax, subject to generally applicable limitations, you may claim a credit against your U.S. federal income tax liability for the eligible Chilean taxes withheld from distributions on our shares or ADSs. If the dividends are taxed as qualified dividend income (as discussed above), special rules will apply in determining the amount of the dividend taken into account for purposes of calculating the foreign tax credit limitation. THE RULES RELATING TO FOREIGN TAX CREDITS ARE COMPLEX. YOU ARE URGED TO CONSULT YOUR OWN TAX ADVISORS REGARDING THE TREATMENT OF CHILEAN WITHHOLDING TAXES IMPOSED ON DISTRIBUTIONS ON OUR SHARES OR ADSs.
Sale or Other Disposition of our Shares or ADSs
For U.S. federal income tax purposes, the gain or loss a U.S. Holder realizes on the sale or other disposition of our shares or ADSs generally will be U.S.-source capital gain or loss for foreign tax credit purposes, and generally will be a long-term capital gain or loss if the U.S. Holder has held our shares or ADSs for more than one year. The amount of a U.S. Holder’s gain or loss will equal the difference between the U.S. Holder’s tax basis in our shares or ADSs disposed of and the amount realized on the disposition (including any amount withheld in respect of Chilean withholding taxes), in each case as determined in U.S. dollars.
In certain circumstances, Chilean taxes may be imposed upon the sale of shares. See “—Material Chilean Tax Considerations—Capital Gains” above. As discussed in more detail below under “—Foreign Tax Credits,” subject to generally applicable limitations and substantiation requirements, a U.S. Holder may be eligible to claim a credit against its U.S. federal income tax liability for the eligible Chilean taxes withheld pursuant to a sale or other disposition of our shares or ADSs. U.S. HOLDERS ARE URGED TO CONSULT THEIR OWN U.S. TAX ADVISORS WITH RESPECT TO THE PARTICULAR CONSEQUENCES TO THEM OF OWNING OR DISPOSING OF OUR SHARES OR ADSs.
| 115 |
Foreign Tax Credits
Subject to applicable limitations that may vary depending upon a U.S. Holder’s circumstances and subject to the discussion above regarding concerns expressed by the U.S. Treasury, you may be eligible to claim a credit against your U.S. tax liability for Chilean income taxes (or taxes imposed in lieu of an income tax) imposed in connection with distributions on and proceeds from the sale or other disposition of our shares or ADSs. Chilean dividend withholding taxes generally are expected to be income taxes eligible for the foreign tax credit. The Chilean capital gains tax is likely to be treated as an income tax (or a tax paid in lieu of an income tax) and thus eligible for the foreign tax credit; however, you generally may claim a foreign tax credit only after taking into account any available opportunity to reduce the Chilean capital gains tax, such as the reduction for the credit for Chilean corporate income tax that is taken into account when calculating Chilean withholding tax. If a Chilean tax is imposed on the sale or disposition of our shares or ADSs, and a U.S. Holder does not receive significant foreign source income from other sources, such U.S. Holder may not be able to credit such Chilean tax against its U.S. federal income tax liability. If a Chilean tax is not treated as an income tax (or a tax paid in lieu of an income tax) for U.S. federal income tax purposes, a U.S. Holder would be unable to claim a foreign tax credit for any such Chilean tax withheld; however, a U.S. Holder may be able to deduct such tax in computing its U.S. federal income tax liability, subject to applicable limitations. In addition, instead of claiming a credit, a U.S. Holder may, at the U.S. Holder’s election, deduct such Chilean taxes in computing the U.S. Holder’s taxable income, subject to generally applicable limitations under U.S. law. An election to deduct foreign taxes instead of claiming foreign tax credits applies to all taxes paid or accrued in the taxable year to foreign countries and possessions of the U.S. THE CALCULATION OF FOREIGN TAX CREDITS AND, IN THE CASE OF A U.S. HOLDER THAT ELECTS TO DEDUCT FOREIGN INCOME TAXES, THE AVAILABILITY OF DEDUCTIONS, INVOLVES THE APPLICATION OF COMPLEX RULES THAT DEPEND ON YOUR PARTICULAR CIRCUMSTANCES. U.S. HOLDERS ARE URGED TO CONSULT THEIR TAX ADVISORS REGARDING THE AVAILABILITY OF FOREIGN TAX CREDITS IN THEIR PARTICULAR CIRCUMSTANCES.
Passive Foreign Investment Company Rules
We do not expect to be a PFIC for U.S. federal income tax purposes for our 20182020 taxable year and do not anticipate being a PFIC for our 20192021 taxable year. However, because PFIC status depends upon the composition of a company’s income and assets and the market value of its assets from time to time, and because it is unclear whether certain types of our income constitute passive income for PFIC purposes, there can be no assurance that we will not be considered a PFIC for any current, prior or future taxable year. If we were a PFIC for any taxable year during which a U.S. Holder held our shares or ADSs, certain adverse consequences could apply to the U.S. Holder, including the imposition of higher amounts of tax than would otherwise apply, and additional filing requirements. In addition, if we were treated as a PFIC in a taxable year in which we pay a dividend or in the prior taxable year, the favorable dividend rates discussed above with respect to dividends paid to certain non-corporate U.S. Holders would not apply (see “—Cash Dividends and Other Distributions” above). A U.S. Holder should consult its tax advisors regarding the consequences to it if we were a PFIC, as well as the availability and advisability of making any election that might mitigate the adverse consequences of PFIC status.
Information Reporting and Backup Withholding
Required Disclosure with Respect to Foreign Financial Assets
Certain U.S. Holders are required to report information relating to an interest in our shares or ADSs, subject to certain exceptions (including an exception for our shares or ADSs held in accounts maintained by certain financial institutions), by attaching a completed IRS Form 8938, Statement of Specified Foreign Financial Assets, with their tax return for each year in which they hold an interest in our shares or ADSs. U.S. HOLDERS ARE URGED TO CONSULT THEIR OWN U.S. TAX ADVISORS REGARDING INFORMATION REPORTING REQUIREMENTS RELATING TO THEIR OWNERSHIP OF OUR SHARES OR ADSs.
Information Reporting and Backup Withholding
Payments of dividends and sales proceeds that are made within the U.S. or through certain U.S.-related financial intermediaries generally are subject to information reporting and to backup withholding unless (i) the U.S. Holder is an exempt recipient or (ii) in the case of backup withholding, the U.S. Holder provides a correct taxpayer identification number and certifies that it is not subject to backup withholding.
The amount of any backup withholding from a payment to a U.S. Holder will be allowed as a credit against its U.S. federal income tax liability and may entitle it to a refund, provided that the required information is timely furnished to the U.S. Internal Revenue Service.
| 116 |
Medicare Contribution Tax
Legislation enacted in 2010 generally imposes a tax of 3.8% on the “net investment income” of certain individuals, trusts and estates. Among other items, net investment income generally includes gross income from dividends and net gain attributable to the disposition of certain property, like our shares or ADSs, less certain deductions. A U.S. Holder should consult the U.S. Holder’s tax advisor regarding the possible application of this legislation in the U.S. Holder’s particular circumstances.
A U.S. HOLDER SHOULD CONSULT ITS OWN TAX ADVISORS WITH RESPECT TO THE PARTICULAR CONSEQUENCES TO IT OF OWNING AND DISPOSING OF OUR SHARES OR ADSs.
10.F. Dividends and Paying Agents
Not applicable.
10.G. Statement by Experts
Not applicable.
10.H. Documents on Display
We are subject to the information requirements of the Exchange Act, except that as a foreign issuer, we are not subject to the SEC proxy rules (other than general anti-fraud rules) or the short-swing profit disclosure rules of the Exchange Act. In accordance with these statutory requirements, we file or furnish reports and other information with the SEC. Reports, information statements and other information we filed with or furnish to the SEC are available electronically on the SEC’s website http://www.sec.gov, and on our website www.sqm.com.
10.I. Subsidiary Information
See “Item 4.C. Organizational Structure.”
| ITEM 11. | QUANTITATIVE AND QUALITATIVE DISCLOSURES ABOUT MARKET RISK |
As discussed elsewhere in this Annual Report, we transact our businesses in more thanover 110 countries, thereby rendering our market risk dependent upon the fluctuations of foreign currencies and local and international interest rates. These fluctuations may generate losses in the value of financial instruments taken in the normal course of business.
We, from time to time and depending upon then current market conditions, review and re-establish our financial policies to protect our operations. Management is authorized by our Board of Directors to engage in certain derivative contracts such as forwards and swaps to specifically hedge the fluctuations in interest rates and in currencies other than the U.S. dollar.
Derivative instruments used by us are generally transaction-specific so that a specific debt instrument or contract determines the amount, maturity and other terms of the hedge. We do not use derivative instruments for speculative purposes.
| 117 |
Interest Rate Risk. As of December 31, 2018,2020, approximately 5%4% of our financial debt was effectively priced at LIBOR. Interest rate fluctuations, due to the uncertain future behavior of markets, may have a material impact on our financial results should we have such debts.
As of December 31, 2018,2020, our total financial debt is primarily long-term, with 1%4% of maturities less than 12 months, which we believe decreases the exposure to changes in the interest rates.
Exchange Rate Risk. Although the U.S. dollar is the primary currency in which we transact our businesses, our operations throughout the world expose us to exchange rate variations for non-U.S. dollar currencies. Therefore, fluctuations in the exchange rate of such local currencies may affect our financial condition and results of operations. To lessen these effects, we maintain derivative contracts to protect the net difference between our principal assets and liabilities for currencies other than the U.S. dollar. These contracts are renewed periodically depending on the amount covered in each currency. Aside from this, we do not hedge potential future income and expenses in currencies other than the U.S. dollar with the exception of the euro and Chilean peso. We estimate annual sales in euros and expenses in Chilean pesos, and depending on the circumstances we secure the exchange difference with derivative contracts.
The following is a summary of the aggregate net monetary assets and liabilities that are denominated in non-U.S. dollar currencies as of December 31, 2018, 20172020, 2019 and 2016.2018. Figures do not include our financial hedging positions for year-end:
| 2018 | 2017 | 2016 | 2020 | 2019 | 2018 | |||||||||||||||||||
| Th US$ | Th US$ | Th US$ | Th US$ | Th US$ | Th US$ | |||||||||||||||||||
| Chilean pesos | (267,032 | ) | (173,907 | ) | (240,563 | ) | (255,181 | ) | (57,724 | ) | (267,032 | ) | ||||||||||||
| Brazilian real | (756 | ) | (708 | ) | 183 | 140 | 19 | (756 | ) | |||||||||||||||
| Euro | 14,568 | 31,291 | 15,621 | 33,362 | (6,770 | ) | 14,568 | |||||||||||||||||
| Japanese yen | 77,975 | 42,789 | 1,892 | 24,715 | 67,836 | 77,975 | ||||||||||||||||||
| Mexican pesos | 5,471 | (1,650 | ) | 1,166 | 12,065 | 7,781 | 5,471 | |||||||||||||||||
| South African rand | 5,283 | 28,454 | 25,542 | 26,294 | 20,817 | 5,283 | ||||||||||||||||||
| Dirhams | 46,864 | 35,960 | 31,297 | 49,290 | 10,116 | 46,864 | ||||||||||||||||||
| Other currencies | 69,968 | 38,853 | 24,367 | 36,488 | 43,980 | 69,968 | ||||||||||||||||||
| Total, net | (47,659 | ) | 1,084 | (140,495 | ) | (72,827 | ) | 86,055 | (47,659 | ) | ||||||||||||||
Also, we had open forward exchange contracts to buy U.S. dollars and sell Chilean pesos to hedge our time deposits in Chilean pesos for approximately US348US181 million (Ch$229,244143,897 million).
The information contained in Item 11. Quantitative and Qualitative Disclosures About Market Risk, contains statements that may constitute forward-looking statements. See “Cautionary Statement Regarding Forward-Looking Statements” in this Annual Report, for safe harbor provisions.
ITEM 12. DESCRIPTION OF SECURITIES OTHER THAN EQUITY SECURITIES
ITEM 12.A. DEBT SECURITIES
Not applicable.
ITEM 12.B. WARRANTS AND RIGHTS
Not applicable.
ITEM 12.C. OTHER SECURITIES
Not applicable.
ITEM 12.D. AMERICAN DEPOSITARY RECEIPTS
Depositary Fees and Charges
The Company’s American Depositary Shares (“ADS”) program is administered by The Bank of New York Mellon (101 Barclay St., 22(240 Greenwich Street, 8 Fl. W., New York, NY 10286), as Depositary. Under the terms of the Deposit Agreement, an ADS holder may have to pay the following service fees to the Depositary:
| Service Fees | Fees | |
| Execution and delivery of ADSs and the surrender of ADRs | Up to US$0.05 per share |
Depositary Payments Fiscal Year 20182020
The Depositary has agreed to reimburse certain expenses related to the Company’s ADS program and incurred by the Company in connection with the program. In 2018,2020, the Depositary reimbursed expenses related to investor relations for a total amount of US$315,591.149,591.
PART II
| ITEM 13. | DEFAULTS, DIVIDEND ARREARAGES AND DELINQUENCIES |
None.
| ITEM 14. | MATERIAL MODIFICATIONS TO THE RIGHTS OF SECURITY HOLDERS AND USE OF PROCEEDS |
None.
| ITEM 15. | CONTROLS AND PROCEDURES |
| (a) | Disclosure Control and Procedures |
SQM management, with the participation of the Company’s Chief Executive Officer and Chief Financial Officer and other members of the Company’s executive management, evaluated the effectiveness of our disclosure controls and procedures, pursuant to Rule 13a-15(b) promulgated under the Exchange Act, as of the end of the period covered by this Annual Report. Based upon that evaluation, our Chief Executive Officer and Chief Financial Officer have concluded that the Company’s disclosure controls and procedures were effective in providing reasonable assurance that material information is made known to management and that financial and non-financial information is properly recorded, processed, summarized and reported as of December 31, 2018.2020.
The Company’s disclosure controls and procedures are designed to provide reasonable assurance that information required to be disclosed by the issuer in the reports that it files or submits under the Exchange Act is recorded, processed, summarized and reported, within the time periods specified in the Commission’s rules and forms, and that such information is accumulated and communicated to management of the Company, with the participation of its Chief Executive Officer and Chief Financial Officer, as appropriate to allow timely decisions regarding required disclosures. However, through the same design and evaluation period of the disclosure controls and procedures, the Company’s management, including the Company’s Chief Executive Officer and Chief Financial Officer, recognized that there are inherent limitations to the effectiveness of any control system regardless of how well designed and operated. In such a way they can provide only reasonable assurance of achieving the desired control objectives, and no evaluation can provide absolute assurance that all control issues or instances of fraud, if any, within the Company have been detected.
(b) Management’s Annual Report on Internal Control Over Financial Reporting
SQM management is responsible for establishing and maintaining adequate internal control over financial reporting as such term is defined in Exchange Act Rule 13a-15(f). The Company’s internal control over financial reporting is designed to provide reasonable assurance regarding the reliability of financial reporting and the preparation of the financial statements for external purposes in accordance with generally accepted accounting principles.
Because of its inherent limitations, internal control over financial reporting may not necessarily prevent or detect some misstatements. It can only provide reasonable assurance regarding financial statement preparation and presentation. Also, projections of any evaluation of effectiveness for future periods are subject to the risk that controls may become inadequate because of changes in conditions or because the degree of compliance with the polices or procedures may deteriorate over time.
Management assessed the effectiveness of its internal control over financial reporting as of December 31, 2018.2020. The assessment was based on criteria established in the framework “Internal Controls — Integrated Framework (2013)” issued by the Committee of Sponsoring Organizations of the Treadway Commission (COSO). Based on the assessment, SQM management has concluded that as of December 31, 2018,2020, the Company’s internal control over financial reporting was effective.
(c) Attestation Report of the Registered Public Accounting Firm
For the report of PricewaterhouseCoopers Consultores Auditores SpA, independent registered public accounting firm dated April 17, 2019, on the effectiveness of our internal control over financial reporting as of December 31, 2018,2020, see page F-2F-1 of our Audited Consolidated Financial Statements.
(d) Changes in Internal Control Over Financial Reporting
There has been no change in the Company’s internal control over financial reporting (as defined in Rule 13a-15(f) under the Exchange Act) that occurred during the period covered by this Annual Report that has materially affected, or is reasonably likely to materially affect, internal control over financial reporting.
| ITEM 16. | [Reserved] |
| ITEM 16A. | AUDIT COMMITTEE FINANCIAL EXPERT |
The Board of Directors has determined that the Company does not have an audit committee financial expert within the meaning of the regulations adopted under the Sarbanes-Oxley Act of 2002.
Pursuant to Chilean regulations, the Company has a Directors’ Committee whose main duties are similar to those of an audit committee. Each of the members of the Directors’ Committee is a member of the audit committee. See “Item 6.C. Board Practices.”
Our Board believes that the members of the Directors’ Committee have the necessary expertise and experience to perform the functions of the Directors’ Committee pursuant to Chilean regulations.
| ITEM 16B. | CODE OF ETHICS |
We have adopted a Code of Business Conduct that applies to the Chief Executive Officer, the Chief Financial Officer, the Internal Auditor as well as all our officers and employees. Our Code adheres to the definition set forth in Item 16B. of Form 20-F under the Exchange Act.
No waivers have been granted therefrom to the officers mentioned above.
The full text of the code is available on our website athttp://www.sqm.com in the Investor Relations section under “Corporate Governance.”
Amendments to, or waivers from, one or more provisions of the code will be disclosed on our website.
| ITEM 16C. | PRINCIPAL ACCOUNTANT FEES AND SERVICES |
The table shows the amount of fees billed to SQM by our independent auditors, PwC for the 20182020 and 20172019 fiscal years, in relation to audit, tax and other assurance services provided to us (in thousands of US$):
| 2018 | 2017 | 2020 | 2019 | |||||||||||||
| Audit fees | 1,408 | 1,599 | 1,343 | 1,339 | ||||||||||||
| Tax fees | 289 | 265 | 255 | 354 | ||||||||||||
| All other fees | 17 | 36 | 70 | 17 | ||||||||||||
| Total fees | 1,715 | 1,900 | 1,668 | 1,710 | ||||||||||||
Audit fees in the above table are the fees approved by the Directors’ Committee for PwC in 20182020 and 20172019 in connection with the audits of our annual consolidated financial statements.Allstatements
Tax fees and all other fees in the above table are aggregate fees approved by the Directors’ Committee for PwC in 20182020 and 20172019 in connection with services such as transfer pricing and other assurance services that were not related to the audit. These fees were pre-approved by the Directors’ Committee in accordance with our pre-approval policies and procedures.
Directors’ Committee PreApprovalPre-Approval Policies and Procedures.
Chilean law states that public companies are subject to “pre-approval” requirements under which all audit and non-audit services provided by the independent auditor must be pre-approved by the Directors’ Committee. Our Directors’ Committee approves all audits, audit related, tax and other services provided by our auditors.
Any services provided by our auditors that are not specifically included within the scope of the audit must be pre-approved by the Directors’ Committee prior to any engagement.
| ITEM 16D. | EXEMPTIONS FROM THE LISTING STANDARDS FOR AUDIT COMMITTEES |
Our Directors’ Committee performs many of the functions of an audit committee under NYSE corporate governance rules and the Exchange Act but also performs other functions as prescribed under Chilean law. See “Item 6.C. Board Practices.”
Ms. Joanne L. Boyes was an executive officer of Nutrien (formerly PCS prior to the merger with Agrium Inc. on January 1, 2018) during her service on our Directors’ Committee. Nutrien and its affiliates owned and currently owns an aggregate of 32% of the total outstanding shares of SQM. See “Item 7.A. Major Shareholders.”
Ms. Boyes resigned from our Directors’ Committee and Board of Directors on January 24, 2018. During her service on the Directors’ Committee, Ms. Boyes served as an observer on audit committee matters and did not have voting rights on such matters. Ms. Boyes was neither the chair of the Directors’ Committee nor an executive officer of SQM. Accordingly, we relied on the exemption provided in Rule 10A-3(b)(1)(iv)(D) of the Exchange Act for Ms. Boyes’ service on the Directors’ Committee. We do not believe that Ms. Boyes’ affiliation with Nutrien had a materially adverse effect on the ability of the Directors’ Committee to act independently or to satisfy the other requirements relating to audit committees contained in Rule 10A-3 under the Exchange Act.None.
| ITEM 16E. | PURCHASES OF EQUITY SECURITIES BY THE ISSUER AND AFFILIATED PURCHASERS |
None.
ITEM 16F. CHANGE IN REGISTRANT’S CERTIFYING ACCOUNTANT
None.
| ITEM 16G. | CORPORATE GOVERNANCE |
For a summary of the significant differences between our corporate governance practices and the NYSE corporate governance standards, see “Item 6.C. Board Practices.”
| ITEM 16H. | MINE SAFETY AND DISCLOSURE |
Not applicable.
PART III
| ITEM 17. | FINANCIAL STATEMENTS |
See “Item 18. Financial Statements.”
| ITEM 18. | FINANCIAL STATEMENTS |
For a list of all financial statements filed as part of this Form 20-F Annual Report, see “Item 19. Exhibits.”
| ITEM 19. | EXHIBITS |
(a) Index to Financial Statements
*All other schedules have been omitted because they are not applicable or the required information is shown in the Consolidated Financial Statements or notes thereto.
(b) Exhibits
101.INS | XBRL Instance Document | |
| ||
| 101.SCH | XBRL Taxonomy Extension Schema Document | |
| ||
| 101.CAL | XBRL Taxonomy Extension Calculation Linkbase Document | |
| ||
| 101.DEF | XBRL Taxonomy Extension Definition Linkbase Document | |
| ||
| 101.LAB | XBRL Taxonomy Extension Label Linkbase Document | |
| ||
| 101.PRE | XBRL Taxonomy Extension Presentation Linkbase Document |
The registrant hereby certifies that it meets all of the requirements for filing on Form 20-F and that it has duly caused and authorized the undersigned to sign this annual report on its behalf.
SOCIEDAD QUIMICA Y MINERA DE CHILE S.A.
(CHEMICAL AND MINING COMPANY OF CHILE INC.)
/s/ Gerardo Illanes
Gerardo Illanes G.
Chief Financial Officer
Date: March 15, 2021
SOCIEDAD QUIMICA Y MINERA DE CHILE S.A. AND SUBSIDIARIES
Index to Consolidated Financial Statements
Contents
| Ch$ | - | Chilean pesos |
| ThCh$ | - | Thousands of Chilean pesos |
| US$ | - | United States dollars |
| ThUS$ | - | Thousands of United States dollars |
| UF | - | The UF is an inflation-indexed, Chilean peso-denominated monetary unit. The UF rate is set daily in advance, based on the change in the Consumer Price Index of the previous month |
REPORT OF INDEPENDENT REGISTERED PUBLIC ACCOUNTING FIRM
To the Board of Directors and shareholdersShareholders of Sociedad Química y Minera de Chile S.A.
Opinions on the Financial Statements and Internal Control over Financial Reporting
We have audited the accompanying consolidated statements of financial position of Sociedad Química y Minera de Chile S.A. and its subsidiaries (the “Company”) as of December 31, 20182020 and 2017,2019, and the related consolidated statements of income, comprehensive income, changes in equity and, cash flows for each of the three years in the period ended December 31, 2018,2020, including the related notes (collectively referred to as the “consolidated financial statements”). We also have audited the Company’s internal control over financial reporting as of December 31, 2018,2020, based on criteria established inInternal Control - Integrated Framework (2013) issued by the Committee of Sponsoring Organizations of the Treadway Commission (COSO).
In our opinion, the consolidated financial statements referred to above present fairly, in all material respects, the financial position of the Company as of December 31, 20182020 and 2017,2019, and the results of its operations and its cash flows for each of the three years in the period ended December, 31, 20182020 in conformity with International Financial Reporting Standards as issued by the International Accounting Standards Board. Also in our opinion, the Company maintained, in all material respects, effective internal control over financial reporting as of December 31, 2018,2020, based on criteria established inInternal Control - Integrated Framework (2013) issued by the COSO.
Change in Accounting Principle
As discussed in Note 4.2 to the consolidated financial statements, the Company changed the manner in which it accounts for leases in 2019.
Basis for Opinions
The Company's management is responsible for these consolidated financial statements, for maintaining effective internal control over financial reporting, and for its assessment of the effectiveness of internal control over financial reporting, included in Management’s Annual Report on Internal Control over Financial Reporting appearing under Item 15. Our responsibility is to express opinions on the Company’s consolidated financial statements and on the Company's internal control over financial reporting based on our audits. We are a public accounting firm registered with the Public Company Accounting Oversight Board (United States) (PCAOB) and are required to be independent with respect to the Company in accordance with the U.S. federal securities laws and the applicable rules and regulations of the Securities and Exchange Commission and the PCAOB.
We conducted our audits in accordance with the standards of the PCAOB. Those standards require that we plan and perform the audits to obtain reasonable assurance about whether the consolidated financial statements are free of material misstatement, whether due to error or fraud, and whether effective internal control over financial reporting was maintained in all material respects.
Our audits of the consolidated financial statements included performing procedures to assess the risks of material misstatement of the consolidated financial statements, whether due to error or fraud, and performing procedures that respond to those risks. Such procedures included examining, on a test basis, evidence regarding the amounts and disclosures in the consolidated financial statements. Our audits also included evaluating the accounting principles used and significant estimates made by management, as well as evaluating the overall presentation of the consolidated financial statements. Our audit of internal control over financial reporting included obtaining an understanding of internal control over financial reporting, assessing the risk that a material weakness exists, and testing and evaluating the design and operating effectiveness of internal control based on the assessed risk. Our audits also included performing such other procedures as we considered necessary in the circumstances. We believe that our audits provide a reasonable basis for our opinions.
Definition and Limitations of Internal Control over Financial Reporting
A company’s internal control over financial reporting is a process designed to provide reasonable assurance regarding the reliability of financial reporting and the preparation of financial statements for external purposes in accordance with generally accepted accounting principles. A company’s internal control over financial reporting includes those policies and procedures that (i) pertain to the maintenance of records that, in reasonable detail, accurately and fairly reflect the transactions and dispositions of the assets of the company; (ii) provide reasonable assurance that transactions are recorded as necessary to permit preparation of financial statements in accordance with generally accepted accounting principles, and that receipts and expenditures of the company are being made only in accordance with authorizations of management and directors of the company; and (iii) provide reasonable assurance regarding prevention or timely detection of unauthorized acquisition, use, or disposition of the company’s assets that could have a material effect on the financial statements.
Because of its inherent limitations, internal control over financial reporting may not prevent or detect misstatements. Also, projections of any evaluation of effectiveness to future periods are subject to the risk that controls may become inadequate because of changes in conditions, or that the degree of compliance with the policies or procedures may deteriorate.
| F-1 |
Sociedad Química y Minera de Chile S.A.
2
Critical Audit Matters
The critical audit matters communicated below are matters arising from the current period audit of the consolidated financial statements that were communicated or required to be communicated to the audit committee and that (i) relate to accounts or disclosures that are material to the consolidated financial statements and (ii) involved our especially challenging, subjective, or complex judgments. The communication of critical audit matters does not alter in any way our opinion on the consolidated financial statements, taken as a whole, and we are not, by communicating the critical audit matters below, providing separate opinions on the critical audit matters or on the accounts or disclosures to which they relate.
Bulk Inventories Volume
As described in Notes 3.13, 3.33 and 11 to the consolidated financial statements, the Company’s consolidated products in progress and finished products inventories balances at December 31, 2020 amounted to US$488 million and US$563 million, respectively, which included bulk inventories amounting to US$109 million and US$177 million, respectively. The accounting process the Company uses to record products in progress and finished products bulk inventories volume relies on significant estimates primarily relating to topography measures and product density. To assist in validating the reasonableness of these estimates, management periodically reviews product density and performs cyclical physical inventory during the year and an annual physical inventory.
The principal considerations for our determination that performing procedures relating to the bulk inventories volume is a critical matter are (i) the significant judgment by management in determining the products in progress and finished products bulk inventories volume; (ii) a high degree of auditor judgment, subjectivity, and effort in performing our audit procedures and in evaluating audit evidence related to the estimates made by management; and (iii) the audit effort involved the use of professionals with specialized skill and knowledge.
Addressing the matter involved performing procedures and evaluating audit evidence in connection with forming our overall opinion on the consolidated financial statements. These procedures included testing the effectiveness of controls relating to the estimation of inventories volumes, including controls over management’s physical inventory process and the determination of the product density. These procedures also included, among others, observing management’s physical inventory and assessing rollforward activity between the time of the inventory and year-end. Professionals with specialized skill and knowledge were used to assist in the evaluation of management’s topography measures, assess the reasonableness of management’s determination of the product density and observe management’s annual physical inventory.
Litigation - Environmental, Tax and Legal Contingencies
As described in Notes 3.26, 3.33, 21.1, 21.3, 21.4, 21.6 and 21.7 to the consolidated financial statements, provisions are recognized when the Company has a present legal or constructive obligation as a result of a past event, it is probable that an outflow of resources will be required to settle the obligation, and a reliable estimate of the obligation amount can be made. The Company also discloses the contingencies in circumstances where management concludes no loss is probable or reasonably estimable, but it is reasonably possible that a loss may be incurred.
The principal considerations for our determination that performing procedures relating to the environmental, tax and legal contingencies is a critical audit matter are the significant judgment by management when assessing the likelihood of a loss being incurred and when determining whether a reasonable estimate of the loss can be made, which in turn led to a high degree of auditor judgment and effort in evaluating management’s assessment of the loss contingencies associated with environmental, tax and legal matters.
Addressing the matter involved performing procedures and evaluating audit evidence in connection with forming our overall opinion on the consolidated financial statements. These procedures included testing the effectiveness of controls relating to management’s evaluation of the environmental, tax and legal contingencies, including controls over determining whether a loss is probable and whether the amount of loss can be reasonably estimated, as well as consolidated financial statement disclosures. These procedures also included, among others, obtaining and evaluating the letters of audit inquiry with internal and external legal counsels, evaluating the reasonableness of management’s assessment regarding unfavorable outcomes, and evaluating the sufficiency of the Company’s litigation contingency disclosures.
/s/ PricewaterhouseCoopers Consultores Auditores SpA
Santiago – Chile
April 17, 2019
March 15, 2021
We have served as the Company’s auditor since 2011.
| F-2 |
Consolidated Classified Statements of Financial Position
| Note | As of December 31, ThUS$ | As of December 31, ThUS$ | As of December 31, 2020 | As of December 31, 2019 | ||||||||||||||||||
| Assets | ||||||||||||||||||||||
| Current assets | ||||||||||||||||||||||
| ASSETS | Note N° | ThUS$ | ThUS$ | |||||||||||||||||||
| Current Assets | ||||||||||||||||||||||
| Cash and cash equivalents | 10.1 | 556,066 | 630,438 | 10.1 | 509,102 | 588,530 | ||||||||||||||||
| Other current financial assets | 13.1 | 312,721 | 366,979 | 13.1 | 348,069 | 505,490 | ||||||||||||||||
| Other current non-financial assets | 16 | 49,186 | 26,883 | 17 | 57,399 | 50,552 | ||||||||||||||||
| Trade and other receivables, current | 13.2 | 464,855 | 446,875 | 13.2 | 365,206 | 399,142 | ||||||||||||||||
| Trade receivables due from related parties, current | 12.4 | 44,554 | 59,132 | 12.5 | 62,601 | 61,227 | ||||||||||||||||
| Current inventories | 11 | 913,674 | 902,074 | 11 | 1,093,028 | 983,338 | ||||||||||||||||
| Current tax assets | 30.1 | 57,110 | 32,291 | 27.1 | 132,224 | 91,433 | ||||||||||||||||
| Current assets other than those classified as held for sale or disposal | 2,398,166 | 2,464,672 | ||||||||||||||||||||
| Total current assets other than those classified as held for sale or disposal | 2,567,629 | 2,679,712 | ||||||||||||||||||||
| Non-current assets or groups of assets classified as held for sale | 31 | 1,430 | 1,589 | 28 | 1,629 | 2,454 | ||||||||||||||||
| Total non-current assets held for sale | 1,629 | 2,454 | ||||||||||||||||||||
| Total current assets | 2,399,596 | 2,466,261 | 2,569,258 | 2,682,166 | ||||||||||||||||||
| Non-current assets | ||||||||||||||||||||||
| Other non-current financial assets | 13.1 | 17,131 | 42,879 | 13.1 | 51,925 | 8,778 | ||||||||||||||||
| Other non-current non-financial assets | 16 | 27,540 | 19,262 | 17 | 22,042 | 19,729 | ||||||||||||||||
| Trade receivables, non-current | 13.2 | 2,275 | 1,912 | 13.2 | 11,165 | 1,710 | ||||||||||||||||
| Investments classified using the equity method of accounting | 8.1-9.3 | 111,549 | 152,630 | 8.1-9.3 | 85,993 | 109,435 | ||||||||||||||||
| Intangible assets other than goodwill | 14.1 | 188,283 | 113,787 | 15.1 | 178,407 | 188,358 | ||||||||||||||||
| Goodwill | 14.1 | 34,718 | 37,972 | 15.1 | 41,966 | 34,726 | ||||||||||||||||
| Property, plant and equipment | 15.1 | 1,454,823 | 1,429,354 | |||||||||||||||||||
| Property, plant and equipment net | 16.1 | 1,737,319 | 1,569,906 | |||||||||||||||||||
| Right-of-use assets | 14.1 | 30,024 | 37,164 | |||||||||||||||||||
| Tax assets, non-current | 30.1 | 32,179 | 32,179 | 27.1 | 90,364 | 32,179 | ||||||||||||||||
| Total non-current assets | 1,868,498 | 1,829,975 | 2,249,205 | 2,001,985 | ||||||||||||||||||
| Total assets | 4,268,094 | 4,296,236 | 4,818,463 | 4,684,151 | ||||||||||||||||||
The accompanying notes form an integral part of these consolidated financial statements.
| F-3 |
Consolidated Classified Statements of Financial Position (continued)
| Note | As of December 31, 2018 ThUS$ | As of December 31, ThUS$ | As of December 31, 2020 | As of December 31, 2019 | ||||||||||||||||||
| Liabilities and Equity | Note N° | ThUS$ | ThUS$ | |||||||||||||||||||
| Current liabilities | ||||||||||||||||||||||
| Other current financial liabilities | 13.4 | 23,585 | 220,328 | 13.4 | 68,955 | 291,128 | ||||||||||||||||
| Lease liabilities, current | 14.2 | 5,528 | 7,694 | |||||||||||||||||||
| Trade and other payables, current | 13.5 | 163,751 | 196,280 | 13.5 | 203,933 | 205,790 | ||||||||||||||||
| Trade payables due to related parties, current | 12.5-13.7 | 9 | 1,365 | 12.6 | 606 | 475 | ||||||||||||||||
| Other current provisions | 18.1 | 106,197 | 63,445 | 19.1 | 104,166 | 110,565 | ||||||||||||||||
| Current tax liabilities | 30.2 | 47,412 | 75,402 | 27.2 | 22,643 | 17,874 | ||||||||||||||||
| Provisions for employee benefits, current | 17.1 | 20,085 | 22,421 | 18.1 | 9,096 | 16,387 | ||||||||||||||||
| Other current liabilities | 18.3 | 194,624 | 168,804 | |||||||||||||||||||
| Other current non-financial liabilities | 19.3 | 60,955 | 126,899 | |||||||||||||||||||
| Total current liabilities | 555,663 | 748,045 | 475,882 | 776,812 | ||||||||||||||||||
| Non-current liabilities | ||||||||||||||||||||||
| Other non-current financial liabilities | 13.4 | 1,330,382 | 1,031,507 | 13.4 | 1,899,513 | 1,488,723 | ||||||||||||||||
| Lease liabilities, non-current | 14.2 | 25,546 | 30,203 | |||||||||||||||||||
| Trade and other payables, non-current | 13.5 | 4,027 | - | |||||||||||||||||||
| Other non-current provisions | 18.1 | 31,822 | 30,001 | 19.1 | 62,617 | 34,690 | ||||||||||||||||
| Deferred tax liabilities | 30.3 | 175,361 | 205,283 | 27.3 | 156,101 | 183,411 | ||||||||||||||||
| Provisions for employee benefits, non-current | 17.1 | 37,064 | 33,932 | 18.1 | 32,199 | 35,840 | ||||||||||||||||
| Total non-current liabilities | 1,574,629 | 1,300,723 | 2,180,003 | 1,772,867 | ||||||||||||||||||
| Total liabilities | 2,130,292 | 2,048,768 | 2,655,885 | 2,549,679 | ||||||||||||||||||
| Equity | 19 | |||||||||||||||||||||
| Equity attributable to owners of the Parent | 20 | |||||||||||||||||||||
| Share capital | 477,386 | 477,386 | 477,386 | 477,386 | ||||||||||||||||||
| Retained earnings | 1,623,104 | 1,724,784 | 1,638,267 | 1,623,104 | ||||||||||||||||||
| Other reserves | (14,999 | ) | (14,349 | ) | 7,432 | (14,223 | ) | |||||||||||||||
| Equity attributable to owners of the Parent | 2,085,491 | 2,187,821 | 2,123,085 | 2,086,267 | ||||||||||||||||||
| Non-controlling interests | 52,311 | 59,647 | 39,493 | 48,205 | ||||||||||||||||||
| Total equity | 2,137,802 | 2,247,468 | 2,162,578 | 2,134,472 | ||||||||||||||||||
| Total liabilities and equity | 4,268,094 | 4,296,236 | 4,818,463 | 4,684,151 | ||||||||||||||||||
The accompanying notes form an integral part of these consolidated financial statements.
| F-4 |
Consolidated Statements of Income by Function
| January to December | For the period from January to December of the year | |||||||||||||||||||||||||||||
| Note | 2018 ThUS$ | 2017 ThUS$ | 2016 ThUS$ | 2020 | 2019 | 2018 | ||||||||||||||||||||||||
| Consolidated Statements of Income | Note N° | ThUS$ | ThUS$ | ThUS$ | ||||||||||||||||||||||||||
| Revenue | 25.1 | 2,265,803 | 2,157,323 | 1,939,322 | 23.1 | 1,817,191 | 1,943,655 | 2,265,803 | ||||||||||||||||||||||
| Cost of sales | 25.2 | (1,483,524 | ) | (1,394,822 | ) | (1,328,285 | ) | 23.2 | (1,334,321 | ) | (1,383,603 | ) | (1,485,631 | ) | ||||||||||||||||
| Gross profit | 782,279 | 762,501 | 611,037 | 482,870 | 560,052 | 780,172 | ||||||||||||||||||||||||
| Other income | 25.3 | 32,048 | 17,827 | 15,202 | 23.3 | 26,893 | 18,218 | 32,048 | ||||||||||||||||||||||
| Administrative expenses | 25.4 | (118,126 | ) | (101,171 | ) | (88,436 | ) | 23.4 | (107,017 | ) | (117,180 | ) | (118,126 | ) | ||||||||||||||||
| Other expenses by function | 25.5 | (36,907 | ) | (53,600 | ) | (82,533 | ) | 23.5 | (99,612 | ) | (25,995 | ) | (36,907 | ) | ||||||||||||||||
| Net impairment gains on reversal (losses) of financial assets | 2,967 | (8,038 | ) | (7,198 | ) | |||||||||||||||||||||||||
| Net impairment (losses) gains on reversal of financial assets | 23.7 | 4,684 | (1,057 | ) | 2,967 | |||||||||||||||||||||||||
| Other gains (losses) | 25.6 | 6,404 | 543 | 679 | 23.6 | (5,313 | ) | (383 | ) | 6,404 | ||||||||||||||||||||
| Profit from operating activities | 668,665 | 618,062 | 448,751 | 302,505 | 433,655 | 666,558 | ||||||||||||||||||||||||
| Finance income | 22,533 | 13,499 | 10,129 | 23.10 | 13,715 | 26,289 | 22,533 | |||||||||||||||||||||||
| Finance costs | 25.9-27 | (59,914 | ) | (50,124 | ) | (57,498 | ) | 16.5-23.9 | (82,199 | ) | (76,939 | ) | (57,807 | ) | ||||||||||||||||
| Share of profit of associates and joint ventures accounted for using the equity method | 8.1-9.3 | 6,351 | 14,452 | 13,047 | 8.1-9.3 | 8,940 | 9,786 | 6,351 | ||||||||||||||||||||||
| Foreign currency translation differences | 28 | (16,597 | ) | (1,299 | ) | 460 | 26 | (4,423 | ) | (2,169 | ) | (16,597 | ) | |||||||||||||||||
| Profit before taxes | 621,038 | 594,590 | 414,889 | 238,538 | 390,622 | 621,038 | ||||||||||||||||||||||||
| Income tax expense, continuing operations | 30.3 | (178,975 | ) | (166,173 | ) | (132,965 | ) | |||||||||||||||||||||||
| Income tax expense | 27.3 | (70,179 | ) | (110,019 | ) | (178,975 | ) | |||||||||||||||||||||||
| Net profit | 168,359 | 280,603 | 442,063 | |||||||||||||||||||||||||||
| Net profit attributable to: | ||||||||||||||||||||||||||||||
| Profit (loss) attributable to Owners of the Parent | 164,518 | 278,115 | 439,830 | |||||||||||||||||||||||||||
| Profit (loss) attributable to Non-controlling interests | 3,841 | 2,488 | 2,233 | |||||||||||||||||||||||||||
| 168,359 | 280,603 | 442,063 | ||||||||||||||||||||||||||||
| Profit from continuing operations | 442,063 | 428,417 | 281,924 | |||||||||||||||||||||||||||
| Profit attributable to | ||||||||||||||||||||||||||||||
| Owners of the Parent | 439,830 | 427,697 | 278,290 | |||||||||||||||||||||||||||
| Non-controlling interests | 2,233 | 720 | 3,634 | |||||||||||||||||||||||||||
| Profit for the year | 442,063 | 428,417 | 281,924 | |||||||||||||||||||||||||||
| Basic earnings per share (US$ per share) | 0.6251 | 1.0567 | 1.6711 | |||||||||||||||||||||||||||
| Diluted earnings per share (US$ per share) | 0.6251 | 1.0567 | 1.6711 | |||||||||||||||||||||||||||
The accompanying notes form an integral part of these consolidated financial statements.
| F-5 |
Consolidated Statements of Comprehensive Income by Function, (continued)
| January to December | ||||||||||||||||
| Note | 2018 | 2017 | 2016 | |||||||||||||
| US$ | US$ | US$ | ||||||||||||||
| Earnings per share | ||||||||||||||||
| Common shares | ||||||||||||||||
| Basic earnings per share (US$ per share) | 20 | 1.6711 | 1.6250 | 1.0573 | ||||||||||||
| Diluted common shares | ||||||||||||||||
| Diluted earnings per share (US$ per share) | 20 | 1.6711 | 1.6250 | 1.0573 | ||||||||||||
| For the period from January to December of the year | ||||||||||||
| 2020 | 2019 | 2018 | ||||||||||
| Consolidated Statements of Comprehensive Income | ThUS$ | ThUS$ | ThUS$ | |||||||||
| Net Profit | 168,359 | 280,603 | 442,063 | |||||||||
| Items of other comprehensive income that will not be reclassified to profit for the year, before taxes | ||||||||||||
| Losses from measurements of defined benefit plans | 974 | (3,310 | ) | (1,337 | ) | |||||||
| Gains (losses) from financial assets measured irrevocably at fair value through other comprehensive income | 9,784 | 1,152 | (5,546 | ) | ||||||||
| Total other comprehensive income (loss) that will not be reclassified to profit for the year, before taxes | 10,758 | (2,158 | ) | (6,883 | ) | |||||||
| Items of other comprehensive income that will be reclassified to profit for the year, before taxes | ||||||||||||
| Foreign currency exchange gains (losses) | 14,000 | 787 | (1,220 | ) | ||||||||
| (Losses) gains from cash flow hedges | (3,706 | ) | 1,908 | 5,723 | ||||||||
| Total other comprehensive income that will be reclassified to profit for the year | 10,294 | 2,695 | 4,503 | |||||||||
| Other items of other comprehensive income, before taxes | 21,052 | 537 | (2,380 | ) | ||||||||
| Income taxes related to items of other comprehensive income that will not be reclassified to profit for the year | ||||||||||||
| Income taxes relating to measurement of defined benefit pension plans through other comprehensive income | (145 | ) | 702 | 1,488 | ||||||||
| Benefit (income tax) relating to (losses) gains on financial assets measured irrevocably at fair value through other comprehensive income | (2,642 | ) | (311 | ) | 396 | |||||||
| Total income tax related to items of other comprehensive income (loss) that will not be reclassified to profit for the year | (2,787 | ) | 391 | 1,894 | ||||||||
| Income taxes relating to components of other comprehensive income that will be reclassified to profit for the year | ||||||||||||
| Income tax benefit (expense) related to (losses) gains from cash flow hedges | 1,001 | (2,683 | ) | — | ||||||||
| Total income tax relating to components of other comprehensive income that will be reclassified to profit for the year | 1,001 | (2,683 | ) | — | ||||||||
| Total other comprehensive income | 19,266 | (1,755 | ) | (486 | ) | |||||||
| Total comprehensive income | 187,625 | 278,848 | (441,577 | ) | ||||||||
| Comprehensive income attributable to | ||||||||||||
| Comprehensive income attributable to owners of the parent | 183,941 | 276,137 | 439,180 | |||||||||
| Comprehensive income attributable to non-controlling interest | 3,684 | 2,711 | 2,397 | |||||||||
| 187,625 | 278,848 | 441,577 | ||||||||||
The accompanying notes form an integral part of these consolidated financial statements.
| F-6 |
Consolidated Statements of Comprehensive Income
| January to December | ||||||||||||
| 2018 | 2017 | 2016 | ||||||||||
| Statement of comprehensive income | ThUS$ | ThUS$ | ThUS$ | |||||||||
| Profit for the year | 442,063 | 428,417 | 281,924 | |||||||||
| Other comprehensive income | ||||||||||||
| Items of other comprehensive income that will not be reclassified to profit for the year, before taxes | ||||||||||||
| Losses from measurements of defined benefit plans | (1,338 | ) | (1,392 | ) | (3,397 | ) | ||||||
| Loss from financial assets measured irrevocably at fair value through other comprehensive income | (5,546 | ) | ||||||||||
| Total other comprehensive income that will not be reclassified to profit for the year, before taxes | (6,884 | ) | (1,392 | ) | (3,397 | ) | ||||||
| Items of other comprehensive income that will be reclassified to profit for the year, before taxes | ||||||||||||
| Foreign currency exchange losses | (1,219 | ) | (5,446 | ) | (2,252 | ) | ||||||
| (Loss) gain from financial assets measured at fair value through other comprehensive income | - | (26 | ) | 4,813 | ||||||||
| Gain from cash flow hedges | 5,723 | 2,184 | 2,233 | |||||||||
| Total other comprehensive income that will be reclassified to profit for the year, before taxes | 4,504 | (3,288 | ) | 4,794 | ||||||||
| Total other comprehensive income before taxes | (2,380 | ) | (4,680 | ) | 1,397 | |||||||
| Income taxes related to items of other comprehensive income that will not be reclassified to profit for the year | ||||||||||||
| Income tax related to financial assets measured irrevocably at fair value through other comprehensive income | 1,498 | - | - | |||||||||
| Income taxes related to new measurements of defined benefit plans in other comprehensive income | 396 | 282 | 921 | |||||||||
| Total income taxes related to items of other comprehensive income that will not be reclassified to profit for the year | 1,894 | 282 | 921 | |||||||||
| Income tax relating to components of other comprehensive income that will be reclassified to profit (loss) for the year | ||||||||||||
| Income taxes related to cash flow hedges | - | - | (470 | ) | ||||||||
| Income tax related to financial assets measured at fair value through other comprehensive income | - | (550 | ) | (1,300 | ) | |||||||
| Total income tax relating to components of other comprehensive income that will be reclassified to profit (loss) for the year | - | (550 | ) | (1,770 | ) | |||||||
| Total other comprehensive income | (486 | ) | (4,948 | ) | 548 | |||||||
| Total comprehensive income | 441,577 | 423,469 | 282,472 | |||||||||
| Comprehensive income attributable to | ||||||||||||
| Owners of the Parent | 439,180 | 422,736 | 278,831 | |||||||||
| Non-controlling interests | 2,397 | 733 | 3,641 | |||||||||
| Total comprehensive income | 441,577 | 423,469 | 282,472 | |||||||||
The accompanying notes form an integral part of these consolidated financial statements.
Consolidated Statements of Cash Flows
| Consolidated Statements of cash flows | 12/31/2018 ThUS$ | 12/31/2017 ThUS$ | 12/31/2016 ThUS$ | |||||||||||||||||||||||
For the period from January to December | ||||||||||||||||||||||||||
| Cash flows from operating activities | ||||||||||||||||||||||||||
| 2020 | 2019 | 2018 | ||||||||||||||||||||||||
| Consolidated Statements of Cash Flows | Note N° | ThUS$ | ThUS$ | ThUS$ | ||||||||||||||||||||||
| Cash flows from (used in) operating activities | ||||||||||||||||||||||||||
| Classes of cash receipts from operating activities | ||||||||||||||||||||||||||
| Cash receipts from sales of goods and rendering of services | 2,284,514 | 2,082,366 | 1,874,202 | 1,940,720 | 2,044,746 | 2,284,514 | ||||||||||||||||||||
| Cash receipts from premiums and benefits, annuities and other benefits from policies entered | 2,140 | 2,967 | 5,071 | 14,763 | 2,925 | 2,140 | ||||||||||||||||||||
| Cash receipts derived from sub-leases | 188 | 361 | - | |||||||||||||||||||||||
| Classes of Payments | ||||||||||||||||||||||||||
| Cash payments to suppliers for the provision of goods and services | (1,201,674 | ) | (842,079 | ) | (851,972 | ) | (1,358,347 | ) | (1,284,204 | ) | (1,226,091 | ) | ||||||||||||||
| Cash payments to and on behalf of employees | (230,007 | ) | (227,103 | ) | (204,609 | ) | (161,862 | ) | (195,782 | ) | (205,590 | ) | ||||||||||||||
| Other payments related to operating activities (1) | (21,240 | ) | (65,444 | ) | (32,185 | ) | ||||||||||||||||||||
| Net cash generated from (used in) operating activities | 833,733 | 950,707 | 790,507 | |||||||||||||||||||||||
| Cash payments relating to variable leases | (1,117 | ) | (1,037 | ) | - | |||||||||||||||||||||
| Other payments related to operating activities | (87,278 | ) | (25,218 | ) | (21,240 | ) | ||||||||||||||||||||
| Net cash generated from operating activities | 347,067 | 541,791 | 833,733 | |||||||||||||||||||||||
| Dividends received | 8,815 | 2,091 | 4,345 | 5,387 | 14,449 | 8,815 | ||||||||||||||||||||
| Interest paid | (59,565 | ) | (51,335 | ) | (55,217 | ) | (81,567 | ) | (70,963 | ) | (59,565 | ) | ||||||||||||||
| Interest paid on lease liabilities | (1,133 | ) | (1,537 | ) | - | |||||||||||||||||||||
| Interest received | 22,533 | 13,499 | 10,550 | 17,046 | 25,809 | 22,533 | ||||||||||||||||||||
| Income taxes paid | (240,115 | ) | (148,568 | ) | (113,991 | ) | (200,624 | ) | (173,319 | ) | (240,115 | ) | ||||||||||||||
| Other (outflows) of cash (2) | (40,562 | ) | (8,122 | ) | (2,532 | ) | ||||||||||||||||||||
| Other cash inflows (1) | 96,058 | 90,741 | (40,562 | ) | ||||||||||||||||||||||
| Net cash generated from operating activities | 524,839 | 758,272 | 633,662 | 182,234 | 426,971 | 524,839 | ||||||||||||||||||||
| Cash flows from (used in) investing activities | ||||||||||||||||||||||||||
| Cash flows arising from the loss of control of subsidiaries and other businesses | 68,988 | - | - | |||||||||||||||||||||||
| Payments made to acquire interest in joint ventures | (19,989 | ) | (38,088 | ) | (45,000 | ) | ||||||||||||||||||||
| Cash flows arising from the loss/gain of control of subsidiaries and other businesses | 20,996 | 994 | 68,988 | |||||||||||||||||||||||
| Proceeds from the sale of property, plant and equipment | 61 | 229 | 4,347 | 1,680 | 487 | 61 | ||||||||||||||||||||
| Other payments to acquire interest in joint ventures | (16,949 | ) | (2,600 | ) | (19,989 | ) | ||||||||||||||||||||
| Acquisition of property, plant and equipment | (244,693 | ) | (142,144 | ) | (131,251 | ) | (322,242 | ) | (321,324 | ) | (244,693 | ) | ||||||||||||||
| Proceeds from sales of intangible assets | 14,056 | 8,640 | 3,435 | 8,203 | 28,126 | 14,056 | ||||||||||||||||||||
| Proceeds (payments) related to futures, forward options and swap contracts | (6,902 | ) | 1,403 | (204 | ) | |||||||||||||||||||||
| Purchases of intangible assets | (74,374 | ) | - | (2,090 | ) | (579 | ) | (2,492 | ) | (74,374 | ) | |||||||||||||||
| Proceeds from the repayment of advances and loans granted to third parties | (204 | ) | 78 | (163 | ) | |||||||||||||||||||||
| Other inflows (outflows) of cash (3) | 69,151 | (76,782 | ) | 333,108 | ||||||||||||||||||||||
| Net cash (used in) generated from investing activities | (187,004 | ) | (248,067 | ) | 162,386 | |||||||||||||||||||||
| Loans to related parties | (15,000 | ) | - | - | ||||||||||||||||||||||
| Other cash inflows (outflows) (2) | 163,702 | (190,065 | ) | 69,151 | ||||||||||||||||||||||
| Net cash generated used in investing activities | (167,091 | ) | (485,471 | ) | (187,004 | ) | ||||||||||||||||||||
(1) Includes a payment of ThUS$30,000 made to the SEC and the DOJ, which was provisioned in 2016 and paid in 2017.
(2) Other inflows (outflows) of cash from operating activities include net increases (decreases) net of Value Added Tax.value added tax, banking expenses, expenses associated with obtaining loans and taxes associated with interest payments.
(3)
(2) Other inflows (outflows) of cash include investments and redemptions of time deposits and other financial instruments that do not qualify as cash and cash equivalent in accordance with IAS 7, paragraph 7, since they mature in more than 90 days from the original investment date.
The accompanying notes form an integral part of these consolidated financial statements.
| F-7 |
Consolidated Statements of Cash Flows
| For the period from January to December of the year | ||||||||||||||
| 2020 | 2019 | 2018 | ||||||||||||
| Consolidated Statements of Cash Flows | Note N° | ThUS$ | ThUS$ | ThUS$ | ||||||||||
| Cash flows generated from (used in) financing activities | ||||||||||||||
| Repayment of lease liabilities | (8,015 | ) | (7,221 | ) | - | |||||||||
| Proceeds from long-term loans | 400,000 | 450,000 | 256,039 | |||||||||||
| Proceeds from short-term loans | - | - | 120,000 | |||||||||||
| Repayment of borrowings | (264,122 | ) | (7,096 | ) | (213,000 | ) | ||||||||
| Dividends paid | (221,995 | ) | (329,787 | ) | (550,352 | ) | ||||||||
| Net cash generated (used in) from financing activities | (94,132 | ) | 105,896 | (387,313 | ) | |||||||||
| Net (decrease) increase in cash and cash equivalents before the effect of changes in the exchange rate | (78,989 | ) | 47,396 | (49,478 | ) | |||||||||
| Effects of exchange rate fluctuations on cash and cash equivalents | (439 | ) | (14,932 | ) | (24,894 | ) | ||||||||
| (Decrease) increase in cash and cash equivalents | (79,428 | ) | 32,464 | (74,372 | ) | |||||||||
| Cash and cash equivalents at beginning of period | 588,530 | 556,066 | 630,438 | |||||||||||
| Cash and cash equivalents at end of period | 10 | 509,102 | 588,530 | 556,066 | ||||||||||
The accompanying notes form an integral part of these consolidated financial statements.
| F-8 |
Consolidated Statements of Cash Flows, (continued)Changes in Equity
| Consolidated Statements | Share capital | Foreign currency translation reserves | Hedge reserves | Gains and losses from financial assets reserve | Actuarial gains and losses from defined benefit plans reserve | Other miscellaneous reserves | Total reserves | Retained earnings | Equity attributable to owners of the Parent | Non- controlling interests | Total Equity | |||||||||||||||||||||||||||||||||
| of Changes in Equity | ThUS$ | ThUS$ | ThUS$ | ThUS$ | ThUS$ | ThUS$ | ThUS$ | ThUS$ | ThUS$ | ThUS$ | ThUS$ | |||||||||||||||||||||||||||||||||
| Equity at January 1, 2020 | 477,386 | (25,745 | ) | 7,196 | (270 | ) | (9,490 | ) | 14,086 | (14,223 | ) | 1,623,104 | 2,086,267 | 48,205 | 2,134,472 | |||||||||||||||||||||||||||||
| Net profit | - | - | - | - | - | - | - | 164,518 | 164,518 | 3,841 | 168,359 | |||||||||||||||||||||||||||||||||
| Other comprehensive income | - | 14,176 | (2,705 | ) | 7,142 | 810 | - | 19,423 | - | 19,423 | (157 | ) | 19,266 | |||||||||||||||||||||||||||||||
| Comprehensive income | - | 14,176 | (2,705 | ) | 7,142 | 810 | - | 19,423 | 164,518 | 183,941 | 3,684 | 187,625 | ||||||||||||||||||||||||||||||||
| Dividends (1) | - | - | - | - | - | - | - | (149,355 | ) | (149,355 | ) | (10,118 | ) | (159,473 | ) | |||||||||||||||||||||||||||||
| Other increases (decreases) in equity | - | - | - | - | - | 2,232 | 2,232 | - | 2,232 | (2,278 | ) | (46 | ) | |||||||||||||||||||||||||||||||
| Total changes in equity | - | 14,176 | (2,705 | ) | 7,142 | 810 | 2,232 | 21,655 | 15,163 | 36,818 | (8,712 | ) | 28,106 | |||||||||||||||||||||||||||||||
| Equity as of December 31, 2020 | 477,386 | (11,569 | ) | 4,491 | 6,872 | (8,680 | ) | 16,318 | 7,432 | 1,638,267 | 2,123,085 | 39,493 | 2,162,578 | |||||||||||||||||||||||||||||||
| Consolidated Statements | Share capital | Foreign currency translation reserves | Hedge reserves | Gains and losses from financial assets reserve | Actuarial gains and losses from defined benefit plans reserve | Other miscellaneous reserves | Total reserves | Retained earnings | Equity attributable to owners of the Parent | Non- controlling interests | Total Equity | |||||||||||||||||||||||||||||||||
| of Changes in Equity | ThUS$ | ThUS$ | ThUS$ | ThUS$ | ThUS$ | ThUS$ | ThUS$ | ThUS$ | ThUS$ | ThUS$ | ThUS$ | |||||||||||||||||||||||||||||||||
| Equity at January 1, 2019 | 477,386 | (26,307 | ) | 7,971 | (1,111 | ) | (6,884 | ) | 11,332 | (14,999 | ) | 1,623,104 | 2,085,491 | 52,311 | 2,137,802 | |||||||||||||||||||||||||||||
| Net Profit | - | - | - | - | - | - | - | 278,115 | 278,115 | 2,488 | 280,603 | |||||||||||||||||||||||||||||||||
| Other comprehensive income | - | 562 | (775 | ) | 841 | (2,606 | ) | - | (1,978 | ) | - | (1,978 | ) | 223 | (1,755 | ) | ||||||||||||||||||||||||||||
| Comprehensive income | - | 562 | (775 | ) | 841 | (2,606 | ) | - | (1,978 | ) | 278,115 | 276,137 | 2,711 | 278,848 | ||||||||||||||||||||||||||||||
| Dividends (1) | - | - | - | - | - | - | - | (278,115 | ) | (278,115 | ) | (6,817 | ) | (284,932 | ) | |||||||||||||||||||||||||||||
| Other increases (decreases) in equity | - | - | - | - | - | 2,754 | 2,754 | - | 2,754 | - | 2,754 | |||||||||||||||||||||||||||||||||
| Total changes in equity | - | 562 | (775 | ) | 841 | (2,606 | ) | 2,754 | 776 | - | 776 | (4,106 | ) | (3,330 | ) | |||||||||||||||||||||||||||||
| Equity as of December 31, 2019 | 477,386 | (25,745 | ) | 7,196 | (270 | ) | (9,490 | ) | 14,086 | (14,223 | ) | 1,623,104 | 2,086,267 | 48,205 | 2,134,472 | |||||||||||||||||||||||||||||
| Note | 12/31/2018 ThUS$ | 12/31/2017 ThUS$ | 12/31/2016 ThUS$ | |||||||||||
| Cash flows used in financing activities | ||||||||||||||
| Proceeds from long-term loans | 256,039 | - | - | |||||||||||
| Proceeds from short-term borrowings | 120,000 | 143,000 | 100,000 | |||||||||||
| Repayment of borrowings | (213,000 | ) | (180,987 | ) | (517,000) | |||||||||
| Dividends paid | (550,352 | ) | (373,933 | ) | (399,410) | |||||||||
| Net cash generated used in financing activities | (387,313 | ) | (411,920 | ) | (816,410) | |||||||||
| Net (decrease) increase in cash and cash equivalents before the effect of changes in the exchange rate | (49,478 | ) | 98,285 | (20,362) | ||||||||||
| Effects of exchange rate fluctuations on cash and cash equivalents | (24,894 | ) | 17,484 | 7,772 | ||||||||||
| Net (decrease) increase in cash and cash equivalents | (74,372 | ) | 115,769 | (12,590) | ||||||||||
| Cash and cash equivalents at beginning of period | 630,438 | 514,669 | 527,259 | |||||||||||
| Cash and cash equivalents at end of period | 556,066 | 630,438 | 514,669 | |||||||||||
| (1) | See Note 20.6 |
The accompanying notes form an integral part of these consolidated financial statements.
| F-9 |
Consolidated Statements of Changes in Equity
| Consolidated Statements | Share capital | Foreign currency translation reserves | Hedge reserves | Gains and losses from financial assets reserve | Actuarial gains and losses from defined benefit plans reserve | Other miscellaneous reserves | Total reserves | Retained earnings | Equity attributable to owners of the Parent | Non- controlling interests | Total Equity | |||||||||||||||||||||||||||||||||
| of Changes in Equity | ThUS$ | ThUS$ | ThUS$ | ThUS$ | ThUS$ | ThUS$ | ThUS$ | ThUS$ | ThUS$ | ThUS$ | ThUS$ | |||||||||||||||||||||||||||||||||
| Equity at January 1, 2018 | 477,386 | (24,913 | ) | 2,248 | 2,937 | (5,953 | ) | 11,332 | (14,349 | ) | 1,724,784 | 2,187,821 | 59,647 | 2,247,468 | ||||||||||||||||||||||||||||||
| Decrease due to changes in accounting policies | - | - | - | - | - | - | - | (1,680 | ) | (1,680 | ) | - | (1,680 | ) | ||||||||||||||||||||||||||||||
| Restated initial equity | 477,386 | (24,913 | ) | 2,248 | 2,937 | (5,953 | ) | 11,332 | (14,349 | ) | 1,723,104 | 2,186,141 | 59,647 | 2,245,788 | ||||||||||||||||||||||||||||||
| Net profit | - | - | - | - | - | - | - | 439,830 | 439,830 | 2,233 | 442,063 | |||||||||||||||||||||||||||||||||
| Other comprehensive income | - | (1,394 | ) | 5,723 | (4,048 | ) | (931 | ) | - | (650 | ) | - | (650 | ) | 164 | (486 | ) | |||||||||||||||||||||||||||
| Comprehensive income | - | (1,394 | ) | 5,723 | (4,048 | ) | (931 | ) | - | (650 | ) | 439,830 | 439,180 | 2,397 | 441,577 | |||||||||||||||||||||||||||||
| Dividends (1) | - | - | - | - | - | - | - | (539,830 | ) | (539,830 | ) | (9,733 | ) | (549,563 | ) | |||||||||||||||||||||||||||||
| Increase (decrease) in equity | - | (1,394 | ) | 5,723 | (4,048 | ) | (931 | ) | - | (650 | ) | (100,000 | ) | (100,650 | ) | (7,336 | ) | (107,986 | ) | |||||||||||||||||||||||||
| Equity as of December 31, 2018 | 477,386 | (26,307 | ) | 7,971 | (1,111 | ) | (6,884 | ) | 11,332 | (14,999 | ) | 1,623,104 | 2,085,491 | 52,311 | 2,137,802 | |||||||||||||||||||||||||||||
| 2018 | Share capital | Foreign currency translation difference reserves | Gains from cash flow hedge | Gains (losses) from financial assets measured at fair value through other comprehensive income | Losses from measurement of defined benefit plans | Other miscellaneous reserves | Total Other | Retained earnings | Equity attributable to owners of the Parent | Non- controlling interests | Total | |||||||||||||||||||||||||||||||||
| ThUS$ | ThUS$ | ThUS$ | ThUS$ | ThUS$ | ThUS$ | ThUS$ | ThUS$ | ThUS$ | ThUS$ | ThUS$ | ||||||||||||||||||||||||||||||||||
| Equity at beginning of the year | 477,386 | (24,913 | ) | 2,248 | 2,937 | (5,953 | ) | 11,332 | (14,349 | ) | 1,724,784 | 2,187,821 | 59,647 | 2,247,468 | ||||||||||||||||||||||||||||||
| Increase (decrease) due to changes in accounting policies (1) | - | - | - | - | - | - | - | (1,680 | ) | (1,680 | ) | - | (1,680 | ) | ||||||||||||||||||||||||||||||
| Restated opening balance of equity | 477,386 | (24,913 | ) | 2,248 | 2,937 | (5,953 | ) | 11,332 | (14,349 | ) | 1,723,104 | 2,186,141 | 59,647 | 2,245,788 | ||||||||||||||||||||||||||||||
| Profit for the year | - | - | - | - | - | - | 439,830 | 439,830 | 2,233 | 442,063 | ||||||||||||||||||||||||||||||||||
| Other comprehensive income | - | (1,394 | ) | 5,723 | (4,048 | ) | (931 | ) | - | (650 | ) | - | (650 | ) | 164 | (486 | ) | |||||||||||||||||||||||||||
| Comprehensive income | - | (1,394 | ) | 5,723 | (4,048 | ) | (931 | ) | - | (650 | ) | 439,830 | 439,180 | 2,397 | 441,577 | |||||||||||||||||||||||||||||
| Dividends | - | - | - | - | - | - | - | (539,830 | ) | (539,830 | ) | (9,733 | ) | (549,563 | ) | |||||||||||||||||||||||||||||
| Increase (decrease) in equity | - | (1,394 | ) | 5,723 | (4,048 | ) | (931 | ) | - | (650 | ) | (100,000 | ) | (100,650 | ) | (7,336 | ) | (107,986 | ) | |||||||||||||||||||||||||
Equity as of December 31, 2018
| 477,386 | (26,307 | ) | 7,971 | (1,111 | ) | (6,884 | ) | 11,332 | (14,999 | ) | 1,623,104 | 2,085,491 | 52,311 | 2,137,802 | |||||||||||||||||||||||||||||
The accompanying notes form an integral part of these consolidated financial statements.
| F-10 |
Consolidated Statements of Changes in Equity, (continued)Glossary
| 2017 | Share capital | Foreign currency translation difference reserves | Gains from cash flow hedge | Gains (losses) from financial assets measured at fair value through other comprehensive income | Losses from measurement of defined benefit plans | Other miscellaneous reserves | Total Other | Retained earnings | Equity attributable to owners of the Parent | Non- controlling interests | Total | |||||||||||||||||||||||||||||||||
| ThUS$ | ThUS$ | ThUS$ | ThUS$ | ThUS$ | ThUS$ | ThUS$ | ThUS$ | ThUS$ | ThUS$ | ThUS$ | ||||||||||||||||||||||||||||||||||
| Equity at beginning of the year | 477,386 | (19,463 | ) | 64 | 3,513 | (4,834 | ) | 7,832 | (12,888 | ) | 1,781,576 | 2,246,074 | 61,198 | 2,307,272 | ||||||||||||||||||||||||||||||
| Profit for the year | - | - | - | - | - | - | 427,697 | 427,697 | 720 | 428,417 | ||||||||||||||||||||||||||||||||||
| Other comprehensive income | - | (5,450 | ) | 2,184 | (576 | ) | (1,119 | ) | - | (4,961 | ) | - | (4,961 | ) | 13 | (4,948 | ) | |||||||||||||||||||||||||||
| Comprehensive income | - | (5,450 | ) | 2,184 | (576 | ) | (1,119 | ) | - | (4,961 | ) | 427,697 | 422,736 | 733 | 423,469 | |||||||||||||||||||||||||||||
| Dividends | - | - | - | - | - | - | - | (480,989 | ) | (480,989 | ) | (2284 | ) | (483,273 | ) | |||||||||||||||||||||||||||||
| Increase (decrease) due to transfers and other changes | - | - | - | - | - | 3,500 | 3,500 | (3,500 | ) | - | - | - | ||||||||||||||||||||||||||||||||
| Increase (decrease) in equity | - | (5,450 | ) | 2,184 | (576 | ) | (1,119 | ) | 3,500 | (1,461 | ) | (56,792 | ) | (58,253 | ) | (1,551 | ) | (59,804 | ) | |||||||||||||||||||||||||
| Equity as of December 31, 2017 | 477,386 | (24,913 | ) | 2,248 | 2,937 | (5,953 | ) | 11,332 | (14,349 | ) | 1,724,784 | 2,187,821 | 59,647 | 2,247,468 | ||||||||||||||||||||||||||||||
The accompanyingFollowing capitalized terms un these notes form an integral partwill have the following meaning:
“ADS’’ American Depositary Shares;
“CAM’’ Arbitration and Mediation Center of these consolidated financial statements.the Santiago Chamber of Commerce;
“CCHEN’’ Chilean Nuclear Energy Commission;
“CCS’’ cross currency swap;
“CINIIF’’ International Financial Reporting Interpretations Committee;
“CMF’’ Financial Market Commission;
“Directors’ Committee” The Company’s Directors’ Committee;
“Corporate Governance Committee’’ The Company’s Corporate Governance Committee;
“Health, Safety and Environment Committee’’ The Company’s Health, Safety and Environment Committee;
“Lease Agreement’’ the mining concessions lease agreement signed by SQM Salar and Corfo in 1993, as subsequently amended;
“Project Contract” project contract for Salar de Atacama undersigned by Corfo and SQM Salar in 1993, as subsequently amended”;
“Corfo” Chilean Economic Development Agency;
“DCV’’ Central Securities Depository;
“DGA’’ General Directorate of Water Resources;
“Board” The Company’s Board of Directors;
“DOJ’’ United States Department of Justice;
“Dollar’’ o “US$’’ Dollars of the United States of America;
“DPA’’ Deferred Prosecution Agreement;
“EIEP’’ Passive foreign investment company;
“United States” United States of America;
“FCPA’’ Foreign Corrupt Practices Act of the USA;
“FNE Chilean National Economic Prosecutor's Office;
“Management’’ the Company’s management;
"SQM Group’’ The corporate group composed of the Company and its subsidiaries
“Pampa Group’’ Jointly the Sociedad de Inversiones Pampa Calichera S.A., Potasios de Chile S.A. and Inversiones Global Mining (Chile) Limitada;
“IASB’’ International Accounting Standards Board;
“SSI’’ Staff severance indemnities;
| F-11 |
Consolidated Statements of Changes in Equity, (continued)“IFRIC’’ International Financial Reporting Interpretations Committee;
“IPC” Consumer Price Index;
| 2016 | Share capital | Foreign currency translation difference reserves | Gains from cash flow hedge | Gains (losses) from financial assets measured at fair value through other comprehensive income | Losses from measurement of defined benefit plans | Other miscellaneous reserves | Other reserves | Retained earnings | Equity attributable to owners of the Parent | Non- controlling interests | Total | |||||||||||||||||||||||||||||||||
| ThUS$ | ThUS$ | ThUS$ | ThUS$ | ThUS$ | ThUS$ | ThUS$ | ThUS$ | ThUS$ | ThUS$ | ThUS$ | ||||||||||||||||||||||||||||||||||
| Equity at beginning of the year | 477,386 | (14,035 | ) | (1,699 | ) | (2,386 | ) | (1,677 | ) | (19,797 | ) | 1,882,196 | 2,339,785 | 60,571 | 2,400,356 | |||||||||||||||||||||||||||||
| Profit for the year | - | - | - | - | - | - | 278,290 | 278,290 | 3,634 | 281,924 | ||||||||||||||||||||||||||||||||||
| Other comprehensive income | - | (2,287 | ) | 1,763 | 3,513 | (2,448 | ) | - | 541 | - | 541 | 7 | 548 | |||||||||||||||||||||||||||||||
| Comprehensive income | - | (2,287 | ) | 1,763 | 3,513 | (2,448 | ) | - | 541 | 278,290 | 278,831 | 3,641 | 282,472 | |||||||||||||||||||||||||||||||
| Dividends | - | - | - | - | - | - | - | (375,000 | ) | (375,000 | ) | (3,014 | ) | (378,014 | ) | |||||||||||||||||||||||||||||
| (Decrease) increase due to transfers and other changes | (3,141 | ) | - | - | - | 9,509 | 6,368 | (3,910 | ) | 2,458 | - | 2,458 | ||||||||||||||||||||||||||||||||
| (Decrease) increase in equity | - | (5,428 | ) | 1,763 | 3,513 | (2,448 | ) | 9,509 | 6,909 | (100,620 | ) | (93,711 | ) | 627 | (93,084 | ) | ||||||||||||||||||||||||||||
| Equity as of December 31, 2016 | 477,386 | (19,463 | ) | 64 | 3,513 | (4,834 | ) | 7,832 | (12,888 | ) | 1,781,576 | 2,246,074 | 61,198 | 2,307,272 | ||||||||||||||||||||||||||||||
The accompanying notes form an integral part“IRS” interest rate swap;
“Securities Market Law” Securities Market Law No. 18,045;
“Corporate Law'' Ley 18,046 on corporations;
“ThUS$'' thousands of these consolidated financial statements.Dollars;
“MUS$'' millions of Dollars;
“IAS” International Accounting Standard;
“IFRS” International Financial Reporting Standard;
“ILO” International Labour Organization;
“WHO” World Health Organization;
“Pesos’’ or “Ch$” Chilean pesos, legal tender in Chile;
“SEC’’ Securities and Exchange Commission;
“Sernageomin’’ National Geology and Mining Service;
“SIC’’ Standard Interpretations Committee;
“SII” Chilean Internal Revenue Service;
“SMA” Environmental Superintendent’s Office;
“Company” Sociedad Química y Minera de Chile S.A.;
“SQM Industrial’’ SQM Industrial S.A.;
“SQM NA’’ SQM North America Corporation;
“SQM Nitratos’’ SQM Nitratos S.A.;
“SQM Potasio’’ SQM Potasio S.A.;
“SQM Salar’’ SQM Salar S.A.;
“Tianqi’’ Tianqi Lithium Corporation; and
“UF’’ Unidad de Fomento (a Chilean Peso based inflation indexed currency unit);
“WACC’’ Weighted Average Cost of Capital.
| F-12 |
Notes to the Consolidated Financial Statements as of December 31, 2018
Note 1 Identification and Activities of the Company and Subsidiaries
| 1.1 | Historical background |
Sociedad Química y Minera de Chile S.A. "SQM" is an open stock corporation founded under the laws of the Republic of Chile and its Chilean Tax Identification Number is 93.007.000-9.
The Company was incorporated through a public deed dated June 17, 1968 by the public notary of Santiago Mr. Sergio Rodríguez Garcés. Its existence was approved by Decree No. 1,164 of June 22, 1968 of the Ministry of Finance, and it was registered on June 29, 1968 in the Registry of Commerce of Santiago, on page 4,537 No. 1,992. SQM’s headquarters are located at El Trovador 4285, Floor 6, Las Condes, Santiago, Chile.Chile, The Company's telephone number is +56 2+(56 2) 2425-2000.
The Company is registered within the Commission for Financial Markets (CMF) (formerly the Chilean Superintendence of Securities and Insurance (SVS))CMF under number 184 of March 18, 1983 and is therefore subject to oversight by that entity.
| 1.2 | Main domicile where the Company performs its production activities |
The Company’s main domiciles are: Calle Dos Sur plot No. 5 - Antofagasta; Arturo Prat 1060 - Tocopilla; Administration Building w/n - Maria Elena; Administration Building w/n Pedro de Valdivia - María Elena, Anibal Pinto 3228 - Antofagasta, Kilometer 1378 Ruta 5 Norte Highway - Antofagasta, Coya Sur Plant w/n - Maria Elena, kilometer 1760 Ruta 5 Norte Highway - Pozo Almonte, Salar de Atacama (Atacama Saltpeter deposit) potassium chloride plant w/n - San Pedro de Atacama, potassium sulfate plant at Salar de Atacama w/n – San Pedro de Atacama, Minsal Mining Camp w/n CL Plant CL, Potassium– San Pedro de Atacama, formerly the Iris Saltpeter office w/n, Commune of Pozo Almonte, Iquique.
| 1.3 | Codes of main activities |
The codes of the main activities as established by the CMF, as follows:
| - | 1700 (Mining) |
| - | 2200 (Chemical products) |
| - | 1300 (Investment) |
| 1.4 | Description of the nature of operations and main activities |
OurThe products of the Company are mainly derived from mineral deposits found in northern Chile. We mineChile where mining takes place and process caliche ore and brine deposits. The caliche ore in northern Chile contains the only known nitrate and iodine deposits in the world and is the world’s largest commercially exploited source of natural nitrates. The brine deposits of the Salar de Atacama, a salt-encrusted depression in the Atacama Desert in northern Chile, contain high concentrations of lithium and potassium as well as significant concentrations of sulfate and boron.are processed.
| (a) | Specialty plant nutrition: Four main types of specialty plant nutrients are produced: potassium nitrate, sodium nitrate, sodium potassium nitrate and specialty blends. In addition, other specialty fertilizers are sold including third party products. |
| (b) | Iodine: The Company produces iodine and iodine derivatives, which are used in a wide range of medical, pharmaceutical, agricultural and industrial applications, including x-ray contrast media, polarizing films for LCD and LED, antiseptics, biocides and disinfectants, in the synthesis of pharmaceuticals, electronics, pigments and dye components. |
| (c) | Lithium: The Company produces lithium carbonate, which is used in a variety of applications, including electrochemical materials for batteries, frits for the ceramic and enamel industries, heat-resistant glass (ceramic glass), air conditioning chemicals, continuous casting powder for steel extrusion, primary aluminum smelting process, pharmaceuticals and lithium derivatives. We are also a leading supplier of lithium hydroxide, which is primarily used as an input for the lubricating greases industry and for certain cathodes for batteries. |
| F-13 |
Notes to the Consolidated Financial Statements as of December 31, 2018
| (f) | Other products and services: The Company also sells other fertilizers and blends, some of |
From our caliche ore deposits, we produce a wide range of nitrate-based products used for specialty plant nutrients and industrial applications, as well as iodine and iodine derivatives. At the Salar de Atacama, we extract brines rich in potassium, lithium, sulfate and boron in order to produce potassium chloride, potassium sulfate, lithium solutions and bischofite (magnesium chloride). We produce lithium carbonate and lithium hydroxide at our plant near the city of Antofagasta, Chile, from the solutions brought from the Salar de Atacama. We market all of these products through an established worldwide distribution network.
Our products are sold in over 110 countries through our worldwide distribution network, with the majority of our sales derived from countries outside Chile.
Our products are divided into six categories: specialty plant nutrients; iodine and its derivatives; lithium and its derivatives; potassium chloride and potassium sulfate; industrial chemicals and other commodity fertilizers, described as follows:
Specialty plant nutrition: We produce four main types of specialty plant nutrients: potassium nitrate, sodium nitrate, sodium potassium nitrate and specialty blends. We also sell other specialty fertilizers including third party products. All of these specialty plant nutrients are used in either solid or liquid form mainly on high value crops such as vegetables, fruits and flowers. Our nutrients are widely used in crops that employ modern agricultural techniques such as hydroponics, green housing, fertigation (where fertilizer is dissolved in water prior to irrigation) and foliar application. Specialty plant nutrients have certain advantages over commodity fertilizers, such as rapid and effective absorption (without requiring nitrification), superior water solubility, increased soil pH (which reduces soil acidity) and low chloride content. One of the most important products in this business line is potassium nitrate, which is sold in crystalline or prill form, allowing for multiple application methods. Crystalline potassium nitrate products are ideal for application by fertigation and foliar sprays, and potassium nitrate prills are suitable for soil applications.
The new needs of more sophisticated customers demand that the industry provide integrated solutions rather than individual products. Our products, including customized specialty blends that meet specific needs along with the agronomic service provided, allow to create plant nutrition solutions that add value to crops through higher yields and better quality production. Because our products are derived from natural nitrate compounds or natural potassium brines, they have certain advantages over synthetically produced fertilizers, including the presence of certain beneficial trace elements, which makes them more attractive to customers who prefer products of natural origin. As a result, specialty plant nutrients are sold at a premium price compared to commodity fertilizers.
Iodine: We believe that we are the world’s leading producer of iodine and iodine derivatives, which are used in a wide range of medical, pharmaceutical, agricultural and industrial applications, including x-ray contrast media, polarizing films for LCD and LED, antiseptics, biocides and disinfectants, in the synthesis of pharmaceuticals, electronics, pigments and dye components.
| F-14 |
Notes to the Consolidated Financial Statements as of December 31, 2018
Lithium: We are a leading producer of lithium carbonate, which is used in a variety of applications, including electrochemical materials for batteries, frits for the ceramic and enamel industries, heat-resistant glass (ceramic glass), air conditioning chemicals, continuous casting powder for steel extrusion, primary aluminum smelting process, pharmaceuticals and lithium derivatives. We are also a leading supplier of lithium hydroxide, which is primarily used as an input for the lubricating greases industry and for certain cathodes for batteries.
Industrial chemicals: We produce three industrial chemicals: sodium nitrate, potassium nitrate and potassium chloride. Sodium nitrate is used primarily in the production of glass, explosives, and metal treatment. Potassium nitrate is used in the manufacturing of specialty glass, and it is also an important raw material for the production of frits for the ceramics and enamel industries. Solar salts, a combination of potassium nitrate and sodium nitrate, are used as a thermal storage medium in concentrated solar power plants. Potassium chloride is a basic chemical used to produce potassium hydroxide, and it is also used as an additive in oil drilling as well as in food processing, among other uses.Potassium: We produce potassium chloride and potassium sulfate from brines extracted from the Salar de Atacama. Potassium chloride is a commodity fertilizer used to fertilize a variety of crops including corn, rice, sugar, soybean and wheat. Potassium sulfate is a specialty fertilizer used mainly in crops such as vegetables, fruits and industrial crops.
Other products and services: We also sell other fertilizers and blends, some of which we do not produce. We are the largest company that produces and distributes the three main potassium sources: potassium nitrate, potassium sulfate and potassium chloride. This business line also includes revenue from commodities, services, interests, royalties and dividends.
Our subsidiary SQM Salar holds exclusive rights to exploit the mineral resources in an area covering approximately 140,000 hectares of land in the Salar de Atacama in northern Chile, of which SQM Salar is only entitled to exploit the mineral resources in 81,920 hectares. These rights are owned by Corfo and leased to SQM Salar pursuant to the Lease Agreement. Corfo cannot unilaterally amend the Lease Agreement and the Project Agreement, and the rights to exploit the resources cannot be transferred. The Lease Agreement establishes that SQM Salar is responsible for making quarterly lease payments to Corfo according to specified percentages of the value of production of minerals extracted from the Salar de Atacama brines, maintaining Corfo’s rights over the Mining Exploitation Concessions and making annual payments to the Chilean government for such concession rights. The Lease Agreement was entered into in 1993 and expires on December 31, 2030. On January 17, 2018, SQM and CORFO reached an agreement to end an arbitration process directed by the arbitrator, Mr. Héctor Humeres Noguer, in case 1954-2014 of the Arbitration and Mediation Center of Santiago Chamber of Commerce (Centro de Arbitrajes y Mediación de la Cámara de Comercio de Santiago) and other cases related to it.
The agreement signed in January 2018, includes important amendments to the lease agreement and project agreement signed between CORFO and SQM in 1993. The main modifications became effective on April 10, 2018 and requires an increase in the lease payments by increasing the lease rates associated with the sale of the different products produced in the Salar de Atacama, including lithium carbonate, lithium hydroxide and potassium chloride. In regard to lithium carbonate, the former rate of 6.8% on FOB sales was changed to the following structure of progressive rates based on the final sale price:
| ||||
Notes to the Consolidated Financial Statements as of December 31, 2018
See Note 25.2 for the disclosure of lease payments made to CORFO for all periods presented.
In regard to potassium chloride, the former rate of 1.8% on FOB sales was changed to the following structure of progressive rates based on the final sale price:
Similarly, the lease rates associated with the other products (lithium hydroxide, potassium sulfate and others) shall have similar changes to those described in the previous products.
SQM Salar commits to contribute between US$10.8 and US$18.9 million per year to research and development efforts, between US$10 to US$15 million per year to the communities in close proximity to the Salar de Atacama, and 1.7% of total annual sales of SQM Salar to regional development.
Staff
As of December 31, 2018,2020, and December 31, 2017,2019, the workforce was as follows:
| 12/31/2018 | 12/31/2017 | |||||||||||||||||||||||
| Employees | SQM S.A. | Other subsidiaries | Total | SQM S.A. | Other subsidiaries | Total | ||||||||||||||||||
| Executives | 33 | 89 | 122 | 43 | 77 | 120 | ||||||||||||||||||
| Professionals | 115 | 1,078 | 1,193 | 143 | 942 | 1,085 | ||||||||||||||||||
| Technicians and operators | 260 | 3,287 | 3,547 | 248 | 3,177 | 3,425 | ||||||||||||||||||
| Foreign employees | 11 | 417 | 428 | 19 | 272 | 291 | ||||||||||||||||||
| Overall total | 419 | 4,871 | 5,290 | 453 | 4,468 | 4,921 | ||||||||||||||||||
Notes to the Consolidated Financial Statements as of December 31, 2018
| As of December 31, 2020 | As of December 31, 2019 | |||||||||||||||||||||||
| Employees | SQM S.A. | other subsidiaries | Total | SQM S.A. | other subsidiaries | Total | ||||||||||||||||||
| Executives | 30 | 85 | 115 | 30 | 91 | 121 | ||||||||||||||||||
| Professionals | 94 | 1,156 | 1,250 | 110 | 1,170 | 1,280 | ||||||||||||||||||
| Technicians and operators | 267 | 3,310 | 3,577 | 282 | 3,481 | 3,763 | ||||||||||||||||||
| Foreign employees | 17 | 548 | 565 | 17 | 560 | 577 | ||||||||||||||||||
| Overall total | 408 | 5,099 | 5,507 | 439 | 5,302 | 5,741 | ||||||||||||||||||
Main shareholdersAs of December 31, 2020, there were 1,358 shareholders.
The followingFollowing table shows information about the main shareholders of the Company’s Series A or Series B shares in circulation as of December 31, 20182020 and December 31, 2017,2019, in line with information provided by the Central Securities Depository:
The following table presents the information about the beneficial ownership of Series A and Series B shares of the Company as of December 31, 2018 and December 31, 2017,DCV, with respect to each shareholder that, to our knowledge, owns more than 5% of the outstanding Series A or Series B shares. The following information is derived from our registry and reports managed by the Central Securities DepositoryDCV and informed to the CMF and the Chilean Stock Exchanges.Exchanges:
| Shareholders as of December 31, 2020 | No. of Series A | % of Series A shares | No. of Series B | % of Series B shares | % of total shares | |||||||||||||||
| Inversiones TLC SpA (1) | 62,556,568 | 43.80 | % | - | - | 23.77 | % | |||||||||||||
| The Bank of New York Mellon, ADRs | - | - | 50,792,452 | 42.19 | % | 19.30 | % | |||||||||||||
| Sociedad de Inversiones Pampa Calichera S.A. (2) | 44,894,152 | 31.43 | % | 922,971 | 0.77 | % | 17.41 | % | ||||||||||||
| Potasios de Chile S.A. | 18,179,147 | 12.73 | % | - | - | 6.91 | % | |||||||||||||
| Inversiones Global Mining (Chile) Limitada | 8,798,539 | 6.16 | % | - | - | 3.34 | % | |||||||||||||
| Euroamerica C de B S. A. | 1,418 | - | 8,788,517 | 7.30 | % | 3.34 | % | |||||||||||||
| Banco Santander via foreign investor accounts | - | - | 7,294,827 | 6.06 | % | 2.77 | % | |||||||||||||
| Banco de Chile via State Street | - | - | 6,971,782 | 5.79 | % | 2.65 | % | |||||||||||||
| Banco de Chile non-resident third party accounts | - | - | 6,129,339 | 5.09 | % | 2.33 | % | |||||||||||||
| Inversiones la Esperanza de Chile Limitada | 4,147,263 | 2.90 | % | 46,500 | 0.04 | % | 1.59 | % | ||||||||||||
| Banchile Corredora de Bolsa S. A. | 459,202 | 0.32 | % | 2,426,758 | 2.02 | % | 1.10 | % | ||||||||||||
| Banco de Chile on behalf of Citibank NA New York customers | 177,463 | 0.12 | % | 1,732,249 | 1.44 | % | 0.73 | % | ||||||||||||
| F-15 |
| Shareholder as of December 31, 2018 | No, of Series A with ownership | % of Series A shares | No, of Series B with ownership | % of Series B shares | % of total shares | |||||||||||||||
| Inversiones TLC SPA | 62,556,568 | 43.80 | % | - | - | 23.77 | % | |||||||||||||
| Sociedad de Inversiones Pampa Calichera S.A. (*) | 44,894,152 | 31.43 | % | 10,093,154 | 8.38 | % | 20.89 | % | ||||||||||||
| The Bank of New York Mellon, ADRs | - | - | 35,254,267 | 29.29 | % | 13.39 | % | |||||||||||||
| Potasios de Chile S.A. (*) | 18,179,147 | 12.73 | % | - | - | 6.91 | % | |||||||||||||
| Banco de Chile via non-resident third party accounts | 15,687 | 0.01 | % | 10,703,812 | 8.89 | % | 4.07 | % | ||||||||||||
| Inversiones Global Mining (Chile) Limitada (*) | 8,798,539 | 6.16 | % | - | - | 3.34 | % | |||||||||||||
| Banco Itaú through Corpbanca on behalf of foreign investors | - | - | 8,085,730 | 6.72 | % | 3.07 | % | |||||||||||||
| Banco Santander via foreign investor accounts | - | - | 7,138,685 | 5.93 | % | 2.71 | % | |||||||||||||
| Banchile C de B S A | 528,092 | 0.37 | % | 4,028,611 | 3.35 | % | 1.73 | % | ||||||||||||
| Inversiones la Esperanza de Chile Limitada | 3,711,598 | 2.60 | % | 46,500 | 0.04 | % | 1.43 | % | ||||||||||||
| Shareholders as of December 31, 2019 | No. of Series A | % of Series A shares | No. of Series B | % of Series B shares | % of total shares | |||||||||||||||
| Inversiones TLC SpA (1) | 62,556,568 | 43.80 | % | - | - | 23.77 | % | |||||||||||||
| Sociedad de Inversiones Pampa Calichera S.A. (2) | 44,894,152 | 31.43 | % | 3,793,154 | 3.15 | % | 18.50 | % | ||||||||||||
| The Bank of New York Mellon, ADRs | - | - | 38,311,788 | 31.83 | % | 14.56 | % | |||||||||||||
| Potasios de Chile S.A. | 18,179,147 | 12.73 | % | - | - | 6.91 | % | |||||||||||||
| Inversiones Global Mining (Chile) Limitada | 8,798,539 | 6.16 | % | - | - | 3.34 | % | |||||||||||||
| Banco Itaú via foreign investor accounts | - | - | 7,373,216 | 6.13 | % | 2.80 | % | |||||||||||||
| Banco de Chile non-resident third party accounts | 109 | - | 6,842,746 | 5.68 | % | 2.60 | % | |||||||||||||
| Banco Santander via foreign investor accounts | - | - | 6,618,416 | 5.50 | % | 2.51 | % | |||||||||||||
| Euroamerica C de B S. A. | 3,056 | - | 4,863,467 | 4.04 | % | 1.85 | % | |||||||||||||
| Banchile C de B S. A. | 491,729 | 0.34 | % | 4,285,696 | 3.56 | % | 1.82 | % | ||||||||||||
| Inversiones la Esperanza de Chile Limitada | 4,147,263 | 2.90 | % | 46,500 | 0.04 | % | 1.59 | % | ||||||||||||
| Bolsa de comercio de Santiago Bolsa de valores | 30,590 | 0.02 | % | 3,077,930 | 2.56 | % | 1.18 | % | ||||||||||||
| (1) | As reported by DCV, which records the Company's shareholders' register as of December 31, 2020 and December 31, 2019, Inversiones TLC SpA, a subsidiary of Tianqi, is the direct owner of 62,556,568 shares of SQM equivalent to 23.77% of SQM’s shares. Through Tianqi’s subsidiaries it owns 5,516,772 Series B SQM shares as reported by Inversiones TLC Spa. So as of December 31, 2020, Tianqi owns 25.86% of SQM's total Series A and B shares. |
| (2) | Total Sociedad de Inversiones Pampa Calichera S.A. 57,235,201 Series A and B shares; 11,418,078 Series B shares are held by different brokers. |
| 1.6 | Covid-19 |
In January 2020, the WHO deemed COVID-19 a global pandemic. In March 2020, the Chilean Ministry of Health declared a nationwide State of Emergency. As a precaution, our management has implemented several measures to help reduce the speed at which the coronavirus spreads, including measures to mitigate the spread in the workplace, significant reductions in employee travel and a mandatory quarantine for people who have arrived from high risk destinations, in consultation with governmental and international health organization guidelines, and will continue to implement measures consistent with evolving coronavirus situation.
(*) Total Pampa Group 32% (2.247.895 Series B shares areOn March 16, 2020, the Company reported on various points in relation to the custodyoutbreak of different brokers)the COVID-19 virus and its being declared to be a global pandemic by the WHO.
| (1) | Regarding the financial and operational effects that this situation could mean for the Company, it is worth noting that the Company sells its products worldwide, with Asia, Europe and North America being its main markets. Border closures, decrease in commercial activity and difficulties and disruptions in the supply chains in the markets in which we sell have impacted our ability to fulfill our previous sales volume estimates, the impact on our sales volumes and average prices will depend on the duration of the virus in different markets, the efficiency of the measures implemented to contain the spread of the virus in each country and fiscal incentives that may be implemented in different jurisdictions to promote economic recovery. |
For now, our operations have not seen any material impacts related to the outbreak of COVID-19 virus.
We have taken measures to mitigate the impacts of this health emergency on our employees and limit the impact it could have on our operations (described below in point 2).
| Shareholder as of December 31, 2017 | No, of Series A with ownership | % of Series A shares | No, of Series B with ownership | % of Series B shares | % of total shares | |||||||||||||||
| The Bank of New York Mellon, ADRs | - | - | 54,599,961 | 45.36 | % | 20.74 | % | |||||||||||||
| Sociedad de Inversiones Pampa Calichera S.A. (*) | 44,894,152 | 31.43 | % | 7,007,688 | 5.82 | % | 19.72 | % | ||||||||||||
| Inversiones El Boldo Limitada | 29,330,326 | 20.54 | % | 16,363,546 | 13.59 | % | 17.36 | % | ||||||||||||
| Inversiones RAC Chile Limitada | 19,200,242 | 13.44 | % | 2,202,773 | 1.83 | % | 8.13 | % | ||||||||||||
| Potasios de Chile S.A. (*) | 18,179,147 | 12.73 | % | - | - | 6.91 | % | |||||||||||||
| Inversiones PCS Chile Limitada | 15,526,000 | 10.87 | % | 1,600,000 | 1.33 | % | 6.51 | % | ||||||||||||
| Inversiones Global Mining (Chile) Limitada (*) | 8,798,539 | 6.16 | % | - | - | 3.34 | % | |||||||||||||
| Banco de Chile via non-resident third party accounts | - | - | 8,394,289 | 6.97 | % | 3.19 | % | |||||||||||||
| Banco Itau via Investor Accounts | 19,125 | 0.01 | % | 7,017,504 | 5.83 | % | 2.67 | % | ||||||||||||
| Banco Santander via foreign investor accounts | - | - | 4,593,336 | 3.82 | % | 1.75 | % | |||||||||||||
| F-16 |
| (2) | Regarding the measures that management has adopted or intends to adopt to mitigate possible financial and/or operational effects, we inform that the Company has implemented a series of measures in its operations in Chile and abroad that seek to protect its workers and reduce the speed at which the virus spreads. The measures adopted by the Company are: |
| (a) | The flexibility of the working day, arrival and departure times, together with the incentive to work from home in those cases where this is possible. |
| (b) | Avoidance of crowds, seminars and large meetings in the Company´s offices and operating facilities. |
| (c) | Strengthening personal hygiene protocols (use of alcohol-based gel, masks, etc.) and sanitation in plants, cafeterias and offices. |
| (d) | Significant reduction in domestic and international travel, along with obligatory quarantine for people who have arrived from high risk destinations. |
| (e) | The costs associated with the measures implemented by the company correspond primarily to increased expenses in transportation, supplies, room and board, among others. |
| (3) | Regarding the existence of committed insurance and its level of coverage, we inform that as of today, we have not identified any events which would trigger coverage from the insurance policies that the Company has contracted. |
| (4) | Finally, we hereby inform that we do not currently have any other information that management believes is relevant to provide. |
(*) Total Pampa Group 29,97%As of December 31, 2020, there have been no significant impacts associated with COVID-19 other than those reported above.
On December 31, 2018 the total number of shareholders had risen to 1,508.
| F-17 |
Notes to the Consolidated Financial Statements as of December 31, 2018
Note 2 Basis of presentation for the consolidated financial statements
| 2.1 | Accounting period |
These consolidated financial statements cover the following periods:
| Consolidated Statements of Financial Position as of December 31, |
| Consolidated Statements of Income for the periods from January 1 to December 31, 2020, 2019 and 2018. |
| (c) | Consolidated Statements of Comprehensive Income from January 1 to December 31, 2020, 2019 and 2018. |
| (d) | Consolidated Statements of Changes in Equity for the |
| (e) | Consolidated Statements of Cash Flows for the periods ended December 31, 2020, 2019 and 2018. |
| Consolidated financial statements |
The consolidated financial statements of Sociedad Química y Minera de Chile S.A.the Company and its Subsidiaries weresubsidiaries have been prepared in accordance with International Financial Reporting Standards (hereinafter “IFRS”)IFRS and represent the full, explicit and unreserved adoption of International Financial Reporting StandardsIFRS as issued by the International Accounting Standards Board (the “IASB”).Board.
These consolidated financial statements fairly present the Company’s financial position, as of December 31, 20182020 and 2017, and2019, the comprehensive results of operations, changes in equity and cash flows occurring for each of the three years in the period ended on December 31, 2020, 2019 and 2018.
IFRS establish certain alternatives for their application. Thoseapplication, those applied by the Company are detailed in this Note.Note and Note 3.
Notes to the Consolidated Financial Statements as of December 31, 2018
The accounting policies used in the preparation of these consolidated annual accountsfinancial statements comply with each IFRS in force at their date of presentation.
ForPursuant to CMF requirements, on December 31, 2020 the closing dateeffects related to the application of these consolidatedIFRS 16 “Leases” are presented in separate financial statements certainstatement line items and the following reclassifications have been made forwith respect to the captions other non-current financial assets, Intangible assets other than goodwill, Goodwill as ofinformation reported on December 31, 20172019 to correct the prior year presentation. These revisions wereensure a consistent presentation between periods, which are considered not considered material tosignificant for the previously issued financial statements.
A reconciliation of such differences is presented as follows:
| Balances originally reported as of December 31, 2017 | Reclassified balances as of December 31, 2017 | Reclassification | ||||||||||
| ThUS$ | ThUS$ | ThUS$ | ||||||||||
| Assets | ||||||||||||
| Investments classified using the equity method of accounting | 146,425 | 152,630 | 6,205 | |||||||||
| Intangible assets other than goodwill | 105,948 | 113,787 | 7,839 | |||||||||
| Goodwill | 44,177 | 37,972 | (6,205 | ) | ||||||||
| Property, plant and equipment | 1,437,193 | 1,429,354 | (7,839 | ) | ||||||||
| Total | 1,733,743 | 1,733,743 | - | |||||||||
| Original balances reported as of December 31, 2019 | Reclassification | Balances reclassified as of December 31, 2019 | ||||||||||
| Financial statement line items | ThUS$ | ThUS$ | ThUS$ | |||||||||
| Property, plant and equipment, (net) | 1,607,070 | (37,164 | ) | 1,569,906 | ||||||||
| Right-of-use assets | - | 37,164 | 37,164 | |||||||||
| Other current financial liabilities | 298,822 | (7,694 | ) | 291,128 | ||||||||
| Lease liabilities, current | - | 7,694 | 7,694 | |||||||||
| Other non-current financial liabilities | 1,518,926 | (30,203 | ) | 1,488,723 | ||||||||
| Lease liabilities, non-current | - | 30,203 | 30,203 | |||||||||
In addition, revisions were made to notes 19 and 26.
Notes to the Consolidated Financial Statements as of December 31, 2018
| Basis of measurement |
The consolidated financial statements have been prepared on the historical cost basis except for the following:
| Inventories are recorded at the lower of cost and net realizable value. |
| Financial derivatives measured at fair |
| Certain financial investments |
Notes to the Consolidated Financial Statements as of December 31, 2018New accounting pronouncements
New accounting pronouncements
a) The following standards, interpretations and amendments are mandatory for the first time for annual periods beginning on January 1, 2018:
| Mandatory | ||
Notes to the Consolidated Financial Statements as of December 31, 2018
b) Standards, interpretations and amendments issued that had not become effective for financial statements beginning on January 1, 2018 and which the Company has not adopted early are as follows:
|
Notes to the Consolidated Financial Statements as of December 31, 2018
| Amendment to | This amendment | |||
Notes to the Consolidated Financial Statements as of December 31, 2018
| Amendment to IFRS 3 “Definition of a | This amendment revises the definition of a business. Based on the feedback received by the IASB, the application of the current guidance is frequently seen as too complex, and results in too many transactions that qualify as business combinations. | |||
| These amendments provide certain simplifications in relation to the reform to the referential interest rates. These simplifications relate to hedge accounting and | 01-01-2020 | |||
| Amendment to IFRS 16 “Lease Concessions” - Published in May 2020. | This amendment provides lessees with an optional exemption regarding the assessment of whether a lease concession associated with COVID-19 is a lease modification. Lessees may opt to account for lease concessions as they would if there were no lease modifications. In many cases, this would give rise to the accounting for a concession as a variable lease payment. | 01-06-2020 |
Management believesconfirm that the adoption of the aforementioned standards, amendments and interpretations did not significantly impact the company’s consolidated financial statements.
| F-19 |
| (b) | Standards, interpretations and amendments issued that had not become effective for financial statements beginning on January 1, 2020 and which the Company has not adopted early are as follows: |
| Standards and Interpretations | Description | Mandatory for annual periods beginning on or after | ||
| Amendment to IAS 1 “Presentation of financial statements” on classification of liabilities. | These limited scope amendments of IAS 1 “Presentation of financial statements” clarify that the liabilities will be classified as current or non-current depending on the rights that exist at the close of the reporting period. The classification is not affected by the expectations of the entity or the events subsequent to the report date (for example, the receipt of a waiver or noncompliance with the pact). The amendment also clarifies what IAS 1 means when referring to “liquidation” of a liability. The amendment must be applied retroactively in accordance with IAS 8. In May 2020, the IASB issued an “Exposure Draft” proposing deferral of the effective application date to January 1, 2023. | 01-01-2023 | ||
| Reference to the Conceptual Framework - Amendments to IFRS 3. | Minor modifications were made to IFRS 3 “Definition of a Business” to update references to the conceptual framework for financial reporting and to add an exception to the recognition of contingent liabilities and contingent assets within the scope of IAS 37 “Provisions, contingent liabilities and contingent assets” and Interpretation 21 “Levies.” The modifications also confirm that contingent assets should not be recognized in the date of acquisition. | 01-01-2022 | ||
| Amendment to IAS 16 “Property, plant and equipment” | This prohibits companies from deducting from the cost of the property any revenue received from the sale of articles produced while the company is preparing the asset for its anticipated use. The company must recognize this sales revenue and associated costs in the profit or loss for the fiscal year. | 01-01-2022 | ||
| Amendment to IAS 37, “Provisions, contingent liabilities and contingent assets.” | This clarifies for onerous contracts which inevitable costs a company must include to assess whether a contract will result in a loss. | 01-01-2022 | ||
| IFRS 9 Financial Instruments. | This clarifies which fees must be included in the 10% test for the derecognition of financial liabilities. | 01-01-2022 | ||
| IFRS 16 Leases. | Modification of illustrative example 13 to eliminate the illustration of lessor payments in relation to improvements to rental properties, to eliminate any confusion as to the treatment of lease incentives. | 01-01-2022 | ||
| IFRS 1 First-time Adoption of International Financial Reporting Standards. | This enables entities that have measured their assets and liabilities against book values in their head office books to also measure the accumulated translation differences using the amounts notified by the head office. This amendment will also apply to associates and joint ventures that have taken the same IFRS 1 exemption. | 01-01-2022 | ||
| Amendment to IFRS 10 “Consolidated Financial Statements” and IAS 28 “Investments in Associates and Joint Ventures”, Published in September 2014. | These amendments address an inconsistency between the requirements in IFRS 10 and those in IAS 28 in dealing with the sale or contribution of assets between an investor and its associate or joint venture. The main consequence of the amendments is that a full gain or loss is recognized when a transaction involves a business (whether it is housed in a subsidiary or not), A partial gain or loss is recognized when a transaction involves assets that do not constitute a business, even if these assets are housed in a subsidiary. | undetermined | ||
Management believes that the adoption of the above standards, amendments and amendments applicable as of Tuesday, January 1, 2019,interpretations will not have noa significant impact on the Company’s financial statements.
IFRS 16, Leases
The Company is currently preparing its assessment of the impact of the adoption of IFRS 16. The initial application method of the aforementioned standard chosen by the Company is the modified retrospective approach for which comparatives will not be restated.
For contracts qualified as leases under IFRS 16, the following right-of-use assets, among others, are potentially identified: trucks, cranes, excavators, facilities (buildings, warehouses, shops, land), where SQM has the power (control) to direct their activities and to use them during contract term, without the supplier changing the operating instructions.
Notes to the Consolidated Financial Statements as of December 31, 2018
| Basis of |
IFRS 15 - Revenue from Contracts with Customers
For the adoption of IFRS 15 - Revenue from Contracts with Customers, the Company undertook a detailed assessment of its performance obligations underlying revenue recognition, such as the performance obligation to transport products to customers, in line with the terms and conditions previously established in contracts and there is no significant impact - the performance obligation has been satisfied. With regard to products invoiced with a deferred shipment date, the transfer of control has been assessed over and above the transfer of risks and benefits established in the previous standard and a prepayment is estimated in revenue recognition, without a significant impact. Other considerations were also assessed, such as rebates, discounts, guarantees, financing components and product personalization. Based on this analysis, the Company has concluded that no impact nor significant changes were recognized as a result of applying this new standard, except for the impact on disclosures. The adoption of IFRS 15 was based on the modified retrospective approach for which comparatives were not restated.
IFRS 9, Financial Instruments
|IFRS 9 establishes the requirements for the recognition and measurement of financial assets, financial liabilities and certain contracts for the purchase or sale of non-financial items. This standard replaces IAS 39 Financial Instruments: Recognition and Measurement
Classification and measurement of financial assets and financial liabilities
IFRS 9 includes three main classification categories for financial assets: measured at amortized cost, at fair value through changes in other comprehensive income (FVTOCI), and at fair value through profit or loss (FVTPL). The classification of financial assets under IFRS 9 is based on the business model in which a financial asset is managed and its contractual cash flow characteristics. IFRS 9 eliminates the previous categories of IAS 39 from held-to-maturity, loans and receivables and available-for-sale.
Notes to the Consolidated Financial Statements as of December 31, 2018
The followingCompany established control as the basis of consolidation of its financial statements. The Company controls a subsidiary when it is a summaryexposed, or has rights, to variable returns from its involvement with the classification, measurementsubsidiary and effects byhas the application of IFRS 9:
| Financial Assets | Measurement Category under IAS 39 | Measurement category under IFRS 9 | 12/31/2017 Total Amount ThUS$ | IFRS 9 Adjustment ThUS$ | 01/01/2018 Total Amount Restated ThUS$ | |||||||||||
| Description of financial current assets | ||||||||||||||||
| Cash and cash equivalent | Amortized cost | Amortized cost | 630,438 | - | 630,438 | |||||||||||
| Trade receivables due from related parties | Amortized cost | Amortized cost | 59,132 | - | 59,132 | |||||||||||
| Financial assets measured at amortized cost | Amortized cost | Amortized cost | 360,941 | - | 360,941 | |||||||||||
| Loans and receivables measured at amortized cost | Amortized cost | Amortized cost | 446,875 | (2,301 | ) | 444,574 | ||||||||||
| Derivatives held for trading at fair value through profit or loss | FVTPL | FVTPL | 6,038 | - | 6,038 | |||||||||||
| Non-current Assets | ||||||||||||||||
| Financial assets | Amortized cost | Amortized cost | 45 | - | 45 | |||||||||||
| Loans and receivables | Amortized cost | Amortized cost | 1,912 | - | 1,912 | |||||||||||
| Derivatives for hedging purposes | FVTOCI | FVTOCI | 8,910 | - | 8,910 | |||||||||||
| Financial assets classified as available for sale at fair value through equity | Irrevocable FVTOCI | FVTOCI | 33,924 | - | 33,924 | |||||||||||
| Total IFRS 9 Adjustment | (2,301 | ) | ||||||||||||||
Notesability to the Consolidated Financial Statements as of December 31, 2018
| Financial Liabilities | Measurement Category under IAS 39 | Measurement category under IFRS 9 | 12/31/2017 Total Amount ThUS$ | IFRS 9 Adjustment ThUS$ | 01/01/2018 Total Amount Restated ThUS$ | |||||||||||
| Description of financial Current liabilities | ||||||||||||||||
| Accounts payable to related entities | Amortized cost | Amortized cost | 1,365 | 1,365 | ||||||||||||
| Derivatives for hedging purposes | FVTOCI | FVTOCI | 37,287 | 37,287 | ||||||||||||
| Derivatives at fair value through profit or loss | FVTOCI | FVTPL | 5,979 | 5,979 | ||||||||||||
| Bank loans | Amortized cost | Amortized cost | 163,568 | 163,568 | ||||||||||||
| Obligations to the public | Amortized cost | Amortized cost | 13,494 | 13,494 | ||||||||||||
| Financial liabilities at amortized cost (trade and other payables) | Amortized cost | Amortized cost | 196,280 | 196,280 | ||||||||||||
| Financial Liabilities Non-Current | ||||||||||||||||
| Obligations to the public | Amortized cost | Amortized cost | 1,031,507 | 1,031,507 | ||||||||||||
| Financial liabilities at amortized cost (trade and other payables) | Amortized cost | Amortized cost | - | - | ||||||||||||
| Deferred tax liabilities | 205,904 | (621 | ) | 205,283 | ||||||||||||
| Equity | ||||||||||||||||
| Total equity | 2,247,468 | (1,680 | ) | 2,245,788 | ||||||||||||
| Total IFRS 9 Adjustment | (2.301 | ) | ||||||||||||||
Notes to the Consolidated Financial Statements as of December 31, 2018
No changes were made to financial liabilities regarding classification and measurement as a result of the adoption of IFRS 9.
IFRS 9 introduces a new model of deterioration losses on financial assets, the expected credit loss model, which replaces the loss model incurred under IAS 39. The Company applies the simplified approach described by IFRS 9 for financial losses. expected credit losses of the account portfolio receivable from customers, as they are short-term financial instruments less than 12 months, without a significant financing component and which are held until maturity. This approach allows the use of the estimated credit losses expectedaffect those returns through its power over the life of the instrument.
Accounts receivable with a low probability of recovery are fully provisioned, while, to measure the expected credit losses of the rest of the portfolio, it is segmented by grouping the commercial accounts receivable based on the characteristics of shared credit risk, and delinquency. The expected loss rates are obtained based on the default rates of the last seven years. To convert the historical loss into projected loss, the behavior of the implicit default probability indicator is used in the prices of financial derivatives that cover the risk of non-payment of sovereign bonds in those countries where the Company generates income from the sale of the product.subsidiary.
The applicationconsolidation of IFRS 9 had an impacta subsidiary starts when the Group controls it and it is no longer included in the consolidation when this control is lost.
Subsidiaries are consolidated through a line by line method, adding items that represent assets, liabilities, income and expenses with a similar content, and eliminating operations between companies within the SQM Group.
Results for dependent companies acquired or disposed of during the period are included in the consolidated accounts from the date on January 1, 2018 duewhich control is transferred to the application ofSQM Group or until the new deterioration model described in the Company's Consolidated Financial Statements of ThUS $ 2,301 (net of deferred taxes ThUS $ 1680), of greater deteriorationdate when this amount was taken to equity according to IAS 8. (See Note 13.2).
In addition,control ends, as a result of the adoption of IFRS 9, a reclassification was made to present gains on reversal (losses) on impairment of financial assets separately from other expenses as function. The corresponding reclassifications for prior periods are described below:
| Balances originally reported as of December 31, 2017 | Reclassified balances as of December 31, 2017 | Reclassification as of December 31, 2017 | ||||||||||
| ThUS$ | ThUS$ | ThUS$ | ||||||||||
| Expenses | ||||||||||||
| Other expenses by function | (61,638 | ) | (53,600 | ) | 8,038 | |||||||
| Net gains on reversal (losses) on impairment of financial assets | - | (8,038 | ) | (8,038 | ) | |||||||
| Total | (61,638 | ) | (61,638 | ) | - | |||||||
| Balances originally reported as of December 31, 2016 | Reclassified balances as of December 31, 2016 | Reclassification as of December 31, 2016 | ||||||||||
| ThUS$ | ThUS$ | ThUS$ | ||||||||||
| Expenses | ||||||||||||
| Other expenses by function | (89,731 | ) | (82,533 | ) | 7,198 | |||||||
| Net gains on reversal (losses) on impairment of financial assets | - | (7,198 | ) | (7,198 | ) | |||||||
| Total | (89,731 | ) | (89,731 | ) | - | |||||||
Notes to the Consolidated Financial Statements as of December 31, 2018
(a) Subsidiaries
These are all those entities where Sociedad Química y Minera de Chile S.A. has control over directing their financial and operational policies. This is generally accompanied by a share of more than half of the voting rights. Subsidiaries apply the same accounting policies of their Parent.relevant.
To account for thean acquisition, of a business the Company uses the acquisition method. Under this method the acquisition cost is the fair value of assets delivered, equity securities issued, and liabilities incurred or assumed liabilities at the date of exchange. Identifiable assets acquired, andAssets, liabilities and contingencies identifiable assumed in a business combination are measured initially at fair value at the acquisition date. For each business combination, the Company will measure the non-controlling interest of the acquiree either at fair value or as proportional share of net identifiable assets of the acquiree. For more information, please see Note 8.1.acquire.
Companies included in consolidation:
| Ownership interest | ||||||||||||||||||||||
| TAX ID | Country of | 12/31/2018 | 12/31/2017 | |||||||||||||||||||
| No. | Foreign subsidiaries | origin | Functional currency | Direct | Indirect | Total | Total | |||||||||||||||
| Foreign | Nitratos Naturais Do Chile Ltda, | Brazil | US$ | 0.0000 | 100.0000 | 100.0000 | 100.0000 | |||||||||||||||
| Foreign | Nitrate Corporation Of Chile Ltd, | United Kingdom | US$ | 0.0000 | 100.0000 | 100.0000 | 100.0000 | |||||||||||||||
| Foreign | SQM North America Corp, | USA | US$ | 40.0000 | 60.0000 | 100.0000 | 100.0000 | |||||||||||||||
| Foreign | SQM Europe N.V. | Belgium | US$ | 0.5800 | 99.4200 | 100.0000 | 100.0000 | |||||||||||||||
| Foreign | Soquimich S.R.L. Argentina | Argentina | US$ | 0.0000 | 100.0000 | 100.0000 | 100.0000 | |||||||||||||||
| Foreign | Soquimich European Holding B.V. | Netherlands | US$ | 0.0000 | 100.0000 | 100.0000 | 100.0000 | |||||||||||||||
| Foreign | SQM Corporation N.V. | Netherlands | US$ | 0.0002 | 99.9998 | 100.0000 | 100.0000 | |||||||||||||||
| Foreign | SQI Corporation N.V. | Netherlands | US$ | 0.0159 | 99.9841 | 100.0000 | 100.0000 | |||||||||||||||
| Foreign | SQM Comercial De México S.A. de C.V. | Mexico | US$ | 0.0100 | 99.9900 | 100.0000 | 100.0000 | |||||||||||||||
| Foreign | North American Trading Company | USA | US$ | 0.0000 | 100.0000 | 100.0000 | 100.0000 | |||||||||||||||
| Foreign | Administración y Servicios Santiago S.A. de C.V. | Mexico | US$ | 0.0000 | 100.0000 | 100.0000 | 100.0000 | |||||||||||||||
| Foreign | SQM Peru S.A. | Peru | US$ | 0.9800 | 99.0200 | 100.0000 | 100.0000 | |||||||||||||||
| Foreign | SQM Ecuador S.A. | Ecuador | US$ | 0.0040 | 99.9960 | 100.0000 | 100.0000 | |||||||||||||||
| Foreign | SQM Nitratos Mexico S.A. de C.V. | Mexico | US$ | 0.0000 | 100.0000 | 100.0000 | 100.0000 | |||||||||||||||
| Foreign | SQMC Holding Corporation L.L.P. | USA | US$ | 0.1000 | 99.9000 | 100.0000 | 100.0000 | |||||||||||||||
| Foreign | SQM Investment Corporation N.V. | Netherlands | US$ | 1.0000 | 99.0000 | 100.0000 | 100.0000 | |||||||||||||||
| Foreign | SQM Brasil Limitada | Brazil | US$ | 1.0900 | 98.9100 | 100.0000 | 100.0000 | |||||||||||||||
| Foreign | SQM France S.A. | France | US$ | 0.0000 | 100.0000 | 100.0000 | 100.0000 | |||||||||||||||
| Foreign | SQM Japan Co. Ltd. | Japan | US$ | 0.1597 | 99.8403 | 100.0000 | 100.0000 | |||||||||||||||
| Foreign | Royal Seed Trading Corporation A.V.V. | Aruba | US$ | 1.6700 | 98.3300 | 100.0000 | 100.0000 | |||||||||||||||
| Foreign | SQM Oceania Pty Limited | Australia | US$ | 0.0000 | 100.0000 | 100.0000 | 100.0000 | |||||||||||||||
| Foreign | Rs Agro-Chemical Trading Corporation A.V.V. | Aruba | US$ | 98.3333 | 1.6667 | 100.0000 | 100.0000 | |||||||||||||||
| Foreign | SQM Colombia SAS | Colombia | US$ | 0.0000 | 100.0000 | 100.0000 | 100.0000 | |||||||||||||||
| Foreign | SQM Australia PTY | Australia | Australian dollar | 0.0000 | 100.0000 | 100.0000 | 100.0000 | |||||||||||||||
| Foreign | SACAL S.A. | Argentina | Argentine peso | 0.0000 | 100.0000 | 100.0000 | 100.0000 | |||||||||||||||
Notes to the Consolidated Financial Statements as of December 31, 2018
| Ownership interest | ||||||||||||||||||||||
| TAX ID | Country | 12/31/2018 | 12/31/2017 | |||||||||||||||||||
| No. | Foreign subsidiaries | of origin | Functional currency | Direct | Indirect | Total | Total | |||||||||||||||
| Foreign | SQM Indonesia S.A. | Indonesia | US$ | 0.0000 | 80.0000 | 80.0000 | 80.0000 | |||||||||||||||
| Foreign | SQM Virginia L.L.C. | USA | US$ | 0.0000 | 100.0000 | 100.0000 | 100.0000 | |||||||||||||||
| Foreign | SQM Italia SRL | Italy | US$ | 0.0000 | 100.0000 | 100.0000 | 100.0000 | |||||||||||||||
| Foreign | Comercial Caimán Internacional S.A. | Panama | US$ | 0.0000 | 100.0000 | 100.0000 | 100.0000 | |||||||||||||||
| Foreign | SQM Africa Pty. | South Africa | US$ | 0.0000 | 100.0000 | 100.0000 | 100.0000 | |||||||||||||||
| Foreign | SQM Lithium Specialties LLC | USA | US$ | 0.0000 | 100.0000 | 100.0000 | 100.0000 | |||||||||||||||
| Foreign | SQM Iberian S.A. | Spain | US$ | 0.0000 | 100.0000 | 100.0000 | 100.0000 | |||||||||||||||
| Foreign | SQM Beijing Commercial Co. Ltd. | China | US$ | 0.0000 | 100.0000 | 100.0000 | 100.0000 | |||||||||||||||
| Foreign | SQM Thailand Limited | Thailand | US$ | 0.0000 | 99.996 | 99.996 | 99.996 | |||||||||||||||
| Foreign | SQM Internacional N.V. | Belgium | US$ | 0.5800 | 99.4200 | 100.0000 | 0.0000 | |||||||||||||||
| Foreign | SQM (Shanghai) Chemicals Co. Ltd. | China | US$ | 0.0000 | 100.0000 | 100.0000 | 0.0000 | |||||||||||||||
Investments in joint arrangements are classified as joint operations or joint ventures. The classification depends on the contractual rights and obligations of each investor, rather than the legal structure of the joint arrangement.
With respect to joint operations, the Company recognizes its direct right to the assets, liabilities, income and expenses of the joint arrangement.
| Ownership interest | ||||||||||||||||||||||
| TAX ID | Country | 12/31/2018 | 12/31/2017 | |||||||||||||||||||
| No. | Domestic subsidiaries | of origin | Functional currency | Direct | Indirect | Total | Total | |||||||||||||||
| 96.801.610-5 | Comercial Hydro S.A. | Chile | US$ | 0,0000 | 60,6383 | 60,6383 | 60,6383 | |||||||||||||||
| 96.651.060-9 | SQM Potasio S.A. | Chile | US$ | 99,9999 | 0,0000 | 99,9999 | 99,9999 | |||||||||||||||
| 96.592.190-7 | SQM Nitratos S.A. | Chile | US$ | 99,9999 | 0,0001 | 100,0000 | 100,0000 | |||||||||||||||
| 96.592.180-K | Ajay SQM Chile S.A. | Chile | US$ | 51,0000 | 0,0000 | 51,0000 | 51,0000 | |||||||||||||||
| 86.630.200-6 | SQMC Internacional Ltda. | Chile | Ch$ | 0,0000 | 60,6381 | 60,6381 | 60,6381 | |||||||||||||||
| 79.947.100-0 | SQM Industrial S.A. | Chile | US$ | 99,0470 | 0,9530 | 100,0000 | 100,0000 | |||||||||||||||
| 79.906.120-1 | Isapre Norte Grande Ltda. | Chile | Ch$ | 1,0000 | 99,0000 | 100,0000 | 100,0000 | |||||||||||||||
| 79.876.080-7 | Almacenes y Depósitos Ltda. | Chile | Ch$ | 1,0000 | 99,0000 | 100,0000 | 100,0000 | |||||||||||||||
| 79.770.780-5 | Servicios Integrales de Tránsitos y Transferencias S.A. | Chile | US$ | 0,0003 | 99,9997 | 100,0000 | 100,0000 | |||||||||||||||
| 79.768.170-9 | Soquimich Comercial S.A. | Chile | US$ | 0,0000 | 60,6383 | 60,6383 | 60,6383 | |||||||||||||||
| 79.626.800-K | SQM Salar S.A. | Chile | US$ | 18,1800 | 81,8200 | 100,0000 | 100,0000 | |||||||||||||||
| 78.053.910-0 | Proinsa Ltda. | Chile | Ch$ | 0,0000 | 60,5800 | 60,5800 | 60,5800 | |||||||||||||||
| 76.534.490-5 | Sociedad Prestadora de Servicios de Salud Cruz del Norte S.A. | Chile | Ch$ | 0,0000 | 100,0000 | 100,0000 | 100,0000 | |||||||||||||||
| 76.425.380-9 | Exploraciones Mineras S.A. | Chile | US$ | 0,2691 | 99,7309 | 100,0000 | 100,0000 | |||||||||||||||
| 76.064.419-6 | Comercial Agrorama Ltda. (a) | Chile | Ch$ | 0,0000 | 42,4468 | 42,4468 | 42,4468 | |||||||||||||||
| 76.145.229-0 | Agrorama S.A. | Chile | Ch$ | 0,0000 | 60,6377 | 60,6377 | 60,6377 | |||||||||||||||
| 76.359.919-1 | Orcoma Estudios SPA | Chile | US$ | 51,0000 | 0,0000 | 51,0000 | 51,0000 | |||||||||||||||
| 76.360.575-2 | Orcoma SPA | Chile | US$ | 100,0000 | 0,0000 | 100,0000 | 100,0000 | |||||||||||||||
| 76.686.311-9 | SQM MaG SpA. | Chile | US$ | 0,0000 | 100,0000 | 100,0000 | 100,0000 | |||||||||||||||
Interests in companies over which joint control is exercised (joint ventures) or where an entity has significant influence (associates) are recognized using the equity accounting method. Significant influence is presumed when the investor owns over 20% of the investee’s share capital. The investment is recognized using this method in the statement of financial position at cost plus changes subsequent to acquisition and includes the proportional share of the associate’s equity. For these purposes, the percentage interest in the associate is used. The associated acquired goodwill is included in the investee’s book value and is not amortized. The debit or credit to the income statement reflects the proportional share of the profit or loss of the associate or joint venture.
Unrealized gains from transactions with joint ventures or associates are eliminated in accordance with the Company's percentage interest in such entities. Any unrealized losses are also eliminated, unless that transaction provides evidence that the transferred asset is impaired.
Changes in associate’s or joint ventures equity are recognized proportionally with a charge or credit to "Other Reserves" and are classified according to their origin. The reporting dates of the associate or joint ventures, the Company and related policies are similar for equivalent transactions and events in similar circumstances. In the event that significant influence is lost, or the investment is sold, or held for sale, the equity method is suspended, not recognizing the proportional share of the gain or loss. If the resulting value under the equity method is negative, the share of profit or loss is reflected as zero in the consolidated financial statements, unless there is a commitment by the Company to restore the capital position of the Company, in which case the related risk provision and expense are recorded.
Dividends received by these companies are recorded by reducing the value of the investment and are shown in cash flows from operating activities, and the proportional share of the gain or loss recognized in accordance with the equity method is included in the consolidated income statement under "Share of Gains (Losses) of Associates and Joint Ventures Accounted for Using the Equity Method''.
Notes to the Consolidated Financial Statements as of December 31, 2018
Subsidiaries are consolidated using the line-by-line method, adding the items that represent assets, liabilities, revenues, and expenses of similar content, and eliminating those related to intragroup transactions.
Profit or loss of subsidiaries acquired or divested during the year are included in profit or loss accounts consolidated from the date control is transferred to the Group, or up to the date control is lost, as applicable.
Non-controlling interest represents the equity of a subsidiary not directly or indirectly attributable to the Parent.
Notes to the Consolidated Financial Statements as of December 31, 2018
Note 3 Significant accounting policies
| 3.1 | Classification of balances as current and non-current |
In the attached consolidated statement of financial position, balances are classified in consideration of their recovery (maturity) dates; i.e., those maturing within a period equal to or less than 12 months are classified as current counted from the closing date of the consolidated financial statements and those with maturity dates exceeding the aforementioned period are classified as non-current.
The exception to the foregoing relates to deferred taxes, which are classified as non-current, regardless of the maturity they have.
| 3.2 | Functional and presentation currency |
The Company’s consolidated financial statements are presented in United States dollars, (“U.S. dollars”),without decimal places, which is the Company’s functional and presentation currency and is the currency of the main economic environment in which it operates.
Consequently, the term foreign currency is defined as any currency other than the U.S. dollar.
The consolidated financial statements are presented in thousands of United States dollars without decimals.
| 3.3 | Accounting policy for foreign currency translation |
(a) Group entities:
The revenue, expenses, assets and liabilities of all entities that have a functional currency other than the presentation currency are converted to the presentation currency as follows:
| - | Assets and liabilities are converted at the closing exchange rate prevailing on the reporting date. |
| - | Revenues and expenses of each profit or loss account are converted at monthly average exchange rates. |
| - | All resulting foreign currency translation gains and losses are recognized as a separate component in translation reserves. |
In consolidation, foreign currency differences arising from the translation of a net investment in foreign entities are recorded in shareholder’s equity (other reserves).(“other reserves”), At the date of disposal, such foreign currency translation differences are recognized in the statement of income as part of the gain or loss from the sale.
Notes to the Consolidated Financial Statements as of December 31, 2018
The main exchange rates and the adjustment unitUF used to translate monetary assets and liabilities, expressed in foreign currency at the end and average of each period in respect to U.S. dollars, are as follows:
| 12/31/2018 | 12/31/2017 | |||||||
| US$ | �� | US$ | ||||||
| Brazilian real | 3.87 | 3.02 | ||||||
| New Peruvian sol | 3.37 | 3.08 | ||||||
| Argentine peso | 37.74 | 18.40 | ||||||
| Japanese yen | 110.38 | 113.00 | ||||||
| Euro | 0.87 | 0.83 | ||||||
| Mexican peso | 19.68 | 19.65 | ||||||
| Australian dollar | 1.42 | 1.28 | ||||||
| Pound Sterling | 0.79 | 0.74 | ||||||
| South African rand | 14.35 | 12.35 | ||||||
| Ecuadorian dollar | 1.00 | 1.00 | ||||||
| Chilean peso | 694.77 | 614.75 | ||||||
| Chinese yuan | 6.88 | 6.51 | ||||||
| Indian rupee | 69.93 | 63.84 | ||||||
| Thai baht | 32.53 | 32.85 | ||||||
| Turkish lira | 5.27 | 3.79 | ||||||
| UF (*) | 39.68 | 43.59 | ||||||
| Closing exchange rates | Average exchange rates | |||||||||||||||
As of December 31, | As of December 31, | As of December 31, | As of December 31, | |||||||||||||
| Currencies | ThUS$ | ThUS$ | ThUS$ | ThUS$ | ||||||||||||
| Brazilian real | 5.18 | 4.02 | 5.14 | 4.11 | ||||||||||||
| New Peruvian sol | 3.62 | 3.31 | 3.60 | 3.35 | ||||||||||||
| Argentine peso | 84.14 | 59.83 | 82.62 | 59.86 | ||||||||||||
| Japanese yen | 105.56 | 108.90 | 103.81 | 109.12 | ||||||||||||
| Euro | 0.81 | 0.89 | 0.82 | 0.90 | ||||||||||||
| Mexican peso | 19.93 | 18.89 | 19.97 | 19.11 | ||||||||||||
| Australian dollar | 1.30 | 1.43 | 1.33 | 1.45 | ||||||||||||
| Pound Sterling | 0.74 | 0.76 | 0.74 | 0.76 | ||||||||||||
| South African rand | 14.61 | 14.06 | 14.88 | 14.42 | ||||||||||||
| Chilean peso | 710.95 | 748.74 | 731.92 | 767.22 | ||||||||||||
| Chinese yuan | 6.51 | 6.98 | 6.53 | 7.01 | ||||||||||||
| Indian rupee | 73.30 | 71.31 | 73.65 | 71.16 | ||||||||||||
| Thai Baht | 29.94 | 29.97 | 30.08 | 30.22 | ||||||||||||
| Turkish lira | 7.36 | 5.94 | 7.70 | 5.85 | ||||||||||||
| UF (*) | 40.89 | 37.81 | 39.73 | 36.90 | ||||||||||||
(*) The Unidad de Fomento (UF) is an indexed monetary unit used in Chile, calculated based on the variation in the Consumer Price Index (CPI). It is represented as dollars to UF.US$ per UF
(b) Transactions and balances
| (b) | Transactions and balances |
Non-monetaryThe Company’s non-monetary transactions in currencies other than the functional currency (Dollar) are translated to the respective functional currencies of Group entities at the exchange rate on the date of the transaction. Monetary assets and liabilities denominated in foreign currencies at the reporting date are retranslated to the functional currency at the exchange rate at that date. All differences are recorded in the statement of income except for all monetary items that provide an effective hedge for a net investment in a foreign operation. These items are recognized in other comprehensive income onuntil disposal of the divestment,invesment when they are recognized in the statement of income. Charges and credits attributable to foreign currency translation differences on those hedge monetary items are also recognized in other comprehensive income.
Non-monetary assets and liabilities that are measured at historical cost in a foreign currency are retranslated to the functional currency at the historical exchange rate of the transaction. Non-monetary items that are measured based on fair value in a foreign currency are translated using the exchange rate at the date on which the fair value is determined.
Notes to the Consolidated Financial Statements as of December 31, 2018
SQM S.A. uses the level of control it has in subsidiaries as a basis to determine their share in the consolidated financial statements. This control consists of the Company’s ability to exercise power in the subsidiary, exposure, or right, to variable performance from its share in the investee and the ability to use its power on the investee to have an influence on the amount of the investor’s performance.
The Company prepares the consolidated financial statements using consistent accounting policies for the entire Group. The consolidation of a subsidiary commences when the Company has control over the subsidiary and stops when control ceases.
| Consolidated statement of cash flows |
Cash equivalents correspond to highly-liquidhighly liquid short-term investments that are easily convertible into known amounts of cash. They arecash and subject to insignificant risk of changes in their value and mature in less than three months from the date of acquisition of the instrument.
For the purposes of the statement of cash flows, cash and cash equivalents comprise cash and cash equivalents as defined above.
The statement of cash flows includes movements inpresent cash transactions performed during the year, determined using the direct method.
| F-24 |
| Accounting policy for Financial assets |
As of January 1, 2018, the Company's Management (the "Administration") determines the classification of its financial assets, in accordance with the provisions of IFRS 9, at fair value (either through other comprehensive income, or through profitsprofit or losses)loss), and at amortized cost. The classification depends on the business model of the entity to manage the financial assets and the contractual terms of the cash flows.
In the initial recognition, the Company measures its financial assets at fair value more or less, in the case of a financial asset that is not accounted for at fair value through profit or loss, the transaction costs that are directly attributable to the acquisition of the financial asset on the date when the Company commits to the purchase or sale of an asset. In the case of commercial debtorsaccount receivables and other accounts receivable,receivables, the transaction price at the initial recognition will measure their transaction priceis measured in accordance with the provisions of IFRS 15.
After initial recognition, the Company measures its financial assets according to the following:Company's business model for managing its financial assets and the contractual terms of its cash flows:
| Financial instruments measured at amortized cost. Financial assets that meet the following conditions are included in this category |
| Financial instruments at fair value. A financial asset should be measured at fair value through profit or loss or fair value through other comprehensive income, depending on the following: |
| (i) | "Fair Value Through Other Comprehensive Income": Assets held to collect contractual cash flows and to be sold, where the asset cash flows are only capital and interest payments, are measured at fair value through other comprehensive income. Changes in book values are through other comprehensive income, except for the recognition of impairment losses, interest income and exchange gains and losses, which are recognized in the income statement. When a financial asset is derecognized, the cumulative gain or loss previously recognized in other comprehensive income is reclassified from equity to the income statement. Interest income from these financial assets is included in financial income using the effective interest method. Exchange gains and losses are presented in the income statement and impairment losses are separately presented in the income statement. |
| (ii) | "Fair Value Through Profit and Loss": Assets that do not meet the amortized cost or "Fair Value Through Other Comprehensive Income" criteria are valued at "Fair Value Through Profit and Loss". |
| (c) | Financial equity assets at fair value through other comprehensive income. Equity |
Until December 31, 2017, the Company determined the classification of its financial assets at the time of initial recognition, based on the basis of the business model for the management of financial assets and the characteristics of the contractual cash flows of the financial assets. financial assets. In accordance with IAS 39, financial assets were initially measured at fair value plus the transaction costs incurred that were directly attributable to the acquisition of the financial asset. Subsequently, financial assets were measured at amortized cost or at fair value.
The Company evaluated at the date of each report, whether there was objective evidence that any asset or group of financial assets presented any impairment. An asset or group of financial assets presented a deterioration, if and only if, there was objective evidence of impairment as a result of one or more events that occurred after the initial recognition of the asset or group of these. In order for impairment to be recognized, the loss event must have an impact on the estimation of future flows of the asset or groups of financial assets.
NotesFinancial asset impairment
The Company evaluates expected credit losses associated with its debt instruments carried at amortized cost and fair value through other comprehensive income. The impairment method used depends on whether there has been a significant increase in credit risk.
The Company applies the IFRS 9 simplified approach to measure expected credit losses using the Consolidated Financial Statementslifetime expected loss on all trade receivables. Expected credit losses are measured by grouping receivables by their shared credit risk characteristics and days overdue.
The Company has concluded that the expected loss rates for trade receivables are a reasonable approximation of the loss rates for these assets. Expected loss rates are based on sales payment profiles and historical credit losses within this period. Historical loss rates are adjusted to reflect current and expected information regarding macroeconomic factors that affect the ability of customers to meet their commitments.
Impairment losses from receivables and contract assets are shown as net impairment losses in the line “Impairment of December 31, 2018financial assets and reversal of impairment losses”, see Note 23.7. The subsequent recovery of previously canceled amounts is accredited in the same line.
| F-26 |
| Financial liabilities |
As of January 1, 2018, the CompanyManagement determines the classification of its financial liabilities, in accordance with the provisions of IFRS 9, at fair value or at amortized cost. The classification depends on the business model of the entity to manage the financial assets and the contractual terms of the cash flows.
InAt the initial recognition, the Company measures its financial liabilities by their fair value more or less, in the case of a financial liability that is not accounted for at fair value through profit or loss, the transaction costs that are directly attributable to the acquisition of the financial liability.
After initial recognition, the Company measures its financial liabilities at amortized cost unless the Company, at the initial moment, irrevocably designates the financial liability as measured at fair value through profit or loss.
Financial liabilities measured at amortized cost are commercial accounts payable and other accounts payable and other financial liabilities.
Until December 31, 2017, the Company determined the classification of its financial liabilities at the time of initial recognition in accordance with the provisions of IAS 39. Financial liabilities at the time of initial recognition were measured at fair value, minus costs of the transaction in which they were incurred and which are directly attributable to the issuance of the financial liability. Subsequently, they were measuredValuation at amortized cost is made using the effective interest rate method. InAmortized cost is calculated by considering any premium or discount on the caseacquisition and includes transaction costs that are an integral part of financialthe effective interest rate.
Financial liabilities that were initially recognized at fair value through profit or loss,are recorded as not current when they were measured after fair value.mature in more than 12 months and as current when they mature in less than 12 months.
| Reclassification of financial instruments |
At such time whenWhen the Company changes its business model for managing financial assets, it will reclassify thoseall its financial assets affected by the new business model.
Financial liabilities could notcannot be reclassified.
In accordance with IFRS 9, theThe Company derecognizes a financial asset when the contractual rights to the cash flows from the asset expire, or it transfers the rights to receive the contractual cash flows in a transaction in which substantially all the risks and rewards of ownership of the financial asset are transferred; and the control of the financial assets has not been retained.
The Company derecognizes a financial liability when its contractual obligations or a part of these are discharged, paid to the creditor or legally extinguished.extinguished from the principle responsibility contained in the liability.
| Derivative and hedging financial instruments |
Derivatives are recognized initially at fair value as of the date on which the derivatives contract is signed and, they are subsequently assessed at fair value. The method for recognizing the resulting gain or loss depends on whether the derivative has been designated as an accounting hedge instrument and, if so, it depends on the type of hedging, which may be as follows:
| a) | Fair value hedge of assets and liabilities recognized (fair value hedges); |
| b) | Hedging of a single risk associated with |
Notes to the Consolidated Financial Statements as of December 31, 2018
At the beginning of the transaction, the Company documents the relationship that exists between hedging instruments and those items hedged, as well as their objectives for risk management purposes and the strategy to conduct different hedging operations.
| F-27 |
The Company also documents its evaluation both at the beginning and at the end of each period if the derivatives used in hedging transactions are highly effective to offset changes in the fair value or in cash flows of hedged items.
The fair value of derivative instruments used for hedging purposes is shown in Note 14.3 (hedging assets and liabilities).14.3. Changes in the cash flow hedge reserve are classified as a non-current asset or liability if the remaining expiration period of the hedged item is more than 12 months, and as a current asset or liability if the remaining expiration period of the entryhedged item is less than 12 months.
Derivatives that are not designated or do not qualify as hedging derivatives are classified as current assets or liabilities, and changes in the fair value are directly recognized through profit or loss.
| a) | Fair value hedge |
a) Fair value hedge
Changes in the fair value of derivatives that are designated and qualify as fair value hedges are recorded in profit or loss, together with any changes in the fair value of the hedged asset or liability that are attributable to the hedged risk. The gain or loss relating to the effective portion of interest rate swaps that hedge fixed rate borrowings is recognized in profit or loss within finance costs, together with changes in the fair value of the hedged fixed rate borrowings attributable to interest rate risk. The gain or loss relating to the ineffective portion is recognized in profit or loss within other income or other expenses. If the hedge no longer meets the criteria for hedge accounting, the adjustment to the carrying amount of a hedged item for which the effective interest method is used is amortized to profit or loss over the period to maturity using a recalculated effective interest rate.
| b) | Cash flow hedges |
b) Cash flow hedges
Amounts takenThe effective portion of the gain or loss on the hedging instrument is initially recognized with a debit or credit to other comprehensive income, while any ineffective portion is immediately recognized with a debit or credit to income, as appropriate depending on the nature of the hedged risk. The amounts accumulated in net equity are transferredcarried over to profit or lossresults when the hedged transaction affects profititems are settled or when these have an impact on results.
When a hedging instrument no longer meets the criteria for hedge accounting, any cumulative deferred gain or loss as whenand deferred costs of hedging in equity at that time remains in equity until the hedged interest income or expense is recognized when a projected saleforecast transaction occurs. When the hedged entry is the cost of a non-financial asset or liability, amounts taken to other reserves are transferred to the initial carrying value of the non-financial asset or liability.
IfWhen the expected firmforecast transaction or commitment is no longer expected to occur, the amounts previously recognizedcumulative gain or loss and deferred costs of hedging that were reported in equity are transferredimmediately reclassified to profit or loss. If a hedge instrument expires, is sold, finished, or exercised without any replacement, or if a rollover is performed or if its designation as hedging is revoked, the amounts previously recognized in other reserves are maintained in equity until the expected firm transaction or commitment occurs.
Notes to the Consolidated Financial Statements as of December 31, 2018
| Derivative financial instruments not considered as hedges |
Derivative financial instruments not considered as hedges are recognized at fair value with the effect in the results of the year. The Company maintainshas derivative financial instruments to hedge its exposure to foreign currencies. Derivative financial instruments are recognized initially at fair value; attributable transact ion costs are recognized when incurred. Subsequent to initial recognition, any changes in the fair value of such derivatives are recognized in profit or loss as part of gains and losses.currency risk exposure.
The Company permanently assessescontinually evaluates the existence of embedded derivatives in both in its contracts and in its financial instruments,instruments. As of December 31, 2018,2020, and December 31, 2017, there were no2019, the Company does not have any embedded derivatives.
From the initial recognition, the Company measures its assets and liabilities at fair value plus or minus transaction costs incurred that are directly attributable to the acquisition of a financial asset or issuance of a financial liability
| Deferred acquisition costs from insurance contracts |
Acquisition costs from insurance contracts are classified as prepayments and correspond to insurance contracts in force, recognized using the straight-line method and on an accrual basis andindependent of payment date. These are recognized under other non-financial assets.
| 3.12 | Leases |
| (a) | Right-of-use assets |
The Company recognizes right-of-use assets on the initial lease date (i.e., the date on which the underlying asset is available for use). Right-of-use assets are measured at cost, less any accumulated depreciation and impairment losses, adjusted by any new measurement of the lease liability. The cost of right-of-use assets includes the amount of recognized lease liabilities, direct initial costs incurred and lease payments made on the start date or sooner, less the lease incentives received. Unless the Company is reasonably sure it will take ownership of the leased asset at the end of the lease period, the assets recognized through right-of-use are depreciated in a straight line during the shortest period of their estimated useful life and lease period. Right-of-use assets are subject to impairment as per “IAS 36 Impairment of Assets”.
| (b) | Lease liabilities |
On the lease start date, the Company recognizes lease liabilities measured at present value of lease payments that will be made during the lease period. Lease payments include fixed payments (including payments that are essentially fixed), less incentives for lease receivables, variable lease payments that are dependent on an index or rate and amounts that are expected to be paid as guaranteed residual value. Lease payments also include the exercise price of a purchase option if the Company is reasonably sure it will exercise this and penalty payments for terminating a lease, if the lease period reflects that the Company will exercise the option to terminate. Variable lease payments that are not dependent on an index or rate are recognized as expenses in the period that produces the event or condition that triggers payment.
When calculating the present value of lease payments, the Company uses the incremental borrowing rate on the initial lease date if the interest rate implicit in the lease cannot be determined easily. After the start date, the lease liability balance will increase to reflect the accumulation of interest and will diminish as lease payments are made. Furthermore, the book value of lease liabilities is remeasured in the event of an amendment, a change in the lease period, a change in the fixed lease payments in substance or a change in the assessment to buy the underlying asset.
Payments made that affect lease liabilities are presented as part of the financing activities in the cash flow statement.
| (c) | Short-term leases and low-value asset leases |
The Company applies the short-term lease recognition exemption to leases with a lease term of 12 months or less starting on the start date and that don’t have a purchase option. It also applies the low-value asset lease recognition exemptions. Lease payments in short-term leases and low-value asset leases are recognized as lineal expenses during the lease term.
(d) Significant judgments in the determination of the lease term for contracts with renewal options The Company determines the lease term as the non-cancellable period of the lease, together with periods covered by an option to extend the lease if it is reasonably certain that this will be exercised, or any period covered by an option to terminate the lease, if it is reasonably certain that this will not be exercised.
NotesThe Company has the option, under some of its leases, to lease assets for additional terms. The Company applies its judgment when assessing whether it is reasonably certain that it will exercise the Consolidated Financial Statements as of December 31, 2018option to renovate. In other words, it considers all the relevant factors that create an economic incentive for it to exercise the option to renovate. After the start date, the Company reevaluates the lease term if there is a significant event or change in the circumstances that are under its control and affect its capacity to exercise (or not exercise) the option to renovate.
(a) Lease - Finance lease
Leases are classified as finance leases when the Company substantially owns all the risks and rewards inherent in the ownership of the asset. Finance leases are capitalized at the commencement of the lease term at the lower of the fair value of the leased asset and the present value of the minimum lease payments.
Each finance lease payment is apportioned between the liability and the finance charges so as to obtain the constant rate of interest on the remaining balance of the liability. The respective lease obligations, net of finance charges, are included in other non-current liabilities. The interest part of the finance cost is charged to the consolidated financial statements for the lease term so as to produce a constant periodic rate of interest on the remaining balance of the liability for each year.
(b) Lease - Operating lease
Leases where the lessor retains a significant part of the risks and benefits derived from the property are classified as operating leases. Operating lease payments (net of any incentive received by the lessor) should be recognized as an expense in the income statement or capitalized (as appropriate) over the lease term on a straight-line basis.
Notes to the Consolidated Financial Statements as of December 31, 2018
| Inventory measurement |
The method used to determine the cost of inventories is the weighted average monthly cost of warehouse storage.
In determining production costs for own products, the company includes the costs of labor, raw materials, materials and supplies used in production, depreciation and maintenance of the goods that participate in the production process, the costs of product movement necessary to maintain stock on location and in the condition in which they are found, and also includes the indirect costs of each task such as laboratories, process and planning areas, and personnel expenses related to production, among others.
For finished and in-process products, the company has four types of provisions, which are reviewed quarterly:
| Provision associated with the lower value of |
| Provision associated with physical differences in inventory: |
Notes to the Consolidated Financial Statements as of December 31, 2018
| Potential errors in the determination of stock: The company has an algorithm that is reviewed at least once a year and corresponds to diverse percentages assigned to each inventory based on the product, location, complexity involved in the associated measurement, rotation and control mechanisms. |
| Provisions undertaken by business subsidiaries: these are historical percentages that are adjusted as zero ground is attained based on normal inventory management. |
Inventories of raw materials, materials and supplies for production are recorded at acquisition cost. Cyclical inventories are performed in warehouses, as well as general inventories every three years. Differences are recognized at the moment they are detected. The company has a provision that makes quarterly calculations from percentages associated with each type of material (classification by warehouse and rotation). These, these percentages use the lower value resulting from deterioration or obsolescence as well as potential losses. This provision is reviewed at least annually, and considers the historical profit and loss obtained in the inventory processes.
Under IFRS 11 Joint Arrangements investments in joint arrangements are classified as either joint operations or joint ventures. The classification depends on the contractual rights and obligations of each investor, rather than the legal structure of the joint arrangement.
Joint Ventures and Associates
Interests in companies over which joint control is exercised (joint venture) or where an entity has a significant influence (associates) are recognized using the equity method of accounting. Significant influence is presumed to exist when interest greater than 20% is held in the capital of an investee. Under this method, the investment is recognized in the statement of financial position at cost plus changes, subsequent to the acquisition, and considering the proportional share in the equity of the associate. For such purposes, the interest percentage in the ownership of the associate is used. The associated goodwill acquired is included in the carrying amount of the investee and is not amortized. The debit or credit to profit or loss reflects the proportional share in the profit or loss of the associate.
Unrealized gains for transactions with affiliates or associates are eliminated according to the Company’s interest percentage in such entities. Unrealized losses are also eliminated, except if the transaction provides evidence of impairment loss of the transferred asset.
Changes in the equity of associates are recognized on a proportional basis with a charge or credit to “Other reserves” and classified according to their origin. Reporting dates of the associate, the Company and related policies are similar for equivalent transactions and events under similar circumstances. In the event that the significant influence is lost or the investment is sold or is held as available for sale, the equity method is discontinued, suspending the recognition of the proportional share of profit or loss. If the resulting amount according to the equity method is negative, the share of profit or loss is reflected as zero in the consolidated financial statements, unless a commitment exists by the Company to reinstate the Company’s equity position, in which case the related provision for risks and expenses is recorded.
Dividends received by these companies are recorded by reducing the equity value, and the proportional share of profit or loss recognized according to the equity share are included in the consolidated profit or loss accounts in the caption “Equity share of profit (loss) of associates and joint ventures that are accounted for using the equity method of accounting”.Joint Operation
Regarding joint operations, the Company recognizes its direct right to the assets, liabilities, revenues and expenses of joint operations and its share of any jointly held or incurred assets, liabilities, revenues and expenses.
Notes to the Consolidated Financial Statements as of December 31, 2018
| Transactions with non-controlling interests |
Non-controlling interests are recorded in the consolidated statement of financial position within equity but separate from equity attributable to the owners of the Parent.
| Related party transactions |
Transactions between the Company and its subsidiaries are part of the Company’s normal operations within its scope of business activities. Conditions for such transactions are those normally effective for those types of operations with regard to terms and market prices. These transactions have been eliminated in consolidation. The expirationmaturity conditions vary according to the originating transaction.
| Property, plant and equipment |
The assets tangible property,Property, plant and equipment assets are stated at acquisition cost, net of the related accumulated depreciation, amortization and impairment losses that they might have experienced.
In addition to the price paid for the acquisition of tangible property, plant and equipment, the Company has considered the following concepts as part of the acquisition cost, as applicable:
| Accrued interest expenses during the construction period that are directly attributable to the acquisition, construction or production of qualifying assets, which are those that require a substantial period prior to being ready for use. The interest rate used is that related to the project’s specific financing or, should this not exist, the average financing rate of the investor company. |
| The future costs that the Company will have to experience, related to the closure of its facilities at the end of their useful life, are included at the present value of disbursements expected to be required to settle the |
Having initially recognized provisions for closure and refurbishment, the corresponding cost is capitalized as an asset in “Property, plant and equipment” and amortized in line with the amortization criteria for the associated assets.
Construction-in-progress is transferred to property, plant and equipment in operation once the assets are available for use and the related depreciation and amortization begins on that date.
Extension, modernization or improvement costs that represent an increase in productivity, ability or efficiency or an extension of the useful lives of property, plant and equipment are capitalized as a higher cost of the related assets. All the remaining maintenance, preservation and repair expenses are charged to expense as they are incurred.
The replacement of full assets, which increase the asset’s useful life or its economic capacity, are recorded as a higher value of property, plant and equipment with the related derecognition of replaced or renewed elements.
Gains or losses which are generated from the sale or disposal of property, plant and equipment are recognized as income (or loss) in the period and calculated as the difference between the asset’s sales value and its net carrying value.
Costs derived from the daily maintenance of property, plant and equipment are recognized when incurred.
Notes to the Consolidated Financial Statements as of December 31, 2018
| Depreciation of property, plant and equipment |
Property, plant and equipment are depreciated through the straight-line distribution of cost over the estimated technical useful life of the asset, which is the period in which the Company expects to use the asset. When components of one item of property, plant and equipment have different useful lives, they are recorded as separate assets. Useful lives are reviewed on an annual basis.
Fixed assets associated with thelocated in Salar de Atacama consider useful life to be the lesser value between the technical useful life and the years remaining until 2030.
In the case of certain mobile equipment, depreciation is performed depending on the hours of operationoperation.
The useful lives used for the depreciation and amortization of assets included in property, plant and equipment in years are presented below.below:
| Classes of property, plant and equipment | Minimum life or rate (years) | Maximum life or rate (years) | life or average rate in years | Minimum life or rate (years) | Maximum life or rate (years) | life or average rate in years | ||||||||||||||||||
| Mining assets | 3 | 8 | 7 | 3 | 7 | 6 | ||||||||||||||||||
| Energy generating assets | 3 | 16 | 7 | 3 | 16 | 9 | ||||||||||||||||||
| Buildings | 2 | 40 | 11 | 3 | 25 | 13 | ||||||||||||||||||
| Supplies and accessories | 2 | 16 | 6 | 2 | 10 | 7 | ||||||||||||||||||
| Office equipment | 2 | 20 | 6 | 5 | 5 | 5 | ||||||||||||||||||
| Transport equipment | 2 | 20 | 9 | 5 | 8 | 6 | ||||||||||||||||||
| Network and communication equipment | 3 | 15 | 5 | 4 | 10 | 8 | ||||||||||||||||||
| IT equipment | 2 | 16 | 4 | 5 | 11 | 7 | ||||||||||||||||||
| Machinery, plant and equipment | 1 | 28 | 9 | 5 | 25 | 13 | ||||||||||||||||||
| Other property, plant and equipment | 1 | 26 | 6 | 3 | 15 | 10 | ||||||||||||||||||
| Goodwill |
Goodwill acquired represents the excess in acquisition cost on the fair value of the Company's ownership of the net identifiable assets of the subsidiary on the acquisition date. Goodwill acquired related to the acquisition of subsidiaries is included in the line item goodwill, which is subject to impairment tests annually or more frequently if events or changes in circumstances indicate that it might be impaired and is stated at cost less accumulated impairment losses. Gains and losses related to the sale of an entity include the carrying value of goodwill related to the entity sold.
This intangible asset is assigned to cash-generating units with the purpose of testing impairment losses. It is allocated based on cash-generating units expected to obtain benefits from the business combination from which the aforementioned goodwill acquired arose.
Notes to the Consolidated Financial Statements as of December 31, 2018
| Intangible assets other than goodwill |
Intangible assets other than goodwill mainly relate to water rights, emission rights, commercial brands, costs for rights of way for electricity lines, license costs and the development of computer software and mining property and concession rights, client portfolio and commercial agent.
| (a) | Water rights |
Water rights acquired by the Company relate to water from natural sources and are recorded at acquisition cost. Given that these assets represent legal rights granted in perpetuity to the Company, they are not amortized, but are subject to annual impairment tests.
| (b) | Rights of way for electric lines |
As required for the operation of industrial plants, the Company has paid rights of way in order to install wires for the different electric lines on third party land. These rights are presented under intangible assets.asset. Amounts paid are capitalized at the date of the agreement and charged toamortized in the statement of income, according to the life of the right of way.
| (c) | Computer software |
Licenses for IT programs acquired are capitalized based on their acquisition and customization costs. These costs are amortized over their estimated useful lives.
Expenses related to the development or maintenance of IT programs are recognized as an expense as and when incurred. Costs directly related to the production of unique and identifiable IT programs controlled by the Group, and which will probably generate economic benefits that are higher than its costs during more than a year, are recognized as intangible assets. Direct costs include the expenses of employees who develop information technology software and general expenses in accordance with corporate charges received.
The costs of development for IT programs are recognized as assets are amortized over their estimated useful lives.
| (d) | Mining property and concession rights |
The Company holds mining property and concession rights from the Chilean and Western Australian Governments. Property rights from the State of Chile are usually obtained at no initial cost (other than the payment of mining patents and minor recording expenses) and once the rights on these concessions have been obtained, they are retained by the Company while annual patents are paid. Such patents, which are paid annually, are recorded as prepaid assets and amortized over the following twelve months. Amounts attributable to mining concessions acquired from third parties that are not from the Chilean Government are recorded at acquisition cost within intangible assets.
| (e) |
The periodFinite useful life measures the length of, or number of production or similar units constituting that useful life., except for exploiting these portfolios is unlimited sothe mining claims granted by Corfo, which correspond to assets subject to restitution. For this reason they are considered assets with an indefinitea finite useful life and are therefore not subject to amortization. However,their useful life is assigned until the year 2030 when the contract ends.
The estimated useful life for software which they are subjectedamortized corresponds to an annual impairment test and the corresponding amounts are recorded inperiods defined by the profitcontracts or loss.rights from which they originate.
Notes to the Consolidated Financial Statements as of December 31, 2018
| f) | Minimum and maximum amortization lives or rates of intangible assets: |
| Estimated useful life or amortization rate | Rate | Maximum Life or Rate | ||
| Water rights and rights of way | Indefinite | Indefinite | ||
| Mining rights granted by Corfo | 10 years | 10 years | ||
| Mining rights | Unit-production method | |||
| IT programs | 2 years | 8 years | ||
The rights obtained through the acquisition of the commercial agent of Sociedad Agrocom Ltda. corresponded to the fair value of that company’s line of business. The period for exploiting these rights is unlimited so they are considered assets with an indefinite useful life and are therefore not subject to amortization. However, the indefinite useful life is subject to review for every reporting period, to see whether indefinite useful life continues to apply.
| Research and development expenses |
Research and development expenses are charged to profit or loss in the period in which the expenditure was incurred.
The Company holds mining concessions for exploration and exploitation of ore. Theore, the Company gives the following treatment to expenses associated with exploration and assessment of these resources:
| Caliche |
Once the rights have been obtained, the Company records the disbursements directly associated with the exploration and assessment of the deposit as an at cost asset. These disbursements include the following items: geological surveys, drilling, borehole extraction and sampling, activities related to the technical assessment and commercial viability of the extraction, and in general, any disbursement directly related to specific projects where the objective is to find ore resources.
If the technical studies determine that the ore grade is not economically viable, the asset is directly charged to profit and loss. If determined otherwise, the asset described above is associated with the extractable ore tonnage which is amortized as it is used. These assets are presented in the other“other non-current assetsnon-financial assets” category, reclassifying the portion related to the area to bybe extracted that year as stock.inventories.
Expenses related to metal exploration are charged to profit or loss in the period in which they are recognized if the project assessed doesn't qualify for consideration as advanced exploration otherwise, these are amortized during the development stage.
| Salar de Atacama exploration |
Salar de Atacama exploration expenses are presented as non-current assets as the property, plant and equipment category and correspond mainly to wells that can also be used in the extraction of the deposit and/or monitoring, these are amortized over 10 years.
Mount Holland exploration expenses are presented into “Property, Plant and Equipment”, specifically in Constructions in progress and primarily consider exploration boreholes and complementary studies for the lithium ore study of the area of Western Australia, Australia. These expenses will begin to be amortized in the development stage.
Notes to the Consolidated Financial Statements as of December 31, 2018
| Impairment of non-financial assets |
Assets subject to depreciation and amortization are also subject to impairment testing, provided that an event or change in the circumstances indicates that the amounts in the accounting records may not be recoverable. Anrecoverable, an impairment loss is recognized for the excess of the book value of the asset over its recoverable amount.
For assets other than goodwill, the Group annually assesses whether there is any indication that a previously recognized impairment loss may no longer exist or may have decreased. Should such indications exist, the recoverable amount is estimated.
The recoverable amount of an asset is the higher between the fair value of an asset or cash generating unit (“CGU”) less costs of sales and its value in use, and is determined for an individual asset unless the asset does not generate any cash inflows that are clearly independent from other assets or groups of assets.
When the carrying value of an asset exceeds its recoverable amount, the asset is considered an impaired asset and is reduced to its net recoverable amount.assets
In evaluating value in use, estimated future cash flows are discounted using a pre-tax discount rate that reflects current market assessment, the value of money over time and the specific asset risks.
To determine the fair value less costs to sell, an appropriate valuation model is used.
Impairment losses from continuing operations are recognized with a debit to profit or loss in the categories of expenses associated with the impaired asset function, except for properties reevaluated previously where the revaluation was taken to equity.function.
For assets other than acquired goodwill, an annual evaluation is carried out to determine whether any previously recognized impairment losses have already decreased or ceased to exist. If this should be the case, the recoverable amount is estimated. Aa previously recognized impairment loss is only reversed if there have been changes in the estimates used to determine the asset’s recoverable amount since the last time an impairment loss was recognized. If this is the case, the carrying value of the asset is increased to its recoverable amount. This increased amount cannot exceed the carrying value that would have been determined, net of depreciation, if an asset impairment loss had not been recognized in prior years. This reversal is recognized with a credit to profit or loss.
Assets with indefinite lives are assessed for impairment annually.
The current value of future cash flows generated by these assets has been estimated given the variation in sales volumes, market prices and costs, discounted with a WACC rate. For December 31, 2020, the WACC rate was 9.73%.
| Minimum dividend |
As required by Chilean law and regulations, our dividend policy is decided upon from time to time by our Board of Directors and is announced at the Annual Ordinary Shareholders’ Meeting, which is generally held in April of each year. Shareholder approval of the dividend policy is not required. However, each year the Board must submit the declaration of the final dividend or dividends in respect of the preceding year, consistent with the then-established dividend policy, to the Annual Ordinary Shareholders’ Meeting for approval. As required by the Chilean Companies Act, unless otherwise decided by unanimous vote of the holders of issued shares, we must distribute a cash dividend in an amount equal to at least 30% of our consolidated net income for that year (determined in accordance with CMF regulations), unless and to the extent the Company has a deficit in retained earnings. (See Note 20.4).
| Earnings per share |
The basic earnings per share amounts are calculated by dividing the profit for the year attributable to the ordinary owners of the parent by the weighted average number of ordinary shares outstanding during the year.
The Company has not conducted any type of operation of potential dilutive effect that would entail the disclosure of diluted earnings per share.
Notes to the Consolidated Financial Statements as of December 31, 2018
Trade and other payables are measured at fair value plus all costs associated with the transaction. Subsequently, these are carried out at amortizedThe cost using the effectiveof interest rate method.
At initial recognition, interest-bearing borrowings are measured at fair value net of transaction costs incurred. Subsequently, they are measured at amortized cost using the effective interest rate method. Amortized cost is calculated considering any premium or discount from the acquisition and includes costs of transactions which arerecognized as an integral part of the effective interest rate.
These are recorded as non-current when their expiration period exceeds twelve months and as current when the term is lower than such term. Interest expense is calculated in the year in which it is incurred, except for interest that is directly related to the acquisition and construction of tangible property, plant and equipment assets and that complies with the requirements of IAS 23.
The Company capitalizes all interest costs directly related to the construction or to the acquisition of property, plant and equipment, which require a substantial time to be suitable for use.
The financial expenses accrued following a financial criterion.during the construction period that are directly attributable to the acquisition, construction or production of assets that qualify for this, the corresponding interest rate for the financing specific to the project is used; where this does not exist, the average financing rate of the subsidiary that makes the investment is used.
| Other provisions |
Provisions are recognized when:
| The Company has a present, |
| It is |
| A reliable estimate of the obligation amount can be |
In the event that the provision or a portion of it is reimbursed, the reimbursement is recognized as a separate asset solely if there is certainty of income.
In the consolidated statement of income, the expense for any provision is presented net of any reimbursement.
Should the effect of the value of money over time be significant, provisions are discounted using a discount rate before tax that reflects the liability’s specific risks. When a discount rate is used, the increase in the provision over time is recognized as a finance costcost.
The Company’s policy is to maintain provisions to cover risks and expenses based on a better estimate to deal with possible or certain and quantifiable responsibilities from current litigation, compensations or obligations, pending expenses for which the amount has not yet been determined, collaterals and other similar guarantees for which the Company is responsible. These are recorded at the time the responsibility or the obligation that determines the compensation or payment is generated.
Notes to the Consolidated Financial Statements as of December 31, 2018
| Obligations related to employee termination benefits and pension commitments |
Obligations towards the Company’s employees comply with the provisions of the collective bargaining agreements in force, which are formalized through collective employment agreements and individual employment contracts, except for the United States, which is regulated in accordance with employment plans in force up to 2002. (See more details in Note 17.4)18.4).
These obligations are valued using actuarial calculations, according to the projected unit credit method which considers such assumptions as the mortality rate, employee turnover, interest rates, retirement dates, effects related to increases in employees’ salaries, as well as the effects on variations in services derived from variations in the inflation rate. The criteria in force contained in the revised IAS 19 are also taken into account.considered.
Actuarial gains and losses that may be generated by variations in defined, pre-established obligations are directly recorded in other comprehensive income.“Other Comprehensive Income”.
Actuarial losses and gains have their origin in departuresdeviations between the estimate and the actual behavior of actuarial assumptions or in the reformulation of established actuarial assumptions.
The discount rate used by the Company for calculating the obligation was 4.642% and 5.114% for the periods ended December 31, 2018 and December 31, 2017, respectively.
The Company’s subsidiary SQM North America has established pension plans for its retired employees that are calculated by measuring the projected obligation using a net salary progressive rate net of adjustments for inflation, mortality and turnover assumptions, deducting the resulting amounts at present value using a 3.75% interest rate for 2018 and 4.50% for 2017.value. The net balance of this obligation is presented under the non-current provisions“Non-Current Provisions for employee benefitsEmployee Benefits” (refer to Note 17.4)18.4).
| F-36 |
| Compensation plans |
Compensation plans implemented through benefits provided in share-based payments settled in cash are recognized in the financial statements at their fair value, in accordance with International Financial Reporting Standards No. 2 "Share-based Payments.”IFRS 2. Changes in the fair value of options granted are recognized with a charge to payroll on a straight-line basis duringin the period betweenresults for the date on which these options are granted and the payment dateperiod (see Note 18.6).
Notes to the Consolidated Financial Statements as of December 31, 2018
| Revenue recognition |
Revenue includes the fair value of the considerationconsiderations received or to be receivedreceivable for the sale of goods and services induring the ordinary courseperformance of the Company's activities. Revenue is presented net of value added tax, estimated returns, rebates and discounts and after eliminatingthe elimination of sales made betweenamong subsidiaries.
Revenue isRevenues are recognized when the amount of the income can be reliably valued, it is probable that the future economic benefits will flow to the entity and the specific conditions for each of the types of income from activities will bestream are met, as described below:follows:
| (a) | Sale of goods |
The sale of goods is recognized when the Company has delivered products to the customer, and there is no obligation pending compliance that could affect the acceptance of products by the customer. The delivery does not occur until products have been shipped to the customer or confirmed as received by the customer, and the related risks of obsolescence and loss have been transferred to the customer and the customer has accepted the products in accordance with the conditions established in the sale, when the acceptance period has ended, or when there is objective evidence that those criteria required for acceptance have been met.
Sales are recognized in consideration of the price set in the sales agreement, net of volume discounts and estimated returns at the date of the sale. Volume discounts are evaluated in consideration of annual foreseen purchases and in accordance with the criteria defined in agreements.
| (b) | Sale of services |
Revenue associated with the rendering of services is recognized considering the degree of completion of the service as of the date of presentation of the consolidated classified statement of financial position, provided that the result from the transaction can be estimated reliably.
| (c) |
Interest income is recognized when interest is accrued in consideration of the principal pending payment using the effective interest rate method.
| Income from dividends |
Income from dividends is recognized when the right to receive the payment is established.
Notes to the Consolidated Financial Statements as of December 31, 2018
| Finance income and finance costs |
Finance income is mainly composed of interest income infrom financial instruments such as term deposits and mutual fund deposits. Interest income is recognized in profit or loss at amortized cost, using the effective interest rate method.
Finance costs are mainly composed of interest on bank borrowing expenses, interest on bonds issued and interest capitalized for borrowing costs for the acquisition, construction or production or qualifying assets.
Borrowing costs and bonds issued are also recognized in profit or loss using the effective interest rate method.
For finance costs accrued during the construction period that are directly attributable to the acquisition, construction or production of qualifying assets, the effective interest rate related to the project’s specific financing is used. If none exists, the average financing rate of the subsidiary making the investment is utilized.
Borrowing and financing costs that are directly attributable to the acquisition, construction or production of an asset are capitalized as part of that asset’s cost.
Corporate income tax for the year is determined as the sum of current and deferred income taxes from the different consolidated companies.
Current taxes are based on the application of the various types of taxes attributable to taxable income for the year.period.
Differences between the book value of assets and liabilities and their tax basis generate the balance of deferred tax assets or liabilities, which are calculated using the tax rates expected to be applicable when the assets and liabilities are realized.
In conformity with current Chilean tax regulations, the provision for corporate income tax and taxes on mining activity is recognized on an accrual basis, presenting the net balances of accumulated monthly tax provisional payments for the fiscal period and associated credits. The balances of these accounts are presented in current income taxes recoverable or current taxes payable, as applicable.
Tax on companies
| F-37 |
The income tax and variations in deferred tax assets or liabilities that are not the result of business combinations are recorded in the statement of income accounts or equity accounts in the consolidated statement of financial position, considering the origin of the gains or losses which have generated them.
At each reporting period, the carrying amount of deferred tax assets has beenis reviewed and reduced to the extent where thererecognized only if it is probable that future taxable amounts will not be sufficient taxable incomeavailable to allow the recovery of all or a portion of the deferred tax assets. Likewise, as of the date of the consolidated financial statements, deferred tax assets that are not recognized were evaluated and not recognized as it was more likely than not that future taxable income will allow for recovery of the deferred tax asset.
With respect to deductible temporary differences associated with investments in subsidiaries, associated companies and interest in joint ventures, deferred tax assets are recognized solely provided that it is more likely than not that the temporary differences will be reversed in the near future and that there will be taxable income with which they may be used.
The deferred income taxtaxes related to entriesitems directly recognized in equity is recognizedregistered with an effect on equityother comprehensive income and not with an effect on profit or loss.income.
Deferred tax assets and liabilities are offset if there is a legally receivable right of offsetting tax assets against tax liabilities and the deferred tax is related to the same tax entity and authority.
NotesThe recognized deferred tax assets refer to the Consolidated Financial Statements asamount of December 31, 2018income tax to recover in future periods, related to:
| b) | compensation for losses obtained in prior periods, which have not yet been subject to tax deduction; and |
| c) | compensation for unused credits from prior periods. |
The Company recognizes deferred tax assets when it has the certainty that they can be offset with tax income from subsequent periods, unused tax losses or credits to date, but only when this availability of future tax income is probable and can be used for offsetting these unused tax losses or credits.
The recognized deferred tax liabilities refer to the amount of income tax to pay in a future period, related to taxable temporary differences.
IFRS 8 requires that companies adopt a “management approach”management approach to disclose information on the operations generated by its operating segments. In general, this is the information that management uses internally for the evaluation of segment performance and making the decision on how to allocate resources for this purpose.
An operating segment is a group of assets and operations responsible for providing products or services subject to risks and performance that are different from those of other business segments. A geographical segment is responsible for providing products or services in a given economic environment subject to risks and performance that are different from those of other segments operating in other economic environments.
ForAllocation of assets and liabilities, the allocation to each segment is not possible given that these are associated with more than one segment, except for depreciation, amortization and impairment of assets, which are directly allocated to the applicable segments, in accordance with the criteria established in the costing process for product inventories.inventories to the corresponding segments.
The following operating segments have been identified by the Company:
Notes to the Consolidated Financial Statements as of December 31, 2018
The Management of Sociedad Química y Minera de Chile S.A. and its subsidiaries is responsible for the information contained in these consolidated financial statements, which expressly indicate that all the principles and criteria included in IFRS, as issued by the International Accounting Standards Board (IASB),IASB, have been applied in full.
In preparing the consolidated financial statements of Sociedad Química y Minera de Chile S.A. and its subsidiaries, Managementmanagement has made judgments and estimates to quantify certain assets, liabilities, revenues, expenses and commitments included therein. Basically, these estimates refer to:
| Estimated useful lives are determined based on current facts and past experience and take into consideration the |
| Impairment losses of certain assets - |
| Assumptions used in calculating the actuarial amount of pension-related and severance indemnity payment benefit |
| Contingencies – The amount recognized as a provision, including legal, contractual, constructive and other exposures or obligations, is the best estimate of the consideration required to settle the related liability, including any related interest charges, |
Despite the fact that these estimates have been made on the basis of the best information available on the date of preparation of these consolidated financial statements, certain events may occur in the future and oblige their amendment (upwards or downwards) over the next few years, which would be made prospectively, recognizing the effects of the change in estimates in the related future consolidated financial statements.prospectively.
Notes to the Consolidated Financial Statements as of December 31, 2018
In general, the Company follows the criteria of considering amounts usedNote 4 Changes in environmental protectionaccounting estimates and improvement as environmental expenses. However, the cost of facilities, machinery and equipment used for the same purpose are considered property, plant and equipment, as the case may be.policies
| 4.1 | Changes in accounting estimates |
InThere have been no changes in the preparation ofmethodologies used to determine such estimates in the consolidated financial statements of the Company and subsidiaries, the management has made estimates regarding the useful lives of Properties, Plants and Equipment, assumptions used for the actuarial calculation of employee benefits, contingencies and provisions (for more information, see Note 3.41)periods presented.
| 4.2 | Changes in accounting policies |
AsThe accounting principles and criteria were applied consistently, except for the following:
(a) the new instructions established by the CMF for the taxonomy of the financial statements in 2020 modifies the presentation of right-of-use assets and lease liabilities recognized under IFRS 16. This change has been made as of January 01, 2020 and retroactively as of December 31, 2018, the2019.
(b) The Company’s consolidated financial statements as of the Company presentDecember 31, 2019, show changes in the accounting policies with respect toover the previous period due to the application of IFRS 9 and IFRS 15 from16 as of January 1, 2018. (for further details refer to Note 2.2)2019.
ExceptThe Company chose to apply the simplified transition approach. Under this method, the cumulative effect of initially applying the standard is recognized at January 1, 2019 and comparative amounts are not restated. As the amount of right-of-use assets recognized was equal to the lease liability, there was no impact on retained earnings as described above,a result of the accounting principles were applied consistently for all periods presented.adoption of IFRS 16.
Notes to the Consolidated Financial Statements as of December 31, 2018
Note 5 Financial risk management
| 5.1 | Financial risk management policy |
The Company’s financial risk management policy is focused on safeguarding the stability and sustainability of the Company and its subsidiaries with regard to all such relevant financial uncertainty components.
The Company’s operations are subject to certain financial risk factors that may affect its financial position or results. The most significant risk exposures are market risk, liquidity risk, currency risk, doubtful accountscredit risk, and interest rate risk, among others.
There could also be additional risks, which are either unknown or known but not currently deemed to be significant, which could also affect the Company’s business operations, its business, financial position, or profit or loss.
The financial risk management structure includes identifying, determining, analyzing, quantifying, measuring and controlling these events. Management and in particular, Finance Management, is responsible for constantly assessing the financial risk. The Company uses derivatives to hedge a significant portion of those risks.
Notes to the Consolidated Financial Statements as of December 31, 2018
| Credit risk |
A global economic downturn - and itsmay have potentially negative effects on the financial situationassets of the Company, which are primarily made up of financial investments and trade receivables, and the impact on of our customers - could extend the payment terms of the Company's receivables by increasing its exposure to credit risk. Although measures are taken to minimize the risk, this global economic situation could mean losses with adverse material effects on the business, financial position or profit and loss of the Company's operations.
ToTrade receivables: to mitigate these risks,credit risk, the Company maintains active control of collection and uses measures such asrequires the use of credit insurance. Credit insurance covers the risk of insolvency and unpaid invoices corresponding to 80% of all receivables with third parties. For the uncovered portion, the Company uses other instruments such as letters of credit and prepayments for a portion of receivables.prepayments. The credit risk associated with receivables is analyzed in Note 14.2 b) and the associated accounting policy can be found in Note 3.5.
The concentration of credit risk with respect to sales debtors is reduced, due to the large number of companies that comprise the Company's customer base and their distribution throughout the world.
No significant modifications have been made during the period to risk models or parameters used in comparison to December 31, 2019, and no modifications have been made to contractual cash flows that have been significant during this period.
Financial investmentsinvestments: correspond to time deposits whose maturity date is greater than 90 days and less than 360 days from the date of investment, so they are not exposed to excessive market risks. The counterparty risk in implementation of financial operations is assessed on an ongoing basis for all financial institutions in which the Company holds financial investments.
| F-41 |
The credit quality of financial assets that are not past due or impaired can be evaluated by reference to external credit ratings (if they are available) or historical information on counterparty late payment rates:
| Rating | As of December 31, 2020 | |||||||||||||||||||||||
| Financial institution | Financial assets | Moody´s | S&P | Fitch | ||||||||||||||||||||
| Banco de Crédito e Inversiones | Time deposits | P-1 | A-1 | - | 9,002 | |||||||||||||||||||
| Banco de Chile | Time deposits | P-1 | A-1 | - | 10,503 | |||||||||||||||||||
| Banco Estado | Time deposits | P-1 | A-1 | - | 1,001 | |||||||||||||||||||
| Banco Itau Corpbanca | Time deposits | P-2 | A-2 | - | 7,299 | |||||||||||||||||||
| Banco Santander – Santiago | Time deposits | P-1 | A-1 | - | ||||||||||||||||||||
| Time deposits | - | |||||||||||||||||||||||
| - | ||||||||||||||||||||||||
| 7,002 | ||||||||||||||||||||||||
| JP Morgan US dollar Liquidity Fund Institutional | Investment fund | AAAm | AAAmmf | 102,753 | ||||||||||||||||||||
| Legg Mason - Western Asset Institutional | Investment fund | - | AAAm | AAAmmf | 107,625 | |||||||||||||||||||
| Other banks with lower balances | Time deposits | - | - | - | 86 | |||||||||||||||||||
| Total | 261,973 | |||||||||||||||||||||||
| Rating | As of December 31, 2020 | |||||||||||||||||
| Financial institution | Financial assets | Moody´s | S&P | Fitch | ||||||||||||||
| Banco de Crédito e Inversiones | 90 days to 1 year | P-1 | A-1 | - | 185,589 | |||||||||||||
| Banco | 90 days to 1 year | P-2 | A-2 | - | 49,006 | |||||||||||||
| Banco | 90 days to 1 year | P-1 | A-1 | - | 45,168 | |||||||||||||
| Banco | 90 days to 1 year | - | - | F1+ | 31,668 | |||||||||||||
| JP Morgan Asset Management | 90 days to 1 year | P-1 | A-1 | N1+ | 34,028 | |||||||||||||
| Total | 345,459 | |||||||||||||||||
The following table presents comparative information as of December 2017:
| Rating | As of December 31, 2019 | |||||||||||||||||||||||
| Financial institution | Financial assets | Moody´s | S&P | Fitch | ThUS$ | |||||||||||||||||||
| Banco | Time deposits | P-1 | A-1 | - | 50,221 | |||||||||||||||||||
| Banco de Crédito e Inversiones | Time deposits | P-1 | A-1 | - | 42,096 | |||||||||||||||||||
| Banco | Time deposits | P-2 | A-2 | - | 39,093 | |||||||||||||||||||
| Banco Santander | Time deposits | P-1 | A-1 | - | 2,708 | |||||||||||||||||||
| Scotiabank Sud Americano | Time deposits | - | - | F1+ | 14,428 | |||||||||||||||||||
| Banco Estado | Time deposits | P-1 | A-1 | - | 500 | |||||||||||||||||||
| BBVA Banco Francés | Time deposits | - | - | |||||||||||||||||||||
| - | 53 | |||||||||||||||||||||||
| JP Morgan US dollar Liquidity Fund Institutional | Investment fund | AAAm | AAAmmf | 181,155 | ||||||||||||||||||||
| Legg Mason - Western Asset Institutional | Investment fund | - | ||||||||||||||||||||||
| Total | 476,332 | |||||||||||||||||||||||
Notes to the Consolidated Financial Statements as of December 31, 2018
| Financial | Rating | As of December 31, 2019 | ||||||||||||||||
| Financial institution | Moody´s | S&P | Fitch | ThUS$ | ||||||||||||||
| Banco | 90 days to 1 year | P-2 | - | - | 54,180 | |||||||||||||
| Banco de Crédito e Inversiones | 90 days to 1 year | P-1 | A-1 | - | 178,448 | |||||||||||||
| Banco Santander (*) | 90 days to 1 year | P-1 | A-1 | - | 74,365 | |||||||||||||
| Banco Itau Corpbanca | 90 days to 1 year | P-2 | A-2 | - | 127,579 | |||||||||||||
| Banco Security | 90 days to 1 year | - | A-2 | F2 | 17,965 | |||||||||||||
| Banco de Chile | 90 days to 1 year | - | - | - | 18,026 | |||||||||||||
| Banco | 90 days to 1 year | P-1 | A-1 | - | ||||||||||||||
| Total | 485,689 | |||||||||||||||||
Notes(*) This includes ThUS$ 1,870 associated with collateral in guarantee used to reduce the Consolidated Financial Statements as of December 31, 2018liquidity risk.
| Currency risk |
The functional currency of the Companycompany is the US Dollar,dollar, due to its influence on the determination of price levels, its relation to the cost of sales and considering that a significant part of the Company’s business is conducted in this currency. However, the global nature of the Company's business generates an exposure to exchange rate variations of several currencies with the US Dollar.dollar. Therefore, the Company maintains hedge contracts to mitigate the exposure generated by its main mismatches (net between assets and liabilities) in currencies other than the US dollar against the exchange rate variation, updating these contracts periodically depending on the amount of mismatching to be covered in these currencies. Occasionally, subject to the approval of the Company’s Board, of Directors (the “Board”), the Company ensures short-term cash flows from certain specific line items in currencies other than the US Dollar.dollar.
A significant portion of the Company’s costs, especially salary payments, is associated with the Chilean peso (the “Peso”).Peso. Therefore, an increase or decrease in its exchange rate with the US Dollardollar would affect the Company's profit and loss. By the fourth quarter of 2020, approximately US$400 473 million accumulated in expenses are associated with the Peso. A significant part of the effect of these liabilities on the Statement of Financial Position is covered by derivative instrument operations that cover the balance sheet mismatch.
As of December 31, 2018,2020, the Company held derivative instruments classified as hedges of foreign exchange risks associated with 100% of all of the bond liabilities denominated in UF, for an asset at fair value of US$ 18.41 million. As of December 31, 2019, a liability was recognized amounting to US$ 18.9 million.
Furthermore, on December 31, 2020, the Company held derivative instruments classified as hedges of foreign exchange risks associated with 100% of all denominated term deposits in UF and in pesos, at a fair value of US$3.9 21 million against the Company. and as ofin liabilities. On December 31, 2017, it totaled2019, an asset was recognized for an amount of US$5 million against the Company.
As of December 31, 2018, the exchange rate value for equivalent Pesos to US Dollars was Ch$694.77 per US Dollar, and as of December 31, 2017, it was Ch$614.75 per US Dollar.
Notes to the Consolidated Financial Statements as of December 31, 2018 16.4 million.
| Interest rate risk |
Interest rate fluctuations, primarily due to the uncertain future behavior of markets, may have a material impact on the financial results of the Company. Significant increases in the rate could make it difficult to access financing at attractive rates for the Company's investment projects.
The Company maintains current and non-current financial debt valued at thefixed rates and LIBOR rate plus spread.
As of December 31, 2018,2020, the Company has around 5%4% of its financial liabilities linked to variations in the LIBOR rate. 100% of these obligations are covered by derivative instruments classified as interest rate andhedging; therefore, anya significant increases in that rate increase would not impact itsour financial position. A change of 100 base points over that rate could generate variations in finance costs of around US$0.06 million.condition.
Additionally, as of December 31, 2018, the Company does not maintain maturities of less than 12 months on all capital of the financial debt, thereby reducing exposure to variations in interest rates.
| F-43 |
| Liquidity risk |
Liquidity risk relates to the funds needed to comply with payment obligations. The Company’s objective is to maintain financial flexibility through a comfortable balance between fund requirements and cash flows from regular business operations, bank borrowings, bonds, short term investments, and marketable securities, among others. For this purpose, the Company keeps a high liquidity ratio1, which enables it to cover current obligations with clearance. (On December 31, 2020, this was 5.40).
The Company has an important capital expense program which is subject to change over time.
On the other hand, world financial markets go through periods of contraction and expansion that are unforeseeable in the long-term and may affect SQM’s access to financial resources. Such factors may have a material adverse impact on the Company’s business, financial position and results of operations.
SQMThe Company constantly monitors the matching of its obligations with its investments, taking due care of maturities of both, from a conservative perspective, as part of this financial risk management strategy. As of December 31, 2018,2020, the Company had unused, available revolving credit facilities with banks, for a total of approximately US$481 478 million.
The position in other cash and cash equivalents generated by the Company are invested in highly liquid mutual funds with an AAA risk rating.
| Nature of undiscounted cash flows | ||||||||||||||||||||
As of December 31, 2020 (figures expressed in millions of US dollars) | Carrying amount | Less than 1 year | 1 to 5 years | Over 5 years | Total | |||||||||||||||
| Bank borrowings | 70.08 | 0.94 | 71.40 | - | 72.34 | |||||||||||||||
| Unsecured obligations (1) | 1,872.09 | 88.22 | 927.17 | 1,727.14 | 2,742.53 | |||||||||||||||
| Sub total | 1,942.17 | 89.16 | 998.57 | 1,727.14 | 2,814.87 | |||||||||||||||
| Hedging liabilities | 40.21 | 6.06 | 12.34 | 11.07 | 29.47 | |||||||||||||||
| Derivative financial instruments | 5.39 | 5.39 | - | - | 5.39 | |||||||||||||||
| Sub total | 45.60 | 11.45 | 12.34 | 11.07 | 34.86 | |||||||||||||||
| Current and non-current lease liabilities | 31.07 | 6.40 | 21.04 | 7.17 | 34.61 | |||||||||||||||
| Trade accounts payable and other accounts payable | 203.93 | 203.93 | - | - | 203.93 | |||||||||||||||
| Total | 2,222.77 | 310.94 | 1,031.95 | 1,745.38 | 3,088.27 | |||||||||||||||
| Nature of undiscounted cash flows | ||||||||||||||||||||
As of December 31, 2019 (figures expressed in millions of US dollars) | Carrying amount | Less than 1 year | 1 to 5 years | Over 5 years | Total | |||||||||||||||
| Bank borrowings | 70.19 | 2.17 | 74.87 | - | 77.04 | |||||||||||||||
| Unsecured obligations | 1,697.11 | 326.34 | 614.29 | 1,184.38 | 2,125.01 | |||||||||||||||
| Sub total | 1,767.30 | 328.51 | 689.16 | 1,184.38 | 2,202.05 | |||||||||||||||
| Hedging liabilities | 23.66 | 6.57 | 24.33 | 32.37 | 63.27 | |||||||||||||||
| Derivative financial instruments | 3.17 | 3.17 | - | - | 3.17 | |||||||||||||||
| Sub total | 26.83 | 9.74 | 24.33 | 32.37 | 66.44 | |||||||||||||||
| Current and non-current lease liabilities | 37.90 | 8.90 | 23.01 | 10.27 | 42.18 | |||||||||||||||
| Trade accounts payable and other accounts payable | 205.79 | 205.79 | - | - | 205.79 | |||||||||||||||
| Total | 2,037.82 | 552.94 | 736.50 | 1,227.02 | 2,516.46 | |||||||||||||||
(1) Unsecured obligations are presented on a contractual basis and have no effects related to anticipated redemptions.
1 All current assets divided by all current liabilities.
Notes to the Consolidated Financial Statements as of December 31, 2018
| As of December 31, 2018 | Nature of undiscounted cash flows | |||||||||||||||||||
| (in millions of US$) | Carrying amount | Less than 1 year | 1 to 5 years | Over 5 years | Total | |||||||||||||||
| Other non-derivative financial liabilities | ||||||||||||||||||||
| Bank borrowings | 70.25 | 4.10 | 79.66 | - | 83.76 | |||||||||||||||
| Unsecured obligations | 1,273.07 | 61.37 | 823.76 | 713.60 | 1,598.73 | |||||||||||||||
| Subtotal | 1,343.32 | 65.47 | 903.42 | 713.60 | 1,682.49 | |||||||||||||||
| Other derivative financial liabilities | ||||||||||||||||||||
| Hedging liabilities | (14.34 | ) | 5.52 | 15.64 | 29.27 | 50.43 | ||||||||||||||
| Derivative financial instruments | 0.16 | 0.16 | - | - | 0.16 | |||||||||||||||
| Subtotal | (14.18 | ) | 5.68 | 15.64 | 29.27 | 50.59 | ||||||||||||||
| Trade accounts payable and other accounts payable | 163.75 | 163.17 | 0.58 | - | - | |||||||||||||||
| Total | 1,492.89 | 234.32 | 919.64 | 742.87 | 1,733.08 | |||||||||||||||
| As of December 31, 2017 | Nature of undiscounted cash flows | |||||||||||||||||||
| (in millions of US$) | Carrying amount | Less than 1 year | 1 to 5 years | Over 5 years | Total | |||||||||||||||
| Other non-derivative financial liabilities | ||||||||||||||||||||
| Bank borrowings | 163.57 | 164.78 | - | - | 164.78 | |||||||||||||||
| Unsecured obligations | 1,054.89 | 47.45 | 522.52 | 751.67 | 1,321.64 | |||||||||||||||
| Subtotal | 1,218.46 | 212.23 | 522.52 | 751.67 | 1,486.42 | |||||||||||||||
| Other derivative financial liabilities | ||||||||||||||||||||
| Hedging liabilities | 28,38 | 37.01 | (9.51 | ) | (18.36 | ) | 9.14 | |||||||||||||
| Derivative financial instruments | 0,80 | 0.80 | - | - | 0.80 | |||||||||||||||
| Subtotal | 29,18 | 37.81 | (9.51 | ) | (18.36 | ) | 9.94 | |||||||||||||
| Trade accounts payable and other accounts payable | 196,28 | 196.18 | 0.10 | - | - | |||||||||||||||
| Total | 1,247.64 | 446.22 | 513.11 | 733.31 | 1,496.36 | |||||||||||||||
| Risk measurement |
The Company has methods to measure the effectiveness and efficiency of financial risk hedging strategies, both prospectively and retrospectively. These methods are consistent with the risk management profile of the SQM Group. See Note 13.8
Notes toNote 6 Separate information on the Consolidated Financial Statements as of December 31, 2018parent entity
| 6.1 |
| 12/31/2018 | 12/31/2017 | As of December 31, | As of December 31, | |||||||||||||
| ThUS$ | ThUS$ | |||||||||||||||
| Parent Company’s stand-alone assets and liabilities | ThUS$ | ThUS$ | ||||||||||||||
| Assets | 3,737,892 | 3,658,528 | 4,173,308 | 4,069,649 | ||||||||||||
| Liabilities | (1,652,401 | ) | (1,470,707 | ) | (2,050,223 | ) | (1,983,382 | ) | ||||||||
| Equity | 2,085,491 | 2,187,821 | 2,123,085 | 2,086,267 | ||||||||||||
| 6.2 | Parent entity |
Pursuant to Article 99 of Law No. 18,045 of the Securities Market (the "Securities Market Law"),Law, the Commission for Financial Market (the "CMF")CMF may determine that a company does not have a controllercontrolling entity in accordance with the distribution and dispersion of its ownership. On November 30, 2018, the CMF issued the ordinary letter No. 32.13132,131 whereby it determined that Sociedad de Inversionesthe Pampa Calichera S.A., Potasios de Chile S.A. and Inversiones Global Mining (Chile) Limitada (the "Pampa Group"),Group do not exert decisive power over the management of the Company since it does not have a predominance in the ownership that allows it to make management decisions. Therefore, the CMF has determined not to consider Grupo Pampa Group the controllercontrolling entity of the Company and that the Company does not have a controllercontrolling entity given its current ownership structure.
Notes to the Consolidated Financial Statements as of December 31, 2018
| Subsidiary | % of interests in the ownership held by non-controlling interests, | Profit (loss) attributable to non- controlling interests | Equity, non-controlling interests | Dividends paid to non- controlling interests | ||||||||||||||||||||||||
| 12/31/2018 | 12/31/2017 | 12/31/2018 | 12/31/2017 | 12/31/2018 | 12/31/2017 | |||||||||||||||||||||||
| ThUS$ | ThUS$ | ThUS$ | ThUS$ | ThUS$ | ThUS$ | |||||||||||||||||||||||
| Proinsa Ltda. | 0.1 | % | - | - | - | - | - | - | ||||||||||||||||||||
| SQM Potasio S.A. | 0.0000001 | % | - | - | - | - | - | - | ||||||||||||||||||||
| Ajay SQM Chile S.A. | 49 | % | 1,176 | 1,023 | 8,659 | 8,306 | 823 | 989 | ||||||||||||||||||||
| SQM Indonesia S.A. | 20 | % | - | - | 1 | 1 | - | - | ||||||||||||||||||||
| Soquimich Comercial S.A. | 39.3616784 | % | 1,375 | 100 | 41,855 | 49,247 | 8,910 | 1,264 | ||||||||||||||||||||
| Comercial Agrorama Ltda. | 30 | % | (318 | ) | (403 | ) | (481 | ) | (184 | ) | - | - | ||||||||||||||||
| Agrorama S.A. | 0.001 | % | - | - | - | - | - | - | ||||||||||||||||||||
| Orcoma Estudios SPA | 49 | % | - | - | 2,277 | 2,277 | - | - | ||||||||||||||||||||
| SQM (Thailand) Limited. | 0.004 | % | - | - | - | - | - | - | ||||||||||||||||||||
| Total | 2,233 | 720 | 52,311 | 59,647 | 9,733 | 2,253 | ||||||||||||||||||||||
Notes to the Consolidated Financial Statements as of December 31, 2018
Note 7 Board of Directors, Senior Management and Key management personnel
SQM S.A. is managed by a Board of Directors which is composed of 8 regular directors,
As of December 31,
During the periods covered by these financial statements, there are no pending
Directors’ compensation differs according to the period during the corresponding year. Thus, from April 25, 2019 to April 22, 2020 (Period 2019-2020), Directors’ compensation was determined by the annual general shareholders' meeting held on April 25, 2019. While for the following period (Period 2020-2021), Directors’ compensation was determined by the annual general shareholders' meeting held on April 23, 2020. For each of these periods, Directors’ compensation is detailed as follows:
Period 2019-2020
These fixed and variable amounts for both periods shall not be challenged and those expressed in percentage terms shall be paid immediately after the respective annual general shareholders meeting approves the financial statements, the annual report, the account inspectors report and the external auditors report for the respective year. All amounts expressed in UF shall be paid in Chilean pesos at its value on the last day of the respective calendar month, as determined by the CMF (formerly Superintendence of Banks and Financial Institutions) the Chilean Central Bank or any other relevant institution that replaces them. Accordingly, the compensation and profit sharing paid to members of the Directors' Committee and the directors as of December 31, 2020 amounted to ThUS$ 4,582 and as of December 31, 2019 to ThUS$ 5,168.
Directors' Committee compensation differs according to the period during the corresponding year. Thus, for the Period 2019-2020, Directors’ Committee compensation was determined by the annual general shareholders' meeting held on April 25, 2019. While for the Period 2020-2021, Directors’ Committee compensation was determined by the annual general shareholders' meeting held on April 23, 2020. For each of these periods the compensation of the Directors Committee comprises: Period 2019-2020
Period 2020-2021
The remuneration
The remuneration for this committee
No guarantees have been constituted in favor of the directors.
No guarantees have been pledged in favor of the Company’s management. (i) Pensions, life insurance, paid leave, shares in earnings, incentives, disability loans, other than those mentioned in the above points. The Company’s Management and Directors do not receive or have not received any benefit during the ended December 31, 2020 and the year ended December 31, 2019 or compensation for the concept of pensions, life insurance, paid time off, profit sharing, incentives, or benefits due to disability other than those mentioned in the preceding points.
As of December 31,
Please also see the description of the compensation plan for executives in Note 18.6.
Note 8 Equity-accounted investees
As of December 31,
(*) As of December 31, 2020, these investments no longer form part of the group. See Note 8.4 (a).
The companies described in the table below are related parties of the following associates:
(1) Doktor Tarsa Tarim Sanayi AS (2) Terra Tarsa B.V. (3) Abu Dhabi Fertilizer Industries WWL
(*) This percentage does not consider the shareholdings of the holders of these subsidiaries.
The Company has no participation in unrecognized losses in investments in associates.
The Company has no investments that are not accounted for according to the equity method. The basis of preparation of the financial information of associates corresponds to the amounts included in the financial statements in conformity with IFRS.
Note 9 Joint Ventures
At the date of issuance of these financial statements,
The companies described in the following table are related to the following joint ventures:
The amounts described in the following box represent numbers used in the consolidation of the company:
The following companies are subsidiaries
In 2017, On January 23, 2020, after finalizing the In addition, the
Note 10 Cash and cash equivalents
As of December 31,
As of December 31,
Short-term investments are highly liquid
As of December 31,
Financial assets pledged as collateral On November 4, 2004, Isapre Norte Grande has a guarantee equivalent to the total amount owed to its subsidiaries and
As of December 31,
The detail at the end of each period is as follows:
This section sets out an analysis of net debt and
The definition of debt is described in Note 13.
The definition of debt is described in Note 13.
The composition of inventory at each period-end is as follows:
As of December 31,
As of December 31, 2020, and 2019, inventory allowances recognized, amounted to ThUS$ 80,930 and ThUS$ 88,174, respectively. For finished and in-process products,
For
The
The Company has not
As of December 31,
Note 12 Related party disclosures
Balances pending at period-end are not guaranteed, accrue no interest and are settled in
Pursuant to Article 99 of Law of the Securities Market Law, the CMF may determine that a company does not have a controlling entity in accordance with the distribution and dispersion of its ownership. On November 30, 2018, the CMF issued the ordinary letter No. 32,131 whereby it determined that Pampa Group, do not exert decisive power over the management of the Company since it does not have a predominance in the ownership that allows it to make management decisions. Therefore, the CMF has determined not to consider Pampa Group as the controlling entity of the Company and that the Company does not have a controlling entity given its current ownership structure.
As of December 31,
Transactions between the Maturity terms for each case vary by virtue of the transaction giving rise to them.
As of December 31,
As of December 31, 2020, the Company has made contributions to Mt Holland in favor of Wesfarmers in the amount of US$ 15 million. This value is presented in the financial statements in the line “Trade and other accounts receivable.” For more details, see Note 9.6. Note 7 describes the remuneration of the Board of Directors, administration and key management personnel
Note 13 Financial instruments
See discussion about credit risk in Note 5.2.
As of December 31, 2020, and December 31, 2019 the detail of the renegotiated portfolio is as follows:
As of December 31, 2020, and December 31, 2019, movements in provisions are as follows:
The balance represents derivative financial instruments measured at fair value which have been classified as hedges
The balances in the Derivative contract maturities are detailed as follows:
Effectiveness
The Company uses cross currency swap derivative instruments to hedge the possible financial risk associated with the volatility of the exchange rate associated with Chilean pesos and UF. The objective is to hedge the exchange rate and inflation financial risks associated with bonds payable. Hedges are documented and tested to measure their effectiveness.
Based on a comparison of critical terms, hedging is highly effective, given that the hedged amount is consistent with obligations maintained for bonds denominated in
Other current and non-current financial liabilities
As of December 31,
Current and non-current bank borrowings
As of December 31,
As of December 31,
As of December 31,
Effective rates of bonds in
Effective rates of bonds in
The following table shows the details of bank loans
The
Bonds
As of December 31,
On January 13, 2009, the Company placed
On January 5, 2020, amortization of principal amounted to UF 181,818.18. (ThUS$ 6,787) with an associated cross currency swap hedge loss of ThUS$ 268. On July 5, 2020, amortization of principal amounted to UF 181,818.18. (ThUS$ 6,509) with an associated cross currency swap hedge loss of ThUS$ 546. See more details in Note 20.1 For the periods ended December 31,
On April 21, 2010, the Company informed the CMF of its placement in international markets of an unsecured bond of ThUS$250,000, pursuant to Rule 144 -A and Regulation S of the Securities and Exchange Commission with a maturity of 10 years The Company paid the principal on April 21, 2020.
As of December 31,
On April 4, 2012, the Company
For the periods ended December 31,
On April 3, 2013, the Company issued a
On October 23, 2014, the Company
The
On October 31, 2018, the issuance of Series Q bonds
The
On November 8, 2018, all the Series Q Bonds have been placed and sold to Euroamerica S.A. for a total amount of
For the
On May 7, 2019, the CMF was informed that the Company issued and placed unsecured bonds for ThUS$ 450,000 pursuant to For the periods ended on December 31, 2020 and December 31, 2019, the following payments have been made:
On January 22, 2020, the Company has placed unsecured bonds in international markets for US$ 400 million, pursuant to Rule 144-A and
As of December 31,
Suppliers current on all payments
Suppliers past due on payments
Purchase commitments held by the Company are recognized as liabilities when the goods and services are received by the
The fair value hierarchy is detailed as follows:
As required by IFRS 7, the following information is presented for the disclosure of the estimated fair value of financial assets and liabilities. Although inputs represent Management's best estimate, they are subjective and involve significant estimates related to the current economic and market conditions, as well as risk features. Methodologies and assumptions used depend on the risk terms and characteristics of instruments and include the following as a summary: Estimate of fair value for recognition purposes
Financial assets and liabilities measured at fair value consist of
The fair value of the Company’s assets and liabilities recognized by
In the case of CCS, the entry data used for the valuation models are UF,
The effects on profit or loss of movements in these amounts
14.1 Right-of-use assets
The (a) The nature of the Company’s (b) The Company does not estimate any significant future cash outflows that would potentially expose the Company, and these are likewise not reflected in the measurement of lease liabilities, related to concepts such as: (i) Variable lease payments, (ii) Expansion options and termination options, (iii) Guaranteed residual value and (c) These are not subject to restrictions or agreements imposed by contracts.
i)Current and non-current lease liabilities
As of December 31, 2020 and December 31, 2019, the Non-current lease liabilities are analyzed as follows:
Other lease disclosures Total lease expenses related to lease payments were ThUS$ 61,705 and ThUS$ 56,051 for the periods ended December 31, 2020 and 2019. See Note 23.8. Expenses related to variable payments not included in lease liabilities were MUS$ 1,133 and MUS$ 1,096 for the periods ending December 31, 2020 and 2019. Income from subleases on right-of-use assets were ThUS$ 176 and ThUS$ 261 as of December 31, 2020 and 2019, respectively. Contractual payments for lease liabilities are disclosed in Note 5.2 Liquidity Risk.
| |||||||||||||||||||||||||||||||||||||||||||||||||||||||||||||||||||||||||||||||||||||||||||||||||||||||||||||||||||||||||||||||||||||||||||||||||||||||||||||||||||||||||||||||||||||||||||||||||||||||||||||||||||||||||||||||||||||||||||||||||||||||||||||||||||||||||||||||||||||||||||||||||||||||||||||||||||||||||||||||||||||||||||||||||||||||||||||||||||||||||||||||||||||||||||||||||||||||||||||||||||||||||||||||||||||||||||||||||||||||||||||||||||||||||||||||||||||||||||||||||||||||||||||||||||||||||||||||||||||||||||||||||||||||||||||||||||||||||||||||||||||||||||||||||||||||||||||||||||||||||||||||||||||||||||||||||||||||||||||||||||||||||||||||||||||||||||||||||||||||||||||||||||||||||||||||||||||||||||||||||||||||||||||||||||||||||||||||||||||||||||||||||||||||||||||||||||||||||||||||||||||||||||||||||||||||||||||||||||||||||||||||||||||||||||||||||||||||||||||||||||||||||||||||||||||||||||||||||||||||||||||||||||||||||||||||||||||||||||||||||||||||||||||||||||||||||||||||||||||||