GSK’s 11 CEDDs, based in Europe and the USA, are: | | | • | Biopharmaceuticals – Stevenage, UK | | | | • | Cardiovascular & Urogenital – Upper Merion, USA | | • | Centre of Excellence for External Drug Discovery – Upper Merion, USA | | • | Immuno-inflammation – Stevenage, UK | | • | Infectious Disease – Upper Merion and Research Triangle Park, USA | | |
| • | Metabolic – Research Triangle Park, USA | | | | • | Oncology – Upper Providence, USA | | | | • | Macrolide Drug Discovery – Zagreb, Croatia (acquired Pliva ResearchInstitute in May 2006) | | | | • | Neurology & Gastrointestinal Diseases – Harlow, UK | | | | • | Psychiatry – Verona, Italy | | | | • | Respiratory and Inflammation – Stevenage, UK. |
Each CEDD is responsible for identifying the targets of most relevance in its therapeutic area and building on the lead compounds transferred from MDR to produce a potential medicine. The fundamental steps in turning a lead compound into a medicine are optimising it for potency, efficacy and safety and defining the biology in animals and humans so that the medicine can be tested for effects in the right patient groups. These inventive steps are underpinned through scientific research and the application of informed judgement to develop creative solutions to the problems and challenges that inevitably arise in discovery and early development. Once a candidate compound is selected, the CEDDs are responsible for undertaking the clinical studies necessary to demonstrate ana beneficial effect sufficient to declare “proof of concept” – the first indication in patients that the new medicine works. Based on the programme’s profile of safety and efficacy a decision is then made on whether to progress the medicine into late-stage drug development, where large-scale clinical trials are conducted to confirmdevelopment. As part of GSK’s commitment towards pursuing the efficacy and safety and gain regulatory approval to commercialisebest science anywhere in the product. Duringworld, the year, 19 new projects entered Phase II clinical trials for the first time.
GSK is committed to developing clinical science to ensure the understanding of disease processes in humans and learning as much as possible about the medicines in development. The application of experimental medicine is a major opportunity for the industry to optimise the drug discovery process. Advances in clinical imaging are revolutionising experimental medicine and opening opportunities to visualise the effects of medicines in humans. In 2006, GSK opened the Clinical Imaging Centre (CIC) on the biomedical research campus of Imperial College, London. The new £46 million facility is staffed by clinical investigation research groups working with state-of-the-art magnetic resonance imaging and positron emission tomography imaging systems. Facilities include radiochemistry, biology, image analysis and neurophysiology laboratories. The formidable capabilities of the CIC are augmented through multiple, global collaborations with academic imaging centres, established by GSK over the last decade.
In addition to the nine CEDDs, GSK also created a Centre of Excellence for External Drug Discovery (CEEDD) was established in 2005. This small team is responsible forThe CEEDD has the same objective as the CEDDs: delivering compounds to the proof of concept stagemedicines into late-stage development, but does so by establishing and managing long-term strategic collaborations with biotechnology companies,biotech and small andto medium-sized pharmaceutical companies and academic institutions.companies. In 2006,2007, the CEEDD exercised its first option to bring in a compound to clinical development: XL880, an anti-cancer inhibitor from Exelixis.
As part of this same strategic intent, in 2007 GSK established foura dedicated R&D centre in Shanghai. R&D in China will focus on research into neurodegeneration with the objective of creating new collaborationsmedicines for such severe disorders as multiple sclerosis, Parkinson’s disease and currently oversees a portfolioAlzheimer’s disease. The centre will eventually direct the global discovery and development activities within its therapeutic area, from drug-target identification to late-stage clinical studies, while collaborating with research institutions elsewhere in China and other countries. Establishing R&D China reflects GSK’s commitment to ally with talented researchers wherever they are located and to further encourage within R&D the contest of 58 drug discovery projects ranging from target selection throughideas needed to human clinical trials.create new medicines. Developing medicines for patients
Progression into late-stage development (referred to at GSK as ‘medicines development’), consists of optimising both the physical product properties of the medicine, that is, the chemical steps and formulation required to manufacture and deliver it, as well as the large scale confirming studies of efficacy and safety. The former activity is the responsibility of Preclinical Development, while the latter is the responsibility of the clinical development and development operations teams. The combination of the results of these two steps into a regulatory file for submission to regulatory agencies and approval for patient use is the responsibility of the regulatory team. The integration of all steps above into a coherent project is the responsibility of the project teams, which are grouped therapeutically into Medicine Development Centres. These roles are described in more detail as follows:
| 14 | GSK Annual Report 2007 | | |
Back to Contents | | | REPORT OF THE DIRECTORS | | | Delivering the product pipeline for patients | | | | | | Business review | | Delivering the product pipeline for patients | | continued | | |
Preclinical Development (PCD) includes a wide range of activities throughout the entire medicines development process. In addition, this function is involved in the enhancement of existing products by devising more convenient formulations. Early in the development process, the metabolism and safety of compounds are evaluated in laboratory animals before testing in humans. The testing required in animals is highly regulated (see Animals and research, page 12)16). PCD researchers investigate appropriate dosage forms (for example, tablets or inhalers) and develop formulations to enhance a drug’s effectiveness and its ease of use by the patient.
Back to Contents
| Business review | | Delivering the product pipeline for patients | continued |
| |
Processes and supporting analytical methods for drug synthesis and product formulation and delivery are scaled up to meet increasing supply requirements. This leads to the technical transfer of the processes and methods to manufacturing. The new product supply process, a partnership between R&D and Global Manufacturing and Supply, ensures that a robust product is developed for large-scale commercial manufacturing and launch. In 2006, GSK redesigned the management of late-stage development by dividing the single large late-stage development organisation into three distinct, empowered entities. The first component, Medicines Development is the collection of six therapeutically aligned Medicine Development Centres (MDCs).MDCs. Each MDC has ultimate accountability for developing experimental drugs into regulatory-approved medicines for patients. The MDCs are responsible for creating value through the execution of full product development plans and ensuring strong partnerships with the rest of GSK, in particular the CEDDs and the other late-stage development groups.
The MDCs are based at the major USA and UK sites and are aligned with the following therapeutic areas: | • | Cardiovascular/Metabolic | | | | • | Infectious Diseases including Diseases of the Developing World(DDW) | | World (DDW) | | • | Musculoskeletal/Inflammation/Gastrointestinal/Urology | | | | • | Neuroscience (Psychiatry/Neurology) | | | | • | Oncology | | | | • | Respiratory |
The MDCs discharge their responsibilities through project teams for each medicine in development. These project teams are responsible for maximising the worldwide development opportunities for each product within their remit and to see that all the information needed to support the registration, safety programmes, pricing and formulary negotiations is available. Commercial input from Global Product Strategy and Commercial Operations ensures that regional marketing needs are integrated into development plans at an early stage. The second component, Development Operations drives operational excellence in medicine delivery at the study, project and portfolio level.execution of the project’s clinical studies. This is done by establishing integrated planning to ensure consistent and predictable drug project plans and supplying valued clinical developmentoperations capabilities. In 2006,2007, development operations managed clinical trials with over 30,000 active patients, handling everything from patient recruitment to data management to project planning. Development Operations is also responsible for helping to identify patients outside of traditional markets. In 2006, it identified more than 20,000 new patients, 39% of whom were outside of Western Europe and North America.
The Office of the Chief Medical Officer is the third component of late-stage development and is charged with the safety of patients involved in clinical trials, as well as the proper filing of the findings with regulatory authorities. All clinical trials sponsored by GSK, irrespective of where they take place, are conducted according to international standards of good clinical practice and applicable laws and regulations. The protocols are reviewed by the external regulatory agencies in the relevant countries where required and all protocols are considered by an ethics review committee, whose responsibilities cover the sites where the studies will take place. Safety data are routinely collected throughout development programmes and are reported to national and regional regulatory agencies in line with applicable regulations. GSK considers itsGSK’s Chief Medical Officer, working with the Global Safety Board, to beis ultimately accountable for oversight of all major decisions regarding patient safety. The GSK Global Safety Board is responsible internally for approving pivotal studies and investigating any issues related to patient safety arising during the development programme. Information from GSK clinical trials is widely and easily available at the Clinical Trial Register on theGSK’s website.
In 2006, GSK formed a dedicated pharmacogenetics group. GSK believes that pharmacogenetic research, correlating genetic data with response to medicine, will help its scientists understand how different people respond to the effects of a medicine, both those therapeutically intended and those causing adverse events. R&D is collecting DNA samples, under appropriate patient consent, in clinical studies to identify pharmacogenetic information which may help predict a patient’s response. This information is intended to define patient groups likely to gain benefit from treatment or to suffer a side effect. Pharmacogenetics promises to provide physicians with information to help them select the medicine and dose most likely to benefit the patient and, in the long run, may help to reduce pipeline attrition and improve productivity.
In-licensing
GSK continues to identify compounds from other companies that would enhance the portfolio and to create innovative collaborations to ensure that the Group is regarded as the partner of choice for large and small companies. The subjects of acquisitions, in-licensing, co-marketing/co-promotion, or future options arrangements in 2006 were:
• | Genmab’sHuMax-CD20(ofatumumab), anti CD20 MabThe subjects of acquisitions, in-licensing, co-marketing/co-promotion, or future options arrangements in oncology (Phase III) and rheumatoid arthritis (Phase II)2007 included: | | | | | • | HGS’LymphoStat BXenoport (XP13512, phase III for lupus erythematosus (Phase III) | | RLS and phase II for neuropathic pain) | | • | Gilead/Myogen’s ambrisentan (commercialisation, excluding USA),selective endothelin receptor antagonist for pulmonary arterialhypertension (Phase III)Sepracor (Lunesta/Lunivia (excluding USA, Canada, Mexico and Japan), plus marketing and distribution agreementfor GSK'sFlolan(in the USA) by Myogen | | GABA-A agonist, insomnia, pending EU filing) | | • | Akros/Japan Tobacco’s JTP-74057, a MEK inhibitor (preclinical) | | Synta (STA-4783, HSP70 upregulation, melanoma, sarcoma, solid tumors, phase III) | | • | ChemoCentryx – options on preclinical assets and traficet (PhaseToleRx (anti-CD3 mAb for autoimmune diseases, phase II) | | | | • | EPIX – options on discovery targetsTargacept (TC-2696 in phase II for acute post-operative pain and 5HT4 agonist (Phase I)novel leads for Central nervous system diseases) | | • | Anacor (novel candidates for viral and bacterial diseases, preclinical) | | • | OncoMed (cancer stem cell therapeutics, preclinical) | | • | Galapagos – options on discovery programmes in osteoarthritis(preclinical) | | (novel anti-bacterials and antivirals, preclinical) | | • | Kissei’s SGLT1 inhibitors for type 2 diabetes (preclinical) | | | • | Pharmacopeia – options on discovery programmes (preclinical) | | | • | Sirna’s RNAI-based therapeutics for respiratory diseases (preclinical) | | | • | Acquisition of the Pliva Research InstituteSantaris (novel antiviral agents, preclinical) |
Extending the use of existing products
Once a product is launched, it is important to establish additional ways in which patients may be helped. This can be done through investigating whether other illnesses may be treated with the product or by the development of additional, more convenient dosage forms. Some developments reflect feedback from patients and medical professionals, while others are the result of continuing research into disease and its causes.
Back to Contents
| Business review | | Delivering the product pipeline for patients | continued |
| | |
In 2006, GSK received approval in the USA for a controlled-release version ofCoreg,Coreg CR, which allows once-daily dosing for hypertension and mild to severe heart failure. The product will be launched in the USA in Q1 2007. GSK also began a novel investigation to determine whether its diabetes treatment, rosiglitazone XR is effective in Alzheimer’s Disease. The scientific basis for this programme was developed thanks to the pharmacogenetics work undertaken with rosiglitazone over the past seven years.
Managing the portfolio
Key projects reaching significant milestones are reviewed each month by the Product Management Board (PMB), which is responsible for determining if a medicine has met criteria for passing into the next phase of development. Progress of the portfolio is communicated to investors and the media at regular intervals during the year. Details of GSK’s product development pipeline are given on pages 1318 to 16.21. Risk in R&D
Pharmaceutical R&D, by its very nature, is an inherently risky venture. From the time a potential medicine is discovered until it becomes an approved medicine can take 10-15 years. Further, only one in ten molecules that starts human clinical trials ever reaches regulatory approval. The nine out of ten that fail can be discontinued for a variety of reasons, from insufficient safety thresholds to lack of efficacy to manufacturing hurdles. These discontinuations occur despite extensive predictive testing. Late-stage projects terminated during 20062007 included brecanavirAriflo for HIVCOPD andRedona odiparcil for diabetes.stroke prevention.
| GSK Annual Report 2007 | 15 | | |
Back to Contents | | | REPORT OF THE DIRECTORS | | Delivering the product pipeline for patients | | | | | | Business review | | Delivering the product pipeline for patients | | continued | | |
Research and development – vaccines
The majority of GSK’s vaccine division activities are conducted at its biologicals headquarters in Rixensart and Wavre, Belgium. These include research, clinical development, regulatory strategy, commercial strategy, scaling up, vaccine production, packaging and all other support functions. The discovery and development of a new vaccine is a complex process requiring long-term investment. In R&D over 1,500 scientists are devoted to developing new vaccines and more cost-effective and convenient combination vaccines to prevent infections that cause serious medical problems worldwide. GSKGSK’s vaccine division is also targetingdeveloping therapeutic vaccines that may prevent relapseimmunotherapeutics aimed at educating the patient’s immune system to identify and attack cancer cells in cancer patients.a highly specific manner. Thanks to the use of innovative technologies and its global business model, GSK is a fast-growing vaccine maker, delivering value by contributing to the health and well-being of people in every generation around the world. Vaccine discovery involves many collaborations with academia and the biotech industry to identify new vaccine antigens which are then expressed in yeast, bacteria or mammalian cells and purified to a very high level. This is followed by formulation of the clinical lots of the vaccine. This may involve mixing antigens with selected GSK novel proprietary adjuvant systems, which are combinations of selected adjuvants designed to enhance the immune response. The first step is to evaluate the safety and efficacy of the candidate vaccine in a preclinical setting, usually involving an animal model. The candidate vaccine is then tested in clinical trials in healthy individuals to evaluate safety and effectiveness in inducing an immune response to protect the body from infection encountered later in a natural setting (Phase(phase I/II). Large-scale field trials in healthy individuals follow to establish safety and efficacy in a cross section of the population (Phase(phase III). The results obtained during clinical trials and data regarding the development of a quality and large-scale production process and facilities are then combined into a regulatory file which is submitted to the authorities in the countries where the vaccine will be made available. After launch, post marketing studies of considerable size are set up to assess vaccination programmes and to monitor vaccine safety (Phase(phase IV). Vaccine manufacturing is particularly complex as it requires the use of innovative technologies and living micro-organisms. Sophisticated quality assurance and quality control procedures are in place to ensure both quality and safety of the vaccines and this commonly includes animal use according to health authorities’ requirements. Due to their biological nature, individual health authorities may subject vaccines to a second control to guarantee the highest quality standards. GSK has been increasing its capacity to supply vaccines across the globe by developing a uniqueits global manufacturing network based on three major regional hubs in Europe, North America(see page 26, 'Global manufacturing and Asia. After the establishment of its North American hub in 2005 through three major acquisitions, GSK further strengthened in 2006 its vaccine capabilities in both Asia and Europe:supply'). – | investing more than £100 million to set up a vaccine manufacturing site dedicated to the primary production of paediatric vaccines in Singapore | | | – | opening in Gödöllö, Hungary, its €100 million primary production facility for the manufacturing of diphtheria, tetanus and pertussis antigens used in several paediatric combinations vaccines | | | – | investing more than €500 million in its vaccine manufacturing plant in St Amand-les-Eaux, France, to increase production capacity in formulation, filing, freeze-drying and packaging. |
Diseases of the developing world
Continued investment in research into diseases that disproportionately affect the developing world is essential if there is to be a long-term improvement in the health of people who live in these regions. As part of GSK’s response to this challenge, it operates a drug discovery unit, based at Tres Cantos (Spain), primarily dedicated to finding new medicines for malaria and tuberculosis. Additional research sites in the USA and the UK are focused on discovering new medicines to treat HIV/AIDS and drug resistant bacteria, while vaccine research is conducted in Rixensart (Belgium). Medicines and vaccines that enter clinical trials are taken through development and regulatory processes by dedicated groups based in the UK, USA and Belgium. Through these R&D efforts, GSK is addressing the prevention and treatment of all three of the World Health Organization’s (WHO) top priority infectious diseases. Recently, GSK has developed scored-tablets for its key anti-retroviral products to simplify the treatment of children living with HIV. GSK currently has 1412 clinical programmes of relevance to the developing world, 7seven of which are aimed at producing vaccines and medicines for diseases that disproportionately affect developing countries.
Back to Contents
| Business review | | Delivering the product pipeline for patients | continued |
| |
Public/Private Partnerships (PPPs) remain essential to fund research where there is no commercially viable market for a potential product. GSK is a leader in working in PPPs and continues to collaborate closely with many governments, academic centres, United Nations’ agencies and other global funding bodies in this area, to maximise expertise and knowledge. This has the dual benefit of encouraging research and development and accelerating access to the medicines in the developing world. Animals and research
For ethical, regulatory and scientific reasons, research using animals remains a small but vital part of research and development of new medicines and vaccines. GSK only uses animals where there is no alternative and only in the numbers required for each test. The Group strives to exceed regulatory standards in the care and use of the animals it uses and undergoes internal and external review to assure these standards. The vast majority of the experimental methods do not use animals. GSK is actively engaged in research to develop and validate more tests that either avoid the use of animals in research or reduce the numbers needed. When animals are used in research unnecessary pain or suffering is scrupulously avoided. GSK understands that use of animals for research purposes commands a high level of public interest. The GlaxoSmithKline Public Policy Position ‘The care and ethical use of animals in research’, and further information and reports, are available on theGSK’s website www.gsk.com or from Secretariat.
| 16 | GSK Annual Report 2007 | | |
Back to Contents | | | REPORT OF THE DIRECTORS | | | Delivering the product pipeline for patients | | | | | | | Business review | | Delivering the product pipeline for patients | | continued | |
Research and development – Consumer Healthcare
The focus of R&D is to identify and develop novel products that benefit consumers in the over-the-counter (OTC), oral carehealthcare and nutritional healthcare markets. To achieve a significant increase in innovation from internal and external sources, R&D has been remodelled to deliver a more valuable pipeline of products. With this change, specific tasks that can be performed at lower cost outside the companyGSK have been transferred to external development partners. This transfer, along with other headcount reductions and savings, releases substantial funds for investment in additional innovation projects. The remodelling builds on the recently adopted Consumer Healthcare operating model whereby, for the Global brands, R&D mirrors the commercial structure, with brand-dedicated R&D teams paired with commercial brand teams and both located together at the Innovation Centres at Weybridge, UK or Parsippany, USA. GSK’s pipeline
At the endbeginning of February 2007,2008, GSK had nearly 210 pharmaceutical and vaccine projects in development. Of these, 158157 are in the clinic comprising 9496 NCEs, 4137 PLEs and 2324 vaccines, compared with 118123 in 2001. In the last 12 months, 4 NCEs, 3GSK commenced 9 new vaccinesphase III clinical development programmes (including 2 vaccines) and 3 in-licenced assets entered late-stage development. GSK now has 31 major34 key assets in phase III/registration.
Compounds in phase III/registration 
GSK has maintained momentum in delivering its late-stage pipeline, receiving 10 product approvals and filing 10 product applications in 2007. Currently it has 13 new product opportunities in phase III development or registration, comprising 13 new chemical entities (NCEs), 6 new vaccines and 12 product line extensions (PLEs).filed with regulators. Major NCEs and vaccines inDevelopment programmes progressed into phase III development: | | ambrisentan – for hypertensionin 2007: | | • | Lymphostat-B* – for lupusbelimumab (LymphoStat B) | | • | casopitant* – for post-operative and chemotherapy-induced vomiting and nauseaelesclomol | | • | pazopanib* – for prevention of tumour growthGSK 1838262 (XP13512) | | • | mepolizumab – for hypereosinophilic syndromeMAGE-A3 therapeutic vaccine | | • | MenACWY vaccine | | • | ofatumumab (RA) | | • | Promacta* – for patients with low platelet count(Hep C) | • | New generation ‘flu vaccine* | | • | GloborixTykerb– a new combination paediatric vaccine against hepatitis B, diphtheria, meningitis A and C+Armala(IBC) | | • | New meningitisTykerb(Head & Neck) |
| Products filed: | | • | Avodart& alpha blocker co-prescription | | • | Cervarix(USA & Japan) | | • | EnteregPOI | | • | H5N1 vaccine against meningitis C and Y and Hib*(EU) | | • | Kinrix(USA) | | • | Lamictal XR(USA) | | • | Lunivia(EU) | | • | Promacta(USA) | | • | Requip XL(USA) | | • | Rotarix(USA) | | • | Synflorix– vaccine to prevent pneumococcal disease.(EU & International) | | (* entered late-stage in the last 12 months) | | | Major NCEs and vaccines filed: | | • | Allermist/AvamysTreximet– for hay fever; US approval expected in first halfof 2007 | | • | Altabax/AltargoVolibris– for skin infections; approval expected in 2007 | • | Entereg– for post-operative ileus, approval expected in 2007 | • | Tykerb– for breast cancer; US approval expected in first half of 2007 | • | Cervarix– vaccine to prevent cervical cancer; European and | | International launches expected in second half of 2007 | • | H5N1 pandemic vaccine. | | Late-stage assets in-licensed during the last 12 months: | • | Hu-Max-CD20– for the treatment of leukaemia and non-Hodgkin’s | | lymphoma | • | gepirone ER – for major depressive disorder | • | XP13512 – for restless legs syndrome and treatment of neuropathicpain.(EU) |
In 2007, GSK expects to launch 5 majora sustained flow of new pharmaceutical products.products in the next two years. For further details of these developments, and information on other important launches/filings expected in 2007, see GSK outlook on page 44.50.
This maturity in the late stage pipeline is expected to lead to an increase in registrations in the coming years. The content of the drug development portfolio will change over time as new compounds progress from discovery to development and from development to the market. Owing to the nature of the drug development process, many of these compounds, especially those in early stages of investigation, may be terminated as they progress through development. Phase I NCEs with multiple indications are counted only once. NCEs in later phases are counted by each indication. For competitive reasons, new projects in pre-clinical development have not been disclosed and some project types may not have been identified.
GSK’s policy is to seek to obtain patent protection on all protectable inventions discovered or developed through its R&D activities. Patent protection for new active ingredients is available in all significant markets and protection can also be obtained, for example, on new pharmaceutical formulations, manufacturing processes, medical uses and special devices for administering products, see page 23.28 ‘Intellectual property’.
|
| GSK Annual Report 20062007 | 17 | 12 | |
<Back to Contents | Business review | | | | Delivering the product pipeline for patients | continued |
| | | | | Business review |
KeyDelivering the product pipeline for patients | | continued | | | |
| Key | | | † | In-license or other alliance relationship with third party | | NDA | New drug application (USA) | | | | | | | S | Date of first submission | | Phase I | Evaluation of clinical pharmacology, usually conducted in volunteers | | | | | | | A | Date of first regulatory approval (for MAA, this is the first EU approval letter) | | Phase II | Determination of dose and initial evaluation of efficacy, conducted in a small number of patients | | | | | | | AL | Date Approvable letteror Complete Response Letter received – indicates that ultimately approval can be given subject to resolution of outstanding queries | | BLA | Phase III | Large comparative study (compound versus placebo and/or established treatment) in patients to establish clinical benefit and safety.Biological License Application | | | | |
| | | | MAA | Marketing authorisation application (Europe) | | NDA | New drug application (USA) | | Phase I | Evaluation of clinical pharmacology, usually conducted in volunteers | | Phase II | Determination of dose and initial evaluation of efficacy, conducted in a small number of patients | | Phase III | Large comparative study (compound versus placebo and/or establishedtreatment) in patients to establish clinical benefit and safety. | | | |
Estimated submission dates are only disclosed where they are within 12 months of the date of the chart. This date represents the most likely year of submission where it is considered that there is a reasonably high probability of successfully meeting the date assuming the clinical data meets the expected end-points of the clinical trials. | | | | | | | | Estimated | | | | | | | | | | | submission | dates | Compound/ProductCompound | | Type | | Indication | | Phase | | MAA | | NDA |
|
|
|
|
|
|
|
|
|
|
| | Cardiovascular & Metabolic | | | | | | | | | Cardiovascular projects | | | | | | | | | | | 256073 | | high affinity nicotinic acid receptor | | dyslipidaemia | | I | | | | | | | (HM74A) agonist | | | | | | | | | 568859† | | lipoprotein-associated phospholipase A2 (Lp-PLA2) inhibitor | | atherosclerosis | | I | | | | | 813893 | | factor Xa inhibitor | | prevention of stroke in atrial fibrillation | | I | | | | | 856553 | | p38 kinase inhibitor | | atherosclerosis (also rheumatoid arthritis & chronic obstructive pulmonary disease, COPD) | | I | | | | | | rilapladib† | | Lp-PLA2 inhibitor | | atherosclerosis | | I | | | | | 501516† | | peroxisome proliferator-activator receptor (PPAR) delta agonist | | dyslipidaemia | | II | | | | | | 681323 | | p38 kinase inhibitor | | atherosclerosis (also COPD, neuropathic pain & rheumatoid arthritis)chronic obstructive pulmonary | | II | | | | | | | | disease – COPD, neuropathic pain & rheumatoid arthritis) | | | | | | | 856553 | | p38 kinase inhibitor | | atherosclerosis (also COPD, depression & rheumatoid arthritis) | | II | | | | | darapladib† | | Lp-PLA2 inhibitor | | atherosclerosis | | ll/III | | | | | Coreg CR†+ ACE inhibitor | | beta blocker + angiotensin converting enzyme inhibitor | | hypertension – fixed dose combination | | III | | N/A | 2008 | ambrisentanVolibris† | | endothelin A antagonist | | pulmonary arterial hypertension | | IIISubmitted | | 2007 | S:Mar07 | N/A | Coreg CR†+ ACE inhibitor | | beta blocker + angiotensin converting | | hypertension – fixed dose combination | | III | | N/A | | | | | enzyme inhibitor | | | | | | | | | | Arixtra | | synthetic factor Xa inhibitor | | treatment of acute coronary syndrome | | ApprovableApproved | | S:Jul06 | A:Aug07 | AL:Feb07 | Coreg CR† | | beta blocker | | hypertension & congestive heart failure – once-daily | | Approved | | N/A | | A:Oct06& Sep07 | | Metabolic projects | | | | | | | | | | | 189075†remoglifozin etabonate | | sodium dependent glucose transport (SGLT2) inhibitor | | obesity | | I | | | | | (189075)† | | inhibitor | | | | | | | | | 376501 | | PPAR gamma partial agonist | | type 2 diabetes | | I | | | | | 625019756050 | | PPAR panbile acid receptor agonist | | type 2 diabetes & metabolic syndrome | | I | | | | | otelixizumab (TRX4)† | | anti-CD3 monoclonal antibody | | type 1 diabetes | | II | | | | 189075†remoglifozin etabonate | | SGLT2 inhibitor | | type 2 diabetes | | II | | | | | 677954(189075)† | | PPAR pan agonist | | type 2 diabetes, metabolic syndrome & dyslipidaemia | | II | | | | | 869682† | | SGLT2 inhibitor | | obesity | | II | | | | | albiglutide (716155)Syncria† | | glucagon-like peptide 1 agonist | | type 2 diabetes | | II | | | | | Avandia | | PPAR gamma agonist | | atherosclerosis in type 2 diabetes | | II | | | | | | Avandamet XR | | PPAR gamma agonist + metformin | | type 2 diabetes – extended release | | III | | N/A | | 2007 | | Avandia | | PPAR gamma agonist | | prevention ofatherosclerosis in type 2 diabetes | | III | | N/A | | 2007 | | Avandia | | PPAR gamma agonist | | prevention of disease progression | | III | | N/A | | 2007 | Avandia+ simvastatin | | PPAR gamma agonist + statin | | type 2 diabetes | | III | | N/A | | 2007 | Avandaryl/AvaglimAvandia† | | PPAR gamma agonist + sulphonylurea | | type 2 diabetes – fixed dose combinationprevention of disease progression | | ApprovedSubmitted | | A:Jun06 | | A:Dec05S:Feb07 |
|
|
|
|
|
|
|
|
|
|
| | Infectious Diseases | | | | | | | | | | | 565154580416 | | oral pleuromutilinribosome inhibitor | | treatment of bacterial infections | | I | | | | | 742510945237 | | oral pleuromutilintopoisomerase ll inhibitor | | treatment of bacterial infections | | I | | | | | 1349572† | | HIV integrase inhibitor | | HIV infections | | I | | | | | farglitazar | | PPAR gamma agonist | | hepatic fibrosis | | II | | | | | | sitamaquine | | 8-aminoquinoline | | treatment of visceral leishmaniasis | | II | | | | N/A | | tafenoquine† | | 8-aminoquinoline | | Plasmodium vivaxmalaria | | II | | | |
| | |
chlorproguanil, dapsone +18 | | antifolate + artemisinin | | treatment of uncomplicated malaria | | IIl | | 2008 | | N/A GSK Annual Report 2007 | artesunate (CDA)† | | | | | | | | |
Back to Contents | | | Altabax/Altargo | | topical pleuromutilin | | bacterial skin infections | | Approvable | | S:Jun06 | | AL:Dec06 | Antivirals | | | | | | | | | | | 625433 | | polymerase inhibitor | | hepatitis C | | I | | | | | 825780† | | DNA antiviral vaccine | | HIV infection | | I | | | | | 364735† | | integrase inhibitor | | HIV infection | | II | | | | | Relenza† | | neuraminidase inhibitor | | influenza prophylaxis | | Approved | | A:Aug06 | | A:Mar06 |
|
|
|
|
|
|
|
|
|
|
|
<Back to Contents
| Business review | | | | Delivering the product pipeline for patients | continued |
|
| | | | | | | | | | | | | | | | Business review | | Delivering the product pipeline for patients | | continued | | |
| | | | | | | | Estimated | | | | | | | | | | submission | dates | | Compound | | Type | | Indication | | Phase | MAA | NDA |
| | Musculoskeletal, Inflammation, Gastrointestinal & Urology | | | | | | 315234 | | monoclonal antibody | | rheumatoid arthritis | | I | | | | 768974† | | parathyroid hormone agonist | | osteoporosis | | I | | | | 962040 | | motilin receptor agonist | | delayed gastric emptying | | I | | | | 971086 | | androgen modulator | | sarcopaenia | | I | | | | 1827771 | | interleukin 1 antagonist | | rheumatoid arthritis | | I | | | | belimumab† | | anti-B lymphocyte stimulator monoclonal antibody (s.c.) | | systemic lupus erythematosus | | I | | | | pazopanib | | multi-kinase angiogenesis inhibitor | | age-related macular degeneration (also cancer indications) | | I | | | | 221149 | | oxytocin antagonist | | threatened pre-term labour | | II | | | | 232802 | | 3G-selective oestrogen receptor modulator | | treatment of menopausal symptoms | | II | | | | 274150 | | selective iNOS inhibitor | | rheumatoid arthritis | | II | | | | 681323 | | p38 kinase inhibitor (oral) | | rheumatoid arthritis (also atherosclerosis, COPD & neuropathic pain) | | II | | | | 856553 | | p38 kinase inhibitor (oral) | | rheumatoid arthritis (also atherosclerosis, COPD & depression) | | II | | | | 876008† | | corticotrophin releasing factor (CRF1) antagonist | | irritable bowel syndrome (also depression & anxiety) | | II | | | | ronacaleret† | | calcium antagonist | | osteoporosis & fracture healing | | II | | | | solabegron | | beta3 adrenergic agonist | | irritable bowel syndrome | | II | | | | solabegron | | beta3 adrenergic agonist | | overactive bladder | | II | | | | Avodart | | 5-alpha reductase inhibitor | | reduction in the risk of prostate cancer | | III | | | | Avodart+ alpha blocker | | 5-alpha reductase inhibitor + alpha blocker | | benign prostatic hyperplasia – fixed dose combination | | III | 2008 | 2009 | | belimumab† | | anti-B lymphocycte stimulator monoclonal antibody (i.v.) | | systemic lupus erythematosus | | III | | | | Bosatria(mepolizumab) | | anti-IL5 monoclonal antibody | | hypereosinophilic syndrome (also severe asthma & nasal polyposis) | | III | 2008 | 2008 | | Entrareg/Entereg† | | peripheral mu-opioid antagonist | | opioid-induced bowel dysfunction | | III | | | | ofatumumab† | | anti-CD20 human monoclonal antibody | | rheumatoid arthritis (also cancer indications) | | III | | | | Entrareg/Entereg† | | peripheral mu-opioid antagonist | | post operative ileus | | Approvable | | AL:Jul05 & | | | | | | | | | | AL:Nov06 |
| | Neurosciences | | | | | | | | | | 163090 | | 5HT1 antagonist | | depression & anxiety | | I | | | | 239512 | | histamine H3 antagonist | | dementia | | I | | | | 249320 | | monoclonal antibody | | neuronal injury | | I | | | | 424887 | | NK1 antagonist/SSRI | | depression & anxiety | | I | | | | 561679† | | CRF1 antagonist | | depression & anxiety | | I | | | | 586529† | | CRF1 antagonist | | depression & anxiety | | I | | | | 598809 | | dopamine D3 antagonist | | drug dependency | | I | | | | 618334 | | dopamine D3 antagonist | | drug dependency | | I | | | | 729327 | | AMPA receptor modulator | | schizophrenia | | I | | | | 933776 | | monoclonal antibody | | Alzheimer’s disease | | I | | | | 1014802 | | sodium channel inhibitor | | bipolar disorder | | I | | | | 1018921 | | type 1 glycine transport inhibitor | | schizophrenia | | I | | | | orvepitant | | NK1 antagonist | | depression & anxiety | | I | | | | 189254 | | histamine H3 antagonist | | narcolepsy | | II | | | | 372475† | | triple (5HT/noradrenaline/dopamine) re-uptake inhibitor | | depression | | II | | | | 468816 | | glycine antagonist | | smoking cessation | | II | | | | 649868† | | orexin antagonist | | sleep disorders | | II | | | | 681323 | | p38 kinase inhibitor | | neuropathic pain (also atherosclerosis, COPD & rheumatoid arthritis) | | II | | | | 742457 | | 5HT6 antagonist | | dementia | | II | | | | 773812 | | mixed 5HT/dopaminergic antagonist | | schizophrenia | | II | | | | 842166 | | non-cannabinoid CB2 agonist | | inflammatory pain | | II | | | | 856553 | | p38 kinase inhibitor | | depression (also atherosclerosis, COPD & rheumatoid arthritis) | | II | | | | 876008† | | CRF1 antagonist | | depression & anxiety (also irritable bowel syndrome) | | II | | | | 1838262 (XP13512)† | | voltage-gated calcium channel modulator | | migraine prophylaxis | | II | | | | 1838262 (XP13512)† | | voltage-gated calcium channel modulator | | neuropathic pain | | II | | | | casopitant | | NK1 antagonist | | depression & anxiety (also asZunrisa/Rezonicfor chemo- | | II | | | | | | | | therapy induced & postoperative nausea & vomiting) | | | | | | firategrast† | | dual alpha4 integrin antagonist (VLA4) | | multiple sclerosis | | II | | | | 1838262 (XP13512)† | | voltage-gated calcium channel modulator | | restless legs syndrome | | III | | 2008 | | Lamictal XR | | sodium channel inhibitor | | epilepsy – partial generalised tonic-clonic seizures, | | III | N/A | 2008 | | | | | | once-daily | | | | | | rosiglitazone XR | | PPAR gamma agonist | | Alzheimer’s disease | | III | | | | Lunivia† | | non-benzodiazepine GABA agonist | | insomnia | | Submitted | S:Jul07 | N/A | | Lamictal XR | | sodium channel inhibitor | | epilepsy – partial seizures, once-daily | | Approvable | N/A | AL:Sep07 | | Treximet† | | 5HT1 agonist + naproxen | | migraine – fixed dose combination | | Approvable | N/A | AL:Jun06 | | | | | | | | | | & Aug07 | | Requip Modutab/XL† | | non-ergot dopamine agonist | | Parkinson’s disease – once-daily controlled release | | Approved | A:Mar07 | AL:Dec07 | | | | | | formulation | | | | |
| | |
| GSK Annual Report 2007 | | | | | Estimated | | | 19 | | | | | | | | | | submission dates | | Compound/Product | | Type | | Indication | | Phase | | MAA | | NDA | |
| Musculoskeletal, Inflammation, Gastrointestinal & Urology | | | | | | | | 221149 | | oxytocin antagonist | | threatened pre-term labour | | I | | | | | | 232802 | | 3G-selective oestrogen receptor modulator | | treatment of menopausal symptoms | | I | | | | | | 267268 | | vitronectin integrin antagonist | | age-related macular degeneration | | I | | | | | | 315234 | | monoclonal antibody | | rheumatoid arthritis | | I | | | | | | 366074† | | potassium channel opener | | overactive bladder | | I | | | | | | 751689† | | calcium antagonist | | osteoporosis | | I | | | | | | 768974† | | parathyroid hormone agonist | | osteoporosis | | I | | | | | | relacatib† | | cathepsin K inhibitor | | osteoporosis & osteoarthritis (also bone metastases) | | I | | | | | | 274150 | | selective iNOS inhibitor | | rheumatoid arthritis (also migraine) | | II | | | | | | 681323 | | p38 kinase inhibitor (oral) | | rheumatoid arthritis (also atherosclerosis, COPD | | II | | | | | | | | | | & neuropathic pain) | | | | | | | | 856553 | | p38 kinase inhibitor (oral) | | rheumatoid arthritis (also atherosclerosis & COPD) | | II | | | | | | 876008† | | corticotrophin releasing factor (CRF1) antagonist | | irritable bowel syndrome (also depression & anxiety) | | II | | | | | | casopitant | | NK1 antagonist | | overactive bladder (also depression & anxiety, | | II | | | | | | | | | | chemotherapy induced & postoperative nausea & vomiting) | | | | | | | | dutasteride+ testosterone | | 5-alpha reductase inhibitor + testosterone | | hypogonadism – fixed dose combination | | II | | | | | | HuMax-CD20 | | human monoclonal antibody | | rheumatoid arthritis (chronic lymphocytic leukaemia | | II | | | | | | (ofatumumab)† | | | | & non-Hodgkin’s lymphoma) | | | | | | | | mepolizumab | | anti-IL5 monoclonal antibody | | eosinophilic esophagitis (also severe asthma & nasal polyposis) | | II | | | | | | rosiglitazone XR | | PPAR gamma agonist | | rheumatoid arthritis (also Alzheimer’s disease) | | II | | | | | | solabegron | | beta3 adrenergic agonist | | irritable bowel syndrome | | II | | | | | | solabegron | | beta3 adrenergic agonist | | overactive bladder | | II | | | | | | Avodart+ alpha blocker | | 5-alpha reductase inhibitor + alpha blocker | | benign prostatic hyperplasia – fixed dose combination | | III | | | | | | Avodart | | 5-alpha reductase inhibitor | | reduction in the risk of prostate cancer | | III | | | | | | belimumab† | | anti-B lymphocycte stimulator monoclonal antibody | | systemic lupus erythematosus | | III | | | | | | Entereg/Entrareg† | | peripheral mu-opioid antagonist | | opioid induced bowel dysfunction | | III | | | | | | mepolizumab | | anti-IL5 monoclonal antibody | | hypereosinophilic syndrome (also severe asthma & nasal polyposis) | | III | | | | | | Entereg/Entrareg† | | peripheral mu-opioid antagonist | | post operative ileus | | Approvable | | | | AL:Jul05 & | | | | | | | | | | | | AL:Nov06 | | Boniva/Bonviva† | | bisphosphonate | | treatment of postmenopausal osteoporosis – i.v. injection | | Approved | | A:Mar06 | | A:Jan06 | |
| Neurosciences | | | | | | | | | | | | 163090 | | 5HT1 antagonist | | depression & anxiety | | I | | | | | | 189254 | | histamine H3 antagonist | | dementia | | I | | | | | | 239512 | | histamine H3 antagonist | | dementia | | I | | | | | | 561679† | | CRF1 antagonist | | depression & anxiety | | I | | | | | | 588045 | | 5HT1 antagonist | | depression & anxiety | | I | | | | | | 598809 | | dopamine D3 antagonist | | drug dependency | | I | | | | | | 729327 | | AMPA receptor modulator | | schizophrenia | | I | | | | | | 823296 | | NK1 antagonist | | depression & anxiety | | I | | | | | | 274150 | | selective iNOS inhibitor | | migraine (also rheumatoid arthritis) | | II | | | | | | 372475† | | triple (5HT/noradrenaline/dopamine) re-uptake inhibitor | | depression | | II | | | | | | 468816 | | glycine antagonist | | smoking cessation | | II | | | | | | 649868† | | orexin antagonist | | sleep disorders | | II | | | | | | 681323 | | p38 kinase inhibitor | | neuropathic pain (also atherosclerosis, COPD & | | II | | | | | | | | | | rheumatoid arthritis) | | | | | | | | 683699† | | dual alpha4 integrin antagonist (VLA4) | | multiple sclerosis | | II | | | | | | 742457 | | 5HT6 antagonist | | dementia | | II | | | | | | 773812 | | mixed 5HT/dopaminergic antagonist | | schizophrenia | | II | | | | | | 842166 | | non-cannabinoid CB2 agonist | | inflammatory pain | | II | | | | | | 876008† | | CRF1 antagonist | | depression & anxiety (also irritable bowel syndrome) | | II | | | | | | casopitant | | NK1 antagonist | | depression & anxiety (also overactive bladder, | | II | | | | | | | | | | chemotherapy induced & postoperative nausea & vomiting) | | | | | | | | talnetant | | NK3 antagonist | | schizophrenia | | II | | | | | | gepirone ER† | | 5HT1a agonist | | major depressive disorder, once-daily | | III | | | | 2007 | | Lamictal XR | | sodium channel inhibitor | | epilepsy – partial generalised tonic-clonic seizures, once-daily | | III | | N/A | | 2007 | | rosiglitazone XR | | PPAR gamma agonist | | Alzheimer's disease (also rheumatoid arthritis) | | III | | | | | | Lamictal XR | | sodium channel inhibitor | | epilepsy – partial seizures, once-daily | | Submitted | | N/A | | S:Nov06 | | Requipextended release | | non-ergot dopamine agonist | | restless legs syndrome | | Submitted | | N/A | | S:Oct06 | | Requip Modutab/XL 24 hour† | | non-ergot dopamine agonist | | Parkinson’s disease – once-daily controlled release formulation | | Submitted | | S:Dec05 | | S:Feb07 | | Trexima† | | 5HT1 agonist + naproxen | | migraine – fixed dose combination | | Approvable | | N/A | | AL:Jun06 | | Wellbutrin XL† | | noradrenaline/dopamine re-uptake inhibitor | | seasonal affective disorder | | Approved | | N/A | | A:Jun06 | | Wellbutrin XL/XR† | | noradrenaline/dopamine re-uptake inhibitor | | depression | | Approved | | A:Dec06 | | A:Aug03 | |
<
Back to Contents | Delivering the product pipeline for patients | | | | | | Business review | | Delivering the product pipeline for patients | | continued | |
| | | | | | | Estimated | | | | | | | | | submission | dates | | Compound | | Type | | Indication | Phase | MAA | NDA |
| | Oncology | | | | | | | | | 461364 | | polo-like kinase inhibitor | | cancer | I | | | | 690693 | | AKT kinase inhibitor | | cancer | I | | | | 923295† | | centromere-associated protein E (CENP-E) | | cancer | I | | | | | | inhibitor | | | | | | | Armala(pazopanib) | | multi-kinase angiogenesis inhibitor | | colorectal cancer | I | | | iboctadekin†+ rituximab | | lL18 immunomodulator + anti-CD20 | | non-Hodgkin’s lymphoma | I | | | | | | monoclonal antibody | | | | | | | totrombopag† | | thrombopoietin agonist | | thrombocytopaenia | I | | | | 1363089 (XL-880)† | | C-met kinase inhibitor | | papillary renal cell carcinoma, gastric cancer and head & neck squamous cell carcinoma | II | | | | ofatumumab† | | anti-CD20 human monoclonal antibody | | relapsed diffuse large B cell lymphoma | II | | | | Armala(pazopanib) | | multi-kinase angiogenesis inhibitor | | non-small cell lung cancer | II | | | | Armala(pazopanib) | | multi-kinase angiogenesis inhibitor | | ovarian cancer | II | | | | Armala(pazopanib) | | multi-kinase angiogenesis inhibitor | | sarcoma | II | | | | Armala(pazopanib) + | | multi-kinase angiogenesis inhibitor + ErbB-2 | | metastatic breast cancer | II | | | | Tyverb/Tykerb | | and epidermal growth factor receptor | | | | | | | | | (EGFR) dual kinase inhibitor | | | | | | | Armala(pazopanib + | | multi-kinase angiogenesis inhibitor + ErbB-2 | | other cancers | II | | | | Tyverb/Tykerb | | and EGFR dual kinase inhibitor | | | | | | | Revolade/Promacta† | | thrombopoietin agonist | | chemotherapy-induced thrombocytopaenia | II | | | | Tyverb/Tykerb | | ErbB-2 and EGFR dual kinase inhibitor | | head & neck squamous cell carcinomas | II | | | | | | | | (unresectable disease) | | | | | Tyverb/Tykerb | | ErbB-2 and EGFR dual kinase inhibitor | | refractory inflammatory breast cancer | II | | | | Armala(pazopanib) | | multi-kinase angiogenesis inhibitor | | renal cell cancer | III | | | | Armala(pazopanib) + | | multi-kinase angiogenesis inhibitor + ErbB-2 | | inflammatory breast cancer | III | | | | Tyverb/Tykerb | | and EGFR dual kinase inhibitor | | | | | | | elesclomol (STA-4783)† | | oxidative stress inducer | | metastatic melanoma | III | | | | Hycamtin | | topoisomeraseI inhibitor | | ovarian cancer first-line therapy | III | | | | ofatumumab† | | anti-CD20 human monoclonal antibody | | refractory chronic lymphocytic leukaemia | III | 2008 | 2008 | | | | | | (also rheumatoid arthritis) | | | | | ofatumumab† | | anti-CD20 human monoclonal antibody | | refractory follicular lymphoma (also rheumatoid arthritis) | III | | | | Revolade/Promacta† | | thrombopoietin agonist | | hepatitis C | III | | | | Revolade/Promacta† | | thrombopoietin agonist | | long-term idiopathic thrombocytopaenic purpura | III | 2008 | 2008 | | Tyverb/Tykerb | | ErbB-2 and EGFR dual kinase inhibitor | | breast cancer, adjuvant therapy | III | | | | Tyverb/Tykerb | | ErbB-2 and EGFR dual kinase inhibitor | | breast cancer, brain metastases | III | | | | Tyverb/Tykerb | | ErbB-2 and EGFR dual kinase inhibitor | | breast cancer, first-line therapy | III | | | | Tyverb/Tykerb | | ErbB-2 and EGFR dual kinase inhibitor | | head & neck squamous cell carcinomas (resectable disease) | III | | | | Zunrisa/Rezonic | | NK1 antagonist | | chemotherapy induced & postoperative nausea & | III | 2008 | 2008 | | | | | | vomiting (also depression & anxiety) | | | | | Revolade/Promacta† | | thrombopoietin agonist | | short-term idiopathic thrombocytopaenic purpura | Submitted | 2008 | S:Dec07 | | Hycamtin | | topoisomerase I inhibitor (oral) | | small cell lung cancer, second-line therapy | Approved | S:May07 | A:Oct07 | | Tyverb/Tykerb | | ErbB-2 and EGFR dual kinase inhibitor | | refractory breast cancer | Approved | S:Oct06 | A:Mar07 |
| | Respiratory | | | | | | | | | 656933 | | interleukin 8 antagonist | | cystic fibrosis | I | | | | 835726 | | histamine H1/H3 dual antagonist (oral) | | allergic rhinitis | I | | | | 1004723 | | histamine H1/H3 dual antagonist (intranasal) | | allergic rhinitis | I | | | | 2190914 (AM-103)† | | 5 lipoxygenase activating protein (FLAP) inhibitor | | respiratory diseases | I | | | | 159797† | | long-acting beta2 agonist | | COPD, also COPD & asthma in combination with a glucocorticoid agonist | II | | | | 159802† | | long-acting beta2 agonist | | COPD, also COPD & asthma in combination with a glucocorticoid agonist | II | | | | 256066 | | PDE IV inhibitor (inhaled) | | COPD | II | | | | 256066 | | PDE IV inhibitor (inhaled) | | asthma | II | | | | 256066 | | PDE IV inhibitor (intranasal) | | allergic rhinitis | II | | | | 573719 | | muscarinic acetylcholine antagonist | | COPD | II | | | | 642444† | | long-acting beta2 agonist | | COPD, also COPD & asthma in combination with a glucocorticoid agonist | II | | | | 679586 | | monoclonal antibody | | severe asthma | II | | | | 681323 | | p38 kinase inhibitor (oral) | | COPD (also atherosclerosis, neuropathic pain & | II | | | | | | | | rheumatoid arthritis) | | | | | 685698 | | glucocorticoid agonist | | asthma, also COPD & asthma in combination with a long-acting beta2 agonist (also as Avamys/Veramyst for allergic rhinitis) | II | | | | 856553 | | p38 kinase inhibitor (oral) | | COPD (also atherosclerosis, depression & rheumatoid arthritis) | II | | | | 870086 | | novel glucocorticoid agonist | | asthma | II | | | | 961081† | | muscarinic antagonist, beta2 agonist | | COPD | II | | | | darotropium (233705) | | muscarinic acetylcholine antagonist | | COPD | II | | | | mepolizumab | | anti-IL5 monoclonal antibody | | severe asthma & nasal polyposis (also hypereosinophilic syndrome) | II | | | | Avamys/Veramyst | | glucocorticoid agonist | | allergic rhinitis | Approved | A:Jan08 | A:Apr07 |
| | |
| 20 | GSK Annual Report 2007 | | |
Back to Contents | | | REPORT OF THE DIRECTORS | | | Delivering the product pipeline for patients | continued |
|
| | | | | | | | | Estimated | | | | | | | | | | | | | submission dates | | | Compound/Product | | Type | | Indication | | Phase | | MAA | | NDA | |
| | Oncology | | | | | | | | | | | | | 559448† | | thrombopoietin agonist | | thrombocytopaenia | | I | | | | | | | 626616† | | human kinase inhibitor | | chemoprotection | | I | | | | | | | pazopanib | | vascular endothelial growth factor | | non-small cell lung cancer & colorectal cancer | | I | | | | | | | | | (VEGF) tyrosine kinase inhibitor | | (in combination with other treatment regimens) | | | | | | | | | relacatib† | | cathepsin K inhibitor | | bone metastases (also osteoporosis & osteoarthritis) | | I | | | | | | | pazopanib +Tykerb | | VEGF tyrosine kinase inhibitor + ErbB-2 and epidermal growth factor receptor (EGFR) dual kinase inhibitor | | breast cancer | | II | | | | | | | | | | | | | | | | | | | | | | | | | | | | | | | pazopanib +Tykerb | | VEGF tyrosine kinase inhibitor + ErbB-2 | | other cancers | | II | | | | | | | | | and EGFR dual kinase inhibitor | | | | | | | | | | | Promacta(eltrombopag)† | | thrombopoietin agonist | | chemotherapy induced thrombocytopaenia | | II | | | | | | | Promacta(eltrombopag)† | | thrombopoietin agonist | | hepatitis C | | II | | | | | | | casopitant | | NK1 antagonist | | chemotherapy induced & postoperative* nausea & | | III | | | | | | | | | | | vomiting (*USA only) | | | | | | | | | | | | | (also overactive bladder, depression & anxiety) | | | | | | | | | HuMax-CD20 | | human monoclonal antibody | | chronic lymphocytic leukaemia & non-Hodgkin’s | | III | | | | | | | (ofatumumab)† | | | | lymphoma (also rheumatoid arthritis) | | | | | | | | | Hycamtin | | topo-isomerase I inhibitor | | ovarian cancer first-line therapy | | III | | | | | | | Hycamtin | | topo-isomerase I inhibitor | | small cell lung cancer second-line therapy – | | III | | 2007 | | 2007 | | | | | | | oral formulation | | | | | | | | | pazopanib | | VEGF tyrosine kinase inhibitor | | renal cell cancer | | III | | | | | | | Promacta(eltrombopag)† | | thrombopoietin agonist | | long-term idiopathic thrombocytopaenic purpura | | III | | | | | | | Promacta(eltrombopag)† | | thrombopoietin agonist | | short-term idiopathic thrombocytopaenic purpura | | III | | | | 2007/08 | | | Tykerb | | ErbB-2 and EGFR dual kinase inhibitor | | breast cancer, adjuvant therapy | | III | | | | | | | Tykerb | | ErbB-2 and EGFR dual kinase inhibitor | | breast cancer, first-line therapy | | III | | | | | | | Tykerb | | ErbB-2 and EGFR dual kinase inhibitor | | head & neck squamous cell carcinomas | | III | | | | | | | Tykerb | | ErbB-2 and EGFR dual kinase inhibitor | | refractory breast cancer | | Submitted | | S:Oct06 | | S:Sep06 | | | Arranon/Atriance | | guanine arabinoside prodrug | | acute lymphoblastic leukaemia & lymphomas | | Approved | | S:May06 | | A:Oct05 | | | Hycamtin | | topo-isomerase I inhibitor | | cervical cancer, second-line therapy | | Approved | | A:Nov06 | | A:Jun06 | |
| | Respiratory | | | | | | | | | | | | | 256066 | | PDE IV inhibitor (inhaled) | | COPD | | I | | | | | | | 573719 | | muscarinic acetylcholine antagonist | | COPD | | I | | | | | | | 679586 | | monoclonal antibody | | severe asthma | | I | | | | | | | 961081† | | muscarinic antagonist, beta2 agonist | | COPD | | I | | | | | | | 159797† | | long-acting beta2 agonist | | COPD, also COPD & asthma in combination with a | | II | | | | | | | | | | | glucocorticoid agonist | | | | | | | | | 159802† | | long-acting beta2 agonist | | COPD, also COPD & asthma in combination with a | | II | | | | | | | | | | | glucocorticoid agonist | | | | | | | | | 233705 | | muscarinic acetylcholine antagonist | | COPD | | II | | | | | | | 256066 | | PDE IV inhibitor (inhaled) | | asthma | | II | | | | | | | 256066 | | PDE IV inhibitor (intranasal) | | allergic rhinitis | | II | | | | | | | 597901† | | long-acting beta2 agonist | | COPD, also COPD & asthma in combination with a | | II | | | | | | | | | | | glucocorticoid agonist | | | | | | | | | 642444† | | long-acting beta2 agonist | | COPD, also COPD & asthma in combination with a | | II | | | | | | | | | | | glucocorticoid agonist | | | | | | | | | 678007† | | long-acting beta2 agonist | | COPD, also COPD & asthma in combination with a | | II | | | | | | | | | | | glucocorticoid agonist | | | | | | | | | 681323 | | p38 kinase inhibitor (oral) | | COPD (also atherosclerosis, neuropathic pain & | | II | | | | | | | | | | | rheumatoid arthritis) | | | | | | | | | 685698 | | glucocorticoid agonist | | asthma & COPD in combination with a long-acting | | II | | | | | | | | | | | beta2 agonist (also asAvamys/Allermistfor allergic rhinitis) | | | | | | | | | 784568 | | glucocorticoid agonist (intranasal) | | allergic rhinitis | | II | | | | | | | 799943 | | glucocorticoid agonist | | asthma & COPD in combination with a long-acting | | II | | | | | | | | | | | beta2 agonist | | | | | | | | | 856553 | | p38 kinase inhibitor (oral) | | COPD (also atherosclerosis & rheumatoid arthritis) | | II | | | | | | | 870086 | | novel glucocorticoid agonist | | asthma | | II | | | | | | | mepolizumab | | anti-IL5 monoclonal antibody | | severe asthma & nasal polyposis (also hypereosinophilic | | II | | | | | | | | | | | syndrome & eosinophilic esophagitis) | | | | | | | | | Avamys/Allermist | | glucocorticoid agonist | | allergic rhinitis | | Submitted | | S:Jul06 | | S:Jun06 | | | Seretide/Advair | | beta2 agonist/inhaled corticosteroid | | COPD – mortality claim | | Submitted | | S:Sep06 | | S:Oct06 | | | Ariflo | | PDE IV inhibitor (oral) | | COPD | | Approvable | | | | AL:Oct03 | | | Seretide | | beta2 agonist/inhaled corticosteroid | | asthma – initial maintenance therapy | | Approved | | A:Jul06 | | N/A | | | Seretide/Advair | | beta2 agonist/inhaled corticosteroid | | asthma – non-CFC inhaler | | Approved | | A:Jun00 | | A:Jun06 | |
<Back to Contents
| Business review | | Delivering the product pipeline for patients | continued |
|
| | | | | | | | | | | | | | Business review | | Delivering the product pipeline for patients | | continued | | |
| | | | | | | Estimated | | | | | | | | | submission | dates | | Vaccine | | Type | | Indication | Phase | MAA | BLA |
| | Paediatric Vaccines | | | | | | | | | Hib-MenCY-TT | | conjugated | | Neisseria meningitisgroups C & Y disease & | III | | | | | | | | Haemophilus influenzaetype b disease prophylaxis | | | | | MenACWY-TT | | conjugated | | Neisseria meningitisgroups A, C, W & Y disease | III | | | | | | | | prophylaxis | | | | | Infanrix-IPV/Kinrix | | subunit – inactivated | | diptheria, tetanus, pertussis + poliomyelitis prophylaxis (booster-5th dose) | Submitted | | S:Apr07 | | Synflorix | | conjugated | | Streptococcus pneumoniaedisease and non-typeable | Submitted | S:Dec07 | | | | | | | Haemophilus influenzaeprophylaxis for children | | | | | Rotarix† | | live attenuated (oral) | | rotavirus-induced gastroenteritis prophylaxis | Approved | A:Feb06 | S:Jun07 | | Other Vaccines | | | | | | | | | Cytomegalovirus | | recombinant | | cytomegalovirus infection prophylaxis | I | | | | HIV | | recombinant | | HIV infection prophylaxis | I | | | | S. pneumoniaeadult | | recombinant – conjugated | | Streptococcus pneumoniaedisease prophylaxis | l | | | | Dengue fever | | attenuated tetravalent vaccine | | Dengue fever prophylaxis | ll | | | | Epstein-Barr virus† | | recombinant | | EBV infection prophylaxis | ll | | | | Hepatitis E virus† | | recombinant | | hepatitis E prophylaxis | ll | | | | Mosquirix | | recombinant | | malaria prophylaxis | ll | | | | Tuberculosis | | recombinant | | tuberculosis prophylaxis | II | | | | Varicella Zoster virus | | recombinant | | Varicella Zoster prevention | II | | | | Flu pandemic† | | H5N1 inactivated split – monovalent | | pandemic influenza prophylaxis | III | 2008 | | | | | (Quebec) | | | | | | | Flu pre-pandemic† | | H5N1 inactivated split – monovalent | | pandemic influenza prophylaxis | III | 2008 | 2008 | | | | (Quebec) | | | | | | New generation flu vaccine | | inactivated split – trivalent | | seasonal influenza prophylaxis for the elderly | III | | | | Simplirix | | recombinant | | genital herpes prophylaxis | lll | | | | Boostrix | | subunit | | adult booster for diphtheria, tetanus & pertussis | Submitted | | S:Feb08 | | Flu pandemic† | | H5N1 inactivated split – monovalent | | pandemic influenza prophylaxis | Submitted | S:Feb07 | | | | | (Dresden) | | | | | | | Flu pre-pandemic† | | H5N1 inactivated split – monovalent | | pandemic influenza prophylaxis | Submitted | S:Jan07 | | | | | (Dresden) | | | | | | | Cervarix† | | recombinant | | human papilloma virus infection prophylaxis | Approved | A:Sep07 | AL:Dec07 | | Antigen Specific Cancer Immunotherapeutic (ASCI) | | | | | | | MAGE-A3 ASCI | | recombinant | | treatment of melanoma | II | | | | MAGE-A3 ASCI | | recombinant | | treatment of non-small cell lung cancer | III | | |
| | |
| GSK Annual Report 2007 | | | | | Estimated | 21 | | | | | | | | | | submission dates | |
Back to Contents Compound/Product | | Type | | Indication | | Phase | | MAA | | NDA | |
| Paediatric Vaccines | | | | | | | | | | | | MenACWY-TT | | conjugated | | Neisseria meningitisgroups A, C, W & Y disease | | II | | | | | | | | | | | prophylaxis | | | | | | | | Globorix | | conjugated | | diptheria, tetanus, pertussis, hepatitis B,Haemophilus | | lll | | 2007 | | | | | | | | influenzaetype b disease,Neisseria meningitisgroups | | | | | | | | | | | | A & C disease prophylaxis | | | | | | | | Hib-MenCY-TT | | conjugated | | Neisseria meningitisgroups C & Y disease & | | III | | | | | | | | | | Haemophilus influenzaetype b disease prophylaxis | | | | | | | | Infanrix-IPV | | subunit – inactivated | | diptheria, tetanus, pertussis + poliomyelitis prophylaxis | | III | | | | 2007 | | | | | | (booster 5th dose) | | | | | | | | Synflorix | | conjugated | | Streptococcus pneumoniaedisease and non-typeable | | lll | | 2007 | | | | | | | | Haemophilus influenzaeprophylaxis for children | | | | | | | | Priorix-Tetra | | live attenuated | | measles, mumps, rubella & varicella prophylaxis | | Approved | | A:Jul06 | | | | Rotarix† | | live attenuated – oral | | rotavirus induced gastroenteritis prophylaxis | | Approved | | A:Feb06 | | 2007 | |
| Other Vaccines | | | | | | | | | | | | HIV | | recombinant | | HIV infection prophylaxis | | l | | | | | | S. pneumoniaeelderly | | recombinant – conjugated | | Streptococcus pneumoniaedisease prophylaxis | | l | | | | | | Dengue fever | | attenuated tetravalent vaccine | | Dengue fever prophylaxis | | ll | | | | | | Epstein-Barr virus† | | recombinant | | EBV infection prophylaxis | | ll | | | | | | Hepatitis E virus† | | recombinant | | hepatitis E prophylaxis | | ll | | | | | | Mosquirix | | recombinant | | malaria prophylaxis | | ll | | | | | | Tuberculosis | | recombinant | | tuberculosis prophylaxis | | II | | | | | | Varicella Zoster virus | | recombinant | | Varicella Zoster prevention | | II | | | | | | New generation ‘flu vaccine | | inactivated split-trivalent | | seasonal influenza prophylaxis for the elderly | | III | | | | | | Simplirix | | recombinant | | genital herpes prophylaxis | | lll | | | | | | Daronrix | | inactivated whole-aluminium salt – | | pandemic influenza prophylaxis | | Submitted | | S:Dec05 | | | | | | monovalent | | | | | | | | | | ‘Flu pre-pandemic | | H5N1 inactivated split- monovalent | | pandemic influenza prophylaxis | | Submitted | | S:Jan07 | | | | Cervarix† | | recombinant | | human papilloma virus infection prophylaxis | | Submitted | | S:Mar06 | | 2007 | | FluLaval | | inactivated split | | influenza prophylaxis | | Approved | | 2007 | | A:Oct06 | |
| Pharmaccines | | | | | | | | | | | | P501 | | recombinant | | treatment of prostate cancer | | l | | | | | | MAGE-A3 | | recombinant | | treatment of non-small cell lung cancer & melanoma | | ll | | | | | |
<Back to Contents
| Business review | | | | Being the best place for the best people to do their best work | | | |
| | | Business review | | Being the best place for the best people to do their best work | | | |
GlaxoSmithKline people
GlaxoSmithKline is committed to creating the best place for the best people to do their best work to deliver the Group’s business strategy. The Group employs over 100,000 people in more than 117 countries.
| | | GSK employs over 100,000 people in more than 100 countries and is committed to creating the best place for the best people to do their best work. | | |
Recruitment, talent management and leadership development
Attracting and recruiting the best people in the industry is critical to enhancing and sustaining GSK’s performance. The Group’s Talent Solutions recruiters in the USA and UKRecruiters across GSK are focused on pro-active identificationactively targeting the best talent and assessing their fit with the organisation for many key roles. GSK seeks to recruit people with the highest level of talented external candidatesintegrity. Interview questions with specific ethical and integrity components have been developed for key jobs.inclusion in the standard interview questionnaire during 2008. The annual performance and development planning (PDP) process ensures that employees set business alignedbusiness-aligned objectives and behavioural goals. PDPs are reviewed throughout the year, culminating with an end of year review that is factored into compensation decisions. The annual talent management cycle identifies the highest performing people in each business and function and key talent is developed through tailored management and leadership programmes, (for more detail see the Group’s Corporate Responsibility Report), exposure to top management through programmes such as the Chief Executive Forum and stretch assignments. A pool of potential successors is identified for each Vice-President position and other critical roles inthroughout the organisation.Group. Performance and reward
Reward systems are designed to support a culture of high performance and to attract and retain the best people. Performance based pay and bonuses, share awards and share options align employee interests with the meeting of business targets. Communication and employee involvement
The Group conducts a Global Leadership Survey (GLS) every two years. The most recent survey was conducted in 2006 among more than 10,000 managers to gauge opinions on critical issues such as culture and confidence in the Group’s future. Scores on morale and engagement have steadily increased since 2002 and compare very favourably with global benchmarks (42 top-ranked companies). In the 2006 survey, 90% of managers were “proud‘proud to be part of GlaxoSmithKline”GSK’ and 86% would “gladly‘gladly refer a friend or family member to work for GlaxoSmithKline”GSK’. Each business and function develops action plans to address areas for improvement based on results from the GLS and other surveys. The Group also consults employees on changes that affect them and discusses developments in the businessesbusiness with a European Employee Consultation Forum and similar bodies in countries where this is national practice. In 2006 in the UK, a new national consultation forum was created. The UK Information and Consultation Forum is made up of 15 elected employee representatives and seven management representatives. It meets regularly so that employee views can be taken into account before major changes affecting all employees are implemented. Employee numbers by region 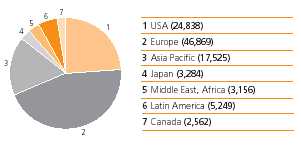 Business ethics and reputation
Performance with integrity is central to operating at GSK. The 2006 GLS showed 91% believe that “people in their department show commitment to performance with integrity”and 82% agree that they “can report unethical practices without fear of reprisal”. To engage a wider range of managers, the half-day workshop on Ethical Decision-making (attended by 479 leaders in 2005) has been extended to three e-learning modules, which are being implemented across the businesses. So far, over 400 people have completed at least one of the three modules.
Maintaining Standards
GSK expects employees to meet high ethical standards in all aspects of business by conducting activities with honesty and integrity, adhering to corporate responsibility principles and complying with applicable laws and regulations. GSK audits its operationsThe 2006 GLS showed 91% believed that ‘people in their department showed commitment to ensure relevant standards expected, such as those in marketingperformance with integrity’ and 82% agreed that they ‘can report unethical practices without fear of reprisal’. A half-day workshop on Ethical Decision-making has now been extended to three e-learning modules, which are reached or exceeded.being implemented across GSK.
Commitment to the GSK Code of Conduct is reinforced each year by a senior management certification programme, and in 2006each year over 12,000 managers certifiedcertify that they hadhave complied with “Performance‘Performance with Integrity”Integrity’ principles. The PDP process includes an assessment of how well employees have implemented the GSK Spirit, the principles usedaudits its operations regularly to define GSK’s culture. This may have a significant impact on bonus payments and may also affect future career development. In this way the Group holds employees accountable for delivering performance with highensure that relevant standards, of integrity to protect and enhance GSK’s reputation.such as those in marketing practices, are reached or exceeded.
Diversity
The diversity and inclusion initiatives focus on improving performance by responding to the diverse needs of employees, customers and external stakeholders.performance. In the fifth year of the annual Multicultural Marketing and Diversity Awards, 14 teams from aroundaward winning projects repeatedly demonstrated the world highlighted innovative activities that demonstrated business impact.value of understanding diverse perspectives and leveraging those differences to make a positive difference in the workplace, with customers and in the communities served. In 2006,2007, the global management population was 63.7%63% male and 36.3%37% female. For more details on diversity measures, see the Employment Practices section of theGroup’s Corporate Responsibility report. The Group is committed to employment policies free from discrimination against existing or potential staff on the grounds of age, race, ethnic and national origin, gender, sexual orientation, faith or disability. GSK is committed to offering people with disabilities access to the full range of recruitment and career opportunities. Every effort is made to retain and support employees who become disabled while working with the Group. HealthHealthy high performance
Healthy, energised and well-being
Healthyengaged employees together with healthy and healthysustainable ways of working contribute to the sustained performance of the Group. Global policies on employee health are supported by mandatory standards that integrate employee health and safety and environmental requirements. These standards are applied to all the Group’s facilities and operations worldwide.
A commitment to flexible working through flexi-time, tele-conferencing, remote working and flexible work schedules, recognises that employees work best in an environment that helps them integrate their work and personal lives. During 2006, theThe Group’s Employee Health Management function developed ais actively delivering and implementing team and personal resilience programmeprogrammes which are now available in 13 languages. In 2007, in partnership with the Group’s Leadership and Development function, Energy for Performance training has now been translated into 11 languages and adoptedintroduced in 12 countries.order to improve further the potential of employees.
| 22 |
| GSK Annual Report 20062007 | 17 | |
<Back to Contents | Business review | | | | Improving access to medicines | | |
| | | | | Business review | | Improving access to medicines | | | |
| | | GSK is committed to contributing to health improvements in a sustainable manner. In the developing world, this includes not-for-profit pricing, community investment programmes and other innovative solutions, while in the developed world the focus is on patient assistance programmes. | | |
Access to healthcare in the developing world Access to healthcare in developing countries remains a major challenge to the global community. The problem, which is rooted in poverty, demands a significant mobilisation of political will, additional resources and a true spirit of partnership. GSK continues to play a vital role, through its commitment to R&D into diseases particularly prevalent in the developing world, through its programme of preferential pricingnot-for-profit prices for its anti-retrovirals (ARVs), anti-malarials and vaccines, through its community investment programmes (see page 19)24) and through its willingness to seek innovative solutions, such as voluntary licencinglicensing arrangements. Preferential pricing programme
GSK has offered its vaccines to key organisations for vaccination programmes in developing countries at preferential prices for over 20 years. The Group also sets a single not-for-profit price for each of its ARVs and anti-malarials to a wide range of customers in the Least Developed Countries (UN definition) and sub-Saharan Africa, as well as Country Coordinating Mechanism-projects fully funded by the Global Fund to Fight AIDS, TB, and Malaria and the US President’s Emergency Plan for AIDS Relief (PEPFAR). In July 2006, GSK introduced two new ARVs,KivexaandTelzir, to its not-for-profit offering and reduced prices to GSK’s abacavir-containing products by up to 30%. GSK is committed to contributing to health improvements in a sustainable manner. The prices for its ARVs and anti-malarials are therefore set at levels at which no profit is made, but direct costs are covered, allowing supply to be sustained for as long as required. During 2006,2007, GSK shipped to developing countries over 2713 million tablets of not-for-profit-pricedCombivirand nearly 5972 million tablets of not-for-profit-pricedEpivir. Some of ourGSK’s licensees are now supplying key markets in a more significant way. The offer of not-for-profit prices requires a sustainable framework, combining GSK’s commitment to preferential pricing with commitments from governments of the developed world to avoid price referencing against preferentially priced medicines and from all governments to help prevent product diversion. GSK has taken steps to minimise the threat of diversion with the registration of specific access packs or access tablets (differentiated red tablet as opposed to the traditional white) for its key ARVs. GSK isremains the only companyGroup to have registered its ARVs under the European Union’s Anti-Diversion Regulation. Innovative solutions
GSK has shown industry leadership in granting voluntary licences to eight generic companies for the manufacture and supply of ARVs to both the public and private sectors in sub-Saharan Africa. GSK is also a leader in collaborating in Public-Private Partnerships to enable new drug discovery and development to take place more effectively. Looking ahead
GSK will continue to build on its product, pricing and partnership commitments to help improve healthcare in the developing world. However, a significant increase in funding from the global community is still needed. It is also important to maintain incentives for R&D through protection of intellectual property. While much has been achieved, sustainable progress will only occur if the significant barriers that stand in the way of better access to healthcare are tackled as a shared responsibility by all sectors of global society – governments, international agencies, charities, academic institutions, the pharmaceutical industry and others. Access to medicines in the developed world Programmes in the USA
GSK is working to provide meaningful access to medicines for people with limited financial resources and without prescription drug insurance. In 2006, 2007 marked the launch of GSK’s US patient assistance programmes provided $370 million worth of medicines, valued at wholesale acquisition cost, to 402,000 qualifying low income US residents. GSK has worked to expand itsnewest patient assistance programme, and created “GSK Access” to include thoseGSK Access, for eligible patients enrolled in Medicare Part D. BeginningD prescription drug plans. Enrolment in 2007, GSK Access will help eligible Part-D-enrolled patients who have spent at least $600 of their own money during the current year on outpatient medicinesthis new programme was encouraged through a multi-million dollar national advertising campaign in major magazines and may qualify to receive GSK medicines free.newspapers.
For uninsured Americans who do not qualify for Medicare or Medicaid, GSK and 11 other pharmaceutical companies created Together Rx Access, a programme for qualified individuals offering reductions in the pharmacy cost on more than 300 medicines. Over 820,000 Together Rx Access cardholders saved about $24 million in 2006.2007. GSK also participates in the Partnership for Prescription Assistance (PPA), the largesta national programme dedicated to helpingservice that helps match people in need with prescription medicine access prescription medicines.programmes. To date, PPA has helped more than 3 million USprovided patients in need find programmes providing significant help. GSKthe USA with information about assistance to obtain necessary medicines. Launched withTykerb to help with access to this medicine,TykerbCARES is a single point of contact for physicians and other US pharmaceutical companies launched the programme in 2005 working with healthcare, physicianpatients.TykerbCARES provides reimbursement support and patient advocacy organisations.adherence support through services like pre-therapy counselling from a trained oncology nurse. Patient Advocacy
The Patient Advocacy initiative has demonstrated significant progress since its inception in 2002. Initially launched as a US programme, it is now a critical initiative throughout GSK. Patient Advocacy teams in the USA and Europe share best practices and established processes to optimise interaction with patient groups. Typically these relationships provide mutual opportunities: to learn about patient needs and priorities and for patient groups to develop an understanding of drug development challenges. In 2006, Patient Advocacy Leaders Summits were held in the USA, Brazil and Japan,2007, GSK continued to work with over 1,000 attending GSK sponsored meetings. In the USA, GSK partnered with the Centers for Medicaid and Medicare Services to develop 12 regional meetingspatient groups to educate them on issues of mutual concern, to advocate for access to medicines and treatment and to improve its reputation with them, governments and the media through efforts to promote transparency. GSK is considered to be a trustworthy partner with patient groups, onand has developed guidelines and procedures for working with patient groups that are being imitated throughout the new Medicare Drug Benefit and increase programme participation.industry. Programmes in other countries
The Group has also introduced Orange Cards providing discounts on certain GSK prescription medicines for eligible patients in Bulgaria, Lithuania and Ukraine.a number of other countries. The nature of the discounts varies between countries and the way in which theits healthcare system operates. In September 2006, GSK announced an agreement with the Russian Government to supply anti-retroviral medicines, for the treatment of HIV/AIDS, at discounted prices. The agreement is the first direct, federal purchase of anti-retroviral medicines in Russia.
Preparing for a ‘flu pandemic
As part of its commitment to support governments and health authorities to prepare for the threat of an influenza pandemic, GSK announced in 2006 promising data on the immunogenicity of its new generation H5N1 pandemic influenza vaccine. This innovative pandemic vaccine candidate is also believed to have the potential to offer protection against drifted variants of the H5N1 virus allowing a proactive pre-pandemic vaccination approach to be considered.
|
| GSK Annual Report 20062007 | 23 | 18 | |
<Back to Contents | Business review | | | | Corporate responsibility and community investment |
| | | | | Business review | | Corporate responsibility and community investment | | | |
| In 2007, GSK made product, cash and other donations valued at £282 million to support over 100 community programmes around the world |
Commitment to corporate responsibility
GSK is committed to connecting business decisions to ethical, social and environmental concerns. Thus, corporate responsibility is an integral and embedded part of the way GSK does business. In 2003, GSK published a set of Corporate Responsibility principles to provide guidance on the standards to which the Group is committed. This sets out the approach to 10 areas: standards of ethical conduct, research and innovation, products and customers, access to medicines, employment practices, human rights, community investment, caring for the environment, leadership and advocacy, and engagement with stakeholders. The Group reports annually on progress in upholding these principles in its Corporate Responsibility Report, which is available on the website at www.gsk.com.GSK’s website. Partnership success
GSK works as a partner with under-served communities in the developed and developing world. It supports programmes that are innovative and sustainable and that bring real benefits to these communities. The Group engages with numerous external stakeholders, funds community-ledcommunity led initiatives around the world and donates medicines to support humanitarian efforts and community-basedcommunity based healthcare. Community investment
GSK’s global community investment activities in 20062007 were valued at £302£282 million, equivalent to 3.9%3.8% of Group total profit before tax. This comprised product donations of £238£224 million, cash giving of £46£41 million, other in-kind donations of £3 million andplus costs of £15£14 million to manage and deliver community programmes in 109over 100 countries. Product donations and cash giving in 20062007 were as follows: 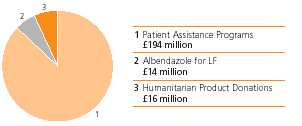
1. ProductAll product donations valued at wholesale acquisition cost (WAC).
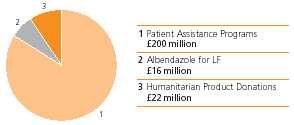 GSK’s cash giving was targeted primarily at health and education initiatives.initiatives as follows: 2. Breakdown of cash giving
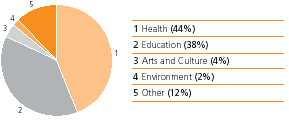
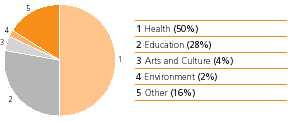
In the UK, GSK contributed £7£6 million in 20062007 to its continuing programme of charitable activities supporting over 10070 organisations in health, medical research, science education, the arts and the environment. Programmes in North America focused on improving public education and access to better healthcare for children and seniors both nationally and locally with funding of $34$35 million. On National Philanthropy Day in the USA, GSK received the Excellence in Corporate Philanthropy Award from the Committee Encouraging Corporate Philanthropy (CECP). GSK does not operate a single charitable foundation for its community investment programmes, but has a number of country based foundations. The grants made by these foundations in 20062007 are included in the investment total. Global Health Programmes
Eliminating lymphatic filariasis
The Group’s effort to eliminate the disabling disease, lymphatic filariasis (LF) from the world, continued in close partnership with the governments of countries where the disease is endemic, the WHO and over 40 partner organisations. GSK is committed to donate as much of the anti-parasitic drug albendazole as required to treat the one billion people at risk in over 80 countries. In 2006, 1552007, 150 million albendazole treatments, worth £16£14 million at wholesale acquisition cost, were donated to 3419 countries. Since the global elimination programme started in 2000, a cumulative total of almost 600750 million albendazole treatments have been donated. Positive Action on HIV/AIDS
Positive Action is GSK’s pioneering global programme working with communities affected by AIDS. Started in 1992, it supports community-based organisations to deliver effective HIV and AIDS education, prevention and healthcare services. During 2006,2007, Positive Action worked with 2616 partners to support programmes in 1719 countries. Positive Action was the principal sponsor of the community section (The Global Village) at the International AIDS Conference heldAction’s larger programmes operate in Toronto.Mexico, Kenya, India, China, Cambodia and Vietnam. The GlaxoSmithKline African Malaria Partnership
Since 2002, this partnership has supported three behavioural development programmes working in eight African countries. The programmes have targeted nearly two million people, focusing particularly on young children and pregnant women, encouraging effective prevention measures, prompt treatment and antenatal malaria management. In addition, GSK’s malaria advocacy programme ‘Mobilising for Malaria’ has launched country Coalitions Against Malaria in the UK, Belgium, France, Ethiopia and Cameroon to increase awareness of malaria and mobilise resources. During 2007 Innovation Grants for Malaria Advocacy were awarded to four organisations in Africa, working in Nigeria, Congo, Senegal and Uganda. The benefits of GSK’s three previous behavioural development programmes targeting malaria in eight African countries continue to be seen.
| 24 |
| GSK Annual Report 20062007 | 19 | |
<Back to Contents | Business review | | | | Corporate responsibility and community investment | continued |
| | | | | Business review | | Corporate responsibility and community investment | | | |
PHASE
The PHASE programme (Personal Hygiene And Sanitation Education), initiated by GSK in 1998, is now providing education to thousands of school children in Kenya, Uganda, Zambia, Nicaragua, Peru, Mexico, Tajikistan and Bangladesh to improve their health and hygiene to fight infectious diseases. In 20062007, the Group committed three year funding of $0.9over $1.8 million to extend the programme to MexicoIndonesia and TajikistanBolivia in partnership with Save the Children, USA. This also includes funding to introduce PHASE to the Millennium Village project which employs science-based interventions to meet the Millennium Development Goals. Humanitarian product donations
During 2006,2007, GSK donated essential products, such as antibiotics, through non-profit partners including AmeriCares, Direct Relief International, MAP International and Project HOPE, to support humanitarian relief efforts and community healthcare. The total value of the Group’s international humanitarian product donations was £22£16 million. This excludes albendazole donated as part of the Group’s commitment to the lymphatic filariasis elimination programme. Product donations are valued at wholesale acquisition cost, which is the wholesale list price, not including discounts, and is a standard industry method.method of valuation. Community initiatives
GSK is dedicated to strengthening the fabric of communities through providing health and education initiatives and support for local civic and cultural institutions that improve the quality of life. GSK’s contribution to improve healthcare includes a grant of almost $3 million over three years to the Children’s Health Fund to expand their Referral Management Initiative (RMI) to sites in Philadelphia, including the Delaware Valley Community Health Center. The RMI ensures continuity of specialist medical care for high-risk children who are often homeless. The2007 marked the tenth anniversary of the annual GlaxoSmithKline IMPACT Awards to recognise excellence in the work of non-profit community health organisations across the UK and in the Greater Philadelphia area of the USA. OverEach year over 20 charities receive unrestricted awards for their work dealing with diverse and difficult social issues such as domestic violence, sexual health services for young people, community health support and counselling services.
To further medical research, over £592,000£490,000 was provided to fourthree UK medical charities, Asthma UK, the British Retinitis Pigmentosa Society, DeafnessPrimary Immunodeficiency Association, Research UKinto Ageing and the Muscular Dystrophy Campaign.WellChild. Education initiatives
GSK’s effortsDuring 2007, GSK continued to improve public and science education included a $1 million endowment to the National Board for Professional Teaching Standards to increase the number of science teachers attaining certification initially in the North Carolina and Philadelphia areas, but extending to all 50 states. During 2006, GSK supportedsupport the Institute for a Competitive Workforce, a new business coalition staffed by the Business Civic Leadership Center of the US Chamber of Commerce. This is aimed at improving education and creating a skilled workforce.workforce for the future.
GSK also supports a range of local initiatives in the USA. For example ‘Science in the Summer’, a free library-based science education programme in the Philadelphia area teaching basic scientific concepts, continued to receive support with a grant of almost $400,000.nearly $427,000. GSK has also been a major sponsor of the University of North Carolina’s travelling science laboratory, Destiny, since its inception in 1999. Destiny serves approximately 100 under-served secondary schools and reaches 4,000 students per year. In 2006,2007, GSK helped to launch PUPPETS: Talkingthe CREST Star Investigators education initiative. This programme has been developed in partnership with the British Association for the Advancement of Science Engaging Science intoto provide science activities and awards for after school clubs in UK primary schools. 5,000 schools with grants of over £480,000 over four years. The puppets and their supporting materials increase children’s engagement and motivate them55,000 children are expected to talk about science. GSK’s support will enable 9,000 teachers to attend subsidised training over the next four years, and provide a set of puppets and training materials to each of the participating schools.be taking part by 2010. Only 25% of secondary school science teachers in England are chemistry specialists. Chemistry for Non-Specialists has been developed by the Royal Society of Chemistry to train teachers to teach chemistry with confidence, flair and enthusiasm. GSK is supporting the programme with a donation of £450,000 over three years starting in 2006.years. Employee involvement
GSK employees are encouraged to contribute to their local communities through employee volunteering schemes. Support varies around the world, but includes employee time, cash donations to charities where employees volunteer and a matching gifts programme.gift programmes. In 20062007 in the USA, the Group matched more than 17,50016,500 employee and retiree gifts at a value of over $5 million. The Group also matched more than $1.3$1.1 million of employee donations to GSK’s annual United Way campaign. GSK’s GIVE program provided grants of over $390,000 to almost $340,000 to more than 365380 organisations where US employees have volunteered. GSK’s Making a Difference programme in the UK provided grants of £225,000almost £260,000 to overnearly 380 non-profit organisations and registered charities based on employee involvement.
|
| GSK Annual Report 20062007 | 25 | 20 | |
<Back to Contents | Global manufacturing and supply | | | | | | Business review | | | Global manufacturing and supply |
| | |
| | | GSK’s manufacturing operations comprise a network of 79 sites in 37 countries and employ over 33,000 people. | | |
GSK manufactures a large portfolio of products, ranging from tablets and toothpaste to inhalers and complex capsules, in over 28,000 different pack sizes and presentations. Manufacture of medicines starts with the development of a therapeutic active ingredient (bulk active) in a selected formulation. Global Manufacturing and Supply (GMS) develops manufacturing processes for full scale volume production of active compounds at primary manufacturing sites. Secondary sites then convert these active compounds into finished medicines. Each year GMS produces around 6,000 tonnes of bulk actives and more than four billion packs, which are sold in over 140 countries. It also supports about 2,000 new product and line extension launches every year. By adopting leading edge practices and developing its people, GMS provides: | • | a secure source of supply of high quality products | | • | compliance with regulatory requirements and customer expectations | | • | best in class cost. |
Organisation GMS operates as a single global network of 8079 sites in 37 countries. The sites are grouped into four supply divisions, based on common business drivers, areas of expertise and the commercial activities that they support. Primary supply
Primary supply has 12 sites in six countries, supplying high quality, competitively priced bulk actives. The division is focused on improvements in primary technologies and processes. New product and global supply
There are 10 new product and global supply sites in seven countries. Sites work closely with R&D’s development team to ensure that the right technical competencies are in place to support rapid and successful new product introduction. These sites also ensure secure supply of key brands that are sold across many markets. This division is the focal point for developing and introducing new secondary manufacturing technologies for GMS. Regional pharma supply
Regional pharma supply operates to supply key products in particular regions or markets and tailor packaging to meet specific local requirements. This division focuses on reducing costs, allowing GSK to compete more effectively in all its markets. There are 29 regional pharma supply sites in 22 countries. Consumer Healthcare supply
Consumer Healthcare supply delivers high-quality, competitively priced products and supports rapid new product introduction in a highly innovative and competitive business with far shorter time frames than pharmaceuticals. New technologies have become a fundamental platform for driving innovation, lowering costs and providing flexibility in operations. There are 2928 sites in 21 countries in Consumer Healthcare supply.countries. Operational excellence
Within GMS, Operational Excellenceoperational excellence provides the capability to drive improvements in process robustness, quality, performance and customer service. Operational Excellenceexcellence is underpinned by extensive education and a culture of continuous improvement. Vision Factory
GSK introduced the Vision Factory initiative to work towards a simpler, more efficient operating model within GMS. Vision Factory is enabling manufacturing operations to accelerate the improvement in performance and cost control. Quality
The quality organisation oversees product quality across the supply chain, from suppliers and third party manufacturers through manufacturing to the supply operations that deliver products into the market. The quality organisation focuses on improving quality and compliance by increasing product quality understanding, and harmonising the quality approach across all sites. GSK continues to work with the FDA on Good Manufacturing Practice for the 21st Century and other initiatives. External suppliers
GMS spends over £2 billion annually with many external suppliers, purchasing active ingredients, chemical intermediates, packaging components, and part-finished and finished products. It takes appropriate steps to protect ourits supply chains from any disruption. Procurement
Widely recognised by industry analysts as a best practice leader, procurement works collaboratively to develop and implement sourcing strategies which ensures that GSK receives best value when buying goods and services. GSK leverages its procurement activities across the Group structure.Group. Vaccines supply chain
GSK biologicals’GSK’s global vaccine manufacturing network is based onmanaged from the vaccine division’s headquarters in Belgium. By being present in all the three major regional hubs in Europe, North America and Asia. In Europe, vaccine manufacturing is located primarily at Rixensart and Wavre in Belgium, with three other sites in France, Germany and Hungary. In North America,regions, GSK established its vaccine production network in 2005 through three major acquisitions: US based Corixa Corporation, with a production site in Hamilton, Montana, which manufactures MPL, a key componentaims to ensure effective supply of GSK’s adjuvant systems, a vaccine production site in Marietta, Pennsylvania and ID Biomedical with ‘flu vaccine manufacturing facilities in Laval and Quebec, Canada. In Asia, new vaccine production facilities are being built in India and Singapore. vaccines across the globe: | • | in Europe, vaccine manufacturing is located primarily at Rixensart and Wavre in Belgium, with three other sites in France, Germany and Hungary where the site is being extended. | | | | • | in North America, GSK established its vaccine production network in 2005 through three major acquisitions. It has a production site in Hamilton, Montana manufacturing MPL, a key component of GSK’s novel and proprietary adjuvant systems, a vaccine production site in Marietta, Pennsylvania and flu vaccine manufacturing facilities in Laval and Ste Foy, both in Quebec, Canada. | | | | • | in the International region, new vaccine production facilities are being built in India, Singapore and China where some packaging activities are already performed in Shanghai. |
Managing the vaccine supply chain involves anticipating market needs and using a flexible approach to be able to meet fluctuations in demand. These are based on forecasts from the different markets and firm orders from health authorities for mass vaccination campaigns. Bulk,Production of bulk vaccines, filling and packaging activities are carefully balanced and stockingplanned. Storing of vaccines helps manage short-term increases in demand. Such increases can result from disease outbreaks or increased demand from the public owing toprompted by disease awareness campaigns.
| 26 |
| GSK Annual Report 20062007 | 21 | |
<Back to Contents | Regulatory environment | | | | | | | Business review | | | Regulatory environment | | |
|
| | | | GSK operates in a highly regulated environment, encompassing product approval, pricing restrictions, maintenance of intellectual property and environmental, health and safety responsibilities. | | |
Regulation – Pharmaceuticals GSK operates within a highly regulated environment. Regional and country-specific laws and regulations define the data required to show safety and efficacy of pharmaceutical products, as well as govern testing, approval, manufacturing, labelling and marketing of drugs. These regulatory requirements are a major factor in determining whether a marketable product may be successfully developed and the amount of time and expense associated with thisthe development. In Europe, pharmaceutical firms and regulators are managing a transition following the implementation of new medicines legislation at the end of 2005. Significant changes are being implemented including approval procedures, post marketing requirements, manufacturing controls, labelling requirements, pharmacovigilance processes and an increased emphasis on transparency of regulatory processes.
The climate of change is set to continue, with the finalisation of a new Paediatric Regulation at the end of 2006. This Regulation is aimed at stimulating industry research into paediatric indications, via intellectual property incentives. Implementation activities will continue during 2007/08, and the new provisions will become operational in 2008.
The EU Commission is championing a ‘Better Regulation’ initiative to cut red tape and over-regulation of Industry. GSK is actively supporting this initiative and a similar one in the UK. For example in the UK, GSK has made 50 wide ranging better regulation proposals to the government, covering significant areas of interest to the Group. Many have been positively received and some are being considered for incorporation into new regulations.
In the USA, the safety of prescription drugs remains a primary focus of the FDA and congressional oversight committees are evaluating the ability and resourcing of the FDA to continue to provide this important role. New safety-related legislation has been proposed by Congress which may be enacted in 2007, with likely impact on the pharmaceutical industry. As in Europe, evaluation of benefit and risk continues to be an important consideration for approval of a newseek to encourage innovation in drug by the FDA. The FDA is in the second year ofdevelopment via its Critical Path Initiative to facilitate innovation in drug development. Newand new tools and processes such as pharmacogenomics, surrogate markers of efficacy and manufacturing innovations are being pursued to enhance development of safe and effective drugs. TheGSK and others in the pharmaceutical industry including GSK, isare collaborating with the FDA and National Institutes of Health in a number of these areas, including evaluation of new biomarkers.biomarkers and benefit/risk assessments.
Drug safety remains a primary focus of the FDA and congressional oversight committees and, as in Europe, evaluation of benefit and risk continues to be a paramount consideration for approval of a new drug. New legislation passed in 2007, the FDA Amendments Act, renews the User Fee system for drug reviews and mandates a rigorous FDA review of safety from approval through the post-marketing phase of the product. The US government is making information aboutlegislation also provides the benefitsFDA with new tools to require sponsors to complete post-marketing studies and risksto make labelling changes. Regulations requiring development of prescription drugs more readily available viaand biologics for paediatric populations were reauthorised by the Internet,US Congress in 2007. Similarly in Europe new paediatrics regulation has now been implemented. GSK fully supports the objective of ensuring the development of better medicines for children. In Europe, pharmaceutical companies and government regulators continue to implement the new medicines legislation introduced at the end of 2005. This involves significant changes to the EU regulatory system, including changes to product approval procedures, post-marketing requirements, manufacturing controls, labelling requirements, pharmacovigilance processes and increased transparency of regulatory processes. EU regulators are also engaged in ‘Better Regulation’ initiatives to cut red tape and over-regulation of the full prescribing information whichpharmaceutical industry. GSK welcomes the recognition that unnecessarily burdensome regulatory requirements can damage competitiveness and may negatively impact public health, and is posted within one day of approval.therefore active in supporting these initiatives. The regulatory environment in the International region continues to evolve. GSK is now providing product labellingparticipating in a number of regional regulatory initiatives, for example in China where proposed changes to the FDAregulatory framework have provided GSK with an opportunity to work directly with the State Food Drug Administration (SFDA). GSK continues to include broader sets of patient populations from the International region in an electronic format which allows easierglobal development programmes in order to increase global patient access to the key details in the prescribing information. GSK is well placed to manage effectively these changes in the externalnew innovative medicines and optimise regulatory environment.approvals.
Price controls
In many countries the prices of pharmaceutical products are controlled by law. Governments may also influence prices through their control of national healthcare organisations, which may bear a large part of the cost of supplying productsmedicines to consumers. Recent government healthcare reforms in countries such as France, Spain and Germany may restrict pricing and reimbursement. In the USA, recent legislationlegislative proposals on healthcare reform, cross-border trade, the acceleration of generics to market, and increased patient contributionscomparative effectiveness have further increased the focus on pricing. Currently, there are no government price controls over private sector purchases, but federal law requires pharmaceutical manufacturers to pay prescribed rebates on certain drugs in order to be eligible for reimbursement under Medicaid and other state and federal healthcare programmes. For the 2008 Presidential elections healthcare is one of the leading domestic issues. Though prices are part of the discussions, increasingly the leading candidates are proposing health reforms to address chronic disease as the primary healthcare cost driver. Medicare
InFrom 2006, the US Medicare program, a federally funded healthcare insurance programprogramme benefiting senior citizens and certain disabled Americans, included coverage for prescription medicines. This is a new benefit under the Medicare program and the most dramatic change in the program since its inception in the 1960s. The coverage is voluntary, includes brand-name and generic drugs and is open to the 41 million Americans with Medicare coverage. A number of competing private organisations provide the new benefit with premiums subsidised by the government. Benefits must satisfy a minimum standard outlined in federal law. While the law provides incentives for manufacturers to negotiate prices with private health insurance plans, it does not provide for government price controls. The government provides additional help to more than 14 million people on Medicare with limited incomes and resources. Those qualifying beneficiaries pay no or reduced premiums and deductibles, and low copaymentsco-payments for their prescriptions. The benefit has proved to be a marked success. Competition has reduced the estimate of total costs made by the Congressional Budget Office by $387 billion over a ten year period. Recent polls of Medicare beneficiaries enrolled in the new benefit show satisfaction rates of 85-89%. Value for money
Payers around the world are concerned about the cost of healthcare and the pricing of medicines. The requirement to satisfy healthcare purchasers on value for money is becoming an additional hurdle for product acceptance over and above the regulatory tests of safety, efficacy and quality. | GSK Annual Report 2007 | 27 | | |
Back to Contents | | | REPORT OF THE DIRECTORS | | Regulatory environment | | | | | | Business review | | Regulatory environment | | continued | |
While it is appropriate for payers to seek value for money when purchasing medicines, this often translates into cost-containment measures that delay patient access to new medicines and make it difficult even for significantly improved therapies to achieve a price that reflects added value. Healthcare budgets could be managed in a more strategic and long-term manner. Focus should shift to value not cost, and pricing should reflect value. Value should be defined broadly. What matters is whether a medicine works and responds to medical and patient needs. If so, it should be rewarded appropriately.
<Back to Contents
| Business review | | Regulatory environment | continued |
| |
Payers must also allocate their resources efficiently to provide the best health outcomes. Attention should be focussedfocused in three areas: prevention, innovation and better management of chronic diseases. As part of this triple solution, innovative medicines and vaccines will play a key role by preventing, or providing better treatments for expensive diseases such as cervical cancer, breast cancer, asthma, Alzheimer’s and diabetes. It is not possible to predict whether and to what extent, the Group’s business will be affected by future legislative and regulatory developments relating to specific pharmaceutical products or their price. Regulation – Consumer Healthcare The consumer healthcare industry is subject to national regulation for the testing, approval, manufacturing, labelling and marketing of products. In many countries, high standards of technical appraisal involve a lengthy approval process before a new product is launched. National regulatory authorisation is also required to approve the switch of products from prescription to OTC. The requirements include long-term experience of the quality, safety and efficacy of the product in a wide patient population and data to confirm that the relevant condition is both self-limiting and easily diagnosed by the consumer. Intellectual property Intellectual property is a key business asset for GSK. The effective legal protection of intellectual property is critical in ensuring a reasonable return on investment in R&D. Intellectual property can be protected by patents, trademarks, registered designs, copyrights and domain name registrations. Certain markets, including the USA, the EU and Canada also provide a period of regulatory data exclusivity to qualifying drugs which are new chemical entities or which are new formulations or uses of marketed drugs. Manufacturers of generic drugs may, following any period of data exclusivity, launch, or attempt to launch, generic versions of patented drugs prior to normal patent expiry, arguing that the relevant patents are invalid and/or are not infringed by their product. Significant litigation concerning these challenges is summarised in Note 4344 to the financial statements, ‘Legal proceedings’. Patents
GSK’s policy is to seek to obtain patent protection on all protectable inventions discovered or developed through its R&D activities. Patent protection for new active ingredients is available in most significant markets, and protection can also be obtained for example for new pharmaceutical formulations, manufacturing processes, medical uses and special devices for administering products. Patents protecting new active ingredients are generally applied for early in the development process. Since the term of a patent in most countries is a set period from the filing date, typically 20 years, the effective term depends on how long a product is in development before launch. This leads to a variation in patent term on a product by product basis, although in a number of markets, including the USA and Europe, it is possible in certain circumstances to obtain a partial restoration of patent term to compensate for the length of the development process. The patent position with respect to the active ingredients in significant products is as follows: Advair/Seretide. The patent on the specific combination of salmeterol xinafoate and fluticasone propionate is not due to expire until 2010 (USA) and 2013b (Europe). The US Patent has been re-issued by the US Patent and Trademark Office (USPTO)e. Litigation under patents protecting the product is ongoing in certain European marketse. The UK patent has been revoked by the UK courts. Patents on the individual ingredients have expired except the patents on salmeterol xinafoate in the USA (August 2008), France (December 2008), and Italy (2009). Avandia,AvandametandAvandamet Avandaryl. The patent on rosiglitazone is not due to expire until 2012a,c(USA) and 2013b(Europe). Patents on the commercial form of the active ingredient rosiglitazone maleate are not due to expire until 2015 (USA) and 2014b(Europe). Litigation challenging the validity of the patents protecting these products is ongoing in the USAehas been settled on terms allowing for generic entry late in the first quarter 2012e. Avodart. The patent on dutasteride is not due to expire until 2015a(USA) and 2017b(Europe). Litigation challenging the validity of the patent protecting this product in the USA is ongoinge. BonivaAvamys/Veramyst. The patent on fluticasone furoate is not due to expire until 2021 in the USA and 2022 in Europe.
Boniva. GSK has co-promotion rights under the patent on ibandronate which is not due to expire until 2012a (USA) and 2011b((Europe). Litigation challenging the validity of the patent protecting this product is ongoing in the USA and Europe)e. Combivir. The patent on the specific combination of lamivudine and zidovudine is not due to expire until 2012 (USA) and 2013b(Europe). Litigation challenging the validity of the patent protecting the combination is ongoing in the USAe. Coreg. GSK is the exclusive licensee under the US patent on carvedilol, which expired in 2007a,c.Coreg CRis protected by a formulation patent that is not due to expire in 2007the USA until 2016, and a patent on the active form carvedilol phosphate that is not due to expire until 2023. Litigation challenging the validity of the patent on the active form is ongoing in the USAa,ce. Epivir. The patent on lamivudine is not due to expire until 2010a,c(USA) and 2011b(Europe). Imigran/Imitrex. The patent on sumatriptan is not due to expire until 2009c(USA) and has expired in Europe (except Cyprus (2007), Italy and Switzerland (2008)(December 2008)). Litigation challenging the validity of the patent protecting this product in the USA has been settlede. allowing generic entry in the fourth quarter 2008. Lamictal. The patent on lamotrigine is not due to expire until 2009a,c(USA). Litigation challenging the validity of this patent in the USA has been settled.settled on terms allowing for generic entry of tablet forms in mid-2008. In Europe, the corresponding patent has expired and generic competition exists.
| 28 | GSK Annual Report 2007 | | |
Back to Contents | | | REPORT OF THE DIRECTORS | | | Regulatory environment | | | | | | | Business review | | Regulatory environment | | continued | | |
Levitrad. GSK has co-promotion rights under the US patent on vardenafil, which is not due to expire until 2018. Lexiva/Telzir. GSK is the exclusive licensee under the patent on fosamprenavir, which is not due to expire until 2017 (USA) and 2019b(Europe). Lovaza. The formulation of omega-3 acid ethyl esters is protected by a patent that expires in the USA in 2018. Paxil/Seroxat. The patent on the commercial form of paroxetine has expired and generic competition exists onPaxil instant release (IR) forms in the USA, Europe and other markets. Litigation relating to patents protecting the product is ongoing in the USAe.Paxil CR is protected by a patent issued in June 2007 relating to a delayed and controlled release formulation of paroxetine hydrochloride. Litigation relating to this patent has been settled on terms allowing for generic entry on all strengths ofPaxil CR no later than fourth quarter 2008e. Requip. The patent on ropinirole expired in 20062007a in Europethe USA and is due to expire in 2007cin the USA. Litigation relating to the validity and infringement of a patent directed to a method of manufacture of paroxetine hydrochloride anhydrate is ongoing in the USAe. Generic competition onPaxilinstant release (IR) and oral suspension has commenced in the USA, Europe and certain other markets.Paxil CRis protected by a formulation patent that is not due to expire until 2012. A generic manufacturer has applied for FDA approval of a generic form ofPaxilCR asserting non-infringement of this patente. Requip. The patent on ropinirole is not due to expire until 2007a(USA) andNovember 2008b(Europe). in Europe. A patent relating to the use of ropinirole in Parkinson’s disease is not due to expire until May 2008 (USA) and 2011b(Europe). Litigation challenging the validity of the Parkinson’s use patent is ongoing in the USA has been dismissed by the court, and generic entry is not expected until after expiry of the patent in May 2008e.
Seretide/Advair.The patent on the specific combination of salmeterol xinafoate and fluticasone propionate is not due to expire until 2010 (USA) and 2013b(Europe). An application for re-issue of the US patent has been allowed by the US Patent and Trademark Office (USPTO)e. The UK patent has been revoked by the UK courts. Patents on the individual ingredients have expired in the UK. In the USA, the patent on salmeterol xinafoate does not expire until 2008.
< Back to Contents
| Business review | | Regulatory environment | continued |
| |
Serevent.The patent on salmeterol xinafoate is not due to expire untilexpires in August 2008 in the USA. In Europe, the patent has expired, except in France (2008(December 2008b) and Italy (2009b). Trizivir.The patent on the method of treatment using a combination of lamivudine, zidovudine and abacavir does not expire until 2016 (USA) and 2016 (Europe). Tykerb/Tyverb. The Patent on lapatinib is not due to expire until 2020ain the USA and 2022b in Europe. Valtrex.The patent on valaciclovir is not due to expire until 2009a(USA) and 2009b(Europe, (Europe, except Greece and Spain (August 2008)). Litigation challenging the validity of the patent in the USA has been settled on terms allowing for generic entry in late 2009eis ongoing.. Wellbutrin SR, Wellbutrin XLandZyban.The patent on the active ingredient has expired. There is now generic competition for the sustained release (SR) and instant release (IR) forms in the USA, and generic competition for the 300mg dosage form ofWellbutrin XLcommenced in the USA. Litigation in the USA relating to formulation patents coveringWellbutrin XL has been settled on terms allowing generic entry for the 150mg form in December 2006.2008. In Europe, regulatory data exclusivity provides protection until 2009 in some markets. Litigation is ongoing in the USA relating to formulation patents coveringWellbutrin XLthat expire in 2018e. Ziagen.The patent on abacavir is not due to expire until 2012a,c(USA) and 2014b(Europe). Zofran.The patent on ondansetron has expired in the USA and Europe, (except France (2007b) and Italy (2008(November 2008b)). A patent on use in treating emesis expiredhas also expired. Generic competition exists in 2006. In the USA, generic entry of ondansetron injectionEurope and oral solution dosage forms commenced in November 2006 and on tablet and orally disintegrating tablet dosage forms in December 2006. Generic competition has also now commenced in a number of countries in Europe.other markets. | a) | Including granted or pending patent term restoration under the Hatch-Waxman Act | | b) | Including granted or pending extension of term by national or European supplementary protection certificates | | c) | Including granted or pending extension of term for paediatric exclusivity | | d) | A registered trademark of Bayer AG | | e) | See Note 4344 to financial statements ‘Legal proceedings’. |
Trademarks
All of GSK’s pharmaceutical products are protected by registered trademarks in major markets. There may be local variations, for example, in the USA the trademarkPaxilis used instead ofSeroxatandAdvairis used instead ofSeretide. Trademark protection may generally be extended for as long as the trademark is used by renewing it when necessary. GSK’s trademarks on pharmaceutical products are important for maintaining the brand identity of the product upon expiration of the patent. The Consumer Healthcare trademarks are particularly important, as the business is very brand orientatedoriented and many products do not have patent protection. Responsibility for environment, health and safety Environment, health and safety (EHS) is a key element of corporate responsibility for the Group and has a high priority. Responsibility for EHS is at the highest level. There is a corporate groupdepartment reporting to the General Counsel that has overall responsibility for providing governance and leadership on EHS issues. The head of this groupdepartment makes regular reports to the Corporate Executive Team (CET) and the Audit and Corporate Responsibility Committees of the Board. Within the businesses operationsall executives and managers are responsible for EHS and are supported by site-based EHS and occupational healthmedical staff. EHS strategy and plan
GSK has a 10-year strategic planning processplan for EHS that looks forward 10 years but is reviewed every year.extends to 2015 with annual action plans. The plan is aligned with the GSK business drivers and includes management objectives with performance measures and targets. In 2006,2007, GSK’s progress in the first five years of the EHS Plan for Excellence was evaluated and a 10 year plan extending to 2015 was developed.against the targets set in 2006. The first five years had focused on establishingfocus for 2007 was EHS Stewardship which is about building a sustainable business. It involves caring for the fundamentals and preparing programmes that would contributepresent while thinking to the environmental sustainability of the business. Successesfuture in 2006 included greater integration of EHS into the manufacturing planning process, introduction of EHS directors in manufacturing executive teams, establishment of new performance targets, establishment of new targets for audit scores, that will be the same for GSK’s own manufacturing sites and contract manufacturers, publication of positions on pharmaceuticalsmaking decisions. This supports all three aspirations in the environment, the selection of hazardous chemicals in manufacturing and energy conservation. The next phase of the plan strengthens the focus on operational efficiency and renews the commitment to stakeholder engagement. The three aspirations for 2006 to 2015 areplan – embedding EHS in the business, environmental sustainability and open and transparent stakeholder relations. Strategic focusAccomplishments in 2006
The plan provides an area of special focus each year. In 2006, the focus was on embedding EHS in the business, making EHS an integral part of GSK’s business processes and continuous improvement culture with the participation of all employees. The goal is to develop a culture where every employee is mindful of the importance of safe working and protecting the environment. While this was the 2006 focus it will take more than one year to accomplish.
2007 | • | Climate change: A comprehensive strategy on climate change and energy efficiency was approved and is available on GSK’s website. A climate change and energy reduction team has been formed to manage a special fund which is used to support climate change projects. The team identified more than 400 projects for 2007 and 2008 to reduce energy consumption and to increase GSK’s use of renewable energy. | | |
• | Manufacturing efficiency: In the ongoing effort to improve the efficiency of manufacturing processes and therefore significantly decrease both the purchase of raw materials and the production of waste, GSK has selected the best candidate medicines for improvement. The mass efficiency of processes in development continues to improve and progress is being made to achieve the target to double mass efficiency and thereby halve the waste per unit of product for the manufacturing processes for all phase III compounds by 2010. Late stage products have been evaluated since 2005 for efficiency with an improvement to 2.8% on average. Certain marketed products, with a known market potential, have also been selected for improvement of the efficiency of their manufacturing processes. |
GSK Annual Report 20062007 | 29 | 24 | |
< Back to Contents | Regulatory environment | | | | | | Business review | | | Regulatory environment | | continued |
| | |
Part of embedding EHS in GSK meant each business developed its own plan for moving EHS forward based on its own risks and opportunities. Some accomplishments against the objectives that contributed to the overall focus were:
| • | Workplace chemical exposure:Occupational hygiene measurements have been completed for over 50% of GSK tasks involving exposure to reduce the need formost potent materials. Most results show that exposures are adequately controlled by the respiratory protective equipment occupational hygiene monitoring dataworn, with 9% verified as “respirator free” meaning respiratory protection is not necessary. Immediate action was taken to control exposures in the few instances where levels were utilisedfound to focus attention onbe higher than predicted. Manufacturing sites have a target of 80% respirator free by the processes in most needend of improvement2010. | | | | | • | to improve the efficiency of manufacturing processes it was agreed that allProcess safety:GSK’s Process Safety Management System is being enhanced, with new products launched from 2006 to 2010engineering standards and training programmes under development. The standards will be evaluated using green chemistry tools with a targetused to double the manufacturing efficiency, whichdesign new process plant and to upgrade existing plants where needed. The training programmes will result in waste per tonne of product from new processes being reduced by half in comparison to existing processesincrease process safety awareness and competencies for engineers, chemists and managers. | | | | | • | External stakeholders:In addition to improvethe ongoing UK stakeholder group meeting in March, a panel of US stakeholders met in October to provide input on EHS management systemsissues from a targetUS perspective. In a benchmark assessment of environmental programmes, carried out by the UK charity, Business in the Environment, GSK was set to improve audit scoresranked with the top companies. GSK is also included in both the FTSE 4Good index and all pharmaceutical manufacturing sites will be required to be certified to ISO 14001 and OHSAS 18001 by 2010 | | | • | to minimise EHS risks arising from new product introduction and process changes EHS requirements and sustainability principles were incorporated into the product development process | | | • | to improve EHS performance of R&D processes novel technologies will be explored.Dow Jones Sustainability Index. |
EHS audits
As part of its governance responsibility, GSK conducts EHS audits of its sites, operating entities and key suppliers, assessing the management of key risks and impacts and performance against theGSK’s global EHS standards and assigningstandards. This includes providing audited sites with quantitative performance scores.information as well as highlighting areas for risk reduction and improvement. In 2006, 32 sites2007, 33 operating entities were audited, 1217 of these achieved audit scores of 80% or better.better, which reflects our long term goal to have all of our sites score above 95%. No site scored less than 50%. As part of the but seven critical findings were raised. These have been corrected. To ensure continuous improvement, process, progress was monitored on actionscorrective and preventive action plans arising from issues raised on all audits. As part of the commitment to corporate responsibility and the pro-active management of the GSK manufacturing and supply base, 3655 current and potential suppliers were also assessed, representing about 10% of priority suppliers.assessed. This process evaluated the management of key EHS risks and impacts, including fire and explosion risks, aspects of process safety and loss prevention, control of exposure to hazardous substances and environmental protection as well as core human rights issues, based on the Group’s requirements for priority suppliers. Recommendations were made for improvements where needed.needed and 75% of the potential suppliers failed to achieve GSK’s recommendations. GSK plans to partner only with the successful candidates to improve their overall environment, health, safety and loss prevention performance. EHS targets
As part of the EHS plan, targets are set every five years.years with 2006 wasas the baseline year for the next group of five-year targets. In the 2005 EHS report achievements against the targets for 2001-2005 were reported.to 2010. Progress towards meeting the targets for 2006-2010 will be tracked every year. Final data for 2006 will be published on the website www.gsk.com.
GSK selected its measures of performance improvement based on the potential for adverse impact on people, or the environment, business continuity or business reputation. Most of the measures selected are similar to those reported by other companies and are recommended by the Global Reporting Initiative, a long-term, multi-stakeholder, international undertaking, to develop and disseminate globally applicable sustainability reporting guidelines. Targets have been set to eliminate CFCschlorofluorocarbons (CFCs) from all uses by 2010 and each year to reduce energy use and non-hazardous waste disposed by 1%, reduce water use and Volatilevolatile organic compound (VOC) releases to air by 2% and, reduce pollution of wastewater, measured as chemical oxygen demand, of wastewater by 3% and reduce energy usage and greenhouse gas emissions by 1%. During the year, a further target was set to reduce energy usage and greenhouse gas emissions by 20% by 2010 and 45% by 2015. All targets are normalised by sales.sales based on a constant exchange rate. EHS performance
In 2007, GSK remained on track to eliminate the use of CFCs by 2010 and to meet its 2010 targets for energy use and related greenhouse gas emissions. Progress towards the 2010 energy and related greenhouse gas emissions target is expected to accelerate in 2008 and beyond. The performanceannual targets were met for reduction in 2006 was:
• | CFC emissions from patient use of inhalers down 36% per £ sales | | | • | volatile organic compound emissions down 22% per £ sales | | | • | chemical oxygen demand in wastewater down 21% per £ sales | | | • | non-hazardous waste disposed down 15% per £ sales | | | • | energy use down 8% per £ sales | | | • | water use down 5% per £ sales |
Sustainability
water use and wastewater pollution. GSK did not meet its targets for non-hazardous waste disposal or VOC releases to air. In the workcase of non-hazardous waste disposal, this was because there was an 83% increase in solid waste disposal in the vaccines business due to its expansion programme in the development and launch of new vaccines. In the case of VOC releases, this was because, due to product mix changes, solvent recovery equipment at some of the manufacturing sites was inadequate to completely capture and recycle certain solvents used in the manufacturing process.
Final EHS performance data for 2007 with explanations of the trends will be published in the Corporate Responsibility report on GSK’s website. Sustainability
In working towards sustainability, GSK is addressing the economic, environmental and social issues in research, manufacturing, sales and distribution of its medicines.medicines and consumer healthcare and nutritionals products. Sustainability starts with healthcare solutions found by R&D and continues with sustainable solutions ininnovations to improve the efficiency of manufacturing and sales. R&D is considering improving operational efficiencyprocesses for new products. This reduces resource use which in turn lowers waste and cost. With lower cost our productscan be available to a wider population around the world. In the future,future, the EHS plan for excellence proposes investigating the use of renewable resources. resources in manufacturing. The Group seeks dialogue with external stakeholders and considers their views when developing approaches to sustainable development. More information on EHS programmes and performance may be found on the GSKGSK’s website.
| 30 |
| GSK Annual Report 20062007 | 25 | |
< Back to Contents | World market | | | | | | | Business review | | World market | World Market | |
| | |
World economy The global economy remained relatively robust in 2006, withcontinued to be broadly positive during 2007, buoyed by growth in manydeveloping markets such as China, although the mortgage-related issues in the USA and China.had an adverse effect in several countries. World Gross domestic productDomestic Product (GDP) growth eased from 3.9% in 2006 to 3.6%. The International Monetary Fund forecasts global GDP growth to be 4.1% in 2008. Equity markets struggled in 2007, against a backdrop of record-breaking oil prices and continued concerns over the situations in Iraq and Afghanistan. Oil prices, which averaged $71 per barrel throughout the year, rose to $100 later in the year. Inflation in the OECD countries was estimated at 3.9%, up1.9% but is expected to increase to 2.5% in 2008. The US economy weakened significantly, led by a slump in new housing starts and exacerbated by the sub-prime lending crisis. GDP growth slowed from 3.5%2.9% in 2005. Analysts2006 to 2.2% in 2007 and many analysts expect it to fall back in 2007 and towardsbelow the end of 2006,2% mark during 2008. The Dow Jones Industrial Index gained 6.4% over the OECD trimmed its 2007 global growth forecastperiod while interest rates dropped by 1% to 2.5%, the lowest rate since 2003. Equity markets rose during 2006 and concerns regarding inflation started to recede as the year progressed only to return in some regions later in the year. Global oil prices hit $78-a-barrel highs in mid-July following the crisis between Israel and Lebanon. As 2006 closed oil fell towards the $60 mark, a level around which many analysts feel it will trade through 2007, barring unforeseen events.
In the USA, GDP slipped from a two year high of 5.5% in the first quarter of 2006 to 2.2% in the fourth quarter. This performance was impacted to4.25% before a significant extent by a weakening housing market and a dropcut in new housing starts that is expectedJanuary 2008 took them down to continue throughout 2007. During 2006, US interest rates rose from 4.29% to 5.25%, the seventeenth rise in two and half years. In December, the US dollar fell to its lowest level for almost two years against the Euro and a 14-year low against Sterling.3%. In 2007, the US dollar continued to decline against both the Euro and Sterling. Having fallen throughout the year, the US dollar was worth less than 50p in November, its lowest point since 1992.
The Chinese economy continued to make sound progress, growing by 11.3% during 2007. Growth is forecast to dip slightly in 2008, particularly as problems in the USA may impact on demand for Chinese exports. In Japan, GDP was 1.9% and the Nikkei 225 fell by 11.1% during the year, marking its first annual decline in five years. The Indian and Brazilian economies both achieved double-digit growth in 2007. In the Eurozone, GDP growth slowed from 3.3% in 2006 to 2.7% and is expected to experience a soft-landing rather than a major slowdown, with growth predictedfall to be1.9% in a range2008. France expanded by 1.8% in 2007, Germany by 2.5% to 3%. After its rapid expansion in 2004, the UK by 3.1% and 2005, the Chinese economy grewSpain by over 10% in 2006, while India reported growth of 9.1%3.3% . India’s Sensex Index gained 46% in value while Japan’s Nikkei 225 Index moved ahead by 7% for the year. Japan is currently experiencing the longest period of uninterrupted growth since the Second World War, reporting GDP growth of 3.8% at the year-end.
EurozoneEuropean Central Bank interest rates beganclosed the year at 2.25% before rising4%, up 0.5% on the end of 2006. UK rates started the year at 5%, rose in five separatethree steps to 3.5%5.75% and fell back to 5.5% at the year end. Economic growth was 3.3% across the continent, up from 1.4% in 2005. Germany expanded by 3.7%, France by 2% and Spain by 4.0% . In the UK, interest rates rose to 5% in November, withyear-end while the FTSE 100 gaining almost 11% in 2006. Economic growth was 2.7%Index gained just 3.8%, with the Treasury and the Bank of England expecting growth of more than 3% in 2007.its weakest annual performance since 2003.
Exchange The currencies that most influence the Group’s results are the US dollar, the Euro and the Japanese Yen. In 2006,2007, the US dollar fell by 14%2% against the pound,Sterling, to $1.96$1.99 at the year-end. The year-end rates for the Euro weakenedstrengthened by 1%8% and the Japanese Yen by 15%5% against Sterling. World market – pharmaceuticals Global pharmaceutical sales increased by 8% in 2006 to2007 were £329 billion compared with £328 billion. | World market by | Value | | % of | | Growth | | | geographic region | £bn | | total | | £% | |
| | | USA | 145.0 | | 44 | | 9 | | | Europe | 92.8 | | 28 | | 6 | | | France | 17.6 | | 5 | | 4 | | | Germany | 16.6 | | 5 | | 3 | | | UK | 10.8 | | 3 | | 3 | | | Italy | 10.5 | | 3 | | 7 | | | Japan | 31.3 | | 10 | | (3 | ) | | Asia Pacific | 23.3 | | 7 | | 14 | | | Latin America | 15.9 | | 5 | | 21 | | | Middle East, Africa | 11.3 | | 3 | | 13 | | | Canada | 8.3 | | 3 | | 19 | |
| | | Total | 327.9 | | 100 | | 8 | |
| |
Growthbillion in the2006.
| World market by | Value | | % of | | Growth | | | geographic region | £bn | | total | | £% | |
|
|
|
|
|
| | | USA | 140.8 | | 43 | | (3 | ) | | Europe | 97.6 | | 30 | | 5 | | | France | 18.6 | | 6 | | 5 | | | Germany | 17.2 | | 5 | | 3 | | | UK | 11.3 | | 3 | | 5 | | | Italy | 10.3 | | 3 | | (2 | ) | | Japan | 28.6 | | 9 | | (9 | ) | | Asia Pacific | 24.6 | | 7 | | 10 | | | Latin America | 16.5 | | 5 | | 7 | | | Middle East, Africa | 12.4 | | 4 | | 4 | | | Canada | 8.3 | | 2 | | – | |
|
|
|
|
|
| | | Total | 328.8 | | 100 | | – | |
|
|
|
|
|
| |
The US market has increased to 9%decreased by 3%, but it still represents 44%43% of the global prescription pharmaceutical market compared with 30% a decade ago. At 30th September 2006,2007, GSK held second position in the world pharmaceutical market with a market share of 6.3%5.9%, behind Pfizer with a market share of 8%7%. GSK had sixfour of the world’s top 60 pharmaceutical products. These wereAvandia,Lamictal,Seretide/Advair Valtrex,WellbutrinandZofranValtrex. | World market – | | | | Growth | | Value | | % of | | Growth | | | top five therapeutic classes | Value | | % of | |
| | | | top six therapeutic classes | | £bn | | total | | £% | | | | £bn | | total | | CER% | | £% | |
| |
| | | | Central nervous system | | 54.4 | | 17 | | 1 | | | Cardiovascular | 54.5 | | 17 | | 6 | | 7 | | 50.7 | | 15 | | (6 | ) | | Central nervous system | 54.0 | | 16 | | 7 | | 8 | | | | Alimentary tract and metabolic | 39.8 | | 12 | | 7 | | 9 | | 39.7 | | 12 | | (1 | ) | | Antineoplastic/Immunomodulatory | | 35.6 | | 11 | | 8 | | | Anti-infectives (bacterial, | | 32.9 | | 10 | | (1 | ) | | viral and fungal) excluding | | | | | | | | vaccines | 33.2 | | 10 | | 1 | | 3 | | | | | | | | Respiratory | 21.7 | | 7 | | 5 | | 6 | | 22.1 | | 7 | | 2 | |
|
| |
| | | (Note: data based on 12 months to 30th September 2006.) | | |
(Note: data based on 12 months to 30th September 2007)
|
| GSK Annual Report 20062007 | 31 | 26 | |
< Back to Contents | Products and competition | | | | | | Business review | | | Productsandcompetition |
| | | | | |
| | | | Both the prescription pharmaceutical and consumer healthcare industries are highly competitive. Despite being the second largest pharmaceutical company in the world, GSK has only a 5.9% share of the world market. | | | | |
Pharmaceutical products GlaxoSmithKline’s principal pharmaceutical products are currently directed to eight main therapeutic areas. An analysis of sales by these therapeutic areas, andarea, with a description of the principal products, areis set out below: | | 2006 | | 2005 | | 2004 | | 2007 | 2006 | 2005 | | | Turnover by therapeutic area | £m | | £m | | £m | | £m | £m | |
|
| |
| | | Respiratory | 4,995 | | 5,054 | | 4,394 | | 5,032 | 4,995 | 5,054 | | | Central nervous system | 3,642 | | 3,219 | | 3,462 | | 3,348 | 3,642 | 3,219 | | | Anti-virals | 2,827 | | 2,598 | | 2,359 | | 3,028 | 2,827 | 2,598 | | | Metabolic | 1,875 | | 1,495 | | 1,251 | | 1,514 | 1,875 | 1,495 | | | Vaccines | 1,692 | | 1,389 | | 1,194 | | 1,993 | 1,692 | 1,389 | | | Cardiovascular and urogenital | 1,636 | | 1,331 | | 932 | | 1,554 | 1,636 | 1,331 | | | Anti-bacterials/anti-malarials | 1,369 | | 1,519 | | 1,547 | | 1,330 | 1,369 | 1,519 | | | Oncology and emesis | 1,069 | | 1,016 | | 934 | | 477 | 1,069 | 1,016 | | | Other | 973 | | 1,040 | | 1,027 | | 957 | 973 | 1,040 | |
|
| |
| | | | 20,078 | | 18,661 | | 17,100 | | 19,233 | 20,078 | 18,661 | |
|
| |
| |
Products and all their formulations may not be approved for all indications in all markets where they are available. Respiratory
Seretide/Advair, a combination ofSereventandFlixotide, offers a long-acting bronchodilator and an anti-inflammatory in a single inhaler. It is approved for the treatment of asthma and COPD. Flixotide/FloventandBecotide/Becloventare inhaled steroids for the treatment of inflammation associated with asthma and COPD. Sereventis a long-acting bronchodilator used to treat asthma and COPD, andVentolinis a selective short-acting bronchodilator used to treat bronchospasm. Veramyst/Avamys, Flixonase/FlonaseandBeconaseare steroid intra-nasal preparations for the treatment of perennial and seasonal rhinitis. Central nervous system (CNS)
Seroxat/Paxilis a selective serotonin re-uptake inhibitor (SSRI) for the treatment of major depressive disorder, panic, obsessive compulsive disorder, post traumatic stress disorder, social anxiety disorder, anddisorderand generalised anxiety disorder. A controlled release formulation,Paxil CR, is also available in the USA. Wellbutrinis an anti-depressant, available in the USA and somemany European and international markets in normal, sustained-release (SR) and once-daily (XL) formulations. Imigran/Imitrexis a 5HT1 receptor agonist used for the treatment of severe or frequent migraine and cluster headache and has become the reference product in this sector.Naramig/Amergeis also a 5HT1 receptor agonist indicated for the treatment of migraine. Lamictal, a well established treatment for epilepsy, is also indicated for bipolar disorder. Requipis a specific dopamine D2/D3 receptor agonist indicated for the treatment of Parkinson’s disease and Restless Legs Syndrome (RLS). Anti-virals
Combivir, a combination ofRetrovirandEpivir, has consolidated the position of these two reverse transcriptase inhibitors as the cornerstone of many multiple anti-HIV product regimens. Physician acceptance has clearly demonstrated the value placed on minimising the pill burden faced by patients. Ziagenis a reverse transcriptase inhibitor. The product’s potency, ease of use and resistance profile allow it to play a significant role in a variety of highly active, well tolerated and simplified HIV treatment regimens. Triziviris a combination ofCombivirandZiagen, combining three anti-HIV therapies in one tablet, for twice dailytwice-daily administration. Epzicom/Kivexa, approved for use in the USA and Europe, is a combination ofEpivirandZiagenthat is taken as one tablet with once-daily dosing for HIV/AIDS in combination with at least one other anti-HIV drug. Lexiva/Telziris a protease inhibitor for the treatment of HIV that is well tolerated and more convenient thanAgenerase, which it supersedes.Lexivamay be taken twice dailytwice-daily or once dailyonce-daily when boosted with ritonavir. Zeffixhas been approved for marketing in the USA, Europe, China and other markets for the treatment of chronic hepatitis B. Valtrexis a treatment for episodic genital herpes as well as the long term suppression and reduction of transmission of genital herpes, zoster (shingles), cold sores and chicken pox.ValtrexsupersedesZovirax, which is also used to treat herpes infections. Metabolic
Avandiais a potent insulin sensitising agent which acts on the underlying pathophysiology of type 2 diabetes. Avandametis a combination ofAvandiaand metformin HCI it is the first medicine that targets insulin resistance and decreases glucose production in one convenient pill. AvandarylAvandaryl/Avaglimis a combination ofAvandiaand Amaryl, a Sanofi-Aventis product.AvandarylAvandaryl/Avaglymtargets insulin resistance and stimulates pancreatic insulin production.
Bonviva/Bonivais a long-acting bisphosphonate available in once-monthly oral and quarterly injection forms for the treatment of osteoporosis.osteoporosis (co-promoted with Roche). Vaccines
GSK markets over 30 vaccines worldwide, of which more than half are combination vaccines to protect children, adolescents and/or adults against up to six diseases at the same time. Infanrixis GSK’s range of paediatric vaccine combinations.Infanrixprovides protection against diphtheria, tetanus and pertussis (whopping(whooping cough).Infanrix penta(Europe)/Pediarix(USA, (USA, Canada) provides additional protection against hepatitis B and polio, andpolio.Infanrix hexafurther adds protection against Haemophilus influenzae type b, which is a cause of meningitis. In the USA,Boostrixis available to add protection against pertussis (whopping cough) to the routine tetanus/diptheria booster administered to teenagers. In GSK’s hepatitis vaccines range,Havrixprotects against hepatitis A andEngerix-Bagainst hepatitis B.
| 32 |
| GSK Annual Report 20062007 | 27 | |
< Back to Contents | Products and competition | | | | | | | Business review | | | Productsandcompetition | | continued |
| | |
Twinrixis the only available combined hepatitis A and B vaccine, protecting against both diseases with one vaccine and available in both adult and paediatric strengths. In Europe,FENDrix, a vaccine to prevent hepatitis B in patients with renal insufficiency including high-risk groups such as pre-haemodialysis and haemodialysis patients, is available from 15 years of age onwards. GSK addedFluviralto its portfolio of products when it acquired the Canadian vaccine manufacturer ID Biomedical Corporation in December 2005.Fluviralis marketed in Canada. In 2006,Canada and, following FDA approval, the same ‘flu vaccine was approved by the US Food and Drug Administration (FDA) forUSA where it is approvedfor the active immunisation of adults 18 years and older against influenza disease under the brandFluLaval.FluviralandFluLavaladd toFluarixGSK’s seasonal ‘flu vaccine, which is distributed in 79 countries including the USA. GSK also marketsPriorix, a measles, mumps and rubella vaccine,Typherix, a vaccine for protection against typhoid fever, andVarilrix, a vaccine against varicella or chicken pox.Priorix-Tetra, GSK’s new combination vaccine to prevent measles, mumps, rubella and varicella (MMRV) was first launched in Germany in August 2006. In addition, the Group markets a range of vaccines to prevent meningitis under the umbrella nameMencevax. GSK’s new Hib-MenC vaccine,Menitorixis now available in the UK. GSK’s meningitis vaccine portfolio will be complimentedcomplemented by new meningitis conjugate vaccines in the near future. As part of its paediatric franchise, GSK continued to roll out the launch of its vaccine against rotavirus induced gastroenteritis,Rotarix, which is now launched in 90 countries worldwide. Rotavirus vaccination has been included in the national vaccination calendar of five Latin American countries whereRotarixwill be available free at public health clinics, as part of governmental paediatric immunisation programmes. Cardiovascular and urogenital
Coregis an alpha/beta blocker which has been proven to be effective in treating patients with mild, moderate and severe heart failure, heart attack or hypertension. GSK has sole marketing rights in the USA and Canada. A controlled release formulation,Coreg CR is also available in the USA. Generic versions of the productCoreg are available in the USA and Canada. Levitrais a PDE-5 inhibitor indicated for male erectile dysfunction. GSK has co-promotion rights in the USA and more than 20 other markets. Avodartis a 5-ARI inhibitor currently indicated for benign prostatic hyperplasia. A large clinical outcome study is underway examining its efficacy in reducing the preventionrisk of prostate cancer. Vesicareis an anti-muscarinic indicated for overactive bladder. GSK has co-promotion rights with Astellas in the USA. Its major competitors are Detrol LA, Ditropan XL/generic oxybutynin, and Enablex. Arixtra, a selective Factor Xa inhibitor, is indicated for the prophylaxistreatment of deep vein thrombosis which may lead to(DVT) and pulmonary embolism (PE) and for the prevention of DVT and PE in hip fracturepatients undergoing major orthopaedic surgery, knee replacement, hip replacementabdominal surgery and abdominal surgery. Itacutely ill medical patients (EU only). Also in the EU,Arixtra is also indicated for the treatment of deep vein thrombosispatients with acute coronary (unstable angina, NSTEMI and pulmonary embolism.STEMI). Fraxiparineis a low-molecular weight heparin indicated for prophylaxis of thromboembolic disorders (particularly deep vein thrombosis and pulmonary embolism) in general surgery and in orthopedic surgery, treatment of deep vein thrombosis and prevention of clotting during hemodialysis.haemodialysis. Integrilinis a GP IIb-IIIa inhibitor, approved in the EU for the prevention of early myocardial infarction in patients with unstable angina or non-Q-wave MI. Anti-bacterials and anti-malarials
Augmentinis a broad-spectrum antibiotic suitable for the treatment of a wide range of common bacterial infections and is particularly effective against respiratory tract infections.Augmentin ES-600is an extra strength suspension specifically designed to treat children with recurrent or persistent middle ear infections.Augmentin XRis an extra strength tablet formextended release formulation for adults to combat difficult to treat infections.the treatment of patients with community acquired pneumonia or acute bacterial sinusitis. Altabax/Altargo, approved in 2007 for the topical treatment of certain bacterial skin infections, represents the first new class of topical antibiotics approved by the FDA in nearly two decades. Altabax/Altargo co Ceftin/Zinnatis an oral antibiotic used primarily for community-acquired infections of the lower respiratory tract. Malaroneis an oral anti-malarial used for the treatment and prophylaxis of malaria caused by Plasmodium falciparum. Oncology and emesis
LapdapTykerbis an effectiveoral treatment for patients with advanced or metastatic breast cancer whose tumours overexpress HER2 and well toleratedwho have received prior therapy including an anthracycline, a taxaneand trastuzumab.Tykerb was approved in the USA in 2007 and is submitted for the treatment of malaria, which has been developed through a public/private collaboration.European approval. OncologyHycamtin is a second line treatment for ovarian, cervical and emesissmall cell lung cancer.
Bexxar is a treatment for patients with CD20 follicular, non-Hodgkin’s lymphoma with and without transformation whose disease is refractory to rituximab and who have relapsed following chemotherapy.
Arranon (nelarabine) a treatment for patients with T-cell acute lymphoblastic leukaemia and T-cell lymphoblastic lymphoma. Zofranis used to prevent nausea and vomiting associated with chemotherapy and radiotherapy for cancer, and is available in both oral and injectable forms. It is also approved for use in the prevention and treatment of post-operative nausea and vomiting. Hycamtinis a second line treatment for ovarian, cervical and small cell lung cancer.
Bexxaris a treatment for patients with CD20 follicular, non-Hodgkin’s lymphoma with and without transformation whose disease is refractory to rituximab and who have relapsed following chemotherapy.
Arranon(nelarabine) a treatment for patients with T-cell acute lymphoblastic leukaemia and T-cell lymphoblastic lymphoma, received US approval in 2005 and was submitted for European approval in 2006.
Other
This category includesBetnovate, the higher potencyDermovateand the newerCutivate, which are topical anti-inflammatory steroid products used to treat skin diseases such as eczema and psoriasis,Relafen, a non-steroidal anti-inflammatory drug for the treatment of arthritis, andZantac, for the treatment of peptic ulcer disease and a range of gastric acid related disorders.
|
| GSK Annual Report 20062007 | 33 | 28 | |
<Back to Contents | Products and competition | | | | | | Business review | | | Productsandcompetition | | continued |
| | |
Pharmaceuticals competition The pharmaceutical industry is highly competitive. GSK’s principal competitors range from small to large pharmaceutical companies often with substantial resources. Some of these companies and their major products are mentioned below. Pharmaceuticals may be subject to competition from other products during the period of patent protection and, once off patent, from generic versions. The manufacturers of generic products typically do not bear significant research and development or education and marketing development costs and consequently are able to offer their products at considerably lower prices than the branded competitors. A research and development based pharmaceutical company will normally seek to achieve a sufficiently high profit margin and sales volume during the period of patent protection to repay the original investment, which is generally substantial, and to fund research for the future. Competition from generic products generally occurs as patents in major markets expire. Increasingly patent challenges are made prior to patent expiry, claiming that the innovator patent is not valid and/or that it is not infringed by the generic product. Following the loss of patent protection, generic products rapidly capture a large share of the market, particularly in the USA. GSK believes that remaining competitive is dependent upon the discovery and development of new products, together with effective marketing of existing products. Within the pharmaceutical industry, the introduction of new products and processes by competitors may affect pricing levels or result in changing patterns of product use. There can be no assurance that products will not become outmoded, notwithstanding patent or trademark protection. In addition, increased government and other pressures for physicians and patients to use generic pharmaceuticals, rather than brand-name medicines, may increase competition for products that are no longer protected by patent. Respiratory
GSK’s respiratory franchise is driven by the growth ofSeretide/Advair. Major respiratory competitors are Singulair from Merck, especially in the USA, Symbicort from AstraZeneca and Spiriva from Pfizer/ Boehringer Ingelheim. CNS disorders
Major competitors in the USA toPaxilare its generic forms, as well as generic fluoxetine, the generic form of Eli Lilly’s Prozac, generic sertraline, the generic form of Pfizer’s Zoloft, Cymbalta from Eli Lilly, Forest Laboratories’ Celexa and Lexapro, and Effexor XR from Wyeth. The principal competitors in the USA forWellbutrinare generic forms of bupropion, the generic forms of SSRIs, Lexapro, Effexor XR, and Cymbalta.Paxil CRand the once-dailyWellbutrin XLhelp to retain a strong presence in the anti-depressant market, given the availability of both generic paroxetine and bupropion in the USA. Generic competition forSeroxat/Paxilhas also occurred in a number of other markets. The major competitors forLamictalin epilepsy are J&J’s Dilantin and generic phenytoin, Novartis’s Tegretol/Novartis’ egretol/Tegretol XR and generic carbamazepine. UCB’s Keppra and Abbot’s Depakote/Depakote ER. In Bipolarbipolar the major competitors are generic Lithium,lithium, other anti-epileptics including Abbott’s Depakote/Depakote ER and the atypical anti-psychotics including AstraZeneca’s Seroquel. The major competitors forImitrex/Imigranare AstraZeneca’s Zomig, Merck’s Maxalt and Pfizer’s Relpax. Anti-virals
GSK is a pioneer in the HIV market, launching AZT (Retrovir)in 1987 andEpivirin 1995, which today are available asCombivirin a single tablet, a cornerstone of HIV combination therapy. The launches of ZiagenZiagen,Agenerase,Trizivir,LexivaandEpzicomhave broadened the Group’s portfolio of HIV products. Major competitors in the HIV market include Gilead, Bristol Myers Squibb, Abbott, Roche and Boehringer Ingelheim. Valtrexhas strengthened the Group’s position in the anti-herpes area, where GSK’sValtrexandZoviraxcompete with Novartis’ Famvir.Valtrexis a market leader, whilstZoviraxfaces competition from generic acyclovir. In the hepatitis B market, GSK’sZeffixwas the first anti-viral on the market. Gilead’s Hepsera was the second. The Group has secured marketing rights toHepserain some key markets. Metabolic
The major competitor forAvandiais Takeda Chemical’s Actos, which is co-promotedwhose co-promotion with Eli Lilly in the USA.USA ended in 2007. Takeda also market ActoplusMetActoplusmet/Competact (a combination of Metforminmetformin HCI and Actos) in the USA and some EU markets and DuetAct (a combination of glimepiride and Actos) in the USA. MonthlyBoniva/Bonvivacompetes with Merck’s weekly Fosamax and Proctor & Gamble/Sanofi-Aventis’s weekly Actonel.Sanofi-Aventis’ twice-monthly Actonel, and Novartis’ Reclast/Aclasta which is dosed as an annual infusion. Generic Fosamax (alendronate) is now available in several EUmany markets, including the USA, UK, and Germany and also in Canada. Vaccines
The vaccine market is dominated by five key players. GSK’s major competitors include Sanofi Pasteurare SanofiPasteur (SP), Merck, Novartis and Wyeth. Within the paediatric vaccine field,Infanrix’smain competitor is SP’s range of DTPa-based combination vaccines, although theInfanrix hexacombination is the only available hexavalent paediatric combination in Europe. Merck and the joint venture between Merck and SP in Europe market two new vaccines against rotavirus induced infection and HPV, that respectively compete againstRotarix andCervarix. Cardiovascular and urogenital
GSK marketsCoregin the USA where its major competitors are Toprol XL and generic betablockers.Avodartcompetes directly with Merck’s Proscar within the BPH (enlarged prostate) market. The Group has co-promotion rights in the USA forLevitra, which faces competition from Pfizer’s Viagra and Lilly’s Cialis. The major competitor forArixtra is the low molecular weight heparin enoxaparin, a product marketed by Sanofi-Aventis. Anti-bacterials and anti-malarials
Generic versions of bothAugmentinandCeftin/Zinnatare available in the USA.Augmentinalso faces generic competition in various European countries.Augmentin XRandAugmentin EScompete against a broad range of other branded and generic antibiotics.Malarone’ssafety profile and convenient dosing regimen have helped put this product in a strong position versus mefloquine for malaria prophylaxis. Altabax/Altargo competes in the topical antibiotic market against a number of generic competitors, including generic mupirocin and fusidic acid. Altabax/Altargo’s offers less frequent and shorter duration of therapy and lack of cross resistance to other established classes of anti-bacterials.
| 34 | GSK Annual Report 2007 | | |
Back to Contents | | | REPORT OF THE DIRECTORS | | | Productsand competition | | | | | | | Business review | | Products and competition | | continued | | |
Oncology and emesis
Major competitors in the diverse therapeutic market include Roche/ Genentech, Novartis, Sanofi-Aventis and Bristol Myers Squibb. GSK’s therapeutic portfolio led by the recently approvedTykerb andHycamtin, currently holds a relatively small market position.Zofranprovided GSK with a leadership position in the anti-emetic market where competitor companies include Roche, Sanofi-Aventis and more recently MGI and Merck. Generic competitors became available late in 2006.Zofrannow has full generic competition in the USA. Major competitors in the diverse cytotoxic market include Bristol Myers Squibb, Sanofi-Aventis, Novartis and Roche/Genentech. GSK’s cytotoxic portfolio, led byHycamtin, currently holds a relatively small market position.
<Back to Contents
| Business review | | Products and competition | continued |
| |
Consumer Healthcare products GlaxoSmithKline’s principal consumer healthcare products are in three major areas. An analysis of sales by these areas is set out below: | | 2006 | | 2005 | | 2004 | | 2007 | 2006 | 2005 | | | | £m | | £m | | £m | | £m | £m | |
|
| |
| | | OTC medicines | 1,496 | | 1,437 | | 1,400 | | 1,718 | 1,496 | 1,437 | | | Oral care | 993 | | 943 | | 913 | | 1,049 | 993 | 943 | | | Nutritional healthcare | 658 | | 619 | | 573 | | 716 | 658 | 619 | |
|
| |
| | | | 3,147 | | 2,999 | | 2,886 | | 3,483 | 3,147 | 2,999 | |
|
| |
| |
Major products, which are not necessarily sold in all markets, are: | Category | Product | |
|
| | | Over-the-counter medicines | | | | Analgesics | Panadol | | | Dermatologicals | Zovirax | | | | Abreva | | | External nasal dilators | Breathe Right | | | Gastro-intestinal | Tums | | | | Citrucel | | | Respiratory tract | Contac | | | | Beechams | | | Smoking control | Commit | | | | Nicorette | | | | NicoDerm CQ | | | | NiQuitin CQ | | | | Nicabate CQ | | | Natural wellness support | Abtei | | | FiberChoice | |
|
| | | Weight control | alli | |
|
| | Oral carehealthcare | Aquafresh | | | | Dr Best | | | | Macleans | | | | Odol | | | Odol Med 3 | | | Polident | | | | Poligrip | | | | Sensodyne | |
|
| | | Nutritional healthcare | Lucozade | | | | Ribena | | | | Horlicks | |
|
| |
Over-the-counter medicines
The leading products arePanadol, a widely available paracetamol/ acetaminophen analgesic,Nicorettegum in the USA, theNicoDerm,NiQuitin CQandNicabaterange of smoking control products,Tums, a calcium-based antacid,Citrucellaxative,Contacfor the treatment of colds,Abtei, a natural medicines and vitamin range, andZoviraxandAbrevafor the treatment of cold sores. In December 2006,Recent additions to the company acquiredportfolio includeBreathe Rightnasal strips that gently lift open nasal passages to provide better breathing, andFiberChoicedaily fibre supplements, through the acquisition of CNS, Inc. in 2006, and the switch of orlistat from prescription-only status in the United States to over-the-counter, marketed as the weight control product,alli. GSK’s portfolio will be strengthened further in 2007 with the US launch ofalli, a new treatment for weight-loss.
Oral care
The leading Oral care products are toothpastes and mouthwashes under theAquafresh,Odol,SensodyneandMacleansbrand names, and a range of toothbrushes sold under theAquafreshandDr Bestnames. In addition, denture care products are available principally under thePolident,PoligripandCoregabrand names. Nutritional healthcare
The leading products in this category areLucozadeenergy and sports drinks,Ribena, a blackcurrant juice-based drink, andHorlicks, a range of milk-based malted food and chocolate drinks. Consumer Healthcare competition GSK holds leading global positions in all its key consumer product areas. Worldwide it is the third largest in Oral care and in OTC medicines. In Nutritional healthcare it holds the leading position in the UK, India and Ireland. The environment in which the Consumer Healthcare business operates has become ever more challenging: | • | consumers are demanding better quality, better value and improvedperformance improved performance | | | | | • | retailers have consolidated and globalised which has strengthenedtheirstrengthened their negotiation power | | | | | • | manufacturers are consolidating, leading to more aggressivecompetitionaggressive competition across all elements of the marketing mix | | | | | • | cycle times for innovation have reduced. |
The main competitors include the major international companies Colgate-Palmolive, Johnson & Johnson, Procter & Gamble, Unilever and Wyeth. In addition, there are many other companies that compete with GSK in certain markets.
The major competitor products in OTC medicines are:
| | The main competitors include the major international companiesColgate-Palmolive, Johnson & Johnson, Procter & Gamble, Unileverand Wyeth. In addition, there are many other companies thatcompete with GSK in certain markets. | | | The major competitor products in OTC medicines are: | | | | • | in the USA: Metamucil (laxative), Pepcid (indigestion) and privatelabelprivate label smoking control products | | | | | • | in the UK: Lemsip (cold remedy), Nurofen and Anadin (analgesics),and Nicorette and Nicotinell (smoking control treatments). |
In Oral care the major competitors are Colgate-Palmolive’s Colgate and Procter & Gamble’s Crest. In Nutritional healthcare the major competitors toHorlicksare Ovaltine and Milo malted food and chocolate drinks. The competitors toRibenaare primarily local fruit juice products, whileLucozadecompetes with other energy drinks.
|
| GSK Annual Report 20062007 | 35 | 30 | |
<Back to Contents | Financial review 2007 | | | | | | Business review | | Financialreview2007 | Financial review 2006continued | | |
|
| | | | GSK turnover grew 2% in 2007, and
business performance EPS grew 10% to
99.1p. The dividend was raised 10% to 53p.
Share repurchases were £3.8 billion in 2007,
with a further £6 billion expected in 2008. | | |
Pharmaceutical turnover All growth rates included in the review of turnover are at constant exchange rates (CER) unless otherwise stated. The sterlingSterling growth rates may be found in the tables of pharmaceutical turnover by therapeutic area on page 3237 and by geographic region on page 33.38. Total pharmaceutical turnover in 20062007 was £20,078£19,233 million compared with £18,661£20,078 million in 2005, an increase of 9%2006, in line with 2006 turnover at CER. Within the Group’s portfolio, turnover of new products first launched in a major market within the last five years accounted for 27% (2005 – 24%) of total turnover and grew by 20% to £5,333 million (2005 – £4,478 million). Turnover of the more established, franchise products amounted to £11,709 million (2005 – £10,933 million), representing 58% of total turnover, and increased 9% compared with last year. Turnover of older products, now less actively promoted, was £3,036 million (2005 – £3,250 million), representing 15% of total turnover, and declined by 5%. In sterling terms total pharmaceutical turnover increased 8%decreased 4%, 1%four percentage points less than CER, principally due principally to the strength of Sterling against major International currencies.the US dollar. Pharmaceutical turnover by therapeutic area GSK’s abilityturnover in 2007 was in line with 2006 to deliver continued pharmaceutical turnover growth was primarily due to an exceptionally broad product portfolio ofas high-value growth products coupled with sales and marketing excellence. These growth products includeSeretide/Advair, the were offset by lowerAvandiaproduct group, Vaccines, sales and US generic competition toCoreg IR,Flonase,Wellbutrin XL andZofran. The high-value growth products includedSeretide/Advair, vaccines,Lamictal,Valtrex,CoregRequip,RequipAvodart, andAvodartBonivaandBoniva. Respiratory
GSK continues to be thea global leader in respiratory pharmaceuticals with sales of its three key products,Seretide/Advair,Flixotide/FloventandSereventamounting to £4.3£4.4 billion, up 9%8%. Total sales ofSeretide/Advair, for asthma and COPD, rose 11%10% to £3.3£3.5 billion. In the USA, sales grew 13%9% to £1.9 billion. In Europe sales grew 10%9% to £1.1£1.2 billion and in International markets sales grew 9%23% to over £300 million. £372 million, enhanced by its launch in Japan in June. Market share by value in the anti-asthma and COPD therapy class was 29% in Europe and 33%31% in the USA, an increase of 2 percentage points in Europe and a flat marketUSA. Market share growth in the USA (reflecting lower prescription volumes dueby value forSeretide/Advair 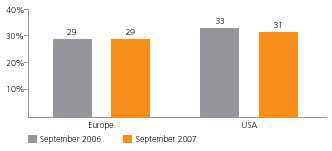 GSK continues to a label change in early 2006 that restricted GSK’s ability to promote the product, offset by favourable pricing changes). 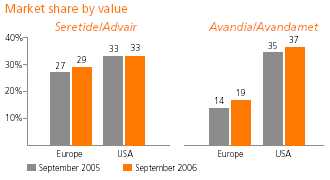 The positive results of the TOwards a Revolution in COPD Health (TORCH) study, the largest of its kind, were filed with regulators early in 2007 and in February were published in the ‘New England Journal of Medicine’. The results of the three year study, sponsored by GSK, showed important benefitssee increased use ofSeretideSeretide/Advairin the treatment of patientsCOPD and is in ongoing discussions with COPD.the FDA to expand the indication for use in this patient group, including assessment of data supporting a claim for reduction of exacerbations.
Central nervous system (CNS)CNS
CNS sales increased 15%decreased 2% to £3.6£3.3 billion. Sales increaseddecreased in the USA and International, but declined in Europe, due to generic competition. TotalSeroxat/Paxilsales grew 4% to £620 million, due to strong growth ofPaxil CRin the USA andPaxil IRin Japan partly offset byreflecting generic competition toSeroxat/Paxil IRin Europe.
TotalWellbutrinboth regions. International sales grew 24%6% which included 4% growth inPaxil in Japan. TotalSeroxat/Paxil sales declined 6% to £900£553 million. Sales ofTotalWellbutrin XL, a once-daily product, grew 25% sales declined 37% to £798 million. In December 2006,£529 million, owing to US generic competition to theWellbutrin SR/IR andWellbutrin XL300mg tablet (approximately 60% ofWellbutrinsales) entered the US market.tablet.
Sales ofLamictal, for the treatment of epilepsy and bipolar disorder, grew 19%18% to just under £1£1.1 billion, driven by sales in the USA which were up 26% to £892 million, benefiting from its new indication to treat one of the most serious forms of epilepsy – primary generalised tonic-clonic seizures.indication.Lamictalis also the only medicine with long-term clinical data that demonstrates that it can delay the onset of depressive episodes of bipolar disorder. In November, GSK submittedLamictal XR, a new once daily treatment,expects to respond to the FDAUS FDA’s approvable letter for treatment of epilepsy. The company intends to present data onLamictal XRat in the American Academymiddle of Neurology meeting in April 2007.2008. Sales ofRequip, for Parkinson’s disease and Restless Legs Syndrome (RLS), grew 74%36% to £268 million£346 million.Requip XL, a new once-daily formulation for Parkinson’s disease, has now been approved in 13 European countries and launched in December,seven markets. Further European approvals are anticipated during 2008. In the USA, GSK expects a response from the FDA accepted GSK’s fileon its application for approvalRequip XL during the first half of the new formulationRequip CR.2008. Anti-virals
Total sales of HIV products were £1.5£1.4 billion, down 1%. Competition to older products,Combivirdown 9%10% to £528£455 million andEpivirdown 21%20% to £202£156 million, was mostlylargely offset by strong sales growth of new productsEpzicom/Kivexa, which more than doubledgrew 39% to £241£324 million andLexiva/Agenerase, up 13% to £141 million. Sales ofValtrex, for herpes, rose 18% to £131 million. Sales ofValtrex, rose 24% to £845£934 million, with US sales up 30%20% to £600£668 million driven by patients switchingincreased use of the product for prevention of disease transmission. Sales in Europe grew 9% to suppression therapy.£120 million and in International grew 13% to £146 million. Sales ofRelenza, an antiviral treatment for flu, were £262 million (2006 – £91 million), driven primarily by one-off government orders for stockpiling against a possible flu pandemic.
Metabolic
GSK launchedIn 2007, sales of theAvandia product group, for the treatment of type 2 diabetes, in 1999 and a combination product,Avandamet, for blood sugar control in 2002. The product group was expanded further in February 2006declined 22% to £1.2 billion. In the USA sales fell 29% to £780 million, with the launchfourth quarter sales down 55% to £130 million following publication of an article in the New England Journal of Medicine. This article suggested that there may be cardiovascular risk associated withAvandia. Despite GSK’s efforts, doctors became reluctant to start new patients onAvandiawithout further guidance from the FDA. Following clarification from the FDA in October, there is now a new approved label forAvandia. Outside the USA, of a fixed-dose combination treatment,Avandaryl, which combinesAvandiawith a sulfonylurea. In 2006, sales ofin Europe grew 4% for theAvandiaproduct group grew 24% year to £1.2 billion in the USA. In Europe, sales grew 39% to £217£227 million, driven by the increasing use ofAvandamet. Salesand in International markets, rose 17%sales declined 7% to £234£212 million. TheAvandiaproduct group achieved in 2006 a market share by value in oral anti-diabetics of 37% in the USA and 19% in Europe, up 2 and 5 percentage points, respectively. In the USA,Avandametprescription volume growth was adversely impacted by product supply issues during the year which have now been resolved.
In December, GSK presented data from the landmark ADOPT study, which demonstrated thatAvandiais more effective than metformin, or a sulphonylurea, in long-term blood sugar control in type 2 diabetes. These data are in addition to those recently presented from the DREAM study, which showed thatAvandiacan reduce the risk of progression to type 2 diabetes. Data from both these studies are expected to be filed with regulatory agencies during the first half of 2007.
GSK recorded in turnover a £95£161 million share of co-promotion income forBoniva/Bonviva, a new once-monthly oral bisphosphonate for the treatment of postmenopausal osteoporosis, which was developedosteoporosis. Vaccines
Vaccine sales increased 20% to £2.0 billion, with Roche,good performances in all regions: US sales rose 44% to £628 million; European sales grew 14% to £814 million and launchedsales in 2005.International were up 8% to £551 million. Sales of hepatitis vaccines grew 14% to £529 million, driven by US growth of 33%. | 36 |
| GSK Annual Report 20062007 | 31 | |
<Back to Contents
| Business review | | Financial review 2006 | continued |
| |
Pharmaceutical turnover by therapeutic area 2006
| | Total | | USA | | Europe | | | | International | | | |
|
|
|
|
|
|
|
|
| |
|
|
|
|
| |
|
|
|
|
| |
|
|
|
|
| | | | | | | | | | Growth | | | | Growth | | | | Growth | | | | Growth | | | Therapeutic area/major | % of | | 2006 | | 2005 | |
|
|
| | 2006 | |
|
|
| | 2006 | |
|
|
| | 2006 | |
|
|
| | | products | total | | £m | | £m | | CER | % | £% | | £m | | CER | % | £% | | £m | | CER | % | £% | | £m | | CER | % | £% | |
|
|
|
|
|
|
|
|
|
|
|
|
|
|
|
|
|
|
|
|
|
|
|
|
|
|
|
| | | Respiratory | 27 | | 4,995 | | 5,054 | | – | | (1 | ) | 2,461 | | (3 | ) | (5 | ) | 1,697 | | 3 | | 2 | | 837 | | 4 | | 3 | | | Seretide/Advair | | | 3,313 | | 3,003 | | 11 | | 10 | | 1,870 | | 13 | | 11 | | 1,133 | | 10 | | 10 | | 310 | | 9 | | 10 | | | Flixotide/Flovent | | | 659 | | 638 | | 5 | | 3 | | 298 | | 16 | | 14 | | 173 | | (8 | ) | (8 | ) | 188 | | 2 | | – | | | Serevent | | | 291 | | 330 | | (10 | ) | (12 | ) | 86 | | (16 | ) | (17 | ) | 140 | | (13 | ) | (13 | ) | 65 | | 5 | | (2 | ) | | Flixonase/Flonase | | | 311 | | 656 | | (52 | ) | (53 | ) | 184 | | (63 | ) | (64 | ) | 51 | | (15 | ) | (15 | ) | 76 | | (14 | ) | (16 | ) |
|
|
|
|
|
|
|
|
|
|
|
|
|
|
|
|
|
|
|
|
|
|
|
|
|
|
|
| | | Central Nervous System | 17 | | 3,642 | | 3,219 | | 15 | | 13 | | 2,588 | | 28 | | 26 | | 595 | | (15 | ) | (15 | ) | 459 | | 2 | | (1 | ) | | Seroxat/Paxil | | | 620 | | 615 | | 4 | | 1 | | 175 | | 35 | | 32 | | 149 | | (20 | ) | (20 | ) | 296 | | 5 | | – | | | Paxil IR | | | 448 | | 488 | | (5 | ) | (8 | ) | 19 | | 11 | | 6 | | 149 | | (20 | ) | (20 | ) | 280 | | 4 | | (1 | ) | | Paxil CR | | | 172 | | 127 | | 37 | | 35 | | 156 | | 38 | | 36 | | – | | – | | – | | 16 | | 25 | | 33 | | | Wellbutrin | | | 900 | | 739 | | 24 | | 22 | | 882 | | 24 | | 22 | | 2 | | – | | – | | 16 | | 7 | | 14 | | | Wellbutrin IR, SR | | | 102 | | 92 | | 12 | | 11 | | 89 | | 14 | | 11 | | 2 | | – | | – | | 11 | | – | | 10 | | | Wellbutrin XL | | | 798 | | 647 | | 25 | | 23 | | 793 | | 25 | | 23 | | – | | – | | – | | 5 | | 25 | | 25 | | | Imigran/Imitrex | | | 711 | | 697 | | 3 | | 2 | | 551 | | 11 | | 9 | | 118 | | (18 | ) | (18 | ) | 42 | | (12 | ) | (14 | ) | | Lamictal | | | 996 | | 849 | | 19 | | 17 | | 765 | | 37 | | 35 | | 175 | | (22 | ) | (23 | ) | 56 | | 2 | | 2 | | | Requip | | | 268 | | 156 | | 74 | | 72 | | 176 | | > 100 | | > 100 | | 81 | | 21 | | 19 | | 11 | | 25 | | 38 | |
|
|
|
|
|
|
|
|
|
|
|
|
|
|
|
|
|
|
|
|
|
|
|
|
|
|
|
| | | Anti-virals | 14 | | 2,827 | | 2,598 | | 10 | | 9 | | 1,354 | | 7 | | 5 | | 855 | | 11 | | 11 | | 618 | | 16 | | 14 | | | HIV | | | 1,515 | | 1,554 | | (1 | ) | (3 | ) | 700 | | (7 | ) | (9 | ) | 621 | | 3 | | 2 | | 194 | | 8 | | 7 | | | Combivir | | | 528 | | 583 | | (9 | ) | (9 | ) | 238 | | (14 | ) | (16 | ) | 217 | | (4 | ) | (4 | ) | 73 | | – | | – | | | Trizivir | | | 268 | | 303 | | (11 | ) | (12 | ) | 141 | | (13 | ) | (15 | ) | 113 | | (7 | ) | (8 | ) | 14 | | (7 | ) | – | | | Epivir | | | 202 | | 261 | | (21 | ) | (23 | ) | 69 | | (25 | ) | (26 | ) | 90 | | (26 | ) | (26 | ) | 43 | | (2 | ) | (7 | ) | | Ziagen | | | 117 | | 136 | | (13 | ) | (14 | ) | 48 | | (11 | ) | (13 | ) | 41 | | (24 | ) | (24 | ) | 28 | | 4 | | 4 | | | Agenerase, Lexiva | | | 131 | | 112 | | 18 | | 17 | | 74 | | 7 | | 6 | | 48 | | 40 | | 37 | | 9 | | 14 | | 29 | | | Epzicom/Kivexa | | | 241 | | 118 | | > 100 | | > 100 | | 125 | | 49 | | 47 | | 97 | | > 100 | | > 100 | | 19 | | > 100 | | > 100 | | | | | | | | | | | | | | | | | | | | | | | | | | | | | | | | | Herpes | | | 965 | | 826 | | 19 | | 17 | | 610 | | 30 | | 28 | | 144 | | 4 | | 4 | | 211 | | 3 | | – | | | Valtrex | | | 845 | | 695 | | 24 | | 22 | | 600 | | 30 | | 28 | | 109 | | 12 | | 11 | | 136 | | 10 | | 7 | | | Zovirax | | | 120 | | 131 | | (6 | ) | (8 | ) | 10 | | 67 | | 67 | | 35 | | (15 | ) | (15 | ) | 75 | | (7 | ) | (11 | ) | | | | | | | | | | | | | | | | | | | | | | | | | | | | | | | | Zeffix | | | 162 | | 145 | | 12 | | 12 | | 13 | | 8 | | 8 | | 23 | | 10 | | 10 | | 126 | | 13 | | 13 | | | Relenza | | | 91 | | 5 | | > 100 | | > 100 | | – | | – | | – | | 62 | | > 100 | | > 100 | | 29 | | > 100 | | > 100 | |
|
|
|
|
|
|
|
|
|
|
|
|
|
|
|
|
|
|
|
|
|
|
|
|
|
|
|
| | | Metabolic | 8 | | 1,875 | | 1,495 | | 27 | | 25 | | 1,277 | | 30 | | 28 | | 252 | | 33 | | 33 | | 346 | | 12 | | 12 | | | Avandia | | | 1,399 | | 1,154 | | 23 | | 21 | | 1,068 | | 26 | | 24 | | 125 | | 13 | | 12 | | 206 | | 13 | | 16 | | | Avandamet | | | 204 | | 175 | | 17 | | 17 | | 86 | | (22 | ) | (24 | ) | 92 | | > 100 | | > 100 | | 26 | | 41 | | 53 | | | Avandaryl | | | 42 | | – | | – | | – | | 40 | | – | | – | | – | | – | | – | | 2 | | – | | – | | | Bonviva/Boniva | | | 95 | | 18 | | > 100 | | > 100 | | 83 | | > 100 | | > 100 | | 12 | | > 100 | | > 100 | | – | | – | | – | |
|
|
|
|
|
|
|
|
|
|
|
|
|
|
|
|
|
|
|
|
|
|
|
|
|
|
|
| | | Vaccines | 8 | | 1,692 | | 1,389 | | 23 | | 22 | | 465 | | 40 | | 38 | | 709 | | 20 | | 20 | | 518 | | 13 | | 13 | | | Hepatitis | | | 479 | | 444 | | 9 | | 8 | | 161 | | 21 | | 18 | | 227 | | 2 | | 2 | | 91 | | 8 | | 10 | | | Infanrix, Pediarix | | | 511 | | 431 | | 29 | | 28 | | 172 | | 20 | | 18 | | 281 | | 40 | | 39 | | 58 | | 12 | | 12 | | | Boostrix | | | 60 | | 29 | | > 100 | | > 100 | | 41 | | > 100 | | > 100 | | 15 | | 88 | | 88 | | 4 | | 67 | | 33 | |
|
|
|
|
|
|
|
|
|
|
|
|
|
|
|
|
|
|
|
|
|
|
|
|
|
|
|
| | | Cardiovascular and | | | | | | | | | | | | | | | | | | | | | | | | | | | | | | urogenital | 7 | | 1,636 | | 1,331 | | 24 | | 23 | | 1,072 | | 42 | | 40 | | 395 | | (4 | ) | (5 | ) | 169 | | 13 | | 13 | | | Coreg | | | 779 | | 573 | | 38 | | 36 | | 773 | | 38 | | 36 | | – | | – | | – | | 6 | | 20 | | 20 | | | Levitra | | | 43 | | 40 | | 8 | | 8 | | 41 | | 20 | | 17 | | 1 | | (75 | ) | (75 | ) | 1 | | – | | – | | | Avodart | | | 216 | | 129 | | 69 | | 67 | | 131 | | > 100 | | > 100 | | 69 | | 25 | | 25 | | 16 | | 67 | | 78 | | | Arixtra | | | 58 | | 24 | | > 100 | | > 100 | | 32 | | > 100 | | > 100 | | 23 | | > 100 | | > 100 | | 3 | | > 100 | | > 100 | | | Fraxiparine | | | 209 | | 211 | | (1 | ) | (1 | ) | – | | – | | – | | 179 | | – | | – | | 30 | | (6 | ) | (6 | ) |
|
|
|
|
|
|
|
|
|
|
|
|
|
|
|
|
|
|
|
|
|
|
|
|
|
|
|
| | | Anti-bacterials | 8 | | 1,369 | | 1,519 | | (9 | ) | (10 | ) | 217 | | (15 | ) | (17 | ) | 628 | | (12 | ) | (13 | ) | 524 | | (2 | ) | (3 | ) | | Augmentin | | | 570 | | 666 | | (14 | ) | (14 | ) | 94 | | (31 | ) | (32 | ) | 268 | | (15 | ) | (15 | ) | 208 | | – | | (1 | ) | | Zinnat/Ceftin | | | 164 | | 197 | | (16 | ) | (17 | ) | 12 | | 20 | | 20 | | 82 | | (27 | ) | (27 | ) | 70 | | (5 | ) | (7 | ) |
|
|
|
|
|
|
|
|
|
|
|
|
|
|
|
|
|
|
|
|
|
|
|
|
|
|
|
| | | Oncology & emesis | 5 | | 1,069 | | 1,016 | | 7 | | 5 | | 836 | | 12 | | 10 | | 153 | | (7 | ) | (7 | ) | 80 | | (11 | ) | (12 | ) | | Zofran | | | 847 | | 837 | | 3 | | 1 | | 679 | | 8 | | 6 | | 107 | | (14 | ) | (14 | ) | 61 | | (16 | ) | (18 | ) | | Hycamtin | | | 113 | | 99 | | 15 | | 14 | | 72 | | 11 | | 9 | | 34 | | 26 | | 26 | | 7 | | 17 | | 17 | |
|
|
|
|
|
|
|
|
|
|
|
|
|
|
|
|
|
|
|
|
|
|
|
|
|
|
|
| | | Other | 6 | | 973 | | 1,040 | | (5 | ) | (6 | ) | 83 | | 19 | | 19 | | 263 | | (19 | ) | (18 | ) | 627 | | (1 | ) | (3 | ) | | Zantac | | | 232 | | 244 | | (2 | ) | (5 | ) | 72 | | 28 | | 24 | | 52 | | (19 | ) | (19 | ) | 108 | | (7 | ) | (11 | ) |
|
|
|
|
|
|
|
|
|
|
|
|
|
|
|
|
|
|
|
|
|
|
|
|
|
|
|
| | | | 100 | | 20,078 | | 18,661 | | 9 | | 8 | | 10,353 | | 16 | | 14 | | 5,547 | | 1 | | – | | 4,178 | | 6 | | 4 | |
|
|
|
|
|
|
|
|
|
|
|
|
|
|
|
|
|
|
|
|
|
|
|
|
|
|
|
| | | | | | | | | | | | | | | | | | | | | | | | | | | | | | | | | CER% represents growth at constant exchange rates. £% represents growth at actual exchange rates. Turnover by quarter is given in the Financial record on pages 168 to 171. | |
<Back to Contents | Financial review 2007 | | | | | | | Business review | | Financial review 20062007 | | continued |
Pharmaceutical turnover by therapeutic area 2007 | Total | | | | USA | | | | Europe | | | | International | |
|
|
|
|
|
|
|
| |
|
|
|
| |
|
|
|
| |
|
| | Therapeutic area/ | % of | 2007 | 2006 | | | | Growth | 2007 | | | | Growth | 2007 | | | | Growth | 2007 | | | | Growth | | major products | total | £m | £m | CER% | £% | £m | CER% | £% | £m | CER% | £% | £m | CER% | £% |
|
|
|
|
|
|
|
|
|
|
|
|
|
|
|
|
|
|
|
|
|
|
|
|
|
| | | Respiratory | 26 | 5,032 | 4,995 | | 5 | | 1 | | 2,377 | | 4 | | (3 | ) | 1,772 | | 4 | | 4 | | 883 | | 10 | | 5 | | | Seretide/Advair | | 3,499 | 3,313 | | 10 | | 6 | | 1,891 | | 9 | | 1 | | 1,236 | | 9 | | 9 | | 372 | | 23 | | 20 | | | Flixotide/Flovent | | 621 | 659 | | (1 | ) | (6 | ) | 284 | | 3 | | (5 | ) | 161 | | (8 | ) | (7 | ) | 176 | | (2 | ) | (6 | ) | | Serevent | | 269 | 291 | | (4 | ) | (8 | ) | 74 | | (7 | ) | (14 | ) | 134 | | (5 | ) | (4 | ) | 61 | | – | | (6 | ) | | Flixonase/Flonase | | 199 | 311 | | (34 | ) | (36 | ) | 72 | | (60 | ) | (61 | ) | 51 | | – | | – | | 76 | | 5 | | – | |
|
|
|
|
|
|
|
|
|
|
|
|
|
|
|
|
|
|
|
|
|
|
|
|
|
| | | Central nervous system | 17 | 3,348 | 3,642 | | (2 | ) | (8 | ) | 2,377 | | (1 | ) | (8 | ) | 513 | | (14 | ) | (14 | ) | 458 | | 6 | | – | | | Seroxat/Paxil | | 553 | 620 | | (6 | ) | (11 | ) | 143 | | (12 | ) | (18 | ) | 122 | | (19 | ) | (18 | ) | 288 | | 5 | | (3 | ) | | Paxil IR | | 400 | 448 | | (6 | ) | (11 | ) | 7 | | (63 | ) | (63 | ) | 122 | | (19 | ) | (18 | ) | 271 | | 4 | | (3 | ) | | Paxil CR | | 153 | 172 | | (4 | ) | (11 | ) | 136 | | (6 | ) | (13 | ) | – | | – | | – | | 17 | | 13 | | 6 | | | Wellbutrin | | 529 | 900 | | (37 | ) | (41 | ) | 512 | | (38 | ) | (42 | ) | 4 | | 100 | | 100 | | 13 | | (13 | ) | (19 | ) | | Wellbutrin IR, SR | | 75 | 102 | | (23 | ) | (26 | ) | 63 | | (26 | ) | (29 | ) | 2 | | – | | – | | 10 | | - | | (9 | ) | | Wellbutrin XL | | 454 | 798 | | (39 | ) | (43 | ) | 449 | | (39 | ) | (43 | ) | 2 | | – | | – | | 3 | | (40 | ) | (40 | ) | | Imigran/Imitrex | | 685 | 711 | | 3 | | (4 | ) | 558 | | 9 | | 1 | | 89 | | (25 | ) | (25 | ) | 38 | | (2 | ) | (10 | ) | | Lamictal | | 1,097 | 996 | | 18 | | 10 | | 892 | | 26 | | 17 | | 145 | | (18 | ) | (17 | ) | 60 | | 13 | | 7 | | | Requip | | 346 | 268 | | 36 | | 29 | | 238 | | 46 | | 35 | | 91 | | 11 | | 12 | | 17 | | 64 | | 55 | |
|
|
|
|
|
|
|
|
|
|
|
|
|
|
|
|
|
|
|
|
|
|
|
|
|
| | | Anti-virals | 16 | 3,028 | 2,827 | | 13 | | 7 | | 1,494 | | 19 | | 10 | | 870 | | 1 | | 2 | | 664 | | 13 | | 7 | | | HIV | | 1,442 | 1,515 | | (1 | ) | (5 | ) | 637 | | (2 | ) | (9 | ) | 612 | | (2 | ) | (1 | ) | 193 | | 5 | | (1 | ) | | Combivir | | 455 | 528 | | (10 | ) | (14 | ) | 195 | | (11 | ) | (18 | ) | 192 | | (12 | ) | (12 | ) | 68 | | (1 | ) | (7 | ) | | Trizivir | | 233 | 268 | | (9 | ) | (13 | ) | 120 | | (8 | ) | (15 | ) | 99 | | (13 | ) | (12 | ) | 14 | | 7 | | – | | | Epivir | | 156 | 202 | | (20 | ) | (23 | ) | 53 | | (16 | ) | (23 | ) | 67 | | (26 | ) | (26 | ) | 36 | | (14 | ) | (16 | ) | | Ziagen | | 109 | 117 | | (3 | ) | (7 | ) | 45 | | 2 | | (6 | ) | 37 | | (10 | ) | (10 | ) | 27 | | (4 | ) | (4 | ) | | Agenerase, Lexiva | | 141 | 131 | | 13 | | 8 | | 78 | | 14 | | 5 | | 53 | | 10 | | 10 | | 10 | | 22 | | 11 | | | Epzicom/Kivexa | | 324 | 241 | | 39 | | 34 | | 142 | | 23 | | 14 | | 149 | | 54 | | 54 | | 33 | | 74 | | 74 | | | Herpes | | 1,041 | 965 | | 15 | | 8 | | 678 | | 20 | | 11 | | 151 | | 4 | | 5 | | 212 | | 6 | | – | | | Valtrex | | 934 | 845 | | 18 | | 11 | | 668 | | 20 | | 11 | | 120 | | 9 | | 10 | | 146 | | 13 | | 7 | | | Zovirax | | 107 | 120 | | (8 | ) | (11 | ) | 10 | | – | | – | | 31 | | (11 | ) | (11 | ) | 66 | | (7 | ) | (12 | ) | | Zeffix | | 168 | 162 | | 8 | | 4 | | 13 | | 8 | | – | | 24 | | 4 | | 4 | | 131 | | 9 | | 4 | | | Relenza | | 262 | 91 | | >100 | | >100 | | 131 | | – | | – | | 76 | | 21 | | 23 | | 55 | | >100 | | 90 | |
|
|
|
|
|
|
|
|
|
|
|
|
|
|
|
|
|
|
|
|
|
|
|
|
|
| | | Metabolic | 8 | 1,514 | 1,875 | | (15 | ) | (19 | ) | 895 | | (24 | ) | (30 | ) | 294 | | 15 | | 17 | | 325 | | (2 | ) | (6 | ) | | Avandia | | 877 | 1,399 | | (34 | ) | (37 | ) | 592 | | (40 | ) | (45 | ) | 113 | | (10 | ) | (10 | ) | 172 | | (14 | ) | (17 | ) | | Avandamet | | 292 | 204 | | 49 | | 43 | | 147 | | 85 | | 71 | | 111 | | 20 | | 21 | | 34 | | 35 | | 31 | | | Avandaryl | | 50 | 42 | | 26 | | 19 | | 41 | | 10 | | 3 | | 3 | | – | | – | | 6 | | >100 | | >100 | | | Bonviva/Boniva | | 161 | 95 | | 79 | | 69 | | 115 | | 49 | | 39 | | 45 | | >100 | | >100 | | 1 | | – | | – | |
|
|
|
|
|
|
|
|
|
|
|
|
|
|
|
|
|
|
|
|
|
|
|
|
|
| | | Vaccines | 10 | 1,993 | 1,692 | | 20 | | 18 | | 628 | | 44 | | 35 | | 814 | | 14 | | 15 | | 551 | | 8 | | 6 | | | Hepatitis | | 529 | 479 | | 14 | | 10 | | 199 | | 33 | | 24 | | 235 | | 3 | | 4 | | 95 | | 8 | | 4 | | | Influenza | | 320 | 170 | | 93 | | 88 | | 193 | | >100 | | >100 | | 93 | | >100 | | >100 | | 34 | | (19 | ) | (21 | ) | | Infanrix, Pediarix | | 543 | 511 | | 9 | | 6 | | 196 | | 23 | | 14 | | 275 | | (3 | ) | (2 | ) | 72 | | 26 | | 24 | | | Boostrix | | 66 | 60 | | 15 | | 10 | | 40 | | 5 | | (2 | ) | 19 | | 27 | | 27 | | 7 | | 75 | | 75 | | | Rotarix | | 91 | 44 | | >100 | | >100 | | – | | – | | – | | 23 | | >100 | | >100 | | 68 | | 79 | | 74 | | | Cervarix | | 10 | – | | – | | – | | – | | – | | – | | 9 | | – | | – | | 1 | | – | | – | |
|
|
|
|
|
|
|
|
|
|
|
|
|
|
|
|
|
|
|
|
|
|
|
|
|
| | | Cardiovascular and urogenital | 8 | 1,554 | 1,636 | | – | | (5 | ) | 970 | | (2 | ) | (10 | ) | 412 | | 3 | | 4 | | 172 | | 7 | | 2 | | | Coreg | | 587 | 779 | | (18 | ) | (25 | ) | 581 | | (19 | ) | (25 | ) | – | | – | | – | | 6 | | 17 | | – | | | Levitra | | 49 | 43 | | 23 | | 14 | | 47 | | 24 | | 15 | | 2 | | 100 | | 100 | | – | | – | | – | | | Avodart | | 285 | 216 | | 38 | | 32 | | 175 | | 44 | | 34 | | 86 | | 23 | | 25 | | 24 | | 56 | | 50 | | | Arixtra | | 100 | 58 | | 81 | | 72 | | 55 | | 88 | | 72 | | 39 | | 70 | | 70 | | 6 | | 100 | | 100 | | | Fraxiparine | | 184 | 209 | | (12 | ) | (12 | ) | – | | – | | – | | 160 | | (12 | ) | (11 | ) | 24 | | (17 | ) | (20 | ) | | Vesicare | | 50 | 32 | | 69 | | 56 | | 50 | | 69 | | 56 | | – | | – | | – | | – | | – | | – | |
|
|
|
|
|
|
|
|
|
|
|
|
|
|
|
|
|
|
|
|
|
|
|
|
|
| | | Anti-bacterials | 7 | 1,330 | 1,369 | | (1 | ) | (3 | ) | 195 | | (3 | ) | (10 | ) | 612 | | (3 | ) | (3 | ) | 523 | | 3 | | – | | | Augmentin | | 530 | 570 | | (6 | ) | (7 | ) | 67 | | (23 | ) | (29 | ) | 250 | | (7 | ) | (7 | ) | 213 | | 5 | | 2 | |
|
|
|
|
|
|
|
|
|
|
|
|
|
|
|
|
|
|
|
|
|
|
|
|
|
| | | Oncology and emesis | 2 | 477 | 1,069 | | (54 | ) | (55 | ) | 272 | | (65 | ) | (67 | ) | 139 | | (10 | ) | (9 | ) | 66 | | (14 | ) | (18 | ) | | Zofran | | 196 | 847 | | (77 | ) | (77 | ) | 78 | | (88 | ) | (89 | ) | 71 | | (34 | ) | (34 | ) | 47 | | (21 | ) | (23 | ) | | Hycamtin | | 119 | 113 | | 10 | | 5 | | 70 | | 6 | | (3 | ) | 42 | | 21 | | 24 | | 7 | | – | | – | | | Tykerb | | 51 | – | | – | | – | | 36 | | – | | – | | 13 | | – | | – | | 2 | | – | | – | |
|
|
|
|
|
|
|
|
|
|
|
|
|
|
|
|
|
|
|
|
|
|
|
|
|
| | | Other | 6 | 957 | 973 | | 1 | | (2 | ) | 65 | | (18 | ) | (22 | ) | 266 | | – | | 1 | | 626 | | 4 | | – | | | Zantac | | 168 | 232 | | (24 | ) | (28 | ) | 33 | | (51 | ) | (54 | ) | 42 | | (19 | ) | (19 | ) | 93 | | (8 | ) | (14 | ) |
|
|
|
|
|
|
|
|
|
|
|
|
|
|
|
|
|
|
|
|
|
|
|
|
|
| | | | 100 | 19,233 | 20,078 | | – | | (4 | ) | 9,273 | | (3 | ) | (10 | ) | 5,692 | | 2 | | 3 | | 4,268 | | 6 | | 2 | |
|
|
|
|
|
|
|
|
|
|
|
|
|
|
|
|
|
|
|
|
|
|
|
|
|
| |
CER% represents growth at constant exchange rates. £% represents growth at actual exchange rates. Turnover by quarter is given in the Financial record on pages 162 to 165. | GSK Annual Report 2007 | 37 | | |
Back to Contents | | | REPORT OF THE DIRECTORS | | Financial review 2007 | | | | | | Business review | | Financial review 2007 | | continued | | |
Vaccines
Overall vaccine sales increased 23% to £1.7 billion, with good performances from all regions: US sales rose 40% to £465 million; European sales grew 20% to £709 million and sales in International were up 13% to £518 million. Key contributors were:Infanrix/Pediarix, GSK’s combination vaccines for children, with sales up 29% to £511 million; and sales of hepatitis vaccines, which grew 9% to £479£543 million, benefiting from a strongagain driven by US performancegrowth ofHavrix, following approval last year for broader paediatric use.
23%. Sales of the new vaccines also helped drive overall sales growth. Total sales oftwo-dose vaccine,Rotarix, forto prevent rotavirusBoostrix, for prevention of diphtheria, tetanus gastroenteritis, doubled to £91 million, with strong growth in both Europe and whooping cough, and influenza vaccines,Fluarix/FluLaval, reached £274 million, up 91%. This was the first full year sales ofFluLavalfollowing the acquisition of ID Biomedical in late 2005. Oncology and emesis
International. Sales ofZofranCervarixgrew 3%, GSK’s vaccine to £847 million, driven by the US market, up 8% to £679prevent cervical cancer, were £10 million. EuropeIt has been approved in over 50 countries and Internationallicensing applications have been submitted in 28 countries including Japan. GSK’s pre-pandemic influenza vaccine achieved sales declined 14% and 16% respectively due to generic competition. A generic competitor toZofranentered the US market in November 2006.of £146 million. Discussions regarding further orders continue with a number of governments.
Cardiovascular and urogenital
Sales ofCoreg, for heart disease, grew 38%fell 18% to £779£587 million, following the introduction of US generic competition toCoreg IR in September. Sales ofCoreg CR, which was launched in March 2007, were £88 million.Avodart, for benign prostatic hyperplasia (enlarged prostate), had a very strong year,continued to perform strongly with sales increasing 69%up 38% to £216£285 million. Positive data from the CombAT study, (assessing use ofAvodart and the alpha-blocker, tamsulosin, as combination therapy), were recently published in the Journal of Urology. GSK has filed for a co-prescription indication in the USA, Europe and some International markets. A response is expected from the FDA during the second quarter of 2008. Anti-bacterials
Anti-bacterial sales declined 9%1% to £1,330 million reflecting generic competition in all regions. Oncology and a weaker ‘flu season.emesis
Tykerb achieved sales of £51 million in its first year, £36 million of which arose in the USA following its launch in March. Sales ofZofran declined 77% to £196 million, reflecting generic competition in the USA, Europe and International where sales declined 88%, 34% and 21% respectively. Other therapeutic areas
Sales ofZantacfell 2%24% to £232£168 million, with declines in Europe and International partially offset by a 28% growth in the USA ..all regions. Regional analysis Pharmaceutical turnover by geographic region in 20062007 on an invoiced basis
The turnover reported in the table below represents sales invoiced by GSK’s local entity to its customers in the local market plus co-promotion income within each market. | | | | | | | | Growth* | | | | | % of | | 2006 | | 2005 | |
|
|
| | | | Region/major markets | total | | £m | | £m | | CER% | | £% | | | | Region/ | | % of | 2007 | 2006 | | Growth* | | | major markets | | total | £m | £m | | CER% | | £% | |
|
|
|
| |
|
|
| | | USA | 52 | | 10,353 | | 9,106 | | 16 | | 14 | | 48 | 9,273 | 10,353 | | (3 | ) | (10 | ) |
|
|
|
| |
|
|
| | | Europe | 27 | | 5,547 | | 5,537 | | 1 | | – | | 30 | 5,692 | 5,547 | | 2 | | 3 | | | France | | | 967 | | 975 | | – | | (1 | ) | | 991 | 967 | | 2 | | 2 | | | UK | | | 788 | | 762 | | 3 | | 3 | | | 822 | 786 | | 5 | | 5 | | | Italy | | | 665 | | 662 | | 1 | | – | | | 620 | 664 | | (7 | ) | (7 | ) | | Germany | | | 595 | | 554 | | 8 | | 7 | | | 602 | 592 | | 1 | | 2 | | | Spain | | | 577 | | 586 | | (1 | ) | (2 | ) | | 605 | 577 | | 4 | | 5 | | | Other Europe | | | 1,955 | | 1,998 | | (2 | ) | (2 | ) | | 2,052 | 1,961 | | 4 | | 5 | |
|
|
|
| |
|
|
| | | International | 21 | | 4,178 | | 4,018 | | 6 | | 4 | | 22 | 4,268 | 4,178 | | 6 | | 2 | | | Asia Pacific | | | 1,377 | | 1,324 | | 4 | | 4 | | | 1,441 | 1,377 | | 6 | | 5 | | | Japan | | | 860 | | 854 | | 8 | | 1 | | | 867 | 860 | | 10 | | 1 | | | Middle East, Africa | | | 744 | | 746 | | 3 | | – | | | 774 | 744 | | 7 | | 4 | | | Latin America | | | 714 | | 651 | | 10 | | 10 | | | 709 | 714 | | 4 | | (1 | ) | | Canada | | | 483 | | 443 | | 4 | | 9 | | | 477 | 483 | | 2 | | (1 | ) |
|
|
|
| |
|
|
| | | | 100 | | 20,078 | | 18,661 | | 9 | | 8 | | 100 | 19,233 | 20,078 | | 0 | | (4 | ) |
|
|
|
| |
|
|
| | | | | | | | | | * CER% represents growth at constant exchange rates. £% represents growth at actual exchange rates. | | |
| * | CER% represents growth at constant exchange rates. £% represents growth at actual exchange rates. |
| Sales and constant exchange rate growth by region | 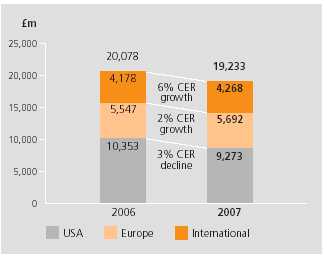 |
Individual governments determine the pricing of medicines in most countries within Europe, which can result in wide price variations for the same product. Parallel trade occurs when third parties exploit this price differential by purchasing products in markets where low prices are enforced and selling them to governments and other purchasers in those markets where higher prices have been agreed. This parallel trade is permitted under the single market rules in the European Union. GSK does not derive any benefit from the profit on resale at the higher price. As a result, management believes that within the European region, turnover by market, on an invoiced basis as presented above, does not properly represent the consumption of the products within each market. GSK employees based in each market are instrumental in the promotion of the Group’s products within their market, thereby creating a product sale and final consumption in that market. The following table gives the adjustments made in order to restate the turnover for markets within Europe on a turnover created basis. Pharmaceutical turnover for Europe region in 20062007 on a turnover created basis | | 2006 | | 2005 | | | 2007 | | 2006 | | | |
|
|
| |
|
|
| |
| |
| | | | Invoiced | | Adjustment | | Created | | Invoiced | | Adjustment | | Created | | | | Region/major markets | £m | | £m | | £m | | £m | | £m | | £m | | | | Region/ | | Invoiced | Adjustment | | Created | | Invoiced | Adjustment | | Created | | | major markets | | £m | | £m | | £m | | £m | |
|
|
|
|
|
| |
| | | Europe | 5,547 | | – | | 5,547 | | 5,537 | | – | | 5,537 | | 5,692 | – | | 5,692 | | 5,547 | – | | 5,547 | | | France | 967 | | (66 | ) | 901 | | 975 | | (47 | ) | 928 | | 991 | (43 | ) | 948 | | 967 | (66 | ) | 901 | | | UK | 788 | | 101 | | 889 | | 762 | | 91 | | 853 | | 822 | 101 | | 923 | | 786 | 102 | | 888 | | | Italy | 665 | | (25 | ) | 640 | | 662 | | (13 | ) | 649 | | 620 | (14 | ) | 606 | | 664 | (25 | ) | 639 | | | Germany | 595 | | 71 | | 666 | | 554 | | 57 | | 611 | | 602 | 87 | | 689 | | 592 | 72 | | 664 | | | Spain | 577 | | (14 | ) | 563 | | 586 | | (15 | ) | 571 | | 605 | (12 | ) | 593 | | 577 | (14 | ) | 563 | | | Other Europe | 1,955 | | (67 | ) | 1,888 | | 1,998 | | (73 | ) | 1,925 | | 2,052 | (119 | ) | 1,933 | | 1,961 | (69 | ) | 1,892 | |
|
|
|
|
|
|
| |
| |
These adjustments are GSK’s estimates based on the most recent data from independent external sources, valued in Sterling at relevant exchange rates. Management believes that this turnover created basis of reporting turnover by market provides a better reflection of the performance of the businesses in each market within Europe. The total turnover for the Europe region is unaffected by this restatement. Parallel trade occurs occasionally elsewhere in the world, but it is not sufficiently material to affect significantly the turnover data by market presented on an invoiced basis.
| 38 |
| GSK Annual Report 20062007 | 33 | |
<Back to Contents | Financial review 2007 | | | | | | | Business review | | Financial review 20062007 | | continued |
| | |
Pharmaceutical turnover by geographic region in 20062007 on a turnover created basis
Turnover by market within Europe has been adjusted for the effects of parallel trade to show turnover on the basis of the country where the product is finally consumed, not where the product was sold by GSK. | | | | Growth | * | | | Region/ | % of | | 2006 | | 2005 | |
| | % of | 2007 | 2006 | | Growth* | | | major markets | total | | £m | | £m | | CER% | | £% | | total | £m | £m | | CER% | | £% | |
|
|
|
| |
| | | USA | 52 | | 10,353 | | 9,106 | | 16 | | 14 | | 48 | 9,273 | 10,353 | | (3 | ) | (10 | ) |
|
|
|
| |
| | | Europe | 27 | | 5,547 | | 5,537 | | 1 | | – | | 30 | 5,692 | 5,547 | | 2 | | 3 | | | France | | | 901 | | 928 | | (2 | ) | (3 | ) | | 948 | 901 | | 5 | | 5 | | | UK | | | 889 | | 853 | | 4 | | 4 | | | 923 | 888 | | 4 | | 4 | | | Italy | | | 640 | | 649 | | (1 | ) | (1 | ) | | 606 | 639 | | (6 | ) | (5 | ) | | Germany | | | 666 | | 611 | | 10 | | 9 | | | 689 | 664 | | 3 | | 4 | | | Spain | | | 563 | | 571 | | (1 | ) | (1 | ) | | 593 | 563 | | 5 | | 5 | | | Other Europe | | | 1,888 | | 1,925 | | (2 | ) | (2 | ) | | 1,933 | 1,892 | | 1 | | 2 | |
|
|
|
| |
| | | International | 21 | | 4,178 | | 4,018 | | 6 | | 4 | | 22 | 4,268 | 4,178 | | 6 | | 2 | | | Asia Pacific | | | 1,377 | | 1,324 | | 4 | | 4 | | | 1,441 | 1,377 | | 6 | | 5 | | | Japan | | | 860 | | 854 | | 8 | | 1 | | | 867 | 860 | | 10 | | 1 | | | Middle East, Africa | | | 744 | | 746 | | 3 | | – | | | 774 | 744 | | 7 | | 4 | | | Latin America | | | 714 | | 651 | | 10 | | 10 | | | 709 | 714 | | 4 | | (1 | ) | | Canada | | | 483 | | 443 | | 4 | | 9 | | | 477 | 483 | | 2 | | (1 | ) |
|
|
|
| |
| | | | 100 | | 20,078 | | 18,661 | | 9 | | 8 | | 100 | 19,233 | 20,078 | | – | | (4 | ) |
|
|
|
| |
| |
| * | CER% represents growth at constant exchange rates. £% represents growth at actual exchange rates. Turnover by quarter is given in the Financial record on pages 168162 to 171.165. |
USA
A strong sales performanceSales in the USA up 16%declined 3% to £10.4£9.3 billion, wasreflecting generic competition toWellbutrin,Zofran, Flonase andCoreg IR which declined 38%, 88%, 60% and 31% respectively and a decline in the main contributor to total pharmaceutical turnoversales ofAvandia products, partly offset by growth of 9% in 2006. Advairsales grew 13% to £1,870 million.ofFloventsales increased by 16%.FlonaseAdvair, indicated for the treatment of perennial rhinitis, declined 63% following the launch of a generic competitor in Q1 2006.anti-virals, vaccines,Lamictal andRequip.
Sales of theWellbutrinAvandiaproducts grew 24% to £882 million reflecting product group declined 29% following the performancepublication of an article in the New England Journal of Medicine in May, which suggested there may be a cardiovascular risk associated withWellbutrin XLAvandia,. Following clarification from the FDA in October, there is now a new once-daily product, which grew 25% to £793 million approved label forAvandia. TotalAdvair sales ofPaxilwere up 35%grew 9% to £175£1,891 million largely dueowing to the rectificationincreased use in the treatment of supply issues experienced in 2005 at the Cidra plant in Puerto Rico.COPD.
Sales in the anti-virals therapeutic area grew 7%19% to £1,494 million with herpes products up 20% and HIV products down 7% and herpes products up 30%2%. CompetitionWithin HIV, competition to older products,Combivirdown 14%11% andEpivirdown 25%16%, was partly offset by the growth of new productsEpzicom/Kivexaup 49%23% andLexivaup 7%14%.Valtrex, for herpes, grew 30%20% to £600m£668 million, driven by patients switching to suppression therapy. Sales of theAvandiaRelenzaproduct group increased, an anti-viral treatment for flu, were £131 million, primarily driven by 24% reflecting the re-supply of product following supply disruption at the Cidra plant in Puerto Rico in 2005 and price increases.one-off government orders for stockpiling against a possible flu pandemic. Vaccines grew 40%44% to £628 million reflecting the good performance of the Hepatitis family of products,PediarixandBoostrix,FluarixFluarix/Flulavaland the launch ofFlulavalBoostrix. Sales ofLamictal, for the treatment of epilepsy and bipolar disorder, grew 26% to £892 million, benefiting from its new indication to treat one of the most serious forms of epilepsy – primary generalised tonic-clonic seizures. Sales ofRequip, for Parkinson’s disease and Restless Legs Syndrome (RLS), grew 46% to £238 million following launch of the RLS indication in 2006. Coregsales increased 38% to £773 million as it continued to benefit from its wide range of indications in heart disease.Zofransales increased 8% to £679 million. A generic competitor toZofranentered the market in November 2006.
Anti-bacterial sales declined 15% as a result of generic competition.
Europe
The discussion of individual market performance in the Europe region is on a turnover created basis. Sales in Europe contributed 27%30% of pharmaceutical turnover and grew 1%,2% to over £5.5£5.7 billion, with strong sales fromofSeretide,Avandia/Avandametand vaccines offsetting the impact of generic competition to a number of products and continued price cuts resulting from government healthcare reforms. MarketsAll major markets recorded growth with the exception of Italy, which recorded good growth included Germany, the UK, Central and South/East Europe whilst growth in France, the Netherlands, Poland, Italy and Spain was adversely impacted by pricing restrictions and generics.
generic competition. Major growth drivers wereSeretide, GSK’s largest selling product in Europe, with growth of 10%,Avandia/Avandametwhich grew 39%9%, and the vaccines franchise, up 20%14%. Sales of anti-virals grew 11% primarily due to government orders ofRelenzaas a measure in the event of a potential ‘flu pandemic. Generic competition negativelyadversely impacted sales ofSeroxat, down 20%19%,Lamictal, down 22%18%,Zofran, down 14%34% andImigran, down 18%25%. Sales of anti-bacterials decreased 12%3% due to a combination of a weaker ‘flu season than in 20052006 and generic competition. Sales ofAvandia/Avandamet grew 4%. International
The International region reported year on year turnover growth of 6%. Strong growth inFaster growing markets included Japan, up 8% (despite the biennial price reductions)10%, China/Hong Kong,China, up 24% and Middle East/Africa, up 7% and Latin America, up 10%, while there was partly offset bymore modest sales growth of 2% in Canada, 3% in Australia and 4% in Canada and 3% in Australia.Latin America. The Canadian sales performance reflected lower sales ofAvandia and generic competition forImigranandZofranwhilst the Australian business was negativelyadversely impacted by Governmentgovernment pricing reforms and generic competition tolower government orders forLamictalandPaxilRelenza. The good performance in Japan was driven by the saleslaunch in the year ofPaxilAdoair, up 15%,Serevent, up 16% and Anti-virals, up 8% and the full year impact ofstrong demand forZyrtecRelenza., an allergy product in-licenced from UCB in 2005. These were partially offset by declines in the older productsZantacandZovirax.Flonasealso declined due to a low pollen season. Across allthe remaining markets in International, the key products driving growth wereSeretide, which grew 9%23% to record sales of £310£372 million, theAvandiaValtrexrange of products which grew 17%13% to £234£146 million, HIV products which grew 8% and the vaccines franchise, which recorded growth of 13%8% and achieved sales of £518£551 million, and the HIV products which grew 5% to £193 million. TheAvandia range of products declined 7% to £212 million, with declines in Canada and Korea, partly offset by growth in Australia. Consumer Healthcare sales An analysis of Consumer Healthcare sales is set out in the following table: | | 2007 | 2006 | | Growth | | | | £m | £m | | CER% | | £% | |
|
|
|
|
|
|
| | | OTC medicines | 1,718 | 1,496 | | 20 | | 15 | | | Analgesics | 410 | 380 | | 11 | | 8 | | | Dermatological | 175 | 165 | | 10 | | 6 | | | Gastro-intestinal | 262 | 252 | | 9 | | 4 | | | Respiratory tract | 244 | 172 | | 45 | | 42 | | | Smoking control | 314 | 353 | | (6 | ) | (11 | ) | | Natural wellness support | 125 | 132 | | (3 | ) | (5 | ) | | Weight management | 150 | – | | – | | – | | | Oral care | 1,049 | 993 | | 8 | | 6 | | | Nutritional healthcare | 716 | 658 | | 9 | | 9 | |
|
|
|
|
|
|
| | | | 3,483 | 3,147 | | 14 | | 11 | |
|
|
|
|
|
|
| |
| GSK Annual Report 2007 | 39 | | |
Back to Contents | | | REPORT OF THE DIRECTORS | | Financialreview 2007 | | | | | | Business review | | Financial review 2007 | | continued | |
OTC medicines
Over-the-counter medicine sales grew 20% to £1.7 billion, withPanadol up 14% to £262 million andalli sales of £150 million since launch in the USA in June. Smoking control products declined 6% to £314 million due to strong competition in the US market.Breathe Right andFiberChoice, added to the portfolio with the acquisition of CNS in December 2006, achieved combined sales of £81 million. Oral care
Oral care sales grew 8% to over £1 billion. Sales ofAquafresh were up 12% to £308 million, helped by the success of the newAquafresh White Trays.Sensodyne also grew strongly, up 16% for the year to £293 million, driven by a successful launch ofSensodyne ProNamel. Nutritional healthcare
Nutritional healthcare product sales grew 9% to £716 million.Lucozade grew 16% to £347 million, andHorlicks grew 12% to £174 million.Ribena sales were down 7% to £156 million. Operating profit – total results Total results include restructuring costs related to the new Operational Excellence programme, which commenced in October 2007. | | | | 2007 | | | | 2006 | | | | Growth | | | |
|
|
| |
|
|
| |
|
|
| | | | £m | | % | | £m | | % | | CER% | | £% | |
|
|
|
|
|
|
|
|
|
|
|
| | | Turnover | 22,716 | | 100.0 | | 23,225 | | 100.0 | | 2 | | (2 | ) |
|
|
|
|
|
|
|
|
|
|
|
| | | Cost of sales | (5,317 | ) | (23.4 | ) | (5,010 | ) | (21.6 | ) | 8 | | 6 | | Selling, general and administration | (6,954 | ) | (30.6 | ) | (7,257 | ) | (31.2 | ) | – | | (4 | ) | Research and development | (3,327 | ) | (14.7 | ) | (3,457 | ) | (14.9 | ) | (1 | ) | (4 | ) | | Other operating income | 475 | | 2.1 | | 307 | | 1.3 | | | | | |
|
|
|
|
|
|
|
|
|
|
|
| | | Operating profit | 7,593 | | 33.4 | | 7,808 | | 33.6 | | 3 | | (3 | ) |
|
|
|
|
|
|
|
|
|
|
|
| |
Cost of sales
Cost of sales as a percentage of turnover increased by 1.8 percentage points. At constant exchange rates, cost of sales as a percentage of turnover increased by 1.3 percentage points, reflecting charges related to the new Operational Excellence programme of £111 million (2006 – £nil) and unfavourable product and regional mixes compared with 2006. Selling, general and administration
Selling, general and administration (SG&A) costs as a percentage of turnover reduced 0.6 percentage points. At constant exchange rates, the decrease was 0.7 percentage points, reflecting flat expenditure compared with the prior year on a turnover growth of 2%. SG&A costs included charges related to the new Operational Excellence programme of £137 million (2006 – £nil). Advertising and promotion increased by 2%, selling and distribution increased by 2%, and general and administration expenditure declined 5%. Research and development
R&D expenditure declined 1% and included charges related to the new Operational Excellence programme of £90 million (2006 – £nil). The benefit arose from lower impairment charges and the winding-down of previous restructuring activities. Excluding these items, R&D expenditure declined 2% on last year. Pharmaceutical R&D expenditure represented 16.7% (2006 – 16.7%) of pharmaceutical turnover. Other operating income
Other operating income includes royalty income, equity investment disposals and impairments, product disposals and fair value adjustments to financial instruments. Other operating income was £475 million in 2007 (2006 – £307 million). The increase is primarily due to higher royalty income (£216 million in 2007 compared with £94 million in 2006), favourable fair value movements on financial instruments (£41 million in 2007 compared with £29 million in 2006), and the Roche litigation settlement relating to carvedilol, partially offset by lower asset disposal profits. Operating profit
Overall, the operating profit margin decreased 0.2 percentage points as operating profit decreased 3% in sterling terms to £7,593 million. Operating profit increased 3% at constant exchange rates and the CER margin increased 0.5 percentage points, reflecting flat SG&A expenditure and higher other operating income, partially offset by an increase in cost of sales. In the year, gains from asset disposals were £109 million (£169 million in 2006), costs for legal matters were £255 million (£333 million in 2006), fair value movements on financial instruments resulted in an income of £41 million (income of £29 million in 2006), charges related to old restructuring activity were £92 million (£205 million in 2006) and charges related to the new Operational Excellence programme were £338 million (2006 – £nil). The total operating profit impact of these items was a £535 million charge in 2007 (£340 million charge in 2006). Profit before taxation – total results Net finance costs | | 2007 | | 2006 | | | Finance income | £m | | £m | |
|
|
|
| | | Interest and other finance income | 255 | | 285 | | | Fair value adjustments and hedges | 7 | | 2 | |
|
|
|
| | | | 262 | | 287 | |
|
|
|
| | | | | | | | | Finance costs | | | | |
|
|
|
| | | Interest costs | (432 | ) | (314 | ) | | Unwinding of discount on liabilities | (27 | ) | (36 | ) | | Fair value adjustments and hedges | 6 | | (2 | ) |
|
|
|
| | | | (453 | ) | (352 | ) |
|
|
|
| |
Finance costs increased owing to increased levels of debt to finance the share buy-back programme.
| 40 |
| GSK Annual Report 20062007 | 34 | |
Back to Contents | Financial review 2007 | Business review | | | | | | | | Business review | Financial review 20062007 | | continued |
|
| | |
Consumer HealthcareShare of after tax profits of associates and joint ventures
The share of profits of associates arises principally from the Group’s holding in Quest Diagnostics Inc.
Profit before taxation – total results
Taking account of net finance costs and the contribution from associates, total profit before taxation was £7,452 million compared with £7,799 million in 2006, an increase of 2% at constant exchange rates, but a 4% sterling decline. Operational Excellence In October 2007, GSK announced a significant new £1.5 billion Operational Excellence programme to improve the effectiveness and productivity of its operations. This new programme is expected to deliver annual pre-tax savings of £700 million by 2010. GSK expects to realise the majority of annual savings within the first two years of the programme, with approximately £350 million expected by 2008 and £550 million by 2009. These savings will partly mitigate the expected impact to 2008 earnings from generic competition and lowerAvandia sales
An analysis and the associated adverse impact on GSK’s gross margin. One-off charges of Consumer Healthcare sales is set out£338 million before tax relating to the programme were recorded in Q4 2007. There were no significant acquisition-related restructuring costs incurred in 2006 or 2007. Because of the significance of this new programme, a columnar presentation has been adopted in the following table: | | | | | Growth | | | | 2006 | | 2005 | |
|
|
| | | | £m | | £m | | CER% | | £% | |
|
|
|
|
|
|
|
| | | OTC medicines | 1,496 | | 1,437 | | 5 | | 4 | | | Analgesics | 380 | | 362 | | 7 | | 5 | | | Dermatological | 165 | | 161 | | 4 | | 2 | | | Gastro-intestinal | 252 | | 249 | | 2 | | 1 | | | Respiratory tract | 172 | | 154 | | 12 | | 12 | | | Smoking control | 353 | | 336 | | 7 | | 5 | | | Natural wellness support | 132 | | 133 | | – | | (1 | ) | | Oral care | 993 | | 943 | | 6 | | 5 | | | Nutritional healthcare | 658 | | 619 | | 7 | | 6 | |
|
|
|
|
|
|
|
| | | | 3,147 | | 2,999 | | 6 | | 5 | |
|
|
|
|
|
|
|
| |
Consumer Healthcare sales grew 6%income statement in order to £3.1 billion, with sales in International up 10% and Europe up 7%, performing well. Total sales in the USA were flat, with an improvedillustrate GSK’s underlying performance in the fourth quarter, with sales up 7%.
OTC medicines
Over-the-counter medicine sales grew 5% to £1.5 billion withPanadoland smoking control performing well.
Oral care
Oral care sales grew 6% to £993 million.Sensodynegrew strongly, up 19% for the year to £257 million. Sales ofAquafreshwere down 3% to £283 million.
Nutritional healthcare
Nutritional healthcare products sales grew 7% to £658 million.Lucozade, grew 14% to £301 million, andHorlicks, grew 6% to £156 million.Ribenasales were down 1% to £169 million.
Operating profit
2007. The analysis below of operating profit and the subsequent discussion comparesexcludes restructuring costs related to the 2006 resultsnew Operational Excellence programme, which commenced in October 2007. Management believes that exclusion of these items provides a more useful reflection of the way in which the business is managed, and accordingly this supplemental information is provided in addition to that contained in the consolidated income statement on page 90 prepared in accordance with 2005 results.IFRS. | | 2006 | | 2005 | | Growth | | | |
| |
| |
| | | | £m | | % | | £m | | % | | CER% | | £% | |
|
|
|
|
|
|
|
|
|
|
|
| | | Turnover | 23,225 | | 100.0 | | 21,660 | | 100.0 | | 9 | | 7 | |
|
|
|
|
|
|
|
|
|
|
|
| | | Cost of sales | (5,010 | ) | (21.6 | ) | (4,764 | ) | (22.0 | ) | 6 | | 5 | | Selling, generaland administration | (7,257 | ) | (31.2 | ) | (7,250 | ) | (33.5 | ) | – | | – | | | Research anddevelopment | (3,457 | ) | (14.9 | ) | (3,136 | ) | (14.5 | ) | 11 | | 10 | | | Other operating income | 307 | | 1.3 | | 364 | | 1.7 | | | | | |
|
|
|
|
|
|
|
|
|
|
|
| | | Operating profit | 7,808 | | 33.6 | | 6,874 | | 31.7 | | 17 | | 14 | |
|
|
|
|
|
|
|
|
|
|
|
| |
Operating profit – business performance | | | | 2007 | | | | 2006 | | | | Growth | | |
|
|
| |
|
|
| |
|
|
| | | | £m | | % | | £m | | % | | CER% | | £% | |
|
|
|
|
|
|
|
|
|
|
|
| | | Turnover | 22,716 | | 100.0 | | 23,225 | | 100.0 | | 2 | | (2 | ) |
|
|
|
|
|
|
|
|
|
|
|
| | | Cost of sales | (5,206 | ) | (22.9 | ) | (5,010 | ) | (21.6 | ) | 6 | | 4 | | | Selling, general and administration | (6,817 | ) | (30.0 | ) | (7,257 | ) | (31.2 | ) | (2 | ) | (6 | ) | | Research and development | (3,237 | ) | (14.3 | ) | (3,457 | ) | (14.9 | ) | (3 | ) | (6 | ) | | Other operating income | 475 | | 2.1 | | 307 | | 1.3 | | | | | |
|
|
|
|
|
|
|
|
|
|
|
| | | Operating profit | 7,931 | | 34.9 | | 7,808 | | 33.6 | | 8 | | 2 | |
|
|
|
|
|
|
|
|
|
|
|
| |
Cost of sales
Cost of sales declined as a percentage of turnover increased by 0.41.3 percentage points. At constant exchange rates, the decline was 0.6cost of sales as a percentage of turnover increased by 0.8 percentage points, reflecting favourable priceunfavourable product and regional mix impact.mix. Selling, general and administration
Selling, general and administration (SG&A) costs as a percentage of turnover reduced 2.31.2 percentage points. Atpoints and at constant exchange rates, the decrease was 2.51.3 percentage points, reflecting flata 2% decline in expenditure compared with prior year on a turnover growth of 9%2%. SG&A costs were flatdown 2% due to higher advertising, promotionlower selling and selling expenditure offset by lower general and administration expenditure.expenditure partly offset by higher advertising and promotion. Advertising and promotion and selling increased 3%2% and accounted for less than a 2%1% increase in total SG&A. GeneralSelling and distribution declined 1% and general and administration expenditure declined 5% and7%. Collectively these items accounted for a 2% decline in total SG&A, of which one percentage point was due to lower charges related to legal matters and one percentage point was due to lower costs related to programmes to deliver future cost savings.matters. Research and development
R&D expenditure increased 11%decreased 3% partly as a result of higherlower impairment charges related toand the winding-down of previous restructuring programmes.activities. Excluding restructuring costs R&D grew 8%, broadly in-line with turnover. Pharmaceuticalsthese items, R&D expenditure excluding restructuring costs,was flat. Pharmaceutical R&D expenditure represented 16.2% (2005(2006 – 16.2%16.7%) of pharmaceutical turnover. Other operating income
Other operating income includes royalty income, equity investment disposals and impairments, product disposals and fair value adjustments to the Quest collar and Theravance options.financial instruments. Other operating income was £307£475 million in 2006 compared with £364 million in 2005.2007 (2006 – £307 million). The decreaseincrease is primarily due to lower producthigher royalty income (£216 million in 2007 compared with £94 million in 2006), favourable fair value movements on financial instruments (£41 million in 2007 compared with £29 million in 2006), and asset disposal profitsthe Roche litigation settlement relating to carvedilol, partially offset by the favourable fair value movement to the Quest collar and Theravance options.lower asset disposal profits. Operating profit
Overall,the operating profit margin increased 1.91.3 percentage points as operating profit increased 14%2% in sterling terms to £7,808£7,931 million. Operating profit increased 17%8% at constant exchange rates and the margin increased 2.42 percentage points, reflecting declines in SG&A growth below the rate ofand R&D expenditure on turnover growth partially offset byof 2%, and higher costs related to programmes to deliver future cost savings and lower other operating income. GainsIn the year, gains from asset disposals were £169£109 million (2005(2006 – £290£169 million), costs for legal matters were £255 million (2006 – £333 million (2005 – £430 million), the fair value movements on the Quest collar and Theravance optionsfinancial instruments resulted in an income of £29£41 million (2005(2006 – £19£29 million) and charges relatingrelated to cost-saving programmesold restructuring activity were £92 million (2006 – £205 million (2005 – £141 million).The total operating profit impact of these items was a £340£197 million charge in 2006, compared with a £262 million charge in 2005.2007 (2006 – £340 million).
Profit before taxation – business performance The discussion below compares the 2006 results with the 2005 results.Net finance costs
| | 2007 | | 2006 | | | Finance income | £m | | £m | |
|
|
|
| | | Interest and other income | 255 | | 285 | | | Fair value adjustments and hedges | 7 | | 2 | |
|
|
|
| | | | 262 | | 287 | |
|
|
|
| | | Finance costs | | | | |
|
|
|
| | | Interest costs | (432 | ) | (314 | ) | | Unwinding of discount on liabilities | (27 | ) | (36 | ) | | Fair value adjustments and hedges | 6 | | (2 | ) |
|
|
|
| | | | (453 | ) | (352 | ) |
|
|
|
| |
| GSK Annual Report 2007 | 41 | | |
Back to Contents | | | REPORT OF THE DIRECTORS | | Financial review 2007 | | | | | | Business review | | Financial review 2007 | | continued | |
Share of profits/(losses)after tax profits of associates and joint ventures and associated undertakings
The share of profits of associates arises principally from the Group’s holding in Quest Diagnostics Inc. DisposalProfit before taxation – business performance
Taking account of interest innet finance costs and the contribution from associates,
There were no disposals of interests in associates business performance profit before taxation was £7,790 million compared with £7,799 million in 2006, and 2005. The Group’s shareholdingan increase of 6% CER, but flat in Quest as at 31st December 2006 was 18.7% .sterling terms.
Taxation
<Back to Contents
| Business review | | Financial review 2006 | continued |
| |
| Net finance costs | | | | | | | 2006 | | 2005 | | | Finance income | £m | | £m | |
|
|
|
| | | Interest income | 285 | | 276 | | | Fair value adjustments and hedges | 2 | | (19 | ) |
|
|
|
| | | | 287 | | 257 | |
|
|
|
| | | Finance costs | | | | |
|
|
|
| | | Interest costs | (314 | ) | (427 | ) | | Unwinding of discount on liabilities | (36 | ) | (25 | ) | | Fair value adjustments and hedges | (2 | ) | 1 | |
|
|
|
| | | | (352 | ) | (451 | ) |
|
|
|
| |
Finance income increased compared with 2005 predominantly due to increased income on extended credit on receivables and increased interest income due to higher US dollar interest rates. Finance costs reduced due to the refinancing of two expensive bonds in December 2005 and January 2006 as well as lower swap costs resulting from reduced interest rate differentials.
| Taxation | | | | | 2006 | | 2005 | | 2007 | | 2006 | | | | £m | | £m | | £m | | £m | |
|
|
|
| |
| | | UK corporation tax | 400 | | 172 | | 452 | | 400 | | | Overseas taxation | 2,310 | | 1,847 | | 1,962 | | 2,310 | |
|
|
|
| |
| | | Current taxation | 2,710 | | 2,019 | | 2,414 | | 2,710 | | | Deferred taxation | (409 | ) | (103 | ) | (272 | ) | (409 | ) |
|
|
|
| |
| | | Total | 2,301 | | 1,916 | | |
|
|
|
| | 2,142 | | 2,301 | |
| |
| |
The charge for taxation on total profit amounting to £2,301£2,142 million, represents an effective tax rate of 29.5% (200528.7% (2006 – 29.5%) . The charge for taxation on business performance profit, amounting to £2,219 million, represents an effective tax rate of 28.5% (2006 – 29.5%) . The Group balance sheet at 31st December 20062007 included a tax payable liability of £621£826 million and a tax recoverable asset of £186£58 million. As reported last year, GSK’s largest unresolvedThe Group’s main open tax issues were withare in the US Internal Revenue Service (IRS)UK, USA, Canada and UK HM Revenue and Customs (HMRC) in respect of transfer prices related to the Glaxo heritage products.
On 11th September 2006, GSK and the IRS agreed to a resolution of their dispute. Under the agreement, GSK has made gross payments to the IRS of approximately $3.3 billion. The final net cash cost to the Group is approximately $3.1 billion, which covers federal, state and local taxes, interest and the benefit of tax relief on the payments made. The settlement resolved all the transfer pricing issues in dispute for the period 1989 – 2000, which were due to go to trial in February 2007, and also covers the subsequent years 2001 – 2005. GSK had previously made provision for the dispute and this settlement did not have any significant impact on the Group’s reported earnings or tax rate for the year.Japan.
GSK continues to be in dispute with HMRCHM Revenue & Customs (‘HMRC’) primarily in respect of transfer pricing and Controlled Foreign Companies legislation(‘CFC’) matters for the years 1994 to date and the parties are now preparing for litigation.date. HMRC hashave not formally quantified itsyet formalised claims in respect of these matters but thereand GSK is seeking to resolve them in discussions with HMRC. There continues, however, to be a wide difference between the Group and HMRC positions, onwhich may ultimately have to be settled by litigation. Following its audit of the period 2001 to 2003, the US Internal Revenue Service (‘IRS’) has in Notices of Proposed Adjustment challenged deductions arising from intercompany financing arrangements for those years, with which GSK disagrees and which it will vigorously contest. GSK estimates that the IRS claim for tax and interest at 31st December 2007, net of federal tax relief for these matters. years, is $680 million. GSK believes, supported by external professional advice, that this claim has open issuesno merit and that no adjustment is warranted. If, contrary to GSK’s view, the IRS prevailed in its argument before a court, GSK would expect to have an additional liability for the four year unaudited period 2004-2007 proportionate to its liability for the three year audited period 2001-2003. In the event that GSK is not able to resolve this issue with the IRS, a court decision would not be expected before 2010. Lower courts in Japan and Canada, which were the subject of court proceedings in 2006. In Japanhave upheld claims by the tax authorities are claiming approximatelyfor Yen 39 billion (£169177 million) relating to Japanese CFC legislation. GSK has paid and fully provided for the full tax but is pursuing a claim for refund to the Japanese Supreme Court. In Canada a court hearing in respect of transactions in 1998. GSK has paid the tax claimed, as required by law, and applied for a refund. A court decision is expected in late March 2007. A court decisiontransfer pricing in the Group’s dispute withearly 1990s was completed in July 2006. GSK is still awaiting the Canadian Revenue Authority over the pricing ofZantacin the years 1989 – 1993 is expected in the first half of 2007.court’s judgement.
GSK uses the best advice in determining its transfer pricing methodology and in seeking to manage transfer pricing and other taxation issues to a satisfactory conclusion and, on the basis of external professional advice, continues to believe that it has made adequate provision for the liabilities likely to arise from open assessments. The ultimate liability for such matters may vary from the amounts provided and is dependent upon the outcome of litigation proceedings and negotiations with the relevant tax authorities. | Profit for the year | | | | | | | | | | | | | | | | | | | Growth | | | | | 2006 | | | 2005 | |
|
|
| | | | | £m | | | £m | | CER% | | £% | |
|
|
|
|
|
|
|
|
|
| | | Profit after taxation for the year | | 5,498 | | | 4,816 | | 17 | | 14 | |
|
|
|
|
|
|
|
|
|
| | | Profit attributable to shareholders | | 5,389 | | | 4,689 | | 18 | | 15 | | | Earnings per share (pence) | | 95.5 | p | | 82.6 | p | 19 | | 16 | | | Earnings per ADS (US$) | $ | 3.53 | | $ | 3.00 | | | | | | | Weighted average number of shares (millions) | | 5,643 | | | 5,674 | | | | | |
|
|
|
|
|
|
|
|
|
| | | Diluted earnings per share (pence) | | 94.5 | p | | 82.0 | p | | | | | | Diluted earnings per ADS (US$) | $ | 3.50 | | $ | 2.98 | | | | | | | Weighted average number of shares (millions) | | 5,700 | | | 5,720 | | | | | |
|
|
|
|
|
|
|
|
|
| |
Profit for the year | | 2007 | | 2006 | | | Growth | | | | £m | | £m | | CER% | £% | |
|
|
|
|
|
|
| | | Total profit after taxation for the year | 5,310 | | 5,498 | | 3 | (3 | ) | | Total profit attributable to shareholders | 5,214 | | 5,389 | | 3 | (3 | ) | | Basic earnings per share (pence) | 94.4 | p | 95.5 | p | 5 | (1 | ) | | Basic earnings per ADS (US$) | $3.77 | | $3.53 | | | | |
|
|
|
|
|
|
| | | Business performance profit after taxation for the year | 5,571 | �� | 5,498 | | 8 | 1 | | | Business performance profit attributable to shareholders | 5,475 | | 5,389 | | 8 | 2 | | | Adjusted earnings per share (pence) | 99.1 | p | 95.5 | p | 10 | 4 | | | Adjusted earnings per ADS (US$) | $3.96 | | $3.53 | | | | | | Weighted average number of shares (millions) | 5,524 | | 5,643 | | | | |
|
|
|
|
|
|
| | | Diluted total earnings per share (pence) | 93.7 | p | 94.5 | p | | | | | Diluted total earnings per ADS (US$) | $3.75 | | $3.50 | | | | | | Weighted average number of shares (millions) | 5,567 | | 5,700 | | | | |
|
|
|
|
|
|
| |
Total results including restructuring costs related to the new Operational Excellence programme produced a basic EPS of 94.4p compared with 95.5p in 2006. This was a 5% increase in CER terms compared with 2006, but a 1% decline in sterling terms. Business performance profit for the year was £5,498£5,571 million, an increase of 17% (14%8% (1% in sterling terms). Profit attributable to minority interests was £109£96 million and profit attributable to shareholders was £5,389£5,475 million, an increase of 18% (15%8% (2% in sterling terms). Earnings perThe interest cost of the share buy-back programme adversely impacts the Group’s profits but benefits EPS. Business performance EPS increased 19%10%, reflecting higher profits and also the reduction in the weighted average number of shares resulting from the Group’s share buy-back programme. The interest cost of this programme also adversely impacts the Group’s earnings. At actual rates of exchange, earnings per share increased 16%4%. The unfavourable currency impact on EPS of threesix percentage points reflectsreflected a strengthening of Sterling against other major currenciesthe US dollar and comparescompared with a twofour percentage point unfavourable currency impact on turnover. Dividend
The Board has declared a fourth interim dividend of 1416 pence per share resulting in a dividend for the year of 4853 pence, a fourfive pence increase over the dividend of 4448 pence per share for 2005.2006. The equivalent fourth interim dividend receivable by ADR holders is 55.162862.7264 cents per ADS based on an exchange rate of £1/$1.9701.1.9602. The dividend had an ex-dividend date of 14thwill be 13th February 2007,2008, with a record date of 16th15th February 20072008 and will be paid on 12tha payment date of 10th April 2007. The liability for an interim dividend is only recognised when it is paid, which is usually after the accounting period to which it relates. The 2006 financial statements recognise the dividends paid in 2006, namely the third and fourth interim dividends for 2005 and the first and second interim dividends for 2006, which total £2,598 million (2005: £2,390 million).2008.
| 42 |
| GSK Annual Report 20062007 | 36 | |
<Back to Contents | Financial review 2007 | | | | | | | Business review | | Financial review 20062007 | | continued |
| | |
Critical accounting policies The consolidated ffinancialfinancial statements are prepared in accordance with International Financial Reporting Standards,IFRS, as adopted for use in the European Union, and also with IFRS as issued by the IASB, following the accounting policies approved by the Board and described in Note 2 to the financial statements, ‘Accounting policies’. Management is required to make estimates and assumptions that affect the amounts of assets, liabilities, revenue and expenses reported in the financial statements. Actual amounts and results could differ from those estimates. The following are considered to be the critical accounting policies adopted. Turnover
Revenue is recognised when title and risk of loss is passedadopted relate to the customerfollowing areas:
| • | Turnover | | | | • | Taxation | | | | • | Legal and other disputes | | | | • | Impairment of property, plant & equipment | | | | • | Intangible assets | | | | • | Pensions and other post-employment benefits |
Information on the judgements and reliable estimates can be made of relevant deductions. Gross turnoverin these areas is reduced by rebates, discounts, allowancesgiven in Note 3 to the financial statements, ‘Key accounting judgements and product returns given or expected to be given, which vary by product arrangements and buying groups. These arrangements with purchasing organisations are dependent upon the submission of claims some time after the initial recognitionestimates’. In respect of the sale. Accruals are made atTurnover accounting policy, the time of sale for the estimated rebates, discounts or allowances payable or returns to be made, based on available market information and historical experience. Because the amounts are estimated they may not fully reflect the final outcome, and the amounts are subject to change dependent upon, amongst other things, the types of buying group and product sales mix. The level of accrual is reviewed and adjusted regularly in the light of contractual and legal obligations, historical trends, past experience and projected market conditions. Market conditions are evaluated using wholesaler and other third-party analyses, market research data and internally generated information. Future events could cause the assumptions on which the accruals are based to change, which could affect the future results of the Group. The Group’s largest business is US pharmaceuticals, and the US market has the most complex arrangements for rebates, discounts and allowances. The following briefly describes the nature of the arrangements in existence in the Group’s US pharmaceuticals business.
| • | Customer rebates are offered to key managed care and group purchasing organisations (GPO) and other direct and indirect customers. These arrangements require the customer to achieve certain performance targets relating to value of product purchased, formulary status or pre-determined market shares relative to competitors. Rebates given under Medicare, Part D are included in this category. The Medicare, Part D programme was introduced during 2006 and replaces the Government Medicaid subsidies for some individuals with subsidised coverage provided through private prescription plans. The accrual for these rebates is estimated based on the specific terms in each agreement, historical experience and product growth rates. | | | • | GSK has arrangements with certain key parties,indirect customers whereby the partythecustomer is able to buy products from wholesalers at lowerreduced prices. A chargebackAchargeback represents the difference between the invoice price to the wholesalerthewholesaler and the indirect customer’s contractual discounted price.
Accruals for estimating chargebacks are calculated based on the termsof each agreement, historical experience and product growth rates. |
| | | • | Customer rebates are offered to key managed care and grouppurchasing organisations (GPO) and other direct and indirectcustomers. These arrangements require the customer to achievecertain performance targets relating to value of product purchased,formulary status or pre-determined market shares relative tocompetitors. Rebates given under Medicare, Part D are included inthis category. The Medicare, Part D programme was introduced in2006 and replaced the Government Medicaid subsidies for someindividuals with subsidised coverage provided through privateprescription plans. The accrual for these rebates is estimated basedon the specific terms in each agreement, historical experience andproduct growth rates. | | | | • | The US Medicaid programme is a state-administered programme providingprogrammeproviding assistance to certain poor and vulnerable patients. In 1990,In1990, the Medicaid Drug Rebate Program was established to reducetoreduce state and federal expenditure on prescription drugs. GSK participatesGSKparticipates by providing rebates to states. Accruals for Medicaid rebatesMedicaidrebates are calculated based on the specific terms of individual stateindividualstate agreements using a combination of historical experience,product and population growth, anticipated price increases and theandthe impact of contracting strategies. | | | | | • | Cash discounts are offered to customers to encourage prompt payment.promptpayment. These are accrued for at the time of invoicing and adjustedandadjusted subsequently to reflect actual experience. | | |
| • | Where there is historical experience of customer returns, GSK recordsGSKrecords an accrual for estimated sales returns by applying historical experiencehistoricalexperience of customer returns to the amounts invoiced, together withtogetherwith market related information such as stock levels at wholesalers,anticipated price increases and competitor activity. |
| | | A reconciliation of gross turnover to net turnover for the US pharmaceuticals business is as follows: | | | |
| | | | 2007 | | | | 2006 | | | | 2005 | | |
|
|
| |
|
|
| |
|
|
| | | | £m | | % | | £m | | % | | £m | | % | |
|
|
|
|
|
|
|
|
|
|
|
| | | Gross turnover | 11,826 | | 100 | | 13,131 | | 100 | | 11,875 | | 100 | | | Chargebacks | 917 | | 8 | | 846 | | 6 | | 786 | | 7 | | | Managed care, GPO rebates and Medicare Part D | 727 | | 6 | | 912 | | 7 | | 686 | | 6 | | | US government and state programmes | 481 | | 4 | | 507 | | 4 | | 775 | | 6 | | | Cash discounts | 208 | | 2 | | 248 | | 2 | | 227 | | 2 | | | Customer returns | 131 | | 1 | | 140 | | 1 | | 155 | | 1 | | | Prior year adjustments | (73 | ) | – | | (69 | ) | – | | (34 | ) | – | | | Other items | 162 | | 1 | | 194 | | 1 | | 174 | | 1 | |
|
|
|
|
|
|
|
|
|
|
|
| | | Total deductions | 2,553 | | 22 | | 2,778 | | 21 | | 2,769 | | 23 | |
|
|
|
|
|
|
|
|
|
|
|
| | | Net turnover | 9,273 | | 78 | | 10,353 | | 79 | | 9,106 | | 77 | |
|
|
|
|
|
|
|
|
|
|
|
| |
Chargebacks have increased in 2007 as a result of gross turnover to net turnover for thesignificant sales of product into US pharmaceuticals business is as follows: | | | | 2006 | | | | 2005 | | | | 2004 | | | |
|
|
| |
|
|
| |
|
|
| | | | £m | | % | | £m | | % | | £m | | % | |
|
|
|
|
|
|
|
|
|
|
|
| | | Gross turnover | 13,131 | | 100 | | 11,875 | | 100 | | 10,835 | | 100 | | Managed care, GPO rebates and Medicare, Part D | 912 | | 7 | | 686 | | 6 | | 575 | | 5 | | | Chargebacks | 846 | | 6 | | 786 | | 7 | | 732 | | 7 | | | US Government and State programmes | 507 | | 4 | | 775 | | 6 | | 734 | | 7 | | | Cash discounts | 248 | | 2 | | 227 | | 2 | | 208 | | 2 | | | Customer returns | 140 | | 1 | | 155 | | 1 | | 86 | | 1 | | | Prior year adjustments | (69 | ) | – | | (34 | ) | – | | (51 | ) | (1 | ) | | Other items | 194 | | 1 | | 174 | | 1 | | 126 | | 1 | |
|
|
|
|
|
|
|
|
|
|
|
| | | Total deductions | 2,778 | | 21 | | 2,769 | | 23 | | 2,410 | | 22 | |
|
|
|
|
|
|
|
|
|
|
|
| | | Net turnover | 10,353 | | 79 | | 9,106 | | 77 | | 8,425 | | 78 | |
|
|
|
|
|
|
|
|
|
|
|
| |
Rebates given under the US Government Medicaid programmegovernment stockpiles. Customer rebates have fallen incompared with 2006 and been replaced with rebates granted under the Medicare, Part D programme. The overall level of rebates has fallen slightly, partly as a result of products with traditionally higher rebate percentages becoming subject to generic competition and being replaced with sales of newer products with lower rebate percentages.
The total accruals for rebates, discounts, allowances and returns in the US pharmaceuticals business were as follows: | | At 31st | | At 31st | | | | December | | December | | | | 2006 | | 2005 | | | | £m | | £m | |
|
|
|
| | | Managed care, GPO rebates and | | | | | | Medicare, Part D | 435 | | 401 | | | Chargebacks | 50 | | 56 | | | US Government and State programmes | 283 | | 417 | | | Cash discounts | 24 | | 27 | | | Customer returns | 184 | | 146 | | | Other | 69 | | 53 | |
|
|
|
| | | Total | 1,045 | | 1,100 | |
|
|
|
| |
<Back to Contents
| Business review | | Financial review 2006 | continued |
| |
| | At 31st | | At 31st | | | | December | | December | | | | 2007 | | 2006 | | | | £m | | £m | |
|
|
|
| | | Chargebacks | 38 | | 50 | | | Managed care, GPO and Medicare, Part D rebates | 340 | | 435 | | | US government and state programmes | 240 | | 283 | | | Cash discounts | 21 | | 24 | | | Customer returns | 194 | | 184 | | | Other | 37 | | 69 | |
|
|
|
| | | Total | 870 | | 1,045 | |
|
|
|
| |
A monthly process is operated to monitor inventory levels at wholesalers for any abnormal movements. This process uses gross sales volumes, prescription volumes based on third party data sources and information received from key wholesalers. The aim of this is to maintain inventories at a consistent level from year to year based on the pattern of consumption. On this basis, US pharmaceutical inventory levels at wholesalers and in other distribution channels at 31st December 20062007 were estimated to amount to approximately one month of turnover. This calculation uses third party information, the accuracy of which cannot be totally verified, but is believed to be sufficiently reliable for this purpose. Taxation
Current tax is provided at the amounts expected to be paid, and deferred tax on temporary differences between the tax bases of assets and liabilities and their carrying amounts, at the rates that have been enacted or substantially enacted by the balance sheet date.
The Group has open tax issues with a number of revenue authorities, principally in relation to transfer pricing disputes. GSK uses the best advice in determining its transfer pricing methodology and in seeking to manage transfer pricing issues to a satisfactory conclusion and, on the basis of external professional advice, continues to believe that it has made adequate provision for the liabilities likely to arise from open assessments. However, there continues to be a wide difference of views where open issues exist. The ultimate liability for such matters may vary from the amounts provided and is dependent upon the outcome of litigation proceedings and negotiations with the relevant tax authorities.
Legal and other disputes
GSK provides for anticipated settlement costs where a reasonable estimate may be made of the likely outcome of the dispute and legal and other expenses arising from claims against the Group. The company’s Directors, having taken legal advice, have established provisions after taking into account the relevant facts and circumstances of each matter and in accordance with accounting requirements. Provisions for product liability claims on certain products have been made on an ‘incurred but not reported’ basis where sufficient history of claims made and settlements is available. No provisions have been made for other unasserted claims or for claims for which no reasonable estimate of the likely outcome can yet be made. The ultimate liability for pending and unasserted claims may vary from the amounts provided, if any, and is dependent upon the outcome of litigation proceedings, investigations and possible settlement negotiations.
Impairment of fixed assets
The carrying values of fixed assets subject to depreciation and amortisation are reviewed for impairment when there is an indication that the values of the assets might be impaired. Impairment is determined by reference to the higher of net realisable value and value in use, measured by reference to risk-adjusted future cash flows discounted using appropriate interest rates. These future cash flows are based on business forecasts and are therefore inherently judgemental. Future events could cause the assumptions used in these impairment reviews to change with a consequent adverse effect on the future results of the Group.
Intangible assets
Where intangible assets are acquired by GlaxoSmithKline from third parties the costs of acquisition are capitalised. Licences to compounds in development are amortised from the point at which they are available for use, over their estimated useful lives, up to 20 years. Estimated useful lives are reviewed annually and impairment tests are undertaken if events occur which call into question the carrying values of the assets. Brands acquired with businesses are capitalised independently where they are separable and have an expected life of more than one year. Brands are amortised over their estimated useful lives, not exceeding 20 years, except where the end of the useful economic life cannot be foreseen. Where brands are not amortised, they are subject to annual impairment tests. Impairment tests are based on risk-adjusted future cash flows discounted using appropriate interest rates. These future cash flows are based on business forecasts and are therefore inherently judgemental. Future events could cause the values of these intangible assets to be impaired and this would have an adverse effect on the future results of the Group.
Pensions and other post-employment benefits
The costs of providing pensions and other post-retirement benefits are charged to the income statement in accordance with IAS 19 over the period during which benefit is derived from the employee’s services. The costs are assessed in accordance with advice received from independent actuaries on the basis of assumptions selected by management for use under both IFRS and US GAAP. These assumptions include future earnings and pension increases, discount rates and expected long term rates of return on assets and are disclosed in Note 26 to the financial statements, ‘Pensions and other post-employment benefits’. The expected long term rates of return on bonds are determined based on the portfolio mix of index-linked, government and corporate bonds. An equity risk premium is added to this for equities. Discount rates are based on appropriate long-term indices, including the iBoxx over 15 year AA index for the UK, and Moody’s Aa index for the USA. Sensitivity analysis is provided in Note 26, but a 0.25% reduction in the discount rate would lead to an increase in the net pension deficit of approximately £369 million and an increase in the annual pension cost of approximately £4 million. The selection of different assumptions could affect the future results of the Group.
Product rights and goodwill
In addition to the critical accounting policies outlined above, the accounting policy for product rights and goodwill is deemed to be important in respect of the balance sheet prepared in accordance with US generally accepted accounting principles. Under US GAAP the merger of Glaxo Wellcome and SmithKline Beecham in 2000 was accounted for as an acquisition which gave rise to product rights of £24 billion and goodwill of £16 billion being recognised. Goodwill and those product rights determined to have indefinite lives are not amortised but rather reviewed annually for impairment. These impairment reviews assess business projections prepared as part of the Group’s annual budgeting and planning process to determine whether or not an impairment in value has occurred. The business projections include assumptions about future events. Changes in future events could cause the assumptions in the business projections to change with a consequent adverse effect on the future results of the Group as reported under US GAAP.
|
| GSK Annual Report 20062007 | 43 | 38 | |
<Back to Contents | Financial position and resources | | | | | | Business review | | | Financialposition and resources |
| | |
| Financial position | | | | | Financial position | | | | 2006 | | 2005 | | 2007 | | 2006 | | | | £m | | £m | | £m | | £m | |
|
|
|
| |
| | Assets | | | | Non-current assets | | | | Property, plant and equipment | 6,930 | | 6,652 | | 7,821 | | 6,930 | | | Goodwill | 758 | | 696 | | 1,370 | | 758 | | | Other intangible assets | 3,293 | | 3,383 | | 4,456 | | 3,293 | | | Investments in associates and joint ventures | 295 | | 276 | | 329 | | 295 | | | Other investments | 441 | | 362 | | 517 | | 441 | | | Deferred tax assets | 2,123 | | 2,214 | | 2,196 | | 2,123 | | | Derivative financial instruments | | 1 | | 113 | | | Other non-current assets | 721 | | 438 | | 687 | | 608 | |
|
|
|
| |
| | Total non-current assets | 14,561 | | 14,021 | | 17,377 | | 14,561 | |
|
|
|
| |
| | Current assets | | | | Inventories | 2,437 | | 2,177 | | 3,062 | | 2,437 | | | Current tax recoverable | 186 | | 416 | | 58 | | 186 | | | Trade and other receivables | 5,317 | | 5,348 | | 5,495 | | 5,237 | | | Derivative financial instruments | | 475 | | 80 | | | Liquid investments | 1,035 | | 1,025 | | 1,153 | | 1,035 | | | Cash and cash equivalents | 2,005 | | 4,209 | | 3,379 | | 2,005 | | | Assets held for sale | 12 | | 2 | | 4 | | 12 | |
|
|
|
| |
| | Total current assets | 10,992 | | 13,177 | | 13,626 | | 10,992 | |
|
|
|
| |
| | Total assets | 25,553 | | 27,198 | | 31,003 | | 25,553 | |
|
|
|
| |
| | Liabilities | | | | Current liabilities | | | | Short-term borrowings | (718 | ) | (1,200 | ) | (3,504 | ) | (718 | ) | | Trade and other payables | (4,871 | ) | (5,147 | ) | (4,861 | ) | (4,831 | ) | | Derivative financial instruments | | (262 | ) | (40 | ) | | Current tax payable | (621 | ) | (2,269 | ) | (826 | ) | (621 | ) | | Short-term provisions | (1,055 | ) | (895 | ) | (892 | ) | (1,055 | ) |
|
|
|
| |
| | Total current liabilities | (7,265 | ) | (9,511 | ) | (10,345 | ) | (7,265 | ) |
|
|
|
| |
| | Non-current liabilities | | | | Long-term borrowings | (4,772 | ) | (5,271 | ) | (7,067 | ) | (4,772 | ) | | Deferred tax provision | (595 | ) | (569 | ) | (887 | ) | (595 | ) | | Pensions and other post- employment benefits | (2,339 | ) | (3,069 | ) | | | Pensions and other post-employment benefits | | (1,383 | ) | (2,339 | ) | | Other provisions | (528 | ) | (741 | ) | (1,035 | ) | (528 | ) | | Derivative financial instruments | | (8 | ) | (60 | ) | | Other non-current liabilities | (406 | ) | (467 | ) | (368 | ) | (346 | ) |
|
|
|
| |
| | Total non-current liabilities | (8,640 | ) | (10,117 | ) | (10,748 | ) | (8,640 | ) |
|
|
|
| |
| | Total liabilities | (15,905 | ) | (19,628 | ) | (21,093 | ) | (15,905 | ) |
|
|
|
| |
| | Net assets | 9,648 | | 7,570 | | 9,910 | | 9,648 | |
|
|
|
| |
| | Equity | | | | Share capital | 1,498 | | 1,491 | | 1,503 | | 1,498 | | | Share premium account | 858 | | 549 | | 1,266 | | 858 | | | Retained earnings | 6,965 | | 5,579 | | 6,475 | | 6,965 | | | Other reserves | 65 | | (308 | ) | 359 | | 65 | |
|
|
|
| |
| | Shareholders’ equity | 9,386 | | 7,311 | | 9,603 | | 9,386 | | | Minority interests | 262 | | 259 | | 307 | | 262 | |
|
|
|
| |
| | Total equity | 9,648 | | 7,570 | | 9,910 | | 9,648 | |
|
|
|
| |
| | | | | | | |
Property, plant and equipment
The total cost of the Group’s property, plant and equipment at 31st December 2006 was £13.3 billion, with a net book value of £6.9 billion. Of this, land and buildings represented £2.8 billion, plant and equipment £2.7 billion and assets in construction £1.4 billion. In 2006, GSK invested £1,485 million in new and renewal property, plant and equipment. This is mainly related to a large number of projects for the renewal improvement and expansion of facilities at various worldwide sites. Property is mainly held freehold. New investment is financed from Group liquid resources. At 31st December 2006, GSK had capital contractual commitments for future expenditure of some £521 million and 2007 operating lease commitments of £374 million. GSK’s business is science-based, technology-intensive and highly regulated by governmental authorities. The Group allocates significant financial resources to the renewal and maintenance of its property, plant and equipment to minimise risks of interruption of production and to achieve compliance with regulatory standards. A number of its processes use chemicals and hazardous materials. The total cost of the Group’s property, plant and equipment at 31st December 2007 was £15,087 million, with a net book value of £7,821 million. Of this, land and buildings represented £2,978 million, plant and equipment £2,968 million and assets in construction £1,875 million. In 2007, GSK invested £1,583 million in new and renewal property, plant and equipment. This is mainly related to a large number of projects for the renewal, improvement and expansion of facilities at various worldwide sites. Property is mainly held freehold. New investment is financed from Group liquid resources. At 31st December 2007, GSK had capital contractual commitments for future expenditure of £597 million and 2008 operating lease commitments of £360 million. GSK believes that its facilities are adequate for its current needs. The Group observes stringent procedures and uses specialist skills to manage environmental risks from these activities. Environmental issues, sometimes dating from operations now modified or discontinued, are reported under ‘Responsibility for environment, health and safety’ (page 24)29) and in Note 4344 to the financial statements, ‘Legal proceedings’. GSK believes that its facilities are adequate for its current needs. Goodwill
Goodwill has increased during the year from £758 million at 31st December 2006 to £1,370 million. The increase reflects the goodwill arising on theacquisition of Reliant Pharmaceuticals of £350 million and Domantis of £181 million as well as a strengthening of overseas currencies on the translation of existing foreign currency goodwill balances. Other intangible assets
Other intangible assets include the cost of intangibles acquired from third parties and computer software. The net book value of other intangible assets as at 31st December 20062007 was £3,293£4,456 million (2005 (2006 – £3,383£3,293 million). The decreaseincrease in 20062007 reflects additions of £1,298 million and currency movements and amortisation of existing intangibles, partly offset by additionsthe amortisation and impairment of £444 million.existing intangibles. The largest element of the additions relatesis £613 million relating to the acquisition of CNS,Reliant Pharmaceuticals Inc., which added a range of speciality medicines combating heart disease to the GSK portfolio, including the US marketing rights toBreathe RightLovazanasal strips andFiberChoicedietary products.. Investments
GSK held investments, including associates and joint ventures, with a carrying value at 31st December 20062007 of £736£846 million (2005(2006 – £638£736 million). The market value at 31st December 20062007 was £1,517 million (2006 – £1,461 million (2005 – £1,487 million). The investments are mainly in equity shares where the holding derives directly from the Group’s business. The largest of these investments is in thean associate, Quest Diagnostics Inc., which had a book value at 31st December 20062007 of £262£299 million (2005(2006 – £244£262 million). The investments include equity stakes in companies where the Group has research collaborations, which provide access to biotechnology developments of potential interest or interests in companies that arise from business divestments.
| 44 | GSK Annual Report 2007 | | |
Back to Contents | | | REPORT OF THE DIRECTORS | | | Financial position and resources | | | | | | | Business review | | Financial position and resources | | continued | |
Derivative financial instruments: assets
GSK held both non-current and current derivative financial instruments held at fair value of £476 million (2006 – £193 million). The increase primarily reflects fluctuations in far forward valuations on foreign exchange contracts hedging inter-company loans and deposits. Exchange movements are largely due to changes in Euro, US dollar and Yen market rates. Trade and other receivables
Trade and other receivables include £80of £5,495 million (2005 – £180 million) of derivative financial instruments now held at fair value. The remaining increasehave increased from 2005 reflects increased sales and higher VAT recoverables partly offset by2006 reflecting the impact of weakeningstrengthing overseas currencies on the translation of foreign currency receivables.receivables partly offset by lower VAT recoverables. Derivative financial instruments: liabilities
GSK held both non-current and current derivative financial instruments held at fair value of £270 million (2006 – £100 million) relating primarily to hedging exchange on translation of currency assets on consolidation. The increase again reflects the impact from Euro, US dollar and Yen currency fluctuations. Trade and other payables
Trade and other payables include £41amounting to £4,861 million (2005 – £171 million) of derivative financial instruments now held at fair value. The remaining decrease reflectshave marginally increased from 2006 with the impact of weakeningstrengthening overseas currencies on the translation of foreign currency payables.payables partly offset by a decrease in customer return and rebate accruals.
<Back to Contents
| Business review | | Financial position and resources | continued |
| |
Provisions
The Group carried deferred tax provisions and other short-term and non-current provisions of £2,178£2,814 million at 31st December 2006 (20052007 (2006 – £2,205£2,178 million) in respect of estimated future liabilities, of which £1,105£1,152 million related to legal and other disputes. Provision has been made for legal and other disputes, indemnified disposal liabilities and the costs of manufacturing restructuring and merger integrationprogrammes to the extent that at the balance sheet date an actual or constructive obligation existed and could be reasonably estimated. Pensions and other post-employment benefits
The Group accounts for pension and other post-employment arrangements in accordance with IAS 19. The net deficitdeficits before allowing for deferred taxation was £2,338were £411 million (2005(2006 – £3,069£1,276 million). on pension arrangements and £972 million (2006 – £1,063 million) on unfunded post-employment liabilities. The pension and other post-employment liabilities decreased following improvements in asset values, further special funding contributions to the UK pension funds of £285 million (2006 – £346 million to the UK and US pension funds of £346 million (2005 – £366 million)schemes) and a strengthening of long-term interest rates, including an increase in the rate used to discount UK pension liabilities from 4.75%5.0% to 5.0%5.75% . These benefits were partly offset by an improvement in mortality rates and a higher inflation assumption in the UK. | Net debt | | | | | | | 2006 | | 2005 | | | | £m | | £m | |
|
|
|
| | | Cash, cash equivalents and liquid investments | 3,040 | | 5,234 | | | Borrowings – repayable within one year | (718 | ) | (1,200 | ) | | Borrowings – repayable after one year | (4,772 | ) | (5,271 | ) |
|
|
|
| | | Net debt | (2,450 | ) | (1,237 | ) |
|
|
|
| |
Net debt | | 2007 | | 2006 | | | | £m | | £m | |
|
|
|
|
| | Cash, cash equivalents and liquid investments | 4,532 | | 3,040 | | | Borrowings – repayable within one year | (3,504 | ) | (718 | ) | | Borrowings – repayable after one year | (7,067 | ) | (4,772 | ) |
|
|
|
|
| | Net debt | (6,039 | ) | (2,450 | ) |
|
|
|
|
|
Net debt increased by £1,213£3,589 million primarily due to the gross payment of $3.3 billion (£1.8 billion) under the transfer pricing dispute settlement with the US Internal Revenue Service (see ‘Taxation’ on page 36) and higher share repurchases and acquisition of businesses partly offset by increased cash inflows from operating profits.activities. Total equity
A summary of the movements in equity is set out below. | | 2006 | | 2005 | | 2007 | | 2006 | | | | £m | | £m | | £m | | £m | |
|
|
|
| |
| | Total equity at beginning of year | 7,570 | | 5,937 | | 9,648 | | 7,570 | | | Implementation of accounting for financial instruments under IAS 39 | – | | (12 | ) | |
|
|
|
| | | | Total equity at beginning of year, as adjusted | 7,570 | | 5,925 | | | | Total recognised income and expense for the year | 5,395 | | 4,576 | | 6,134 | | 5,395 | | | Dividends to shareholders | (2,598 | ) | (2,390 | ) | (2,793 | ) | (2,598 | ) | | Ordinary shares issued | 316 | | 252 | | 417 | | 316 | | | Ordinary shares purchased and held as Treasury shares | (1,348 | ) | (1,000 | ) | (3,537 | ) | (1,348 | ) | | Ordinary shares issued by ESOP Trusts | 151 | | 68 | | | | Share-based payments | 247 | | 265 | | | | Changes in minority interest shareholdings– | 2 | | (40 | ) | | | Ordinary shares purchased and cancelled | | (213 | ) | – | | | Consideration received for shares transferred by ESOP Trusts | | 116 | | 151 | | | Ordinary shares acquired by ESOP Trusts | | (26 | ) | – | | | Share-based incentive plans | | 237 | | 226 | | | Tax on share-based incentive plans | | 4 | | 21 | | | Changes in minority interest shareholdings | | – | | 2 | | | Minority interests | (87 | ) | (86 | ) | (77 | ) | (87 | ) |
|
|
|
| |
| | Total equity at end of year | 9,648 | | 7,570 | | 9,910 | | 9,648 | |
|
|
|
| |
|
At 31st December 2006,2007, total equity had increased from £7,570£9,648 million at 31st December 20052006 to £9,648£9,910 million. The increase arises principally from retained earnings and actuarial gains on defined benefit pension plans in the year, partially offset by further purchases of Treasury shares. Share purchases
In 2006,2007, the ESOPEmployee Share Ownership Plan (ESOP) Trusts did not make any market purchasesacquired £26 million of shares in GSK plc (2005(2006 – nil)£nil). Shares are held by the Trusts to satisfy future exercises of options and awards under the Group share option and award schemes. A proportion of the shares held by the Trusts are in respect of awards where the rules of the scheme require the companyGSK to satisfy exercises through market purchases rather than the issue of new shares. The shares held by the Trusts are matched to options and awards granted and diminish the dilutive effect of new share issues on shareholders’ equity and earnings.granted. At 31st December 2006,2007, the ESOP Trusts held 153.5134.5 million GSK shares against the future exercise of share options and share awards. The carrying value of £1,999£1,617 million has been deducted from other reserves. The market value of these shares was £2,062£1,721 million. GSK repurchased £1,348£3,537 million of shares in 2006,2007, to be held as Treasury shares. The company completed its second £4 billion share repurchase programme in September,shares and in October commencedpurchased a new sharefurther £213 million for cancellation. In July 2007, GSK announced an increased buy-back programme totalling £6 billion.to £12 billion, representing a £7.7 billion increase compared with continuation of the existing programme. This new programme is expected to be completed over a threetwo year period including £2£6 billion in 2007.2008. The exact amount and timing of future purchases, and the extent to which repurchased shares will be held as Treasury shares rather than being cancelled, will be determined by the company and is dependent on market conditions and other factors. At 31st December 2006,2007, GSK also held 235.5504.2 million shares as Treasury shares, at a cost of £3,147£6,683 million, which has been deducted from retained earnings. 28.9 million shares have been purchased in the period 1st January 2008 to 22nd February 2008 at a cost of £323 million. All purchases were made through the publicly announced buy-back programme.
| GSK Annual Report 2007 | 45 | | |
Back to Contents | | | REPORT OF THE DIRECTORS | | Financial position and resources | | | | | | Business review | | Financial position and resources | | continued | |
Commitments and contingent liabilities
Financial commitments are summarised in Note 3739 to the financial statements, ‘Commitments’. Other contingent liabilities and obligations in respect of short and long-term debt are set out in Note 2931 to the financial statements, ‘Contingent liabilities’ and Note 3032 to the financial statements, ‘Net debt’. Amounts provided for pensions and post-retirement benefits are set out in Note 2628 to the financial statements, ‘Pensions and other post-employment benefits’. Amounts provided for restructuring and integration plansprogrammes and legal, environmental and other disputes are set out in Note 2729 to the financial statements, ‘Other provisions’. Contractual obligations and commitments
The following table sets out the Group’s contractual obligations and commitments at 31st December 20062007 as they fall due for payment. | | Total | | Under 1 yr | | 1-3 yrs | | 3-5 yrs | | 5 yrs+ | | | | £m | | £m | | £m | | £m | | £m | |
|
|
|
|
|
|
|
|
|
| | | Loans | 5,351 | | 676 | | 1,505 | | 11 | | 3,159 | | | Interest on loans | 2,875 | | 215 | | 344 | | 307 | | 2,009 | | | Finance lease obligations | 139 | | 42 | | 63 | | 22 | | 12 | | | Operating lease commitments | 374 | | 94 | | 129 | | 74 | | 77 | | | Intangible assets | 3,219 | | 558 | | 465 | | 645 | | 1,551 | | | Property, plant & equipment | 521 | | 381 | | 140 | | – | | – | | | Investments | 196 | | 192 | | 4 | | – | | – | | | Business combinations | 258 | | 258 | | – | | – | | – | | | Purchase commitments | 299 | | 151 | | 128 | | 20 | | – | | | Pensions | 975 | | 325 | | 650 | | – | | – | | | Theravance put option agreement | 258 | | 258 | | – | | – | | – | | | Other commitments | 65 | | 31 | | 25 | | 4 | | 5 | |
|
|
|
|
|
|
|
|
|
| | | Total | 14,530 | | 3,181 | | 3,453 | | 1,083 | | 6,813 | |
|
|
|
|
|
|
|
|
|
| |
<Back to Contents
| Business review | | Financial position and resources | continued |
| |
| | Total | Under 1 yr | 1-3 yrs | 3-5 yrs | 5 yrs+ | | | | £m | £m | £m | £m | £m | |
|
|
|
|
|
| | | Loans | 10,448 | 3,474 | 370 | 2,195 | 4,409 | | | Interest on loans | 5,170 | 393 | 646 | 634 | 3,497 | | | Finance lease obligations | 123 | 40 | 61 | 13 | 9 | | | Finance lease charges | 14 | 5 | 5 | 3 | 1 | | | Operating lease commitments | 360 | 101 | 134 | 74 | 51 | | | Intangible assets | 5,730 | 618 | 745 | 805 | 3,562 | | | Property, plant & equipment | 597 | 459 | 137 | 1 | – | | | Investments | 65 | 38 | 27 | – | – | | | Purchase commitments | 159 | 72 | 54 | 24 | 9 | | | Pensions | 650 | 325 | 325 | – | – | | | Other commitments | 32 | 20 | 7 | – | 5 | |
|
|
|
|
|
| | | Total | 23,348 | 5,545 | 2,511 | 3,749 | 11,543 | |
|
|
|
|
|
Commitments in respect of loans and future interest payable on loans are disclosed after taking into account the effect of interest rate swaps.derivatives. The Group has entered into a number of research collaborations to develop new compounds with other pharmaceutical companies. The terms of these arrangements can include up-front fees, equity investments, loans and commitments to fund specified levels of research. In addition the Group will often agree to make further payments if future ‘milestones’ are achieved. As some of these agreements relate to compounds in the early stages of development, milestone payments will continue for a number of years if the compounds move successfully through the development process. Generally the closer the product is to marketing approval the greater the possibility of success. The payments shown above within intangible assets represent the maximum that would be paid if all milestones are achieved. A number of new commitments were made in 20062007 under licensing and other agreements, including arrangements with ChemoCentryxAnacor Pharmaceuticals, Inc., EPIXOncomed Pharmaceuticals, Inc., Santaris Pharma A/S and Genmab A/S.Targacept, Inc. In 2006, GSK formalised an agreement with the trustees of the UK pension schemes to make additional contributions of up to £325 million per year, in addition to the normal contributions, over a four-year period ending 31st December 2009 in order to eliminate the then pension deficits on an IAS 19 basis by that point. The table on page 40opposite shows this commitment, but excludes the normal ongoing annual funding requirement of approximately £200 million. GSK has also committed to eliminate any future deficits that may arise over a rolling five-year period. No other commitments have been made past 31st December 2009. For further information on pension obligations, see Note 28 to the financial statements, ‘Pensions and other post-employment benefits’. Contingent liabilities
The following table sets out contingent liabilities, comprising discounted bills, performance guarantees, letters of credit and other items arising in the normal course of business, and when they are expected to expire. | | Total | | Under 1 yr | | 1-3 yrs | | 3-5 yrs | | 5 yrs+ | | Total | Under 1 yr | 1-3 yrs | 3-5 yrs | 5 yrs+ | | | | £m | | £m | | £m | | £m | | £m | | £m | |
|
|
|
|
|
|
|
|
|
| |
| | | Guarantees | 221 | | 74 | | 28 | | 5 | | 114 | | 166 | 37 | 10 | – | 119 | | | Other contingent liabilities | 37 | | 12 | | 10 | | 4 | | 11 | | 40 | 13 | 9 | 4 | 14 | |
|
|
|
|
|
|
|
|
|
| |
| | | Total | 258 | | 86 | | 38 | | 9 | | 125 | | 206 | 50 | 19 | 4 | 133 | |
|
| |
| |
In the normal course of business GSK has provided various indemnification guarantees in respect of business disposals in which legal and other disputes have subsequently arisen. A provision is made where a reasonable estimate can be made of the likely outcome of the dispute and this is included in Note 2729 to the financial statements, ‘Other provisions’. It is the Group’s policy to provide for the settlement costs of asserted claims and environmental disputes when a reasonable estimate may be made. Prior to this point no liability is recorded. Legal and environmental costs are discussed in ‘Risk factors’ on pages 50 to 53 and Note 44 to 47.the financial statements, ‘Legal proceedings’. GSK uses the best advice in determining its transfer pricing methodology and, on the basis of external professional advice, continues to believe that it has made adequate provision for the liabilities likely to arise from open taxation assessments. The ultimate liability for such matters may vary significantly from amounts provided and is dependent upon the outcome of litigation proceedings and negotiations with the relevant tax authorities. This is discussed further in Note 1214 to the financial statements, ‘Taxation’.
| 46 | GSK Annual Report 2007 | | |
Back to Contents | | | REPORT OF THE DIRECTORS | | | Financial position and resources | | | | | | | Business review | | Financial position and resources | | continued | |
Cash flow
A summary of the consolidated cash flow statement is set out below:below | | 2006 | | 2005 | | 2007 | | 2006 | | | | £m | | £m | | £m | | £m | |
|
|
|
| |
| | | Net cash inflow from operating activities | 4,357 | | 5,958 | | 6,161 | | 4,357 | | | Net cash outflow from investing activities | (1,521 | ) | (1,660 | ) | (3,009 | ) | (1,521 | ) | | Net cash outflow from financing activities | (4,792 | ) | (2,914 | ) | (1,741 | ) | (4,792 | ) |
|
|
|
| |
| | | Decrease/Increase in cash and bank overdrafts | (1,956 | ) | 1,384 | | | | Increase/(decrease) in cash and bank overdrafts | | 1,411 | | (1,956 | ) | | Exchange adjustments | (254 | ) | 233 | | 48 | | (254 | ) | | Cash and bank overdrafts at beginning of year | 3,972 | | 2,355 | | 1,762 | | 3,972 | |
|
|
|
| |
| | | Cash and bank overdrafts at end of year | 1,762 | | 3,972 | | 3,221 | | 1,762 | |
|
| |
| | | Cash and bank overdrafts at end of year | | | | | | | comprise: | | | | | | | Cash and cash equivalents | 2,005 | | 4,209 | | 3,379 | | 2,005 | | | Overdrafts | (243 | ) | (237 | ) | (158 | ) | (243 | ) |
|
|
|
| |
| | | | 1,762 | | 3,972 | | 3,221 | | 1,762 | |
|
|
|
| |
| |
The net cash inflow from operating activities after taxation paid was £4,357£6,161 million, a decreasean increase of £1,601£1,804 million over 2005,2006, arising mainly from thebecause a gross taxation payment of $3.3 billion (£1.8 billion) under the US transfer pricing dispute settlement was made in 2006 (see page 36), partially offset by higher operating profits.Note 14 the financial statements, 'Taxation'.). The net cash outflow from investing activities was £1,521£3,009 million, a decreasean increase of £139£1,488 million which reflected increased capital expenditure and the purchase of businesses, including CNS in 2006Reliant Pharmaceuticals for £273£794 million (purchasesand Domantis for £218 million, net of businesses in 2005 were over £1 billion reflecting the purchase of Corixa and ID Biomedical).cash acquired. Cash returned to shareholders 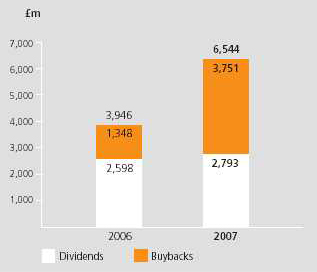 Free cash flow was £2,623£3,857 million, a decreasean increase of 44%47% over 2005,2006, principally reflecting the impact of the US tax settlement andin 2006 partly offset by higher levels of capital expenditure. Free cash flow is the amount of cash generated by the business after meeting its obligations for interest, tax and dividends paid to minority interests, and after capital expenditure on non-current tangible and intangible assets. Free cash flow is used by GSK’s management for planning and reporting purposes and in discussions with and presentations to investment analysts and rating agencies. GSK’s free cash flow measure is not defined in IFRS. This measure may not be directly comparable with similarly described measures used by other companies. A reconciliation of net cash inflow from operating activities, which is the closest equivalent IFRS measure, to free cash flow is shown below. Reconciliation of free cash flow | | 2006 | | 2005 | | 2007 | | 2006 | | | | £m | | £m | | £m | | £m | |
|
|
|
| |
| | | Net cash inflow from operating activities | 4,357 | | 5,958 | | 6,161 | | 4,357 | | | Purchase of non-current tangible assets | (1,366 | ) | (903 | ) | (1,516 | ) | (1,366 | ) | | Purchase of non-current intangible assets | (224 | ) | (278 | ) | (627 | ) | (224 | ) | | Disposal of non-current tangible fixed assets | 43 | | 54 | | 35 | | 43 | | | Interest paid | (414 | ) | (381 | ) | (378 | ) | (414 | ) | | Interest received | 299 | | 290 | | 247 | | 299 | | | Dividends received from joint ventures and associated undertaking | 15 | | 10 | | | | Dividends received from joint ventures and | | | | | | | associated undertaking | | 12 | | 15 | | | Dividends paid to minority interests | (87 | ) | (86 | ) | (77 | ) | (87 | ) |
|
|
|
| |
| | | Free cash flow | 2,623 | | 4,664 | | 3,857 | | 2,623 | |
|
|
|
| |
| |
Movements in net debt | | 2007 | | 2006 | | | | £m | | £m | |
|
|
|
| | | Net debt at beginning of year | (2,450 | ) | (1,237 | ) | | Increase/(decrease) in cash and | | | | | | bank overdrafts | 1,411 | | (1,956 | ) | | Cash outflow from liquid investments | 39 | | 55 | | | Net increase in long-term loans | (3,276 | ) | – | | | Net (increase in)/repayment of short-term loans | (1,632 | ) | 739 | | | Exchange and other movements | (131 | ) | (51 | ) |
|
|
|
|
| | Net debt at end of year | (6,039 | ) | (2,450 | ) |
|
|
|
| |
|
| GSK Annual Report 20062007 | 47 | 41 | |
<Back to Contents | | | | REPORT OF THE DIRECTORS | | Financial position and resources | | |
| | | Business review | | | Financial position and resources | | continued |
| | |
Reconciliation of net cash flow to movement in net debt
| | 2006 | | 2005 | | | | £m | | £m | |
|
|
|
| | | Net debt at beginning of year | (1,237 | ) | (1,984 | ) | | (Decrease)/increase in cash and | | | | | | bank overdrafts | (1,956 | ) | 1,384 | | | Cash outflow/(inflow) from liquid investments | 55 | | (550 | ) | | Net increase in long-term loans | - | | (912 | ) | | Net repayment of short-term loans | 739 | | 857 | | | Exchange and other movements | (51 | ) | (32 | ) |
|
|
|
| | | Net debt at end of year | (2,450 | ) | (1,237 | ) |
|
|
|
| |
Investment appraisal
GSK has a formal process for assessing potential investment proposals in order to ensure decisions are aligned with the Group’s overall strategy. This process includes an analysis of the impact of the project on earnings, its return on invested capital and an assessment of the return based on discounted cash flows. The discount rate used to perform financial analysis is decided internally, to allow determination of the extent to which investments cover the Group’s cost of capital. For specific investments the discount rate may be adjusted to take into account country or other risk weightings. Capital expenditure and financial investment
Cash payments for tangible and intangible fixed assets amounted to £1,590£2,143 million (2005(2006 – £1,181£1,590 million). Disposals realised £218£44 million (2005(2006 – £275£218 million). Cash payments to acquire equity investments of £57£186 million (2005(2006 – £23£57 million) were made in the year and sales of equity investments realised £32£45 million (2005(2006 – £35£32 million). Future cash flow
The Group expects that future operating cash flow will be sufficient to fund its operating and debt service costs, to satisfy normal levels of capital expenditure, to meet obligations under existing licensing agreements and to meet other routine outflows including tax and dividends, subject to the risk factors discussed on pages 4450 to 47.53. GSK may from time to time have additional demands for finance, such as for acquisitions. It has access to other sources of liquidity from short and long-term capital markets and banks and other financial institutions, in addition to the cash flow from operations, for such needs. Payment policies Group companies are responsible for monitoring and managing their working capital. The terms of sales collections and supplier payments reflect local commercial practice. In the UK, the company and each of its UK subsidiaries have policies to ensure that suppliers are paid on time. In particular, the UK companies seek: | • | to settle terms of payment with suppliers when agreeing the termsofterms of the transaction | | • | to ensure that suppliers are made aware of the agreed termsofterms of payment | | • | to abide by the terms of payment. |
The policy includes arrangements for accelerated payment of small suppliers. Payment performance
At 31st December 2006,2007, the average number of days’ purchases represented by trade and fixed asset creditors of the parent company was nil (2005(2006 – nil) and in respect of the company and its UK subsidiaries in aggregate was 24 days (2005(2006 – 2224 days). Treasury policies GlaxoSmithKline plc reports in Sterling and pays dividends out of sterlingSterling profits. The role of Corporate Treasury in GSK is to manage and monitor the Group’s external and internal funding requirements and financial risks in support of Group corporate objectives. Treasury activities are governed by policies and procedures approved by the Board and monitoredof Directors, most recently on 5th October 2007. A Treasury Management Group (TMG) chaired by the Group’s Chief Financial Officer, meets on a monthly basis to review treasury activities. Its members receive management group. GSK maintainsinformation relating to treasury activities. The Corporate Executive Team (CET) also review a monthly finance report which focuses on operational finance issues. The Group’s internal auditors review the treasury internal control systems and procedures to monitor foreign exchange, interest rate, liquidity, credit and other financial risks.environment regularly.
LiquidityCapital management
GSK operates globally, primarily through subsidiary companies established in the markets in which the Group trades. Due to the natureWith significant levels of GSK’s business, with patent protection on many of the products in its portfolio, the Group’s products compete largely on product efficacy rather than on price. Selling margins are sufficient to exceedcover normal operating costs and the Group’s operating subsidiaries are substantiallygenerally cash generative.
Operating cash flow is used to fund investment in the research and development of new products as well as to make the routine outflows of capital expenditure, tax, dividends and repayment of maturing debt. In July 2007, GSK announced an increased share buy-back programme of £12 billion over the period to July 2009 which will result in substantially increased borrowings. The Group’s policy is to borrow centrally, using a variety of capital market issues and borrowing facilities, to meet anticipated funding requirements. These borrowings, together with cash generated from operations, are on-lent, contributed as equity to certain subsidiaries or used to fund the Group’s £12 billion share buy-back programme, due to complete by July 2009. Liquidity
The Group may, from time to time, have additional demands formanages its net borrowing requirements through a portfolio of long-term borrowings, including bonds, together with short-term finance such as for share purchases and acquisitions. GSK operates withunder a high level of interest cover and at low levels of net debt relative to its market capitalisation. In addition to the strong positive cash flow from normal trading activities, additional liquidity is readily available via itsUS$10 billion commercial paper programme and short-term investments. programme. At 31st December 2007, the Group also had $5 billion committed undrawn bank facilities.
The Group also has a European Medium Term Note programme of £10 billion, of which £3.5£7.2 billion was in issue as at 31st December 2006. In 2004, the Group established2007, and a US Shelf Registration of $5 billion; at 31st December 2006 $2.42007, $2 billion (£1.21 billion) was in issue. The TMG monitors the cashflow forecast of GSK on a monthly basis. The Group’s long-term borrowings mature at dates between 2008 and 2042. On 18th February 2008 GSK’s long-term Standard and Poor’s debt rating was revised from AA with negative outlook to A+ stable. At this time, Standard and Poor’s also revised GSK’s short-term rating for paper issued under the Group’s commercial paper programme from A-1+ to A-1. Moody’s Investors’ Services rate GSK as A1 with negative outlook for long-term debt and P-1 for short-term debt. There has been no change to GSK’s rating from Moody’s since 25th July 2007. In the light of likely increased commercial paper issuance resulting from the increased share buy-back programme, GSK has increased its committed bank facilities from $900 million to $5 billion. In addition, the Group maintains substantial cash and liquid investments which amounted to £4.5 billion at 31st December 2007.
| 48 | GSK Annual Report 2007 | | |
Back to Contents | | | REPORT OF THE DIRECTORS | | | Financial position and resources | | | | | | | Business review | | Financial position and resources | | continued | |
Treasury operations
The objective of treasury activity is to manage the post-tax net cost/income of financial operations to the benefit of Group earnings. Corporate Treasury does not operate as a profit centre. GSK uses a variety of financial instruments, including derivatives, to finance its operations and to manage market risks from those operations. Derivatives, principally comprising forward foreign currency contracts, interest rate and currency swaps, are used to swap borrowings and liquid assets into the currencies required for Group purposes and to manage exposure to funding risks from changes in foreign exchange ratesrate and interest rates.
Back to Contents
| Business review | | Financial position and resources | continued |
| |
GSK balances the use of borrowings and liquid assets having regard to the cash flow from operating activities, the currencies in which it is earned, the tax cost of intra-Group distributions, the currencies in which business assets are denominated, and the post-tax cost of borrowings compared with the post-tax return on liquid assets.
Liquid assets surplus to the immediate operating requirements of Group companies are generally invested and managed centrally by Corporate Treasury. Requirements of Group companies for operating finance are met whenever possible from central resources.
External borrowings, mainly managed centrally by Corporate Treasury, comprise a portfolio of long and medium-term instruments and short-term finance.
GSK does not hold or issue derivative financial instruments for tradingspeculative purposes and the Group’s Treasurytreasury policies specifically prohibit such activity. All transactions in financial instruments are undertaken to manage the risks arising from underlying business activities, not for speculation. Funding, maturity and counterparty risk
The Group invests centrally managed liquid assets in government bonds, short-term corporate debt instruments with a minimum short-term credit rating of A-1/P-1, money market funds with a credit rating of AAA/Aaa and other structured investments (credit ratings shown are from Standard and Poor’s and Moody’s Investors’ Services, respectively).
The Group manages its net borrowing requirements through a portfolio of long-term borrowings, including bonds, together with short-term finance under the US$10 billion commercial paper programme.
The Group’s long-term borrowings mature at dates between 2007 and 2034. These include a private financing which, although maturing in 2032, may be redeemed by GSK at any time and, in particular, in the event of any accelerating event that would increase the cost of funding for the Group. GSK’s long-term debt rating is AA from Standard and Poor’s and Aa2 from Moody’s Investors’ Services. The agencies’ short-term ratings for paper issued under the Group’s commercial paper programme are A-1+ and P-1 respectively.
Foreign exchange risk management
In GSK foreignForeign currency transaction exposure arising on normal trade flows, in respect of both external and intra-Group trade, is not hedged. The policy is to minimise the exposure of overseas operating subsidiaries to transaction risk is minimised by matching local currency income with local currency costs. For this purpose, intra-Group trading transactions are matched centrally and intra-Group payment terms are managed to reduce risk. ExceptionalExceptionally foreign currency cash flows are hedged selectively under the management of Corporate Treasury. The Group manages centrally the short-term cash surpluses or borrowing requirements of subsidiary companies and uses forward contracts to hedge future repayments back into the originating currency. The Group seeks to denominate borrowings in the currencies of its principal assets and cash flows. These are primarily denominated in US dollars, Euros and Sterling. Certain of these and other borrowings are swapped into other currencies as required for Group purposes. Borrowings denominated in, or swapped into, foreign currencies that match investments in overseas Group assets are treated as a hedge against the relevant net assets. Based The ratio of borrowings to assets is reviewed by currency on a month-by-month basis by the composition of net debt at 31st December 2006, a 10% appreciation in Sterling against major currencies would result in a reduction in the Group’s net debt of approximately £210 million. A 10% weakening in Sterling against major currencies would result in an increase in the Group’s net debt of approximately £256 million.TMG.
Interest rate risk management
GSK’s policy on interest rate risk management requires that the minimum amount of net borrowings at fixed rates increasesto increase with the ratio of forecast net interest payable to trading profit. The fixed to floating ratio is reviewed monthly by the TMG. The Group uses a limited number of interest rate swaps to redenominate external borrowings into the interest rate coupon required for Group purposes. The duration of these swaps matches the duration of the principal debt instruments. Interest rate derivative instruments are accounted for as fair value or cash flow hedges of the relevant assets or liabilities. The Group manages centrally the short-term cash surpluses or borrowing requirements of subsidiary companies and uses forward contracts to hedge future repayments back into the originating currency.
Sensitivity analysis considers the sensitivity of the Group’s net debt to hypothetical changes in market rates and assumes that all other variables remain constant. Based on the composition of net debt and financing arrangements at 31st December 2006, and taking into consideration all fixed rate borrowings in place, a one percentage point (100 basis points) decrease in average interest rates would result in an increase in the Group’s annual net interest charge of approximately £5 million.
Equity risk management
Equity investments classified as current assets are available-for-sale and the Group manages disposals to meet overall business requirements as they arise. The Group regularly monitors the value of its equity investments and only enters into hedges selectively with the approval of the Board.
Financial assets and liabilities
An analysis of net debt is given in Note 3032 to the financial statements, ‘Net debt’. An analysis of financial assets and liabilities at carrying value and fair value and a reconciliation to net debt areis given in Note 3941 to the financial statements, ‘Financial instruments and related disclosures’, together with a discussion of derivative financial instruments and quantitative disclosures about market risk in accordance with the requirements of IAS 32 and IAS 39.. The Group continues to benefit from strong positive cash flow.flow from operating activities. Group net debt would have decreased significantly in the year to 31st December 2006,2007, but for the Group’s purchase of its own shares in the market of £1.3£3.8 billion the gross US tax settlement of US$3.3 billion (£1.8 billion) and acquisitions of approximately £0.3£1 billion. The financial assets and liabilities at 31st December 20062007 are representative of the treasury policies and strategies of GSK applied consistently duringsince July 2007. At that time, GSK announced a changed financial strategy, involving an increased share buy-back programme of £12 billion, which will result in substantially increased borrowings. From July 2007 onwards, GSK tightened its criteria for holding cash equivalents and liquid investments in response to the year. There werecredit crisis. GSK has suffered no significant changes in such policies throughout the year.loss of principal as a result of this crisis.
|
| GSK Annual Report 20062007 | 49 | 43 | |
Back to Contents | | | | REPORT OF THE DIRECTORS | | Outlook and risk factors | | |
| | | Business review | | | Outlook and risk factors |
| | | |
Outlook Sales growth of existing products and launchlaunches of new products are key drivers of GSK’s business performance.business. The sales growth seen from key products such asSeretide/Advair, theAvandiagroup of products, Vaccines,Lamictal,vaccines,Valtrex,Coregand the high potential products,RequipAvodart,AvodartArixtraandBonivais expected to continue in 2007.2008. Sales growth is also expected from newer productsLovaza, Cervarix,Tykerb/Tyverb,Rotarix,Veramyst/Avamys andAltabax/ Altargo. Sales growth ofAvandia, GSK’s product for diabetes, has been adversely impacted following publication in May 2007 of a meta-analysis. Typically, sales of existing products decline dramatically when generic competition is introduced either on patent expiry or earlier if there is a successful challenge to the Group’s patent. In Q4 2006,2007, generic competitors toWellbutrin XLCoreg IR300mg tablet (approximately 60% ofWellbutrinsales) andZofranentered the US market. Several other products will become exposed to generic competition in the USA during 2008, includingWellbutrin XL 150mg,Requip IR,Lamictal IR, Paxil CR andImitrex. GSK is engaged in legal proceedings regarding the validity and infringement of the Group’s patents relating to many of its products. These are discussed in ‘Risk factors’ below and in Note 4344 to the financial statements, ‘Legal proceedings’. Five majorGSK expects a sustained flow of new pharmaceutical product launches are expected in 2007. These includeTykerb,for breast cancer,Cervarix, for cervical cancer (in Europe),Allermist, for allergic rhinitis,Coreg CR, for heart failure andTrexima,for migraine.
GSK also expects to launch several other important products during the year including:Arixtra, to treat acute coronary syndromes (ACS);Altabax/Altargo, for skin infections, andEntereg, for the management of post-operative ileus.
GSK’s consumer brand portfolio will be strengthened further in 2007, with the launch of 10 products, includingalli, a new treatment for weight-loss in the USA. Two more brands,next two years. Thirteen new product opportunities are currently filed with regulators; these includeBreathe Right,Promactanasal strips (USA),Rotarix (USA),Treximet(USA) andFiberChoice,Synflorixdietary fibre supplements, were added to the portfolio, following the acquisition of CNS, Inc. which was completed in December 2006.
Several new products are expected to be filed for approval with the regulatory authorities in 2007, including vaccine opportunities: US filing ofCervarix, for cervical cancer andRotarix, for rotavirus (EU and the European filing ofSynflorix, a vaccine for pneumococcal disease.International). GSK continues to progress development of vaccines for use before, and in the event of, a ’flu pandemic. In January 2007, GSK submitted its H5N1 vaccine to European regulators for approval for pre-pandemic use.
GSK nowcurrently has 31 major product opportunities34 key assets in phase III development or registration, comprising 13 NCEs, 6 new vaccines and 12 product line extensions.development/registration.
GSK’sIn its published earnings guidance for 2007 is2008 GSK expects that earnings per share growth is expectedthe impact of lowerAvandia sales, together with increase generic competition, will lead to be 8% to 10%a mid-single digit percentage decline in CER terms.
The Group has net debt of £2.5 billion, which is low relative to its market capitalisation, and this positions it to take advantage of any opportunities that might arise to build the business.business performance EPS, at constant exchange rates.
There are risks and uncertainties inherent in the business that may affect future performance including R&D projects, anticipated sales growth and expected earnings growth. These are discussed in ‘Risk factors ‘ below. Risk factors There are risks and uncertainties relevant to the Group’s business.business, financial conditions and results of operations. The factors listed below are among those that the Group thinks could cause the Group’s actual results to differ materially from expected and historical results.results, as could other risks and uncertainties not currently known to the Group or which the Group currently deems immaterial. Risk that R&D will not deliver commercially successful new products
Continued development of commercially viable new products as well as the development of additional uses for existing products is critical to the Group’s ability to replace sales of older products that decline upon expiration of exclusive rights, and to increase overall sales. Developing new products is a costly, lengthy and uncertain process. A new product candidate can fail at any stage of the process, and one or more late-stage product candidates could fail to receive regulatory approval. New product candidates may appear promising in development but, after significant investment, fail to reach the market or have only limited commercial success. This, for example, could be as a result of efficacy or safety concerns, inability to obtain necessary regulatory approvals, difficulty or excessive costs to manufacture, erosion of patent term as a result of a lengthy development period, infringement of patents or other intellectual property rights of others or inability to differentiate the product adequately from those with which it competes. Health authorities such as the US FDA, the European Medicines Agency and the Japan Pharmaceuticals and Medicines Device Agency have increased their focus on safety when assessing the benefit/risk balance of drugs. In light of this increased scrutiny, and other factors, there has been a reduction in the number of new drugs gaining regulatory approvals in recent years. For example, the FDA approved only 19 new drugs in 2007, the lowest single-year total since 1983. Risk of unplanned loss of patents
Patent infringement litigation
The Group’s patents, in common with all patents, can be challenged at any time. Efforts by generic manufacturers may involve challenges to the validity or enforceability of a patent or assertions that their generic product does not infringe the Group’s patents. If the Group is not successful in defending an attack on its patents and maintaining exclusive rights to market one or more of its major products, particularly in the USA where the Group has its highest turnover and margins, the Group’s turnover and margins would be adversely affected. See Note 4344 to the financial statements, ‘Legal proceedings’, for a discussion of patent-related proceedings in which the Group is involved.involved and page 28 for a description of resolution of prior proceedings which affect the dates on which generic versions of the Group’s products may be introduced. Generic drug manufacturers are seeking to market generic versions of many of the Group’s most important products, prior to the expiration of the Group’s patents, and have exhibited a readiness to do so for other products in the future. The US launch of generic products competing withPaxilCoreg IR,Zofran,FlonaseandWellbutrin XLhad a significant impact on the Group’s overall turnover and earnings.earnings for 2007. Potential changes in intellectual property laws and regulations
Proposals to change existing patent and data exclusivity laws and regulations in major markets in which the Group sells its products are a continuing feature of the political process in those countries, including proposals that could have the effect of making prosecution of patents for new products more difficult and time-consuming or adversely affecting the exclusivity period for the Group’s products, including biological products. Should such proposals be enacted they could have an adverse impact on the Group’s future sales and results of operations.
| 50 | GSK Annual Report 2007 | | |
Back to Contents | | | REPORT OF THE DIRECTORS | | | Outlook and risk factors | | | | | | | Business review | | Outlook and risk factors | | continued | |
Weakness of intellectual property protection in certain countries
In some of the countries in which the Group operates, patent protection may be significantly weaker than in the USA or the European Union. In addition, in an effort to control public health crises, some developing countries, such as South Africa and Brazil, have considered plans for substantial reductions in the scope of patent protection for pharmaceutical products. In particular, these countries could facilitate competition within their markets from generic manufacturers who would otherwise be unable to introduce competing products for a number of years.
Back to Contents
| Business review | | Outlook and risk factors | continued |
| |
Any loss of patent protection, including abrogation of patent rights or compulsory licensing, is likely to affect adversely the Group’s operating results in those national markets but is not expected to be material to the Group overall. Absence of adequate patent protection could limit the opportunity to look to such markets for future sales growth. Risk of substantial adverse outcome of litigation and government investigations
See Note 4344 to the financial statements, ’Legal proceedings’, for a discussion of proceedings and governmental investigations – involving matters which if proven could give rise to civil and/or criminal liabilities – in which the Group is currently involved. Unfavourable resolution of these and similar future proceedings or investigations may have a material adverse effect on the Group’s financial results.condition and results of operations. The Group has made material provisions in 2004, 2005, 2006 and 20062007 related to legal proceedings and investigations which reduced its earnings. The Group may also make additional significant provisions related to legal proceedings and investigations in the future, which would reduce its earnings. In many cases the practice of the plaintiff bar is to claim damages – compensatory, punitive and statutory – indamagesin amounts that bear no relationship to the underlying harm. Accordingly it is potentially misleading to quantify the potential exposure to claims, proceedings and investigations of the type described in Note 43.44 to the financial statements 'Legal proceedings'. Recent insurance loss experience, including pharmaceutical product liability exposures, has increased the cost of, and narrowed the coverage afforded by, insurance for pharmaceutical companies generally, including the Group. In order to contain insurance costs in recent years the Group has continued to adjust its coverage profile, accepting a greater degree of un-insured exposure. In addition, where claims are made under insurance policies, insurers may reserve the right to deny coverage on various grounds. If denial of coverage is ultimately upheld on these claims, this could result in material additional charges to the Group’s earnings. Product liability litigation
Pre-clinical and clinical trials are conducted during the development of potential products to determine the safety and efficacy of products for use by humans following approval by regulatory bodies. Notwithstanding these efforts, when drugs and vaccines are introduced into the marketplace, unanticipated side effects may become evident. In other instances third parties may perform analyses of published clinical trial results which, although not necessarily accurate or meaningful, may raise questions regarding safety of pharmaceutical products which may be publicised by the media and may result in product liability claims. The Group is currently a defendant in a number of product liability lawsuits, including class actions, that involve substantial claims for damages related to the Group’s pharmaceutical products. Litigation, particularly in the USA, is inherently unpredictable and excessive verdicts that are not justified by the evidence can occur. Class actions that sweep together all persons who were prescribed the Group’s products can inflate the potential liability by the force of numbers. Claims for pain and suffering and punitive damages are frequently asserted in product liability actions and, if allowed, can represent potentially open-ended exposure. Anti-trust litigation
In the USA it has become increasingly common that following publicity around government investigations or an adverse outcome in prosecution of patent infringement actions, the defendants and direct and indirect purchasers and other payers initiate anti-trust actions as well. Claims by direct and indirect purchasers and other payers are typically filed as class actions and the relief sought may include treble damages and restitution claims. Damages in adverse anti-trust verdicts are subject to automatic trebling in the USA. Similarly, anti-trust claims may be brought following settlement of patent litigation, alleging that such settlements are anti-competitive and in violation of anti-trust laws. Sales, marketing and regulation
The Group operates globally in complex legal and regulatory environments that often vary among jurisdictions. The failure to comply with applicable laws, rules and regulations in these jurisdictions may result in civil and criminal legal proceedings. As those rules and regulations change or as governmental interpretation of those rules and regulations evolve, prior conduct may be called into question. In the USA, for example, the Group is responding to federal and state governmental investigations into pricing, marketing and reimbursement of its prescription drug products. These investigations could result in related restitution or civil false claims act litigation on behalf of the federal or state governments, as well as related proceedings initiated against the Group by or on behalf of consumers and private payers. Such proceedings may result in trebling of damages awarded or fines in respect of each violation of law. Criminal proceedings may also be initiated against Group companies or individuals. Risks of competition, price controls and limitations on sales
Third party competition
The Group operates in highly competitive businesses. In the pharmaceuticals business, it faces competition both from proprietary products of large international manufacturers and producers of generic pharmaceuticals. Significant product innovations, technical advances or the intensification of price competition by competitors could adversely affect the Group’s operating results. The Group cannot predict the timing or impact of competitive products or their potential impact on sales of the Group’s products. Continued consolidation in the pharmaceutical industry could adversely affect the Group’s competitive position, while continued consolidation among the Group’s customers may increase pricing pressures.
| GSK Annual Report 2007 | 51 | | |
Back to Contents | | | REPORT OF THE DIRECTORS | | Outlook and risk factors | | | | | | Business review | | Outlook and risk factors | | continued | |
The Group had 13eight products with over £500 million in annual global sales in 2006. 2007. Among these products isareAugmentin IR, with respect to which the Group has generic competition, andAvandia,ValtrexImitrex,Lamictal andWellbutrin XLValtrex, with respect to which the Group’s intellectual property rights in the USA are currently the subject of litigation and two others –Zofranand the 300 mg tablet version ofWellbutrin XL– with respector settlement agreements related to which thesuch litigation. Group has had generic competition in the USA forCoreg IR, another significant product, since the fourth quarter of 2006.September 2007.
<Back to Contents
| Business review | | Outlook and risk factors | continued |
| |
If these or any of the Group’s other major products were to become subject to a problem such as unplanned loss of patent protection, unexpected side effects, regulatory proceedings, publicity affecting doctor or patient confidence or pressure from competitive products, or if a new, more effective treatment should be introduced, the adverse impact on the Group’s revenues and operating results could be significant. In particular, the Group faces intense competition from manufacturers of generic pharmaceutical products in all of its major markets. Generic products often enter the market upon expiration of patents or data exclusivity periods for the Group’s products. Introduction of generic products typically leads to a dramatic loss of sales and reduces the Group’s revenues and margins for its proprietary products. The expiration dates for patents for the Group’s major products and a description of litigation settlements which may affect the dates on which generic versions of the Group’s products may be introduced are set out on page 23 and legal28. Legal proceedings involving patent challenges are set out in Note 4344 to the financial statements, ‘Legal proceedings’. Governmental and payer controls
Pharmaceutical products are subject to price controls or pressures and other restrictions in many markets, including Japan, Germany, Spain, France and Italy. Some governments intervene directly in setting prices. In addition, in some markets major purchasers of pharmaceutical products (whether governmental agencies or private health care providers) have the economic power to exert substantial pressure on prices or the terms of access to formularies. The Group cannot predict whether existing controls, pressures or restrictions will increase or new controls, pressures or restrictions will be introduced that will reduce the Group’s margins or affect adversely its ability to introduce new products profitably. For example, in the USA, where the Group has its highest margins and the most sales for any country, pricing pressures could significantly increase following implementation of the pharmaceutical benefit under Medicare or in the event that other state programmes to control the cost of prescription drugs are adopted. Asas experience develops under the Medicare programme outpatient pharmaceutical coverage for itsprogramme covering Medicare beneficiaries that began in 2006, the US government, or the2006. The private insurers through which coverage is offered, through their enormous purchasing power under the programme, could demand discounts that may implicitly create price controls on prescription drugs. Changes to the enabling legislation could afford the US government a direct role in negotiating prices under the Medicare programme. Additionally a number of states have proposed or implemented various schemes to control prices for their own senior citizens’ programmes, including importation from other countries and bulk purchases of drugs. The growth in the number of patients covered through large managed care institutions in the USA, which is likely to increasehas increased with implementation of the Medicare benefit, also increases pricing pressures on the Group’s products. These trends may adversely affect the Group’s revenues and margins from sales in the USA. Regulatory controls
The Group must comply with a broad range of regulatory controls on the testing, approval, manufacturing and marketing of many of its pharmaceutical and consumer healthcare products, particularly in the USA and countries of the European Union, that affect not only the cost of product development but also the time required to reach the market and the uncertainty of successfully doing so. Health authorities have increased their focus on safety when assessing the benefit risk/balance of drugs in the context of not only initial product approval but also in the context of approval of additional indications and review of information regarding marketed products. Stricter regulatory controls also heighten the risk of changes in product profile or withdrawal by regulators on the basis of post-approval concerns over product safety, which wouldcould reduce revenues and can result in product recalls and product liability lawsuits. There is also greater regulatory scrutiny, especially in the USA, on advertising and promotion and in particular on direct-to-consumer advertising. In addition, in some cases the Group may voluntarily cease marketing a product (for example, the withdrawal ofLotronexin 2000 shortly after its initial launch in the USA) or face declining sales based on concerns about efficacy or safety (for example, declines in sales ofAvandia in 2007 following publicity around questions regarding risks associated with the product), whether or not scientifically justified, even in the absence of regulatory action. The development of the post-approval adverse event profile for a product or the product class may have a major impact on the marketing and sale of the product. Risk of interruption of product supply
The manufacture of pharmaceutical products and their constituent materials requires compliance with good manufacturing practice regulations. The Group’s manufacturing sites are subject to review and approval by the FDA and other regulatory agencies. Compliance failure by suppliers of key services and materials or the Group’s own manufacturing facilities could lead to product recalls and seizures, interruption of production and delays in the approvals of new products pending resolution of manufacturing issues. Non-compliance can also result in fines and disgorgement of profits. Any interruption of supply or fines or disgorgement remedy could materially and adversely affect the Group’s financial results. The Group’s Cidra, Puerto Rico facility has worked atFor example, during resolution of FDA observations of deficiencies in manufacturing practices and is subject to a consent decree entered into withat the FDA during 2005,Group’s Cidra, Puerto Rico facility, as referred to in Note 4344 to the financial statements, ‘Legal proceedings’. As a consequence of those discussions,, supplies of certain products manufactured at Cidrathat site were curtailed or constricted which had an adverse impact on sales in 2005 and 2006. Although the Group undertakes business continuity planning, single sourcing for certain components, bulk active materials and finished products creates a risk of failure of supply in the event of regulatory non-compliance or physical disruption at the manufacturing sites. Risk from concentration of sales to wholesalers
In the USA, in line with other pharmaceutical companies, the Group sells its products through a small number of wholesalers in addition to hospitals, pharmacies, physicians and other groups. Sales to the three largest wholesaleswholesalers amounted to approximately 80%85% of the Group’s US pharmaceutical sales. At 31st December 20062007 the Group had trade receivables due from these three wholesalers totalling £1,044£915 million (31st December 20052006 – £1,051£1,044 million). The Group is exposed to a concentration of credit risk in respect of these wholesalers such that, if one or more of them is affected by financial difficulty, it could materially and adversely affect the Group’s financial results.
| 52 |
| GSK Annual Report 20062007 | 46 | |
<Back to Contents | Business review | | | | Outlook and risk factors | | | | | | | Business review | | Outlook and risk factors | | continued |
| | |
Reliance on information technology
The Group is increasingly dependent on information technology systems, including Internet-based systems, for internal communication as well as communication with customers and suppliers. Any significant disruption of these systems, whether due to computer viruses or other outside incursions, could materially and adversely affect the Group’s operations. Taxation
The effective tax rate on the Group’s earnings benefits from the fact that a portion of its earnings is taxed at more favourable rates in some jurisdictions outside the UK. Changes in tax laws or in their application with respect to matters such as transfer pricing, and the risk of double taxation that relate to the portion of the Group’s earnings taxed at more favourable rates,foreign dividends, controlled companies or a restriction in tax relief allowed on the interest on intra-Group debt, could increase the Group’s effective tax rate and adversely affect its financial results. In 2006 the Group resolved the claims by the US Internal Revenue Service related to Glaxo heritage products. The Group has open issues with the revenue authorities in the UK, the USA, Japan and Canada. These matters are discussed in Note 1214 to the financial statements, ‘Taxation’. Disruption from pandemic influenza
In the event of pandemic influenza, the Group could be subject to disruption from a range of factors. National governments may be more willing to abrogate intellectual property rights for medicines that might otherwise be in short supply. In a country afflicted by pandemic ‘flu, there would be a risk that employees and their families will be affected with the consequence that sales and distribution and manufacturing activities could be shut down and supply continuity – for active ingredients and finished goods – affected. Environmental liabilities
The environmental laws of various jurisdictions impose actual and potential obligations on the Group to remediate contaminated sites. The Group has also been identified as a potentially responsible party under the US Comprehensive Environmental Response Compensation and Liability Act at a number of sites for remediation costs relating to the Group’s use or ownership of such sites. Failure to manage properly the environmental risks could result in additional remedial costs that could materially and adversely affect the Group’s operations. See Note 4344 to the financial statements, ‘Legal proceedings’, for a discussion of environmental-related proceedings in which the Group is involved. Global political and economic conditions
The Group conducts a substantial portion of its operations outside the UK. The Group’s management of foreign exchange rates is discussed in Business Review, ‘Foreign exchange risk management’ (see page 43)49). Fluctuations in exchange rates between Sterling and other currencies, especially the US dollar, the Euro and the Japanese Yen, could materially affect the Group’s financial results. The Group has no control over changes in inflation and interest rates, foreign currency exchange rates and controls or other economic factors affecting its businesses or the possibility of political unrest, legal and regulatory changes or nationalisation in jurisdictions in which the Group operates. These factors could materially affect the Group’s future results of operations. Accounting standards
New or revised accounting standards, rules and interpretations promulgated from time to time by international or US accounting standard setting boardsboard could result in changes to the recognition of income and expense that may adversely impact the Group’s reported financial results. International and US accounting standardsstandard changes in the market valuation of certain financial instruments (such as the equity collar linked to the Group’s investment in Quest Diagnostics the put and call options linked to the Group’s strategic alliance with Theravance and impairments of equity investments) are reflected in the Group’s reported results before those gains or losses are actually realised and could have a significant impact on the income statement in any given period. Also under international accounting standards, accounting for deferred taxation on inter-company inventory may give rise to volatility depending upon the ownership of the inventory at the balance sheet date. Regulators regularly review the financial statements of listed companies like GSK for compliance with accounting and regulatory requirements. The Group believes that it complies with the appropriate regulatory requirements concerning its financial statements and disclosures. However, other companies have experienced investigations into potential non-compliance with accounting and disclosure requirements that have resulted in restatements of previously reported results and sometimes significant penalties. Human resources
The Group has approximately 100,000103,000 employees around the world and is subject to laws and regulations concerning its employees – ranging from discrimination and harassment to personal privacy to labour relations – that vary significantly from jurisdiction to jurisdiction. The Group faces intense competition for qualified individuals from other pharmaceutical and biotechnology companies, universities, governmental entities and other research institutions. Failure to continue to recruit and retain the right people and maintain a culture of compliance could have a significant adverse effect on the Group.
|
| GSK Annual Report 20062007 | 53 | 47 | |
<Back to Contents | | | | REPORT OF THE DIRECTORS | | Financial review 2006 | | |
| | | Business review | | Financial review 2006 | Financial review 2005 | |
| | |
In accordance with US SEC disclosure requirements, the following discussion compares results for the year to 31st December 20052006 with the results for the year to 31st December 2004. The information has been prepared under IFRS.2005. All growth rates are at constant exchange rates (CER) unless otherwise stated. The sterling growth rates may be found in the tables of pharmaceutical turnover by therapeutic area on page 50.55. Exchange The currencies that most influence the Group’s results are the US dollar, the Euro and the Japanese Yen. In 2005,2006, the US dollar strengthenedfell by over 10%14% against the pound, rising to $1.72$1.96 at the year-end. The year-end following two years of weakness. Bothrates for the Euro weakened by 1% and the Japanese Yen year-end rates weakenedby 15% against the pound by just over 3%.Sterling. World market – pharmaceuticals Global pharmaceutical sales increased by 6%8% in 20052006 to £302£328 billion. | World market by | Value | | % of | | Growth | | Value | | % of | | Growth | | | geographic region | £bn | | total | | £% | | £bn | | total | | £% | |
|
| |
| | | USA | 132.0 | | 44 | | 3 | | 145.0 | | 44 | | 9 | | | Europe | 86.8 | | 29 | | 8 | | 92.8 | | 28 | | 6 | | | France | | 17.6 | | 5 | | 4 | | | Germany | 16.4 | | 5 | | 8 | | 16.6 | | 5 | | 3 | | | France | 15.9 | | 5 | | 9 | | | | UK | 10.5 | | 3 | | – | | 10.8 | | 3 | | 3 | | | Italy | 9.9 | | 3 | | 3 | | 10.5 | | 3 | | 7 | | | Japan | 32.5 | | 11 | | 4 | | 31.3 | | 10 | | (3 | ) | | Asia Pacific | 20.5 | | 7 | | 13 | | 23.3 | | 7 | | 14 | | | Latin America | 13.7 | | 4 | | 15 | | 15.9 | | 5 | | 21 | | | Middle East, Africa | 9.8 | | 3 | | 17 | | 11.3 | | 3 | | 13 | | | Canada | 7.0 | | 2 | | 14 | | 8.3 | | 3 | | 19 | |
|
| |
| | | Total | 302.3 | | 100 | | 6 | | 327.9 | | 100 | | 8 | |
|
| |
| |
Growth in the US market has slowedmarketincreased to 3%9%, but it still representsrepresenting 44% of the global prescription pharmaceutical market compared with 30% a decade ago.earlier. At 30th September 2005,2006, GSK held second position in the world pharmaceutical market with a market share of 6.3%, behind Pfizer with a market share of 8.9% 8%. GSK had eightsix of the world’s top 60 pharmaceutical products. These wereAvandia,Flixonase, Imigran/Imitrex,Lamictal,Seretide/Advair,,Seroxat/Paxil Valtrex,WellbutrinandZofran. | | | | | | Growth | | | | World market – | Value | | % of | |
| | | | top five therapeutic classes | £bn | | total | | CER% | | £% | | | | World market – top five therapeutic classes | | Value | | % of | | Growth | | | £bn | | total | | CER% | | £% | |
|
| |
| | | Cardiovascular | 50.7 | | 17 | | 7 | | 6 | | 54.5 | | 17 | | 6 | | 7 | | | Central nervous system | 49.7 | | 16 | | 6 | | 4 | | 54.0 | | 16 | | 7 | | 8 | | | Alimentary tract and metabolic | 36.6 | | 12 | | 6 | | 5 | | 39.8 | | 12 | | 7 | | 9 | | | Anti-infectives (bacterial, viral and fungal) excluding vaccines | 32.2 | | 11 | | 7 | | 5 | | 33.2 | | 10 | | 1 | | 3 | | | Respiratory | 20.7 | | 7 | | 8 | | 7 | | 21.7 | | 7 | | 5 | | 6 | |
|
| |
| | | (Note: data based on 12 months to 30th September 2005.) | | | (Note: data based on 12 months to 30th September 2006.) | | (Note: data based on 12 months to 30th September 2006.) | |
Pharmaceutical turnover All growth rates included in the review of turnover are at constant exchange rates (CER) unless otherwise stated. The sterling growth rates may be found in the tables of pharmaceutical turnover. Total pharmaceutical turnover in 20052006 was £18,661£20,078 million compared with £17,100£18,661 million in 2004,2005, an increase of 8%9% CER. In sterling terms total pharmaceutical turnover increased 9%8%, 1% less than CER due principally due to the strength of the Euro and otherSterling against major International currencies. Pharmaceutical turnover by therapeutic area GSK’s ability to continuein 2006 to deliver continued pharmaceutical turnover growth iswas primarily due to an exceptionally broad product portfolio of fast-growing, high-value products. Salesgrowth products coupled with sales and marketing excellence. These growth products includeSeretide/Advair, the Avandia product group, Vaccines,Lamictal,Valtrex,Coreg,Requip,Avodart andBoniva. Respiratory
GSK continued to be the global leader in respiratory pharmaceuticals with sales of GSK’s largest product, its three key products,Seretide/Advair were,Flixotide/FloventandSerevent amounting to £4.3 billion, up 22%9%. Total sales ofSeretide/Advair, for asthma and COPD, rose 11% to £3.0£3.3 billion. In the USA, sales grew 13% to £1.9 billion. In Europe, sales grew 10% to £1.1 billion and continuedin International markets, sales grew 9% to gain market share across all regions.over £300 million. Market share by value in the anti-asthma and COPD therapy class was 27%29% in Europe and 33% in the USA, an increase of 2 percentage points in both cases comparedEurope and a flat market share growth in the USA (reflecting lower prescription volumes due to a label change in early 2006 that restricted GSK’s ability to promote the product, offset by favourable pricing changes). CNS
CNS sales increased 15% to £3.6 billion. Sales increased in the USA and International, but declined in Europe due to generic competition. TotalSeroxat/Paxil sales grew 4% to £620 million, due to strong growth ofPaxil CR in the USA andPaxil IR in Japan partly offset by generic competition toPaxil IR in Europe. TotalWellbutrin sales grew 24% to £900 million. Sales ofWellbutrin XL, a once-daily product, grew 25% to £798 million. In December 2006, generic competition to theWellbutrin XL300mg tablet (approximately 60% ofWellbutrin sales) entered the US market. Sales ofLamictal, for the treatment of epilepsy and bipolar disorder, grew 19% to just under £1 billion, benefiting from its new indication to treat one of the most serious forms of epilepsy – primary generalised tonic-clonic seizures.Lamictal is also the only medicine with 2004. long-term clinical data that demonstrates that it can delay the onset of depressive episodes of bipolar disorder. Sales of diabetes treatmentsRequip, for Parkinson’s disease and Restless Legs Syndrome (RLS), grew 74% to £268 million.
| 54 | GSK Annual Report 2007 | | |
Back to Contents | | | REPORT OF THE DIRECTORS | | | Financial review 2006 | | | | | | | Business review | | Financial review 2006 | | continued | | |
Pharmaceutical turnover by therapeutic area 2006 | | | | | | | | | Total | | | | | | USA | | | | | | Europe | | | | International | |
| | | Therapeutic area/ | % of | | 2006 | 2005 | | | | Growth | | 2006 | | | | Growth | | 2006 | | | | Growth | | 2006 | | | | Growth | | | major products | total | | £m | £m | | CER% | | £% | | £m | | CER% | | £% | | £m | | CER% | | £% | | £m | | CER% | | £% | |
| | | Respiratory | 27 | | 4,995 | 5,054 | | – | | (1 | ) | 2,461 | | (3 | ) | (5 | ) | 1,697 | | 3 | | 2 | | 837 | | 4 | | 3 | | | Seretide/Advair | | | 3,313 | 3,003 | | 11 | | 10 | | 1,870 | | 13 | | 11 | | 1,133 | | 10 | | 10 | | 310 | | 9 | | 10 | | | Flixotide/Flovent | | | 659 | 638 | | 5 | | 3 | | 298 | | 16 | | 14 | | 173 | | (8 | ) | (8 | ) | 188 | | 2 | | – | | | Serevent | | | 291 | 330 | | (10 | ) | (12 | ) | 86 | | (16 | ) | (17 | ) | 140 | | (13 | ) | (13 | ) | 65 | | 5 | | (2 | ) | | Flixonase/Flonase | | | 311 | 656 | | (52 | ) | (53 | ) | 184 | | (63 | ) | (64 | ) | 51 | | (15 | ) | (15 | ) | 76 | | (14 | ) | (16 | ) |
| | | Central nervous system | 17 | | 3,642 | 3,219 | | 15 | | 13 | | 2,588 | | 28 | | 26 | | 595 | | (15 | ) | (15 | ) | 459 | | 2 | | (1 | ) | | Seroxat/Paxil | | | 620 | 615 | | 4 | | 1 | | 175 | | 35 | | 32 | | 149 | | (20 | ) | (20 | ) | 296 | | 5 | | – | | | Paxil IR | | | 448 | 488 | | (5 | ) | (8 | ) | 19 | | 11 | | 6 | | 149 | | (20 | ) | (20 | ) | 280 | | 4 | | (1 | ) | | Paxil CR | | | 172 | 127 | | 37 | | 35 | | 156 | | 38 | | 36 | | – | | – | | – | | 16 | | 25 | | 33 | | | Wellbutrin | | | 900 | 739 | | 24 | | 22 | | 882 | | 24 | | 22 | | 2 | | – | | – | | 16 | | 7 | | 14 | | | Wellbutrin IR, SR | | | 102 | 92 | | 12 | | 11 | | 89 | | 14 | | 11 | | 2 | | – | | – | | 11 | | – | | 10 | | | Wellbutrin XL | | | 798 | 647 | | 25 | | 23 | | 793 | | 25 | | 23 | | – | | – | | – | | 5 | | 25 | | 25 | | | Imigran/Imitrex | | | 711 | 697 | | 3 | | 2 | | 551 | | 11 | | 9 | | 118 | | (18 | ) | (18 | ) | 42 | | (12 | ) | (14 | ) | | Lamictal | | | 996 | 849 | | 19 | | 17 | | 765 | | 37 | | 35 | | 175 | | (22 | ) | (23 | ) | 56 | | 2 | | 2 | | | Requip | | | 268 | 156 | | 74 | | 72 | | 176 | | >100 | | >100 | | 81 | | 21 | | 19 | | 11 | | 25 | | 38 | |
| | | Anti-virals | 14 | | 2,827 | 2,598 | | 10 | | 9 | | 1,354 | | 7 | | 5 | | 855 | | 11 | | 11 | | 618 | | 16 | | 14 | | | HIV | | | 1,515 | 1,554 | | (1 | ) | (3 | ) | 700 | | (7 | ) | (9 | ) | 621 | | 3 | | 2 | | 194 | | 8 | | 7 | | | Combivir | | | 528 | 583 | | (9 | ) | (9 | ) | 238 | | (14 | ) | (16 | ) | 217 | | (4 | ) | (4 | ) | 73 | | – | | – | | | Trizivir | | | 268 | 303 | | (11 | ) | (12 | ) | 141 | | (13 | ) | (15 | ) | 113 | | (7 | ) | (8 | ) | 14 | | (7 | ) | – | | | Epivir | | | 202 | 261 | | (21 | ) | (23 | ) | 69 | | (25 | ) | (26 | ) | 90 | | (26 | ) | (26 | ) | 43 | | (2 | ) | (7 | ) | | Ziagen | | | 117 | 136 | | (13 | ) | (14 | ) | 48 | | (11 | ) | (13 | ) | 41 | | (24 | ) | (24 | ) | 28 | | 4 | | 4 | | | Agenerase, Lexiva | | | 131 | 112 | | 18 | | 17 | | 74 | | 7 | | 6 | | 48 | | 40 | | 37 | | 9 | | 14 | | 29 | | | Epzicom/Kivexa | | | 241 | 118 | | >100 | | >100 | | 125 | | 49 | | 47 | | 97 | | >100 | | >100 | | 19 | | >100 | | >100 | | | Herpes | | | 965 | 826 | | 19 | | 17 | | 610 | | 30 | | 28 | | 144 | | 4 | | 4 | | 211 | | 3 | | – | | | Valtrex | | | 845 | 695 | | 24 | | 22 | | 600 | | 30 | | 28 | | 109 | | 12 | | 11 | | 136 | | 10 | | 7 | | | Zovirax | | | 120 | 131 | | (6 | ) | (8 | ) | 10 | | 67 | | 67 | | 35 | | (15 | ) | (15 | ) | 75 | | (7 | ) | (11 | ) | | Zeffix | | | 162 | 145 | | 12 | | 12 | | 13 | | 8 | | 8 | | 23 | | 10 | | 10 | | 126 | | 13 | | 13 | | | Relenza | | | 91 | 5 | | >100 | | >100 | | – | | – | | – | | 62 | | >100 | | >100 | | 29 | | >100 | | >100 | |
| | | Metabolic | 8 | | 1,875 | 1,495 | | 27 | | 25 | | 1,277 | | 30 | | 28 | | 252 | | 33 | | 33 | | 346 | | 12 | | 12 | | | Avandia | | | 1,399 | 1,154 | | 23 | | 21 | | 1,068 | | 26 | | 24 | | 125 | | 13 | | 12 | | 206 | | 13 | | 16 | | | Avandamet | | | 204 | 175 | | 17 | | 17 | | 86 | | (22 | ) | (24 | ) | 92 | | >100 | | >100 | | 26 | | 41 | | 53 | | | Avandaryl | | | 42 | – | | – | | – | | 40 | | – | | – | | – | | – | | – | | 2 | | – | | – | | | Bonviva/Boniva | | | 95 | 18 | | >100 | | >100 | | 83 | | >100 | | >100 | | 12 | | >100 | | >100 | | – | | – | | – | |
| | | Vaccines | 8 | | 1,692 | 1,389 | | 23 | | 22 | | 465 | | 40 | | 38 | | 709 | | 20 | | 20 | | 518 | | 13 | | 13 | | | Hepatitis | | | 479 | 444 | | 9 | | 8 | | 161 | | 21 | | 18 | | 227 | | 2 | | 2 | | 91 | | 8 | | 10 | | | Infanrix, Pediarix | | | 511 | 431 | | 29 | | 28 | | 172 | | 20 | | 18 | | 281 | | 40 | | 39 | | 58 | | 12 | | 12 | | | Boostrix | | | 60 | 29 | | >100 | | >100 | | 41 | | >100 | | >100 | | 15 | | 88 | | 88 | | 4 | | 67 | | 33 | |
| | | Cardiovascular and urogenital | 7 | | 1,636 | 1,331 | | 24 | | 23 | | 1,072 | | 42 | | 40 | | 395 | | (4 | ) | (5 | ) | 169 | | 13 | | 13 | | | Coreg | | | 779 | 573 | | 38 | | 36 | | 773 | | 38 | | 36 | | – | | – | | – | | 6 | | 20 | | 20 | | | Levitra | | | 43 | 40 | | 8 | | 8 | | 41 | | 20 | | 17 | | 1 | | (75 | ) | (75 | ) | 1 | | – | | – | | | Avodart | | | 216 | 129 | | 69 | | 67 | | 131 | | >100 | | >100 | | 69 | | 25 | | 25 | | 16 | | 67 | | 78 | | | Arixtra | | | 58 | 24 | | >100 | | >100 | | 32 | | >100 | | >100 | | 23 | | >100 | | >100 | | 3 | | >100 | | >100 | | | Fraxiparine | | | 209 | 211 | | (1 | ) | (1 | ) | – | | – | | – | | 179 | | – | | – | | 30 | | (6 | ) | (6 | ) |
| | | Anti-bacterials | 8 | | 1,369 | 1,519 | | (9 | ) | (10 | ) | 217 | | (15 | ) | (17 | ) | 628 | | (12 | ) | (13 | ) | 524 | | (2 | ) | (3 | ) | | Augmentin | | | 570 | 666 | | (14 | ) | (14 | ) | 94 | | (31 | ) | (32 | ) | 268 | | (15 | ) | (15 | ) | 208 | | – | | (1 | ) | | Zinnat/Ceftin | | | 164 | 197 | | (16 | ) | (17 | ) | 12 | | 20 | | 20 | | 82 | | (27 | ) | (27 | ) | 70 | | (5 | ) | (7 | ) |
| | | Oncology and emesis | 5 | | 1,069 | 1,016 | | 7 | | 5 | | 836 | | 12 | | 10 | | 153 | | (7 | ) | (7 | ) | 80 | | (11 | ) | (12 | ) | | Zofran | | | 847 | 837 | | 3 | | 1 | | 679 | | 8 | | 6 | | 107 | | (14 | ) | (14 | ) | 61 | | (16 | ) | (18 | ) | | Hycamtin | | | 113 | 99 | | 15 | | 14 | | 72 | | 11 | | 9 | | 34 | | 26 | | 26 | | 7 | | 17 | | 17 | |
| | | Other | 6 | | 973 | 1,040 | | (5 | ) | (6 | ) | 83 | | 19 | | 19 | | 263 | | (19 | ) | (18 | ) | 627 | | (1 | ) | (3 | ) | | Zantac | | | 232 | 244 | | (2 | ) | (5 | ) | 72 | | 28 | | 24 | | 52 | | (19 | ) | (19 | ) | 108 | | (7 | ) | (11 | ) |
| | | | 100 | | 20,078 | 18,661 | | 9 | | 8 | | 10,353 | | 16 | | 14 | | 5,547 | | 1 | | – | | 4,178 | | 6 | | 4 | |
| |
CER% represents growth at constant exchange rates. £% represents growth at actual exchange rates. | GSK Annual Report 2007 | 55 | | |
Back to Contents | | | REPORT OF THE DIRECTORS | | Financial review 2006 | | | | | | Business review | | Financial review 2006 | | continued | |
Anti-virals
Total sales of HIV products were also£1.5 billion, down 1%. Competition to older products,Combivir down 9% to £528 million andEpivirdown 21% to £202 million, was mostly offset by strong with Avandia/Avandametsales growth of new productsEpzicom/Kivexa which more than doubled to £241 million andLexiva/Agenerase up 18% to £1.3 billion. £131 million. Sales ofValtrex, rose 24% to £845 million, with US sales up 30% to £600 million driven by patients switching to suppression therapy. Metabolic
GSK launchedAvandia for the treatment of type 2 diabetes in 1999 and a combination product,Avandamet, for blood sugar control in 2002. The product group was expanded further in February 2006 with the launch in the USA of a fixed-dose combination treatment,Avandaryl, which combinesAvandia with a sulfonylurea. In 2005, Avandia/2006, sales of theAvandia product group grew 24% to £1.2 billion in the USA. In Europe, sales grew 39% to £217 million driven by the increasing use ofAvandamet. Sales in International markets rose 17% to £234 million. TheAvandia product group achieved in 2006 a market share by value in oral anti-diabetics of 14% in Europe and 35% in the USA, up 3 and 6 percentage points, respectively. Other fast growing products wereLamictalfor epilepsy/bipolar disorder, up 24% (£0.8 billion),Valtrexfor herpes, up 21% (£0.7 billion),Coregfor heart disease, up 32% (£0.6 billion) and vaccines, up 15% (£1.4 billion).
In addition, in 2005 there was a rapid uptake of a number of high potential products such asRequip, for restless legs syndrome (sales up 34% to £156 million),Avodartfor benign prostatic hyperplasia (sales doubled to £129 million) andBoniva/Bonvivafor the treatment of osteoporosis, which was launched in 2005 and captured a 10% share of new prescriptions for oral bisphosphonates in the US market.
Respiratory
GSK continues to be the global leader in respiratory pharmaceuticals with sales of its three key products,Seretide/Advair,Flixotide/FloventandSerevent,amounting to £4.0 billion, up 15%.Seretide/Advairsales rose 26% to £1.7 billion in the USA. Sales were also strong in both European and International markets, which were up 16% to £1 billion and £0.3 billion, respectively.
Central nervous system (CNS)
CNS sales declined 8% to £3.2 billion. Sales declined37% in the USA and 19% in Europe, with a small gain in International. TotalPaxilsales fell 42% to £615 million, due to generic competitionup 2 and the interruption in supply toPaxil CRduring the year. See ‘Product supply’ on page 49. Partially mitigating this decline was the strong performance ofPaxilin Japan, up 17% to £197 million.
<Back to Contents
| Business review | | Financial review 2005 | continued |
| |
TotalWellbutrinturnover fell 2% to £739 million.Wellbutrin IRandSRsales fell 68% to £92 million due to generic competition, but this was largely offset by the very strong performance ofWellbutrin XL(up 38% to £647 million).
The strong growth of GSK’s epilepsy and bi-polar disorder treatmentLamictalcontinued, with sales up 24% to £849 million, driven by the indication for the maintenance treatment of bi-polar disorder.
Requipsales rose 34% to £156 million. By Q1 2006, weekly new prescriptions for the product have quadrupled in the USA since it was launched for restless legs syndrome (RLS) in Q2 2005.
Anti-virals
Global HIV product sales grew 5% to £1.6 billion, with sales from new productsEpzicom/KivexaandLexiva(together more than doubling to £226 million) offsetting the performance ofTrizivir(down 6% to £303 million) andEpivir(down 12% to £261 million). Sales of the herpes treatmentValtrexgrew 21% to £695 million. Performance is being driven by the USA (up 26% to £470 million) where the product is the clear market leader in treatments for genital herpes.
Anti-bacterials
Anti-bacterial sales declined 3% worldwide.5 percentage points, respectively. In the USA,Avandamet prescription volume growth was adversely impacted by product supply issues during the decline was 27% reflecting increased generic competition.year which have now been resolved.
Metabolic
The diabetes treatmentsIn December, GSK presented data from the landmark ADOPT study, which demonstrated thatAvandia/AvandametAvandiacontinued is more effective than metformin, or a sulphonylurea, in long-term blood sugar control in type 2 diabetes. These data are in addition to perform very strongly,those recently presented from the DREAM study, which showed thatAvandia can reduce the risk of progression to type 2 diabetes. Data from both these studies are expected to be filed with overall salesregulatory agencies during the first half of £1.3 billion, up 18%. In the USA, sales grew 14% to £977 million.Avandia/Avandametare also establishing strong positions in Europe, with sales rising 52% to £157 million, helped by the launch ofAvandamet. Sales in International markets rose 13% to £195 million.2007.
GSK recorded in turnover a £95 million share of co-promotion income forBoniva/Bonviva, a new once-monthly oral bisphosphonate for the treatment of postmenopausal osteoporosis, which was developed with Roche, had a strong launchand launched in the USA and in February 2006 had a 10% share of new prescriptions for oral bisphosphonates.Bonivainjection, the first-ever quarterly treatment for osteoporosis, was approved in the USA in January 2006 and received a positive opinion from the CHMP in Europe on 27th January 2006.2005. Vaccines
The vaccines business performed well,Overall vaccine sales increased 23% to £1.7 billion, with totalgood performances from all regions: US sales rising 15%rose 40% to £1.4 billion, led byInfanrix. Vaccine£465 million; European sales were particularly strong in the USA, where turnover rose 26%grew 20% to £338 million, helped by the launch of two new products,FluarixandBoostrix. In July, GSK acquired Corixa Corporation for £150£709 million and sales in December, completedInternational were up 13% to £518 million. Key contributors were:Infanrix/ Pediarix, GSK’s combination vaccines for children, with sales up 29% to £511 million; and sales of hepatitis vaccines, which grew 9% to £479 million, benefiting from a strong US performance ofHavrix, following approval last year for broader paediatric use.
Sales of new vaccines also helped drive overall sales growth. Total sales ofRotarix, for rotavirus,Boostrix, for prevention of diphtheria, tetanus and whooping cough, and influenza vaccines,Fluarix/ FluLaval, reached £274 million, up 91%. This was the first full year sales ofFluLaval following the acquisition of ID Biomedical Corporation for £0.9 billion.in late 2005. Oncology and emesis
Sales ofZofrangrew 9%3% to £837£847 million, driven by the US market, up 12%8% to £639£679 million. Europe and International sales declined 14% and 16% respectively due to generic competition. A generic competitor toZofran entered the US market in November 2006. Cardiovascular and urogenital
Sales ofCoreg, for heart disease, grew 32%38% to £573£779 million. Avodart, for benign prostatic hyperplasia (enlarged prostate), had a very strong year, with sales doublingincreasing 69% to £129£216 million. By January 2006 the product accounted for 42% of new prescriptions in the US 5-Alpha Reductase Inhibitor market. Anti-bacterials
Anti-bacterial sales declined 9% reflecting generic competition and a weaker ‘flu season. Other therapeutic areas
Sales ofZantacfell 12%2% to £244£232 million, with declines in all regions.Europe and International partially offset by a 28% growth in the USA. Product supplyConsumer Healthcare sales
Following FDA inspections in October 2003 and November 2004, which identified possible deficiencies in manufacturing practices at the Group’s facility at Cidra in Puerto Rico, the FDA halted distributionAn analysis of supplies ofPaxil CRandAvandametin March 2005. This site is engaged in tableting and packaging for a range of GSK products, primarily for the US market includingPaxil,Paxil CR,Coreg,AvandiaandAvandamet. In April 2005, the Group reached agreement with the FDA on a Consent Decree, which provides for an independent expert to review manufacturing processes at the site for compliance with FDA Good Manufacturing Practice requirements. The Decree also allows for potential future penalties, up to a maximum of $10 million a year, if GSK fails to meet its terms.
In June 2005, the Group began re-supplying the US and other markets with bothPaxil CRandAvandamet. The sales of these products were significantly impacted in 2005 by this interruption in supply. The impact onAvandametwas mitigated by the switching of patients toAvandia. In 2005, the Group also established a provision for the external costs required to rectify the manufacturing issues at the plant. For further details see Risk factors on pages 44 to 47 and Note 43 to the financial statements, ‘Legal proceedings’.
| Consumer Healthcare sales | | | | | | | | | | | | | Growth | | | | 2005 | | 2004 | |
| | | | £m | | £m | | CER% | | £% | |
|
|
|
|
|
|
|
| | | OTC medicines | 1,437 | | 1,400 | | 1 | | 3 | | | Analgesics | 362 | | 333 | | 6 | | 9 | | | Dermatological | 161 | | 180 | | (12 | ) | (11 | ) | | Gastro-intestinal | 249 | | 241 | | 1 | | 3 | | | Respiratory tract | 154 | | 145 | | 5 | | 6 | | | Smoking control | 336 | | 327 | | 2 | | 3 | | | Natural wellness support | 133 | | 136 | | (4 | ) | (2 | ) | | Oral care | 943 | | 913 | | 2 | | 3 | | | Nutritional healthcare | 619 | | 573 | | 7 | | 8 | |
|
|
|
|
|
|
|
| | | | 2,999 | | 2,886 | | 2 | | 4 | |
|
|
|
|
|
|
|
| |
The growth in Consumer Healthcare sales of 2%is set out in the following table:
| | 2006 | | 2005 | | Growth | | | | £m | | £m | | CER% | | £% | |
| | | OTC medicines | 1,496 | | 1,437 | | 5 | | 4 | | | Analgesics | 380 | | 362 | | 7 | | 5 | | | Dermatological | 165 | | 161 | | 4 | | 2 | | | Gastro-intestinal | 252 | | 249 | | 2 | | 1 | | | Respiratory tract | 172 | | 154 | | 12 | | 12 | | | Smoking control | 353 | | 336 | | 7 | | 5 | | | Natural wellness support | 132 | | 133 | | – | | (1 | ) | | Oral care | 993 | | 943 | | 6 | | 5 | | | Nutritional healthcare | 658 | | 619 | | 7 | | 6 | |
| | | | 3,147 | | 2,999 | | 6 | | 5 | |
| |
Consumer Healthcare sales grew 6% to £3.0£3.1 billion, comprisedwith sales in International up 10% and Europe up 7%, performing well. Total sales in the USA were flat, with an improved performance in the fourth quarter, with sales up 7%. OTC medicines
Over-the-counter medicine sales increase of 1%, a Nutritional healthcare sales increase of 7%grew 5% to £1.5 billion withPanadol and an smoking control performing well. Oral care
Oral care sales increasegrew 6% to £993 million.Sensodyne grew strongly, up 19% for the year to £257 million. Sales of 2%.Aquafresh were down 3% to £283 million. Nutritional healthcare
Nutritional healthcare products sales grew 7% to £658 million.Lucozade, grew 14% to £301 million, andHorlicks, grew 6% to £156 million.Ribena sales were down 1% to £169 million.
| 56 |
| GSK Annual Report 20062007 | 49 | |
<Back to Contents | Financial review 2006 | | | | | | | Business review | | Financial review 20052006 | | continued |
| |
Pharmaceutical turnover by therapeutic area 2005
| Total | | USA | | Europe | | International | |
|
|
|
|
|
|
|
|
|
|
|
|
|
|
|
|
|
|
|
|
|
|
|
|
|
|
|
|
|
|
|
|
|
|
|
| | | | | | | | | | Growth | | | | | Growth | | | | | Growth | | | | | Growth | | | Therapeutic area/ | % of | | 2005 | | 2004 | | |
| | 2005 | | |
| | 2005 | | |
| | 2005 | | |
| | major products | total | | £m | | £m | | | CER% | | | £% | | £m | | | CER% | | | £% | | £m | | | CER% | | | £% | | £m | | | CER% | | | £% | |
|
|
|
|
|
|
|
|
|
|
|
|
|
|
|
|
|
|
|
|
|
|
|
|
|
|
|
|
|
|
|
|
|
|
|
| | | Respiratory | 27 | | 5,054 | | 4,394 | | | 14 | | | 15 | | 2,580 | | | 17 | | | 18 | | 1,660 | | | 8 | | | 9 | | 814 | | | 13 | | | 17 | | | Seretide/Advair | | | 3,003 | | 2,441 | | | 22 | | | 23 | | 1,687 | | | 26 | | | 27 | | 1,033 | | | 16 | | | 17 | | 283 | | | 16 | | | 24 | | | Flixotide/Flovent | | | 638 | | 618 | | | 2 | | | 3 | | 262 | | | 4 | | | 4 | | 188 | | | (3 | ) | | (1 | ) | 188 | | | 3 | | | 6 | | | Serevent | | | 330 | | 349 | | | (7 | ) | | (5 | ) | 104 | | | (20 | ) | | (19 | ) | 160 | | | (3 | ) | | (1 | ) | 66 | | | 12 | | | 14 | | | Flixonase/Flonase | | | 656 | | 578 | | | 13 | | | 13 | | 506 | | | 12 | | | 12 | | 60 | | | (1 | ) | | 2 | | 90 | | | 27 | | | 30 | |
|
|
|
|
|
|
|
|
|
|
|
|
|
|
|
|
|
|
|
|
|
|
|
|
|
|
|
|
|
|
|
|
|
|
|
| | | Central Nervous System | 17 | | 3,219 | | 3,462 | | | (8 | ) | | (7 | ) | 2,051 | | | (10 | ) | | (10 | ) | 704 | | | (7 | ) | | (6 | ) | 464 | | | 2 | | | 5 | | | Seroxat/Paxil | | | 615 | | 1,063 | | | (42 | ) | | (42 | ) | 133 | | | (75 | ) | | (74 | ) | 187 | | | (26 | ) | | (25 | ) | 295 | | | – | | | 1 | | | Paxil IR | | | 488 | | 667 | | | (27 | ) | | (27 | ) | 18 | | | (87 | ) | | (87 | ) | 187 | | | (26 | ) | | (25 | ) | 283 | | | (1 | ) | | (1 | ) | | Paxil CR | | | 127 | | 396 | | | (68 | ) | | (68 | ) | 115 | | | (70 | ) | | (70 | ) | – | | | – | | | – | | 12 | | | 40 | | | 50 | | | Wellbutrin | | | 739 | | 751 | | | (2 | ) | | (2 | ) | 723 | | | (2 | ) | | (2 | ) | 2 | | | 42 | | | 100 | | 14 | | | (14 | ) | | (7 | ) | | Wellbutrin IR, SR | | | 92 | | 284 | | | (68 | ) | | (68 | ) | 80 | | | (70 | ) | | (70 | ) | 2 | | | 42 | | | 100 | | 10 | | | (35 | ) | | (23 | ) | | Wellbutrin XL | | | 647 | | 467 | | | 38 | | | 39 | | 643 | | | 37 | | | 38 | | – | | | – | | | – | | 4 | | | >100 | | | 100 | | | Imigran/Imitrex | | | 697 | | 682 | | | 1 | | | 2 | | 504 | | | 2 | | | 2 | | 144 | | | 1 | | | 1 | | 49 | | | (2 | ) | | 2 | | | Lamictal | | | 849 | | 677 | | | 24 | | | 25 | | 568 | | | 36 | | | 37 | | 226 | | | 3 | | | 4 | | 55 | | | 15 | | | 22 | | | Requip | | | 156 | | 116 | | | 34 | | | 34 | | 80 | | | 50 | | | 51 | | 68 | | | 21 | | | 21 | | 8 | | | 22 | | | 14 | |
|
|
|
|
|
|
|
|
|
|
|
|
|
|
|
|
|
|
|
|
|
|
|
|
|
|
|
|
|
|
|
|
|
|
|
| | | Anti-virals | 14 | | 2,598 | | 2,359 | | | 9 | | | 10 | | 1,285 | | | 10 | | | 10 | | 773 | | | 6 | | | 7 | | 540 | | | 12 | | | 15 | | | HIV | | | 1,554 | | 1,462 | | | 5 | | | 6 | | 766 | | | 2 | | | 3 | | 607 | | | 8 | | | 9 | | 181 | | | 12 | | | 15 | | | Combivir | | | 583 | | 570 | | | 1 | | | 2 | | 283 | | | 1 | | | 1 | | 227 | | | – | | | 1 | | 73 | | | 8 | | | 12 | | | Trizivir | | | 303 | | 322 | | | (6 | ) | | (6 | ) | 166 | | | (7 | ) | | (6 | ) | 123 | | | (5 | ) | | (5 | ) | 14 | | | (8 | ) | | (7 | ) | | Epivir | | | 261 | | 294 | | | (12 | ) | | (11 | ) | 93 | | | (33 | ) | | (33 | ) | 122 | | | 4 | | | 6 | | 46 | | | 12 | | | 15 | | | Ziagen | | | 136 | | 155 | | | (14 | ) | | (12 | ) | 55 | | | (26 | ) | | (25 | ) | 54 | | | (8 | ) | | (10 | ) | 27 | | | 11 | | | 23 | | | Retrovir | | | 41 | | 43 | | | (6 | ) | | (5 | ) | 14 | | | (17 | ) | | (18 | ) | 16 | | | (6 | ) | | – | | 11 | | | 12 | | | 10 | | | Agenerase, Lexiva | | | 112 | | 63 | | | 77 | | | 78 | | 70 | | | 50 | | | 52 | | 36 | | | >100 | | | >100 | | 6 | | | 46 | | | 20 | | | Epzicom/Kivexa | | | 118 | | 1 | | | >100 | | | >100 | | 85 | | | – | | | – | | 29 | | | >100 | | | >100 | | 4 | | | >100 | | | >100 | | | Herpes | | | 826 | | 718 | | | 14 | | | 15 | | 476 | | | 24 | | | 25 | | 139 | | | – | | | 1 | | 211 | | | 4 | | | 6 | | | Valtrex | | | 695 | | 571 | | | 21 | | | 22 | | 470 | | | 26 | | | 27 | | 98 | | | 9 | | | 9 | | 127 | | | 12 | | | 13 | | | Zovirax | | | 131 | | 147 | | | (11 | ) | | (11 | ) | 6 | | | (32 | ) | | (45 | ) | 41 | | | (16 | ) | | (15 | ) | 84 | | | (6 | ) | | (5 | ) | | Zeffix | | | 145 | | 130 | | | 9 | | | 12 | | 12 | | | 11 | | | 9 | | 21 | | | (8 | ) | | (5 | ) | 112 | | | 13 | | | 15 | |
|
|
|
|
|
|
|
|
|
|
|
|
|
|
|
|
|
|
|
|
|
|
|
|
|
|
|
|
|
|
|
|
|
|
|
| | | Anti-bacterials | 8 | | 1,519 | | 1,547 | | | (3 | ) | | (2 | ) | 261 | | | (27 | ) | | (27 | ) | 718 | | | 3 | | | 4 | | 540 | | | 5 | | | 7 | | | Augmentin | | | 666 | | 708 | | | (7 | ) | | (6 | ) | 139 | | | (38 | ) | | (38 | ) | 316 | | | 5 | | | 6 | | 211 | | | 11 | | | 13 | | | Augmentin IR | | | 552 | | 533 | | | 2 | | | 4 | | 40 | | | (34 | ) | | (32 | ) | 305 | | | 3 | | | 4 | | 207 | | | 11 | | | 14 | | | Augmentin ES, XR | | | 114 | | 175 | | | (35 | ) | | (35 | ) | 99 | | | (40 | ) | | (40 | ) | 11 | | | 97 | | | 83 | | 4 | | | (19 | ) | | (20 | ) | | Zinnat/Ceftin | | | 197 | | 205 | | | (6 | ) | | (4 | ) | 10 | | | 2 | | | 11 | | 112 | | | (9 | ) | | (7 | ) | 75 | | | (4 | ) | | (1 | ) |
|
|
|
|
|
|
|
|
|
|
|
|
|
|
|
|
|
|
|
|
|
|
|
|
|
|
|
|
|
|
|
|
|
|
|
| | | Metabolic | 8 | | 1,495 | | 1,251 | | | 18 | | | 20 | | 995 | | | 16 | | | 17 | | 190 | | | 39 | | | 43 | | 310 | | | 12 | | | 17 | | | Avandia | | | 1,154 | | 892 | | | 27 | | | 29 | | 864 | | | 31 | | | 32 | | 112 | | | 20 | | | 23 | | 178 | | | 15 | | | 22 | | | Avandamet | | | 175 | | 222 | | | (22 | ) | | (21 | ) | 113 | | | (43 | ) | | (43 | ) | 45 | | | >100 | | | >100 | | 17 | | | 2 | | | 13 | | | Bonviva/Boniva | | | 18 | | – | | | >100 | | | >100 | | 17 | | | – | | | – | | 1 | | | >100 | | | >100 | | – | | | – | | | – | |
|
|
|
|
|
|
|
|
|
|
|
|
|
|
|
|
|
|
|
|
|
|
|
|
|
|
|
|
|
|
|
|
|
|
|
|
| | Vaccines | 8 | | 1,389 | | 1,194 | | | 15 | | | 16 | | 338 | | | 26 | | | 26 | | 592 | | | 12 | | | 14 | | 459 | | | 10 | | | 13 | | | Hepatitis | | | 444 | | 405 | | | 8 | | | 10 | | 137 | | | 1 | | | 2 | | 224 | | | 11 | | | 12 | | 83 | | | 13 | | | 17 | | | Infanrix, Pediarix | | | 431 | | 356 | | | 19 | | | 21 | | 145 | | | 13 | | | 12 | | 202 | | | 24 | | | 25 | | 84 | | | 20 | | | 27 | |
|
|
|
|
|
|
|
|
|
|
|
|
|
|
|
|
|
|
|
|
|
|
|
|
|
|
|
|
|
|
|
|
|
|
|
| | | Oncology and emesis | 5 | | 1,016 | | 934 | | | 8 | | | 9 | | 761 | | | 12 | | | 12 | | 164 | | | (4 | ) | | (4 | ) | 91 | | | 1 | | | 7 | | | Zofran | | | 837 | | 763 | | | 9 | | | 10 | | 639 | | | 12 | | | 13 | | 124 | | | (5 | ) | | (5 | ) | 74 | | | 3 | | | 9 | | | Hycamtin | | | 99 | | 99 | | | (1 | ) | | – | | 66 | | | 2 | | �� | 3 | | 27 | | | (6 | ) | | (7 | ) | 6 | | | (6 | ) | | – | |
|
|
|
|
|
|
|
|
|
|
|
|
|
|
|
|
|
|
|
|
|
|
|
|
|
|
|
|
|
|
|
|
|
|
|
| | | Cardiovascular and urogenital | 7 | | 1,331 | | 932 | | | 41 | | | 43 | | 766 | | | 36 | | | 36 | | 415 | | | 57 | | | 59 | | 150 | | | 32 | | | 39 | | | Coreg | | | 573 | | 432 | | | 32 | | | 33 | | 568 | | | 33 | | | 34 | | – | | | – | | | – | | 5 | | | (30 | ) | | (29 | ) | | Levitra | | | 40 | | 49 | | | (19 | ) | | (18 | ) | 35 | | | 79 | | | 75 | | 4 | | | (78 | ) | | (81 | ) | 1 | | | (94 | ) | | (88 | ) | | Avodart | | | 129 | | 64 | | | 100 | | | >100 | | 65 | | | 90 | | | 91 | | 55 | | | >100 | | | >100 | | 9 | | | >100 | | | >100 | | | Arixtra | | | 24 | | 6 | | | >100 | | | >100 | | 15 | | | >100 | | | >100 | | 8 | | | >100 | | | >100 | | 1 | | | >100 | | | >100 | | | Fraxiparine | | | 211 | | 56 | | | >100 | | | >100 | | – | | | – | | | – | | 179 | | | >100 | | | >100 | | 32 | | | >100 | | | >100 | | | Vesicare | | | 13 | | – | | | – | | | – | | 13 | | | – | | | – | | – | | | – | | | – | | – | | | – | | | – | |
|
|
|
|
|
|
|
|
|
|
|
|
|
|
|
|
|
|
|
|
|
|
|
|
|
|
|
|
|
|
|
|
|
|
|
| | | Other | 6 | | 1,040 | | 1,027 | | | – | | | 1 | | 69 | | | (22 | ) | | (22 | ) | 321 | | | (2 | ) | | (1 | ) | 650 | | | 3 | | | 6 | | | Zantac | | | 244 | | 273 | | | (12 | ) | | (11 | ) | 58 | | | (19 | ) | | (17 | ) | 64 | | | (15 | ) | | (11 | ) | 122 | | | (6 | ) | | (7 | ) |
|
|
|
|
|
|
|
|
|
|
|
|
|
|
|
|
|
|
|
|
|
|
|
|
|
|
|
|
|
|
|
|
|
|
|
| | | | 100 | | 18,661 | | 17,100 | | | 8 | | | 9 | | 9,106 | | | 8 | | | 8 | | 5,537 | | | 8 | | | 9 | | 4,018 | | | 9 | | | 12 | |
|
|
|
|
|
|
|
|
|
|
|
|
|
|
|
|
|
|
|
|
|
|
|
|
|
|
|
|
|
|
|
|
|
|
|
| | | | | | | | | | | | | | | | | | | | | | | | | | | | | | | | | | | | | | | |
CER% represents growth at constant exchange rates. £% represents growth at actual exchange rates.
<Back to Contents
| Business review | | Financial review 2005 | continued |
| | |
OTC medicines
Over-the-counter medicine sales were £1,437 million, up 1%. Growth from analgesics, up 6%, and respiratory tract, up 5%, helped offset the loss of sales from the dermatological products divested in 2004.Panadolgrowth of 12% in International markets was the key driver of the growth in analgesics.
Oral care
Oral care sales grew 2% to £943 million. Sales ofSensodyneand the denture care brands (Polident,PoligripandCorega) grew by 12% and 6%, respectively, helping to offset lower sales of other toothpaste products.
Nutritional healthcare
Nutritional healthcare product sales grew 7% to £619 million.Lucozade, up 11%, continued to grow strongly in Europe.
Operating profit
The analysis below of operating profit and subsequent discussion compares the 20052006 results with 20042005 results.
| | 2005 | | 2004 | | Growth | | | 2006 | | 2005 | | Growth | | | |
|
|
| |
|
|
| |
| |
| |
| |
| | | | £m | | % | | £m | | % | | CER% | | £% | | £m | | % | | £m | | % | | CER% | £% | |
|
|
|
|
|
|
|
|
|
| |
| | | Turnover | 21,660 | | 100.0 | | 19,986 | | 100.0 | | 7 | | 8 | | 23,225 | | 100.0 | | 21,660 | | 100.0 | | 9 | 7 | |
|
|
|
|
|
|
|
|
|
| |
| | | Cost of sales | (4,764 | ) | (22.0 | ) | (4,360 | ) | (21.8 | ) | 8 | | 9 | | (5,010 | ) | (21.6 | ) | (4,764 | ) | (22.0 | ) | 6 | 5 | | | Selling, general and administration | (7,250 | ) | (33.5 | ) | (7,201 | ) | (36.0 | ) | – | | 1 | | (7,257 | ) | (31.2 | ) | (7,250 | ) | (33.5 | ) | – | | | Research and development | (3,136 | ) | (14.5 | ) | (2,904 | ) | (14.5 | ) | 8 | | 8 | | (3,457 | ) | (14.9 | ) | (3,136 | ) | (14.5 | ) | 11 | 10 | | | Other operating income | 364 | | 1.7 | | 235 | | 1.1 | | | | | 307 | | 1.3 | | 364 | | 1.7 | | |
|
|
|
|
|
|
|
|
|
| |
| | | Operating profit | 6,874 | | 31.7 | | 5,756 | | 28.8 | | 16 | | 19 | | 7,808 | | 33.6 | | 6,874 | | 31.7 | | 17 | 14 | |
|
|
|
|
|
|
|
|
|
| |
| |
Cost of sales
Cost of sales declined as a percentage of turnover increased 0.2by 0.4 percentage points. At constant exchange rates the increasedecline was also 0.20.6 percentage points reflecting higher costs related to the ongoing rectification of manufacturing issues at the Cidra site in Puerto Rico, which were only partly offset by operating efficiencies compared with the previous year.favourable price and regional mix impact. Selling, general and administration
Selling, general and administration (SG&A) costs as a percentage of turnover decreased 2.5reduced 2.3 percentage points. At constant exchange rates, the decrease was 2.22.5 percentage points, reflecting flat expenditure compared with the prior year on a turnover increasegrowth of 7%9%. SG&A costs were in line with 2004 overall, withflat due to higher advertising, promotion and selling expense beingexpenditure offset by lower general and administration expenditure. Advertising, promotion and selling expenses increased 3% and accounted for a 2% increase in total SG&A. General and administration costsexpenditure declined 4%5% and accounted for a 2% reductiondecline in total SG&A. This&A, of which one percentage point was due to lower charges related to legal matters equaland one percentage point was due to a 2% reduction in total SG&A, and lower share-based payment charges, equal to a 1% decrease in total SG&A, partly offset by higher costs related to programmes to deliver future cost savings equal to a 1% increase in total SG&A.savings.
Research and development
R&D expenditure as a percentage of turnover was 14.5%, in line with 2004, and increased 8% compared with the previous year,11% partly as a result of some write-offs of intangible assets.higher charges related to restructuring programmes. Excluding these write-offs,restructuring costs R&D expenditure grew slightly below turnover growth.8%, broadly in-line with turnover. Pharmaceuticals R&D expenditure, excluding restructuring costs, represented 16.2% (2005 – 16.2%) of pharmaceutical turnover. Other operating income
Other operating income includes royalty income, equity investment disposals and impairments, product disposals and fair value adjustments to the Quest collar and Theravance options. Other operating income was £307 million in 2006 compared with £364 million in 2005 compared with £235 million in 2004.2005. The increased income in 2005decrease is predominantlyprimarily due to increasedlower product and asset disposal gains compared with 2004, and aprofits partially offset by the favourable fair value movement of £19 million into the Quest collar and the Theravance options. Operating profit
Overall, the operating profit margin increased 2.91.9 percentage points as operating profit of £6,874 million increased 19%14% in sterling terms. Atterms to £7,808 million. Operating profit increased 17% at constant exchange rates operating profit increased 16% and the margin increased 2.52.4 percentage points, reflecting the lower charges relating to legal matters and share-based payments, higher product and asset disposals and increases in advertising, promotion and selling that wereSG&A growth below the rate of turnover growth. Partially offsetting these items weregrowth, partially offset by higher costs related to programmes to deliver future cost savings and increased R&D expenditure.lower other operating income. Profit before taxation
The discussion below compares the 2005 results with the 2004 results. Gains from asset disposals including associates, were £290£169 million (2004(2005 – £295£290 million), costs for legal matters were £333 million (2005 – £430 million), the fair value movements on the Quest collar and Theravance options resulted in an income of £29 million (2004(2005 – £595£19 million) and charges relating to cost-saving programmes were £141£205 million (2004(2005 – £104£141 million). Share-based paymentsThe total operating profit impact of these items was a £340 million charge in 2005 were £2362006, compared with a £262 million (2004 – £333 million).charge in 2005.
Profit before taxation
The discussion below compares the 2006 results with the 2005 results. Net finance costs | | 2006 | | 2005 | | | Finance income | £m | | £m | |
| | | Interest and other finance income | 285 | | 276 | | | Fair value adjustments and hedges | 2 | | (19 | ) |
| | | | 287 | | 257 | |
| | | |
| Finance costs | | | | |
| | | Interest costs | (314 | ) | (427 | ) | | Unwinding of discount on liabilities | (36 | ) | (25 | ) | | Fair value adjustments and hedges | (2 | ) | 1 | |
| | | | (352 | ) | (451 | ) |
| |
Finance income increased compared with 2005 predominantly due to increased income on extended credit on receivables and increased interest income due to higher US dollar interest rates. Finance costs reduced due to the refinancing of two expensive bonds in December 2005 and January 2006 as well as lower swap costs resulting from reduced interest rate differentials. Share of profits/(losses)after tax profits of associates and joint ventures and associated undertakings
The share of profits of associates arises principally from the Group’s holding in Quest Diagnostics Inc Disposal of interest in associates
There were no disposals of interests in associates in 2005. During 2004, the Group disposed of 3.8 million shares from its investment in Quest Diagnostics Inc. for cash proceeds of £188 million. A profit of £150 million was recognised. The Group’s shareholding in Quest as at 31st December 2005 was 18.4% .
|
| GSK Annual Report 20062007 | 57 | 51 | |
<Back to Contents | | | | REPORT OF THE DIRECTORS | | Financial review 2006 | | |
| | | Business review | | Financial review 20052006 | | continued |
| | |
Net finance costs
| | 2005 | | 2004 | | | Finance income | £m | | £m | |
|
|
|
| | | Interest income | 276 | | 173 | | | Unwinding of discount on assets | – | | 3 | | | Fair value adjustments | (19 | ) | – | |
|
|
|
| | | | 257 | | 176 | |
|
|
|
| | | Finance costs | | | | |
|
|
|
| | | Interest costs | (427 | ) | (346 | ) | | Unwinding of discount on liabilities | (25 | ) | (16 | ) | | Fair value adjustments | 1 | | – | |
|
|
|
| | | | (451 | ) | (362 | ) |
|
|
|
| |
Finance income increased compared with 2004 predominantly due to higher interest rates and higher cash balances. Finance costs increased due to higher interest rates as well as higher interest costs resulting from the issue of two
€750 million bonds in 2005.
Taxation | | | | | | | | | 2005 | | 2004 | | 2006 | | 2005 | | | | £m | | £m | | £m | | £m | |
|
|
|
| |
| | | UK corporation tax | 172 | | 148 | | 400 | | 172 | | | Overseas taxation | 1,847 | | 1,519 | | 2,310 | | 1,847 | |
|
|
|
| |
| | | Current taxation | 2,019 | | 1,667 | | 2,710 | | 2,019 | | | Deferred taxation | (103 | ) | 90 | | (409 | ) | (103 | ) |
|
|
|
| |
| | | Total | 1,916 | | 1,757 | | 2,301 | | 1,916 | |
|
|
|
| |
| |
The charge for taxation on profit amounting to £1,916£2,301 million, representsrepresented an effective tax rate of 28.5% (200429.5% (2005 – 30.4%28.5%) . The Group balance sheet at 31st December 2006 included a tax rate in 2005payable liability of 28.5% benefited from higher£621 million and a tax relief on the actual or potential exerciserecoverable asset of share options by employees, arising from the increase in the share price in the year.£186 million. The integrated nature of the Group’s worldwide operations, involving significant investment in research and strategic manufacture at a limited number of locations, with consequential cross-border supply routes into numerous end-markets, gives rise to complexity and delay in negotiations with revenue authorities as to the profits on which individual Group companies are liable to tax. Disagreements with, and between, revenue authorities as to intra-Group transactions, in particular the price at which goods should be transferred between Group companies in different tax jurisdictions, can produce conflicting claims from revenue authorities as to the profits to be taxed in individual territories. Resolution of such issues is a continuing fact of life for GSK. The Group had significant open issues with the revenue authorities in the USA, UK, Japan and Canada, detailsCanada. On 11th September 2006 GSK and the US Internal Revenue Service agreed to a resolution of which are set out in Note 12 to the financial statements, ‘Taxation’.their dispute. Profit for the year | | | | | | Growth | | | | 2005 | | 2004 | |
| | 2006 | | 2005 | | | | Growth | | | | £m | | £m | | CER% | | £% | | £m | | £m | | CER% | | £% | |
|
|
|
|
|
| |
| | | Profit after taxation for the year | 4,816 | | 4,022 | | 17 | | 20 | | 5,498 | | 4,816 | | 17 | | 14 | |
|
|
|
|
|
| |
| | | Profit attributable to shareholders | 4,689 | | 3,908 | | 17 | | 20 | | 5,389 | | 4,689 | | 18 | | 15 | | | Earnings per share (pence) | 82.6 | p | 68.1 | p | 18 | | 21 | | 95.5 | p | 82.6 | p | 19 | | 16 | | | Earnings per ADS (US$) | $3.00 | | $2.49 | | 18 | | 21 | | $3.53 | | $3.00 | | | | | | Weighted average number of shares (millions) | 5,674 | | 5,736 | | | | | | 5,643 | | 5,674 | | | | |
|
|
|
|
|
| |
| | | Diluted earnings per share (pence) | 82.0 | p | 68.0 | p | | | | | 94.5 | p | 82.0 | p | | | | | | Diluted earnings per ADS (US$) | $2.98 | | $2.49 | | | | | | $3.50 | | $2.98 | | | | | | Weighted average number of shares (millions) | 5,720 | | 5,748 | | | | | | | | | |
|
|
|
|
|
| | 5,700 | | 5,720 | | | | |
| |
| |
Profit for the year was £4,816£5,498 million, an increase of 17% (20%(14% in sterling terms). Profit attributable to minority interests was £127£109 million and profit attributable to shareholders was £4,689£5,389 million, an increase of 17% (20%18% (15% in sterling terms). The interest cost of the share buy-back adversely impacted the Group’s earnings but benefits Earnings per share (EPS). EPS increased 18%19%, reflecting higher profits and also the reduction in the weighted average number of shares resulting from the Group’s share buy-back programme. The interest cost of this programme also impacts the Group’s earnings. At actual rates of exchange, earnings per share increased 21%16%. The favourableunfavourable currency impact on EPS of three percentage points reflectsreflected a strengthening of the US dollarSterling against other major currencies and Euro average exchange rates relative to 2004 and comparescompared with a 1% favourabletwo percentage point unfavourable currency impact on turnover. This difference principally arises from a different mix of currencies in profits compared with turnover.
| 58 |
| GSK Annual Report 20062007 | 52 | |
Back to Contents | Corporate governance | | | | | | | | | Corporate governance |
| | |
This section discusses GlaxoSmithKline’s management structures and governance procedures.
It contains the company’s reporting disclosures on corporate governance required by the Combined Code on Corporate Governance of the Financial Reporting Council (Combined Code), including the required statement of compliance.
Further, the company reports on compliance with the US laws and regulations that apply to it.
|
| GSK Annual Report 20062007 | 59 | 53 | |
Back to ContentContents | | | | REPORT OF THE DIRECTORS | | Corporate governance | | |
| | | | | Corporate governance | | continued |
| | |
The Board Sir Christopher Gent (Aged 58)59)
Appointed on 1st June 2004. Chairman. Sir Christopher was the Chief Executive Officer of Vodafone Group plc, until his retirement in July 2003. He is a Non-Executive Director of Lehman Brothers Holdings Inc,Inc., a Non-Executive Director of Ferrari S.p.A., a member of KPMG’s Chairman’s Advisory Group, a member of the Financial Reporting Council, a Senior Adviser at Bain & Co. and a member of the advisory boardAdvisory Board of Reform. Dr Jean-Pierre Garnier (Aged 59)60)
Appointed on 23rd May 2000. Retiring on 21st May 2008. Chief Executive Officer. Dr Garnier was appointed an Executive Director of SmithKline Beecham plc in 1992, and became Chief Executive Officer in April 2000. He is a Non-Executive Director of United Technologies Corporation and a member of the Board of TrusteesOverseers of the Eisenhower Exchange Fellowships.Weill Cornell Medical College. Andrew Witty (Aged 43)
Appointed on 31st January 2008. CEO Designate. He holdswill succeed Dr Garnier on 21st May 2008. Mr Witty joined the Group in 1985 and has held senior positions in Asia, Africa, Europe and the USA. In January 2003 he was appointed President, Pharmaceuticals Europe. He has served as a PhD in pharmacology fromboard member of the UniversitySingapore Economic Development Board. He is a member of Louis Pasteur in Francethe INSEAD UK Council, a Director of the Office for Strategic Coordination of Health Research, sits on the Imperial College Commercialisation Advisory Board and an MBA from Stanford Universityis a member of the Health Innovation Council in the USA.UK. Professor Sir Roy Anderson (Aged 60)
Appointed on 1st October 2007. Non-Executive Director. Professor Anderson is the Professor of Infectious Disease Epidemiology in the Faculty of Medicine, Imperial College, London and until September 2007, was the Chief Scientific Adviser at the Ministry of Defence in the UK. He will become Rector of Imperial College in July 2008. Dr Stephanie Burns (Aged 52)53)
Appointed on 12th February 2007. Non-Executive Director. Dr Burns is Chairman, President and Chief Executive Officer of Dow Corning Corporation. She is also a member of the American Chemical Society and sits on the Executive Committee of the Society of Chemical Industry, America Section, serves on the Board of Directors of the American Chemistry Council, and on the Board of Directors for the Society for Women’s Health Research and on the Board of Trustees of The Conference Board.Research. Dr Burns holds a PhD in organic chemistry from Iowa State University. Lawrence Culp (Aged 43)44)
Appointed on 1st July 2003. Non-Executive Director. Mr Culp is President and Chief Executive Officer of Danaher Corporation. Prior to joining Danaher, he held positions in Accenture, previously Andersen Consulting. Sir Crispin Davis (Aged 57)58)
Appointed on 1st July 2003. Non-Executive Director. Sir Crispin is Chief Executive of Reed Elsevier PLC. Prior to that, he was Chief Executive of Aegis Group plc, which he joined from Guinness plc, where he was a member of the main board and Group Managing Director of United Distillers. He spent his early career with Procter & Gamble. Julian Heslop (Aged 53)54)
Appointed on 1st April 2005. Chief Financial Officer. Mr Heslop joined Glaxo Wellcome as Financial Controller in April 1998. In January 2001 following the merger, he was appointed Senior Vice President, Operations Controller. Prior to joining Glaxo Wellcome,the Group he held senior finance roles at Grand Metropolitan PLC.Metropolitan. Sir Deryck Maughan (Aged 59)60)
Appointed on 1st June 2004. Non-Executive Director. Sir Deryck is a Managing Director of Kohlberg Kravis Roberts & Co. He was formerly Chairman and CEO of Citigroup International and of Salomon Brothers Inc. He is a Non-Executive Director of Reuters Group plc and BlackRock Inc. as well as serving on the Boards of Directors of Carnegie Hall, Lincoln Center and NYU Medical Center. He served as Vice Chairman of the New York Stock Exchange from 1996 to 2000. Dr Daniel Podolsky (Aged 53)54)
Appointed on 1st July 2006. Non-Executive Director. Dr Podolsky is MallinkrodtMallinckrodt Professor of Medicine and Chief of Gastroenterology at Massachusetts General Hospital and Harvard Medical School as well as Chief Academic Officer of Partners HealthCare System. He is past editor-in-chief of the journal Gastroenterology, Past President of the American Gastroenterological Association andalso Chairman of the Board and Scientific Co-Founder of the GI Company. Sir Ian Prosser (Aged 63)64)
Appointed on 23rd May 2000. Senior Independent Director. Sir Ian was formerly a Non-Executive Director of SmithKline Beecham plc. He was Chairman and Chief Executive of Bass plc and ultimately Chairman of the demerged InterContinental Hotels Group plc. He was Chairman of the World Travel and Tourism Council and the London Stock Exchange Listed Advisory Council. He is Non-Executive Deputy Chairman of BP plc, a Non-Executive Director of Sara Lee Corporation and a member of the CBI President’s Committee. Dr Ronaldo Schmitz (Aged 68)69)
Appointed on 23rd May 2000. Non-Executive Director. Dr Schmitz was formerly a Non-Executive Director of Glaxo Wellcome plc. He is a Non-Executive Director of Legal & General Group plc, a member of the Board of Directors of Rohm and Haas Company and Cabot Corporation and a member of the Supervisory Board of SICK AG. Dr Moncef Slaoui (Aged 47)48)
Appointed on 17th May 2006. Chairman, Research & Development. Dr Slaoui joined GSK Biologicals in 1988 where he engineered the development of a robust vaccines pipeline. He has a PhD in Molecular Biology and Immunology from Université Libre de Bruxelles. Tom de Swaan (Aged 60)61)
Appointed on 1st January 2006. Non-Executive Director. Mr de Swaan was a member of the Managing Board and Chief Financial Officer of ABN AMRO until 1st January 2006. He was a Non-Executive Director of the Financial Services Authority. He is a member of the Board of Directors of Zurich Financial Services in Switzerland and Vice Chairman of the Supervisory Board and Chairman of the Audit Committee of Royal Ahold, a member of the Supervisory BoardBoards of Royal DSM and Buhrmann in the Netherlands. He isof Corporate Express, and Vice Chairman of the Supervisory Board of VanLanschot Bankiers. Christopher Viehbacher (Aged 47)
Appointed on 31st January 2008. President, US Pharmaceuticals. Mr Viehbacher joined the Netherlands OperaGroup in 1988 and has held a variety of senior positions in Europe and Canada. He was appointed President, US Pharmaceuticals in January 2003. He served on the European Commission approved G10 working group to restore the competitiveness of the EU Pharmaceutical industry. He is a board member of PhRMA, the Board of the Royal Concertgebouw Orchestra.CEO Roundtable on Cancer and Research!America. Sir Robert Wilson (Aged 63)64)
Appointed on 1st November 2003. Non-Executive Director. Sir Robert is Non-Executive Chairman of BG Group plc and The Economist Group and was previously Executive Chairman of Rio Tinto. Other Directors
Dr Lucy Shapiro, formerly Non-Executive Director, retired from the Board on 17th May 2006. Dr Tachi Yamada, formerly Chairman, Research & Development, retired from the Board on 31st May 2006.
Details of membership of the Board Committees may be found on page 57.63.
| 60 |
| GSK Annual Report 20062007 | 54 | |
Back to Contents | | | Corporate governance | | | | | | | | Corporate governance | | continued |
| | |
Corporate Executive Team (CET) JP Garnier
Chief Executive Officer
As Chief Executive Officer, Dr Garnier is responsible for the management of the Group. He oversees all operational aspects of the Group, including establishing policies, objectives and initiatives, and he directs long-term strategy. He was formerly Chief Executive Officer of SmithKline Beecham, having joined the Group in 1990. Andrew Witty
CEO Designate
Mr Witty was appointed CEO Designate in October 2007, and will succeed JP Garnier as CEO May 2008. He joined Glaxo in 1985. During his career with the company he has held the roles of Vice President and General Manager, Marketing for Glaxo Wellcome Inc., in the US, and Senior Vice President, Asia Pacific. He was appointed President, Pharmaceuticals Europe for GlaxoSmithKline in January 2003. Rupert Bondy
Senior Vice President and General Counsel
Mr Bondy is responsible for legal matters across the Group, together with environmental,environment, health and safety issues and security. He was a lawyer in private practice before joining SmithKline BeechamBeecham. He will leave GSK in 1995.March 2008. John Clarke
President, Consumer Healthcare
Mr Clarke is responsible for the Consumer Healthcare business which produces oral, over-the-counter and nutritional healthcare products. He joined Beecham in 1976 and was the President of the Futures Group before his current appointment in January 2006. Marc Dunoyer
President, Pharmaceuticals Japan
Mr Dunoyer was appointed President, Pharmaceuticals Japan in March 2003. He joined the Group in 1999 and was Senior Vice President and Regional Director, Japan until his current appointment. Eddie Gray
President, Pharmaceuticals Europe
Mr Gray became responsible for the Group’s operations in Europe in January 2008. He joined Beecham in 1988 and, prior to his current appointment, was Senior Vice President and General Manager, Pharmaceuticals UK. Russell Greig
President, Pharmaceuticals International
Dr Greig leads the pharmaceutical operations outside the USA, Japan and most of Europe, covering more than 100 countries. He joined the Group in 1980 and was Senior Vice President, Worldwide Business Development for R&D prior to his current appointment in March 2003. Julian Heslop
Chief Financial Officer
Mr Heslop became Chief Financial Officer on 1st April 2005. As head of the finance function Mr Heslop is responsible for activities such as financial reporting and control, tax and treasury, finance systems, internal audit, insurance and real estate. He joined Glaxo Wellcome as Financial Controller in April 1998. Duncan Learmouth
Senior Vice President, Corporate Communications and Community Partnerships
Mr Learmouth is responsible for the Group’s investor relations, internal and external communications, its image and partnerships with global communities. He joined Glaxo in 1991 and was Vice President, Global Investor Relations, before appointment to his current position in July 2006. Bill Louv
Chief Information Officer
Mr Louv succeeded Dr Calhoun as Chief Information Officer on 31stin January 2007. He is responsible for information technology, a global function that enables key business processes across all parts of the Group. He joined the companyGroup in 1994 and has held a number of increasingly senior roles in IT, including for US Pharmaceuticals and GSK’s R&D functions. Dan Phelan
Senior Vice President, Human Resources
Mr Phelan is responsible for benefits, compensation, recruitment, organisation development, leadership development and succession planning, human resource information systems and employee health management. He was a lawyer in private practice before joining Smith Kline & French in 1981. David Pulman
President, Global Manufacturing and Supply
Dr Pulman is responsible for the Global Manufacturing and Supply Organisationorganisation and Global Procurement. He trained as a microbiologist and joined Glaxo in 1978 and was responsible for1978. He has broad experience of manufacturing operations having previously led the Primary Supply, European manufacturing, North American supply network, manufacturing, strategyGlobal Logistics and logistics until his current appointment in 2002.Manufacturing Strategy organisations. Moncef Slaoui
Chairman, Research & Development
Dr Slaoui leads the Group’s complex drug discovery and development activities. He joined the Group in 1988 and was Senior Vice President, Worldwide Business Development until his current appointment in June 2006. David Stout
President, Pharmaceutical Operations
Mr Stout is responsible for all pharmaceuticals and vaccines operations worldwide, including the USA, Europe, International, Japan and Global Manufacturing and Supply. He joined SmithKline Beecham in 1996 and was President, US Pharmaceuticals, until his current appointment in January 2003.
Chris Viehbacher
President, US Pharmaceuticals
Mr Viehbacher is responsible for US Pharmaceuticals. He joined Wellcome in 1988 and was responsible for GSK’s European Pharmaceuticals business before his current appointment in 2003. Andrew Witty
President, Pharmaceuticals Europe
Mr Witty is responsible for the Group’s pharmaceuticals operations in Europe. He joined Glaxo in 1985 and was Senior Vice President, Asia Pacific until his current appointment in 2003.
Other members
Mr Ziegler retired as head of the Consumer Healthcare business on 31st January 2006. Mrs Younger left the Group in June 2006 and Dr Calhoun retired as Chief Information Officer on 31st January 2007. Mr Stout left the Group in February 2008. Mr Ingram continues to act as a special consultant to the Group and attends CET meetings in that capacity.
|
| GSK Annual Report 20062007 | 61 | 55 | |
Back to Contents | | | Corporate governance | continued | |
| | | | Corporate governance | | continued | | |
Governance and policy The Board and Corporate Executive Team
The Directors are listed under ‘The Board’ on page 54.60. The Board is responsible for the Group’s system of corporate governance and is ultimately accountable for the Group’s activities, strategy and financial performance. The Chief Executive Officer (CEO) is responsible for executive management of the Group and is assisted by the CET. The CET meets 11 times per year and otherwise as necessary. The members and their responsibilities are listed under “Corporate‘Corporate Executive Team”Team’ (page 55)61). The Board comprises threefive Executive and teneleven Non-Executive Directors. The Board considers all its Non-Executive Directors to be independent in character and judgement. Dr Schmitz has served on the Board for more than nine years, having been appointed to the Board of Glaxo Wellcome plc on 1st January 1997. During consideration of the Annual Review of Board effectiveness at its meeting in December 2006,2007, the Board concluded that Dr Schmitz remained independent, notwithstanding his length of service. In the opinion of the Board, Dr Schmitz continued to demonstrate the characteristics of independence, such as objectively challenging management and taking part in rigorous debate, while at the same time possessing an outstanding knowledge of the company’s business and affairs, together with his experience gained as Chairman of the Audit Committee. In a long cycle investment business, such as GSK, it was considered to be particularly important to have experienced members on the Board. When Sir Christopher Gent was appointed to the Board as Deputy Chairman, he was determined by the Board to be independent. Upon taking up the chairmanship of the Board on 1st January 2005, in accordance with the Combined Code, he was excluded from the determination of whether at least half the Board are independent Non-Executive Directors. Sir Christopher Gent did not hold a position on a Board Committee where independence was required under the Combined Code. He has however been appointed a member of the Remuneration Committee effective 1st January 2007 following the recent change to the Combined Code. The Board considers that Professor Sir Roy Anderson, Dr Burns, Mr Culp, Sir Crispin Davis, Sir Deryck Maughan, Dr Podolsky, Sir Ian Prosser, Dr Schmitz, Mr de Swaan and Sir Robert Wilson are independent in accordance with the recommendations of the Combined Code. At the date of publication and throughout 2006,2007, a majority of the Board members, excluding the Chairman, were independent Non-Executive Directors. Dr Shapiro, who left the Board on 17th May 2006 was not considered to be independent due to the remuneration that she received from the Group as a member of the GlaxoSmithKline Scientific Advisory Board. Sir Christopher Gent succeeded Sir Christopher Hogg on 1st January 2005 and chaired the company throughout 2006.2007. Dr Garnier is the CEO. He will retire from the Board at the end of the AGM on 21st May 2008 and Mr Andrew Witty will succeed him as CEO. Mr Witty’s biographical details can be found on page 60. Mr Witty was appointed to the Board on 31st January 2008. The Chairman leads the Board, and represents the Board to the CEO and other CET members as necessary between Board meetings. The CEO manages the Group and implements the strategy and policies adopted by the Board. The Chairman and the chairmen of Board Committees communicate regularly with the CEO and other CET members. The division of responsibilities between the role of Chairman and the CEO has been set out in writing, agreed by the Board and appears in full on the company’s website. Sir Ian Prosser was appointed Senior Independent Director (SID) on 1st January 2005 and held this role throughout 2006.2007. Board process
The Board has the authority, and is accountable to shareholders, for ensuring that the company is appropriately managed and achieves the strategic objectives it sets. The Board discharges those responsibilities through an annual programme of meetings which includes the approval of overall budgetary planning and business strategy. The Board reviews the company’s internal controls and risk management policies and approves its governance structure and code of ethics.
The Board appraises and approves major financing, investment and licensing decisions in excess of defined thresholds. In addition, the Board evaluates and monitors the performance of the Group as a whole. This includes:
| Board process | | The Board has the authority, and is accountable to shareholders, for ensuring that the company is appropriately managed and achieves the strategic objectives it sets. The Board discharges those responsibilities through an annual programme of meetings which includes the approval of overall budgetary planning and business strategy. The Board reviews the company’s internal controls and risk management policies and approves its governance structure and code of ethics. | | | | The Board appraises and approves major financing, investment and licensing decisions in excess of defined thresholds. In addition, the Board evaluates and monitors the performance of the Group as a whole. This includes: | | | | • | engaging at Board meetings with the CEO, the other Executive Directors and members of the CET as appropriate, on the financial and operating performance of GSK and external issues material to the Group’s prospects | | | | | • | evaluating progress toward the achievement of the Group’s financial and business objectives and annual plans | | | | | • | monitoring, through reports received directly or from various committees, the significant risks facing the Group. |
The Board has overall responsibility for succession planning for the CEO and the other Executive Directors. The Board has given the CEO broad authority to operate the business of the Group, and the CEO is accountable for, and reports to the Board on business performance.the performance of the business. CET members make regular presentations to the Board on their areas of responsibility, and the Board meets with all the CET members on an annual basis to discuss collectively the Group’s strategy. A primary element of the induction process for new Non-Executive Directors is undertaken by members of the CET, and all Non-Executive Directors are encouraged to have separate informal discussions at their discretion with any CET members. The Board met six times in 2006,2007, with each member attending as follows: | | Number of meetings | | Number of | | Number of meetings | | Number of | | | Name | held whilst a Board member | | meetings attended | | held whilst a Board member | | meetings attended | |
|
| |
| | | Sir Christopher Gent | 6 | | 6 | | 6 | | 6 | | | Dr JP Garnier | 6 | | 6 | | 6 | | 6 | | | Mr J Heslop | 6 | | 6 | | 6 | | 6 | | | Dr M Slaoui | 4 | | 4 | | 6 | | 6 | | | Professor Sir Roy Anderson* | | 2 | | 2 | | | Dr S Burns* | | 5 | | 5 | | | Mr L Culp | 6 | | 5 | | 6 | | 6 | | | Sir Crispin Davis | 6 | | 6 | | 6 | | 6 | | | Sir Deryck Maughan | 6 | | 4 | | 6 | | 6 | | | Dr D Podolsky | 3 | | 3 | | 6 | | 6 | | | Sir Ian Prosser | 6 | | 5 | | 6 | | 6 | | | Dr R Schmitz | 6 | | 6 | | 6 | | 6 | | | Mr T de Swaan | 6 | | 5 | | 6 | | 6 | | | Sir Robert Wilson | 6 | | 6 | | 6 | | 6 | | | Dr T Yamada | 3 | | 3 | | | | Dr L Shapiro | 3 | | 3 | | |
|
| |
| |
| * | Professor Anderson joined the Board on 1st October 2007 and Dr Burns joined on 12th February 2007. |
In addition to the six6 scheduled meetings, the Board also met on a quorate basis on three3 occasions.
| 62 |
| GSK Annual Report 20062007 | 56 | |
Back to Contents | | | Corporate governance | | | | | | | | Corporate governance | | continued |
| | |
Business environment development
To ensure that the Board is kept up-to-date on important matters, including legal, governance and regulatory developments, presentations are made on a regular basis by both external and internal advisers. Independent advice
The Board recognises that there may be occasions when one or more of the Directors feel it is necessary to take independent legal and/or financial advice at the company’s expense. There is an agreed procedure to enable them to do so. This is explained in the Corporate Governance section of the company’s website. Indemnification of Directors
Qualifying third party indemnity provisions (as defined in section 309B(1)234 of the Companies Act 1985)2006) are in force for the benefit of the Directors and former Directors who held office during 2006.2007. Company Secretary
The Company Secretary is responsible to the Board and is available to individual Directors in respect of Board procedures. The Company Secretary is Mr Simon Bicknell, who was appointed in May 2000. He is a barrister and joined the Group in 1984. He is secretary to all of the Board Committees. Board Committees
The Board has established a number of Committees and provides sufficient resources to enable them to undertake their duties. Executive Directors are not members of the Audit, Remuneration, Nominations or Corporate Responsibility Committees, although they may be invited to attend meetings. Each Director is a member of the Corporate Administration & Transactions and Financial Results Committees. Membership of these Committees is shown in the table below. | | | | | | | | Corporate | | | | Audit | | Remuneration | | Nominations | | Responsibility | |
|
|
|
|
|
|
|
| | | Sir Christopher Gent | – | | M | | C | | C | | | Dr Burns | – | | – | | – | | – | | | Mr L Culp | – | | M | | – | | – | | | Sir Crispin Davis | – | | M | | – | | – | | | Sir Deryck Maughan | M | | – | | – | | – | | | Dr D Podolsky | M | | – | | – | | M | | | Sir Ian Prosser | M | | – | | M | | M | | | Dr R Schmitz* | M | | M | | M | | – | | | Mr T de Swaan* | C | | – | | – | | M | | | Sir Robert Wilson | M | | C | | – | | – | |
|
|
|
|
|
|
|
| |
* | Mr de Swaan succeeded Dr Schmitz as Chairman of the Audit Committee from September 2006. | Key: C = Chairman. M = Member. |
| | | | | | | | Corporate | | | | Audit | | Remuneration | | Nominations | | Responsibility | |
|
|
|
|
|
|
|
| | | Sir Christopher Gent | – | | M | | C | | C | | | Professor Sir Roy Anderson | – | | – | | – | | – | | | Dr S Burns | – | | – | | – | | M | | | Mr L Culp | – | | M | | – | | – | | | Sir Crispin Davis | – | | M | | – | | – | | | Sir Deryck Maughan | M | | – | | – | | – | | | Dr D Podolsky | M | | – | | – | | M | | | Sir Ian Prosser | M | | – | | M | | M | | | Dr R Schmitz | M | | M | | M | | – | | | Mr T de Swaan | C | | – | | – | | M | | | Sir Robert Wilson | M | | C | | – | | – | |
|
|
|
|
|
|
|
| | | Key: C = Chairman M = Member | | | | | | | | |
The following is a summary of the role and terms of reference of each Committee. The current full terms of reference of each Committee may be obtained from the Company Secretary or the Corporate Governance section of the company’s website. Audit Committee
The Audit Committee reviews the financial and internal reporting process, the system of internal controls, the management of risks and the external and internal audit process. The Committee also proposes to shareholders the appointment of the external auditors and is directly responsible for their remuneration and oversight of their work. The Committee consists entirely of independent Non-Executive Directors. It meets at least four times a year and otherwise as necessary. The Audit Committee Report is on pages 6067 to 62.68. Remuneration Committee
The Remuneration Committee determines the terms of service and remuneration of the Executive Directors and members of the CET and, with the assistance of external independent advisors, it evaluates and makes recommendations to the Board on overall executive remuneration policy. The Committee consists entirely of independent Non-Executive Directors, together with the Chairman, in accordance with the Combined Code. It meets at least four times a year and otherwise as necessary. Information on the remuneration of Directors is given in the Remuneration Report on pages 6571 to 82.86. The Chairman of the company and the CEO are responsible for evaluating and making recommendations to the Board on the remuneration of the Non-Executive Directors. Nominations Committee
The Nominations Committee reviews the structure, size and composition of the Board and the appointment of members to the Board and the CET, and makes recommendations to the Board as appropriate. The Committee also monitors the planning of succession to the Board and Senior Management. The Committee consists entirely of Non-Executive Directors, of whom a majority are independent, and meets at least once a year and otherwise as necessary. The Nominations Committee Report is given on page 62.pages 68 to 69. Corporate Responsibility Committee
The Corporate Responsibility Committee consists entirely of Non-Executive Directors and provides a Board-level forum for the regular review of external issues that have the potential for serious impact upon the Group’s business and reputation and for the oversight of reputation and the views of external stakeholders. The Committee is also responsible for governance oversight of the Group’s worldwide donations and community support. The Committee meets formally three times a year and otherwise as necessary. The Corporate Responsibility Committee Report is given on page 69. Financial Results Committee
The Financial Results Committee reviews and approves, on behalf of the Board, the Annual Report and Form 20-F, the Annual Review and the convening of the Annual General Meeting, together with the preliminary and quarterly statements of trading results. Each Director is a member of the Committee and the quorum for a meeting is any three members. To be quorate, each meeting must include the Chairman or the Chairman of the Audit Committee and the CEO or the Chief Financial Officer (CFO). The Committee meets as necessary.
Back to Contents
| Corporate governance | continued |
| |
Corporate Administration & Transactions Committee
The Corporate Administration & Transactions Committee reviews and approves matters in connection with the administration of the Group’s business, and certain corporate transactions. The Committee consists of the Directors, CET members and the Company Secretary. The Committee meets as necessary. Evaluation of the Board, Board Committees and Directors
The performance evaluation of the Chairman, the Board, its Committees and Directors during 20062007 was undertaken by the SID and implemented in collaboration with the Committee Chairmen, with the support of the Company Secretary. The Board considered the review conclusions at its meeting in December 20062007 and agreed a number of minor improvements to its procedures and operating methodology. An external consultant was appointed to assist inThe Audit Committee Chairman undertook the evaluationreview of the Audit Committee.Committee for 2007, building on the work undertaken by an external consultant’s review of the Committee in 2006.
| GSK Annual Report 2007 | 63 | | |
Back to Contents | | | REPORT OF THE DIRECTORS | | Corporate governance | | | | | | | Corporate governance | | continued | |
Dialogue with shareholders Financial results are announced quarterly. The company reports formally to shareholders twice a year, when its half-year and full-year results are announced. The full-year results are included in the company’s Annual Report and Annual Review, which are published for shareholders. TheIn 2007, the company’s half-year results arewere published in a national newspaper shortly after release. The CEO CFO and President, Pharmaceutical OperationsCFO give presentations on the full-year results to institutional investors, analysts and the media. There are webcast teleconferences after the release of the first, second and third quarter results for institutional investors, analysts and the media. The Annual Report, Annual Review and quarterly results are available on the company’s website. The Annual General Meeting (AGM) takes place in London, and formal notification is sent to shareholders at least one month in advance. At the Meeting, a business presentation is made to shareholders and all Directors able to attend are available, formally during the AGM, and informally afterwards, for questions. Committee Chairmen ordinarily attend the AGM to respond to shareholders’ questions. The entire Board was in attendance at the company’s AGM in May 2006.2007. All resolutions at the AGM are decided on a poll as required by the company’s Articles of Association. The results of the poll are announced to the London Stock Exchange and posted on the company’s website. Details of the 20072008 AGM are set out in the section ‘Annual General Meeting’ (see page 59).65) and the Notice of AGM is published on the company’s website. To ensure that the Non-Executive Directors are aware of and understand the views of major shareholders about the company, the Board has in place a process focusing on sector-specific issues, as well as general shareholder preferences. At its meeting in September, the Board received an external review of shareholder opinion. The CEO and CFO maintain a dialogue with institutional shareholders on performance, plans and objectives through a programme of regular meetings. The Group’s Investor Relations department, with offices in London and Philadelphia, acts as a focal point for contact with investors throughout the year. The Chairman meets regularly with institutional investors to hear their views and discuss issues of mutual importance. The Chairman of the Remuneration Committee meets annually with major shareholders to discuss executive remuneration policy. All Non-Executive Directors, including new appointees, are available to meet with major shareholders if requested. The company’s website provides access to current financial and business information about the Group. Share capital and controlDetails of the company’s authorised and issued share capital and the number of shares held in Treasury, as at 31st December 2007, can be found in Note 33 to the financial statements, ‘Share capital and share premium account’. GSK’s shares are listed on the London Stock Exchange and are also quoted on the New York Stock Exchange in the form of American Depositary shares (ADSs). Each ADS represents two Ordinary shares. The holders of Ordinary shares are entitled to receive dividends, when declared, the company’s reports and accounts, to attend and speak at General Meetings of the company, to appoint proxies and to exercise voting rights. There are no restrictions on transfer, or limitations on the holding of Ordinary shares and no requirements to obtain prior approval to any transfers. NoOrdinary shares carry any special rights with regard to control of the company and there are no restrictions on voting rights. Major shareholders have the same voting rights per share as all other shareholders. There are no known arrangements under which financial rights are held by a person other than the holder of the shares and no known agreements on restrictions on share transfers or on voting rights. Shares acquired through GSK share schemes and plans rank equally with the other shares in issue and have no special rights. The trustees of the company’s Employee Share Ownership Plan (ESOP) trusts have waived their rights to dividends on shares held by the ESOP trusts. Change of controlThe company is not party to any significant agreementsthat would take effect, alter or terminate upon a change of control following a takeover bid.The company does not have agreements with any Director or Officer that would provide compensation for loss of office or employment resulting from a takeover, except that provisions of the company’s share plans may cause options and awards granted under such plans to vest on a takeover. Interests in voting rightsOther than as stated below, as far as the company is aware, there are no persons with significant direct or indirect holdings in the company. Information provided to the company pursuant to the Financial Services and Authority’s (FSA) Disclosure and Transparency Rules (DTRs) is published on a Regulatory Information Service and on the company’s website.At 22nd February 2008, the company had received notifications in accordance with the FSA’s DTRs of the following notifiable interests, in the voting rights in the company’s issued share capital: | | No. of | | Percentage of issued | | | | shares | | capital (%) | * |
|
|
|
| | | Legal & General Management | | | | | | Limited | 289,799,780 | | 5.29 | | | Barclays PLC | 199,225,616 | | 3.63 | |
|
|
|
| |
| * | Percentage of Ordinary shares in issue, excluding Treasury shares as at 22nd February 2008. |
The Bank of New York Mellon is the Depositary for the company’s ADRs, which are listed on the New York Stock Exchange. Ordinary shares representing the company’s ADR program, which are managed by the Depositary, are registered in the name of BNY (Nominees) Limited. Details of the number of Ordinary shares held by the Depositary can be found on page 170. The company has not acquired or disposed of any interests in its own shares, other than in connection with the company’s share buy-back programme. Details of the shares purchased, cancelled and held in Treasury are disclosed in Note 33 to the financial statements, ‘Share capital and share premium account’.
| 64 | GSK Annual Report 2007 | | |
Back to Contents | | | REPORT OF THE DIRECTORS | | | Corporate governance | | | | | | | | Corporate governance | | continued | |
Directors and Officers
The interests of Directors and Officers and their connected persons in the issued share capital of the company are given in the Remuneration Report (pages 71 to 86). The rules about the appointment and replacement of directors are contained in the company’s Articles of Association. The company’s Articles must be approved by shareholders in accordance with the legislation in force from time to time. The Articles provide that directors may be appointed by an ordinary resolution of the members or by a resolution of the directors, provided that, in the latter instance, a director appointed in this way retires at the first AGM following his appointment. The Articles also provide that at every AGM at least one third of the directors retire by rotation, and detail the circumstances in which and how they may be re-elected. The company’s members may remove a director by passing an ordinary resolution of which special notice has been given. A director may automatically cease to be a director if (i) a bankrupcy order is made against him, (ii) he makes an arrangement or composition with his creditors or applies for an interim order in connection with a voluntary arrangement, (iii) he is suffering from a mental disorder, (iv) he has missed directors’ meetings for a continuous period of six months without permission and the other directors resolve that he shall cease to be a director, (v) he is prohibited from being a director by law, (vi) he resigns, (vii) he offers to resign and the other directors accept that offer, or (viii) at least three other directors require him to resign. The company’s articles may be amended by a special resolution of the members. The powers of the directors are determined by UK legislation and the company’s Memorandum and Articles of Association, available on GSK’s website. As provided in those Articles, the directors may exercise all the company’s powers provided that the Articles or applicable legislation do not stipulate that any such powers must be exercised by the members. The directors have been authorised to issue and allot Ordinary shares, pursuant to Articles 9-15 and have authority to make market purchases of shares pursuant to Article 8. The powers under Articles 8, and 10-13 are referred to shareholders at the AGM for renewal. Shareholders are also requested to renew the directors’ power to make market purchases of shares at each AGM. Any shares purchased may be cancelled or held as Treasury shares. Share buy-back programme
The company has repurchased £7.8£11.6 billion of its own shares for cancellation or to be held as Treasury shares, of which £1.3£3.8 billion was spent in 2006. 2007. In October 2006,July 2007, a programme totalling £6£12 billion of share repurchases over threetwo years commenced. It is expected that £2 billion worth of shares will be brought back in the first 12 months. These programmes coverThe programme covers purchases by the company of shares for cancellation or to be held as Treasury shares, in accordance with the authority renewed by shareholders at the company’s AGM in 2006.2007. In May 2006,2007, the company was authorised to purchase a maximum of 582575 million shares. During 2006, 92.6 millionDetails of shares representing 1.7% of the issued share capital, were purchased, andthose held as Treasury shares (seeand those cancelled are disclosed in Note 3133 to the financial statements ‘Share capital and share premium account’). The exact amount and timing of future purchases, and the extent to which repurchased shares will be held as Treasury shares rather than being cancelled, will be determined by the company and is dependent on market conditions and other factors. Donations to Political OrganisationsEU political organisations and EU Political Expenditure
political expenditure At the AGM in May 2001, shareholders first authorised the company to make donations to EU Political Organisationspolitical organisations and to incur EU Political Expenditure,political expenditure, under the provisions of the Political Parties, Elections and Referendums Act 2000, of up to £100,000 each year. This authority has since been renewed annually. Although the company does not make and does not intend to make such payments or donations to EU political parties, within the normal meaning of that expression, the definition in the legislation of ’EU Political Organisation’ is wide. It may extend to bodies, which the company and its subsidiaries might wish to support including those concerned with policy review, law reform, the representation of the business community and special interest groups, such as those concerned with the environment. No donations were made to EU Political Organisationspolitical organisations during 2006.2007. The Group made donations to non-EU Political Organisationspolitical organisations totalling £319,000£276,000 during 20062007 (£320,000319,000 in 2005)2006).
Back to Contents
| Corporate governance | continued |
| |
Donations of £290,000£249,000 (£301,000290,000 in 2005)2006) were made in the USA, £27,000 (£19,00027,000 in 2005)2006) in Canada and £2,000£nil (£2,000 in 2006) in Australia. The USA is the largest recipient of political donations, and this reflects the US political system, where candidates are sponsored solely by donations from individuals, NGOs, companies and other parties. In line with US law, the corporate donations by GSK are not made at a federal level, but only to candidates and political parties at the state and local levels. Donations are accepted practice in the USA, and as a major employer in a heavily regulated industry, it is important for GSK to engage fully in the political process. Donations are one of the ways of doing this. GSK supports those candidates who seek an environment that appropriately rewards high-risk, high-investment industries and who believe in free market principles and intellectual property rights. The situation is similar in Canada, and donations follow the same guidelines. In the rest of the world donations are very rare and of low value. There is also a GSK Political Action Committee (PAC) in the USA which gives political donations. PAC’s are employee organisations which allow employees to contribute to a fund for political donations. Employees decide upon the recipients of the PAC donations. In 2006,2007, a total of £735,600£522,172 (£282,000735,600 in 2005)2006) was donated to political organisations by the GSK PAC. Annual General Meeting The AGM will be held at 2.30pm on Wednesday, 23rd21st May 20072008 at The Queen Elizabeth II Conference Centre, Broad Sanctuary, Westminster, London SW1P 3EE. The business to be transacted at the meeting will include: | • | Receiving and adopting GlaxoSmithKline's 2006 AnnualReportGlaxoSmithKline’s 2007 Annual Report | | | | | • | Approving the 20062007 Remuneration Report | | | The Remuneration Report on pages 6571 to 8286 sets out theremunerationthe remuneration policies operated by GlaxoSmithKline and disclosuresondisclosures on Directors’ remuneration, including those required by theCompaniesthe Companies Act 19852006 and the Directors’ Remuneration ReportRegulationsReport Regulations 2002. A resolution will be proposed to approve theRemunerationthe Remuneration Report. |
| GSK Annual Report 2007 | 65 | | | |
Back to Contents | | | REPORT OF THE DIRECTORS | | Corporate governance | | | | | | | Corporate governance | | continued | |
| • | Retirement, election and re-election of Directors | | | Dr PodolskyMr Witty, Mr Viehbacher and Dr BurnsProfessor Sir Roy Anderson have been appointed Directors since the2006the 2007 AGM and will offer themselves for election to the Board. MrHeslop, Sir Deryck Maughan,Christopher Gent, Sir Ian Prosser and Dr Schmitz and Sir Robert Wilson willeachwill each retire and offer themselves for re-election to the Board underarticleunder article 93 of the company’s Articles of Association. Dr Garnier will also be retiring by rotation but will not be seeking re-appointment as he will be retiring from the Board after the conclusion of the AGM. | | | | | • | Re-appointment and remuneration of Auditors | | | Resolutions will be proposed to re-appoint PricewaterhouseCoopersLLPPricewaterhouseCoopers LLP as auditors and to authorise the Audit Committee to determinetheirdetermine their remuneration. |
| | • | Special business | | | The company will seek authority to: | | | | | | | • | make donations to EU Political Organisationspolitical organisations and incur EU Political Expenditurepolitical expenditure, each capped at £50,000 | | | | | | • | allot Ordinary Shares in the company | | | | | | • | give the Directors authority to disapply pre-emption rights when allotting new Shares in connection with rights issues or otherwise up to a maximum of 5% of the current issued share capital and purchase its own Ordinary Shares up to a maximum of just under 10% of the current issued share capital.capital | | | | | | • | amend the company’sadopt new Articles of Association to enable electronic communication with shareholders, in accordance withreflect the changes introduced by the new Companies Act 2006. |
Shareholders are entitled to appoint one or more proxies to attend the AGM, and to speak and vote on their behalf. Details on how to appoint or be appointed a corporate representative or proxy can be found on page 171. The Notice of AGM will be published on the company’s website. Internal control framework The Board recognises its responsibility to present a balanced and understandable assessment of the Group’s position and prospects. The structure of accountability and audit operated in GSK is as follows. The Board has accountability for reviewing and approving the adequacy and effectiveness of internal controls operated by the Group, including financial, operational and compliance controls and risk management. The Board has delegated responsibility for such review to the Audit Committee, which receives reports from those individuals identified in the Committee’s Report on pages 6067 to 62.69. It is the responsibility of management, through the CET, to implement Board policies on risk and control. The CET is responsible for identifying, approving, monitoring and enforcing key policies that go to the heart of how the Group conducts business. The internal control framework includes central direction, resource allocation and risk management of the key activities of research and development, manufacturing, marketing and sales, legal, human resources, information systems and financial practice. As part of this framework, there is a comprehensive planning system with an annual budget approved by the Board. The results of operating units are reported monthly and compared towith the budget. Forecasts are prepared regularly during the year. Extensive financial controls, procedures, self-assessment exercises and risk activities are reviewed by the Group’s internal auditors. Commercial and financial responsibility, however, is clearly delegated to local business units, supported by a regional management structure. These principles are designed to provide an environment of central leadership coupled with local operating autonomy as the framework for the exercise of accountability and control within the Group. The Group also attaches importance to clear principles and procedures designed to achieve appropriate accountability and control. A Group policy, ‘Risk Management and Legal Compliance’, mandates that business units establish processes for managing and monitoring risks significant to their businesses and the Group. The internal control framework also relies on the following for overseeing and reporting risk and compliance issues.
Back to Contents
| Corporate governance | continued |
| |
Risk Oversight and Compliance Council (ROCC)
The ROCC is a council of senior executives authorised by the Board to assist the Audit Committee oversee the risk management and internal control activities of the Group. Membership comprises several CET members and some of the heads of departments with internal control, risk management, audit and compliance responsibilities. The ROCC meets on a regular basis to review and assess significant risks and their mitigation plans.plans and provide oversight of internal controls to ensure compliance with applicable laws, regulations and internal GSK policies. The ROCC, responding to the Group policy referred to above, has provided the business units with a framework for risk management and upward reporting of significant risks. Mitigation planning and identification of a manager with overall responsibility for management of any given risk is a requirement. Risk Management and Compliance Boards (RMCBs)
Risk Management and Compliance Boards (RMCBs) have been established in each of the major business units. Membership often comprises members of the senior executive team of the respective business unit, augmented by specialists where appropriate. The RMCBs oversee management of all risks that are considered important for their respective business units, including those risks that are designated as significant to GlaxoSmithKline as a whole, thus increasing the number of risks that are actively managed across the Group. Each RMCB regularly reports the status regarding its significant risks to the ROCC. Compliance functions
In a number of risk areas, specific standards that meet or exceed requirements of applicable law have been established. Specialist audit and compliance functions (for example: Corporate Environment, Health & Safety, Global Quality Assurance and Worldwide Regulatory Compliance) assist in the dissemination, implementation and audit of these standards. Corporate Ethics & Compliance (CEC)
The ROCC is also supported by the Corporate Ethics & Compliance department which is responsible for supporting the development and implementation of practices that facilitate employees’ compliance with laws and Group policy. The thrust of the Group’s compliance effort is due diligence in preventing and detecting misconduct andor non-compliance with law or regulation by promoting ethical behaviour, compliance with all laws and regulations, corporate responsibility at all levels and effective compliance systems.
| 66 | GSK Annual Report 2007 | | |
Back to Contents | | | REPORT OF THE DIRECTORS | | | Corporate governance | | | | | | | | Corporate governance | | continued | |
The CEC is managed by the Corporate Compliance Officer, who reports directly to the CEO. The Corporate Compliance Officer chairs the ROCC and provides summary reports on the ROCC’s activities and the Group’s significant risks to the CET and the Audit Committee on a regular basis. The Corporate Compliance Officer’s direct reporting line to the Audit Committee provides a mechanism for bypassing the executive management should the need ever arise. Areas of potentially significant risk
For details of risks affecting the Group, see ‘Risk factors’ on pages 4450 to 4753 and Note 4344 to the financial statements, ‘Legal proceedings’. Effectiveness of controls
The internal control framework has been in operation for the whole of the year under review and continues to operate up to the date of approval of this report. The system of internal controls is designed to manage rather than eliminate the risk of not achieving business objectives, and can only provide reasonable and not absolute assurance against material misstatement or loss. The Audit Committee receives reports on areas of significant risk to the Group and on related internal controls. Following consideration of these reports, the Audit Committee reports annually to the Board on the effectiveness of controls. Such controls may mitigate but cannot eliminate risks. In addition, there are areas of the Group’s business where it is necessary to take risks to achieve a satisfactory return for shareholders, such as investment in R&D and in acquiring new products or businesses. In these cases, it is the Group’s objective to apply its expertise in the prudent management rather than elimination of risk. The Directors’ review relates to the company and its subsidiaries and does not extend to material associated undertakings, joint ventures or other investments. The Board, through the Audit Committee, has reviewed the assessment of risks and the internal control framework that operates in GlaxoSmithKline and has considered the effectiveness of the system of internal control in operation in the Group for the year covered by this report and up to the date of its approval by the Board. The process followed by the Board in reviewing the system of internal controls accords with the guidance on internal control issued by the Turnbull Committee in 1999.Committee. Committee reports Audit Committee Report
The Audit Committee’s role flows directly from the Board’s oversight function and it is authorised by the Board to investigate any activity within its terms of reference. The Committee has written terms of reference which have been approved by the Board. The Committee reports regularly to the Board on the performance of the activities it has been assigned. The Committee’s main responsibilities include reviewing the corporate accounting and financial reporting process, monitoring the integrity of the financial statements, evaluating the system of internal control and the management of risks, overseeing activities of each of the Group’s compliance audit functions and overseeing compliance with laws, regulations and ethical codes of practice. The Committee’s oversight role requires it to address regularly the relationships between management and the internal and external auditors, and understand and monitor the reporting relationships and tiers of accountability between them.
<Back to Contents
| Corporate governance | continued |
| |
The Committee receives regular reports from members of the CET and senior managers covering the key compliance activities of the Group, including those concerning R&D, manufacturing, sales and marketing and EHS. Committee members, with the exception of Dr Podolsky, bring considerable financial and accounting experience to the Committee’s work. Members have past employment experience in either finance or accounting roles or comparable experience in corporate activities. Dr Schmitz was the Chairman of the Committee from April 2001 until September 2006. Prior to his appointmentPodolsky’s background as a Non-Executive Director ofworld-renowned researcher enables him to bring scientific expertise to the company, he was a Non-Executive Director of Glaxo Wellcome plc, where he served on the Audit Committee. Dr Schmitz has also been a member of the Executive Board of Directors of Deutsche Bank AG. He retired from that Board in 2000 having been in charge of investment banking. Dr Schmitz was formerly a member of the Executive Board of Directors of BASF from 1980 to 1990, including CFO from 1985 to 1990. He holds an MBA from Insead.Committee’s deliberations. Mr de Swaan joined the Board and the Committee with effect from 1st January 2006. He succeeded Dr Schmitz as Chairman of the Committee with effect from September 2006. When appointing Mr de Swaan to the Committee, the Board determined that he had recent and relevant financial experience, in accordance with the Combined Code. In coming to this conclusion, the Board paid particular attention to Mr de Swaan’s role as Chief Financial Officer of ABN AMRO, from which he retired on 31st December 2005. The Board also considers Mr de Swaan to be an Audit Committee Financial Expert, as defined by Sarbanes-Oxley. Sir Deryck Maughan is a Managing Director of Kohlberg Kravis Roberts & Co (KKR) and Chairman of KKR Asia. He was Chairman and CEO of Citigroup International and Vice Chairman of Citigroup Inc. Prior to the creation of Citigroup, he was Chairman and Co-Chief Executive Officer of Salomon Smith Barney. He was also Chairman and Chief Executive Officer of Salomon Brothers Inc. Sir Ian Prosser was CFO and later CEO of Bass plc and is a member of the Institute of Chartered Accountants in England and Wales. Dr Schmitz was the Chairman of the Committee from April 2001 until September 2006. Prior to his appointment as a Non-Executive Director of the company, he was a Non-Executive Director of Glaxo Wellcome plc, where he served on the Audit Committee. Dr Schmitz has also been a member of the Executive Board of Directors of Deutsche Bank AG. He retired from the Board in 2000 having been in charge of investment banking. Dr Schmitz was formerly a member of the Executive Board of Directors of BASF from 1980 to 1990, including CFO from 1985 to 1990. He holds an MBA from Insead. Sir Robert Wilson began his professional career as an economist. He is Chairman of BG Group plc. He held senior management positions at Rio Tinto plc culminating in his appointment as Executive Chairman, from which he retired in 2003. Dr Daniel Podolsky was appointed to the Committee with effect from 1st January 2007. He is a world-renowned researcher who has advanced knowledge of underlying mechanisms of disease and new therapies for gastrointestinal disorders. He is Mallinkrodt Professor of Medicine and Chief of Gastroenterology at Massachusetts General Hospital and Harvard Medical School as well as Chief Academic Officer of Partners HealthCare system. His background will enableenables him to bring scientific rather than financial or accounting expertise to the Committee’s deliberations. The Committee is supported by the Company Secretary, who attends the Committee’s meetings and itis also the Corporate Compliance Officer. It has available to it financial resources to take independent professional advice when considered necessary. Meetings of the Committee are attended by the Chairman, CEO, CFO, General Counsel, Head of Global Internal Audit (GIA), Corporate Compliance Officer and the external auditors.
| GSK Annual Report 2007 | 67 | | |
Back to Contents | | | REPORT OF THE DIRECTORS | | Corporate governance | | | | | | | | Corporate governance | | continued | |
In 2006,2007, the Committee worked to a structured programme of activities, with standing items that the Committee is required to consider at each meeting together with other matters focused to coincide with key events of the annual financial reporting cycle: | • | the external auditors reported to the Committee on all criticalaccountingcritical accounting policies, significant judgements and practices used by the company, alternativeaccountingalternative accounting treatments which had been discussed withmanagementwith management and the resultant conclusion by the external auditors,material written communications with management and anyrestrictionsany restrictions on access to information | | | | • | the CFO reported on the financial performance of the company and on technical financial and accounting matters | | | | | • | the General Counsel reported on material litigation | | | | | • | the Company Secretary and the Corporate Compliance Officer reported on corporate governance and on the activities undertaken by the ROCC | | | | • | the Heads of each of the Group’s compliance and audit groups reported on their audit scope, annual coverage, audit resources and on the results of audits conducted throughout the year | | | | • | the Corporate Compliance Officer reported on the activitiesundertaken by the ROCC | | | | • | the Company Secretary, as Chairman of the Disclosure Committee,reported on matters that affected the quality and timely disclosureofdisclosure of financial and other material information to the Board, to thepublicthe public markets and to shareholders. This enabled the Committee toreviewto review the clarity and completeness of the disclosures in thepublishedthe published annual financial statements, interim reports, quarterlyandquarterly and preliminary results announcements and other formalannouncementsformal announcements relating to financial performance prior to theirreleasetheir release by the Board. | |
The Audit Committee, management, internal auditors and the full Board work together to ensure the quality of the company’s corporate accounting and financial reporting. The Committee serves as the primary link between the Board and the external and internal auditors. This facilitates the necessary independence from management and encourages the external and internal auditors to communicate freely and regularly with the Committee. In 2006,2007, the Committee met both collectively and separately with the external auditors and the Head of GIA, and the Corporate Compliance Officer without members of management being present. The Committee has primary responsibility for making a recommendation to shareholders on the appointment, reappointment and removal of the external auditors by annually assessing the qualifications, expertise, resources and independence of the external auditors and the effectiveness of the audit process.
Back to Contents
| Corporate governance | continued |
| |
In making its assessment, the Committee considers papers which detail the relevant regulatory requirements relating to external auditors and evaluates reports from the external auditors on their compliance with the requirements. Where the external auditors provide non-audit services, the Committee ensures that auditor objectivity and independence are safeguarded by a policy requiring pre-approval by the Audit Committee for such services. These services may include audit services, audit-related services, tax services and other services. Pre-approval is detailed as to the particular service or categories of services, and is subject to a specific budget. The external auditors and management report regularly to the Committee regarding the extent of services provided in accordance with this pre-approval and the fees for the services performed. The Committee may also pre-approve additional services on a case-by-case basis. Expenditure on audit and non-audit services is set out in Note 79 to the financial statements, ‘Operating profit’. The guidelines set out in the company’s policy on engaging the external auditors to provide non-audit services include ascertaining that: the skills and experience of the external auditors make them a suitable supplier of the non-audit services; adequate safeguards are in place so that the objectivity and independence of the audit are not compromised; and the fee levels relative to the annual audit fee are within the limits set by the Committee. The company also has well-established policies, including a Code of Ethics, which is available on its website, and a help-line facility for the reporting and investigation of unlawful conduct. No waivers to the Code were made in 2006.2007. The Committee met in full session fivesix times in 20062007 and five times on a quorate basis. Each full session was attended by all members except Mr de Swaan and Sir Deryck Maughan, who were eachwas unable to attend one meeting. Nominations Committee Report
The Nominations Committee’s terms of reference include responsibility for proposing the appointment of Board and Committee members. During 2006,2007, the Committee’s main focus was on the selection of a new CEO to succeed Dr Garnier. Sir Robert Wilson, Mr de Swaan and Mr Culp attended the Committee’s meetings for the purpose of considering Dr Garnier’s successor. In implementing its process to select the new CEO, the Committee took external advice from an executive search company, which conducted a search to identify potential external candidates, in addition to the internal candidates already identified. A further executive search company was used to conduct a 360 degrees analysis of the candidates. The Chairman conducted interviews with a number of key individuals both within and outside the company to gain their perspectives on the candidates. In addition, Dr Garnier provided the Committee with his analysis of the candidates. After considering the Chairman and CEO’s feedback, the external advice and benchmarking, the Committee concluded by making a recommendation to the Board that Mr Witty should be appointed the Company’s next CEO. The Committee also made recommendations to the Board on the appointment of Dr PodolskyBurns as a Non-Executive Director, Professor Sir Roy Anderson as a Non-Executive Director and Scientific/Medical expert.expert and the appointment of Mr Viehbacher as an Executive Director.
| 68 | GSK Annual Report 2007 | | |
Back to Contents | | | REPORT OF THE DIRECTORS | | | Corporate governance | | | | | | | | Corporate governance | | continued | |
In February 2006,Following recommendations by the Committee, recommended to the Board that Dr Moncef Slaoui, would succeed Dr Yamada as Chairman, Research & Development, on his retirement from the company on 31st May 2006.
In February 2007, the Committee with the Board’s approval, appointed Dr Stephanie Burns was appointed as a Non-Executive Director.Director in February 2007 and Professor Sir Roy Anderson in October 2007. Professor Sir Roy Anderson has been appointed as one of the Board’s Scientific/Medical experts.
When recruiting Non-Executive Directors, the Committee considers the particular skills, knowledge and experience that would benefit the Board most significantly for each appointment. Broad selection criteria are used which focus on achieving a balance between the representation of European, UK and US markets, and having individuals with CEO experience and skills developed in various sectors and specialities. During 2006,2007, particular focus was placed upon recruiting a Non-Executive with scientific and medical expertise.expertise and a Non-Executive with CEO experience from the USA. Professional search agencies are engaged specialising in the recruitment of high calibre Non-Executive Directors. Dossiers of potential Non-Executive appointees are provided to the Committee and candidates are short-listed for interview after considering their relevant qualifications. A customised induction process is conducted for each of the new Non-Executive Directors focusing on their particular experience and taking account of their different backgrounds. This process includes meeting members of the CET and other senior executives and visiting particular operational facilities of the Group. The Committee continued to keep under review the succession planning for senior executive positions, including that of the CEO. During 2006, the Committee agreed the process for selecting Dr Garnier’s successor as CEO of GSK.
When appointing new Executive Directors, and CET members, the Committee considers the skills, knowledge and experience required for the particular executive position. The Committee will consider potential external and internal candidates before recommending to the Board to approve the new appointment. All new Directors offer themselves for election at the company’s next AGM. Their appointments are announced publicly. TheAt the end of 2006 the Committee recommended the appointment of Dr Podolsky to the Corporate Responsibility Committee with effect from June 2006 and then to the Audit Committee with effect from 1st January 2007. The Committee also recommendedand the appointment of Sir Christopher Gent to the Remuneration Committee both with effect from 1st January 2007.
The Committee also recommended the appointment of Dr Burns to the Corporate Responsibility Committee in December 2007. The Committee met fourthree times during 2006 in full session.2007. All members were present at the full meetings.meetings, except Dr Schmitz who was unable to attend one meeting. Remuneration Report
The Remuneration Report can be found on pages 6571 to 82.86. Corporate Responsibility Committee Report
The main responsibilities of the Corporate Responsibility Committee are to review GSK’s policies and practices in anticipating and managing external issues that have the potential to impact seriously the Group’s business and reputation. The Committee has terms of reference, which have been approved by the Board and are published on the GSK’s website. The Committee meets three times a year and has a rolling agenda that ensures that progress on meeting GSK’s Corporate Responsibility Principles is reviewed on an appropriate basis. Four Principles – access to medicines, standards of ethical conduct, research and innovation and global community partnerships – are reviewed annually. Other Principles are discussed at least once every two years. The Committee also reviews and approves the annual Corporate Responsibility Report. The Committee receives regular reports from the members of the CET and senior managers, which cover the key corporate responsibility areas for GSK. The Committee members have been selected for the relevant expertise that they may contribute to the Committee’s activities. The Committee members are Sir Christopher Gent (Chairman), Dr Burns, Sir Ian Prosser, Dr Podolsky and Mr de Swaan. The Committee is supported by the Company Secretary, who attends the Committee’s meetings. The CEO, General Counsel, Senior Vice President of Corporate Communications and Community Partnerships and the Head of Corporate Responsibility also attend the meetings. The Chairman reports to the Board on the Committee’s activities. During the year the Corporate Responsibility Committee reviewed GSK’s activity in a number of responsibility areas including access to medicines, community partnerships, reputation management, caringhuman rights in the supply chain, efficiency of manufacturing processes, climate change, the risk management processes in R&D, transparency of clinical trial data, informed consent procedures for the environment, ethical conduct, Direct To Consumer (DTC) advertisingclinical trials, financial interactions with health care professionals, animal research and GSK’s commercial practices codes. Membershiptesting, ethics and compliance initiatives, policy violations and discipline, use of the Committee changed during the year. Following Dr. Shapiro’s retirement from the Board in May 2006, Tom de Swaansocial media tools and Dr. Daniel Podolsky joined the Committee.employment practices.
The Committee met fivethree times during 2006.2007. Each meeting was attended by all Committee members except Sir Ian Prosser who was unable to attend one meeting, and Dr. Shapiro who was unable to attend two meetings.members. GSK’s Corporate Responsibility Report can be accessed on www.gsk.com.the website. The Combined Code Throughout 2006,2007, the company complied with the Code provisions of the Combined Code, except as follows: B.1.1 – In designing schemes of performance-related remuneration, the Remuneration Committee should follow the provisions in Schedule A to the Code. Item 6 of Schedule A states that, in general, only basic salary should be pensionable. The company’s position is explained in the Remuneration Report on pages 6571 to 82.86.
Back to Contents
| Corporate governance | continued |
| |
US law and regulation A number of provisions of US law and regulation apply to GSK because the company’s shares are quoted on the New York Stock Exchange (NYSE) in the form of ADSs. NYSE rules
In general, the NYSE rules permit the company to follow UK corporate governance practices instead of those applied in the USA, provided that the company explains any significant variations. This explanation is on the company’s website. NYSE rules that came into effect in 2005 require the company to file annual and interim written affirmations concerning the Audit Committee and the company’s statement on significant differences in corporate governance. Sarbanes-Oxley Act of 2002
Following a number of corporate and accounting scandals in the USA, Congress passed the Sarbanes-Oxley Act of 2002 (Sarbanes-Oxley). Sarbanes-Oxley is a wide ranging piece of legislation concerned largely with financial reporting and corporate governance. As recommended by the Securities and Exchange Commission (SEC), GSK has established a Disclosure Committee. The Committee reports to the CEO, the CFO and to the Audit Committee. It is chaired by the Company Secretary and the members consist of senior managers from finance, legal, compliance, corporate communications and investor relations.
| GSK Annual Report 2007 | 69 | | |
Back to Contents | | | REPORT OF THE DIRECTORS | | Corporate governance | | | | | | | | Corporate governance | | continued | |
External legal counsel and the external auditors are invited to attend its meetings periodically. It has responsibility for considering the materiality of information and, on a timely basis, determining the disclosure of that information. It has responsibility for the timely filing of reports with the SEC and the formal review of the Annual Report and Form 20-F. In 2006,2007, the Committee met 14nine times. Sarbanes-Oxley requires that the Annual Report contains a statement as to whether a member of the company’s Audit Committee is an audit committee financial expert. For an explanation and details of the basis for the Board’s judgement on this matter, refer to page 61.67. Additional disclosure requirements arise under Section 302 and Section 404 in respect of disclosure controls and procedures, and internal control over financial reporting. Section 302: Corporate responsibility for financial reports
Sarbanes-Oxley also introduced a requirement for the CEO and the CFO to complete formal certifications, confirming that: | • | they have each reviewed the Annual Report and Form 20-F | | | | | • | based on their knowledge, it contains no material misstatements or omissions | | | | | • | based on their knowledge, the financial statements and other financial information fairly present, in all material respects, the financial condition, results of operations and cash flows as of the dates, and for the periods, presented in the Annual Report and Form 20-F |
| | | • | they are responsible for establishing and maintaining disclosure controls and procedures that ensure that material information is made known to them, have evaluated the effectiveness of these controls and procedures as at the year end,year-end, the results of such evaluation being contained in the Annual Report and Form 20-F | | | | | • | they are responsible for establishing and maintaining internal control over financial reporting that provides reasonable assurance regarding the reliability of financial reporting and the preparation of financial statements for external purposes in accordance with generally accepted accounting principles | | | | | • | they have disclosed in the Annual Report and Form 20-F any changes in internal controls over financial reporting during the period covered by the Annual Report and Form 20-F that have materially affected, or are reasonably likely to affect materially, the company’s internal control over financial reporting | | | | | • | they have disclosed, based on their most recent evaluation of internal control over financial reporting, to the external auditors and the Audit Committee, all significant deficiencies and material weaknesses in the design or operation of internal control over financial reporting which are reasonably likely to affect adversely the company’s ability to record, process, summarise and report financial information and any fraud (regardless of materiality) involving persons that have a significant role in the company’s internal control over financial reporting. |
The CEO and CFO completed these certifications on 2nd March 2007, and they will be filed with the SEC as part of the Group’s Form 20-F. The Group has carried out thean evaluation under the supervision and with the participation of the Group’s management, including the CEO and CFO, of the effectiveness of the design and operation of the Group’s disclosure controls and procedures as at 31st December 2006. 2007.
There are inherent limitations to the effectiveness of any system of disclosure controls and procedures, including the possibility of human error and the circumvention or overriding of the controls and procedures. Accordingly, even effective disclosure controls and procedures can only provide reasonable assurance of achieving their control objectives. Based upon the Group’s evaluation, the CEO and CFO have concluded that, as at 31st December 2006,2007, the disclosure controls and procedures were effective to provide reasonable assurance that information required to be disclosed in the reports the Group files and submits under the US Securities Exchange Act of 1934, as amended, is recorded, processed, summarised and reported as and when required and that it is accumulated and communicated to management, including the CEO and CFO, as appropriate, to allow timely decisions regarding required disclosure.
The CEO and CFO completed these certifications on 29th February 2008.
<Back to Contents
| Corporate governance | continued |
| |
Section 404: Management’s annual report on internal control over financial reporting
In accordance with the requirements of section 404 of Sarbanes-Oxley, the following report is provided by management in respect of the Company’s internal control over financial reporting (as defined in Rules 13a-15(f) and 15d-15(f) under the US Securities Exchange Act of 1934): | • | Management is responsible for establishing and maintaining adequate internal control over financial reporting for the Group. Internal control over financial reporting is designed to provide reasonable assurance regarding the reliability of financial reporting and the preparation of financial statements for external purposes in accordance with IFRS including the reconciliations required under US GAAP. | | | | | • | Management conducted an evaluation of the effectiveness of internal control over financial reporting based on the framework inInternal Control – Integrated Frameworkissued by the Committeeof Sponsoring Organisations of the Treadway Commission.Commission | | | | | • | Management has assessed the effectiveness of internal control over financial reporting, as at 31st December 2006,2007 and has concluded that such internal control over financial reporting was effective. In addition, there have been no changes in the Group’sGroup's internal control over financial reporting during 20062007 that have materially affected, or are reasonably likely to affect materially, the Group’sGroup's internal control over financial reporting. | | | | | • | PricewaterhouseCoopers LLP, which has audited the consolidated financial statements of the Group for the year ended 31st December 2006,2007, has also audited management’s assessment of the effectiveness of internal control over financial reporting andassessed the effectiveness of the Group’s internal control over financial reporting under Auditing Standard No. 25 of the Public Company Accounting Oversight Board (United States). Their audit report may be found on page 85.89. | | |
| 70 |
| GSK Annual Report 20062007 | 64 | |
Back to Contents | Remuneration Report | | | | | | | | | Remuneration Report |
| | |
The Remuneration Report sets out the remuneration policies operated by GSK in respect of the Directors and Corporate Executive Team (CET) members, together with disclosures on Directors’ remuneration including those required by The Directors’ Remuneration Report Regulations 2002 (the Regulations). In accordance with the Regulations, the following sections of the Remuneration Report are subject to audit: Annual remuneration; Non-Executive Directors’ remuneration; Share options; Incentive plans; performance criteria on Performance Share Plans and share options; and Pensions. The remaining sections are not subject to audit nor are the pages referred to from within the audited sections. This Report is submitted to shareholders by the Board for approval at the Annual General Meeting, as referenced in the noticeNotice of Annual General Meeting. Throughout the Remuneration Report the Executive Directors and CET members are referred to as the ‘Executives’. References to GlaxoSmithKline shares and ADSs mean, respectively, Ordinary Shares of GlaxoSmithKline plc of 25p and American Depository Shares of GlaxoSmithKline plc. Each ADS represents two GlaxoSmithKline shares. |
| GSK Annual Report 20062007 | 71 | 65 | |
Back to Contents | | | Remuneration Report | continued | |
| | | | | Remuneration Report | | | |
Introduction The Remuneration Committee (or Committee) is responsible for making recommendations to the Board on the company’s remuneration policy and, within the terms of the agreed policy, determining the total individual remuneration packages of the Executives. GSK’s remuneration policy was agreed after an extensive consultation process with shareholders and institutional bodies during the course of 2003 and 2004. The appropriateness of the elements of the policy is kept under review by the Committee.
The Chairman of the Remuneration Committee continues to have regular dialogue with institutional investors regarding GSK’s remuneration policy.
GlaxoSmithKline’s remuneration policy is designed to establish a framework for remuneration that is consistent with the company’s scale and scope of operations, meets the recruitment needs of the business and is closely aligned with UK shareholder guidelines. As at 31st December 2006,2007, the company was the second largest pharmaceutical company in the world by revenue, with operations on five continents with products sold in over 140 countries and with overapproximately 50% of sales being generated in the USA. The appropriateness of GSK’s remuneration policy is kept under review by the Remuneration Committee and, as part of this ongoing commitment, the Committee has commenced a process to reassess the remuneration policy to ensure that it continues to support the future direction of the business. The company has announced the appointment of its new CEO, effective May 2008. A dialogue has begun, with the purpose of reviewing the alignment of the remuneration structure with the new business priorities set by the new CEO. This may lead to changes being considered over the coming year. The Chairman of the Committee continues to have regular dialogue with institutional investors regarding GSK’s remuneration policy and any material changes to the policy will be discussed with major shareholders and disclosed in the 2008 Remuneration Report. The remainder of this report sets out GSK’s current remuneration policy. Remuneration Committee
Sir Robert Wilson has been Chairman of the Committee since 17th May 2004. Sir Crispin Davis, Mr Culp, Sir Christopher Gent and Dr Schmitz were members of the Committee throughout 2006.2007. The Board deemed all of the members of the Committee to be independent Non-Executive Directors in accordance with the Combined Code. FollowingCode with the change toexception of the Combined Code made byChairman of the Financial Reporting Council, with effect from 1st November 2006,company Sir Christopher Gent, who was appointed a member ofindependent on appointment to the Committee with effect from 1st January 2007.company.
The Committee met four times during 20062007 with each member attending as follows: | | Number of meetings | | Number of meetings | | Number of meetings | | Number of meetings | | | | held whilst a | | attended by | | held whilst a | | attended by | | | Name | Committee member | | Committee member | | Committee member | | Committee member | |
|
| |
| | | Sir Robert Wilson | 4 | | 4 | | 4 | | 4 | | | Mr Larry Culp | 4 | | 3 | | | | Mr L Culp | | 4 | | 4 | | | Sir Crispin Davis | 4 | | 4 | | 4 | | 4 | | | Dr Ronaldo Schmitz | 4 | | 4 | | | | Sir Christopher Gent | | 4 | | 4 | | | Dr R Schmitz | | 4 | | 4 | |
|
| |
| |
At these meetings, amongst other items, the Committee considered:considered the terms of service and remuneration levels for new Executive appointments and the competitiveness of the company’s total reward package, including the level of annual and long-term incentive opportunity. • | the terms of service and remuneration levels for new Executive appointments | • | the competitiveness of the company’s total reward package, including the level of annual and long-term incentive opportunity | • | the effectiveness of the annual bonus plan, particularly for R&D employees | • | the structure and competitiveness of US pension arrangements. |
The policy aspects above were discussed by the Chairman and the Chairman of the Committee at their annual meetings with institutional investors. In addition, each year following the AGM, the Committee considers GSK’s remuneration policy in the context of market and best practice. Two quorate meetings were held during the year to approve the formal grant of share options and performance share awards in accordance with GSK remuneration policy. With the exception of Mr Bicknell (Company Secretary), no employees of the company were involved in the conduct of Committee meetings. Dr Garnier (CEO) and Mr Phelan (Senior Vice President, Human Resources), were invited to attend part of some meetings of the Committee as required. Deloitte & Touche LLP (Deloitte) havehas been appointed by the Committee to provide it with independent advice on executive remuneration. Deloitte provided other consulting services to GSK during the year, but did not provide advice on executive remuneration matters other than to the Committee. Towers Perrin providesprovided market data and data analysis to the Committee. Remuneration policy Principles
The remuneration policy for GlaxoSmithKlineGSK is designed to secure outstanding executive talent, and to provide pay for performance and only for performance, within a transparent and robust governance structure. The Committee determined that GSK’s remuneration policy would be based on the following key principles: | • | the remuneration structure must support the needs of the business in a very competitive market place | | • | UK shareholder guidelines will be followed to the maximum extent consistent with the needs of the business and the company would maintain a regular dialogue with shareholders | | • | global pharmaceutical companies are the primary pay comparator group | | • | performance conditions would be based on the measurable delivery of strong financial performance and the delivery of superior returns to shareholders as compared with other pharmaceutical companies | | • | a high proportion of the total remuneration opportunity will be based on performance-related remuneration which will be delivered over the medium to long term | | • | remuneration would be determined using the projected value method (see ‘Benchmarking’ below) | | • | there would be one remuneration structure for Executive Directors and the CET with the same performance conditions applying equally to their long-term incentive awards | | • | no ex-gratia payments will be made | | • | pay structures would be as simple as is consistent with the business needs. |
Overall, the policy is intended to provide median total remuneration for median performance, with the opportunity to earn upper quartile total remuneration for exceptional performance. Poor performance will result in total remuneration significantly below the pay comparator group median. This strong alignment with performance is demonstrably in the interests of shareholders and provides the Executives with unambiguous signals about the importance of delivering success to the company’s shareholders.
72 | GSK Annual Report 20062007 | 66 | |
<Back to Contents | | | Remuneration Report | | | | | | | | | Remuneration Report | | continued |
| | |
Commitment
The Committee will apply this policy onin a consistent and transparent basis.way. Any significant changes in the measures used to assess performance will be discussed with shareholders. In the use of comparators for pay benchmarking, the Committee will use its discretion to ensure that remuneration levels are reasonable, and if it believes that changes may cause concern amongst shareholders, the position will be discussed with shareholders prior to implementation. Pay and performance comparators
The following table sets out the companies used for pay and performance comparison: | | | | Market Cap | | | | | | 31.12.06Capitalisation | | | Company | Country | | 31.12.07 | | | | | £m | |
|
|
|
| | | Abbott Laboratories | USA | | 38,14445,822 | | | Amgen | USA | | 40,65625,322 | | | AstraZeneca | UK | | 42,03632,549 | | | Bristol-Myers Squibb | USA | | 26,41026,486 | | | Eli Lilly | USA | | 30,07931,955 | | | GlaxoSmithKline | UK | | 77,36270,452 | | | Johnson & Johnson | USA | | 97,66196,264 | | | Merck | USA | | 48,29463,509 | | | Novartis | Switzerland | | 77,06674,112 | | | Pfizer | USA | | 95,28180,550 | | | Roche Holdings | Switzerland | | 80,15763,543 | | | Sanofi-Aventis | France | | 64,16665,724 | | | Schering-Plough | USA | | 17,88221,854 | | | Takeda Pharmaceutical Company* | Japan | | 31,18225,196 | | | Wyeth | USA | | 34,98731,944 | |
|
|
|
| | * only included for performance comparisoncomparison. |
The merger of Aventis and Sanofi-Synthelabo during 2004 reduced the size of the comparator group to 13 companies and GlaxoSmithKline. During the year, the Committee reviewed this group, as part of its continuous appraisal of GSK’s remuneration arrangements and as a result determined that Amgen should be added to the group with effect from 1st January 2007.
Benchmarking
For benchmarking purposes, total remuneration incorporates base salary, annual bonus and long-term incentives. Notwithstanding this, whenWhen setting pay, the Committee also has due regard to the Executives’ pension arrangements. The global pharmaceutical industry is used as the primary pay comparator for Executives, as it is the appropriate marketplace for the company’s most senior executive talent. In the first instance, pay is benchmarked to publicly available remuneration data for these companies. To provide additional context reference is also made to the Towers Perrin annual global pharmaceutical pay survey for the Pharmaceutical Human Resources Association (PHRA). To ensure that the global pharmaceutical industry benchmark is subject to scrutiny and review, the Committee also regularly considers pay data from other global businesses primarily in the consumer and the manufacturing sectors. Prior to determining the annual long-term incentive opportunity, the Committee considers a range of payout levels that may be achieved based on different assumptions, such as share price growth, performance levels etc. For performance in line with expectations, total remuneration is targeted at the median of the pay comparator group and the long-term incentive opportunity is set in a way which provides for positioning of total remuneration at the median of this group. Valuation method
The projected value method is used to benchmark total remuneration. This method projects the future value of the remuneration package under different performance scenarios. This method, taken together with an assessment of the pay comparator groups’group’s incentive policies over several years, moderates the impact of market fluctuations in the short term and strengthens the focus on performance. Following the independent review in 2003, theThe Committee made a deliberate and conscious decision to useuses the projected value method for pay benchmarking purposes as it enables a comparison of packages with different structural characteristics and provides an insight into the value gearing of different equity instruments.
Individual elements of remuneration
The balance between the fixed (base salary) and variable (annual bonus and long-term incentive) elements of remuneration changes with performance. The chart below shows the anticipated normal range of the mix between fixed and variable pay at different levels of performance for the CEOMr Heslop and the typical case for the other Executive Directors (ED).Dr Slaoui. In some years, the ranges may be higher or lower, depending on the performance of the company and the individual. 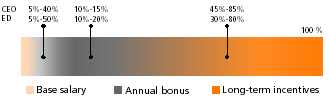 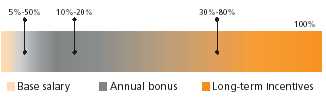
Base salary
Base salaries are set by reference to the median for the relevant market. For Executives, this is the pharmaceutical pay comparator group. Actual salary levels are reviewed annually and are influenced by an Executive’s experience, responsibility and market value. Any changes usually take effect from 1st April. The table below sets out current base salary increases that took effect during the yearsalaries and those that will take effect in April 2007.2008. | | Base salary from | | Percentage | | Base salary from | | | | 1st April 2006 | | increase | | 1st April 2007 | |
|
|
|
|
|
| | | Dr Garnier | $1,730,000 | | 6 | % | $1,834,000 | | | Mr Heslop* | £400,000 | | 12.5 | % | £450,000 | | | Dr Slaoui* | $600,000 | ** | 21 | % | $725,000 | |
|
|
|
|
|
| |
| | | Base salary from | | Percentage | | Base salary from | | | | | 1st April 2007 | | increase | | 1st April 2008 | |
| | | Dr JP Garnier* | | $1,834,000 | | – | | $1,834,000 | | | Mr J Heslop** | | £450,000 | | 7.8 | % | £485,000 | | | Dr M Slaoui** | | $725,000 | | 13.8 | % | $825,000 | |
| |
| * | Dr Garnier will retire from the Board on 21st May 2008. | | | ** | These base salary increases reflect the Committee’s assessment of performance in their respective roles since appointment. | ** | Dr Slaoui was appointed to the Board with effect from 17th May 2006 and succeeded Dr Yamada with effect from 1st June 2006. |
Mr Witty and Mr Viehbacher were both appointed to the Board with effect from 31st January 2008. Their salaries at that time were £550,000 and $800,000 respectively.
|
| GSK Annual Report 20062007 | 73 | 67 | |
<Back to Contents | | | Remuneration Report | continued | |
| | | Business review | | Remuneration Report | | continued | | |
Annual bonus
All annual cash bonuses are determined on the basis of a formal review of annual performance against stretching financial targets based on profit before interest and tax and are subject to detailed assessment of individual, business unit and Group achievements against objectives. No bonus is payable if financial performance is less than 96% of the target. The maximum annual cash bonus that Executives can earn based solely on corporate performance is approximately two-thirds of the maximum bonus opportunity. The individual performance against objectives can increase or decrease the bonus level by a factor which can range from zero to 1.5. Bonuses are subject to upper limits which, for the Executives other than the CEO, range between 100% and 200% of base salary. The CEO’s maximum bonus opportunity is 200%. Following the review of the Annual Bonus Plan, the Committee determined that bonus measures linked to the pipeline would be introduced for R&D employees including Dr Slaoui. A robust governance structure has been established to ensure that the bonus payable under the revised arrangements fairly reflects R&D productivity and performance as well as profit targets. The Committee will review the bonus arrangements after the first year of operation.
The aim of the remuneration policy is to deliver annual cash remuneration in line with the median of the pay comparator group for on-target business performance. In the case of the CEO, the bonus targets are set by the Board. In setting the objectives for the CEO, the Board takes into account the strategies that have been developed by the company, andwhich are set out on page 210 of the Annual Report. For reasons of commercial sensitivity, the specific objectives set against the strategic business drivers, as set out on page 210, are kept confidential. Following the end of the financial year, the Board reviews the CEO’s performance generally and against the set objectives, and the Committee then determines the bonus payable. For the other Executives, the CEO makes recommendations to the Committee regarding the performance level achieved against objectives. These recommendations are then considered by the Committee to determine the resultant bonus. The objectives set for 20062007 focused in particular on building the best productcontinued development and launch of late-stage pipeline inassets, delivery of commercial plans and acceleration of operational excellence programmes. Bonus measures for R&D employees, including Dr Slaoui, are linked to the industrypipeline. A robust governance structure has been established to ensure that the bonus payable fairly reflects R&D productivity and delivering commercialperformance as well as profit targets. The Committee reviewed the new arrangements following the first year of implementation and operational excellence.agreed that it should continue as established. The Committee took into account the company’s success in achieving thesethe above objectives, as well as individual Executives’ performance, when determining the bonus awards for 2006.2007. Looking forward, in order to drive the necessary changes through the business, the Committee may set additional targets with associated bonuses for the achievement of specific operational goals. Any incremental bonus will be in the form of GSK shares deferred for a period and will not exceed 100% of salary. Long-term incentives
Executives are eligible for performance shareannual long-term incentive (LTI) awards, and share options. Thethe remuneration policy provides that annual long-term incentive (LTI) awardsthese will normally be made up of a performance share award and a share option award. The Committee considers that performance shares provide a stronger alignment to shareholder interests, and therefore the remuneration policy places greater emphasis on the use of performance shares. LTI awards are determined such that for on-target performance more than half of the LTI reward should be derived from performance shares. The annual grant of LTI awards using more than one plan is consistent with the practice of the pay comparator group and other leading UK companies. LTIsLTI awards for the CET are provided on the same basis as the Executive Directors. The level of the annual LTI opportunity is considered carefully year-on-year by the Committee in the context of market practice and GSK’s policy on market positioning. Following this review in 2006, the Committee determined it appropriate to make adjustments to the LTI awards for a number of Executives in line with the policy. To align the award cycles more closely with GSK’s financial year and budgeting process, the Committee decided in 2005 to change the annual grant date for LTI awards for all eligible employees from the fourth quarter of each year to the first quarter of each year. No compensation was provided for the change in the award cycle.
Historically, the performance period for awards made in the fourth quarter started on 1st January following the date of award. For LTI awards made in 2006 and thereafter, theThe performance period starts on 1st January of the year of award (i.e. 1st January 20062008 for awards made in February 2006)2008).
Performance share awardsshares and share options are delivered to US resident executives in the form of ADSs. Awards are delivered in the form of Ordinary Shares to executives resident in the UK and other countries. All awards are made under plans which incorporate dilution limits consistent with the guidelines provided by the Association of British Insurers, the National Association of Pension Funds and other shareholder representative bodies. Current estimated dilution from existing awards under all GlaxoSmithKlineGSK employee share schemes made since the merger is approximately 6.6%6.4% of the company’s share capital at 31st December 2006.2007. a) Performance shares
For the Executives, the level of performance shares vesting is based on the company’s Total Shareholder Return (TSR) relative to the performance comparator group (see page 67)73) over a three-year measurement period. TSR was chosen as the most appropriate comparative measure since it focuses on the return to shareholders, is a well-understood and tested mechanism to measure performance and allows comparison between companies operating in different countries. TSR is measured in Sterling over the performance period and represents the change in the value of a share together with the value of reinvested dividends paid. In order to remove the impact of the varying tax treatments of dividends in different jurisdictions, all dividends are reinvested gross. The table below sets out the performance share awards made in February 2007,2008, for which full disclosure will be made in the 20072008 Remuneration Report. | | | | | | | Executive Director | Performance share award | | Market price on
date of grant | |
|
|
|
| | | Dr JP Garnier* | – | | – | | | Mr A Witty | 225,000 shares | | £11.47 | | | Mr J Heslop | 105,000 shares | | £11.47 | | | Dr M Slaoui | 69,000 ADSs | | $44.75 | | | Mr C Viehbacher | 42,500 ADSs | | $44.75 | |
|
|
|
| |
| * | | | Market price on | | Executive Director | Performance share award | | date of grant | |
|
|
|
| | | Dr Garnier | 240,000 ADSs | | $58.00 | | Mr Heslop | 105,000 shares | | £14.88 | | Dr Slaoui | 69,000 ADSs | | $58.00 | |
|
|
|
| will retire from the Board on 21st May 2008. |
If GSK is ranked at the median of the performance comparator group, 35% of the shares will vest. Any ranking below this point will result in no shares vesting. Only if GSK is one of the top two companies will all of the shares vest. When determining vesting levels, the Committee has regard for the company’s underlying financial performance.
| 74 |
| GSK Annual Report 20062007 | 68 | |
<Back to Contents | | | Remuneration Report | | | | | | | Business review | | Remuneration Report | | continued |
| | |
The tablegraph below sets out the vesting schedule for the 2007 awards made to the Executives in 2008 based on a performance comparator group comprising 14 companies excluding GSK. Where GSK’s TSR performance falls between two companies vesting increases on a straight-line basis. | | Percentage of | | TSR rank | award vesting* |
|
| | 1 | 100% | | 2 | 100% | | 3 | 90% | | 4 | 80% | | 5 | 70% | | 6 | 60% | | 7 | 50% | | Median | 35% | | Below median | 0% |
|
|
| | * | TSR is measured on a pro-rata basis. Where GlaxoSmithKline’s performance falls between two of the comparators, the level of vesting will be determined by the actual relative level of TSR rather than simple ranking. | |
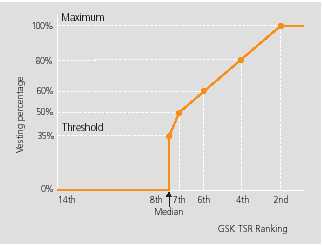 To provide a closer link between shareholder returns and payments to the Executives, notional dividends are reinvested and paid out in proportion to the vesting of the award. The receipt of dividends has been incorporated into the benchmarking of award levels. In addition, performance shares earned by the Executives cannot be sold, except to meet related tax liabilities, for a further two years following the end of the vestingperformance period. The Committee believes that this further aligns the interests of the Executives with the long-term interests of shareholders. The Performance Share Plan awards granted to the Executive Directors (excluding Dr Slaoui) in December 2003,2004, with the performance period starting on 1st January 20042005 and ending on 31st December 2006 did not vest for the Executives who were2007 vested in office in 2003part (38.47%) because GSK’s relative TSR performance was belowplaced the company above the median and as a resultof the awards lapsed.comparator group. The awards made in 2003 to other senior executives in 2004, including Dr Slaoui, and Mr Heslop, were dependent in part on TSR performance and in part on EPS performance. Half of these awardsThe TSR portion vested as GSK’sin part and the EPS performance reached the target level for full vesting.portion vested in full. The vesting tables for the performance share awards granted in 2003, 2004, 2006, 2007 and 20062008 are given on page 80.84. b) Share options
Share options allow a holder to buy shares at a future date at the share price prevailing at the time of grant. Share options are granted to more than 12,000 managers at GlaxoSmithKline,GSK, including the Executives. The vesting of the share options granted to the Executives is linked to the achievement of compound annual EPS growth over the performance period. EPS is measured at constant exchange rates (CER) as it is GSK’s practice to measure performance on a CER basis. The Committee considers that EPS is the key measure of the performance of the business and is fully reflected through the business measures extended throughout the Group, ensuring organisational alignment. When setting EPS targets the Committee considers, prior to each grant, the company’s internal projections and analysts’ forecasts for GlaxoSmithKline’sGSK’s EPS performance, as well as analysts’ forecasts for the pharmaceutical industry. After extensive and careful consideration, the Committee agreed that the annualised growth in EPS to achieve 100% vesting for the share option awards granted in February 20072008 would be RPI + 6%. The following key principles govern the use of EPS as a performance measure: | • | adjustments will only be considered for major items | | • | adjustments will be for the judgement of the Committee | | • | the purpose of the adjustments is to ensure that the performance measurement is fair and reasonable to both participants and shareholders | | • | any discretion exercised by the Committee will be disclosed to shareholders in the Annual Report. |
The Committee will set out the basis of its decision if it considers it appropriate to make any significant adjustment. The table below sets out the share option awards made in February 2007,2008, for which full disclosure will be made in the 20072008 Remuneration Report. | Executive Director | Share option award | | | Option price | |
|
|
|
|
| | | Dr Garnier | 550,000 ADSs | | $ | 58.00 | | | Mr Heslop | 242,750 shares | | £ | 14.88 | | | Dr Slaoui | 158,750 ADSs | | $ | 58.00 | |
|
|
|
|
| |
| Executive Director | Share option award | | Option price | |
|
|
|
| | | Dr JP Garnier* | – | | – | | | Mr A Witty | 525,000 shares | | £11.47 | | | Mr J Heslop | 242,750 shares | | £11.47 | | | Dr M Slaoui | 158,750 ADSs | | $44.75 | | | Mr C Viehbacher | 97,750 ADSs | | $44.75 | |
|
|
|
| |
| * | Dr Garnier will retire from the Board on 21st May 2008. |
For share option grantsoptions granted to the Executives in 2007,2008, vesting increases on a straight-line basis for EPS performance between the hurdles set out in the following graph. 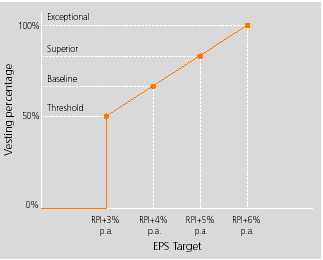 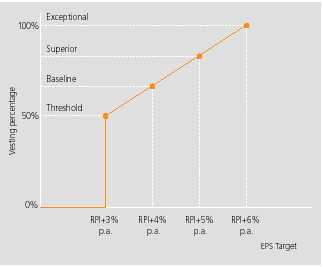
| GSK Annual Report 2007 | 75 | | |
Back to Contents | | | REPORT OF THE DIRECTORS | | Remuneration Report | | | | | | Business review | | Remuneration Report | | continued | |
This performance condition is substantially consistent with UK shareholder guidelines and expectations and is demanding when compared with those operated by other global pharmaceutical companies. This is consistent with the policy of providing pay for performance and only for performance. Performance is measured over periodsa period of three financial years. The performance period starts in the year of award with the base year being the preceding financial year. There is no performance retesting, so if the performance condition is not met after the three-year period the options will lapse. The Share Optionsshare options granted in 20032004 vested in full.
<Back to Contents
| Remuneration Report | continued |
| |
Pensions
The Executives participate in GlaxoSmithKline senior executive pension plans. The pension arrangements are structured in accordance with the plans operated for executives in the country in which the executives are likely to retire. Details of individual arrangements for the Executive Directors are set out on page 81.85. In response to the new pensions regime in the UK, the Committee carefully considered the impact of the change in legislation and decided the following: | • | the company will continue to fulfil its obligations under existing pension arrangements | | | | | • | no compensation will be provided if participants are adversely affected by the new pension regime. | | | | The GSK pension policy for executives in the UK is: | | | | | • | newly employed executives benefit from a company contribution of 15% of base pay under the defined contribution plan together with the opportunity to receive up to a further 4% in matched contributions | | | | | • | legacy final salary plans which provide for two-thirds of final salary at age 60 were grandfathered for existing employees and no new entrants have been allowed | | | | | • | for capped employees, benefits in excess of the cap are currently all provided through unfunded arrangements | | | | | • | under the legacy final salary plans, actuarial reduction factors apply where a participant leaves employment of his own accord before the age of 60, effectively spreading the value of the pension earned over a longer life expectancy. If employment is terminated by the company (e.g. redundancy) the reduction factors will not apply. |
In the USA, GSK operates a US cash balance planCash Balance Plan which provides for an annual contribution and interest on the sum accumulated in the cash balance plan but with no contractual promise to provide specific levels of retirement income. In light of market data, an extensive review of the pension arrangements for US executives was undertaken by the Committee during 2006. This review took account of the cost implications for the company as well as the competitiveness of the current arrangements. The conclusion was that the pension offered by GSK in the USA had fallen significantly behind the market at the senior level.
In view of this and taking account of concerns raised by both institutions and investors in relation to the basis on which contributions were previously determined under the US cash balance plan, the Committee approved the introduction of a new US executive cash balance plan. This change tookWith effect from 1st January 2006, the company introduced an executive Pension Credit within the US Cash Balance Plan for senior US executives with the exception of the CEO, whose provisions were grandfathered in light of his anticipated retirement in 2008. Under this plan contributions are determined solely by reference to the executive’s base salary.executives. Contribution rates under the plan range from 15% to 38% of base salary. All senior US executives are eligible for the new executive Pension Credit, except for Dr Garnier, whose provisions were grandfathered in light of his anticipated retirement in 2008.
For capped employees in the USA, benefits above the cap are provided by an unfunded non-qualified plan. Share ownership requirements
To align the interests of executives with those of shareholders, executives are required to maintainbuild up significant holdings of shares in GlaxoSmithKline.GlaxoSmithKline and maintain these. These requirements are an important part of aligning the interests of executives with shareholders. The CEO is required to holdacquire shares to the value of four times base salary.salary within three years of appointment. Other Executive Directors are required to build a shareholding to the value of three times base salary. Members of the CET are required to build a shareholding to a value of two times base salary. The other top 700 executives in the Group are required to build a shareholding to the value of one times base salary and are required to confirm this holding which is audited by KPMG on an annual basis. Where individuals are recruited or promoted, the new shareholding requirement is expected to be met within three years. In order forFor shares to qualify for these share ownership requirements they must be held personally by the Executive or their spouse (except where the spouse is also employed by GSK and is also subject to these requirements) or minor children or have been earned but deferred under one of the share programmes operated by the company. Unexercised share options are not included in this calculation.
As at 31st December 2006,2007, Dr Garnier’s holding was 497,545514,369 ADSs, Dr Slaoui’s was 11420,699 ADSs and 42,815 ordinary shares and Mr Heslop’s was 28,55441,529 ordinary shares. Dr Garnier’s holding was in excess of the share ownership requirements. Mr Heslop has until December 2008 and Dr Slaoui has until December 2009 to build their holdings to the value of three times base salary. Executives are required to continue to satisfy these shareholding requirements for a minimum of twelve months following retirement from the company.
Dr Yamada and Mr Coombe, who retired on 31st May 2006 and 31st March 2005 respectively, both met this requirement. Other remuneration elements
The Executives participate in various legacy Glaxo Wellcome and SmithKline Beecham all-employee share plans in either the UK or the USA and in the GlaxoSmithKline plans that replaced them. The Sharesave plan and the ShareReward plan are Her Majesty’sUK HM Revenue &and Customs approved plans open to all UK employees on the same terms. Mr Witty and Mr Heslop is a memberare members of the Sharesave plan, into which he contributesthey contribute £250 a month. This provides himthem with the option to buy shares at the end of the three-year savings period in line with the opportunity available to all UK employees. Mr Witty and Mr Heslop also contributescontribute £125 per month to buy shares under the ShareReward plan. The company matches the number of shares bought each month. The Executives also receive other benefits including healthcare (medical and dental), personal financial advice and life assurance. The cash value of the benefits received by the Executive Directors in 20062007 is shown on page 73.79. On 19th February 2008, the company made a conditional award of 111,750 ADSs to Mr Viehbacher. The award will vest in two tranches, subject to his continued employment with GSK and the Committee’s assessment of his performance over the vesting period. 67,050 ADSs will vest on 31st December 2009 with the balance vesting on 31st December 2011. The number of ADSs will be adjusted to reflect dividends that would have accrued in the period between award and vesting to the extent that the ADSs vest.
| 76 |
| GSK Annual Report 20062007 | 70 | |
Back to Contents | | | Remuneration Report | | | | | | | | Remuneration Report | | continued |
| | |
Executive Director terms, conditions and remuneration Executive Director contracts
The policy set out below provides the framework for contracts for Executive Directors appointed since 2003 and going forward.2003. | Aspect | Policy |
| | Notice period on | termination by the employing companyor executive | 12 calendar months | termination by the | | | | employing company | | | | or executive | | | |
| | Termination payment | | – | 1x1 x annual salary and | | | | | 1x1 x annual ‘on-target’ bonus1 | | | | – | No mitigation required2 |
| Benefits | | Governed by benefits policy, | | | including: | | | – | healthcare (medical and dental) | | | – | personal financial advice | | | – | life assurance contributions |
| | Vesting of long-termincentives | | Rules of relevant equity incentive | incentives | | plan3 |
| | Pension | | Based on existing arrangements and | | | terms of the relevant pension plan |
| | Non-compete clause | | 12 months from terminationnotice date2 |
|
| | | 1 | Dr Garnier’s target bonus is 100% of salary, Dr Slaoui’s is 85% of salary and Mr Heslop’s is 75% of salary. When reviewing the level of severance payments, the Committee considered investor and DTIDepartment for Business Enterprise & Regulatory Reform guidance. However, it determined that in line with competitive practice it is appropriate to provide for the payment of salary and target bonus on termination. | | | | 2 | The imposition of a 12-month non-compete period on the Executives is considered vitally important by the company in order to protect the Group’s intellectual property. In light of the non-compete clause and competitor practice, the Committee believes that it would not be appropriate to provide for mitigation in the contracts. | | | | 3 | As approved by shareholders of GlaxoSmithKline, Glaxo Wellcome and SmithKline Beecham, as appropriate. | |
In 2003, Dr Garnier agreed to changes to his previous contractual terms without compensation to come broadly in line with the new contractual framework, including the reduction of contractual notice period from 24 to 12 calendar months. However, in order to honour certain aspects of his ‘old’previous contractual terms, there are a number of individual features which were retained. TheseThe retained individual features include the entitlement to reimbursement of excise tax on change of control related payments and life insurance benefit funded by the company to age 65.
In relation to LTI awards, these are subject to performance testing, and any share options or performance share awards madegranted within 12 months of the termination notice date will lapse. However, on termination by the company (other than for cause), on retirement or on resignation for ‘good reason’ (i.e. resignation due to not being elected or retained as a director of the company or any merged company, or as a result of a change of control provided that such resignation occurs on or within 30 days of the first anniversary of the change in control) share options remain exercisable for the full option term. In addition, except on retirement, Dr Garnier is entitled to receive one year’s worth of pension contributions on termination. The terms of Dr Garnier’s retirement will be in accordance with his contractual entitlements. The following table sets out the details of the Executive Directors'Directors’ service contracts: | Current Directors | Date of contract | | Effective date | | Expiry date | |
|
|
|
|
|
|
| | Dr Garnier | 03.03.04 | | 01.01.04 | | 31.05.08 | | | Mr Heslop | 16.03.05 | | 01.04.05 | | 31.01.14 | | | Dr Slaoui | 16.05.06 | | 01.06.06 | | 01.08.19 | |
|
|
|
|
|
|
|
| | | | | | | | | Former Directors | Date of contract | | Effective date | | Expiry date | |
|
|
|
|
|
| | | Dr Yamada* | 27.07.04 | | 01.01.04 | | 30.06.07 | | | Mr Coombe | 03.03.04 | | 01.01.04 | | 31.03.05 | |
|
|
|
|
|
| |
| Current Directors | Date of contract | Effective date | Expiry date | |
| | | Dr JP Garnier* | 03.03.04 | 01.01.04 | 31.05.08 | | | Mr A Witty | 27.02.08 | 31.01.08 | 31.08.24 | | | Mr J Heslop | 16.03.05 | 01.04.05 | 31.01.14 | | | Dr M Slaoui | 16.05.06 | 01.06.06 | 01.08.19 | | | Mr C Viehbacher | 27.02.08 | 31.01.08 | 01.04.20 | |
| |
| | | * | Dr Yamada retiredGarnier will retire from the Board and the company on 31st21st May 2006.2008. |
No termination payments will be made in respect of any part of a notice period extending beyond the contract expiry dates. Individual pension arrangements
For individual pension arrangements for the Executive Directors refer to page 81.85. Other entitlements
In addition to the contractual provisions outlined above, in the event that Executive Directors’ service agreements are terminated by their employing company, the following would apply: | • | in the case of outstanding awards under the GlaxoSmithKline Annual Investment Plan, provided that their agreement is terminated other than for cause, any deferred amount, and any income and gains, are automatically distributed as soon as administratively practicable after termination. If they resign, retire or the termination is for cause, then any deferred amount is not distributed until the end of the minimum three-year deferral period | | | | | • | in line with the policy applicable to US senior executives, Dr Garnier and Dr Yamada areis entitled to receive continuing medical and dental insurance. Dr Slaoui is a memberand Mr Viehbacher are members of the same plan and may become eligible, at a future date, to receive continuing medical and dental cover into retirement | | | | | • | following the merger, those participants in the legacy share option schemes who elected to exchange their legacy options for options over GlaxoSmithKline shares will receive an additional cash benefit equal to 10% of the grant price of the original option. This additional benefit is triggered when the new option is exercised or lapses. To qualify for this additional cash benefit, participants had to retain their options until at least the second anniversary of the effective date of the merger. |
Outside appointments for Executive Directors
Any outside appointments must be approved by the Chairman on behalf of the Board. It is the company’s policy that remuneration earned from such appointments may be kept by the individual Executive Director.
|
| GSK Annual Report 20062007 | 77 | 71 | |
Back to Contents | | | Remuneration Report | continued | |
| | | | Remuneration Report | | continued | | |
Non-Executive Director terms, conditions and fees Non-Executive Directors of GlaxoSmithKline do not have service contracts but instead have letters of appointment under which it is agreed that they serve the company as a Non-Executive Director until the conclusion of the Annual General Meeting following the third anniversary of their appointment. In each case this can be extended for a further term of three years by mutual agreement. No Directors serve a term longer than three years without offering themselves for re-election by the shareholders. The company aims to provide Non-Executive Directors with fees that are competitive with other companies of equivalent size and complexity. The following table shows the date of the initial letter of appointment of each Non-Executive Director: | Non-Executive | Date of letter | | | Director | of appointment | |
|
| | Professor Sir Roy Anderson | 28.09.07 | | | Dr S Burns | 12.02.07 | | | Mr L Culp | 09.06.03 | | | Sir Crispin Davis | 09.06.03 | | | Sir Deryck Maughan | 26.05.04 | | | Dr D Podolsky | 03.07.06 | | | Sir Ian Prosser | 19.06.00 | | | Dr R Schmitz | 19.06.00 | | | Mr T de Swaan | 21.12.05 | | | Sir Robert Wilson | 09.06.03 | |
|
| |
The fee structure for the Non-Executive Directors is as follows: | | | Per annum | |
|
|
| | | Standard annual cash retainer fee | | £60,000 | |
|
|
| | | Supplemental fees | | | | Senior Independent Director, the Audit Committee Chairman and Scientific/Medical Experts | | £30,000 | | Chairmen of the Remuneration and Corporate Responsibility Committees | | £20,000 | |
|
|
| | Non-Executive Director undertakingintercontinental travel to meetings | | £5,000 per meeting | |
|
|
|
| Exchange rate | | | | Fees that are paid in US dollars are converted at a rate of £1/US$1.8162, being the exchange rate that applied on 29th July 2004 when the new fee arrangements were approved by the Board. | |
|
|
|
|
Exchange rate
Fees that are paid in US dollars are converted at a rate of £1/ US$1.8162, being the exchange rate that applied on 29th July 2004 when the fee arrangements were approved by the Board. Non-Executive Directors’ share allocation plan
To enhance the link between Directors and shareholders GlaxoSmithKline requires Non-Executive Directors to receive a significant part of their fees in the form of shares. At least 25% of the Non-Executive Directors’ total fees, excluding the Chairman, are paid in the form of shares or ADSs and allocated to a share account. The Non-Executive Directors may also take the opportunity to invest part or all of the balance of their fees into the same share account. The shares or ADSs which are notionally awarded to the Non-Executive Directors and allocated to their interest accounts are included within the Directors’ interests tables on page 76.81. The accumulated balance of these shares or ADSs, together with notional dividends subsequently reinvested, are not paid out to the Non-Executive Directors until retirement. Upon retirement, the Non-Executive Directors will receive either the shares or ADSs or a cash amount equal to the value of the shares or ADSs at the date of retirement. Non-Executive Directors are not entitled to compensation if their appointment is terminated. Chairman
Sir Christopher Gent’s letter of appointment to the Board was dated 26th May 2004, under which it was agreed that he serve the company as Deputy Chairman until 31st December 2004 and from 1st January 2005 as Chairman until the conclusion of the Annual General Meeting following the third anniversary of his appointment. This may be extended for a further term of three years by mutual agreement. In 2006,From 2007, he received £400,000 per annum plus an allocation of GlaxoSmithKline shares to the value of £100,000 per annum as Chairman. Following a review, the Board agreed to increase his fees with effect from 1st January 2007, toreceives £460,000 per annum plus an allocation of GlaxoSmithKline shares to the value of £115,000 per annum.annum as Chairman. TSR performance graph
The following graph sets out the performance of the company relative to the FTSE 100 Index of which the company is a constituent and to the performance comparator group from 1st January 20022003 to 31st December 2006.2007. The graph has been prepared in accordance with the Regulations and is not an indication of the likely vesting of awards granted under any of the company’s incentive plans. 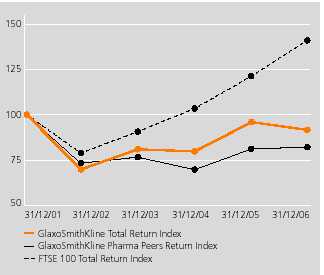 Directors and Senior Management remuneration The following tables set out for the Directors of GlaxoSmithKline plc the remuneration earned in 2006,2007, their interests in shares of GlaxoSmithKline plc, their interests in share options and incentive plans and their pension benefits. The members of the CET and the Company Secretary, known as the Senior Management, also participate in the same remuneration plans as the Executive Directors and the aggregate remuneration and interests of the Directors and Senior Management are also provided.
| 78 |
| GSK Annual Report 20062007 | 72 | |
Back to Contents | | | Remuneration Report | | | | | | | | Remuneration Report | | continued |
| | |
Annual remuneration | | | | | | | | | | 2006 | | | | | | | | | | 2005 | | | 2007 | | 2006 | | | |
|
| |
|
| | |
| |
| | | | | | | | | | | | Total | | | | | | | | | | Total | | | Total | | Total | | | | | | Fees and | | Other | | Annual | | annual | | Fees and | | Other | | Annual | | Deferred | | annual | | | Fees and | Other | Annual | annual | | Fees and | Other | Annual | annual | | | | | | salary | | benefits | | bonus | | remuneration | | salary | | benefits | | bonus* | | bonus | | remuneration | | | salary | benefits | bonus | remuneration | | salary | benefits | bonus | remuneration | | | | Footnote | | 000 | | 000 | | 000 | | 000 | | 000 | | 000 | | 000 | | 000 | | 000 | | Footnote | 000 | 000 | | 000 | |
|
| |
| | | Executive Directors | | | | | | | Dr JP Garnier | a,b,c | | $ | 1,700 | | $ | 633 | | $ | 3,080 | | $ | 5,413 | | $ | 1,582 | | $ | 641 | | $ | 2,812 | | $ | 1,556 | | $ | 6,591 | | a,b | $1,810 | $1,516 | $2,709 | $6,035 | | $1,700 | $633 | $3,080 | $5,413 | | | Dr M Slaoui | | | $ | 370 | | $ | 317 | | $ | 497 | | $ | 1,184 | | – | | – | | – | | – | | – | | | $701 | $321 | $843 | $1,865 | | $370 | $317 | $497 | $1,184 | | | | | | | | Mr J Heslop | | | £ | 380 | | £ | 31 | | £ | 437 | | £ | 848 | | £ | 240 | | £ | 9 | | £ | 280 | | – | | £ | 529 | | | £438 | £16 | £410 | £864 | | £380 | £31 | £437 | £848 | |
|
| |
| | | Non-Executive Directors | | | | | | | Professor Sir Roy Anderson | | e | £23 | – | £23 | | – | | | Sir Crispin Davis | | | £ | 70 | | – | | – | | £ | 70 | | £ | 70 | | – | | – | | – | | £ | 70 | | | £70 | – | £70 | | £70 | – | £70 | | | Sir Christopher Gent | | | £ | 500 | | £ | 1 | | – | | £ | 501 | | £ | 500 | | – | | – | | – | | £ | 500 | | | £575 | £1 | – | £576 | | £500 | £1 | – | £501 | | | Sir Ian Prosser | | | £ | 95 | | – | | – | | £ | 95 | | £ | 100 | | – | | – | | – | | £ | 100 | | | £95 | – | £95 | | £95 | – | £95 | | | Dr R Schmitz | | | £ | 90 | | – | | – | | £ | 90 | | £ | 95 | | – | | – | | – | | £ | 95 | | | £70 | – | £70 | | £90 | – | £90 | | | Mr T de Swaan | | | £ | 70 | | – | | – | | £ | 70 | | – | | – | | – | | – | | – | | | £100 | – | £100 | | £70 | – | £70 | | | Sir Robert Wilson | | | £ | 90 | | – | | – | | £ | 90 | | £ | 90 | | – | | – | | – | | £ | 90 | | | £90 | – | £90 | | £90 | – | £90 | | | | | | | | | Dr S Burns | | e | $124 | – | $124 | | – | | | Mr L Culp | | | $ | 136 | | – | | – | | $ | 136 | | $ | 136 | | – | | – | | – | | $ | 136 | | | $127 | – | $127 | | $136 | – | $136 | | | Sir Deryck Maughan | | | $ | 136 | | – | | – | | $ | 136 | | $ | 146 | | – | | – | | – | | $ | 146 | | | $136 | – | $136 | | $136 | – | $136 | | | Dr D Podolsky | | | $ | 100 | | – | | – | | $ | 100 | | – | | – | | – | | – | | – | | | $191 | – | $191 | | $100 | – | $100 | |
|
| |
| | | Former Directors | | | | | | | Mr J Coombe | c,d | | – | | £ | 22 | | – | | £ | 22 | | £ | 139 | | £ | 32 | | – | | – | | £ | 171 | | a | – | £69 | – | £69 | | – | £22 | – | £22 | | | Dr M Barzach | e | | £ | 57 | | – | | – | | £ | 57 | | £ | 58 | | – | | – | | – | | £ | 58 | | c | £56 | – | £56 | | £57 | – | £57 | | | Sir Roger Hurn | | – | | – | | – | | – | | – | | £ | 5 | | – | | – | | £ | 5 | | | | Sir Peter Job | | – | | – | | – | | – | | – | | £ | 5 | | – | | – | | £ | 5 | | | | Sir Richard Sykes | | – | | £ | 1 | | – | | £ | 1 | | – | | £ | 1 | | – | | – | | £ | 1 | | | – | £1 | – | £1 | | – | £1 | – | £1 | | | | | | | Dr T Yamada | a,b,c | | $ | 428 | | $ | 493 | | $ | 281 | | $ | 1,202 | | $ | 763 | | $ | 739 | | $ | 1,110 | | $ | 698 | | $ | 3,310 | | a | – | $250 | – | $250 | | $428 | $493 | $281 | $1,202 | | | Dr L Shapiro | f | | $ | 144 | | $ | 11 | | – | | $ | 155 | | $ | 230 | | – | | – | | – | | $ | 230 | | d | $85 | – | $85 | | $144 | $11 | – | $155 | |
|
| |
| | | Total Remuneration | | | £ | 2,982 | | £ | 841 | | £ | 2,523 | | £ | 6,346 | | £ | 2,862 | | £ | 810 | | £ | 2,436 | | £ | 1,238 | | £ | 7,346 | | | | Total remuneration | | | £3,104 | £1,131 | £2,186 | £6,421 | | £2,982 | £841 | £2,523 | £6,346 | |
|
| |
| | | Analysed as: | | | | | | | Executive Directors | | | £ | 1,499 | | £ | 545 | | £ | 2,371 | | £ | 4,415 | | £ | 1,109 | | £ | 361 | | £ | 1,826 | | £ | 855 | | £ | 4,151 | | | £1,693 | £935 | £2,186 | £4,814 | | £1,499 | £545 | £2,371 | £4,415 | | | Non-Executive Directors | | | £ | 1,116 | | £ | 1 | | – | | £ | 1,117 | | £ | 1,010 | | – | | – | | – | | £ | 1,010 | | | £1,312 | £1 | – | £1,313 | | £1,116 | £1 | – | £1,117 | | | Former Directors | | | £ | 367 | | £ | 295 | | £ | 152 | | £ | 814 | | £ | 743 | | £ | 449 | | £ | 610 | | £ | 383 | | £ | 2,185 | | | £99 | £195 | – | £294 | | £367 | £295 | £152 | £814 | |
|
| |
| | | Total Remuneration | | | £ | 2,982 | | £ | 841 | | £ | 2,523 | | £ | 6,346 | | £ | 2,862 | | £ | 810 | | £ | 2,436 | | £ | 1,238 | | £ | 7,346 | | | | Total remuneration | | | £3,104 | £1,131 | £2,186 | £6,421 | | £2,982 | £841 | £2,523 | £6,346 | |
|
| |
| |
| Remuneration for Directors on the US Payrollpayroll is reported in Dollars. Dollar amounts are included in the totals based on conversion to Sterling at the average exchange rates for each year. | | | | | a) | Following the merger, and in order to encourage employees to convert their non-savings related options, held over Glaxo Wellcome or SmithKline Beecham shares or ADSs,for options over GlaxoSmithKline shares or ADSs, employees were granted an additional cash benefit equal to 10% of the grant price of the original option. This additional benefit, known as the Exchange Offer Incentive (EOI), is only payable when the new option is exercised or lapses above market value. To qualify for this additional cash benefit, participants had to retain these options until at least the second anniversary of the effective date of the merger. During the year, Dr Garnier received $192,639 (2005–$174,472)$1,132,994 (2006 – $192,639), in EOI payments as a result of exercising options granted to him in March and November 1997, during February and August 2007. These options would have expired in March and November 2007 had they not been exercised. Full details of these option exercises are given on page 83. Dr Yamada received $60,204 (2005$184,516 (2006 – $167,405) relating to options exercised (page 78)$60,204) and Mr Coombe received £67,200 (2006 – £nil). | | | | | b) | Dr Garnier is a Non-Executive Director of United Technologies Corporation, in respect of which in 2006 he received $230,000 in the form of deferred stock units. In 2005, Dr Garnier received $110,0002007 (2006 – $230,000) in the form of deferred stock units and 3,000 stock options with a grant price of $101.05. Dr Yamadawhich is a member of the Advisory Board of Quaker BioVentures, Inc., for which, in the period from 1st January 2006 until his retirement from GlaxoSmithKline on 31st May 2006, he received $5,000 (2005 – $12,000).not included above. | | | | | c) | In 2001, following the merger, Dr Garnier, Mr Coombe and Dr Yamada were awarded a one-off special deferred bonus as members of the CET. Each was awarded an amount equivalent to his annual salary on 31st December 2001 and this was notionally invested in GlaxoSmithKline shares or ADSs on 15th February 2002 and deferred for three years. The deferred bonus vested on 15th February 2005 and the amounts paid were equivalent to the then value of GlaxoSmithKline shares or ADSs notionally acquired in February 2002 plus dividends reinvested over the period. Dr Garnier received $1,556,324, and Dr Yamada received $697,663. Mr Coombe waived his deferred bonus of £383,924. The company made a contribution to the pension plan in 2005 of £383,924 to enhance his pension entitlements. This amount is not included in the table above. | | | d) | Mr Coombe waived his prorated 2005 bonus of £106,870. The company made contributions to the pension plan in 2005 of £106,870 to enhance his pension entitlements. These amounts are not included within fees and salary above. | | | e) | Dr Barzach received fees of¤84,244 (2005 –¤84,244)of €81,933 (2006 – €84,244) from GlaxoSmithKline France for healthcare consultancy provided. These are included within fees and salary above. | | | | f)d) | Although Dr Shapiro retired from the Board on 17th May 2006 she continues to be a member of GlaxoSmithKline’s Scientific Advisory Board for which, during 2006,2007, she received fees of $85,000 (2005(2006 – $85,000), of which $30,000 (2005(2006 – $30,000) was in the form of ADSs. These are included within fees and salary above. | | | | | e) | Dr Burns joined the Board as a Non-Executive Director on 12th February 2007 and Professor Sir Roy Anderson joined the Board on 1st October 2007. Therefore no fees were paid to them in 2006. | | | | None of the above Directors received reimbursement for expenses during the year requiring separate disclosure as required by the Regulations. |
| | Dr S Burns joined the Board as a Non-Executive Director on 12th February GSK Annual Report 2007 therefore no fees were paid to her in 2006. | 79 | | |
Back to Contents | | | REPORT OF THE DIRECTORS | | Remuneration Report | | | | * | In light of the low take up levels and in response to concerns expressed by institutional investors in relation to the 1 for 10 non-performance related match provided under the Annual Investment Plan (AIP), the Committee decided in 2005 to discontinue the AIP. This was open to approximately 700 senior executives who all participated on the same terms. The last deferral elections under the AIP were made in respect to bonuses earned during 2005. Although the AIP has now closed, GSK will continue to manage the ongoing administration of subsisting awards as required by the AIP rules. |
Back to Contents
| | Remuneration Report | | continued |
| | |
Non-Executive Directors’ remuneration | | | | | | | 2006 | | | | | | 2005 | | | 2007 | | 2006 | | | |
|
|
|
|
|
| |
|
|
|
|
|
| |
| |
| | | | | Total | | Cash | | Shares/ADSs | | Total | | Cash | | Shares/ADSs | | Total | | Cash | | Shares/ADSs | | Total | | Cash | | Shares/ADSs | | | Fees | | 000 | | 000 | | 000 | | 000 | | 000 | | 000 | | 000 | | 000 | | 000 | | 000 | | 000 | | 000 | |
|
| |
| | | Current Non-Executive Directors | | | | | | | | | | | | | | | | | | | | | | | | | Professor Sir Roy Anderson | | £23 | | £17 | | £6 | | – | | – | | – | | | Sir Crispin Davis | £ | 70 | | | – | | £ | 70 | | £ | 70 | | | – | | £ | 70 | | £70 | | – | | £70 | | £70 | | – | | £70 | | | Sir Christopher Gent | £ | 500 | | £ | 400 | | £ | 100 | | £ | 500 | | £ | 400 | | £ | 100 | | £575 | | £460 | | £115 | | £500 | | £400 | | £100 | | | Sir Ian Prosser | £ | 95 | | £ | 48 | | £ | 47 | | £ | 100 | | £ | 50 | | £ | 50 | | £95 | | £48 | | £47 | | £95 | | £48 | | £47 | | | Dr R Schmitz | £ | 90 | | £ | 54 | | £ | 36 | | £ | 95 | | £ | 57 | | £ | 38 | | £70 | | £42 | | £28 | | £90 | | £54 | | £36 | | | Mr T de Swaan | £ | 70 | | £ | 53 | | £ | 17 | | | – | | | – | | | – | | £100 | | £75 | | £25 | | £70 | | £53 | | £17 | | | Sir Robert Wilson | £ | 90 | | £ | 68 | | £ | 22 | | £ | 90 | | £ | 68 | | £ | 22 | | £90 | | £68 | | £22 | | £90 | | £68 | | £22 | | | | | | | Dr S Burns | | $124 | | $62 | | $62 | | – | | – | | – | | | Mr L Culp | $ | 136 | | | – | | $ | 136 | | $ | 136 | | | – | | $ | 136 | | $127 | | – | | $127 | | $136 | | – | | $136 | | | Sir Deryck Maughan | $ | 136 | | | – | | $ | 136 | | $ | 146 | | | – | | $ | 146 | | $136 | | – | | $136 | | $136 | | – | | $136 | | | Dr D Podolsky | $ | 100 | | $ | 50 | | $ | 50 | | | – | | | – | | | – | | $191 | | $96 | | $95 | | $100 | | $50 | | $50 | |
|
| |
| | | Former Non-Executive Directors | | | | | | | | | | | | | | | | | | | | | | | | | Dr L Shapiro | $ | 59 | | $ | 52 | | $ | 7 | | $ | 145 | | $ | 109 | | $ | 36 | | – | | – | | – | | $59 | | $52 | | $7 | |
|
| |
| | | Total Remuneration | £ | 1,148 | | £ | 678 | | £ | 470 | | £ | 1,090 | | £ | 635 | | £ | 455 | | £1,312 | | £789 | | £523 | | £1,148 | | £678 | | £470 | |
|
| |
| |
The table above sets out the remuneration received as Non-Executive Directors of GlaxoSmithKline. Accordingly, itIt does not include Dr Shapiro’s fees received as a member of GlaxoSmithKline’s Scientific Advisory Board. From the formation of GSK, the Non-Executive Directors have been required to take at least a part of their total fees in the form of shares allocated to a share account.account which is not paid out until retirement from the Board. At least 25% of Non-Executive DirectorsDirectors’ fees, except those of the Chairman (see page 7278 for further details), must be taken under the fee allocation arrangement. Non-Executive Directors can then elect to receive either all or part of the remaining cash payment in the form of further shares or ADSs. The total value of these shares and ADSs as at the date of award, together with the cash payment, forms their total fees, which are included within the Annual remuneration table under ‘Fees and salary’. The table above sets out the value of their fees received in the form of cash and shares and ADSs.
<Back to Contents
| Remuneration Report | continued |
| |
The table below sets out the accumulated number of shares and ADSs held by eachthe Non-Executive DirectorDirectors in relation to their fees received as Board members as at 31st December 2006,2007, together with the movements in their accountaccounts over the year. | | | Number of shares and ADSs | | | | | |
|
|
| | Number of shares and ADSs | | | | | | Dividends | | |
| | | Non-Executive Directors’ share arrangements | Footnote | | At 31.12.05 | | Elected | | reinvested | | Paid out | | At 31.12.06 | | | | | | Dividends | | | |
|
| | At 31.12.06 | | Elected | | reinvested | | At 31.12.07 | |
| |
| | | Current Non-Executive Directors | | | | | | | | | | | Shares | | | | | | | | | | | Professor Sir Roy Anderson | | – | | 438 | | – | | 438 | | | Sir Crispin Davis | | | 12,758 | | 4,839 | | 460 | | – | | 18,057 | | 18,057 | | 5,283 | | 729 | | 24,069 | | | Sir Christopher Gent | | | 10,386 | | 6,952 | | 383 | | – | | 17,721 | | 17,721 | | 8,704 | | 728 | | 27,153 | | | Sir Ian Prosser | | | 16,590 | | 3,295 | | 580 | | – | | 20,465 | | 20,465 | | 3,586 | | 810 | | 24,861 | | | Dr R Schmitz | | | 13,898 | | 2,477 | | 487 | | – | | 16,862 | | 16,862 | | 2,113 | | 664 | | 19,639 | | | Mr T de Swaan | | | – | | 1,226 | | 7 | | – | | 1,233 | | 1,233 | | 1,888 | | 35 | | 3,156 | | | Sir Robert Wilson | | | 3,047 | | 1,557 | | 112 | | – | | 4,716 | | 4,716 | | 1,699 | | 192 | | 6,607 | | | | | | | ADSs | | | | | | | | | | | Dr S Burns | | – | | 1,178 | | 6 | | 1,184 | | | Mr L Culp | | | 6,227 | | 2,552 | | 200 | | – | | 8,979 | | 8,979 | | 2,410 | | 358 | | 11,747 | | | Sir Deryck Maughan | | | 4,242 | | 2,552 | | 139 | | – | | 6,933 | | 6,933 | | 2,588 | | 279 | | 9,800 | | | Dr D Podolsky | | | – | | 942 | | – | | – | | 942 | | 942 | | 1,811 | | 43 | | 2,796 | |
|
| |
| | | Former Non-Executive Directors | | | | Shares | | | | Dr L Shapiro | a | | 1,723 | | – | | 40 | | – | | 1,763 | | | | Sir Roger Hurn | b | | 10,284 | | – | | – | | (10,284 | ) | – | | | | ADSs | | | | Dr L Shapiro | a | | 3,426 | | 130 | | 73 | | – | | 3,629 | | |
| | |
Dividends are notionally reinvested at the end of the financial year in which payment is made.
The table below sets out the settlement of former Non-Executive Directors’ share arrangements on their leaving the Board:
| | | | | | | | Value of | | | Value of | | | | | | | | | | | | | awards on | | | awards on | | | Payments | | | | | | | Date of leaving | | | allocation | | | leaving | | | in 2006 | |
|
|
|
|
|
|
|
|
|
|
|
|
|
| | | Current year | | | | | | | | | | | | | | | | Dr L Shapiro | a,c | | | 17.05.06 | | $ | 196,673 | | $ | 259,163 | | $ | 259,163 | | | Prior years | | | | | | | | | | | | | | | | Sir Roger Hurn | b | | | 05.06.03 | | | – | | | – | | £ | 151,948 | |
|
|
|
|
|
|
|
|
|
|
|
|
|
| | | | | | | | | | | | | | | | | |
a)80 | Dr Shapiro’s closing balance appears as at 17th May 2006, the date when she left the Board. All share arrangements with Dr Shapiro were settled in September 2006 with a lump sum cash payment. GSK Annual Report 2007 | | |
Back to Contents | | | REPORT OF THE DIRECTORS | | | Remuneration Report | | | | | b) | On leaving the Board, Sir Roger Hurn elected to receive the settlement of his Non-Executive Directors’ share arrangements in 40 quarterly cash payments. In July 2006, Sir Roger agreed to receive the outstanding balance of this plan as a lump sum. | | | | c) | The change in value of awards between allocation and leaving is attributable to dividends re-invested and the change in share price between the dates of award and the dates of leaving. | | |
Back to Contents
| | Remuneration Report | | continued |
| | |
Directors’ interests The following beneficial interests of the Directors and connected persons of the company are shown in the register maintained by the company in accordance with the Companies Act 1985:Listing Rules. | | | | Shares | | | ADSs | | | Shares | | ADSs | | | | | |
| |
| |
| |
| | | | | | 23rd February | | 31st December | | 1st January | | 23rd February | | 31st December | | 1st January | | | 22nd February | | 31st December | | 1st January | | 22nd February | | 31st December | | 1st January | | | | Footnote | | 2007 | | 2006 | | 2006 | | 2007 | | 2006 | | 2006 | | Footnote | | 2008 | | 2007 | | 2007 | | 2008 | | 2007 | | 2007 | |
|
| |
| | | Executive Directors | | | | | | | | | | | | | | | | | Dr JP Garnier | a | | – | | – | | – | | 251,124 | | 250,528 | | 225,896 | | a | | – | | – | | – | | 305,567 | | 252,475 | | 250,528 | | | Mr A Witty | | b,e | | 71,392 | | – | | – | | – | | – | | – | | | Dr M Slaoui | b | | 39,659 | | 36,955 | | 38,821 | | 156 | | 114 | | – | | a | | 47,590 | | 40,961 | | 36,955 | | 336 | | 286 | | 114 | | | Mr J Heslop | c | | 41,331 | | 28,554 | | 18,885 | | – | | – | | – | | b | | 45,906 | | 41,529 | | 28,554 | | – | | – | | – | | | Mr C Viehbacher | | a,e | | 92,257 | | – | | – | | 11,788 | | – | | – | |
|
| |
| | | Non-Executive Directors | | | | | | | | | | | | | | | | | Professor Sir Roy Anderson | | d,f | | 438 | | 438 | | – | | – | | – | | – | | | Dr S Burns | d | | 44 | | – | | – | | 95 | | – | | – | | c,f | | 44 | | 44 | | 44 | | 1,344 | | 1,344 | | 160 | | | Mr L Culp | e | | – | | – | | – | | 8,979 | | 8,979 | | 6,227 | | f | | – | | – | | – | | 11,747 | | 11,747 | | 8,979 | | | Sir Crispin Davis | e | | 23,224 | | 23,224 | | 17,925 | | – | | – | | – | | f | | 29,236 | | 29,236 | | 23,224 | | – | | – | | – | | | Sir Christopher Gent | e | | 17,721 | | 17,721 | | 10,386 | | – | | – | | – | | f | | 27,153 | | 27,153 | | 17,721 | | – | | – | | – | | | Sir Deryck Maughan | e | | – | | – | | – | | 6,933 | | 6,933 | | 4,242 | | f | | – | | – | | – | | 9,800 | | 9,800 | | 6,933 | | | Dr D Podolsky | e,f | | – | | – | | – | | 942 | | 942 | | – | | f | | – | | – | | – | | 2,796 | | 2,796 | | 942 | | | Sir Ian Prosser | e | | 21,375 | | 21,375 | | 17,500 | | – | | – | | – | | f | | 25,771 | | 25,771 | | 21,375 | | – | | – | | – | | | Dr R Schmitz | e | | 22,542 | | 22,542 | | 13,898 | | – | | – | | 2,840 | | f | | 25,319 | | 25,319 | | 22,542 | | – | | – | | – | | | Mr T de Swaan | e | | 1,233 | | 1,233 | | – | | – | | – | | – | | f | | 3,156 | | 3,156 | | 1,233 | | – | | – | | – | | | Sir Robert Wilson | e | | 5,844 | | 5,844 | | 4,175 | | – | | – | | – | | f | | 12,736 | | 12,736 | | 5,844 | | – | | – | | – | |
|
| |
| | | Former Directors | | | | Dr T Yamada | a,g | | – | | – | | – | | – | | 73,912 | | 67,512 | | | | Dr L Shapiro | e,g | | – | | 1,763 | | 1,723 | | – | | 7,900 | | 7,401 | | |
| | |
| | One GlaxoSmithKline ADS represents two GlaxoSmithKline shares. The interests of the above-mentioned Directors at 22nd February 2008 reflect the change between the year-end and that date. | | | | | a) | Includes the equivalent number of ADSs purchased in the GlaxoSmithKline Stock Fund within the 401(k) plan.US Retirement Savings Plan and US Executive Supplemental Savings Plan. | | | | | b) | In the case of Dr Slaoui, the opening number of shares is shown as at 17th May 2006. | | | c) | Includes shares purchased through the GlaxoSmithKline ShareReward Plan for Mr Heslop totalling 1,2501,523 at 31st December 20062007 (31st December 20052006 – 1,013)1,250) and 1,2951,577 shares at 23rd22nd February 2007.2008. Mr Witty held 1,577 shares in this plan as at 22nd February 2008. | | | | | c) | In the case of Dr Burns, the opening number of shares is shown as at 12th February 2007, the date she joined the Board. | | | d) | Dr BurnsProfessor Sir Roy Anderson joined the Board on 12th February 2007.1st October 2007 and did not own any shares in GSK at that date. | | | | | e) | Mr Witty and Mr Viehbacher joined the Board on 31st January 2008 and their holdings are disclosed above from this date. As at 22nd February 2008, Mr Witty held options over a maximum of 1,524,244 shares granted under the company’s share option schemes and awards over a maximum of 396,727 shares under the company’s incentive plans and Mr Viehbacher held options over a maximum of 778,367 shares and 461,750 ADSs granted under the company’s share option schemes and awards over a maximum of 240,078 ADSs made under the company’s incentive plans. Mr Witty and Mr Viehbacher’s actual entitlement to GSK shares under these plans will depend on the extent to which the performance conditions, set at the time of the grant or award, have been met at the end of the respective performance periods. | | | | f) | Includes shares and ADSs received as part or all of their fees, as described under Non-Executive Directors’ share arrangementsallocation plan on page 72.78. Dividends received on these shares and ADSs were converted to shares and ADSs as at 31st December 2006. These are also included in the Directors’ interests above. | | | f) | Dr Podolsky joined the Board on 1st July 2006 and did not own any shares in GlaxoSmithKline at that date. | | | g) | Dr Yamada left the Board on 31st May 2006 and Dr Shapiro left the Board on 17th May 2006. Therefore their closing interests are recorded in the table above at these dates and are not included at 23rd February 2007. | | | | The interests of the above-mentioned Directors at 23rd February 2007 reflect the change between year-end and that date. | | |
| Share options | | | | | | | | | | | | | | | | | | | | | Options – Shares | | | | | | | | | | | Granted | | | | | | | | | | | |
|
|
|
|
|
|
|
| | | | | | | | Footnote | | At 31.12.05 | | Date of grant | | Exercise period | | | Grant price | | Number | | Exercised | | At 31.12.06 | |
|
|
|
|
|
|
|
|
|
|
|
|
|
|
|
|
| | | Dr M Slaoui | a | | 170,712 | | – | | – | | | – | | – | | – | | 170,712 | | | Mr J Heslop | | | 365,504 | | 21.02.06 | | 21.02.09 – 20.02.16 | | £ | 14.68 | | 231,000 | | 54,000 | | 542,504 | |
|
|
|
|
|
|
|
|
|
|
|
|
|
|
|
|
| |
| | | | | | | | | | | | | | | | | | | Options – ADSs | | | | | | | | | | | Granted | | | | | | | | | | | |
|
|
|
|
|
|
|
| | | | | | | | | | At 31.12.05 | | Date of grant | | Exercise period | | | Grant price | | Number | | Exercised | | At 31.12.06 | |
|
|
|
|
|
|
|
|
|
|
|
|
|
|
|
|
| | | Dr JP Garnier | | | 3,765,594 | | 21.02.06 | | 21.02.09 – 20.02.16 | | $ | 51.02 | | 500,000 | | 68,411 | | 4,197,183 | | | Dr T Yamada | b | | 1,148,490 | | – | | – | | | – | | – | | 21,380 | | 1,127,110 | |
|
|
|
|
|
|
|
|
|
|
|
|
|
|
|
|
| | | | | | | | | | | | | | | | | | | | |
| Share options | | | | | | | | | | | | | | | | | | | | | | | | | | | | | | | | | | | | Options – Shares | | | | | | | | | | | Granted | | | | | | | | | | | |
|
|
|
|
|
|
| | | | | | | | Footnote | | At 31.12.06 | | Date of grant | | Exercise period | | Grant price | | Number | | Exercised | | At 31.12.07 | |
|
|
|
|
|
|
|
|
|
|
|
|
|
|
|
| | | Dr M Slaoui | a | | 170,712 | | | | | | | | – | | – | | 170,712 | | | Mr J Heslop | b | | 542,504 | | 20.02.07 | | 20.02.10 – 19.02.17 | | £14.88 | | 242,750 | | – | | 785,254 | |
|
|
|
|
|
|
|
|
|
|
|
|
|
|
|
| | | | | | | | | | | | | | | | | | | | | Options – ADSs | | | | | | | | | | | Granted | | | | | | | | | | | |
|
|
|
|
|
|
| | | | | | | | | | At 31.12.06 | | Date of grant | | Exercise period | | Grant price | | Number | | Exercised | | At 31.12.07 | |
|
|
|
|
|
|
|
|
|
|
|
|
|
|
|
| | | Dr JP Garnier | | | 4,197,183 | | 20.02.07 | | 20.02.10 – 19.02.17 | | $58.00 | | 550,000 | | 293,735 | | 4,453,448 | | | Dr M Slaoui | a,b | | – | | 20.02.07 | | 20.02.10 – 19.02.17 | | $58.00 | | 162,320 | | – | | 162,320 | |
|
|
|
|
|
|
|
|
|
|
|
|
|
|
|
| |
| a) | Dr Slaoui joined the Board on 17th May 2006. These details cover the period from 17th May 2006 to 31st December 2006 and include the interests of his spouseDr Slaoui’s connected person who is also an employee of GSK. | | | | | b) | Dr Yamada retired on 31st May 2006 and as such was excluded from the grant of options on 21st February 2006, as he retired from the company within 12 monthsAs part of the datemain option grant that occurred on 19th February 2008, with a vesting period of the grant. These details cover the period from 1st January 200619th February 2008 to 31st May 2006.19th February 2011, Dr Yamada’s unvested awards will vest at the endSlaoui was awarded 158,750 ADS options with a grant price of the relevant performance period, subject to performance. | | $44.75 and Mr Heslop was awarded 242,750 share options with a grant price of £11.47. |
|
| GSK Annual Report 20062007 | 81 | 76 | |
<Back to Contents | | | Remuneration Report | continued | |
| | | | Remuneration Report | | continued | | |
For those options outstanding at 31st December 2006,2007, the earliest and latest vesting and lapse dates for thoseoptions above and below the market price for a GlaxoSmithKline share at the year endyear-end are given in the table below. | | | | | | | | | | | Vesting date | | | | Lapse date | | | | Weighted average | | | |
|
|
| |
|
|
| | | Dr JP Garnier | | | | grant price | | Number | | earliest | | latest | | earliest | | latest | |
|
|
|
|
|
|
|
|
|
|
|
|
|
|
| | | Above market price (“underwater”) at year end: | vested options | | $ | 59.46 | | 1,133,448 | | 23.11.01 | | 24.11.02 | | 22.11.08 | | 23.11.09 | |
|
|
|
|
|
|
|
|
|
|
|
|
|
|
| | | Below market price at year end: | vested options | | $ | 45.18 | | 2,103,735 | | 24.03.00 | | 15.12.06 | | 23.03.07 | | 14.12.13 | | | | unvested options | | $ | 47.53 | | 960,000 | | 02.12.07 | | 21.02.09 | | 01.12.14 | | 20.02.16 | |
|
|
|
|
|
|
|
|
|
|
|
|
|
|
| | | Total ADS options as at 31st December 2006 | | $ | 49.57 | | 4,197,183 | | | | | | | | | |
|
|
|
|
|
|
|
|
|
|
|
|
|
|
| | | | | | | | | | | | | | | | | |
| | | | | | | | | | | Vesting date | | | | Lapse date | | | | Weighted average | | | |
|
|
| |
|
|
| | | Dr M Slaoui | | | | grant price | | Number | | earliest | | latest | | earliest | | latest | |
|
|
|
|
|
|
|
|
|
|
|
|
|
|
| | | Above market price (“underwater”) at year end: | vested options | | £ | 18.56 | | 15,522 | | 24.11.02 | | 24.11.02 | | 23.11.09 | | 23.11.09 | | | | unvested options | | £ | 14.68 | | 73,340 | | 21.02.09 | | 21.02.09 | | 20.02.16 | | 20.02.16 | |
|
|
|
|
|
|
|
|
|
|
|
|
|
|
| | | Below market price at year end: | vested options | | £ | 11.79 | | 52,800 | | 03.12.05 | | 03.12.05 | | 02.10.12 | | 02.10.12 | | | | unvested options | | £ | 11.23 | | 29,050 | | 02.12.07 | | 02.12.07 | | 01.12.14 | | 01.12.14 | |
|
|
|
|
|
|
|
|
|
|
|
|
|
|
| | | Total share options as at 31st December 2006 | | £ | 13.55 | | 170,712 | | | | | | | | | |
|
|
|
|
|
|
|
|
|
|
|
|
|
|
| |
| | | | | | | Nominal vesting date* | | Lapse date | | | | | | Weighted average | | | | | | | | | | | | | Dr JP Garnier | | | grant price | | Number | | earliest | | latest | | earliest | | latest | |
|
|
|
|
|
|
|
|
|
|
|
|
|
| | | Above market price (“underwater”) at year-end: | vested options | | $55.99 | | 2,033,448 | | 23.11.01 | | 28.11.04 | | 22.11.08 | | 27.11.11 | | | | unvested options | | $54.68 | | 1,050,000 | | 21.02.09 | | 20.02.10 | | 20.02.16 | | 19.02.17 | |
|
|
|
|
|
|
|
|
|
|
|
|
|
| |
|
|
|
|
|
|
|
|
|
|
|
|
|
| | | Below market price at year-end: | vested options | | $40.95 | | 910,000 | | 03.12.05 | | 15.12.06 | | 02.12.12 | | 14.12.13 | | | | unvested options | | $43.73 | | 460,000 | | 02.12.07 | | 02.12.07 | | 01.12.14 | | 01.12.14 | |
|
|
|
|
|
|
|
|
|
|
|
|
|
| |
|
|
|
|
|
|
|
|
|
|
|
|
|
| | | Total ADS options as at 31st December 2007 | | | $51.34 | | 4,453,448 | | | | | | | | | |
|
|
|
|
|
|
|
|
|
|
|
|
|
| |
| | | | | | | | Nominal vesting date* | | Lapse date | | | | | | Weighted average | | | | | | | | | | | | | Dr M Slaoui | | | grant price | | Number | | earliest | | latest | | earliest | | latest | |
|
|
|
|
|
|
|
|
|
|
|
|
|
| | | Above market price (“underwater”) at year-end: | vested options | | £18.56 | | 15,522 | | 24.11.02 | | 24.11.02 | | 23.11.09 | | 23.11.09 | | | | unvested options | | £14.68 | | 73,340 | | 21.02.09 | | 21.02.09 | | 20.02.16 | | 20.02.16 | |
|
|
|
|
|
|
|
|
|
|
|
|
|
| |
|
|
|
|
|
|
|
|
|
|
|
|
|
| | | Below market price at year-end: | vested options | | £11.79 | | 52,800 | | 03.12.05 | | 03.12.05 | | 02.12.12 | | 02.12.12 | | | | unvested options | | £11.23 | | 29,050 | | 02.12.07 | | 02.12.07 | | 01.12.14 | | 01.12.14 | |
|
|
|
|
|
|
|
|
|
|
|
|
|
| |
|
|
|
|
|
|
|
|
|
|
|
|
|
| | | Total share options as at 31st December 2007 | | | £13.55 | | 170,712 | | | | | | | | | |
|
|
|
|
|
|
|
|
|
|
|
|
|
| |
|
|
|
|
|
|
|
|
|
|
|
|
|
| | | Above market price (“underwater”) at year-end: | unvested options | | $58.00 | | 162,320 | | 20.02.10 | | 20.02.10 | | 19.02.17 | | 19.02.17 | |
|
|
|
|
|
|
|
|
|
|
|
|
|
| |
|
|
|
|
|
|
|
|
|
|
|
|
|
| | | Total ADS options as at 31st December 2007 | | | $58.00 | | 162,320 | | | | | | | | | |
|
|
|
|
|
|
|
|
|
|
|
|
|
| |
This includes those share options held by Dr Slaoui’s spouse,connected person, who is also an employee of GSK. | | | | | | | | | | | Vesting date | | | | Lapse date | | | | Weighted average | | | |
|
|
| |
|
|
| | | Mr J Heslop | | | | grant price | | Number | | earliest | | latest | | earliest | | latest | |
|
|
|
|
|
|
|
|
|
|
|
|
|
|
| | | Above market price (“underwater”) at year end: | vested options | | £ | 17.04 | | 194,438 | | 31.07.01 | | 28.11.04 | | 30.07.08 | | 27.11.11 | | | | unvested options | | £ | 14.68 | | 231,000 | | 21.02.09 | | 21.02.09 | | 21.02.16 | | 21.02.16 | |
|
|
|
|
|
|
|
|
|
|
|
|
|
|
| | | Below market price at year end: | vested options | | £ | 12.70 | | 54,000 | | 28.10.06 | | 28.10.06 | | 26.10.13 | | 26.10.13 | | | | unvested options | | £ | 11.23 | | 63,066 | | 03.12.07 | | 27.10.08 | | 01.12.14 | | 26.10.15 | |
|
|
|
|
|
|
|
|
|
|
|
|
|
|
| | | Total share options as at 31st December 2006 | | £ | 14.93 | | 542,504 | | | | | | | | | |
|
|
|
|
|
|
|
|
|
|
|
|
|
|
| | | | | | | | | | | | | | | | | |
| | | | | | | | | | | Vesting date | | | | Lapse date | | | | Weighted average | | | |
|
|
| |
|
|
| | | Dr T Yamada | | | | grant price | | Number | | earliest | | latest | | earliest | | latest | |
|
|
|
|
|
|
|
|
|
|
|
|
|
|
| | | Above market price (“underwater”) at year end: | vested options | | $ | 60.91 | | 320,519 | | 15.03.02 | | 24.11.02 | | 31.05.08 | | 31.05.08 | |
|
|
|
|
|
|
|
|
|
|
|
|
|
|
| | | Below market price at year end: | vested options | | $ | 47.02 | | 530,591 | | 13.11.00 | | 03.12.05 | | 12.11.07 | | 31.05.08 | | | | unvested options | | $ | 44.15 | | 276,000 | | 01.06.06 | | 01.06.06 | | 31.05.08 | | 01.12.08 | |
|
|
|
|
|
|
|
|
|
|
|
|
|
|
| | | Total ADS options as at 31st May 2006 | | | $ | 50.27 | | 1,127,110 | | | | | | | | | |
|
|
|
|
|
|
|
|
|
|
|
|
|
|
| |
The lapse dates for Dr Yamada’s options have been modified to reflect his retirement in 2006.
<Back to Contents
| Remuneration Report | continued |
| |
| | | | | | | | Nominal vesting date* | | Lapse date | | | | | | Weighted average | | | | | | | | | | | | | Mr J Heslop | | | grant price | | Number | | earliest | | latest | | earliest | | latest | |
|
|
|
|
|
|
|
|
|
|
|
|
|
| | | Above market price (“underwater”) at year-end: | vested options | | £17.04 | | 194,438 | | 31.07.01 | | 28.11.04 | | 30.07.08 | | 27.11.11 | | | | unvested options | | £14.78 | | 473,750 | | 21.02.09 | | 20.02.10 | | 20.02.16 | | 19.02.17 | |
|
|
|
|
|
|
|
|
|
|
|
|
|
| |
|
|
|
|
|
|
|
|
|
|
|
|
|
| | | Below market price at year-end: | vested options | | £12.70 | | 54,000 | | 28.10.06 | | 28.10.06 | | 27.10.13 | | 27.10.13 | | | | unvested options | | £11.23 | | 63,066 | | 03.12.07 | | 27.10.08 | | 02.12.14 | | 26.10.15 | |
|
|
|
|
|
|
|
|
|
|
|
|
|
| |
|
|
|
|
|
|
|
|
|
|
|
|
|
| | | Total share options as at 31st December 2007 | | | £14.91 | | 785,254 | | | | | | | | | |
|
|
|
|
|
|
|
|
|
|
|
|
|
| | | | | * Subsequent to the nominal vesting date, the Remuneration Committee meets to determine whether the required performance criteria have been satisfied. |
GSK grants share options to Executive Directors and Senior Managers on an annual basis. The Directors hold these options under the various share option plans referred to in Note 4042 to the financial statements, ‘Employee share schemes’. None of the other Directors had an interest in any option over the company’s shares. The table below sets out, for grants of share options in respect of the last four financial2003 and 2004 grant years, the grant year, the performance period, whether or not the options have vested at 31st December 2007, and the performance targets. | | | | | | | | Performance target | | | | | | | |
|
|
| | | | | | Vesting status | | Annualised growth | | Percentage of | | | Grant | Performance period | | Vesting statusat 31.12.07 | | in EPS under IFRS | | award vesting | |
|
|
|
|
|
|
|
| | November 2002December 2003 | 01.01.03 - 31.12.0501.01.04 – 31.12.06 | | Vested | |  | | 100%100 | % | | December 2004 | 01.01.05 – 31.12.07 | | | Unvested | | RPI + 4% | | 75%75 | % | | | | | | | RPI + 3% | | 50%50 | % | | | | | | | < RPI + 3% | | 0%0 | |
|
|
|
|
|
|
|
| | December 2003 | 01.01.04 - 31.12.06 | | Vested | | RPI + 5% | | 100 | | | | | | | RPI + 4% | | 75% | | | | | | | RPI + 3% | | 50% | | | | | | | < RPI + 3% | | 0% | |
|
|
|
|
|
|
|
| | December 2004 | 01.01.05 - 31.12.07 | | Not yet vested | | RPI + 5% | | 100% | | | | | | | RPI + 4% | | 75% | | | | | | | RPI + 3% | | 50% | | | | | | | < RPI + 3% | | 0% | |
|
|
|
|
|
|
|
| | February 2006 | 01.01.06 - 31.12.08 | | Not yet vested | | RPI + 6% | | 100% | | | | | | | RPI + 5% | | 83% | | | | | | | RPI + 4% | | 67% | | | | | | | RPI + 3% | | 50% | | | | | | | < RPI + 3% | | 0% | % |
|
|
|
|
|
|
|
| |
Following
| 82 | GSK Annual Report 2007 | | |
Back to Contents | | | REPORT OF THE DIRECTORS | | | Remuneration Report | | | | | | | | Remuneration Report | | continued | |
The table below sets out, for grants of share options in respect of 2006, 2007 and 2008 grant years, the introduction of International Financial Reporting Standards (IFRS) on 1st January 2005,performance period, whether or not the Committee considered what EPS measurement basis, either IFRS or UK GAAP, should be used for share awards having performance periods that straddled the IFRS conversion data. The Committee determined that UK GAAP would be used for the 2002 grant (performance period 1st January 2003 tooptions have vested at 31st December 2005) as two out of2007, and the three years would be reported under UK GAAP, and thereafter IFRS would apply.performance targets. | | | | | | | | | | | | | 2006 | | | 2005 | | | |
|
|
|
|
|
|
|
|
|
|
|
| |
|
| | | | | | | | | Grant | | | Market | | | | | | | | | Options exercised | Date | | Number | | | price | | | price | | | Gain | | | Gain | |
|
|
|
|
|
|
|
|
|
|
|
|
|
|
|
| | | Dr JP Garnier | 30.10.06 | | 68,411 | | $ | 28.16 | | $ | 53.12 | | $ | 1,707,351 | | $ | 2,029,561 | | | Mr J Heslop | 27.04.06 | | 54,000 | | £ | 11.79 | | £ | 15.41 | | £ | 195,480 | | £ | 5,665 | | | Dr T Yamada | 03.05.06 | | 21,380 | | $ | 28.16 | | $ | 56.77 | | $ | 611,712 | | $ | 2,083,931 | |
|
|
|
|
|
|
|
|
|
|
|
|
|
|
|
| | | Aggregate gain on options exercised | | | | | | | | | | | £ | 1,449,028 | | £ | 2,265,825 | |
|
|
|
|
|
|
|
|
|
|
|
|
|
|
|
| |
| | | | Performance target | | |
| | | | Vesting status | Annualised growth | Percentage of | | | Grant | Performance period | at 31.12.07 | in EPS under IFRS | award vesting | |
| | | February 2006 | 01.01.06 – 31.12.08 | Unvested | > RPI + 6% | 100% | | | February 2007 | 01.01.07 – 31.12.09 | Unvested | RPI + 5% | 83% | | | February 2008 | 01.01.08 – 31.12.10 | Unvested | RPI + 4% | 67% | | | | | RPI + 3% | 50% | | | | | < RPI + 3% | 0% | |
| |
| | | | | | | | | | | | | | | | 2007 | | 2006 | | |
| |
| | | | | | Grant | Market | | | | | | Options exercised | Date | Number | price | price | Gain | | Gain | |
|
|
| | | Dr JP Garnier | 08.02.07 | 68,411 | $32.09 | 5$5.81 | $1,622,709 | | $1,707,351 | | | | 03.08.07 | 144,967 | $40.54 | $52.12 | $1,678,718 | | | | | | 06.08.07 | 80,357 | $40.54 | $52.00 | $920,891 | | | | | Mr J Heslop | – | – | – | – | – | | £195,480 | |
| | | Aggregate gain on options exercised | | | | | £2,111,159 | | £1,118,372 | |
| |
Dr Slaoui did not exercise any options betweenduring 2007 nor during the period from 17th May 2006 andto 31st December 2006. At the average exchange rate for the year, the above gain made by Dr Garnier amounted to £922,893. Mr Heslop did not exercise any options during 2007. An EOI benefit of $192,639$1,132,994 (£104,129)566,497) was paid to Dr Garnier on exercise of thesehis options. This benefit has been included in the table on page 73.
On 8th February 2007, Dr Garnier exercised a further 68,411 options with a grant price of $32.09 (market price on date of exercise was $55.81) giving rise to a gain of $1,622,709 (£877,140). Dr Garnier also received $219,531 (£118,665) in respect of the EOI benefit arising on the exercise of these options.
At the average rate for the year, the above gain made by Dr Yamada amounted to £330,655. An EOI benefit of $60,204 (£32,543) was paid to Dr Yamada on the exercise of these options. This benefit has been included in the table on page 73.79.
The highest and lowest closing prices during the year ended 31st December 20062007 for GlaxoSmithKline shares were £15.77£14.93 and £13.26,£11.60, respectively. The highest and lowest prices for GlaxoSmithKline ADSs during the year ended 31st December 20062007 were $58.38$59.35 and $50.15,$47.87, respectively. The market price for a GlaxoSmithKline share on 31st December 20062007 was £13.44£12.79 (31st December 20052006 – £14.69)£13.44) and for a GlaxoSmithKline ADS was $52.69$50.39 (31st December 20052006 – $50.48)$52.69) . The prices on 23rd22nd February 20072008 were £14.50£11.10 per GlaxoSmithKline share and $56.92$44.08 per GlaxoSmithKline ADS. Incentive plans Performance Share Plan (PSP) awards | | | | | | Market | | | | | | | | | Additional | | | | | | Dr JP Garnier – ADSs | | | Number | | price on | | Vested & deferred | | | | ADS by | | | Number | | | | Unvested | | granted in | | date of | | | | Market | | | | | dividends | | Unvested | granted | | | Performance period | at 31.12.06 | | 2007 | | grant | | Number | | price | Gain | | Lapsed | | reinvested | | at 31.12.07 | in 2008 | |
| | | 01.01.04 – 31.12.06 | 219,392 | | – | | $44.57 | | – | | – | – | | 219,392 | | – | | – | – | | | 01.01.05 – 31.12.07 | 211,264 | | – | | $43.73 | | – | | – | – | | – | | 7,681 | | 218,945 | – | | | 01.01.06 – 31.12.08 | 223,186 | | – | | $51.02 | | – | | – | – | | – | | 8,114 | | 231,300 | – | | | 01.01.07 – 31.12.09 | – | | 240,000 | | $58.00 | | – | | – | – | | – | | 4,320 | | 244,320 | – | | | 01.01.08 – 31.12.10 | – | | – | | – | | – | | – | – | | – | | – | | – | – | |
| |
Dr Garnier held 76,042 deferred performance shares at year-end, which are not included in the above table. The increase in this balance of 2,719 relates to dividends reinvested during the year. | | | | | Market | | | | | | | | | | Additional | | | | | | Dr M Slaoui – Shares and ADSs | Number | | price on | | Vested & deferred | | | | shares by | | | Number | | | | Unvested | granted in | | date of | | | | Market | | | | | | dividends | | Unvested | granted | | | Performance period | at 31.12.06 | 2007 | | grant | | Number | | price | | Gain | | Lapsed | | reinvested | | at 31.12.07 | in 2008 | |
| | | 01.01.04 – 31.12.06 | 5,000 | – | | £12.70 | | 2,500 | | £14.88 | | £37,200 | | 2,500 | | – | | – | | | | 01.01.05 – 31.12.07 | 13,760 | – | | £11.63 | | – | | – | | – | | – | | 500 | | 14,260 | | | | 01.01.06 – 31.12.08 | 29,147 | – | | £14.68 | | – | | – | | – | | – | | 1,061 | | 30,208 | | |
| |
| | | | | Market | | | | | | | | | | Additional | | | | | | | | Number | | price on | | Vested & deferred | | | | ADS by | | | Number | | | | Unvested | granted in | | date of | | | | Market | | | | | | dividends | | Unvested | granted | | | Performance period | at 31.12.06 | 2007 | | grant | | Number | | price | | Gain | | Lapsed | | reinvested | | at 31.12.07 | in 2008 | |
| | | 01.01.07 – 31.12.09 | – | 70,570 | | $58.00 | | – | | – | | – | | – | | 1,270 | | 71,840 | – | | | 01.01.08 - 31.12.10 | – | – | | $44.75 | | – | | – | | – | | – | | – | | – | 70,570 | |
| |
This includes those performance shares held by Dr Slaoui’s connected person, who is also an employee of GSK. | GSK Annual Report 2007 | 83 | | |
Back to Contents | | | REPORT OF THE DIRECTORS | | Remuneration Report | | | | | | |
| GSK Annual Report 2006 | 78 |
Back to Contents
| | Remuneration Report | | continued |
| | |
Incentive plans | Performance Share Plan (PSP) awards | | | | | | | | | | | Dr JP Garnier – ADSs | | | Market | | | Vested & deferred | | Additional | | Number | | | Number | price on | |
| | ADS by | | | | | Unvested | granted in | date of | | | Market | | | dividends | Unvested | granted | | Performance period | at 31.12.05 | 2006 | grant | | Number | price | Gain | Lapsed | reinvested | at 31.12.06 | in 2007 |
| | 01.01.03 – 31.12.05 | 70,000 | – | $37.25 | | 35,000 | $51.35 | $1,797,247 | 35,000 | – | – | – | | 01.01.04 – 31.12.06 | 212,763 | – | $44.57 | | – | – | | – | 6,629 | 219,392 | – | | 01.01.05 – 31.12.07 | 204,881 | – | $43.73 | | – | – | | – | 6,383 | 211,264 | – | | 01.01.06 – 31.10.08 | – | 220,000 | $51.02 | | – | – | – | – | 3,186 | 223,186 | – | | 01.01.07 – 31.12.09 | – | – | $58.00 | | – | – | – | – | – | – | 240,000 |
|
Dr Garnier held 73,323 deferred PSPs at year-end. The increase in this balance of 36,648 relates to dividends reinvested during the year of 1,648 and a further 35,000 PSPs which vested during the year that Dr Garnier elected to defer. The total value of the awards vesting during 2006 was $1,797,247. |
| Dr M Slaoui – Shares and ADSs | | | | | | | | | | | | | | | | Market | | | Vested & exercised | | Additional | | | | | | Number | price on | |
| | shares by | | Number | | | Unvested | granted in | date of | | | Market | | | dividends | Unvested | granted | | Performance period | at 17.05.06 | 2006 | grant | | Number | price | Gain | Lapsed | reinvested | at 31.12.06 | in 2007 |
| | 01.01.04 – 31.12.06 | 5,000 | – | £12.70 | | – | – | – | – | – | 5,000 | – | | 01.01.05 – 31.12.07 | 13,559 | – | £11.63 | | – | – | – | – | 201 | 13,760 | – | | 01.01.06 – 31.12.08 | 28,720 | – | £14.68 | | – | – | – | – | 427 | 29,147 | – |
|
| | | | | | | | | | | | | | | | | Market | | | Vested & exercised | | Additional | | | | | Number | price on | |
| | ADS by | | Number | | | Unvested | granted in | date of | | | Market | | | dividends | Unvested | granted | | Performance period | at 31.12.05 | 2006 | grant | | Number | price | Gain | Lapsed | reinvested | at 31.12.06 | in 2007 |
| | 01.01.07 – 31.12.09 | – | – | $58.00 | | – | – | – | – | – | – | 70,570 |
| | This includes those PSPs held by Dr Slaoui’s spouse, who is also an employee of GSK. |
| Mr J Heslop – Shares | | | Market | | | Vested & exercised | | Additional | | | | | Number | price on | |
| | shares by | | Number | | | Unvested | granted in | date of | | | Market | | | dividends | Unvested | granted | | Performance period | at 31.12.05 | 2006 | grant | | Number | price | Gain | Lapsed | reinvested | at 31.12.06 | in 2007 |
| | 01.01.03 – 31.12.05 | 5,000 | – | £11.79 | | 2,500 | £14.65 | £36,625 | 2,500 | – | – | – | | 01.01.04 – 31.12.06 | 5,000 | – | £12.70 | | – | – | – | – | – | 5,000 | – | | 01.01.05 – 31.12.07 | 15,885 | – | £11.63 | | – | – | – | – | 501 | 16,386 | – | | 01.01.06 – 31.12.08 | – | 100,000 | £14.68 | | – | – | – | – | 1,487 | 101,487 | – | | 01.01.07 – 31.12.09 | – | – | £14.88 | | – | – | – | – | – | – | 105,000 |
|
| Dr T Yamada – ADSs | | | Market | | | Vested & exercised | | Additional | | | | | Number | price on | |
| | ADS by | | Number | | | Unvested | granted in | date of | | | Market | | | dividends | Unvested | granted | | Performance period | at 31.12.05 | 2006 | grant | | Number | price | Gain | Lapsed | reinvested | at 31.05.06* | in 2007 |
| | 01.01.03 – 31.12.05 | 20,000 | – | $37.25 | | 10,000 | $51.35 | $513,500 | 10,000 | – | – | – | | 01.01.04 – 31.12.06 | 63,829 | – | $44.57 | | – | – | – | – | 1,049 | 64,878 | – | | 01.01.05 – 31.12.07 | 61,464 | – | $43.73 | | – | – | – | – | 1,010 | 62,474 | – |
|
* | Dr Yamada’s unvested awards will vest at the end of the relevant performance period, subject to performance. |
At the average exchange rate for the year, the above gains by Dr Garnier and Dr Yamada amounted to £971,485 and £277,567 respectively. The total gain on vesting of PSPPerformance Share Plan (PSP) awards made by Executive Directors is £1,285,677 (2005 – £1,431,804).
| | | | | | | | | | | | | | | | | | | | | | | | | | | | | | | | | | | | | | | | | | | Mr J Heslop – Shares | | | | | Market | | | | | | Additional | | | | | | | | | | Number | | price on | | Vested & exercised | | | shares by | | | | Number | | | | Unvested | | granted in | | date of | | | | Market | | | | | dividends | | Unvested | | granted | | | Performance period | at 31.12.06 | | 2007 | | grant | | Number | | price | | Gain | | Lapsed | reinvested | | at 31.12.07 | | in 2008 | |
| | | 01.01.04 – 31.12.06 | 5,000 | | – | | £12.70 | | 2,500 | | £14.88 | | £37,200 | | 2,500 | – | | – | | – | | | 01.01.05 – 31.12.07 | 16,386 | | – | | £11.63 | | – | | – | | – | | – | 596 | | 16,982 | | – | | | 01.01.06 – 31.12.08 | 101,487 | | – | | £14.68 | | – | | – | | – | | – | 3,691 | | 105,178 | | – | | | 01.01.07 – 31.12.09 | – | | 105,000 | | £14.88 | | – | | – | | – | | – | 1,887 | | 106,887 | | – | | | 01.01.08 – 31.12.10 | – | | – | | £11.47 | | – | | – | | – | | – | – | | – | | 105,000 | |
| |
The PSP is a medium-term incentive scheme introduced during 2001. Under the terms of the PSP the number of shares actually vesting is determined following the end of the relevant three-year measurement period and is dependent on GSK’s performance during that period as described on pages 68 and 69.74 to 76. The performance share awards were previously granted annually in November or December prior to the start of the performance period but, since the 2006 grant, they are granted in February of the first year of the performance period. The measurement period commences on 1st January ending after three years on 31st December. For awards with a performance period commencing on 1st January 2005 and subsequent awards, dividends are reinvested on the PSPsperformance shares awarded to membersExecutives, throughout the performance period and up to the date of the CET. Dividends are reinvested infinal award. The dividend reinvestment is calculated as of the quarter in which payment is made.ex-dividend date. Under the terms of the PSP, US participants may defer receipt of all or part of their vested awards. The total gain on vesting of PSP awards made by Executive Directors is £74,400 (2006 – £1,285,677). The PSP awards granted to Executive Directors (excluding Dr Slaoui) in December 2003,2004, with the performance period starting on 1st January 20042005 and ending on 31st December 2006 did not vest for the Executives who were2007 vested in office in 2003part because of GSK’s relative TSR performance was belowplaced the company above the median and as a resultof the awards lapsed. comparator group. The awards made in 2003 to other senior executives in 2004, including Dr Slaoui and Mr Heslop, were dependent in part on TSR performance and in part on EPS performance. Half of these awardsThe TSR portion vested as GSK’sin part and the EPS performance reached the target level for full vesting.portion vested in full.
<Back to Contents
| Remuneration Report | continued |
|
The following vesting schedules apply to awards made in 2003, 2004 and 2006. | | | Vesting schedule | | | Vesting schedule | | | | |
| | |
| | | Award | Performance Period | | TSR rank with 14 companies* | Percentage of award vesting** | | Performance Period | TSR rank with 13 companies | Percentage of award vesting* | |
|
|
| | | 2003 | 1st January 2004 to 31st December 2006 | | 1 | 100 | % | | | 2004 | 1st January 2005 to 31st December 2007 | | 2 | 100 | % | 01.01.05 – 31.12.07 | 1 | 100% | | | 2006 | | 01.01.06 – 31.12.08 | 2 | 100% | | | | | | 3 | 90 | % | | 3 | 87% | | | | | | 4 | 80 | % | | 4 | 74% | | | | | | 5 | 70 | % | | 5 | 61% | | | | | | 6 | 60 | % | | 6 | 48% | | | | | | 7 | 50 | % | | Median | 35% | | | | | | Median | 35 | % | | Below median | 0% | | | | | | Below median | 0 | % |
| |
| |
The following vesting schedules apply to awards made in 2007 and 2008. | | | Vesting schedule | | | Vesting schedule | | | | |
| |
| | | Award | Performance Period | | TSR rank with 13 companies | Percentage of award vesting** | | Performance Period | TSR rank with 14 companies | Percentage of award vesting* | |
|
|
| | | 2006 | 1st January 2006 to 31st December 2008 | | 1 | 100 | % | | | 2007 | | 01.01.07 – 31.12.09 | 1 | 100% | | | 2008 | | 01.01.08 – 31.12.10 | 2 | 100% | | | | | | 2 | 100 | % | | 3 | 90% | | | | | | 3 | 87 | % | | 4 | 80% | | | | | | 4 | 74 | % | | 5 | 70% | | | | | | 5 | 61 | % | | 6 | 60% | | | | | | 6 | 48 | % | | 7 | 50% | | | | | | Median | 35 | % | | Median | 35% | | | | | | Below median | 0 | % | | Below median | 0% | |
|
|
| |
| * | The performance comparator group for these awards comprised 14 other companies and GlaxoSmithKline. Both Aventis and Sanofi-Synthelabo were in the comparator group prior to their merger to form Sanofi-Aventis. For the purposes of calculating TSR over the performance period for the awards granted in December 2003, the starting price of the shares of the two individual companies will be compared to the price of the merged company at the end of the performance period, adjusted by the merger ratio. Dividends will be treated as having been reinvested during the performance period. | ** | TSR is measured on a pro-rata basis. Where GlaxoSmithKline’s performance falls between two of the comparators, the level of vesting will be determined by the actual relative level of TSR rather than simple ranking. Dividends will be treated as reinvested during the performance period. |
| | | | | | | | | | | | Share Value Plan awards | | | | | | | | | | | Dr M Slaoui – Shares and ADSs | | | Market | | | Vested & exercised | | | Number | | | | Number | price on | |
| | | of ADSs | | | Unvested | granted | date of | | | Market | | | Unvested | granted | | Plan year | at 17.05.06 | in 2006 | grant | | Number | price | Gain | Lapsed | at 31.12.06 | in 2007 |
| | 2004 | 4,660 | – | £11.23 | | – | – | – | – | 4,660 | – | | 2006 | 1,200 | – | £14.68 | | – | – | – | – | 1,200 | – | | 2007 | – | – | $58.00 | | – | – | – | – | – | 890 |
|
| 84 | GSK Annual Report 2007 | | |
Back to Contents | | | REPORT OF THE DIRECTORS | | | Remuneration Report | | | | | | | Remuneration Report | | continued | |
Share Value Plan awards Dr M Slaoui – Shares and ADSs | | | | | | Market | | | | | | | | | | | | | | | | Number | | price on | | Vested & exercised | | | | | | Number | | | | Unvested | | granted in | | date of | �� | | | Market | | | | | | Unvested | | granted | | | Plan year | at 31.12.06 | | 2007 | | grant | | Number | | price | | Gain* | | Lapsed | | at 31.12.07 | | in 2008 | |
| | | 2004 | 4,660 | | – | | £11.23 | | 4,660 | | £12.84 | | £43,014 | | – | | – | | – | | | 2006 | 1,200 | | – | | £14.68 | | – | | – | | – | | – | | 1,200 | | – | | | 2007 (ADSs) | – | | 890 | | $58.00 | | – | | – | | – | | – | | 890 | | – | | | 2008 (ADSs) | – | | – | | $44.75 | | – | | – | | – | | – | | – | | 890 | |
| |
| * | The gain disclosed relates only to Dr Slaoui and not to any person connected to him. |
In his capacity as SVP, Worldwide Business Development, Dr Slaoui was eligible to participate in the GSK Share Value Plan. Both Dr Slaoui and his wife, asconnected person, an employee of GSK, received awards under the Share Value Plan. Following the announcement of his appointment to the Board in February 2006, he ceased to be eligible to receive awards under this plan. The awards are subject to a 3-yearthree year vesting periodperiods and the vesting is contingent on their continued employment with GSK. | | Vested and | Additional ADS | Vested and | Vested and | | Additional ADS | | Vested and | | | | deferred | by dividends | deferred | deferred | | by dividends | | deferred | | | | participations | reinvested | participations | participations | | reinvested | | participations | | | Mid-Term Incentive Plan – ADSs | at 31.12.05 | in 2006 | at 31.12.06 | at 31.12.06 | | in 2007 | | at 31.12.07 | |
|
|
| | | Dr JP Garnier | 168,464 | 5,230 | 173,694 | 173,694 | | 6,443 | | 180,137 | |
|
|
|
| |
The Mid-Term Incentive Plan (MTIP) was a share award scheme operated by SmithKline Beecham. The plan closed to new entrants upon completion of the merger and no further participations have been granted. Where a final award of ADSs is made, receipt of the award may be deferred by a Director. Dr Garnier deferred receipt of the full amounts which vested in each year between 1999 2000, 2001, 2002 and 2003. The deferred awards, together with any additional ADSs subsequently received through dividend reinvestment, are not included in the Directors’ interests table on page 7681 since they are retained in the MTIP until paid out.
Back to Contents
| Remuneration Report | continued |
| |
| | | | Average | | Stock Appreciation Rights (SARs) – ADSs | At 31.12.05 | At 17.05.06 | grant price |
| | Dr L Shapiro | 872 | 872 | $57.25 |
|
Dr Shapiro did not exercise any SARS in 2006. Her gain on exercise in 2005 was $6,380.
All SARs held by Dr Shapiro had a grant price above the market price of a GlaxoSmithKline ADS at 17th May 2006, the date she retired from the Board of GlaxoSmithKline.
Dr Shapiro is a member of GlaxoSmithKline’s Scientific Advisory Board (SAB). Dr Shapiro was a member of SmithKline Beecham’s SAB from 1993 until the completion of the merger with Glaxo Wellcome. Along with other members of the SAB, she received annual grants of SmithKline Beecham SARs which, in general, vested three years from the date of grant and will expire 10 years from the date of grant. Grants of SARs to SAB members ceased in 1999.
SARs entitle the holder to a cash sum at a future date based on share price growth between the date of grant and the date of exercise. Full provision is made in the financial statements for accrued gains on SARs from the date of grant. In connection with the merger, all previously granted SARs became immediately exercisable.
Pensions The accrued annual pension benefits and transfer values for Executive Directors in office on 31st December 2007 on retirement are set out below. The regulations require disclosure of the accrued benefit at the end of the year, the change in accrued benefit over the year, the transfer value at both the beginning and end of the year and the change in the transfer value over the year. The Listing Rules require additional disclosure of the change in the accrued benefit net of inflation and the transfer value of this change. Pensions for the Executive Directors have been disclosed in the currency in which the pension is payable. | | | | | | | | | Personal | | | | | | | | | Change in | | | | | Change in | | | | | | | | | Change in | | | contributions | | | | | | | | | accrued | | Transfer value | | | Change in | | Personal | | accrued | | Transfer value | | | | | Accrued | | | Accrued | | | accrued | | | made to the | | | Transfer | | | Transfer | | | Change | | | benefit over | | | of change | | Accrued | | Accrued | | accrued | | contributions | | Transfer | | Transfer | | Change | | benefit over | | of change | | | | | benefit at | | | benefit at | | | benefit | | | scheme during | | | value at | | | value | | | in transfer | | | year net | | | in accrued | | benefit at | | benefit at | | benefit | | made during | | value at | | value at | | in transfer | | year net | | in accrued | | | Executive Directors | | 31.12.06 | | 31.12.07 | | over year | | the year | | 31.12.06 | | 31.12.07 | | value* | | of inflation | | benefit* | | | | | 31.12.05 | | | 31.12.06 | | | over year | | | the year | | | 31.12.05 | | | at 31.12.06 | | | value* | | of inflation | | | benefit* | | 000 | | 000 | | 000 | | 000 | | 000 | | 000 | | 000 | | 000 | | 000 | | | | | 000 | | | 000 | | | 000 | | | 000 | | | 000 | | | 000 | | | 000 | | | 000 | | | 000 | |
| |
|
| | | | Current Executive Directors | | | | | | | | | | | | | | | | | | | | | Dr JP Garnier | $ | 1,093 | | $ | 1,202 | | $ | 109 | | | – | | $ | 13,240 | | $ | 14,680 | | $ | 1,440 | | $ | 87 | | $ | 1,440 | | $1,202 | | $1,235 | | $33 | | – | | $14,680 | | $16,239 | | $1,559 | | ($18 | ) | $1,559 | |
|
|
| | | Dr M Slaoui | | – | | $ | 26 | | $ | 26 | | | – | | | – | | $ | 131 | | $ | 131 | | $ | 26 | | $ | 131 | | $26 | | $72 | | $46 | | – | | $131 | | $400 | | $269 | | $44 | | $269 | | | | € | 52 | | € | 53 | | € | 1 | | | – | | € | 493 | | € | 538 | | € | 45 | | | – | | € | 45 | | €53 | | €53 | | – | | – | | €538 | | €571 | | €33 | | (€2 | ) | €33 | |
|
|
| | | Mr J Heslop | £ | 75 | | £ | 111 | | £ | 36 | | £ | 11 | | £ | 1,260 | | £ | 1,930 | | £ | 659 | | £ | 34 | | £ | 415 | | £111 | | £142 | | £31 | | £13 | | £1,930 | | £2,609 | | £666 | | £27 | | £512 | |
|
|
| | | Former Executive Directors | | | | | | | | | | | | | | | | | | | | | Dr T Yamada | $ | 168 | | $ | 169 | | $ | 1 | | | – | | $ | 1,985 | | $ | 2,110 | | $ | 125 | | | – | | $ | 125 | | |
| |
| * | These are shown net of contributions made by the individual. |
Dr Garnier is a member of the All Employee US Cash Balance Pension Plan, under which GlaxoSmithKlineGSK makes annual contributions calculated as a percentage of the employee’s base salary and bonus. GlaxoSmithKlineGSK makes annual contributions of 15% of Dr Garnier’s annual salary and bonus, as detailed in his contract. The fund increases at an interest rate set annually in advance based on the 30 year US treasury bond rate to provide a cash sum at retirement. This cash sum is used to purchase a pension at retirement based on the annuity rates applicable at that time. The plan has no entitlement to a spouse’s pension or to pension increases, other than by reducing the executive’s own initial pension. The transfer value, or cash sum, of Dr Garnier’s plan has increased by $1,440,430$1,558,562 over the year as a result of further accumulation of interest and contributions paid by the company. Dr Garnier will retire from the company on 31st May 2008. | GSK Annual Report 2007 | 85 | | |
Back to Contents | | | REPORT OF THE DIRECTORS | | Remuneration Report | | | | | | | | Remuneration Report | | continued | |
Pensions With effect from 1st June 2006, Dr Slaoui became a member of the US Executive Cash Balance Pension Plan, under which GlaxoSmithKlineGSK makes annual contributions calculated as a percentage of the executive’s base salary. GlaxoSmithKlineGSK makes annual contributions of 38% of Dr Slaoui’s annual salary. The fund increases at an interest rate set annually in advance based on the 30 year US treasury bond rate to provide a cash sum at retirement. This cash sum is used to purchase a pension at retirement based on the annuity rates applicable at that time. The plan has no entitlement to a spouse’s pension or to pension increases, other than by reducing the executive'sexecutive’s own initial pension. The transfer value, or cash sum, of Dr Slaoui’s plan has increased by $268,771 over the year as a result of further accumulation of interest and contributions paid by the company. Dr Slaoui was an active participant ofin the Belgium FortesFortis Plan until 31st May 2006. This plan is a defined benefit plan with a lump sum payable at Normal Retirementnormal retirement age for the plan which is 60 years of age. The transfer value, or cash sum, of Dr Slaoui’s plan has increased by ¤45,042€33,465 over the year as a result of the further accumulation of interest and contributions paid by the company.interest. Mr Heslop participates in the Glaxo Wellcome Defined Benefit Plan with an accrual rate of 1/30th of final pensionable salary per annum. In 2000 all benefits accrued under the Glaxo Wellcome UK pension arrangements were augmented by the Trustees of the plans by 5% to reflect a distribution of surplus. This augmentation will apply to that element of Mr Heslop’s pension earnings before 31st March 2000.
Back to Contents
| Remuneration Report | continued |
|
Mr Heslop’s transfer value has been calculated on the basis of actuarial advice in accordance with Actuarial Guidance Note GN11. The transfer value represents the present value of future payments to be made under the pension plan. Mr Heslop’s annual accrued benefit has increased by £36,401£31,351 (£34,38927,358 excluding the effects of inflation), and the transfer value less personal contributions has increased by £658,794£665,646 over the year. The increase in Mr Heslop’s pensionable salary of £80,000£58,000 is the primary reason for the increase in transfer value. Dr Yamada retired on 31st May 2006, as a member of the All Employee US Cash Balance Pension Plan, under which GlaxoSmithKline makes annual contributions calculated as a percentage of the employee’s base salary and bonus. GlaxoSmithKline made annual contributions of 18% of Dr Yamada’s annual salary and bonus (as detailed in his contract). The fund increases at an interest rate set annually in advance based on the 30 year US treasury bond rate to provide a cash sum at retirement. This cash sum is used to purchase a pension at retirement based on the annuity rates applicable at that time. The plan has no entitlement to a spouse’s pension or to pension increases, other than by reducing the executive’s own initial pension. Dr Yamada commenced his pension benefit in the form of an annuity on 1st June 2006. Dr Garnier Dr Slaoui and Dr YamadaSlaoui are also members of the US Retirement Savings Plan, a 401k savings scheme open to all US employees and the Executive Supplemental Savings Plan, a savings scheme open to executives to restoreaccrue benefits above US government limits imposed on the Retirement Savings Plan. Contributions to both plans are invested in a range of funds and the value of the accumulated funds is paid at retirement. During 2006,2007, contributions of $183,840$198,475 (£99,373)99,238) were paid into these two schemes by the companyGSK in respect of Dr Garnier. In respect of Dr Slaoui, contributions of $20,354$85,212 (£11,002)42,606) were paid into the scheme. In respect of Dr Yamada, contributions of $62,494 (£33,781) were paid into the scheme.
Directors and Senior Management For US reporting purposes, itFurther information is necessary to provide informationalso provided on compensation and interests of Directors and Senior Management as a group (‘the group’). For thethis purpose, the group is defined as the Executive and Non-Executive Directors, members of the CET and the Company Secretary. For the financial year 2006,2007, the total compensation paid to members of the group for the periods during which they served in that capacity was £14,906,027,£14,490,295, the aggregate increase in accrued pension benefits, net of inflation, was £290,013£183,422 and the aggregate payment to defined contribution schemes was £446,115. £442,922. Also accrued during the year was an amount of £1,739,000 relating to compensation for loss of office and £535,800 in respect of associated pension contributions.
During 2006,2007, the members of the group were granted 887,150933,930 share options and 1,060,0001,333,820 ADS options under the Share Option Scheme, 383,070403,130 shares and 462,000579,070 ADSs under the Performance Share Plan and were awarded 3,1602,520 shares and 890 ADSs under the Share Value Plan. Members of the group were also awarded 21,33933,624 shares and 38,45849,333 ADSs through the reinvestment of dividends in the Performance Share Plan. At 23rd22nd February 2007,2008, the group (comprising 2527 persons) owned 573,400716,727 shares and 346,738463,427 ADSs, constituting less than 1% of the issued share capital of the company. The group also held, at that date: options to purchase 6,302,3567,759,454 shares and 7,720,8077,667,846 ADSs; 1,104,3691,393,001 shares and 1,611,6591,531,017 ADSs awarded under the Performance Share Plan, including those shares and ADSs that are vested and deferred; 222,403232,177 vested and deferred ADSs under the legacy SmithKline Beecham Mid-Term Incentive Plan, and 21,02019,260 shares and 3,8503,260 ADSs awarded under the Share Value Plan. These holdings were issued under the various executive share option plans described in Note 4042 to the financial statements, ‘Employee share schemes’. Directors’ interests in contracts Except as described in Note 3335 to the financial statements, ‘Related party transactions’, during or at the end of the financial year no Director or connected person had any material interest in any contract of significance in relation to the Group’s business with a Group company. The Directors’ Remuneration Report has been approved by the Board of Directors and signed on its behalf by Sir Christopher Gent
Chairman
28th27th February 20072008
| 86 |
| GSK Annual Report 20062007 | 82 | |
<Back to Contents | | Financial statements | | | | | | | |
Financial statements | | | |
|
| GSK Annual Report 20062007 | 87 | 83 | |
<Back to Contents | | FINANCIAL STATEMENTS | | Directors’ statements of responsibility | | | |
| | | | Directors’ statements of responsibility | | | |
Directors’ statement of responsibility in relation to the consolidated financial statements The Directors are responsible for: | • | ensuring the maintenance of proper accounting records, whichdisclose with reasonable accuracy the financial position of the GroupatGroup at any time and from which financial statements can be preparedtoprepared to comply with the Companies ActActs 1985 and 2006, and Article 4 of the IASRegulationIAS Regulation | | | | | • | preparing financial statements for each financial period which giveagive a true and fair view, in accordance with IFRS as adopted for use inthein the European Union, of the state of affairs of the Group as at theendthe end of the financial period and of the profit or loss for that period | | | | | • | ensuring the operation of systems of internal control and for takingreasonabletaking reasonable steps to safeguard the assets of the Group and forpreventingfor preventing and detecting fraud and other irregularities. |
The directors confirm that they have complied with the above requirements in preparing the financial statements. The financial statements for the year ended 31st December 2006,2007, comprising principal statements and supporting notes, are set out in ‘Financial statements’ on pages 8690 to 164158 of this report. The Directors confirm that suitable accounting policies have been consistently applied in the preparation of the financial statements, supported by reasonable and prudent judgements and estimates as necessary. The responsibilities of the auditors in relation to the financial statements are set out in the Independent Auditors’ report (page 8589 opposite). The financial statements for the year ended 31st December 20062007 are included in the Annual Report 2006,2007, which is published in hard-copyhardcopy printed form and made available on the website. The Directors are responsible for the maintenance and integrity of the Annual Report on the website in accordance with UK legislation governing the preparation and dissemination of financial statements. Access to the website is available from outside the UK, where comparable legislation may be different. Disclosure of information to auditors The Directors, in office at the date of this Report, have each confirmed that: | • | so far as they are aware, there is no relevant audit information ofwhichof which the company’s auditors are unaware; and | | | | | • | each Director has taken all the steps that he/she ought to have takenastaken as a Director to make himself/herself aware of any relevant auditinformationaudit information and to establish that the company’s auditors are awareofaware of that information. |
This confirmation is given and should be interpreted in accordance with the provisions of Section 234 ZA of the Companies Act 1985. Directors’ remuneration The Remuneration Report on pages 6571 to 8286 sets out the remuneration policies operated by GlaxoSmithKline and disclosures on Directors’ remuneration and other disclosable information relating to Directors and officers and their interests. It has been prepared in accordance with the Companies ActActs 1985 and 2006, and complies with Section B of the Combined Code on Corporate Governance. Going concern basis After making enquiries, the Directors have a reasonable expectation that the Group has adequate resources to continue in operational existence for the foreseeable future. For this reason, they continue to adopt the going concern basis in preparing the financial statements. Internal control The Board, through the Audit Committee, has reviewed the assessment of risks and the internal control framework that operates in GlaxoSmithKline and has considered the effectiveness of the system of internal control in operation in the Group for the year covered by this report and up to the date of its approval by the Board of Directors. The Combined Code The Board considers that GlaxoSmithKline plc applies the principles of the Combined Code on Corporate Governance of the Financial Reporting Council, as described under ‘Corporate governance’ on pages 5359 to 63,70, and has complied with its provisions except as described on page 62.69. As required by the Listing Rules of the Financial Services Authority, the auditors have considered the Directors’ statement of compliance in relation to those points of the Combined Code which are specified for their review. Annual Report The Annual Report for the year ended 31st December 2006,2007, comprising the Report of the Directors, the Remuneration Report, the Financial statements and additional information for investors, has been approved by the Board of Directors and signed on its behalf by Sir Christopher Gent
Chairman
28th27th February 20072008
| 88 |
| GSK Annual Report 20062007 | 84 | |
<Back to Contents | FINANCIALSTATEMENTS | | | Independent Auditors’ report | | | | | | | | | Report of Independent Registered Public Accounting Firm | | To the Board of Directors and Shareholders of GlaxoSmithKline plc |
| | |
We have completed an integrated audit of GlaxoSmithKline’s 2006 consolidated financial statements and of its internal control over financial reporting as of 31st December 2006 and an audit of its 2005 and 2004 consolidated financial statements in accordance with the standards of the Public Company Accounting Oversight Board (United States). Our opinions, based on our audits, are presented below.
Consolidated financial statements
In our opinion, the accompanying consolidated balance sheetsincome statements and the related consolidated income statements,balance sheets, consolidated statements of cash flows and, consolidated statements of recognised income and expense present fairly, in all material respects, the financial position of GlaxoSmithKline and its subsidiaries at 31st December 20062007 and 20052006 and the results of their operations and cash flows for each of the three years in the period ended 31st December 2006,2007, in conformity with International Financial Reporting Standards (IFRSs) as adoptedissued by the European Union. TheseInternational Accounting Standards Board. Also, in our opinion the Group maintained, in all material respects, effective internal control over financial reporting as of 31st December 2007, based on criteria established in Internal Control – Integrated Framework issued by the Committee of Sponsoring Organizations of the Treadway Commission (COSO). The Group’s management are responsible for these financial statements, arefor maintaining effective internal control over financial reporting and for its assessment of the responsibilityeffectiveness of GlaxoSmithKline’s management.internal control over financial reporting, included in ‘Management’s annual report on internal control over financial reporting’ on page 70. Our responsibility is to express an opinionopinions on these financial statements and on the Group’s internal control over financial reporting based on our audits.audits (which were integrated audits in 2007 and 2006). We conducted our audits of these financial statements in accordance with the standards of the Public Company Accounting Oversight Board (United States). Those standards require that we plan and perform the auditaudits to obtain reasonable assurance about whether the financial statements are free of material misstatement. An auditmisstatement and whether effective internal control over financial reporting was maintained in all material respects. Our audits of the financial statements includesincluded examining, on a test basis, evidence supporting the amounts and disclosures in the financial statements, assessing the accounting principles used and significant estimates made by management, and evaluating the overall financial statementsstatement presentation. We believe that our audits present a reasonable basis for our opinion. IFRSs as adopted by the European Union vary in certain significant respects from accounting principles generally accepted in the United States of America. Information relating to the nature and effect of such differences is presented in Note 41 to the consolidated financial statements.
Internal control over financial reporting
Also, in our opinion, management’s assessment, included in ‘Management’s annual report on internal control over financial reporting’ on page 64, that the Group maintained effective internal control over financial reporting as of 31st December 2006 based on criteria established in Internal Control – Integrated Framework issued by the Committee of Sponsoring Organizations of the Treadway Commission (COSO) is fairly stated, in all material respects, based on those criteria. Furthermore, in our opinion, the Group maintained, in all material respects, effective internal control over financial reporting as of 31st December 2006, based on criteria established in Internal Control – Integrated Framework issued by the COSO. The Group’s management is responsible for maintaining effective internal control over financial reporting and for its assessment of the effectiveness of internal control over financial reporting. Our responsibility is to express opinions on management’s assessment and on the effectiveness of the Group’s internal control over financial reporting based on our audit.
We conducted our audit of internal control over financial reporting in accordance with the standards of the Public Company Accounting Oversight Board (United States). Those standards require that we plan and perform the audit to obtain reasonable assurance about whether effective internal control over financial reporting was maintained in all material respects. An audit of internal control over financial reporting includesincluded obtaining an understanding of internal control over financial reporting, evaluating management’s assessment,assessing the risk that a material weakness exists, and testing and evaluating the design and operating effectiveness of internal control andbased on the assessed risk. Our audits also included performing such other procedures as we considerconsidered necessary in the circumstances. We believe that our audit providesaudits provide a reasonable basis for our opinions.
A company’s internal control over financial reporting is a process designed to provide reasonable assurance regarding the reliability of financial reporting and the preparation of financial statements for external purposes in accordance with generally accepted accounting standards and principles. A company’s internal control over financial reporting includes those policies and procedures that (i) pertain to the maintenance of records that, in reasonable detail, accurately and fairly reflect the transactions and dispositions of the assets of the company; (ii) provide reasonable assurance that transactions are recorded as necessary to permit preparation of financial statements in accordance with generally accepted accounting standards and principles, and that receipts and expenditures of the company are being made only in accordance with authorisationsauthorizations of management and directors of the company; and (iii) provide reasonable assurance regarding prevention or timely detection of unauthorized acquisition, use, or disposition of the company’s assets that could have a material effect on the financial statements. Because of its inherent limitations, internal control over financial reporting may not prevent or detect misstatements. Also, projections of any evaluation of effectiveness to future periods are subject to the risk that controls may become inadequate because of changes in conditions, or that the degree of compliance with the policies or procedures may deteriorate. PricewaterhouseCoopers LLP
Chartered Accountants and Registered Auditors
London
United Kingdom
2827th February 20072008
|
| GSK Annual Report 20062007 | 89 | 85 | |
<Back to Contents
| Consolidated income statement | for the year ended 31st December 2006 |
| |
| | | | 2006 | | 2005 | | 2004 | | | | Notes | | £m | | £m | | £m | |
|
|
|
|
|
|
|
| | | Turnover | 5 | | 23,225 | | 21,660 | | 19,986 | | | Cost of sales | | | (5,010 | ) | (4,764 | ) | (4,360 | ) |
|
|
|
|
|
|
|
| | | Gross profit | | | 18,215 | | 16,896 | | 15,626 | | | Selling, general and administration | | | (7,257 | ) | (7,250 | ) | (7,201 | ) | | Research and development | | | (3,457 | ) | (3,136 | ) | (2,904 | ) | | Other operating income | 6 | | 307 | | 364 | | 235 | |
|
|
|
|
|
|
|
| | | Operating profit | 7,8 | | 7,808 | | 6,874 | | 5,756 | | | | | | | | | | | | | Finance income | 9 | | 287 | | 257 | | 176 | | | Finance costs | 10 | | (352 | ) | (451 | ) | (362 | ) | | Share of after tax profits of associates and joint ventures | 11 | | 56 | | 52 | | 60 | | | Profit on disposal of interest in associates | 36 | | – | | – | | 149 | |
|
|
|
|
|
|
|
| | | Profit before taxation | | | 7,799 | | 6,732 | | 5,779 | | | | | | | | | | | | | Taxation | 12 | | (2,301 | ) | (1,916 | ) | (1,757 | ) |
|
|
|
|
|
|
|
| | | Profit after taxation for the year | | | 5,498 | | 4,816 | | 4,022 | |
|
|
|
|
|
|
|
| | | Profit attributable to minority interests | | | 109 | | 127 | | 114 | | | Profit attributable to shareholders | | | 5,389 | | 4,689 | | 3,908 | |
|
|
|
|
|
|
|
| | | | | | 5,498 | | 4,816 | | 4,022 | |
|
|
|
|
|
|
|
| | | Basic earnings per share (pence) | 13 | | 95.5 | p | 82.6 | p | 68.1 | p | | Diluted earnings per share (pence) | 13 | | 94.5 | p | 82.0 | p | 68.0 | p |
|
|
|
|
|
|
|
| |
<Back to Contents | FINANCIALSTATEMENTS | | Consolidated income statement | | | | | | | Consolidated balance sheet | at 31st December 2006 |
| |
| | | | 2006 | | 2005 | | | | Notes | | £m | | £m | |
|
|
|
|
|
| | | Non-current assets | | | | | | | | Property, plant and equipment | 15 | | 6,930 | | 6,652 | | | Goodwill | 16 | | 758 | | 696 | | | Other intangible assets | 17 | | 3,293 | | 3,383 | | | Investments in associates and joint ventures | 18 | | 295 | | 276 | | | Other investments | 19 | | 441 | | 362 | | | Deferred tax assets | 12 | | 2,123 | | 2,214 | | | Other non-current assets | 20 | | 721 | | 438 | |
|
|
|
|
|
| | | Total non-current assets | | | 14,561 | | 14,021 | |
|
|
|
|
|
| | | | | | | | | | | Current assets | | | | | | | | Inventories | 21 | | 2,437 | | 2,177 | | | Current tax recoverable | 12 | | 186 | | 416 | | | Trade and other receivables | 22 | | 5,317 | | 5,348 | | | Liquid investments | 30 | | 1,035 | | 1,025 | | | Cash and cash equivalents | 23 | | 2,005 | | 4,209 | | | Assets held for sale | 24 | | 12 | | 2 | |
|
|
|
|
|
| | | Total current assets | | | 10,992 | | 13,177 | |
|
|
|
|
|
| | | Total assets | | | 25,553 | | 27,198 | |
|
|
|
|
|
| | | | | | | | | | | Current liabilities | | | | | | | | Short-term borrowings | 30 | | (718 | ) | (1,200 | ) | | Trade and other payables | 25 | | (4,871 | ) | (5,147 | ) | | Current tax payable | 12 | | (621 | ) | (2,269 | ) | | Short-term provisions | 27 | | (1,055 | ) | (895 | ) |
|
|
|
|
|
| | | Total current liabilities | | | (7,265 | ) | (9,511 | ) |
|
|
|
|
|
| | | | | | | | | | | Non-current liabilities | | | | | | | | Long-term borrowings | 30 | | (4,772 | ) | (5,271 | ) | | Deferred tax provision | 12 | | (595 | ) | (569 | ) | | Pensions and other post-employment benefits | 26 | | (2,339 | ) | (3,069 | ) | | Other provisions | 27 | | (528 | ) | (741 | ) | | Other non-current liabilities | 28 | | (406 | ) | (467 | ) |
|
|
|
|
|
| | | Total non-current liabilities | | | (8,640 | ) | (10,117 | ) |
|
|
|
|
|
| | | Total liabilities | | | (15,905 | ) | (19,628 | ) |
|
|
|
|
|
| | | Net assets | | | 9,648 | | 7,570 | |
|
|
|
|
|
| | | | | | | | | | | Equity | | | | | | | | Share capital | 31 | | 1,498 | | 1,491 | | | Share premium account | 31 | | 858 | | 549 | | | Retained earnings | 32 | | 6,965 | | 5,579 | | | Other reserves | 32 | | 65 | | (308 | ) |
|
|
|
|
|
| | | Shareholders’ equity | | | 9,386 | | 7,311 | |
|
|
|
|
|
| | | Minority interests | | | 262 | | 259 | |
|
|
|
|
|
| | | Total equity | | | 9,648 | | 7,570 | |
|
|
|
|
|
| |
Approved by the Board on 28th February 2007
Sir Christopher Gent
income statementChairman
<Back to Contents
| Consolidated cash flow statement | for the year ended 31st December 2006 |
2007 | | |
| | | | | 2006 | | 2005 | | 2004 | | | | | Notes | | £m | | £m | | £m | |
|
|
|
|
|
|
|
|
| | | Cash flow from operating activities | | | | | | | | | | | Cash generated from operations | | 34 | | 8,203 | | 7,665 | | 6,527 | | | Taxation paid | | | | (3,846 | ) | (1,707 | ) | (1,583 | ) |
|
|
|
|
|
|
|
|
| | | Net cash inflow from operating activities | | | | 4,357 | | 5,958 | | 4,944 | |
|
|
|
|
|
|
|
|
| | | | | Cash flow from investing activities | | | | | | | | | | | Purchase of property, plant and equipment | | | | (1,366 | ) | (903 | ) | (788 | ) | | Proceeds from sale of property, plant and equipment | | | | 43 | | 54 | | 53 | | | Proceeds from sale of intangible assets | | | | 175 | | 221 | | – | | | Purchase of intangible assets | | | | (224 | ) | (278 | ) | (255 | ) | | Purchase of equity investments | | | | (57 | ) | (23 | ) | (103 | ) | | Proceeds from sale of equity investments | | | | 32 | | 35 | | 58 | | | Share transactions with minority shareholders | | 36 | | (157 | ) | (36 | ) | – | | | Purchase of businesses, net of cash acquired | | 36 | | (273 | ) | (1,026 | ) | (297 | ) | | Disposal of businesses and interest in associates | | 36 | | 5 | | (2 | ) | 230 | | | Investments in associates and joint ventures | | 36 | | (13 | ) | (2 | ) | (2 | ) | | Interest received | | | | 299 | | 290 | | 173 | | | Dividends from associates and joint ventures | | | | 15 | | 10 | | 11 | |
|
|
|
|
|
|
|
|
| | | Net cash outflow from investing activities | | | | (1,521 | ) | (1,660 | ) | (920 | ) |
|
|
|
|
|
|
|
|
| | | | | Cash flow from financing activities | | | | | | | | | | | (Increase)/decrease in liquid investments | | | | (55 | ) | 550 | | (53 | ) | | Proceeds from own shares for employee share options | | | | 151 | | 68 | | 23 | | | Issue of share capital | | 31 | | 316 | | 252 | | 42 | | | Share capital purchased for cancellation | | | | – | | – | | (201 | ) | | Purchase of Treasury shares | | | | (1,348 | ) | (999 | ) | (799 | ) | | Redemption of preference shares issued by subsidiary | | | | – | | – | | (489 | ) | | Increase in long-term loans | | | | – | | 982 | | 1,365 | | | Repayment of long-term loans | | | | – | | (70 | ) | (15 | ) | | Net repayment of short-term loans | | | | (739 | ) | (857 | ) | (407 | ) | | Net repayment of obligations under finance leases | | | | (34 | ) | (36 | ) | (22 | ) | | Interest paid | | | | (414 | ) | (381 | ) | (350 | ) | | Dividends paid to shareholders | | | | (2,598 | ) | (2,390 | ) | (2,475 | ) | | Dividends paid to minority interests | | | | (87 | ) | (86 | ) | (73 | ) | | Dividends paid on preference shares | | | | – | | – | | (2 | ) | | Other financing cash flows | | | | 16 | | 53 | | 49 | |
|
|
|
|
|
|
|
|
| | | Net cash outflow from financing activities | | | | (4,792 | ) | (2,914 | ) | (3,407 | ) |
|
|
|
|
|
|
|
|
| | | | | (Decrease)/increase in cash and bank overdrafts | | 35 | | (1,956 | ) | 1,384 | | 617 | | | | | Exchange adjustments | | | | (254 | ) | 233 | | (93 | ) | | Cash and bank overdrafts at beginning of year | | | | 3,972 | | 2,355 | | 1,831 | |
|
|
|
|
|
|
|
|
| | | Cash and bank overdrafts at end of year | | | | 1,762 | | 3,972 | | 2,355 | |
|
|
|
|
|
|
|
|
| | | | | Cash and bank overdrafts at end of year comprise: | | | | | | | | | | | Cash and cash equivalents | | | | 2,005 | | 4,209 | | 2,467 | | | Overdrafts | | | | (243 | ) | (237 | ) | (112 | ) |
|
|
|
|
|
|
|
|
| | | | | | | 1,762 | | 3,972 | | 2,355 | |
|
|
|
|
|
|
|
|
| |
| | | | | | | 2007 | | 2006 | | 2005 | | | | |
| |
| |
| | | | | Business | | Restructuring | | | | | | | | | | Notes | performance | | costs | | Total | | | | | | | | | £m | | £m | | £m | | £m | | £m | |
|
|
|
|
|
|
|
|
|
|
| | | Turnover | 6 | 22,716 | | – | | 22,716 | | 23,225 | | 21,660 | | | Cost of sales | | (5,206 | ) | (111 | ) | (5,317 | ) | (5,010 | ) | (4,764 | ) |
|
|
|
|
|
|
|
|
|
|
| | | Gross profit | | 17,510 | | (111 | ) | 17,399 | | 18,215 | | 16,896 | | | Selling, general and administration | | (6,817 | ) | (137 | ) | (6,954 | ) | (7,257 | ) | (7,250 | ) | | Research and development | | (3,237 | ) | (90 | ) | (3,327 | ) | (3,457 | ) | (3,136 | ) | | Other operating income | 8 | 475 | | – | | 475 | | 307 | | 364 | |
|
|
|
|
|
|
|
|
|
|
| | | Operating profit | 9,10 | 7,931 | | (338 | ) | 7,593 | | 7,808 | | 6,874 | | | Finance income | 11 | 262 | | – | | 262 | | 287 | | 257 | | | Finance costs | 12 | (453 | ) | – | | (453 | ) | (352 | ) | (451 | ) | | Share of after tax profits of associates and joint ventures | 13 | 50 | | – | | 50 | | 56 | | 52 | |
|
|
|
|
|
|
|
|
|
|
| | | Profit before taxation | | 7,790 | | (338 | ) | 7,452 | | 7,799 | | 6,732 | | | Taxation | 14 | (2,219 | ) | 77 | | (2,142 | ) | (2,301 | ) | (1,916 | ) |
|
|
|
|
|
|
|
|
|
|
| | | Profit after taxation for the year | | 5,571 | | (261 | ) | 5,310 | | 5,498 | | 4,816 | |
|
|
|
|
|
|
|
|
|
|
| | | Profit attributable to minority interests | | 96 | | – | | 96 | | 109 | | 127 | | | Profit attributable to shareholders | | 5,475 | | (261 | ) | 5,214 | | 5,389 | | 4,689 | |
|
|
|
|
|
|
|
|
|
|
| | | | | 5,571 | | (261 | ) | 5,310 | | 5,498 | | 4,816 | |
|
|
|
|
|
|
|
|
|
|
| | | Basic earnings per share (pence) | 15 | | | | | 94.4 | p | 95.5 | p | 82.6 | p | | Diluted earnings per share (pence) | 15 | | | | | 93.7 | p | 94.5 | p | 82.0 | p |
|
|
|
|
|
|
|
|
|
|
| | | | | | | | | | | | | | |
The calculation of business performance, a supplemental non-IFRS measure, is described in Note 1, ‘Presentation of the financial statements’. | 90 |
| GSK Annual Report 20062007 | 88 | |
<Back to Contents | Consolidated balance sheet | | | | | | | | | Consolidated balance sheet | | at 31st December 2007 | |
| | | 2007 | | 2006 | | | | Notes | £m | | £m | |
|
|
|
|
| | | Non-current assets | | | | | | | Property, plant and equipment | 17 | 7,821 | | 6,930 | | | Goodwill | 18 | 1,370 | | 758 | | | Other intangible assets | 19 | 4,456 | | 3,293 | | | Investments in associates and joint ventures | 20 | 329 | | 295 | | | Other investments | 21 | 517 | | 441 | | | Deferred tax assets | 14 | 2,196 | | 2,123 | | | Derivative financial instruments | 41 | 1 | | 113 | | | Other non-current assets | 22 | 687 | | 608 | |
|
|
|
|
| | | Total non-current assets | | 17,377 | | 14,561 | |
|
|
|
|
| | | Current assets | | | | | | | Inventories | 23 | 3,062 | | 2,437 | | | Current tax recoverable | 14 | 58 | | 186 | | | Trade and other receivables | 24 | 5,495 | | 5,237 | | | Derivative financial instruments | 41 | 475 | | 80 | | | Liquid investments | 32 | 1,153 | | 1,035 | | | Cash and cash equivalents | 25 | 3,379 | | 2,005 | | | Assets held for sale | 26 | 4 | | 12 | |
|
|
|
|
| | | Total current assets | | 13,626 | | 10,992 | |
|
|
|
|
| | | Total assets | | 31,003 | | 25,553 | |
|
|
|
|
| | | Current liabilities | | | | | | | Short-term borrowings | 32 | (3,504 | ) | (718 | ) | | Trade and other payables | 27 | (4,861 | ) | (4,831 | ) | | Derivative financial instruments | 41 | (262 | ) | (40 | ) | | Current tax payable | 14 | (826 | ) | (621 | ) | | Short-term provisions | 29 | (892 | ) | (1,055 | ) |
|
|
|
|
| | | Total current liabilities | | (10,345 | ) | (7,265 | ) |
|
|
|
|
| | | Non-current liabilities | | | | | | | Long-term borrowings | 32 | (7,067 | ) | (4,772 | ) | | Deferred tax liabilities | 14 | (887 | ) | (595 | ) | | Pensions and other post-employment benefits | 28 | (1,383 | ) | (2,339 | ) | | Other provisions | 29 | (1,035 | ) | (528 | ) | | Derivative financial instruments | 41 | (8 | ) | (60 | ) | | Other non-current liabilities | 30 | (368 | ) | (346 | ) |
|
|
|
|
| | | Total non-current liabilities | | (10,748 | ) | (8,640 | ) |
|
|
|
|
| | | Total liabilities | | (21,093 | ) | (15,905 | ) |
|
|
|
|
| | | Net assets | | 9,910 | | 9,648 | |
|
|
|
|
| | | Equity | | | | | | | Share capital | 33 | 1,503 | | 1,498 | | | Share premium account | 33 | 1,266 | | 858 | | | Retained earnings | 34 | 6,475 | | 6,965 | | | Other reserves | 34 | 359 | | 65 | |
|
|
|
|
| | | Shareholders’ equity | | 9,603 | | 9,386 | |
|
|
|
|
| | | Minority interests | 34 | 307 | | 262 | |
|
|
|
|
| | | Total equity | | 9,910 | | 9,648 | |
|
|
|
|
| |
Approved by the Board on 27th February 2008 Sir Christopher Gent
Chairman | GSK Annual Report 2007 | 91 | | |
Back to Contents | | | FINANCIALSTATEMENTS | | Consolidated cash flow statement of recognised income and expense | | | | | | | Consolidated cash flow statement | for the year ended 31st December 2006 |
2007 | | |
| | 2006 | | 2005 | | 2004 | | | | £m | | £m | | £m | |
|
|
|
|
|
| | | Exchange movements on overseas net assets | (390 | ) | 203 | | (47 | ) | | Tax on exchange movements | (78 | ) | 99 | | (73 | ) | | Fair value movements on available-for-sale investments | 84 | | (1 | ) | – | | | Deferred tax on fair value movements on available-for-sale investments | (15 | ) | (10 | ) | – | | | Exchange movements on goodwill in reserves | 31 | | 9 | | 6 | | | Actuarial gains/(losses) on defined benefit plans | 429 | | (794 | ) | 108 | | | Deferred tax on actuarial movements in defined benefit plans | (161 | ) | 257 | | (17 | ) | | Fair value movements on cash flow hedges | (5 | ) | (4 | ) | – | | | Deferred tax on fair value movements on cash flow hedges | 2 | | 1 | | – | |
|
|
|
|
|
| | | Net losses recognised directly in equity | (103 | ) | (240 | ) | (23 | ) | | Profit for the year | 5,498 | | 4,816 | | 4,022 | |
|
|
|
|
|
| | | Total recognised income and expense for the year | 5,395 | | 4,576 | | 3,999 | |
|
|
|
|
|
| | | | | Total recognised income and expense for the year attributable to: | | | | | | | | Shareholders | 5,307 | | 4,423 | | 3,906 | | | Minority interests | 88 | | 153 | | 93 | |
|
|
|
|
|
| | | | 5,395 | | 4,576 | | 3,999 | |
|
|
|
|
|
| |
| | | | 2007 | | 2006 | | 2005 | | | | Notes | | £m | | £m | | £m | |
|
| | | Cash flow from operating activities | | | | | | | | | | Cash generated from operations | 36 | | 8,080 | | 8,203 | | 7,665 | | | Taxation paid | | | (1,919 | ) | (3,846 | ) | (1,707 | ) |
|
| | | Net cash inflow from operating activities | | | 6,161 | | 4,357 | | 5,958 | |
|
| | | Cash flow from investing activities | | | | | | | | | | Purchase of property, plant and equipment | | | (1,516 | ) | (1,366 | ) | (903 | ) | | Proceeds from sale of property, plant and equipment | | | 35 | | 43 | | 54 | | | Proceeds from sale of intangible assets | | | 9 | | 175 | | 221 | | | Purchase of intangible assets | | | (627 | ) | (224 | ) | (278 | ) | | Purchase of equity investments | | | (186 | ) | (57 | ) | (23 | ) | | Proceeds from sale of equity investments | | | 45 | | 32 | | 35 | | | Share transactions with minority shareholders | 38 | | – | | (157 | ) | (36 | ) | | Purchase of businesses, net of cash acquired | 38 | | (1,027 | ) | (273 | ) | (1,026 | ) | | Disposal of businesses and interest in associates | 38 | | – | | 5 | | (2 | ) | | Investments in associates and joint ventures | 38 | | (1 | ) | (13 | ) | (2 | ) | | Interest received | | | 247 | | 299 | | 290 | | | Dividends from associates and joint ventures | | | 12 | | 15 | | 10 | |
|
| | | Net cash outflow from investing activities | | | (3,009 | ) | (1,521 | ) | (1,660 | ) |
|
| | | Cash flow from financing activities | | | | | | | | | | (Increase)/decrease in liquid investments | | | (39 | ) | (55 | ) | 550 | | | Proceeds from own shares for employee share options | | | 116 | | 151 | | 68 | | | Shares acquired by ESOP Trusts | | | (26 | ) | – | | – | | | Issue of share capital | 33 | | 417 | | 316 | | 252 | | | Purchase of own shares for cancellation | | | (213 | ) | – | | – | | | Purchase of Treasury shares | | | (3,538 | ) | (1,348 | ) | (999 | ) | | Increase in long-term loans | | | 3,483 | | – | | 982 | | | Repayment of long-term loans | | | (207 | ) | – | | (70 | ) | | Net increase in/(repayment of) short-term loans | | | 1,632 | | (739 | ) | (857 | ) | | Net repayment of obligations under finance leases | | | (39 | ) | (34 | ) | (36 | ) | | Interest paid | | | (378 | ) | (414 | ) | (381 | ) | | Dividends paid to shareholders | | | (2,793 | ) | (2,598 | ) | (2,390 | ) | | Dividends paid to minority interests | | | (77 | ) | (87 | ) | (86 | ) | | Other financing cash flows | | | (79 | ) | 16 | | 53 | |
|
| | | Net cash outflow from financing activities | | | (1,741 | ) | (4,792 | ) | (2,914 | ) |
|
| | | Increase/(decrease) in cash and bank overdrafts | 37 | | 1,411 | | (1,956 | ) | 1,384 | | | Exchange adjustments | | | 48 | | (254 | ) | 233 | | | Cash and bank overdrafts at beginning of year | | | 1,762 | | 3,972 | | 2,355 | |
|
| | | Cash and bank overdrafts at end of year | | | 3,221 | | 1,762 | | 3,972 | |
|
| | | Cash and bank overdrafts at end of year comprise: | | | | | | | | | | Cash and cash equivalents | | | 3,379 | | 2,005 | | 4,209 | | | Overdrafts | | | (158 | ) | (243 | ) | (237 | ) |
|
| | | | | | 3,221 | | 1,762 | | 3,972 | |
|
| | | | | |
| 92 | GSK Annual Report 2007 | | |
Back to Contents | | | FINANCIAL STATEMENTS | | | Consolidated statement of recognised income and expense | | | | | | | |
Consolidated statement of recognised income and expense | | for the year ended 31st December 2007 | |
| | 2007 | | 2006 | | 2005 | | | | £m | | £m | | £m | |
| | | Exchange movements on overseas net assets | 425 | | (390 | ) | 203 | | | Tax on exchange movements | 21 | | (78 | ) | 99 | | | Fair value movements on available-for-sale investments | (99 | ) | 84 | | (1 | ) | | Deferred tax on fair value movements on available-for-sale investments | 19 | | (15 | ) | (10 | ) | | Exchange movements on goodwill in reserves | (14 | ) | 31 | | 9 | | | Actuarial gains/(losses) on defined benefit plans | 671 | | 429 | | (794 | ) | | Deferred tax on actuarial movements in defined benefit plans | (195 | ) | (161 | ) | 257 | | | Fair value movements on cash flow hedges | (6 | ) | (5 | ) | (4 | ) | | Deferred tax on fair value movements on cash flow hedges | 2 | | 2 | | 1 | |
| | | Net profits/(losses) recognised directly in equity | 824 | | (103 | ) | (240 | ) | | Profit for the year | 5,310 | | 5,498 | | 4,816 | |
| | | Total recognised income and expense for the year | 6,134 | | 5,395 | | 4,576 | |
| | | Total recognised income and expense for the year attributable to: | | | | | | | | Shareholders | 6,012 | | 5,307 | | 4,423 | | | Minority interests | 122 | | 88 | | 153 | |
| | | | 6,134 | | 5,395 | | 4,576 | |
| | | | |
GSK Annual Report 20062007 | 93 | 89 | |
Back to Contents | | FINANCIAL STATEMENTS | | Notes to the financial statements |
| | | | | | Notes to the financial statements | | | |
1 Presentation of the financial statements Description of business
GlaxoSmithKline is a major global healthcare group which is engaged in the creation and discovery, development, manufacture and marketing of pharmaceutical products including vaccines, over-the-counter (OTC) medicines and health-related consumer products. GlaxoSmithKline’sGSK’s principal pharmaceutical products include medicines in the following therapeutic areas: respiratory, central nervous system, respiratory, anti-virals, anti-bacterials, metabolic, vaccines, cardiovascular and urogenital, anti-bacterial, oncology and emesis, metabolic, cardiovascular and urogenital.emesis. Compliance with applicable law and IFRS
The financial statements have been prepared in accordance with the Companies Act 1985, Article 4 of the IAS Regulation and International Accounting Standards (IAS) and International Financial Reporting Standards (IFRS) and related interpretations, as adopted by the European Union. For GSK, thereThe financial statements are no differences betweenalso in compliance with IFRS as adopted for use in the European Union and full IFRS as publishedissued by the International Accounting Standards Board.
Financial period
These financial statements cover the financial year from 1st January to 31st December 2006, with comparative figures for the financial years from 1st January to 31st December 2005 and, where appropriate, from 1st January to 31st December 2004.
Composition of the Group
A list of the subsidiary and associated undertakings which, in the opinion of the Directors, principally affected the amount of profit or the net assets of the Group is given in ‘Principal Group companies’, Note 42.
Composition of financial statements
The consolidated financial statements are drawn up in Sterling, the functional currency of GlaxoSmithKline plc, and in accordance with IFRS and with IFRS accounting presentation. The financial statements comprise: | • | Consolidated income statement | | • | Consolidated balance sheet | | • | Consolidated cash flow statement | | • | Consolidated statement of recognised income and expense | | • | Notes to the financial statements. |
Additional information in accordance with the requirements of US generally accepted accounting principles (US GAAP) is included in the notes to the financial statements. In Note 41 a statement of differences, and reconciliations of net income and shareholders’ equity, between IFRS and US GAAP are provided.
Accounting convention
The financial statements have been prepared using the historical cost convention, as modified forby the revaluation of certain items, carried at fair value, as stated in the accounting policies. Financial period
These financial statements cover the financial year from 1st January to 31st December 2007, with comparative figures for the financial years from 1st January to 31st December 2006 and, where appropriate, from 1st January to 31st December 2005. Composition of the Group
A list of the subsidiary and associated undertakings which, in the opinion of the Directors, principally affected the amount of profit or the net assets of the Group is given in Note 43, ‘Principal Group companies’. Presentation of business performance
A columnar presentation has been adopted in the income statement in order to illustrate underlying business performance. Business performance, which is a supplemental non-IFRS measure, is the primary performance measure used by management and is presented after excluding costs relating to the new Operational Excellence programme, which commenced in October 2007, and significant acquisitions. Management believes that exclusion of these items provides a better reflection of the way in which the business is managed and gives a more useful indication of the underlying performance of the Group. This information, which is provided in addition to the total results prepared under IFRS, is given to assist shareholders to gain a clearer understanding of the underlying performance of the business and to increase comparability for the periods presented. Accounting principles and policies
The preparation of the financial statements in conformity with generally accepted accounting principles requires management to make estimates and assumptions that affect the reported amounts of assets and liabilities and disclosure of contingent assets and liabilities at the date of the financial statements and the reported amounts of revenues and expenses during the reporting period. Actual results could differ from those estimates. The financial statements have been prepared in accordance with the Group’s accounting policies approved by the Board and described in Note 2. 2, Accounting policies ‘Accounting policies’. Information on the application of these accounting policies, including areas of estimation and judgement is given under ‘Critical in Note 3, ‘Key accounting judgements and estimates’. During 2007 the Group has implemented IFRS 7 ‘Financial instruments: disclosures’, which amends and adds to previous disclosures relating to financial instruments. 2 Accounting Policies’ in ‘Financial Review 2006’ on page 37.policies Consolidation
The consolidated financial statements include: | • | the assets and liabilities, and the results and cash flows, of thecompany and its subsidiaries, including ESOP Trusts | | | | | • | the Group’s share of the results and net assets of associates andjoint ventures. |
The financial statements of entities consolidated are made up to 31st December.December each year. Entities over which the Group has the power to govern the financial and operating policies are accounted for as subsidiaries. Where the Group has the ability to exercise joint control, the entities are accounted for as joint ventures, and where the Group has the ability to exercise significant influence, they are accounted for as associates. The results and assets and liabilities of associates and joint ventures are incorporated into the consolidated financial statements using the equity method of accounting. Interests acquired in entities are consolidated from the date the Group acquires control and interests sold are de-consolidated from the date control ceases. Transactions and balances between subsidiaries are eliminated; no profit before tax is taken on sales between subsidiaries or on sales to joint ventures and associates until the products are sold to customers outside the Group. Deferred tax relief on unrealised intra-Group profit is accounted for only to the extent that it is considered recoverable. Goodwill arising on the acquisition of interests in subsidiaries, joint ventures and associates, representing the excess of the acquisition cost over the Group’s share of the fair values of the identifiable assets, liabilities and contingent liabilities acquired, is capitalised as a separate item in the case of subsidiaries and as part of the cost of investment in the case of joint ventures and associates. Goodwill is denominated in the currency of the operation acquired. Where the cost of acquisition is below the fair value of the net assets acquired, the difference is recognised directly in the income statement. The results and assets and liabilities of associates and joint ventures are incorporated into the consolidated financial statements using the equity method of accounting.
| 94 |
| GSK Annual Report 20062007 | 90 | |
<Back to Contents | | | Notes to the financial statements | | | | | | | | Notes to the financial statements | | continued |
| | |
2 Accounting policiescontinued Foreign currency translation
Foreign currency transactions are booked in the functional currency of the Group company at the exchange rate ruling on the date of transaction. Foreign currency monetary assets and liabilities are retranslated into localthe functional currency at rates of exchange ruling at the balance sheet date. Exchange differences are included in the income statement. AssetsOn consolidation, assets and liabilities, including related goodwill, of overseas subsidiaries, associates and joint ventures, are translated into Sterling at rates of exchange ruling at the balance sheet date. The results and cash flows of overseas subsidiaries, associates and joint ventures are translated into Sterling using average rates of exchange. Exchange adjustments arising when the opening net assets and the profits for the year retained by overseas subsidiaries, associates and joint ventures are translated into Sterling, less exchange differences arising on related foreign currency borrowings which hedge the Group’s net investment in these operations, are taken to a separate component of equity.
When translating into Sterling the assets, liabilities, results and cash flows of overseas subsidiaries, associates and joint ventures which are reported in currencies of hyper-inflationary economies, adjustments are made to reflect current price levels. Any loss on net monetary assets is charged to the consolidated income statement. Revenue
Revenue is recognised in the income statement when goods or services are supplied or made available to external customers against orders received, and when title and risk of loss passesis passed to the customer.customer, and reliable estimates can be made of relevant deductions. Turnover represents net invoice value after the deduction of discounts and allowances given and accruals for estimated future rebates and returns. The methodology and assumptions used to estimate rebates and returns are monitored and adjusted regularly in the light of contractual and legal obligations, historical trends, past experience and projected market conditions. Market conditions are evaluated using wholesaler and other third-party analyses, market research data and internally generated information. Turnover also includes co-promotion income where the Group records its share of the revenue but no related cost of sales. Value added tax and other sales taxes are excluded from revenue. Expenditure
Expenditure is recognised in respect of goods and services received when supplied in accordance with contractual terms. Provision is made when an obligation exists for a future liability in respect of a past event and where the amount of the obligation can be reliably estimated. Manufacturing start-up costs between validation and the achievement of normal production are expensed as incurred. Advertising and promotion expenditure is charged to the income statement as incurred. Shipment costs on intercompany transfers are charged to cost of sales; distribution costs on sales to customers are included in selling, general and administrative expenditure. Restructuring costs are recognised and provided for, where appropriate, in respect of the direct expenditure of a business reorganisation where the plans are sufficiently detailed and well advanced, and where appropriate communication to those affected has been undertaken. Research and development
Research and development expenditure is charged to the income statement in the period in which it is incurred. Development expenditure is capitalised when the criteria for recognising an asset are met, usually when a regulatory filing has been made in a major market and approval is considered highly probable. Property, plant and equipment used for research and development is depreciated in accordance with the Group’s policy. Environmental expenditure
Environmental expenditure related to existing conditions resulting from past or current operations and from which no current or future benefit is discernible is charged to the income statement. The Group recognises its liability on a site-by-site basis when it can be reliably estimated. This liability includes the Group’s portion of the total costs and also a portion of other potentially responsible parties’ costs when it is probable that they will not be able to satisfy their respective shares of the clean-up obligation. Recoveries of reimbursements are recorded as assets when virtually certain. Legal and other disputes
Provision is made for the anticipated settlement costs of legal or other disputes against the Group where an outflow of resources is considered probable and a reasonable estimate can be made of the likely outcome of legal or other disputes against the Group.outcome. In addition, provision is made for legal or other expenses arising from claims received or other disputes. In respect of product liability claims related to products where there is sufficient history of claims made and settlements, an “incurred but not reported” (IBNR) actuarial technique is used to determine a reasonable estimate of the Group’s exposure to unasserted claims for those products and a provision is made on that basis. No provision is made for other unasserted claims or where an obligation exists under a dispute but it is not possible to make a reasonable estimate. Costs associated with claims made by the Group against third parties are charged to the income statement as they are incurred. Pensions and other post-employment benefits
The costs of providing pensions under defined benefit schemes are calculated using the projected unit credit method and spread over the period during which benefit is expected to be derived from the employees’ services, in accordance with the advice of qualified actuaries. Pension obligations are measured as the present value of estimated future cash flows discounted at rates reflecting the yields of high quality corporate bonds. Pension scheme assets are measured at fair value at the balance sheet date. Actuarial gains and losses, differences between the expected and actual returns of assets and the effect of changes in actuarial assumptions, are recognised in the statement of recognised income and expense in the year in which they arise. The Group’s contributions to defined contribution plans are charged to the income statement as incurred. The costs of other post-employment liabilities are calculated in a similar way to defined benefit pension schemes and spread over the period during which benefit is expected to be derived from the employees’ services, in accordance with the advice of qualified actuaries.
|
| GSK Annual Report 20062007 | 95 | 91 | |
<Back to Contents | | FINANCIAL STATEMENTS | | Notes to the financial statements | continued | |
| | | | | Notes to the financial statements | | continued | | |
2 Accounting policiescontinued Employee share plans
Incentives in the form of shares are provided to employees under share option and share award schemes. These The fair values of these options and awards are fair valuedcalculated at their grant dates using a Black-Scholes option pricing model and the cost is charged to the income statement over the relevant vesting periods. This has been applied on a fully retrospective basis. The Group provides finance to ESOP Trusts to purchase company shares on the open market to meet the obligation to provide shares when employees exercise their options or awards. Costs of running the ESOP Trusts are charged to the income statement. Shares held by the ESOP Trusts are deducted from other reserves. A transfer is made between other reserves and retained earnings over the vesting periods of the related share options or awards to reflect the ultimate proceeds receivable from employees on exercise. If there is deemed to be a permanent impairment in value this is also reflected by a transfer to retained earnings. Property, plant and equipment
Property, plant and equipment (PP&E) is stated at the cost of purchase or construction less provisions for depreciation and impairment. Financing costs are not capitalised. Depreciation is calculated to write off the cost less residual value of PP&E, excluding freehold land, using the straight-line basis over the expected useful life. Residual values and lives are reviewed, and where appropriate adjusted, annually. The normal expected useful lives of the major categories of PP&E are:
|
| | Freehold buildings | 20 to 50 years | | Leasehold land and buildings | Lease term or 20 to 50 years | | Plant and machinery | 10 to 20 years | | Fixtures and equipment | 3 to 10 years |
|
|
On disposal of PP&E, the cost and related accumulated depreciation and impairments are removed from the financial statements and the net amount, less any proceeds, is taken to the income statement. Leases
Leasing agreements which transfer to the Group substantially all the benefits and risks of ownership of an asset are treated as finance leases, as if the asset had been purchased outright. The assets are included in PP&E or computer software and the capital elements of the leasing commitments are shown as obligations under finance leases. Assets held under finance leases are depreciated on a basis consistent with similar owned assets or the lease term if shorter. The interest element of the lease rental is included in the income statement. All other leases are operating leases and the annual rentalsrental costs are included incharged to the income statement on a straight-line basis over the lease term. Goodwill
Goodwill is stated at cost less impairments. Goodwill is deemed to have an indefinite useful life and is tested for impairment annually. Where the fair value of the interest acquired in an entity’s assets, liabilities and contingent liabilities exceeds the consideration paid, this excess is recognised immediately as a gain in the income statement. Other intangible assets
Intangible assets are stated at cost less provisions for amortisation and impairments. Licences, patents, know-how and marketing rights separately acquired or acquired as part of a business combination are amortised over their estimated useful lives, using the straight-line basis, from the time they are available for use. The estimated useful lives for determining the amortisation charge are reviewed annually, and take into account patent lives, where applicable, as well as the estimated time it takes to bring the compounds or products to market.value obtained from periods of non-exclusivity. Asset lives are reviewed, and where appropriate adjusted, annually. Any development costs incurred by the Group and associated with acquired licences, patents, know-how or marketing rights are written off to the income statement when incurred, unless the criteria for recognition of an internally generated intangible asset are met, usually when a regulatory filing has been made in a major market and approval is considered highly probable. BrandsAcquired brands are valued independently as part of the fair value of businesses acquired from third parties where the brand has a value which is substantial and long-term and where the brands can be sold separately from the rest of the businesses acquired. Brands are amortised over their estimated useful lives, except where it is considered that the useful economic life is indefinite.
The costs of acquiring and developing computer software for internal use and internet sites for external use are capitalised as intangible fixed assets where the software or site supports a significant business system and the expenditure leads to the creation of a durable asset. ERP systems software is amortised over seven years and other computer software over three to five years. Impairment of non-current assets
The carrying values of all non-current assets are reviewed for impairment when there is an indication that the assets might be impaired. Additionally, goodwill, intangible assets with indefinite useful lives and intangible assets which are not yet available for use are tested for impairment annually. Any provision for impairment is charged to the income statement in the year concerned. Investments in associates and joint ventures
Investments in associates and joint ventures are carried in the consolidated balance sheet at the Group’s share of their net assets at date of acquisition and of their post-acquisition retained profits or losses together with any goodwill arising on the acquisition.
| 96 |
| GSK Annual Report 20062007 | 92 | |
<Back to Contents | | | Notes to the financial statements | | | | | | | | | Notes to the financial statements | | continued |
| | |
2 Accounting policiescontinued Available-for-sale investments
Liquid investments and other investments are treatedclassified as available-for-sale investments and are initially recorded at costfair value plus transaction costs and then remeasured at subsequent reporting dates to fair value. Unrealised gains and losses on available-for-sale investments are recognised directly in equity. Impairments arising from the significant or prolonged decline in fair value of an investment reduce the carrying amount of the asset directly and are charged to the income statement. On disposal or impairment of the investments, theany gains and losses that have been deferred in equity are recycled into the income statement. Dividends on equity investments are recognised in the income statement when the Group’s right to receive payment is established. Equity investments are recorded in non-current assets unless they are expected to be sold within one year. Purchases and sales of equity investments are accounted for on the trade date and purchases and sales of other available-for-sale investments are accounted for on settlement date. In 2004 equity investments are recorded at cost.
Inventories
Inventories are included in the financial statements at the lower of cost (including raw materials, direct labour, other direct costs and related production overheads) and net realisable value. Cost is generally determined on a first in, first out basis. Pre-launch inventory is held as an asset when there is a high probability of regulatory approval for the product. Before that point a provision is made against the carrying value to its recoverable amount, whichamount; the provision is then reversed at the point when a high probability of regulatory approval is determined. Trade receivables
Trade receivables are carried at original invoice amount less any provisions for doubtful debts. Provisions are made where there is evidence of a risk of non-payment, taking into account ageing, previous experience and general economic conditions. ReceivablesWhen a trade receivable is determined to be uncollectable it is written off, firstly against any provision available and then to the income statement. Subsequent recoveries of amounts previously provided for are credited to the income statement. Long-term receivables are discounted where the effect is material. Trade payables
Trade payables are held at amortised cost which equates to nominal value. Long-term payables are discounted where the effect is material. Cash and cash equivalents
Cash and cash equivalents comprise cash in hand, current balances with banks and similar institutions and highly liquid investments with original maturities of three months or less when acquired.less. They are readily convertible into known amounts of cash and have an insignificant risk of changes in value. Taxation
Current tax is provided at the amounts expected to be paid applying tax rates that have been enacted or substantively enacted by the balance sheet date. Deferred tax is provided in full, using the liability method, on temporary differences arising between the tax bases of assets and liabilities and their carrying amounts in the financial statements. Deferred tax assets are recognised to the extent that it is probable that future taxable profits will be available against which the temporary differences can be utilised. Deferred tax is provided on temporary differences arising on investments in subsidiaries, associates and joint ventures, except where the timing of the reversal of the temporary difference can be controlled and it is probable that the temporary difference will not reverse in the foreseeable future. Deferred tax is provided using rates of tax that have been enacted or substantively enacted by the balance sheet date. Deferred tax liabilities and assets are not discounted. Discounting
Where the time effect of money is material, balances are discounted to current values using appropriate rates of interest. The unwinding of the discounts is recorded in finance income/costs.
Derivative financial instruments and hedging (2006 and 2005)
Derivative financial instruments are used to manage exposure to market risks from treasury operations. The principal derivative instruments used by GlaxoSmithKline are foreign currency swaps, interest rate swaps and forward foreign exchange contracts. The Group does not hold or issue derivative financial instruments for trading or speculative purposes. Derivative financial instruments are initially recognisedclassified as held-for-trading and are carried in the balance sheet at cost and then remeasured at subsequent reporting dates to fair value. Derivatives designated as hedging instruments are classified on inception as fair value hedges, cash flow hedges, or net investment hedges. Changes in thehedges or fair value of derivatives designated as fair value hedges are recorded in the income statement, with the changes in the fair value of the hedged asset or liability.hedges. Changes in the fair value of derivatives designated as cash flow hedges are recognised in equity, to the extent that the hedges are effective. Ineffective portions are recognised in profit or loss immediately. Amounts deferred in equity are recycled to the income statement when the hedged item affects profit or loss. Hedges of net investments in foreign entitiesNet investment hedges are accounted for in a similar way to cash flow hedges.
Changes in the fair value of derivatives designated as fair value hedges are recorded in the income statement, together with the changes in the fair value of the hedged asset or liability. Changes in the fair value of any derivative instruments that do not qualify for hedge accounting are recognised immediately in the income statement. Derivative financial instruments and hedging (2004 )Discounting
IAS 32 and 39 were adopted byWhere the Group on 1st January 2005. In accordance with an exemption permitted under IFRS I, the 2004 information relatingtime effect of money is material, balances are discounted to financial instruments remains as reported under UK GAAP and applying the following policies.
Derivative contracts are treated from inception as an economic hedgecurrent values using appropriate rates of interest. The unwinding of the underlying financial instrument with matching accounting treatment and cash flows. Derivative instruments no longer designated as hedges are restated at market value and any future changesdiscounts is recorded in value are taken directly to the profit and loss account.
Currency swaps and forward exchange contracts used to fix the value of the related asset or liability in the contract currency and at the contract rate are accrued to the profit and loss account over the life of the contract.
Gains and losses on foreign exchange contracts designated as hedges of forecast foreign exchange transactions are deferred and included in the measurement of the related foreign currency transactions in the period they occur. Gains and losses on balance sheet hedges are accrued and are taken directly to reserves except that forward premiums/discounts are recognised as interest over the life of the contracts.
Interest differentials under interest swap agreements are recognised in the profit and loss account by adjustment of interest expense over the life of the agreement.finance income/costs.
|
| GSK Annual Report 20062007 | 97 | 93 | |
Back to Contents | | | | FINANCIAL STATEMENTS | | Notes to the financial statements | | | | | | | | Notes to the financial statements | | continued | |
3 Key accounting judgements and estimates In preparing the financial statements, management is required to make estimates and assumptions that affect the amounts of assets, liabilities, revenue and expenses reported in the financial statements. Actual amounts and results could differ from those estimates. The following are considered to be the key accounting judgements and estimates made. Turnover
Revenue is recognised when title and risk of loss is passed to the customer and reliable estimates can be made of relevant deductions. Gross turnover is reduced by rebates, discounts, allowances and product returns given or expected to be given, which vary by product arrangements and buying groups. These arrangements with purchasing organisations are dependent upon the submission of claims some time after the initial recognition of the sale. Accruals are made at the time of sale for the estimated rebates, discounts or allowances payable or returns to be made, based on available market information and historical experience. Because the amounts are estimated they may not fully reflect the final outcome, and the amounts are subject to change dependent upon, amongst other things, the types of buying group and product sales mix. The level of accrual is reviewed and adjusted regularly in the light of contractual and legal obligations, historical trends, past experience and projected market conditions. Market conditions are evaluated using wholesaler and other third-party analyses, market research data and internally generated information. Future events could cause the assumptions on which the accruals are based to change, which could affect the future results of the Group. Where the Group co-promotes a product and the third party records the sale, the Group records its share of revenue as co-promotion income within turnover. The nature of co-promotion activities is such that the Group records no costs of sales. Pharmaceutical turnover includes co-promotion revenue of £274 million (2006 – £182 million, 2005 – £112 million). Taxation
Current tax is provided at the amounts expected to be paid, and deferred tax is provided on temporary differences between the tax bases of assets and liabilities and their carrying amounts, at the rates that have been enacted or substantively enacted by the balance sheet date. The Group has open tax issues with a number of revenue authorities. GSK uses the best advice in determining its transfer pricing methodology and in seeking to manage transfer pricing issues to a satisfactory conclusion and, on the basis of external professional advice, continues to believe that it has made adequate provision for the liabilities likely to arise from open assessments. Where open issues exist the ultimate liability for such matters may vary from the amounts provided and is dependent upon the outcome of negotiations with the relevant tax authorities or, if necessary, litigation proceedings. Legal and other disputes
GSK provides for anticipated settlement costs where a reasonable estimate may be made of the likely outcome of the dispute and legal and other expenses arising from claims against the Group. The company’s Directors, having taken legal advice, have established provisions after taking into account the relevant facts and circumstances of each matter and in accordance with accounting requirements. Provisions for product liability claims on certain products have been made on an ‘incurred but not reported’ basis where sufficient history of claims made and settlements is available. No provisions have been made for other unasserted claims or for claims for which no reasonable estimate of the likely outcome can yet be made. The ultimate liability for pending and unasserted claims may vary from the amounts provided, if any, and is dependent upon the outcome of litigation proceedings, investigations and possible settlement negotiations. Property, plant and equipment
The carrying values of property, plant and equipment are reviewed for impairment when there is an indication that the values of the assets might be impaired. Impairment is determined by reference to the higher of fair value less costs to sell and value in use, measured by assessing risk-adjusted future cash flows discounted using appropriate interest rates. These future cash flows are based on business forecasts and are therefore inherently judgemental. Future events could cause the assumptions used in these impairment reviews to change with a consequent adverse effect on the future results of the Group. Intangible assets
Where intangible assets are acquired by GSK from third parties the costs of acquisition are capitalised. Licences to compounds in development are amortised from the point at which they are available for use, over their estimated useful lives, which may include periods of non-exclusivity. Estimated useful lives are reviewed annually and impairment tests are undertaken if events occur which call into question the carrying values of the assets. Brands acquired with businesses are capitalised independently where they are separable and have an expected life of more than one year. Brands are amortised over their estimated useful lives, not exceeding 20 years, except where the end of the useful economic life cannot be foreseen. Where brands are not amortised, they are subject to annual impairment tests. Impairment tests are based on risk-adjusted future cash flows discounted using appropriate interest rates. These future cash flows are based on business forecasts and are therefore inherently judgemental. Future events could cause the values of these intangible assets to be impaired and this would have an adverse effect on the future results of the Group. Pensions and other post-employment benefits
The costs of providing pensions and other post-employment benefits are charged to the income statement in accordance with IAS 19 over the period during which benefit is derived from the employee’s services. The costs are assessed in accordance with advice received from independent actuaries on the basis of assumptions selected by management. These assumptions include future earnings and pension increases, discount rates and expected long term rates of return on assets and are disclosed in Note 28, ‘Pensions and other post-employment benefits’. The expected long term rates of return on bonds are determined based on the portfolio mix of index-linked, government and corporate bonds. An equity risk premium is added to this for equities.
| 98 | GSK Annual Report 2007 | | |
Back to Contents | | | FINANCIAL STATEMENTS | | | Notes to the financial statements | | | | | | | | Notes to the financial statements | | continued |
| | |
3 Key accounting judgements and estimates continued Discount rates are based on appropriate long-term indices, including the iBoxx over 15 year AA index for the UK, and Moody’s Aa index for the USA. Sensitivity analysis is provided in Note 28, ‘Pensions and other post-employment benefits’, but a 0.25% reduction in the discount rate would lead to an increase in the net pension deficit of approximately £374 million and an increase in the annual pension cost of approximately £8 million. The selection of different assumptions could affect the future results of the Group. 34 New accounting requirements
The following IFRS and IFRIC interpretations have been issued by the IASB and are likely to affect future Annual Reports, although none is expected to have a material impact on the results or financial position of the Group. IFRS 7 ‘Financial instruments: disclosures’IFRIC11 ‘IFRS 2 – Group and treasury share transactions’ was issued in August 2005November 2006 and is required to be implemented by GSK from 1st January 2007.2008. This new standard incorporates the disclosureinterpretation provides guidance on whether share-based transactions involving group entities should be accounted for as equity settled or cash settled transactions.
IFRIC 14 ‘IAS 19 – The limit on a defined benefit asset, minimum funding requirements of IAS 32, which it supersedes, and adds further quantitative and qualitative disclosures in relation to financial instruments. Amendment to IAS 1 ‘Capital disclosures’their interaction’ was issued in August 2005July 2007 and is required towill be implemented by GSKeffective from 1st January 2007.2008. The amendment requires new disclosures about howInterpretation provides general guidance on the amount of a pension surplus that may be recognised as an entity manages its capital resources.asset.
IFRS 8 ‘Operating segments’ was issued in November 2006 and is required to be implemented by GSK from 1st January 2009. This standard replaces IAS 14 and aligns the segmental reporting requirements with those of the equivalent US standard. The new standard adopts a ‘management approach’ under which segmental information is to be disclosed on the same basis as that used for internal reporting purposes. IFRIC 9 ‘Reassessment of embedded derivatives’IAS 23 (Revised) ‘Borrowing costs’ was issued in March 20062007 and is required towill be implemented by GSKprospectively from 1st January 2007. This interpretation clarifies that an embedded derivative should2009. It requires borrowing costs attributable to the acquisition or construction of certain assets to be assessed on its inception and only reassessed if there is a change in the termscapitalised. The option currently taken by GSK of the relevant contract.expensing such costs as incurred will no longer be available.
IFRIC 10 ‘InterimIAS 1 (Revised) ‘Presentation of financial reporting and impairment’statements’ was issued in July 2006September 2007 and is required towill be implemented by GSKeffective from 1st January 2007. Under this interpretation any impairment losses on goodwill2009. The amendments to the Standard mandate various presentation formats and disclosures, many of which are already adopted by GSK. Movements in equity investments recognisedwill be presented in a quarterly interim statement may not be reversedStatement of changes in subsequent interim or annualequity rather than as a Note to the financial statements.
IFRIC 11 ‘IFRSAn amendment to IFRS 2 - Group‘Share-based payment’ relating to vesting conditions and treasury share transactions’cancellations was issued in November 2006 and is required to be implemented by GSKJanuary 2008. The amendment will apply retrospectively from 1st January 2008. This interpretation provides guidance on whether2009 and specifies that all cancellations of share-based transactions involving group entitiespayment arrangements, including those by an employee or other counterparty, should be accounted for as equity settled or cash settled transactions.receive the same accounting treatment of requiring immediate recognition in the income statement of the charge that would otherwise have been recognised over the remainder of the service period.
IFRS 3 (Revised) ‘Business combinations’ was issued in January 2008 and will apply to business combinations arising from 1st January 2010. Amongst other changes, the new Standard will require recognition of subsequent changes in the fair value of contingent consideration in the income statement rather than against goodwill, and transaction costs to be recognised immediately in the income statement. Fair value gains or losses on existing investments in an acquired company will be recognised in the income statement at the date of acquisition. IAS 27 (Revised) ‘Consolidated and separate financial statements’ was issued in January 2008 and will be implemented at the same time as IFRS 3 (Revised). In respect of transactions with non-controlling interests in Group entities that do not result in a change of control, the revised Standard requires that the difference between the consideration paid or received and the recorded non-controlling interest is recognised in equity. In the case of divestment of a subsidiary, any retained interest will be remeasured to fair value and the difference between fair value and the previous carrying value will be recognised immediately in the income statement. IFRS 3 (Revised) and IAS 27 (Revised) will both be applied prospectively to transactions occurring after the implementation date. It is therefore not possible to assess in advance their impact on the financial statements of the Group. 45 Exchange rates
The Group uses the average of exchange rates prevailing during the period to translate the results and cash flows of overseas subsidiaries, joint ventures and associated undertakings into Sterling and period end rates to translate the net assets of those undertakings. The currencies which most influence these translations and the relevant exchange rates were: | | | 2006 | | 2005 | | 2004 | | 2007 | | 2006 | | 2005 | |
|
| |
| | | Average rates: | | | | | | | | | | | | | | £/US$ | | 1.85 | | 1.82 | | 1.83 | | 2.00 | | 1.85 | | 1.82 | | | £/Euro | | 1.47 | | 1.46 | | 1.47 | | 1.46 | | 1.47 | | 1.46 | | | £/Yen | | 215 | | 200 | | 197 | | 235 | | 215 | | 200 | | | Period end rates: | | | | | | | | | | | | | | £/US$ | | 1.96 | | 1.72 | | 1.92 | | 1.99 | | 1.96 | | 1.72 | | | £/Euro | | 1.48 | | 1.46 | | 1.41 | | 1.36 | | 1.48 | | 1.46 | | | £/Yen | | 233 | | 203 | | 197 | | 222 | | 233 | | 203 | |
|
| |
| |
| GSK Annual Report 2007 | 99 | | |
Back to Contents | | | FINANCIAL STATEMENTS | | Notes to the financial statements | | | | | | | Notes to the financial statements | | continued | |
56 Segment information
The Group’s primary segment reporting is by business sector with geographical reporting being the secondary format. The business sectors consist of Pharmaceuticals (prescription pharmaceuticals and vaccines) and Consumer Healthcare (oral care, OTC medicines and nutritional healthcare). The geographical sectors of the USA, Europe and International (other Rest of World markets) reflect the Group’s most significant regional markets and are consistent with the Group’s regional market management reporting structure. Business sector data includes an allocation of corporate costs to each sector on an appropriate basis. There are no sales between business sectors.Thesectors. The Group’s activities are organised on a global basis. The geographical sector figures are therefore influenced by the location of the Group’s operating resources, in particular manufacturing and research, and by variations over time in intra-Group trading and funding arrangements. Turnover is shown by business sector, by location of customer and by location of subsidiary. Operating profit is shown by business sector and by location of subsidiary. Other geographic information is given by location of subsidiary. The UK segment information gives turnover by location of customer and location of subsidiary. The UK operating profit, total assets and net assets are also shown. Where the Group co-promotes a product and the third party records the sale, the Group records its share of revenue as co-promotion income within turnover. The nature of co-promotion activities is such that the Group records no costs of sales. Pharmaceutical turnover includes co-promotion revenue of £182 million (2005 –£112 million, 2004 – £65 million).
| | 2007 | | 2006 | | 2005 | | | Turnover by business sector | £m | | £m | | £m | |
| | | Pharmaceuticals | 19,233 | | 20,078 | | 18,661 | | | Consumer Healthcare | 3,483 | | 3,147 | | 2,999 | |
| | | Turnover | 22,716 | | 23,225 | | 21,660 | |
| | | Profit by business sector | | | | | | |
| | | Pharmaceuticals | 6,857 | | 7,125 | | 6,159 | | | Consumer Healthcare | 736 | | 683 | | 715 | |
| | | Operating profit | 7,593 | | 7,808 | | 6,874 | | | Finance income | 262 | | 287 | | 257 | | | Finance costs | (453 | ) | (352 | ) | (451 | ) | | Share of after tax profits of associates and joint ventures: | | | | | | | | Pharmaceuticals | 50 | | 56 | | 52 | | | Consumer Healthcare | – | | – | | – | |
| | | Profit before taxation | 7,452 | | 7,799 | | 6,732 | | | Taxation | (2,142 | ) | (2,301 | ) | (1,916 | ) |
| | | Profit after taxation for the year | 5,310 | | 5,498 | | 4,816 | |
| | | Investments in associates and joint ventures by business sector | | | | | | |
| | | | | Pharmaceuticals | 329 | | 295 | | | | | Consumer Healthcare | – | | – | | | |
| | | | | Investment in associates and joint ventures | 329 | | 295 | | | |
| | | | | Property, plant and equipment and other intangible assets by business sector | | | | | | |
| | | | | Additions | | | | | | | | Pharmaceuticals | 2,567 | | 1,795 | | | | | Consumer Healthcare | 322 | | 139 | | | |
| | | | | Total additions | 2,889 | | 1,934 | | | |
| | | | | Depreciation/amortisation | | | | | | | | Pharmaceuticals | (934 | ) | (849 | ) | | | | Consumer Healthcare | (88 | ) | (109 | ) | | |
| | | | | Total depreciation/amortisation | (1,022 | ) | (958 | ) | | |
| | | | | Impairment | | | | | | | | Pharmaceuticals | (216 | ) | (241 | ) | | | | Consumer Healthcare | (2 | ) | (3 | ) | | |
| | | | | Total impairment | (218 | ) | (244 | ) | | |
| | | | | Impairment reversal | | | | | | | | Pharmaceuticals | 67 | | 61 | | | | | Consumer Healthcare | – | | – | | | |
| | | | | Total impairment reversal | 67 | | 61 | | | |
| | | | | | | | |
| 100 |
| GSK Annual Report 20062007 | 94 | |
<Back to Contents | | | Notes to the financial statements | | | | | | | | Notes to the financial statements | | continued |
|
56 Segment informationcontinued
| Turnover by business sector | 2006 | | 2005 | | 2004 | | | £m | £m | £m |
|
|
|
|
|
| | | Pharmaceuticals | 20,078 | | 18,661 | | 17,100 | | | Consumer Healthcare | 3,147 | | 2,999 | | 2,886 | |
|
|
|
|
|
| | | Turnover | 23,225 | | 21,660 | | 19,986 | |
|
|
|
|
|
| | | Profit by business sector | | | | | | |
|
|
|
|
|
| | | Pharmaceuticals | 7,125 | | 6,159 | | 5,126 | | | Consumer Healthcare | 683 | | 715 | | 630 | |
|
|
|
|
|
| | | Operating profit | 7,808 | | 6,874 | | 5,756 | |
|
|
|
|
|
| | | Finance income | 287 | | 257 | | 176 | | | Finance costs | (352 | ) | (451 | ) | (362 | ) | | Share of after tax profits of associates and joint ventures: | | | | | | | | Pharmaceuticals | 56 | | 52 | | 60 | | | Consumer Healthcare | – | | – | | – | | | Profit on disposal of interest in associates | – | | – | | 149 | |
|
|
|
|
|
| | | Profit before taxation | 7,799 | | 6,732 | | 5,779 | |
|
|
|
|
|
| | | Taxation | (2,301 | ) | (1,916 | ) | (1,757 | ) |
|
|
|
|
|
| | | Profit after taxation for the year | 5,498 | | 4,816 | | 4,022 | |
|
|
|
|
|
| | | Investments in associates and joint ventures by business sector | | | | | | |
|
|
|
| | | | | Pharmaceuticals | 295 | | 276 | | | | | Consumer Healthcare | – | | – | | | |
|
|
|
| | | | | Investment in associates and joint ventures | 295 | | 276 | | | |
|
|
|
| | | | | Property, plant and equipment and other intangible assets by business sector | | | | | | |
|
|
|
| | | | | Additions | | | | | | | | Pharmaceuticals | 1,795 | | 2,031 | | | | | Consumer Healthcare | 139 | | 164 | | | |
|
|
|
| | | | | Total additions | 1,934 | | 2,195 | | | |
|
|
|
| | | | | Depreciation/amortisation | | | | | | | | Pharmaceuticals | (849 | ) | (807 | ) | | | | Consumer Healthcare | (109 | ) | (97 | ) | | |
|
|
|
| | | | | Total depreciation/amortisation | (958 | ) | (904 | ) | | |
|
|
|
| | | | | Impairment | | | | | | | | Pharmaceuticals | (241 | ) | (92 | ) | | | | Consumer Healthcare | (3 | ) | – | | | |
|
|
|
| | | | | Total impairment | (244 | ) | (92 | ) | | |
|
|
|
| | | | | Impairment reversal | | | | | | | | Pharmaceuticals | 61 | | 3 | | | | | Consumer Healthcare | – | | – | | | |
|
|
|
| | | | | Total impairment reversal | 61 | | 3 | | | |
|
|
|
| | | |
| | 2007 | | 2006 | | | | | Total assets by business sector | £m | | £m | | | |
| | | | | Pharmaceuticals | 20,231 | | 16,936 | | | | | Consumer Healthcare | 3,177 | | 2,768 | | | |
| | | | | Total operating assets | 23,408 | | 19,704 | | | | | Investments in associates and joint ventures | 329 | | 295 | | | | | Liquid investments | 1,153 | | 1,035 | | | | | Derivative financial instruments | 476 | | 193 | | | | | Cash and cash equivalents | 3,379 | | 2,005 | | | | | Current and deferred taxation | 2,254 | | 2,309 | | | | | Tangible assets held for sale | 4 | | 12 | | | |
| | | | | Total assets | 31,003 | | 25,553 | | | |
| | | | | Total liabilities by business sector | | | | | | |
| | | | | Pharmaceuticals | (7,651 | ) | (8,148 | ) | | | | Consumer Healthcare | (888 | ) | (951 | ) | | |
| | | | | Total operating liabilities | (8,539 | ) | (9,099 | ) | | | | Short-term borrowings | (3,504 | ) | (718 | ) | | | | Long-term borrowings | (7,067 | ) | (4,772 | ) | | | | Derivative financial instruments | (270 | ) | (100 | ) | | | | Current and deferred taxation | (1,713 | ) | (1,216 | ) | | |
| | | | | Total liabilities | (21,093 | ) | (15,905 | ) | | |
| | | | | Net assets by business sector | | | | | | |
| | | | | Pharmaceuticals | 12,580 | | 8,788 | | | | | Consumer Healthcare | 2,289 | | 1,817 | | | |
| | | | | Net operating assets | 14,869 | | 10,605 | | | | | Net debt | (6,039 | ) | (2,450 | ) | | | | Investments in associates and joint ventures | 329 | | 295 | | | | | Derivative financial instruments | 206 | | 93 | | | | | Current and deferred taxation | 541 | | 1,093 | | | | | Tangible assets held for sale | 4 | | 12 | | | |
| | | | | Net assets | 9,910 | | 9,648 | | | |
| | | |
| | | | | | | | | | 2007 | | 2006 | | 2005 | | | Turnover by location of customer | £m | | £m | | £m | |
| | | USA | 10,168 | | 11,102 | | 9,867 | | | Europe | 7,239 | | 7,010 | | 6,892 | | | International | 5,309 | | 5,113 | | 4,901 | |
| | | Turnover | 22,716 | | 23,225 | | 21,660 | |
| | | | |
|
| GSK Annual Report 20062007 | 101 | 95 | |
<Back to Contents
| Notes to the financial statements | continued |
|
5 Segment informationcontinued
| Total assets by business sector | 2006 | | 2005 | | | | | £m | £m | |
|
|
|
| | | | | Pharmaceuticals | 16,936 | | 16,431 | | | | | Consumer Healthcare | 2,768 | | 2,446 | | | |
|
|
|
| | | | | Total operating assets | 19,704 | | 18,877 | | | |
|
|
|
| | | | | Investments in associates and joint ventures | 295 | | 276 | | | | | Liquid investments | 1,035 | | 1,025 | | | | | Derivative financial instruments | 193 | | 179 | | | | | Cash and cash equivalents | 2,005 | | 4,209 | | | | | Current and deferred taxation | 2,309 | | 2,630 | | | | | Tangible assets held for sale | 12 | | 2 | | | |
|
|
|
| | | | | Total assets | 25,553 | | 27,198 | | | |
|
|
|
| | | | | | | Total liabilities by business sector | | | | | | |
|
|
|
| | | | | Pharmaceuticals | (8,148 | ) | (9,099 | ) | | | | Consumer healthcare | (951 | ) | (1,070 | ) | | |
|
|
|
| | | | | Total operating liabilities | (9,099 | ) | (10,169 | ) | | |
|
|
|
| | | | | Short-term borrowings | (718 | ) | (1,200 | ) | | | | Long-term borrowings | (4,772 | ) | (5,271 | ) | | | | Derivative financial instruments | (100 | ) | (150 | ) | | | | Current and deferred taxation | (1,216 | ) | (2,838 | ) | | |
|
|
|
| | | | | Total liabilities | (15,905 | ) | (19,628 | ) | | |
|
|
|
| | | | | | | Net assets by business sector | | | | | | |
|
|
|
| | | | | Pharmaceuticals | 8,788 | | 7,332 | | | | | Consumer Healthcare | 1,817 | | 1,376 | | | |
|
|
|
| | | | | Net operating assets | 10,605 | | 8,708 | | | | | Net debt | (2,450 | ) | (1,237 | ) | | | | Investments in associates and joint ventures | 295 | | 276 | | | | | Derivative financial instruments | 93 | | 29 | | | | | Current and deferred taxation | 1,093 | | (208 | ) | | | | Tangible assets held for sale | 12 | | 2 | | | |
|
|
|
| | | | | Net assets | 9,648 | | 7,570 | | | |
|
|
|
| | | | | | | | | | | |
| Turnover by location of customer | 2006 | | 2005 | | 2004 | | | £m | £m | £m |
|
|
|
|
|
| | | USA | 11,102 | | 9,867 | | 9,191 | | | Europe | 7,010 | | 6,892 | | 6,395 | | | International | 5,113 | | 4,901 | | 4,400 | |
|
|
|
|
|
| | | Turnover | 23,225 | | 21,660 | | 19,986 | |
|
|
|
|
|
| | | | | Turnover by location of subsidiary undertaking | | | | | | |
|
|
|
|
|
| | | USA | 11,362 | | 10,185 | | 9,511 | | | Europe | 14,007 | | 12,303 | | 11,192 | | | International | 9,349 | | 8,547 | | 7,787 | |
|
|
|
|
|
| | | Turnover including inter-segment turnover | 34,718 | | 31,035 | | 28,490 | |
|
|
|
|
|
| | | USA | 339 | | 308 | | 327 | | | Europe | 6,337 | | 4,836 | | 4,304 | | | International | 4,817 | | 4,231 | | 3,873 | |
|
|
|
|
|
| | | Inter-segment turnover | 11,493 | | 9,375 | | 8,504 | |
|
|
|
|
|
| | | USA | 11,023 | | 9,877 | | 9,184 | | | Europe | 7,670 | | 7,467 | | 6,888 | | | International | 4,532 | | 4,316 | | 3,914 | |
|
|
|
|
|
| | | External turnover | 23,225 | | 21,660 | | 19,986 | |
|
|
|
|
|
| |
<Back to Contents | | | | FINANCIAL STATEMENTS | | Notes to the financial statements | | | | | | | Notes to the financial statements | | continued | |
6 Segment information continued | | 2007 | | 2006 | | 2005 | | | Turnover by location of subsidiary undertaking | £m | | £m | | £m | |
|
|
|
|
|
| | | USA | 10,400 | | 11,362 | | 10,185 | | | Europe | 14,009 | | 14,007 | | 12,303 | | | International | 10,911 | | 9,349 | | 8,547 | |
|
|
|
|
|
| | | Turnover including inter-segment turnover | 35,320 | | 34,718 | | 31,035 | |
|
|
|
|
|
| | | USA | 341 | | 339 | | 308 | | | Europe | 6,042 | | 6,337 | | 4,836 | | | International | 6,221 | | 4,817 | | 4,231 | |
|
|
|
|
|
| | | Inter-segment turnover | 12,604 | | 11,493 | | 9,375 | |
|
|
|
|
|
| | | USA | 10,059 | | 11,023 | | 9,877 | | | Europe | 7,967 | | 7,670 | | 7,467 | | | International | 4,690 | | 4,532 | | 4,316 | |
|
|
|
|
|
| | | External turnover | 22,716 | | 23,225 | | 21,660 | |
| | | Operating profit by location of subsidiary undertaking | | | | | | |
|
|
|
|
|
| | | USA | 2,849 | | 2,495 | | 2,016 | | | Europe | 3,671 | | 2,701 | | 2,798 | | | International | 1,073 | | 2,612 | | 2,060 | |
|
|
|
|
|
| | | Operating profit | 7,593 | | 7,808 | | 6,874 | |
| | | Property, plant and equipment and other intangible asset additions by location | | | | | | |
|
|
|
| | | | | USA | 1,172 | | 637 | | | | | Europe | 1,456 | | 1,020 | | | | | International | 261 | | 277 | | | |
|
|
|
| | | | | Total additions | 2,889 | | 1,934 | | | |
| | | | | Total assets by location | | | | | | |
|
|
|
| | | | | USA | 6,125 | | 4,830 | | | | | Europe | 12,812 | | 10,127 | | | | | International | 5,106 | | 5,389 | | | | | Inter-segment trading balances | (635 | ) | (642 | ) | | |
|
|
|
| | | | | Total operating assets | 23,408 | | 19,704 | | | |
| | | | | | | | |
| 102 | GSK Annual Report 2007 | | |
Back to Contents | | | FINANCIAL STATEMENTS | | | Notes to the financial statements | | | | | | | | Notes to the financial statements | | continued |
|
56 Segment informationcontinued
| Property, plant and equipment and other intangible asset additions by location | 2006 | | 2005 | | | | | £m | £m | |
|
|
|
| | | | | USA | 637 | | 509 | | | | | Europe | 1,020 | | 742 | | | | | International | 277 | | 944 | | | |
|
|
|
| | | | | Total additions | 1,934 | | 2,195 | | | |
|
|
|
| | | | | | | Total assets by location | | | | | | |
|
|
|
| | | | | USA | 4,830 | | 4,459 | | | | | Europe | 15,166 | | 16,423 | | | | | International | 5,389 | | 5,020 | | | | | Inter-segment trading balances | (5,681 | ) | (7,025 | ) | | |
|
|
|
| | | | | Total operating assets | 19,704 | | 18,877 | | | |
|
|
|
| | | | | Investments in associates and joint ventures | 295 | | 276 | | | | | Liquid investments | 1,035 | | 1,025 | | | | | Derivative financial instruments | 193 | | 179 | | | | | Cash and cash equivalents | 2,005 | | 4,209 | | | | | Current and deferred taxation | 2,309 | | 2,630 | | | | | Tangible assets held for sale | 12 | | 2 | | | |
|
|
|
| | | | | Total assets | 25,553 | | 27,198 | | | |
|
|
|
| | | | | | | Net assets by location | | | | | | |
|
|
|
| | | | | USA | 919 | | 446 | | | | | Europe | 11,151 | | 11,628 | | | | | International | 4,216 | | 3,659 | | | | | Inter-segment trading balances | (5,681 | ) | (7,025 | ) | | |
|
|
|
| | | | | Net operating assets | 10,605 | | 8,708 | | | | | Net debt | (2,450 | ) | (1,237 | ) | | | | Investments in associates and joint ventures | 295 | | 276 | | | | | Derivative financial instruments | 93 | | 29 | | | | | Current and deferred taxation | 1,093 | | (208 | ) | | | | Tangible assets held for sale | 12 | | 2 | | | |
|
|
|
| | | | | Net assets | 9,648 | | 7,570 | | | |
|
|
|
| | | |
| | 2007 | | 2006 | | | | | Net operating assets by location | £m | | £m | | | |
|
|
|
| | | | | USA | 2,385 | | 277 | | | | | Europe | 9,212 | | 6,112 | | | | | International | 3,272 | | 4,216 | | | |
|
|
|
| | | | | Net operating assets | 14,869 | | 10,605 | | | |
| | | |
UK Segment
segmentFor the purposes of US GAAP information The UK is given separately in respect of the UK, which, although included in the Group’s Europe market region, is considered the Group’s home segment for the purposes of segmental reporting.region. | | 2006 | | 2005 | | 2004 | | 2007 | | 2006 | | 2005 | | | £m | £m | £m | | £m | | £m | |
|
| |
| | | Turnover by location of customer | 1,501 | | 1,431 | | 1,382 | | 1,553 | | 1,501 | | 1,431 | |
|
| |
| | | Turnover including inter-segment turnover | 4,890 | | 4,414 | | 4,386 | | 4,977 | | 4,890 | | 4,414 | | | Inter-segment turnover | 3,086 | | 2,657 | | 2,709 | | 2,956 | | 3,086 | | 2,657 | |
|
| |
| | | Turnover by location of subsidiary | 1,804 | | 1,757 | | 1,677 | | 2,021 | | 1,804 | | 1,757 | |
|
| |
| | | Operating profit | 1,468 | | 1,576 | | 1,327 | | | | Non-current assets | | 4,380 | | 3,875 | |
|
| |
| | | Total assets | 6,208 | | 7,057 | | 6,521 | | |
|
| | | | | Net operating assets | 2,829 | | 2,290 | | 2,253 | | |
| | |
|
| GSK Annual Report 20062007 | 103 | 97 | |
Back to Contents | | FINANCIAL STATEMENTS | | Notes to the financial statements | | | | | | | Notes to the financial statements | | continued |
|
67 Restructuring costs
GSK has undertaken a significant new Operational Excellence programme to improve the effectiveness and productivity of its operations. This programme is expected to deliver total annual pre-tax savings of up to £700 million by 2010 with savings realised across the business. In manufacturing, GSK will reduce the overall number of sites operating in its network and simplify processes and site activities to reduce over-capacity. The Group will also continue to seek opportunities to outsource the manufacturing of existing products and for low-cost sourcing of materials, whilst focusing its capability on new products. GSK has conducted several sales force pilot initiatives to assess new sales structures and selling techniques. Results from these initiatives have provided GSK with new opportunities to evolve its traditional selling methods competitively, including adopting more tailored and customised sales approaches in both developed and emerging markets. In R&D, GSK will continue to invest in the development of its promising late-stage pipeline and will increase investment in key areas of future growth, such as biopharmaceuticals, oncology, vaccines, neuroscience and emerging markets such as China. Cost savings in R&D will be focused on simplification and streamlining of support infrastructure. Total one-off costs for implementation of the new programme are expected to be approximately £1.5 billion, to be incurred over the period from 2007 to 2010. In addition, in December 2007 GSK acquired Reliant Pharmaceuticals, Inc. in the USA. A rationalisation and restructuring programme has been initiated as part of the integration of Reliant Pharmaceuticals into the Group, although no costs were incured under this programme in 2007. | | Asset | | Staff | | | | | | impairment | | reductions | | Total | | | | £m | | £m | | £m | |
| | | Cost of sales | (77 | ) | (34 | ) | (111 | ) | | Selling, general and administration | (1 | ) | (136 | ) | (137 | ) | | Research and development | (28 | ) | (62 | ) | (90 | ) |
| | | Effect on profit before taxation | (106 | ) | (232 | ) | (338 | ) | | Effect on taxation | | | | | 77 | |
| | | Effect on earnings | | | | | (261 | ) |
| |
These restructuring costs are reported in the middle column of the Income statement on page 90. 8 Other operating income | 2006 | | 2005 | | 2004 | | | £m | | £m | | £m | |
|
|
|
|
|
| | | Royalties | 112 | | 83 | | 96 | | | Asset disposal profits | 169 | | 290 | | 146 | | | Other income including fair value adjustments | 26 | | (9 | ) | (7 | ) |
|
|
|
|
|
| | | 307 | | 364 | | 235 | |
|
|
|
|
|
| |
| | 2007 | | 2006 | | 2005 | | | | £m | | £m | | £m | |
| | | Royalty and milestone income | 223 | | 112 | | 83 | | | Impairment of equity investments | (19 | ) | (14 | ) | (35 | ) | | Disposal of equity investments | 32 | | 18 | | 15 | | | Disposal of other assets and legal settlements | 181 | | 151 | | 275 | | | Fair value adjustments on derivative financial instruments | 41 | | 29 | | 19 | | | Other income | 17 | | 11 | | 7 | |
| | | | 475 | | 307 | | 364 | |
| |
Royalties areRoyalty and milestone income is principally a core of recurring income from the out-licensing of intellectual property. Asset disposal profits include product divestments and disposals of equity investments, intellectual property and tangible property. Other income includes equity investment carryingFair value adjustments arising from stock market changes and fair value adjustments arisingon derivative financial instruments include movements on the Quest Collarcollar and Theravance put and call options.
| 104 | GSK Annual Report 2007 | | |
Back to Contents | | | FINANCIAL STATEMENTS | | | Notes to the financial statements | | | | | | | | Notes to the financial statements | | continued | |
79 Operating profit
| 2006 | | 2005 | | 2004 | | | £m | | £m | | £m | |
|
|
|
|
|
| | | The following items have been charged in operating profit: | | | | | | | | Employee costs (Note 8) | 5,495 | | 5,254 | | 5,054 | | | Advertising | 759 | | 697 | | 599 | | | Distribution costs | 276 | | 270 | | 266 | | | Depreciation of property, plant and equipment | 732 | | 710 | | 691 | | | Amortisation of intangible assets | 226 | | 194 | | 168 | | | Net foreign exchange losses/(gains) | 36 | | (3 | ) | 72 | | | Inventories: | | | | | | | | Cost of inventories included in cost of sales | 4,480 | | 4,335 | | 4,032 | | | Write-down of inventories | 146 | | 119 | | 142 | | | Reversal of prior year write-down of inventories | (93 | ) | (61 | ) | (49 | ) | | Operating lease rentals: | | | | | | | | Minimum lease payments | 114 | | 104 | | 110 | | | Contingent rents | 11 | | 12 | | 9 | | | Sub-lease payments | 2 | | 1 | | – | | | Fees payable to company’s auditor for the audit of parent company and | | | | | | | | consolidated financial statements | 1.7 | | 1.4 | | 1.1 | | | Fees payable to the company’s auditor and its associates for other services | 15.9 | | 13.1 | | 13.4 | |
|
|
|
|
|
| |
| | | 2007 | | 2006 | | 2005 | | | The following items have been included in operating profit: | £m | | £m | | £m | |
|
|
|
|
|
|
| | | Employee costs (Note 10) | 5,733 | | 5,495 | | 5,254 | | | Advertising | 744 | | 759 | | 697 | | | Distribution costs | 270 | | 276 | | 270 | | | Depreciation of property, plant and equipment | 796 | | 732 | | 710 | | | Amortisation of intangible assets | 226 | | 226 | | 194 | | | Net foreign exchange (gains)/losses | (1 | ) | 36 | | (3 | ) | | Inventories: | | | | | | | | | Cost of inventories included in cost of sales | 4,784 | | 4,480 | | 4,335 | | | | Write-down of inventories | 265 | | 146 | | 119 | | | | Reversal of prior year write-down of inventories | (103 | ) | (93 | ) | (61 | ) | | Operating lease rentals: | | | | | | | | | Minimum lease payments | 121 | | 114 | | 104 | | | | Contingent rents | 13 | | 11 | | 12 | | | | Sub-lease payments | 2 | | 2 | | 1 | | | Fees payable to company’s auditor for the audit of parent company andconsolidated financial statements | 1.8 | | 1.7 | | 1.4 | | | Fees payable to the company’s auditor and its associates for other services | 14.5 | | 15.9 | | 13.1 | |
|
|
|
|
|
|
| |
The reversals of prior year write-downs of inventories principally arise from the reassessment of usage or demand expectations prior to inventory expiration. | 2006 | | 2005 | | 2004 | | | 2007 | | 2006 | | 2005 | | | Fees payable to the company’s auditor and its associates for other services | £m | | £m | | £m | | Fees payable to the company’s auditor and its associates for other services | £m | | £m | | £m | |
|
|
|
|
|
| |
| | | Audit of accounts of the Group’s UK and overseas subsidiaries and related pension | | | | | | | | schemes of the company, pursuant to legislation | 7.7 | | 6.7 | | 5.7 | | | | Audit of accounts of the Group’s UK and overseas subsidiaries and related pension schemes of the company, pursuant to legislation | | Audit of accounts of the Group’s UK and overseas subsidiaries and related pension schemes of the company, pursuant to legislation | 7.9 | | 7.7 | | 6.7 | | | Other assurance services, pursuant to such legislation | 4.4 | | 2.6 | | 2.2 | | Other assurance services, pursuant to such legislation | 2.9 | | 4.4 | | 2.6 | | | Other tax services | 1.9 | | 2.3 | | 3.0 | | Other tax services | 2.5 | | 1.9 | | 2.3 | | | All other services, including regulatory, compliance and treasury related services | 1.9 | | 1.5 | | 2.5 | | All other services, including regulatory, compliance and treasury related services | 1.2 | | 1.9 | | 1.5 | |
|
|
|
|
|
| |
| | | 15.9 | | 13.1 | | 13.4 | | | 14.5 | | 15.9 | | 13.1 | |
|
|
|
|
|
| |
| |
At 31st December 2006,2007, the amount due to PricewaterhouseCoopers LLP and its associates for fees yet to be invoiced was £3.7£4.1 million, comprising statutory audit £3.4£3.2 million, taxation services £0.6 million and taxationother services £0.3 million. Fees in respect of the GlaxoSmithKline plcUK pension schemeschemes included above: | 2006 | | 2005 | | 2004 | | 2007 | | 2006 | | 2005 | | | £m | | £m | | £m | | £m | | £m | | £m | |
|
|
|
|
|
| |
| | | Audit | 0.3 | | 0.2 | | 0.2 | | 0.2 | | 0.3 | | 0.2 | | | Other services | 0.1 | | – | | – | | 0.1 | | 0.1 | | – | |
|
|
|
|
|
| |
| | | 0.4 | | 0.2 | | 0.2 | | 0.3 | | 0.4 | | 0.2 | |
|
|
|
|
|
| |
| | | | | |
|
| GSK Annual Report 20062007 | 105 | 98 | |
Back to Contents | | FINANCIAL STATEMENTS | | Notes to the financial statements | | | | | | | Notes to the financial statements | | continued |
|
810 Employee costs
| 2006 | | 2005 | | 2004 | | 2007 | 2006 | 2005 | | | £m | | £m | | £m | | £m | £m | |
|
|
|
|
|
| |
| | | Wages and salaries | 4,363 | | 4,152 | | 3,864 | | 4,444 | 4,363 | 4,152 | | | Social security costs | 461 | | 432 | | 430 | | 527 | 461 | 432 | | | Pension and other post-employment costs (see Note 26) | 377 | | 350 | | 347 | | | | Pension and other post-employment costs, including augmentations (Note 28) | | 313 | 377 | 350 | | | Cost of share-based incentive plans | 226 | | 236 | | 333 | | 237 | 226 | 236 | | | Severance and other costs from integration and restructuring activities | 68 | | 84 | | 80 | | 212 | 68 | 84 | |
|
|
|
|
|
| |
| | | | 5,495 | | 5,254 | | 5,054 | | 5,733 | 5,495 | 5,254 | |
|
|
|
|
|
| |
| |
The Group provides benefits to employees, commensurate with local practice in individual countries, including, in some markets, healthcare insurance, subsidised car schemes and personal life assurance. | 2006 | | 2005 | | 2004 | | 2007 | 2006 | 2005 | | | The average number of persons employed by the Group (including Directors) during the year | Number | | Number | | Number | | | | The average number of persons employed by the Group (including Directors) during the year: | | Number | Number | |
|
|
|
|
|
| |
| | | Manufacturing | 32,403 | | 30,906 | | 31,427 | | 33,975 | 32,403 | 30,906 | | | Selling, general and administration | 53,665 | | 53,634 | | 53,513 | | 53,707 | 53,665 | 53,634 | | | Research and development | 15,734 | | 14,963 | | 14,897 | | 15,719 | 15,734 | 14,963 | |
|
|
|
|
|
| |
| | | 101,802 | | 99,503 | | 99,837 | | 103,401 | 101,802 | 99,503 | |
|
|
|
|
|
| |
| |
The average number of Group employees excludes temporary and contract staff. The numbersnumber of Group employees at the end of each financial year are given in the Financial record on page 175.174. The average number of persons employed by GlaxoSmithKline plc in 20062007 was nil (2005(2006 – nil). The compensation of the Directors and Senior Management (members of the CET and the Company Secretary) in aggregate, was as follows: | 2006 | | 2005 | | 2004 | | 2007 | 2006 | 2005 | | | £m | | £m | | £m | | £m | £m | |
|
| |
| | | Wages and salaries | 15 | | 17 | | 13 | | 16 | 15 | 17 | | | Social security costs | 1 | | 1 | | 1 | | 1 | 1 | | | Pension and other post-employment costs | 3 | | 3 | | 2 | | 3 | 3 | | | Cost of share-based incentive plans | 14 | | 15 | | 16 | | 15 | 14 | 15 | |
|
| |
| | | 33 | | 36 | | 32 | | 35 | 33 | 36 | |
|
| |
| |
911 Finance income
| 2006 | | 2005 | | 2004 | | | £m | | £m | | £m | |
|
|
|
|
|
| | | Interest income | 262 | | 268 | | 173 | | | Unwinding of discount on assets | 1 | | – | | 3 | | | Interest on extended credit on receivables | 21 | | 8 | | – | | | Net investment hedges | (2 | ) | (17 | ) | – | | | Fair value adjustments on non-hedging derivatives | 4 | | (2 | ) | – | | | Realised gains on financial instruments | 1 | | – | | – | |
|
|
|
|
|
| | | 287 | | 257 | | 176 | |
|
|
|
|
|
| |
| | 2007 | 2006 | | 2005 | | | | £m | £m | | £m | |
|
|
|
|
| | | Interest income arising from: | | | | | | | – cash and cash equivalents | 98 | 168 | | 167 | | | – available-for-sale investments | 49 | 35 | | 15 | | | – derivatives at fair value through profit or loss | 79 | 59 | | 86 | | | – loans and receivables | 27 | 21 | | 8 | | | Realised gains on liquid investments | 1 | 1 | | – | | | Fair value adjustments on derivatives at fair value through profit or loss | – | 4 | | (2 | ) | | Net investment hedge ineffectiveness | 7 | (2 | ) | (17 | ) | | Unwinding of discounts on assets | 1 | 1 | | – | |
|
|
|
|
| | | | 262 | 287 | | 257 | |
|
|
|
|
| |
10 Finance costsAll derivatives at fair value through profit or loss other than designated and effective hedging instruments (see Note 41, ‘Financial instruments and related disclosures’) are classified as held-for-trading financial instruments under IAS 39. Interest income arising from derivatives at fair value through profit or loss relates to swap interest income.
| 2006 | | 2005 | | 2004 | | | £m | | £m | | £m | |
|
|
|
|
|
| | | Interest on bank loans and overdrafts | (5 | ) | (11 | ) | (6 | ) | | Interest on other loans | (301 | ) | (412 | ) | (337 | ) | | Interest in respect of finance leases | (8 | ) | (4 | ) | (2 | ) | | Realised losses on financial instruments | – | | – | | (1 | ) | | Unwinding of discount on provisions | (36 | ) | (25 | ) | (16 | ) | | Fair value hedges | – | | 2 | | – | | | Fair value adjustments on non-hedging derivatives | (2 | ) | (1 | ) | – | |
|
|
|
|
|
| | | (352 | ) | (451 | ) | (362 | ) |
|
|
|
|
|
| |
| 106 |
| GSK Annual Report 20062007 | 99 | |
Back to Contents | FINANCIAL STATEMENTS | | | Notes to the financial statements | | | | | | | | Notes to the financial statements | | continued |
|
1112 Finance costs
| | 2007 | | 2006 | | 2005 | | | | £m | | £m | | £m | |
|
|
|
|
|
| | | Interest expense arising on: | | | | | | | | – financial liabilities at amortised cost | (313 | ) | (241 | ) | (288 | ) | | – derivatives at fair value through profit or loss | (121 | ) | (73 | ) | (139 | ) | | Fair value hedges: | | | | | | | | – fair value adjustments on derivatives designated as hedging instruments | 10 | | (31 | ) | 79 | | | – fair value adjustments on hedged items | (8 | ) | 28 | | (77 | ) | | Fair value adjustments on other derivatives at fair value through profit or loss | 6 | | 1 | | (1 | ) | | Unwinding of discounts on provisions | (27 | ) | (36 | ) | (25 | ) |
|
|
|
|
|
| | | | (453 | ) | (352 | ) | (451 | ) |
|
|
|
|
|
| |
All derivatives at fair value through profit or loss except designated and effective hedging instruments are classified as held-for-trading financial instruments under IAS 39. 13 Associates and joint ventures | 2006 | | 2005 | | 2004 | | 2007 | | 2006 | | 2005 | | | £m | | £m | | £m | | £m | | £m | | £m | |
|
| |
| | | Associates: | | | | Share of after tax profits of Quest Diagnostics Inc. | 59 | | 52 | | 59 | | 48 | | 59 | | 52 | | | Share of after tax losses of other associates | (2 | ) | (1 | ) | (1 | ) | (3 | ) | (2 | ) | (1 | ) |
|
| |
| | | 57 | | 51 | | 58 | | 45 | | 57 | | 51 | | | Share of after tax (losses)/profits of joint ventures | (1 | ) | 1 | | 2 | | | | Share of after tax profits/(losses) of joint ventures | | 5 | | (1 | ) | 1 | |
|
| |
| | | 56 | | 52 | | 60 | | 50 | | 56 | | 52 | |
|
| |
| | | Share of turnover of joint ventures | 21 | | 32 | | 31 | | 13 | | 21 | | 32 | | | Sales to joint ventures and associates | 18 | | 48 | | 50 | | 9 | | 18 | | 48 | |
|
| |
| |
Summarised income statement information in respect of the Group’s associates is set out below: | 2006 | | 2005 | | 2004 | | 2007 | 2006 | 2005 | | | £m | | £m | | £m | | £m | £m | |
|
| |
| | | Total turnover | 3,392 | | 3,029 | | 2,806 | | 3,352 | 3,392 | 3,029 | | | Total profit/(loss) | 315 | | 296 | | 275 | | | | Total profit | | 167 | 315 | 296 | |
|
| |
| | | | | |
| GSK Annual Report 2007 | 107 | | |
Back to Contents12 Taxation | 2006 | | 2005 | | 2004 | | | Taxation charge based on profits for the year | £m | | £m | | £m | |
|
|
|
|
|
| | | UK corporation tax at the UK statutory rate | 2,512 | | 407 | | 304 | | | Less double taxation relief | (2,112 | ) | (235 | ) | (156 | ) |
|
|
|
|
|
| | | 400 | | 172 | | 148 | | | Overseas taxation | 2,310 | | 1,847 | | 1,519 | |
|
|
|
|
|
| | | Current taxation | 2,710 | | 2,019 | | 1,667 | | | Deferred taxation | (409 | ) | (103 | ) | 90 | |
|
|
|
|
|
| | | 2,301 | | 1,916 | | 1,757 | |
|
|
|
|
|
| | | | | | | | | |
| 2006 | | 2005 | | 2004 | | | Reconciliation of the taxation rate on Group profits | % | | % | | % | |
|
|
|
|
|
| | | UK statutory rate of taxation | 30.0 | | 30.0 | | 30.0 | | | Overseas taxes | 4.2 | | 3.0 | | 2.5 | | | Benefit of special tax status | (5.2 | ) | (2.3 | ) | (3.6 | ) | | R&D credits | (1.3 | ) | (1.4 | ) | (1.5 | ) | | Intercompany stock profit | (1.9 | ) | 1.0 | | 0.3 | | | Impact of share based payments | 0.5 | | (0.3 | ) | 1.5 | | | Tax on profit of associates | (0.4 | ) | (0.4 | ) | (0.4 | ) | | Other differences | 0.3 | | (0.4 | ) | 0.5 | | | Prior year items | 3.3 | | (0.7 | ) | 1.1 | |
|
|
|
|
|
| | | Tax rate | 29.5 | | 28.5 | | 30.4 | |
|
|
|
|
|
| |
Additional UK Corporation tax and Double Taxation relief in 2006 arise from dividends received from overseas subsidiaries. Current tax expense has been reduced by a benefit of £5 million arising from previously unrecognised tax losses. Deferred tax expense has been reduced by a benefit of £2 million arising from changes in tax rates.
| | | FINANCIAL STATEMENTS | | Notes to the financial statements | | | | | | | Notes to the financial statements | | continued | |
| 14 Taxation | | | | | | | | | | | 2007 | | 2006 | | 2005 | | | Taxation charge based on profits for the year | | £m | | £m | | £m | | | | | | | | | | | UK corporation tax at the UK statutory rate | | 791 | | 2,512 | | 407 | | | Less double taxation relief | | (339 | ) | (2,112 | ) | (235 | ) |
|
|
|
|
|
|
| | | | | 452 | | 400 | | 172 | | | Overseas taxation | | 1,962 | | 2,310 | | 1,847 | |
|
|
|
|
|
|
| | | Current taxation | | 2,414 | | 2,710 | | 2,019 | | | Deferred taxation | | (272 | ) | (409 | ) | (103 | ) |
|
|
|
|
|
|
| | | | | 2,142 | | 2,301 | | 1,916 | |
|
|
|
|
|
|
| |
| | | | | | | | | | | | | | | | | | | | | 2007 | | 2006 | | 2005 | | | Reconciliation of the taxation rate on Group profits | | % | | % | | % | |
|
|
|
|
|
|
| | | UK statutory rate of taxation | | 30.0 | | 30.0 | | 30.0 | | | Overseas taxes | | 4.3 | | 4.2 | | 3.0 | | | Benefit of special tax status | | (3.6 | ) | (5.2 | ) | (2.3 | ) | | R&D credits | | (1.5 | ) | (1.3 | ) | (1.4 | ) | | Intercompany stock profit | | (0.8 | ) | (1.9 | ) | 1.0 | | | Impact of share based payments | | 0.6 | | 0.5 | | (0.3 | ) | | Tax on profit of associates | | (0.3 | ) | (0.4 | ) | (0.4 | ) | | Other differences | | (0.3 | ) | 0.3 | | (0.4 | ) | | Prior year items | | 0.1 | | 3.3 | | (0.7 | ) | | Restructuring | | 0.2 | | – | | – | |
|
|
|
|
|
|
| | | Tax rate | | 28.7 | | 29.5 | | 28.5 | |
|
|
|
|
|
|
| |
The Group operates in countries where the tax rate differs from the UK tax rate. The impact of these overseas taxes on the company’s overall rate of tax is shown above. Profits arising from certain operations in Singapore, Puerto Rico Ireland and BelgiumIreland are accorded special status and are taxed at reduced rates compared with the normal rates of tax in these territories. The effect of this reduction in the taxation charge increased earnings per share by 4.9p in 2007, 7.2p in 2006 and 2.7p in 2005 and 3.6p in 2004.2005. The Group is required under IFRS to create a deferred tax asset in respect of unrealised intercompany profit arising on stockinventory held by the Group at the year endyear-end by applying the tax rate of the country in which the stockinventory is held (rather than the tax rate of the country where the profit was originally made and the tax paid, which is the practice under UK and US GAAP). TheAs a result of this difference in accounting treatment the Group tax rate wasunder IFRS decreased by 0.8% in 2007 (2006 – 1.9% in 2006 (2005 –1.0% increase, 2004decrease, 2005 – 0.3%1.0% increase) as a result of increaseschanges in work-in-progress and finished goods. The integrated nature of the Group’s worldwide operations, involving significant investment in research and strategic manufacture at a limited number of locations, with consequential cross-border supply routes into numerous end-markets, gives rise to complexity and delay in negotiations with revenue authorities as to the profits on which individual Group companies are liable to tax. Resolution of such issues is a continuing fact of life for GSK. |
| GSK Annual Report 2006 | 100 |
<Back to Contents
| Notes to the financial statements | continued |
|
12 Taxationcontinued
As reported last year, GSK’s largest unresolvedThe Group’s main open tax issues were withare in the UK, the US, Internal Revenue Service (IRS)Canada and UK HM Revenue and Customs (HMRC) in respect of transfer prices related to the Glaxo heritage products.Japan.
On 11th September 2006, GSK and the IRS agreed to a resolution of their dispute. Under the agreement, GSK has made gross payments to the IRS of approximately $3.3 billion. The final net cash cost to the Group is approximately $3.1 billion, which covers federal, state and local taxes, interest and the benefit of tax relief on the payments made. The settlement resolved all the transfer pricing issues in dispute for the period 1989 – 2000, which were due to go to trial in February 2007, and also covers the subsequent years 2001 – 2005. GSK had previously made provision for the dispute and this settlement did not have any significant impact on the Group’s reported earnings or tax rate for the year.
GSK continues to be in dispute with HMRC primarily in respect of transfer pricing and Controlled Foreign Companies legislation(‘CFC’) matters for the years 1994 to date and the parties are now preparing for litigation.date. HMRC hashave not formally quantified itsyet formalised claims in respect of these matters but thereand GSK is seeking to resolve them in discussions with HMRC. There continues however to be a wide difference between the Group and HMRC positions, onwhich may ultimately need to be settled by litigation. Following its audit of the period 2001 to 2003, the IRS has in Notices of Proposed Adjustment challenged deductions arising from intercompany financing arrangements for those years, with which GSK disagrees and which it will vigorously contest. GSK estimates that the IRS claim for tax and interest at 31st December 2007 net of federal tax relief for these matters.years, is $680 million. GSK alsobelieves, supported by external professional advice, that this claim has open issuesno merit and that no adjustment is warranted. If, contrary to GSK’s view, the IRS prevailed in its argument before a court, the company would expect to have an additional liability for the four year unaudited period 2004-2007 proportionate to its liability for the three year audited period 2001-2003. In the event that the company is not able to resolve this issue with the IRS, a court decision would not be expected before 2010. Lower courts in Japan and Canada, which were the subject of court proceedings in 2006. In Japanhave upheld claims by the tax authorities are claiming approximatelyfor Yen 39 billion (£169177 million) relating to Japanese CFC legislation. The company has paid and fully provided for the full tax but is pursuing a claim for refund to the Japanese Supreme Court. In Canada a court hearing in respect of transactions in 1998. GSK has paid the tax claimed, as required by law, and applied for a refund. A court decision is expected in late March 2007. A court decisiontransfer pricing in the Group’s dispute withearly 1990s was completed in July 2006. GSK is still awaiting the Canadian Revenue Authority over the pricing ofZantacin the years 1989court’s judgement. | 108 | GSK Annual Report 2007 | | |
Back to 1993 is expected in the first half of 2007.Contents | | | FINANCIAL STATEMENTS | | | Notes to the financial statements | | | | | | | | Notes to the financial statements | | continued | |
14 Taxationcontinued GSK uses the best advice in determining its transfer pricing methodology and in seeking to manage transfer pricing and other taxation issues to a satisfactory conclusion and, on the basis of external professional advice, continues to believe that it has made adequate provision for the liabilities likely to arise from open assessments. The ultimate liability for such matters may vary from the amounts provided and is dependent upon the outcome of litigation proceedings and negotiations with the relevant tax authorities. Except as shown in this Annual Report, noNo provision has been made for taxation which would arise on the distribution of profits retained by overseas subsidiary and associated undertakings, on the grounds that no remittance of profit retained at 31st December 20062007 is required in such a way that incremental tax will arise. The aggregate amount of these unremitted profits at the balance sheet date was approximately £31 billion (2006 – £26 billion.billion).
| Payable | | Recoverable | | Net | | | Movement on current tax account | £m | | £m | | £m | |
|
|
|
|
|
| | | At 1st January 2006 | (2,269 | ) | 416 | | (1,853 | ) | | Exchange adjustments | 170 | | (8 | ) | 162 | | | Charge for the year | (1,981 | ) | (729 | ) | (2,710 | ) | | Cash paid | 3,438 | | 408 | | 3,846 | | | Other movements | 21 | | 99 | | 120 | |
|
|
|
|
|
| | | At 31st December 2006 | (621 | ) | 186 | | (435 | ) |
|
|
|
|
|
| |
| | | Payable | | Recoverable | | Net | | | Movement on current tax account | | £m | | £m | | £m | |
|
|
|
|
|
|
| | | At 1st January 2007 | | (621 | ) | 186 | | (435 | ) | | Exchange adjustments | | (14 | ) | 3 | | (11 | ) | | Charge for the year | | (2,002 | ) | (412 | ) | (2,414 | ) | | Cash paid | | 1,637 | | 282 | | 1,919 | | | Transfer to/from deferred tax | | 122 | | – | | 122 | | | Other movements | | 52 | | (1 | ) | 51 | |
|
|
|
|
|
|
| | | At 31st December 2007 | | (826 | ) | 58 | | (768 | ) |
|
|
|
|
|
|
| |
| | | | | | | | | | | | | | | | | | | | | | | | | | | Movement in deferred tax assets and liabilities | | | | | | | | | | | | | | | | | | | | | | | | | | | | | | | | | | | | Pensions & | | | | | | Manu-- | | | | Share | | Other | | | | | | | | Accelerated | | | | Intra- | | other post | | | | Legal | | facturing | | Stock | | option | | net | | Offset | | | | | Deferred taxation | capital | | | | group | | retirement | | Tax | | & other | | restruct- | | valuation | | and award | | temporary | | within | | | | | asset/(liability) | allowances | | Intangibles | | profit | | benefits | | losses | | disputes | | uring | | adjustments | | schemes | | differences | | countries | | Total | | | | £m | | £m | | £m | | £m | | £m | | £m | | £m | | £m | | £m | | £m | | £m | | £m | |
|
|
|
|
|
|
|
|
|
|
|
|
|
|
|
|
|
|
|
|
|
|
|
| | Deferred tax asset at1st January 2007 | 24 | | 71 | | 934 | | 742 | | 98 | | 153 | | 74 | | 19 | | 157 | | 598 | | (747 | ) | 2,123 | | Deferred tax liability at1st January 2007 | (631 | ) | (555 | ) | – | | (4 | ) | – | | – | | – | | (109 | ) | – | | (43 | ) | 747 | | (595 | ) |
|
|
|
|
|
|
|
|
|
|
|
|
|
|
|
|
|
|
|
|
|
|
|
| | | At 1st January 2007 | (607 | ) | (484 | ) | 934 | | 738 | | 98 | | 153 | | 74 | | (90 | ) | 157 | | 555 | | – | | 1,528 | | | Exchange adjustments | (11 | ) | (19 | ) | – | | (2 | ) | 1 | | (2 | ) | 1 | | (7 | ) | – | | 16 | | – | | (23 | ) | Credit/(charge) to incomestatement | 25 | | 65 | | 187 | | 22 | | (17 | ) | 19 | | 31 | | (12 | ) | (39 | ) | (9 | ) | – | | 272 | | | Credit/(charge) to equity | – | | – | | 19 | | (195 | ) | – | | – | | – | | – | | (17 | ) | 26 | | – | | (167 | ) | | Transfer to/from current tax | 1 | | – | | – | | (107 | ) | – | | – | | 2 | | – | | – | | (18 | ) | – | | (122 | ) | | Acquisitions | – | | (250 | ) | – | | – | | 55 | | – | | – | | – | | – | | 16 | | – | | (179 | ) |
|
|
|
|
|
|
|
|
|
|
|
|
|
|
|
|
|
|
|
|
|
|
|
| | | At 31st December 2007 | (592 | ) | (688 | ) | 1,140 | | 456 | | 137 | | 170 | | 108 | | (109 | ) | 101 | | 586 | | – | | 1,309 | |
|
|
|
|
|
|
|
|
|
|
|
|
|
|
|
|
|
|
|
|
|
|
|
| | Deferred tax assets at31st December 2007 | 4 | | 94 | | 1,140 | | 458 | | 137 | | 170 | | 108 | | 18 | | 101 | | 640 | | (674 | ) | 2,196 | | Deferred tax liability at31st December 2007 | (596 | ) | (782 | ) | – | | (2 | ) | – | | – | | – | | (127 | ) | – | | (54 | ) | 674 | | (887 | ) |
|
|
|
|
|
|
|
|
|
|
|
|
|
|
|
|
|
|
|
|
|
|
|
| | | | (592 | ) | (688 | ) | 1,140 | | 456 | | 137 | | 170 | | 108 | | (109 | ) | 101 | | 586 | | – | | 1,309 | |
|
|
|
|
|
|
|
|
|
|
|
|
|
|
|
|
|
|
|
|
|
|
|
| |
Movement inThe deferred tax assets and liabilities
| | | | | | | | | | Pensions & | | | | | | | | | | Share | | Other | | | | | | Accelerated | | | | | Product & | | other post | | | | Legal | | Manu- | | Stock | | option | | net | | | | | Deferred taxation | capital | | | Intra-group | | business | | retirement | | Tax | | & other | | facturing | | valuation | | and award | | temporary | | | | | asset/(liability) | allowances | Intangibles | | profit | | disposals | | benefits | | Losses | | disputes | | restructuring | | adjustments | | schemes | | differences | | Total | |
|
|
|
|
|
|
|
|
|
|
|
|
|
|
|
|
|
|
|
|
|
|
|
| | | Deferred tax asset at | | | | | | | | | | | | | | | | | | | | | | | | | | 1st January 2006 | (492 | ) | (18 | ) | 709 | | (9 | ) | 1,035 | | 63 | | 160 | | 73 | | (72 | ) | 151 | | 614 | | 2,214 | | | Deferred tax liability at | | | | | | | | | | | | | | | | | | | | | | | | | | 1st January 2006 | (123 | ) | (522 | ) | – | | 13 | | 25 | | 24 | | 1 | | – | | (50 | ) | – | | 63 | | (569 | ) |
|
|
|
|
|
|
|
|
|
|
|
|
|
|
|
|
|
|
|
|
|
|
|
| | | | | | | | | | | | | | | | | | | | | | | | | | | | At 1st January 2006 | (615 | ) | (540 | ) | 709 | | 4 | | 1,060 | | 87 | | 161 | | 73 | | (122 | ) | 151 | | 677 | | 1,645 | | | Exchange adjustments | 11 | | 27 | | – | | – | | (55 | ) | (10 | ) | (17 | ) | (1 | ) | 8 | | – | | (82 | ) | (119 | ) | | Credit/(charge) to income | (5 | ) | 113 | | 225 | | (9 | ) | 33 | | 15 | | 9 | | 7 | | 16 | | 5 | | – | | 409 | | | Credit/(charge) to equity | – | | – | | – | | – | | (161 | ) | – | | – | | – | | – | | 1 | | (13 | ) | (173 | ) | | Transfer to/from current tax | 2 | | – | | – | | 4 | | (139 | ) | – | | – | | (5 | ) | 3 | | – | | (20 | ) | (155 | ) | | Acquisitions | – | | (84 | ) | – | | – | | – | | 1 | | – | | – | | – | | – | | 4 | | (79 | ) | | Other movements | – | | – | | – | | – | | – | | 5 | | – | | – | | 5 | | – | | (10 | ) | – | |
|
|
|
|
|
|
|
|
|
|
|
|
|
|
|
|
|
|
|
|
|
|
|
| | | At 31st December 2006 | (607 | ) | (484 | ) | 934 | | (1 | ) | 738 | | 98 | | 153 | | 74 | | (90 | ) | 157 | | 556 | | 1,528 | |
|
|
|
|
|
|
|
|
|
|
|
|
|
|
|
|
|
|
|
|
|
|
|
| | | | | | | | | | | | | | | | | | | | | | | | | | | | | Deferred tax asset at | | | | | | | | | | | | | | | | | | | | | | | | | | 31st December 2006 | (34 | ) | (49 | ) | 934 | | – | | 416 | | 64 | | 147 | | 30 | | (35 | ) | 124 | | 526 | | 2,123 | | | Deferred tax liability at | | | | | | | | | | | | | | | | | | | | | | | | | | 31st December 2006 | (573 | ) | (435 | ) | – | | (1 | ) | 322 | | 34 | | 6 | | 44 | | (55 | ) | 33 | | 30 | | (595 | ) |
|
|
|
|
|
|
|
|
|
|
|
|
|
|
|
|
|
|
|
|
|
|
|
| | | (607 | ) | (484 | ) | 934 | | (1 | ) | 738 | | 98 | | 153 | | 74 | | (90 | ) | 157 | | 556 | | 1,528 | |
|
|
|
|
|
|
|
|
|
|
|
|
|
|
|
|
|
|
|
|
|
|
|
| |
|
| GSK Annual Report 2006 | 101 |
Backcredit to Contents
| Notes to the financial statements | continued |
|
12 Taxationcontinued
At 31st December 2006, the Group had recognised aincome relating to changes in tax rates is £23 million. All other deferred tax asset of £98 million (2005 – £87 million) in respect of income tax losses of approximately £348 million (2005 – £291 million). Of these losses, £100 million (2005 – £64 million) are due to expire between 2007–2013, £178 million (2005 – £184 million) are due to expire between 2019–2027 and £70 million (2005 – £43 million) are available indefinitely. At 31st December 2006, the Group had not recognised any deferred tax asset in respect of income tax losses of approximately £3,742 million (2005 – £217 million), of which £131 million (2005 – £28 million) are due to expire between 2007–2018, £21 million (2005 – £79 million) are due to expire between 2019–2027 and £3,590 million (2005 – £110 million) are available indefinitely. Unrecognised losses have increased in 2006 due to quantification of previously uncertain amounts arising principally in 2003 and 2004. The Group had capital losses at 31st December 2006 estimated to be in excess of £10 billion in respect of which no deferred tax asset has been recognised. Deferred tax assets are recognised where it is probable that future taxable profit will be available to utilise losses. All deferred taxation movements arise from the origination and reversal of temporary differences. Other net temporary differences include accrued expenses and other provisions.
At 31st December 2007, the Group had recognised a deferred tax asset of £137 million (2006 – £98 million) in respect of income tax losses of approximately £494 million (2006 – £348 million). Of these losses, £136 million (2006 – £100 million) are due to expire between 2008–2012, £3 million (2006 – £nil) are due to expire between 2013–2019, £327 million (2006 – £178 million) are due to expire between 2020–2028 and £28 million (2006 – £70 million) are available indefinitely. At 31st December 2007, the Group had not recognised any deferred tax asset in respect of income tax losses of approximately £3,688 million (2006 – £3,742 million), of which £62 million (2006 – £131 million) are due to expire between 2008–2019, £45 million (2006 – £21 million) are due to expire between 2020–2028 and £3,581 million (2006 – £3,590 million) which are available indefinitely. The Group had capital losses at 31st December 2007 of approximately £9 billion in respect of which no deferred tax asset has been recognised. A substantial part of both income tax and capital losses are still subject to agreement by relevant tax authorities. Deferred tax assets are recognised where it is probable that future taxable profit will be available to utilise losses. | GSK Annual Report 2007 | 109 | | |
Back to Contents | | | FINANCIAL STATEMENTS | | Notes to the financial statements | | | | | | | Notes to the financial statements | | continued | |
1315 Earnings per share
| 2006 | | 2005 | | 2004 | | | 2007 | | 2006 | | 2005 | | | p | | p | | p | | | pence | | pence | | pence | |
|
| |
| | | Basic earnings per share | 95.5 | | 82.6 | | 68.1 | | | 94.4 | | 95.5 | | 82.6 | | | Adjustment for restructuring costs | | | 4.7 | |
| |
| | | Business performance earnings per share (basic) | | | 99.1 | |
| |
| | | Diluted earnings per share | 94.5 | | 82.0 | | 68.0 | | | 93.7 | | 94.5 | | 82.0 | | | Adjustment for restructuring costs | | | 4.6 | |
|
| |
| | | Business performance earnings per share (diluted) | | | 98.3 | |
| |
| |
Basic and adjusted earnings per share have been calculated by dividing the profit attributable to shareholders by the weighted average number of shares in issue during the period after deducting shares held by the ESOP Trusts and treasuryTreasury shares. Adjusted earnings per share is calculated using business performance earnings. The calculation of business performance, a supplemental non-IFRS measure, is described in Note 1 ‘Presentation of the financial statements’. Diluted earnings per share have been calculated after adjusting the weighted average number of shares used in the basic calculation to assume the conversion of all potentially dilutive shares. A potentially dilutive share forms part of the employee share schemes where its exercise price is below the average market price of GSK shares during the period and any performance conditions attaching to the scheme have been met at the balance sheet date. The numbernumbers of shares used in calculating basic and diluted earnings per share are reconciled below. | | | | 2007 | | 2006 | | 2005 | | | Weighted average number of shares in issue | millions | | millions | | millions | | | millions | | millions | | millions | |
|
| |
| | | Basic | 5,643 | | 5,674 | | 5,736 | | | 5,524 | | 5,643 | | 5,674 | | | Dilution for share options | 57 | | 46 | | 12 | | | 43 | | 57 | | 46 | |
|
| |
| | | Diluted | 5,700 | | 5,720 | | 5,748 | | | 5,567 | | 5,700 | | 5,720 | |
|
| |
| |
Shares held by the ESOP Trusts are excluded. The trustees have waived their rights to dividends on the shares held by the ESOP Trusts. 1416 Dividends
| 2007 | | | First interim | | Second interim | | Third interim | | Fourth interim | | Total | |
| |
| | | Total dividend (£m) | | | 670 | | 667 | | 708 | | 860 | | 2,905 | | | Dividend per share (pence) | | | 12 | | 12 | | 13 | | 16 | | 53 | | | Paid/payable | | | 12th July 2007 | | 11th October 2007 | | 10th January 2008 | | 10th April 2008 | |
| |
| | | | | | | 2006 | | First interim | | Second interim | | Third interim | | Fourth interim | | Total | | |
|
| |
| | | Total dividend (£m) | | 619 | | 620 | | 671 | | 785 | | 2,695 | | | 619 | | 620 | | 671 | | 785 | | 2,695 | | | Dividend per share (pence) | | 11 | | 11 | | 12 | | 14 | | 48 | | | 11 | | 11 | | 12 | | 14 | | 48 | | | Paid | | | 6th July 2006 | | 5th October 2006 | | 4th January 2007 | | 12th April 2007 | | | | | | | | | | | | | | |
| | | Paid/payable | | 6th July 2006 | | 5th October 2006 | | 4th January 2007 | | 12th April 2007 | | | | |
|
| | | | 2005 | | | | | | | | | | | | |
|
| |
| | | Total dividend (£m) | | 568 | | 567 | | 568 | | 791 | | 2,494 | | | 568 | | 567 | | 568 | | 791 | | 2,494 | | | Dividend per share (pence) | | 10 | | 10 | | 10 | | 14 | | 44 | | | 10 | | 10 | | 10 | | 14 | | 44 | | | | | | | | | | | | | | | | | Paid | | 7th July 2005 | | 6th October 2005 | | 5th January 2006 | | 6th April 2006 | | | | | 7th July 2005 | | 6th October 2005 | | 5th January 2006 | | 6th April 2006 | |
|
| |
| | | 2004 | | | | | | | | | | | | |
| | | | Total dividend (£m) | | 575 | | 573 | | 571 | | 684 | | 2,403 | | | | Dividend per share (pence) | | 10 | | 10 | | 10 | | 12 | | 42 | | | | | | | | | | | | | | | | | | Paid | | 1st July 2004 | | 30th September 2004 | | 6th January 2005 | | 7th April 2005 | | | | |
| | |
Under IFRS interim dividends are only recognised in the financial statements when paid and not when declared. GSK normally pays a dividend two quarters after the quarter to which it relates and one quarter after it is declared. The 20062007 financial statements recognise those dividends paid in 2006,2007, namely the third and fourth interim dividends for 20052006 and the first and second interim dividends for 2006.2007. The amounts recognised in each year are as follows: | 2006 | | 2005 | | 2004 | | | £m | | £m | | £m | |
|
|
|
|
|
| | | Dividends to shareholders | 2,598 | | 2,390 | | 2,476 | |
|
|
|
|
|
| |
| | | 2007 | | 2006 | | 2005 | | | | | £m | | £m | | £m | |
|
|
|
|
|
|
| | | Dividends to shareholders | | 2,793 | | 2,598 | | 2,390 | |
|
|
|
|
|
|
| | | | | | | | | | |
| 110 |
| GSK Annual Report 20062007 | 102 | |
Back to Contents | | | Notes to the financial statements | | | | | | | | Notes to the financial statements | | continued |
|
| | | | | | | | | | | 15 Property, plant and equipment | | | Plant, | | | | | | | Land and | | equipment | | Assets in | | | | | buildings | | and vehicles | | construction | | Total | | | £m | | £m | | £m | | £m | |
|
|
|
|
|
|
|
| | | Cost at 1st January 2005 | 4,062 | | 7,512 | | 682 | | 12,256 | | | Exchange adjustments | 136 | | 183 | | 19 | | 338 | | | Additions | 54 | | 307 | | 640 | | 1,001 | | | Additions through business combinations | 32 | | 45 | | 33 | | 110 | | | Disposals and write-offs | (82 | ) | (404 | ) | (4 | ) | (490 | ) | | Reclassifications | 83 | | 255 | | (348 | ) | (10 | ) | | Transfer to assets held for sale | (4 | ) | (11 | ) | – | | (15 | ) |
|
|
|
|
|
|
|
| | | Cost at 31st December 2005 | 4,281 | | 7,887 | | 1,022 | | 13,190 | | | Exchange adjustments | (232 | ) | (295 | ) | (65 | ) | (592 | ) | | Additions | 100 | | 403 | | 982 | | 1,485 | | | Additions through business combinations | – | | 5 | | – | | 5 | | | Disposals and write-offs | (44 | ) | (578 | ) | (5 | ) | (627 | ) | | Reclassifications | 153 | | 358 | | (511 | ) | – | | | Transfer to assets held for sale | (14 | ) | (4 | ) | – | | (18 | ) |
|
|
|
|
|
|
|
| | | Cost at 31st December 2006 | 4,244 | | 7,776 | | 1,423 | | 13,443 | |
|
|
|
|
|
|
|
| | | Depreciation at 1st January 2005 | (1,171 | ) | (4,578 | ) | – | | (5,749 | ) | | Exchange adjustments | (38 | ) | (119 | ) | – | | (157 | ) | | Provision for the year | (125 | ) | (585 | ) | – | | (710 | ) | | Disposals and write-offs | 43 | | 356 | | – | | 399 | | | Reclassifications | – | | 1 | | – | | 1 | | | Transfer to assets held for sale | 1 | | 10 | | – | | 11 | |
|
|
|
|
|
|
|
| | | Depreciation at 31st December 2005 | (1,290 | ) | (4,915 | ) | – | | (6,205 | ) | | Exchange adjustments | 73 | | 196 | | – | | 269 | | | Provision for the year | (137 | ) | (595 | ) | – | | (732 | ) | | Disposals and write-offs | 23 | | 506 | | – | | 529 | | | Transfer to assets held for sale | 6 | | 3 | | – | | 9 | |
|
|
|
|
|
|
|
| | | Depreciation at 31st December 2006 | (1,325 | ) | (4,805 | ) | – | | (6,130 | ) |
|
|
|
|
|
|
|
| | | Impairment at 1st January 2005 | (136 | ) | (147 | ) | (27 | ) | (310 | ) | | Exchange adjustments | (9 | ) | (2 | ) | – | | (11 | ) | | Disposals and write-offs | 10 | | 2 | | 2 | | 14 | | | Impairment losses | (13 | ) | (18 | ) | – | | (31 | ) | | Reversal of impairments | – | | 3 | | – | | 3 | | | Transfer to assets held for sale | 2 | | – | | – | | 2 | |
|
|
|
|
|
|
|
| | | Impairment at 31st December 2005 | (146 | ) | (162 | ) | (25 | ) | (333 | ) | | Exchange adjustments | 13 | | 4 | | 3 | | 20 | | | Disposals and write-offs | 12 | | 10 | | 2 | | 24 | | | Impairment losses | (46 | ) | (107 | ) | (2 | ) | (155 | ) | | Reversal of impairments | 26 | | 24 | | 11 | | 61 | |
|
|
|
|
|
|
|
| | | Impairment at 31st December 2006 | (141 | ) | (231 | ) | (11 | ) | (383 | ) |
|
|
|
|
|
|
|
| | | Total depreciation and impairment at 31st December 2005 | (1,436 | ) | (5,077 | ) | (25 | ) | (6,538 | ) | | Total depreciation and impairment at 31st December 2006 | (1,466 | ) | (5,036 | ) | (11 | ) | (6,513 | ) |
|
|
|
|
|
|
|
| | | Net book value at 1st January 2005 | 2,755 | | 2,787 | | 655 | | 6,197 | |
|
|
|
|
|
|
|
| | | Net book value at 31st December 2005 | 2,845 | | 2,810 | | 997 | | 6,652 | |
|
|
|
|
|
|
|
| | | Net book value at 31st December 2006 | 2,778 | | 2,740 | | 1,412 | | 6,930 | |
|
|
|
|
|
|
|
| |
17 Property, plant and equipment | | | | Plant, | | | | | | | | Land and | | equipment | | Assets in | | | | | | buildings | | and vehicles | | construction | | Total | | | | £m | | £m | | £m | | £m | |
|
|
|
|
|
|
|
| | | Cost at 1st January 2006 | 4,281 | | 7,887 | | 1,022 | | 13,190 | | | Exchange adjustments | (232 | ) | (295 | ) | (65 | ) | (592 | ) | | Additions | 100 | | 403 | | 982 | | 1,485 | | | Additions through business combinations | – | | 5 | | – | | 5 | | | Disposals and write-offs | (44 | ) | (578 | ) | (5 | ) | (627 | ) | | Reclassifications | 153 | | 358 | | (511 | ) | – | | | Transfer to assets held for sale | (14 | ) | (4 | ) | – | | (18 | ) |
|
|
|
|
|
|
|
| | | Cost at 31st December 2006 | 4,244 | | 7,776 | | 1,423 | | 13,443 | | | Exchange adjustments | 143 | | 229 | | 61 | | 433 | | | Additions | 140 | | 401 | | 1,042 | | 1,583 | | | Additions through business combinations | 1 | | 7 | | – | | 8 | | | Disposals and write-offs | (20 | ) | (309 | ) | (16 | ) | (345 | ) | | Reclassifications | 134 | | 418 | | (552 | ) | – | | | Transfer to assets held for sale | (8 | ) | (25 | ) | (2 | ) | (35 | ) |
|
|
|
|
|
|
|
| | | Cost at 31st December 2007 | 4,634 | | 8,497 | | 1,956 | | 15,087 | |
|
|
|
|
|
|
|
| | | Depreciation at 1st January 2006 | (1,290 | ) | (4,915 | ) | – | | (6,205 | ) | | Exchange adjustments | 73 | | 196 | | – | | 269 | | | Provision for the year | (137 | ) | (595 | ) | – | | (732 | ) | | Disposals and write-offs | 23 | | 506 | | – | | 529 | | | Transfer to assets held for sale | 6 | | 3 | | – | | 9 | |
|
|
|
|
|
|
|
| | | Depreciation at 31st December 2006 | (1,325 | ) | (4,805 | ) | – | | (6,130 | ) | | Exchange adjustments | (45 | ) | (125 | ) | – | | (170 | ) | | Provision for the year | (177 | ) | (619 | ) | – | | (796 | ) | | Disposals and write-offs | 10 | | 242 | | – | | 252 | | | Transfer to assets held for sale | 3 | | 17 | | – | | 20 | |
|
|
|
|
|
|
|
| | | Depreciation at 31st December 2007 | (1,534 | ) | (5,290 | ) | – | | (6,824 | ) |
|
|
|
|
|
|
|
| | | Impairment at 1st January 2006 | (146 | ) | (162 | ) | (25 | ) | (333 | ) | | Exchange adjustments | 13 | | 4 | | 3 | | 20 | | | Disposals and write-offs | 12 | | 10 | | 2 | | 24 | | | Impairment losses | (46 | ) | (107 | ) | (2 | ) | (155 | ) | | Reversal of impairments | 26 | | 24 | | 11 | | 61 | |
|
|
|
|
|
|
|
| | | Impairment at 31st December 2006 | (141 | ) | (231 | ) | (11 | ) | (383 | ) |
|
|
|
|
|
|
|
| | | Exchange adjustments | (2 | ) | (3 | ) | (1 | ) | (6 | ) | | Disposals and write-offs | 7 | | 32 | | 5 | | 44 | | | Impairment losses | (29 | ) | (53 | ) | (82 | ) | (164 | ) | | Reversal of impairments | 43 | | 16 | | 8 | | 67 | |
|
|
|
|
|
|
|
| | | Impairment at 31st December 2007 | (122 | ) | (239 | ) | (81 | ) | (442 | ) |
|
|
|
|
|
|
|
| | | Total depreciation and impairment at 31st December 2006 | (1,466 | ) | (5,036 | ) | (11 | ) | (6,513 | ) | | Total depreciation and impairment at 31st December 2007 | (1,656 | ) | (5,529 | ) | (81 | ) | (7,266 | ) |
|
|
|
|
|
|
|
| | | Net book value at 1st January 2006 | 2,845 | | 2,810 | | 997 | | 6,652 | |
|
|
|
|
|
|
|
| | | Net book value at 31st December 2006 | 2,778 | | 2,740 | | 1,412 | | 6,930 | |
|
|
|
|
|
|
|
| | | Net book value at 31st December 2007 | 2,978 | | 2,968 | | 1,875 | | 7,821 | |
|
|
|
|
|
|
|
| |
The net book value at 31st December 20062007 of the Group’s land and buildings comprises freehold properties £2,632£2,752 million (2005(2006 – £2,635£2,632 million), properties with leases of 50 years or more £116£168 million (2005(2006 – £155£116 million) and properties with leases of less than 50 years £30£58 million (2005(2006 – £55£30 million). |
| GSK Annual Report 20062007 | 111 | 103 | |
Back to Contents | | FINANCIAL STATEMENTS | | Notes to the financial statements | | | | | | | Notes to the financial statements | | continued |
|
1517 Property, plant and equipmentcontinued
Included in land and buildings at 31st December 20062007 are leased assets with a cost of £241£424 million (2005(2006 – £165£241 million), accumulated amortisationdepreciation of £95£198 million (2005(2006 – £49£95 million) and a net book value of £146£226 million (2005(2006 – £116£146 million). Included in plant, equipment and vehicles at 31st December 20062007 are leased assets with a cost of £263£180 million (2005(2006 – £153£263 million), accumulated amortisationdepreciation of £81 million (2006 – £97 million (2005 – £57 million), and a net book value of £166£99 million (at 1st January 20062007 – £96£166 million). Some lease agreements include renewal or purchase options or escalation clauses. The impairment losses principally arise from decisions to rationalise facilities and are calculated based on either fair value less costs to sell or value in use. The value in use calculations determine the net present value of the projected risk-adjusted, post-tax cash flows of the relevant asset or cash generating unit, applying a discount rate of the Group post-tax weighted average cost of capital of 8%, adjusted where appropriate for country specific risks. TheseWhere an impairment is indicated a pre-tax cash flow calculation is expected to give a materially different result, the test would be reperformed using pre-tax cash flows and a pre-tax discount rate. The impairment losses have been charged through cost of sales £125 million,(£117 million), R&D £22 million,(£44 million) and SG&A £8 million.(£3 million). Reversals of impairment arise from subsequent reviews of the impaired assets where the conditions which gave rise to the original impairments are deemed no longer to apply. The principal component of the 2006 reversals relates to the Montrose manufacturing facility, and allAll of the reversals have been credited to cost of sales. The principal component of the 2007 reversals relates to the Suzhou pharmaceuticals manufacturing facility, where a planned withdrawal of manufacturing of a key product has been terminated. The recoverable amount has been calculated by applying a value in use calculation and a 12% discount rate. | 16 Goodwill | 2006 | | 2005 | | | £m | | £m | |
|
|
|
| | | Cost at 1st January | 696 | | 304 | | | Exchange adjustments | (54 | ) | 10 | | | Additions through business combinations | 126 | | 383 | | | Disposals | – | | (1 | ) | | Impairments | (10 | ) | – | |
|
|
|
| | | Cost at 31st December | 758 | | 696 | |
|
|
|
| | | Net book value at 1st January | 696 | | 304 | |
|
|
|
| | | Net book value at 31st December | 758 | | 696 | |
|
|
|
| |
18 Goodwill | | 2007 | | 2006 | | | £m | £m |
|
|
|
| | | Cost at 1st January | 758 | | 696 | | | Exchange adjustments | 81 | | (54 | ) | | Additions through business combinations | 533 | | 126 | | | Impairments | (2 | ) | (10 | ) |
|
|
|
| | | Cost at 31st December | 1,370 | | 758 | |
|
|
|
| | | Net book value at 1st January | 758 | | 696 | |
|
|
|
| | | Net book value at 31st December | 1,370 | | 758 | |
|
|
|
| |
The additions for the year comprise £112£350 million on the acquisition of CNS,Reliant Pharmaceuticals, Inc., £8£181 million on the acquisition of Pliva Research Institute,Domantis Limited and a further £6£2 million on the acquisition of the minority interest held in GlaxoSmithKline K.K.Praecis Pharmaceuticals Inc. See Note 3638, ‘Acquisitions and disposals’ for further details. The impairments in the year of £10£2 million relate to the Europharm business located in Romania and were determined using the fair value less costs to sell model. The carrying value of goodwill is made up of balances arising on acquisition of the following companies: | | 2006 | | 2005 | | 2007 | | 2006 | | | | £m | | £m | | £m | | £m | |
|
| |
| | | ID Biomedical Corporation | 316 | | 358 | | 367 | | 316 | | | Reliant Pharmaceuticals, Inc. | | 356 | | – | | | Domantis Limited | | 181 | | – | | | CNS, Inc. | 112 | | – | | 111 | | 112 | | | Nippon Glaxo | 134 | | 143 | | | | GlaxoSmithKline K.K. | | 140 | | 134 | | | Polfa Poznan S.A. | 96 | | 98 | | 111 | | 96 | | | Corixa Corporation | 25 | | 28 | | 24 | | 25 | | | Others | 75 | | 69 | | 80 | | 75 | |
|
| |
| | | | 758 | | 696 | | 1,370 | | 758 | |
|
| |
| |
Goodwill is allocated to cash generating units which are tested for impairment at least annually. The recoverable amounts of the cash generating units are assessed using a value in use or a fair value less costs to sell model, depending on the nature of the unit. Value in use is calculated as the net present value of the projected risk-adjusted, five-year post-tax cash flows plus a terminal value of the cash generating unit to which the goodwill is allocated. Initially a post-tax discount rate based on the Group’s weighted average cost of capital of 8%, adjusted where appropriate for country specific risks, is applied to calculate the net present value of the post-tax cash flows. Where this indicates that the recoverable value of the unit is close to or below its carrying value, the impairment test is reperformed using a pre-tax discount rate and pre-tax cash flows in order to determine if an impairment exists and to establish its magnitude. Fair value is calculated using a discounted cash flow approach, which in this case is based on the Group’s acquisition valuation model. A post-tax discount rate based on the Group’s weighted average cost of capital is applied, adjusted where appropriate for country specific risks. This rate is applied to projected risk-adjusted post-tax cash flows. | 112 | GSK Annual Report 2007 | | |
Back to Contents | | | FINANCIAL STATEMENTS | | | Notes to the financial statements | | | | | | | | Notes to the financial statements | | continued | |
18 Goodwillcontinued The cash generating units for which the carrying amount of goodwill allocated to the unit is significant in comparison with the total goodwill balance are Vaccines, Consumer Healthcare, US Pharmaceuticals, worldwide Pharmaceuticals, Japan and Poland. Total goodwill of £362£414 million (2005(2006 – £407£362 million), principally relating to the acquisitions of ID Biomedical and Corixa, is allocated to the Vaccines unit. The recoverable value of this unit is determined using the fair value less costs to sell model. Goodwill arising on the acquisition of the minority interest in Nippon GlaxoGlaxoSmithKine K.K. of £134£140 million (2005(2006 – £143£134 million) and on the acquisition of Polfa Poznan of £96£111 million (2005(2006 – £98£96 million) is allocated to the Japan and Poland cash generating units respectively. The recoverable value of both these units is determined using the value in use model. Goodwill arising on the acquisition of CNS, Inc. in December 2006 is allocated to the Consumer Healthcare cash generating unit. As Domantis Limited is a research operation, the goodwill arising on the acquisition has been allocated to the worldwide Pharmaceuticals cash generating unit. Goodwill arising on the acquisition of Reliant Pharmaceuticals, Inc. in December 2007 is allocated to the US Pharmaceuticals cash generating unit. 19 Other intangible assets | | Computer | | Licences, | | Amortised | | Indefinite life | | | | | software | patents, etc. | brands | brands | Total | | £m | £m | £m | £m | £m |
|
|
|
|
|
|
|
|
|
| | | Cost at 1st January 2006 | 685 | | 2,399 | | 73 | | 1,184 | | 4,341 | | | Exchange adjustments | (23 | ) | (204 | ) | (9 | ) | (62 | ) | (298 | ) | | Additions | 90 | | 138 | | – | | – | | 228 | | | Additions through business combinations | – | | 29 | | – | | 187 | | 216 | | | Disposals and asset write-offs | (37 | ) | (80 | ) | – | | – | | (117 | ) |
|
|
|
|
|
|
|
|
|
| | | Cost at 31st December 2006 | 715 | | 2,282 | | 64 | | 1,309 | | 4,370 | | | Exchange adjustments | 9 | | 128 | | (1 | ) | 44 | | 180 | | | Additions | 85 | | 339 | | 203 | | – | | 627 | | | Additions through business combinations | 1 | | 670 | | – | | – | | 671 | | | Disposals and asset write-offs | (8 | ) | (26 | ) | – | | – | | (34 | ) | | Transfer to assets held for sale | (1 | ) | – | | – | | – | | (1 | ) |
|
|
|
|
|
|
|
|
|
| | | Cost at 31st December 2007 | 801 | | 3,393 | | 266 | | 1,353 | | 5,813 | |
|
|
|
|
|
|
|
|
|
| | | Amortisation at 1st January 2006 | (399 | ) | (381 | ) | (4 | ) | – | | (784 | ) | | Exchange adjustments | 13 | | 37 | | 1 | | – | | 51 | | | Provision for the year | (87 | ) | (138 | ) | (1 | ) | – | | (226 | ) | | Disposals and asset write-offs | 29 | | 7 | | – | | – | | 36 | |
|
|
|
|
|
|
|
|
|
| | | Amortisation at 31st December 2006 | (444 | ) | (475 | ) | (4 | ) | – | | (923 | ) | | Exchange adjustments | (8 | ) | (13 | ) | (1 | ) | – | | (22 | ) | | Provision for the year | (80 | ) | (141 | ) | (5 | ) | – | | (226 | ) | | Disposals and asset write-offs | 1 | | 7 | | – | | – | | 8 | | | Transfer to assets held for sale | 1 | | – | | – | | – | | 1 | |
|
|
|
|
|
|
|
|
|
| | | Amortisation at 31st December 2007 | (530 | ) | (622 | ) | (10 | ) | – | | (1,162 | ) |
|
|
|
|
|
|
|
|
|
| | | Impairment at 1st January 2006 | (23 | ) | (127 | ) | – | | (24 | ) | (174 | ) | | Exchange adjustments | – | | 29 | | – | | 3 | | 32 | | | Impairment losses | (9 | ) | (80 | ) | – | | – | | (89 | ) | | Disposals and asset write-offs | 8 | | 69 | | – | | – | | 77 | |
|
|
|
|
|
|
|
|
|
| | | Impairment at 31st December 2006 | (24 | ) | (109 | ) | – | | (21 | ) | (154 | ) | | Exchange adjustments | – | | (6 | ) | – | | – | | (6 | ) | | Impairment losses | – | | (54 | ) | – | | – | | (54 | ) | | Disposals and asset write-offs | – | | 19 | | – | | – | | 19 | |
|
|
|
|
|
|
|
|
|
| | | Impairment at 31st December 2007 | (24 | ) | (150 | ) | – | | (21 | ) | (195 | ) |
|
|
|
|
|
|
|
|
|
| | | Total amortisation and impairment at 31st December 2006 | (468 | ) | (584 | ) | (4 | ) | (21 | ) | (1,077 | ) | | Total amortisation and impairment at 31st December 2007 | (554 | ) | (772 | ) | (10 | ) | (21 | ) | (1,357 | ) |
|
|
|
|
|
|
|
|
|
| | | Net book value at 1st January 2006 | 263 | | 1,891 | | 69 | | 1,160 | | 3,383 | |
|
|
|
|
|
|
|
|
|
| | | Net book value at 31st December 2006 | 247 | | 1,698 | | 60 | | 1,288 | | 3,293 | |
|
|
|
|
|
|
|
|
|
| | | Net book value at 31st December 2007 | 247 | | 2,621 | | 256 | | 1,332 | | 4,456 | |
|
|
|
|
|
|
|
|
|
| | | | | | | | | | | | | |
|
| GSK Annual Report 20062007 | 113 | 104 | |
Back to Contents | | FINANCIAL STATEMENTS | | Notes to the financial statements | continued | |
| |
| | | | | | | | | | | 17 Other intangible assets | Computer | | Licences, | | | | | | | software | | patents, etc. | | Brands | | Total | | | £m | | £m | | £m | | £m | |
|
|
|
|
|
|
|
| | | Cost at 1st January 2005 | 609 | | 1,449 | | 1,143 | | 3,201 | | | Exchange adjustments | 13 | | 72 | | 41 | | 126 | | | Additions | 62 | | 207 | | – | | 269 | | | Additions through business combinations | – | | 816 | | – | | 816 | | | Disposals and asset write-offs | (9 | ) | (72 | ) | – | | (81 | ) | | Reclassifications from property, plant and equipment | 10 | | – | | – | | 10 | |
|
|
|
|
|
|
|
| | | Cost at 31st December 2005 | 685 | | 2,472 | | 1,184 | | 4,341 | | | Exchange adjustments | (23 | ) | (213 | ) | (62 | ) | (298 | ) | | Additions | 90 | | 138 | | – | | 228 | | | Additions through business combinations | – | | 29 | | 187 | | 216 | | | Disposals and asset write-offs | (37 | ) | (80 | ) | – | | (117 | ) |
|
|
|
|
|
|
|
| | | Cost at 31st December 2006 | 715 | | 2,346 | | 1,309 | | 4,370 | |
|
|
|
|
|
|
|
| | | Amortisation at 1st January 2005 | (314 | ) | (265 | ) | – | | (579 | ) | | Exchange adjustments | (6 | ) | (21 | ) | – | | (27 | ) | | Provision for the year | (85 | ) | (109 | ) | – | | (194 | ) | | Disposals and asset write-offs | 7 | | 10 | | – | | 17 | | | Reclassifications from property, plant and equipment | (1 | ) | – | | – | | (1 | ) |
|
|
|
|
|
|
|
| | | Amortisation at 31st December 2005 | (399 | ) | (385 | ) | – | | (784 | ) | | Exchange adjustments | 13 | | 38 | | – | | 51 | | | Provision for the year | (87 | ) | (139 | ) | – | | (226 | ) | | Disposals and asset write-offs | 29 | | 7 | | – | | 36 | |
|
|
|
|
|
|
|
| | | Amortisation at 31st December 2006 | (444 | ) | (479 | ) | – | | (923 | ) |
|
|
|
|
|
|
|
| | | Impairment at 1st January 2005 | (23 | ) | (65 | ) | (21 | ) | (109 | ) | | Exchange adjustments | – | | (2 | ) | (2 | ) | (4 | ) | | Impairment losses | (1 | ) | (60 | ) | (1 | ) | (62 | ) | | Disposals and asset write-offs | 1 | | – | | – | | 1 | |
|
|
|
|
|
|
|
| | | Impairment at 31st December 2005 | (23 | ) | (127 | ) | (24 | ) | (174 | ) | | Exchange adjustments | – | | 29 | | 3 | | 32 | | | Impairment losses | (9 | ) | (80 | ) | – | | (89 | ) | | Disposals and asset write-offs | 8 | | 69 | | – | | 77 | |
|
|
|
|
|
|
|
| | | Impairment at 31st December 2006 | (24 | ) | (109 | ) | (21 | ) | (154 | ) |
|
|
|
|
|
|
|
| | | Total amortisation and impairment at 31st December 2005 | (422 | ) | (512 | ) | (24 | ) | (958 | ) | | Total amortisation and impairment at 31st December 2006 | (468 | ) | (588 | ) | (21 | ) | (1,077 | ) |
|
|
|
|
|
|
|
| | | Net book value at 1st January 2005 | 272 | | 1,119 | | 1,122 | | 2,513 | |
|
|
|
|
|
|
|
| | | Net book value at 31st December 2005 | 263 | | 1,960 | | 1,160 | | 3,383 | |
|
|
|
|
|
|
|
| | | Net book value at 31st December 2006 | 247 | | 1,758 | | 1,288 | | 3,293 | |
|
|
|
|
|
|
|
| |
| |
| GSK Annual Report 2006 | 105 |
Back to Contents
| | Notes to the financial statements | | continued |
|
| 19 Other intangible assetscontinued | | | | | | Amortisation and impairment have been charged in the income statement as follows: | | | | | | | Amortisation | | Impairment | | | | £m | | £m | |
|
|
|
| | | Cost of sales | 32 | | – | | | Selling, general and administration | 123 | | 3 | | | Research and development | 71 | | 51 | |
|
|
|
| | | Total amortisation and impairment | 226 | | 54 | |
|
|
|
| |
17 Other intangible assetscontinued
Amortisation and impairment have been charged through Research and development, and Selling, general and administration. At 31st December 2006, the net book value of computer software included £28 million that had been internally generated.
The additions through business combinations in the year of £216£671 million include £207£603 million from CNS, Inc.in respect ofLovaza, acquired with the acquisition of Reliant Pharmaceuticals (see Note 36)38, ‘Acquisitions and disposals’). Included within other additions are internally generated costs of £41 million (2006 – £25 million) relating to computer software and £6 million (2006 – £nil) relating to other intangible assets. At 31st December 2007, the net book value included £136 million (2006 – £112 million) of internally generated costs of which £130 million (2006 – £112 million) related to computer software and £6 million (2006 – £nil) related to other intangible assets. BrandsAmortised brands include OTC rights relating toalli, acquired from Roche, of £249 million (2006 – £51 million).
Indefinite life brands comprise a portfolio of products acquired with the acquisitions of Sterling Winthrop, Inc. in 1994, The Block Drug Company, Inc. in 2001 and CNS, Inc., in 2006. The book values of the major brands are as follows: | | 2006 | | 2005 | | 2007 | | 2006 | | | | £m | | £m | | £m | | £m | |
|
| |
| | | Panadol | 317 | | 340 | | 330 | | 317 | | | Sensodyne | 220 | | 230 | | 231 | | 220 | | | Breathe Right | 169 | | – | | 165 | | 169 | | | Polident | 93 | | 97 | | 98 | | 93 | | | Corega | 83 | | 87 | | 87 | | 83 | | | Poligrip | 57 | | 60 | | 60 | | 57 | | | Solpadeine | 56 | | 56 | | 57 | | 56 | | | Others | 293 | | 290 | | 304 | | 293 | |
|
| |
| | | | 1,288 | | 1,160 | | 1,332 | | 1,288 | |
|
| |
| |
Each of these brands is considered to have an indefinite life, given the strength and durability of the brand and the level of marketing support. The brands are in relatively similar stable and profitable market sectors, with similar risk profiles, and their size, diversification and market shares mean that the risk of market-related factors causing a shorteningreduction in the lives of the brands’ livesbrands is considered to be relatively low. The Group is not aware of any material legal, regulatory, contractual, competitive, economic or other factor which could limit their useful lives. Accordingly, they are not amortised. Each brand is tested annually for impairment applying a fair value less costs to sell methodology, and using five year post-tax cash flow forecasts with a terminal value calculation and applying a discount rate ofequal to the Group post-tax weighted average cost of capital of 8%, adjusted where appropriate for country-specific risks. The main assumptions include future sales prices and volumes, product contribution, the future expenditure required to maintain the product’s marketability and registration in the relevant jurisdiction and the product’s useful economic life. These assumptions are reviewed as part of management’s budgeting and strategic planning cycle for changes in market conditions and sales erosion through competition. | 18 Investments in associates and joint ventures | Joint | | Associated | | 2006 | | 2005 | | | ventures | | undertakings | | Total | | Total | | | £m | | £m | | £m | | £m | |
|
|
|
|
|
|
|
| | | At 1st January | 14 | | 262 | | 276 | | 209 | | | Implementation of accounting for financial instruments under IAS 39 | – | | – | | – | | (7 | ) |
|
|
|
|
|
|
|
| | | At 1st January, as adjusted | 14 | | 262 | | 276 | | 202 | | | Exchange adjustments | (2 | ) | (35 | ) | (37 | ) | 26 | | | Additions | 8 | | 5 | | 13 | | 2 | | | Fair value adjustment | – | | 1 | | 1 | | – | | | Retained profit for the year | (4 | ) | 46 | | 42 | | 46 | |
|
|
|
|
|
|
|
| | | At 31st December | 16 | | 279 | | 295 | | 276 | |
|
|
|
|
|
|
|
| |
| | | | | | | | | | | 20 Investments in associates and joint ventures | | | | | | | | | | | Joint | | Associated | | 2007 | | 2006 | | | | ventures | | undertakings | | Total | | Total | | | | £m | | £m | | £m | | £m | |
|
|
|
|
|
|
|
| | | At 1st January | 16 | | 279 | | 295 | | 276 | | | Exchange adjustments | – | | (4 | ) | (4 | ) | (37 | ) | | Additions | – | | 1 | | 1 | | 13 | | | Fair value adjustment | – | | 1 | | 1 | | 1 | | | Retained (loss)/profit for the year | (1 | ) | 37 | | 36 | | 42 | |
|
|
|
|
|
|
|
| | | At 31st December | 15 | | 314 | | 329 | | 295 | |
|
|
|
|
|
|
|
| |
The principal associated undertaking is Quest Diagnostics Inc., a US clinical laboratory business listed on the New York Stock Exchange. The investment had a book value at 31st December 20062007 of £262£299 million (2005(2006 – £244£262 million) and a market value of £987£970 million (2005(2006 – £1,093£987 million). At 31st December 2006,2007, the Group owned 18.7%18.9% of Quest (2005(2006 – 18.4%18.7%) . Although the Group holds less than 20% of the ownership interest and voting control in Quest, the Group has the ability to exercise significant influence through both its significant shareholding and its nominated director’s active participation on the Quest Board of Directors and Board sub-committees. | 114 |
| GSK Annual Report 20062007 | 106 | |
Back to Contents | | | Notes to the financial statements | | | | | | | | Notes to the financial statements | | continued |
|
1820 Investments in associates and joint venturescontinued
| Summarised balance sheet information in respect of the Group’s associates is set out below: | 2006 | | 2005 | | | | | | | £m | | £m | | | | | | 2007 | | 2006 | | | | | £m | | £m | |
|
| |
| | | Total assets | 2,930 | | 3,134 | | 4,342 | | 2,930 | | | Total liabilities | (1,350 | ) | (1,481 | ) | (2,634 | ) | (1,350 | ) |
|
| |
| | | Net assets | 1,580 | | 1,653 | | 1,708 | | 1,580 | |
|
| |
| | | Group’s share of associates‘ net assets | 279 | | 262 | | | | Group’s share of associates’ net assets | | 314 | | 279 | |
|
| |
| |
Investments in joint ventures comprise £22£21 million share of gross assets (2005(2006 – £17£22 million) and £6 million share of gross liabilities (2005(2006 – £3£6 million). These principally arise from 50% interests in two joint ventures, Shionogi-GlaxoSmithKline Holdings, L.P., which is developing specified chemical compounds, and GlaxoSmithKline Shire BioChem,Canada, which primarily co-marketsCombivir,TrizivirandEpivirin certain territories, together with a 29%30% interest in another joint venture, Pharmaceutical Insurance Limited, which is a mutual insurance company covering pharmaceutical property risk. In 2002, GSK hedged part of the equity value of its holding in Quest Diagnostics Inc. through a series of variable sale forward contracts. The contracts (‘the equity collar’) were renewed in 2006 and are structured in five series, each over two million Quest shares, and mature between 2010 and 2012. The fair value of the contracts at 31st December 20062007 was a liability of $24$4 million (2005(2006 – $24 million). | 19 Other investments | 2006 | | 2005 | | | £m | | £m | |
|
|
|
| | | At 1st January | 362 | | 298 | | | Implementation of accounting for financial instruments under IAS 39 | – | | 61 | |
|
|
|
| | | At 1st January as adjusted | 362 | | 359 | | | Exchange adjustments | (45 | ) | 33 | | | Additions | 57 | | 23 | | | Fair value movements | 116 | | 14 | | | Impairments | (16 | ) | (35 | ) | | Transfers | – | | (12 | ) | | Disposals | (33 | ) | (20 | ) |
|
|
|
| | | At 31st December | 441 | | 362 | |
|
|
|
| |
A second series of hedging contracts over an additional 10 million shares was entered into on 15th February 2007. These contracts are also structured in five series, each over two million Quest shares, and mature between 2013 and 2015. The fair value of the contracts at 31st December 2007 was an asset of $15 million. | | | | | | | 21 Other investments | | | | | | | 2007 | | 2006 | | | | £m | | £m | |
|
|
|
| | | At 1st January | 441 | | 362 | | | Exchange adjustments | 12 | | (45 | ) | | Additions | 206 | | 57 | | | Net fair value movements | (67 | ) | 116 | | | Impairments | (31 | ) | (16 | ) | | Disposals | (44 | ) | (33 | ) |
|
|
|
| | | At 31st December | 517 | | 441 | |
|
|
|
| |
Other investments comprise non-current equity investments which are available-for-sale investments recorded at fair value at each balance sheet date. For investments traded in an active market, the fair value is determined by reference to the relevant stock exchange quoted bid price. For other investments, the fair value is estimated by reference to the current market value of similar instruments or by reference to the discounted cash flows of the underlying net assets. The Group holds a number of equity investments, frequently in entities where the Group has entered into research collaborations. Equity investments are recorded as non-current assets unless they are expected to be sold within one year, in which case they are recorded as current assets. Non-current
The Group holds a number of equity investments in entities where the Group has entered into research collaborations. Other investments include listed investments of £348£413 million (2005(2006 – £268£348 million) that offer the Group the opportunity for return through dividend income and fair value gains. On disposal of investments, fair value movements are reclassified from reserves to the income statement based on average cost. The impairment losses recorded in the tables above have been recognised in the income statement for the year within other operating income, together with amounts recycled from the fair value reserve (Note 32)8, ‘Other operating income’) on recognition of the impairments. These impairments initially result from prolonged or significant declines in the fair value of the equity investments below acquisition cost, subsequent to which any further declines in fair value are immediately taken to the income statement. At 31st December 2007 impaired assets with a fair value of £97 million (2006 – £117 million) are included in other investments. | 20 Other non-current assets | | | | | | | | | | | | | 22 Other non-current assets | | | | | | | | 2006 | | 2005 | | 2007 | | 2006 | | | £m | | £m | | £m | | £m | |
|
| |
|
|
| | | Amounts recoverable under insurance contracts | 262 | | 265 | | 271 | | 262 | | | Derivative financial instruments | 113 | | 15 | | | | Pension schemes in surplus | 179 | | 12 | | 255 | | 179 | | | Other receivables | 167 | | 146 | | 161 | | 167 | |
|
| |
|
|
| | | | 721 | | 438 | | 687 | | 608 | |
|
| |
| | | | | |
|
| GSK Annual Report 20062007 | 115 | 107 |
Back to Contents
| Notes to the financial statements | continued |
|
21 Inventories
| | 2006 | | 2005 | | | | £m | | £m | |
|
|
|
| | | Raw materials and consumables | 764 | | 721 | | | Work in progress | 626 | | 552 | | | Finished goods | 1,047 | | 904 | |
|
|
|
| | | 2,437 | | 2,177 | |
|
|
|
| |
22 Trade and other receivables
| | 2006 | | 2005 | | | | £m | | £m | |
|
|
|
| | | Trade receivables | 4,356 | | 4,411 | | | Prepaid pension contributions | 1 | | 1 | | | Other prepayments and accrued income | 223 | | 285 | | | Interest receivable | 28 | | 42 | | | Employee loans and advances | 51 | | 59 | | | Derivative financial instruments | 80 | | 180 | | | Other receivables | 578 | | 370 | |
|
|
|
| | | 5,317 | | 5,348 | |
|
|
|
| |
Trade receivables include £13 million (2005 – £2 million) due from associates and joint ventures.
Movements in the bad and doubtful debt provision are as follows:
| | 2006 | | 2005 | | | | £m | | £m | |
|
|
|
| | | At 1st January | 140 | | 128 | | | Exchange adjustments | (9 | ) | 8 | | | Charge for the year | 12 | | 40 | | | Utilised | (39 | ) | (36 | ) |
|
|
|
| | | At 31st December | 104 | | 140 | |
|
|
|
| |
23 Cash and cash equivalents
| | 2006 | | 2005 | | | | £m | | £m | |
|
|
|
| | | Cash at bank and in hand | 620 | | 686 | | | Short-term deposits | 1,324 | | 1,677 | | | Commercial paper | 61 | | 1,846 | |
|
|
|
| | | 2,005 | | 4,209 | |
|
|
|
| |
24 Assets held for sale
| | 2006 | | 2005 | | | | £m | | £m | |
|
|
|
| | | Land and buildings | 8 | | 1 | | | Plant, equipment and vehicles | 1 | | 1 | | | Equity investments | 3 | | – | |
|
|
|
| | | 12 | | 2 | |
|
|
|
| |
25 Trade and other payables
| | 2006 | | 2005 | | | | £m | | £m | |
|
|
|
| | | Trade payables | 865 | | 819 | | | Wages and salaries | 718 | | 804 | | | Social security | 104 | | 102 | | | Other payables | 265 | | 240 | | | Deferred income | 40 | | 34 | | | Customer return and rebate accruals | 1,119 | | 1,187 | | | Other accruals | 1,713 | | 1,784 | | | Derivative financial instruments | 40 | | 171 | | | Dividends payable | 7 | | 6 | |
|
|
|
| | | 4,871 | | 5,147 | |
|
|
|
| |
|
| GSK Annual Report 2006 | 108 |
Back to Contents | | | | FINANCIAL STATEMENTS | | Notes to the financial statements | | | | | | | Notes to the financial statements | | continued | |
| 23 Inventories | | | | | | | 2007 | | 2006 | | | | £m | | £m | |
|
|
|
| | | Raw materials and consumables | 1,105 | | 764 | | | Work in progress | 771 | | 626 | | | Finished goods | 1,186 | | 1,047 | |
|
|
|
| | | | 3,062 | | 2,437 | |
|
|
|
| |
| 24 Trade and other receivables | | | | | | | 2007 | | 2006 | | | | £m | | £m | |
|
|
|
| | | Trade receivables | 4,649 | | 4,356 | | | Prepaid pension contributions | 1 | | 1 | | | Other prepayments and accrued income | 238 | | 223 | | | Interest receivable | 37 | | 28 | | | Employee loans and advances | 55 | | 51 | | | Other receivables | 515 | | 578 | |
|
|
|
| | | | 5,495 | | 5,237 | |
|
|
|
| | | Trade receivables include £8 million (2006 – £13 million) due from associates and joint ventures. | | | | |
| | 2007 | | 2006 | | | Bad and doubtful debt provision | £m | | £m | |
|
|
|
| | | At 1st January | 104 | | 140 | | | Exchange adjustments | 6 | | (9 | ) | | Charge for the year | 18 | | 12 | | | Subsequent recoveries of amounts provided for | (28 | ) | (38 | ) | | Utilised | (2 | ) | (1 | ) |
|
|
|
| | | At 31st December | 98 | | 104 | |
|
|
|
| |
| 25 Cash and cash equivalents | | | | | | | 2007 | | 2006 | | | | £m | | £m | |
|
|
|
| | | Cash at bank and in hand | 627 | | 620 | | | Short-term deposits | 2,383 | | 1,324 | | | Commercial paper | 369 | | 61 | |
|
|
|
| | | | 3,379 | | 2,005 | |
|
|
|
| |
| 26 Assets held for sale | | | | | | | 2007 | | 2006 | | | | £m | | £m | |
|
|
|
| | | Land and buildings | 3 | | 8 | | | Plant, equipment and vehicles | 1 | | 1 | | | Equity investments | – | | 3 | |
|
|
|
| | | | 4 | | 12 | |
|
|
|
| |
| 27 Trade and other payables | | | | | | | 2007 | | 2006 | | | | £m | | £m | |
|
|
|
| | | Trade payables | 931 | | 865 | | | Wages and salaries | 812 | | 718 | | | Social security | 116 | | 104 | | | Other payables | 214 | | 272 | | | Deferred income | 48 | | 40 | | | Customer return and rebate accruals | 973 | | 1,119 | | | Other accruals | 1,767 | | 1,713 | |
|
|
|
| | | | 4,861 | | 4,831 | |
|
|
|
| | | | | | | |
| 116 | GSK Annual Report 2007 | | |
Back to Contents | | | FINANCIAL STATEMENTS | | | Notes to the financial statements | | | | | | | | Notes to the financial statements | | continued |
|
2527 Trade and other payablescontinued
Customer return and rebate accruals are provided for by the Group at the point of sale in respect of the estimated rebates, discounts or allowances payable to customers, principally in the USA. Provisions are made at the time of sale but the actual amounts paid are based on claims made some time after the initial recognition of the sale. As the amounts are estimated they may not fully reflect the final outcome and the amounts are subject to change dependent upon, amongst other things, the types of buying group and product sales mix. The level of provision is reviewed and adjusted quarterly in the light of historical experience of actual rebates, discounts or allowances given and returns made and any changes in arrangements. Future events could cause the assumptions on which the provisions are based to change, which could affect the future results of the Group. 2628 Pensions and other post-employment benefits
| Pension and other post-employment costs | 2006 | | 2005 | | 2004 | | | | 2007 | | 2006 | | 2005 | | | Pension and other post-employment costs | £m | | £m | | £m | | £m | | £m | | £m | |
|
| | | UK pension schemes | 159 | | 124 | | 119 | | 108 | | 159 | | 124 | | | US pension schemes | 35 | | 41 | | 44 | | 24 | | 35 | | 41 | | | Other overseas pensions schemes | 91 | | 83 | | 74 | | 89 | | 91 | | 83 | | | Unfunded post-retirement healthcare schemes | 91 | | 100 | | 92 | | 90 | | 91 | | 100 | | | Other post-employment costs | 1 | | 2 | | 18 | | 2 | | 1 | | 2 | |
|
| |
| | | 377 | | 350 | | 347 | | 313 | | 377 | | 350 | |
|
| |
| | | Analysed as: | | | | | | | | | Funded defined benefit/hybrid pension schemes | 237 | | 198 | | 192 | | 171 | | 237 | | 198 | | | Unfunded defined benefit pension schemes | 19 | | 25 | | 22 | | 17 | | 19 | | 25 | | | Unfunded post-retirement healthcare schemes | 91 | | 100 | | 92 | | 90 | | 91 | | 100 | |
|
| |
| | | Defined benefit schemes | 347 | | 323 | | 306 | | 278 | | 347 | | 323 | | | Defined contribution pension schemes | 29 | | 25 | | 23 | | 33 | | 29 | | 25 | | | Other post-employment costs | 1 | | 2 | | 18 | | 2 | | 1 | | 2 | |
|
| |
| | | 377 | | 350 | | 347 | | 313 | | 377 | | 350 | |
|
| |
| |
The costs of the defined benefit pension and post-retirement healthcare schemes are charged in the income statement as follows: | Cost of sales | 74 | | 71 | | 68 | | 72 | | 74 | | 71 | | | Selling, general and administration | 175 | | 177 | | 166 | | 129 | | 175 | | 177 | | | Research and development | 98 | | 75 | | 72 | | 77 | | 98 | | 75 | |
|
| |
| | | 347 | | 323 | | 306 | | 278 | | 347 | | 323 | |
|
| |
| |
GSK entities operate pension arrangements which cover the Group’s material obligations to provide pensions to retired employees. These arrangements have been developed in accordance with local practices in the countries concerned. Pension benefits can be provided by state schemes; by defined contribution schemes, whereby retirement benefits are determined by the value of funds arising from contributions paid in respect of each employee, or by defined benefit schemes, whereby retirement benefits are based on employee pensionable remuneration and length of service. Some ‘hybrid’ defined benefit schemes also include defined contribution sections. Contributions to defined benefit schemes are determined in accordance with the advice of independent, professionally qualified actuaries. Pension costs of defined benefit schemes for accounting purposes have been assessed in accordance with independent actuarial advice, using the projected unit method. In certain countries pension benefits are provided on an unfunded basis, some administered by trustee companies. Liabilities are generally assessed annually in accordance with the advice of independent actuaries. Formal, independent, actuarial valuations of the Group’s main plans are undertaken regularly, normally at least every three years. The assets of funded schemes are generally held in separately administered trusts or are insured. Assets are invested in different classes in order to maintain a balance between risk and return. Investments are diversified to limit the financial effect of the failure of any individual investment. The long term, overall target asset allocation is 60% equities, 30% bonds and 10% property.
Actuarial movements in the year are recognised in full through the statement of recognised income and expense. The UK discount rate is based on the iBoxx over 15 year AA index and the US discount rate is based on corporate bond yields which reflect the term of the expected benefit payments. The expected rate of return on bonds reflects the portfolio mix of index-linked, government and corporate bonds. An equity risk premium of between 3% and 4% is added to longer term government bond yields to give the expected rate of return on equities. Projected inflation rate and pension increases are long termlong-term predictions based on the yield gap between long termlong-term index-linked and fixed interest Gilts. In the UK, mortality rates are calculated usingdetermined by adjusting the PA92 standard mortality tables to reflect recent scheme experience. These rates are then projected to 2006. Plan obligations are then increased by between 3% and 10%, depending on each individual scheme’s mortality experience, to make allowance for futurereflect improvements in life expectancy.expectancy in line with the medium cohort (i.e. improvements at recently observed higher levels which are assumed to continue to 2020) with minimum improvements thereafter of 1% per year for males and 0.5% for females. In the USA, mortality rates are calculated using the RP2000 fully generational table, projected using scale AA, with the white collar adjustment. The mortality assumptions for the UK and US schemes were set following a review in December 2007. GSK expects to review these again in December 2008. |
| GSK Annual Report 20062007 | 117 | 109 | |
<Back to Contents | | FINANCIAL STATEMENTS | | Notes to the financial statements | | | | | | | Notes to the financial statements | | continued |
|
2628 Pensions and other post-employment benefitscontinued
The average life expectancy assumed now for an individual at the age of 60 and projected to apply in 20262027 for an individual then at the age of 60 is as follows: | | | | UK | | | | USA | |
| |
| | | Male | | Female | | Male | | Female | | | Years | Years | Years | Years |
|
|
|
|
|
|
|
| | | Current | 25.3 | | 26.8 | | 24.3 | | 26.1 | | | Projected for 2026 | 26.9 | | 28.6 | | 25.8 | | 27.0 | |
|
|
|
|
|
|
|
| |
| | | | UK | | | | USA | | | |
| |
| | | | Male | | Female | | Male | | Female | | | | Years | | Years | | Years | | Years | |
| | | Current | 26.8 | | 28.0 | | 24.4 | | 26.1 | | | Projected for 2027 | 29.2 | | 29.8 | | 25.9 | | 27.0 | |
| |
These mortality assumptions were set followingThe assets of funded schemes are generally held in separately administered trusts or are insured. Assets are invested in different classes in order to maintain a reviewbalance between risk and return. Investments are diversified to limit the financial effect of the failure of any individual investment. Following an asset liability study in December 2005. GSK expects to review these again in December 2007.
During 2006,2007, the Group made special funding contributionsdecided to adopt a strategy to reduce gradually the allocation of investment in equities. In the UK it is proposed that the strategy will be linked to the UKfunding levels in the schemes and US pension schemes totalling £346 million (2005 – £366 million). In 2006, GSK formalised an agreementthis will be considered further with the trustees of the UK defined benefit pension schemes in 2008. The allocation of equities and property in the US scheme will be reduced from 80% of the total to make additional contributions of up to £325 million per year60% in addition to the normal contributions, over a four-year period ending 31st December 2009 in order to eliminate the then pension deficits on an IAS 19 basis.2008.
In the UK the defined benefit pension schemes operated for the benefit of former Glaxo Wellcome employees and former SmithKline Beecham employees remain separate. These schemes were closed to new entrants in 2001 and subsequent UK employees are entitled to join a defined contribution scheme. In the USA the former Glaxo Wellcome and SmithKline Beecham defined benefit schemes were merged during 2001. In addition, the Group operates a number of post-retirement healthcare schemes, the principal one of which is in the USA. The Group has applied the following financial assumptions in assessing the defined benefit liabilities: | | | UK | | USA | | Rest of World | | UK | | USA | | Rest of World | |
| |
| |
|
| |
| |
| | | 2006 | | 2005 | | 2004 | | 2006 | | 2005 | | 2004 | | 2006 | | 2005 | | 2004 | 2007 | | 2006 | | 2005 | | 2007 | | 2006 | | 2005 | | 2007 | | 2006 | | 2005 | | | % pa | % pa | % pa | % pa | % pa | % pa | % pa | | % pa | | % pa | | % pa | | % pa | | % pa | | % pa | | % pa | | % pa | |
|
| |
| | | Rate of increase of future earnings | 4.25 | | 4.00 | | 4.00 | | 5.00 | | 5.00 | | 5.00 | | 3.25 | | 3.25 | | 3.25 | | 4.25 | | 4.25 | | 4.00 | | 5.00 | | 5.00 | | 5.00 | | 3.25 | | 3.25 | | 3.25 | | | Discount rate | 5.00 | | 4.75 | | 5.25 | | 5.75 | | 5.50 | | 5.75 | | 4.25 | | 3.75 | | 4.25 | | 5.75 | | 5.00 | | 4.75 | | 6.00 | | 5.75 | | 5.50 | | 4.75 | | 4.25 | | 3.75 | | | Expected pension increases | 3.00 | | 2.75 | | 2.50 | | n/a | | n/a | | n/a | | 2.00 | | 2.00 | | 2.00 | | 3.25 | | 3.00 | | 2.75 | | n/a | | n/a | | n/a | | 2.00 | | 2.00 | | 2.00 | | | Cash balance credit/conversion rate | n/a | | n/a | | n/a | | 4.75 | | 4.50 | | 4.75 | | 1.75 | | 1.75 | | 1.75 | | n/a | | n/a | | n/a | | 4.75 | | 4.75 | | 4.50 | | 1.60 | | 1.75 | | 1.75 | | | Inflation rate | 3.00 | | 2.75 | | 2.50 | | 2.50 | | 2.50 | | 2.50 | | 1.75 | | 1.75 | | 1.75 | | 3.25 | | 3.00 | | 2.75 | | 2.50 | | 2.50 | | 2.50 | | 1.75 | | 1.75 | | 1.75 | |
|
| |
| |
The amounts recorded in the income statement and statement of recognised income and expense for the three years ended 31st December 20062007 in relation to the defined benefit pension and post-retirement healthcare schemes were as follows: | | | | | | | | | | Post-retirement | | | | | | Pensions | benefits | | |
|
|
|
|
|
|
| |
| | | 2006 | UK | | USA | | Rest of World | | Group | | Group | | | | £m | | £m | | £m | | £m | | £m | |
|
|
|
|
|
|
|
| |
| | | Amounts charged to operating profit | | | | | | | | | | | | Current service cost | 135 | | 66 | | 56 | | 257 | | 48 | | | Past service cost | 33 | | – | | (2 | ) | 31 | | – | | | Expected return on pension scheme assets | (333 | ) | (142 | ) | (30 | ) | (505 | ) | – | | | Interest on scheme liabilities | 307 | | 113 | | 42 | | 462 | | 57 | | | Settlements and curtailments | 17 | | (2 | ) | (4 | ) | 11 | | (14 | ) |
|
|
|
|
|
|
|
| |
| | | 159 | | 35 | | 62 | | 256 | | 91 | |
|
|
|
|
|
|
|
| |
| | | Actuarial gains recorded in the statement of recognised income and expense | 111 | | 169 | | 10 | | 290 | | 139 | |
|
|
|
|
|
|
|
| |
| | | | | | | | | | | | | |
| | | | | | | | | | Post-retirement | | | | | Pensions | benefits | |
|
|
|
|
|
|
| |
| | 2005 | UK | | USA | | Rest of World | | Group | | Group | | £m | £m | £m | £m | £m |
|
|
|
|
|
|
|
| |
| | | Amounts charged to operating profit | | | | | | | | | | | | Current service cost | 117 | | 63 | | 52 | | 232 | | 46 | | | Past service cost | – | | – | | – | | – | | 1 | | | Expected return on pension scheme assets | (285 | ) | (126 | ) | (28 | ) | (439 | ) | – | | | Interest on scheme liabilities | 276 | | 104 | | 34 | | 414 | | 53 | | | Settlements and curtailments | 16 | | – | | – | | 16 | | – | |
|
|
|
|
|
|
|
| |
| | | | 124 | | 41 | | 58 | | 223 | | 100 | |
|
|
|
|
|
|
|
| |
| | | Actuarial losses recorded in the statement of recognised income and expense | (490 | ) | (109 | ) | (93 | ) | (692 | ) | (102 | ) |
|
|
|
|
|
|
|
| |
| |
| | Pensions | | Post-retirement benefits | | | |
| |
| | | | UK | | USA | | Rest of World | | Group | | Group | | | 2007 | £m | | £m | | £m | | £m | | £m | |
| |
| | | Amounts charged to operating profit | | | | | | | | | | | | Current service cost | 138 | | 60 | | 57 | | 255 | | 30 | | | Past service cost | – | | (7 | ) | 1 | | (6 | ) | – | | | Expected return on pension scheme assets | (389 | ) | (141 | ) | (37 | ) | (567 | ) | – | | | Interest on scheme liabilities | 335 | | 107 | | 41 | | 483 | | 54 | | | Settlements and curtailments | 24 | | 5 | | (6 | ) | 23 | | 6 | |
| |
| | | | 108 | | 24 | | 56 | | 188 | | 90 | |
| |
| | Actuarial gains recorded in the statement ofrecognised income and expense | 523 | | 66 | | 43 | | 632 | | 39 | |
| |
| | | | | | |
| | Pensions | | Post-retirement benefits | | | |
| |
| | | | UK | | USA | | Rest of World | | Group | | Group | | | 2006 | £m | | £m | | £m | | £m | | £m | |
| |
| | | Amounts charged to operating profit | | | | | | | | | | | | Current service cost | 135 | | 66 | | 56 | | 257 | | 48 | | | Past service cost | 33 | | – | | (2 | ) | 31 | | – | | | Expected return on pension scheme assets | (333 | ) | (142 | ) | (30 | ) | (505 | ) | – | | | Interest on scheme liabilities | 307 | | 113 | | 42 | | 462 | | 57 | | | Settlements and curtailments | 17 | | (2 | ) | (4 | ) | 11 | | (14 | ) |
| |
| | | | 159 | | 35 | | 62 | | 256 | | 91 | |
| |
| | Actuarial gains recorded in the statement ofrecognised income and expense | 111 | | 169 | | 10 | | 290 | | 139 | |
| |
| | | | | | |
| 118 |
| GSK Annual Report 20062007 | 110 | |
<Back to Contents | | | Notes to the financial statements | | | | | | | | Notes to the financial statements | | continued |
|
2628 Pensions and other post-employment benefitscontinued
| | | | | | | | | | Post-retirement | | Pensions | | Post-retirement benefits | | | | | | | | | | Pensions | | benefits | |
| |
| | | |
|
|
|
|
|
|
| |
| | | | 2004 | UK | | USA | | Rest of World | | Group | | Group | | | | 2005 | | UK | | USA | | Rest of World | | Group | | Group | | | | £m | | £m | | £m | | £m | | £m | | £m | | £m | | £m | | £m | | £m | |
|
|
|
|
|
|
|
| |
| |
| |
| | | Amounts charged to operating profit | | | | | | | | | | | | | Current service cost | 117 | | 58 | | 42 | | 217 | | 37 | | 117 | | 63 | | 52 | | 232 | | 46 | | | Past service cost | – | | – | | 2 | | 2 | | – | | – | | – | | – | | – | | 1 | | | Expected return on pension scheme assets | (272 | ) | (118 | ) | (20 | ) | (410 | ) | – | | (285 | ) | (126 | ) | (28 | ) | (439 | ) | – | | | Interest on scheme liabilities | 269 | | 104 | | 27 | | 400 | | 55 | | 276 | | 104 | | 34 | | 414 | | 53 | | | Settlements and curtailments | 5 | | – | | – | | 5 | | – | | 16 | | – | | – | | 16 | | – | |
|
|
|
|
|
|
|
| |
| |
| |
| | | 119 | | 44 | | 51 | | 214 | | 92 | | 124 | | 41 | | 58 | | 223 | | 100 | |
|
|
|
|
|
|
|
| |
| |
| |
| | | Actuarial gains/(losses) recorded in the statement of recognised income and expense | 162 | | 26 | | (26 | ) | 162 | | (54 | ) | | Actuarial losses recorded in the statement ofrecognised income and expense | | (490 | ) | (109 | ) | (93 | ) | (692 | ) | (102 | ) |
|
|
|
|
|
|
|
| |
| |
| |
| |
The total actuarial losses recorded in the statement of recognised income and expense since 1st January 2003 amount to £689£18 million. The fair values of the assets and liabilities of the UK and US defined benefit pension schemes, together with aggregated data for other defined benefit pension schemes in the Group are as follows: | | UK | | USA | | Rest of World | | Group | | | |
| |
| |
| |
| | | | | | | | | | | | Average | | | | | | | At 31st December 2007 | Expected rate | | Fair | | Expected rate | | Fair | | expected rate | | Fair | | Fair | | | | of return | | value | | of return | | value | | of return | | value | | value | | | | % | | £m | | % | | £m | | % | | £m | | £m | |
| |
| |
| |
| | | Equities | 8.00 | | 4,578 | | 8.50 | | 1,446 | | 7.50 | | 223 | | 6,247 | | | Property | 7.00 | | 338 | | 7.50 | | 213 | | 7.00 | | 20 | | 571 | | | Bonds | 5.00 | | 2,322 | | 5.00 | | 335 | | 4.00 | | 430 | | 3,087 | | | Other assets | 6.00 | | 55 | | 4.75 | | 10 | | 4.25 | | 212 | | 277 | |
| |
| |
| |
| | | Fair value of assets | | | 7,293 | | | | 2,004 | | | | 885 | | 10,182 | | | Present value of scheme obligations | | | (7,371 | ) | | | (1,945 | ) | | | (1,022 | ) | (10,338 | ) |
| |
| |
| |
| | | | | | (78 | ) | | | 59 | | | | (137 | ) | (156 | ) |
| |
| |
| |
| | | Included in other non-current assets | | | 10 | | | | 215 | | | | 30 | | 255 | | | Included in pensions and other post-employment benefits | | | (88 | ) | | | (156 | ) | | | (167 | ) | (411 | ) |
| |
| |
| |
| | | | | | (78 | ) | | | 59 | | | | (137 | ) | (156 | ) |
| |
| |
| |
| | | Actual return on plan assets | | | 557 | | | | 187 | | | | 19 | | 763 | |
| |
| |
| |
| |
| | UK | | USA | | Rest of World | | Group | | | |
| |
| |
| |
| | | | | | | | | | | | Average | | | | | | | At 31st December 2006 | Expected rate | | Fair | | Expected rate | | Fair | | expected rate | | Fair | | Fair | | | | of return | | value | | of return | | value | | of return | | value | | value | | | | % | | £m | | % | | £m | | % | | £m | | £m | |
| |
| |
| |
| | | Equities | 8.00 | | 4,218 | | 8.50 | | 1,412 | | 7.25 | | 205 | | 5,835 | | | Property | 7.00 | | 210 | | 7.50 | | 169 | | 6.75 | | 11 | | 390 | | | Bonds | 4.50 | | 2,026 | | 5.50 | | 324 | | 3.50 | | 351 | | 2,701 | | | Other assets | 5.00 | | 100 | | 5.00 | | 48 | | 3.75 | | 174 | | 322 | |
| |
| |
| |
| |
| | | Fair value of assets | | | 6,554 | | | | 1,953 | | | | 741 | | 9,248 | | | Present value of scheme obligations | | | (7,444 | ) | | | (1,949 | ) | | | (952 | ) | (10,345 | ) |
| |
| |
| |
| |
| | | | | | (890 | ) | | | 4 | | | | (211 | ) | (1,097 | ) |
| |
| |
| |
| |
| | | Included in other non-current assets | | | – | | | | 160 | | | | 19 | | 179 | | | Included in pensions and other post-employment benefits | | | (890 | ) | | | (156 | ) | | | (230 | ) | (1,276 | ) |
| |
| |
| |
| |
| | | | | | (890 | ) | | | 4 | | | | (211 | ) | (1,097 | ) |
| |
| |
| |
| |
| | | Actual return on plan assets | | | 560 | | | | 310 | | | | 56 | | 926 | |
| |
| |
| |
| |
| | | | | | | | | | | | |
| | | | | | | | | | | | | | | | | | UK | | | | USA | | Rest of World | | Group | | | |
| |
| |
| |
| | | | | | | | | | | | Average | | | | | | | At 31st December 2005 | Expected rate | | Fair | | Expected rate | | Fair | | expected rate | | Fair | | Fair | | | | of return | | value | | of return | | value | | of return | | value | | value | | | | % | | £m | | % | | £m | | % | | £m | | £m | |
|
|
|
|
|
|
|
|
|
|
|
|
|
| | | Equities | 7.75 | | 3,895 | | 8.50 | | 1,440 | | 7.00 | | 192 | | 5,527 | | | Property | – | | – | | 7.50 | | 106 | | 6.25 | | 11 | | 117 | | | Bonds | 4.25 | | 1,764 | | 5.50 | | 352 | | 3.50 | | 302 | | 2,418 | | | Other assets | 4.00 | | 85 | | 4.00 | | 78 | | 3.25 | | 152 | | 315 | |
|
|
|
|
|
|
|
|
|
|
|
|
|
| | | Fair value of assets | | | 5,744 | | | | 1,976 | | | | 657 | | 8,377 | | | Present value of scheme obligations | | | (7,054 | ) | | | (2,150 | ) | | | (922 | ) | (10,126 | ) |
|
|
|
|
|
|
|
|
|
|
|
|
|
| | | | | (1,310 | ) | | | (174 | ) | | | (265 | ) | (1,749 | ) |
|
|
|
|
|
|
|
|
|
|
|
|
|
| | | Included in other non-current assets | | | – | | | | – | | | | 12 | | 12 | |
|
|
|
|
|
|
|
|
|
|
|
|
|
| | | Included in pensions and other post-employment benefits | | | (1,310 | ) | | | (174 | ) | | | (277 | ) | (1,761 | ) |
|
|
|
|
|
|
|
|
|
|
|
|
|
| | | | | | (1,310 | ) | | | (174 | ) | | | (265 | ) | (1,749 | ) |
|
|
|
|
|
|
|
|
|
|
|
|
|
| | | Actual return on plan assets | | | 932 | | | | 129 | | | | 63 | | 1,124 | |
|
|
|
|
|
|
|
|
|
|
|
|
|
| |
| GSK Annual Report 2007 | 119 |
| GSK Annual Report 2006 | 111 |
<Back to Contents | FINANCIAL STATEMENTS | | Notes to the financialstatements | | | | | | | | Notes to the financial statements | | continued |
|
2628 Pensions and other post-employment benefitscontinued
| | | | UK | | | | USA | | Rest of World | | Group | | |
| |
| |
| |
| | | | | | | | | | | | Average | | | | | | | At 31st December 2004 | Expected rate | | Fair | | Expected rate | | Fair | | expected rate | | Fair | | Fair | | | | of return | | value | | of return | | value | | of return | | value | | value | | | | % | | £m | | % | | £m | | % | | £m | | £m | |
|
|
|
|
|
|
|
|
|
|
|
|
|
| | | Equities | 8.25 | | 3,053 | | 8.50 | | 1,223 | | 7.50 | | 208 | | 4,484 | | | Property | – | | – | | 6.50 | | 58 | | 6.25 | | 7 | | 65 | | | Bonds | 4.50 | | 1,428 | | 5.75 | | 307 | | 3.75 | | 270 | | 2,005 | | | Other assets | 4.00 | | 80 | | 2.50 | | 50 | | 2.25 | | 62 | | 192 | |
|
|
|
|
|
|
|
|
|
|
|
|
|
| | | Fair value of assets | | | 4,561 | | | | 1,638 | | | | 547 | | 6,746 | | | Present value of scheme obligations | | | (5,735 | ) | | | (1,750 | ) | | | (761 | ) | (8,246 | ) |
|
|
|
|
|
|
|
|
|
|
|
|
|
| | | | | (1,174 | ) | | | (112 | ) | | | (214 | ) | (1,500 | ) |
|
|
|
|
|
|
|
|
|
|
|
|
|
| | | Included in other non-current assets | | | – | | | | – | | | | 14 | | 14 | |
|
|
|
|
|
|
|
|
|
|
|
|
|
| | | Included in pensions and other post-employment benefits | | | (1,174 | ) | | | (112 | ) | | | (228 | ) | (1,514 | ) |
|
|
|
|
|
|
|
|
|
|
|
|
|
| | | | | (1,174 | ) | | | (112 | ) | | | (214 | ) | (1,500 | ) |
|
|
|
|
|
|
|
|
|
|
|
|
|
| | | Actual return on plan assets | | | 468 | | | | 204 | | | | 43 | | 715 | |
|
|
|
|
|
|
|
|
|
|
|
|
|
| |
| | | | | | | | | | | | | | | | | | | | | Post-retirement | | | | | | | | | Pensions | | benefits | | |
|
|
|
|
|
|
| |
| | | Movements in defined benefit obligations | UK | | USA | | Rest of World | | Group | | Group | | | £m | | £m | | £m | | £m | | £m | |
|
|
|
|
|
|
|
| |
| | | Obligations at 1st January 2004 | (5,508 | ) | (1,751 | ) | (707 | ) | (7,966 | ) | (951 | ) | | Exchange adjustments | – | | 126 | | 31 | | 157 | | 52 | | | Service cost | (117 | ) | (58 | ) | (44 | ) | (219 | ) | (37 | ) | | Interest cost | (269 | ) | (104 | ) | (27 | ) | (400 | ) | (55 | ) | | Settlements and curtailments | (5 | ) | – | | – | | (5 | ) | – | | | Actuarial losses | (34 | ) | (60 | ) | (49 | ) | (143 | ) | (54 | ) | | Scheme participants’ contributions | (12 | ) | – | | (3 | ) | (15 | ) | (8 | ) | | Benefits paid | 210 | | 97 | | 38 | | 345 | | 48 | |
|
|
|
|
|
|
|
| |
| | | Obligations at 31st December 2004 | (5,735 | ) | (1,750 | ) | (761 | ) | (8,246 | ) | (1,005 | ) |
|
|
|
|
|
|
|
| |
| | | Exchange adjustments | – | | (217 | ) | 14 | | (203 | ) | (138 | ) | | Service cost | (117 | ) | (63 | ) | (52 | ) | (232 | ) | (47 | ) | | Interest cost | (276 | ) | (104 | ) | (34 | ) | (414 | ) | (53 | ) | | Settlements and curtailments | (16 | ) | – | | – | | (16 | ) | – | | | Actuarial losses | (1,137 | ) | (112 | ) | (128 | ) | (1,377 | ) | (102 | ) | | Scheme participants’ contributions | (12 | ) | – | | (3 | ) | (15 | ) | (9 | ) | | Benefits paid | 239 | | 96 | | 42 | | 377 | | 46 | |
|
|
|
|
|
|
|
| |
| | | Obligations at 31st December 2005 | (7,054 | ) | (2,150 | ) | (922 | ) | (10,126 | ) | (1,308 | ) |
|
|
|
|
|
|
|
| |
| | | Exchange adjustments | – | | 267 | | 30 | | 297 | | 151 | | | Service cost | (168 | ) | (66 | ) | (54 | ) | (288 | ) | (48 | ) | | Interest cost | (307 | ) | (113 | ) | (42 | ) | (462 | ) | (57 | ) | | Settlements and curtailments | (17 | ) | 2 | | 12 | | (3 | ) | 14 | | | Actuarial (losses)/gains | (116 | ) | 1 | | (16 | ) | (131 | ) | 139 | | | Scheme participants’ contributions | (11 | ) | – | | (3 | ) | (14 | ) | (8 | ) | | Benefits paid | 229 | | 110 | | 43 | | 382 | | 54 | |
|
|
|
|
|
|
|
| |
| | | Obligations at 31st December 2006 | (7,444 | ) | (1,949 | ) | (952 | ) | (10,345 | ) | (1,063 | ) |
|
|
|
|
|
|
|
| |
| |
| | | | UK | | | | USA | | Rest of World | | Group | | | |
|
|
| |
|
|
| |
| |
| | | At 31st December 2005 | | | | | | | | | Average | | | | | | | | Expected rate | | Fair | | Expected rate | | Fair | | expected rate | | Fair | | Fair | | | | of return | | value | | of return | | value | | of return | | value | | value | | | | % | | £m | | % | | £m | | % | | £m | | £m | |
|
|
|
| |
|
|
| |
|
|
| |
| | | Equities | 7.75 | | 3,895 | | 8.50 | | 1,440 | | 7.00 | | 192 | | 5,527 | | | Property | – | | – | | 7.50 | | 106 | | 6.25 | | 11 | | 117 | | | Bonds | 4.25 | | 1,764 | | 5.50 | | 352 | | 3.50 | | 302 | | 2,418 | | | Other assets | 4.00 | | 85 | | 4.00 | | 78 | | 3.25 | | 152 | | 315 | |
|
|
|
| |
|
|
| |
|
|
| |
| | | Fair value of assets | | | 5,744 | | | | 1,976 | | | | 657 | | 8,377 | | | Present value of scheme obligations | | | (7,054 | ) | | | (2,150 | ) | | | (922 | ) | (10,126 | ) |
|
|
|
| |
|
|
| |
|
|
| |
| | | | | | (1,310 | ) | | | (174 | ) | | | (265 | ) | (1,749 | ) |
|
|
|
| |
|
|
| |
|
|
| |
| | | Included in other non-current assets | | | – | | | | – | | | | 12 | | 12 | | | Included in pensions and other post-employment benefits | | | (1,310 | ) | | | (174 | ) | | | (277 | ) | (1,761 | ) |
|
|
|
| |
|
|
| |
|
|
| |
| | | | | | (1,310 | ) | | | (174 | ) | | | (265 | ) | (1,749 | ) |
|
|
|
| |
|
|
| |
|
|
| |
| | | Actual return on plan assets | | | 932 | | | | 129 | | | | 63 | | 1,124 | |
|
|
|
| |
|
|
| |
|
|
| |
| | | | | | | | | | | | | | | | | |
| | | | | | | | | | Post-retirement | | | | | | | | | | Pensions | | benefits | | | |
|
|
|
|
|
|
| |
| | | Movements in defined benefit obligations | UK | | USA | | Rest of World | | Group | | Group | | | | £m | | £m | | £m | | £m | | £m | |
|
|
|
|
|
|
|
| |
| | | Obligations at 1st January 2005 | (5,735 | ) | (1,750 | ) | (761 | ) | (8,246 | ) | (1,005 | ) | | Exchange adjustments | – | | (217 | ) | 14 | | (203 | ) | (138 | ) | | Service cost | (117 | ) | (63 | ) | (52 | ) | (232 | ) | (47 | ) | | Interest cost | (276 | ) | (104 | ) | (34 | ) | (414 | ) | (53 | ) | | Settlements and curtailments | (16 | ) | – | | – | | (16 | ) | – | | | Actuarial losses | (1,137 | ) | (112 | ) | (128 | ) | (1,377 | ) | (102 | ) | | Scheme participants’ contributions | (12 | ) | – | | (3 | ) | (15 | ) | (9 | ) | | Benefits paid | 239 | | 96 | | 42 | | 377 | | 46 | |
|
|
|
|
|
|
|
| |
| | | Obligations at 31st December 2005 | (7,054 | ) | (2,150 | ) | (922 | ) | (10,126 | ) | (1,308 | ) |
|
|
|
|
|
|
|
| |
| | | Exchange adjustments | – | | 267 | | 30 | | 297 | | 151 | | | Service cost | (168 | ) | (66 | ) | (54 | ) | (288 | ) | (48 | ) | | Interest cost | (307 | ) | (113 | ) | (42 | ) | (462 | ) | (57 | ) | | Settlements and curtailments | (17 | ) | 2 | | 12 | | (3 | ) | 14 | | | Actuarial (losses)/gains | (116 | ) | 1 | | (16 | ) | (131 | ) | 139 | | | Scheme participants’ contributions | (11 | ) | – | | (3 | ) | (14 | ) | (8 | ) | | Benefits paid | 229 | | 110 | | 43 | | 382 | | 54 | |
|
|
|
|
|
|
|
| |
| | | Obligations at 31st December 2006 | (7,444 | ) | (1,949 | ) | (952 | ) | (10,345 | ) | (1,063 | ) |
|
|
|
|
|
|
|
| |
| | | Exchange adjustments | – | | 34 | | (80 | ) | (46 | ) | 9 | | | Service cost | (138 | ) | (53 | ) | (58 | ) | (249 | ) | (30 | ) | | Interest cost | (335 | ) | (107 | ) | (41 | ) | (483 | ) | (54 | ) | | Settlements and curtailments | (24 | ) | (5 | ) | 4 | | (25 | ) | (6 | ) | | Actuarial gains | 355 | | 20 | | 61 | | 436 | | 39 | | | Scheme participants’ contributions | (38 | ) | – | | (5 | ) | (43 | ) | – | | | Benefits paid | 253 | | 115 | | 49 | | 417 | | 44 | | | Transfers | – | | – | | – | | – | | 89 | |
|
|
|
|
|
|
|
| |
| | | Recognised in the balance sheet at 31st December 2007 | (7,371 | ) | (1,945 | ) | (1,022 | ) | (10,338 | ) | (972 | ) |
|
|
|
|
|
|
|
| |
| | | Unrecognised past service costs | – | | – | | – | | – | | (47 | ) |
|
|
|
|
|
|
|
| |
| | | Obligations at 31st December 2007 | (7,371 | ) | (1,945 | ) | (1,022 | ) | (10,338 | ) | (1,019 | ) |
|
|
|
|
|
|
|
| |
| |
The UK defined benefit schemes include defined contribution sections with obligations totalling £693 million at 31st December 2007 (2006 – £609 million, 2005 – £515 million). | 120 | GSK Annual Report 2007 | | |
Back to Contents | | | FINANCIAL STATEMENTS | | | Notes to the financialstatements | | | | | | | | Notes to the financial statements | | continued | |
28 Pensions and other post-employment benefitscontinued The liability for the US post-retirement healthcare scheme has been assessed using the same assumptions as for the US pension scheme, together with the assumption for future medical inflation of 8.5% (2006 – 9.25%), reducing by 0.75% per year to 5% in 2013 and thereafter. On this basis the liability forDuring 2007, the US post-retirement healthcare scheme has been assessed atwas amended. The main change was an increase in the cap on company costs. At the year-end the plan obligation was £879 million. However, in accordance with IAS 19 the unvested part of a benefit improvement is not recognised immediately on the balance sheet but is recognised gradually through the income statement. At the year-end the unrecognised amount was £47 million and the amount recognised on the balance sheet was therefore £832 million (2006 – £927 million, (20052005 – £1,133 million, 2004 – £895 million). |
| GSK Annual Report 2006 | 112 |
<BackThe Group provides certain medical benefits to Contents
| Notes to the financial statements | continued |
|
26 Pensionsdisabled employees and their spouses in the USA. The obligations for these benefits which were transferred at a value of £89 million are now shown within other post-employment benefitscontinued
provisions.
The defined benefit pension obligation is analysed as follows: | | 2006 | | 2005 | | 2004 | | 2007 | | 2006 | | 2005 | | | £m | £m | £m | | £m | | £m | |
|
|
|
|
|
| |
| | | Funded | (10,099 | ) | (9,858 | ) | (8,029 | ) | (10,079 | ) | (10,099 | ) | (9,858 | ) | | Unfunded | (246 | ) | (268 | ) | (217 | ) | (259 | ) | (246 | ) | (268 | ) |
|
|
|
|
|
| |
| | | | (10,345 | ) | (10,126 | ) | (8,246 | ) | (10,338 | ) | (10,345 | ) | (10,126 | ) |
|
|
|
|
|
| |
| |
Post-retirement benefits are unfunded. | Movements in fair value of assets | | | | | | | | | Post-retirement | | | | | | Pensions | benefits | |
| | | UK | | USA | | Rest of World | | Group | | | £m | | £m | | £m | | £m | |
|
| |
| | | Post-retirement | | | Assets at 1st January 2004 | 3,955 | | 1,583 | | 444 | | 5,982 | | – | | | | Exchange adjustments | – | | (117 | ) | 27 | | (90 | ) | – | | | | Expected return on assets | 272 | | 118 | | 20 | | 410 | | – | | | | Actuarial gains | 196 | | 86 | | 23 | | 305 | | – | | | | Employer contributions | 336 | | 65 | | 68 | | 469 | | 40 | | | | Scheme participants’ contributions | 12 | | – | | 3 | | 15 | | 8 | | | | Benefits paid | (210 | ) | (97 | ) | (38 | ) | (345 | ) | (48 | ) | |
|
| |
| | | Pensions | | benefits | | | Assets at 31st December 2004 | 4,561 | | 1,638 | | 547 | | 6,746 | | – | | |
|
| |
| |
| |
| | | Movements in fair values of assets | | UK | | USA | | Rest of World | | Group | | Group | | | | | £m | | £m | | £m | | £m | | £m | |
| |
| |
| | | Assets at 1st January 2005 | | 4,561 | | 1,638 | | 547 | | 6,746 | | – | | | Exchange adjustments | – | | 200 | | (4 | ) | 196 | | – | | – | | 200 | | (4 | ) | 196 | | – | | | Expected return on assets | 285 | | 126 | | 28 | | 439 | | – | | 285 | | 126 | | 28 | | 439 | | – | | | Actuarial gains | 647 | | 3 | | 35 | | 685 | | – | | 647 | | 3 | | 35 | | 685 | | – | | | Employer contributions | 478 | | 105 | | 90 | | 673 | | 37 | | 478 | | 105 | | 90 | | 673 | | 37 | | | Scheme participants’ contributions | 12 | | – | | 3 | | 15 | | 9 | | 12 | | – | | 3 | | 15 | | 9 | | | Benefits paid | (239 | ) | (96 | ) | (42 | ) | (377 | ) | (46 | ) | (239 | ) | (96 | ) | (42 | ) | (377 | ) | (46 | ) |
|
| |
| |
| |
| | | Assets at 31st December 2005 | 5,744 | | 1,976 | | 657 | | 8,377 | | – | | 5,744 | | 1,976 | | 657 | | 8,377 | | – | |
|
| |
| |
| |
| | | Exchange adjustments | – | | (255 | ) | (30 | ) | (285 | ) | – | | – | | (255 | ) | (30 | ) | (285 | ) | – | | | Expected return on assets | 333 | | 142 | | 30 | | 505 | | – | | 333 | | 142 | | 30 | | 505 | | – | | | Settlements and curtailments | – | | – | | (8 | ) | (8 | ) | – | | – | | – | | (8 | ) | (8 | ) | – | | | Actuarial gains | 227 | | 168 | | 26 | | 421 | | – | | 227 | | 168 | | 26 | | 421 | | – | | | Employer contributions | 468 | | 32 | | 106 | | 606 | | 46 | | 468 | | 32 | | 106 | | 606 | | 46 | | | Scheme participants’ contributions | 11 | | – | | 3 | | 14 | | 8 | | 11 | | – | | 3 | | 14 | | 8 | | | Benefits paid | (229 | ) | (110 | ) | (43 | ) | (382 | ) | (54 | ) | (229 | ) | (110 | ) | (43 | ) | (382 | ) | (54 | ) |
|
| |
| |
| |
| | | Assets at 31st December 2006 | 6,554 | | 1,953 | | 741 | | 9,248 | | – | | 6,554 | | 1,953 | | 741 | | 9,248 | | – | |
|
| |
| |
| |
| | | Exchange adjustments | | – | | (29 | ) | 68 | | 39 | | – | | | Expected return on assets | | 389 | | 141 | | 37 | | 567 | | – | | | Settlements and curtailments | | – | | – | | 2 | | 2 | | – | | | Actuarial gains | | 168 | | 46 | | (18 | ) | 196 | | – | | | Employer contributions | | 397 | | 8 | | 99 | | 504 | | 41 | | | Scheme participants’ contributions | | 38 | | – | | 5 | | 43 | | 3 | | | Benefits paid | | (253 | ) | (115 | ) | (49 | ) | (417 | ) | (44 | ) |
| |
| |
| | | Assets at 31st December 2007 | | 7,293 | | 2,004 | | 885 | | 10,182 | | – | |
| |
| |
| |
The UK defined benefit schemes include defined contribution sections with account balances totalling £609£693 million at 31st December 2006 (20052007 (2006 – £609 million, 2005 – £515 million). During 2007, the Group made special funding contributions to the UK pension schemes totalling £285 million 2004(2006 – £404 million)£346 million to the UK and US pension schemes). InformationIn 2006, GSK formalised an agreement with the trustees of the UK defined benefit pension schemes to make additional contributions of up to £325 million per year in addition to the normal contributions, over a four-year period ending 31st December 2009 in order to eliminate the then pension deficits on scheme assets under US GAAP is given in Note 41.an IAS 19 basis. Employer contributions for 20072008, including special funding contributions, are estimated to be approximately £500£200 million in respect of defined benefit pension schemes and £50£40 million in respect of post-retirement benefits. The transition date for conversion to IFRS for GSK was 1st January 2003 and therefore the following historical data has been presented from that date. This will be built up to a rolling five year record next year.
| History of experience gains and losses | | | | | | | | | Post-retirement | | | | | | Pensions | benefits |
|
|
|
|
|
|
|
| | UK | | USA | | Rest of World | | Group | Group | | £m | | £m | | £m | | £m | £m |
|
|
|
|
|
|
|
| |
| | | | | | | | | | | | | | | 2006 | | | | | | | | | | | | Experience gains of scheme assets (£m) | 227 | | 168 | | 26 | | 421 | | | | | Percentage of scheme assets at 31st December 2006 | 3 | % | 9 | % | 4 | % | 5 | % | | |
|
|
|
|
|
|
|
| | | | | | | | | | | | | | | | | Experience (losses)/gains of scheme liabilities (£m) | (37 | ) | (16 | ) | (42 | ) | (95 | ) | 17 | | | Percentage of scheme obligations at 31st December 2006 | – | | 1 | % | 4 | % | 1 | % | 2 | % |
|
|
|
|
|
|
|
| |
| | | | | | | | | | | | | | | Fair value of assets | 6,554 | | 1,953 | | 741 | | 9,248 | | – | | | Present value of scheme obligations | (7,444 | ) | (1,949 | ) | (952 | ) | (10,345 | ) | (1,063 | ) |
|
|
|
|
|
|
|
| |
| | | (Deficits)/surpluses in the schemes | (890 | ) | 4 | | (211 | ) | (1,097 | ) | (1,063 | ) |
|
|
|
|
|
|
|
| |
| |
|
| GSK Annual Report 20062007 | 121 | 113 | |
<Back to Contents | FINANCIAL STATEMENTS | | Notes to the financialstatements | | | | | | | | Notes to the financial statements | | continued |
|
2628 Pensions and other post-employment benefitscontinued
| History of experience gains and losses | | | | | | | | | Post-retirement | | | | | | Pensions | benefits | |
|
|
|
|
|
|
| | | UK | | USA | | Rest of World | | Group | | | | Post-retirement | | | | | | Pensions | | benefits | | | | |
| |
| | | History of experience gains and losses | £m | | £m | | £m | | £m | | £m | | UK | | USA | | Rest of World | | Group | | Group | |
|
|
|
|
|
|
| £m | | £m | | £m | | £m | | £m | | |
| |
| | | | | 168 | | 46 | | (18 | ) | 196 | | | | | Percentage of scheme assets at 31st December 2007 | | 2 | % | 2 | % | 2 | % | 2 | % | |
| |
| |
| | | Experience gains/(losses) of scheme liabilities (£m) | | 33 | | (30 | ) | 6 | | 9 | | – | | | Percentage of scheme obligations at 31st December 2007 | | – | | 2 | % | 1 | % | – | | – | |
| |
| |
| | | Fair value of assets | | 7,293 | | 2,004 | | 885 | | 10,182 | | – | | | Present value of scheme obligations | | (7,371 | ) | (1,945 | ) | (1,022 | ) | (10,338 | ) | (1,019 | ) |
| |
| |
| | | (Deficits)/surpluses in the schemes | | (78 | ) | 59 | | (137 | ) | (156 | ) | (1,019 | ) |
| |
| |
| | | 2006 | | | | Experience gains of scheme assets (£m) | | 227 | | 168 | | 26 | | 421 | | | Percentage of scheme assets at 31st December 2006 | | 3 | % | 9 | % | 4 | % | 5 | % | |
| |
| |
| | | Experience (losses)/gains of scheme liabilities (£m) | | (37 | ) | (16 | ) | (42 | ) | (95 | ) | 17 | | | Percentage of scheme obligations at 31st December 2006 | | – | | 1 | % | 4 | % | 1 | % | 2 | % |
| |
| |
| | | Fair value of assets | | 6,554 | | 1,953 | | 741 | | 9,248 | | – | | | Present value of scheme obligations | | (7,444 | ) | (1,949 | ) | (952 | ) | (10,345 | ) | (1,063 | ) |
| |
| |
| | | (Deficits)/surpluses in the schemes | | (890 | ) | 4 | | (211 | ) | (1,097 | ) | (1,063 | ) | | | | | | | | | | | | |
| |
| | | 2005 | | | | | | | | | | | | | Experience gains of scheme assets (£m) | 647 | | 3 | | 35 | | 685 | | | | 647 | | 3 | | 35 | | 685 | | | Percentage of scheme assets at 31st December 2005 | 11 | % | – | | 5 | % | 8 | % | | | 11 | % | – | | 5 | % | 8 | % | |
|
|
|
|
|
|
|
| | | |
| |
| | | | | | | | | | | | | | | | Experience losses of scheme liabilities (£m) | (94 | ) | (10 | ) | (35 | ) | (139 | ) | (4 | ) | (94 | ) | (10 | ) | (35 | ) | (139 | ) | (4 | ) | | Percentage of scheme obligations at 31st December 2005 | 1 | % | – | | 4 | % | 1 | % | – | | 1 | % | – | | 4 | % | 1 | % | – | |
|
|
|
|
|
|
|
| |
| |
| |
| | | Fair value of assets | | 5,744 | | 1,976 | | 657 | | 8,377 | | – | | | Present value of scheme obligations | | (7,054 | ) | (2,150 | ) | (922 | ) | (10,126 | ) | (1,308 | ) |
| |
| |
| | | Deficits in the schemes | | (1,310 | ) | (174 | ) | (265 | ) | (1,749 | ) | (1,308 | ) |
| |
| |
| | | 2004 | | | | Experience gains of scheme assets (£m) | | 196 | | 86 | | 23 | | 305 | | | Percentage of scheme assets at 31st December 2004 | | 4 | % | 5 | % | 4 | % | 5 | % | |
| |
| |
| | | Experience (losses)/gains of scheme liabilities (£m) | | (25 | ) | (5 | ) | (18 | ) | (48 | ) | 47 | | | Percentage of scheme obligations at 31st December 2004 | | – | | – | | 2 | % | 1 | % | 5 | % |
| |
| |
| | | Fair value of assets | | 4,561 | | 1,638 | | 547 | | 6,746 | | – | | | Present value of scheme obligations | | (5,735 | ) | (1,750 | ) | (761 | ) | (8,246 | ) | (1,005 | ) |
| |
| |
| | | Deficits in the schemes | | (1,174 | ) | (112 | ) | (214 | ) | (1,500 | ) | (1,005 | ) |
| |
| |
| | | 2003 | | | | Experience gains of scheme assets (£m) | | 336 | | 231 | | 33 | | 600 | | | Percentage of scheme assets at 31st December 2003 | | 8 | % | 15 | % | 7 | % | 10 | % | |
| |
| |
| | | Experience (losses)/gains of scheme liabilities (£m) | | (183 | ) | 5 | | (19 | ) | (197 | ) | (123 | ) | | Percentage of scheme obligations at 31st December 2003 | | 3 | % | – | | 3 | % | 2 | % | 13 | % | | | | | | | | | | | | |
| |
| | | Fair value of assets | 5,744 | | 1,976 | | 657 | | 8,377 | | – | | 3,955 | | 1,583 | | 444 | | 5,982 | | – | | | Present value of scheme obligations | (7,054 | ) | (2,150 | ) | (922 | ) | (10,126 | ) | (1,308 | ) | (5,508 | ) | (1,751 | ) | (707 | ) | (7,966 | ) | (951 | ) |
|
|
|
|
|
|
|
| |
| |
| |
| | | Deficits in the schemes | (1,310 | ) | (174 | ) | (265 | ) | (1,749 | ) | (1,308 | ) | (1,553 | ) | (168 | ) | (263 | ) | (1,984 | ) | (951 | ) |
|
|
|
|
|
|
|
| |
| |
| |
| | | | | | | | | | | | | | | | 2004 | | | | | | | | | | | | | Experience gains of scheme assets (£m) | 196 | | 86 | | 23 | | 305 | | | | | | Percentage of scheme assets at 31st December 2004 | 4 | % | 5 | % | 4 | % | 5 | % | | | |
|
|
|
|
|
|
|
| |
| | | | | | | | | | | | | | | | | Experience (losses)/gains of scheme liabilities (£m) | (25 | ) | (5 | ) | (18 | ) | (48 | ) | 47 | | | | Percentage of scheme obligations at 31st December 2004 | – | | – | | 2 | % | 1 | % | 5 | % | |
|
|
|
|
|
|
|
| |
| | | | | | | | | | | | | | | | | Fair value of assets | 4,561 | | 1,638 | | 547 | | 6,746 | | – | | | | Present value of scheme obligations | (5,735 | ) | (1,750 | ) | (761 | ) | (8,246 | ) | (1,005 | ) | |
|
|
|
|
|
|
|
| |
| | | | Deficits in the schemes | (1,174 | ) | (112 | ) | (214 | ) | (1,500 | ) | (1,005 | ) | |
|
|
|
|
|
|
|
| |
| | | | | | | | | | | | | | | | | 2003 | | | | | | | | | | | | | Experience gains of scheme assets (£m) | 336 | | 231 | | 33 | | 600 | | | | | | Percentage of scheme assets at 31st December 2003 | 8 | % | 15 | % | 7 | % | 10 | % | | | |
|
|
|
|
|
|
|
| |
| | | | | | | | | | | | | | | | | Experience (losses)/gains of scheme liabilities (£m) | (183 | ) | 5 | | (19 | ) | (197 | ) | (123 | ) | | | Percentage of scheme obligations at 31st December 2003 | 3 | % | – | | 3 | % | 2 | % | 13 | % | |
|
|
|
|
|
|
|
| |
| | | | | | | | | | | | | | | | | Fair value of assets | 3,955 | | 1,583 | | 444 | | 5,982 | | – | | | | Present value of scheme obligations | (5,508 | ) | (1,751 | ) | (707 | ) | (7,966 | ) | (951 | ) | |
|
|
|
|
|
|
|
| |
| | | | Deficits in the schemes | (1,553 | ) | (168 | ) | (263 | ) | (1,984 | ) | (951 | ) | |
|
|
|
|
|
|
|
| |
| | |
| 122 | GSK Annual Report 2007 | | |
Sensitivity analysis
Effect of changes in assumptions used on the annual defined benefit pension and post-retirement costs or the benefit obligations:Back to Contents
| | | FINANCIAL STATEMENTS | | | Notes to the financial statements | | | | | | | | Notes to the financial statements | | continued | |
| 28 Pensions and other post-employment benefitscontinued | | | | | | Sensitivity analysis
| | | | Effect of changes in assumptions used on the annual defined benefit pension and post-retirement costs or the benefit obligations: | | | | | £m | |
|
| | | | | | A 0.25% decrease in discount rate would have the following approximate effect: | | | | | | | | Increase in annual pension cost | 48 | | | Increase in annual post-retirement benefits cost | 1– | | | Increase in pension obligation | 369374 | | | Increase in post-retirement benefits obligation | 3729 | |
|
| | | | | | A one year increase in life expectancy would have the following approximate effect: | | | | | | | | Increase in annual pension cost | 17 | | | Increase in annual post-retirement benefits cost | 3 | | | Increase in pension obligation | 259231 | | | Increase in post-retirement benefits obligation | 3938 | |
|
| |
|
| GSK Annual Report 2006 | 114 |
Back to Contents
| Notes to the financial statements | continued |
|
26 Pensions and other post-employment benefitscontinued
Sensitivity analysis
| £m | |
|
| | | A 0.25% decrease in expected rates of returns on assets would have the following approximate effect: | | | | | | | | Increase in annual pension cost | 2224 | |
|
| | | | | | A 1% increase in the rate of future healthcare inflation would have the following approximate effect: | | | | | | | | Increase in annual post-retirement benefits cost | 83 | | | Increase in post-retirement benefits obligation | 8947 | |
|
| | | | | | A 0.25% increase in inflation would have the following approximate effect: | | | | | | | | Increase in annual pension cost | 2326 | | | Increase in pension obligation | 298317 | |
|
| |
2729 Other provisions
| | | | | | | | Integration | | | | | | | | Legal | | New Operational | | Employee | | and | | | | | | | | and other | | Excellence | | related | | manufacturing | | Other | | | | | | disputes | | programme | | provisions | | re-organisation | | provisions | | Total | | | | £m | | £m | | £m | | £m | | £m | | £m | |
|
|
|
|
|
|
|
|
|
|
|
| | | At 1st January 2007 | 1,105 | | – | | 175 | | 167 | | 136 | | 1,583 | | | Exchange adjustments | (1 | ) | 6 | | 1 | | 2 | | 4 | | 12 | | | Charge for the year | 349 | | 220 | | 2 | | 32 | | 48 | | 651 | | | Reversed unused | (133 | ) | – | | (27 | ) | (16 | ) | (41 | ) | (217 | ) | | Unwinding of discount | 17 | | – | | 7 | | – | | 3 | | 27 | | | Utilised | (186 | ) | (9 | ) | (17 | ) | (64 | ) | (15 | ) | (291 | ) | | Reclassifications and other movements | 1 | | 29 | | 93 | | (5 | ) | 44 | | 162 | |
|
|
|
|
|
|
|
|
|
|
|
| | | At 31st December 2007 | 1,152 | | 246 | | 234 | | 116 | | 179 | | 1,927 | |
|
|
|
|
|
|
|
|
|
|
|
| | | To be settled within one year | 468 | | 212 | | 55 | | 75 | | 82 | | 892 | | | To be settled after one year | 684 | | 34 | | 179 | | 41 | | 97 | | 1,035 | |
|
|
|
|
|
|
|
|
|
|
|
| | | At 31st December 2007 | 1,152 | | 246 | | 234 | | 116 | | 179 | | 1,927 | |
|
|
|
|
|
|
|
|
|
|
|
| | | | | | | | | | | | | | | |
| GSK Annual Report 2007 | 123 | | |
Back to Contents | | | FINANCIAL STATEMENTS | | Notes to the financial statements | | | | | | | Notes to the financial statements | | continued | |
29 Other provisionscontinued | | Exchange | | | | | | Legal | | | | | | | | Offer | | Merger | | Operational | | and other | | Other | | | | | | Incentive | | integration | | excellence | | disputes | | provisions | | Total | | | | £m | | £m | | £m | | £m | | £m | | £m | |
|
|
|
|
|
|
|
|
|
|
|
| | | At 1st January 2006 | 133 | | 59 | | 52 | | 1,165 | | 227 | | 1,636 | | | Exchange adjustments | (5 | ) | (1 | ) | (5 | ) | (94 | ) | (15 | ) | (120 | ) | | (Credit)/charge for the year | (2 | ) | (24 | ) | 134 | | 293 | | 45 | | 446 | | | Unwinding of discount | 2 | | – | | – | | 24 | | 10 | | 36 | | | Applied | (11 | ) | (15 | ) | (50 | ) | (274 | ) | (41 | ) | (391 | ) | | Reversed unused | – | | – | | – | | (8 | ) | (14 | ) | (22 | ) | | Reclassifications and other movements | – | | (2 | ) | – | | (1 | ) | 1 | | (2 | ) |
|
|
|
|
|
|
|
|
|
|
|
| | | At 31st December 2006 | 117 | | 17 | | 131 | | 1,105 | | 213 | | 1,583 | |
|
|
|
|
|
|
|
|
|
|
|
| | | | | | | | | | | | | | | | | To be settled within one year | 64 | | 15 | | 117 | | 743 | | 116 | | 1,055 | | | To be settled after one year | 53 | | 2 | | 14 | | 362 | | 97 | | 528 | |
|
|
|
|
|
|
|
|
|
|
|
| | | At 31st December 2006 | 117 | | 17 | | 131 | | 1,105 | | 213 | | 1,583 | |
|
|
|
|
|
|
|
|
|
|
|
| |
The Group has recognised costs in previous years in respect of plans for the integration of the Glaxo WellcomeLegal and SmithKline Beecham businesses. Implementation of the integration following the merger is substantially complete. The exchange offer incentive programme operated at the time of the merger to encourage staff to convert Glaxo Wellcome or SmithKline Beecham share options into GlaxoSmithKline share options. The incentive is paid either when employees exercise the relevant options, or when the options lapse, up to 2010. The discount on this provision increased by £2 million in 2006 (2005 – £4 million), and was calculated using risk-free rates of return. Costs recognised in the remaining merger integration provision in respect of identified severances are expected to be incurred in 2007.
Operational excellence is the term used by the Group to refer to the continuous worldwide programme of cost saving measures that are carried out within all areas of the business. The majority of these projects are of a short-term nature.
other disputes
GSK is involved in a number of legal and other disputes, including notification of possible claims, as set out in Note 4344 ‘Legal proceedings’. Provisions for legal and other disputes include amounts relating to US anti-trust, product liability, contract terminations, self-insurance, environmental clean-up and property rental. The company’s Directors, having taken legal and other specialist advice, have established provisions after taking into account insurance and other agreements and having regard to the relevant facts and circumstances of each matter and in accordance with accounting requirements. These The discount on these provisions were discounteddecreased by £10 million in 2007 (2006 - £2 million in 2006 (2005 – £71 million)increase) and was calculated using risk-adjusted projected cash flows and risk-free rates of return. The effectmovement in 2007 includes a decrease of the£34 million arising from a change in the discount rate in 2006 is to increase the discount at 31st December by £7 million.year. A number of products have a history of claims made and settlements which makes it possible to use an IBNR (incurred but not reported) actuarial technique to determine a reasonable estimate of the Group’s exposure for unasserted claims in relation to those products. Apart from the IBNR provision, no provisions have been made for unasserted claims. The ultimate liability for such matters may vary from the amounts provided and is dependent upon the outcome of litigation proceedings, investigations and possible settlement negotiations. It is in the nature of the Group’s business that a number of these matters, including those provided using the IBNR actuarial technique, may be the subject of negotiation and litigation over several years. The largest individual amounts provided are expected to be settled within three years. At 31st December 2006,2007, it is expected that £120£89 million (2005(2006 – £115£120 million) of the provision made for legal and other disputes will be reimbursed by third party insurers. This amount is included within current and non-current assets. For a discussion of legal issues, refer to Note 4344 ‘Legal proceedings’. |
| GSK Annual Report 2006 | 115 |
BackNew Operational Excellence programme
In October 2007, GSK announced a significant new £1.5 billion Operational Excellence programme to Contentsimprove the effectiveness and productivity of its operations. This new programme is expected to deliver annual pre-tax savings of £700 million by 2010. GSK expects to realise the majority of annual savings within the first two years of the programme, with approximately £350 million expected by 2008 and £550 million by 2009. These savings will partly mitigate the expected impact to 2008 earnings from generic competition and lowerAvandia sales and the associated adverse impact on GSK’s gross margin. Costs recognised as a provision, principally in respect of identified severances at sites where it has been announced that manufacturing activities will be reduced or cease, are expected to be incurred mainly in 2008 and 2009. Asset retirement obligations recognised as a provision amount to £29 million in the year. Costs of asset write-downs have been recognised as impairments of property, plant and equipment.
| Notes to the financial statements | continued |
|
Employee related provisions
Employee related provisions includes the exchange offer incentive programme which operated at the time of the merger to encourage staff to convert Glaxo Wellcome or SmithKline Beecham share options into GlaxoSmithKline share options. The incentive is paid either when employees exercise the relevant options, or when the options lapse, up to 2010. The discount on this provision increased by £7 million in 2007 (2006 – £2 million), and was calculated using risk-free rates of return. The Group provides certain medical benefits to disabled employees and their spouses in the USA. These were transferred from post-retirement benefits at a value of £89 million during the year and are reflected in the total reclassifications and other movements figure of £162 million. At 31st December 2007, the provision for these benefits amounted to £73 million. Other employee benefits reflect a variety of provisions for severance costs, jubilee awards and other long-service benefits. Integration and manufacturing re-organisation
The Group has recognised costs in previous years in respect of plans for the integration of the Glaxo Wellcome and SmithKline Beecham businesses. Implementation of the integration following the merger is substantially complete. Costs recognised in the remaining merger integration provision in respect of identified severances are expected to be incurred in 2008. Other smaller cost-saving initiatives since the merger are now included within this category. 2830 Other non-current liabilities
| | 2006 | | 2005 | | 2007 | | 2006 | | | | £m | | £m | | £m | | £m | |
|
| |
| | | Accruals and deferred income | 97 | | 58 | | 68 | | 97 | | | Derivative financial instruments | 60 | | 26 | | | | Other payables | 249 | | 383 | | 300 | | 249 | |
|
| |
| | | | 406 | | 467 | | 368 | | 346 | |
|
| |
| |
2931 Contingent liabilities
At 31st December 20062007 contingent liabilities, comprising guarantees, letters of credit, discounted bills and other items arising in the normal course of business, amounted to £258£206 million (2005(2006 – £342£258 million). At 31st December 2006,2007, £119 million (2006 – £114 million (2005 – £96 million) of financial assets were pledged as collateral for contingent liabilities. For discussions of tax and legal issues, refer to Note 12,14, ‘Taxation’ and Note 43,44, ‘Legal proceedings’. | 124 | GSK Annual Report 2007 | | |
Back to Contents | | | FINANCIAL STATEMENTS | | | Notes to the financial statements | | | | | | | | Notes to the financial statements | | continued | |
3032 Net debt
| | 2006 | | 2005 | | 2007 | | 2006 | | | | £m | | £m | | £m | | £m | |
|
|
|
| |
| | | Current assets: | | | | | | | Liquid investments | 1,035 | | 1,025 | | 1,153 | | 1,035 | | | Cash and cash equivalents | 2,005 | | 4,209 | | 3,379 | | 2,005 | |
|
|
|
| |
| | | | 3,040 | | 5,234 | | 4,532 | | 3,040 | |
|
| |
| | | Short-term borrowings: | | | | | | | 6.125% US$ Notes 2006 | – | | (291 | ) | | | 2.375% US$ Medium Term Note 2007 | (255 | ) | – | | – | | (255 | ) | | 3.375% € European Medium Term Note | | (736 | ) | – | | | 4.875% £ European Medium Term Note | | (497 | ) | – | | | Commercial paper | – | | (576 | ) | (2,064 | ) | – | | | Bank loans and overdrafts | (410 | ) | (249 | ) | (161 | ) | (410 | ) | | Other loans | (11 | ) | (46 | ) | (6 | ) | (11 | ) | | Obligations under finance leases | (42 | ) | (38 | ) | (40 | ) | (42 | ) |
|
|
|
| |
| | | | (718 | ) | (1,200 | ) | (3,504 | ) | (718 | ) |
|
| |
| | | Long-term borrowings: | | | | | | | 2.375%US$ US Medium Term Note 2007 | – | | (283 | ) | | | 3.375%€European Medium Term Note 2008 | (671 | ) | (689 | ) | – | | (671 | ) | | 4.875% £ European Medium Term Note 2008 | (494 | ) | (502 | ) | – | | (494 | ) | | 3.25%€European Medium Term Note 2009 | (338 | ) | (342 | ) | (368 | ) | (338 | ) | | 3.00%€European Medium Term Note 2012 | (503 | ) | (510 | ) | (548 | ) | (503 | ) | | 5.125% € European Medium Term Note 2012 | | (1,645 | ) | – | | | 4.375% US$ US Medium Term Note 2014 | (719 | ) | (825 | ) | (746 | ) | (719 | ) | | 5.625% € European Medium Term Note 2017 | | (912 | ) | – | | | 4.00%€European Medium Term Note 2025 | (497 | ) | (503 | ) | (542 | ) | (497 | ) | | 5.25% £ European Medium Term Note 2033 | (977 | ) | (976 | ) | (978 | ) | (977 | ) | | 5.375% US$ US Medium Term Note 2034 | (253 | ) | (288 | ) | (249 | ) | (253 | ) | | 5.25% £ European Medium Term Note 2042 | | (984 | ) | – | | | Loan stock | (10 | ) | (11 | ) | (9 | ) | (10 | ) | | Bank loans | (1 | ) | (3 | ) | (1 | ) | (1 | ) | | Other loans and private financing | (212 | ) | (256 | ) | (2 | ) | (212 | ) | | Obligations under finance leases | (97 | ) | (83 | ) | (83 | ) | (97 | ) |
|
|
|
| |
| | | | (4,772 | ) | (5,271 | ) | (7,067 | ) | (4,772 | ) |
|
|
|
| |
| | | Net debt | (2,450 | ) | (1,237 | ) | (6,039 | ) | (2,450 | ) |
|
|
|
| |
| |
Current assets
Liquid investments are classified as available-for-sale investments. At 31st December 2006,2007, they included redeemable shares, which were fully102% collateralised with highly rated bonds, of€1 €1 billion (£736 million) (2006 – €1 billion (£676 million),) and government bonds. The effective interest rate on liquid investments at 31st December 20062007 was approximately 3.7 % (20054.9% (2006 – approximately 2.8%3.7%) . Liquid investment balances at 31st December 2007 earning interest at floating and fixed rates amount to £868 million and £285 million, respectively (2006 – £750 million and £285 million). The effective interest rate on cash and cash equivalents at 31st December 20062007 was approximately 4.8% (20055.0% (2006 – approximately 4.0%4.8%) . Cash and cash equivalents balances at 31st December 2007 earning interest at floating and fixed rates amount to £3,257 million and £36 million, respectively (2006 – £1,940 million and £12 million). From July 2007 onwards, GSK tightened its criteria for holding cash equivalents and liquid investments in response to the credit crisis. GSK has suffered no loss of principal as a result of this crisis. GSK’s policy regarding the credit quality of cash and cash equivalents is referred to in Note 41, ‘Financial instruments and related disclosures’. |
| GSK Annual Report 20062007 | 125 | 116 | |
<Back to Contents | | FINANCIAL STATEMENTS | | Notes to the financial statements | | | | | | | Notes to the financial statements | | continued |
|
3032 Net debtcontinued
Short-term borrowings
Commercial paper comprises a US$10US $10 billion programme, of which none$4.1 billion (£2.1 billion) was in issue at 31st December 2006 (20052007 (2006 – $991 million (£576 million))nil), backed up by committed facilities of 364 days duration of $900 million$5 billion (£459 million) (20052.5 billion) (2006 – $900 million (£523459 million)) renewable annually, and liquid investments, cash and cash equivalents as shown in the table above. The weighted average interest rate on current bank loans and overdrafts at 31st December 20062007 was 2.4% (20054.85% (2006 – 4.0%2.4%). Long-term borrowings
LoansAt the year-end, GSK had long-term borrowings of £7.1 billion (2006 – £4.8 billion) of which £4.4 billion (2006 – £3.2 billion) falls due after one year are repayable over various periods as follows:in more than five years. | | 2006 | | 2005 | | | | £m | | £m | |
|
|
|
| | | Between one and two years | 1,202 | | 317 | | | Between two and three years | 366 | | 1,224 | | | Between three and four years | 26 | | 354 | | | Between four and five years | 7 | | 9 | | | After five years | 3,171 | | 3,367 | |
|
|
|
| | | | 4,772 | | 5,271 | |
|
|
|
| |
The loansLong-term borrowings repayable after five years carry interest at effective rates between 3.0%4.03% and 5.4%5.66% . The repayment dates range from 20122014 to 2034.
2042. The average effective interest rate of all Notesnotes at 31st December 20062007 was approximately 4.3% (20054.8% (2006 – approximately 4.5%4.3%). Secured loans
Loans amounting to £8 million (2005 – £20 million) areGSK had no loans secured by charges on non-current and current assets.assets in the year (2006 – £nil). | Finance lease obligations | 2006 | | 2005 | | | | | 2007 | | 2006 | | | Finance lease obligations | £m | | £m | | | £m | | £m | |
|
| | | Rental payments due within one year | 49 | | 41 | | | 45 | | 49 | | | Rental payments due between one and two years | 41 | | 33 | | | 40 | | 41 | | | Rental payments due between two and three years | 30 | | 23 | | | 26 | | 30 | | | Rental payments due between three and four years | 18 | | 13 | | | 11 | | 18 | | | Rental payments due between four and five years | 8 | | 9 | | | 5 | | 8 | | | Rental payments due after five years | 14 | | 15 | | | 10 | | 14 | |
|
|
|
| |
| | | Total future rental payments | 160 | | 134 | | | 137 | | 160 | | | Future finance charges | (21 | ) | (13 | ) | | (14 | ) | (21 | ) |
|
|
|
| |
| | | Total finance lease obligations | 139 | | 121 | | | 123 | | 139 | |
|
|
|
| |
| |
Finance lease obligations at 31st December 2007 bearing interest at floating and fixed rates amount to £94 million and £29 million, respectively (2006 – £93 million and £46 million). | 126 |
| GSK Annual Report 20062007 | 117 | |
Back to Contents | FINANCIAL STATEMENTS | | | Notes to the financial statements | | | | | | | | Notes to the financial statements | | continued |
|
3133 Share capital and share premium account
| | | | | | | | | | Ordinary shares of 25p each | | Share | | | |
|
|
| | premium | | | | Number | | £m | | £m | |
|
|
|
|
|
| | | Share capital authorised | | | | | | | | At 31st December 2004 | 10,000,000,000 | | 2,500 | | | | | At 31st December 2005 | 10,000,000,000 | | 2,500 | | | | | At 31st December 2006 | 10,000,000,000 | | 2,500 | | | |
|
|
|
|
|
| | | Share capital issued and fully paid | | | | | | | | | | | | | | | | At 1st January 2004 | 5,949,463,628 | | 1,487 | | 264 | | | Issued under share option schemes | 6,300,203 | | 2 | | 40 | | | Purchased and cancelled | (18,075,000 | ) | (5 | ) | – | |
|
|
|
|
|
| | | At 31st December 2004 | 5,937,688,831 | | 1,484 | | 304 | | | Issued under share option schemes | 25,162,425 | | 7 | | 245 | |
|
|
|
|
|
| | | At 31st December 2005 | 5,962,851,256 | | 1,491 | | 549 | | | Issued under share option schemes | 28,750,592 | | 7 | | 309 | |
|
|
|
|
|
| | | At 31st December 2006 | 5,991,601,848 | | 1,498 | | 858 | |
|
|
|
|
|
| | | | | | | | | |
| | 31st December | | 31st December | | 31st December | | | | 2006 | | 2005 | | 2004 | |
|
|
|
|
|
| | | Number (‘000) of shares issuable under outstanding options (Note 40) | 225,163 | | 221,293 | | 276,954 | |
|
|
|
|
|
| | | Number (‘000) of unissued shares not under option | 3,783,235 | | 3,815,856 | | 3,785,358 | |
|
|
|
|
|
| |
| | | | | | | | | | | | Ordinary shares of 25p each | | Share | | | | |
|
|
| | Premium | | | | | Number | | £m | | £m | |
|
|
|
|
|
|
| | | Share capital authorised | | | | | | | �� | | At 31st December 2005 | | 10,000,000,000 | | 2,500 | | | | | At 31st December 2006 | | 10,000,000,000 | | 2,500 | | | | | At 31st December 2007 | | 10,000,000,000 | | 2,500 | | | |
|
|
|
|
|
|
| | | Share capital issued and fully paid | | | | | | | | | At 1st January 2005 | | 5,937,688,831 | | 1,484 | | 304 | | | Issued under share option schemes | | 25,162,425 | | 7 | | 245 | |
|
|
|
|
|
|
| | | At 31st December 2005 | | 5,962,851,256 | | 1,491 | | 549 | | | Issued under share option schemes | | 28,750,592 | | 7 | | 309 | |
|
|
|
|
|
|
| | | At 31st December 2006 | | 5,991,601,848 | | 1,498 | | 858 | | | Issued under share option schemes | | 37,307,678 | | 9 | | 408 | | | Share capital purchased and cancelled | | (16,322,500 | ) | (4 | ) | – | |
|
|
|
|
|
|
| | | At 31st December 2007 | | 6,012,587,026 | | 1,503 | | 1,266 | |
|
|
|
|
|
|
| |
| | | | | | | | | | | | 31st December | | 31st December | | 31st December | | | | | 2007 | | 2006 | | 2005 | |
|
|
|
|
|
|
| | | Number (‘000) of shares issuable under outstanding options (Note 42) | | 218,182 | | 225,163 | | 221,293 | |
|
|
|
|
|
|
| | | Number (‘000) of unissued shares not under option | | 3,769,231 | | 3,783,235 | | 3,815,856 | |
|
|
|
|
|
|
| |
At 31st December 2006,2007, of the issued share capital, 153,451,642134,529,906 shares were held in the ESOP Trust, 235,482,678504,194,158 shares were held as Treasury shares and 5,602,667,5285,373,862,962 shares were in free issue. All issued shares are fully paid. The nominal, carrying and market values of the shares held in the ESOP Trust are disclosed in Note 40.42, Employee share schemes’. In October 2006,July 2007, the Group announced a newincreased its share buy-back programme totalling £6to £12 billion, which is expected to be completed over a three yeartwo-year period. The exact amount and timing of future purchases, and the extent to whichwhether repurchased shares will be held as Treasury shares rather than beingor cancelled, will be determined by the company and is dependent on market conditions and other factors. In 2006,2007, the Group also commenced close period share buy-backs by operating under specific, irrevocable agreements put in place with its brokers prior to the start of each close period. A total of £7.8£11.6 billion has been spent by the company between 1st January 2001 and 31st December 20062007 on buying its own shares for cancellation or to be held as Treasury shares, of which £1.3£3.8 billion was spent in 2006 (£0.5 billion under the new £6 billion programme).2007. 20.428.9 million shares have been purchased and cancelled in the period 1st January 20072008 to 23rd22nd February 20072008 at a cost of £290£323 million. All purchases were made through the publicly announced buy-back programme.
The table below sets out the monthly purchases under the share buy-back programme: | | | | Average share price excluding | | | | Number of shares | | commission and stamp duty | | | Month | 000 | | £ | |
|
|
|
| | | January 2006 | Nil | | – | | | February 2006 | 4,375 | | 14.67 | | | March 2006 | 10,040 | | 15.34 | | | April 2006 | 640 | | 15.63 | | | May 2006 | 10,200 | | 15.09 | | | June 2006 | 8,567 | | 14.81 | | | July 2006 | 5,935 | | 15.07 | | | August 2006 | 9,080 | | 14.41 | | | September 2006 | 6,525 | | 14.42 | | | October 2006 | 10,628 | | 14.30 | | | November 2006 | 18,550 | | 13.73 | | | December 2006 | 8,163 | | 13.39 | |
|
|
|
| | | Total | 92,703 | | 14.45 | |
|
|
|
| |
| | | | | Average share price excluding | | | | | Number of shares | | commission and stamp duty | | | Month | | 000 | | £ | |
|
|
|
|
| | | January 2007 | | 12,090 | | 13.87 | | | February 2007 | | 9,910 | | 14.48 | | | March 2007 | | 23,900 | | 13.97 | | | April 2007 | | 8,800 | | 14.45 | | | May 2007 | | 12,886 | | 13.78 | | | June 2007 | | 22,480 | | 13.05 | | | July 2007 | | 3,950 | | 12.56 | | | August 2007 | | 47,528 | | 12.76 | | | September 2007 | | 38,512 | | 13.21 | | | October 2007 | | 55,775 | | 12.76 | | | November 2007 | | 32,880 | | 12.10 | | | December 2007 | | 16,323 | | 12.99 | |
|
|
|
|
| | | Total | | 285,034 | | 13.09 | |
|
|
|
|
| |
AllOf the shares purchased in 20062007, 269 million (£3,537 million) are held as Treasury shares.shares and 16 million (£213 million) have been cancelled. For details of substantial shareholdings refer to ‘Substantial shareholdings’ on page 177.170.
|
| GSK Annual Report 20062007 | 127 | 118 | |
Back to Contents | | | | FINANCIAL STATEMENTS | | Notes to the financial statements | | | | | | | Notes to the financial statements | | continued | |
34 Movements in equity | | | Shareholders’ equity | | | | | | | | |
|
|
|
|
|
|
|
|
| | | | | | | | | Share | | Share | | Retained | | Other | | Total | | Minority | | Total | | | | | capital | | premium | | earnings | | reserves | | £m | | interests | | equity | | | | | £m | | £m | | £m | | £m | | | | £m | | £m | |
|
|
|
|
|
|
|
|
|
|
|
|
|
|
| | | At 1st January 2005 | | 1,484 | | 304 | | 4,448 | | (528 | ) | 5,708 | | 217 | | 5,925 | | | Recognised income and expense for the year | | – | | – | | 4,426 | | (3 | ) | 4,423 | | 153 | | 4,576 | | | Changes in minority shareholdings | | – | | – | | (15 | ) | – | | (15 | ) | (25 | ) | (40 | ) | | Distributions to minority shareholders | | – | | – | | – | | – | | – | | (86 | ) | (86 | ) | | Dividends to shareholders | | – | | – | | (2,390 | ) | – | | (2,390 | ) | – | | (2,390 | ) | | Ordinary shares issued | | 7 | | 245 | | – | | – | | 252 | | – | | 252 | | | Ordinary shares purchased and held as Treasury shares | | – | | – | | (1,000 | ) | – | | (1,000 | ) | – | | (1,000 | ) | | Ordinary shares transferred by ESOP Trusts | | – | | – | | – | | 68 | | 68 | | – | | 68 | | | Write-down of shares held by ESOP Trusts | | – | | – | | (155 | ) | 155 | | – | | – | | – | | | Share-based incentive plans | | – | | – | | 240 | | – | | 240 | | – | | 240 | | | Tax on share based incentive plans | | – | | – | | 25 | | – | | 25 | | – | | 25 | |
|
|
|
|
|
|
|
|
|
|
|
|
|
|
| | | At 31st December 2005 | | 1,491 | | 549 | | 5,579 | | (308 | ) | 7,311 | | 259 | | 7,570 | | | Recognised income and expense for the year | | – | | – | | 5,248 | | 59 | | 5,307 | | 88 | | 5,395 | | | Changes in minority shareholdings | | – | | – | | – | | – | | – | | 2 | | 2 | | | Distributions to minority shareholders | | – | | – | | – | | – | | – | | (87 | ) | (87 | ) | | Dividends to shareholders | | – | | – | | (2,598 | ) | – | | (2,598 | ) | – | | (2,598 | ) | | Ordinary shares issued | | 7 | | 309 | | – | | – | | 316 | | – | | 316 | | | Ordinary shares purchased and held as Treasury shares | | – | | – | | (1,348 | ) | – | | (1,348 | ) | – | | (1,348 | ) | | Ordinary shares transferred by ESOP Trusts | | – | | – | | – | | 151 | | 151 | | – | | 151 | | | Write-down of shares held by ESOP Trusts | | – | | – | | (163 | ) | 163 | | – | | – | | – | | | Share-based incentive plans | | – | | – | | 226 | | – | | 226 | | – | | 226 | | | Tax on share-based incentive plans | | – | | – | | 21 | | – | | 21 | | – | | 21 | |
|
|
|
|
|
|
|
|
|
|
|
|
|
|
| | | At 31st December 2006 | | 1,498 | | 858 | | 6,965 | | 65 | | 9,386 | | 262 | | 9,648 | | | Recognised income and expense for the year | | – | | – | | 6,104 | | (92 | ) | 6,012 | | 122 | | 6,134 | | | Distributions to minority shareholders | | – | | – | | – | | – | | – | | (77 | ) | (77 | ) | | Dividends to shareholders | | – | | – | | (2,793 | ) | – | | (2,793 | ) | – | | (2,793 | ) | | Ordinary shares issued | | 9 | | 408 | | – | | – | | 417 | | – | | 417 | | | Ordinary shares purchased and cancelled | | (4 | ) | – | | (213 | ) | 4 | | (213 | ) | – | | (213 | ) | | Ordinary shares purchased and held as Treasury shares | | – | | – | | (3,537 | ) | – | | (3,537 | ) | – | | (3,537 | ) | | Ordinary shares acquired by ESOP Trusts | | – | | – | | – | | (26 | ) | (26 | ) | – | | (26 | ) | | Ordinary shares transferred by ESOP Trusts | | – | | – | | – | | 116 | | 116 | | – | | 116 | | | Write-down of shares held by ESOP Trusts | | – | | – | | (292 | ) | 292 | | – | | – | | – | | | Share-based incentive plans | | – | | – | | 237 | | – | | 237 | | – | | 237 | | | Tax on share-based incentive plans | | – | | – | | 4 | | – | | 4 | | – | | 4 | |
|
|
|
|
|
|
|
|
|
|
|
|
|
|
| | | At 31st December 2007 | | 1,503 | | 1,266 | | 6,475 | | 359 | | 9,603 | | 307 | | 9,910 | |
|
|
|
|
|
|
|
|
|
|
|
|
|
|
| | | | | | | | | | | | | | | | | | |
| 128 | GSK Annual Report 2007 | | |
Back to Contents | | | FINANCIAL STATEMENTS | | | Notes to the financial statements | | | | | | | | Notes to the financial statements | | continued |
|
3234 Movements in equitycontinued
| | | | | | | | Shareholders’ equity | | | | | | | |
|
|
|
|
|
|
| | | | | | | | Share | | Share | | Retained | | Other | | | | Minority | | Total | | | | capital | | premium | | earnings | | reserves | | Total | | interests | | equity | | | | £m | | £m | | £m | | £m | | £m | | £m | | £m | |
|
|
|
|
|
|
|
|
|
|
|
|
|
| | | At 1st January 2004 | 1,487 | | 264 | | 3,959 | | (793 | ) | 4,917 | | 681 | | 5,598 | | | Recognised income and expense for the year | – | | – | | 3,906 | | – | | 3,906 | | 93 | | 3,999 | | | Changes in minority shareholdings | – | | – | | – | | – | | – | | (489 | ) | (489 | ) | | Distributions to minority shareholders | – | | – | | – | | – | | – | | (72 | ) | (72 | ) | | Dividends to shareholders | – | | – | | (2,476 | ) | – | | (2,476 | ) | – | | (2,476 | ) | | Ordinary shares issued | 2 | | 40 | | – | | – | | 42 | | – | | 42 | | | Ordinary shares purchased and cancelled | (5 | ) | – | | (201 | ) | 5 | | (201 | ) | – | | (201 | ) | | Ordinary shares purchased and held as Treasury shares | – | | – | | (799 | ) | – | | (799 | ) | – | | (799 | ) | | Ordinary shares transferred by ESOP Trusts | – | | – | | – | | 23 | | 23 | | – | | 23 | | | Write-down of shares held by ESOP Trusts | – | | – | | (180 | ) | 180 | | – | | – | | – | | | Share-based incentive plans | – | | – | | 333 | | (21 | ) | 312 | | – | | 312 | |
|
|
|
|
|
|
|
|
|
|
|
|
|
| | | At 31st December 2004 | 1,484 | | 304 | | 4,542 | | (606 | ) | 5,724 | | 213 | | 5,937 | | | Implementation of accounting for financial instruments under IAS 39 | – | | – | | (94 | ) | 78 | | (16 | ) | 4 | | (12 | ) |
|
|
|
|
|
|
|
|
|
|
|
|
|
| | | At 1st January 2005, as adjusted | 1,484 | | 304 | | 4,448 | | (528 | ) | 5,708 | | 217 | | 5,925 | | | Recognised income and expense for the year | – | | – | | 4,426 | | (3 | ) | 4,423 | | 153 | | 4,576 | | | Changes in minority shareholdings | – | | – | | (15 | ) | – | | (15 | ) | (25 | ) | (40 | ) | | Distributions to minority shareholders | – | | – | | – | | – | | – | | (86 | ) | (86 | ) | | Dividends to shareholders | – | | – | | (2,390 | ) | – | | (2,390 | ) | – | | (2,390 | ) | | Ordinary shares issued | 7 | | 245 | | – | | – | | 252 | | – | | 252 | | | Ordinary shares purchased and held as Treasury shares | – | | – | | (1,000 | ) | – | | (1,000 | ) | – | | (1,000 | ) | | Ordinary shares transferred by ESOP Trusts | – | | – | | – | | 68 | | 68 | | – | | 68 | | | Write-down of shares held by ESOP Trusts | – | | – | | (155 | ) | 155 | | – | | – | | – | | | Share-based incentive plans | – | | – | | 240 | | – | | 240 | | – | | 240 | | | Tax on share-based incentive plans | – | | – | | 25 | | – | | 25 | | – | | 25 | |
|
|
|
|
|
|
|
|
|
|
|
|
|
| | | At 31st December 2005 | 1,491 | | 549 | | 5,579 | | (308 | ) | 7,311 | | 259 | | 7,570 | | | Recognised income and expense for the year | – | | – | | 5,248 | | 59 | | 5,307 | | 88 | | 5,395 | | | Changes in minority shareholdings | – | | – | | – | | – | | – | | 2 | | 2 | | | Distributions to minority shareholders | – | | – | | – | | – | | – | | (87 | ) | (87 | ) | | Dividends to shareholders | – | | – | | (2,598 | ) | – | | (2,598 | ) | – | | (2,598 | ) | | Ordinary shares issued | 7 | | 309 | | – | | – | | 316 | | – | | 316 | | | Ordinary shares purchased and held as Treasury shares | – | | – | | (1,348 | ) | – | | (1,348 | ) | – | | (1,348 | ) | | Ordinary shares transferred by ESOP Trusts | – | | – | | – | | 151 | | 151 | | – | | 151 | | | Write-down of shares held by ESOP Trusts | – | | – | | (163 | ) | 163 | | – | | – | | – | | | Share-based incentive plans | – | | – | | 226 | | – | | 226 | | – | | 226 | | | Tax on share-based incentive plans | – | | – | | 21 | | – | | 21 | | – | | 21 | |
|
|
|
|
|
|
|
|
|
|
|
|
|
| | | At 31st December 2006 | 1,498 | | 858 | | 6,965 | | 65 | | 9,386 | | 262 | | 9,648 | |
|
|
|
|
|
|
|
|
|
|
|
|
|
| |
Retained earnings and other reserves amounted to £7,030£6,834 million at 31st December 2006 (20052007 (2006 – £5,271£7,030 million, 20042005 – £3,936£5,271 million) of which £10,358 million (2006 – £7,180 million, (20052005 – £8,067 million, 2004 – £10,243 million) relates to the company and £218 million (2006 – £185 million, (20052005 – £180 million, 2004– £108 million) relates to joint ventures and associated undertakings. The cumulative translation exchange in equity since 1st January 2003 is shown in the following table: | | 2006 | | 2005 | | 2004 | | | | £m | | £m | | £m | |
|
|
|
|
|
| | | Translation exchange at 1st January | 217 | | 5 | | 46 | | | Exchange movements on overseas net assets | (390 | ) | 203 | | (47 | ) | | Exchange movements on goodwill in reserves | 31 | | 9 | | 6 | |
|
|
|
|
|
| | | Translation exchange at 31st December | (142 | ) | 217 | | 5 | |
|
|
|
|
|
| |
|
| GSK Annual Report 2006 | 119 |
Back to Contents
| Notes to the financial statements | continued |
|
32 Movements in equitycontinued
Other reserves is analysed as follows:
| | | | | | Cash flow | | | | | | | | ESOP Trust | | Fair value | | hedge | | Other | | | | | | shares | | reserve | | reserve | | reserves | | Total | | | | £m | | £m | | £m | | £m | | £m | |
|
|
|
|
|
|
|
|
|
| | | At 1st January 2004 | (2,718 | ) | – | | – | | 1,925 | | (793 | ) | | Ordinary shares purchased and cancelled | – | | – | | – | | 5 | | 5 | | | Ordinary shares transferred by ESOP Trusts | 23 | | – | | – | | – | | 23 | | | Write-down of shares held by ESOP Trusts | 180 | | – | | – | | – | | 180 | | | Share-based incentive plans | (21 | ) | – | | – | | – | | (21 | ) |
|
|
|
|
|
|
|
|
|
| | | At 31st December 2004 | (2,536 | ) | – | | – | | 1,930 | | (606 | ) | | Implementation of accounting for financial instruments under IAS 39 | – | | 76 | | 2 | | – | | 78 | |
|
|
|
|
|
|
|
|
|
| | | At 1st January 2005, as adjusted | (2,536 | ) | 76 | | 2 | | 1,930 | | (528 | ) | | Recognised income and expense for the year | – | | – | | (3 | ) | – | | (3 | ) | | Ordinary shares transferred by ESOP Trusts | 68 | | – | | – | | – | | 68 | | | Write-down of shares held by ESOP Trusts | 155 | | – | | – | | – | | 155 | |
|
|
|
|
|
|
|
|
|
| | | At 31st December 2005 | (2,313 | ) | 76 | | (1 | ) | 1,930 | | (308 | ) | | Recognised income and expense for the year | – | | 61 | | (2 | ) | – | | 59 | | | Ordinary shares transferred by ESOP Trusts | 151 | | – | | – | | – | | 151 | | | Write-down of shares held by ESOP Trusts | 163 | | – | | – | | – | | 163 | |
|
|
|
|
|
|
|
|
|
| | | At 31st December 2006 | (1,999 | ) | 137 | | (3 | ) | 1,930 | | 65 | |
|
|
|
|
|
|
|
|
|
| |
| | Net translation exchange included in: | | | | | |
| | | | | | | | | | | | Total | | | | Fair value | | Retained | | Minority | | translation | | | | reserve | | earnings | | interest | | exchange | | | | £m | | £m | | £m | | £m | |
|
|
|
|
|
|
|
| | | At 1st January 2005 | – | | 96 | | (91 | ) | 5 | | | Exchange movements on overseas net assets | 14 | | 167 | | 22 | | 203 | | | Exchange movements on goodwill in reserves | – | | 9 | | – | | 9 | |
|
|
|
|
|
|
|
| | | At 31st December 2005 | 14 | | 272 | | (69 | ) | 217 | | | Exchange movements on overseas net assets | (5 | ) | (362 | ) | (23 | ) | (390 | ) | | Exchange movements on goodwill in reserves | – | | 31 | | – | | 31 | |
|
|
|
|
|
|
|
| | | At 31st December 2006 | 9 | | (59 | ) | (92 | ) | (142 | ) | | Exchange movements on overseas net assets | – | | 408 | | 17 | | 425 | | | Exchange movements on goodwill in reserves | – | | (14 | ) | – | | (14 | ) |
|
|
|
|
|
|
|
| | | At 31st December 2007 | 9 | | 335 | | (75 | ) | 269 | |
|
|
|
|
|
|
|
| | | | | | | | | | | |
| The analysis of other reserves is as follows: | | | | | Cash flow | | | | | | | | ESOP Trust | | Fair value | | hedge | | Other | | | | | | shares | | reserve | | reserve | | reserves | | Total | | | | £m | | £m | | £m | | £m | | £m | |
|
|
|
|
|
|
|
|
|
| | | At 1st January 2005 | (2,536 | ) | 76 | | 2 | | 1,930 | | (528 | ) | | Transferred to income and expense in the year on disposals | – | | (11 | ) | – | | – | | (11 | ) | | Net fair value movement in the year | – | | 11 | | (3 | ) | – | | 8 | | | Ordinary shares transferred by ESOP Trusts | 68 | | – | | – | | – | | 68 | | | Write-down of shares held by ESOP Trusts | 155 | | – | | – | | – | | 155 | |
|
|
|
|
|
|
|
|
|
| | | At 31st December 2005 | (2,313 | ) | 76 | | (1 | ) | 1,930 | | (308 | ) | | Transferred to income and expense in the year on disposals | – | | (19 | ) | – | | – | | (19 | ) | | Transferred to income and expense in the year on impairment | – | | (2 | ) | – | | – | | (2 | ) | | Net fair value movement in the year | – | | 82 | | (2 | ) | – | | 80 | | | Ordinary shares transferred by ESOP Trusts | 151 | | – | | – | | – | | 151 | | | Write-down of shares held by ESOP Trusts | 163 | | – | | – | | – | | 163 | |
|
|
|
|
|
|
|
|
|
| | | At 31st December 2006 | (1,999 | ) | 137 | | (3 | ) | 1,930 | | 65 | | | Transferred to income and expense in the year on disposals | – | | (34 | ) | – | | – | | (34 | ) | | Transferred to income and expense in the year on impairment | – | | (12 | ) | – | | – | | (12 | ) | | Net fair value movement in the year | – | | (42 | ) | (4 | ) | – | | (46 | ) | | Ordinary shares purchased and cancelled | – | | – | | – | | 4 | | 4 | | | Ordinary shares acquired by ESOP Trusts | (26 | ) | – | | – | | – | | (26 | ) | | Ordinary shares transferred by ESOP Trusts | 116 | | – | | – | | – | | 116 | | | Write-down of shares held by ESOP Trusts | 292 | | – | | – | | – | | 292 | |
|
|
|
|
|
|
|
|
|
| | | At 31st December 2007 | (1,617 | ) | 49 | | (7 | ) | 1,934 | | 359 | |
|
|
|
|
|
|
|
|
|
| |
Other reserves include the merger reserve created on the merger of Glaxo Wellcome and SmithKline Beecham amounting to £1,561 million at 31st December 2006 (20052007 (2006 – £1,561 million; 20042005 – £1,561 million). Other reserves also include the capital redemption reserve created as a result of the share buy-back programme amounting to £81£85 million at 31st December 2006 (20052007 (2006 – £81 million, 20042005 – £81 million). | GSK Annual Report 2007 | 129 | | |
Back to Contents | | | FINANCIAL STATEMENTS | | Notes to the financial statements | | | | | | | Notes to the financial statements | | continued | |
33 35Related party transactions
GlaxoSmithKline held an 18.7%18.9% interest in Quest Diagnostics Inc. at 31st December 2006 (20052007 (2006 – 18.4%18.7%) . The Group and Quest Diagnostics are parties to a long-term contractual relationship under which Quest Diagnostics is the primary provider of clinical laboratory testing to support the Group’s clinical trials testing requirements worldwide. During 2006,2007, Quest Diagnostics provided services of £48£38 million (2005(2006 – £39£48 million) to the Group. At 31st December 20062007 the balance payable by GlaxoSmithKline to Quest Diagnostics was £4£5 million (2005(2006 – £5£4 million). In 2006,2007, both the Group and Shionogi & Co. Ltd. entered into transactions with their 50/50 US joint venture company in support of the research and development activities conducted by that joint venture company. During 2006,2007, GlaxoSmithKline provided services to the joint venture of £2 million (2005(2006 – £1£2 million). At 31st December 20062007 the balance due to GlaxoSmithKline from the joint venture was £3£2 million (2005(2006 – £1£3 million). Dr Shapiro, a former Non-Executive Director of GlaxoSmithKline plc, received fees of $85,000 (2005(2006 – $85,000) of which $30,000 (2005 –$30,000)(2006 – $30,000) was in the form of ADSs, from a subsidiary of the company, for her membership of the Group’s Scientific Advisory Board. These fees are included within ‘Annual remuneration’ in the Remuneration Report on pages 6571 to 82.86. The aggregate compensation of the Directors, CET and Company Secretary is given in Note 8,10, ‘Employee Costs’. 36 Reconciliation of profit after tax to operating cash flows | | 2007 | | 2006 | | 2005 | | | | £m | | £m | | £m | |
|
|
|
|
|
| | | Profit after tax | 5,310 | | 5,498 | | 4,816 | | | Tax on profits | 2,142 | | 2,301 | | 1,916 | | | Share of after tax profits of associates and joint ventures | (50 | ) | (56 | ) | (52 | ) | | Finance income/costs | 191 | | 65 | | 194 | | | Depreciation | 796 | | 732 | | 710 | | | Impairment and assets written off | 206 | | 208 | | 193 | | | Amortisation of intangible assets | 226 | | 226 | | 194 | | | Profit on sale of property, plant and equipment | – | | – | | (19 | ) | | Profit on sale of intangible assets | (5 | ) | (158 | ) | (203 | ) | | Profit on sale of equity investments | (32 | ) | (18 | ) | (15 | ) | | Changes in working capital: | | | | | | | | (Increase)/decrease in inventories | (457 | ) | (298 | ) | 47 | | | Increase in trade and other receivables | (79 | ) | (529 | ) | (397 | ) | | (Decrease)/increase in trade and other payables | (187 | ) | 354 | | 491 | | | Decrease in pension and other provisions | (123 | ) | (270 | ) | (453 | ) | | Share-based incentive plans | 237 | | 226 | | 236 | | | Other | (95 | ) | (78 | ) | 7 | |
|
|
|
|
|
| | | Cash generated from operations | 8,080 | | 8,203 | | 7,665 | |
|
|
|
|
|
| |
37 Reconciliation of net cash flow to movement in net debt | | 2007 | | 2006 | | 2005 | | | | £m | | £m | | £m | |
|
|
|
|
|
| | | Net debt at beginning of year | (2,450 | ) | (1,237 | ) | (1,984 | ) | | Implementation of accounting for financial instruments under IAS 39 | – | | – | | 13 | | | Increase/(decrease) in cash and bank overdrafts | 1,411 | | (1,956 | ) | 1,384 | | | Cash outflow/(inflow) from liquid investments | 39 | | 55 | | (550 | ) | | Net increase in long-term loans | (3,276 | ) | – | | (912 | ) | | Net (increase in)/repayment of short-term loans | (1,632 | ) | 739 | | 857 | | | Net repayment of obligations under finance leases | 39 | | 34 | | 36 | | | Net non-cash funds of subsidiary undertakings acquired | – | | – | | (68 | ) | | Exchange adjustments | (88 | ) | (9 | ) | 39 | | | Other non-cash movements | (82 | ) | (76 | ) | (52 | ) |
|
|
|
|
|
| | | Movement in net debt | (3,589 | ) | (1,213 | ) | 747 | |
|
|
|
|
|
| | | Net debt at end of year | (6,039 | ) | (2,450 | ) | (1,237 | ) |
|
|
|
|
|
| | | | | | | | | |
| 130 |
| GSK Annual Report 20062007 | 120 | |
Back to Contents | | | Notes to the financial statements | continued |
| |
34 Reconciliation of profit after tax to operating cash flows
Reconciliation of profit after tax to operating cash flows
| | | | 2006 | | 2005 | | 2004 | | | | Notes | | £m | | £m | | £m | |
|
|
|
|
|
|
|
| | | Profit after tax | 5 | | 5,498 | | 4,816 | | 4,022 | | | Tax on profits | | | 2,301 | | 1,916 | | 1,757 | | | Share of after tax profits of associates and joint ventures | | | (56 | ) | (52 | ) | (60 | ) | | Profit on disposal of interest in associates | | | – | | – | | (149 | ) | | Finance income/costs | | | 65 | | 194 | | 186 | | | Depreciation | | | 732 | | 710 | | 691 | | | Impairment and assets written off | | | 208 | | 193 | | 94 | | | Amortisation of intangible assets | | | 226 | | 194 | | 168 | | | (Profit)/loss on sale of property, plant and equipment | | | – | | (19 | ) | 2 | | | (Profit)/loss on sale of intangible assets | | | (158 | ) | (203 | ) | 1 | | | Profit on sale of equity investments | | | (18 | ) | (15 | ) | (33 | ) | | Fair value loss on inventory sold | | | – | | – | | 13 | | | Changes in working capital: | | | | | | | | | | (Increase)/decrease in inventories | | | (298 | ) | 47 | | (33 | ) | | Increase in trade and other receivables | | | (529 | ) | (397 | ) | (235 | ) | | Increase in trade and other payables | | | 354 | | 491 | | 163 | | | Decrease in pension and other provisions | | | (270 | ) | (453 | ) | (351 | ) | | Share-based incentive plans | | | 226 | | 236 | | 333 | | | Other | | | (78 | ) | 7 | | (42 | ) |
|
|
|
|
|
|
|
| | | Cash generated from operations | | | 8,203 | | 7,665 | | 6,527 | |
|
|
|
|
|
|
|
| |
35 Reconciliation of net cash flow to movement in net debt
Reconciliation of net cash flow to movement in net debt
|
|
|
|
|
| | | Net debt at beginning of year | (1,237 | ) | (1,984 | ) | (1,648 | ) | | Implementation of accounting for financial instruments under IAS 39 | – | | 13 | | – | | | (Decrease)/increase in cash and bank overdrafts | (1,956 | ) | 1,384 | | 617 | | | Cash outflow/(inflow) from liquid investments | 55 | | (550 | ) | 53 | | | Net increase in long-term loans | – | | (912 | ) | (1,350 | ) | | Net repayment of short-term loans | 739 | | 857 | | 407 | | | Net repayment of obligations under finance leases | 34 | | 36 | | 22 | | | Net non-cash funds of subsidiary undertakings acquired | – | | (68 | ) | – | | | Exchange adjustments | (9 | ) | 39 | | 24 | | | Other non-cash movements | (76 | ) | (52 | ) | (109 | ) |
|
|
|
|
|
| | | Movement in net debt | (1,213 | ) | 747 | | (336 | ) |
|
|
|
|
|
| | | Net debt at end of year | (2,450 | ) | (1,237 | ) | (1,984 | ) |
|
|
|
|
|
| |
| | | |
| GSK Annual Report 2006 | 121 |
Back to Contents
| | Notes to the financial statements | | continued |
|
3537 Reconciliation of net cash flow to movement in net debtcontinued
Analysis of changes in net debt
| | At 31.12.05 | | Exchange | | Other | | Acquisitions | | Cash flow | | At 31.12.06 | | At 31.12.06 | | Exchange | | Other | | Acquisitions | | Cash flow | | At 31.12.07 | | | | £m | | £m | | £m | | £m | | £m | | £m | | | | Analysis of changes in net debt | | £m | | £m | | £m | | £m | | £m | | £m | |
|
| |
| | | Liquid investments | 1,025 | | (45 | ) | – | | – | | 55 | | 1,035 | | 1,035 | | 79 | | – | | – | | 39 | | 1,153 | |
|
| |
| | | Cash and cash equivalents | 4,209 | | (281 | ) | – | | 25 | | (1,948 | ) | 2,005 | | 2,005 | | 56 | | – | | 60 | | 1,258 | | 3,379 | | | Overdrafts | (237 | ) | 27 | | – | | – | | (33 | ) | (243 | ) | (243 | ) | (8 | ) | – | | – | | 93 | | (158 | ) |
|
| |
| | | | 3,972 | | (254 | ) | – | | 25 | | (1,981 | ) | 1,762 | | 1,762 | | 48 | | – | | 60 | | 1,351 | | 3,221 | |
|
| |
| | | Debt due within one year: | | | | | | | | Commercial paper | (576 | ) | – | | – | | – | | 576 | | – | | – | | – | | – | | – | | (2,064 | ) | (2,064 | ) | | Eurobonds and Medium-Term Notes | (291 | ) | 10 | | (255 | ) | – | | 281 | | (255 | ) | (255 | ) | 3 | | (1,233 | ) | – | | 252 | | (1,233 | ) | | Other | (96 | ) | (1 | ) | (11 | ) | – | | (112 | ) | (220 | ) | (220 | ) | (12 | ) | (1 | ) | – | | 184 | | (49 | ) |
|
| |
| | | | (963 | ) | 9 | | (266 | ) | – | | 745 | | (475 | ) | (475 | ) | (9 | ) | (1,234 | ) | – | | (1,628 | ) | (3,346 | ) |
|
| |
| | | Debt due after one year: | | | | | | | | Eurobonds, Medium-Term Notes and private financing | (5,160 | ) | 271 | | 230 | | – | | – | | (4,659 | ) | (4,659 | ) | (204 | ) | 1,173 | | – | | (3,282 | ) | (6,972 | ) | | Other | (111 | ) | 10 | | (40 | ) | – | | 28 | | (113 | ) | (113 | ) | (2 | ) | (21 | ) | – | | 41 | | (95 | ) |
|
| |
| | | | (5,271 | ) | 281 | | 190 | | – | | 28 | | (4,772 | ) | (4,772 | ) | (206 | ) | 1,152 | | – | | (3,241 | ) | (7,067 | ) |
|
| |
| | | Net debt | (1,237 | ) | (9 | ) | (76 | ) | 25 | | (1,153 | ) | (2,450 | ) | (2,450 | ) | (88 | ) | (82 | ) | 60 | | (3,479 | ) | (6,039 | ) |
|
| |
| |
For further information on significant changes in net debt see Note 3032 ‘Net debt’. 3638 Acquisitions and disposals
Details of the acquisition and disposal of subsidiary and associated undertakings, joint ventures and other businesses are given below: 2007
Acquisitions
Reliant Pharmaceuticals Inc.
On 18th December 2007, the Group acquired 100% of the issued share capital of Reliant Pharmaceuticals Inc., a pharmaceutical company based in the USA for a cash consideration of £814 million. The company specialises in the development and marketing of speciality medicines to combat heart disease which includes the US rights toLovaza, a treatment for adult patients with very high levels of triglycerides. This transaction has been accounted for by the purchase method of accounting. The goodwill arising on the acquisition reflects the potential for product growth throughout the USA and Puerto Rico and the expected synergies for the Group. Reliant Pharmaceuticals Inc. had a turnover of £276 million and a profit after tax of £8 million for the year, of which £8 million of turnover and £1 million of profit after tax related to the period since acquisition and are included in the Group accounts. The fair values set out below are based on provisional valuations and may be subject to change in the future. | | Book | | Fair value | | Fair | | | | value | | adjustment | | value | | | | £m | | £m | | £m | |
|
|
|
|
|
| | | Net assets acquired | | | | | | | | Intangible assets | 13 | | 600 | | 613 | | | Property, plant and equipment | 2 | | 4 | | 6 | | | Other assets including cash and cash equivalents | 80 | | 16 | | 96 | | | Deferred tax provision | – | | (175 | ) | (175 | ) | | Other liabilities | (75 | ) | (1 | ) | (76 | ) |
|
|
|
|
|
| | | | 20 | | 444 | | 464 | | | Goodwill | – | | 350 | | 350 | |
|
|
|
|
|
| | | Total consideration | 20 | | 794 | | 814 | |
|
|
|
|
|
| | | | | | | | | |
| GSK Annual Report 2007 | 131 | | |
Back to Contents | | | FINANCIAL STATEMENTS | | Notes to the financial statements | | | | | | | Notes to the financial statements | | continued | |
38 Acquisitions and disposalscontinued Domantis Limited
On 5th January 2007, the Group acquired 100% of the issued share capital of Domantis Limited, a drug discovery company based in the UK for a cash consideration of £234 million. The company is developing the next generation of antibody therapies. This transaction has been accounted for by the purchase method of accounting. The goodwill arising on the acquisition reflects the potential for combining the world-leading technology of Domantis with the development programme already in place within GSK to put the Group at the forefront of biotechnology. Domantis Limited had a turnover of £nil and a loss after tax of £10 million for the year, of which £nil of turnover and £9 million of loss after tax related to the period since acquisition and are included in the Group accounts. | | | Book | | Fair value | | Fair | | | | | value | | adjustment | | value | | | | | £m | | £m | | £m | |
|
|
|
|
|
|
| | | Net assets acquired | | | | | | | | | Intangible assets | – | | 51 | | 51 | | | | Property, plant and equipment | 1 | | – | | 1 | | | | Other assets including cash and cash equivalents | 19 | | – | | 19 | | | | Deferred tax provision | – | | (14 | ) | (14 | ) | | | Other liabilities | (4 | ) | – | | (4 | ) |
|
|
|
|
|
|
| | | | | 16 | | 37 | | 53 | | | Goodwill | – | | 181 | | 181 | |
|
|
|
|
|
|
| | | Total consideration | 16 | | 218 | | 234 | |
|
|
|
|
|
|
| |
Praecis Pharmaceuticals Inc.
On 16th February 2007, the Group acquired 100% of the issued share capital of Praecis Pharmaceuticals, Inc., a biopharmaceutical company based in the USA for a cash consideration of £39 million. The company has developed a more efficient method of identifying drug leads targeting human disease using proprietary technology. This transaction has been accounted for by the purchase method of accounting. Praecis Pharmaceuticals Inc. had a turnover of £nil and a loss after tax of £11 million for the year, of which £nil of turnover and £9 million of loss after tax related to the period since acquisition and are included in the Group accounts. | | | Book | | Fair value | | Fair | | | | | value | | adjustment | | value | | | | | £m | | £m | | £m | |
|
|
|
|
|
|
| | | Net assets acquired | | | | | | | | | Intangible assets | – | | 7 | | 7 | | | | Property, plant and equipment | 1 | | – | | 1 | | | | Other assets including cash and cash equivalents | 25 | | – | | 25 | | | | Deferred tax asset | – | | 10 | | 10 | | | | Other liabilities | (6 | ) | – | | (6 | ) |
|
|
|
|
|
|
| | | | | 20 | | 17 | | 37 | | | Goodwill | – | | 2 | | 2 | |
|
|
|
|
|
|
| | | Total consideration | 20 | | 19 | | 39 | |
|
|
|
|
|
|
| |
| | Reliant | | Domantis | | Praecis | | Other | | Total | | | Cash flows | £m | | £m | | £m | | £m | | £m | |
|
|
|
|
|
|
|
|
|
| | | Cash consideration | 814 | | 234 | | 39 | | 1 | | 1,088 | | | Cash and cash equivalents acquired | (20 | ) | (16 | ) | (24 | ) | – | | (60 | ) |
|
|
|
|
|
|
|
|
|
| | | Net cash payment on acquisitions | 794 | | 218 | | 15 | | 1 | | 1,028 | |
|
|
|
|
|
|
|
|
|
| |
If Reliant, Domantis and Praecis had been acquired at the beginning of the year, combined Group turnover for the year would have been £22,984 million and combined Group profit for the year would have been £5,314 million. | 132 | GSK Annual Report 2007 | | |
Back to Contents | | | FINANCIAL STATEMENTS | | | Notes to the financial statements | | | | | | | | Notes to the financial statements | | continued | |
38 Acquisitions and disposalscontinued 2006
Acquisitions
CNS, Inc.
On 19th December 2006, the Group acquired 100% of the issued share capital of CNS, Inc., a consumer healthcare company based in the USA for a cash consideration of £280 million. The company marketsBreathe Rightnasal dilator strips andFiberChoicedietary fibre supplements. These are the key intangible assets acquired and have been valued using a discounted cash flow calculation. This transaction has been accounted for by the purchase method of accounting. The goodwill arising on the acquisition reflects the potential for expansion of the brands into other overseas markets and the expected synergies for the Group. CNS, Inc. had a turnover of £71 million (2005 – £60 million) and a profit of £11 million (2005 – profit £9 million) for the year2006 of which £2 million of turnover and £nil of profit related to the period since acquisition and are included in the Group accounts. | | | Book | | Fair value | | Fair | | | | | value | | adjustment | | value | | | | | £m | | £m | | £m | |
|
|
|
|
|
|
| | | Net assets acquired | | | | | | | | | Intangible assets | 4 | | 203 | | 207 | | | | Property, plant and equipment | 1 | | – | | 1 | | | | Other assets including cash and cash equivalents | 44 | | – | | 44 | | | | Deferred tax provision | – | | (77 | ) | (77 | ) | | | Other liabilities | (7 | ) | – | | (7 | ) |
|
|
|
|
|
|
| | | | | 42 | | 126 | | 168 | | | Goodwill | – | | 112 | | 112 | |
|
|
|
|
|
|
| | | Total consideration | 42 | | 238 | | 280 | |
|
|
|
|
|
|
| |
|
| GSK Annual Report 2006 | 122 |
<Back to Contents
| Notes to the financial statements | continued |
|
36 Acquisitions and disposalscontinued
Euclid SR Partners, LP
During 2006, an additional £5 million was invested in Euclid SR Partners, LP, an associate in which the Group has a 38.7% share. Shionogi-GlaxoSmithKline Holdings Ltd
During 2006, an additional £8 million was invested in Shionogi GlaxoSmithKline Holdings Ltd, a joint venture in which the Group has a 50% share. Pliva Research Institute Ltd.
In May 2006, the Group purchased the entire share capital of the Pliva Research Institute Ltd. for a cash consideration of £26 million, of this amount £8 million is deferred, with payment being made when Phasephase I clinical trials are initiated. GlaxoSmithKline K.K.
In August 2006, a Japanese subsidiary of the Group made a cash payment of £150 million to complete the purchase of the remaining 15% of the share capital held by the minority shareholder. This payment was preceded in the year by a dividend to the minority shareholders of £7 million representing additional consideration. | | | | Shionogi | | Pliva | | | | | Shionogi | | Pliva | | | | | Euclid SR | | GlaxoSmithKline | | Research | | GlaxoSmith- | | | | Euclid SR | | GlaxoSmithKline | | Research | | GlaxoSmith- | | | | | CNS Inc. | | Partners, LP | | Holdings Ltd. | | Institute | | Kline K.K. | | Other | | Total | | CNS | | Partners, LP | | Holdings, Ltd | | Institute | | Kline K.K. | | Other | | Total | | | Cash flows | £m | | £m | | £m | | £m | | £m | | £m | | £m | | £m | | £m | | £m | | £m | | £m | | £m | | £m | |
|
| |
| | | Cash consideration | 280 | | 5 | | 8 | | 18 | | 157 | | – | | 468 | | 280 | | 5 | | 8 | | 18 | | 157 | | – | | 468 | | | Cash and cash equivalents acquired | (24 | ) | – | | – | | (1 | ) | – | | – | | (25 | ) | (24 | ) | – | | – | | (1 | ) | – | | – | | (25 | ) |
|
| |
| | | Net cash payment on acquisitions | 256 | | 5 | | 8 | | 17 | | 157 | | – | | 443 | | 256 | | 5 | | 8 | | 17 | | 157 | | – | | 443 | |
|
| |
| | | Net cash proceeds from disposals | – | | – | | – | | – | | – | | (5 | ) | (5 | ) | – | | – | | – | | – | | – | | (5 | ) | (5 | ) |
|
| |
| | | | | |
| GSK Annual Report 2007 | 133 | | |
Back to Contents | | | FINANCIAL STATEMENTS | | Notes to the financial statements | | | | | | | Notes to the financial statements | | continued | |
38 Acquisitions and disposalscontinued 2005
Acquisitions
ID Biomedical Corporation
On 8th December 2005, the Group acquired 100% of the issued share capital of ID Biomedical Corporation, a biotechnology company based in Canada specialising in the development and manufacture of vaccines, particularly influenza vaccines, for a cash consideration of £874 million. This transaction has been accounted for by the purchase method of accounting. The goodwill arising on the acquisition results from benefits which cannot be separately quantified and recorded, including immediate access to additional ‘flu vaccines manufacturing capacity, particularly in the event of a pandemic, a skilled workforce and good relations with the US and Canadian governments regarding the supply of ‘flu vaccines. ID Biomedical Corporation had a turnover of £30 million (2004 – £23 million) and a loss of £83 million (2004 – loss £17 million) for the year, of which £1 million of turnover and £11 million of loss related to the period since acquisition and are included in the Group accounts. | | | Book | | Fair value | | Fair | | | | | value | | adjustment | | value | | | | | £m | | £m | | £m | |
|
|
|
|
|
|
| | | Net assets acquired | | | | | | | | | Intangible assets | 15 | | 686 | | 701 | | | | Property, plant and equipment | 88 | | – | | 88 | | | | Other assets | 74 | | 23 | | 97 | | | | Deferred tax provision | – | | (225 | ) | (225 | ) | | | Other liabilities | (136 | ) | (8 | ) | (144 | ) |
|
|
|
|
|
|
| | | | | 41 | | 476 | | 517 | | | Goodwill | – | | 357 | | 357 | |
|
|
|
|
|
|
| | | Total consideration | 41 | | 833 | | 874 | |
|
|
|
|
|
|
| |
The total consideration included directly attributable costs of £3 million. |
| GSK Annual Report 2006 | 123 |
<Back to Contents
| Notes to the financial statements | continued |
|
36 Acquisitions and disposalscontinued
Corixa Corporation
On 12th July 2005, the Group acquired 92% of the issued share capital of Corixa Corporation, a biotechnology company specialising in developing vaccine adjuvants and immunology based products, for a cash consideration of £150 million. This investment increased the Group’s holding in Corixa to 100%. The Group had a number of business relationships with Corixa prior to the acquisition date, principally in relation to an adjuvant developed by Corixa and used in some of the Group’s vaccines. This transaction has been accounted for by the purchase method of accounting. The existing 8% investment in Corixa, with a book value of £12 million, was previously classified as an available-for-sale investment and now forms part of the investment in the subsidiary. The existing 8% of the issued share capital had been acquired, in previous years, for a cash consideration of £24 million. Corixa Corporation had a turnover of £3 million and a loss of £49 million for the year, of which £1 million of turnover and £24 million of loss related to the period since acquisition and are included in the Group accounts. | | | Book | | Fair value | | Fair | | | | | value | | adjustment | | value | | | | | £m | | £m | | £m | |
|
|
|
|
|
|
| | | Net assets acquired | | | | | | | | | Intangible assets | – | | 115 | | 115 | | | | Other assets | 91 | | 29 | | 120 | | | | Other liabilities | (95 | ) | (4 | ) | (99 | ) |
|
|
|
|
|
|
| | | | | (4 | ) | 140 | | 136 | | | Goodwill | – | | 26 | | 26 | | | Existing investment | (12 | ) | – | | (12 | ) |
|
|
|
|
|
|
| | | Total consideration | (16 | ) | 166 | | 150 | |
|
|
|
|
|
|
| |
The total consideration included directly attributable costs of £1 million. | 134 | GSK Annual Report 2007 | | |
Back to Contents | | | FINANCIAL STATEMENTS | | | Notes to the financial statements | | | | | | | | Notes to the financial statements | | continued | |
38 Acquisitions and disposalscontinued Euclid SR Partners, LP
During 2005, an additional £2 million was invested in Euclid SR Partners, LP, an associate in which the Group has a 38.7% interest. GlaxoSmithKline Consumer Healthcare Limited
In April 2005, an Indian subsidiary of the Group purchased 3.16% of the share capital held by minority shareholders, for a cash consideration of £16 million. GlaxoSmithKline Pharmaceuticals Limited
In May and June 2005, an Indian subsidiary of the Group purchased 1.52% of the share capital held by minority shareholders, for a cash consideration of £26 million. GlaxoSmithKline Biologicals (Shanghai) Limited
During 2005, a Chinese subsidiary of the Group purchased all of the share capital held by minority shareholders for a cash consideration of £4 million. Disposals
Ideapharm SA
In December 2005, the Group disposed of Ideapharm SA, a subsidiary located in Romania, for cash proceeds of £3 million, which were received in January 2006. The net assets disposed of in the year included cash of £2 million. Aseptic Technologies S.A.
In April 2005, the Group disposed of 16.22% of Aseptic Technologies S.A. to Societe Regionale d’Investissement de Wallonie S.A. for cash proceeds of £10 million. | | GSK | | | | GSK | | GSK | | | | | | | | | | | | | | Biologicals | | Aseptic | | Pharma- | | Consumer | | | | Euclid | | | | ID | | | GSK | | GSK | | | | (Shanghai) | | Tech. | | ceuticals | | Healthcare | | Ideapharm | | SR | | Corixa | | Biomedical | | | Biologicals | Aseptic | Pharma- | Consumer | | Euclid | | ID | | | Cash flows | £m | | £m | | £m | | £m | | £m | | £m | | £m | | £m | | Total | | (Shanghai) | Tech. | ceuticals | Healthcare | Ideapharm | SR | Corixa | | Biomedical | | | | | £m | | £m | Total | |
|
| |
| | | Cash consideration | 4 | | – | | 26 | | 16 | | – | | 2 | | 150 | | 874 | | 1,072 | | 4 | – | 26 | 16 | – | 2 | 150 | | 874 | 1,072 | | | Cash and cash equivalents acquired | – | | – | | – | | – | | – | | – | | (7 | ) | 9 | | 2 | | – | (7 | ) | 9 | 2 | |
|
| |
| | | Net cash payment on acquisitions | 4 | | – | | 26 | | 16 | | – | | 2 | | 143 | | 883 | | 1,074 | | 4 | – | 26 | 16 | – | 2 | 143 | | 883 | 1,074 | |
|
| |
| | | Cash and cash equivalents disposed | – | | – | | – | | – | | 2 | | – | | – | | – | | 2 | | – | 2 | – | | – | 2 | |
|
| |
| | | Net cash proceeds from disposals | – | | 10 | | – | | – | | – | | – | | – | | – | | 10 | | – | 10 | – | | – | 10 | |
|
| |
| | | | | |
|
| GSK Annual Report 20062007 | 135 | 124 |
<Back to Contents
| Notes to the financial statements | continued |
|
36 Acquisitions and disposalscontinued
2004
Acquisitions
Fraxiparine, Fraxodi and Arixtra
In September 2004, the Group acquiredFraxiparine, FraxodiandArixtra andrelated assets including a manufacturing facility for a cash consideration of £297 million.
| | Book | | Fair value | | Net assets | | | | value | | adjustment | | acquired | | | | £m | | £m | | £m | |
|
|
|
|
|
| | | Intangible assets | – | | 262 | | 262 | | | Tangible fixed assets | 56 | | (24 | ) | 32 | | | Inventory | 79 | | – | | 79 | | | Provisions for onerous contracts | – | | (76 | ) | (76 | ) |
|
|
|
|
|
| | | | 135 | | 162 | | 297 | |
|
|
|
|
|
| |
Euclid SR Partners, LP
During 2004 an additional £2 million was invested in Euclid SR Partners, LP, an associate company in which the Group has a 38.7% interest.
Disposals
Quest Diagnostics Inc.
During 2004, the Group disposed of 3.8 million shares from its investment in Quest Diagnostics Inc. for cash proceeds of £188 million, reducing the Group’s shareholding at 31st December 2004 to 18.6% . A profit of £150 million was recognised.
GlaxoSmithKline Vehicle Finance Ltd
During 2004, the Group disposed of its employee vehicle financing subsidiary resulting in a loss of £3 million.
GlaxoSmithKline Pharmaceuticals (Chongqing) Ltd
During 2004, the Group disposed of GlaxoSmithKline Pharmaceuticals (Chongqing) Ltd, a Group subsidiary located in China, for £7 million. A profit on disposal of £2 million was realised.
Beeyar Investments (Pty) Ltd
In July 2004, the Group disposed of Beeyar Investments (Pty) Ltd, a subsidiary located in South Africa, for cash proceeds of £1 million, realising a profit of £1 million.
OptiLead S.r.l.
During the year, part of the Group’s holding in an associated undertaking, OptiLead S.r.l. was sold, resulting in a loss of £1 million.
| | Fraxiparine | | | | | | GSK | | GSK | | | | | | | | Fraxodi | | | | Quest | | Vehicle | | Pharmaceuticals | | Beeyar | | | | | | andArixtra | | Euclid SR | | Diagnostics | | Finance | | (Chongqing) | | Investments | | Total | | | Cash flows | £m | | £m | | £m | | £m | | £m | | £m | | £m | |
|
|
|
|
|
|
|
|
|
|
|
|
|
| | | Cash consideration paid | 297 | | 2 | | – | | – | | – | | – | | 299 | |
|
|
|
|
|
|
|
|
|
|
|
|
|
| | | Net cash proceeds from disposals | – | | – | | 188 | | 34 | | 7 | | 1 | | 230 | |
|
|
|
|
|
|
|
|
|
|
|
|
|
| |
|
| GSK Annual Report 2006 | 125 |
Back to Contents | | FINANCIAL STATEMENTS | | Notes to the financial statements | | | | | | | Notes to the financial statements | | continued |
|
3739 Commitments
| Contractual obligations and commitments | 2006 | | 2005 | | | | 2007 | 2006 | | | Contractual obligations and commitments | £m | | £m | | £m | £m | |
|
| | | Contracted for but not provided in the financial statements: | | | | | | | | Intangible assets | 3,219 | | 1,833 | | 5,730 | 3,219 | | | Plant, property and equipment | 521 | | 376 | | 597 | 521 | | | Investments | 196 | | 13 | | 65 | 196 | | | Purchase commitments | 299 | | 376 | | 159 | 299 | | | Business combinations | 258 | | – | | – | 258 | | | Pensions | 975 | | 2,200 | | 650 | 975 | | | Theravance put option agreement | 258 | | 258 | | – | 258 | | | Other commitments | 65 | | 64 | | 32 | 65 | | | Interest on loans | 2,875 | | 3,067 | | 5,170 | 2,875 | | | Finance lease charges | | 14 | 21 | |
|
| |
| | | | 8,666 | | 8,187 | | 12,417 | 8,687 | |
|
| |
| |
The commitments related to intangible assets include milestone payments, which are dependent on successful clinical development and which represent the maximum that would be paid if all milestones are achieved. A number of commitments were made in 20062007 under licensing and other agreements, including ChemoCentryxarrangements with Anacor Pharmaceuticals, Inc., EPIXOncomed Pharmaceuticals, Inc., Santaris Pharma A/S and Genmab A/S. At 31st December 2006, the Genmab agreement was subject to review by the US Government under the Hart-Scott-Rodino Act. Approval was received on 6th February 2007. On 8th December 2006, GSK entered into an agreement to acquire Domantis Limited for £230 million in cash. At 31st December 2006, the acquisition agreement was subject to clearance under the Hart-Scott-Rodino Act. Approval was received on 5th January 2007. On 21st December 2006, GSK entered into an agreement to acquire all the outstanding shares of Praecis PharmaceuticalsTargacept, Inc. for approximately $54.8 million (£28 million) by means of a cash tender offer in early 2007.
In 2006, GSK formalised an agreement with the trustees of the UK pension schemes to make additional contributions of up to £325 million per year, in addition to the normal contributions, over a four-year period ending 31st December 2009 in order to eliminate the then pension deficits on an IAS 19 basis by that point. The table above shows this commitment, but excludes the normal ongoing annual funding requirement of approximately £200 million. GSK has also committed to eliminate any future deficits that may arise over a rolling five-year period. No other commitments have been made past 31st December 2009. TheAt 31st December 2006, the Group has entered intowas party to a put option agreement whereby Theravance’s shareholders cancould sell up to half of their Theravance shares to GSK at a pre-determined price ($19.375) . Given the maximum number of shares subject to the put option, the Group’s obligation iswas capped at $525 million. The expiry date isput option expired unexercised in August 2007.
The Group also has other commitments which principally relate to revenue payments to be made under licences and other alliances. Commitments in respect of future interest payable on loans are disclosed after taking into account the effect of interest rate swaps. | Commitments under operating leases | 2006 | | 2005 | | | | 2007 | 2006 | | | Commitments under operating leases | £m | | £m | | £m | £m | |
|
| | | Rental payments due within one year | 94 | | 111 | | 101 | 94 | | | Rental payments due between one and two years | 74 | | 78 | | 76 | 74 | | | Rental payments due between two and three years | 55 | | 60 | | 58 | 55 | | | Rental payments due between three and four years | 41 | | 45 | | 41 | 41 | | | Rental payments due between four and five years | 33 | | 40 | | 33 | 33 | | | Rental payments due after five years | 77 | | 103 | | 51 | 77 | |
|
| |
| | | Total commitments under operating lease | 374 | | 437 | | | | Total commitments under operating leases | | 360 | 374 | |
|
| |
| |
3840 Post balance sheet events
On 5th25th January 2007, GSK completed the acquisition of Domantis Limited for £230 million in cash. On 7th February 2007,2008, the FDA approved orlistatissued a not approvable letter in respect of Merck’s NDA seeking approval for over-the-counter Mevacor. This triggered repayment to GSK of the upfront fee GSK had paid to Merck in 2007 for the US OTC use in the USArights.
On 18th February 2008, GSK’s long-term Standard and Poor’s debt rating was revised from AA with negative outlook to A+ stable. Standard and Poor’s also revised GSK’s short-term rating for paper issued under the brand namealli. On 15th February 2007, GSK entered into a second hedging contract over an additional 10 million shares in Quest Diagnostics Inc. through another series of variable sale forward contracts maturing between 2013 and 2015.
On 16th February 2007, GSK completed the cash tender offer for Praecis Pharmaceuticals Inc.
On 20th February 2007, GSK and the Roche Group settled their arbitration proceedings relatingGroup’s commercial paper programme from A-1+ to the licensing and co-marketing of carvedilol and GSK acquired from Roche the OTC marketing rights to orlistat outside the USA.A-1.
| 136 |
| GSK Annual Report 20062007 | 126 | |
Back to Contents | | | Notes to the financial statements | | | | | | | | Notes to the financial statements | | continued |
| | |
3941 Financial instruments and related disclosures
Financial risk management
GlaxoSmithKline plc reports in Sterling and pays dividends out of Sterlingsterling profits. The role of Corporate Treasury in GSK is to manage and monitor the Group’s external and internal funding requirements and financial risks in support of Group corporate objectives. Treasury activities are governed by policies and procedures approved by the Board and monitoredof Directors, most recently on 5th October 2007.
A Treasury Management Group (TMG) chaired by the Group’s Chief Financial Officer, meets on a monthly basis to review treasury activities. Its members receive management group. GSK maintainsinformation relating to treasury activity. The Corporate Executive Team (CET) also review a monthly finance report which focuses on operational finance issues. The Group’s internal auditors review the Treasury internal control systems and procedures to monitor foreign exchange, interest rate, liquidity, credit and other financial risks.environment regularly.
GSK uses a variety of financial instruments, including derivatives, to finance its operationoperations and to manage market risks from thesethose operations. Financial instruments include cash and liquid resources, borrowings and spot foreign exchange contracts. A number of derivative financial instruments are used to manage the market risks from Treasury operations. Derivative instruments,Derivatives, principally comprising forward foreign currency contracts, and interest rate and currency swaps, are used to swap borrowings and liquid assets into the currencies required for Group purposes and to manage exposure to funding risks from changes in foreign exchange rates and interest rates.
GSK balances the use of borrowings and liquid assets having regard to the cash flow from operating activities and the currencies in which it is earned; the tax cost of intra-Group distributions; the currencies in which business assets are denominated; and the post-tax cost of borrowings compared to the post-tax return on liquid assets. Liquid assets surplus to the immediate operating requirements of Group companies are generally invested and managed centrally by Corporate Treasury. Requirements of Group companies for operating finance are met whenever possible from central resources.
External borrowings, mainly managed centrally by Corporate Treasury, comprise a portfolio of long and medium-term instruments and short-term finance.
GSK does not hold or issue derivative financial instruments for tradingspeculative purposes and the Group’s Treasury policies specifically prohibit such activity. All transactions in financialfi nancial instruments are undertaken to manage the risks arising from underlying business activities, not for speculation.
Foreign exchange riskCapital management
The capital structure of the Group consists of net debt (see Note 32, ‘Net debt’) and shareholders’ equity (see Note 34, ‘Movements in equity’). The Group manages its capital to ensure that entities in the Group are able to operate as going concerns and to optimise return to shareholders through an appropriate balance of debt and equity. In July 2007, GSK foreign currency transaction exposure arisingannounced an increased share buy-back programme of £12 billion over the period to July 2009 which will result in substantially increased borrowings. The Board reviews the Group’s dividend policy and funding requirements annually.
GSK operates globally, primarily through subsidiary companies established in the markets in which the Group trades. With significant levels of patent and trademark protection the Group’s products compete largely on product efficacy rather than on price. Selling margins are sufficient to cover normal trade flows,operating costs and the Group’s operating subsidiaries are generally cash generative. None of the entities in respectthe Group is subject to externally imposed capital requirements. Operating cash flow is used to fund investment in research and development of both externalnew products as well as to make the routine outflows of capital expenditure, tax, dividends and intra-Group trade, is not hedged. GSK’srepayment of maturing debt. The Group’s policy is to minimiseborrow centrally, using a variety of capital market issues and borrowing facilities, to meet anticipated funding requirements. These borrowings, together with cash generated from operations, are on-lent within the exposureGroup, contributed as equity to certain subsidiaries or used to fund the Group’s £12 billion share buy-back programme. Liquidity risk
The Group manages its net borrowing requirements through a portfolio of overseas operating subsidiaries to transaction risk by matching local currency incomelong-term borrowings, including bonds, together with local currency costs. For this purpose, intra-Group trading transactions are matched centrally and intra-Group payment terms are managed to reduce risk. Exceptional foreign currency cash flows are hedged selectivelyshort-term finance under the management of Corporate Treasury.US$10 billion commercial paper programme. At 31st December 2007, the Group also had $5 billion committed undrawn bank facilities. The Group seeks to denominate borrowingshas a European Medium Term Note programme of £10 billion, of which £7.2 billion was in the currencies of its principal assets and cash flows. These are primarily denominated in US Dollars, Euros and Sterling. Certain of these and other borrowings are swapped into other currenciesissue as required for Group purposes. Borrowings denominated in, or swapped into, foreign currencies that match investments in overseas Group assets are treated as a hedge against the relevant net assets.
At 31st December 2006, the Group had outstanding contracts to sell or purchase foreign currency having a total gross notional principal amount of £14,687 million (2005 – £15,974 million). The majority of contracts are for periods of 12 months or less.
Based on the composition of net debt at 31st December 2006,2007 and a 10% appreciationUS Shelf Registration of $5 billion; at 31st December 2007, $2.0 billion (£1.0 billion) was in Sterling against major currencies would result inissue. The TMG monitors the cashflow forecast of GSK on a reduction inmonthly basis.
The Group’s long-term borrowings mature at dates between 2008 and 2042. On 18th February 2008 GSK’s long-term Standard and Poor’s debt rating was revised from AA with negative outlook to A+ stable. At this time, Standard and Poor’s also revised GSK’s short-term rating for paper issued under the Group’s netcommercial paper programme from A-1+ to A-1. Moody’s Investors’ Services rate GSK as A1 with negative outlook for long-term debt and P-1 for short-term debt. There has been no change to GSK’s rating from Moody’s since 25th July 2007. In the light of approximately £210 million. A 10% weakening in Sterling against major currencies would result in an increase inlikely increased commercial paper issuance resulting from the Group’s net debt of approximately £256 million.increased share buy-back programme, GSK has increased its committed bank facilities from $900 million to $5 billion. In addition, the Group maintains substantial cash and liquid investments which at 31st December 2007 amounted to £4.5 billion. Market risk
Interest rate risk management
GSK’s policy on interest rate risk management requires that the minimum amount of net borrowings at fixed rates increasesto increase with the ratio of forecast net interest payable to trading profit. The fixed to floating ratio is reviewed monthly by the TMG. The Group uses a limited number of interest rate swaps to redenominate external borrowings into the interest rate coupon required for Group purposes. The duration of these swaps matches the duration of the principal instruments. Interest rate derivative instruments are accounted for as fair value or cash flow hedges of the relevant assets or liabilities. Foreign exchange risk management
Foreign currency transaction exposure arising on normal trade flows, in respect of both external and intra-Group trade, is not hedged. The exposure of overseas operating subsidiaries to transaction risk is minimised by matching local currency income with local currency costs. For this purpose, intra-Group trading transactions are matched centrally and intra-Group payment terms are managed to reduce risk. Exceptional foreign currency cash flows are hedged selectively under the management of Corporate Treasury. The Group manages centrally the short-term cash surpluses or borrowing requirements of subsidiary companies and uses forward contracts to hedge future repayments back into the originating currency. Sensitivity analysisThe Group seeks to denominate borrowings in the currencies of its principal assets and cash flows. These are primarily denominated in US dollars, Euros and Sterling. Certain borrowings are swapped into other currencies as required for Group purposes.
| GSK Annual Report 2007 | 137 | | |
Back to Contents | | | FINANCIALSTATEMENTS | | Notes to the financial statements | | | | | | | Notes to the financial statements | | continued | |
41 Financial instruments and related disclosures continued Borrowings denominated in, or swapped into, foreign currencies that match investments in overseas Group assets are treated as a hedge against the relevant assets. The ratio of borrowings to assets is reviewed by currency on a month by month basis by the TMG. Credit risk
The Group considers its maximum credit risk to be £8,529 million (2006 – £7,848 million) which is the sensitivitytotal of the Group’s net debtfinancial assets with the exception of ’Other investments’ which do not bear credit risk, and US treasury bills, bonds and notes, classified within cash and cash equivalents and liquid investments. US treasury bills, bonds and notes are held both directly and through US Treasuries–only money market funds and bear credit exposure to hypothetical changes in market rates and assumes that all other variables remain constant. Basedthe US government. See page 139 for details on the compositionGroup’s total financial assets. Treasury-related credit risk
In 2007, credit risk increased following the global sub-prime crisis. GSK has suffered no loss of net debt and financing arrangements at 31st December 2006, and taking into consideration all fixed rate borrowings in place,investment principal as a one percentage point (100 basis points) decrease in average interest rates would result in an increase in the Group’s annual net interest charge of approximately £5 million. Market risk of financial assets
this crisis. The Group invests centrally managed liquid assets in government bonds, short-term corporate debt instruments with a minimum short-term credit rating of A-1/P-1, bank deposits, Treasuries-only money market funds with a credit rating of AAA/Aaa (Standard and Poor’s/Moody’s Investors’ Services) and other structured investments (creditinvestments.
A report on relationship banks and their credit ratings shown are fromis presented annually to the TMG for approval. The aggregate credit risk in respect of financial instruments the Group may have with one counterparty is limited by reference to the long-term credit ratings assigned for that counterparty by Moody’s and Standard and Poor’sPoor’s. Wholesale and Moody’s Investors’ Services, respectively). These investments are classified as available-for-sale. Equity investments are classified as available-for-sale investments and the Group manages disposals to meet overall business requirements as they arise. The Group regularly monitors the value of its equity investments and only enters into hedges selectively with the approval of the Board.
Creditretail credit risk
In the USA, in line with other pharmaceutical companies, the Group sells its products through a small number of wholesalers in addition to hospitals, pharmacies, physicians and other groups. Sales to the three largest wholesalers amountedamount to approximately 80%85% of the Group’s US pharmaceutical sales. At 31st December 2006,2007, the Group had trade receivables due from these three wholesalers totalling £915 million (2006 – £1,044 million (31st December 2005 – £1,051 million).
|
| GSK Annual Report 2006 | 127 |
<Back to Contents
| Notes to the financial statements | continued |
| |
39 Financial instruments and related disclosurescontinued
The Group is exposed to a concentration of credit risk in respect of these wholesalers such that, if one or more of them is affected byencounters financial difficulty, it could materially and adversely affect the Group’s financial results. The Group does not believe it is exposedGroup’s credit risk monitoring activities relating to major concentrationsthese wholesalers includes review of their quarterly financial information and Standard & Poor’s credit ratings, development of GSK internal risk ratings, and establishment and periodic review of credit risk on other classes of financial instruments. The Group is exposed to credit-related losses in the event of non-performance by counterparties to financial instruments, but does not expect any counterparties to fail to meet their obligations. Wherelimits. However, the Group has significant investments with a single counterparty, collateralbelieves there is obtainedno further credit risk provision required in order to reduce risk. The Group applies Board-approved limits to the amount of credit exposure to any one counterparty and employs strict minimum credit worthiness criteria as to the choice of counterparty.
Liquidity
The Group operates globally, primarily through subsidiary companies established in the markets in which the Group trades. Due to the natureexcess of the Group’s business with patent protection on many products innormal provision for bad and doubtful debts (see Note 24, Trade and other receivables’). Outside the Group’s portfolio,USA no customers account for more than 5% of the Group’s products compete largely on product efficacy rather than on price. Selling margins are sufficient to exceed normal operating costs and the Group’s operating subsidiaries are substantially cash generative.trade receivables balance.
Operating cash flow is used to fund investment in the research and development of new products as well as routine outflows of capital expenditure, tax, dividends and repayment of maturing debt. The Group may, from time to time, have additional demands for finance, such as for share purchases and business acquisitions.
GSK operates with a high level of interest cover and at low levels of net debt relative to its market capitalisation. In addition to the strong positive cash flow from normal trading activities, additional liquidity is readily available via its commercial paper programme and short-term investments. The Group also has a European Medium Term Note programme of £10 billion, of which £3.5 billion was in issue at 31st December 2006. In March 2004, the Group established a US Shelf Registration of $5 billion; at 31st December 2006 $2.4 billion (£1.2 billion) was in issue.
Fair value of financial assets and liabilities
The table on page 129139 presents the carrying amounts under IFRS and the fair values of the Group’s financial assets and liabilities at 31st December 20062007 and 31st December 2005.2006. The fair values of the financial assets and liabilities are included at the amount at which the instrument could be exchanged in a current transaction between willing parties, other than in a forced or liquidation sale. The following methods and assumptions were used to estimate the fair values: Equity investments – investments traded in an active market, determined by reference to the relevant stock exchange quoted bid price; other investments determined by reference to the current market value of similar instruments or by reference to the discounted cash flows of the underlying net assets
| • | Cash and cash equivalents – approximates to the carrying amountcarryingamount | | | | | • | Liquid investments – based on quoted market prices in the case ofmarketableofmarketable securities; based on principal amounts in the case ofnon-marketableofnon-marketable securities because of their short repricing periods | | | | | • | Other investments – investments traded in an active marketdetermined by reference to the relevant stock exchange quotedbid price; other investments determined by reference to thecurrent market value of similar instruments or by reference to thediscounted cash flows of the underlying net assets | | | | • | Short-term loans and overdrafts – approximates to the carrying amountcarryingamount because of the short maturity of these instruments | | | | | • | Long-term loans – based on quoted market prices in the case of theofthe Eurobonds and other fixed rate borrowings; approximates to thetothe carrying amount in the case of floating rate bank loans and otherandother loans | | | | | • | Forward exchange contracts – based on market prices and exchange ratesexchangerates at the balance sheet date | | | | | • | Currency swaps – based on market valuationsdata at the balance sheet date | | | | | • | Quest equity collar and Theravance put and call options – based on anbasedon a Black-Scholes option pricing model which uses significant assumptions in respectinrespect of price volatility, dividend yield and interest rates | | | | | • | Interest rate instrumentsswaps – based on the net present value of discounted cashdiscountedcash flows | | | | | • | Receivables and payables – approximates to the carrying amount | | | | | • | Lease obligations – approximates to the carrying amount.amount |
In the year ended 31st December 2006, the total amount of the change in fair values estimated using valuation techniques referred to above resulted in a credit to the income statement of £5 million (2005 – £1 million).
Fair value of investments in GSK shares
At 31st December 20062007, the ESOP Trusts held GSK ordinary shares with a carrying value of £1,999£1,617 million (2005(2006 – £2,313£1, 999 million) with a fair value of £2,062£1,721 million (2005(2006 – £2,460£2,062 million) based on quoted market price. The shares represent purchases by the ESOP Trusts to satisfy future exercises of options and awards under employee incentive schemes. The carrying value, which is the lower of cost or expected proceeds, of these shares has been recognised as a deduction from other reserves. At 31st December 2006,2007, GSK held Treasury shares at a cost of £3,147£6,683 million (2005(2006 – £1,799£3,147 million) which has been deducted from retained earnings. Committed facilities
The Group has committed facilities to back up the commercial paper programme of $900 million$5 billion (£459 million) (20052.5 billion) (2006 – $900 million (£523459 million)) of 364 days duration, renewable annually. At 31st December 2006,2007, undrawn committed facilities totalled $5 billion (£2.5 billion) (2006 – $900 million (£459 million) (2005 – $900 million (£523 million)).
| 138 |
| GSK Annual Report 20062007 | 128 | |
<Back to Contents | FINANCIALSTATEMENTS | | | Notes to the financial statements | | | | | | | | Notes to the financial statements | | continued |
|
3941 Financial instruments and related disclosurescontinued
| | | | | | 2007 | | | | 2006 | | | | | |
| |
| | | | | | Carrying | | Fair | | Carrying | | Fair | | | | | | value | | value | | value | | value | | | | | | £m | | £m | | £m | | £m | |
|
|
|
|
|
|
|
|
|
| | | Cash and cash equivalents | 3,379 | | 3,379 | | 2,005 | | 2,005 | | | Available-for-sale investments: | | | | | | | | | | | Liquid investments: | | | | | | | | | | | – | redeemable shares | 736 | | 736 | | 676 | | 676 | | | | – | government bonds | 205 | | 205 | | 197 | | 197 | | | | – | other | 212 | | 212 | | 162 | | 162 | | | |
|
|
|
|
|
|
|
|
| | | | | Total liquid investments | 1,153 | | 1,153 | | 1,035 | | 1,035 | | | | | Other investments | 517 | | 517 | | 441 | | 441 | | | Loans and receivables: | | | | | | | | | | | | Trade and other receivables and Other non-current assets in scope of IAS 39 | 5,317 | | 5,317 | | 4,776 | | 4,776 | | | Held-for-trading financial assets: | | | | | | | | | | | | Derivatives designated as accounting hedges | 175 | | 175 | | 167 | | 167 | | | | | Other derivatives | 301 | | 301 | | 26 | | 26 | |
|
|
|
|
|
|
|
| | | Total financial assets | 10,842 | | 10,842 | | 8,450 | | 8,450 | |
|
|
|
|
|
|
|
| | | Financial liabilities measured at amortised cost: | | | | | | | | | | | Borrowings: | | | | | | | | | | | – | bonds in a designated hedging relationship | (5,452 | ) | (5,433 | ) | (2,980 | ) | (2,951 | ) | | | – | other bonds | (2,753 | ) | (2,599 | ) | (1,727 | ) | (1,768 | ) | | | – | commercial paper | (2,064 | ) | (2,064 | ) | – | | – | | | | – | bank loans and overdrafts | (171 | ) | (171 | ) | (421 | ) | (421 | ) | | | – | other loans and private financing | (8 | ) | (8 | ) | (223 | ) | (233 | ) | | | – | obligations under finance leases | (123 | ) | (123 | ) | (139 | ) | (139 | ) | | |
|
|
|
|
|
|
|
|
| | | | | Total borrowings | (10,571 | ) | (10,398 | ) | (5,490 | ) | (5,512 | ) | | | | Trade and other payables and Other non-currentliabilities in scope of IAS 39 | (4,450 | ) | (4,450 | ) | (4,609 | ) | (4,609 | ) | | Held-for-trading financial liabilities: | | | | | | | | | | | | Derivatives designated as accounting hedges | (226 | ) | (226 | ) | (51 | ) | (51 | ) | | | | Other derivatives | (44 | ) | (44 | ) | (49 | ) | (49 | ) |
|
|
|
|
|
|
|
| | | Total financial liabilities | (15,291 | ) | (15,118 | ) | (10,199 | ) | (10,221 | ) |
|
|
|
|
|
|
|
| | | Net financial assets and financial liabilities | (4,449 | ) | (4,276 | ) | (1,749 | ) | (1,771 | ) |
|
|
|
|
|
|
|
| | | | | | | | | | | |
| GSK Annual Report 2007 | 139 | | |
Back to Contents | | | FINANCIALSTATEMENTS | | Notes to the financial statements | | | | | | | Notes to the financial statements | | continued | |
41 Financial instruments and related disclosurescontinued ClassificationTrade and fair valuesother receivables and Other non-current assets in scope of financial assets and liabilitiesIAS 39
The following table sets outreconciles Trade and other receivables and Other non-current assets which fall within the classificationscope of IAS 39 to the relevant balance sheet amounts. Other assets include tax receivables, pension surplus balances and prepayments, which are outside the scope of IAS 39. The financial assets are predominantly non-interest earning.
| | 2007 | | 2006 | | | | £m | | £m | |
|
|
|
| | | Trade and other receivables (Note 24) | 5,495 | | 5,237 | | | Other non-current assets (Note 22) | 687 | | 608 | |
|
|
|
| | | | 6,182 | | 5,845 | |
|
|
|
| | | Analysed as: | | | | | | Financial assets in scope of IAS 39 | 5,317 | | 4,776 | | | Other assets | 865 | | 1,069 | |
|
|
|
| | | | 6,182 | | 5,845 | |
|
|
|
| |
The following table shows the age of such financial assets which are past due and liabilities. Receivablesfor which no provision for bad or doubtful debts has been raised: | | 2007 | | 2006 | | | | £m | | £m | |
|
|
|
| | | Past due by 1–30 days | 288 | | 156 | | | Past due by 31–90 days | 101 | | 132 | | | Past due by 91–180 days | 97 | | 103 | | | Past due by 181–365 days | 108 | | 92 | | | Past due by more than 365 days | 214 | | 132 | |
|
|
|
| | | | 808 | | 615 | |
|
|
|
| |
Amounts past due by greater than 90 days total £419 million (2006 – £327 million). Of this balance £315 million (2006 – £213 million) relates to receivables due from state hospital authorities in certain European countries. The Group has not raised bad or doubtful debt provisions against these amounts as they are considered to be recoverable. Trade and other payables have been includedand Other non-current liabilities in scope of IAS 39
The following table reconciles Trade and other payables and Other non-current liabilities which fall within the scope of IAS 39 to the extent theyrelevant balance sheet amounts. Other liabilities include payments on account and tax and social security payables, which are classified asoutside the scope of IAS 39. The financial assets and liabilities in accordance with IAS 32. Where appropriate, currency and interest rate swaps have been presented alongside the underlying principal instrument. The carrying amounts of these instruments have been adjusted for the effect of the currency and interest rate swaps acting as hedges.are predominantly non-interest bearing. | | | | 2006 | | | | 2005 | | | |
|
|
| |
|
|
| | | At 31st December | Carrying | | Fair | | Carrying | | Fair | | | value | value | value | value | | £m | £m | £m | £m |
|
|
|
|
|
|
|
| | | Liquid investments | 1,035 | | 1,035 | | 1,025 | | 1,025 | | | Cash and cash equivalents | 2,005 | | 2,005 | | 4,209 | | 4,209 | |
|
|
|
|
|
|
|
| | | Current asset financial instruments | 3,040 | | 3,040 | | 5,234 | | 5,234 | |
|
|
|
|
|
|
|
| | | £ notes and bonds | (977 | ) | (1,043 | ) | (976 | ) | (1,097 | ) |
|
|
|
|
|
|
|
| | | US$ notes, bonds and private financing | (1,435 | ) | (1,446 | ) | (1,929 | ) | (1,932 | ) | | Notes and bonds swapped into US$ | (494 | ) | (493 | ) | (502 | ) | (501 | ) | | Currency swaps | 101 | | 101 | | 54 | | 54 | | | Interest rate swaps | (46 | ) | (46 | ) | (47 | ) | (47 | ) |
|
|
|
|
|
|
|
| | | | (1,874 | ) | (1,884 | ) | (2,424 | ) | (2,426 | ) |
|
|
|
|
|
|
|
| | | Notes swapped into Yen | (338 | ) | (335 | ) | (342 | ) | (348 | ) | | Currency swaps | 44 | | 44 | | 10 | | 10 | |
|
|
|
|
|
|
|
| | | | (294 | ) | (291 | ) | (332 | ) | (338 | ) |
|
|
|
|
|
|
|
| | | €notes | (1,671 | ) | (1,620 | ) | (1,702 | ) | (1,705 | ) | | Interest rate swap | 6 | | 6 | | 5 | | 5 | |
|
|
|
|
|
|
|
| | | | (1,665 | ) | (1,614 | ) | (1,697 | ) | (1,700 | ) |
|
|
|
|
|
|
|
| | | Other short-term borrowings | (463 | ) | (463 | ) | (909 | ) | (909 | ) | | Other long-term borrowings | (112 | ) | (112 | ) | (111 | ) | (111 | ) |
|
|
|
|
|
|
|
| | | Total borrowings and related swaps | (5,385 | ) | (5,407 | ) | (6,449 | ) | (6,581 | ) |
|
|
|
|
|
|
|
| | | Equity investments | 441 | | 441 | | 362 | | 362 | | | Receivables | 4,773 | | 4,773 | | 4,934 | | 4,934 | | | Payables | (4,581 | ) | (4,581 | ) | (4,754 | ) | (4,754 | ) | | Other derivatives – assets | 37 | | 37 | | 126 | | 126 | | | Other derivatives – liabilities | (49 | ) | (49 | ) | (150 | ) | (150 | ) | | Other financial assets | 263 | | 263 | | 271 | | 271 | | | Other financial liabilities | (232 | ) | (232 | ) | (391 | ) | (391 | ) |
|
|
|
|
|
|
|
| | | Total financial assets and liabilities | (1,693 | ) | (1,715 | ) | (817 | ) | (949 | ) |
|
|
|
|
|
|
|
| | | Total financial assets | 8,710 | | 8,710 | | 10,996 | | 10,996 | |
|
|
|
|
|
|
|
| | | Total financial liabilities | (10,403 | ) | (10,425 | ) | (11,813 | ) | (11,945 | ) |
|
|
|
|
|
|
|
| | | Reconciliation to net debt | | | | | | | | |
|
|
|
|
|
|
|
| | | Liquid investments | 1,035 | | 1,035 | | 1,025 | | 1,025 | | | Cash and cash equivalents | 2,005 | | 2,005 | | 4,209 | | 4,209 | | | Total borrowings | (5,385 | ) | (5,407 | ) | (6,449 | ) | (6,581 | ) |
|
|
|
|
|
|
|
| | | | (2,345 | ) | (2,367 | ) | (1,215 | ) | (1,347 | ) | | Less net effect of interest rate and currency swaps | (105 | ) | (105 | ) | (22 | ) | (22 | ) |
|
|
|
|
|
|
|
| | | Net debt | (2,450 | ) | (2,472 | ) | (1,237 | ) | (1,369 | ) |
|
|
|
|
|
|
|
| |
| | 2007 | | 2006 | | | | £m | | £m | |
|
|
|
| | | Trade and other payables (Note 27) | (4,861 | ) | (4,831 | ) | | Other non-current liabilities (Note 30) | (368 | ) | (346 | ) |
|
|
|
| | | | (5,229 | ) | (5,177 | ) |
|
|
|
| | | Analysed as: | | | | | | Financial liabilities in scope of IAS 39 | (4,450 | ) | (4,609 | ) | | Other liabilities | (779 | ) | (568 | ) |
|
|
|
| | | | (5,229 | ) | (5,177 | ) |
|
|
|
| | | | | | | |
| 140 |
| GSK Annual Report 20062007 | 129 | |
<Back to Contents | FINANCIAL STATEMENTS | | | Notes to the financialstatements | | | | | | | | Notes to the financial statements | | continued |
|
3941 Financial instruments and related disclosurescontinued
InterestDebt interest rate profiles of financial assets and liabilitiesrepricing table
The following tables settable sets out the exposure of financial assetsthe Group to interest rates on debt before and liabilitiesafter the effect of interest rate swaps. The maturity analysis of fixed rate debt is stated by contractual maturity and of floating rate debt by interest rate repricing dates. For the purpose of this table, debt is defined as all classes of borrowings other than obligations under finance leases.
| | | | | | 2007 | | | | | | 2006 | | | |
| |
| | | | | | Effect of | | | | | | Effect of | | | | | | | | interest | | | | | | interest | | | | | | Debt | | rate swaps | | Total | | Debt | | rate swaps | | Total | | | | £m | | £m | | £m | | £m | | £m | | £m | |
| | | Floating and fixed rate debt less than one year | (3,455 | ) | (746 | ) | (4,201 | ) | (895 | ) | (1,883 | ) | (2,778 | ) | | Between one and two years | (369 | ) | – | | (369 | ) | (1,166 | ) | 1,164 | | (2 | ) | | Between two and three years | (1 | ) | – | | (1 | ) | (339 | ) | – | | (339 | ) | | Between three and four years | (1 | ) | – | | (1 | ) | (1 | ) | – | | (1 | ) | | Between four and five years | (2,194 | ) | – | | (2,194 | ) | – | | – | | – | | | Greater than five years | (4,409 | ) | 746 | | (3,663 | ) | (2,948 | ) | 719 | | (2,229 | ) |
| | | Total | (10,429 | ) | – | | (10,429 | ) | (5,349 | ) | – | | (5,349 | ) |
| | | Original issuance profile: | | | | | | | | | | | | | | Fixed rate interest | (8,204 | ) | 1,979 | | (6,225 | ) | (4,721 | ) | 2,138 | | (2,583 | ) | | Floating rate interest | (2,225 | ) | (1,979 | ) | (4,204 | ) | (628 | ) | (2,138 | ) | (2,766 | ) |
| | | Total interest bearing | (10,429 | ) | – | | (10,429 | ) | (5,349 | ) | – | | (5,349 | ) | | Non-interest bearing | (19 | ) | – | | (19 | ) | (2 | ) | – | | (2 | ) |
| | | | (10,448 | ) | – | | (10,448 | ) | (5,351 | ) | – | | (5,351 | ) |
| |
Sensitivity analysis
The sensitivity analysis has been prepared on the assumption that the amount of net debt, the ratio of fixed to either fixed interest rates, floating interest rates or noof the debt and derivatives portfolio and the proportion of financial instruments in foreign currencies are all constant and on the basis of the hedge designations in place at 31st December. Financial instruments affected by market risk include borrowings, deposits and derivative financial instruments. The following analyses are intended to illustrate the sensitivity of such financial instruments to changes in relevant foreign exchange and interest rates. Foreign exchange sensitivity
The maturity profile oftable below shows the Group’s sensitivity to foreign exchange rates on its US dollar, Euro and Yen financial assetsinstruments excluding trade payables, trade receivables, other non-derivative financial instruments not in net debt and liabilities exposedobligations under finance leases, which do not present a material exposure. These three currencies are the major currencies in which GSK’s financial instruments are denominated. GSK has considered movements in these currencies over the last two years and has concluded that a 10% movement in rates is a reasonable benchmark. In this table, financial instruments are only considered sensitive to interest rate riskforeign exchange rates where they are not in the tables below indicatesfunctional currency of the contractual repricingentity that holds them. Intercompany loans which are fully hedged to maturity with a currency swap have been excluded from this analysis. | | | | 2007 | | | | 2006 | | | |
| |
| | | | Increase | | Reduction | | Increase | | Reduction | | | | in income | | in equity | | in income | | in equity | | | | £m | | £m | | £m | | £m | |
| | | 10% appreciation of the US dollar | 38 | | 580 | | 35 | | 195 | | | 10% appreciation of the Euro | 1 | | 709 | | – | | 436 | | | 10% appreciation of the Yen | – | | 15 | | – | | 14 | |
| |
A 10% depreciation of the stated currencies would have an equal and maturity dates of these instruments.opposite effect. | | | | | | Cash and | | | | Other | | | | | | | | Liquid | | cash | | | | financial | | | | | At 31st December 2006 | Investments | | investments | | equivalents | | Receivables | | assets | | Total | | | Financial assets | £m | | £m | | £m | | £m | | £m | | £m | |
|
|
|
|
|
|
|
|
|
|
|
| | | Less than one year | – | | 1,035 | | 1,952 | | 211 | | 1 | | 3,199 | | | Between one and two years | – | | – | | – | | 3 | | – | | 3 | | | Between two and three years | – | | – | | – | | 1 | | – | | 1 | | | Between three and four years | – | | – | | – | | – | | – | | – | | | Between four and five years | – | | – | | – | | – | | – | | – | | | Greater than five years | – | | – | | – | | – | | 104 | | 104 | |
|
|
|
|
|
|
|
|
|
|
|
| | | Total interest earning | – | | 1,035 | | 1,952 | | 215 | | 105 | | 3,307 | |
|
|
|
|
|
|
|
|
|
|
|
| | | Analysed as: | | | | | | | | | | | | | | Fixed rate interest | – | | 285 | | 12 | | 207 | | 104 | | 608 | | | Floating rate interest | – | | 750 | | 1,940 | | 8 | | 1 | | 2,699 | |
|
|
|
|
|
|
|
|
|
|
|
| | | Total interest earning | – | | 1,035 | | 1,952 | | 215 | | 105 | | 3,307 | | | Non-interest earning | 441 | | – | | 53 | | 4,558 | | 351 | | 5,403 | |
|
|
|
|
|
|
|
|
|
|
|
| | | Total | 441 | | 1,035 | | 2,005 | | 4,773 | | 456 | | 8,710 | |
|
|
|
|
|
|
|
|
|
|
|
| | | | | | | | | | | | | | | | | | | | | | | | | | | | | |
| | | | | | Cash and | | | | Other | | | | | | | | Liquid | | cash | | | | financial | | | | | At 31st December 2005 | Investments | | investments | | equivalents | | Receivables | | assets | | Total | | | Financial assets | £m | | £m | | £m | | £m | | £m | | £m | |
|
|
|
|
|
|
|
|
|
|
|
| | | Less than one year | – | | 1,025 | | 4,188 | | 204 | | 94 | | 5,511 | | | Between one and two years | – | | – | | – | | 8 | | – | | 8 | | | Between two and three years | – | | – | | – | | 13 | | – | | 13 | | | Between three and four years | – | | – | | – | | 12 | | – | | 12 | | | Between four and five years | – | | – | | – | | – | | – | | – | | | Greater than five years | – | | – | | – | | – | | 117 | | 117 | |
|
|
|
|
|
|
|
|
|
|
|
| | | Total interest earning | – | | 1,025 | | 4,188 | | 237 | | 211 | | 5,661 | |
|
|
|
|
|
|
|
|
|
|
|
| | | Analysed as: | | | | | | | | | | | | | | Fixed rate interest | – | | 292 | | – | | 207 | | 117 | | 616 | | | Floating rate interest | – | | 733 | | 4,188 | | 30 | | 94 | | 5,045 | |
|
|
|
|
|
|
|
|
|
|
|
| | | Total interest earning | – | | 1,025 | | 4,188 | | 237 | | 211 | | 5,661 | | | Non-interest earning | 362 | | – | | 21 | | 4,697 | | 255 | | 5,335 | |
|
|
|
|
|
|
|
|
|
|
|
| | | Total | 362 | | 1,025 | | 4,209 | | 4,934 | | 466 | | 10,996 | |
|
|
|
|
|
|
|
|
|
|
|
| |
The movements in the income statement relate primarily to the hedging instrument for a US dollar legal provision. Whilst this is an economic hedge, the provision is not a financial instrument and therefore is not included in the table above. The movements in equity relate to foreign exchange positions used to hedge Group assets denominated in US dollar, Euro and Yen. Therefore, a depreciation on the currency swap would give rise to a corresponding appreciation on the Group asset. Foreign exchange sensitivity on Group assets other than financial instruments is not included above. |
| GSK Annual Report 20062007 | 141 | 130 | |
<Back to Contents | Notes to the financialstatements | | | | | | | | Notes to the financial statements | | continued |
|
3941 Financial instruments and related disclosurescontinued
| | | | Effect of | | Obligations | | | | Other | | | | | | | | interest rate | | under finance | | | | financial | | | | | At 31st December 2006 | Debt | | swaps | | leases | | Payables | | liabilities | | Total | | | Financial liabilities | £m | | £m | | £m | | £m | | £m | | £m | |
|
|
|
|
|
|
|
|
|
|
|
| | | Less than one year | (895 | ) | (1,883 | ) | (106 | ) | (14 | ) | – | | (2,898 | ) | | Between one and two years | (1,166 | ) | 1,164 | | (10 | ) | – | | – | | (12 | ) | | Between two and three years | (339 | ) | – | | (7 | ) | – | | – | | (346 | ) | | Between three and four years | (1 | ) | – | | (8 | ) | – | | – | | (9 | ) | | Between four and five years | – | | – | | (6 | ) | – | | – | | (6 | ) | | Greater than five years | (2,948 | ) | 719 | | (2 | ) | – | | – | | (2,231 | ) |
|
|
|
|
|
|
|
|
|
|
|
| | | Total interest bearing | (5,349 | ) | – | | (139 | ) | (14 | ) | – | | (5,502 | ) |
|
|
|
|
|
|
|
|
|
|
|
| | | Analysed as: | | | | | | | | | | | | | | Fixed rate interest | (4,721 | ) | 2,138 | | (46 | ) | (6 | ) | – | | (2,635 | ) | | Floating rate interest | (628 | ) | (2,138 | ) | (93 | ) | (8 | ) | – | | (2,867 | ) |
|
|
|
|
|
|
|
|
|
|
|
| | | Total interest bearing | (5,349 | ) | – | | (139 | ) | (14 | ) | – | | (5,502 | ) | | Non-interest bearing | (2 | ) | – | | – | | (4,567 | ) | (332 | ) | (4,901 | ) |
|
|
|
|
|
|
|
|
|
|
|
| | | Total | (5,351 | ) | – | | (139 | ) | (4,581 | ) | (332 | ) | (10,403 | ) |
|
|
|
|
|
|
|
|
|
|
|
| | | | | | | | | | | | | | | | | | | | | | | | | | | | | |
| | | | Effect of | | Obligations | | | | Other | | | | | | | | interest rate | | under finance | | | | financial | | | | | At 31st December 2005 | Debt | | swaps | | leases | | Payables | | liabilities | | Total | | | Financial liabilities | £m | | £m | | £m | | £m | �� | £m | | £m | |
|
|
|
|
|
|
|
|
|
|
|
| | | Less than one year | (1,176 | ) | (2,348 | ) | (103 | ) | (148 | ) | (61 | ) | (3,836 | ) | | Between one and two years | (287 | ) | 291 | | (3 | ) | – | | (23 | ) | (22 | ) | | Between two and three years | (1,190 | ) | 1,185 | | (3 | ) | – | | – | | (8 | ) | | Between three and four years | (343 | ) | – | | (2 | ) | – | | – | | (345 | ) | | Between four and five years | – | | – | | (2 | ) | – | | – | | (2 | ) | | Greater than five years | (3,354 | ) | 872 | | (8 | ) | – | | – | | (2,490 | ) |
|
|
|
|
|
|
|
|
|
|
|
| | | Total interest bearing | (6,350 | ) | – | | (121 | ) | (148 | ) | (84 | ) | (6,703 | ) |
|
|
|
|
|
|
|
|
|
|
|
| | | Analysed as: | | | | | | | | | | | | | | Fixed rate interest | (5,527 | ) | 2,348 | | (21 | ) | – | | (24 | ) | (3,224 | ) | | Floating rate interest | (823 | ) | (2,348 | ) | (100 | ) | (148 | ) | (60 | ) | (3,479 | ) |
|
|
|
|
|
|
|
|
|
|
|
| | | Total interest bearing | (6,350 | ) | – | | (121 | ) | (148 | ) | (84 | ) | (6,703 | ) | | Non-interest bearing | – | | – | | – | | (4,606 | ) | (504 | ) | (5,110 | ) |
|
|
|
|
|
|
|
|
|
|
|
| | | Total | (6,350 | ) | – | | (121 | ) | (4,754 | ) | (588 | ) | (11,813 | ) |
|
|
|
|
|
|
|
|
|
|
|
| |
Interest rate sensitivity
The table below shows the Group’s sensitivity to interest rates on its floating rate Sterling, US dollar and Euro financial instruments, being the currencies in which GSK has historically issued debt and held investments. GSK has considered movements in these interest rates over the last two years and has concluded that a 1% increase is a reasonable benchmark. Debt with a maturity of less than one year is floating rate for this calculation. A 1% movement in interest rates is not deemed to have a material effect on equity. | | 2007 | | 2006 | | | | Increase/(decrease) | | Increase/(decrease) | | | | in income | | in income | | | | £m | | £m | |
| | | 1% increase in Sterling interest rates | 1 | | 3 | | | 1% increase in US dollar interest rates | (16 | ) | (8 | ) | | 1% increase in Euro interest rates | 3 | | 2 | |
| |
A 1% decrease in these interest rates would have an equal and opposite effect. Interest rate movements on obligations under finance leases, foreign currency and interest rate derivatives, trade payables, trade receivables and other financial instruments not in net debt do not present a material exposure to the Group’s balance sheet based on a 1% increase or decrease in these interest rates. MaturityContractual cash flows for non-derivative financial liabilities and derivative instruments
The following is an analysis of the anticipated contractual cash flows including interest earningpayable for the Group’s non-derivative financial assetsliabilities on an undiscounted basis. For the purpose of this table, debt is defined as all classes of borrowings except for obligations under finance leases. Interest is calculated based on debt held at 31st December without taking account of future issuance. Floating rate interest is estimated using the prevailing interest rate at the balance sheet date. Cash flows in foreign currencies are translated using spot rates at 31st December.
| | | | | | | | Finance charge | | Trade and | | | | | | | | | | Obligations | | on obligations | | other | | | | | | | | Interest on | | under finance | | under finance | | payables not | | | | | | Debt | | debt | | leases | | leases | | in net debt | | Total | | | At 31st December 2007 | £m | | £m | | £m | | £m | | £m | | £m | |
| | | Due less than one year | (3,466 | ) | (412 | ) | (40 | ) | (5 | ) | (4,330 | ) | (8,253 | ) | | Between one and two years | (368 | ) | (339 | ) | (37 | ) | (3 | ) | (75 | ) | (822 | ) | | Between two and three years | (10 | ) | (327 | ) | (24 | ) | (2 | ) | (15 | ) | (378 | ) | | Between three and four years | – | | (327 | ) | (9 | ) | (2 | ) | (3 | ) | (341 | ) | | Between four and five years | (2,206 | ) | (327 | ) | (4 | ) | (1 | ) | (1 | ) | (2,539 | ) | | Greater than five years | (4,478 | ) | (3,563 | ) | (9 | ) | (1 | ) | (26 | ) | (8,077 | ) |
| | | Gross contractual cash flows | (10,528 | ) | (5,295 | ) | (123 | ) | (14 | ) | (4,450 | ) | (20,410 | ) |
| |
| | | | | | | | Finance charge | | Trade | | | | | | | | | | Obligations | | on obligations | | and other | | | | | | | | Interest on | | under finance | | under finance | | payables not | | | | | | Debt | | debt | | leases | | leases | | in net debt | | Total | | | At 31st December 2006 | £m | | £m | | £m | | £m | | £m | | £m | |
| | | Due less than one year | (677 | ) | (209 | ) | (42 | ) | (7 | ) | (4,534 | ) | (5,469 | ) | | Between one and two years | (1,179 | ) | (205 | ) | (36 | ) | (5 | ) | (55 | ) | (1,480 | ) | | Between two and three years | (339 | ) | (158 | ) | (27 | ) | (3 | ) | (15 | ) | (542 | ) | | Between three and four years | (11 | ) | (147 | ) | (15 | ) | (3 | ) | (2 | ) | (178 | ) | | Between four and five years | – | | (147 | ) | (7 | ) | (1 | ) | – | | (155 | ) | | Greater than five years | (3,242 | ) | (2,082 | ) | (12 | ) | (2 | ) | (3 | ) | (5,341 | ) |
| | | Gross contractual cash flows | (5,448 | ) | (2,948 | ) | (139 | ) | (21 | ) | (4,609 | ) | (13,165 | ) |
| |
The maturityfollowing table provides an analysis of interest earning financial assets is equivalent to the maturity analysis presentedanticipated contractual cash flows for the Group’s derivative instruments, excluding embedded derivatives and equity options, using undiscounted cash flows. Cash flows in the interest rate profile table above.foreign currencies are translated using spot rates at 31st December. Maturity analysis of interest bearing financial liabilities
| | | Finance | | | 2007 | | 2006 | | | At 31st December 2006 | Debt | | leases | | Payables | | Total | | | | Financial liabilities | £m | | £m | | £m | | £m | | |
|
| |
| |
| | | Within one year or on demand | (676 | ) | (42 | ) | (14 | ) | (732 | ) | | | | | Receivables | | Payables | | Receivables | | Payables | | | | | £m | | £m | | £m | | £m | |
| |
| | | Less than one year | | 23,784 | | (23,630 | ) | 13,980 | | (13,988 | ) | | Between one and two years | (1,166 | ) | (36 | ) | – | | (1,202 | ) | 389 | | (323 | ) | 536 | | (428 | ) | | Between two and three years | (339 | ) | (27 | ) | – | | (366 | ) | 10 | | (14 | ) | 350 | | (304 | ) | | Between three and four years | (11 | ) | (15 | ) | – | | (26 | ) | 34 | | (39 | ) | 1 | | (9 | ) | | Between four and five years | – | | (7 | ) | – | | (7 | ) | 216 | | (246 | ) | 24 | | (32 | ) | | After five years | (3,157 | ) | (12 | ) | – | | (3,169 | ) | | | Greater than five years | | – | | (5 | ) | – | | (21 | ) |
| |
| | | Gross contractual cash flows | | 24,433 | | (24,257 | ) | 14,891 | | (14,782 | ) |
|
| |
| | | | (5,349 | ) | (139 | ) | (14 | ) | (5,502 | ) | | |
| | |
| 142 |
| GSK Annual Report 20062007 | 131 | |
<Back to Contents
| Notes to the financial statements | continued |
|
39 Financial instruments and related disclosurescontinued
| | | | | | | | Other | | | | | | | | Finance | | | | financial | | | | | At 31st December 2005 | Debt | | leases | | Payables | | liabilities | | Total | | | Financial liabilities | £m | | £m | | £m | | £m | | £m | |
|
|
|
|
|
|
|
|
|
| | | Within one year or on demand | (1,162 | ) | (38 | ) | (148 | ) | (61 | ) | (1,409 | ) | | Between one and two years | (287 | ) | (30 | ) | – | | (23 | ) | (340 | ) | | Between two and three years | (1,203 | ) | (21 | ) | – | | – | | (1,224 | ) | | Between three and four years | (343 | ) | (11 | ) | – | | – | | (354 | ) | | Between four and five years | (1 | ) | (8 | ) | – | | – | | (9 | ) | | After five years | (3,354 | ) | (13 | ) | – | | – | | (3,367 | ) |
|
|
|
|
|
|
|
|
|
| | | | (6,350 | ) | (121 | ) | (148 | ) | (84 | ) | (6,703 | ) |
|
|
|
|
|
|
|
|
|
| |
Currency profiles of financial assets and liabilities
The Group’s currency exposures that give rise to net currency gains and losses that are recognised in the income statement arise principally in companies with Sterling functional currency. The tables below set out these exposures on financial assets and liabilities held in currencies other than the functional currencies of Group companies after the effect of currency swaps.
| At 31st December 2006 | Sterling | | US$ | | Euro | | Yen | | Other | | Total | | | Financial assets | £m | | £m | | £m | | £m | | £m | | £m | |
|
|
|
|
|
|
|
|
|
|
|
| | | Investments | – | | 140 | | 3 | | – | | 27 | | 170 | | | Cash and cash equivalents | 2 | | 81 | | 6 | | 2 | | 18 | | 109 | | | Receivables | 2 | | 221 | | 118 | | – | | 34 | | 375 | | | Other financial assets | – | | 2 | | 1 | | – | | 4 | | 7 | |
|
|
|
|
|
|
|
|
|
|
|
| | | | 4 | | 444 | | 128 | | 2 | | 83 | | 661 | |
|
|
|
|
|
|
|
|
|
|
|
| | | | | | | | | | | | | | | | | | | | | | | | | | | | | |
| At 31st December 2005 | Sterling | | US$ | | Euro | | Yen | | Other | | Total | | | Financial assets | £m | | £m | | £m | | £m | | £m | | £m | |
|
|
|
|
|
|
|
|
|
|
|
| | | Investments | 8 | | 108 | | 3 | | – | | 11 | | 130 | | | Cash and cash equivalents | 1 | | 46 | | 10 | | 2 | | 19 | | 78 | | | Receivables | 7 | | 123 | | 89 | | – | | 91 | | 310 | | | Other financial assets | – | | – | | – | | – | | – | | – | |
|
|
|
|
|
|
|
|
|
|
|
| | | | 16 | | 277 | | 102 | | 2 | | 121 | | 518 | |
|
|
|
|
|
|
|
|
|
|
|
| | | | | | | | | | | | | | | | | | | | | | | | | | | | | |
| At 31st December 2006 | Sterling | | US$ | | Euro | | Yen | | Other | | Total | | | Financial liabilities | £m | | £m | | £m | | £m | | £m | | £m | |
|
|
|
|
|
|
|
|
|
|
|
| | | Debt | – | | – | | – | | – | | – | | – | | | Obligations under finance leases | – | | – | | (9 | ) | – | | (8 | ) | (17 | ) | | Payables | (14 | ) | (117 | ) | (67 | ) | (2 | ) | (93 | ) | (293 | ) |
|
|
|
|
|
|
|
|
|
|
|
| | | | (14 | ) | (117 | ) | (76 | ) | (2 | ) | (101 | ) | (310 | ) |
|
|
|
|
|
|
|
|
|
|
|
| | | | | | | | | | | | | | | | | | | | | | | | | | | | | |
| At 31st December 2005 | Sterling | | US$ | | Euro | | Yen | | Other | | Total | | | Financial liabilities | £m | | £m | | £m | | £m | | £m | | £m | |
|
|
|
|
|
|
|
|
|
|
|
| | | Debt | – | | – | | (497 | ) | – | | – | | (497 | ) | | Obligations under finance leases | – | | (2 | ) | – | | – | | – | | (2 | ) | | Payables | (7 | ) | (18 | ) | (13 | ) | (1 | ) | (30 | ) | (69 | ) |
|
|
|
|
|
|
|
|
|
|
|
| | | | (7 | ) | (20 | ) | (510 | ) | (1 | ) | (30 | ) | (568 | ) |
|
|
|
|
|
|
|
|
|
|
|
| |
|
| GSK Annual Report 2006 | 132 |
<Back to Contents | | | Notes to the financialstatements | | | | | | | | Notes to the financial statements | | continued |
| | |
3941 Financial instruments and related disclosurescontinued
Derivative financial instruments and hedging programmes
The following table below sets out the net principal amountamounts and fair valuevalues of derivative contractsderivatives held by GSK:GSK. | | | | | | | Fair value | | | | | Contract or underlying |
|
|
| | | | | principal amount | Assets | | Liabilities | | | | | 2006 | 2006 | | 2006 | | | | | £m | £m | | £m | |
|
|
|
|
|
|
| | | Currency and interest related instruments: | | | | | | | | | Foreign exchange contracts | | 461 | | 20 | | (25 | ) | | Cross currency swaps | | 838 | | 150 | | (5 | ) | | Interest rate swaps | | 1,696 | | 6 | | (46 | ) | | | | Equity related instruments: | | | | | | | | | Options and warrants | | 407 | | 13 | | (12 | ) | | Equity collar | | 270 | | – | | (12 | ) | | | | | | | | | | | Embedded derivatives | | 43 | | 4 | | – | |
|
|
|
|
|
|
| | | Total derivative financial instruments | | | | 193 | | (100 | ) |
|
|
|
|
|
|
| |
| | | | | | | | | | | | | | | | Fair value | | | | | Contract or underlying | |
|
|
| | | | | principal amount | | Assets | | Liabilities | | | | | 2005 | | 2005 | | 2005 | | | | | £m | | £m | | £m | |
|
|
|
|
|
|
| | | Currency and interest related instruments: | | | | | | | | | Foreign exchange contracts | | (4,665 | ) | 102 | | (85 | ) | | Cross currency swaps | | 842 | | 64 | | – | | | Interest rate swaps | | 1,848 | | 5 | | (47 | ) | | | | | | | | | | | Equity related instruments: | | | | | | | | | Options and warrants | | 290 | | 21 | | (49 | ) | | Equity collar | | 299 | | – | | (14 | ) | | | | | | | | | | | Embedded derivatives | | 34 | | 3 | | (2 | ) |
|
|
|
|
|
|
| | | Total derivative financial instruments | | | | 195 | | (197 | ) |
|
|
|
|
|
|
| |
| | | | | | 2007 | | | | | | 2006 | | | | | | | | Fair value | | | | | | Fair value | | | | | |
| | | |
| | | | Principal | | | | | | Principal | | | | | | | | amount | | Assets | | Liabilities | | amount | | Assets | | Liabilities | | | | £m | | £m | | £m | | £m | | £m | | £m | |
| | | Cash flow hedges: | | | | | | | | | | | | | | Cross currency swaps | 368 | | 57 | | – | | 338 | | 44 | | – | | | Fair value hedges: | | | | | | | | | | | | | | Interest rate swaps | 1,989 | | 7 | | (6 | ) | 2,196 | | 6 | | (51 | ) | | Net investment hedges: | | | | | | | | | | | | | | Foreign exchange contracts | (9,553 | ) | – | | (220 | ) | (5,049 | ) | 11 | | – | | | Cross currency swaps | 388 | | 111 | | – | | 394 | | 106 | | – | |
| | | Derivatives designated as accounting hedges | (6,808 | ) | 175 | | (226 | ) | (2,121 | ) | 167 | | (51 | ) |
| | | Foreign exchange contracts | 10,156 | | 287 | | (40 | ) | 5,510 | | 9 | | (25 | ) | | Equity related instruments: | | | | | | | | | | | | | | Options and warrants | 4 | | 4 | | – | | 407 | | 13 | | (12 | ) | | Equity collar | 532 | | 7 | | (2 | ) | 270 | | – | | (12 | ) | | Embedded derivatives | 92 | | 3 | | (2 | ) | 43 | | 4 | | – | |
| | | Other derivatives | 10,784 | | 301 | | (44 | ) | 6,230 | | 26 | | (49 | ) |
| | | Total derivative instruments | 3,976 | | 476 | | (270 | ) | 4,109 | | 193 | | (100 | ) |
| | | Analysed as: | | | | | | | | | | | | | | Current | | | 475 | | (262 | ) | | | 80 | | (40 | ) | | Non-current | | | 1 | | (8 | ) | | | 113 | | (60 | ) |
| | | Total | | | 476 | | (270 | ) | | | 193 | | (100 | ) |
| |
Derivative financial instruments
The principal amount on foreign exchange contracts is calculated based on outstanding positions at the balance sheet date, calculated net by currency and buy/sell side position. The majority of contracts are for periods of 12 months or less. Included in ‘Equity related instruments’ above are variable sale forward contracts in Quest Diagnostics, Inc. and various equity warrants. At 31st December 2006 the Group also held put and call options in Theravance, Inc., as detailed Further information on the Quest and Theravance derivatives is provided below. In 2002, GSK hedged part of the equity value of its holdings in Quest, its largest equity investment,an associated undertaking, through a series of variable sale forward contracts. The contracts (‘the equity collar’) were renewed in 2006 and are structured in five series, each over two million Quest shares, and mature between 2010 and 2012. The fair value of the contracts at 31st December 20062007 was a liability of $4 million (£2 million) (2006 – $24 million (£12 million) (2005 – $24 million (£14 million)). A second series of hedging contractcontracts over an additional 10 million shares was entered into on 15th February 2007. These contracts are also structured in five series, each over two million Quest shares, and mature between 2013 and 2015. The fair value of the contracts at 31st December 2007 – see Note 38 ‘Post balance sheet events’was an asset of $15 million (£7 million). TheAt 31st December 2006 the Group has entered intoheld a put option agreement whereby Theravance’s shareholders cancould sell up to half of their Theravance shares to GSK at a pre-determined price ($19.375) . Given the maximum number of shares subject to the put option, the Group’s obligation is capped at $525 million.price. At 31st December 2006, this option iswas recorded as a liability of $19 million (£10 million) (2005 – $81 million (£47 million)). As atThis option expired unexercised in August 2007.
At 31st December 2006, the maximum potential exposure to GSK from fair value movements of these options is therefore approximately $506 million (£258 million) (2005 – $444 million (£258 million)). The expiry date is August 2007. The Group has entered intoheld a call option agreement whereby it cancould purchase half of the outstanding Theravance shares in issue at a predetermined price ($54.25) .pre-determined price. At 31st December 2006, this option iswas recorded as an asset of $15 million (£8 million) (2005 – $28 million (£16 million)). As atThis option expired unexercised in July 2007.
At 31st December 2006,2007, the maximum potential exposure to GSK fromGroup held outstanding foreign exchange contracts consisting primarily of currency swaps with a total fair value movements of this option is therefore $15 million. The expiry date is July 2007.£247 million (2006 – £16 million liability). These represent hedges of intercompany loans and deposits, but are not designated as accounting hedges. Changes in fair value are taken to profit and loss in the period to offset the exchange gains and losses on the related inter-company lending and borrowing. |
| GSK Annual Report 20062007 | 143 | 133 | |
Back to Contents | | FINANCIAL STATEMENTS | | Notes to the financial statements | continued | |
| | | | | Notes to the financial statements | | continued | | |
3941 Financial instruments and related disclosurescontinued
The following table sets out the principal amount and fair values of derivative contracts which qualify for hedge accounting treatment:
| | | | 2006 | | | | 2005 | | | |
|
|
| |
|
|
| | | | Contract or underlying | | Fair value of | | Contract or underlying | | Fair value of | | | | principal amount | | derivative contract | | principal amount | | derivative contract | | | | £m | | £m | | £m | | £m | |
|
|
|
|
|
|
|
| | | Cash flow hedges: | | | | | | | | | | Cross currency swaps | 338 | | 44 | | 342 | | 10 | |
|
|
|
|
|
|
|
| | | Fair value hedges: | | | | | | | | | | Foreign exchange contracts | – | | – | | 2,151 | | 74 | | | Interest rate swaps | 1,696 | | (40 | ) | 1,848 | | (42 | ) | | Cross currency swaps | 500 | | (5 | ) | 500 | | 3 | |
|
|
|
|
|
|
|
| | | Net investment hedges: | | | | | | | | | | Foreign exchange contracts | (5,049 | ) | 11 | | (6,816 | ) | (57 | ) | | Cross currency swaps | 500 | | 106 | | 500 | | 51 | |
|
|
|
|
|
|
|
| |
Cash flow hedges
The Group has entered into a cross currency swap and designated it a cash flow hedge converting fixed Euro coupons,interest, payable annually, to fixed Yen payments. The bond matures in 2009. The risk being hedged is the variability of cash flows arising from currency fluctuations. No ineffectiveness is assumed on the hedge. All cash flows relating to the hedge are expected to occur within the next two years. The amounts recognised in equity are recycled to the income statement to offset the exchange gains or losses in the same period on the underlying bond as a result of revaluation at the balance sheet date. The amount recognised in equity in 2007 for cross currency interest rate swaps was £10 million credit (2006 – £30 million credit). The amount recycled from equity to the income statement in 2007 for cross currency interest rate swaps to offset the exchange loss on the underlying bond recognised in the income statement was £14 million (2006 – £32 million). The net fair value movements on cash flow hedges are disclosed in the Consolidated statement of recognised income and expense. Fair value hedges
The Group has designated interest rate swaps and the interest element of one of its two cross currency swaps as a fair value hedges.hedge. The risk being hedged is the variability of the fair value of the bonds arising from interest rate fluctuations. Gains and losses on fair value hedges are disclosed in Note 12, ‘Finance costs’. Net investment hedges
Foreign exchange contracts and the currency element of one of the Group’s two cross currency swaps have been designated as net investment hedges in respect of the foreign currency translation risk principally arising on consolidation of the Group’s net investment in its US dollar, Euro and Yen foreign operations. In addition, Euro loan capital issued during the year of€3.5 billion, and€750 million from previous years, has been designated as a non-monetary net investment hedge in respect of the foreign currency translation risk principally arising on consolidation of the Group’s net investment in its Euro operations. Net investment hedge ineffectiveness is disclosed in Note 11, ‘Finance income’. 4042 Employee share schemes
The Group operates share option schemes, whereby options are granted to employees to acquire shares or ADSs in GlaxoSmithKline plc at the grant price, savings-related share option schemes and share award schemes, whereby awards are granted to employees to acquire shares or ADSs in GlaxoSmithKline plc at no cost, subject to the achievement by the Group of specified performance targets. In 2004, the Group introduced a new share award scheme, the Share Value Plan, whereby awards are granted to employees to acquire shares or ADSs in GlaxoSmithKline plc at no cost after a three year vesting period. The granting of restricted share awards has replaced the granting of options to certain employees as the cost of the scheme more readily equates to the potential gain to be made by the employee. Grants under share option schemes are normally exercisable between three and ten years from the date of grant. Grants of restricted shares and share awards are normally exercisable at the end of the three year vesting/performance period. Grants under savings-related share option schemes are normally exercisable after three years’ saving. Options under the share option schemes are granted at the market price ruling at the date of grant. In accordance with UK practice, the majority of options under the savings-related share option schemes are granted at a price 20% below the market price ruling at the date of grant. Share options awarded to the Directors and, with effect from the 2004 grant, the CET are subject to performance criteria as laid out in the Remuneration Report.criteria. The stock-based compensation charge has been recorded in the income statement as follows:
| | 2006 | | 2005 | | 2004 | | | | £m | | £m | | £m | |
|
|
|
|
|
| | | Cost of sales | 18 | | 17 | | 35 | | | Selling, general and administration | 143 | | 150 | | 207 | | | Research and development | 65 | | 69 | | 91 | |
|
|
|
|
|
| | | | 226 | | 236 | | 333 | |
|
|
|
|
|
| |
| 144 |
| GSK Annual Report 20062007 | 134 | |
<Back to Contents | | | Notes to the financial statements | | | | | | | | | Notes to the financial statements | | continued |
| | |
4042 Employee share schemescontinued
Option pricing
For the purposes of valuing options to arrive at the stock-based compensation charge, the Black-Scholes option pricing model has been used. The assumptions used in the model for 2004, 2005, 2006 and 20062007 are as follows: | | | 2006 | | 2005 | | 2004 | | | 2007 | | 2006 | | 2005 | | |
| | |
| |
| | |
| |
| |
| | | Risk-free interest rate | | 4.2% – 5.0% | | | 4.0% – 4.8% | | | 3.3% – 4.6% | | | 4.7% – 5.3% | | 4.2% – 5.0% | | 4.0% – 4.8% | | | Dividend yield | | 3.3% | | | 3.0% | | | 3.2% | | | 4.0% | | 3.3% | | 3.0% | | | Volatility | | 18% – 29% | | | 21% – 28% | | | 26% – 29% | | | 17% – 25% | | 18% – 29% | | 21% – 28% | | | Expected lives of options granted under: | | | | | | | | | Share option schemes | | 5 years | | | 5 years | | | 5 years | | | 5 years | | 5 years | | 5 years | | | Savings-related share option schemes | | 3 years | | | 3 years | | | 3 years | | | 3 years | | 3 years | | 3 years | | | Weighted average share price for grants in the year: | | | | | | | | | Ordinary shares | £ | 14.64 | | £ | 13.15 | | £ | 11.25 | | | £14.41 | | £14.64 | | 13.15 | | | ADSs | $ | 51.40 | | $ | 47.42 | | $ | 43.23 | | | $57.59 | | $51.40 | | 47.42 | |
|
| |
| |
Volatility was determined based on the three year share price history. The fair value of performance share plan grants take into account market conditions. Expected lives of options were determined based on weighted average historic exercises of options. | Options outstanding | | | | | | | | Share option | | | | | | | | | Share option | | | | | | | | | Savings-related | | | | | | | | schemes – shares | | | | | | schemes – ADSs | | | share option schemes | | | |
|
|
|
|
|
|
|
| |
|
|
|
|
|
|
|
| |
|
|
|
|
|
|
|
| | | | | | | | Weighted | | | Weighted | | | | | | Weighted | | | Weighted | | | | | | Weighted | | | Weighted | | | | | Number | | | exercise | | | fair | | | Number | | | exercise | | | fair | | | Number | | | exercise | | | fair | | | | | 000 | | | price | | | value | | | 000 | | | price | | | value | | | 000 | | | price | | | value | |
|
|
|
|
|
|
|
|
|
|
|
|
|
|
|
|
|
|
|
|
|
|
|
|
|
|
| | | At 1st January 2004 | | 205,705 | | £ | 14.89 | | | | | | 106,529 | | $ | 46.58 | | | | | | 10,583 | | £ | 9.59 | | | | | | Options granted | | 9,837 | | £ | 11.23 | | £ | 2.49 | | | 9,222 | | $ | 42.99 | | $ | 8.54 | | | 1,580 | | £ | 9.52 | | £ | 3.30 | | | Options exercised | | (5,764 | ) | £ | 6.54 | | | | | | (1,845 | ) | $ | 25.65 | | | | | | (232 | ) | £ | 9.18 | | | | | | Options lapsed | | (11,997 | ) | £ | 15.33 | | | | | | (3,427 | ) | $ | 48.28 | | | | | | (1,790 | ) | £ | 10.46 | | | | |
|
|
|
|
|
|
|
|
|
|
|
|
|
|
|
|
|
|
|
|
|
|
|
|
|
|
| | | At 31st December 2004 | | 197,781 | | £ | 14.92 | | | | | | 110,479 | | $ | 46.57 | | | | | | 10,141 | | £ | 9.44 | | | | | | Options granted | | 516 | | £ | 12.57 | | £ | 2.76 | | | 956 | | $ | 45.66 | | $ | 9.90 | | | 5,167 | | £ | 11.45 | | £ | 3.68 | | | Options exercised | | (10,483 | ) | £ | 9.91 | | | | | | (7,537 | ) | $ | 38.83 | | | | | | (5,732 | ) | £ | 9.16 | | | | | | Options lapsed | | (20,888 | ) | £ | 17.16 | | | | | | (8,306 | ) | $ | 50.26 | | | | | | (810 | ) | £ | 11.02 | | | | |
|
|
|
|
|
|
|
|
|
|
|
|
|
|
|
|
|
|
|
|
|
|
|
|
|
|
| | | At 31st December 2005 | | 166,926 | | £ | 14.97 | | | | | | 95,592 | | $ | 46.86 | | | | | | 8,766 | | £ | 10.66 | | | | | | Options granted | | 9,776 | | £ | 14.78 | | £ | 3.53 | | | 7,940 | | $ | 51.36 | | $ | 11.59 | | | 2,069 | | £ | 11.40 | | £ | 3.41 | | | Options exercised | | (13,244 | ) | £ | 11.66 | | | | | | (13,310 | ) | $ | 41.78 | | | | | | (2,009 | ) | £ | 9.48 | | | | | | Options lapsed | | (6,755 | ) | £ | 15.35 | | | | | | (1,791 | ) | $ | 46.88 | | | | | | (653 | ) | £ | 10.97 | | | | |
|
|
|
|
|
|
|
|
|
|
|
|
|
|
|
|
|
|
|
|
|
|
|
|
|
|
| | | At 31st December 2006 | | 156,703 | | £ | 15.22 | | | | | | 88,431 | | $ | 48.02 | | | | | | 8,173 | | £ | 11.11 | | | | |
|
|
|
|
|
|
|
|
|
|
|
|
|
|
|
|
|
|
|
|
|
|
|
|
|
|
| | | Range of exercise prices | £ | 10.06 | – | £ | 19.77 | | | | | $ | 32.09 | – | $ | 61.35 | | | | | £ | 10.20 | – | £ | 11.45 | | | | |
|
|
|
|
|
|
|
|
|
|
|
|
|
|
|
|
|
|
|
|
|
|
|
|
|
|
| | | Weighted average remaining contractual life | | | | | 4.9 years | | | | | | | | | 5.6 years | | | | | | | | | 2.4 years | | | | |
|
|
|
|
|
|
|
|
|
|
|
|
|
|
|
|
|
|
|
|
|
|
|
|
|
|
| |
The total intrinsic value (the amount by which the share price exceeded the exercise price of the option) of options exercised during 2006 was £129 million (2005 – £122 million).
The aggregate intrinsic value of options outstanding at 31st December 2006 was £342 million.
| | | | | Share option | | | | | Share option | | | | | Savings-related | | | Options outstanding | | | schemes - shares | | | | | schemes - ADSs | | | | | share option schemes | | | | | |
| | | |
|
| | | | |
| | | | | | | Weighted | | Weighted | | | | | Weighted | | Weighted | | | | | Weighted | | Weighted | | | | Number | | | exercise | | fair | | Number | | | exercise | | fair | | Number | | | exercise | | fair | | | | 000 | | | price | | value | | 000 | | | price | | value | | 000 | | | price | | value | |
| | | At 1st January 2005 | 197,781 | | | £14.92 | | | | 110,479 | | | $46.57 | | | | 10,141 | | | £9.44 | | | | | Options granted | 516 | | | £12.57 | | £2.76 | | 956 | | | $45.66 | | $9.90 | | 5,167 | | | £11.45 | | £3.68 | | | Options exercised | (10,483 | ) | | £9.91 | | | | (7,537 | ) | | $38.83 | | | | (5,732 | ) | | £9.16 | | | | | Options lapsed | (20,888 | ) | | £17.16 | | | | (8,306 | ) | | $50.26 | | | | (810 | ) | | £11.02 | | | |
| | | At 31st December 2005 | 166,926 | | | £14.97 | | | | 95,592 | | | $46.86 | | | | 8,766 | | | £10.66 | | | | | Options granted | 9,776 | | | £14.78 | | £3.53 | | 7,940 | | | $51.36 | | $11.59 | | 2,069 | | | £11.40 | | £3.41 | | | Options exercised | (13,244 | ) | | £11.66 | | | | (13,310 | ) | | $41.78 | | | | (2,009 | ) | | £9.48 | | | | | Options lapsed | (6,755 | ) | | £15.35 | | | | (1,791 | ) | | $46.88 | | | | (653 | ) | | £10.97 | | | |
| | | At 31st December 2006 | 156,703 | | | £15.22 | | | | 88,431 | | | $48.02 | | | | 8,173 | | | £11.11 | | | | | Options granted | 10,587 | | | £14.82 | | £3.07 | | 8,624 | | | $57.58 | | $10.93 | | 3,212 | | | £10.50 | | £2.87 | | | Options exercised | (9,863 | ) | | £12.10 | | | | (18,149 | ) | | $44.27 | | | | (1,140 | ) | | £9.74 | | | | | Options lapsed | (8,386 | ) | | £15.64 | | | | (1,632 | ) | | $50.90 | | | | (1,707 | ) | | £11.33 | | | |
| | | At 31st December 2007 | 149,041 | | | £15.38 | | | | 77,274 | | | $49.91 | | | | 8,538 | | | £11.02 | | | |
| | | Range of exercise prices | £10.76 | | – | £19.77 | | | | $37.09 | | – | $61.35 | | | | £9.52 | | – | £11.45 | | | |
| | | Weighted average remaining contractual life | | | 4.32 years | | | | | | 5.14 years | | | | | | 2.2 years | | | |
| | | | |
|
| GSK Annual Report 20062007 | 145 | 135 | |
<Back to Contents | | FINANCIAL STATEMENTS | | Notes to the financial statements | continued | |
| | | | | Notes to the financial statements | | continued | | |
4042 Employee share schemescontinued
In order to encourage employees to convert options, excluding savings-related share options, held over Glaxo Wellcome or SmithKline Beecham shares or ADSs, into those over GlaxoSmithKline shares or ADSs, a programme was established to give an additional cash benefit of 10% of the exercise price of the original option provided that the employee did not voluntarily leave the Group for two years from the date of the merger and did not exercise the option before the earlier of six months from the expiry date of the original option and two years from the date of the merger. The cash benefit will also be paid if the options expire unexercised if the market price is below the exercise price on the date of expiry. | Options outstanding | | Share option | | | Share option | | | Savings-related | | | | Share option | | | Share option | | | Savings-related | | | at 31st December 2006 | | schemes – shares | | | schemes – ADSs | | share option schemes | | | | at 31st December 2007 | | | | schemes - shares | | | schemes - ADSs | | | share option schemes | | | |
| |
| |
| | |
| |
| |
| | | | | Weighted | Latest | | | Weighted | Latest | | | Latest | | | | Weighted | | Latest | | | Weighted | | Latest | | | | | Latest | | | | Number | | exercise | | Number | | exercise | | Number | | Exercise | exercise | | Number | | exercise | | exercise | | Number | | exercise | | exercise | | Number | | Exercise | | exercise | | | Year of grant | 000 | | price | date | | 000 | | price | date | | 000 | | price | date | | 000 | | price | | date | | 000 | | price | | date | | 000 | | price | | date | |
|
| |
| | | 1997 | 4,379 | £ | 11.85 | 13.11.07 | | 2,130 | $ | 40.20 | 13.11.07 | | – | | – | | | | 1998 | 14,286 | £ | 16.91 | 23.11.08 | | 5,132 | $ | 54.29 | 23.11.08 | | – | | – | | 13,609 | | £16.91 | | 23.11.08 | | 4,137 | | $54.42 | | 23.11.08 | | – | | – | | – | | | 1999 | 15,225 | £ | 18.20 | 01.12.09 | | 6,966 | $ | 60.15 | 24.11.09 | | – | | – | | 14,477 | | £18.19 | | 01.12.09 | | 6,695 | | $60.18 | | 24.11.09 | | – | | – | | – | | | 2000 | 14,649 | £ | 14.90 | 11.09.10 | | 326 | $ | 58.88 | 09.08.10 | | – | | – | | 14,012 | | £14.90 | | 11.09.10 | | 310 | | $58.88 | | 09.08.10 | | – | | – | | – | | | 2001 | 42,824 | £ | 18.12 | 29.11.11 | | 27,450 | $ | 51.84 | 28.11.11 | | – | | – | | 39,870 | | £18.12 | | 28.11.11 | | 23,532 | | $51.84 | | 28.11.11 | | – | | – | | – | | | 2002 | 19,302 | £ | 11.95 | 03.12.12 | | 9,838 | $ | 37.60 | 03.12.12 | | – | | – | | 16,817 | | £11.96 | | 03.12.12 | | 6,712 | | $37.64 | | 03.12.12 | | – | | – | | – | | | 2003 | 27,318 | £ | 12.67 | 14.12.13 | | 19,396 | $ | 43.55 | 14.12.13 | | 179 | £ | 10.20 | 31.05.07 | | 22,151 | | £12.67 | | 15.12.13 | | 11,877 | | $43.54 | | 15.12.13 | | – | | – | | – | | | 2004 | 8,922 | £ | 11.23 | 02.12.14 | | 8,919 | $ | 43.05 | 02.12.14 | | 1,268 | £ | 9.52 | 31.05.08 | | 8,273 | | £11.23 | | 03.12.14 | | 7,664 | | $43.19 | | 02.12.14 | | 307 | | £9.52 | | 31.05.08 | | | 2005 | 206 | £ | 13.08 | 01.11.15 | | 464 | $ | 47.33 | 31.10.15 | | 4,663 | £ | 11.45 | 31.05.09 | | 195 | | £13.06 | | 01.11.15 | | 439 | | $47.33 | | 01.11.15 | | 3,689 | | £11.45 | | 31.05.09 | | | 2006 | 9,592 | £ | 14.69 | 28.11.16 | | 7,810 | $ | 51.34 | 28.07.16 | | 2,063 | £ | 11.40 | 31.05.10 | | 9,245 | | £14.69 | | 28.11.16 | | 7,445 | | $51.29 | | 28.07.16 | | 1,373 | | £11.40 | | 31.05.10 | | | 2007 | | 10,392 | | £14.81 | | 25.07.17 | | 8,463 | | $57.58 | | 25.07.17 | | 3,169 | | £10.50 | | 31.05.11 | |
|
| |
| | | Total | 156,703 | £ | 15.22 | | 88,431 | $ | 48.02 | | 8,173 | £ | 11.11 | | 149,041 | | £15.38 | | | | 77,274 | | $49.91 | | | | 8,538 | | £11.02 | | | |
|
| |
| |
All of the above options are exercisable, except all options over shares and ADSs granted in 2004, 2005, 2006 and 20062007 and the savings-related share options granted in 2004, 2005, 2006 and 2006. The total number of non-vested options at 31st December 2006 was 26,713,865 share options and 17,192,398 ADS options (2005 – 45,645,311 share options and 31,326,848 ADS options). These options had a weighted average grant date fair value of £3.53 for share options, $11.59 for ADS options and £3.41 for savings-related share options (2005 – £2.95, $2.72 and £3.68 respectively).2007. There has been no change in the effective exercise price of any outstanding options during the year. | Options exercisable | | | | | Share option | | | | | | Share option | | | | | | Savings-related | | | | | schemes – shares | | | | schemes – ADSs | | share option schemes | | | |
|
|
|
|
| |
|
|
|
|
| |
|
|
|
|
| | | | | | Weighted | | Weighted | | | | Weighted | | Weighted | | | | Weighted | | Weighted | | | | Number | | exercise | | fair | | Number | | exercise | | fair | | Number | | exercise | | fair | | | | 000 | | price | | value | | 000 | | price | | value | | 000 | | price | | value | |
|
|
|
|
|
|
|
|
|
|
|
|
|
|
|
|
|
| | | At 31st December 2004 | 126,917 | £ | 16.49 | | | | 57,421 | $ | 51.75 | | | | 270 | £ | 14.12 | | | | | At 31st December 2005 | 128,316 | £ | 15.77 | | | | 64,265 | $ | 48.56 | | | | 1,429 | £ | 9.16 | | | | | At 31st December 2006 | 137,983 | £ | 15.51 | | | | 71,238 | $ | 48.32 | | | | 179 | £ | 10.20 | | | |
|
|
|
|
|
|
|
|
|
|
|
|
|
|
|
|
|
| | | Weighted average remaining | | | 4.4 years | | | | | | 4.9 years | | | | | | 0.3 years | | | | | contractual life | | | | | | | | | | | | | | | | | | |
|
|
|
|
|
|
|
|
|
|
|
|
|
|
|
|
|
| | | Options vested during the year | 24,991 | | | £ | 3.27 | | 18,103 | | | $ | 12.35 | | 789 | | | £ | 4.15 | |
|
|
|
|
|
|
|
|
|
|
|
|
|
|
|
|
|
| |
The aggregate intrinsic value of options exercisable at 31st December 2006 was £251 million. The total fair value of options vesting during the year was £206 million (2005 – £250 million; 2004 – £630 million).
| Options exercisable | Share option | | Share option | | Savings-related | | | at 31st December 2007 | schemes - shares | schemes - ADSs | | share option schemes | | | |
| |
| |
| | | | | | Weighted | | | | Weighted | | | | Weighted | | | | Number | | exercise | | Number | | exercise | | Number | | exercise | | | | 000 | | price | | 000 | | price | | 000 | | price | |
| | | At 31st December 2005 | 128,316 | | £15.77 | | 64,265 | | $48.56 | | 1,429 | | £9.16 | | | At 31st December 2006 | 137,983 | | £15.51 | | 71,238 | | $48.32 | | 179 | | £10.20 | | | At 31st December 2007 | 129,209 | | £15.47 | | 60,927 | | $48.70 | | 307 | | £9.52 | |
| | | | |
| 146 |
| GSK Annual Report 20062007 | 136 | |
<
Back to Contents | | | Notes to the financial statements | | | | | | | | Notes to the financial statements | | continued |
| | |
4042 Employee share schemescontinued
GlaxoSmithKline share award schemes
Performance Share Plan
The Group operates a Performance Share Plan whereby awards are granted to Directors and senior executives at no cost. The percentage of each award that vests is based upon the performance of the Group over a three year measurement period. The performance conditions consist of two parts, each of which applies to 50% of the award. For awards granted in 2003, the first part of the condition compares GlaxoSmithKline’sGSK’s Total Shareholder Return (TSR) over the period with the TSR of companies in the UK FTSE 100 Index over the same period. For awards granted in 2004, and subsequent years, the first part of the condition compares GlaxoSmithKline’sGSK’s TSR over the period with the TSR of 13 pharmaceutical companies in the comparator group over the same period. TheFor all awards, the second part of the performance condition compares GlaxoSmithKline’sGSK’s earnings per share growth to the increase in the UK Retail Prices Index over the three year performance period. Awards granted to Directors and members of the CET from 15th December 2003 are subject to a single performance condition which compares GlaxoSmithKline’sGSK’s TSR over the period with the TSR of companies in the comparator group over the same period. | Number of shares and ADSs issuable | Shares | | Weighted | | ADSs | | Weighted | | | | Shares | | Weighted | | ADSs | | Weighted | | | Number of shares and ADSs issuable | Number (000) | | fair value | | Number (000) | | fair value | | Number (000) | | fair value | | Number (000) | | fair value | |
| |
| | | At 1st January 2004 | 3,500 | | | | | 2,479 | | | | | | | Awards granted | 1,778 | | £ | 7.25 | | 1,339 | | $ | 23.89 | | | | Awards exercised | (409 | ) | | | | (187 | ) | | | | | Awards cancelled | (520 | ) | | | | (276 | ) | | | |
| | | | At 31st December 2004 | 4,349 | | | | | 3,355 | | | | | | At 1st January 2005 | | 4,349 | | | | 3,355 | | | | | Awards granted | 130 | | £ | 9.02 | | 88 | | $ | 32.34 | | 130 | | £9.02 | | 88 | | $32.34 | | | Awards exercised | (375 | ) | | | | (199 | ) | | | (375 | ) | | | (199 | ) | | | | Awards cancelled | (477 | ) | | | | (237 | ) | | | (477 | ) | | | (237 | ) | | |
|
| |
| | | At 31st December 2005 | 3,627 | | | | | 3,007 | | | | 3,627 | | | 3,007 | | | | Awards granted | 2,068 | | £ | 10.06 | | 1,452 | | $ | 35.13 | | 2,068 | | £10.06 | | 1,452 | | $35.13 | | | Awards exercised | (438 | ) | | | | (187 | ) | | | (438 | ) | | | (187 | ) | | | | Awards cancelled | (501 | ) | | | | (238 | ) | | | (501 | ) | | | (238 | ) | | |
|
| |
| | | At 31st December 2006 | 4,756 | | | | | 4,034 | | | | 4,756 | | | 4,034 | | | | Awards granted | | 2,071 | | £10.26 | | 1,501 | | $34.87 | | | Awards exercised | | (147 | ) | | | (77 | ) | | | | Awards cancelled | | (949 | ) | | | (1,131 | ) | | |
|
| |
| | | At 31st December 2007 | | 5,731 | | | 4,327 | | |
| |
| |
Share Value Plan
The Group operates a Share Value Plan whereby awards are granted, in the form of shares, to certain employees at no cost. The awards vest after three years. There are no performance criteria attached. | Number of shares and ADSs issuable | Shares | | Weighted | | ADSs | | Weighted | | | | Shares | | Weighted | | ADSs | | Weighted | | | Number of shares and ADSs issuable | Number (000) | | fair value | | Number (000) | | fair value | | Number (000) | | fair value | | Number (000) | | fair value | |
| |
|
| | | At 1st January 2004 | – | | | | | – | | | | | | | Awards granted | 4,419 | | £ | 10.07 | | 3,562 | | $ | 38.14 | | |
| | | | At 31st December 2004 | 4,419 | | | | | 3,562 | | | | | | At 1st January 2005 | | 4,419 | | | | 3,562 | | | | | Awards granted | 403 | | £ | 12.00 | | 511 | | $ | 44.39 | | 403 | | £12.00 | | 511 | | $44.39 | | | Awards exercised | (138 | ) | | | | (143 | ) | | | (138 | ) | | | (143 | ) | | | | Awards cancelled | (170 | ) | | | | (81 | ) | | | (170 | ) | | | (81 | ) | | |
|
| |
|
| | | At 31st December 2005 | 4,514 | | | | | 3,849 | | | | 4,514 | | | 3,849 | | | | Awards granted | 4,759 | | £ | 13.45 | | 4,126 | | $ | 52.53 | | 4,759 | | £13.45 | | 4,126 | | $52.53 | | | Awards exercised | (131 | ) | | | | (66 | ) | | | (131 | ) | | | (66 | ) | | | | Awards cancelled | (348 | ) | | | | (280 | ) | | | (348 | ) | | | (280 | ) | | |
|
| |
|
| | | At 31st December 2006 | 8,794 | | | | | 7,629 | | | | 8,794 | | | 7,629 | | | | Awards granted | | 5,155 | | £13.22 | | 4,231 | | $52.08 | | | Awards exercised | | (3,643 | ) | | | (3,038 | ) | | | | Awards cancelled | | (672 | ) | | | (539 | ) | | |
|
| |
|
| | | At 31st December 2007 | | 9,634 | | | 8,283 | | |
| |
|
| | | | | | |
|
| GSK Annual Report 20062007 | 147 | 137 | |
<Back to Contents | | FINANCIAL STATEMENTS | | Notes to the financial statements | continued | |
| | | | Notes to the financial statements | | continued | | |
4042 Employee share schemescontinued
Employee Share Ownership Plan Trusts
The Group sponsors Employee Share Ownership Plan (ESOP) Trusts to acquire and hold shares in GlaxoSmithKline plc to satisfy awards made under employee incentive plans and options granted under employee share option schemes. The trustees of the ESOP Trusts purchase shares on the open market with finance provided by the Group by way of loans or contributions. Costs of running the ESOP Trusts are charged to the income statement. Shares held by the ESOP Trusts are deducted from other reserves and held at the value of proceeds receivable from employees on exercise. If there is deemed to be a permanent diminution in value this is reflected by a transfer to retained earnings. The Trusts also acquire and hold shares to meet notional dividends re-invested on deferred awards under the SmithKline Beecham Mid-Term Incentive Plan. The trustees have waived their rights to dividends on the shares held by the ESOP Trusts. | Shares held for share award schemes | 2006 | | 2005 | | 2007 | | 2006 | |
|
| |
|
| | | Number of shares (‘000) | 37,508 | | 22,169 | | 45,247 | | 37,508 | | | | | | | | £m | | £m | | £m | | £m | |
|
| |
|
| | | Nominal value | 9 | | 6 | | 11 | | 9 | | | Carrying value | 196 | | 116 | | 242 | | 196 | | | Market value | 504 | | 326 | | 579 | | 504 | |
| |
|
| |
|
| | | | Shares held for share option schemes | 2006 | | 2005 | | 2007 | | 2006 | |
|
| |
|
| | | Number of shares (‘000) | 115,943 | | 145,267 | | 89,283 | | 115,943 | | | | | | | | £m | | £m | | £m | | £m | |
|
| |
|
| | | Nominal value | 29 | | 36 | | 22 | | 29 | | | Carrying value | 1,803 | | 2,197 | | 1,375 | | 1,803 | | | Market value | 1,558 | | 2,134 | | 1,142 | | 1,558 | |
|
| |
|
| | | | | | |
| 148 |
| GSK Annual Report 20062007 | 138 | |
Back to Contents | | | Notes to the financial statements | continued |
| | |
41 Reconciliation to US accounting principles
The analyses and reconciliations presented in this Note represent the financial information prepared on the basis of US Generally Accepted Accounting Principles (US GAAP) rather than IFRS.
Summary of material differences between IFRS and US GAAP
Acquisition of SmithKline Beecham
The Group has exercised the exemption available under IFRS 1 ‘First-time Adoption of IFRS’ not to restate business combinations prior to the date of transition of the Group’s reporting GAAP from UK Generally Accepted Accounting Principles (UK GAAP) to IFRS. Therefore the combination in 2000 of Glaxo Wellcome plc and SmithKline Beecham plc continues to be accounted for as a merger (pooling of interests) in accordance with UK GAAP at that time. Under US GAAP, this business combination did not qualify for pooling of interests accounting and Glaxo Wellcome was deemed to be the accounting acquirer in a purchase business combination.
Accordingly the net assets of SmithKline Beecham were recognised at fair value as at the date of acquisition. As a result of the fair value exercise, increases in the values of SmithKline Beecham’s inventory, property, plant and equipment, intangible assets, investments and pension obligations were recognised and fair market values attributed to its internally-generated intangible assets, mainly product rights (inclusive of patents and trademarks) and in-process research and development, together with appropriate deferred taxation effects. The difference between the cost of acquisition and the fair value of the assets and liabilities of SmithKline Beecham is recorded as goodwill.
Capitalised interest
Under IFRS, the Group does not capitalise interest. US GAAP requires interest incurred as part of the cost of constructing a fixed asset to be capitalised and amortised over the life of the asset.
Goodwill
The Group has exercised the exemption available under IFRS 1 not to restate business combinations prior to the date of transition of the Group’s reporting GAAP from UK GAAP to IFRS. Under UK GAAP, goodwill arising on acquisitions before 1998 accounted for under the purchase method was eliminated against equity, and under IFRS, on future disposal or closure of a business, any goodwill previously taken directly to equity under a former GAAP will not be charged against income. Under UK GAAP, goodwill arising on acquisitions from 1998 was capitalised and amortised over a period not exceeding 20 years. On the date of the Group’s transition to IFRS, 1st January 2003, amortisation ceased in accordance with IFRS 3 ‘Business combinations’. The Group must instead identify and value its reporting units for the purpose of assessing, at least annually, potential impairment of goodwill allocated to each reporting unit. As permitted by the business combinations exemption available under IFRS 1, amortisation arising prior to 2003 was not reversed.
Under US GAAP, goodwill arising on acquisitions prior to 30th June 2001 was capitalised and amortised over a period not exceeding 40 years. In July 2001, the Financial Accounting Standards Board (FASB) issued Statement of Financial Accounting Standard (SFAS) 142, ‘Goodwill and Other Intangible Assets’. Like IFRS 3, SFAS 142 requires that goodwill must not be amortised and that annual impairment tests of goodwill must be undertaken. The implementation of SFAS 142 in 2002, a year earlier than the Group’s transition to IFRS, results in goodwill balances acquired between 1998 and 2003 reflecting one year less of amortisation under US GAAP than under IFRS.
Under IFRS, costs to be incurred in integrating and restructuring the Wellcome, SmithKline Beecham and Block Drug businesses following the acquisitions in 1995, 2000 and 2001 respectively were charged to the income statement post acquisition. Similarly, integration and restructuring costs arising in respect of the acquisitions of CNS in 2006 and Corixa and ID Biomedical in 2005 have been charged to the income statement under IFRS. Under US GAAP, certain of these costs are considered in the allocation of purchase consideration thereby affecting the goodwill arising on acquisition.
In-process research & development (IPR&D)
Under IFRS, IPR&D projects acquired in a business combination are capitalised and remain on the balance sheet, subject to any impairment write-downs. Amortisation is charged over the assets’ estimated useful lives from the point when the assets became available for use. Under US GAAP, such assets are recognised in the opening balance sheet but are then written off immediately to the income statement, as the technological feasibility of the IPR&D has not yet been established and it has no alternative future use. Under IFRS, deferred tax is provided for IPR&D assets acquired in a business combination. US GAAP does not provide for deferred tax on these assets, resulting in a reconciling adjustment to deferred tax and goodwill.
IPR&D acquired in transactions other than business combinations is discussed under Intangible assets below.
Intangible assets
Under IFRS, certain intangible assets related to specific compounds or products which are purchased from a third party and are developed for commercial applications are capitalised but not subject to amortisation until regulatory approval is obtained. Under US GAAP, payments made in respect of these compounds or products which are still in development and have not yet received regulatory approval are charged directly to the income statement.
Under IFRS, intangible assets are amortised over their estimated useful economic life except in the case of certain acquired brands where the end of the useful economic life of the brand cannot be foreseen. Under US GAAP, until the implementation of SFAS 142 ‘Goodwill and Other Intangible Assets’ in 2002, all intangible assets, including brands, were amortised over a finite life. On implementation of SFAS 142 in 2002, intangible assets deemed to have indefinite lives were no longer amortised. As a result of the difference in accounting treatment prior to the implementation of SFAS 142, the carrying values of indefinite lived brands are affected by amortisation charged before 2002 under US GAAP.
|
| GSK Annual Report 2006 | 139 |
<Back to Contents
| Notes to the financial statements | continued |
| |
41 Reconciliation to US accounting principlescontinued
Restructuring costs
Under IFRS, restructuring costs incurred following acquisitions are charged to the profit and loss account post acquisition. For US GAAP purposes, certain of these costs are recognised as liabilities upon acquisition in the opening balance sheet.
Other restructuring costs are recorded as a provision under IFRS when a restructuring plan has been announced. Under US GAAP, a provision may only be recognised when further criteria are met or the liability is incurred. Therefore adjustments have been made to eliminate provisions for restructuring costs that do not meet US GAAP requirements.
Marketable securities
Marketable securities consist primarily of equity securities and certain other liquid investments, principally government bonds and short-term corporate debt instruments. Under SFAS 115 ‘Accounting for Certain Investments in Debt and Equity Securities’, these securities are considered available for sale and are carried at fair value, with the unrealised gains and losses, net of tax, recorded as a separate component of shareholders’ equity. Under IFRS, these are accounted for as available-for-sale financial assets in accordance with IAS 39 ‘Financial Instruments : Recognition and Measurement’.
The accounting treatment for marketable securities under US GAAP and IFRS is similar. However, differences do arise, principally as a result of the category of marketable securities as defined by SFAS 115 being smaller than the category of available-for-sale financial assets as defined by IAS 39. Investments which are not marketable securities under the SFAS 115 definition are accounted for at cost less impairments under US GAAP rather than at fair value.
The Group did not adopt IAS 39 until 1st January 2005, and, in accordance with the exemption available under IFRS 1, has presented financial instruments in the comparative periods in accordance with UK GAAP. Therefore in 2004 these securities are stated at the lower of cost and net realisable value.
Marketable securities are reviewed at least every quarter for other than temporary impairment. For equity securities, the factors considered include:
• | the investee’s current financial performance and future prospects | • | the general market condition of the geographic or industry area in which the investee operates | • | the duration and extent to which the market value has been below cost. |
Gross unrealised gains and losses on marketable securities were £142 million and less than £1 million, respectively, at 31st December 2006 (2005 – £36 million and £4 million, respectively). The fair value of marketable securities with unrealised losses at 31st December 2006 is £3 million (2005 – £62 million). All of these marketable securities have been in a continuous loss position for less than 12 months. Deferred tax provided against unrealised gains and losses at 31st December 2006 was £21 million (2005 – £4 million). Gains of £8 million were reclassified out of accumulated other comprehensive income into the income statement on disposals of equity investments during the year (2005 – £7 million gain).
The proceeds from sale of marketable securities under US GAAP were £19,013 million in the year ended 31st December 2006 (2005 –£19,416 million). The proceeds include the roll-over of liquid funds on short-term deposit. The gross gains and losses reflected in the consolidated income statement in respect of marketable securities were £11 million and £nil, respectively (2005 – £7 million and £nil).
Pensions and other post-retirement benefits
The key difference between IFRS and US GAAP is the method of recognition of actuarial gains and losses. GSK has opted under IFRS to recognise actuarial gains and losses in the statement of recognised income and expense in the year in which they arise. Under US GAAP actuarial gains and losses are recognised using the 10% corridor approach and deferred actuarial gains and losses are amortised.
Stock-based compensation
Under IFRS 2 ‘Share-based Payment’, share options are fair valued at their grant dates and the cost is charged to the income statement over the relevant vesting periods. Under US GAAP, the Group applies SFAS 123R ‘Share-Based Payment’ and related accounting interpretations in accounting for its option plans, which also require options to be fair valued at their grant date and charged to the income statement over the vesting period of the options. Minor differences arise as a result of the differing definitions of grant date for certain share-based payments and in the accounting treatment of share options with certain conditions linked to inflation, which are classified as liabilities under SFAS 123R.
Derivative instruments
SFAS 133, ‘Accounting for Derivative Instruments and Hedging Activities’, as amended by SFAS 137 and SFAS 138 and as interpreted by the Derivatives Implementation Group, was adopted by the Group with effect from 1st January 2001. SFAS 133 establishes accounting and reporting standards for derivative instruments, including certain derivative instruments embedded in other contracts (collectively, referred to as derivatives) and for hedging activities. SFAS 133 requires that an entity recognise all derivatives as either assets or liabilities in the consolidated balance sheet and measure those instruments at fair value. Changes in fair value over the period are recorded in current earnings unless hedge accounting is obtained. SFAS 133 prescribes requirements for designation and documentation of hedging relationships and ongoing assessments of effectiveness in order to qualify for hedge accounting.
The Group also evaluates contracts for ‘embedded’ derivatives. In accordance with SFAS 133 requirements, if embedded derivatives are not clearly and closely related to the host contract, they are accounted for separately from the host contract as derivatives.
The key differences between IFRS under which the Group’s financial statements are prepared and US GAAP, and in the Group’s application of their respective requirements, are:
certain derivatives which are designated by the Group as hedging instruments under IAS 39 are not designated as hedging instruments under SFAS 133. Accordingly, hedge accounting is not applied under US GAAP in respect of these arrangements
|
| GSK Annual Report 2006 | 140 |
<Back to Contents
| Notes to the financial statements | continued |
| |
41 Reconciliation to US accounting principlescontinued
• | the definition of derivatives within the scope of SFAS 133 excludes instruments for which there is no liquid market. This leads to certain items not being recognised on the balance sheet, although they are accounted for as derivatives under IFRS, most notably the call option over Theravance shares | | | | • | IAS 39 has an exemption from the requirement to recognise embedded foreign currency derivatives where the currency is commonly used in the economic environment of the host contract. SFAS 133 does not grant a similar exemption and so the Group identifies and separately accounts for more embedded derivatives under US GAAP than it does under IFRS. |
In 2005 the Group exercised the exemption available under IFRS 1 to present financial instruments in the comparative periods in accordance with UK GAAP. Under UK GAAP, some derivative instruments used for hedges were not recognised on the balance sheet and the matching principle was used to match the gain or loss under these hedging contracts to the foreign currency transaction or profits to which they related. Gains and losses related to the fair value adjustments on these derivative instruments are therefore reconciling items in the 2004 comparative period presented in the reconciliation of profit. In 2006 and 2005, the Group did not designate any of its derivatives as qualifying hedge instruments under SFAS 133.
Hedging arrangements under US GAAP
As at 31st December 2006, the Group applied $500 million of borrowings (2005 – $1 billion) to hedge the foreign currency exposures of the Group’s net investment in certain foreign operations. These borrowings are designated as hedges of net investments. The effective portion of foreign exchange gains or losses on these hedges is recorded as part of the foreign currency translation component of other comprehensive income. In 2006, £32 million of after tax gains (2005 – £42 million of after tax losses) were recorded in other comprehensive income.
Valuation of derivative instruments
The fair value of derivative instruments is sensitive to movements in the underlying market rates and variables. The Group monitors the fair value of derivative instruments on at least a quarterly basis. Derivatives, including interest rate swaps and cross-currency swaps, are valued using standard valuation models, counterparty valuations, or third party valuations. Standard valuation models used by the Group consider relevant discount rates, the market yield curve on the valuation date, forward currency exchange rates and counterparty risk. All significant rates and variables are obtained from market sources. All valuations are based on the remaining term to maturity of the instrument.
Foreign exchange contracts are valued using forward rates observed from quoted prices in the relevant markets when possible. The Group assumes parties to long-term contracts are economically viable but reserves the right to exercise early termination rights if economically beneficial when such rights exist in the contract.
Dividends
Under IFRS, GSK plc’s quarterly dividends are recognised only on payment. Under US GAAP, the dividends are recognised in the financial statements when they are declared.
Other
The following adjustments are also included in the reconciliations:
• | computer software – under IFRS, the Group capitalises costs incurred in acquiring and developing computer software for internal use where the software supports a significant business system and the expenditure leads to the creation of a durable asset. For US GAAP, the Group applies SOP 98-1, ‘Accounting for the Costs of Computer Software Developed or Obtained for Internal Use’, which restricts the categories of costs which can be capitalised. | | | | • | variable interest entities – under the FASB’s Interpretation No. 46 Revised (FIN 46R), ‘Consolidation of Variable Interest Entities’, certain entities, known as Variable Interest Entities (VIEs), must be consolidated by the ‘primary beneficiary’ of the entity. The primary beneficiary is generally defined as having the majority of the risks and rewards arising from the VIE. Additionally, for VIEs in which a significant, but not majority, variable interest is held, certain disclosures are required. The Group regularly reviews potential VIEs and, as a consequence, consolidated Theravance Inc. between May 2004 and February 2006 (see Note (c) on page 147). No other VIEs of which the Group is the primary beneficiary have been identified. | | | • | fixed asset and inventory impairments – reversals of impairments previously recorded against the carrying value of assets are permitted under IFRS in certain circumstances. US GAAP does not permit reversals of these impairments. | | | • | various other small adjustments. |
Consolidated summary statement of cash flows
The US GAAP cash flow statement reports three categories of cash flows: operating activities (including tax and interest); investing activities (including capital expenditure, acquisitions and disposals together with cash flows from available-for-sale current asset investments); and financing activities (including dividends paid). A summary statement of cash flows is presented on page 144.
Comprehensive income statement
The requirement of SFAS 130, ‘Reporting comprehensive income’, to provide a comprehensive income statement is met under IFRS by the Statement of recognised income and expense (page 89).
Recent pronouncements
Share-based payment
On 1st January 2006, the Group adopted SFAS 123R, ‘Share-Based Payment’ using the modified prospective application method. Prior to this, GSK applied the fair value provisions of SFAS 123, ‘Accounting for Stock-Based Compensation’ in accounting for employee share-based compensation awards. The adoption of SFAS 123R had the following impact on the Group’s consolidated financial statements:
Under SFAS 123, the Group had elected to account for the forfeiture of non-vested stock options as incurred. As a result of adopting SFAS 123R, the Group is now required to estimate total forfeitures at the grant date, and revise its estimate throughout the vesting period. The impact of estimating the level of option forfeitures in advance of actual occurrence reduces the cumulative compensation cost recognised in respect of options outstanding at the date of adoption of SFAS 123R of 1st January 2006 by £19 million (£12 million net of tax). This has been recognised as a cumulative effect of a change in accounting principle.
|
| GSK Annual Report 2006 | 141 |
<Back to Contents
| | Notes to the financial statements | | continued |
| |
41 Reconciliation to US accounting principlescontinued
• | Under SFAS 123R share options whose vesting is indexed to a factor that is not a market, performance or service condition are classified as liabilities on the balance sheet and remeasured to fair value at each reporting date. Accordingly, share options granted by GSK with a condition linked to inflation are accounted for as liabilities under US GAAP. Under IFRS, these options are accounted for as equity-settled share-based payments, so their fair value is measured at grant date only and this is recognised over the vesting period in shareholders’ funds. The impact of accounting for options outstanding at 1st January 2006 on the revised US GAAP basis increases the cumulative compensation cost recognised by £3 million (£2 million net of tax). This has been recognised as a cumulative effect of a change in accounting principle. | | | • | Under SFAS 123, the Group allocated share option compensation expense based on the nominal vesting period, rather than the expected time to achieve retirement eligibility. SFAS 123R specifies that a share-based award is considered vested for expense attribution purposes when the employee’s retention of the award is no longer contingent upon providing subsequent service. Accordingly, the Group has prospectively revised its expense attribution method so that the related compensation cost is recognised over the period from the grant date to the date retirement eligibility is achieved, if less than the stated vesting period. The impact of this change was not significant. |
For the year ended 31st December 2006, compensation expense for all types of share-based payment arrangements and the related income tax benefit recognised was £252 million and £26 million, respectively. Had the Group continued to account for compensation expense under the fair value provisions of SFAS 123, the compensation expense would not have been materially different from the SFAS 123R expense for the year.
At 31st December 2006, GSK had approximately £288 million of total unrecognised compensation cost related to non-vested share-based compensation arrangements granted under the plans, of which £135 million relates to share option schemes. The total cost is expected to be recognised over a weighted-average period of 1.9 years, and 1.8 years for share option schemes.
The tax benefit realised from share options exercised during 2006 was £54 million.
Pensions and other post retirement benefits
In September 2006, the FASB issued SFAS 158, ‘Employers’ Accounting for Defined Benefit Pension and Other Post-retirement Plans’. SFAS 158 requires GSK to (i) recognise the overfunded or underfunded status of a defined benefit plan (other than a multi-employer plan) as an asset or liability with changes in that funded status recognised through comprehensive income; (ii) measure the funded status of a plan as of the year-end date; and (iii) provide additional disclosures.
The Group adopted SFAS 158 in 2006 and has initially recognised the funded status of the defined benefit post-retirement plan and provided the required disclosures at 31st December 2006. Retrospective application was not permitted, therefore in 2005 and 2004 actuarial gains and losses were recognised using the 10% corridor approach and deferred actuarial gains and losses were amortised.
The impact of the adoption of SFAS 158 on the Group’s consolidated financial statements is disclosed in note (f) within this Note.
Accounting for uncertain tax positions
In July 2006, the FASB issued FIN 48, ‘Accounting for Uncertain Tax Positions’. FIN 48 clarifies the accounting for uncertainty in income taxes recognised in an enterprise’s financial statements under US GAAP, in accordance with SFAS 109, ‘Accounting for Income Taxes’. The interpretation prescribes a recognition threshold and measurement attribute for the financial statement recognition and measurement of a tax position taken or expected to be taken in a tax return. FIN 48 also provides guidance on derecognition, classification, interest and penalties, disclosure and transition. The Group is currently evaluating the potential impacts of FIN 48 on its US GAAP financial statements. For the Group, the interpretation will be effective from 1st January 2007.
Other Pronouncements
• | SFAS 157 – In September 2006, the FASB issued SFAS 157, ‘Fair Value Measurements’. This Statement defines fair value, establishes a framework for measuring fair value in US GAAP, and expands disclosures about fair value measurements. The Statement refers to other accounting pronouncements that require or permit fair value measurements, the FASB having previously concluded in those accounting pronouncements that fair value is the relevant measurement attribute. This Statement does not require any new fair value measurements. For the Group, the Statement will be effective on 1st January 2008. | | | • | SFAS 159 – In February 2007, the FASB issued SFAS 159, ‘The Fair Value Option for Financial Assets and Financial Liabilities’. This Statement permits entities to choose to elect, at specified election dates, to measure eligible financial instruments at fair value. Unrealised gains and losses on items for which the fair value option has been elected would be reported in net income at each subsequent reporting date, and upfront costs and fees related to those items would be recognised in net income as incurred and not deferred. The Group is unlikely to elect to exercise the Fair Value Option. | | | • | SAB 108 – In September 2006, the SEC staff issued Staff Accounting Bulletin No. 108. SAB 108 establishes a dual approach for qualifying financial statement errors, requiring evaluation of errors under both the iron curtain and the roll-over methods. The guidance applies to the Group’s US GAAP financial information for 2006 and accordingly has been adopted by the Group. SAB 108 has had no impact on the US GAAP financial information presented in this Note. |
|
| GSK Annual Report 2006 | 142 |
<Back to Contents
| Notes to the financial statements | continued |
|
41 Reconciliation to US accounting principlescontinued
The following is a summary of the material adjustments to profit and shareholders’ funds which would be required if US GAAP had been applied instead of IFRS.
| Profit | | | 2006 | | 2005 | | 2004 | | | Notes | | £m | | £m | | £m | |
|
|
|
|
|
|
|
| | | Profit after taxation for the year under IFRS | | | 5,498 | | 4,816 | | 4,022 | | | Profit attributable to minority interests | | | (109 | ) | (127 | ) | (114 | ) |
|
|
|
|
|
|
|
| | | Profit attributable to shareholders under IFRS | | | 5,389 | | 4,689 | | 3,908 | | | US GAAP adjustments: | | | | | | | | | | Goodwill impairment | | | 10 | | – | | – | | | Amortisation and impairment of intangible assets | b | | (1,276 | ) | (1,584 | ) | (1,441 | ) | | Acquisition and disposal of product rights | b | | (111 | ) | (72 | ) | (210 | ) | | Write-off of in-process R&D acquired in business combinations | b | | (14 | ) | (26 | ) | – | | | Depreciation and impairment of other assets | | | (93 | ) | (40 | ) | (2 | ) | | Capitalised interest | | | 4 | | (1 | ) | (17 | ) | | Disposal of interests in associates and subsidiaries | | | – | | – | | (97 | ) | | Investments | | | (10 | ) | (2 | ) | (30 | ) | | Pensions and post-retirement benefits | f | | (171 | ) | (127 | ) | (126 | ) | | Stock-based compensation | | | (26 | ) | 6 | | 13 | | | Derivative instruments and hedging | | | 477 | | (30 | ) | 33 | | | Fair value of put option granted to minority shareholders | c | | – | | – | | 17 | | | Restructuring costs | | | (16 | ) | 1 | | (12 | ) | | Tax benefits on exercise of stock options | d | | 16 | | (47 | ) | (10 | ) | | Deferred taxation | d | | 276 | | 585 | | 757 | | | Other | | | – | | (16 | ) | (51 | ) |
|
|
|
|
|
|
|
| | | Net income under US GAAP before cumulative effect of change in accounting principle | | | 4,455 | | 3,336 | | 2,732 | | | Cumulative effect of change in accounting principle | | | 10 | | – | | – | |
|
|
|
|
|
|
|
| | | Net income under US GAAP | | | 4,465 | | 3,336 | | 2,732 | |
|
|
|
|
|
|
|
| | | | | | | | | | | |
| Earnings per share under US GAAP | 2006 | | 2005 | | 2004 | | | p | | p | | p | |
|
|
|
|
|
| | | Basic net income per share before cumulative effect of change in accounting principle | 78.9 | | 58.8 | | 47.6 | | | Cumulative effect of change in accounting principle per share | 0.2 | | – | | – | |
|
|
|
|
|
| | | Basic net income per share after cumulative effect of change in accounting principle | 79.1 | | 58.8 | | 47.6 | |
|
|
|
|
|
| | | Diluted net income per share before cumulative effect of change in accounting principle | 78.2 | | 58.3 | | 47.5 | | | Cumulative effect of change in accounting principle per share | 0.2 | | – | | – | |
|
|
|
|
|
| | | Diluted net income per share after cumulative effect of change in accounting principle | 78.4 | | 58.3 | | 47.5 | |
|
|
|
|
|
| | | | | | | | | |
| Earnings per ADS under US GAAP | 2006 | | 2005 | | 2004 | | | $ | | $ | | $ | |
|
|
|
|
|
| | | Basic net income per ADS before cumulative effect of change in accounting principle | 2.92 | | 2.14 | | 1.74 | | | Cumulative effect of change in accounting principle per ADS | 0.01 | | – | | – | |
|
|
|
|
|
| | | Basic net income per ADS after cumulative effect of change in accounting principle | 2.93 | | 2.14 | | 1.74 | |
|
|
|
|
|
| | | Diluted net income per ADS before cumulative effect of change in accounting principle | 2.89 | | 2.12 | | 1.74 | | | Cumulative effect of change in accounting principle per ADS | 0.01 | | – | | – | |
|
|
|
|
|
| | | Diluted net income per ADS after cumulative effect of change in accounting principle | 2.90 | | 2.12 | | 1.74 | |
|
|
|
|
|
| |
|
| GSK Annual Report 2006 | 143 |
<Back to Contents
| Notes to the financial statements | continued |
| |
41 Reconciliation to US accounting principlescontinued
| Equity shareholders’ funds | | | 2006 | | 2005 | | | | | Notes | £m | £m | |
|
|
|
|
|
| | | | | Total equity under IFRS | | | 9,648 | | 7,570 | | | | | Minority interests | | | (262 | ) | (259 | ) | | |
|
|
|
|
|
| | | | | Shareholders’ equity under IFRS | | | 9,386 | | 7,311 | | | | | US GAAP adjustments: | | | | | | | | | | Goodwill | a | | 17,949 | | 17,976 | | | | | Product rights | b | | 10,634 | | 12,065 | | | | | Pension intangible asset | f | | – | | 86 | | | | | Fixed assets | | | (35 | ) | 33 | | | | | Inventory impairment reversals | | | (54 | ) | (30 | ) | | | | Capitalised interest | | | 183 | | 179 | | | | | Investments | | | 500 | | 576 | | | | | Pensions and other post-retirement benefits | f | | 35 | | 1,163 | | | | | Restructuring costs | | | 39 | | 65 | | | | | Derivative instruments | | | (44 | ) | (33 | ) | | | | Dividends | | | (676 | ) | (568 | ) | | | | Deferred taxation | e | | (3,262 | ) | (4,531 | ) | | | | Other | | | (2 | ) | (10 | ) | | |
|
|
|
|
|
| | | | | Shareholders’ equity under US GAAP | | | 34,653 | | 34,282 | | | |
|
|
|
|
|
| | | |
| | | | | | | | | Consolidated statement of cash flows under US GAAP | 2006 | 2005 | 2004 | | £m | £m | £m |
|
|
|
|
|
| | | Net cash provided by operating activities | 4,163 | | 5,751 | | 4,618 | | | Net cash used in investing activities | (1,752 | ) | (1,843 | ) | (988 | ) | | Net cash used in financing activities | (4,345 | ) | (2,409 | ) | (3,038 | ) |
|
|
|
|
|
| | | Net increase in cash and cash equivalents | (1,934 | ) | 1,499 | | 592 | | | Exchange rate movements | (282 | ) | 237 | | (93 | ) | | Cash and cash equivalents at beginning of year | 4,221 | | 2,485 | | 1,986 | |
|
|
|
|
|
| | | Cash and cash equivalents at end of year | 2,005 | | 4,221 | | 2,485 | |
|
|
|
|
|
| |
|
| GSK Annual Report 2006 | 144 |
<Back to Contents
| Notes to the financial statements | continued |
| |
41 Reconciliation to US accounting principlescontinued
Notes to the Profit and Equity shareholders’ funds reconciliations
(a) Goodwill
The following tables set out the IFRS to US GAAP adjustments required to the IFRS balance sheet in respect of goodwill.
| Balance sheet | 2006 | | 2005 | | | | | £m | £m | |
|
|
|
| | | | | Goodwill under IFRS | 758 | | 696 | | | | | Goodwill under US GAAP | 18,707 | | 18,672 | | | |
|
|
|
| | | | | IFRS to US GAAP adjustments | 17,949 | | 17,976 | | | |
|
|
|
| | | |
Of the £18,707 million US GAAP goodwill balance at 31st December 2006 (2005 – £18,672 million), £15,875 million (2005 – £15,875 million) is in respect of the goodwill arising on the acquisition of SmithKline Beecham by Glaxo Wellcome in 2000.
The following table presents the changes in goodwill allocated to the Group’s reportable segments:
| | | | Consumer | | | | | Pharmaceuticals | Healthcare | Total | | £m | £m | £m |
|
|
|
|
|
| | | At 1st January 2005 | 15,672 | | 2,449 | | 18,121 | | | Additions | 528 | | – | | 528 | | | Disposals | (1 | ) | – | | (1 | ) | | Exchange adjustments | 5 | | 19 | | 24 | |
|
|
|
|
|
| | | At 31st December 2005 | 16,204 | | 2,468 | | 18,672 | | | Additions | 16 | | 116 | | 132 | | | Exchange adjustments | (76 | ) | (21 | ) | (97 | ) |
|
|
|
|
|
| | | At 31st December 2006 | 16,144 | | 2,563 | | 18,707 | |
|
|
|
|
|
| |
(b) Intangible assets
The following tables set out the IFRS to US GAAP adjustments required to the IFRS income statement and balance sheet in respect of intangible assets:
| Income statement | 2006 | | 2005 | | 2004 | | | £m | £m | £m |
|
|
|
|
|
| | | Amortisation charge under IFRS | 139 | | 109 | | 75 | | | Amortisation charge under US GAAP | 1,454 | | 1,674 | | 1,516 | |
|
|
|
|
|
| | | IFRS to US GAAP adjustment for amortisation | 1,315 | | 1,565 | | 1,441 | |
|
|
|
|
|
| | | Impairment charge under IFRS | 80 | | 99 | | 26 | | | Impairment charge under US GAAP | 41 | | 118 | | 26 | |
|
|
|
|
|
| | | IFRS to US GAAP adjustment for impairment | (39 | ) | 19 | | – | |
|
|
|
|
|
| |
In addition to the above adjustments for amortisation and impairments, further IFRS to US GAAP adjustments arose during the year of £125 million (2005 – £98 million; 2004 – £173 million) in respect of the acquisition and disposal of in-process R&D, licences, patents etc. which are capitalised under IFRS but charged directly to research and development expense under US GAAP, and £nil (2005 – £nil; 2004 – £37 million) in respect of disposals of product rights which have a higher carrying value under US GAAP than under IFRS.
|
| GSK Annual Report 2006 | 145 |
<Back to Contents
| Notes to the financial statements | continued |
| |
41 Reconciliation to US accounting principlescontinued
| Balance sheet | 2006 | | 2005 | | | £m | £m |
|
|
|
| | | Product rights intangible assets under IFRS | 3,046 | | 3,120 | | | Product rights intangible assets under US GAAP | 13,680 | | 15,185 | |
|
|
|
| | | Net IFRS to US GAAP adjustment for product rights intangible assets | 10,634 | | 12,065 | |
|
|
|
| |
Product rights intangible assets under US GAAP are analysed as follows:
| 2006 | Acquired products, | | Brands subject | | Indefinite | | | | | licences, patents, etc. | to amortisation | lived brands | Total | | £m | £m | £m | £m |
|
|
|
|
|
|
|
| | | Cost | 21,249 | | 1,096 | | 4,811 | | 27,156 | | | Accumulated amortisationand impairment | (12,606 | ) | (210 | ) | (660 | ) | (13,476 | ) |
|
|
|
|
|
|
|
| | | Carrying value | 8,643 | | 886 | | 4,151 | | 13,680 | |
|
|
|
|
|
|
|
| |
| | | | | | | | | | | 2005 | £m | | £m | | £m | | £m | |
|
|
|
|
|
|
|
| | | Cost | 21,369 | | 1,096 | | 4,722 | | 27,187 | | | Accumulated amortisationand impairment | (11,187 | ) | (185 | ) | (630 | ) | (12,002 | ) |
|
|
|
|
|
|
|
| | | Carrying value | 10,182 | | 911 | | 4,092 | | 15,185 | |
|
|
|
|
|
|
|
| |
The acquired products, licences and patents are pharmaceutical products, principally arising from the acquisition of SmithKline Beecham plc, and consumer healthcare products with book values net of accumulated amortisation and impairment as follows:
| | 2006 | | 2005 | | | £m | £m |
|
|
|
| | | Avandia | 3,492 | | 3,841 | | | Seroxat/Paxil | 940 | | 1,410 | | | Augmentin | 966 | | 1,142 | | | Fluviral | 571 | | 683 | | | Havrix | 338 | | 363 | | | Infanrix | 275 | | 294 | | | Fraxiparine | 222 | | 239 | | | Twinrix | 219 | | 235 | | | Engerix-B | 209 | | 224 | | | Hycamtin | 177 | | 212 | | | Coreg | 122 | | 240 | | | Others | 1,112 | | 1,299 | |
|
|
|
| | | Acquired products, licences, patents etc. intangible assets under US GAAP | 8,643 | | 10,182 | |
|
|
|
| |
The indefinite lived brands relate to a large number of Consumer Healthcare products, principally arising from the acquisitions of SmithKline Beecham plc (including products previously acquired by SmithKline Beecham from Sterling Winthrop Inc.) and the Block Drug Company, with book values as follows:
| | 2006 | | 2005 | | | £m | £m |
|
|
|
| | | Panadol | 683 | | 730 | | | Aquafresh | 347 | | 347 | | | Lucozade | 324 | | 324 | | | Horlicks | 319 | | 319 | | | Ribena | 309 | | 309 | | | Nicorette | 292 | | 292 | | | Odol | 228 | | 228 | | | Tums | 226 | | 226 | | | Nicoderm | 224 | | 224 | | | Sensodyne | 216 | | 225 | | | Others | 983 | | 868 | |
|
|
|
| | | Indefinite lived brands intangible assets under US GAAP | 4,151 | | 4,092 | |
|
|
|
| |
|
| GSK Annual Report 2006 | 146 |
<Back to Contents
| Notes to the financial statements | continued |
| |
41 Reconciliation to US accounting principlescontinued
Each of these brands is considered to have an indefinite life, given the strength and durability of the brand and the level of marketing support. The brands are in relatively stable and profitable market sectors, and their size, diversification and market shares mean that the risk of market-related factors causing a shortening of the brands’ lives is considered to be relatively low. The Group is not aware of any material legal, regulatory, contractual, competitive, economic or other factor which could limit their useful lives. Accordingly, they are not amortised. Each brand is tested annually for impairment applying a fair value less costs to sell methodology and using five year post-tax cash flow forecasts with a terminal value calculation and applying a discount rate of the Group post-tax weighted average cost of capital of 8%, adjusted where appropriate for country-specific risks.
The carrying values of certain intangibles subject to amortisation were reviewed and an impairment of £6 million (2005 – £68 million) has been recorded. Of this, £6 million (2005 – £46 million) relates to pharmaceutical products and £nil (2005 – £22 million) to Consumer Healthcare products. An impairment charge in respect of Consumer Healthcare intangible assets not subject to amortisation of £35 million was recognised during 2006 (2005 – £50 million).
As discussed in Note 43 ‘Legal proceedings’, a number of distributors of generic drugs have filed applications to market generic versions of a number of the Group’s products prior to the expiration of the Group’s patents. If generic versions of products are launched in future periods at earlier dates than the Group currently expects, impairments of the carrying value of the products may arise.
The estimated future amortisation expense for the next five years for intangible assets subject to amortisation as of 31st December 2006 is as follows:
| Year | | £m | |
|
|
| | | 2007 | | 1,424 | | | 2008 | | 1,241 | | | 2009 | | 865 | | | 2010 | | 846 | | | 2011 | | 815 | |
|
|
| | | Total | | 5,191 | |
|
|
| |
In-process R&D of £14 million (2005 – £26 million; 2004 – £nil) arising on the acquisitions of CNS and Pliva in 2006 and ID Biomedical and Corixa in 2005 has been written off. This has been valued on the same basis as the other intangible assets acquired and relates to various development projects in the pre-approval stage where the technological feasibility of the projects had not been established at the point of acquisition.
(c) Theravance
In May 2004, the Group formed a strategic alliance with Theravance Inc. to develop and commercialise novel medicines across a variety of important therapeutic areas. Under the terms of the alliance, Theravance received $129 million, a significant part of which related to the Group’s purchase of Theravance shares. The Group has a call option in 2007 to further increase its ownership to over 50% at a significant premium to the price paid in the 2004 transaction. Theravance’s other shareholders have a put option at a lower exercise price to cause GlaxoSmithKline to acquire up to half of the outstanding stock in 2007. Given the maximum number of shares subject to the put option, the Group’s obligation is capped at $525 million. The Group has an exclusive option to license potential new medicines from all of Theravance’s programmes until August 2007. Upon exercising its option over a Theravance programme, the Group will be responsible for the relevant development, manufacturing and commercialisation activities. Depending on the success of such programmes, Theravance will receive clinical, regulatory and commercial milestone payments and royalties on the subsequent sales of medicines. Based on the assessment performed in May 2004, the Group was the primary beneficiary of Theravance, as defined by FIN 46R, and as a result Theravance was consolidated into the Group’s US GAAP financial statements from that date. The net assets acquired were measured at fair value. The principal adjustment to the carrying value of the net assets in Theravance’s balance sheet prior to the acquisition was recognition of in-process research and development (IPR&D) at a valuation of £273 million. The IPR&D was written off immediately after the acquisition in accordance with US GAAP purchase accounting.
In February 2006, Theravance completed a secondary offering of common stock, which is a reconsideration event as defined by FIN 46R. The assessment at this date indicated that the Group is no longer the primary beneficiary of Theravance’s variable interests. Accordingly, Theravance has been de-consolidated from the Group’s results under US GAAP since February 2006.
Additionally, the Group previously accounted for the Theravance put option discussed above in accordance with SFAS 150, ‘Accounting for Certain Financial Instruments with Characteristics of both Liabilities and Equity’, which requires the Group to record the fair value of the put option as a liability. Since Theravance ceased to be a subsidiary of the Group under FIN 46R in February 2006, the put option has been accounted for in accordance with SFAS 133, ‘Accounting for Derivative Instruments and Hedging Activities’. This also requires the fair value of the put option to be recorded as a liability. The fair value of the Theravance put option at 31st December 2006 is £10 million (2005 – £47 million). In accordance with SFAS 133, the call option is not recognised in the financial statements as it is not readily convertible into cash.
|
| GSK Annual Report 2006 | 147 |
<Back to Contents
| Notes to the financial statements | continued |
| |
41 Reconciliation to US accounting principlescontinued
| (d) Taxation | | | | | | | | 2006 | 2005 | 2004 | | Total tax expense | £m | | £m | | £m | |
|
|
|
|
|
| | | IFRS: | | | | | | | | Current tax expense | 2,710 | | 2,019 | | 1,667 | | | Deferred tax (credit)/expense | (409 | ) | (103 | ) | 90 | |
|
|
|
|
|
| | | Total tax expense | 2,301 | | 1,916 | | 1,757 | |
|
|
|
|
|
| | | US GAAP: | | | | | | | | Current tax expense | 2,735 | | 2,103 | | 1,717 | | | Deferred tax credit | (685 | ) | (688 | ) | (667 | ) |
|
|
|
|
|
| | | Total tax expense | 2,050 | | 1,415 | | 1,050 | |
|
|
|
|
|
| | | IFRS to US GAAP adjustments: | | | | | | | | Current tax expense | 25 | | 84 | | 50 | | | Deferred tax credit | (276 | ) | (585 | ) | (757 | ) |
|
|
|
|
|
| | | Total tax expense | (251 | ) | (501 | ) | (707 | ) |
|
|
|
|
|
| |
The IFRS to US GAAP adjustment in respect of current tax expense includes £41 million (2005 – £37 million; 2004 – £40 million) for the Group’s share of the tax expense of associates. This is recognised in the Taxation charge in the income statement under US GAAP but recorded in Share of after tax profits of associates in the income statement presented in accordance with IFRS.
| (e) Deferred taxation under US GAAP | 2006 | | 2005 | | | | | £m | £m | |
|
|
|
| | | | | Liabilities | | | | | | | | Stock valuation adjustment | (44 | ) | (42 | ) | | | | Other timing differences | 20 | | 63 | | | |
|
|
|
| | | | | Current deferred taxation liabilities | (24 | ) | 21 | | | |
|
|
|
| | | | | Accelerated capital allowances | (564 | ) | (187 | ) | | | | Product rights | (3,563 | ) | (4,035 | ) | | | | Product and business disposals | (1 | ) | 13 | | | | | Pensions and other post-retirement benefits | 317 | | 25 | | | | | Tax losses | 80 | | – | | | | | Legal and other disputes | 6 | | – | | | | | Manufacturing restructuring | 37 | | – | | | | | Share option and award schemes | 62 | | – | | | | | Other timing differences | 8 | | 25 | | | | | Valuation allowances | (46 | ) | – | | | |
|
|
|
| | | | | Total deferred taxation liabilities | (3,688 | ) | (4,138 | ) | | |
|
|
|
| | | | | Assets | | | | | | | | Intra-Group profit | 696 | | 619 | | | | | Stock valuation adjustment | (28 | ) | (72 | ) | | | | Other timing differences | 360 | | 614 | | | |
|
|
|
| | | | | Current deferred taxation assets | 1,028 | | 1,161 | | | |
|
|
|
| | | | | Accelerated capital allowances | (33 | ) | (492 | ) | | | | Product rights | (49 | ) | (9 | ) | | | | Pensions and other post-retirement benefits | 410 | | 43 | | | | | Tax losses | 1,205 | | 125 | | | | | Restructuring | 26 | | 53 | | | | | Legal and other disputes | 147 | | 160 | | | | | Share option and award schemes | 233 | | 276 | | | | | Other timing differences | 128 | | (3 | ) | | | | Valuation allowances | (1,141 | ) | (62 | ) | | |
|
|
|
| | | | | Total deferred taxation assets | 1,954 | | 1,252 | | | |
|
|
|
| | | |
|
| GSK Annual Report 2006 | 148 |
<Back to Contents
| Notes to the financial statements | continued |
| |
41 Reconciliation to US accounting principlescontinued
| (e) Deferred taxation under US GAAPcontinued | 2006
| | 2005
| | | | | £m | | £m | | | |
| | | | | Net deferred taxation under US GAAP | (1,734 | ) | (2,886 | ) | | | | Net deferred taxation under IFRS | 1,528 | | 1,645 | | | |
| | | | | IFRS to US GAAP adjustment | (3,262 | ) | (4,531 | ) | | |
| | | |
(f) Pensions and post-retirement costs under US GAAP
| | 2006
| | 2005
| | 2004
| | | | £m | | £m | | £m | |
| | | UK pension schemes | 258 | | 218 | | 225 | | | US pension schemes | 61 | | 55 | | 54 | | | Other overseas pension schemes | 102 | | 87 | | 77 | | | Unfunded post-retirement healthcare schemes | 127 | | 114 | | 96 | | | Post-employment costs | 1 | | 2 | | 18 | |
| | | | 549 | | 476 | | 470 | |
| | | Analysed as: | | | | | | | | Funded defined benefit/hybrid schemes | 363 | | 306 | | 298 | | | Unfunded defined benefit schemes | 30 | | 29 | | 37 | | | Defined contribution schemes | 28 | | 25 | | 21 | | | Unfunded post-retirement healthcare schemes | 127 | | 114 | | 96 | | | Post-employment costs | 1 | | 2 | | 18 | |
| | | | 549 | | 476 | | 470 | |
| |
The disclosures below include the additional information required by SFAS 132R and SFAS 158. The pension costs of the UK, US and major overseas defined benefit pension plans have been restated in the following tables in accordance with US GAAP. Minor retirement plans with pension costs in 2006 of £5 million (2005 – £8 million; 2004 – £5 million), have not been recalculated in accordance with the requirements of SFAS 87, and have been excluded.
| Net periodic pension cost for the major retirement plans | 2006
| | 2005
| | 2004
| | | £m | | £m | | £m | |
| | | Service cost | 247 | | 223 | | 213 | | | Interest cost | 448 | | 408 | | 400 | | | Expected return on plan assets | (491 | ) | (444 | ) | (431 | ) | | Amortisation of prior service cost | 16 | | 13 | | 14 | | | Amortisation of transition obligation | 2 | | 2 | | 2 | | | Amortisation of net actuarial loss | 146 | | 107 | | 115 | |
| | | Net periodic pension cost under US GAAP | 368 | | 309 | | 313 | |
| | | Termination benefits and curtailment costs | 19 | | 19 | | 13 | |
| |
The assumptions used under IAS 19 within Note 26, are similar to those disclosed in the following table, which are presented on a weighted average basis.
| Major assumptions used in computing pension costs | 2006
| | 2005
| | 2004
| | | % pa | | % pa | | % pa | |
| | | Rates of future pay increases | 4.25 | | 4.00 | | 4.25 | | | Discount rate | 5.00 | | 4.75 | | 5.25 | | | Expected long-term rates of return on plan assets | 6.75 | | 6.75 | | 7.00 | |
| |
In aggregate, average international plan assumptions did not vary significantly from US assumptions.
| Estimated future benefit payments | £m | |
| | | 2007 | 355 | | | 2008 | 368 | | | 2009 | 385 | | | 2010 | 400 | | | 2011 | 416 | | | 2012–2016 | 2,386 | |
| |
|
| GSK Annual Report 2006 | 149 |
Back to Contents
| Notes to the financial statements | continued |
| |
41 Reconciliation to US accounting principlescontinued
| Change in benefit obligation | 2006
| | 2005
| | | | | £m | | £m | | | |
| | | | | Benefit obligation at 1st January | (9,997 | ) | (8,171 | ) | | | | Amendments | (36 | ) | (1 | ) | | | | Service cost | (247 | ) | (223 | ) | | | | Interest cost | (448 | ) | (408 | ) | | | | Plan participants’ contributions | (14 | ) | (15 | ) | | | | Actuarial loss | (43 | ) | (1,334 | ) | | | | Benefits paid | 368 | | 372 | | | | | Termination benefits and curtailment costs | (17 | ) | (15 | ) | | | | Exchange adjustments | 263 | | (202 | ) | | |
| | | | | Benefit obligation at 31st December | (10,171 | ) | (9,997 | ) | | |
| | | | | Benefit obligation at 31st December for pension plans with accumulated benefit | | | | | | | | obligations in excess of plan assets | (6,643 | ) | (8,748 | ) | | |
| | | |
The accumulated benefit obligation at 31st December 2006 was £9,385 million (31st December 2005 – £9,294 million).
| Change in plan assets | 2006
| | 2005
| | | | | £m | | £m | | | |
| | | | | Fair value of plan assets at 1st January | 8,298 | | 6,690 | | | | | Actual return on plan assets | 867 | | 1,113 | | | | | Employer contributions | 592 | | 661 | | | | | Plan participants’ contributions | 14 | | 15 | | | | | Benefits paid | (368 | ) | (372 | ) | | | | Exchange adjustments | (262 | ) | 191 | | | |
| | | | | Fair value of plan assets at 31st December | 9,141 | | 8,298 | | | |
| | | | | Fair value of plan assets at end of year for pension plans with accumulated benefit | | | | | | | | obligations in excess of plan assets | 6,214 | | 7,735 | | | |
| | | |
Plan assets consist primarily of investments in UK and overseas equities, fixed interest securities, index-linked securities and property. At 31st December 2006 UK equities included 0.1 million GSK shares (2005 – 1.9 million shares) with a market value of £1 million (2005 – £28 million). An analysis of the proportions of total plan assets for each major category is disclosed in Note 26. That analysis includes assets valued at £125 million in minor retirement plans, which have been excluded from these US GAAP tables.
| Funded status before adoption of SFAS 158 | 2006
| | 2005
| | | | | £m | | £m | | | |
| | | | | Funded status | (1,030 | ) | (1,699 | ) | | | | Unrecognised net actuarial loss | 1,966 | | 2,499 | | | | | Unrecognised prior service cost | 81 | | 60 | | | | | Unrecognised transition obligation | 16 | | 21 | | | |
| | | | | Net amount recognised before adoption of SFAS 158 | 1,033 | | 881 | | | |
| | | |
| | | | | | | | | Amounts recognised in the statement of financial position before adoption of SFAS 158 | 2006
| | 2005
| | | | | £m | | £m | | | |
| | | | | Prepaid benefit cost | 423 | | 8 | | | | | Accrued pension liability | (460 | ) | (1,027 | ) | | | | Intangible asset | 100 | | 86 | | | | | Accumulated other comprehensive income | 970 | | 1,814 | | | |
| | | | | Net amount recognised before adoption of SFAS 158 | 1,033 | | 881 | | | |
| | | |
|
| GSK Annual Report 2006 | 150 |
<Back to Contents
| Notes to the financial statements | continued |
| |
41 Reconciliation to US accounting principlescontinued
| Amount recognised in the statement of financial position | Before
| | Incremental
| | After
| | | adoption | | effect | | adoption | | | of SFAS 158 | | of SFAS 158 | | of SFAS 158 | | | £m | | £m | | £m | |
| | | Prepaid/accrued | (37 | ) | (993 | ) | (1,030 | ) | | Intangible asset | 100 | | (100 | ) | – | | | Deferred tax asset | 319 | | – | | 319 | | | Accumulated other comprehensive income, net of deferred tax | 651 | | 1,093 | | 1,744 | |
| | | At 31st December 2006 | 1,033 | | – | | 1,033 | |
| |
| | | Amounts estimated to be recognised in net periodic pension cost in 2007 | Total
| | £m | |
| | Net actuarial loss | 108 | | Prior service cost | 17 | | Transition obligation | 2 | |
| | | 127 | |
| |
Post-retirement healthcare under US GAAP
The post-retirement healthcare costs of the UK, US and major overseas post-retirement healthcare schemes have been restated in the following tables in accordance with US GAAP. Minor healthcare plans with costs in 2006 of £8 million (2005 – £5 million; 2004 – £nil) have not been recalculated and have been excluded.
| Net healthcare cost | 2006
| | 2005
| | 2004
| | | £m | | £m | | £m | |
| | | Service cost | 35 | | 37 | | 32 | | | Interest cost | 62 | | 57 | | 55 | | | Amortisation of prior service cost | (1 | ) | (2 | ) | (1 | ) | | Amortisation of net actuarial loss | 22 | | 15 | | 11 | |
| | | Net healthcare cost | 118 | | 107 | | 97 | |
| |
| | | | | | | | | The major assumptions used in calculating the net healthcare cost were: | %pa | | %pa | | %pa | |
| | | Rate of future healthcare inflation | 9.25 to 5.0 | | 10.0 to 5.0 | | 9.0 to 5.0 | | | Discount rate | 5.75 | | 5.50 | | 5.75 | |
| |
| Change in benefit obligation | | | | | | | 2006
| | 2005
| | | | | £m | | £m | | | |
| | | | | Benefit obligation at 1st January | 1,211 | | 965 | | | | | Amendments | (16 | ) | – | | | | | Service cost | 35 | | 37 | | | | | Interest cost | 62 | | 57 | | | | | Plan participants’ contributions | 8 | | 8 | | | | | Actuarial (gain)/loss | (117 | ) | 82 | | | | | Benefits paid | (53 | ) | (43 | ) | | | | Exchange | (102 | ) | 105 | | | |
| | | | | Benefit obligation at 31st December | 1,028 | | 1,211 | | | |
| | | | | | | | | | | | | Change in plan assets | | | | | | |
| | | | | Fair value of plan assets at 1st January | – | | – | | | | | Employer and plan participants’ contributions | 53 | | 43 | | | | | Benefits paid | (53 | ) | (43 | ) | | |
| | | | | Fair value of plan assets at 31st December | – | | – | | | |
| | | |
|
| GSK Annual Report 2006 | 151 |
<Back to Contents
| Notes to the financial statements | continued |
| |
41 Reconciliation to US accounting principlescontinued
| Funded status before adoption of SFAS 158 | 2006
| | 2005
| | | | | £m | | £m | | | |
| | | | | Funded status | (1,028 | ) | (1,211 | ) | | | | Unrecognised net actuarial loss | 265 | | 450 | | | | | Unrecognised prior service cost | (27 | ) | (14 | ) | | |
| | | | | Accrued post-retirement healthcare cost before adoption of SFAS 158 | (790 | ) | (775 | ) | | |
| | | | | | | | | | | | | Amount recognised in the statement of financial position before adoption of SFAS 158 | | | | | | |
| | | | | Accrued benefit cost | (790 | ) | (775 | ) | | |
| | | | | Accrued post-retirement healthcare cost before adoption of SFAS 158 | (790 | ) | (775 | ) | | |
| | | |
| | | | | | | | | Amount recognised in the statement of financial position | Before
| | Incremental
| | After
| | | adoption | | effect | | adoption | | | of SFAS 158 | | of SFAS 158 | | of SFAS 158 | | | £m | | £m | | £m | |
| | | Prepaid/accrued | (790 | ) | (238 | ) | (1,028 | ) | | Deferred tax asset | 408 | | – | | 408 | | | Accumulated other comprehensive income, net of deferred tax | (408 | ) | 238 | | (170 | ) |
| | | At 31st December 2006 | (790 | ) | – | | (790 | ) |
| |
| | | Amounts estimated to be recognised in net periodic pension cost in 2007 | Total
| | £m | |
| | Net actuarial loss | 13 | | Prior service cost | (2 | ) |
| | | 11 | |
| |
| | | | | | | Impact of a 1% variation in the assumed rate of future healthcare inflation | 1% decrease
| | 1% increase
| | | £m | | £m | |
| | | Effect on total service and interest cost for post-retirement healthcare | (7 | ) | 8 | | | Effect on obligation for post-retirement healthcare | (75 | ) | 89 | |
| |
| | | | | | | | | Estimated future benefit payments | | | Medicare
| |
| | Gross
| | subsidy | | Net | | | £m | | £m | | £m | |
| | | 2007 | 46 | | (3 | ) | 43 | | | 2008 | 50 | | (4 | ) | 46 | | | 2009 | 55 | | (4 | ) | 51 | | | 2010 | 59 | | (5 | ) | 54 | | | 2011 | 62 | | (5 | ) | 57 | | | 2012-2016 | 354 | | (33 | ) | 321 | |
| |
|
| GSK Annual Report 2006 | 152 |
Back to Contents
| Notes to the financial statements | continued |
| |
4243 Principal Group companies
The following represent the principal subsidiary and associated undertakings of the GlaxoSmithKline Group at 31st December 2006.2007. Details are given of the principal country of operation, the location of the headquarters, the business segment and the business activities. The equity share capital of these undertakings is wholly owned by the Group except where its percentage interest is shown otherwise. All companies are incorporated in their principal country of operation except where stated. | Europe | | Location | | Subsidiary undertaking | | Segment | | Activity | | % | |
|
|
| | | England | | Brentford | | +GlaxoSmithKline Holdings Limited | | Ph,CH | | h | | | | | | | Brentford | | +GlaxoSmithKline Holdings (One) Limited | | Ph,CH | | h | | | | | | | Brentford | | +GlaxoSmithKline Services Unlimited | | Ph,CH | | s | | | | | | | | | | | | | | | | | Brentford | | GlaxoSmithKline Finance plc | | Ph,CH | | f | | | | | | | Brentford | | GlaxoSmithKline Capital plc | | Ph | | f | | | | | | | Brentford | | SmithKline Beecham p.l.c. | | Ph,CH | | d e h m p r | | | | | | | Brentford | | Wellcome Limited | | Ph,CH | | h | | | | | | | Greenford | | Glaxo Group Limited | | Ph | | h | | | | | | | Greenford | | Glaxo Operations UK Limited | | Ph | | p | | | | | | | Brentford | | Glaxo Wellcome International B.V. (i) | | Ph,CH | | h | | | | | | | Brentford | | Glaxo Wellcome Investments B.V. (i) | | Ph,CH | | h | | | | | | Stockley Park | | Glaxo Wellcome UK Limited | | Ph | | h m p | | | | | | | Brentford | | GlaxoSmithKline Export Limited | | Ph | | e | | | | | | | Brentford | | GlaxoSmithKline Research & Development Limited | | Ph | | d r | | | | | | | Brentford | | GlaxoSmithKline UK Limited | | Ph | | m p | | | | | | | Brentford | | SmithKline Beecham (Investments) Limited | | Ph,CH | | f | | | | | | Brentford | | SmithKline Beecham (SWG) Limited | | CH | | e m | | | | | | | Brentford | | Setfirst Limited | | Ph,CH | | h | | | | | | | Greenford | | The Wellcome Foundation Limited | | Ph | | p | | | | | Cambridge | | Domantis Limited | | Ph | | d r | | |
| | Brentford | | SmithKline Beecham Overseas Limited | | Ph | | h | | | | | Brentford | | SmithKline Beecham Holdings (UK) Limited | | Ph | | h | | | | | Brentford | | GlaxoSmithKline (Netherlands) B.V. (i) | | Ph | | h | | |
|
| | | Austria | | Vienna | | GlaxoSmithKline Pharma G.m.b.H | | Ph | | m | | | |
|
|
| | | Belgium | | Genval | | GlaxoSmithKline S.A. | | Ph | | m | | | | | | | Rixensart | | GlaxoSmithKline Biologicals S.A. | | Ph | | d e m p r | | | | | | Rixensart | | GlaxoSmithKline Biologicals Manufacturing S.A. | | Ph | | h | | | |
|
|
| | | Czech Republic | | Prague | | GlaxoSmithKline s.r.o. | | Ph,CH | | m | | | |
|
|
| | | Denmark | | BallerupOrestadt | | GlaxoSmithKline Consumer Healthcare A/S | | CH | | m | | | | | | | Brøndby | | GlaxoSmithKline Pharma A/S | | Ph | | m | | | |
|
|
| | | Finland | | Espoo | | GlaxoSmithKline Oy | | Ph | | m | | | |
|
|
| | | France | | Marly le Roi | | Groupe GlaxoSmithKline S.A.S. | | Ph | | h | | | | | | | Marly le Roi | | Laboratoire GlaxoSmithKline S.A.S. | | Ph | | m | r d | | | | | | Marly le Roi | | Glaxo Wellcome Production S.A.S. | | Ph | | m p | | | | | | | Marly le Roi | | GlaxoSmithKline Sante Grand Public S.A.S. | | CH | | m | | | |
|
|
| | | Germany | | Buehl | | GlaxoSmithKline Consumer Healthcare GmbH & Co. KG | | CH | | d h m p r s | | | | | | | Munich | | GlaxoSmithKline Pharma GmbH & Co. KG | | Ph | | d h | m p r s | | |
|
|
| | | Greece | | Athens | | GlaxoSmithKline A.E.B.E | | Ph,CH | | h m | | | |
|
|
| | | Guernsey | | St. Peter Port | | SmithKline Beecham Limited | | Ph,CH | | i | | | | | | St. Peter Port | | Setfirst (No.2) Limited | | Ph,CH | | h | | | |
|
|
| | | Hungary | | Budapest | | GlaxoSmithKline Medicine and Healthcare Products Limited | | Ph,CH | | e m | | | |
|
|
| | | Italy | | Verona | | GlaxoSmithKline S.p.A. | | Ph | | d h m r | | | | | | | Milan | | GlaxoSmithKline Consumer Healthcare S.p.A. | | CH | | h m | | | | | Verona | | GlaxoSmithKline Manufacturing S.p.A. | | Ph | | p | | |
|
|
| | | Luxembourg | | Mamer | | GlaxoSmithKline International (Luxembourg) S.A. | | Ph,CH | | f h | | | |
|
|
| |
|
| GSK Annual Report 2006 | 153 |
<Back to Contents
| Notes to the financial statements | continued |
| |
42 Principal Group companiescontinued
Europe | | Location | | Subsidiary undertaking | | Segment | | Activity | | % | |
| | Netherlands | | Zeist | | GlaxoSmithKline B.V. | | Ph | | m | | | | | | | ZeistUtrecht | | GlaxoSmithKline Consumer Healthcare B.V. | | CH | | m | | | |
| Norway | | Oslo | | GlaxoSmithKline AS | | Ph | | m | | | |
| Poland | | Poznan | | GlaxoSmithKline Pharmaceuticals S.A. | | Ph | | m p | | 97 | | | | | Poznan |
| GSK Annual Report 2007 | 149 | | |
Back to Contents GSK Services Sp.z.o.o | | Ph | | | mFINANCIAL STATEMENTS | | Notes to the financial statements | | | | | | | Warsaw | | Notes to the financial statements | | continued | |
43 Principal Group companiescontinued | Europe | Location | Subsidiary undertaking | Segment | Activity | % | |
|
|
|
|
|
| | | Norway | Oslo | GlaxoSmithKline AS | Ph | m | | |
|
|
|
|
|
| | | Poland | Poznan | GlaxoSmithKline Pharmaceuticals S.A. | Ph | p | 97 | | | Poznan | GSK Services Sp.z.o.o | Ph | m | | | | Warsaw | GlaxoSmithKline Consumer Healthcare Sp.z.o.o. | | CH | | m e | | | |
|
|
|
|
|
| | | Portugal | | Alges | | GlaxoSmithKline-Produtos Farmaceuticos, Limitada | | Ph | | m | | | |
|
|
|
|
|
| | | Republic of | | Carrigaline | | SmithKline Beecham (Cork) Limited (ii) | | Ph | | p | r | | | | Ireland | | Carrigaline | Cork | GlaxoSmithKline Trading Services Limited (ii) | | Ph | | e | | | | | | | Dublin | | GlaxoSmithKline Consumer Healthcare (Ireland) Limited (ii) | | CH | | m | | | | Dublin | GlaxoSmithKline (Ireland) Limited | Ph | m | | |
|
|
|
|
|
| | | Russian | | Moscow | | GlaxoSmithKline Trading | ZAO | Ph | | m | | | | | Federation | Moscow | GlaxoSmithKline Healthcare ZAO | CH | m | | |
|
|
|
|
|
| | | Spain | Madrid | GlaxoSmithKline S.A. | Ph | m | | | | Madrid | GlaxoSmithKline Consumer Healthcare S.A. | CH | m | | | | Aranda de Duero | Glaxo Wellcome S.A. | Ph | p | | |
|
|
|
|
|
| | | Sweden | Solna | GlaxoSmithKline AB | Ph | m | | |
|
|
|
|
|
| | | Switzerland | Muenchenbuchsee | GlaxoSmithKline AG | Ph | m | | |
|
|
|
|
|
| | | | | | | | | |
| Spain | | Madrid | | GlaxoSmithKline S.A. | | Ph | | m pUSA | | | | | | Madrid | | GlaxoSmithKline Consumer Healthcare S.A. | | CH | | m | | | |
|
|
|
|
|
| | SwedenUSA | Hamilton | Corixa Corporation | Ph | m p | | Solna | | | GlaxoSmithKline ABPittsburgh | CNS, Inc. | Ph | CH | m | | | | Philadelphia | SmithKline Beecham Corporation | Ph,CH | d e h m p r s | | | | Pittsburgh | GlaxoSmithKline Consumer Healthcare, L.P. | CH | m p | 88 | | | Pittsburgh | Block Drug Company, Inc. | CH | h m | | | | Wilmington | GlaxoSmithKline Holdings (Americas) Inc. | Ph,CH | h | | | | Liberty Corner | Reliant Pharmaceuticals, Inc. | Ph | m r | | | | Wilmington | GlaxoSmithKline Capital Inc. | Ph | f | | |
| Switzerland
|
| Muenchenbuchsee
|
| GlaxoSmithKline AG | | Ph | | m | |
| |
| USA | | | | | | | | | | | |
| USA | | Hamilton | | Corixa Corporation | | Ph | | m pAmericas | | | | | | Minneapolis | | CNS, Inc. | | CH | | m p | | | | | | Philadelphia | | SmithKline Beecham Corporation | | Ph,CH | | d e h m p r s | | | | | | Pittsburgh | | GlaxoSmithKline Consumer Healthcare, L.P. | | CH | | m p | | 88 | | | | Pittsburgh | | Block Drug Company, Inc. | | CH | | h m p | | | | | | Wilmington | | GlaxoSmithKline Holdings (Americas) Inc. | | Ph,CH | | h | | | |
|
|
|
|
|
| | AmericasBermuda | Hamilton | GlaxoSmithKline Insurance Ltd | Ph,CH | i | | |
|
|
|
|
|
| | | Canada | Mississauga | GlaxoSmithKline Inc. | Ph | m p r | | | | Oakville | GlaxoSmithKline Consumer Healthcare Inc. | CH | m | | | | Laval | ID Biomedical Corporation | Ph | d m p r | | | | Laval | ID Biomedical Corporation of Quebec | Ph | d m p r | | |
|
|
|
|
|
| | | | | | | | | |
| BermudaAsia Pacific | | Hamilton | | GlaxoSmithKline Insurance Ltd | | Ph,CH | | i | | | |
| Canada
|
|
|
|
| | MississaugaAustralia | Boronia | GlaxoSmithKline Inc. | Australia Pty Ltd | Ph,CH | | d e m p r | | |
|
|
|
|
|
| | | China | Hong Kong | GlaxoSmithKline Limited | Ph,CH | m | | | | Tianjin | Sino-American Tianjin Smith Kline & French Laboratories Ltd | Ph | d m p r | 55 | |
|
|
|
|
|
| | | India | Mumbai | GlaxoSmithKline Pharmaceuticals Limited | Ph | m p | 51 | | | Nabha | GlaxoSmithKline Consumer Healthcare Limited (iii) | CH | m p | 43 | |
|
|
|
|
|
| | | Malaysia | Petaling Jaya | GlaxoSmithKline Pharmaceutical Sdn Bhd | Ph | m | | | | Petaling Jaya | GlaxoSmithKline Consumer Healthcare Sdn Bhd | CH | m | | |
|
|
|
|
|
| | | New Zealand | Auckland | GlaxoSmithKline NZ Limited | Ph,CH | m | | |
|
|
|
|
|
| | | Pakistan | Karachi | GlaxoSmithKline Pakistan Limited | Ph,CH | m p e | 79 | |
|
|
|
|
|
| | | Philippines | Makati | GlaxoSmithKline Philippines Inc | Ph,CH | m | | |
|
|
|
|
|
| | | Singapore | Singapore | Glaxochem Pte Ltd | Ph | h | | | | Singapore | Glaxo Wellcome Manufacturing Pte Ltd | Ph | p | | | | Singapore | GlaxoSmithKline Pte Ltd | Ph,CH | m | | |
|
|
|
|
|
| | | | | | | | |
| 150 | GSK Annual Report 2007 | | |
Back to Contents | | | FINANCIAL STATEMENTS | | | Notes to the financial statements | | | | | | | | Oakville | | | GlaxoSmithKline Consumer Healthcare Inc.Notes to the financial statements | | continued | | |
43 Principal Group companiescontinued CHAsia Pacific | Location | mSubsidiary undertaking | Segment | Activity | % | |
|
|
|
|
|
| | LavalSouth Korea | Seoul | ID Biomedical Corporation | GlaxoSmithKline Korea Limited | Ph | | d m p r | | | |
|
|
|
|
|
| | Asia PacificThailand | Bangkok | GlaxoSmithKline (Thailand) Limited | Ph,CH | m | | |
|
|
|
|
|
| | | | | | | | | |
| AustraliaJapan | | Boronia | | Glaxo Wellcome Australia Pty Ltd | | Ph,CH | | d e m p r | | | |
| China
|
| Hong Kong
|
| GlaxoSmithKline Limited | | Ph,CH | | m | |
| | | Japan | Tokyo | Tianjin | | Sino-American Tianjin Smith Kline & French Laboratories Ltd | GlaxoSmithKline K.K. | Ph, | CH | d m p r | | 55 | |
| India | | Mumbai | | GlaxoSmithKline Pharmaceuticals Limited | | Ph | | m p | | 51 | | | | Nabha | | GlaxoSmithKline Consumer Healthcare Limited (iii) | | CH | | m p | | 43 | |
| Malaysia | | Petaling Jaya | | GlaxoSmithKline Pharmaceutical Sdn Bhd | | Ph | | m | | | |
| New Zealand
|
| Auckland
|
| GlaxoSmithKline NZ Limited | | Ph,CH | | m | |
| |
| Pakistan | | Karachi | | GlaxoSmithKline Pakistan Limited | | Ph,CH | | m p e | | 79 | |
| Philippines | | Makati | | GlaxoSmithKline Philippines Inc | | Ph,CH | | m | | | |
| Singapore | | Singapore | | Glaxo Wellcome Manufacturing Pte Ltd | | Ph | | p | | | | | | Singapore | | GlaxoSmithKline Pte Ltd | | Ph | | m | | | |
| South Korea | | Seoul | | GlaxoSmithKline Korea | | Ph | | m p | | | |
| Taiwan | | Taipei | | Glaxo Wellcome Taiwan Limited | | Ph | | m p | | | |
|
|
| GSK Annual Report 2006 | 154 |
<Back to Contents
| Notes to the financial statements | continued |
| |
42 Principal Group companiescontinued
Japan | | Location | | Subsidiary undertaking | | Segment | | Activity | | % | |
| Japan | | Tokyo | | GlaxoSmithKline K.K. | | Ph,CH | | d m p r | | | |
| Latin America | | | | | | | | | | | |
| ArgentinaLatin America | | Buenos Aires | | GlaxoSmithKline Argentina S.A. | | Ph,CH | | m p | | | |
| Brazil
|
|
|
|
| | Rio de JaneiroArgentina | Buenos Aires | GlaxoSmithKline Brasil Ltda | Argentina S.A. | Ph,CH | | m p | | |
|
|
|
|
|
| |
| ColombiaBrazil | | Bogota | Rio de Janeiro | GlaxoSmithKline Colombia S.A. | Brasil Ltda | Ph,CH | | e m | p | | |
|
|
|
|
|
| | | Colombia | Bogota | GlaxoSmithKline Colombia S.A. | Ph,CH | m | | |
|
|
|
|
|
| | | Mexico | | Delegacion Tlalpan | | GlaxoSmithKline Mexico S.A. de C.V. | | Ph,CH | | e m p s | | | |
|
|
|
|
|
| | | Puerto Rico | | Guaynabo | | GlaxoSmithKline Puerto Rico Inc. | | Ph | | m | | | | | | | San Juan | Cidra | SB Pharmco Puerto Rico Inc. | | Ph | | p | | | |
|
|
|
|
|
| | | Venezuela | | Caracas | | GlaxoSmithKline Venezuela C.A. | | Ph,CH | | m | | | |
| Middle East &
|
|
|
|
| | | | | | | | | | | | | AfricaMiddle East & | | | | | | | | Africa | | | | | | |
|
|
|
|
|
| | | Egypt | Cairo | GlaxoSmithKline S.A.E | Ph | m p | 91 | |
|
|
|
|
|
| | | South Africa | Bryanston | GlaxoSmithKline South Africa (Pty) Ltd | Ph,CH | m p | | |
|
|
|
|
|
| | | Turkey | Istanbul | GlaxoSmithKline Ilaclari Sanayi ve Ticaret A.S. | Ph | m p | | |
|
|
|
|
|
| | | | | | | | | |
| Egypt | | Cairo | | GlaxoSmithKline S.A.E | | Ph | | m p | | 91 | |
| South Africa | | Bryanston | | GlaxoSmithKline South Africa (Pty) Ltd | | Ph,CH | | m p | | | |
| Turkey | | Istanbul | | GlaxoSmithKline Ilaclari Sanayi ve Ticaret A.S. | | Ph | | m p | | | |
| | USA | | Location | | Associated undertaking | | Business | | | | % | |
|
|
|
|
|
| | | USA | | Teterboro | Madison | Quest Diagnostics Incorporated (iv) | | Clinical testing | | | | 19 | |
|
|
|
|
|
| |
| | | i) | Incorporated in the Netherlands. | | | | ii) | Exempt from the provisions of Section 7 of the Companies (Amendment) Act 1986 (Ireland). | | | | | iii) | Consolidated as a subsidiary undertaking in accordance with Section 258 (4)(a) of the Companies Act 1985 on the grounds of dominant influence. | | | | iv) | Equity accounted on the grounds of significant influence. | | | | | + | Directly held wholly owned subsidiary of GlaxoSmithKline plc. |
Key Business segment: Ph Pharmaceuticals, CH Consumer Healthcare Business activity: d development, e exporting, f finance, h holding company, i insurance, m marketing, p production, r research, s service Full details of all Group subsidiary and associated undertakings will be attached to the company’s Annual Return to be filed with the Registrar of Companies. Each of GlaxoSmithKline Capital Inc. and GlaxoSmithKline Capital plc is a wholly-owned finance subsidiary of the company, and the company has fully and unconditionally guaranteed the securities issued by each of GlaxoSmithKline Capital Inc. and GlaxoSmithKline Capital plc.
| GSK Annual Report 2007 | 151 | | | |
Back to Contents | | | FINANCIAL STATEMENTS | | Notes to the financial statements | | | | | | | | | |
Key | | | | Business segment: | Ph Pharmaceuticals, CH Consumer Healthcare | | | Business activity: | d development, e exporting, f finance, h holding company, i insurance, m marketing, p production, r research, s service | | | Full details of all Group subsidiary and associated undertakings will be attached to the company’s Annual Return to be filed with the Registrar of Companies. |
|
| GSK Annual Report 2006 | 155 |
Back to Contents
| | Notes to the financial statements | | continued |
| | |
4344 Legal proceedings
The Group is involved in significant legal and administrative proceedings, principally product liability, intellectual property, tax, antitrust and governmental investigations and related private litigation. The Group makes provision for these proceedings on a regular basis as summarised in Notes 2 and 27.29. The Group may make additional significant provisions for such legal proceedings as required in the event of further developments in these matters, consistent with generally accepted accounting principles. Litigation, particularly in the USA, is inherently unpredictable and excessive awards that may not be justified by the evidence may occur. The Group could in the future incur judgements or enter into settlements of claims that could result in payments that exceed its current provisions by an amount that would have a material adverse effect on the Group’s financial condition, results of operations and/or cash flows. Intellectual property claims include challenges to the validity and enforceability of the Group’s patents on various products or processes and assertions of non-infringement of those patents. A loss in any of these cases could result in loss of patent protection for the product at issue. The consequences of any such loss could be a significant decrease in sales of that product and could materially affect future results of operations for the Group. Legal expenses incurred and provisions related to legal claims are charged to selling, general and administration costs. Provisions are made, after taking appropriate legal and other specialist advice, when a reasonable estimate can be made of the likely outcome of the dispute. Beginning in 2004, theThe Group has established an actuarially determined provision for product liability claims incurred but not yet reported as described in Note 27.29, ‘Other provisions’. At 31st December 2006,2007, the Group’s aggregate provision for legal and other disputes (not including tax matters described under ‘Taxation’ in Note 12)14, ‘Taxation’) was over £1£1.2 billion. The ultimate liability for legal claims may vary from the amounts provided and is dependent upon the outcome of litigation proceedings, investigations and possible settlement negotiations. The most significant of those matters are described below. Intellectual property
AdvairAdvair/Seretide
In September 2004, the Group applied to the US Patent and Trademark Office (USPTO) for re-issue of its combination patent forAdvair, an inhaled combination of salmeterol and fluticasone propionate, which expires in September 2010. This followed an internal review which concluded that the language in the patent may not have accurately describedescribed all of the circumstances of the invention and may not claimhave claimed the invention as precisely as it could. The objective of seeking re-issuance iswas to strengthen the protection afforded by the patent. In January 2007,The USPTO reissued the Group received a Notice of Allowance finding the pharmaceutical composition claims patentable.patent in February 2008. The reissued patent will havehas the same September 2010 expiration date as the original composition patent and will beis listed in the register of pharmaceutical patents maintained by the US Food and Drug Administration (FDA) (theFDA, the Orange Book).Book. TheIn October 2007, the Group holds other US patents relating tofiled a complaint with the Patent Dispute Chamber of the Regional Court in Düsseldorf, Germany against Neolab (UK) for infringement of its German patent claiming compositions containing the combination of salmeterol and fluticasone propionate as used inSeretide (known asAdvairViani, including various patents relating to theDiskusdevice which expire over a period from 2011 to 2016, and various patents relating to the HFA formulation and MDI device which expire over a period from 2014 to 2017. in Germany).
The complaint is based on a threat to market a salmeterol/fluticasone combination product in Germany prior to patent expiry. The basic patent covering the combination product inSeretide expires in September 2010 but is subject to a Supplementary Protection Certificate which extends protection until September 2013. The action is in its early stages. Argatroban
In December 2007, Encysive Pharmaceuticals Inc., Mitsubishi Kasei Corporation and the Group filed an action in the US District Court for the Southern District of New York against Barr Laboratories, Inc. for infringement of Mitsubishi’s pharmaceutical composition patent covering argatroban. Pursuant to a license from Mitsubishi, Encysive has developed argatroban for the treatment of heparin-induced thrombocytopenia and holds the New Drug Application approved by the US FDA. Encysive has licensed the US marketing rights to argatroban to the Group. The Mitsubishi patent expires in June 2014. Barr had filed an Abbreviated New Drug Application (ANDA) with the FDA with a certification of invalidity, unenforceability and non-infringement of the Mitsubishi patent. FDA approval of that ANDA is stayed until the earlier of May 2010 or resolution of the patent infringement action. The case is in its early stages. Avandia, Avandamet and AvandametAvandaryl
In August 2003, the Group filed an action in the US District Court for the District of New Jersey against Teva Pharmaceuticals USA Inc. for infringement of the Group’s patent relating to the maleate salt form of rosiglitazone, the active ingredient inAvandia, which expires in 2015. In September 2003, the Group filed a comparable action in same court against Dr. Reddy’s Laboratories, alleging infringement of the same patent. Those actions were filed in response to Abbreviated New Drug Application (ANDA)ANDA filings with the FDA by Dr. Reddy’s Laboratories and Teva with certifications that the Group’s maleate salt patent is invalid.was invalid, unenforceable, or not infringed. Teva subsequently filed an additionala similar certification challenging the validity of the Group’s basic compound patent for rosiglitazone, and in January 2004 the Group commenced an action against Teva in the same court for infringement of that patent. The basic compound patent currently expires in 2012 after giving effect to patent term restoration and paediatric exclusivity. The actions have been consolidated and a trial date set for 6th August 2007 for the Group’s actions against Teva on the basic compound and maleate salt patents and Dr. Reddy’s on the maleate salt patent. Both Teva and Dr. Reddy’s have tentative FDA approval for all dosage strengths. The Hatch-Waxman stays against final FDA approval in respect of the ANDAs filed by both companies expired in November 2006.
In January 2005, the Group filed an action in the US District Court for the District of New Jersey against Teva for infringement of the same two patents – the basic compound and maleate salt patents for rosiglitazone. Teva had filed an ANDA with the FDA for a generic version ofAvandametwith a certification that those patents arewere invalid, unenforceable, or not infringed. FDA approval of that ANDA is stayed until the earlier of June 2007 or resolution of the patent infringement action. SinceAvandametis protected by the same patents asAvandia, any earlier holding of invalidity in theAvandiacases would be dispositive forAvandametas well. Imitrex
In December 2003,May 2007, the Group commenced an action in the US District Court for the Southern District of New York against Dr. Reddy’s Laboratories, alleging infringement of one of the two primary compound patents for sumatriptan, the active ingredient inImitrex. The patent at issue affords protection through February 2009 after giving effect to a grant of paediatric exclusivity by the FDA. The defendant had filed an ANDA with the FDA for sumatriptan oral tablets with a certification of invalidity of that compound patent but did not certify invalidity or non-infringement of the other compound patent that expires in June 2007 after giving effect to paediatric exclusivity.
In March 2004, the Group commenced an infringement action against Cobalt Pharmaceuticals which was transferred to the US District Court for the Southern District of New York. The defendant had filed an ANDA for sumatriptan oral tablets with a certification of invalidity or non-infringement of the same compound patent at issue in the Dr. Reddy’s case.
In February 2005, the Group commenced an infringement action in the US District Court for the District of Delaware against Spectrum Pharmaceuticals. The defendant had filed an ANDA for injectable sumatriptan with a certification of invalidity or non-infringement of the same compound patent at issue in the Dr. Reddy’s and Cobalt cases.
|
| GSK Annual Report 2006 | 156 |
<Back to Contents
| Notes to the financial statements | continued |
| |
43 Legal proceedingscontinued
In October 2006, the Group reached a settlement agreement with Dr. Reddy’s which provides that Dr. Reddy’s may exclusively distribute authorised generic versions of sumatriptan tablets in the USA with an expected launch date late in the fourth quarter of 2008. In November 2006, the Group reached a settlement with Cobalt which provides that Cobalt may distribute a generic version of sumatriptan tablets in the USA with an expected launch date early in the first quarter of 2009. In December 2006, the Group reached a settlement with Spectrum which provides that Spectrum may exclusively distribute authorised versions of certain sumatriptan injection products in the USA with an expected launch during the Group’s sumatriptan paediatric exclusivity period which begins in August 2008, with such launch occurring not later than early November 2008.
Lamictal
In August 2002, the Group commenced an action in the US District Court for the District of New Jersey against Teva Pharmaceuticals USA Inc., allegingfor infringement of the Group’s patent related to the maleate salt form of rosiglitazone, and the Group’s basic patent for rosiglitazone. Teva had filed an ANDA with the FDA for a generic version ofAvandaryl with a certification that those patents were invalid, unenforceable, or not infringed.
In June 2007, the Group voluntarily dismissed its infringement claims in respect of the patent covering the maleate salt form of rosiglitazone. Since Dr. Reddy’s had not challenged the basic compound patent, the dismissal of the maleate salt claim dismissed all claims against Dr. Reddy’s in respect ofAvandia.
| 152 | GSK Annual Report 2007 | | |
Back to Contents | | | FINANCIAL STATEMENTS | | | Notes to the financial statements | | | | | | | | Notes to the financial statements | | continued | |
44 Legal proceedingscontinued With respect to the Group’s patent infringement actions against Teva in respect of the basic compound and maleate salt form patents, in August 2007 the parties reached a settlement which provides that Teva may enter the US market with its generic versions ofAvandia,Avandamet andAvandaryl oral tablets late in the first quarter 2012. Other terms of the settlement remain confidential. Avodart
In February 2008, the Group filed an action in the US District Court for lamotrigine,the District of Delaware against Barr Laboratories for infringement of the basic patent covering the active ingredient inLamictalAvodartoral and the compound generally and its use to treat benign prostate hypertrophy (BPH). The basic compound patent expires in November 2015 and the other two patents expire in September 2013. Barr had filed an ANDA with the FDA with a certification of invalidity, unenforceability and non-infringement of all three patents. FDA approval of Barr’s ANDA is stayed until the earlier of July 2010, or resolution of the patent infringement action. The case is in its early stages. Boniva
In September 2007, Roche Laboratories commenced actions in the US District Court for the District of New Jersey against seven generic drug manufacturers, and in the US District Court for the Northern District of Illinois against an eighth such manufacturer in each case alleging infringement of Roche patents relating toBoniva tablets. ThatEach of the defendants had filed an ANDA with the FDA with a certification of invalidity, unenforceability or non-infringement of at least one of the Roche patents. Only one manufacturer has challenged the basic compound patent affords protection through January 2009 after giving effectwhich expires in March 2012. Final FDA approval of those ANDAs is stayed until the earlier of November 2010 or resolution of the relevant patent infringement action. The Group participates in the marketing ofBoniva pursuant to a grantco-promotion agreement with Roche. The cases are in their early stages. Combivir
In November 2007, the Group filed an action in the District Court for the District of paediatric exclusivity byDelaware against Teva Pharmaceuticals for infringement of one of its patents relating toCombivir. The patent, which covers the FDA.combination of AZT and lamivudine to treat HIV, expires in May 2012. Teva had filed an ANDA with the FDA with a certification of invalidity, unenforceability and non-infringement of that combination patent. Teva did not challenge two other patents relating toCombivir that expire in 2010 and 2016. The case is in its early stages. Coreg CR
In February 2008, the Group filed an action in the US District Court for the Eastern District of Pennsylvania against United Research Laboratories Inc./Mutual Pharmaceuticals Company, Inc. in respect of the Group’s patent.patent relating to the crystalline salt form of carvedilol, the active ingredient inCoreg CR. URL/ Mutual had filed an ANDA with the FDA with a certification of invalidity, unenforceability and non-infringement of the patents covering the crystalline salt form and delayed release technology used for manufacturing that product which expire in 2023 and 2016, respectively. In January 2008, the USPTO reissued the Group’s patent on a method of use for administration of carvedilol with other therapeutic agents. The parties reached a settlement agreement pursuant tore-issued patent, which the Group has granted Teva an exclusive royalty-bearing license to distributebeen listed in the USAOrange Book, expires in 2016. The Group’s action against URL/Mutual was amended to include a generic versionclaim for infringement of lamotrigine chewable tablets. In addition, Teva was granted the exclusive rightre-issued patent. FDA approval of URL/ Mutual’s ANDA is stayed until the earlier of June 2010 or resolution of the patent infringement action, but in no event can such approval issue prior to manufacture and sell Teva’s own generic versionthe expiration of lamotrigine tabletsthe data exclusivity period in the USA with an expected launch dateApril 2010. The case is in 2008.its early stages. Paxil/Seroxat
In the USA a number of distributors of generic drugs filed applications with the FDA to market generic versions ofPaxil/Paxil/Seroxat(paroxetine (paroxetine hydrochloride) prior to the expiration in 2007 of the Group’s patent on paroxetine hyrdrochloride hemihydrate. Other distributors sought to bring to market anhydrate or other versions of paroxetine hydrochloride and in one case paroxetine mesylate. In response the Group filed a number of patent infringement actions, all of which have concluded or been resolved except as described below. One distributor, Apotex, launched its generic product in the USA in September 2003. Additional generic products were launched by other defendants after March 2004. The Group had filed two separate patent infringement actions against all those distributors for infringement of various of the Group’s patents on the basis that the generic anhydrate and other versions infringe because they contain and/or convert to the hemihydrate form and/or infringe other Group patents. In July 1998, the Group filed an action against Apotex, one in the US District Court for the Northern District of Illinois for infringementand the other in the Eastern District of Pennsylvania. After appeals by the Group’s patent for paroxetine hydrochloride hemihydrate. Apotex had filed an ANDA with the FDA seeking approval to introduce a generic form ofPaxil. Following a trial in February 2003, the judge ruled the Group’s patent valid but not infringed by Apotex’s product. On the Group’s appealGroup to the US Court of Appeals for the Federal Circuit (CAFC), which hears all appeals from US District Courts on patent matters, the CAFC ruled that the Group’s patent was infringed but invalid based upon ‘public use’ in clinical trials prior to the filing date in the USA. The Group filedeach of these cases, and a petition to the CAFC for rehearing on its appeal by the full court and in April 2005 the full CAFC vacated that judgement and remandedremand of the matter to the same panel. Concurrently with entry of that decision,panel on one case, the panel issued a new opinion ruling the same patent invalid under an alternative theory.
Between 1999 and 2001 the Group filed further actions against Apotex in the US District Court for the Eastern District of Pennsylvania for infringement of additionalrelevant claim of the Group’s patents. In December 2002, the judge granted in part and denied in part summary judgement motions filed by Apotex with the result that issues of validity and infringement of three of the four new patents remained for trial. In July 2004, the judge certified the patent that had been held invalid for appeal to the US Circuit Court for the CAFC. In February 2006, the CAFC affirmed the judge’s ruling of invalidity of that patent.
The Group also commenced actions in the US District Court for the Eastern District of Pennsylvania against Geneva, Alphapharm, Andrx Pharmaceuticals, Zenith and Teva Pharmaceuticals in connection with their ANDA filings forPaxiland BASF and Sumika Fine Chemicals in connection with their supply ofon paroxetine hydrochloride for use in ANDAs. All the Group’s patent infringementhemihydrate was ruled invalid. Other claims against these defendantsof other patents have been resolved.ruled invalid and/or not infringed, in some cases with appeals pending or planned, and other claims are pending trial.
Apotex launched its generic product in the USA in September 2003. AdditionalIn Europe, generic products were launched by other defendants after March 2004.
The Group’s US patent litigation with Synthon BV was settled in December 2003 enabling US marketing of Synthon’s paroxetine mesylate product. This was followed with settlement in August 2004 of most of the Group’s non-US patent litigation with Synthon as a consequence of which Synthon is free to market its paroxetine mesylate product in many markets globally where it has obtained marketing authorisations. Paroxetine mesylate is a different salt form of paroxetine than that used in the marketed form ofSeroxat/Paxil. In certain markets litigation with Synthon is ongoing and Synthon is asserting counterclaims for unfair competition against the Group.
Generic products containing the anhydrate form of paroxetine hydrochloride are now on the market in most European countries. Whilst some of these products are the subject of continuing litigation, most actions have now been settledconcluded or settled. With respect to two manufacturers, Synthon BV and itFAL, litigation is expected that more will be settled inongoing and counterclaims for unfair competition have been asserted against the future. In the UK, litigation of several years standing between the Group and Apotex culminated in an Appeal Court decision that the Group’s anhydrate process patent was valid but not infringed. Group.
Following the litigation in Canada with Apotex over several other patents related to paroxetine, Apotex launched its generic product in Canada in October 2003. Apotex alleged that as a result of that litigation it had been enjoined from launching that product after receipt of regulatory approval. An action by Apotex to recover damages related to the delay occasioned by those injunctions is ongoing. Paxil CR
In November 2005, Mylan Pharmaceuticals filed an ANDA forPaxil CR(paroxetine (paroxetine hydrochloride controlled release formulation) with a certification of invalidity, unenforceability and non-infringement of several patents listed in the FDA Orange Book. There was no such certification of invalidity or non-infringementin respect of the patent covering paroxetine hydrochloride hemihydrate, which Mylan admitted is the active ingredient in its product. That patent expiresexpired in June 2007, after giving effect to a grant of paediatric exclusivity by the FDA. As the Group did not file a patent infringement action against Mylan within the 45-day period provided under Hatch-Waxman, there is no 30-month stay of FDA approval of the Mylan ANDA. A new US patent covering a delayed and controlled release formulation of paroxetine hydrochloride (Paxil CR) was issued to the Group in June 2007 and listed in the FDA Orange Book and thereafter the Group filed an action in the US District Court for the District of New Jersey against Mylan for infringement of that newly issued patent.
|
| GSK Annual Report 20062007 | 153 | 157 | |
<Back to Contents | | FINANCIAL STATEMENTS | | Notes to the financial statements | continued | |
| | | | Notes to the financial statements | | continued | | |
4344 Legal proceedingscontinued
Subsequently, the parties reached a settlement which permits Mylan to enter the market for all strengths ofPaxil CR no later than 1st October 2008. Other terms of the settlement remain confidential. Requip
In April 2005, the Group commenced an action in the US District Court for the District of Delaware against Teva Pharmaceutical USA Inc. alleging infringement of the Group’s compound patent for ropinirole hydrochloride (the active ingredient inRequip) and a method of use patent for treatment of Parkinson’s disease, both of which are listed in the FDA Orange Book. The compound patent expiresexpired in December 2007 and the method of use patent expires in May 2008. The defendant had filed an ANDA with the FDA with a certification of invalidity and non-infringement ofthat those patents. FDA approval of that ANDA is stayed until the earlier of August 2007patents were invalid, unenforceable, or resolution of the patent infringement action.not infringed. In December 2006, the judge ruled at the conclusion of the trial that the Group’s patent on the method of use of ropinirole to treat Parkinson’s Diseasedisease is novel and nonobvious rejecting Teva’s claims on those grounds. Teva’s further claim that the patent is unenforceable for inequitable conduct remains before the judge as the evidence was not reviewed at the trial. This issue is to be decided on the basis of deposition testimony and documents and consideration of further potential filings by the parties. Teva’s original challenge to the Group’s basic compound patent was withdrawn, before trial, and Teva has accepted that the FDA will not approve its product prior to expiration of that patent. In addition, Teva has stipulated that the Group’s method of use patent is valid and enforceable and that Teva’s generic version would infringe. Teva has waived its right to appeal the December 2006 judgement in favour of the Group and has agreed to wait until the expiration of the Group’s patent in May 2008 before launching their generic product. Valtrex
In May 2003, the Group commenced an action in the US District Court for the District of New Jersey against Ranbaxy Laboratories, alleging infringement of the Group’s compound patent for valacyclovir, the active ingredient inValtrex. That patent expires in 2009. The defendant has filed an ANDA with the FDA with a certification that the Group’s compound patent was invalid, unenforceable or not infringed. In August 2004,The case has been settled on terms that permit Ranbaxy filed a motion for partial summary judgement thatto enter the patent was invalid for beingmarket in ‘public use’ more than one year before the filing of the patent application and the Group filed a motion that the patent was not invalid on those grounds. In March 2005, the court ruled inlate 2009 (taking into account expected paediatric exclusivity with respect to the Group’s favour that the patent was not invalid on those grounds.basic composition of matter patent). On 1st February 2007 Ranbaxy received FDA approval for its generic valacyclovir product and notified the Group that it sought to market the product in the USA. Under the terms of an earlier agreement between the companies, previously approved by the court, Ranbaxy had agreed that if the Group applied for a preliminary injunction within 45 days of that notification Ranbaxy would not launch its product until the court either ruled on the preliminary injunction or decided the pending court case. At a conference with the court on 28th February 2007 a trial date for the case was set for 7th August 2007 and the parties agreed that it would not be necessary that the Group file a request for a preliminary injunction.
Wellbutrin XL
In December 2004, Biovail commenced actions in the US District Court for the Central District of California against Anchen Pharmaceuticals and in the US District Court for the Southern District of Florida against Abrika Pharmaceuticals, in each case alleging infringement of Biovail formulation patents forWellbutrin XL. In April 2005, Biovail filed an action in the US District Court for the Eastern District of Pennsylvania against Impax Laboratories for infringement of the same patents. Those patents expire in 2018. Each of Anchen, Abrika and Impax had filed an ANDA with the FDA with a certification of invalidity or non-infringement of the Biovail patents. The Group is the licensee under those patents. In August 2006, the judge granted Anchen’s motion and ruled that Anchen’s ANDA product did not infringe Biovail’s patent. Biovail has appealed that decision to the CAFC. A hearing on Abrika’s motion for summary judgement was heard in April 2006 but as of the date of this report no decision has been announced. Impax filed a motion for summary judgement of nonfringement in August 2006, but as of the date of this report no decision has been announced. The Group is not a party to any of those actions. In September 2005, Biovail commenced actions in the US District Court for the Southern District of New York against Watson Laboratories alleging infringement of the Biovail formulation patents. Watson’s third party counterclaim against the Group based on listing activities associated with the FDA Orange Book was dismissed in October 2006. In March 2007, Biovail announced, following a review by the US Federal Trade Commission (FTC) that was requested by the parties, a comprehensive settlement with Anchen Pharmaceuticals, Impax Laboratories, Watson Pharmaceuticals and Teva Pharmaceutical Industries. Certain aspects of the settlements remain confidential but the parties did disclose that, with defined exceptions, Anchen, Impax, Watson and Teva may not market a generic version of the 150mg strength ofWellbutrin XL until 2008. The FDA has given final approval to Anchen’s ANDA for its generic version ofWellbutrin XLand to Impax for a generic 300 mg300mg tablet product. The 300 mg300mg generic product was launched in the USA at the end of December 2006. No generic version of the 150 mg150mg tablet has been launched as of the date of this report. USPTO Action
In December 2005, Andrx PharmaceuticalsOctober 2007, the Group filed an action against the GroupUS Patent and Trademark Office in the US District Court for the SouthernEastern District of Florida, alleging thatVirginia requesting the manufacture, importation and sale ofcourt to enjoin the 150 mgWellbutrin XLproduct infringes a patent issued to Andrx in June 2005 and asking for treble damages, attorneys’ fees and that the Group and others acting in concert with it be enjoined. In February 2007, the parties reached a settlement, providing that the Group pay Andrx a $35 million license fee and that Andrx grant the Group a royalty-bearing license to its US patents coveringWellbutrin XL. Zofran
In August 2001, the Group commenced an action in the US District Court for the District of New Jersey against Reddy-Cheminor and Dr. Reddy’s Laboratories. Dr. Reddy had certified invalidity of three patents for ondansetron, the active ingredient inZofrantablets, including the compound patent that expired in July 2005 and two method of use patents, the later of which expired in December 2006, in both instances taking into account the extension for paediatric exclusivity. In July 2003, the Group filed an action against Dr. Reddy’s Laboratories in the same district court for infringement of the Group’s patentsOffice from implementing new regulations affecting substantive rights related to the orally disintegrating tablet presentationfiling and obtaining ofZofran. patents. Those regulations were due to become effective on 1st November 2007. In October 2003,2007, the Group filedcourt issued an action against West-ward Pharmaceuticals, Inc. in the same district court for infringementorder enjoining implementation of the Group’s patents related to an injectable presentation ofZofran. Bothrules until a full hearing could be held on the Dr. Reddy’s disintegrating tablet caseparties’ cross-motions for summary judgement and the West-ward case were consolidated with the earlier Dr. Reddy’s case.
|
| GSK Annual Report 2006 | 158 |
<Back to Contents
| Notes to the financial statements | continued |
| |
43 Legal proceedingscontinued
Prior to the trial both Reddy-Cheminor and West-ward withdrew their challenge to the compound patent. The trial over infringement and validitya final decision is rendered. That hearing was held on 8th February 2008 but no decision has been reported as of the Group’s methoddate of use and process patents was completed in June 2004 and closing arguments were heard in May 2005. The parties subsequently reached a settlement agreement, the terms of which remain confidential.
In March 2002, the Group filed a similar action against Teva Pharmaceuticals USA Inc. in the US District Court for the District of Delaware alleging infringement of the two method of use patents for ondansetron. Teva had certified invalidity or non-infringement of the two method of use patents. Teva did not challenge the compound patent. The trial judge ruled in the Group’s favour, upholding the validity of the method of use patents. Following an appeal by Teva to the CAFC, the parties reached a settlement agreement, the terms of which remain confidential.
In January 2003, the Group commenced an action against Kali Laboratories (now Par Pharmaceutical Company) in the US District Court for the District of New Jersey involving orally disintegratingZofrantablets. The trial judge denied Kali’s summary judgement motion and granted the Group’s summary judgement motions in June 2005 and July 2005, affirming the validity of the Group’s method of use patents and holding that Kali’s proposed generic product would infringe those patents. Following an appeal by Kali to the CAFC, the parties reached a settlement agreement, the terms of which remain confidential.this report.
Following the settlement agreements referred to above, generic ondansetron tablet products were launched by a number of distributors in the USA in December 2006.
Product liability
Pre-clinical and clinical trials are conducted during the development of potential products to determine the safety and efficacy of products for use by humans following approval by regulatory bodies. Notwithstanding these efforts, when drugs and vaccines are introduced into the marketplace, unanticipated side effects may become evident. The Group is currently a defendant in a number of product liability lawsuits related to the Group’s pharmaceutical products. The most significant of those matters are described below. PaxilAvandia
TheIn May 2007, the New England Journal of Medicine (NEJM) published an article onAvandia in which the author, based on a meta-analysis of 42 clinical trials, raises concerns that use of the drug rosiglitazone (Avandia) may be associated with an increased risk of heart attack and cardiovascular death in comparison to the use of a placebo or other anti-diabetic therapies. Following publication of the NEJM article, the Group has receivedbeen named in product liability lawsuits and claims filed on behalf of patients alleging that they have suffered symptoms on discontinuing treatment withPaxil(paroxetine). Separately, the Group has received lawsuitsindividuals and claims that patients who had commencedPaxiltreatment committed or attempted to commit suicidepurported class action cases asserting consumer fraud and/or acts of violence. The Group has also received lawsuits andpersonal injury claims alleging that use ofPaxilduring pregnancy resulted in the birth of a child with birth defects or health issues.
The Group received lawsuits filed in state and federal courts in the USA and Canada on behalf of thousandspurchasers and users of plaintiffs, including purported class actions, alleging that paroxetine (the active ingredient inPaxilAvandia) is addictive and causes dependency and withdrawal reactions. Plaintiffs sought remedies including compensatory, punitive and statutory damages and the cost. The federal cases are part of a fund for medical monitoring. In 2003, a federal judge in the US District Court for the Central District of California denied class action certifications for a nationwide class and a California statewide class as to cases filed in federal court in that district. Subsequently, on petition from plaintiffs’ counsel all federal court cases were transferred to that District Court for consolidation in Multidistrict Litigationmulti-district litigation (MDL). In January 2006, a conditional settlement agreement that included more than 90 per cent of the pending claims based on symptoms on discontinuingPaxiltreatment became effective. The Group did not, as part of the settlement, admit any liability with respect to the allegations in any of the suits. Virtually all the personal injury lawsuits concerning discontinuation symptoms have now been resolved by settlement or dismissal. One purported class action consumer fraud lawsuit focused on discontinuation symptoms continues in California state court. There is also purported class action litigation in Canada concerning symptoms on discontinuation ofPaxil.
The Group has received numerous claims and lawsuits alleging that treatment withPaxilhas caused homicidal or suicidal behaviour exhibited by users of the product. Class certification was denied in January 2007 in the one purported personal injury class action lawsuit proceeding which is pending in the US District Court for the Eastern District of Pennsylvania. In January 2005, the FDA approved a black box warning that antidepressants increased the risk of suicidal thoughts or behaviourCases have also been filed in paediatric patients and other strengthened warnings for selective serotonin reuptake inhibitor (SSRI) products, includingPaxil, as a class. In May 2006, thePaxilUS label was updated to warn that young adults, especially those with Major Depressive Disorder, may bestate courts. The litigation is at increased risk for suicidal behaviour during treatment with paroxetine. In December 2006, the FDA held an Advisory Committee meeting following a review of data regarding suicidal thoughts and behaviours in clinical studies of various antidepressants in adults. The FDA is expected to update the label for antidepressants as a class to advise of a possible increased risk for suicidal behaviour in young adults.early stage.
The Group has received numerous lawsuits and claims alleging that use ofPaxilduring the first trimester of pregnancy resulted in the birth of a child with a heart defect or other birth defect. The Group is also involved in litigation alleging that the use ofPaxilduring pregnancy resulted in the birth of a baby with primary pulmonary hypertension of the newborn. In September 2005, the US label forPaxilwas updated to reflect new information that suggested an increased risk of congenital malformations (particularly cardiovascular malformations) in infants born to mothers who tookPaxilduring the first trimester of pregnancy. In December 2005, thePaxilUS label was further updated to include new data and to strengthen the pregnancy warning from Category C to Category D, which indicates there is evidence of risk to the foetus, but the potential benefits from the use of the drug in pregnant women may outweigh the risk. In May 2006, thePaxilUS label was again updated to include a class warning concerning persistent pulmonary hypertension of the newborn in mothers who tookPaxilafter the 20th week of pregnancy.
| 154 |
| GSK Annual Report 20062007 | 159 | |
<Back to Contents | FINANCIAL STATEMENTS | | | Notes to the financial statements | | | | | | | | Notes to the financial statements | | continued |
| | |
4344 Legal proceedingscontinued
Phenylpropanolamine
Following a report from the Yale Haemorrhagic Stroke Project that found a suggestion of an association between first use of phenylpropanolamine (PPA) decongestant and haemorrhagic stroke, the Group and most other manufacturers have voluntarily withdrawn consumer healthcare products in which PPA was an active ingredient. Since the PPA product withdrawal the Group has been named as a defendant in numerous personal injury and class action lawsuits filed in state and federal courts alleging personal injury or increased risk of injury from use of products containing PPA and unfair and deceptive business practices. Plaintiffs seek remedies including compensatory and punitive damages and refunds.
The federal cases have been consolidated in a multidistrict litigation proceeding in the US District Court for the District of Washington. The judge responsible for those proceedings has denied class certification and struck all class allegations in the federal personal injury and consumer refund class actions. Class certification has been denied in California state court and a Pennsylvania state court putative class action has been dismissed, leaving no putative class actions pending against the Group in this litigation. A substantial number of cases in which the Group or other manufacturers are defendants have reached trial in state and federal courts. Manufacturers have for the most part received favourable outcomes at trial.
Baycol
In August 2001, Bayer AG withdrewBaycol(cerivastatin (cerivastatin sodium) worldwide in light of reports of adverse events, including deaths, involving rhabdomyolosis.rhabdomyolysis. The Group had participated in the marketing ofBaycolin the USA pursuant to a co-promotion agreement with Bayer which was the licence holder and manufacturer of the product. Following the withdrawal, Bayer and the Group have beenwere named as defendants in thousands of lawsuits filed in state and federal courts in the USA on behalf of both individuals and putative classes of formerBaycolusers. A number of the suits allege that the plaintiffs have suffered personal injuries, including rhabdomyolosis,rhabdomyolsis, from the use ofBaycol. Others claim that persons who tookBaycol, although not injured, may be at risk of future injury or may have suffered economic damages from purchasing and usingBaycol. Plaintiffs seek remedies including compensatory, punitive and statutory damages and creation of funds for medical monitoring. The Group and Bayer Corporation, the principal US subsidiary of Bayer AG, have signed an allocation agreement under which Bayer Corporation has agreed to pay 95 per cent95% of all settlements and compensatory damages judgements, with each party retaining responsibility for its own attorneys’ fees and any punitive damages. The federal cases have been consolidated in aan MDL proceeding in the US District Court for the District of Minnesota. To date two statewide class actions have been certified – a medical monitoring case in Pennsylvania and a Consumer Fraud and Deceptive Business Practices Act case in Illinois. The medical monitoring action was dismissed by the court on summary judgement. Another class action, in which GSK was not named as a defendant, has been certified in Oklahoma. A substantial number ofMore than 3,000 claims for death or serious injury have been settled and manythousands of others alleging muscle aches and pains have been voluntarily or involuntarily dismissed. Paxil and Paxil CR
The Group has received lawsuits and claims alleging that use ofPaxil (paroxetine) during pregnancy resulted in the birth of a child with birth defects or health issues. Separately, the Group has received lawsuits and claims that patients who tookPaxil committed or attempted to commit suicide and/or acts of violence. The Group also has received lawsuits and claims filed on behalf of patients alleging that they suffered symptoms on discontinuing treatment withPaxil. The Group has received numerous lawsuits and claims alleging that use ofPaxil during pregnancy resulted in the birth of a child with a congenital malformation or persistent pulmonary hypertension of the newborn. In September 2005, the US label forPaxilwas updated to reflect new information that suggested an increased risk of congenital malformations (particularly cardiovascular malformations) in infants born to mothers who tookPaxil during the first trimester of pregnancy. In December 2005, thePaxil US label was further updated to include new data and to strengthen the pregnancy warning from Category C to Category D, which indicates there is evidence of risk to the foetus, but the potential benefits from the use of the drug in pregnant women may outweigh the risk. In May 2006, thePaxil US label was again updated to include a class warning concerning persistent pulmonary hypertension of the newborn arising in mothers who took selective serotonin reuptake inhibitor (SSRI) antidepressants after the 20th week of pregnancy. Fen-PhenThe Group has received numerous claims and lawsuits alleging that treatment with
Paxil has caused homicidal or suicidal behaviour exhibited by users of the product. Class certification was denied in January 2007 in a purported personal injury class action lawsuit. In 1997,January 2005, the FDA became awareapproved both a boxed warning that antidepressants increased the risk of reportssuicidal thoughts or behaviour in paediatric patients and other strengthened warnings for SSRI products, includingPaxil, as a class. In May 2006, thePaxil US label was updated to warn that young adults, especially those with Major Depressive Disorder, may be at increased risk for suicidal behaviour during treatment with paroxetine. In August 2007, FDA required updated US labels for antidepressants as a class to state in the boxed warning that antidepressants increased the risk of cardiac valvular problemssuicidal thinking and behaviour in individuals for whom fenfluramine or dexfenfluramine alone orchildren, adolescents, and young adults; that no increase was shown beyond age 24; that there was a reduction in combinationrisk in adults aged 65 and older; and that depression and other psychiatric disorders are themselves associated with phentermine was prescribed as part of a regimen of weight reduction and requested the voluntary withdrawal of fenfluramine and dexfenfluramine from the market. increased risk.
The reports of cardiac valvular problems and the subsequent withdrawal of those products form the market spawned numerous product liabilityGroup received lawsuits filed against the manufacturers and distributors of fenfluramine, dexfenfluramine and phentermine. As one of a number of manufacturers of phentermine, the Group remains a defendant in less than one hundred of several thousand lawsuits that were filed in various state and federal district courts in the USA against the Group and other defendants. Most of the lawsuits seek relief including some combination of compensatory and punitive damages, medical monitoring and refunds for purchases of drugs. In 1997, the Judicial PanelCanada on Multidistrict Litigation issued an order consolidating and transferring all federal actions to the US District Court for the Eastern District of Pennsylvania. That court approved a global settlement proposed by defendant Wyeth, which sold fenfluramine and dexfenfluramine. The settlement, subsequently approved by the Third Circuit Court of Appeals, does not include any of the phentermine defendants, including the Group. Individual plaintiffs may elect to opt out of the class settlement and pursue their claims individually and tensbehalf of thousands of plaintiffs, including purported class actions, alleging that paroxetine (the active ingredient in Paxil) is addictive and causes dependency and withdrawal reactions. The US federal cases were consolidated in an MDL proceeding. In January 2006, a conditional settlement agreement became effective. The Group did not admit liability with respect to the allegations in the lawsuits. Virtually all the US actions have electednow been resolved. One purported class action consumer fraud lawsuit, focused on discontinuation symptoms, is on appeal from denial of class certification in California state court. There is purported class action litigation in Canada. The Group is also defending litigation which has commenced in the UK on behalf of hundreds of plaintiffs who allege that paroxetine has caused them to do so. Wyeth continues to settle individual state court cases before trialsuffer from withdrawal reactions and the Group continues to be dismissed from lawsuits as they are settled by Wyeth.dependency.
Thimerosal
The Group, along with a number of other pharmaceutical companies, has been named as a defendant in numerous individual personal injury lawsuits in state and federal district courts in the USA alleging that thimerosal, a preservative used in the manufacture of vaccines, causes neurodevelopmental disorders and other injuries, including autism. Two of the cases are purported class actions although there has been no determination whether any of those cases will be permitted to proceed as a class action. A number of purported class actions in other jurisdictions have been withdrawn or dismissed. Plaintiffs seek remedies including compensatory, punitive and statutory damages and the cost of a fund for medical monitoring and research. As of the date of this report, in the limited number of cases that have approached trial dates, vaccine manufacturers and manufacturers of other thimerosal-containing medicinal products have been successful in excluding testimony of plaintiffs’ expert witnesses on causation, on grounds that plaintiffs have failed to establish that the hypothesized link between thimerosal and neurodevelopmental disorders is generally accepted as reliable within the relevant scientific community. As of the date of this report there are no cases scheduled for trial in 20072008 in which the Group is a defendant.
|
| GSK Annual Report 20062007 | 155 | 160 | |
<Back to Contents | | FINANCIAL STATEMENTS | | Notes to the financial statements | continued | |
| | | | Notes to the financial statements | | continued | | |
4344 Legal proceedingscontinued
Sales and marketing and regulation
Marketing and promotion
In February 2004, the Group received a subpoena from the US Attorney’s office in Colorado regarding the Group’s sales and promotional practices relating to nine of its largest selling products, for the period from January 1997 to the present. In particular, the government has inquired about alleged promotion of these drugs for off-label uses as well as Group sponsored continuing medical education programmes, other speaker events, special issue boards, advisory boards, speaker training programmes, clinical studies, and related grants, fees, travel and entertainment. Although the original subpoena was issued from the US Attorney’s office in Colorado, the scope of the inquiry is nationwide. The Groupgovernment is co-operating withalso inquiring about the investigation and providing the requested information. The Group had earlier respondedGroup’s response to an October 2002 letter from the FDA’s Division of Drug Marketing, Advertising and Communication requesting information on the Group’s alleged promotion ofWellbutrin SRfor off-label use. In June 2005, the Group and other pharmaceutical manufacturers received a letter from the US Senate Finance Committee in which the Committee expressed concern that educational grants were being improperly used to promote drug products and requesting that each company provide detailed information and documents about its use of educational grants. In January 2006, the Group and the same manufacturers received a second letter from the Committee asking for additional information on the Group’s internal grant approval process, grants to medical/physician/professional organisations, academic institutions or state agencies to support journal articles and other publications and grants to patient education or advocacy groups. The Group is co-operating inwith the Committee’s investigation and providing the requested information.
In February 2003, the Verona Public Prosecutor commenced a criminal investigation into GSK’sthe Group’s sales and marketing practices in Italy. Specific areas of investigation include medical education programmes, clinical studies and congresses as well as the interaction between GSKthe Group’s representatives and physicians. The Public Prosecutor has proposed that a number of physicians and representatives of the Group face criminal charges and a hearing has been set for October 2008. The US Securities and Exchange Commission (SEC) staff has initiated an investigation into the allegations. The Group is co-operating with both of thesethe investigations. In February 2006,Following a United Nations report alleging that bribes had been paid to Iraqi government officials in connection with the UN Oil for Food Programme, the Group received a subpoena from the SEC in February 2006 in respect of the Group’s participation in that programme. The US Department of Justice also initiated an investigation. In December 2007, the United Nations Oil for Food Programme.UK Serious Fraud Office issued a formal notice to the Group requiring production of documents related to the Group’s participation in the programme. The Group is co-operating with the SECinvestigations and providing documents responsive to the subpoena. The US Department of Justice is also investigating this matter.subpoena and the notice.
Average wholesale price
GSK has responded to subpoenas from the Office of the Inspector General of the US Department of Health and Human Services (HHS), the US Department of Justice and the states of Texas and California in connection with allegations that pharmaceutical companies, including GSK, have violated federal fraud and abuse laws, such as the Federal False Claims Act (and,and, comparable state laws with respect to Texas and California, comparable state laws) as a result of the way ‘average wholesale price’ (AWP) was determined and reported for certain drugs and the way the Medicare and Medicaid programmes reimburse for those drugs. In September 2005, the Group reached a civil settlement with the US Department of Justice, the US Attorney for the District of Massachusetts and the Office of the Inspector General for HHS (the “DOJ Settlement”‘DOJ Settlement’). The Group agreed to pay the government a civil settlement of $149 million in respect of the marketing ofZofran andKytril, which included settlement amounts for each of the states for the claims being settled. As part of the settlement the corporate integrity agreement to which the Group is a party was amended to address issues raised in the course of the government investigation. Subsequent to the initial subpoenas, a number of states through their respective attorneys general and most of the counties in New York state filed civil lawsuits in state and federal courts against GSK and many other drug companies. The actions claim, on behalf of the states as payers (and in some cases on behalf of in-state patients as consumers), damages and restitution due to AWP-based price reporting for pharmaceutical products covered by the states’ Medicaid programmes (and in some cases by other governmental programmes). In addition, private payer class action lawsuits were filed against GSK in multiple federal district and state courts. All the federal cases were consolidated in a MDL proceeding in the US District Court for the District of Massachusetts. In August 2005, the judge in that MDL proceeding granted in part and denied in part the private-payer plaintiffs’ motion for class certification, thereby narrowing the scope of the class claims. In August 2006 the Group reached civil settlements to resolve the class action litigation and certain of the state attorney general claims. The Group agreed to a nationwide settlement (subject to court approval) of $70 million to resolve these claims.claims which was approved by the trial court in August 2007. The Group separately resolved potential AWP claims by state Medicaid programmes in more than two-thirds of the states through the procedures established by the DOJ Settlement, and also fully resolvedSettlement. AWP lawsuits filed or threatened by a number of state attorneys general.general were also fully resolved. Litigation concerning AWP issues is continuing with a group of other state attorneys generalten states as well as with New York counties. Nominal pricing
The Group responded to two letter requests from the US Senate Committee on Finance, dated April 2004 and February 2005, for documents and information relating to the nominal price exception to the best price reporting requirements under the Medicaid Drug Rebate Programme. There has been no further activity in connection with this inquiry byIn January 2007, the Committee ascommittee released its findings that some pharmaceutical manufacturers inappropriately used the nominal price exception contrary to the Group since September 2005.committee’s interpretation of Congressional intent. In May 2004, the Group was advised by the US Department of Justice that they are investigating certain of the Group’s nominal pricing and bundled sales arrangements to determine whether those arrangements qualify under the exception to the best price reporting requirements or violate civil statutes or laws. The Group is co-operating in that investigation and has provided documents and information to the Department of Justice regarding nominal pricing arrangements for a number of the Group’s products. In March 2007, the Group received two subpoenas from the Delaware Attorney General’s Office seeking documents related to nominal price contracts with hospitals and healthcare providers located in Delaware. Other pharmaceutical companies have received similar subpoenas. The Group is providing documents responsive to the subpoenas. In addition to these governmental investigations, allegations concerning nominal pricing have been made by certain government payers as part of the AWP litigation.
| 156 |
| GSK Annual Report 20062007 | 161 | |
<Back to Contents | FINANCIAL STATEMENTS | | | Notes to the financial statements | | | | | | | | Notes to the financial statements | | continued |
| | |
4344 Legal proceedingscontinued
Paxil/Seroxat
Following announcement of the New York State Attorney General’s office about the state’s lawsuit, subsequently settled in August 2004, alleging failure to disclose data on the use ofPaxilin children and adolescents, similar cases, some of which purport to be class actions, have beenwere filed in state and federal and Canadian courts by private plaintiffs seeking to recover amounts paid forPaxilpurchased for use by patients under age 18. The Canadian litigation has been dismissed. The Group reached a class settlement agreement in an Illinois state court action that would includeincludes all persons in the USA who boughtPaxilfor someone under age 18. The Group denies any liability. The agreement relates only to the cost of purchasingPaxilfor use by paediatric patients and does not include any personal injury claims. The settlement received preliminary approvalwas approved by the court in April 2007. Remaining are four lawsuits seeking recovery on behalf of insurance companies and other third-party payers for payments for prescriptions ofPaxilto children and adolescents. The Group was granted partial summary judgement dismissing class claims in one of those cases. Discovery is underway in a judgestate court action in Madison County, Illinois in October 2006. The final fairnessCalifornia pending a hearing on the settlement is scheduled for 25th April 2007.class certification. In the UK an investigation remains pending by the UK Medicines and Healthcare products Regulatory Agency (MHRA) to determine whether the Group has complied with its pharmacovigilencepharmacovigilance obligations in reporting data from clinical trials forSeroxat/Seroxat/Paxilin children and adolescents. Cidra, Puerto Rico manufacturing site
Following FDA inspections in October 2003 and November 2004 which resulted in observations of possible deficiencies in manufacturing practices at the Group’s manufacturing facility in Cidra, Puerto Rico, in March 2005 the FDA halted distributionseized certain lots of supplies ofPaxil CRandAvandametdue to manufacturing issues. The FDA observations related to certain aspects of production controls, process validation and laboratory investigations. The Cidra site is engaged in tableting and packaging for a range of GlaxoSmithKline products – primarily for the US market – including Paxil,Paxil CR,Coreg,Avandia, andAvandamet. In April 2005 the Group reached agreement with the FDA on a Consent Decree. The Consent Decree provides for an independent expert to review manufacturing processes at the site for compliance with FDA Good Manufacturing Practice (GMP) requirements. As provided in the Consent Decree, in September 2005 the Group provided a report to the FDA on the deficiencies identified in this review, setting out a corrective plan and timetable for completion. The Group remains fully committed to working cooperatively withanticipates completion of the work identified in that plan by mid-2008. In March 2007, the FDA to address any issuescompleted a general GMP inspection which resulted in a timely fashion.four inspectional observations. The Group has resumed manufacturebeen advised by the FDA that the Group’s response to the inspectional observations is satisfactory.
In October 2007 the Group announced plans to cease operations at the Cidra site but expects to continue production ofPaxil CR at the site until that production can be transferred to another facility which the Group currently expects to take place in 2009. Production of all other products at the site. In June 2006,site was discontinued by the FDA confirmed that the status for the site had been upgraded to ‘voluntary action indicated,’ which means that the FDA deems the site acceptable for the exportend of products and for routine manufacturing operations.2007. No financial penalties have been imposed underIn October 2003, the Consent Decree. The Consent Decree allows for potential future penalties upUS federal government executed a search warrant at the Cidra facility and seized records relating to a maximum of $10 million a year if the Group fails to meetmanufacturing operations at the terms of the Consent Decree.site.
In April 2005, the Group received a subpoena from the US Attorney’s Office in Boston requesting production of records regarding manufacturing at the Cidra site, covering the same type of information as that collectedis similar to that seized by the US government in Puerto Rico in 2003. Subsequently, in August 2007 and January 2008, the Group received two additional subpoenas from the government related to the Cidra facility. The Group is co-operating with the US Attorney’s Office and producing the records responsive to the subpoena. subpoenas. In addition, in July 2007, the Group learned that the US District Court for the District of Massachusetts had unsealed a complaint brought by a former employee under the federal False Claims Act claiming monetary damages as a result of the alleged failure of the Cidra facility to comply with GMP in the manufacture of various products. The Group is also named in two purported consumer fraud class action lawsuits – one filed in California state court and the other in the US District Court for the District of Puerto Rico – alleging thatPaxil CRand/orPaxilOral Suspensionproducts were not manufactured according to GMP. Plaintiffs seek economic, statutory and punitive damages, along with a request for injunctive relief. There has not yet been any determination whether either case will be permitted to proceed as a class action. Anti-trust
Paxil/Seroxat
In the paroxetine patent infringement actions brought by the Group as described under ‘Intellectual property’ above, Apotex Alphapharm, BASF and Sumika havecertain other companies filed anti-trust and unfair competition counterclaims against the Group in the US District Court for the Eastern District of PennsylvaniaPennsylvania. These were based on allegations that the Group monopolised a ‘market’ forPaxilby bringing allegedly sham patent litigation and allegedly abusing the regulatory procedures for the listing of patents in the FDA Orange Book. Whilst the Apotex matter remains in the discovery stage, the Alphapharm and BASF matters with the other companies have been resolved and a settlement agreement in principle has been reached with Sumika.resolved. In November 2000, the US Federal Trade Commission (FTC)FTC staff advised the Group that they were conducting a non-public investigation to determine whether the Group was violating Section 5 of the Federal Trade Commission Act by ‘monopolising or attempting to monopolise’ the market‘market’ for paroxetine hydrochloride by preventing generic competition toPaxiland requested the Group to submit certain information in connection with that investigation. In October 2003, the FTC closed its investigation on the basis of its finding that no further action was warranted. Following public reference to the FTC investigation regardingPaxil, a number of governmental and private civil actions and claims were initiated in the USA. All have been resolved with the exception of a private indirect purchaser opt-out lawsuit brought in the Minnesota state court.courts. That matter is in the discovery phase. Additionally, class actions have been filed in provincial courts in Canada on behalf of direct and indirect purchasers. Those cases are in their early stages.
|
| GSK Annual Report 2006 | 162 |
<Back to Contents
| Notes to the financial statements | continued |
| |
43 Legal proceedingscontinued
In October 2005, the Competition Directorate of the European Commission initiated an inspection concerning allegations that the Group has abused a dominant position in the marketplace concerning enforcement of its intellectual property rights, litigation surrounding regulatory approvals and marketing ofSeroxatin Europe. In October 2006, the Commission made a formal request for further information. The Group continuesresponded to co-operate fullythis request by the end of 2006.
| GSK Annual Report 2007 | 157 | | |
Back to Contents | | | FINANCIAL STATEMENTS | | Notes to the financial statements | | | | | | | Notes to the financial statements | | continued | |
44 Legal proceedingscontinued In January 2008, the European Commission announced an inquiry into certain aspects of competition in the pharmaceutical sector and initiated inspections at the premises of a number of innovative and generic pharmaceutical companies, including the Group. The Group is co-operating with the Commission.Commission in its investigation. Canadian importation
The Group has been named in seven purported class action lawsuits along with eight other pharmaceutical companies. Following the Group’s actions in 2003 to reduce illegal importation of prescription drugs from Canada, the lawsuits alleged that the companies entered into an unlawful conspiracy to prevent Canadian pharmacies from selling their products to US customers. Those lawsuits were consolidated into one action before the US District Court for the District of Minnesota. The Group’s motion to dismiss the consolidated action was granted by the court and affirmed by the US Circuit Court of Appeals for the Eighth Circuit in November 2006.
In relation to the same matter, the Minnesota state attorney general has filed a civil investigative demand and, subsequently, a complaint alleging that the Group has violated state anti-trust and commercial laws. That case is still in the discovery phase.
The Group has also been named as a defendant, along with thirteen other drug companies, in a state court action in California, in which the plaintiffs, independent pharmacies, allege that the defendants unlawfully conspired to keep prices artificially high in the USA to the detriment of the plaintiffs. In December 2006, the trial judge granted the Group’s motion for summary judgement. Plaintiffs have filed an appeal with the California Court of Appeals.
Wellbutrin SR
In December 2004, and January 2005 and February 2005, lawsuits, several of which purported to be class actions, were filed in the US District Court for the Eastern District of Pennsylvania against the Group on behalf of direct and indirect purchasers ofWellbutrin SR. The complaints allege violations of US anti-trust laws through sham litigation and fraud on the patent office by the Group in obtaining and enforcing patents coveringWellbutrin SR. The complaints follow the introduction of generic competition toWellbutrin SRin April 2004, after district and appellate court rulings that a generic manufacturer did not infringe the Group’s patents. The parties are involved in discovery. Secondary wholesaler
In July 2006, RxUSA Wholesale, Inc., a ‘secondary wholesaler’, filed suit against the Group and many other pharmaceutical manufacturers and wholesalers in the US District Court for the Eastern District of New York. The complaint alleges that the defendants engaged in a conspiracy to refuse to supply pharmaceutical products to RxUSA in violation of federal and state anti-trust laws. The Group’s motion to dismiss the complaint isremains pending. Commercial and corporate
Relenza
In May 2004, Biota Holdings Limited filed a complaint in the Victorian Supreme Court in Australia alleging that the Group had failed to fulfil its development, promotion and production obligations for zanamivir (Relenza) under the terms of the licence agreement between the Group and Biota. Biota is seeking substantial cash damages. The Group believes that it has adhered to its obligations under the licence agreement. The parties are involved in extensive discovery. Securities class actionactions
In September 2005, attorneys representing a purported class of purchasers of GlaxoSmithKline shares and American Depositary Shares (ADSs) filed a second amended securities class action complaint against the Group in the US District Court for the Southern District of New York, alleging that the Group violated US securities laws through failure to disclose unfavourable clinical data from studies onPaxil, misrepresentation of the remaining patent protection forPaxilandAugmentinand violation of the Federal False Claims Act on the basis of the Group’s recent AWP settlement with the government. In October 2006, the judge entered an order dismissing the complaint. Plaintiffs have filed an appeal with the US Court of Appeals for the Second Circuit. Oral argument on the appeal has been set for 5th March 2008. In November 2007, attorneys purporting to represent a class of purchasers of GlaxoSmithKline shares and ADSs filed an amended consolidated complaint against the Group and senior officers in the US District Court for the Southern District of New York alleging that the Group and the individual defendants violated US securities laws and artificially inflated the price of GlaxoSmithKline’s stock by misleading investors about the safety ofAvandia. The amended consolidated complaint also alleges that several current and former senior officers and members of the Group engaged in insider trading. A motion to dismiss the complaint has been filed on behalf of the Group and the individual defendants. Relenza
In May 2004, Biota Holdings Limited filed a complaint in the Victorian Supreme Court in Australia alleging that the Group had failed to fulfil its development, promotion and production obligations for zanamivir (Relenza) under the terms of the licence agreement between the Group and Biota. Biota is seeking substantial cash damages. The Group believes that it has adhered to its obligations under the licence agreement. The parties are involved in extensive discovery. The Court has ordered the parties to mediate by the end of July 2008 and has scheduled the trial to commence in August 2008. Overtime claims
In December 2006, two purported class actions were filed in the US District Courts for the Central and Southern Districts of California against the Group on behalf of all the Group’s US pharmaceutical sales representatives. TheThese actions, which were filed in or transferred to the US District Court for the Central District of California allege that those representatives are not ‘exempt’ employees under California law and/or the US Fair Labor Standards Act and consequently entitled to overtime pay. The suits seek double damages for all overtime allegedly worked by the Group’s sales representatives over a three-year period together with attorneys’ fees. The cases are in their early stages. Similar actions have been filed against other pharmaceutical companies. The casesIn several of those actions, courts have found in favour of the companies and dismissed the actions. Those dismissals are in their early stages.now on appeal. Environmental matters
GSK has been notified of its potential responsibility relating to past operations and its past waste disposal practices at certain sites, primarily in the USA. Some of these matters are the subject of litigation, including proceedings initiated by the US federal or state governments for waste disposal site remediation costs and tort actions brought by private parties. GSK has been advised that it may be a responsible party at approximately 29 sites, of which 14 appear on the National Priority List created by the Comprehensive Environmental Response Compensation and Liability Act (Superfund).
|
| GSK Annual Report 2006 | 163 |
<Back to Contents
| Notes to the financial statements | continued |
| |
43 Legal proceedingscontinued
These proceedings seek to require the operators of hazardous waste facilities, transporters of waste to the sites and generators of hazardous waste disposed of at the sites to clean up the sites or to reimburse the government for cleanup costs. In most instances, GSK is involved as an alleged generator of hazardous waste although there are a few sites where GSK is involved as a current or former operator of the facility. Although Superfund provides that the defendants are jointly and severally liable for cleanup costs, these proceedings are frequently resolved on the basis of the nature and quantity of waste disposed of at the site by the generator. GSK’s proportionate liability for cleanup costs has been substantially determined for about 20 of the sites referred to above. GSK’s potential liability varies greatly from site to site. While the cost of investigation, study and remediation at such sites could, over time, be substantial, GSK routinely accrues amounts related to its share of the liability for such matters. Tax matters
Pending tax matters are described in Note 12.
| 158 |
| GSK Annual Report 20062007 | 164 | |
<Back to Contents | | Investor information | | | | | | | |
Investor information | | | |
ThisThe investor information section includes the financial record presenting historical information analysedprepared in accordance with current reporting practice. The transition date to IFRS for GSK was 1st January 2003. Therefore,as adopted by the 2006, 2005, 2004 and 2003 information included in the Five year record is in accordance with IFRS. The 2002 information is in accordance with UK GAAP.
To provide a link between IFRS and UK GAAP, 2003 information is presented also under UK GAAP. The accounting policies used in the preparation of the UK GAAP information are disclosed in the 2004 Annual Report. Information prepared under IFRS is not directly comparable with information prepared under UK GAAP.
The Five year record also presents information in accordance with US GAAP.European Union.
This section also discusses shareholder return, in the form of dividends and share price movements, and provides other information for shareholders.
|
| GSK Annual Report 20062007 | 159 | 165 | |
<Back to Contents | | INVESTOR INFORMATION | | Financial record | Quarterly trend | |
| | | | Financial record | | Quarterly trend | | |
An unaudited analysis is provided by quarter of the Group results and pharmaceutical sales by therapeutic area in Sterling for the financial year 2006.2007. | Income statement | | | 12 months 2006 | | | | Q4 2006 | | | | Income statement – total | | 12 months 2007 | | Q4 2007 | | | |
|
|
| |
|
|
| |
| |
| | | | £m | | CER % | | £% | | £m | | CER % | | £% | | £m | | CER% | | £% | | £m | | CER% | | £% | |
|
|
|
|
|
| |
| | | Turnover – Pharmaceuticals | 20,078 | | 9 | | 8 | | 5,136 | | 8 | | 1 | | 19,233 | | – | | (4 | ) | 5,047 | | (2 | ) | (2 | ) | | – Consumer Healthcare | 3,147 | | 6 | | 5 | | 823 | | 9 | | 3 | | | | �� – Consumer Healthcare | | 3,483 | | 14 | | 11 | | 927 | | 11 | | 13 | |
|
|
|
|
|
| |
| | | Total turnover | 23,225 | | 9 | | 7 | | 5,959 | | 9 | | 1 | | 22,716 | | 2 | | (2 | ) | 5,974 | | – | | – | | | Cost of sales | (5,010 | ) | 6 | | 5 | | (1,445 | ) | 15 | | 11 | | (5,317 | ) | 8 | | 6 | | (1,639 | ) | 13 | | 13 | | | Selling, general and administrative | (7,257 | ) | – | | – | | (1,934 | ) | – | | (5 | ) | (6,954 | ) | – | | (4 | ) | (1,823 | ) | (6 | ) | (6 | ) | | Research and development | (3,457 | ) | 11 | | 10 | | (980 | ) | 6 | | 1 | | (3,327 | ) | (1 | ) | (4 | ) | (1,043 | ) | 7 | | 6 | | | Other operating income | 307 | | | | | 100 | | | | 475 | | 119 | |
|
|
|
|
|
| |
| | | Operating profit | 7,808 | | 17 | | 14 | | 1,700 | | 19 | | 4 | | 7,593 | | 3 | | (3 | ) | 1,588 | | (7 | ) | (7 | ) |
|
|
|
|
|
| |
| | | Finance income | 287 | | | | | 83 | | | | 262 | | 52 | | | Finance costs | (352 | ) | | | | | (86 | ) | | | | (453 | ) | | (119 | ) | | | Share of after tax profits of associates and joint ventures | 56 | | | | | 13 | | | | 50 | | 10 | |
|
|
|
|
|
| |
| | | Profit before taxation | 7,799 | | 19 | | 16 | | 1,710 | | 22 | | 6 | | 7,452 | | 2 | | (4 | ) | 1,531 | | (11 | ) | (10 | ) | | Taxation | (2,301 | ) | | | | | (505 | ) | | | | (2,142 | ) | | (455 | ) | | | Tax rate % | 29.5 | % | | | | | 29.5 | % | | | | 28.7 | % | | 29.7 | % | |
|
|
|
|
|
| |
| | | Profit after taxation for the period | 5,498 | | 17 | | 14 | | 1,205 | | 20 | | 5 | | 5,310 | | 3 | | (3 | ) | 1,076 | | (11 | ) | (11 | ) |
|
|
|
|
|
| |
| | | Profit attributable to minority interests | 109 | | | | | 24 | | | | 96 | | 19 | | | Profit attributable to shareholders | 5,389 | | | | | 1,181 | | | | 5,214 | | 1,057 | |
|
|
|
|
|
| |
| | | Basic earnings per share (pence) | 95.5 | p | 19 | | 16 | | 21.0 | p | 22 | | 6 | | 94.4 | p | 5 | | (1 | ) | 19.6 | p | (7 | ) | (7 | ) |
|
|
|
|
|
| |
| | | Diluted earnings per share (pence) | 94.5 | p | | | | | 20.8 | p | | | | 93.7 | p | | 19.4 | p | |
|
|
|
|
|
| |
| | | | | | | | | | | | | | | | | | Income statement – business performance | | |
| |
| | | Turnover – Pharmaceuticals | | 19,233 | | – | | (4 | ) | 5,047 | | (2 | ) | (2 | ) | | – Consumer Healthcare | | 3,483 | | 14 | | 11 | | 927 | | 11 | | 13 | |
| |
| | | Total turnover | | 22,716 | | 2 | | (2 | ) | 5,974 | | – | | – | | | Cost of sales | | (5,206 | ) | 6 | | 4 | | (1,528 | ) | 5 | | 6 | | | Selling, general and administrative | | (6,817 | ) | (2 | ) | (6 | ) | (1,686 | ) | (13 | ) | (13 | ) | | Research and development | | (3,237 | ) | (3 | ) | (6 | ) | (953 | ) | (2 | ) | (3 | ) | | Other operating income | | 475 | | 119 | |
| |
| | | Operating profit | | 7,931 | | 8 | | 2 | | 1,926 | | 14 | | 13 | |
| |
| | | Finance income | | 262 | | 52 | | | Finance costs | | (453 | ) | | (119 | ) | | | Share of after tax profits of associates and joint ventures | | 50 | | 10 | |
| |
| | | Profit before taxation | | 7,790 | | 6 | | – | | 1,869 | | 10 | | 9 | | | Taxation | | (2,219 | ) | | (532 | ) | | | Tax rate % | | 28.5 | % | | 28.5 | % | |
| |
| | | Profit after taxation for the period | | 5,571 | | 8 | | 1 | | 1,337 | | 12 | | 11 | |
| |
| | | Profit attributable to minority interests | | 96 | | 19 | | | Profit attributable to shareholders | | 5,475 | | 1,318 | |
| |
| | | Adjusted earnings per share (pence) | | 99.1 | p | 10 | | 4 | | 24.4 | p | 17 | | 16 | |
| |
| | | Diluted earnings per share (pence) | | 98.3 | p | | 24.2 | p | |
| |
| |
The calculation of business performance, a supplemental non-IFRS measure, is described in Note 1 to the financial statements, ‘Presentation of the financial statements’.
| 160 |
| GSK Annual Report 20062007 | 166 | |
<Back to Contents | | | Financial record | | | | | | | | Financial record | | continued |
|
| | | | | Q3 2007 | | | | | | Q2 2007 | | | | | | Q1 2007 | |
| |
| |
| | | £m | | CER% | | £% | | £m | | CER% | | £% | | £m | | CER% | | £% | |
| | | 4,605 | | (2 | ) | (6 | ) | 4,775 | | – | | (5 | ) | 4,806 | | 3 | | (5 | ) | | 871 | | 16 | | 14 | | 899 | | 18 | | 14 | | 786 | | 9 | | 2 | |
| | | 5,476 | | 1 | | (3 | ) | 5,674 | | 3 | | (2 | ) | 5,592 | | 4 | | (4 | ) | | (1,232 | ) | 2 | | 1 | | (1,212 | ) | 3 | | – | | (1,234 | ) | 14 | | 9 | | | (1,617 | ) | 3 | | – | | (1,841 | ) | 3 | | (2 | ) | (1,673 | ) | (1 | ) | (8 | ) | | (769 | ) | (9 | ) | (12 | ) | (789 | ) | (4 | ) | (8 | ) | (726 | ) | 2 | | (4 | ) | | 52 | | | | | | 97 | | | | | | 207 | | | | | |
| | | 1,910 | | (1 | ) | (6 | ) | 1,929 | | 9 | | 1 | | 2,166 | | 11 | | – | |
| | | 75 | | | | | | 77 | | | | | | 58 | | | | | | | (117 | ) | | | | | (121 | ) | | | | | (96 | ) | | | | | | 14 | | | | | | 11 | | | | | | 15 | | | | | |
| | | 1,882 | | (2 | ) | (7 | ) | 1,896 | | 8 | | – | | 2,143 | | 10 | | 1 | | | (536 | ) | | | | | (541 | ) | | | | | (610 | ) | | | | | | 28.5 | % | | | | | 28.5 | % | | | | | 28.5 | % | | | | |
| | | 1,346 | | (1 | ) | (6 | ) | 1,355 | | 10 | | 1 | | 1,533 | | 11 | | – | |
| | | 36 | | | | | | 22 | | | | | | 19 | | | | | | | 1,310 | | | | | | 1,333 | | | | | | 1,514 | | | | | |
| | | 23.7 | p | 1 | | (4 | ) | 24.0 | p | 11 | | 3 | | 27.0 | p | 14 | | 2 | |
| | | 23.5 | p | | | | | 23.7 | p | | | | | 26.7 | p | | | | |
| | | | |
| GSK Annual Report 2007 | 161 | | |
| | Q3 2006 | | | | | | Q2 2006 | | | | | | Q1 2006 | |
|
|
|
|
| |
|
|
|
|
| |
|
|
|
|
| | | £m | | CER % | | £% | | £m | | CER % | | £% | | £m | | CER % | | £% | |
|
|
|
|
|
|
|
|
|
|
|
|
|
|
|
|
| | | 4,876 | | 7 | | 4 | | 5,021 | | 10 | | 11 | | 5,045 | | 10 | | 16 | | | 766 | | 4 | | 1 | | 790 | | 5 | | 7 | | 768 | | 6 | | 10 | |
|
|
|
|
|
|
|
|
|
|
|
|
|
|
|
|
| | | 5,642 | | 7 | | 3 | | 5,811 | | 9 | | 11 | | 5,813 | | 10 | | 15 | | | (1,222 | ) | 5 | | 3 | | (1,209 | ) | 3 | | 5 | | (1,134 | ) | (2 | ) | 1 | | | (1,617 | ) | (10 | ) | (14 | ) | (1,883 | ) | 8 | | 12 | | (1,823 | ) | 5 | | 11 | | | (871 | ) | 11 | | 8 | | (853 | ) | 20 | | 22 | | (753 | ) | 10 | | 14 | | | 91 | | | | | | 45 | | | | | | 71 | | | | | |
|
|
|
|
|
|
|
|
|
|
|
|
|
|
|
|
| | | 2,023 | | 19 | | 13 | | 1,911 | | 13 | | 12 | | 2,174 | | 15 | | 24 | |
|
|
|
|
|
|
|
|
|
|
|
|
|
|
|
|
| | | 64 | | | | | | 67 | | | | | | 73 | | | | | | | (81 | ) | | | | | (93 | ) | | | | | (92 | ) | | | | | | 16 | | | | | | 12 | | | | | | 15 | | | | | |
|
|
|
|
|
|
|
|
|
|
|
|
|
|
|
|
| | | 2,022 | | 21 | | 15 | | 1,897 | | 15 | | 14 | | 2,170 | | 17 | | 27 | | | (596 | ) | | | | | (560 | ) | | | | | (640 | ) | | | | | | 29.5 | % | | | | | 29.5 | % | | | | | 29.5 | % | | | | |
|
|
|
|
|
|
|
|
|
|
|
|
|
|
|
|
| | | 1,426 | | 19 | | 14 | | 1,337 | | 14 | | 12 | | 1,530 | | 16 | | 25 | |
|
|
|
|
|
|
|
|
|
|
|
|
|
|
|
|
| | | 35 | | | | | | 22 | | | | | | 28 | | | | | | | 1,391 | | | | | | 1,315 | | | | | | 1,502 | | | | | |
|
|
|
|
|
|
|
|
|
|
|
|
|
|
|
|
| | | 24.7 | p | 21 | | 16 | | 23.3 | p | 15 | | 14 | | 26.5 | p | 17 | | 26 | |
|
|
|
|
|
|
|
|
|
|
|
|
|
|
|
|
| | | 24.4 | p | | | | | 23.0 | p | | | | | 26.3 | p | | | | |
|
|
|
|
|
|
|
|
|
|
|
|
|
|
|
|
| |
| |
| GSK Annual Report 2006 | 167 |
<Back to Contents | | INVESTOR INFORMATION | | Financial record | continued | |
| | | | Financial record | | continued | | |
Pharmaceutical turnover – total Group | | Q4 2006 | | Q3 2006 | | Q2 2006 | | Q1 2006 | | | | | | Q4 2007 | | | | | | Q3 2007 | | | | | | Q2 2007 | | | | | | Q1 2007 | | | |
|
|
|
|
| |
|
|
|
|
| |
|
|
|
|
| |
|
|
|
|
| |
|
|
|
|
| |
|
|
|
|
| |
|
|
|
|
| |
|
|
|
|
| | | | £m | | CER % | | £% | | £m | | CER % | | £% | | £m | | CER % | | £% | | £m | | CER % | | £% | | £m | | CER% | | £% | | £m | | CER% | | £% | | £m | | CER% | | £% | | £m | | CER% | | £% | |
|
|
|
|
|
|
|
|
|
|
|
|
|
|
|
|
|
|
|
|
|
|
|
| |
|
|
|
|
|
|
|
|
|
|
|
|
|
|
|
|
|
|
|
|
|
|
| | | Respiratory | 1,269 | | (3 | ) | (10 | ) | 1,185 | | (1 | ) | (4 | ) | 1,232 | | – | | 1 | | 1,309 | | 4 | | 9 | | 1,363 | | 8 | | 7 | | 1,185 | | 4 | | – | | 1,260 | | 8 | | 2 | | 1,224 | | 1 | | (6 | ) | | Seretide/Advair | 862 | | 9 | | 1 | | 813 | | 14 | | 10 | | 822 | | 12 | | 13 | | 816 | | 12 | | 18 | | 958 | | 12 | | 11 | | 835 | | 7 | | 3 | | 871 | | 12 | | 6 | | 835 | | 11 | | 2 | | | Flixotide/Flovent | 172 | | 7 | | (1 | ) | 145 | | (1 | ) | (4 | ) | 164 | | 2 | | 3 | | 178 | | 10 | | 16 | | 175 | | 2 | | 2 | | 140 | | 1 | | (3 | ) | 151 | | (2 | ) | (8 | ) | 155 | | (4 | ) | (13 | ) | | Serevent | 74 | | (9 | ) | (15 | ) | 69 | | (10 | ) | (13 | ) | 74 | | (13 | ) | (13 | ) | 74 | | (9 | ) | (6 | ) | 71 | | (5 | ) | (4 | ) | 63 | | (6 | ) | (9 | ) | 70 | | (1 | ) | (5 | ) | 65 | | (5 | ) | (12 | ) | | Flixonase/Flonase | 48 | | (69 | ) | (72 | ) | 64 | | (59 | ) | (61 | ) | 68 | | (53 | ) | (54 | ) | 131 | | (27 | ) | (23 | ) | 32 | | (35 | ) | (33 | ) | 49 | | (23 | ) | (23 | ) | 55 | | (15 | ) | (19 | ) | 63 | | (49 | ) | (52 | ) |
|
|
|
|
|
|
|
|
|
|
|
|
|
|
|
|
|
|
|
|
|
|
|
| |
|
|
|
|
|
|
|
|
|
|
|
|
|
|
|
|
|
|
|
|
|
|
| | | Central Nervous System | 915 | | 13 | | 3 | | 913 | | 18 | | 13 | | 918 | | 18 | | 19 | | 896 | | 11 | | 18 | | | | | | | | | | | | | | | | | | | | | | | | | | | | | | | Central nervous system | | 899 | | 1 | | (2 | ) | 825 | | (4 | ) | (10 | ) | 828 | | (3 | ) | (10 | ) | 796 | | (2 | ) | (11 | ) | | Seroxat/Paxil | 163 | | 11 | | 3 | | 137 | | 4 | | (3 | ) | 159 | | 5 | | 4 | | 161 | | (4 | ) | (1 | ) | 151 | | (7 | ) | (7 | ) | 128 | | (2 | ) | (7 | ) | 140 | | (4 | ) | (12 | ) | 134 | | (9 | ) | (17 | ) | | Paxil IR | 113 | | – | | (7 | ) | 103 | | (8 | ) | (13 | ) | 122 | | (1 | ) | (3 | ) | 110 | | (11 | ) | (10 | ) | 112 | | (2 | ) | (1 | ) | 92 | | (7 | ) | (11 | ) | 103 | | (8 | ) | (16 | ) | 93 | | (8 | ) | (15 | ) | | Paxil CR | 50 | | 50 | | 39 | | 34 | | 61 | | 48 | | 37 | | 33 | | 37 | | 51 | | 15 | | 24 | | 39 | | (18 | ) | (22 | ) | 36 | | 12 | | 6 | | 37 | | 8 | | – | | 41 | | (10 | ) | (20 | ) | | Wellbutrin | 212 | | 9 | | (2 | ) | 234 | | 27 | | 22 | | 237 | | 40 | | 42 | | 217 | | 22 | | 33 | | 130 | | (36 | ) | (39 | ) | 135 | | (38 | ) | (42 | ) | 132 | | (40 | ) | (44 | ) | 132 | | (33 | ) | (39 | ) | | Wellbutrin IR, SR | 25 | | 13 | | 4 | | 26 | | 17 | | 13 | | 27 | | >100 | | >100 | | 24 | | (31 | ) | (25 | ) | 16 | | (32 | ) | (36 | ) | 21 | | (15 | ) | (19 | ) | 15 | | (41 | ) | (44 | ) | 23 | | – | | (4 | ) | | Wellbutrin XL | 187 | | 9 | | (3 | ) | 208 | | 28 | | 23 | | 210 | | 34 | | 36 | | 193 | | 35 | | 47 | | 114 | | (36 | ) | (39 | ) | 114 | | (41 | ) | (45 | ) | 117 | | (40 | ) | (44 | ) | 109 | | (37 | ) | (44 | ) | | Imigran/Imitrex | 174 | | 2 | | (7 | ) | 180 | | 4 | | – | | 175 | | 7 | | 8 | | 182 | | 2 | | 9 | | 187 | | 11 | | 7 | | 165 | | (2 | ) | (8 | ) | 167 | | 2 | | (5 | ) | 166 | | 1 | | (9 | ) | | Lamictal | 257 | | 23 | | 13 | | 257 | | 27 | | 22 | | 245 | | 12 | | 13 | | 237 | | 14 | | 22 | | 301 | | 21 | | 17 | | 275 | | 14 | | 7 | | 271 | | 18 | | 11 | | 250 | | 11 | | 5 | | | Requip | 76 | | 62 | | 52 | | 70 | | 71 | | 67 | | 64 | | 85 | | 88 | | 58 | | 83 | | 93 | | 95 | | 26 | | 25 | | 87 | | 31 | | 24 | | 84 | | 41 | | 31 | | 80 | | 50 | | 38 | |
|
|
|
|
|
|
|
|
|
|
|
|
|
|
|
|
|
|
|
|
|
|
|
| |
|
|
|
|
|
|
|
|
|
|
|
|
|
|
|
|
|
|
|
|
|
|
| | | | | | | | | | | | | | | | | | | | | | | | | | | | | | Anti-virals | 706 | | 9 | | 1 | | 703 | | 9 | | 6 | | 719 | | 12 | | 13 | | 699 | | 10 | | 16 | | 791 | | 13 | | 12 | | 714 | | 6 | | 2 | | 755 | | 11 | | 5 | | 768 | | 20 | | 10 | | | HIV | 360 | | (5 | ) | (11 | ) | 363 | | (6 | ) | (9 | ) | 393 | | 1 | | 2 | | 399 | | 4 | | 10 | | 359 | | (1 | ) | – | | 360 | | 3 | | (1 | ) | 364 | | (3 | ) | (7 | ) | 359 | | (3 | ) | (10 | ) | | Combivir | 119 | | (14 | ) | (20 | ) | 125 | | (12 | ) | (15 | ) | 141 | | (6 | ) | (5 | ) | 143 | | (3 | ) | 2 | | 108 | | (10 | ) | (9 | ) | 115 | | (4 | ) | (8 | ) | 117 | | (13 | ) | (17 | ) | 115 | | (13 | ) | (20 | ) | | Trizivir | 61 | | (14 | ) | (21 | ) | 63 | | (16 | ) | (18 | ) | 72 | | (5 | ) | (4 | ) | 72 | | (7 | ) | (3 | ) | 56 | | (10 | ) | (8 | ) | 55 | | (8 | ) | (13 | ) | 60 | | (13 | ) | (17 | ) | 62 | | (7 | ) | (14 | ) | | Epivir | 43 | | (24 | ) | (31 | ) | 46 | | (25 | ) | (29 | ) | 53 | | (25 | ) | (22 | ) | 60 | | (12 | ) | (9 | ) | 37 | | (16 | ) | (14 | ) | 38 | | (13 | ) | (17 | ) | 40 | | (21 | ) | (25 | ) | 41 | | (27 | ) | (32 | ) | | Ziagen | 28 | | (12 | ) | (18 | ) | 28 | | (12 | ) | (15 | ) | 29 | | (19 | ) | (19 | ) | 32 | | (9 | ) | (3 | ) | 28 | | (4 | ) | – | | 28 | | 4 | | – | | 27 | | (3 | ) | (7 | ) | 26 | | (9 | ) | (19 | ) | | Agenerase, Lexiva | 34 | | 12 | | 3 | | 32 | | 3 | | 3 | | 32 | | 23 | | 23 | | 33 | | 41 | | 50 | | 36 | | 9 | | 6 | | 37 | | 19 | | 16 | | 33 | | 9 | | 3 | | 35 | | 15 | | 6 | | | Epzicom/Kivexa | 69 | | 66 | | 57 | | 63 | | 88 | | 85 | | 58 | | >100 | | >100 | | 51 | | >100 | | >100 | | 90 | | 29 | | 30 | | 80 | | 33 | | 27 | | 79 | | 43 | | 36 | | 75 | | 57 | | 47 | | | | | | | | | | | | | | | | | | | | | | | | | | | | | | Herpes | 242 | | 18 | | 8 | | 242 | | 21 | | 15 | | 245 | | 25 | | 26 | | 236 | | 13 | | 20 | | 283 | | 19 | | 17 | | 256 | | 12 | | 6 | | 252 | | 11 | | 3 | | 250 | | 17 | | 6 | | | Valtrex | 212 | | 23 | | 12 | | 215 | | 26 | | 20 | | 214 | | 30 | | 32 | | 204 | | 16 | | 24 | | 255 | | 23 | | 20 | | 229 | | 13 | | 7 | | 226 | | 14 | | 6 | | 224 | | 22 | | 10 | | | Zovirax | 30 | | (9 | ) | (12 | ) | 27 | | (6 | ) | (13 | ) | 31 | | (3 | ) | (6 | ) | 32 | | (6 | ) | (3 | ) | 28 | | (10 | ) | (7 | ) | 27 | | 4 | | – | | 26 | | (10 | ) | (16 | ) | 26 | | (13 | ) | (19 | ) | | | | | | | | | | | | | | | | | | | | | | | | | | | | | Zeffix | 42 | | 5 | | – | | 42 | | 16 | | 14 | | 40 | | 5 | | 8 | | 38 | | 24 | | 31 | | 42 | | (2 | ) | – | | 42 | | 5 | | – | | 44 | | 15 | | 10 | | 40 | | 16 | | 5 | | | Relenza | 37 | | >100 | | >100 | | 30 | | – | | – | | 17 | | >100 | | >100 | | 7 | | >100 | | >100 | | 75 | | >100 | | >100 | | 28 | | (7 | ) | (7 | ) | 67 | | >100 | | >100 | | 92 | | >100 | | >100 | |
| |
|
|
|
|
|
|
|
|
|
|
|
|
|
|
|
|
|
|
|
|
|
|
| |
|
|
|
|
|
|
|
|
|
|
|
|
|
|
|
|
|
|
|
|
|
|
|
| | | | | | | | | | | | | | | | | | | | | | | | | | | Metabolic | 474 | | 34 | | 22 | | 438 | | 16 | | 11 | | 529 | | 32 | | 35 | | 434 | | 26 | | 36 | | 321 | | (33 | ) | (32 | ) | 297 | | (29 | ) | (32 | ) | 420 | | (16 | ) | (21 | ) | 476 | | 21 | | 10 | | | Avandia | 324 | | 25 | | 12 | | 323 | | 13 | | 8 | | 408 | | 23 | | 26 | | 344 | | 30 | | 42 | | 160 | | (52 | ) | (51 | ) | 153 | | (51 | ) | (53 | ) | 249 | | (35 | ) | (39 | ) | 315 | | 1 | | (8 | ) | | Avandamet | 68 | | 54 | | 48 | | 44 | | (21 | ) | (23 | ) | 64 | | >100 | | >100 | | 28 | | (39 | ) | (36 | ) | 64 | | (7 | ) | (6 | ) | 60 | | 39 | | 36 | | 85 | | 41 | | 33 | | 83 | | >100 | | >100 | | | Avandaryl | 14 | | – | | – | | 11 | | – | | – | | 5 | | – | | – | | 12 | | – | | – | | 7 | | (57 | ) | (50 | ) | 12 | | 18 | | 9 | | 15 | | >100 | | >100 | | 16 | | 50 | | 33 | | | Bonviva/Boniva | 34 | | >100 | | >100 | | 27 | | >100 | | >100 | | 19 | | >100 | | >100 | | 15 | | – | | – | | 52 | | 59 | | 53 | | 41 | | 56 | | 52 | | 36 | | >100 | | 89 | | 32 | | >100 | | >100 | |
|
|
|
|
|
|
|
|
|
|
|
|
|
|
|
|
|
|
|
|
|
|
|
| |
|
|
|
|
|
|
|
|
|
|
|
|
|
|
|
|
|
|
|
|
|
|
| | | | | | | | | | | | | | | | | | | | | | | | | | | | | | Vaccines | 527 | | 31 | | 25 | | 412 | | 5 | | 3 | | 387 | | 17 | | 20 | | 366 | | 44 | | 48 | | 634 | | 18 | | 20 | | 593 | | 49 | | 44 | | 398 | | 6 | | 3 | | 368 | | 6 | | 1 | | | Hepatitis | 128 | | 19 | | 14 | | 114 | | (2 | ) | (5 | ) | 121 | | 3 | | 4 | | 116 | | 18 | | 23 | | 147 | | 13 | | 15 | | 141 | | 29 | | 24 | | 128 | | 10 | | 6 | | 113 | | 4 | | (3 | ) | | Influenza | | 174 | | 62 | | 63 | | 141 | | >100 | | >100 | | 4 | | (43 | ) | (43 | ) | 1 | | – | | – | | | Infanrix, Pediarix | 136 | | 29 | | 21 | | 122 | | 6 | | 3 | | 129 | | 38 | | 40 | | 124 | | 54 | | 59 | | 137 | | (2 | ) | 1 | | 137 | | 16 | | 12 | | 135 | | 9 | | 5 | | 134 | | 15 | | 8 | | | Boostrix | 18 | | 73 | | 64 | | 18 | | 64 | | 64 | | 14 | | >100 | | >100 | | 10 | | >100 | | >100 | | 13 | | (28 | ) | (28 | ) | 26 | | 56 | | 44 | | 14 | | – | | – | | 13 | | 40 | | 30 | | | Rotarix | | 39 | | 70 | | 70 | | 23 | | >100 | | >100 | | 15 | | >100 | | >100 | | 14 | | >100 | | 100 | | | Cervarix | | 9 | | – | | – | | 1 | | – | | – | | – | | – | | – | | – | | – | | – | |
| |
|
|
|
|
|
|
|
|
|
|
|
|
|
|
|
|
|
|
|
|
|
|
| |
|
|
|
|
|
|
|
|
|
|
|
|
|
|
|
|
|
|
|
|
|
|
|
| | | | | | | | | | | | | | | | | | | | | | | | | | | Cardiovascular and urogenital | 421 | | 25 | | 15 | | 406 | | 23 | | 18 | | 383 | | 21 | | 23 | | 426 | | 29 | | 37 | | 298 | | (31 | ) | (29 | ) | 378 | | (2 | ) | (7 | ) | 439 | | 22 | | 15 | | 439 | | 13 | | 3 | | | Coreg | 199 | | 39 | | 25 | | 195 | | 32 | | 27 | | 160 | | 29 | | 28 | | 225 | | 53 | | 67 | | 23 | | (91 | ) | (88 | ) | 145 | | (20 | ) | (26 | ) | 202 | | 37 | | 26 | | 217 | | 8 | | (4 | ) | | Coreg CR | | 33 | | – | | – | | 31 | | – | | – | | 10 | | – | | – | | 14 | | – | | – | | | Coreg IR | | (10 | ) | – | | – | | 114 | | (37 | ) | (42 | ) | 192 | | 30 | | 20 | | 203 | | 1 | | (10 | ) | | Levitra | 12 | | 30 | | 20 | | 11 | | 22 | | 22 | | 9 | | (18 | ) | (18 | ) | 11 | | – | | 10 | | 11 | | – | | (8 | ) | 13 | | 18 | | 18 | | 11 | | 44 | | 22 | | 14 | | 36 | | 27 | | | Avodart | 61 | | 67 | | 56 | | 57 | | 61 | | 58 | | 51 | | 79 | | 82 | | 47 | | 73 | | 81 | | 83 | | 36 | | 36 | | 72 | | 33 | | 26 | | 67 | | 39 | | 31 | | 63 | | 47 | | 34 | | | Arixtra | 21 | | >100 | | >100 | | 13 | | 100 | | 86 | | 13 | | >100 | | >100 | | 11 | | >100 | | >100 | | 29 | | 43 | | 38 | | 25 | | 100 | | 92 | | 26 | | >100 | | 100 | | 20 | | 100 | | 82 | | | Fraxiparine | 53 | | (2 | ) | (4 | ) | 49 | | 2 | | – | | 56 | | – | | 2 | | 51 | | (4 | ) | (2 | ) | 51 | | (9 | ) | (4 | ) | 41 | | (16 | ) | (16 | ) | 45 | | (18 | ) | (20 | ) | 47 | | (6 | ) | (8 | ) | | Vesicare | | 14 | | 67 | | 56 | | 13 | | 56 | | 44 | | 12 | | 86 | | 71 | | 11 | | 71 | | 57 | |
| |
|
|
|
|
|
|
|
|
|
|
|
|
|
|
|
|
|
|
|
|
|
|
| |
|
|
|
|
|
|
|
|
|
|
|
|
|
|
|
|
|
|
|
|
|
|
|
| | | | | | | | | | | | | | | | | | | | | | | | | | | Anti-bacterials | 354 | | (8 | ) | (13 | ) | 311 | | (8 | ) | (11 | ) | 326 | | (8 | ) | (6 | ) | 378 | | (12 | ) | (9 | ) | 370 | | 2 | | 5 | | 302 | | (2 | ) | (3 | ) | 310 | | (2 | ) | (5 | ) | 348 | | (3 | ) | (8 | ) | | Augmentin | 145 | | (11 | ) | (15 | ) | 121 | | (15 | ) | (19 | ) | 134 | | (15 | ) | (13 | ) | 170 | | (14 | ) | (11 | ) | 146 | | (2 | ) | 1 | | 117 | | (2 | ) | (3 | ) | 120 | | (8 | ) | (10 | ) | 147 | | (9 | ) | (14 | ) | | Zinnat/Ceftin | 42 | | (19 | ) | (22 | ) | 35 | | (10 | ) | (15 | ) | 37 | | (10 | ) | (8 | ) | 50 | | (23 | ) | (19 | ) | |
| |
|
|
|
|
|
|
|
|
|
|
|
|
|
|
|
|
|
|
|
|
|
|
| |
|
|
|
|
|
|
|
|
|
|
|
|
|
|
|
|
|
|
|
|
|
|
|
| | | | | | | | | | | | | | | | | | | | | | | | | | | Oncology and emesis | 213 | | (11 | ) | (21 | ) | 279 | | 11 | | 6 | | 289 | | 15 | | 17 | | 288 | | 14 | | 23 | | 100 | | (54 | ) | (53 | ) | 104 | | (61 | ) | (63 | ) | 126 | | (55 | ) | (56 | ) | 147 | | (45 | ) | (49 | ) | | Zofran | 165 | | (19 | ) | (28 | ) | 223 | | 8 | | 4 | | 229 | | 11 | | 12 | | 230 | | 13 | | 22 | | 22 | | (88 | ) | (87 | ) | 32 | | (86 | ) | (86 | ) | 55 | | (76 | ) | (76 | ) | 87 | | (60 | ) | (62 | ) | | Hycamtin | 28 | | 20 | | 12 | | 28 | | 12 | | 8 | | 28 | | 22 | | 22 | | 29 | | 8 | | 16 | | 31 | | 11 | | 11 | | 30 | | 11 | | 7 | | 28 | | 4 | | – | | 30 | | 14 | | 3 | | | Tykerb | | 19 | | – | | – | | 16 | | – | | – | | 12 | | – | | – | | 4 | | – | | – | |
| |
|
|
|
|
|
|
|
|
|
|
|
|
|
|
|
|
|
|
|
|
|
|
| |
|
|
|
|
|
|
|
|
|
|
|
|
|
|
|
|
|
|
|
|
|
|
|
| | | | | | | | | | | | | | | | | | | | | | | | | | | Other | 257 | | 2 | | (4 | ) | 229 | | (7 | ) | (10 | ) | 238 | | (9 | ) | (10 | ) | 249 | | (6 | ) | (1 | ) | 271 | | 4 | | 5 | | 207 | | (9 | ) | (10 | ) | 239 | | 3 | | – | | 240 | | 5 | | (4 | ) | | Zantac | 55 | | (5 | ) | (14 | ) | 51 | | (11 | ) | (16 | ) | 61 | | 2 | | 2 | | 65 | | 7 | | 10 | | 43 | | (22 | ) | (22 | ) | 37 | | (25 | ) | (27 | ) | 40 | | (31 | ) | (34 | ) | 48 | | (18 | ) | (26 | ) |
|
|
|
|
|
|
|
|
|
|
|
|
|
|
|
|
|
|
|
|
|
|
|
| |
|
|
|
|
|
|
|
|
|
|
|
|
|
|
|
|
|
|
|
|
|
|
| | | | | | | | | | | | | | | | | | | | | | | | | | | | | | Total | 5,136 | | 8 | | 1 | | 4,876 | | 7 | | 4 | | 5,021 | | 10 | | 11 | | 5,045 | | 10 | | 16 | | 5,047 | | (2 | ) | (2 | ) | 4,605 | | (2 | ) | (6 | ). | 4,775 | | – | | (5 | ) | 4,806 | | 3 | | (5 | ) |
|
|
|
|
|
|
|
|
|
|
|
|
|
|
|
|
|
|
|
|
|
|
|
| |
|
|
|
|
|
|
|
|
|
|
|
|
|
|
|
|
|
|
|
|
|
|
| |
Pharmaceutical turnover includes co-promotion income. | 162 |
| GSK Annual Report 20062007 | 168 | |
<Back to Contents | | | Financial record | | | | | | | | Financial record | | continued |
| | |
Pharmaceutical turnover – USA | | Q4 2006 | | Q3 2006 | | Q2 2006 | | Q1 2006 | | | | | | Q4 2007 | | | | | | Q3 2007 | | | | | | Q2 2007 | | | | | | Q1 2007 | | | |
| |
| |
| |
| |
|
|
|
|
| |
|
|
|
|
| |
|
|
|
|
| |
|
|
|
|
| | | | £m | | CER % | | £% | | £m | | CER % | | £% | | £m | | CER % | | £% | | £m | | CER % | | £% | | £m | | CER% | | £% | | £m | | CER% | | £% | | £m | | CER% | | £% | | £m | | CER% | | £% | |
|
| |
|
|
|
|
|
|
|
|
|
|
|
|
|
|
|
|
|
|
|
|
|
|
| | | Respiratory | 616 | | (7 | ) | (16 | ) | 593 | | (4 | ) | (9 | ) | 582 | | (4 | ) | (4 | ) | 670 | | 4 | | 13 | | 632 | | 7 | | 3 | | 570 | | 4 | | (4 | ) | 593 | | 10 | | 2 | | 582 | | (3 | ) | (13 | ) | | Seretide/Advair | 493 | | 11 | | – | | 464 | | 17 | | 11 | | 453 | | 13 | | 14 | | 460 | | 11 | | 21 | | 513 | | 9 | | 4 | | 452 | | 5 | | (3 | ) | 467 | | 11 | | 3 | | 459 | | 12 | | – | | | Flixotide/Flovent | 79 | | 22 | | 10 | | 64 | | 3 | | (2 | ) | 69 | | 8 | | 8 | | 86 | | 30 | | 41 | | 81 | | 8 | | 3 | | 67 | | 13 | | 5 | | 65 | | 3 | | (6 | ) | 71 | | (8 | ) | (17 | ) | | Serevent | 22 | | (17 | ) | (24 | ) | 20 | | (16 | ) | (20 | ) | 21 | | (19 | ) | (19 | ) | 23 | | (13 | ) | (4 | ) | 19 | | (9 | ) | (14 | ) | 18 | | (5 | ) | (10 | ) | 18 | | (5 | ) | (14 | ) | 19 | | (9 | ) | (17 | ) | | Flixonase/Flonase | 17 | | (85 | ) | (87 | ) | 39 | | (70 | ) | (72 | ) | 34 | | (68 | ) | (70 | ) | 94 | | (27 | ) | (22 | ) | 1 | | – | | – | | 21 | | (41 | ) | (46 | ) | 25 | | (26 | ) | (26 | ) | 25 | | (72 | ) | (73 | ) |
|
| |
|
|
|
|
|
|
|
|
|
|
|
|
|
|
|
|
|
|
|
|
|
|
| | | Central Nervous System | 660 | | 25 | | 13 | | 661 | | 34 | | 28 | | 644 | | 35 | | 37 | | 623 | | 19 | | 30 | | | | | | | | | | | | | | | | | | | | | | | | | | | | | | | Central nervous system | | 637 | | 1 | | (3 | ) | 589 | | (4 | ) | (11 | ) | 586 | | (2 | ) | (9 | ) | 565 | | 1 | | (9 | ) | | Seroxat/Paxil | 49 | | 72 | | 53 | | 33 | | 62 | | 57 | | 40 | | 40 | | 33 | | 53 | | (4 | ) | 6 | | 39 | | (18 | ) | (20 | ) | 33 | | 9 | | – | | 34 | | (8 | ) | (15 | ) | 37 | | (23 | ) | (30 | ) | | Paxil IR | 3 | | – | | – | | 2 | | 100 | | 100 | | 8 | | 50 | | 33 | | 6 | | (55 | ) | (45 | ) | 5 | | 33 | | 67 | | – | | – | | – | | 2 | | (75 | ) | (75 | ) | – | | – | | – | | | Paxil CR | 46 | | 59 | | 44 | | 31 | | 60 | | 55 | | 32 | | 38 | | 33 | | 47 | | 10 | | 21 | | 34 | | (22 | ) | (26 | ) | 33 | | 13 | | 6 | | 32 | | 9 | | – | | 37 | | (13 | ) | (21 | ) | | Wellbutrin | 208 | | 10 | | (2 | ) | 229 | | 28 | | 22 | | 232 | | 39 | | 41 | | 213 | | 23 | | 33 | | 125 | | (38 | ) | (40 | ) | 131 | | (38 | ) | (43 | ) | 128 | | (41 | ) | (45 | ) | 128 | | (33 | ) | (40 | ) | | Wellbutrin IR, SR | 22 | | 25 | | 10 | | 22 | | 21 | | 16 | | 24 | | >100 | | >100 | | 21 | | (33 | ) | (30 | ) | 13 | | (41 | ) | (41 | ) | 18 | | (14 | ) | (18 | ) | 12 | | (46 | ) | (50 | ) | 20 | | – | | (5 | ) | | Wellbutrin XL | 186 | | 9 | | (3 | ) | 207 | | 29 | | 23 | | 208 | | 34 | | 36 | | 192 | | 35 | | 48 | | 112 | | (37 | ) | (40 | ) | 113 | | (41 | ) | (45 | ) | 116 | | (40 | ) | (44 | ) | 108 | | (37 | ) | (44 | ) | | Imigran/Imitrex | 138 | | 12 | | – | | 144 | | 15 | | 10 | | 134 | | 19 | | 20 | | 135 | | – | | 10 | | 153 | | 16 | | 11 | | 133 | | – | | (8 | ) | 136 | | 10 | | 1 | | 136 | | 13 | | 1 | | | Lamictal | 204 | | 39 | | 25 | | 201 | | 43 | | 39 | | 186 | | 31 | | 33 | | 174 | | 33 | | 45 | | 247 | | 27 | | 21 | | 224 | | 20 | | 11 | | 221 | | 28 | | 19 | | 200 | | 29 | | 15 | | | Requip | 52 | | 97 | | 79 | | 46 | | >100 | | 100 | | 41 | | >100 | | >100 | | 37 | | >100 | | >100 | | 64 | | 29 | | 23 | | 59 | | 39 | | 28 | | 59 | | 54 | | 44 | | 56 | | 70 | | 51 | |
| |
|
|
|
|
|
|
|
|
|
|
|
|
|
|
|
|
|
|
|
|
|
|
| |
|
| | | | | | | | | | | | | | | | | | | | | | | | | | | Anti-virals | 333 | | 8 | | (4 | ) | 339 | | 6 | | 2 | | 344 | | 11 | | 13 | | 338 | | 3 | | 12 | | 392 | | 23 | | 18 | | 351 | | 12 | | 4 | | 366 | | 15 | | 6 | | 385 | | 28 | | 14 | | | HIV | 168 | | (7 | ) | (17 | ) | 168 | | (11 | ) | (15 | ) | 182 | | (5 | ) | (3 | ) | 182 | | (5 | ) | 2 | | 155 | | (4 | ) | (8 | ) | 159 | | 2 | | (5 | ) | 159 | | (5 | ) | (13 | ) | 164 | | 1 | | (10 | ) | | Combivir | 56 | | (15 | ) | (24 | ) | 57 | | (15 | ) | (20 | ) | 63 | | (11 | ) | (10 | ) | 62 | | (16 | ) | (9 | ) | 45 | | (16 | ) | (20 | ) | 50 | | (7 | ) | (12 | ) | 50 | | (13 | ) | (21 | ) | 50 | | (10 | ) | (19 | ) | | Trizivir | 32 | | (16 | ) | (27 | ) | 34 | | (19 | ) | (21 | ) | 38 | | (5 | ) | (5 | ) | 37 | | (13 | ) | (5 | ) | 28 | | (9 | ) | (13 | ) | 28 | | (9 | ) | (18 | ) | 32 | | (11 | ) | (16 | ) | 32 | | (3 | ) | (14 | ) | | Epivir | 15 | | (23 | ) | (32 | ) | 16 | | (23 | ) | (27 | ) | 18 | | (29 | ) | (25 | ) | 20 | | (24 | ) | (20 | ) | 13 | | (7 | ) | (13 | ) | 14 | | (6 | ) | (13 | ) | 12 | | (22 | ) | (33 | ) | 14 | | (25 | ) | (30 | ) | | Ziagen | 12 | | (7 | ) | (14 | ) | 11 | | (8 | ) | (15 | ) | 12 | | (20 | ) | (20 | ) | 13 | | (8 | ) | – | | 11 | | – | | (8 | ) | 12 | | 18 | | 9 | | 11 | | – | | (8 | ) | 11 | | (8 | ) | (15 | ) | | Agenerase, Lexiva | 19 | | 5 | | (5 | ) | 18 | | (10 | ) | (10 | ) | 18 | | 13 | | 13 | | 19 | | 29 | | 36 | | 19 | | – | | – | | 20 | | 22 | | 11 | | 19 | | 11 | | 6 | | 20 | | 21 | | 5 | | | Epzicom/Kivexa | 33 | | 29 | | 18 | | 31 | | 38 | | 29 | | 32 | | 72 | | 78 | | 29 | | 80 | | 93 | | 37 | | 18 | | 12 | | 34 | | 19 | | 10 | | 36 | | 22 | | 13 | | 35 | | 34 | | 21 | | | | | | | | | | | | | | | | | | | | | | | | | | | | | | | | | | | | | | | | | | | | | | | | | | | | | Herpes | 154 | | 30 | | 17 | | 160 | | 35 | | 30 | | 151 | | 39 | | 41 | | 145 | | 17 | | 27 | | 184 | | 24 | | 19 | | 166 | | 13 | | 4 | | 162 | | 15 | | 7 | | 166 | | 28 | | 14 | | | Valtrex | 150 | | 28 | | 15 | | 158 | | 36 | | 31 | | 149 | | 39 | | 41 | | 143 | | 17 | | 28 | | 181 | | 26 | | 21 | | 162 | | 11 | | 3 | | 161 | | 16 | | 8 | | 164 | | 29 | | 15 | | | Zovirax | 4 | | >100 | | >100 | | 2 | | – | | – | | 2 | | 100 | | 100 | | 2 | | – | | – | | 3 | | (50 | ) | (25 | ) | 4 | | >100 | | 100 | | 1 | | (50 | ) | (50 | ) | 2 | | – | | – | | | | | | | | | | | | | | | | | | | | | | | | | | | | | | | | | | | | | | | | | | | | | | | | | | | | | Zeffix | 3 | | 33 | | – | | 4 | | – | | 33 | | 3 | | – | | – | | 3 | | – | | – | | 3 | | 33 | | – | | 4 | | (25 | ) | – | | 3 | | 33 | | – | | 3 | | – | | – | | | Relenza | – | | – | | – | | – | | – | | – | | – | | – | | – | | – | | – | | – | | 41 | | – | | – | | 12 | | >100 | | >100 | | 34 | | >100 | | – | | 44 | | >100 | | >100 | |
|
| |
|
|
|
|
|
|
|
|
|
|
|
|
|
|
|
|
|
|
|
|
|
|
| | | | | | | | | | | | | | | | | | | | | | | | | | | | | | Metabolic | 321 | | 45 | | 30 | | 289 | | 15 | | 8 | | 372 | | 37 | | 39 | | 295 | | 26 | | 37 | | 166 | | (47 | ) | (48 | ) | 160 | | (41 | ) | (45 | ) | 252 | | (27 | ) | (32 | ) | 317 | | 20 | | 7 | | | Avandia | 246 | | 32 | | 17 | | 242 | | 14 | | 8 | | 315 | | 25 | | 27 | | 265 | | 34 | | 46 | | 99 | | (59 | ) | (60 | ) | 92 | | (60 | ) | (62 | ) | 169 | | (42 | ) | (46 | ) | 232 | | (2 | ) | (12 | ) | | Avandamet | 32 | | 40 | | 28 | | 13 | | (64 | ) | (67 | ) | 37 | | >100 | | >100 | | 4 | | (88 | ) | (88 | ) | 26 | | (19 | ) | (19 | ) | 29 | | >100 | | >100 | | 45 | | 30 | | 22 | | 47 | | >100 | | >100 | | | Avandaryl | 14 | | – | | – | | 10 | | – | | – | | 4 | | – | | – | | 12 | | – | | – | | 5 | | (71 | ) | (64 | ) | 9 | | – | | (10 | ) | 12 | | >100 | | >100 | | 15 | | 33 | | 25 | | | Bonviva/Boniva | 29 | | >100 | | >100 | | 24 | | >100 | | >100 | | 16 | | >100 | | >100 | | 14 | | – | | – | | 38 | | 39 | | 36 | | 28 | | 24 | | 12 | | 26 | | 75 | | 63 | | 23 | | 86 | | 64 | |
|
| |
|
|
|
|
|
|
|
|
|
|
|
|
|
|
|
|
|
|
|
|
|
|
| | | | | | | | | | | | | | | | | | | | | | | | | | | | | | Vaccines | 162 | | 84 | | 71 | | 130 | | 8 | | 6 | | 90 | | 35 | | 36 | | 83 | | 41 | | 54 | | 204 | | 29 | | 26 | | 237 | | 97 | | 82 | | 105 | | 27 | | 17 | | 82 | | 11 | | (1 | ) | | Hepatitis | 43 | | 38 | | 26 | | 39 | | – | | (9 | ) | 42 | | 24 | | 27 | | 37 | | 27 | | 42 | | 54 | | 28 | | 26 | | 66 | | 82 | | 69 | | 47 | | 21 | | 12 | | 32 | | – | | (14 | ) | | Influenza | | 99 | | 68 | | 68 | | 93 | | >100 | | >100 | | – | | – | | – | | – | | – | | – | | | Infanrix, Pediarix | 47 | | 37 | | 24 | | 45 | | (4 | ) | (6 | ) | 39 | | 25 | | 22 | | 41 | | 32 | | 46 | | 44 | | (4 | ) | (6 | ) | 58 | | 40 | | 29 | | 51 | | 44 | | 31 | | 43 | | 17 | | 5 | | | Boostrix | 13 | | 63 | | 63 | | 14 | | 75 | | 75 | | 9 | | >100 | | >100 | | 5 | | – | | – | | 6 | | (54 | ) | (54 | ) | 20 | | 50 | | 43 | | 7 | | (11 | ) | (22 | ) | 7 | | 60 | | 40 | | | Rotarix | | – | | – | | – | | – | | – | | – | | – | | – | | – | | – | | – | | – | | | Cervarix | | – | | – | | – | | – | | – | | – | | – | | – | | – | | – | | – | | – | |
| |
|
|
|
|
|
|
|
|
|
|
|
|
|
|
|
|
|
|
|
|
|
|
| |
|
| | | | | | | | | | | | | | | | | | | | | | | | | | | Cardiovascular and urogenital | 281 | | 44 | | 29 | | 269 | | 37 | | 31 | | 228 | | 36 | | 36 | | 294 | | 53 | | 67 | | 136 | | (51 | ) | (52 | ) | 239 | | (4 | ) | (11 | ) | 292 | | 39 | | 28 | | 303 | | 15 | | 3 | | | Coreg | 198 | | 39 | | 25 | | 193 | | 32 | | 26 | | 158 | | 28 | | 27 | | 224 | | 54 | | 68 | | 23 | | (91 | ) | (88 | ) | 144 | | (21 | ) | (25 | ) | 199 | | 37 | | 26 | | 215 | | 7 | | (4 | ) | | Coreg CR | | 34 | | – | | – | | 31 | | – | | – | | 9 | | – | | – | | 14 | | – | | – | | | Coreg IR | | (11 | ) | – | | – | | 113 | | (38 | ) | (41 | ) | 190 | | 30 | | 20 | | 201 | | – | | (10 | ) | | Levitra | 12 | | 44 | | 33 | | 11 | | 71 | | 57 | | 8 | | – | | – | | 10 | | – | | 11 | | 11 | | – | | (8 | ) | 12 | | 33 | | 33 | | 11 | | 50 | | 38 | | 13 | | 50 | | 30 | | | Avodart | 36 | | 95 | | 71 | | 37 | | 85 | | 85 | | 30 | | >100 | | >100 | | 28 | | >100 | | >100 | | | | Avodart | | 49 | | 44 | | 36 | | 45 | | 27 | | 22 | | 40 | | 47 | | 33 | | 41 | | 64 | | 46 | | | Arixtra | 12 | | >100 | | 100 | | 7 | | >100 | | >100 | | 6 | | 50 | | 50 | | 7 | | >100 | | >100 | | 16 | | 42 | | 33 | | 14 | | >100 | | 100 | | 14 | | >100 | | >100 | | 11 | | 71 | | 57 | | | Fraxiparine | – | | – | | – | | – | | – | | – | | – | | – | | – | | – | | – | | – | | – | | – | | – | | – | | – | | – | | – | | – | | – | | – | | – | | – | | | Vesicare | | 14 | | 67 | | 56 | | 13 | | 56 | | 44 | | 12 | | 86 | | 71 | | 11 | | 71 | | 57 | |
| |
|
|
|
|
|
|
|
|
|
|
|
|
|
|
|
|
|
|
|
|
|
|
| |
|
| | | | | | | | | | | | | | | | | | | | | | | | | | | Anti-bacterials | 57 | | (15 | ) | (22 | ) | 52 | | (2 | ) | (7 | ) | 46 | | (16 | ) | (16 | ) | 62 | | (25 | ) | (18 | ) | 52 | | (5 | ) | (9 | ) | 41 | | (15 | ) | (21 | ) | 49 | | 17 | | 7 | | 53 | | (6 | ) | (15 | ) | | Augmentin | 25 | | (20 | ) | (29 | ) | 20 | | (28 | ) | (31 | ) | 18 | | (38 | ) | (38 | ) | 31 | | (38 | ) | (34 | ) | 15 | | (36 | ) | (40 | ) | 11 | | (40 | ) | (45 | ) | 17 | | (6 | ) | (6 | ) | 24 | | (13 | ) | (23 | ) | | Zinnat/Ceftin | 3 | | – | | (25 | ) | 3 | | – | | 50 | | 2 | | 100 | | 100 | | 4 | | 33 | | 33 | | |
| |
|
|
|
|
|
|
|
|
|
|
|
|
|
|
|
|
|
|
|
|
|
|
| |
|
| | | | | | | | | | | | | | | | | | | | | | | | | | | Oncology and emesis | 162 | | (10 | ) | (22 | ) | 223 | | 18 | | 12 | | 226 | | 21 | | 23 | | 225 | | 20 | | 32 | | 45 | | (72 | ) | (72 | ) | 52 | | (74 | ) | (77 | ) | 75 | | (65 | ) | (67 | ) | 100 | | (52 | ) | (56 | ) | | Zofran | 130 | | (16 | ) | (27 | ) | 185 | | 16 | | 11 | | 183 | | 18 | | 19 | | 181 | | 19 | | 30 | | (7 | ) | – | | – | | 4 | | (98 | ) | (98 | ) | 25 | | (86 | ) | (86 | ) | 56 | | (67 | ) | (69 | ) | | Hycamtin | 18 | | 18 | | 6 | | 17 | | – | | (6 | ) | 17 | | 21 | | 21 | | 20 | | 6 | | 18 | | 17 | | – | | (6 | ) | 18 | | 12 | | 6 | | 16 | | – | | (6 | ) | 19 | | 10 | | (5 | ) | | Tykerb | | 12 | | – | | – | | 11 | | – | | – | | 10 | | – | | – | | 3 | | – | | – | |
| |
|
|
|
|
|
|
|
|
|
|
|
|
|
|
|
|
|
|
|
|
|
|
| |
|
| | | | | | | | | | | | | | | | | | | | | | | | | | | Other | 18 | | 5 | | (5 | ) | 18 | | 6 | | – | | 22 | | 31 | | 38 | | 25 | | 35 | | 47 | | 33 | | 89 | | 83 | | (9 | ) | – | | – | | 9 | | (59 | ) | (59 | ) | 32 | | 44 | | 28 | | | Zantac | 16 | | 12 | | (6 | ) | 16 | | 7 | | 7 | | 19 | | 46 | | 46 | | 21 | | 54 | | 62 | | 7 | | (56 | ) | (56 | ) | 5 | | (69 | ) | (69 | ) | 5 | | (74 | ) | (74 | ) | 16 | | (14 | ) | (24 | ) |
|
| |
|
|
|
|
|
|
|
|
|
|
|
|
|
|
|
|
|
|
|
|
|
|
| | | Total | 2,610 | | 15 | | 4 | | 2,574 | | 14 | | 9 | | 2,554 | | 18 | | 20 | | 2,615 | | 15 | | 26 | | 2,297 | | (8 | ) | (12 | ) | 2,230 | | (7 | ) | (13 | ) | 2,327 | | (2 | ) | (9 | ) | 2,419 | | 3 | | (7 | ) |
|
| |
|
|
|
|
|
|
|
|
|
|
|
|
|
|
|
|
|
|
|
|
|
|
| |
Pharmaceutical turnover includes co-promotion income. |
| GSK Annual Report 20062007 | 163 | 169 | |
<Back to Contents | | INVESTOR INFORMATION | | Financial record | continued | |
| | | | Financial record | | continued | | |
Pharmaceutical turnover – Europe | | Q4 2006 | | Q3 2006 | | Q2 2006 | | Q1 2006 | | | | | | Q4 2007 | | | | | | Q3 2007 | | | | | | Q2 2007 | | | | | | Q1 2007 | | | |
| |
| |
| |
| |
|
|
|
|
| |
|
|
|
|
| |
|
|
|
|
| |
|
|
|
|
| | | | £m | | CER % | | £% | | £m | | CER % | | £% | | £m | | CER % | | £% | | £m | | CER % | | £% | | £m | | CER% | | £% | | £m | | CER% | | £% | | £m | | CER% | | £% | | £m | | CER% | | £% | |
|
| |
|
|
|
|
|
|
|
|
|
|
|
|
|
|
|
|
|
|
|
|
|
|
| | | Respiratory | 433 | | 1 | | (1 | ) | 399 | | 4 | | 3 | | 441 | | 3 | | 5 | | 424 | | 3 | | 2 | | 478 | | 5 | | 10 | | 410 | | 2 | | 3 | | 452 | | 4 | | 2 | | 432 | | 3 | | 2 | | | Seretide/Advair | 293 | | 8 | | 6 | | 271 | | 12 | | 10 | | 293 | | 10 | | 13 | | 276 | | 11 | | 10 | | 336 | | 10 | | 15 | | 293 | | 8 | | 8 | | 313 | | 8 | | 7 | | 294 | | 8 | | 7 | | | Flixotide/Flovent | 42 | | (12 | ) | (14 | ) | 39 | | (7 | ) | (7 | ) | 45 | | (8 | ) | (6 | ) | 47 | | (4 | ) | (4 | ) | 44 | | – | | 5 | | 34 | | (13 | ) | (13 | ) | 41 | | (9 | ) | (9 | ) | 42 | | (9 | ) | (11 | ) | | Serevent | 33 | | (13 | ) | (15 | ) | 35 | | (11 | ) | (8 | ) | 36 | | (16 | ) | (16 | ) | 36 | | (10 | ) | (10 | ) | 35 | | – | | 6 | | 32 | | (9 | ) | (9 | ) | 35 | | (3 | ) | (3 | ) | 32 | | (8 | ) | (11 | ) | | Flixonase/Flonase | 11 | | (15 | ) | (15 | ) | 10 | | (29 | ) | (29 | ) | 17 | | (11 | ) | (11 | ) | 13 | | (7 | ) | (7 | ) | 12 | | – | | 9 | | 10 | | 10 | | – | | 16 | | (6 | ) | (6 | ) | 13 | | – | | – | |
|
| |
|
|
|
|
|
|
|
|
|
|
|
|
|
|
|
|
|
|
|
|
|
|
| | | Central Nervous System | 137 | | (17 | ) | (18 | ) | 142 | | (16 | ) | (17 | ) | 152 | | (18 | ) | (16 | ) | 164 | | (10 | ) | (11 | ) | | | | | | | | | | | | | | | | | | | | | | | | | | | | | | Central nervous system | | 133 | | (8 | ) | (4 | ) | 124 | | (13 | ) | (13 | ) | 128 | | (14 | ) | (16 | ) | 128 | | (21 | ) | (22 | ) | | Seroxat/Paxil | 35 | | (10 | ) | (13 | ) | 35 | | (27 | ) | (27 | ) | 38 | | (19 | ) | (19 | ) | 41 | | (21 | ) | (21 | ) | 29 | | (23 | ) | (17 | ) | 27 | | (23 | ) | (23 | ) | 32 | | (13 | ) | (16 | ) | 34 | | (17 | ) | (17 | ) | | Paxil IR | 35 | | (10 | ) | (13 | ) | 35 | | (29 | ) | (29 | ) | 38 | | (17 | ) | (17 | ) | 41 | | (21 | ) | (21 | ) | 29 | | (23 | ) | (17 | ) | 27 | | (23 | ) | (23 | ) | 32 | | (13 | ) | (16 | ) | 34 | | (17 | ) | (17 | ) | | Paxil CR | – | | – | | – | | – | | – | | – | | – | | – | | – | | – | | – | | – | | – | | – | | – | | – | | – | | – | | – | | – | | – | | – | | – | | – | | | Wellbutrin | – | | – | | – | | 1 | | – | | – | | – | | – | | – | | 1 | | – | | – | | 1 | | – | | – | | 2 | | 100 | | 100 | | – | | – | | – | | 1 | | – | | – | | | Wellbutrin IR, SR | – | | – | | – | | 1 | | – | | – | | – | | – | | – | | 1 | | – | | – | | – | | – | | – | | 1 | | – | | – | | – | | – | | – | | 1 | | – | | – | | | Wellbutrin XL | – | | – | | – | | – | | – | | – | | – | | – | | – | | – | | – | | – | | 1 | | – | | – | | 1 | | – | | – | | – | | – | | – | | – | | – | | – | | | Imigran/Imitrex | 25 | | (34 | ) | (34 | ) | 26 | | (28 | ) | (28 | ) | 30 | | (19 | ) | (19 | ) | 37 | | 12 | | 12 | | 24 | | (8 | ) | (4 | ) | 22 | | (19 | ) | (15 | ) | 22 | | (27 | ) | (27 | ) | 21 | | (41 | ) | (43 | ) | | Lamictal | 39 | | (22 | ) | (24 | ) | 42 | | (16 | ) | (16 | ) | 46 | | (27 | ) | (26 | ) | 48 | | (22 | ) | (24 | ) | 38 | | (10 | ) | (3 | ) | 36 | | (12 | ) | (14 | ) | 36 | | (22 | ) | (22 | ) | 35 | | (25 | ) | (27 | ) | | Requip | 21 | | 16 | | 11 | | 21 | | 24 | | 24 | | 20 | | 18 | | 18 | | 19 | | 27 | | 27 | | 25 | | 14 | | 19 | | 23 | | 10 | | 10 | | 22 | | 10 | | 10 | | 21 | | 11 | | 11 | |
| |
|
|
|
|
|
|
|
|
|
|
|
|
|
|
|
|
|
|
|
|
|
|
| |
|
| | | | | | | | | | | | | | | | | | | | | | | | | | | Anti-virals | 210 | | 11 | | 8 | | 218 | | 14 | | 13 | | 218 | | 7 | | 10 | | 209 | | 14 | | 12 | | 207 | | (7 | ) | (2 | ) | 207 | | (5 | ) | (5 | ) | 230 | | 7 | | 6 | | 226 | | 11 | | 8 | | | HIV | 146 | | (3 | ) | (5 | ) | 149 | | – | | (2 | ) | 163 | | 1 | | 4 | | 163 | | 14 | | 13 | | 156 | | 1 | | 7 | | 148 | | – | | (1 | ) | 156 | | (3 | ) | (4 | ) | 152 | | (5 | ) | (7 | ) | | Combivir | 48 | | (9 | ) | (11 | ) | 52 | | (9 | ) | (9 | ) | 58 | | (3 | ) | (3 | ) | 59 | | 5 | | 5 | | 45 | | (10 | ) | (6 | ) | 47 | | (10 | ) | (10 | ) | 51 | | (12 | ) | (12 | ) | 49 | | (15 | ) | (17 | ) | | Trizivir | 25 | | (13 | ) | (17 | ) | 27 | | (10 | ) | (10 | ) | 29 | | (9 | ) | (9 | ) | 32 | | 3 | | 3 | | 25 | | (8 | ) | – | | 23 | | (19 | ) | (15 | ) | 24 | | (10 | ) | (17 | ) | 27 | | (16 | ) | (16 | ) | | Epivir | 18 | | (34 | ) | (38 | ) | 21 | | (33 | ) | (30 | ) | 25 | | (27 | ) | (24 | ) | 26 | | (10 | ) | (13 | ) | 15 | | (22 | ) | (17 | ) | 16 | | (24 | ) | (24 | ) | 18 | | (24 | ) | (28 | ) | 18 | | (31 | ) | (31 | ) | | Ziagen | 10 | | (9 | ) | (9 | ) | 10 | | (23 | ) | (23 | ) | 10 | | (38 | ) | (38 | ) | 11 | | (21 | ) | (21 | ) | 9 | | (10 | ) | (10 | ) | 9 | | (10 | ) | (10 | ) | 10 | | (10 | ) | – | | 9 | | (9 | ) | (18 | ) | | Agenerase, Lexiva | 12 | | 18 | | 9 | | 12 | | 33 | | 33 | | 12 | | 50 | | 50 | | 12 | | 71 | | 71 | | 14 | | 8 | | 17 | | 13 | | 17 | | 8 | | 13 | | 8 | | 8 | | 13 | | 8 | | 8 | | | Epzicom/Kivexa | 29 | | 100 | | 93 | | 26 | | >100 | | >100 | | 23 | | >100 | | >100 | | 19 | | >100 | | >100 | | 43 | | 45 | | 48 | | 37 | | 42 | | 42 | | 36 | | 57 | | 57 | | 33 | | 79 | | 74 | | | | | | | | | | | | | | | | | | | | | | | | | | | | | | | | | | | | | | | | | | | | | | | | | | | | | Herpes | 36 | | 9 | | 6 | | 36 | | 3 | | 3 | | 36 | | 3 | | 6 | | 36 | | 3 | | – | | 41 | | 6 | | 14 | | 36 | | 3 | | – | | 38 | | 6 | | 6 | | 36 | | 3 | | – | | | Valtrex | 27 | | 17 | | 13 | | 28 | | 12 | | 12 | | 28 | | 13 | | 17 | | 26 | | 8 | | 4 | | 33 | | 11 | | 22 | | 29 | | 7 | | 4 | | 30 | | 7 | | 7 | | 28 | | 12 | | 8 | | | Zovirax | 9 | | (10 | ) | (10 | ) | 8 | | (20 | ) | (20 | ) | 8 | | (20 | ) | (20 | ) | 10 | | (9 | ) | (9 | ) | 8 | | (11 | ) | (11 | ) | 7 | | (13 | ) | (13 | ) | 8 | | – | | – | | 8 | | (20 | ) | (20 | ) | | | | | | | | | | | | | | | | | | | | | | | | | | | | | Zeffix | 6 | | – | | – | | 6 | | 50 | | 50 | | 6 | | (14 | ) | (14 | ) | 5 | | 25 | | 25 | | 6 | | – | | – | | 6 | | – | | – | | 6 | | – | | – | | 6 | | 20 | | 20 | | | Relenza | 22 | | >100 | | >100 | | 24 | | >100 | | >100 | | 10 | | – | | – | | 6 | | – | | – | | 4 | | (91 | ) | (82 | ) | 14 | | (44 | ) | (44 | ) | 26 | | >100 | | >100 | | 32 | | >100 | | >100 | |
| |
|
|
|
|
|
|
|
|
|
|
|
|
|
|
|
|
|
|
|
|
|
|
| |
|
| | | | | | | | | | | | | | | | | | | | | | | | | | | Metabolic | 69 | | 27 | | 25 | | 64 | | 30 | | 28 | | 61 | | 33 | | 36 | | 58 | | 45 | | 45 | | 79 | | 7 | | 14 | | 65 | | 2 | | 2 | | 79 | | 31 | | 30 | | 71 | | 24 | | 22 | | | Avandia | 30 | | 7 | | 3 | | 30 | | 7 | | 7 | | 33 | | 14 | | 14 | | 32 | | 23 | | 23 | | 25 | | (20 | ) | (17 | ) | 26 | | (17 | ) | (13 | ) | 31 | | (3 | ) | (6 | ) | 31 | | (3 | ) | (3 | ) | | Avandamet | 27 | | 75 | | 69 | | 25 | | 100 | | 92 | | 21 | | 100 | | >100 | | 19 | | >100 | | >100 | | 31 | | 7 | | 15 | | 23 | | (8 | ) | (8 | ) | 31 | | 52 | | 48 | | 26 | | 37 | | 37 | | | Avandaryl | – | | – | | – | | – | | – | | – | | – | | – | | – | | – | | – | | – | | 1 | | – | | – | | 1 | | – | | – | | 1 | | – | | – | | – | | – | | – | | | Bonviva/Boniva | 5 | | – | | – | | 3 | | >100 | | >100 | | 3 | | – | | – | | 1 | | – | | – | | 15 | | >100 | | >100 | | 11 | | >100 | | >100 | | 10 | | >100 | | >100 | | 9 | | >100 | | >100 | |
|
| |
|
|
|
|
|
|
|
|
|
|
|
|
|
|
|
|
|
|
|
|
|
|
| | | | | | | | | | | | | | | | | | | | | | | | | | | | | | Vaccines | 200 | | 20 | | 18 | | 169 | | 6 | | 4 | | 175 | | 16 | | 19 | | 165 | | 46 | | 45 | | 258 | | 24 | | 29 | | 206 | | 22 | | 22 | | 178 | | 3 | | 2 | | 172 | | 6 | | 4 | | | Hepatitis | 60 | | 11 | | 11 | | 54 | | (5 | ) | (8 | ) | 58 | | (11 | ) | (6 | ) | 55 | | 17 | | 15 | | 65 | | 3 | | 8 | | 55 | | 2 | | 2 | | 59 | | 5 | | 2 | | 56 | | 2 | | 2 | | | Influenza | | 56 | | >100 | | >100 | | 37 | | >100 | | >100 | | – | | – | | – | | – | | – | | – | | | Infanrix, Pediarix | 72 | | 36 | | 31 | | 65 | | 16 | | 16 | | 76 | | 45 | | 49 | | 68 | | 73 | | 70 | | 74 | | (4 | ) | 3 | | 62 | | (5 | ) | (5 | ) | 66 | | (13 | ) | (13 | ) | 73 | | 10 | | 7 | | | Boostrix | 5 | | 67 | | 67 | | 3 | | 50 | | 50 | | 4 | | 100 | | 100 | | 3 | | >100 | | >100 | | 5 | | – | | – | | 5 | | 67 | | 67 | | 5 | | 25 | | 25 | | 4 | | 33 | | 33 | | | Rotarix | | 7 | | >100 | | >100 | | 6 | | >100 | | >100 | | 6 | | >100 | | >100 | | 4 | | – | | – | | | Cervarix | | 9 | | – | | – | | – | | – | | – | | – | | – | | – | | – | | – | | – | |
| |
|
|
|
|
|
|
|
|
|
|
|
|
|
|
|
|
|
|
|
|
|
|
| |
|
| | | | | | | | | | | | | | | | | | | | | | | | | | | Cardiovascular and urogenital | 101 | | (1 | ) | (4 | ) | 96 | | (6 | ) | (7 | ) | 102 | | (5 | ) | (2 | ) | 96 | | (6 | ) | (7 | ) | 113 | | 5 | | 12 | | 96 | | (1 | ) | – | | 103 | | 3 | | 1 | | 100 | | 6 | | 4 | | | Coreg | – | | – | | – | | – | | – | | – | | – | | – | | – | | – | | – | | – | | – | | – | | – | | – | | – | | – | | – | | – | | – | | – | | – | | – | | | Coreg CR | | – | | – | | – | | – | | – | | – | | – | | – | | – | | – | | – | | – | | | Coreg IR | | – | | – | | – | | – | | – | | – | | – | | – | | – | | – | | – | | – | | | Levitra | – | | – | | – | | – | | – | | – | | 1 | | – | | – | | – | | – | | – | | 2 | | – | | – | | – | | – | | – | | – | | – | | – | | – | | – | | – | | | Avodart | 19 | | 27 | | 27 | | 17 | | 21 | | 21 | | 17 | | 14 | | 21 | | 16 | | 42 | | 33 | | 26 | | 26 | | 37 | | 21 | | 29 | | 24 | | 21 | | 24 | | 24 | | 18 | | 13 | | 13 | | | Arixtra | 7 | | >100 | | >100 | | 6 | | >100 | | >100 | | 6 | | >100 | | >100 | | 4 | | 100 | | 100 | | 11 | | 57 | | 57 | | 9 | | 33 | | 50 | | 10 | | 83 | | 67 | | 9 | | >100 | | >100 | | | Fraxiparine | 44 | | (4 | ) | (4 | ) | 44 | | 5 | | 2 | | 47 | | – | | 4 | | 44 | | – | | (2 | ) | 43 | | (9 | ) | (2 | ) | 35 | | (20 | ) | (20 | ) | 40 | | (15 | ) | (15 | ) | 42 | | (2 | ) | (5 | ) | | Vesicare | | – | | – | | – | | – | | – | | – | | – | | – | | – | | – | | – | | – | |
| |
|
|
|
|
|
|
|
|
|
|
|
|
|
|
|
|
|
|
|
|
|
|
| |
|
| | | | | | | | | | | | | | | | | | | | | | | | | | | Anti-bacterials | 164 | | (9 | ) | (11 | ) | 135 | | (13 | ) | (14 | ) | 149 | | (7 | ) | (4 | ) | 180 | | (18 | ) | (19 | ) | 176 | | 2 | | 7 | | 130 | | (4 | ) | (4 | ) | 131 | | (11 | ) | (12 | ) | 175 | | (1 | ) | (3 | ) | | Augmentin | 67 | | (15 | ) | (17 | ) | 54 | | (21 | ) | (21 | ) | 64 | | (10 | ) | (9 | ) | 83 | | (15 | ) | (15 | ) | 71 | | 1 | | 6 | | 54 | | – | | – | | 52 | | (20 | ) | (19 | ) | 73 | | (10 | ) | (12 | ) | | Zinnat/Ceftin | 22 | | (24 | ) | (24 | ) | 16 | | (16 | ) | (16 | ) | 18 | | (18 | ) | (18 | ) | 26 | | (38 | ) | (38 | ) | |
| |
|
|
|
|
|
|
|
|
|
|
|
|
|
|
|
|
|
|
|
|
|
|
| |
|
| | | | | | | | | | | | | | | | | | | | | | | | | | | Oncology and emesis | 33 | | (15 | ) | (15 | ) | 37 | | (8 | ) | (8 | ) | 42 | | – | | – | | 41 | | (5 | ) | (5 | ) | 38 | | 9 | | 15 | | 35 | | (8 | ) | (5 | ) | 34 | | (17 | ) | (19 | ) | 32 | | (20 | ) | (22 | ) | | Zofran | 21 | | (30 | ) | (30 | ) | 25 | | (10 | ) | (14 | ) | 31 | | (9 | ) | (3 | ) | 30 | | (6 | ) | (9 | ) | 17 | | (24 | ) | (19 | ) | 17 | | (32 | ) | (32 | ) | 17 | | (42 | ) | (45 | ) | 20 | | (33 | ) | (33 | ) | | Hycamtin | 8 | | 50 | | 33 | | 10 | | 29 | | 43 | | 9 | | 14 | | 29 | | 7 | | 14 | | – | | 12 | | 25 | | 50 | | 11 | | 10 | | 10 | | 10 | | 22 | | 11 | | 9 | | 29 | | 29 | | | Tykerb | | 5 | | – | | – | | 5 | | – | | – | | 2 | | – | | – | | 1 | | – | | – | |
| |
|
|
|
|
|
|
|
|
|
|
|
|
|
|
|
|
|
|
|
|
|
|
| |
|
| | | | | | | | | | | | | | | | | | | | | | | | | | | Other | 80 | | (7 | ) | (7 | ) | 61 | | (18 | ) | (20 | ) | 64 | | (20 | ) | (20 | ) | 58 | | (30 | ) | (28 | ) | 80 | | (4 | ) | – | | 63 | | 2 | | 3 | | 67 | | 6 | | 5 | | 56 | | (3 | ) | (3 | ) | | Zantac | 13 | | (24 | ) | (24 | ) | 11 | | (31 | ) | (31 | ) | 14 | | (13 | ) | (7 | ) | 14 | | (6 | ) | (13 | ) | 11 | | (23 | ) | (15 | ) | 10 | | (9 | ) | (9 | ) | 11 | | (14 | ) | (21 | ) | 10 | | (29 | ) | (29 | ) |
|
| |
|
|
|
|
|
|
|
|
|
|
|
|
|
|
|
|
|
|
|
|
|
|
| | | Total | 1,427 | | 1 | | (1 | ) | 1,321 | | – | | (1 | ) | 1,404 | | – | | 2 | | 1,395 | | 1 | | 1 | | 1,562 | | 4 | | 9 | | 1,336 | | 1 | | 1 | | 1,402 | | 1 | | – | | 1,392 | | 1 | | – | |
|
| |
|
|
|
|
|
|
|
|
|
|
|
|
|
|
|
|
|
|
|
|
|
|
| |
Pharmaceutical turnover includes co-promotion income. | 164 |
| GSK Annual Report 20062007 | 170 | |
<Back to Contents | | | Financial record | | | | | | | | Financial record | | continued |
| | |
Pharmaceutical turnover – International | | Q4 2006 | | Q3 2006 | | Q2 2006 | | Q1 2006 | | | Q4 2007 | | Q3 2007 | | Q2 2007 | | Q1 2007 | | | |
| |
| |
| |
| |
| |
| |
| |
| | | | £m | | CER % | | £% | | £m | | CER % | | £% | | £m | | CER % | | £% | | £m | | CER % | | £% | | £m | | CER% | | £% | | £m | | CER% | | £% | | £m | | CER% | | £% | | £m | | CER% | | £% | |
|
| |
|
| | | Respiratory | 220 | | – | | (8 | ) | 193 | | 3 | | (2 | ) | 209 | | 10 | | 11 | | 215 | | 4 | | 13 | | 253 | | 12 | | 15 | | 205 | | 8 | | 6 | | 215 | | 8 | | 3 | | 210 | | 10 | | (2 | ) | | Seretide/Advair | 76 | | 1 | | (6 | ) | 78 | | 7 | | 5 | | 76 | | 12 | | 10 | | 80 | | 20 | | 36 | | 109 | | 37 | | 43 | | 90 | | 15 | | 15 | | 91 | | 25 | | 20 | | 82 | | 14 | | 3 | | | Flixotide/Flovent | 51 | | 4 | | (4 | ) | 42 | | – | | (5 | ) | 50 | | 4 | | 6 | | 45 | | (2 | ) | 2 | | 50 | | (6 | ) | (2 | ) | 39 | | (5 | ) | (7 | ) | 45 | | (4 | ) | (10 | ) | 42 | | 7 | | (7 | ) | | Serevent | 19 | | 11 | | – | | 14 | | – | | (13 | ) | 17 | | 6 | | 6 | | 15 | | – | | – | | 17 | | (11 | ) | (11 | ) | 13 | | – | | (7 | ) | 17 | | 6 | | – | | 14 | | 7 | | (7 | ) | | Flixonase/Flonase | 20 | | (8 | ) | (17 | ) | 15 | | 23 | | 15 | | 17 | | – | | 6 | | 24 | | (38 | ) | (35 | ) | 19 | | – | | (5 | ) | 18 | | – | | 20 | | 14 | | – | | (18 | ) | 25 | | 17 | | 4 | |
|
| |
|
| | | Central Nervous System | 118 | | (3 | ) | (11 | ) | 110 | | – | | (7 | ) | 122 | | 5 | | 4 | | 109 | | 9 | | 14 | | | | Central nervous system | | 129 | | 9 | | 9 | | 112 | | 5 | | 2 | | 114 | | 2 | | (7 | ) | 103 | | 6 | | (6 | ) | | Seroxat/Paxil | 79 | | (1 | ) | (8 | ) | 69 | | 7 | | (4 | ) | 81 | | 7 | | 7 | | 67 | | 10 | | 10 | | 83 | | 8 | | 5 | | 68 | | 3 | | (1 | ) | 74 | | 1 | | (9 | ) | 63 | | 7 | | (6 | ) | | Paxil IR | 75 | | – | | (9 | ) | 66 | | 6 | | (3 | ) | 76 | | 5 | | 3 | | 63 | | 7 | | 7 | | 78 | | 7 | | 4 | | 65 | | 3 | | (2 | ) | 69 | | 1 | | (9 | ) | 59 | | 6 | | (6 | ) | | Paxil CR | 4 | | (25 | ) | – | | 3 | | 25 | | (25 | ) | 5 | | 50 | | >100 | | 4 | | 100 | | 100 | | 5 | | 25 | | 25 | | 3 | | – | | – | | 5 | | – | | – | | 4 | | 25 | | – | | | Wellbutrin | 4 | | (25 | ) | – | | 4 | | (20 | ) | (20 | ) | 5 | | >100 | | >100 | | 3 | | (33 | ) | – | | 4 | | 25 | | – | | 2 | | (50 | ) | (50 | ) | 4 | | (20 | ) | (20 | ) | 3 | | – | | – | | | Wellbutrin IR, SR | 3 | | (33 | ) | – | | 3 | | (25 | ) | (25 | ) | 3 | | >100 | | >100 | | 2 | | (50 | ) | – | | 3 | | 33 | | – | | 2 | | (33 | ) | (33 | ) | 3 | | – | | – | | 2 | | – | | – | | | Wellbutrin XL | 1 | | – | | – | | 1 | | – | | – | | 2 | | 100 | | 100 | | 1 | | – | | – | | 1 | | – | | – | | – | | – | | – | | 1 | | (50 | ) | (50 | ) | 1 | | – | | – | | | Imigran/Imitrex | 11 | | – | | (8 | ) | 10 | | (15 | ) | (23 | ) | 11 | | (23 | ) | (15 | ) | 10 | | (9 | ) | (9 | ) | 10 | | (9 | ) | (9 | ) | 10 | | 10 | | – | | 9 | | (9 | ) | (18 | ) | 9 | | – | | (10 | ) | | Lamictal | 14 | | – | | – | | 14 | | 7 | | (7 | ) | 13 | | (7 | ) | (7 | ) | 15 | | 8 | | 25 | | 16 | | 21 | | 14 | | 15 | | – | | 7 | | 14 | | 15 | | 8 | | 15 | | 13 | | – | | | Requip | 3 | | – | | 50 | | 3 | | 50 | | 50 | | 3 | | 50 | | 50 | | 2 | | – | | – | | 6 | | 67 | | 100 | | 5 | | 67 | | 67 | | 3 | | 67 | | – | | 3 | | 50 | | 50 | |
|
| |
|
| | | Anti-virals | 163 | | 11 | | 4 | | 146 | | 11 | | 6 | | 157 | | 21 | | 21 | | 152 | | 22 | | 31 | | 192 | | 18 | | 18 | | 156 | | 11 | | 7 | | 159 | | 9 | | 1 | | 157 | | 15 | | 3 | | | HIV | 46 | | 2 | | (6 | ) | 46 | | (4 | ) | (6 | ) | 48 | | 24 | | 14 | | 54 | | 12 | | 32 | | 48 | | 4 | | 4 | | 53 | | 17 | | 15 | | 49 | | 6 | | 2 | | 43 | | (7 | ) | (20 | ) | | Combivir | 15 | | (20 | ) | (25 | ) | 16 | | (5 | ) | (16 | ) | 20 | | 6 | | 11 | | 22 | | 25 | | 38 | | 18 | | 13 | | 20 | | 18 | | 25 | | 13 | | 16 | | (20 | ) | (20 | ) | 16 | | (14 | ) | (27 | ) | | Trizivir | 4 | | – | | 33 | | 2 | | (25 | ) | (50 | ) | 5 | | 33 | | 67 | | 3 | | (25 | ) | (25 | ) | 3 | | (25 | ) | (25 | ) | 4 | | >100 | | 100 | | 4 | | (40 | ) | (20 | ) | 3 | | 33 | | – | | | Epivir | 10 | | – | | (9 | ) | 9 | | (8 | ) | (31 | ) | 10 | | (9 | ) | (9 | ) | 14 | | 9 | | 27 | | 9 | | (20 | ) | (10 | ) | 8 | | – | | (11 | ) | 10 | | (10 | ) | – | | 9 | | (21 | ) | (36 | ) | | Ziagen | 6 | | (22 | ) | (33 | ) | 7 | | – | | – | | 7 | | 40 | | 40 | | 8 | | 17 | | 33 | | 8 | | – | | 33 | | 7 | | – | | – | | 6 | | – | | (14 | ) | 6 | | (13 | ) | (25 | ) | | Agenerase, Lexiva | 3 | | 50 | | 50 | | 2 | | – | | – | | 2 | | – | | – | | 2 | | – | | 100 | | 3 | | 67 | | – | | 4 | | – | | – | | 1 | | – | | (50 | ) | 2 | | – | | – | | | Epzicom/Kivexa | 7 | | >100 | | >100 | | 6 | | >100 | | >100 | | 3 | | >100 | | >100 | | 3 | | – | | – | | 10 | | 14 | | 43 | | 9 | | 67 | | 50 | | 7 | | >100 | | >100 | | 7 | | >100 | | >100 | | | | | | | | | | | | | | | | | | | | | | | | | | | | | | | | | | | | | | | | | | | | | | | | | | | | | Herpes | 52 | | (5 | ) | (10 | ) | 46 | | – | | (12 | ) | 58 | | 9 | | 7 | | 55 | | 11 | | 17 | | 58 | | 13 | | 12 | | 54 | | 15 | | 17 | | 52 | | 2 | | (10 | ) | 48 | | (4 | ) | (13 | ) | | Valtrex | 35 | | 6 | | – | | 29 | | – | | (12 | ) | 37 | | 16 | | 16 | | 35 | | 22 | | 30 | | 41 | | 20 | | 17 | | 38 | | 28 | | 31 | | 35 | | 8 | | (5 | ) | 32 | | – | | (9 | ) | | Zovirax | 17 | | (22 | ) | (26 | ) | 17 | | – | | (11 | ) | 21 | | – | | (5 | ) | 20 | | (5 | ) | – | | 17 | | – | | – | | 16 | | (6 | ) | (6 | ) | 17 | | (10 | ) | (19 | ) | 16 | | (10 | ) | (20 | ) | | | | | | | | | | | | | | | | | | | | | | | | | | | | | Zeffix | 33 | | 3 | | – | | 32 | | 13 | | 7 | | 31 | | 11 | | 15 | | 30 | | 27 | | 36 | | 33 | | (6 | ) | – | | 32 | | 9 | | – | | 35 | | 16 | | 13 | | 31 | | 17 | | 3 | | | Relenza | 15 | | >100 | | >100 | | 6 | | >100 | | >100 | | 7 | | >100 | | >100 | | 1 | | – | | – | | 30 | | >100 | | 100 | | 2 | | – | | (67 | ) | 7 | | – | | – | | 16 | | >100 | | >100 | |
|
| |
|
| | | Metabolic | 84 | | 7 | | (2 | ) | 85 | | 10 | | 8 | | 96 | | 15 | | 19 | | 81 | | 17 | | 27 | | 76 | | (13 | ) | (10 | ) | 72 | | (13 | ) | (15 | ) | 89 | | (3 | ) | (7 | ) | 88 | | 21 | | 9 | | | Avandia | 48 | | 4 | | (4 | ) | 51 | | 16 | | 13 | | 60 | | 19 | | 28 | | 47 | | 17 | | 31 | | 36 | | (33 | ) | (25 | ) | 35 | | (27 | ) | (31 | ) | 49 | | (17 | ) | (18 | ) | 52 | | 23 | | 11 | | | Avandamet | 9 | | 60 | | 80 | | 6 | | – | | 20 | | 6 | | >100 | | 100 | | 5 | | – | | 25 | | 7 | | (11 | ) | (22 | ) | 8 | | – | | 33 | | 9 | | 67 | | 50 | | 10 | | >100 | | 100 | | | Avandaryl | – | | – | | – | | 1 | | – | | – | | 1 | | – | | – | | – | | – | | – | | 1 | | – | | – | | 2 | | 100 | | 100 | | 2 | | – | | – | | 1 | | – | | – | | | Bonviva/Boniva | – | | – | | – | | – | | – | | – | | – | | – | | – | | – | | – | | – | | (1 | ) | – | | – | | 2 | | – | | >100 | | – | | – | | – | | – | | – | | – | |
|
| |
|
| | | Vaccines | 165 | | 10 | | 6 | | 113 | | 2 | | (1 | ) | 122 | | 8 | | 12 | | 118 | | 41 | | 48 | | 172 | | 1 | | 4 | | 150 | | 35 | | 33 | | 115 | | (3 | ) | (6 | ) | 114 | | 3 | | (3 | ) | | Hepatitis | 25 | | 8 | | 4 | | 21 | | 6 | | 17 | | 21 | | 10 | | – | | 24 | | 10 | | 20 | | 28 | | 12 | | 12 | | 20 | | – | | (5 | ) | 22 | | – | | 5 | | 25 | | 17 | | 4 | | | Influenza | | 19 | | (20 | ) | (24 | ) | 11 | | 10 | | 10 | | 4 | | (57 | ) | (43 | ) | 1 | | – | | – | | | Infanrix, Pediarix | 17 | | (11 | ) | (11 | ) | 12 | | – | | (14 | ) | 14 | | 44 | | 56 | | 15 | | 40 | | 50 | | 19 | | 12 | | 12 | | 17 | | 33 | | 42 | | 18 | | 36 | | 29 | | 18 | | 27 | | 20 | | | Boostrix | – | | – | | – | | 1 | | – | | – | | 1 | | 100 | | 100 | | 2 | | >100 | | 100 | | 2 | | – | | – | | 1 | | 100 | | – | | 2 | | – | | 100 | | 2 | | – | | – | | | Rotarix | | 32 | | 60 | | 60 | | 17 | | >100 | | >100 | | 9 | | >100 | | >100 | | 10 | | 57 | | 43 | | | Cervarix | | – | | – | | – | | – | | – | | – | | – | | – | | – | | – | | – | | – | |
|
| |
|
| | | Cardiovascular and urogenital | 39 | | (9 | ) | (11 | ) | 41 | | 23 | | 17 | | 53 | | 30 | | 33 | | 36 | | 10 | | 16 | | 49 | | 26 | | 26 | | 43 | | 10 | | 5 | | 44 | | (13 | ) | (17 | ) | 36 | | 11 | | – | | | Coreg | 1 | | – | | – | | 2 | | 100 | | 100 | | 2 | | 100 | | 100 | | 1 | | (50 | ) | (50 | ) | – | | – | | – | | 1 | | 50 | | (50 | ) | 3 | | – | | 50 | | 2 | | 100 | | 100 | | | Coreg CR | | (1 | ) | – | | – | | – | | – | | – | | 1 | | – | | – | | – | | – | | – | | | Coreg IR | | 1 | | – | | – | | 1 | | – | | (50 | ) | 2 | | – | | – | | 2 | | 100 | | 100 | | | Levitra | – | | – | | – | | – | | – | | – | | – | | – | | – | | 1 | | – | | – | | (2 | ) | – | | – | | 1 | | (50 | ) | (50 | ) | – | | – | | – | | 1 | | – | | – | | | Avodart | 6 | | 67 | | 100 | | 3 | | 100 | | 50 | | 4 | | 100 | | 100 | | 3 | | – | | 50 | | 8 | | 17 | | 33 | | 6 | | >100 | | 100 | | 6 | | 50 | | 50 | | 4 | | 67 | | 33 | | | Arixtra | 2 | | – | | – | | – | | – | | – | | 1 | | 100 | | >100 | | – | | – | | – | | 2 | | – | | – | | 2 | | – | | – | | 2 | | – | | 100 | | – | | – | | – | | | Fraxiparine | 9 | | 11 | | – | | 5 | | (17 | ) | (17 | ) | 9 | | – | | (10 | ) | 7 | | (29 | ) | – | | 8 | | (11 | ) | (11 | ) | 6 | | 20 | | 20 | | 5 | | (33 | ) | (44 | ) | 5 | | (29 | ) | (29 | ) | | Vesicare | | – | | – | | – | | – | | – | | – | | – | | – | | – | | – | | – | |
|
| |
|
| | | Anti-bacterials | 133 | | (3 | ) | (10 | ) | 124 | | (5 | ) | (9 | ) | 131 | | (5 | ) | (5 | ) | 136 | | 7 | | 14 | | 142 | | 6 | | 7 | | 131 | | 6 | | 6 | | 130 | | 2 | | (1 | ) | 120 | | (3 | ) | (12 | ) | | Augmentin | 53 | | 2 | | (2 | ) | 47 | | (2 | ) | (10 | ) | 52 | | (9 | ) | (5 | ) | 56 | | 13 | | 19 | | 60 | | 9 | | 13 | | 52 | | 11 | | 11 | | 51 | | 6 | | (2 | ) | 50 | | (5 | ) | (11 | ) | | Zinnat/Ceftin | 17 | | (14 | ) | (19 | ) | 16 | | (5 | ) | (20 | ) | 17 | | (6 | ) | – | | 20 | | 6 | | 18 | | |
|
| |
|
| | | Oncology and emesis | 18 | | (20 | ) | (28 | ) | 19 | | (13 | ) | (17 | ) | 21 | | (9 | ) | (5 | ) | 22 | | – | | 5 | | 17 | | (6 | ) | (6 | ) | 17 | | (5 | ) | (11 | ) | 17 | | (14 | ) | (19 | ) | 15 | | (27 | ) | (32 | ) | | Zofran | 14 | | (25 | ) | (30 | ) | 13 | | (26 | ) | (32 | ) | 15 | | (6 | ) | (17 | ) | 19 | | (6 | ) | 12 | | 12 | | (21 | ) | (14 | ) | 11 | | (8 | ) | (15 | ) | 13 | | (13 | ) | (13 | ) | 11 | | (37 | ) | (42 | ) | | Hycamtin | 2 | | (50 | ) | – | | 1 | | 100 | | – | | 2 | | 50 | | – | | 2 | | – | | 100 | | 2 | | 50 | | – | | 1 | | – | | – | | 2 | | (50 | ) | – | | 2 | | – | | – | | | Tykerb | | 2 | | – | | – | | – | | – | | – | | – | | – | | – | | – | | – | | – | |
|
| |
|
| | | Other | 159 | | 6 | | (3 | ) | 150 | | (2 | ) | (7 | ) | 152 | | (8 | ) | (10 | ) | 166 | | 2 | | 8 | | 158 | | (2 | ) | (1 | ) | 153 | | 5 | | 2 | | 163 | | 11 | | 7 | | 152 | | 2 | | (8 | ) | | Zantac | 26 | | (3 | ) | (13 | ) | 24 | | (10 | ) | (20 | ) | 28 | | (9 | ) | (13 | ) | 30 | | (7 | ) | – | | 25 | | – | | (4 | ) | 22 | | (4 | ) | (8 | ) | 24 | | (11 | ) | (14 | ) | 22 | | (17 | ) | (27 | ) |
|
| |
|
| | | Total | 1,099 | | 3 | | (5 | ) | 981 | | 3 | | (2 | ) | 1,063 | | 6 | | 7 | | 1,035 | | 12 | | 19 | | 1,188 | | 6 | | 8 | | 1,039 | | 9 | | 6 | | 1,046 | | 3 | | (2 | ) | 995 | | 7 | | 4 | |
|
| |
|
| |
Pharmaceutical turnover includes co-promotion income. |
| GSK Annual Report 20062007 | 165 | 171 | |
<Back to Contents | | INVESTOR INFORMATION | | Financial record | continued | |
| | | | Financial record | | continued | | |
Five year record A record of financial performance is provided analysed in accordance with current reporting practice. The transition date to IFRS for GlaxoSmithKline was 1st January 2003. Therefore, the 2006, 2005, 2004 and 2003 information included in the Five year record is prepared in accordance with IFRS as adopted for use in the European Union. For GSK there are no differences between IFRS as adopted for use inby the European Union and fullalso with IFRS as publishedissued by the International Accounting Standards Board. The 2002 information is in accordance with UK GAAP. | Turnover by business segment | 2007 | | 2006 | | 2005 | | 2004 | | 2003 | | | | £m | | £m | | £m | | £m | | £m | |
|
|
| | | Pharmaceuticals | 19,233 | | 20,078 | | 18,661 | | 17,100 | | 18,114 | | | Consumer Healthcare | 3,483 | | 3,147 | | 2,999 | | 2,886 | | 2,956 | |
|
|
| | | | 22,716 | | 23,225 | | 21,660 | | 19,986 | | 21,070 | |
|
|
| | | | | | | | | | | | | | | Pharmaceutical turnover by therapeutic area | 2007 | | 2006 | | 2005 | | 2004 | | 2003 | | | | £m | | £m | | £m | | £m | | £m | |
|
|
| | | Respiratory | 5,032 | | 4,995 | | 5,054 | | 4,394 | | 4,390 | | | Central nervous system | 3,348 | | 3,642 | | 3,219 | | 3,462 | | 4,446 | | | Anti-virals | 3,028 | | 2,827 | | 2,598 | | 2,359 | | 2,345 | | | Metabolic | 1,514 | | 1,875 | | 1,495 | | 1,251 | | 1,077 | | | Vaccines | 1,993 | | 1,692 | | 1,389 | | 1,194 | | 1,121 | | | Cardiovascular and urogenital | 1,554 | | 1,636 | | 1,331 | | 932 | | 770 | | | Anti-bacterials | 1,330 | | 1,369 | | 1,519 | | 1,547 | | 1,800 | | | Oncology and emesis | 477 | | 1,069 | | 1,016 | | 934 | | 1,000 | | | Other | 957 | | 973 | | 1,040 | | 1,027 | | 1,165 | |
|
|
| | | | 19,233 | | 20,078 | | 18,661 | | 17,100 | | 18,114 | |
|
|
| | | | | | | | | | | | | | | Pharmaceutical turnover by geographic area | 2007 | | 2006 | | 2005 | | 2004 | | 2003 | | | | £m | | £m | | £m | | £m | | £m | |
|
|
| | | USA | 9,273 | | 10,353 | | 9,106 | | 8,425 | | 9,410 | | | Europe | 5,692 | | 5,547 | | 5,537 | | 5,084 | | 5,050 | | | International: | | | | | | | | | | | | Asia Pacific | 1,441 | | 1,377 | | 1,324 | | 1,161 | | 1,138 | | | Japan | 867 | | 860 | | 854 | | 769 | | 751 | | | Middle East, Africa | 774 | | 744 | | 746 | | 669 | | 693 | | | Latin America | 709 | | 714 | | 651 | | 581 | | 598 | | | Canada | 477 | | 483 | | 443 | | 411 | | 474 | | | International | 4,268 | | 4,178 | | 4018 | | 3,591 | | 3,654 | |
|
|
| | | | 19,233 | | 20,078 | | 18,661 | | 17,100 | | 18,114 | |
|
|
| |
To provide a link between IFRS and UK GAAP, 2003 information is also presented under UK GAAP. The accounting policies used in the preparation of the UK GAAP information are disclosed in the 2004 Annual Report. Information prepared under IFRS is not directly comparable with information prepared under UK GAAP.Pharmaceutical turnover includes co-promotion income.
The Five year record also presents information in accordance with US GAAP.
| Turnover by business segment – IFRS | 2006 | | 2005 | | 2004 | | 2003 | | | | | | £m | | £m | | £m | | £m | | | |
|
|
|
|
|
|
|
| | | | | Pharmaceuticals | 20,078 | | 18,661 | | 17,100 | | 18,114 | | | | | Consumer Healthcare | 3,147 | | 2,999 | | 2,886 | | 2,956 | | | |
|
|
|
|
|
|
|
| | | | | | 23,225 | | 21,660 | | 19,986 | | 21,070 | | | |
|
|
|
|
|
|
|
| | | |
| | | | | | | Turnover by business segment – UK GAAP | 2003 | | 2002 | | | | £m | | £m | |
|
|
|
| | | Pharmaceuticals | 18,181 | | 17,995 | | | Consumer Healthcare | 3,260 | | 3,217 | |
|
|
|
| | | | 21,441 | | 21,212 | |
|
|
|
| |
| | | | | | | | | | | | | Pharmaceutical turnover by therapeutic area – IFRS | 2006 | | 2005 | | 2004 | | 2003 | | | | | | £m | | £m | | £m | | £m | | | |
|
|
|
|
|
|
|
| | | | | Respiratory | 4,995 | | 5,054 | | 4,394 | | 4,390 | | | | | Central nervous system | 3,642 | | 3,219 | | 3,462 | | 4,446 | | | | | Anti-virals | 2,827 | | 2,598 | | 2,359 | | 2,345 | | | | | Metabolic | 1,875 | | 1,495 | | 1,251 | | 1,077 | | | | | Vaccines | 1,692 | | 1,389 | | 1,194 | | 1,121 | | | | | Cardiovascular and urogenital | 1,636 | | 1,331 | | 932 | | 770 | | | | | Anti-bacterials | 1,369 | | 1,519 | | 1,547 | | 1,800 | | | | | Oncology and emesis | 1,069 | | 1,016 | | 934 | | 1,000 | | | | | Other | 973 | | 1,040 | | 1,027 | | 1,165 | | | |
|
|
|
|
|
|
|
| | | | | | 20,078 | | 18,661 | | 17,100 | | 18,114 | | | |
|
|
|
|
|
|
|
| | | |
| | | | | | | Pharmaceutical turnover by therapeutic area – UK GAAP | 2003 | | 2002 | | | | £m | | £m | |
|
|
|
| | | Respiratory | 4,417 | | 3,987 | | | Central nervous system | 4,455 | | 4,511 | | | Anti-virals | 2,349 | | 2,299 | | | Metabolic | 1,079 | | 960 | | | Vaccines | 1,123 | | 1,080 | | | Cardiovascular and urogenital | 771 | | 661 | | | Anti-bacterials | 1,815 | | 2,210 | | | Oncology and emesis | 1,001 | | 977 | | | Others | 1,171 | | 1,310 | |
|
|
|
| | | | 18,181 | | 17,995 | |
|
|
|
| |
| | | | | | | | | | | | | Pharmaceutical turnover by geographic area – IFRS | 2006 | | 2005 | | 2004 | | 2003 | | | | | | £m | | £m | | £m | | £m | | | |
|
|
|
|
|
|
|
| | | | | USA | 10,353 | | 9,106 | | 8,425 | | 9,410 | | | | | Europe | 5,547 | | 5,537 | | 5,084 | | 5,050 | | | | | International: | | | | | | | | | | | | Asia Pacific | 1,377 | | 1,324 | | 1,161 | | 1,138 | | | | | Japan | 860 | | 854 | | 769 | | 751 | | | | | Middle East, Africa | 744 | | 746 | | 669 | | 693 | | | | | Latin America | 714 | | 651 | | 581 | | 598 | | | | | Canada | 483 | | 443 | | 411 | | 474 | | | |
|
|
|
|
|
|
|
| | | | | International | 4,178 | | 4,018 | | 3,591 | | 3,654 | | | |
|
|
|
|
|
|
|
| | | | | | 20,078 | | 18,661 | | 17,100 | | 18,114 | | | |
|
|
|
|
|
|
|
| | | |
| Consumer Healthcare turnover | 2007 | | 2006 | | 2005 | | 2004 | | 2003 | | | | £m | | £m | | £m | | £m | | £m | |
|
|
| | | OTC medicines | 1,718 | | 1,496 | | 1,437 | | 1,400 | | 1,472 | | | Oral care | 1,049 | | 993 | | 943 | | 913 | | 915 | | | Nutritional healthcare | 716 | | 658 | | 619 | | 573 | | 569 | |
|
|
| | | | 3,483 | | 3,147 | | 2,999 | | 2,886 | | 2,956 | |
|
|
| | | | | | |
| 166 |
| GSK Annual Report 20062007 | 172 | |
<Back to Contents | | | Financial record | | | | | | | | Financial record | | continued |
|
| Financial results - total | 2007 | | 2006 | | 2005 | | 2004 | | 2003 | | | | £m | | £m | | £m | | £m | | £m | |
|
|
| | | Turnover | 22,716 | | 23,225 | | 21,660 | | 19,986 | | 21,070 | | | Operating profit | 7,593 | | 7,808 | | 6,874 | | 5,756 | | 6,050 | | | Profit before taxation | 7,452 | | 7,799 | | 6,732 | | 5,779 | | 5,954 | | | Profit after taxation | 5,310 | | 5,498 | | 4,816 | | 4,022 | | 4,308 | |
|
|
| | | | | |
| | pence | | pence | | pence | | pence | | pence | |
|
| | | Basic earnings per share | 94.4 | p | 95.5 | p | 82.6 | p | 68.1 | p | 72.3 | p | | Diluted earnings per share | 93.7 | p | 94.5 | p | 82.0 | p | 68.0 | p | 72.1 | p |
|
| | | | |
| Financial results - business performance | 2007 | | | | £m | |
|
| | | Turnover | 22,716 | | | Operating profit | 7,931 | | | Profit before taxation | 7,790 | | | Profit after taxation | 5,571 | |
|
| |
| Pharmaceutical turnover by geographic area – UK GAAP | 2003 | | 2002 | | | | £m | | £m | |
|
|
|
| | | USA | 9,410 | | 9,797 | | | Europe | 5,114 | | 4,701 | | | International: | | | | | | Asia Pacific | 1,140 | | 1,100 | | | Japan | 753 | | 712 | | | Middle East, Africa | 693 | | 652 | | | Latin America | 597 | | 606 | | | Canada | 474 | | 427 | |
|
|
|
| | | International | 3,657 | | 3,497 | |
|
|
|
| | | | 18,181 | | 17,995 | |
|
|
|
| |
Pharmaceutical turnover in 2006, 2005, 2004 and 2003 includes co-promotion income.
| Consumer healthcare turnover – IFRS | 2006 | | 2005 | | 2004 | | 2003 | | | | | | £m | | £m | | £m | | £m | | | |
|
|
|
|
|
|
|
| | | | | OTC medicines | 1,496 | | 1,437 | | 1,400 | | 1,472 | | | | | Oral care | 993 | | 943 | | 913 | | 915 | | | | | Nutritional healthcare | 658 | | 619 | | 573 | | 569 | | | |
|
|
|
|
|
|
|
| | | | | | 3,147 | | 2,999 | | 2,886 | | 2,956 | | | |
|
|
|
|
|
|
|
| | | |
| | | | | | | Consumer healthcare turnover – UK GAAP | 2003 | | 2002 | | | | £m | | £m | |
|
|
|
| | | OTC medicines | 1,556 | | 1,586 | | | Oral care | 1,082 | | 1,052 | | | Nutritional healthcare | 622 | | 579 | |
|
|
|
| | | | 3,260 | | 3,217 | |
|
|
|
| |
| | | | | | | | | | | | | Financial results – IFRS | 2006 | | 2005 | | 2004 | | 2003 | | | | | | £m | | £m | | £m | | £m | | | |
|
|
|
|
|
|
|
| | | | | Turnover | 23,225 | | 21,660 | | 19,986 | | 21,070 | | | | | Operating profit | 7,808 | | 6,874 | | 5,756 | | 6,050 | | | | | Profit before taxation | 7,799 | | 6,732 | | 5,779 | | 5,954 | | | | | Profit after taxation | 5,498 | | 4,816 | | 4,022 | | 4,308 | | | | | Basic earnings per share (pence) | 95.5 | p | 82.6 | p | 68.1 | p | 72.3 | p | | | | Diluted earnings per share (pence) | 94.5 | p | 82.0 | p | 68.0 | p | 72.1 | p | | | | Weighted average number of shares in issue: | | | | | | | | | | | | Basic | 5,643 | | 5,674 | | 5,736 | | 5,806 | | | | | Diluted | 5,700 | | 5,720 | | 5,748 | | 5,824 | | | |
|
|
|
|
|
|
|
| | | | | Return on capital employed (%) | 90.6 | | 99.7 | | 100.2 | | 116.6 | | | |
|
|
|
|
|
|
|
| | | |
| | | | | | | Financial results – UK GAAP | 2003 | | 2002 | | | | £m | | £m | |
|
|
|
| | | Turnover | 21,441 | | 21,212 | | | Operating profit | 6,376 | | 5,569 | | | Profit before taxation | 6,313 | | 5,524 | | | Profit after taxation | 4,584 | | 4,060 | | | Basic earnings per share (pence) | 77.1 | p | 66.5 | p | | Diluted earnings per share (pence) | 76.9 | p | 66.3 | p | | Weighted average number of shares in issue: | | | | | | Basic | 5,806 | | 5,912 | | | Diluted | 5,824 | | 5,934 | |
|
|
|
| | | Return on capital employed (%) | 120.8 | | 110.6 | |
|
|
|
| |
| | | | | pence | | |
|
| | | | Adjusted earnings per share | 99.1 | p | | | Adjusted diluted earnings per share | 98.3 | p | |
|
| | |
| | | | | | | | | | | | | | millions | | millions | | millions | | millions | | millions | |
|
|
|
|
|
|
|
|
|
| | | Weighted average number of shares in issue: | | | | | | | | | | | | Basic | 5,524 | | 5,643 | | 5,674 | | 5,736 | | 5,806 | | | Diluted | 5,567 | | 5,700 | | 5,720 | | 5,748 | | 5,824 | |
|
|
|
|
|
|
|
|
|
| | | | | | | | | | | | | | | | % | | % | | % | | % | | % | |
|
|
|
|
|
|
|
|
|
| | | Return on capital employed | 76.2 | | 90.6 | | 99.7 | | 100.2 | | 116.6 | |
|
|
|
|
|
|
|
|
|
| |
Return on capital employed is calculated as statutorytotal profit before taxation as a percentage of average capital employed over the year. | Balance sheet | 2007 | | 2006 | | 2005 | | 2004 | | 2003 | | | | £m | | £m | | £m | | £m | | £m | |
|
| | | Non-current assets | 17,377 | | 14,561 | | 14,021 | | 12,164 | | 11,622 | | | Current assets | 13,626 | | 10,992 | | 13,177 | | 10,780 | | 10,298 | |
|
| | | Total assets | 31,003 | | 25,553 | | 27,198 | | 22,944 | | 21,920 | |
|
| | | Current liabilities | (10,345 | ) | (7,265 | ) | (9,511 | ) | (8,564 | ) | (8,314 | ) | | Non-current liabilities | (10,748 | ) | (8,640 | ) | (10,117 | ) | (8,443 | ) | (8,008 | ) |
|
| | | Total liabilities | (21,093 | ) | (15,905 | ) | (19,628 | ) | (17,007 | ) | (16,322 | ) |
|
| | | Net assets | 9,910 | | 9,648 | | 7,570 | | 5,937 | | 5,598 | |
|
| | | Shareholders’ equity | 9,603 | | 9,386 | | 7,311 | | 5,724 | | 4,917 | | | Minority interests | 307 | | 262 | | 259 | | 213 | | 681 | |
|
| | | Total equity | 9,910 | | 9,648 | | 7,570 | | 5,937 | | 5,598 | |
|
| | | | | |
|
| GSK Annual Report 20062007 | 167 | 173 | |
<Back to Contents
| Financial record | continued |
| |
| Amounts in accordance with US GAAP | 2006 | | 2005 | | 2004 | | 2003 | | 2002 | | | £m | £m | £m | £m | £m |
|
|
|
|
|
|
|
|
|
| | | Turnover | 23,225 | | 21,660 | | 19,986 | | 21,117 | | 21,212 | | | Net income | 4,465 | | 3,336 | | 2,732 | | 2,420 | | 413 | | | Basic net income per share (pence) | 79.1 | p | 58.8 | p | 47.6 | p | 41.7 | p | 7.0 | p | | Diluted net income per share (pence) | 78.4 | p | 58.3 | p | 47.5 | p | 41.6 | p | 7.0 | p |
|
|
|
|
|
|
|
|
|
| |
The information presented in accordance with US GAAP is derived from financial information prepared under IFRS, as adopted for use in the European Union, for 2003-2006 and from UK GAAP for 2002.
| Balance sheet – IFRS | | | | | | | | | | | 2006 | | 2005 | | 2004 | | 2003 | | | £m | £m | £m | £m |
|
|
|
|
|
|
|
| | | Non-current assets | 14,561 | | 14,021 | | 12,164 | | 11,622 | | | Current assets | 10,992 | | 13,177 | | 10,780 | | 10,298 | |
|
|
|
|
|
|
|
| | | Total assets | 25,553 | | 27,198 | | 22,944 | | 21,920 | | | Current liabilities | (7,265 | ) | (9,511 | ) | (8,564 | ) | (8,314 | ) | | Non-current liabilities | (8,640 | ) | (10,117 | ) | (8,443 | ) | (8,008 | ) |
|
|
|
|
|
|
|
| | | Total liabilities | (15,905 | ) | (19,628 | ) | (17,007 | ) | (16,322 | ) |
|
|
|
|
|
|
|
| | | Net assets | 9,648 | | 7,570 | | 5,937 | | 5,598 | |
|
|
|
|
|
|
|
| | | Equity | | | | | | | | |
|
|
|
|
|
|
|
| | | Shareholders’ equity | 9,386 | | 7,311 | | 5,724 | | 4,917 | | | Minority interests | 262 | | 259 | | 213 | | 681 | |
|
|
|
|
|
|
|
| | | | 9,648 | | 7,570 | | 5,937 | | 5,598 | |
|
|
|
|
|
|
|
| | | | | | | | | | | |
| Balance sheet – UK GAAP | | | | | | | 2003 | | 2002 | | | £m | £m |
|
|
|
| | | Fixed assets | 8,575 | | 8,752 | | | Current assets | 12,625 | | 10,749 | |
|
|
|
| | | Total assets | 21,200 | | 19,501 | | | Current liabilities | (8,471 | ) | (8,724 | ) | | Non-current liabilities | (6,925 | ) | (6,130 | ) |
|
|
|
| | | Total liabilities | (15,396 | ) | (14,854 | ) |
|
|
|
| | | Net assets | 5,804 | | 4,647 | |
|
|
|
| | | Equity | | | | |
|
|
|
| | | Shareholders’ equity | 5,059 | | 3,840 | | | Minority interests | 745 | | 807 | |
|
|
|
| | | | 5,804 | | 4,647 | |
|
|
|
| | | | | | | |
| Amounts in accordance with US GAAP | | | | | | | | | | | | | 2006 | | 2005 | | 2004 | | 2003 | | 2002 | | | £m | £m | £m | £m | £m |
|
|
|
|
|
|
|
|
|
| | | Total assets | 54,623 | | 57,218 | | 55,841 | | 56,400 | | 57,671 | | | Net assets | 34,914 | | 34,599 | | 34,429 | | 34,861 | | 35,729 | | | Long-term borrowings | (4,806 | ) | (5,293 | ) | (4,374 | ) | (3,640 | ) | (3,085 | ) | | Shareholders’ equity | 34,653 | | 34,282 | | 34,042 | | 34,116 | | 34,922 | |
|
|
|
|
|
|
|
|
|
| |
|
| GSK Annual Report 2006 | 174 |
<Back to Contents | Financial record | | | | | | | | Financial record | | continued |
| | |
| Number of employees | | | | | | | | | | | | | 2006 | | 2005 | | 2004 | | 2003 | | 2002 | |
|
|
|
|
|
|
|
|
|
| | | USA | 24,726 | | 23,822 | | 23,782 | | 24,036 | | 23,527 | | | Europe | 45,758 | | 43,999 | | 44,679 | | 44,559 | | 46,028 | | | International: | | | | | | | | | | | | Asia Pacific | 17,570 | | 15,991 | | 16,109 | | 18,373 | | 17,289 | | | Japan | 3,195 | | 3,098 | | 2,965 | | 2,842 | | 2,952 | | | Middle East, Africa | 3,204 | | 5,682 | | 5,134 | | 3,400 | | 5,973 | | | Latin America | 5,856 | | 5,664 | | 5,603 | | 5,916 | | 6,876 | | | Canada | 2,386 | | 2,472 | | 1,747 | | 1,793 | | 1,854 | |
|
|
|
|
|
|
|
|
|
| | | International | 32,211 | | 32,907 | | 31,558 | | 32,324 | | 34,944 | |
|
|
|
|
|
|
|
|
|
| | | | 102,695 | | 100,728 | | 100,019 | | 100,919 | | 104,499 | |
|
|
|
|
|
|
|
|
|
| | | Manufacturing | 33,235 | | 31,615 | | 31,143 | | 32,459 | | 35,503 | | | Selling | 44,484 | | 44,393 | | 44,646 | | 43,978 | | 43,994 | | | Administration | 9,024 | | 9,225 | | 9,193 | | 9,550 | | 10,378 | | | Research and development | 15,952 | | 15,495 | | 15,037 | | 14,932 | | 14,624 | |
|
|
|
|
|
|
|
|
|
| | | | 102,695 | | 100,728 | | 100,019 | | 100,919 | | 104,499 | |
|
|
|
|
|
|
|
|
|
| |
Number of employees | | | 2007 | | 2006 | | 2005 | | 2004 | | 2003 | |
|
|
|
|
|
|
|
|
|
|
| | | USA | 24,838 | | 24,726 | | 23,822 | | 23,782 | | 24,036 | | | Europe | 46,869 | | 45,758 | | 43,999 | | 44,679 | | 44,559 | | | International: | | | | | | | | | | | | | Asia Pacific | 17,525 | | 17,570 | | 15,991 | | 16,109 | | 18,373 | | | | Japan | 3,284 | | 3,195 | | 3,098 | | 2,965 | | 2,842 | | | | Middle East, Africa | 3,156 | | 3,204 | | 5,682 | | 5,134 | | 3,400 | | | | Latin America | 5,249 | | 5,856 | | 5,664 | | 5,603 | | 5,916 | | | | Canada | 2,562 | | 2,386 | | 2,472 | | 1,747 | | 1,793 | |
|
|
|
|
|
|
|
|
|
|
| | | International | 31,776 | | 32,211 | | 32,907 | | 31,558 | | 32,324 | |
|
|
|
|
|
|
|
|
|
|
| | | | | 103,483 | | 102,695 | | 100,728 | | 100,019 | | 100,919 | |
|
|
|
|
|
|
|
|
|
|
| | | Manufacturing | 33,995 | | 33,235 | | 31,615 | | 31,143 | | 32,459 | | | Selling | 44,499 | | 44,484 | | 44,393 | | 44,646 | | 43,978 | | | Administration | 8,960 | | 9,024 | | 9,225 | | 9,193 | | 9,550 | | | Research and development | 16,029 | | 15,952 | | 15,495 | | 15,037 | | 14,932 | |
|
|
|
|
|
|
|
|
|
|
| | | | | 103,483 | | 102,695 | | 100,728 | | 100,019 | | 100,919 | |
|
|
|
|
|
|
|
|
|
|
| |
The number of employees is the number of permanent employed staff at the end of the financial period. It excludes those employees who are employed and managed by GlaxoSmithKlineGSK on a contract basis. Exchange rates
As a guide to holders of ADRs, the following tables set out, for the periods indicated, information on the exchange rate of US dollars for Sterling as reported by the Federal Reserve Bank of New York (‘noon buying rate’). | | 2006 | | 2005 | | 2004 | | 2003 | | 2002 | |
|
|
|
|
|
|
|
|
|
| | | Average | 1.85 | | 1.81 | | 1.84 | | 1.63 | | 1.51 | |
|
|
|
|
|
|
|
|
|
| |
| | 2007 | | 2006 | | 2005 | | 2004 | | 2003 | |
|
|
|
|
|
|
|
|
|
| | | Average | 2.00 | | 1.85 | | 1.81 | | 1.84 | | 1.63 | |
|
|
|
|
|
|
|
|
|
| |
The average rate for the year is calculated as the average of the noon buying rates on the last day of each month during the year. | | Feb | | Jan | | Dec | | Nov | | Oct | | Sept | | Feb | | Jan | | Dec | | Nov | | Oct | | Sept | | | 2007 | 2006 | 2008 | | 2008 | | 2007 | | 2007 | | 2007 | | 2007 | |
|
| |
| | | High | 1.97 | | 1.98 | | 1.98 | | 1.97 | | 1.91 | | 1.91 | | 1.98 | | 1.99 | | 2.07 | | 2.11 | | 2.08 | | 2.04 | | | Low | 1.94 | | 1.93 | | 1.95 | | 1.89 | | 1.85 | | 1.86 | | 1.94 | | 1.95 | | 1.98 | | 2.05 | | 2.03 | | 1.99 | |
|
| |
| |
The noon buying rate on 23rd22nd February 20072008 was £1 = US$1.96.1.97. | 168 |
| GSK Annual Report 20062007 | 175 | |
<Back to Contents | INVESTOR INFORMATION | | | Shareholder information | | | | | | | |
Shareholder information | | | |
| Share price | | | | | | | | | 2006 | | 2005 | | 2004 | | | £ | £ | £ |
|
|
|
|
|
| | | At 1st January | 14.69 | | 12.22 | | 12.80 | | | High during the year | 15.77 | | 15.44 | | 12.99 | | | Low during the year | 13.26 | | 11.75 | | 10.42 | | | At 31st December | 13.44 | | 14.69 | | 12.22 | | | (Decrease)/Increase | (9)% | | 20% | | (5)% | |
|
|
|
|
|
| |
Share price | | 2007 | | 2006 | | 2005 | | | | £m | | £m | | £m | |
|
|
|
|
|
| | | At 1st January | 13.44 | | 14.69 | | 12.22 | | | High during the year | 14.93 | | 15.77 | | 15.44 | | | Low during the year | 11.60 | | 13.26 | | 11.75 | | | At 31st December | 12.79 | | 13.44 | | 14.69 | | | (Decrease)/increase | (5)% | | (9)% | | 20% | |
|
|
|
|
|
| |
The table above sets out the middle market closing prices derived from the London Stock Exchange Daily Official List. The company’s share price decreased by 9%5% in 20062007 from a price of £14.69£13.44 at 1st January 20062007 to £13.44£12.79 at 31st December 2006.2007. This compares with an increase in the FTSE 100 index of 11%4% during the year. The share price on 23rd22nd February 20072008 was £14.50.£11.10. Market capitalisation
The market capitalisation, based on shares in public issue excluding Treasury shares, of GlaxoSmithKline at 31st December 20062007 was £77£70 billion. At that date GSK was the fourthfifth largest company by market capitalisation on the FTSE index. SmithKline Beecham plc Floating Rate Unsecured
Loan Stock 1990/2010 The loan stock is not listed on any exchange but holders may require SmithKline Beecham plc to redeem their loan stock at par, i.e. £1 for every £1 of loan stock held, on the first business day of March, June, September and December. Holders wishing to redeem all or part of their loan stock should complete the notice on the back of their loan stock certificate and return it to the registrar, to arrive at least 30 days before the relevant redemption date. Taxation General information concerning the UK and US tax effects of share ownership is set out in 'Taxation‘Taxation information for shareholders'shareholders’ on page 180.173. Dividends GlaxoSmithKline pays dividends quarterly. It continues to increase cash returns to shareholders through its dividend policy. Dividends remain an essential component of total shareholder return and GSK is committed to increasing its dividend over the long-term. Details of the dividends declared, the amount and the payment dates are given in Note 14.16 to the financial statements, ‘Dividends’. Dividends per share
The table below sets out the dividends per share in the last five years. | Year | pence | | pence | |
|
| |
| | | 2007 | | 53 | | | 2006 | 48.0 | | 48 | | | 2005 | 44.0 | | 44 | | | 2004 | 42.0 | | 42 | | | 2003 | 41.0 | | 41 | | | 2002 | 40.0 | | |
|
| |
| |
Dividends per ADS
The table below sets out the dividends per ADS in US dollars in the last five years, translated into US dollars at applicable exchange rates. | Year | US$ | | US$ | |
|
| |
| | | 2007 | | 2.14 | | | 2006 | 1.80 | | 1.80 | | | 2005 | 1.57 | | 1.57 | | | 2004 | 1.53 | | 1.53 | | | 2003 | 1.39 | | 1.39 | | | 2002 | 1.24 | | |
|
| |
| | | | | |
| | | Dividend calendar | | | Fourth quarter 2006 | | |
|
| | Ex-dividend date | 14th February 2007 | | Record date | 16th February 2007 | | Payable | 12th April 2007 | |
|
| | Ex-dividend date | 13th February 2008 | | Record date | 15th February 2008 | | Payable | 10th April 2008 |
|
|
| | First quarter 2007 | | |
|
| | Ex-dividend date | 2nd May 2007 | | Record date | 4th May 2007 | | Payable | 12th July 2007 | |
|
| | Second quarter 2007 | | |
|
| | Ex-dividend date | 1st August 2007 | | Record date | 3rd August 2007 | | Payable | 11th October 2007 | |
|
| | Third quarter 2007 | | |
|
| | Ex-dividend date | 31st October 2007 | | Record date | 2nd November 2007 | | Payable | 10th January 2008 | |
|
| | Ex-dividend date | 30th April 2008 | | Record date | 2nd May 2008 | | Payable | 10th July 2008 |
|
| | | |
| Second quarter 2008 | |
|
| | Ex-dividend date | 30th July 2008 | | Record date | 1st August 2008 | | Payable | 9th October 2008 |
|
| | |
| Third quarter 2008 | |
|
| | Ex-dividend date | 29th October 2008 | | Record date | 31st October 2008 | | Payable | 8th January 2009 |
|
|
Internet
Information about the company including details of the share price is available on GSK’s website at www.gsk.com. Information made available on the website does not constitute part of this Annual Report. Investor relations Investor Relations may be contacted as follows: UK
980 Great West Road, Brentford, Middlesex TW8 9GS
Tel: +44 (0)20 8047 5000 USA
One Franklin Plaza, PO Box 7929, Philadelphia PA 19101
Tel: 1 888 825 5249 (US toll freefree)
Tel: +1 215 751 4000 outside the USA(outside US)
|
| GSK Annual Report 20062007 | 169 | 176 | |
<Back to Contents | Shareholder information | | | | | | | | Shareholder information | | continued |
| | |
| Analysis of shareholdings | | | | | | | | | | Analysis of shareholdings at 31st December 2006 | Number of | % of total | % of total | Number of | | accounts | accounts | shares | shares |
|
|
|
|
|
|
|
| | | Holding of shares | | | | | | | | | | Up to 1,000 | 130,906 | | 71 | | 1 | | 46,807,426 | | | 1,001 to 5,000 | 41,712 | | 23 | | 2 | | 89,668,014 | | | 5,001 to 100,000 | 10,210 | | 5 | | 2 | | 148,081,033 | | | 100,001 to 1,000,000 | 1,048 | | 1 | | 6 | | 366,110,174 | | | Over 1,000,000 | 490 | | – | | 89 | | 5,340,935,201 | |
|
|
|
|
|
|
|
| | | Totals | 184,366 | | 100 | | 100 | | 5,991,601,848 | |
|
|
|
|
|
|
|
| | | Held by | | | | | | | | | | Nominee companies | 30,702 | | 17 | | 78 | | 4,643,364,576 | | | Investment and trust companies | 57 | | – | | 1 | | 58,018,488 | | | Insurance companies | 14 | | – | | – | | 162,380 | | | Individuals and other corporate bodies | 153,591 | | 83 | | 5 | | 324,318,199 | | | BNY (Nominees) Limited | 1 | | – | | 12 | | 730,255,527 | | | Held as Treasury shares by GlaxoSmithKline | 1 | | – | | 4 | | 235,482,678 | |
|
|
|
|
|
|
|
| | | Totals | 184,366 | | 100 | | 100 | | 5,991,601,848 | |
|
|
|
|
|
|
|
| |
Analysis of shareholdings at 31st December 2007 | | Number of | % of total | % of total | Number of | | | | accounts | accounts | shares | shares | |
|
|
|
|
| | | Holding of shares | | | | | | | Up to 1,000 | 126,330 | 71 | 1 | 45,130,222 | | | 1,001 to 5,000 | 39,861 | 23 | 1 | 85,399,100 | | | 5,001 to 100,000 | 9,480 | 5 | 2 | 136,988,653 | | | 100,001 to 1,000,000 | 970 | 1 | 6 | 334,350,551 | | | Over 1,000,000 | 457 | – | 90 | 5,410,718,500 | |
|
|
|
|
| | | | 177,098 | 100 | 100 | 6,012,587,026 | |
|
|
|
|
| | | Held by | | | | | | | Nominee companies | 30,647 | 17 | 73 | 4,355,052,360 | | | Investment and trust companies | 44 | – | 1 | 32,448,597 | | | Insurance companies | 13 | – | – | 109,152 | | | Individuals and other corporate bodies | 146,391 | 83 | 4 | 266,773,798 | | | BNY (Nominees) Limited | 2 | – | 14 | 854,008,961 | | | Held as Treasury shares by GlaxoSmithKline | 1 | – | 8 | 504,194,158 | |
|
|
|
|
| | | | 177,098 | 100 | 100 | 6,012,587,026 | |
|
|
|
|
| |
The Bank of New York’sYork Mellon’s holding held through BNY (Nominees) Limited represents the company’s ADR programme, whereby each ADS represents two Ordinary Sharesshares of 25p nominal value. At 22nd February 2008, BNY (Nominees) Limited held 854,735,903 Ordinary shares representing 15.59% of the issued share capital at that date. At 23rd22nd February 2007,2008, the number of holders of record of shares in the USA was 1,1431,108 with holdings of 1,508,0431,393,956 shares, and the number of registered holders of the ADRs was 39,17337,026 with holdings of 423,258,574427,367,951 ADRs. Certain of these shares and ADRs were held by brokers or other nominees. As a result the number of holders of record or registered holders in the USA is not representative of the number of beneficial holders or of the residence of beneficial holders. ControlDocuments on display
The Memorandum and Articles of company As far as is known toAssociation of the company it is not directly or indirectly owned or controlled by one or more corporations or by any government. The company does not know of any arrangements,and other documents referred to in this Annual Report are available for inspection at the operation of which might result in a change in controlRegistered Office of the company.
Major shareholders havePublications
In late March 2008 GSK will publish on the same voting rights per share as all other shareholders.website its Corporate Responsibility Report covering performance in areas including community investment, ethics and integrity, access to medicines, R&D and environment health and safety. Substantial shareholdings
At 23rd February 2007, the company had received notification of the following interests of 3% or more in the shares in issue, excluding Treasury shares: | | | • | BNY (Nominees) Limited holds 846,517,149 shares representing 14.71%. These shares are held on behalf of holders of ADRs, which evidenceADSs. | | | • | Legal & General Investment Management Limited holds 218,457,607 shares representing 3.80%. | | | • | Barclays PLC holds 240,119,101 shares representing 4.17%. |
As far as is known to the company, no other person was the owner of 3% or more of the shares in issue, excluding Treasury Shares of the company.
Directors and Officers
The interests of the Directors and Officers of the company in share options, as defined in the Companies Act 1985, of the company are given in the Remuneration Report (pages 65 to 82).
Exchange controls and other limitations affecting security holders There are currently no UK laws, decrees or regulations restricting the import or export of capital or affecting the remittance of dividends or other payments to holders of the company’s shares who are non-residents of the UK. There are no limitations relating only to non-residents of the UK under English law or the company’s Memorandum and Articles of Association on the right to be a holder of, and to vote in respect of, the company’s shares. Documents on display
The Memorandum and Articles of Association of the company and other documents referred to in this Annual Report are available for inspection at the Registered Office of the company.
Publications
In late March 2007 GSK will publish on the website its Corporate Responsibility Report covering performance in areas including community investment, ethics and integrity, access to medicines, R&D and environment health and safety.
| 170 |
| GSK Annual Report 20062007 | 177 | |
<Back to Contents | INVESTORINFORMATION | | | Shareholder Information | | | | | | | | | Shareholder information | | continued |
| | |
Nature of trading market The Ordinary Sharesshares of the company were listed on the London Stock Exchange on 27th December 2000. The shares were also listed on the New York Stock Exchange (NYSE) (in the form of American Depositary Shares ‘ADSs’) from the same date. The following tables set out, for the periods indicated, the high and low middle market closing quotations in pence for the shares on the London Stock Exchange, and the high and low last reported sales prices in US dollars for the ADSs on the NYSE. | GlaxoSmithKline | Pence per share | | |
|
|
| | | | High | | Low | |
|
|
|
| | | Quarter ended 31st March 2007* | 1493 | | 1344 | | | February 2007* | 1493 | | 1386 | | | January 2007 | 1418 | | 1344 | | | December 2006 | 1360 | | 1326 | | | November 2006 | 1427 | | 1331 | | | October 2006 | 1511 | | 1400 | | | September 2006 | 1499 | | 1418 | | | Quarter ended 31st December 2006 | 1511 | | 1326 | | | Quarter ended 30th September 2006 | 1540 | | 1418 | | | Quarter ended 30th June 2006 | 1557 | | 1455 | | | Quarter ended 31st March 2006 | 1577 | | 1424 | | | Quarter ended 31st December 2005 | 1544 | | 1395 | | | Quarter ended 30th September 2005 | 1442 | | 1308 | | | Quarter ended 30th June 2005 | 1377 | | 1201 | | | Quarter ended 31st March 2005 | 1318 | | 1175 | | | Year ended 31st December 2004 | 1299 | | 1042 | | | Year ended 31st December 2003 | 1390 | | 1000 | | | Year ended 31st December 2002 | 1780 | | 1057 | |
|
|
|
| | | | | | | |
| | US dollars per ADS | | |
|
|
| | | | High | | Low | |
|
|
|
| | | Quarter ended 31st March 2007* | 58.37 | | 52.66 | | | February 2007* | 58.37 | | 54.71 | | | January 2007 | 55.95 | | 52.66 | | | December 2006 | 53.73 | | 51.93 | | | November 2006 | 54.21 | | 51.41 | | | October 2006 | 56.20 | | 53.21 | | | September 2006 | 56.76 | | 53.23 | | | Quarter ended 31st December 2006 | 56.20 | | 51.41 | | | Quarter ended 30th September 2006 | 57.01 | | 53.23 | | | Quarter ended 30th June 2006 | 58.38 | | 51.48 | | | Quarter ended 31st March 2006 | 54.94 | | 50.15 | | | Quarter ended 31st December 2005 | 53.53 | | 49.16 | | | Quarter ended 30th September 2005 | 51.28 | | 46.47 | | | Quarter ended 30th June 2005 | 51.40 | | 45.19 | | | Quarter ended 31st March 2005 | 50.50 | | 44.48 | | | Year ended 31st December 2004 | 47.50 | | 39.04 | | | Year ended 31st December 2003 | 47.40 | | 32.75 | | | Year ended 31st December 2002 | 50.87 | | 32.86 | |
|
|
|
| | | * to 23rd February 2007 | | | | |
| GlaxoSmithKline | | | | | Pence per share | | | |
| | | | High | | Low | |
| | | Quarter ended 31st March 2008* | 1385 | | 1070 | | | February 2008* | 1184 | | 1070 | | | January 2008 | 1385 | | 1174 | | | December 2007 | 1323 | | 1272 | | | November 2007 | 1288 | | 1160 | | | October 2007 | 1333 | | 1232 | | | September 2007 | 1341 | | 1297 | | | Quarter ended 31st December 2007 | 1333 | | 1160 | | | Quarter ended 30th September 2007 | 1341 | | 1215 | | | Quarter ended 30th June 2007 | 1488 | | 1272 | | | Quarter ended 31st March 2007 | 1493 | | 1344 | | | Quarter ended 31st December 2006 | 1511 | | 1326 | | | Quarter ended 30th September 2006 | 1540 | | 1418 | | | Quarter ended 30th June 2006 | 1557 | | 1455 | | | Quarter ended 31st March 2006 | 1577 | | 1424 | | | Year ended 31st December 2005 | 1544 | | 1175 | | | Year ended 31st December 2004 | 1299 | | 1042 | | | Year ended 31st December 2003 | 1390 | | 1000 | |
| | | |
| | US dollars per ADS | | | |
| | | | High | | Low | |
| | | Quarter ended 31st March 2008* | 54.36 | | 42.16 | | | February 2008* | 47.01 | | 42.16 | | | January 2008 | 54.36 | | 46.77 | | | December 2007 | 53.93 | | 50.39 | | | November 2007 | 52.68 | | 47.87 | | | October 2007 | 54.14 | | 50.52 | | | September 2007 | 54.23 | | 52.22 | | | Quarter ended 31st December 2007 | 54.14 | | 47.87 | | | Quarter ended 30th September 2007 | 54.23 | | 49.43 | | | Quarter ended 30th June 2007 | 59.35 | | 51.28 | | | Quarter ended 31st March 2007 | 58.37 | | 52.66 | | | Quarter ended 31st December 2006 | 56.20 | | 51.41 | | | Quarter ended 30th September 2006 | 57.01 | | 53.23 | | | Quarter ended 30th June 2006 | 58.38 | | 51.48 | | | Quarter ended 31st March 2006 | 54.94 | | 50.15 | | | Year ended 31st December 2005 | 53.53 | | 44.48 | | | Year ended 31st December 2004 | 47.50 | | 39.04 | | | Year ended 31st December 2003 | 47.40 | | 32.75 | |
| |
Annual General Meeting 2007
The Queen Elizabeth II Conference Centre, 23rd May 2007 Broad Sanctuary, Westminster, London SW1P 3EE
| Annual General Meeting 2008 | |
| | | The Queen Elizabeth II Conference Centre, 21st May 2008 | | | Broad Sanctuary, Westminster, | | | London SW1P 3EE | |
| |
The Annual General Meeting is the company'scompany’s principal forum for communication with private shareholders. In addition to the formal business there will be a presentation by the Chief Executive Officer on the performance of the Group and its future development. There will be opportunity for questions to the Board, and the Chairmen of the Board'sBoard’s committees will take questions on matters relating to those committees. Investors holding shares in the company through a nominee service should arrange with that nominee service to be appointed as a corporate representative or proxy in respect of their shareholding in order to attend and vote at the meeting. ADR holders wishing to attend the meeting must obtain a proxy from The Bank of New York Mellon which will enable them to attend and vote on the business to be transacted. ADR holders may instruct The Bank of New York Mellon as to the way in which the shares represented by their ADRs should be voted by completing and returning the voting card provided by the bank in accordance with the instructions given. Financial reporting Financial reporting calendar 20072008 | | |
|
| | | Announcement of 1st Quarter Results | April 20072008 | |
|
| | | Announcement of 2nd Quarter Results | July 20072008 | |
|
| | | Announcement of 3rd Quarter Results | October 20072008 | |
|
| | | Preliminary Announcement of Annual Results | February 20082009 | |
|
| | | Publication of Annual Report/Review | February/March 20082009 | |
|
| |
Results Announcementsannouncements
Results Announcementsannouncements are issued to the London Stock Exchange and are available on its news service. Shortly afterwards, they are issued to the media, are made available on the website and sent to the US Securities and Exchange Commission and the NYSE. Financial reports
The company publishes an Annual Report and, for the investor not needing the full detail of the Report, an Annual Review. These are available from the date of publication on the website. The Annual Review is sent to all shareholders. Shareholders may also elect to receive the Annual Report by writing to the company’s registrars. Alternatively shareholders may elect to receive notification by email of the publication of financial reports by registering on www.shareview.co.uk. Copies of previous financial reports are available on theGSK’s website. Printed copies can be obtained from the registrarregistrars in the UK and from the GSK Response Center in the USA. Queries relating to receipt of duplicate copies of GSK’s publications should be addressed to the registrars.
|
| GSK Annual Report 20062007 | 171 | 178 | |
<Back to Contents | INVESTORINFORMATION | | Shareholder Information | | | | | | | | Shareholder information | | continued |
|
Ordinary shares The company’s shares are listed on the London Stock Exchange. Registrar
The company’s registrars are: Lloyds TSB RegistrarsEquiniti
The Causeway, Worthing,Aspect House, Spencer Road, Lancing, West Sussex BN99 6DA
www.shareview.co.uk
Tel: 0870 600 39910871 384 2991 inside the UK
Tel: +44 (0)121 415 7067 outside the UK
The registrars also provide the following services:
| Equiniti also provide the following services: | | | | • | GlaxoSmithKline Investment Plan | | • | GlaxoSmithKline Individual Savings Account | | • | GlaxoSmithKline Corporate Sponsored Nominee | | • | Shareview service | | • | Shareview dealing service | | • | Dividend reinvestment plan |
ShareShareview dealing service
Shareholders may buy or sell shares by internet or telephone through Shareview dealing, a share dealing service provided by Lloyds TSB Registrars.Equiniti. For internet purchases and sales log on to www.shareview.co.uk/dealing and for telephone purchases and sales call 0870 850 08520871 384 2020 (inside the UK only) between 8.00am and 4.30pm, Monday to Friday.
Glaxo Wellcome and SmithKline Beecham corporate PEPs
The Share Centre Limited
Oxford House, Oxford Road, Aylesbury, Bucks HP21 8SZ
Tel: +44 (0)1296 414141 The provision of the details above is not intended to be an invitation or inducement to engage in an investment activity. Advice on share dealing should be obtained from a stockbroker or independent financial adviser. American Depositary Shares The company’s shares are listed on the NYSE in the form of American Depositary Shares and these are evidenced by American Depositary Receipts (ADRs), each one of which represents two Ordinary Shares.shares. In general, the NYSE’s rules permit the company to follow UK corporate governance practices instead of those that apply in the USA, provided that the company explains any significant variations. This explanation is provided on the company’s website. ADR programme administrator
The ADR programme is administered by: The Bank of New York Mellon
Shareholder Relations
PO Box 11258, Church Street Station
New York NY 10286-1258
www.adrbny.com
Tel: 1 877 353 1154 (US toll freefree)
Tel: +1 212 815 3700 outside the USA(outside US) The administrators also provide Global BuyDIRECT, a direct ADS purchase/sale and dividend reinvestment plan for ADR holders. GSK Response Center
Tel: 1 888 825 5249 (US toll freefree)
| 172 |
| GSK Annual Report 20062007 | 179 | |
<Back to Contents | INVESTORINFORMATION | | | Taxation information for shareholders | | | | | | | |
Taxation information for shareholders | | | |
Information for shareholders
A summary of the main tax consequences for holders of shares and ADRs who are citizens or residents of the UK or the USA is set out below. It is not a complete analysis of all the possible tax consequences of purchase or ownership of these securities. It is intended only as a general guide. Holders are advised to consult their advisers with respect to the tax consequences of the purchase and ownership of their shares or ADRs, and the consequences under state and local tax laws in the USA and the implications of the current UK/US Income Tax convention.
| | | A summary of the main tax consequences for holders of shares and ADRs who are citizens or residents of the UK or the USA is set out below. It is not a complete analysis of all the possible tax consequences of purchase or ownership of these securities. It is intended only as a general guide. Holders are advised to consult their advisers with respect to the tax consequences of the purchase and ownership of their shares or ADRs, and the consequences under state and local tax laws in the USA and the implications of the current UK/US Income Tax convention. | | |
This statement is based upon UK and US tax laws and practices at the date of this report. US holders of ADRs generally will be treated as the owners of the underlying shares for the purposes of the current US/UK double taxation conventions relating to income and gains (Income Tax Convention), estate and gift taxes (Estate and Gift Tax Convention) and for the purposes of the US Internal Revenue Code of 1986, as amended (the Code). UK shareholders Taxation of dividends
From 6th April 1999, the rate of tax credits was reduced to one ninth. As a result of compensating reductions in the rate of tax on dividend income, there is no increase in the tax borne by UK resident individual shareholders. Tax credits are, however, no longer repayable to shareholders with a tax liability of less than the associated tax credit. Taxation of capital gains
UK shareholders may be liable for UK tax on gains on the disposal of shares or ADRs. TheyFor disposals made prior to 6th April 2008, they may also be entitled to indexation relief and taper relief on such sales. Indexation relief is calculated on the market value of shares at 31st March 1982 and on the cost of any subsequent purchases from the date of such purchase. Indexation relief for individual shareholders ceased on 5th April 1998. Taper relief is available to individual shareholders who hold or are deemed to hold shares for at least three years before they are sold. A capital gain is taxed at the marginal tax rate of the individual. For disposals after 5th April 2008 it is proposed that no indexation or taper relief will be available and that a capital gain will be taxed at a flat rate of 18% rather than the marginal tax rate of the individual. These proposals are not yet law and may be subject to change. Inheritance tax
Individual shareholders may be liable to inheritance tax on the transfer of shares or ADRs. Tax may be charged on the amount by which the value of the shareholder'sshareholder’s estate is reduced as a result of any transfer by way of gift or other disposal at less than full market value. Such a gift or other disposal is subject to both UK inheritance tax and US estate or gift tax. The Estate and Gift Tax Convention would generally provide for tax paid in the USA to be credited against tax payable in the UK. Stamp duty
UK stamp duty or stamp duty reserve tax (SDRT) will, subject to certain exemptions, be payable on the purchase of shares at a rate of 0.5% of the purchase price. There is a minimum charge of £5 where a stamp duty liability arises. US shareholders
The following is a summary of certain UK taxation and USA federal income tax considerations that may be relevant to a US holder of shares or ADRs. This summary only applies to a shareholder that holds shares or ADRs as capital assets, is a citizen or resident of the USA or a domestic corporation or that is otherwise subject to United States federal income taxation on a net income basis in respect of the shares or ADRs, and is not resident in the UK for UK tax purposes and does not hold shares for the purposes of a trade, profession or vocation that is carried on in the UK through a branch or agency.
Taxation of dividends
The gross amount of dividends received (without reduction for any UK withholding tax) is treated as foreign source dividend income for US tax purposes. It is not eligible for the dividend received deduction allowed to US corporations. Dividends on ADRs are payable in US dollars; dividends on shares are payable in Sterling. Dividends paid in pounds Sterling will be included in income in the US dollar amount calculated by reference to the exchange rate on the day the dividends are received by the holder. Subject to certain exceptions for short-term or hedged positions, an individual eligible US holder will be subject to US taxation at a maximum rate of 15% in respect of qualified dividends received before 2011. Shareholders are advised to consult their own Tax Advisers to confirm their eligibility. Taxation of capital gains
Generally, US holders will not be subject to UK capital gains tax, but will be subject to US tax on capital gains realised on the sale or other disposal of shares or ADRs. Estate and gift taxes
Under the Estate and Gift Tax Convention, a US shareholder is not generally subject to UK inheritance tax. Stamp duty
UK stamp duty or SDRT will, subject to certain exemptions, be payable on any issue or transfer of shares to the ADR custodian or depository at a rate of 1.5% of their price (if issued), the amount of any consideration provided (if transferred on sale), or their value (if transferred for no consideration). No SDRT would be payable on the transfer of an ADR. No UK stamp duty should be payable on the transfer of an ADR provided that the instrument of transfer is executed and remains at all times outside the UK. Any stamp duty on the transfer of an ADR would be payable at a rate of 0.5% of the consideration for the transfer. Any sale of the underlying shares would result in liability to UK stamp duty or, as the case may be, SDRT at a rate of 0.5% . There is a minimum charge of £5 where a stamp duty liability arises.
|
| GSK Annual Report 20062007 | 173 | 180 | |
<Back to Contents | | INVESTOR INFORMATION | | Glossary of terms | | | |
| | | | Glossary of terms | | | |
| Terms used in the Annual Report | US equivalent or brief description |
| | Accelerated capital allowances | Tax allowance in excess of depreciation arising from the purchase of fixed assets that delay the charging and payment of tax. The US equivalent of tax depreciation. |
| Advance Corporation Tax (ACT) | An advance payment of UK tax that was made when dividends are paid. No direct US equivalent. |
| | American Depositary Receipt (ADR) | Receipt evidencing title to an ADS. Each GlaxoSmithKline ADR represents two Ordinary Shares.shares. |
| | American Depositary Shares (ADSs) | Ordinary Sharesshares registered on the New York Stock Exchange. |
| | Basic earnings per share | Basic income per share. |
| | Called-up share capital | Ordinary Shares,shares, issued and fully paid. |
| | CER growth | Growth at constant exchange rates. |
| | Combined Code | Guidelines required by the Listing Rules of the Financial Services Authority to address the principal aspects of Corporate Governance. |
| | The company | GlaxoSmithKline plc. |
| Creditors | Accounts payable. |
| | Currency swap | An exchange of two currencies, coupled with a subsequent re-exchange of those currencies, at agreed exchange rates and dates. |
| Debtors | Accounts receivable. |
| | Defined benefit plan | Pension plan with specific employee benefits, often called ‘final salary scheme’. |
| | Defined contribution plan | Pension plan with specific contributions and a level of pension dependent upon the growth of the pension fund. |
| | Derivative financial instrument | A financial instrument that derives its value from the price or rate of some underlying item. |
| | Diluted earnings per share | Diluted income per share. |
| | Employee Share Ownership Plan Trusts | Trusts established by the Group to satisfy share-based employee incentive plans. |
| | Finance lease | Capital lease. |
| | Freehold | Ownership with absolute rights in perpetuity. |
| | Gearing ratio | Net debt as a percentage of total equity. |
| | The Group | GlaxoSmithKline plc and its subsidiary undertakings. |
| | Hedging | The reduction of risk, normally in relation to foreign currency or interest rate movements, by making off-setting commitments. |
| | Intangible fixed assets | Assets without physical substance, such as computer software, brands, licences, patents, know-how and marketing rights purchased from outside parties. |
| | Non-equity minority interest | Preference shares issued by a subsidiary to outside parties. |
| | Preference shares | Shares issued at varying dividend rates that are treated as outside interests. |
| | Profit | Income. |
| | Profit attributable to shareholders | Net income. |
| | Share capital | Ordinary Shares,shares, capital stock or common stock issued and fully paid. |
| | Shareholders’ funds | Shareholders’ equity. |
| | Share option | Stock option. |
| | Share premium account | Additional paid-up capital or paid-in surplus (not distributable). |
| Shares in issueoutstanding | Shares outstanding.in issue excluding Treasury shares |
| | Statement of recognised income and expense | Statement of comprehensive income. |
| Stocks | Inventories. |
| Subsidiary undertaking | An affiliateentity in which GlaxoSmithKline holds a majority shareholding and/or exercises control. |
| | Treasury share | Treasury stock. |
| | Turnover | Revenue. |
|
174 | GSK Annual Report 20062007 | 181 | |
<Back to Contents | | | MEMORANDUM AND ARTICLES OF ASSOCIATION | | | | | | |
Memorandum and Articles of Association of GlaxoSmithKline The following is a summary of the principal provisions of the company’s Memorandum of Association and Articles of Association. Shareholders should not rely on this summary, but should instead refer to the current Memorandum and Articles of Association which are filed with the Registrar of Companies in the UK or can be viewed on the company’s website. The Memorandum contains the fundamental provisions of the company’s constitution. The Articles contain the rules for the internal management and control of the company. Memorandum of Association
The Memorandum of Association of GlaxoSmithKline provides that its principal objects are, among other things, to be the holding company of Glaxo Wellcome and SmithKline Beecham and to carry on business as a general commercial company and to carry on any trade or business or activity of any nature which may seem to the Directors to be capable of being conveniently or advantageously carried on. Articles of Association
(a) Voting
All resolutions put to the vote at general meetings will be decided by poll. On a poll, every member who is present in person or by proxy shall have one vote for every Ordinary Share of which he is the holder. Unless the Directors otherwise decide, voting rights may not be exercised by a member who has not paid to the company all calls and other sums then payable by him in respect of shares in the company. Voting rights may not be exercised by a member who is subject to an order under Section 794 of the Companies Act 2006 because he has failed to provide GlaxoSmithKline with information concerning his interests in shares within the prescribed period, as required by Section 793 of the Companies Act 2006. (b) Transfer of Ordinary Shares
Any member may transfer his Ordinary Shares which are in certificated form by an instrument of transfer in any usual form or in any other form which the Directors may approve. Such instrument must be properly stamped and lodged with GlaxoSmithKline accompanied by the relevant share certificate(s) and such other evidence as the Directors may reasonably require to show the right of the transferor to make the transfer. Every transfer of Ordinary Shares which are in uncertificated form must be carried out by means of a relevant system, as defined in the Regulations. The Directors may, in their absolute discretion and without giving any reason, decline to register any transfer of any share which is not a fully paid share. The Articles contain no other restrictions on the transfer of fully paid shares provided (i) the transfer is in favour of not more than four transferees; (ii) the transfer is in respect of only one class of shares; and (iii) the holder of the shares is not subject to an order under Section 794 of the Companies Act 2006. Notice of refusal to register a transfer must be sent to the transferee within two months of the instrument of transfer being lodged. The Directors may decline to register a transfer of Ordinary Shares by a person holding 0.25 per cent or more of the existing shares of a class if such person is subject to an order under Section 794 Companies Act 2006, after failure to provide GlaxoSmithKline with information concerning interests in those shares required to be provided under the Companies Act, unless the transfer is shown to the Directors to be an approved transfer (as defined in the Articles) or the transferor is not himself in default and he meets certain conditions set out in the Articles. The registration of transfers may be suspended at such times and for such periods (not exceeding 30 days in any year) as the Directors may from time to time determine and which have been filed with the Registrar of Companies, either generally or in respect of any class of shares. Provisions in the Articles will not apply to uncertified shares to the extent that they are inconsistent with: | (i) | the holding of shares in uncertified form; | | (ii) | the transfer of title to shares by means of a system such as CREST; and | | (iii) | any provisions of the Regulations. |
(c) Dividends and distribution of assets on liquidation
The profits of GlaxoSmithKline which are available for distribution and permitted by law to be distributed and which GlaxoSmithKline may from time to time determine, upon the recommendation of the Directors, to distribute by way of dividend in respect of any accounting reference period shall be distributed by way of dividend among holders of Ordinary Shares. If in their opinion GlaxoSmithKline’s profits justify such payments, the Directors may, as far as any applicable legislation allows, pay interim dividends on shares of any class, of such amounts and in respect of such periods as they think fit. Except in so far as the rights attaching to, or the terms of issue of, any share otherwise provide, all dividends will be declared, apportioned and paid pro rata according to the amounts paid up on the shares during any portion of the period in respect of which the dividend is paid. As GlaxoSmithKline has only one class of Ordinary Shares, the holders of such shares will under general law be entitled to participate in any surplus assets in a winding-up in proportion to their shareholdings. A liquidator may, with the sanction of an extraordinary resolution, divide among the members in kind all or part of the assets of GlaxoSmithKline (whether they shall consist of property of the same kind or not) as the liquidator deems fair. (d) Variation of rights and changes in capital
Subject to the provisions of the Companies Act and to the terms of issue of the shares concerned, the rights attached to any class of shares may be varied with the written consent of the holders of three-quarters in nominal value of the issued shares of that class or with the sanction of an extraordinary resolution passed at a separate meeting of the holders of shares of that class. At every such separate meeting, the provisions of the Articles relating to general meetings shall apply, except the necessary quorum shall be at least two persons holding or representing as proxy at least one-third in nominal value of the issued shares of the class (but provided that at any adjourned meeting any holder of shares of the class present in person or by proxy shall be a quorum).
| GSK Annual Report 2007 | 175 | | |
Back to Contents INVESTOR INFORMATION | | | MEMORANDUM AND ARTICLES OF ASSOCIATION | | | | | | | |
GlaxoSmithKline may by ordinary resolution increase its share capital, consolidate and divide all or any of its shares into shares of a larger nominal amount, cancel any shares not taken or agreed to be taken by any person and, subject to any applicable legislation, sub-divide its shares into shares of a smaller nominal amount. GlaxoSmithKline may, subject to the provisions of the Companies Acts, by special resolution reduce its share capital or any capital redemption reserve, share premium account or other undistributable reserve. GlaxoSmithKline may also, subject to the requirements of the Companies Acts and the rights of any of the holders of any class of shares, purchase its own shares. (e) Unclaimed dividends
Any dividend unclaimed after a period of 12 years from the date when a resolution was passed for payment will be forfeited and revert to GlaxoSmithKline. GlaxoSmithKline may stop sending dividend warrants by post in respect of any shares if at least two consecutive payments have remained uncashed or are returned undelivered or if one payment has remained uncashed or is returned undelivered and GlaxoSmithKline cannot establish a new address for the holder after making reasonable enquiries but in either case GlaxoSmithKline must resume sending warrants if the holder or any person entitled to the shares by transmission claims the arrears. (f) Untraced shareholders
GlaxoSmithKline may sell any shares in GlaxoSmithKline after advertising its intention and waiting for three months if the shares have been in issue for at least ten years and during that period at least three dividends have become payable on them and have not been claimed and, so far as any Director is aware, GlaxoSmithKline has not received any indication during the relevant period of the whereabouts of the holder of the shares or any person entitled to them by transmission. Upon any such sale, GlaxoSmithKline will become indebted to the former holder of the shares or the person entitled to them by transmission for an amount equal to the net proceeds of sale. (g) Limitations on rights of non-resident or foreign shareholders
There are no limitations imposed by the Articles of Association on the rights of non-resident or foreign shareholders except that there is no requirement for GlaxoSmithKline to serve notices on shareholders outside the United Kingdom and the United States. (h) General meetings of shareholders
GlaxoSmithKline is required to hold an annual general meeting each year. Extraordinary general meetings of shareholders may be called as necessary by the Board and must be called promptly upon receipt of a requisition from shareholders. (i) Directors’ voting powers
Subject to the provisions of the Companies Acts, and provided the nature of a Director’s interest has been declared to the Directors, a Director is not disqualified by that office from contracting with GlaxoSmithKline in any manner, nor is any contract in which he is interested liable to be avoided, and any Director who is so interested is not liable to account to GlaxoSmithKline or the members for any benefit realised by the contract by reason of the Director holding that office or of the fiduciary relationship thereby established. However, no Director may vote on any resolution relating specifically to his own remuneration. A Director may (or any firm of which he is a partner, employee or member may) act in a professional capacity for GlaxoSmithKline (other than as auditor) and be remunerated for so doing. A Director may also be or become director or other officer of, or be otherwise interested in, any company promoted by GlaxoSmithKline or in which GlaxoSmithKline may be interested and will not be liable to account to GlaxoSmithKline or the members for any benefit received by him. (j) Directors’ remuneration
Each of the Directors will be paid a fee at such rate as may from time to time be determined by the Directors. Such fees may be satisfied in shares or in any other non-cash form. Any Director who is appointed to any executive office, acts as chairman or vice-chairman, serves on any committee of the directors or performs any other services which the Directors consider to extend beyond the ordinary services of a director shall be entitled to receive such remuneration (whether by way of salary, commission or otherwise) as the Directors or any committee authorised by the Directors may decide. Each Director may be paid reasonable travelling, hotel and other expenses he incurs in attending and returning from meetings of the Directors, of committees of the Directors or of GlaxoSmithKline or otherwise incurred in connection with the performance of his duties for GlaxoSmithKline. (k) Pensions and gratuities for Directors
The Directors or any committee authorised by the Directors may provide benefits by the payment of gratuities, pensions or insurance or other allowances or benefits for any Director or former Director or their relations, connected persons or dependants. (l) Borrowing powers
So far as the legislation allows, the Directors may exercise all GlaxoSmithKline’s powers to borrow money; to mortgage or charge all or any of GlaxoSmithKline’s undertaking, property (present and future), and uncalled capital; to issue debentures and other securities; and to give security either outright or as collateral security for any debt, liability or obligation or GlaxoSmithKline or of any third party. (m) Retirement and removal of Directors
At every annual general meeting of GlaxoSmithKline, firstly, one-third of the Directors will retire by rotation and be eligible for re-election (or, if one-third is not a whole number, the number of directors to retire is the number which is nearest to one-third). If there are less than three directors, they will all retire. The Directors to retire will be those who were in office at the time of the two previous annual general meetings and who did not retire by rotation at either of them, and, secondly, if the number of directors retiring remains less than the minimum required to retire, those who have been longest in office or, in the case of those who were appointed or re-appointed on the same day, will be (unless they otherwise agree) determined by lot. No Director is required to retire by reason of his age, nor do any special formalities apply to the appointment or re-election of any Director who is over any age limit.
| 176 | GSK Annual Report 2007 | | |
Back to Contents | | | | INVESTOR INFORMATION | | Cross reference to Form 20-F | | | |
| | | | Cross reference to Form 20-F | | |
This table has been provided as a cross reference from the information included in this Annual Report to the requirements of Form 20-F. | Item | | | Page |
| | 1 | | Identity of directors, senior management and advisors | | n/a |
| | 2 | | Offer statistics and expected timetable | | n/a |
| | 3 | | Key information | | | | A | | Selected financial data | | 172-176166-168 | | D | | Risk factors | | 44-4750-53 |
| | 4 | | Information on the company | | | | A | | History and development of the company | | 42 | B | | Business overview | | | | | | Products | | 27-28,3032, 33, 35 | | | Competition | | 29,3034, 35 | | | Regulation | | 22-2327, 28 | | | Marketing and distribution | | 813 | | | Manufacture and supply | | 2126 | | | Research and development | | 9-1614-21 | | | Intellectual property | | 23-2428, 29 | | | Environment, health and safety | | 24-2529,30 | | | Access to medicines | | 1823 | | | Corporate responsibility and community investment | | 19-2024, 25 | | C | | Organisational structure | | 153-155149-151 | | D | | Property, plant and equipment | | 44 | | | | Note 56 – Segment information | | 95-97100-103 | | | Note 17 – Property, plant and equipment | | 39,103-104111, 112 |
| | 4A | | Unresolved staff comments | n/a |
| | 5 | | Operating and financial review and prospects | | | | A | | Operating results | | | | | 2007 and 2006 | 36-53 | | | 2006 and 2005 | | 31-47 | | 2005 and 2004 | | 48-5254-58 | | B | | Liquidity and capital resources | | 39-4344-49 | | C | | Research and development, patents and licenses, etc. | | 9-16,612, 14-21 | | D | | Trend information | | 5612 | | E | Off balance | Off-balance sheet arrangements | | n/a | | F | | Tabular disclosure of contractual obligations | | 40-4146 |
| | 6 | | Directors, senior management and employees | | | | A | | Directors and senior management | | 54-5560-61 | | B | Compensation | Compensation | | | | | Remuneration Report | | 65-8271-86 | | C | | Board practices | | | | | | Corporate governance | | 56-6462-70 | | D | Employees | Employees | | | | GlaxoSmithKline | Being the best place for the best people to do | | 17 | | | | their best work | 22 | | | Note 810 – Employee costs | | 99106 | | | | Note 2628 – Pensions and post-employment benefits | | 109-115117-123 | | | Financial record | | 175168 | | E | | Share ownership | | | | | GlaxoSmithKline | Being the best place for the best people to do | | 17 | | | | their best work | 22 | | | Note 4042 – Employee share schemes | | 134-138 144-148 | | | Share options | | 76-7875, 81-83 | | | Incentive plans | | 79-8174, 75, 83-85 | | | Directors’ interests | | 76,8281, 86 |
| | 7 | | Major shareholders and related party transactions | | | | A | | Major shareholders | | 17764,170 | | B | | Related party transactions | | | | | | Note 3335 – Related party transactions | | 120130 |
|
| Item | | | Page |
| | 8 | | Financial information | | | | A | | Consolidated statements and other financial information | | | | | | Financial statements | | See item 18 | | | | Note 44 – Legal proceedings | | 156-164152-158 | | B | | Significant changes
| | | | Note 38 –40– Post balance sheet events | | 126136 |
| | 9 | | The offer and listing | | | | A | Share price history | Offer and listing details | | | | 176,178Share price listing | 169, 171 | | C | | Markets | | 178171 |
| | 10 | | Additional information | | | | B | | Memorandum and Articles of Association | | Footnote (i)175, 176 | | D | | Exchange controls | | 177170 | | E | | Taxation | | 180173 | | H | | Documents on display | | 177170 |
| | 11 | | Quantitative and qualitative disclosures about market risk | | | | | | Treasury policies | | 42-4348, 49 | | | | Note 3941 – Financial instruments and related disclosures | | 127-134137-144 |
| | 12 | | Description of securities other than equity securities | n/a |
| | 13 | | Defaults, dividend arrearages and delinquencies | n/a |
| 1314 | Defaults, dividend arrearages and delinquencies | | n/a |
| 14 | Material modifications to the rights of security holdersand use of proceeds | | n/a |
| | 15 | | Controls and procedures | | 59-6066, 67 |
| | 16 | | [Reserved] | | |
| | 16A | | Audit Committee financial expert | 67 |
| | 16B | | 61 | B | Code of ethics | 68 |
| | 16C | | 62 | C | Principal accountant fees and services | | | | | | Note 79 – Operating profit | | 98105 |
| | 16D | | Exemptions from the listing standard for auditcommittees | | n/a |
| | 16E | | Purchases of equity securities by the issuer and affiliated purchasers | | | | 118Note 33 – Share capital and share premium account | 127 |
| | 17 | | Financial statements | | n/a |
| | 18 | | Financial statements | | | | | Independent auditors’ report | | 8589 | | | Consolidated income statement | | 8690 | | | Consolidated balance sheet | | 8791 | | | Consolidated cash flow statement | | 8892 | | | Consolidated statement of recognised income and expense | | 8993 | | | Notes to the financial statements | | 90-16494-158 |
| | 19 | Exhibits | | Exhibits | Footnote (ii)(i) |
|
Footnote (i) – information responsive to this item is incorporated by reference tosee the company's Annual Report on Form 20-F for the year ended 31st December 2005. Footnote (ii) – see the company’s Form 20-F filing with the Securities and Exchange Commission.
|
| GSK Annual Report 20062007 | 177 | 182 | |
<Back to Contents
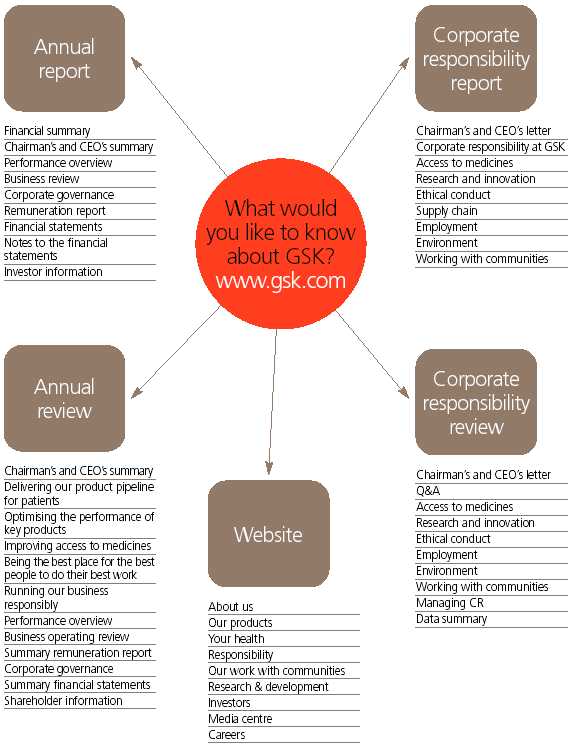 
 | www.gsk.com | | | | | Do more, feel better, live longerHead Office and Registered Office
GlaxoSmithKline plc
980 Great West Road
Brentford, Middlesex TW8 9GS
United Kingdom
Tel: +44 (0)20 8047 5000 | | | | Registered number: 3888792 |
| | | Printed in the UK by The Midas Press. The paper used in
the production of this document is made from pulps
harvested from sustainable forests, also using sawmill
residues and forest thinnings. It is elemental chlorine-free. | |  | | | | | | | Head Office and Registered Office | Produced by Corporate Communications, GSK. | | GlaxoSmithKline plc | | | 980 Great West Road | Designed by CGI London. | | Brentford, Middlesex TW8 9GS | | | United Kingdom | Printed in the UK by St. Ives Direct Edenbridge Ltd. The paper used in the production of this document is made from pulps harvested from sustainable forests, also using sawmill residues and forest thinnings. It is elemental chlorine-free. | | Tel: +44 (0)20 8047 5000 | | www.gsk.com | | | |
Item 19 Exhibits
Exhibit Index
Exhibit No.
| Description
| | | 1.1 | Memorandum and Articles of Association of the Registrant as in effect on the date hereof are incorporated by reference to Exhibit 1.1 to the Registrant’s Annual Report on Form 20-F filed with the Commission on March 3, 2006. | | | 2.1 | Deposit Agreement among the Registrant and The Bank of New York, as Depositary, and the holders from time to time of the American Depositary Receipts issued thereunder, including the form of American Depositary Receipt is incorporated by reference to the Registration Statement on Form F-6 (No. 333-12248) filed with the Commission on July 5, 2000. | | | 4.1 | Service Agreement between SmithKline Beecham Corporation and Jean-Pierre Garnier is incorporated by reference to Exhibit 4.1 to the Registrant’s Annual Report on Form 20-F filed with the Commission on March 8, 2005. | | | 4.2 | Service Agreement between GlaxoSmithKline Services Unlimited and Julian Heslop is incorporated by reference to Exhibit 4.3 to the Registrant’s Annual Report on Form 20-F filed with the Commission on March 3, 2006. | | | | | | | 8.1 | A list of the Registrant’s principal subsidiaries is incorporated by reference to pages 153 to 155 of this Annual Report on Form 20-F. | | | | | | | | | | | | | | | | |
Signature
The registrant hereby certifies that it meets all of the requirements for filing on Form 20-F and that it has duly caused and authorized the undersigned to sign this annual report on its behalf.
| | | | GlaxoSmithKline plc |
|
|
| March 2, 2007 | By: | /s/ Julian Heslop
| | Julian Heslop | | |
|